financial liberalization and banking crises: a cross-country analysis*
TRANSCRIPT

Financial Liberalization andBanking Crises: A Cross-Country
Analysisn
APANARD P. ANGKINANDw,¼, WANVIMOL SAWANGNGOENYUANG
§AND
CLAS WIHLBORGz,k
wMilken Institute, Santa Monica, CA, United States,¼Department of Economics, University of Illinois Springfield,
Springfield, IL, United States,§Bank of Thailand, Thailand,
zChapman University, Orange, CA, United States andkDepartment of Finance, Copenhagen Business School, Frederiksberg, Denmark
ABSTRACT
Several studies indicate that financial liberalization contributes to thelikelihood of a financial crisis. We focus on banking crises and argue thatthey are most likely to occur after an intermediate degree of liberalization.Using a recently updated dataset for financial reforms in 48 countriesbetween 1973 and 2005, we find an inverted U-shaped relationship betweenliberalization and the likelihood of crisis. We ask whether the relationshipremains when institutional characteristics of countries and dynamic effectsof liberalization are considered. The empirical results indicate that therelationship between liberalization and banking crises depends strongly onthe strength of capital regulation and supervision. With very weak regulationand supervision, the probability of banking crises is increasing withliberalization but this relationship is reversed as regulation and supervisionbecome stricter. The most important type of liberalization in relation tobanking crises seems to be behavioral (a relaxation of interest and creditcontrols). A policy implication is that positive growth effects of liberalizationcan be achieved without increasing the risk of a banking crisis if appropriateinstitutions are developed.
I. INTRODUCTION
Many countries liberalized their financial sectors during the 1980s and the1990s with the objective of increasing economic growth through financialsector development (see, e.g., Tornell et al. 2004; Bekaert et al. 2005). However,
n We would like to thank an anonymous referee and our discussant, Jennifer Huang, as well asother participants in the ‘Global Market Integration and Financial Crises,’ July 12–13, 2009, foruseful comments. We are also grateful to Arthur Denzau, Tripon Phumiwasana, and Thomas D.Willett for comments on earlier drafts. The views expressed in this paper are those of the authorsand do not necessarily represent those of the Bank of Thailand.
r 2010 The Authors. Journal compilation r International Review of Finance Ltd. 2010. Published by BlackwellPublishing Ltd., 9600 Garsington Road, Oxford OX4 2DQ, UK and 350 Main Street, Malden, MA 02148, USA.
International Review of Finance, 10:2, 2010: pp. 263–292DOI: 10.1111/j.1468-2443.2010.01114.x
financial liberalization has often been followed by financial instability and isoften considered a cause of banking crises (Caprio and Klingebiel 1996;Kaminsky and Reinhart 1999). This finding is controversial and there exist anumber of arguments discussed below as to why liberalization could enhancefinancial stability as well as growth. In this paper, we ask whether the notedrelationship between liberalization of the financial sector and banking crisisholds over all ranges of liberalization and whether it depends on institutionalcharacteristics of the liberalizing country. The institutional factors consideredare strength of financial supervision and capital regulation, the existence ofdeposit insurance, and the quality of institutions in the liberalizing country. Wealso ask whether different types of financial liberalization affect the likelihoodof banking crises to different degrees.
In our empirical analysis of the effects of financial liberalization on bankingcrises covering the period 1973–2005, we use a recently updated InternationalMonetary Fund Financial Reforms Database from Abiad et al. (2008). Thisdatabase examines several dimensions of financial reform. The extent ofliberalization is specified in each dimension for each year. Most existing studiesexamining financial liberalization capture periods of non-liberalized andliberalized financial systems using a 0/1 dummy.1 A common finding is thatliberalized financial systems have a higher probability of banking crises. Onemay ask whether this observation simply captures a truism because some degreeof liberalization is probably required for losses in the banking system to bemanifested as a banking crisis. A highly repressed banking system may performvery poorly and still survive based on different forms of more or less overt statesupport.
Some existing studies include continuous measures of degrees of financialliberalization. For example, Eichengreen and Arteta (2002) use the ratio ofcapital flows to GDP as a proxy for the extent of external liberalization. Bekaertet al. (2005) use the intensity of equity market liberalization as defined by ameasure of market capitalization. These variables reflect changes in economicoutcome that may occur as a result of liberalization. Kaminsky and Schmukler(2008) and Abiad and Mody (2005) construct indices that capture both theintensity of and changes in policy with respect to financial liberalization.Kaminsky and Schmukler construct a three-level financial liberalization indexfor 28 countries based on the liberalization of capital account, interest ratecontrol, and equity market.
The Financial Reforms Database categorizes financial reforms into sevendimensions each year. Six of them refer to liberalization in the form ofelimination of credit allocation controls, interest rate controls, capital accountcontrols, equity market controls, entry barriers, and privatization while theseventh dimension captures strength of bank capital regulation and supervision(CRS). The intensity of each reform category is captured on a four-point scalefrom fully repressed to fully liberalized for the six dimensions of liberalization.
1 Section II reviews the literature.
International Review of Finance
r 2010 The AuthorsJournal compilation r International Review of Finance Ltd. 2010264
One of our objectives is to analyze whether there is more information withrespect to the likelihood of banking crises when disaggregating a financialliberalization index into types of liberalization. For this reason, we use both thedegree of each different type of liberalization as well as a simple aggregate indexof the six dimensions of liberalization to capture the degree of total financialliberalization. As one type of liberalization is often accompanied or followed byother types of liberalization, the correlations among the six categories tend tobe high. We combine some categories to distinguish among three types ofliberalization: behavioral liberalization, competitive liberalization, and privati-zation. Behavioral liberalization refers to banks’ ability to set interest rate andcredit amounts without regulatory constraints while competitive liberalizationrefers to competitive conditions within the banking sector and betweenbanking and other sources of finance.
Existing theory discussed below does not allow us to specify a clear theory-based hypothesis for the relationship between the level of financial liberal-ization and banking crises. As we argue below, increased liberalization mayincrease or decrease the likelihood of banking crises, or the likelihood of a crisismay be particularly high at a particular level of liberalization. We formulate thespecific hypothesis that, starting from financial repression, increased liberal-ization up to an intermediate degree of liberalization will increase thelikelihood of banking crisis and that the relationship is reversed at relativelyhigh degrees of liberalization. We explore whether such a non-linear relation-ship can be explained by dynamic learning effects of liberalization or byinstitutional characteristics interacting with the degree of liberalization.
Taking learning effects into account does not affect our result that thelikelihood of banking crisis is at a maximum at an intermediate level offinancial liberalization. However, taking strength of CRS into account we findthat the relationship between financial liberalization and banking crisisdepends on this strength.2 Weak capital regulation is associated with anincreasing incidence of crisis as liberalization increases but this relationship isreversed when capital regulation has some effectiveness.
Deposit insurance systems are also considered in the analysis because effectsof liberalization are likely to depend on risk-taking incentives. We do not findthat deposit insurance coverage affects the relationship between liberalizationand likelihood of crisis, however.
The sample of 48 countries is divided into two groups: 21 advancedeconomies and 27 emerging markets. It is possible that emerging markets aremore vulnerable to banking crises after liberalization because capital flows arerelatively volatile and skills in risk assessment and supervision may be lacking.The evidence supports this view at low and intermediate levels of liberal-izations.
2 Most empirical studies that take into account the interactive effect of institutions and
liberalization use a 0/1 liberalization dummy.
Financial Liberalization and Banking Crises
r 2010 The AuthorsJournal compilation r International Review of Finance Ltd. 2010 265

In Section II, we review literature on effects of financial liberalizationreferring to literature on growth effects as well as on the link betweenliberalization and crises. The financial liberalization data and types of liberal-ization are described in Section III. The main hypotheses and the empiricalmethodology are described in Section IV. Results of the empirical tests arepresented in Section V. Conclusions and policy implications follow in SectionVI.
II. FINANCIAL LIBERALIZATION, EFFICIENCY, ANDCRISES IN THE LITERATURE
The main argument in favor of financial liberalization is that it enhanceseconomic efficiency and growth in a market economy. McKinnon (1973), Shaw(1973), and Fry (1997) analyzed how financial repression discourages savingsand contributes to misallocation of credit. Artificially low interest rates makecredit rationing necessary. The public sector, large firms, favored industries, andestablished clients tend to receive credit at favorable terms while small-scaleinvestors have to obtain funds in relatively expensive informal credit markets(Diaz-Alejandro 1985).
In response to the evidence of inefficiencies of financial repression and topressures from trading partners and international financial institutions (the IMFand WTO, in particular), many countries embarked on reforms of their financialsectors during the 1980s and the 1990s. In the 1990s, there was a wave oftheoretical and empirical contributions analyzing the impact of financialreforms on financial sector development and economic growth. While there issome ambiguity in the literature with respect to the causality between financialliberalization growth, the general conclusion is that liberalization is arequirement for increased intermediation associated with financial develop-ment.3
Other studies of financial liberalization focus on effects on the firm level.Beim and Calomiris (2000) show that financial repression results in reducedeconomic growth because banks have little incentive to explore newopportunities and to become innovative. Both external and internal financialliberalizations tend to improve the financial infrastructure and bank govern-ance (Schmukler 2004). Laeven (2003) finds that financing constraints arereduced for both large and small firms over time in liberalizing countries. Desaiet al. (2006) find that capital controls discourage foreign direct investment(FDI).
3 See, for example, Ranciere et al. (2006) and Tressel and Detragiache (2008). Levine (1997)
surveys this literature through the mid-1990s. Short-run and long-run causality between
finance and growth is analyzed in, for example, Demetriades and Hussein (1996), Arestis and
Demetriades (1997), Arestis et al. (2001), and Arestis et al. (2004). Christopoulos and Tsionas
(2004) estimate an error correction model for a panel of 10 countries and find that long-run
causality runs from financial development to growth.
International Review of Finance
r 2010 The AuthorsJournal compilation r International Review of Finance Ltd. 2010266
Berger et al. (2008) test whether increased competition increases or reducesfinancial fragility in 23 developed nations. Although the results generally favora ‘competition-fragility’ view, there is some evidence that competition alsoinduces banks to hold more equity capital and use risk-mitigating techniques.
The mentioned literature on the impact of financial liberalization on thefinancial sector stands in contrast to a common view that liberalization inthe form of elimination of interest rate and credit regulation reduces theprofitability of banks through increased competition and, thereby, increases thefragility of the banking system (e.g., Hellmann et al. 2000; Noy 2004).
There are few explicit models incorporating effects of liberalization oneconomic growth as well as on the likelihood of crises. One exception is Danieland Jones (2007). They develop a model of a transition period followingliberalization showing that financial liberalization can increase the likelihood ofbanking crises in the medium term while also enhancing economic efficiency. Inthe model, the immediate effect of liberalization is to lower the cost of capitaland, thereby, to increase real investment activity. Banks finance more riskyprojects and over time projects with lower returns will be accepted. At this point,when the capital stock has increased and marginal projects offer lower returns,banks become more vulnerable and the likelihood of a crisis increases.
The association between financial liberalization and banking crisis has beenobserved in several empirical studies (see, e.g., Williamson and Mahar 1998;Kaminsky and Reinhart 1999; Demirguc-Kunt and Detragiache 2001; Weller2001; Eichengreen and Arteta 2002; Noy 2004). Demirguc-Kunt and Detra-giache (2001) focus on domestic financial liberalization by observing the datepolicy makers announce interest rate decontrols in 53 countries during theperiod 1980–1995. They find that financial liberalization is strongly andpositively correlated with the probability of a subsequent banking crisis. Weller(2001) finds that a banking crisis becomes more likely after domestic financialliberalization.
Eichengreen and Arteta (2002) extend the analysis in Demirguc-Kunt andDetragiache by distinguishing between the effects of internal and externalfinancial liberalization. The latter is captured by a 0/1 dummy. They find thatcapital account liberalization does not contribute to a banking crisis butinternal financial liberalization does. Furthermore, they find that capitalaccount liberalization increases the likelihood of banking crises for countriesthat liberalize internally. Noy (2004) considers interactions between domesticfinancial liberalization and supervision and concludes that banking crises occuras a result of weak supervision after liberalization.
Ranciere et al. (2006) study the relationship between financial liberalizationand crises using one proxy for equity market liberalization and another forrelaxation of capital account restrictions. Both financial liberalization variablesare associated with higher probabilities of banking and currency crises (twincrises).
Barth et al. (2004) focus on restrictions on bank activity, entry restrictions,and privatization. They find that restrictions on banking activity and foreign
Financial Liberalization and Banking Crises
r 2010 The AuthorsJournal compilation r International Review of Finance Ltd. 2010 267
bank entry increase the likelihood of banking crises, while governmentownership does not have a significant effect on this likelihood. Barth andcolleagues use data for the types of regulatory restrictions on banks from theircountry survey, The Regulation and Supervision of Banks around the World: a NewDatabase. Although these variables capture the extent of regulatory restrictionsacross countries, they exist only as cross-sectional data for the years 1999, 2003,and 2007.
Before developing explicit hypotheses based on the discussion above, thedata on types and strength of liberalization are described.
III. DATA FOR TYPES OF FINANCIAL LIBERALIZATION
Data on liberalization of different types of restrictions and supervision are takenfrom Abiad et al. (2008). The potentially important advantage of the database isthat it has time-series measures for the intensity of reforms in sevendimensions. As noted in their analysis of the pace of financial reform, there isvariation among countries in terms of type of liberalization, intensity, andspeed of reform. The dataset for our analysis includes 21 advanced countriesand 27 emerging markets during the period 1973–2005.4 The list of countriesfor each country group is reported in Appendix A.
For each country, the following six dimensions capture liberalization ofdifferent types of restrictions:
1 Elimination of credit controls and high reserve requirements,2 Elimination of interest rate controls,3 Elimination of entry barriers and of restrictions on the scope of banks’
activities,4 Securities market policy,5 Elimination of capital account restrictions,6 Reduction of state ownership in the banking sector.
The seventh dimension of financial reform does not refer to liberalizationper se, but to capital regulation and prudential supervision.
7 Enhancement of capital regulations and prudential supervision (CRS) of thebanking sector.
Dimensions (1)–(6) are measured on a scale from 0 to 3, where 0, 1, 2, and 3represent fully repressed, partially repressed, largely liberalized, and fullyliberalized. For banking CRS, the scale goes from unregulated and unsupervised(0), through weakly regulated and supervised (1), largely regulated and
4 Abiad et al.’s (2008) dataset covers 91 economies, including 22 advanced countries and 69
emerging and developing countries. Within the latter group, we include only the 27 EMGs
because the effects of financial liberalization are more relevant for EMGs.
International Review of Finance
r 2010 The AuthorsJournal compilation r International Review of Finance Ltd. 2010268
supervised (2), to strongly regulated and supervised (3). The description of eachdimension is reported in Appendix B.
Because there is substantial correlation among the dimensions of liberal-ization (see panel A, Table 2), we combine these dimensions to create threetypes of liberalization. We argue that interest rate and credit controls are nearlyequivalent because freedom to allocate credit without freedom to set interestrates on loans implies that the allocation will be determined by the interest ratestructure. To enjoy faster growth, many governments have initiated liberal-ization by allowing banks to set interest rates or to allocate credit more freely orboth. Credit and interest rate controls of all kinds can be viewed as restrictionson banks actions and behavior. Thus, we combine the first two dimensions ofliberalization, eliminations of credit and interest controls, into one typedenoted ‘behavioral liberalization.’ The behavioral liberalization score refers tothe sum of the scores for these two dimensions added together.
(i) Behavioral liberalization5Score (1)1Score (2)Other types of liberalization include restrictions in equity markets and on
international capital transactions implying restrictions on the set of availablesources and uses of bank funds, as well as on competition from non-bankfinancial institutions and foreign entry. Restrictions on the range of activities ofbanks and restrictions on entry have similar effects on the competitive situationin financial markets. The scores for the third through the fifth dimensions are,therefore, added to create a score for ‘competitive liberalization.’5
(ii) Competitive liberalization5Score (3)1Score (4)1Score (5)We consider government ownership a third separate type of restriction.
Liberalization in this dimension is denoted Privatization.(iii) Privatization5Score (6)The correlation between the first two types of liberalization remains high as
shown in Table 2, raising questions about the possibility of distinguishingbetween effects of types (i) and (ii). We return to this issue.
Total FL represents total financial liberalization captured by the sum of scoresfor categories (1)–(6). CRS represents the score for the strictness of bank capitalregulation and supervision. The descriptive statistics of financial liberalizationvariables are reported in Table 1.
IV. HYPOTHESES AND MODEL SPECIFICATION
The literature on effects of financial liberalization and explanations of bankingcrises do not suggest a simple theoretical prediction about the relationship
5 We also run regressions by including all three components instead of the aggregate variable of
competitive liberalization after controlling for other types of liberalization. The p-value of the
Wald chi-square test for the equality of the coefficients is higher than 0.10, indicating that the
effects of these three components on banking crises cannot be identified. Thus, it is likely that
not much information is lost when using competitive liberalization index instead of (3), (4),
and (5) individually (see Section V).
Financial Liberalization and Banking Crises
r 2010 The AuthorsJournal compilation r International Review of Finance Ltd. 2010 269
between financial liberalization and the likelihood of banking crises. Never-theless, hypotheses can be formulated based on the arguments we expect tohave the greatest weights.
The dominating view in the empirical literature is that increased financialliberalization of any type increases the likelihood of banking crises. Explana-tions could be that behavioral as well as competitive liberalization wouldincrease the possibility that banking crises erupt as the result of speculativebehavior, mistaken expectations, as well as of sudden shifts in portfoliopreferences. In addition, high leverage contributing to the vulnerability of thebanking system may build up during periods of optimistic sentiments in themarket. Privatization would increase the likelihood of crises simply becausegovernment support in different forms would decline.
The main argument contradicting this view is that all types of financialliberalization contribute to a more competitive environment wherein banks aresubject to market discipline providing incentives for improved governance, riskmanagement, and innovation. For market discipline to be effective, financialliberalization must exceed a threshold level. On these grounds, the followinghypothesis can be formulated independent of dynamic effects of liberalization.
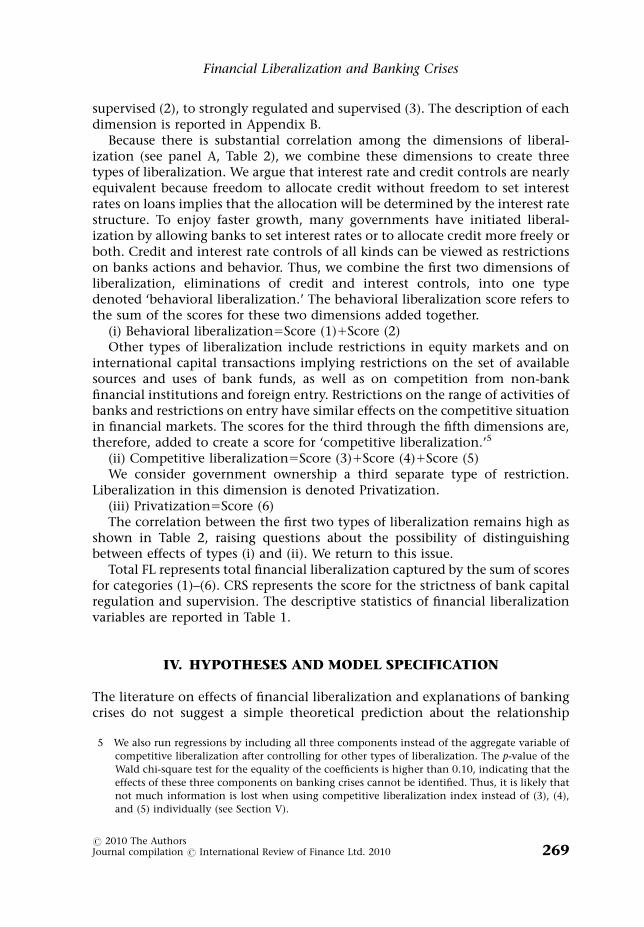
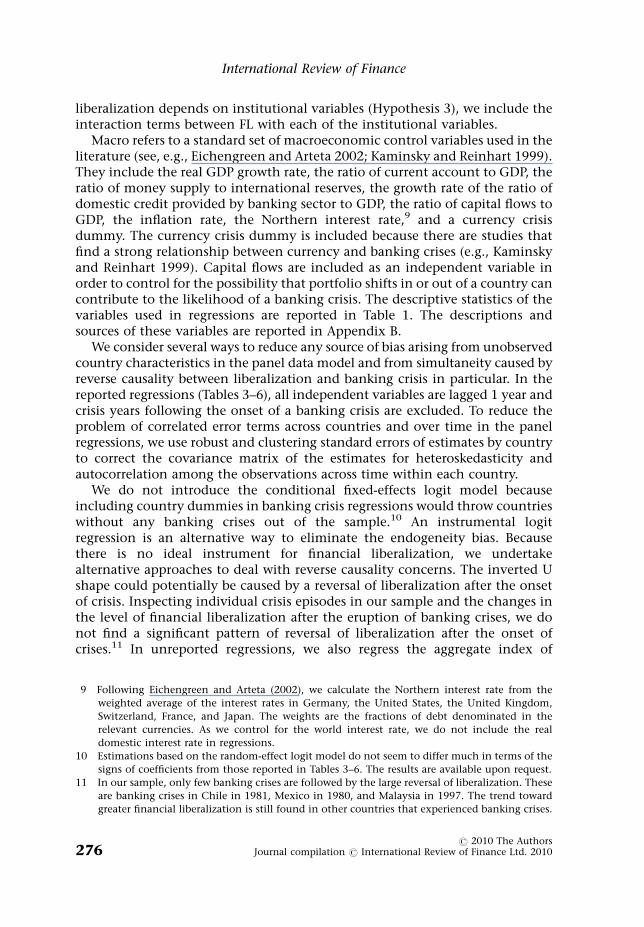
Table 1 Descriptive statistics
Observations Mean StandardDeviation
Minimum Maximum
VariableThe onset of banking crisis 1089 0.051 0.221 0 1GDP growth rate 1089 0.039 0.034 �0.126 0.183CA/GDP 1089 �0.010 0.049 �0.197 0.242M2/reserves 1089 1.945 0.922 �0.267 4.405Credit growth 1089 0.030 0.133 �1.113 1.356Capital flows/GDP 1089 0.008 0.042 �0.308 0.341Inflation 1089 0.129 0.282 �0.063 3.345Northern interest rate 1089 0.063 0.025 0 0.160Currency crises 1089 0.090 0.286 0 1
Financial Liberalization PoliciesTotal FL 1089 11.307 5.621 0 18Behavioral liberalization 1089 3.996 2.147 0 6Competitive liberalization 1089 5.783 2.988 0 9Privatization 1089 1.528 1.173 0 3
Institutional VariablesCapital regulation andsupervision (CRS)
1089 1.001 1.083 0 3
World Bank CRS 991 16.331 3.276 11 23DI coverage 1089 2.559 3.183 0 10GDP/capita (in log) 1089 8.756 1.327 5.338 10.560Law 789 4.515 1.480 0 6(Lack of) corruption 789 3.980 1.407 0 6
International Review of Finance
r 2010 The AuthorsJournal compilation r International Review of Finance Ltd. 2010270

Ta
ble
2C
orr
elati
on
s
Pan
elA
:Fin
an
cial
lib
erali
zati
on
an
din
stit
uti
on
al
vari
ab
lesa
(Ob
serv
ati
on
s5
1089)
Cre
dit
all
oca
tio
nli
ber
ali
zati
on
Inte
rest
rate
lib
erali
zati
on
En
try
an
dact
ivit
yli
ber
ali
zati
on
Eq
uit
ym
ark
etli
ber
ali
zati
on
Cap
ital
acc
ou
nt
lib
erali
zati
on
Pri
vati
zati
on
Beh
avio
ral
lib
erali
zati
on
Co
mp
etit
ive
lib
erali
zati
on
To
tal
FL
CR
SW
orl
dB
an
kC
RS
Rea
lG
DP/
cap
ita
DI
cover
age
Law
Inte
rest
rate
lib
erali
zati
on
0.6
51
En
try
an
dact
ivit
yli
ber
ali
zati
on
0.6
50.6
51
Eq
uit
ym
ark
etli
ber
ali
zati
on
0.6
50.6
70.6
51
Cap
ital
acc
ou
nt
lib
erali
zati
on
0.6
60.6
60.6
40.7
51
Pri
vati
zati
on
0.5
00.4
40.4
10.4
40.5
31
Beh
avio
ral
lib
erali
zati
on
0.9
00.9
10.7
20.7
30.7
30.5
21
Co
mp
etit
ive
lib
erali
zati
on
0.7
40.7
50.8
70.9
00.9
00.5
20.8
21
To
tal
FL
0.8
40.8
40.8
20.8
40.8
70.6
80.9
20.9
51
CR
S0.6
00.5
50.6
60.6
50.6
00.4
30.6
30.7
20.7
11
Wo
rld
Ban
kC
RS
�0.3
70.2
3�
0.1
0�
0.2
1�
0.0
2�
0.1
0�
0.3
0�
0.1
3�
0.2
40.0
91
Rea
lG
DP/c
ap
ita
0.4
20.4
20.4
20.6
50.5
40.4
40.4
60.6
00.5
90.4
3�
0.1
31
DI
cover
age
0.0
80.1
60.2
80.1
70.2
00.0
20.1
30.2
40.1
90.1
6�
0.0
30.0
81
Law
0.4
60.3
40.3
50.6
70.5
40.3
00.4
60.5
80.5
50.4
4�
0.1
20.7
1�
0.1
01
(Lack
of)
corr
up
tio
n0.2
60.2
70.1
80.4
00.3
40.2
70.3
00.3
40.3
60.2
0�
0.0
80.6
7�
0.0
80.6
5

Pan
elB
:T
yp
eso
fli
ber
ali
zati
on
du
rin
g4-y
ear
per
iod
s
To
tal
FL
t�1
To
tal
FL
t�2
To
tal
FL
t�3
To
tal
FL
t�4
Beh
avio
ral
lib
erali
za-
tio
nt�
1
Beh
avio
ral
lib
erali
za-
tio
nt�
2
Beh
avio
ral
lib
erali
za-
tio
nt�
3
Beh
avio
ral
lib
erali
za-
tio
nt�
4
Co
mp
etit
ive
lib
erali
za-
tio
nt�
1
Co
mp
etit
ive
lib
erali
za-
tio
nt�
2
Co
mp
etit
ive
lib
erali
za-
tio
nt�
3
Co
mp
etit
ive
lib
erali
za-
tio
nt�
4
Pri
vati
za-
tio
nt�
1
Pri
vati
za-
tio
nt�
2
Pri
vati
za-
tio
nt�
3
To
tal
FL
t�2
0.9
81
To
tal
FL
t�3
0.9
60.9
81
To
tal
FL
t�4
0.9
40.9
60.9
81
Beh
avio
ral
lib
erali
za-
tio
nt�
1
0.9
30.9
10.8
80.8
51
Beh
avio
ral
lib
erali
za-
tio
nt�
2
0.9
10.9
30.9
00.8
70.9
61
Beh
avio
ral
lib
erali
za-
tio
nt�
3
0.8
90.9
10.9
30.9
00.9
20.9
61
Beh
avio
ral
lib
erali
za-
tio
nt�
4
0.8
60.8
80.9
10.9
30.8
70.9
10.9
61
Co
mp
etit
ive
lib
erali
za-
tio
nt�
1
0.9
50.9
40.9
20.8
90.8
20.8
20.8
10.7
91
Co
mp
etit
ive
lib
erali
za-
tio
nt�
2
0.9
40.9
50.9
40.9
10.8
20.8
20.8
20.8
10.9
81
Co
mp
etit
ive
lib
erali
za-
tio
nt�
3
0.9
20.9
40.9
50.9
40.8
00.8
10.8
20.8
20.9
50.9
81
Co
mp
etit
ive
lib
erali
za-
tio
nt�
4
0.9
00.9
20.9
40.9
50.7
80.8
00.8
10.8
20.9
30.9
50.9
81
Pri
vati
za-
tio
nt�
1
0.6
70.6
80.6
80.6
70.5
10.5
20.5
30.5
20.5
10.5
20.5
20.5
31
Pri
vati
za-
tio
nt�
2
0.6
60.6
70.6
70.6
70.5
00.5
10.5
10.5
20.5
00.5
00.5
20.5
20.9
71
Pri
vati
za-
tio
nt�
3
0.6
30.6
50.6
60.6
60.4
80.4
90.5
00.5
00.4
80.4
90.5
00.5
10.9
40.9
71
Pri
vati
za-
tio
nt�
4
0.6
10.6
20.6
40.6
60.4
70.4
70.4
80.4
90.4
60.4
70.4
80.5
00.9
10.9
40.9
7
aC
orr
elati
on
sb
etw
een
Wo
rld
Ban
kC
RS
an
do
ther
vari
ab
les
are
base
do
n40
ob
serv
ati
on
sin
2003,w
hic
his
the
yea
rth
eW
orl
dB
an
ksu
rvey
was
con
du
cted
,an
dth
eco
rrel
ati
on
sb
etw
een
Law
/(la
cko
f)co
rru
pti
on
wit
ho
ther
vari
ab
les
have
789
ob
serv
ati
on
s.
Ta
ble
2(c
onti
nued
)

Hypothesis 1: There is a partial degree of liberalization at which thelikelihood of a banking crisis is at a maximum when controlling formacroeconomic and institutional factors. We expect this non-linear relation-ship between likelihood of banking crisis and financial liberalization to hold forthe different types of liberalization as well as for the sum of all types ofliberalization discussed above (Total FL).
One weakness of this hypothesis is that it does not distinguish betweentransitional and permanent effects of liberalization. In fact, the invertedU-shaped relationship implied by Hypothesis 1 may be explained by dynamiceffects of liberalization because most of the variation in degree of liberalizationoccurs as an increase in the degree of liberalization over time. It has been arguedthat behavioral and competitive liberalization can increase the likelihood ofbanking crises temporarily, because there is a transition period before riskassessment, and risk-management skills can be developed in an environmentwith greater ability and opportunity for risk taking. Furthermore, banks areoften settled with large amounts of pre-liberalization bad loans that were notrecognized as bad before.
A temporary period of learning to deal with risk in a new, more liberalenvironment could be followed by a decline in financial fragility as a result ofimproved governance and risk management. Kaminsky and Schmukler (2008)show that financial markets are more volatile during 3 years following financialliberalization but financial cycles become more stable over time becauseinstitutions tend to improve after the deregulation of financial markets. Thisobservation is also consistent with the theoretical mechanism developed byDaniel and Jones (2007). They predict that the risk of banking crisis is relativelyhigh some time after liberalization when marginal projects are implemented.
If liberalization has been increasing over most of our estimation period, wemay observe the inverted U-shaped relationship described in Hypothesis 1 butas a result of the dynamic effects discussed above. To analyze this issue further,we will include lags of liberalization and formulate the following hypothesis:
Hypothesis 2: The probability of banking crisis increases after liberalizationwith a lag up to a point where after the probability decreases. The decline is theresult of improved governance, risk management, and credit allocation in aliberalized system after a period of learning.
This hypothesis will be tested using lags of liberalization up to 4 years.Institutional factors as explanations of banking crises have been emphasized
in the literature.6 Such factors can themselves influence the likelihood of crisisbut they are also likely to interact with liberalization. They may also explain theobservation of the inverted U-shaped relationship described in Hypothesis 1 ifinstitutional factors are correlated with liberalization. Table 2 shows that the
6 See, for example, Barth et al. (2004) and other articles referred to in Section II.
Financial Liberalization and Banking Crises
r 2010 The AuthorsJournal compilation r International Review of Finance Ltd. 2010 273

CRS measure from the same database as the liberalization measures is positivelycorrelated with behavioral and competitive liberalization, in particular.
The institutional factors we include in the analysis are GDP/capita, rule oflaw (Law), and lack of corruption as alternative proxies for general institutionalquality, strictness of CRS, and explicit deposit insurance coverage. Stricterregulation and supervision would weaken any relationship while strongerexplicit deposit insurance coverage is expected to reduce market discipline and,thereby, strengthen a positive relationship between liberalization and thelikelihood of crisis. However, if increased liberalization reduces the likelihood ofcrises expanded protection of depositors would weaken this relationship. Thus,expanded deposit insurance coverage is expected to make the relationship morepositive whether it is positive or negative to begin with. Higher institutionalquality can be thought of as better governance translating into strongergovernance and effectiveness of market discipline. Thus, the effects of higherinstitutional quality would be the same as for reduced explicit deposit insurancecoverage.
The following hypotheses are formulated with respect to the interactionbetween institutional factors and financial liberalization:
Hypothesis 3a: Stronger CRS are expected to weaken any positive or negativeassociation between each type of financial liberalization (and Total FL) and theoccurrence of banking crises.
Hypothesis 3b: Expanded protection of bank depositors and other creditors(DI coverage) is expected to make the relationship between each type ofliberalization (and Total FL) and the occurrence of banking crisis more positivewhether the relationship is positive or negative to begin with.
Hypothesis 3c: Higher general, legal, and political institutional quality (GDP/capita, rule of law, lack of corruption) in a country is expected to make therelationship between each type of liberalization (and Total FL) and theoccurrence of banking crisis more negative whether the relationship is positiveor negative to begin with.
After testing these hypotheses for total financial liberalization, we distin-guish among the three types of liberalization expecting behavioral andcompetitive liberalization to have stronger effects than only privatization.One difficulty we face when testing for the impact of the different types ofliberalization is that they tend to be highly correlated as Table 2 shows.Privatization is less correlated with Total FL than the other two types.
The hypotheses are tested for the entire sample of 48 countries and for eachcounty group separately, because advanced economies and emerging marketshave different characteristics in terms of financial development and the extentof capital mobility. We expect that the effects of financial liberalization on theincidence of banking crises are stronger for emerging markets. Generally, these
International Review of Finance
r 2010 The AuthorsJournal compilation r International Review of Finance Ltd. 2010274

countries have less experience with risk management, relatively weak financialregulation and supervision, weak market discipline, and more volatile capitalflows. We cannot expect that the institutional variables control completely forthese differences between the country groups.
We test the above hypotheses using logit estimation based on the followinginitial model specification:
Li;t ¼Pi;t
1� Pi;t
� �¼ aþ bFLi;t�1 þ dInstitutioni;t�1 þ gMacroi;t�1 þ ei;t
where
Pi;t ¼ ProbðBCi;t jXÞ ¼1
1þ e�ðaþbFLi;t�1þdInstitutioni;t�1þgMacroi;t�1Þ:
BC is a banking crisis dummy, which takes a value of 1 in a crisis year and 0 ifthere is no crisis. The subscript i refers to a country and t indicates time. Crisisyears following the initial year of a specific crisis are excluded from the mainregressions to reduce the simultaneity problem caused by the possibility thatthe occurrence of a banking crisis triggers financial reforms. Furthermore, thehypotheses refer to the impact of liberalization on the likelihood that a crisiswill occur but not to the duration of a crisis. A crisis lasting more than 1 yearwould get excess weight in the analysis and possibly bias the results if all crisisyears were included.
Data for banking crisis episodes, including both systemic and borderlinebanking crises, are taken from Caprio et al. (2005).7 FL in the equation refers toeither the aggregate index of financial liberalization (Total FL) or its three types(behavioral liberalization, competitive liberalization, and privatization), whichwere discussed in the previous section. When testing the non-linear relation-ship between banking crises and financial liberalization (the inverted U-shapedin Hypothesis 1), we enter FL in the quadratic functional form as well.
Institution refers to the CRS of banks, deposit insurance systems (DIcoverage), and the quality of domestic institutions. We use the real GDP/capitato capture general institutional quality. In the robustness check, we also use therule of law and (lack of) corruption variables to capture the quality of the legaland political systems in a country.8 A proxy for the coverage of explicit depositinsurance captures the difference in deposit insurance systems. It measuresthe maximum deposit insurance coverage in a country relative to the value ofthe average (per capita) deposit. To test whether the impact of financial
7 In Caprio et al. (2005)’s banking crisis dataset, both a start and end date of each crisis episode are
reported. We also check the dates of crisis episodes with A New Database of Systemic Banking
Crises by Laeven and Valencia (2008). If a start date of the same crisis episode is different, we use
the one from Laeven and Valencia. However, the New Database is limited to systemic banking
crises and only a start date of banking crises is reported.
8 We use the rule of law and corruption only in the robustness check because the data, which are
taken from the International Country Risk Guide, starts in 1984 while our data on financial
reform starts in 1973.
Financial Liberalization and Banking Crises
r 2010 The AuthorsJournal compilation r International Review of Finance Ltd. 2010 275
liberalization depends on institutional variables (Hypothesis 3), we include theinteraction terms between FL with each of the institutional variables.
Macro refers to a standard set of macroeconomic control variables used in theliterature (see, e.g., Eichengreen and Arteta 2002; Kaminsky and Reinhart 1999).They include the real GDP growth rate, the ratio of current account to GDP, theratio of money supply to international reserves, the growth rate of the ratio ofdomestic credit provided by banking sector to GDP, the ratio of capital flows toGDP, the inflation rate, the Northern interest rate,9 and a currency crisisdummy. The currency crisis dummy is included because there are studies thatfind a strong relationship between currency and banking crises (e.g., Kaminskyand Reinhart 1999). Capital flows are included as an independent variable inorder to control for the possibility that portfolio shifts in or out of a country cancontribute to the likelihood of a banking crisis. The descriptive statistics of thevariables used in regressions are reported in Table 1. The descriptions andsources of these variables are reported in Appendix B.
We consider several ways to reduce any source of bias arising from unobservedcountry characteristics in the panel data model and from simultaneity caused byreverse causality between liberalization and banking crisis in particular. In thereported regressions (Tables 3–6), all independent variables are lagged 1 year andcrisis years following the onset of a banking crisis are excluded. To reduce theproblem of correlated error terms across countries and over time in the panelregressions, we use robust and clustering standard errors of estimates by countryto correct the covariance matrix of the estimates for heteroskedasticity andautocorrelation among the observations across time within each country.
We do not introduce the conditional fixed-effects logit model becauseincluding country dummies in banking crisis regressions would throw countrieswithout any banking crises out of the sample.10 An instrumental logitregression is an alternative way to eliminate the endogeneity bias. Becausethere is no ideal instrument for financial liberalization, we undertakealternative approaches to deal with reverse causality concerns. The inverted Ushape could potentially be caused by a reversal of liberalization after the onsetof crisis. Inspecting individual crisis episodes in our sample and the changes inthe level of financial liberalization after the eruption of banking crises, we donot find a significant pattern of reversal of liberalization after the onset ofcrises.11 In unreported regressions, we also regress the aggregate index of
9 Following Eichengreen and Arteta (2002), we calculate the Northern interest rate from the
weighted average of the interest rates in Germany, the United States, the United Kingdom,
Switzerland, France, and Japan. The weights are the fractions of debt denominated in the
relevant currencies. As we control for the world interest rate, we do not include the real
domestic interest rate in regressions.
10 Estimations based on the random-effect logit model do not seem to differ much in terms of the
signs of coefficients from those reported in Tables 3–6. The results are available upon request.
11 In our sample, only few banking crises are followed by the large reversal of liberalization. These
are banking crises in Chile in 1981, Mexico in 1980, and Malaysia in 1997. The trend toward
greater financial liberalization is still found in other countries that experienced banking crises.
International Review of Finance
r 2010 The AuthorsJournal compilation r International Review of Finance Ltd. 2010276

liberalization (with a 0–18 scale) on the onset of banking crisis dummy andother macroeconomic control variables using the order logit model. The p-valuefor the banking crisis dummy is about 0.6. These investigations suggest that ourreported regressions based on the logit model are not driven by the endogeneity.
V. FINANCIAL LIBERALIZATION AND BANKING CRISES:EMPIRICAL RESULTS
Tables 3–5 report the empirical results for the effect of the aggregate index forfinancial liberalization (Total FL) on the onset of banking crises for the entire
Table 3 The aggregate financial liberalization index (Total FL) and banking crises(marginal effects are reported)
Sample (1) (2) (3) (4) (5) (6)ALL ALL ADV ADV EMG EMG
Total FLt�1 0.004nn 0.011nn 0.004nn 0.016nn 0.004nn 0.016nn
(0.003) (0.001) (0.003) (0.001) (0.032) (0.001)(Total FLt�1)2 �0.0004nn �0.001nn �0.001nn
(0.026) (0.017) (0.005)CRSt�1 �0.017nn �0.010# �0.006# �0.001 �0.037nn �0.022#
(0.004) (0.140) (0.320) (0.797) (0.008) (0.105)DI coveraget�1 0.0004 0.001 0.001 0.0001 0.0002 0.001
(0.715) (0.594) (0.576) (0.875) (0.922) (0.471)GDP/capitat�1 �0.010nn �0.011nn 0.020# 0.015# 0.007 0.006
(0.011) (0.004) (0.128) (0.136) (0.353) (0.376)GDP growth ratet�1 �0.259nn �0.244nn �0.041 �0.038 �0.470nn �0.425nn
(0.016) (0.012) (0.883) (0.879) (0.005) (0.005)CA/GDPt�1 �0.272nn �0.258nn �0.206n �0.196n �0.329nn �0.304nn
(0.012) (0.012) (0.089) (0.064) (0.036) (0.033)M2/reservest�1 0.009# 0.009n 0.005 0.007# 0.023nn 0.023nn
(0.135) (0.095) (0.339) (0.178) (0.010) (0.004)Credit growtht�1 0.053nn 0.050nn 0.009 0.008 0.077nn 0.069nn
(0.000) (0.000) (0.723) (0.761) (0.004) (0.003)Capital flows/GDPt�1 0.274nn 0.272nn 0.095 0.043 0.374nn 0.413nn
(0.016) (0.020) (0.397) (0.719) (0.032) (0.017)Inflationt�1 0.036nn 0.032nn 0.231n 0.225n 0.027nn 0.019nn
(0.000) (0.000) (0.099) (0.057) (0.005) (0.030)Northern interest ratet�1 0.481nn 0.524nn 0.450n 0.320# 0.461n 0.520nn
(0.017) (0.007) (0.065) (0.180) (0.089) (0.042)Currency crisest�1 �0.008 �0.008 0.008 0.007 �0.025n �0.023n
(0.465) (0.448) (0.595) (0.606) (0.073) (0.062)
Number of observations 1089 1089 536 536 553 553Wald chi-square 92.195 96.563 82.325 88.162 117.797 196.452Prob4chi-square 0.000 0.000 0.000 0.000 0.000 0.000
The dependent variable is the onset of banking crisis dummy. Regressions are estimated using thelogit model with robust and clustered standard errors within a country. The numbers in parenthesesare p-values. For sample, ALL, all sample; ADV, advanced economies; EMG, emerging markets.n,nnSignificance levels of 10% and 5%, respectively.#Coefficient value zero that falls outside one standard deviation of the estimate.
Financial Liberalization and Banking Crises
r 2010 The AuthorsJournal compilation r International Review of Finance Ltd. 2010 277

sample of 48 countries and two country groups. In Table 3, the squared term isadded in a separate regression for each country group in each table. Table 3includes neither dynamic consideration nor interactions with institutionalfactors. Table 4 includes dynamic considerations while the interactions betweenfinancial liberalization and institutional variables are introduced in Table 5 for
Table 4 The dynamic effects of financial liberalization on banking crises (marginaleffects are reported)
Sample (1) (2) (3) (4) (5) (6)ALL ADV EMG ALL ADV EMG
Total FLt�1 0.006# 0.014nn 0.008n 0.008nn 0.013nn 0.012nn
(0.112) (0.031) (0.082) (0.011) (0.018) (0.009)Total FLt�2 �0.003 �0.003 �0.001
(0.572) (0.453) (0.807)Total FLt�3 0.011nn 0.006# 0.006#
(0.011) (0.132) (0.029)Total FLt�4 �0.005# �0.003# �0.005#
(0.112) (0.349) (0.246)Total FLaverage, t�2 to t�4 0.002# 0.001 0.005#
(0.314) (0.770) (0.123)(Total FLt�1)2 �0.0003n �0.0005# �0.001nn �0.0004n �0.0004# �0.001nn
(0.076) (0.119) (0.010) (0.053) (0.122) (0.008)CRSt�1 �0.009# �0.002 �0.022# �0.010# �0.002 �0.024n
(0.156) (0.696) (0.112) (0.122) (0.758) (0.073)DI coveraget�1 0.001 0.0003 0.001 0.001 0.0004 0.004
(0.397) (0.685) (0.547) (0.500) (0.694) (0.530)GDP/capitat�1 �0.009nn 0.014# 0.007# �0.011nn 0.016 0.004
(0.040) (0.155) (0.254) (0.005) (0.120) (0.530)GDP growth ratet�1 �0.099 �0.124 �0.199# �0.229nn �0.119 �0.399nn
(0.337) (0.446) (0.245) (0.022) (0.498) (0.012)CA/GDPt�1 �0.277nn �0.185n �0.347nn �0.268nn �0.191n �0.308nn
(0.010) (0.090) (0.010) (0.006) (0.085) (0.026)M2/reservest�1 0.008# 0.007# 0.019nn 0.008# 0.005# 0.021nn
(0.143) (0.105) (0.030) (0.134) (0.255) (0.011)Credit growtht�1 0.040nn �0.018 0.060nn 0.049nn �0.015 0.073nn
(0.003) (0.719) (0.011) (0.000) (0.746) (0.002)Capital Flows/GDPt�1 0.278nn 0.063 0.454nn 0.280nn 0.055 0.431nn
(0.023) (0.608) (0.006) (0.018) (0.648) (0.014)Inflationt�1 0.031nn 0.234nn 0.020nn 0.034nn 0.216n 0.023nn
(0.000) (0.024) (0.022) (0.000) (0.054) (0.010)Northern interest ratet�1 0.520nn 0.272# 0.418# 0.499nn 0.283# 0.475n
(0.014) (0.208) (0.121) (0.009) (0.156) (0.056)Currency Crisest�1 �0.006 0.005 �0.022# �0.007 0.009 �0.025nn
(0.627) (0.682) (0.149) (0.513) (0.519) (0.043)
Number of observations 1024 502 522 1073 526 547Wald chi-square 169.6 360.236 343.691 86.840 155.783 133.784Prob4chi-square 0.000 0.000 0.000 0.000 0.000 0.000
The dependent variable is the onset of banking crisis dummy. Regressions are estimated using thelogit model with robust and clustered standard errors within a country. The numbers in parenthesesare p-values. For sample, ALL, all sample; ADV, advanced economies; EMG, emerging markets.n,nnSignificance levels of 10% and 5%, respectively.#Coefficient value zero that falls outside one standard deviation of the estimate.
International Review of Finance
r 2010 The AuthorsJournal compilation r International Review of Finance Ltd. 2010278

Total FL. In Table 6, we replace Total FL with the three types of liberalization(behavioral liberalization, competitive liberalization, and privatization) toinvestigate whether different types of liberalization provide additionalinformation relative to the aggregate index. All tables report the marginaleffects from logit estimations.
Table 5 Interaction between the aggregate financial liberalization index andcapital regulation and supervision (marginal effects are reported)
Sample (1) (2) (3)ALL ADV EMG
Total FLt�1 0.0004 0.003 0.007#
(0.183) (0.573) (0.116)Total FLaverage, t�2 to t�4 0.002 0.001 0.005#
(0.341) (0.553) (0.119)(Total FLt�1)2 �0.0001 �0.00001 �0.0004#
(0.666) (0.959) (0.154)(Total FL�CRS)t�1 �0.004nn �0.003nn �0.006nn
(0.001) (0.047) (0.008)CRSt�1 0.044nn 0.049nn 0.047n
(0.006) (0.050) (0.100)DI coveraget�1 0.0004 �0.0001 0.001
(0.652) (0.932) (0.696)GDP/capitat�1 �0.009nn 0.020nn 0.003
(0.019) (0.044) (0.664)GDP growth ratet�1 �0.218nn �0.106# �0.382nn
(0.017) (0.483) (0.010)CA/GDPt�1 �0.285nn �0.183n �0.275nn
(0.004) (0.085) (0.048)M2/reservest�1 0.009# 0.006# 0.018nn
(0.117) (0.144) (0.019)Credit growtht�1 0.043nn �0.012 0.063nn
(0.001) (0.718) (0.006)Capital flowst�1 0.239nn 0.077 0.355nn
(0.042) (0.509) (0.019)Inflationt�1 0.032nn 0.179n 0.022nn
(0.000) (0.062) (0.015)Northern interest ratet�1 0.424nn 0.194# 0.443nn
(0.016) (0.240) (0.040)Currency crisest�1 �0.009 0.008 �0.024n
(0.341) (0.458) (0.023)
Number of observations 1073 526 547Wald chi-square 94.307 147.214 157.478Prob4chi-square 0.000 0.000 0.000
The dependent variable is the onset of banking crisis dummy. Regressions are estimated using thelogit model with robust and clustered standard errors within a country. The numbers inparentheses are p-values. For sample, ALL, all sample; ADV, advanced economies; EMG, emergingmarkets.n,nnSignificance levels of 10% and 5%, respectively.#Coefficient value zero that falls outside one standard deviation of the estimate.
Financial Liberalization and Banking Crises
r 2010 The AuthorsJournal compilation r International Review of Finance Ltd. 2010 279

The results in Table 3, columns (1), (3), and (5), where a linear relationshipbetween Total FL and the occurrence of banking crisis is assumed, are consistentwith the conventional wisdom that increased financial liberalization isassociated with a higher likelihood of banking crisis. The coefficient for Total
Table 6 Different types of financial liberalization and banking crises (marginaleffects are reported)
Sample (1) (2) (3) (4) (5) (6)ALL ADV EMG ALL ADV EMG
Behavioral liberalizationt�1 0.016n 0.015n 0.023n 0.004 0.002 0.008(0.056) (0.071) (0.072) (0.597) (0.791) (0.531)
Competitive liberalizationt�1 0.002 0.001 0.007# 0.001 �0.0005 0.006#
(0.588) (0.615) (0.202) (0.705) (0.797) (0.198)Privatizationt�1 �0.002 �0.004n �0.007# �0.002 �0.003n �0.005
(0.575) (0.069) (0.279) (0.613) (0.051) (0.400)Behavioralliberalizationaverage, t�2 to t�4
0.005# 0.003 0.007 0.005# 0.004# 0.006(0.271) (0.331) (0.373) (0.217) (0.163) (0.386)
(Behavioral liberalizationt�1)2 �0.002# �0.0001# �0.005nn 0.0003 �0.001 �0.001(0.118) (0.227) (0.034) (0.811) (0.597) (0.524)
(Behavioralliberalization�CRS)t�1
�0.012nn �0.007# �0.019nn
(0.001) (0.080) (0.002)CRSt�1 �0.013nn �0.003 �0.033nn 0.047nn 0.036n 0.052n
(0.026) (0.453) (0.004) (0.007) (0.082) (0.057)DI coveraget�1 0.001 0.0004 �0.0003 0.000 0.0001 �0.001
(0.609) (0.590) (0.861) (0.756) (0.887) (0.738)GDP/capitat�1 �0.009nn 0.017n 0.009# �0.007n 0.015nn 0.008#
(0.024) (0.080) (0.185) (0.051) (0.035) (0.222)GDP growth ratet�1 �0.224nn �0.090 �0.359nn �0.220nn �0.054 �0.352nn
(0.027) (0.482) (0.014) (0.017) (0.551) (0.010)CA/GDPt�1 �0.279nn �0.140 �0.360nn �0.285nn �0.101nn �0.296nn
(0.007) (0.212) (0.026) (0.004) (0.153) (0.027)M2/reservest�1 0.007# 0.005# 0.020nn 0.009# 0.005n 0.017nn
(0.199) (0.150) (0.019) (0.139) (0.079) (0.028)Credit growtht�1 0.048nn �0.012 0.074nn 0.042nn �0.012 0.064nn
(0.000) (0.766) (0.003) (0.000) (0.686) (0.004)Capital flows/GDPt�1 0.280nn 0.065 0.353n 0.238n 0.068 0.288n
(0.022) (0.488) (0.050) (0.052) (0.307) (0.090)Inflationt�1 0.031nn 0.172n 0.019nn 0.030nn 0.124 0.018n
(0.000) (0.098) (0.041) (0.000) (0.046) (0.051)Northern interest ratet�1 0.476nn 0.253# 0.458n 0.406nn 0.160n 0.384#
(0.021) (0.089) (0.100) (0.037) (0.146) (0.109)Currency crisest�1 �0.007 0.010 �0.023n �0.009# 0.007 �0.022n
(0.536) (0.499) (0.081) (0.303) (0.370) (0.054)
Number of observations 1073 526 547 1073 526 547Wald chi-square 85.052 637.658 181.316 95.171 374.871 185.334Prob4chi-square 0.000 0.000 0.000 0.000 0.000 0.000
The dependent variable is the onset of banking crisis dummy. Regressions are estimated using thelogit model with robust and clustered standard errors within a country. The numbers in parenthesesare p-values. For sample, ALL, all sample; ADV, advanced economies; EMG, emerging markets.n,nnSignificance levels of 10% and 5%, respectively.#Coefficient value zero that falls outside one standard deviation of the estimate.
International Review of Finance
r 2010 The AuthorsJournal compilation r International Review of Finance Ltd. 2010280

FL is positive and strongly significant in the regressions for all countries (ALL),advanced countries (ADV) as well as emerging market countries (EMG). Resultsin columns (2), (4) and (6) with respect to Hypothesis 1 referring to an invertedU-shaped relationship indicate that the conventional wisdom needs to benuanced. The hypothesis is supported by the significant, negative coefficientsfor Total FL squared in regressions for all countries as well as for the sub-samples. The Wald chi-square increases in all country groups when the squaredterm is included.
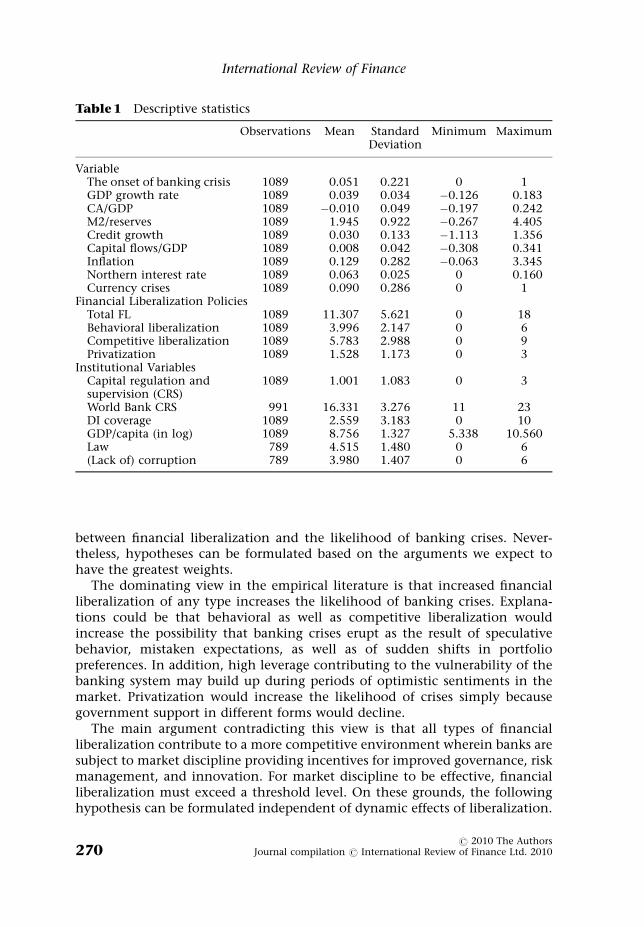
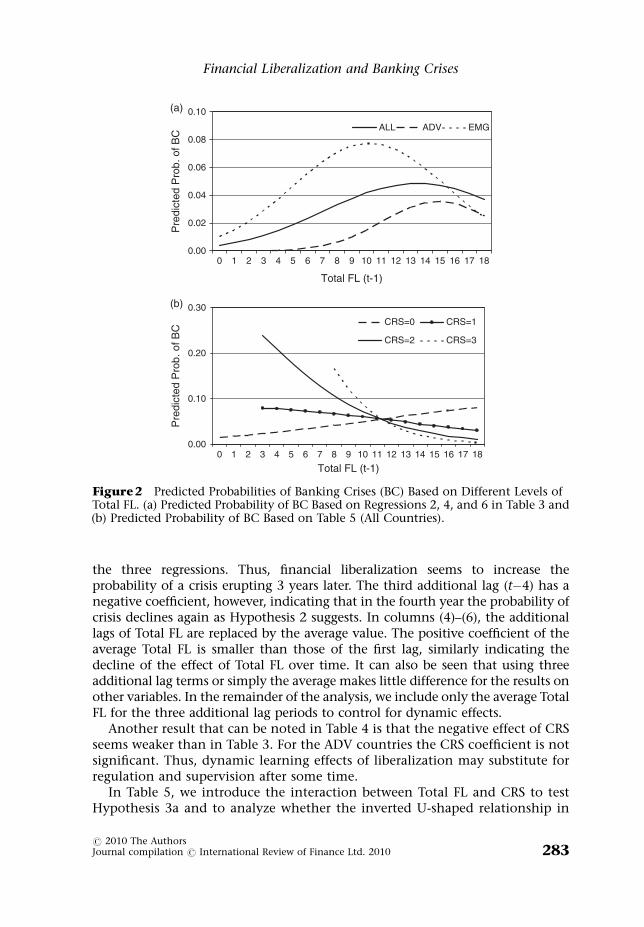
The inverted U-shaped relationship is also supported in Figure 1, where thefrequency of banking crises is shown for different levels of the three types ofliberalization. In Figure 2(a), the predicted probabilities of banking crises basedon the results in Table 3, columns (2), (4), and (6) are drawn at different levels ofTotal FL. The maximum probability occurs at an intermediate level ofliberalization for both country groups and for ALL countries. For EMGcountries, the maximum probability is much higher than for ADV countriesbut the maximum for the EMG countries occurs at a much lower level ofliberalization. Thus, the positive association between liberalization and thelikelihood of banking crises appears to hold only as long as financial marketsremain relatively repressed in emerging economies.
Among the institutional variables we control for, CRS and GDP/capita, aproxy for general institutional quality, have a significant negative effect on theprobability of banking crises for ALL countries. Their coefficients are lesssignificant for the two country groups wherein there is less variation in CRS andGDP/capita. Deposit insurance coverage as a standalone variable is far fromsignificance in all regressions.
Several macroeconomic variables affect the probability of banking crisessignificantly. The results are mostly consistent with the existing literature.Increased inflation and a higher world interest rate increase the likelihood ofbanking crises in both country groups. A low level of foreign exchange reservesrelative to M2 (higher M2/reserves) and higher credit growth are associated withgreater likelihood of banking crisis in emerging economies. Most interesting isthat greater capital flows are associated with a higher likelihood of bankingcrises in the EMG group, but not in ADV group of countries. A currency crisis inthe preceding year seems to reduce the likelihood of banking crises in EMGcountries, however.
In the following, we analyze how the results in Table 3 hold up when we takedynamic effects into account (Table 4), when we allow interaction betweenliberalization and institutional variables (Table 5), and when we distinguishamong types of liberalization (Table 6). In particular, we ask whether thequadratic relationship observed above remains.
Three lags of Total FL are included in the regressions presented in Table 4,columns (1)–(3), in addition to the Total FL with one lag. In columns (4)–(6),the average Total FL for the three additional lag periods substitutes for the threelag terms. The levels of Total FL for the four lags are highly correlated as shownin Table 2, panel B. Results must therefore be interpreted with some care.
Financial Liberalization and Banking Crises
r 2010 The AuthorsJournal compilation r International Review of Finance Ltd. 2010 281

Total FL the year before a banking crisis (t�1) remains significant in theregressions in Table 4. The negative squared term of Total FL remains significantin the regression for ALL countries and for EMG countries.
The dynamic pattern for the impact of liberalization implied by thecoefficients in columns (1)–(3) is only weakly consistent with Hypothesis 2.The first additional lag (t�2) has no explanatory power while the secondadditional lag (t�3) has a positive significant or nearly significant coefficient in
Frequency of BC and Behavioral Liberalization(scale of 0-6)
3.0%
6.8% 8.2% 4.1%
8.1% 9.9%
2.3%
050
100150200250300350400450
0 1 2 3 4 5 6
No.
of O
bser
vatio
ns
BC
Non-BC
Frequency of BC and CompetitiveLiberalization (scale of 0-9)
3.7%
9.1% 6.1%5.7%
8.5% 9.0%
5.2%4.5%
9.6%
2.5%
0
50
100
150
200
250
300
0 1 2 3 4 5 6 7 8 9
No.
of O
bser
vatio
ns
BC
Non-BC
Frequency of BC andPrivatization (scale of 0-3)
6.2%
5.1%
7.3%
2.5%
0
50
100
150
200
250
300
350
0 1 2 3
No.
of O
bser
vatio
ns
BC
Non-BC
Figure 1 The Frequency of Banking Crises under Different Types of Liberalization.
International Review of Finance
r 2010 The AuthorsJournal compilation r International Review of Finance Ltd. 2010282
the three regressions. Thus, financial liberalization seems to increase theprobability of a crisis erupting 3 years later. The third additional lag (t�4) has anegative coefficient, however, indicating that in the fourth year the probability ofcrisis declines again as Hypothesis 2 suggests. In columns (4)–(6), the additionallags of Total FL are replaced by the average value. The positive coefficient of theaverage Total FL is smaller than those of the first lag, similarly indicating thedecline of the effect of Total FL over time. It can also be seen that using threeadditional lag terms or simply the average makes little difference for the results onother variables. In the remainder of the analysis, we include only the average TotalFL for the three additional lag periods to control for dynamic effects.
Another result that can be noted in Table 4 is that the negative effect of CRSseems weaker than in Table 3. For the ADV countries the CRS coefficient is notsignificant. Thus, dynamic learning effects of liberalization may substitute forregulation and supervision after some time.
In Table 5, we introduce the interaction between Total FL and CRS to testHypothesis 3a and to analyze whether the inverted U-shaped relationship in
0.00
0.02
0.04
0.06
0.08
0.10(a)
(b)
0 1 2 3 4 5 6 7 8 9 10 11 12 13 14 15 16 17 18
Total FL (t-1)
Pre
dict
ed P
rob.
of B
C
ALL ADV EMG
0.00
0.10
0.20
0.30
0 1 2 3 4 5 6 7 8 9 10 11 12 13 14 15 16 17 18
Total FL (t-1)
Pre
dict
ed P
rob.
of B
C
CRS=0 CRS=1
CRS=2 CRS=3
Figure2 Predicted Probabilities of Banking Crises (BC) Based on Different Levels ofTotal FL. (a) Predicted Probability of BC Based on Regressions 2, 4, and 6 in Table 3 and(b) Predicted Probability of BC Based on Table 5 (All Countries).
Financial Liberalization and Banking Crises
r 2010 The AuthorsJournal compilation r International Review of Finance Ltd. 2010 283

Table 3 holds up when interaction is taken into account. Interactions betweendeposit insurance coverage and financial liberalization and between institu-tional quality (GDP/capita, rule of law, and lack of corruption) are not includedin Table 5 because these interaction terms were not significant. Appendix Cshows that deposit insurance and GDP/capita interactions are not significant.Hypotheses 3b and 3c are accordingly rejected.12
Table 5 shows that the significance of coefficients for Total FL and for Total FLsquared standing alone do not survive the inclusion of the interaction term.Only for EMG countries are the coefficients nearly significant. Instead, theinteraction term between CRS and Total FL is negative and significant while thesign for CRS alone becomes positive and significant or nearly significant.
To interpret the results more easily, Figure 2(b), shows the predictedrelationship between the probability of banking crises and Total FL at differentdegrees of strictness of CRS based on regression coefficients in column (1). Thefigure shows that in countries with very weak CRS (CRS50), the probability ofbanking crises increases with increased liberalization. In other countries withhigher values for CRS (CRS51, 2, and 3), the crisis probability decreases withincreased liberalization. Furthermore, the stricter the regulation and super-vision is the steeper is the decline in crisis probability with increasedliberalization.
To interpret these results further, it can be noted in Figure 2(b), that there areno observations for some combinations of CRS and Total FL. Specifically, thereare no countries with liberalization levels below 8 (out of 18) with strongregulation and supervision (CRS53). Thus, Total FL is correlated with CRS ascan be expected. This correlation in combination with different effects ofliberalization at different levels of CRS may explain the inverted U-shapedrelationship we observed when interactions were not included in theregressions.
Hypothesis 3a stating that strong regulation and supervision tends to makebanking crises more independent of the degree of liberalization is clearly notsupported. On the contrary, increased strength of regulation and supervisionseems to allow countries to benefit from increased competition and marketdiscipline associated with liberalization. This result could be sensitive to theparticular way strength of supervision and regulation is measured. We return tothis issue below.
The final step in the analysis is to introduce the three types of liberalizationinstead of Total FL. In Table 6, Total FL is replaced by behavioral liberalization,competitive liberalization, and privatization. In columns (1)–(3), the specifica-tion is the same as in Table 3 although the quadratic liberalization term isintroduced only for behavioral liberalization. In columns (4)–(6), the specifica-
12 The lack of significant effects of deposit insurance coverage can be explained by strong implicit
insurance of banks’ creditors in countries with little explicit coverage as noted in Angkinand
and Wihlborg (2010).
International Review of Finance
r 2010 The AuthorsJournal compilation r International Review of Finance Ltd. 2010284

tion is the same as in Table 5 although only behavioral liberalization interactswith CRS. We do not include quadratic terms and interactions for all types ofliberalization because the correlations among the types are quite high as shownin Table 2. We have chosen to include these terms with behavioral liberalizationbecause this type seems to have the highest explanatory value for theprobability of banking crises.
Distinguishing among different types of liberalization does not seem to addmuch explanatory value to the regressions in Tables 3 and 5. The additionalinformation obtained in Table 6 is that behavioral liberalization seems to be themost important type of liberalization from the point of view of its effect on thelikelihood of banking crises. However, it is important to note that the effects ofbehavioral and competitive liberalizations may not be separable with anycertainty because their correlation is as high as 0.80. Privatization, on the otherhand, is less correlated with the other types of liberalization. Our resultsindicate that increased privatization reduce the likelihood of banking crisesparticularly for the group ADV countries. The coefficients are not significant forall countries and the group EMG countries.13
As CRS seems to play a very important role for the results we want to seewhether the above results are robust when an alternative measure of the qualityof regulation and supervision is introduced. For this reason, we use an index forquality of regulation and supervision from the World Bank database (TheRegulation and Supervision of Banks around the World: a New Database). This indexis created in a completely different way from the CRS variable used above. CRSin the Financial Reform Database is based on assessment of availableinformation each year. The World Bank collects the data for financial regulationand supervision from country surveys and questionnaires referring to theorganization and legal framework for supervision. The data exist for only a fewyears. Thus, the World Bank database is most suitable for a cross-sectionalanalysis while the time-series aspect is an important factor in our analysisabove.14
Correlations in Table 2, panel A, show that the two proxies for CRS are hardlycorrelated at all. Thus, the time dimension is responsible for a large share of thevariation in our data. Appendix D shows that coefficients for the World BankCRS variable and its interaction terms are not significant but the signs ofcoefficients are the same as those in Table 5. The lack of any significant resultsfor the World Bank proxy indicates that effectiveness of regulation andsupervision has changed over time in many countries and affected the impactof financial liberalization.
13 We run regressions with each type of liberalization alone as well. In this case, both competitive
and behavioral liberalization are significant. Each type seems to substitute for Total FL but
behavioral liberalization appears to be most significant. Including only one type of
liberalization does not allow us to separate effects of each type because the one type included
in a regression captures effects of other types as well to the extent they are correlated.
14 We use the World Bank’s 2003 survey. The survey is also conducted in 1999 and 2007.
Financial Liberalization and Banking Crises
r 2010 The AuthorsJournal compilation r International Review of Finance Ltd. 2010 285

VI. CONCLUSION
The evidence presented in Tables 3–6 indicates that the common view thatfinancial liberalization leads to an increase in the likelihood of banking crises isnot robust. This commonly observed relationship may be the result of a lack ofovert financial crises in countries with severely repressed financial, governmentcontrolled, and subsidized financial system. A possible negative relationshipover a range of liberalization could be hidden in an analysis based on theassumption that the relationship is linear. In regressions disregarding interac-tion between institutional variables and financial liberalization but controllingfor institutional and macroeconomic variables, we find that liberalizationincreases the probability of banking crisis up to a partial level of liberalization.After this point, increasing liberalization reduces the probability of crisis. Thelevel of liberalization beyond which further liberalization reduces the likelihoodof banking crisis is relatively low in emerging market countries.
It was noted that the observed inverted U-shaped relationship betweenfinancial liberalization and the probability of banking crisis may be explainedby dynamic effects of liberalization or by interaction between liberalization andcorrelated institutional variables. The results indicate that interaction betweenstrength of CRS, and financial liberalization explains the mentioned finding.Taking this interaction into account, we find that financial liberalizationreduces the likelihood of banking crisis except in countries with the weakestregulation and supervision. Thus, stronger regulation and supervision enablecountries to obtain benefits of financial liberalization in terms of growth as wellas reduced likelihood of banking crisis.
With respect to dynamic learning effects, it was hypothesized that imple-mentation of liberalization may increase the likelihood of banking crisis for sometime before learning occurs and governance and risk-management skills developin a more competitive environment. This hypothesis was supported although thereduction in likelihood of crisis occurring with a 4-year lag was small.
When distinguishing among three types of financial liberalization: behavioralliberalization, competitive liberalization, and privatization, we find thatbehavioral liberalization explains most of the results obtained using the proxyaggregating all types of liberalization. Behavioral liberalization refers to theremoval of interest rate and quantitative credit controls. However, competitiveliberalization referring to an expansion in the scope of domestic and cross-borderfinancial activities is highly correlated with behavioral liberalization. The thirdtype of liberalization, privatization, is less correlated with other types but theeffect of privatization alone on the likelihood of banking crises seems to be weak.
One policy implication of the analysis is that positive growth effects offinancial liberalization can be obtained without a simultaneous increase in thelikelihood of banking crises. The positive growth effects are fairly wellestablished in the literature. At a minimum, the empirical evidence indicatesthat financial liberalization is a requirement for growth in a market economy.The results presented here indicate that financial liberalization may reduce the
International Review of Finance
r 2010 The AuthorsJournal compilation r International Review of Finance Ltd. 2010286

likelihood of banking crises as well if only a minimum effectiveness of CRS canbe achieved.
These policy implications may seem contrary to the experiences of the recentfinancial crisis that originated in the United States and, thereafter, affectedEuropean countries the most. Europe and the United States are generallyconsidered economies with relatively high degrees of liberalization as well asstrength of regulation and supervision. However, it should be noted that therecent financial crisis was not primarily a banking crisis in the traditional sensebut a securities market crisis in a country where traditional banking plays amuch smaller role than in the rest of the world.
Clas WihlborgChapman UniversityOne University Dr.Orange, CA 92866United [email protected]
REFERENCES
Abiad, A., E. Detragiache, and T. Tressel (2008), ‘A New Database of Financial Reforms’,IMF Working Paper No. 266, International Monetary Fund.
Abiad, A., and A. Mody (2005), ‘Financial Reform: What Shakes It? What Shapes It?’,American Economic Review, 95, 66–88.
Angkinand, A., and C. Wihlborg (2010), ‘Deposit Insurance Coverage, Ownership andBanks’ Risk-Taking in Emerging Markets’, Journal of International Money and Finance,29, 252–74.
Arestis, P., and P. Demetriades (1997), ‘Financial Development and Economic Growth:Assessing the Evidence’, Economic Journal, 107, 783–99.
Arestis, P., P. Demetriades, and K. B. Luintel (2001), ‘Financial Development and EconomicGrowth: The Role of Stock Markets’, Journal of Money, Credit and Banking, 33, 16–41.
Arestis, P., A. D. Luintel, and K. B. Luintel (2004), ‘Does Financial Structure Matter?’,Working Paper No. 399, The Levy Economics Institute of Bard College.
Barth, J. R., G. Caprio Jr., and R. Levine (2004), ‘The Regulation and Supervision: WhatWorks Best?’, Journal of Financial Intermediation, 13, 205–48.
Beim, D., and C. Calomiris (2000), Emerging Financial Markets. New York, NY: McGrawHill College.
Bekaert, G., C. Harvey, and C. Lundblad (2005), ‘Growth Volatility and FinancialLiberalization’, Journal of International Money and Finance, 24, 370–403.
Berger, A. N., L. F. Klapper, and R. Turk-Ariss (2008), ‘Bank Competition and FinancialStability’, Policy Research Working Paper No. 4696, The World Bank.
Caprio, G. Jr, and D. Klingebiel (1996), ‘Bank Insolvency: Bad Luck, Bad Policy, or BadBanking’, Presented at the Annual World Bank Conference on DevelopmentEconomics, 79–104. Washington, D.C.: World Bank.
Caprio, G. Jr, and D. Klingebiel, and L. Laeven, and G. Noguera (2005), ‘Banking CrisisDatabase’, in P. Honohan and L. Laeven (eds), Systemic Financial Crises: Containmentand Resolution. New York, NY: Cambridge University Press, pp. 307–40.
Financial Liberalization and Banking Crises
r 2010 The AuthorsJournal compilation r International Review of Finance Ltd. 2010 287

Christopoulos, D. K., and E. G. Tsionas (2004), ‘Financial Development and EconomicGrowth: Evidence from Panel Unit Root and Cointegration Tests’, Journal ofDevelopment Economics, 73, 55–74.
Daniel, B. C., and J. B. Jones (2007), ‘Financial Liberalization and Banking Crises inEmerging Economies’, Journal of International Economics, 72, 202–21.
Demetriades, P., and K. Hussein (1996), ‘Does Financial Development Cause EconomicGrowth? Time Series Evidence from 16 Countries’, Journal of Development Economics,15, 387–411.
Demirguc-Kunt, A., and E. Detragiache (2001), ‘Financial Liberalization and FinancialFragility’, in G. Caprio, P. Honohan and J. E. Stiglitz (eds), Financial Liberalization:How Far, How Fast? New York, NY: Cambridge University Press, pp. 96–124.
Demirguc-Kunt, A., B. Karacaovali, and L. Laeven (2005), ‘Deposit insurance aroundthe World: A comprehensive database’, World Bank Policy Research Working PaperNo. 3628, The World Bank: Washington, DC.
Desai, M. A., C. Fritz Foley, and J. R. Hines Jr. (2006), ‘Capital Controls, Liberalizations,and Foreign Direct Investment’, Review of Financial Studies, 19, 1433–64.
Diaz-Alejandro, C. (1985), ‘Good-Bye Financial Repression, Hello Financial Crash’,Journal of Development Economics, 19, 1–24.
Eichengreen, B., and C. Arteta (2002), ‘Banking Crises in Emerging Markets:Presumptions and Evidence’, in M. I. Blejer and M. Skreb (eds), Financial Policiesin Emerging Markets. Cambridge, MA.: MIT Press, pp. 47–94.
Fry, M. (1997), ‘In Favour of Financial Liberalization’, The Economic Journal, 107,754–70.
Glick, R., and M. Hutchison (2001), ‘Banking and Currency Crises: How Common areTwins?’, in R. Glick, R. Moreno, M. Spiegel (eds), Financial Crises in Emerging Markets.Cambridge, UK: Cambridge University Press, pp. 35–69.
Hellmann, T. F., K. C. Murdock, and J. E. Stiglitz (2000), ‘Liberalization, Moral Hazardin Banking, and Prudential Regulation: Are Capital Requirements Enough?’,American Economic Review, 90, 147–65.
Kaminsky, G., and C. Reinhart (1999), ‘The Twin Crises: The Causes of Banking andBalance-Of-Payments Problems’, The American Economic Review, 89, 473–500.
Kaminsky, G., and S. Schmukler (2008), ‘Short-Run Pain, Long-Run Gain: The Effectsof Financial Liberalization’, Review of Finance, 12, 253–92.
Laeven, L. (2003), ‘Does Financial Liberalization Reduce Financing Constraints?’,Financial Management, 32, 5–34.
Laeven, L., and F. Valencia (2008), ‘Systemic Banking Crises: A New Database’, IMFWorking Paper No. 224, International Monetary Fund.
Levine, R. (1997), ‘Financial Development and Economic Growth: Views and Agenda’,Journal of Economic Literature, 35, 688–726.
McKinnon, R. (1973), Money and Capital in Economic Development. Washington, DC:Brookings Institution.
Noy, I. (2004), ‘Financial Liberalization, Prudential Supervision, and the Onset ofBanking Crises’, Emerging Markets Review, 5, 341–59.
Ranciere, R., A. Tornell, and F. Westermann (2006), ‘Decomposing the Effectsof Financial Liberalization: Crises vs. Growth’, Journal of Banking & Finance, 30,3331–48.
Schmukler, S. (2004), ‘Financial Globalization: Gain and Pain for DevelopingCountries’, Federal Reserve Bank of Atlanta Economic Review, 89, 39–66.
Shaw, E. (1973), Financial Deepening in Economic Development. New York: OxfordUniversity Press.
Tornell, A., F. Westermann, and L. Martinez (2004), ‘The Positive Link BetweenFinancial Liberalization, Growth and Crises’, NBER Working Paper No. 10293,National Bureau of Economic Research.
International Review of Finance
r 2010 The AuthorsJournal compilation r International Review of Finance Ltd. 2010288
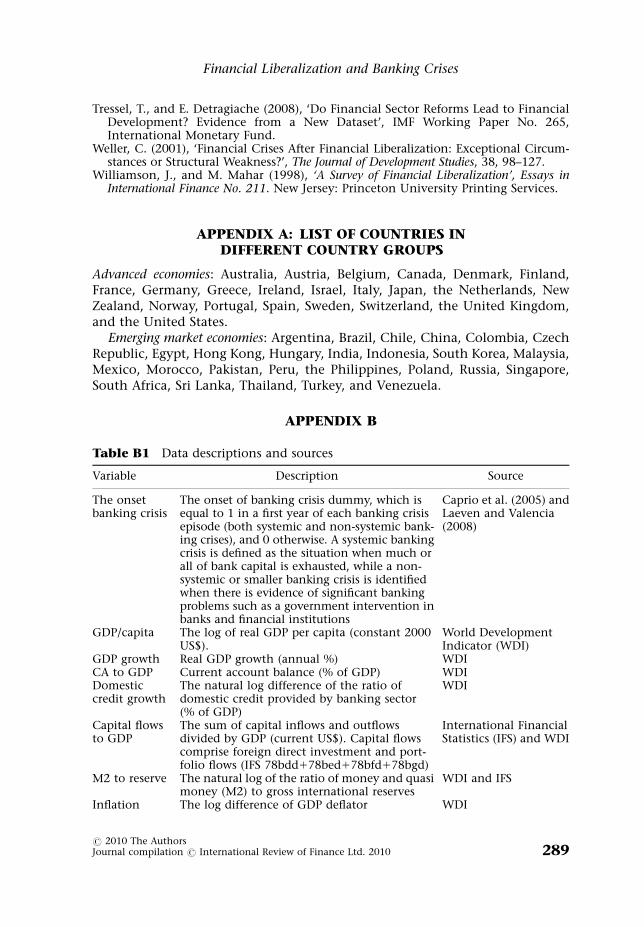
Tressel, T., and E. Detragiache (2008), ‘Do Financial Sector Reforms Lead to FinancialDevelopment? Evidence from a New Dataset’, IMF Working Paper No. 265,International Monetary Fund.
Weller, C. (2001), ‘Financial Crises After Financial Liberalization: Exceptional Circum-stances or Structural Weakness?’, The Journal of Development Studies, 38, 98–127.
Williamson, J., and M. Mahar (1998), ‘A Survey of Financial Liberalization’, Essays inInternational Finance No. 211. New Jersey: Princeton University Printing Services.
APPENDIX A: LIST OF COUNTRIES INDIFFERENT COUNTRY GROUPS
Advanced economies: Australia, Austria, Belgium, Canada, Denmark, Finland,France, Germany, Greece, Ireland, Israel, Italy, Japan, the Netherlands, NewZealand, Norway, Portugal, Spain, Sweden, Switzerland, the United Kingdom,and the United States.
Emerging market economies: Argentina, Brazil, Chile, China, Colombia, CzechRepublic, Egypt, Hong Kong, Hungary, India, Indonesia, South Korea, Malaysia,Mexico, Morocco, Pakistan, Peru, the Philippines, Poland, Russia, Singapore,South Africa, Sri Lanka, Thailand, Turkey, and Venezuela.
APPENDIX B
Table B1 Data descriptions and sources
Variable Description Source
The onsetbanking crisis
The onset of banking crisis dummy, which isequal to 1 in a first year of each banking crisisepisode (both systemic and non-systemic bank-ing crises), and 0 otherwise. A systemic bankingcrisis is defined as the situation when much orall of bank capital is exhausted, while a non-systemic or smaller banking crisis is identifiedwhen there is evidence of significant bankingproblems such as a government intervention inbanks and financial institutions
Caprio et al. (2005) andLaeven and Valencia(2008)
GDP/capita The log of real GDP per capita (constant 2000US$).
World DevelopmentIndicator (WDI)
GDP growth Real GDP growth (annual %) WDICA to GDP Current account balance (% of GDP) WDIDomesticcredit growth
The natural log difference of the ratio ofdomestic credit provided by banking sector(% of GDP)
WDI
Capital flowsto GDP
The sum of capital inflows and outflowsdivided by GDP (current US$). Capital flowscomprise foreign direct investment and port-folio flows (IFS 78bdd178bed178bfd178bgd)
International FinancialStatistics (IFS) and WDI
M2 to reserve The natural log of the ratio of money and quasimoney (M2) to gross international reserves
WDI and IFS
Inflation The log difference of GDP deflator WDI
Financial Liberalization and Banking Crises
r 2010 The AuthorsJournal compilation r International Review of Finance Ltd. 2010 289
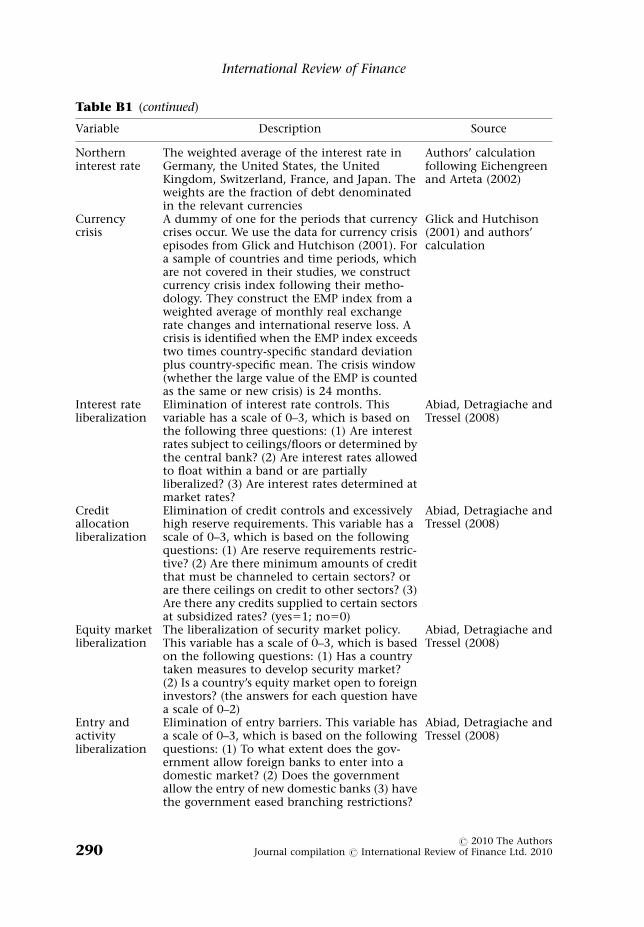
Table B1 (continued)
Variable Description Source
Northerninterest rate
The weighted average of the interest rate inGermany, the United States, the UnitedKingdom, Switzerland, France, and Japan. Theweights are the fraction of debt denominatedin the relevant currencies
Authors’ calculationfollowing Eichengreenand Arteta (2002)
Currencycrisis
A dummy of one for the periods that currencycrises occur. We use the data for currency crisisepisodes from Glick and Hutchison (2001). Fora sample of countries and time periods, whichare not covered in their studies, we constructcurrency crisis index following their metho-dology. They construct the EMP index from aweighted average of monthly real exchangerate changes and international reserve loss. Acrisis is identified when the EMP index exceedstwo times country-specific standard deviationplus country-specific mean. The crisis window(whether the large value of the EMP is countedas the same or new crisis) is 24 months.
Glick and Hutchison(2001) and authors’calculation
Interest rateliberalization
Elimination of interest rate controls. Thisvariable has a scale of 0–3, which is based onthe following three questions: (1) Are interestrates subject to ceilings/floors or determined bythe central bank? (2) Are interest rates allowedto float within a band or are partiallyliberalized? (3) Are interest rates determined atmarket rates?
Abiad, Detragiache andTressel (2008)
Creditallocationliberalization
Elimination of credit controls and excessivelyhigh reserve requirements. This variable has ascale of 0–3, which is based on the followingquestions: (1) Are reserve requirements restric-tive? (2) Are there minimum amounts of creditthat must be channeled to certain sectors? orare there ceilings on credit to other sectors? (3)Are there any credits supplied to certain sectorsat subsidized rates? (yes51; no50)
Abiad, Detragiache andTressel (2008)
Equity marketliberalization
The liberalization of security market policy.This variable has a scale of 0–3, which is basedon the following questions: (1) Has a countrytaken measures to develop security market?(2) Is a country’s equity market open to foreigninvestors? (the answers for each question havea scale of 0–2)
Abiad, Detragiache andTressel (2008)
Entry andactivityliberalization
Elimination of entry barriers. This variable hasa scale of 0–3, which is based on the followingquestions: (1) To what extent does the gov-ernment allow foreign banks to enter into adomestic market? (2) Does the governmentallow the entry of new domestic banks (3) havethe government eased branching restrictions?
Abiad, Detragiache andTressel (2008)
International Review of Finance
r 2010 The AuthorsJournal compilation r International Review of Finance Ltd. 2010290
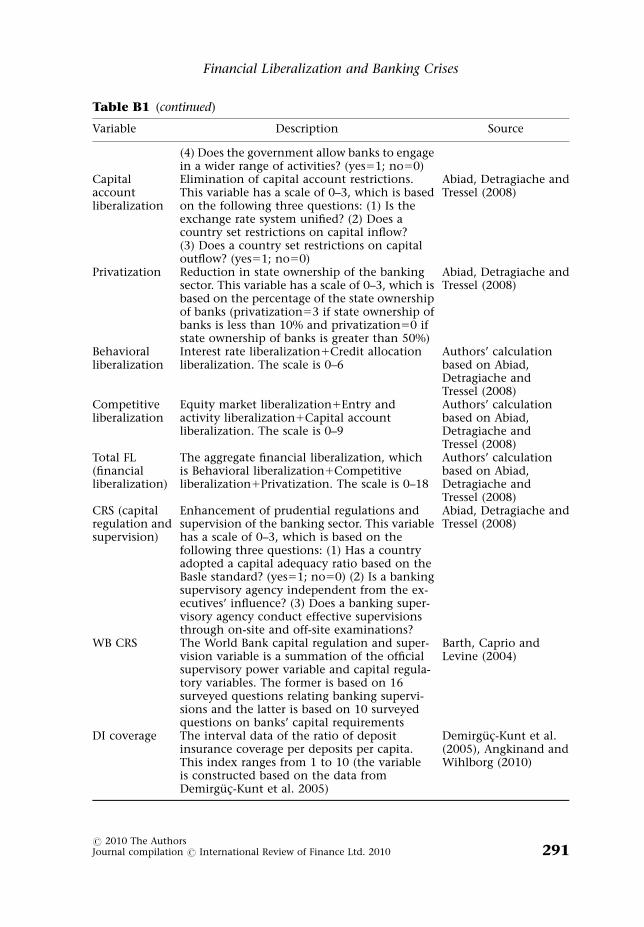
Table B1 (continued)
Variable Description Source
(4) Does the government allow banks to engagein a wider range of activities? (yes51; no50)
Capitalaccountliberalization
Elimination of capital account restrictions.This variable has a scale of 0–3, which is basedon the following three questions: (1) Is theexchange rate system unified? (2) Does acountry set restrictions on capital inflow?(3) Does a country set restrictions on capitaloutflow? (yes51; no50)
Abiad, Detragiache andTressel (2008)
Privatization Reduction in state ownership of the bankingsector. This variable has a scale of 0–3, which isbased on the percentage of the state ownershipof banks (privatization53 if state ownership ofbanks is less than 10% and privatization50 ifstate ownership of banks is greater than 50%)
Abiad, Detragiache andTressel (2008)
Behavioralliberalization
Interest rate liberalization1Credit allocationliberalization. The scale is 0–6
Authors’ calculationbased on Abiad,Detragiache andTressel (2008)
Competitiveliberalization
Equity market liberalization1Entry andactivity liberalization1Capital accountliberalization. The scale is 0–9
Authors’ calculationbased on Abiad,Detragiache andTressel (2008)
Total FL(financialliberalization)
The aggregate financial liberalization, whichis Behavioral liberalization1Competitiveliberalization1Privatization. The scale is 0–18
Authors’ calculationbased on Abiad,Detragiache andTressel (2008)
CRS (capitalregulation andsupervision)
Enhancement of prudential regulations andsupervision of the banking sector. This variablehas a scale of 0–3, which is based on thefollowing three questions: (1) Has a countryadopted a capital adequacy ratio based on theBasle standard? (yes51; no50) (2) Is a bankingsupervisory agency independent from the ex-ecutives’ influence? (3) Does a banking super-visory agency conduct effective supervisionsthrough on-site and off-site examinations?
Abiad, Detragiache andTressel (2008)
WB CRS The World Bank capital regulation and super-vision variable is a summation of the officialsupervisory power variable and capital regula-tory variables. The former is based on 16surveyed questions relating banking supervi-sions and the latter is based on 10 surveyedquestions on banks’ capital requirements
Barth, Caprio andLevine (2004)
DI coverage The interval data of the ratio of depositinsurance coverage per deposits per capita.This index ranges from 1 to 10 (the variableis constructed based on the data fromDemirguc-Kunt et al. 2005)
Demirguc-Kunt et al.(2005), Angkinand andWihlborg (2010)
Financial Liberalization and Banking Crises
r 2010 The AuthorsJournal compilation r International Review of Finance Ltd. 2010 291

APPENDIX C
APPENDIX D
Table C1 Interactions with CRS, GDP/capita, and deposit insurance
Sample (1) (2) (3)ALL ADV EMG
Total FLt�1 �0.003 �0.009 0.004(0.569) (0.559) (0.675)
Total FLaverage, t�2 to t�4 0.003# 0.0008 0.006#
(0.265) (0.606) (0.109)(Total FLt�1)2 0.0003# �0.0001 0.0005#
(0.192) (0.710) (0.137)(Total FL�CRS)t�1 �0.004nn �0.003nn �0.006nn
(0.001) (0.083) (0.010)(Total FL�DI coverage)t�1 0.000 0.00001 0.0001
(0.570) (0.817) (0.669)(Total FL�GDP/capita)t�1 0.001nn 0.002 0.0004
(0.088) (0.520) (0.727)CRSt�1 0.044nn 0.037nn 0.048#
(0.004) (0.088) (0.114)DI coveraget�1 �0.001 �0.001 �0.0004
(0.747) (0.813) (0.885)GDP/capitat�1 �0.019nn �0.004 �0.001
(0.009) (0.908) (0.931)
Number of observations 1073 526 547Prob4chi-square 0.000 0.000 0.000
Note: This table has the same model specification as in Table 5 with the inclusion of interactionterms between Total FL and DI coverage/GDP per capita. Control variables are included, but notreported. Also see note from Table 5.n,nnSignificance levels of 10% and 5%, respectively.#Coefficient value zero that falls outside one standard deviation of the estimate.
Table D1 Using CRS from the regulation and supervision of banks around theworld: A new database
Sample (1) (2) (3)ALL ADV EMG
Total FLt�1 0.0119nn 0.0203nn 0.0165#
(0.094) (0.014) (0.197)Total FLaverage, t�2 to t�4 0.0006 0.0006 0.0020
(0.804) (0.825) (0.575)(Total FLt�1)2 �0.0004nn �0.0005nn �0.0008nn
(0.054) (0.039) (0.024)(Total FL�WB CRS)t�1 �0.0001 �0.0002# �0.0002
(0.684) (0.223) (0.755)CRSt�1 0.0004 0.0042# �0.0004
(0.925) (0.226) (0.961)
Number of observations 975 477 498Prob4chi-square 0.000 0.000 0.000
Note: This table has the same model specification as in Table 5, but uses the data for capitalregulation and supervision from Barth et al. (2004) from the World Bank. Control variables areincluded, but not reported. Also see note from Table 5.
International Review of Finance
r 2010 The AuthorsJournal compilation r International Review of Finance Ltd. 2010292