liberalization, ownership and productivity in turkish banking
TRANSCRIPT

The ERF Working Paper Series disseminates the findings of research working progress to promote the exchange of ideas and encourage discussion and comment among researchers for timely revision by the authors.
The Working Papers are intended to make preliminary research results available with the least possible delay. They have therefore not been made subject to formal review and ERF accepts no responsibility for errors.
The views expressed in the Working Papers are those of the author(s). Unless otherwise stated, copyright is held by the author(s). Requests for permission to quote their contents should be addressed directly to author(s).
7 Boulos Hanna St. Dokki, Cairo, Egypt
Tel: (202) 3370810 – (202) 7485553 – (202) 7602882 Fax: (202) 7616042. Email: [email protected]. Website: http://www.erf.org.eg
LIBERALIZATION, OWNERSHIP AND PRODUCTIVITY IN TURKISH
BANKING
Ihsan Isik, Ugur Meleke & Ebru Isik
Working Paper 0218
As of August 1998, financial support towards the ERF Working Papers Seriesfrom the Commission of the European Communities (through the FEMISEProgram) is gratefully acknowledged. The views expressed in the Working Papersare those of the authors and do not necessarily reflect the views of the EuropeanCommission.
Abstract
This paper examines productivity developments in public, private and foreign banks operating in Turkey over the initial post-liberalization period. With the help of a DEA-type Malmquist index approach, it also tries to explore the contributions of technological change, efficiency change and scale change to productivity growth. The results indicate that all forms of banks benefited from the liberal environment and the performance gap between public and private banks got narrowed. The major source of productivity gains is scale changes for domestic banks and technical progress for foreign banks. Moreover, the pace of productivity growth became stronger as the reforms accelerated and competition reined in the market. In terms of productivity growth, foreign banks strongly dominate domestic banks and there are no observed advantages accruing to larger banks.
1. Introduction
Measurement of X-efficiency in banking has become a very popular avenue in applied finance and economics in recent years. This popularity among researchers has a strong theoretical and practical base since Berger et al. (1993) demonstrated that the resource waste resulting from operating off the best-practice frontier (X-inefficiency) far exceeds the production costs resulting from either operating at an incorrect scale (scale inefficiency) or having a non-optimal mix of service and product lines (scope inefficiency). Benchmark frontiers required in the measurement of X-efficiency are constructed using either parametric (Aigner et al., 1977; Meeusen and van den Broeck, 1977) or nonparametric models (Charnes et al., 1978). Since their inception, there have been numerous studies that extended and applied these models in banking and other areas.1 In reality, all of these models either explicitly or implicitly draw upon the seminal work of Farrel (1957), who provided the initial framework for measuring the concept of efficiency frontier and the distance of the sample units from the estimated frontier. However, Leibenstein (1966) was the pioneering spirit in explaining the causes and effects of inefficient behavior observed in decision-making units. Button and Weyman-Jones (1992) view Farrel and Leibenstein as representing two different ‘spirits’ or ‘schools of thoughts’ in the economic theories underlying X-efficiency. While the Farrell School is essentially concerned with satisfactory measurement of productive efficiency and issue of how it can be computed in practice, the Leibenstein School is primarily concerned with explaining why firms might not be achieving maximal efficiency in their productive decisions and behaviors. In their critique and review of X-efficiency studies, Button and Weyman-Jones caution that: “the majority were preoccupied with measurement (as in the Farrel approach), rather than explanation (in the Leibenstein tradition)”.
Similarly, after surveying the extensive literature from different countries and different types of institutions (e.g. banks, bank branches, S&Ls, credit unions, and insurance companies), Berger, Hunter and Timme (1993), Berger and Humphrey (1997), Berger, Demsetz and Strahan (1998) acknowledge the above point and suggest that more research is warranted in the area of explaining efficiency differences between different banks with the help of the latest theoretical advances in economics and finance. Furthermore, all of these survey studies admit that: “most of the empirical research has focused on U.S. banking organizations” and thus “with so few cross-country comparative efficiency studies to draw upon, the results obtained so far should be taken with caution”.
1 According to Seiford (1996), between 1978 and 1995, over 400 articles, books and dissertations were published involving DEA, a non-parametric method, alone. See Fare et al. (1985) for extensions and Charnes et al. (1994) for applica3tions. For survey studies on banking efficiency, see Berger et al. (1993), Berger and Humphrey (1997), and Berger et al. (1998).
Hence, “future studies ought to focus on recent data from many nations”. Evidently, within their 130 and 250 reference long survey papers, respectively, Berger and Humphrey (1997) cite only one Turkish bank study, and Berger et al. (1998) cite none. The underlying reason, actually, is the limited existence of empirical studies on Turkish banks, especially in the area of productive efficiency (Mercan and Yolalan, 2000). In pursuit of complementing the literature, this paper is to study the sources of productivity and efficiency developments in Turkish banks by ownership, drawing particularly on the initial post liberalization experience of public, private and foreign banks in Turkey.
According to Leibenstein (1978), the basic proposition of X-efficiency theory is that market structure aspects are critical in determining the optimal behavior of firms in production of services and goods. The degree of competitiveness in a firm’s market, the extent to which it is formed as a part of public sector bureaucracy, the nature of regulatory regime under which a firm operates are among the primary factors that may explain X-efficiency. Also, as the quite life theory suggests, the lower the intensity of environmental pressures, the lower the effort expended by managers to derive the maximal output from a given amount of inputs. Moreover, the extent to which a firm has the right organizational structure or ownership form that presents the necessary managerial skills and incentives to adapt to rapid changes in the operating environment and the extent to which a firm has international outlet for its idle resources or access for new technology are other possible sources of variations in X-efficiency among different groups of banks. Hence, the economic theory postulates that liberalization and deregulation of financial markets could heighten the competitive pressures on banks and thereby foster their efficiency and productivity. A more liberal environment relaxes barriers against new entries from internal and external markets and industries, tolerates expansion efforts of banks through new branches and mergers, allows new products and services, reduces regulatory taxes that rise banking costs, creates incentives to develop systems to streamline operations in pursuit of higher profits and survival. All these changes in the operating environment present banks new opportunities to expand their outputs as well as incentives to ration their inputs, both of which consequently lead to higher productivity and efficiency in operations.
As a reflection of the financial liberalization program that was launched in 1980, the Turkish financial system has undergone fundamental changes. The abolition of directed credit policies, liberalization of deposit and loan interest rates and liberal exchange rate policies and the adoption of international best standard banking regulations have accelerated the structural transformation of the banking sector (BDDK and BAT, 2001). An in-depth study of different groups of banks is very important for policy and research concerns especially in this new and challenging environment. First and foremost, to detect the extents and sources of inefficiency (waste of resources) in each organizational form is the first step for
policy makers towards writing right prescriptive measures to tackle the current and future problems of these institutions, which occupy a prominent role in the Turkish economic system. Second of all, like virtually in all emerging markets, banks are the dominant financial institution in Turkey, as they control most of the financial flows and possess 75 percent of the total assets in the financial system. Given the fact that majority of non-bank financial institutions are also affiliates of banks, the dominance of banks in the financial system becomes even greater. Thus, their successes or failures strongly affect the health of the economy at large as demonstrated repeatedly in recent years. Also, bank markets in emerging economies in contrast to those of advanced economies are highly concentrated. While three-bank concentration ratio is 0.19 for the US, 0.22 for Japan, it is 0.44 for Turkey, 0.65 for Egypt, 0.69 for Peru, 0.74 for Pakistan and 0.87 for Uruguay (Demirguc-Kunt and Levine, 1999). It is possible that banks of concentrated markets become less motivated to operate efficiently and productively, as they do not face strong competition from new banks and non-bank financial institutions. The lack of developed money and capital markets also presents comfort for banks of emerging countries, as disintermediation from depositors and borrowers does not threaten their business like in developed markets. Besides, state interventions are more frequent and state and private banks operate side by side in emerging economies. Hence, studies from different regulatory environments and market structures may let us learn the impact of these differences on bank performance.
The great majority of earlier studies of financial liberalization have focused on its impact on the performance of the entire banking industry. However, a limited number of new studies began to examine the association between organizational form and bank performance during times of liberalization such as Grifell-Tatje and Lovell, 1997 (savings X commercial Spanish banks); Bhattacharyya, Lovel and Sahay, 1997 (foreign X Indian state and private banks); Leightner and Lovell, 1998 (small banks X large banks / foreign banks X Thai banks); Wheelock and Wilson, 1999 (small X large US banks) and Sathye, 2001 (foreign X Australian banks). Many earlier studies used limited number of years in their analysis, which is inadequate according to Burger and Humphrey (1997), to capture the long-term benefits of liberalization. Also, they mostly subscribe to the Farrell school of X-efficiency in that they only quantify and report the performance scores of banking groups during liberalization with little effort to uncover the underlying reasons behind the efficiency and productivity developments. Zaim (1995) provided some initial evidence about the positive impact of liberalization on Turkish banks’ efficiency. However, his study focused exclusively on industry level effects of liberalization, which make it intuitive but not conclusive about the productivity aspects of liberalization for different forms of banks operating in Turkey. Moreover, comparing efficiency across years tells only part of the story, because changes in distance function
values from one year to another could be either due to 1) movements of banks within input/output space or 2) to technological change, that is, shift of the production frontier over time (Berg et al., 1992; Gilbert and Wilson, 1998; Wheelock and Wilson, 1999). 2
In the spirit of Leibenstein (1966, 1978), this study explores the interactions between the changes in the regulatory, market and firm characteristics of financial institutions. In particular, using a DEA-type Malmquist index and 10-year series of data (1981-90), this paper aims to explain the developments in the productivity and efficiency of Turkish banks with the changes in their operating environment (financial liberalization), variations in their sizes (small X large) and differences in their ownership and organizational structures (domestic X foreign / public X private). Moreover, it employs two alternative models for measuring productivity and efficiency in banking: (1) traditional banking approach, where banks accept deposits and transform them into an array of interest earning services (on-balance sheet activities), (2) non-traditional banking approach, where banks accept deposits and turn them into a mix of fee generating and interest earning services (off-balance sheet and on-balance sheet activities). Our results indicate that the performance of all forms of banks, whether public or private or foreign, rose after liberalization. Foreign banks reaped the highest benefit from the new environment, followed by private and public banks, respectively. Unlike foreign banks, domestic banks owe their productivity growth mainly to scale changes rather than technical progress. Accounting for non-traditional bank services improved the performance of private banks more than that of public banks.
The paper is structured as follows. Section 2 summarizes the evolution of Turkish banking. Section 3 discusses the empirical setting and data. Section 4 introduces the methodology. Section 5 presents empirical results and analysis. Section 6 concludes.
2 With limited number of years Zaim (1995)’s study was mainly concerned with whether Turkish banks’ proximity to efficient frontier increased in 1990 with respect to that in 1981. As Berger & Humphrey (1997) point out, a long number of years are needed to judge the efficiency impacts of liberalization. Further, Zaim does not study the productivity development, efficiency change, scale change and technical progress issues. According to Berg et al. (1992) & Wheelock & Wilson (1999), the trend in annual efficiency scores may not accurately reflect the true impact of liberalization when the benchmark frontiers, against which efficiency scores are computed, are subject to change. Although related, efficiency and productivity concepts refer to different aspects of bank performance. Such that, as the efficiency of banking industry decreases its productivity increases. Please see Wheelock & Wilson (1999) for an excellent discussion of this case.
2. Institutional Background of the Turkish Banking Sector 3 Whether the set of financial reforms launched in the 1980s to enhance competition in the financial markets has achieved its targets calls for a closer scrutiny over changes in banking over time. Table 1 displays recent trends in Turkish banking for industry as well as for sub-groups of banks. As of 2000, there are 79 banks operating in Turkey, of which 15 are domestic public banks (including banks in state custody), 28 are domestic private banks, 18 are foreign banks and the rest are development and investment banks. The sector has enjoyed an impressive rate of growth in recent years, with assets increasing from $18,631 million (31 percent of GNP) in 1980 to $155,237 million (80 percent of GNP) in 2000. Public and private banks coexist in Turkey’s mixed economic system, where the market share of public sector in banking, 43 percent, is almost matching that of private sector, 47 percent. The record number of foreign bank entries into the system is the defining feature of the Turkish banking industry in the 1980s (net 24 entries between 1980 and 1990, including the development and investment bank entries). However small the market share of foreign banks is (less than 10 percent of the sector assets by 2000), the impact of foreign banks on Turkish banking is remarkable because of the new practices they have introduced (Denizer, 1999).
The evolution of the Turkish banking sector into the current different ownership forms (public, private and foreign) dates back to the 19th century. Since engaging in interest carrying transactions was deemed ‘profane’ and ‘ungodly’ in the Ottoman’s society, foreigners or the minorities in Istanbul conducted all banking activities of these times. Because the financial condition of the Ottoman Empire had worsened after the Crimean War, the Empire had to call for external financial support. Large numbers of foreign banks responded with the hope of earning high interest rates. As a reaction to the increased role and power of foreigners in banking, the national banking movement that emerged during the years following the Second Constitution (1908) led to the foundation of 24 national banks in Istanbul and Anatolia between the years 1908 and 1923. However, these domestic banks were mostly local and too small to finance the newly developing economy. Thus, foreign banks continued to dominate banking markets due to insufficient domestic capital, consecutive wars between 1911-1922, and capitulations given to foreigners (IGEME).
Upon the downfall of the Ottoman Empire after the World War I, the newborn Turkish republic had to face a mounting number of economic issues. The first Izmir Economic Congress held in 1923 to address these issues decided that the state would be the engine of the economic growth and public banks would support main sectors of the economy until the private capital accumulates. 3 This section benefits extensively from BAT, IGEME and BDDK reports as well as Akguc (1992) and Denizer (1997).
Accordingly, several public banks were established to operate in commercial, industrial, and housing loan markets. Thanks to these newly formed public banks, Turkey had a significant rate of growth during the 1950s despite World War II. Positive developments in the private sector, expansion of international cooperation and transition to a multi-party political regime gradually weakened “etatism” in Turkey (Okyar, 1965). However, a large number of private bank failures in the 1960s led to “planned development” periods. According to this system, the state would command the public sector and issue advice to the private sector through 5-year plans prepared by the government. This era gave a larger role to the state in the allocation and mobilization of resources through directed credit programs and subsidized lending to priority sectors. According to Hanson and Neal (1986), only 25 percent of total credit in Turkey was free from government control as late as 1983.
The late 1970s witnessed the rapid growth of private banks controlled by industrial behemoths. Due to lack of capital markets, industrial firms had no option but to open or acquire banks to meet their funding needs, as state banks were primarily dedicated to funding public investments. During this period, rapidly rising inflation rates made borrowing very attractive for banks, which resulted in a frantic expansion of bank branches all over the country. At the same time, there were only 3 new private bank entries and no foreign bank entry in the 70s, implying the existence of the effective regulatory barriers discouraging new entries. Thus the growth efforts of already large existent banks caused extreme diseconomies of scale problems, whose negative effects even prevailed in the post liberalization period.
In 1983, following the three years of military rule, a new government rich, with internationally experienced bureaucrats and technocrats, came into power. Complementing the January 1980 New Economic Policy, this team designed a series of reform packages coined as “December 1983 and January 1984 Decisions”. The main theme of the reforms was to augment the efficiency and productivity of the financial system by fostering competition among economic units. Also, the switch to an export oriented economy accelerated the opening process of a once closed economy to the world. By 1989, the process of capital account liberalization was completed, as capital flows were fully liberalized in the external accounts. Parallel to this trend, most directed credit programs and preferential rates were eliminated contributing to more efficient allocation of resources in Turkey (Denizer, 1997). Privatization of state economic enterprises was also within the priorities of the consecutive Ozal governments (Altunbas et al., 1994).
Parallel to these liberal policies, new types of financial institutions and instruments were allowed and a record number of foreign and domestic institutions entered the market. Interest and foreign exchange rates were freed.
Starting from 1984, residents and non-residents were permitted to hold FX deposits, which boosted the volume of bank transactions. Such that the level of the FX deposits started to surpass the level of the TL deposits in the sector. Special finance houses, doing business according to Islamic banking principles, were also allowed in 1984. The first sale of Government securities via periodic auctions started in 1985. The Istanbul Stock Exchange (ISE) and Inter-bank Money Market were formed in 1986. In 1987, Open Market operations started and banks began to be audited by independent auditors. Turkey joined SWIFT and Foreign Exchange and Foreign Banknote Markets were established in 1989. In 1992, an electronic funds transfer system was installed for direct crediting in the banking system. The Turkish Interbank Clearing System was launched in 1992. During 1995, the Gold Exchange started to operate in Istanbul.
The Banking and Insurance School of T.C. Ziraat Bankasi was founded to prepare tomorrow’s Turkish bankers for a possible integration with EU. In addition, DC Gardner Turkey and several other private training firms entered the market to meet the increasing demand among bankers for learning new financial instruments and practices. In addition to computerization and automation projects, these training programs for bank manpower boosted sector growth. Moreover, the introduction of new markets facilitated the control of liquidity and interest rate risks and the diversification of assets and liabilities. As markets became more complete, banks became able to distribute clients’ portfolio risks to the broader investment areas. Trading in foreign currencies, asset-backed securities, mutual fund shares, corporate bonds, commercial papers, Treasury securities and negotiating and underwriting these securities, establishing mutual funds and providing financial consultation are among the additional banking services this era brought in. The use of new financial methods, such as leasing and factoring, has also promoted market development. Turkish banks, large or small, also took an increasing interest in doing business abroad and engaging in international markets dealing with extensive off-balance sheet activities such as swaps and forward agreements. Banks have increasingly put emphasis on service quality because consumer banking became the fastest growing sectors of their business, possibly reflecting the heightened competition among Turkish banks as they seek to develop high quality services aimed to satisfy client needs better.
The abolishment of interest rate ceilings, reductions in the reserve and liquidity requirements, financial taxes, restrictions on foreign exchange operations as well as barriers on entry and exit have indeed provided a more liberal and contestable financial environment. Within this new environment, bank managers who enjoyed a “quiet life” for a long time, understood the significance of running their banks efficiently, which was something they had overlooked before. Consequently, they first concentrated on computerization and automation projects to increase speed, quality and efficiency of banking services. As can be seen from Table 1, advances in terms of technology infrastructure were
remarkable in Turkish banking with a sharp increase in number of ATMs, use of on-line banking services, use of Electronic Funds Transfer and SWIFT systems. Banking services have also expanded and bankcard and credit card use has increased rapidly. Although Turkish banks started to issue credit cards just in August 1988, the number of credit cards in Turkey increased from 1 million in 1992 to 13.6 million in March 2001, a growth rate that is much higher than the EU average (Denizer, 1999). Another response by Turkish banks to the heightened pressures of the new environment was to shut down or downsize unprofitable branches. Like in other liberalization episodes, such as in the US experience, after the interest rate ceilings were lifted, a competitive scramble outburst among banks to attract scarce deposits in the market. As depicted in Figure 1.1, this intense competition caused funding costs of banks to soar, reaching about 80 percent of the total bank costs at times in the 1980s for all groups of banks. This sudden jump in interest costs severely weakened financial conditions of some small banks and newly formed banker houses between 1982 and 1983, a period dubbed as ‘banker crisis era”. Turkish banks took rapid measures to tackle increased funding costs. First, they established ‘friendship pacts’ among each other to control running interest expenses. Despite this overt collusion, the share of interest expenses in total costs was still far greater in the post-liberalization era than what they were in the pre-liberalization era, as can be seen from Figure 1.1. Secondly, banks adopted restructuring policies to curb the increasing banking costs by trimming their most variable input factor, labor. In parallel to the ‘branching mania’ of the pre liberalization era, over-employment had exacerbated in the sector. However, downsizing efforts induced by competitive pressures resulted in a notable reduction in the number of employees per bank in the sector (from 3,303 in 1980 to 2,444 1990). As Figure 1.2 indicates, large layoffs, coupled with extensive branch closures, tremendously reduced the fraction of labor expense in the total costs of all types of banks, taking it from 45 percent by the end of the 1970s to less than 15 percent by the end of the 1980s.
Apparently, funding costs of Turkish banks have more than doubled in the post-liberalization environment, which abruptly halted the free ride of a guaranteed spread between asset yields and liability costs. However, increased funding costs and following survival threats have disciplined banks in resource management, as suggested by substantial downsizing and automation efforts during the era. These cursory observations suggest that financial reforms fostered incentives to control costs and boost revenues for Turkish banks, both of which are essential steps towards more productive and efficient banking sector. However, how and to what extent the counteractive developments of the new era affected the productivity, technology and efficiency of Turkish banks are subject to an empirical testing.
The economic theory maintains that as entry and exit barriers are reduced, new financial instruments and institutions are allowed, expansion to new markets and regions are permitted, competitive pressures will rise and inefficient banks will either quit or take measures to improve their productivity and efficiency. Thus, we expect that regardless of ownership form, the impact of financial liberalization on Turkish banks will be positive. However, as Berger and Humphrey (1997) stated, the conventional expectation, which holds that deregulation always improves efficiency and productivity, may not come true given that in some cases deregulation led to a reduction in measured productivity rather than an improvement. Unlike in Norway (Berg et al., 1992), Taiwan (Shyu, 1998), Thailand (Leightmer and Lovell, 1998), Korea (Gilbert and Wilson, 1998; Hao et al., 2001), and India (Bhattacharyya et al., 1997), the consequences of deregulation were negative in Spain (Lozano 1995; Grifell-Tatje and Lovell, 1997; Khumbhakar et al., forthcoming) and USA (Grabowski et al., 1994; Humphrey and Pulley, 1997; Wheelock and Wilson, 1999). A desire to expand market share in Spain and a competitive scramble to pay higher deposits interest rates in the US are the main arguments of the relevant literature about these unexpected outcomes.4 As it seems, this issue is still unresolved and requires further studies and analyses from other country episodes.
On the other hand, this paper agrees with the notion in the literature that although financial deregulation could boost banking performance, the extent of its impact may vary across different ownership and organizational forms (Leibenstein, 1978; Saunders, Strock and Travlos, 1990; Button and Weyman-Jones, 1992; Berger, Kashyap and Scalise, 1995). In fact, different forms of banks could demonstrate different reactions to environmental changes. Hence, the impact of financial liberalization could vary across banking groups as a result of the differences in banks’ missions and goals (e.g. social welfare versus profit maximization), familiarity with the old and new political and economic environments, asset and liability compositions (e.g. carrying high level of loan or security portfolios / funding assets with purchased funds or deposits raised through network of branches), attitudes towards risk, degree of support from the state, incentive schemes to mitigate the conflicts of interest between bank managers and owners, and possession of professional skills and systems to cope with the consequences of the new environment. Therefore, whether all forms of banks benefited or suffered equally from the new financial environment is another issue to be investigated. As a result, one of the major themes of this paper is to test the following:
4 However, a recent study by Mukherjee et al. (2001) reported some signs of productivity gains in large US banks after deregulation. In addition, DeYoung et al. (1998) reported that the recent geographical deregulation resulted in higher cost efficiency in the US banks.
nn
ttFOREIGN
nn
ttPRIVATE
nn
ttPUBLIC
nn
ttFOREIGN
nn
ttPRIVATE
nn
ttPUBLIC
MMMH
MMMH
/1
1,
/1
1,
/1
1,1
/1
1,
/1
1,
/1
1,0
)()()(:
)()()(:
≠
≠
=
=
∏∏∏
∏∏∏
===
=== w
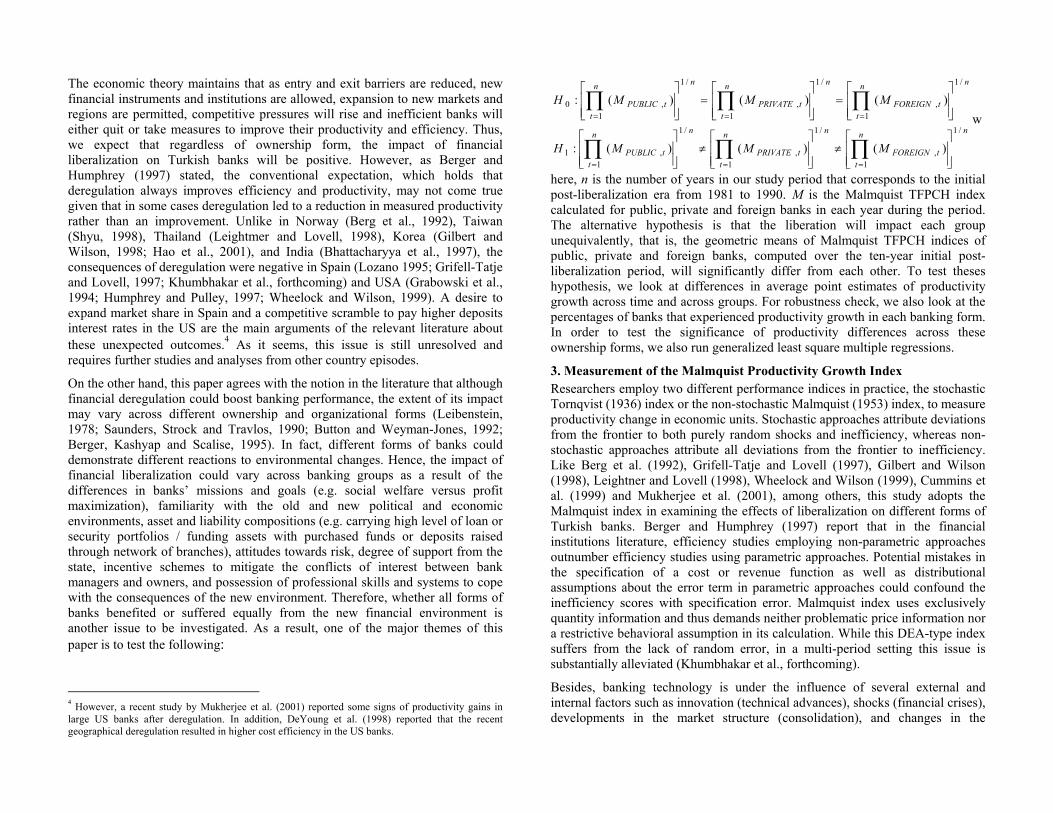
here, n is the number of years in our study period that corresponds to the initial post-liberalization era from 1981 to 1990. M is the Malmquist TFPCH index calculated for public, private and foreign banks in each year during the period. The alternative hypothesis is that the liberation will impact each group unequivalently, that is, the geometric means of Malmquist TFPCH indices of public, private and foreign banks, computed over the ten-year initial post-liberalization period, will significantly differ from each other. To test theses hypothesis, we look at differences in average point estimates of productivity growth across time and across groups. For robustness check, we also look at the percentages of banks that experienced productivity growth in each banking form. In order to test the significance of productivity differences across these ownership forms, we also run generalized least square multiple regressions.
3. Measurement of the Malmquist Productivity Growth Index Researchers employ two different performance indices in practice, the stochastic Tornqvist (1936) index or the non-stochastic Malmquist (1953) index, to measure productivity change in economic units. Stochastic approaches attribute deviations from the frontier to both purely random shocks and inefficiency, whereas non-stochastic approaches attribute all deviations from the frontier to inefficiency. Like Berg et al. (1992), Grifell-Tatje and Lovell (1997), Gilbert and Wilson (1998), Leightner and Lovell (1998), Wheelock and Wilson (1999), Cummins et al. (1999) and Mukherjee et al. (2001), among others, this study adopts the Malmquist index in examining the effects of liberalization on different forms of Turkish banks. Berger and Humphrey (1997) report that in the financial institutions literature, efficiency studies employing non-parametric approaches outnumber efficiency studies using parametric approaches. Potential mistakes in the specification of a cost or revenue function as well as distributional assumptions about the error term in parametric approaches could confound the inefficiency scores with specification error. Malmquist index uses exclusively quantity information and thus demands neither problematic price information nor a restrictive behavioral assumption in its calculation. While this DEA-type index suffers from the lack of random error, in a multi-period setting this issue is substantially alleviated (Khumbhakar et al., forthcoming).
Besides, banking technology is under the influence of several external and internal factors such as innovation (technical advances), shocks (financial crises), developments in the market structure (consolidation), and changes in the
regulatory treatment of banks over time (liberalization), etc. If technology is changing over time, there will be shifts in the best practice technical frontier. Malmquist index allows us to distinguish between shifts in the frontier (technology change, TECCH) and improvements in efficiency relative to the frontier (efficiency change, EFFCH), which are two mutually exclusive and exhaustive sources of total factor productivity change, TFPCH. It is also possible to decompose efficiency change into its distinct components with Malmquist index: changes in management practices (pure efficiency change, PEFFCH) and changes in production scales (scale change, SCH). This treatment ideally improves analytical efforts while tracing the underlying sources of productivity developments.
To understand the measurement of the Malmquist index as well as its decomposition, consider the following. Nt banks employ p inputs to produce q outputs for each time period t = 1, 2,…, T. Transformation of the vector of inputs, xt
p∈ℜ+ , into the vector of outputs, ytq∈ℜ+ during the production
process is represented by the function: Ft: Ft = {(x, y): x can produce y at time t}, which is simply the production possibilities set, the set of all feasible combinations of inputs and outputs, at time t.5 By forming the upper boundary (frontier) of Ft , the best-practices in the sample define the efficient production technology (frontier) at time t. Assume that xt and yt represent the observed input and output vectors of a bank at time t, respectively. The Shephard (1970) output distance function relative to the technology existing at time t is defined as: dt (xt , yt) = inf {φ : ( xt , yt / φ ) ∈ Ft}, which gives a normalized measure of the distance from the location of a bank in the input/output space to the production frontier at time t in the hyper-plane, where inputs are held fixed. Thus, the distance of a combination of xt and yt to the frontier can be as low as zero and as high as one if measured relative to the contemporaneous technology (i.e., 0 ≤ dt (xt , yt) ≤ 1), but it can be higher than one if measured relative to the technology of another period (i.e., 0 ≤ dt+1 (xt , yt) [≤ or >] 1).
Figure 2 illustrates these concepts. First, assume a simple case with single-input/single-output and a constant returns to scale (CRS) technology, which shifted upward from Ft (CRSt) to Ft+1 (CRS t+1) between two periods due to innovation. Assume that in year t, a bank was observed at point b, whereas in year t+1, it was observed at point d. In this multi-period setting, there are two corresponding benchmark banks for both observations. The first year observation, b, can be compared with either the efficient point, h, on its contemporaneous frontier Ft or the efficient point, j, on the next year frontier Ft+1. Likewise, the second year observation d can be assessed with respect to
5 Ft is assumed to satisfy certain conditions which make it possible to obtain meaningful output distance functions (see Shephard, 1970).
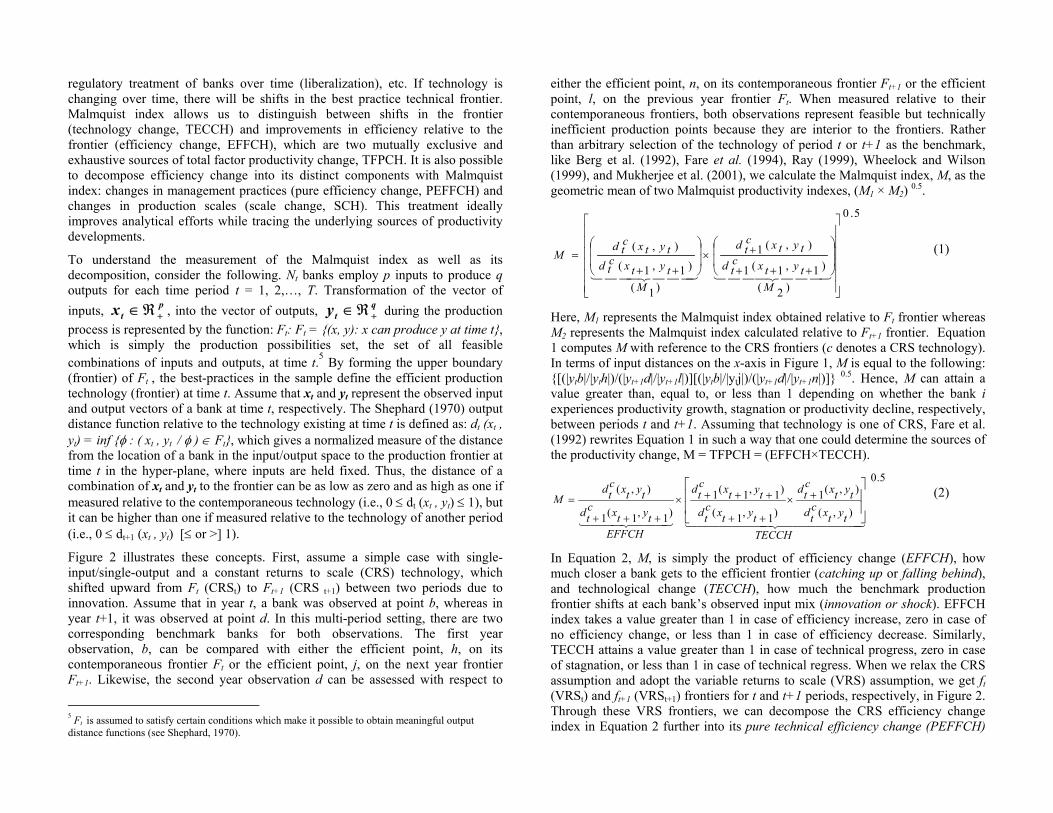
either the efficient point, n, on its contemporaneous frontier Ft+1 or the efficient point, l, on the previous year frontier Ft. When measured relative to their contemporaneous frontiers, both observations represent feasible but technically inefficient production points because they are interior to the frontiers. Rather than arbitrary selection of the technology of period t or t+1 as the benchmark, like Berg et al. (1992), Fare et al. (1994), Ray (1999), Wheelock and Wilson (1999), and Mukherjee et al. (2001), we calculate the Malmquist index, M, as the geometric mean of two Malmquist productivity indexes, (M1 × M2) 0.5.
5.0
)2(
)1,1(1
),(1
)1(
)1,1(
),(
+++
+×
++=
444 3444 21444 3444 21M
tytxctd
tytxctd
Mtytxc
tdtytxc
tdM (1)
Here, M1 represents the Malmquist index obtained relative to Ft frontier whereas M2 represents the Malmquist index calculated relative to Ft+1 frontier. Equation 1 computes M with reference to the CRS frontiers (c denotes a CRS technology). In terms of input distances on the x-axis in Figure 1, M is equal to the following: {[(|ytb|/|yth|)/(|yt+1d|/|yt+1l|)][(|ytb|/|ytj|)/(|yt+1d|/|yt+1n|)]} 0.5. Hence, M can attain a value greater than, equal to, or less than 1 depending on whether the bank i experiences productivity growth, stagnation or productivity decline, respectively, between periods t and t+1. Assuming that technology is one of CRS, Fare et al. (1992) rewrites Equation 1 in such a way that one could determine the sources of the productivity change, M = TFPCH = (EFFCH×TECCH).
5.0
),(
),(1)1,1(
)1,1(1)1,1(1
),(
4444444 34444444 21444 3444 21TECCH
tytxctd
tytxctd
tytxctd
tytxctd
EFFCHtytxc
tdtytxc
tdM
+×
++
+++×
+++
= (2)
In Equation 2, M, is simply the product of efficiency change (EFFCH), how much closer a bank gets to the efficient frontier (catching up or falling behind), and technological change (TECCH), how much the benchmark production frontier shifts at each bank’s observed input mix (innovation or shock). EFFCH index takes a value greater than 1 in case of efficiency increase, zero in case of no efficiency change, or less than 1 in case of efficiency decrease. Similarly, TECCH attains a value greater than 1 in case of technical progress, zero in case of stagnation, or less than 1 in case of technical regress. When we relax the CRS assumption and adopt the variable returns to scale (VRS) assumption, we get ft (VRSt) and ft+1 (VRSt+1) frontiers for t and t+1 periods, respectively, in Figure 2. Through these VRS frontiers, we can decompose the CRS efficiency change index in Equation 2 further into its pure technical efficiency change (PEFFCH)
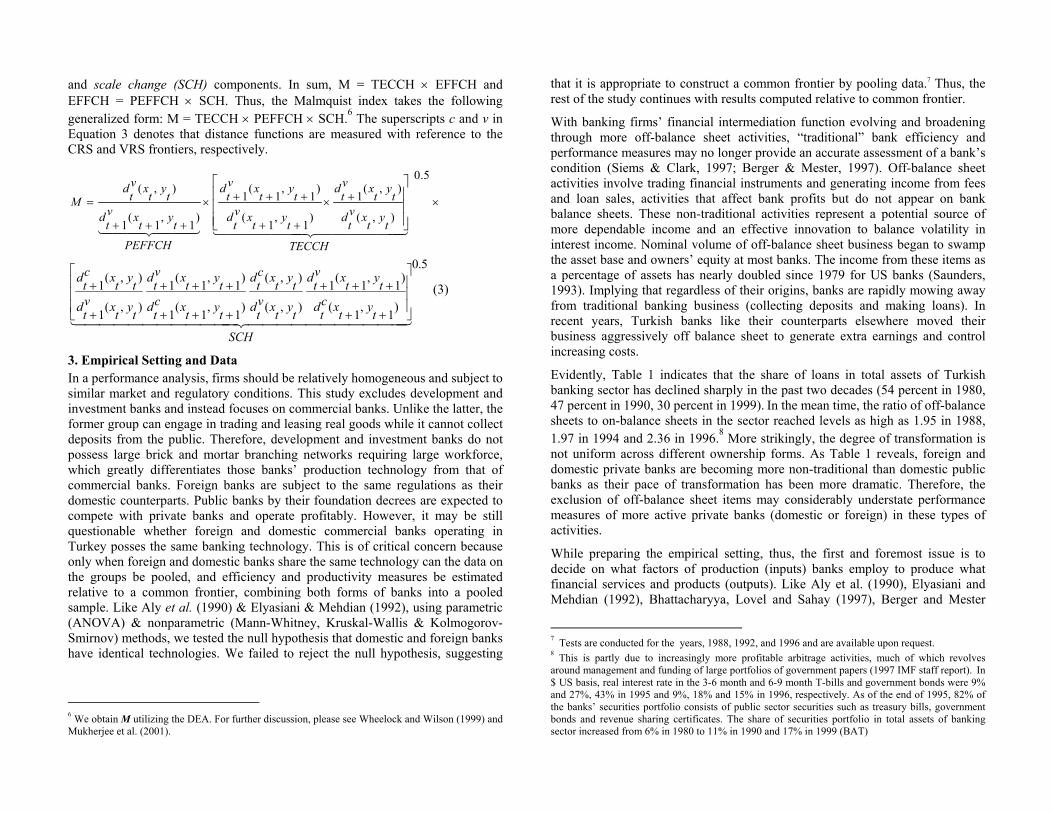
and scale change (SCH) components. In sum, M = TECCH × EFFCH and EFFCH = PEFFCH × SCH. Thus, the Malmquist index takes the following generalized form: M = TECCH × PEFFCH × SCH.6 The superscripts c and v in Equation 3 denotes that distance functions are measured with reference to the CRS and VRS frontiers, respectively.
×+×
++
+++×
+++
=
5.0
),(
),(1
)1
,1
(
)1
,1
(1
)1
,1
(1
),(
444444 3444444 2144 344 21TECCH
ty
txv
td
ty
txv
td
ty
txv
td
ty
txv
td
PEFFCH
ty
txv
td
ty
txv
td
M
5.0
)1,1(
)1,1(1
),(
),(
)1,1(1
)1,1(1
),(1
),(1
44444444444 344444444444 21SCH
tytxctd
tytxvtd
tytxvtd
tytxctd
tytxctd
tytxvtd
tytxvtd
tytxctd
++
+++
+++
+++
+
+ (3)
3. Empirical Setting and Data In a performance analysis, firms should be relatively homogeneous and subject to similar market and regulatory conditions. This study excludes development and investment banks and instead focuses on commercial banks. Unlike the latter, the former group can engage in trading and leasing real goods while it cannot collect deposits from the public. Therefore, development and investment banks do not possess large brick and mortar branching networks requiring large workforce, which greatly differentiates those banks’ production technology from that of commercial banks. Foreign banks are subject to the same regulations as their domestic counterparts. Public banks by their foundation decrees are expected to compete with private banks and operate profitably. However, it may be still questionable whether foreign and domestic commercial banks operating in Turkey posses the same banking technology. This is of critical concern because only when foreign and domestic banks share the same technology can the data on the groups be pooled, and efficiency and productivity measures be estimated relative to a common frontier, combining both forms of banks into a pooled sample. Like Aly et al. (1990) & Elyasiani & Mehdian (1992), using parametric (ANOVA) & nonparametric (Mann-Whitney, Kruskal-Wallis & Kolmogorov-Smirnov) methods, we tested the null hypothesis that domestic and foreign banks have identical technologies. We failed to reject the null hypothesis, suggesting
6 We obtain M utilizing the DEA. For further discussion, please see Wheelock and Wilson (1999) and Mukherjee et al. (2001).
that it is appropriate to construct a common frontier by pooling data.7 Thus, the rest of the study continues with results computed relative to common frontier.
With banking firms’ financial intermediation function evolving and broadening through more off-balance sheet activities, “traditional” bank efficiency and performance measures may no longer provide an accurate assessment of a bank’s condition (Siems & Clark, 1997; Berger & Mester, 1997). Off-balance sheet activities involve trading financial instruments and generating income from fees and loan sales, activities that affect bank profits but do not appear on bank balance sheets. These non-traditional activities represent a potential source of more dependable income and an effective innovation to balance volatility in interest income. Nominal volume of off-balance sheet business began to swamp the asset base and owners’ equity at most banks. The income from these items as a percentage of assets has nearly doubled since 1979 for US banks (Saunders, 1993). Implying that regardless of their origins, banks are rapidly mowing away from traditional banking business (collecting deposits and making loans). In recent years, Turkish banks like their counterparts elsewhere moved their business aggressively off balance sheet to generate extra earnings and control increasing costs.
Evidently, Table 1 indicates that the share of loans in total assets of Turkish banking sector has declined sharply in the past two decades (54 percent in 1980, 47 percent in 1990, 30 percent in 1999). In the mean time, the ratio of off-balance sheets to on-balance sheets in the sector reached levels as high as 1.95 in 1988, 1.97 in 1994 and 2.36 in 1996.8 More strikingly, the degree of transformation is not uniform across different ownership forms. As Table 1 reveals, foreign and domestic private banks are becoming more non-traditional than domestic public banks as their pace of transformation has been more dramatic. Therefore, the exclusion of off-balance sheet items may considerably understate performance measures of more active private banks (domestic or foreign) in these types of activities.
While preparing the empirical setting, thus, the first and foremost issue is to decide on what factors of production (inputs) banks employ to produce what financial services and products (outputs). Like Aly et al. (1990), Elyasiani and Mehdian (1992), Bhattacharyya, Lovel and Sahay (1997), Berger and Mester
7 Tests are conducted for the years, 1988, 1992, and 1996 and are available upon request. 8 This is partly due to increasingly more profitable arbitrage activities, much of which revolves around management and funding of large portfolios of government papers (1997 IMF staff report). In $ US basis, real interest rate in the 3-6 month and 6-9 month T-bills and government bonds were 9% and 27%, 43% in 1995 and 9%, 18% and 15% in 1996, respectively. As of the end of 1995, 82% of the banks’ securities portfolio consists of public sector securities such as treasury bills, government bonds and revenue sharing certificates. The share of securities portfolio in total assets of banking sector increased from 6% in 1980 to 11% in 1990 and 17% in 1999 (BAT)
(1997), Wheelock and Wilson (1999), Mukherjee, Ray and Miller (2001), Sathye (2001), Kumbhakar et al. (forthcoming), among others, this study adopts the so-called intermediation approach (Sealey and Lindley, 1977) in order to define bank inputs and outputs. Accordingly, all variables except for the input factor labor are measured in millions of U.S. dollars.9
In order to understand and account for the impact of nontraditional activities on bank performance measures, we model Turkish banks as multi-product firms in two alternative ways. Model 1 is a traditional banking approach, in which banks use three input factors: (1) labor [Labor], the number of full-time employees on the payroll, (2) capital, [Capital], the book value of premises and fixed assets, and (3) banking funds, [Funds], the sum of the TL and FX demand and time deposits and non-deposit funds, while producing a vector of three bank outputs: (1) short-term loans [ST Loans], (2) long-term loans [LT Loans]: the loans with less than and more than a year maturity, respectively, (3) other earning assets [OEA]: loans to special sectors, inter-bank funds sold and investment securities (treasury and other securities). Whereas, Model 2 is a non-traditional banking approach, in which banks utilize the above three input factors (1) labor, (2) capital, and (3) funds, to generate an array of four bank outputs: (1) short-term loans, (2) long term loans, and (3) other earning assets as well as (4) off-balance sheet activities [OFF-B/S]: guarantees and warranties (letters of guarantee, bank acceptance, letters of credit, guaranteed pre-financing, endorsements and others), commitments, foreign exchange and interest rate transactions as well as other off-balance sheet activities. Model 2 aims to proxy the new bank activities that are mostly fee-based with off-balance sheet activities, which are risk-adjusted using Basle Accord risk weights to provide conformity with on-balance sheet items in terms of credit risk. Data used in this study originate from the several issues of the Banks Association of Turkey (BAT), which houses all forms of banks in Turkey as members under its umbrella. Our sample includes the universe of domestic and foreign banks that operated in Turkish market between 1981 and 1990. Altogether, we have a total of 439 bank observations, of which 97 come from domestic public banks, 210 come from domestic private banks and 132 come from foreign private banks.
Demirguc-Kunt and Detragiache (1998) use the event of interest rate deregulation as the major criteria to determine the start of deregulation in their
9 Because the format of the financial statements of Turkish banks has radically changed after 1980, this study does not extend to the pre-1980 period. In addition, as the 1990s are mostly characterized with financial instabilities, raged inflation, and state interventions to seize ownership of weak banks (see Table 1), this work also does not extend to the post-1990 period. As the new economic policy was introduced in January 1980 and a series of reforms followed soon after, our study period is ideal in tracing the initial impact of the reforms on Turkish banks. The denomination of the variables in $U.S. is expected, to an extent, to eliminate the adverse impact of the inflation on the real magnitudes.
panel data of 53 countries while studying the association between banking crisis and deregulation. After several decades of state interventions, the determination of interest rates in Turkey was eventually left to the market forces in July 1980, which opened a new era in Turkish banking called “July Banking”. However, stability concerns, which emerged especially after the “banker crisis” of 1983, resulted in re-regulation of interest rates between 1983-86. Given the fact that freeing interest rates was not complete until the end of 1986 and the second half of the 1980s was full of breakthrough developments as summarized in section 2 above, this study considers the year 1986 as the benchmark year to divide 1981-1990 period into two distinct periods. Period 1 refers to 1982-86 (preparation stage of liberalization), and Period 2 refers to 1987-90, (maturity stage of liberalization).10 Accordingly, the sample statistics of the bank variables and Malmquist productivity change measures are summarized and analyzed based on this two-stage division of the full study period.
4. Empirical Results and Analysis Table 2 presents the summary statistics of inputs and outputs for public banks (Panel 1, P1), private banks (P2) and foreign banks (P3) for the entire study period (1981-90). The results suggest that the volume of bank inputs and outputs has expanded greatly over time owing to the fast growing Turkish economy and accompanying increased demand for banking services. It is expressive to note that the average volume of short-term loans is at least four times greater than that of long-term loans in the majorities of the new era indicating that Turkish banks have a strong preference to extend shorter-term loans. This policy can be attributed to the heightened interest rate risk within the new business environment. It is also noteworthy that the volume of off-balance sheet activities of banks exceeds the total of short- and long-term loans by at least two folds in the second half of the 1980s, emphasizing the significance of these outputs for Turkish banks in the new era and underscoring the potential bias they could create unless accounted for in the measurement of the Malmquist scores. As also can be seen from the table, reform agenda has been successful in attracting new banks to the system. The number of bank entries during the period, especially from foreign banks, is impressive. There was no foreign bank entry between 1975-80. However, the number of foreign owned banks operating in Turkey more than quadrupled between 1980-90. Despite their small market share, foreign bank entry in large numbers affected the banking behavior of domestic banks positively, as foreign banks improved the quality of manpower and introduced new techniques and practices to the Turkish banking market (Denizer, 1999). Indeed, the empirical results from an 80-country study (Claessens et al., 1998) indicate that the number of foreign entrants matters rather than their
10 Denizer (1997) uses 1986 as the basis year when analyzing the impact of liberalization on market structure and competition of Turkish banks.
market share. Apparently, foreign banks affect local bank competition upon entry rather than after they have gained substantial market share.
Table 3 reports standard deviations and geometric means of Malmquist productivity change index along with its components averaged over the 1982-90 period. The purpose is to provide a quick glance on the central tendency of productivity change among public, private and foreign banks in the post liberalization era. The results according to two alternative models, the ‘traditional’ Model 1 and ‘non-traditional’ Model 2 suggest that all types of banks benefited from the more liberal environment in Turkey. More formally, according to Model 1 (and Model 2), the average results for various ownership forms in Turkey between 1982-90 are as follows. Average productivity growth is 1.2 percent (2.9 percent) for public banks, 3.9 percent (9.5 percent) for private banks, and 14.2 percent (17 percent) for foreign banks.11 Average technical progress is –6.2 percent (-7.2 percent) for public banks, -7.1 percent (-1.7 percent) for private banks and –0.4 percent (9.3 percent) for foreign banks. Average efficiency change is 7.9 percent(10.9 percent) for public banks, 11.8 percent (11.4 percent) for private banks, and 14.6 percent (7.1 percent) for foreign banks.
The above results indicate that although all types of banks were positively affected by liberalization, private and foreign banks’ productivity gains outweigh those of public banks. However, the components of the productivity change index presents interesting results. Although all forms of banks recorded substantial efficiency increases, except for foreign banks, they all experienced notable technical regresses during the new era. This suggests that the major source of productivity gains in Turkish banking is efficiency change (increased proximity of banks to the frontier) rather than technical progress (outward shifts in the benchmark frontier). This finding contradicts with the results of the US banks [Mukherjee et al. (2001)], the Spanish banks [Grifell-Tatje and Lovell (1997)] and Korean banks [Gilbert and Wilson (1998)], where the productivity growth is found to be driven mostly by technical progress rather than efficiency increase. One possible explanation is that Turkish banks are less experienced compared to their peers in those countries in adapting to the conditions of new environment and in assimilating the new technology. If technology input faces learning curves, Turkish banks may need more time to take advantage of their technology investments. 11 These averages are actually rates of productivity growth per year for each group. Thus, total productivity growth between 1981-90 according to Model 1 is 11% for public banks, 42% for private banks, and 229% for foreign banks. According to Model 2, total productivity growth between 1986-90 is 12% for public banks, 43% for private banks, and 88% for foreign banks. For the same period, total productivity growth with Model 1 is 13%, 59% and 89%. These results indicate that the productivity change is positive and substantial over the initial post-liberalization period for these banks.
The results from Model 2 indicate that accounting for off-balance sheet services helped domestic and foreign private banks more than public banks in terms of productivity, maybe because of the fact that the former two forms are more active in these activities. The decomposition of efficiency change into its constituents reveals the following. According to Model 1 (and Model 2), average pure efficiency change is 2.2 percent(-1.7 percent) for public banks, 8.9 percent (8.4 percent) for private banks, and 6.0 percent (4.0 percent) for foreign banks. Average scale efficiency change is 5.5 percent (2.19 percent) for public banks, 2.7 percent (2.7 percent) for private banks, and 8.2 percent (3.0 percent) for foreign banks. These results suggest that the main source of efficiency increases in domestic and foreign private banks is better management practices rather than improved scales. However, scale improvements seem to be the major source of efficiency increase in public banks.
Although the aggregate results from Table 3 reveal the central tendency of the Malmquist index and its components, they conceal the volatility (trends) in those scores. Figures 3.1, 3.2 and 3.3 illustrate historical developments on the TFPCH, TECCH and EFFCH scores between 1982-90, respectively, for public, private and foreign banks. The line passing from 1.0 on the y-axis in these figures is the “demarcation line”. The points above this line indicate improvement whereas the points below it indicate deterioration in the relevant index between two periods. Figure 1 shows that the productivity growth of foreign banks far outweighs that of private banks, whose productivity growth in turn outperforms that of public banks, for the most parts of the period. Another interesting observation is that there is an apparent positive shift after 1986 and a clear convergence towards the end of the period in the productivity growth indices of those banks. Although Figure 3.2 provides a highly volatile picture, the dominance of efficiency changes in driving productivity growth in Turkish banking is very obvious from this figure, as efficiency change indices of all forms of banks sail incessantly above the demarcation line after 1985. On the other hand, Figure 3.3, which depicts technology changes in Turkish banks, suggests that the progress in technology is unimpressive throughout the period except for a few blinks from foreign banks at the onset and at the end of the period.
The causal analysis above based on aggregates (Table 3) and trend lines (Figures 3.1 to 3.3) attribute the productivity growth to efficiency change rather than technical progress for different forms of banks operating in Turkey. To investigate further the main sources of productivity growth in different ownership forms, we correlated the Malmquist productivity scores with its components using the pooled data from 1982-90. The results from Table 3 reinforce the prior findings. For all forms of banks, the productivity change (TFPCH) index is associated more with efficiency change index (the CRS EFFCH or the VRS PEFFCH) than with any other index, conforming the superiority of efficiency improvements in leading productivity changes in
Turkish banks. However, the degree of association between TFPCH and EFFCH (PEFFCH) is more outstanding in domestic, 0.765 (0.812), and foreign private banks, 0.727 (0.771), than in domestic public banks, 0.503 (0.523). The correlation results support the dominant role of resource management improvements (PEFFCH) in fueling efficiency increases (EFFCH) in Turkish banks. The coefficients of correlation between EFFCH and PEFFCH versus between EFFCH and SCH are 0.712 X 0.604 for public banks, 0.840 X 0.401 for private banks, and 0.896 X 0.302 for foreign banks.12
An analysis based on averages is very susceptible to extreme observations.13 However, an analysis based on numbers (or percentages) of banks is less sensitive to such outliers. To see this, assume that a banking industry is made up of only four banks, bank 1, 2, 3, and 4, whose productivity change scores are 0.7, 0.8, 0.9 and 1.8, respectively. These scores indicate that while bank 1, 2, and 3 suffered productivity loss, bank 4 registered an extreme productivity growth. The results based on average would suggest that banking industry experienced 5 percent productivity gain as the average of these four scores is 1.05. On the other hand, the results based on percentages (numbers) would correctly suggest that 75 percent of banks in this industry experienced productivity fall while only 25 percent recorded productivity rise. Hence, as a robustness check, we analyze the developments in the productivity of public (Tables 5.a and 5.b), private (Tables 6.a and 6.b) and foreign banks (Tables 7.a and 7.b) based on percentages between 1981-90. In order to detect whether there is a shift in bank productivity over time, we present the results for the two sub-periods, Period 1 (1982-86) and Period 2 (1987-90) as well as for the entire period (1982-90). In each group, the first table (Table 5.a) reports what percentage of banks experienced improvements or deteriorations in the relevant score over time. Whereas, the second table (Table 5.b) reports what percentage of banks owe their productivity growth (loss) to an efficiency increase (decrease) and what percentage owe it to a technical progress (regress). It also reports what percentage of banks owe their efficiency increase (decrease) to a pure efficiency increase (decrease) and what percentage owe it to a scale efficiency increase (decrease).
12 Technology change index (TECCH) is negatively correlated with all other indices except for TFPCH. It is interesting to observe that the efforts of the inefficient banks to catch up with the best-practice banks either by improving their resource management skills or scales do not result in upward shifts in the benchmark frontier. It may be that technical change derives from other sources. However, the positive relationship between TFPCH and TECCH indices makes sense as the advances in technology enable banks to generate more outputs given the same resources. 13 This issue is critical especially for small samples. Although we contain the universe of Turkish banks in our study, sub-categorization reduces the number of observations. In addition, as can be seen from Table 3, the standard deviations of the Malmquist indices are relatively high, a potential case for the outlier problem.
Both Model 1 and 2 provide very similar results for domestic public banks. According to Model 1 results in Table 5.a, percentage of public banks with productivity growth matches the percentage of public banks with productivity loss during the 10-year period. However, except for 1988, the great majority of public banks recorded productivity growth between 1987-90 (78 percent in 1987, 63 percent in 1989 and 1990). Further, in spite of a slight improvement in the maturity stage of liberalization, most of the public banks (62 percent) showed regress in their technology during the 1980s. Efficiency increase in Period 2, however, was exemplary for public banks. 64 percent of them experienced efficiency increase during Period 2 as opposed to 38 percent in Period 1 (49 percent on aggregate). As for the source of efficiency increase in public banks, it seems to be scale related. While the percentage of public banks with scale efficiency increase between Period 1 and Period 2 rose from 31 percent to 67 percent, the percentage of public banks with pure technical efficiency increase dropped from 33 percent to 24 percent.
Table 5.b highlights the sources of productivity growth (loss) and efficiency increase (decrease) in public banks in more detail. For example, between 1982-90, the banks that saw the productivity growth mostly due to an efficiency increase make up 29 percent of all public banks, while the ones that saw the productivity growth mostly due to technical progress make up 20 percent. Stated differently, of the banks that experienced productivity growth, 60 percent (29/49) owe it mostly to an efficiency increase, while 40 percent owe it mostly to a technical progress. The productivity loss in public banks in the 1980s, on the other hand, can be mostly attributed to a technical regress (72 percent) rather than an efficiency decrease (28 percent). Confirming earlier results, the major source of efficiency increase in public banks is scale related. Between 1982-90, the public banks that recorded an efficiency improvement owe it mostly to a scale efficiency increase (68 percent) rather than a pure technical efficiency increase (32 percent). However, the role of scale efficiency increase in driving efficiency is much profound in Period 2. 64 percent of public banks recorded an efficiency increase during this period. Of those, 81 percent owe it to scale efficiency increase, 19 percent owe it to pure technical efficiency increase. Briefly, in the 1980s, one half of public banks experienced productivity gain and they owe it mostly to an efficiency increase, which mainly stems from scale improvements. The roles of poor management practices and scale problems in driving efficiency decreases in public banks are comparable.
Table 6.a and 6.b report the results for domestic private banks. The results indicate that private banks’ performance tended to rise as the reforms accelerated. The results from Model 1 indicate that 40 percent (60 percent) of private banks observed productivity growth (loss) in Period 1, while the percentage of such banks increased (fell) to 63 percent (37 percent) in Period 2. The results for 1989 and 1990 clearly underline the pace of productivity
development in private banks during the era. 71 percent and 88 percent of private banks recorded productivity growth in 1989 and 1990, respectively. Although modest, there are some signs of technical improvement in private banks during the post liberal era. The percentage of private banks that observed technical progress (regress) rose (dropped) from 40 percent (60 percent) to 46 percent (54 percent) between Period 1 and Period 2. Accounting for off-balance sheet activities in Model 2 increased the percentage of private banks with technical progress by 2 percent in Period 2. The percentage of private banks that experienced efficiency increase (decrease) between the two periods rose (fell) from 53 percent (42 percent) to 68 percent (30 percent). When the CRS assumption is dropped and the VRS is adopted, the improvement in technical efficiency still sustains: the percentage of private banks that experienced “pure” efficiency increase (decrease) between the two periods rose (fell) from 43 percent (42 percent) to 51 percent (37 percent). The results also reveal some scale improvements in private banks: the percentage of private banks that experienced scale efficiency increase (decrease) between the two periods rose (fell) from 44 percent (48 percent) to 64 percent (33 percent).
Table 6.b dwells on the sources of productivity changes more closely for private banks. Both Model 1 and 2 statistics suggest that the engine of productivity growth observed after liberalization in private banks is predominantly efficiency increases rather than technical progress. Although this point is true for both Period 1 and 2, it is more indicative for Period 2. The average percentage of private banks that recorded productivity growth mainly due to efficiency increase rose from 27 percent to 53 percent between the two periods. Stated differently, of the private banks that recorded productivity growth in Period 2 (Period 1), 83 percent (68 percent) owed it to an efficiency increase and 17 percent (32 percent) owed it to a technical progress. Accounting for non-traditional bank services pushes up the percentage of banks that owed the productivity growth mainly to technical progress by 13 percent (11 percent in Model 1 and 24 percent in Model 2). In Period 1, 61 percent of private banks incurred productivity loss, of which 49 percent (30/61) is due to efficiency decrease and 51 percent (31/61) is due to technical regress. Whereas in Period 2, the percentage of private banks that incurred productivity loss dropped to 36 percent, of which 56 percent (20/36) is due to efficiency decrease and 44 percent (16/36) is due to technical regress. Unlike in public banks, the major source of productivity loss in private banks is originating mainly from efficiency decreases rather than technical regress. Efficiency increases in private banks are associated mostly with increases in pure technical efficiency in Period 1 and with improvements in scale efficiency in period 2. Efficiency decreases are mostly related to pure efficiency decreases in Period 1 and scale efficiency decreases in Period 2. These results underscore the importance of scale policies for Turkish banks, as scale changes have become the
major determinant of both efficiency increases and efficiency decreases in Turkish banking.
Table 7.a and 7.b report the results for foreign private banks according to Model 1 and 2. The results from Model 1 indicate that of foreign banks in Period 2 (and Period 1) 60 percent (47 percent) experienced productivity growth while 40 percent (53 percent) incurred productivity loss. There exists an obvious positive development in the productivity of foreign banks in Period 2 as compared to Period 1. There is also improvement in the technology of foreign banks as the percentage of foreign banks with technical progress (regress) rose (fell) from 47 percent (53 percent) to 53 percent (47 percent) between the two periods. Likewise, the percentage of banks with efficiency increase (decrease) climbed (dropped) between the two periods, from 39 percent (39 percent) to 43 percent (30 percent). Between Period 1 and 2, the percentage of banks that suffered “pure” and scale efficiency decrease fell down. However, the percentage of banks that experienced no change in their efficiency increased. Table 7.b reveals interesting results for foreign banks. Foreign banks behaved like their domestic counterparts in Period 1. However, they departed broadly from their peers in Period 2. Unlike domestic banks (public or private), most of the foreign banks owe their productivity growth mainly to technical progress rather than efficiency increase in Period 2. According to Model 1, 60 percent of foreign banks saw productivity growth in Period 2. Of those, 65 percent owe it to technical progress while 35 percent owe it to efficiency increase. According to Model 2, 58 percent of foreign banks recorded productivity growth. Of those, 78 percent owe it to technical progress while 22 percent owe it to efficiency increase. Expressively, accounting for non-traditional banking activities raised the technical progress in foreign banks. Most of the productivity loss is due to technical regress in foreign banks. It seems that technical change is the dominant power driving productivity changes in those banks. Efficiency changes (increases or decreases) in foreign banks are related mostly to pure efficiency change rather than scale efficiency change. This observation is also different from what was observed for domestic public and private banks, whose efficiency changes are mostly scale related.
Our analysis so far suggests that the promotion of liberal policies in Turkey fostered the productivity and efficiency of all types of banks notably in the 1980s. Actually, the developments in the productivity and efficiency measures depend on the changes in the underlying bank outputs and inputs. In other words, the positive outcome we observed in the productivity of Turkish banks during liberalization was brought in by the developments in bank inputs and outputs in this era. Although it is a relative measure, the Malmquist TFPCH index of a bank in a certain period is closely related to the ratio of its “virtual outputs” to its “virtual inputs” (like in our Model 2):
)(3)(2)(1
)/(4)(3)(2)(1FundspCapitalpLaborp
SBOFFqOEAqLTLoansqSTLoansqM
++
−+++= (4)
With the help of the DEA, a mathematical programming technique, we obtained the weights of outputs, q1 to q4, and the weights of inputs, p1 to p3. In the above form, it is obvious that productivity growth directly originates from the changes in the levels of inputs and outputs. For instance, M can increase if outputs increase proportionately more than inputs or if inputs decrease proportionately more than outputs. Liberalization affects bank productivity by its condensed effects on those inputs and outputs. Hence, one essential question is the changes in what factors of production and what types of bank services mostly drove the productivity growth and efficiency change observed in different forms of banks during the liberalization of financial markets in Turkey.
Table 8 presents the correlation coefficients between the Malmquist indices and the changes in bank inputs and outputs for all forms of banks between 1982-90. In general, one would expect that productivity growth should be positively correlated with the changes in outputs and negatively correlated with the changes in inputs. However, this may not betrue for all cases. For example, one may also expect that increases in capital inputs be positively correlated with productivity growth, if such capital increases are mostly in the area of automation and computerization. On the other hand, because those investments inflate the level of inputs in the denominator, if they cannot bring about higher levels of outputs given their expensive acquisition costs, they could cause a reduction in productivity. The same propositions are also valid for other input factors. Our data do not contain information regarding the IT investments of Turkish banks. Thus, capital input in our model encompasses increases in all types of fixed assets, productive and non-productive. Thus, it is hard to form a prior expectation; therefore we leave the final judgment to the data.
Among outputs, productivity growth in public banks is highly positively correlated with the changes in long-term loans whereas it is negatively correlated with the changes in short-term loans and off-balance sheet activities. As for private banks, productivity growth is positively correlated mostly with the changes in short-term loans, then with the changes in long-term loans, other earning assets and off-balance sheet items, respectively. The highest correlation of productivity growth in foreign banks is with the changes in off-balance sheet activities, then with the changes in short-term loans. As it seems, the correlation between productivity growth and the changes in short-term loans is highly negative in public banks and highly positive in private and foreign banks. In the inflationary environment of Turkey, because of interest rate risk, private banks prefer to extend mostly short-term loans. In addition, the production of long-term loans is more costly than short-term loans. With their social missions, public banks produce the majority of long-term loans in Turkey. For this reason, the
productivity growth in private banks may be mostly related with short-term loans. Productivity growth in all forms of banks is negatively correlated with the changes in all inputs except for funds. This suggests that increases in capital and labor factors do not bring more proportionate increases in outputs in Turkish banks. The positive correlation between the changes in productivity and the changes in funds suggest that expansion of funds may lead to expansion in the portfolio of bank products and services, which result in higher productivity. Because a bank cannot make loans more than its funds, increase in funds must be a positive externality for outputs of banks. More funds may mean more customers with many banking needs. Technological change is mostly correlated with the changes in long-term loans in public banks, and with the changes in short-term loans in private banks, and with the changes in off-balance sheet items in foreign banks. Efficiency change is mainly related to the changes in short-term loans in private banks, to the changes in off-balance sheet activities in foreign banks and to the changes in other earning assets in public banks. Apparently, off-balance sheet items mostly enhance the productivity, technology and efficiency of foreign banks. Scale efficiency changes are generally negatively correlated with the changes in outputs for all forms of banks.
Another focal aspect of this study is to examine the performance variance among various forms of Turkish banks across time, particularly between Period 1 (‘preparation’ stage of liberalization) and Period 2 (‘maturity’ stage of liberalization). In this context, an important question is whether the differences in the mean productivity change measures of these banks between the two periods are statistically significant. We run preliminary ANOVA tests for each group to detect this issue. The results indicate that the improvements in the productivity of foreign and domestic private banks are statistically significant at 1 percent significance level. The scale efficiency increases between the two periods are also significant for public and private domestic banks at least at 10 percent significance level. Technology improvements are statistically significant only for foreign banks. Efficiency changes between the two periods are significant for private and foreign banks.14 However, in addition to large variations across time, there are also large variations across different types of banks in terms of performance. Like Mester (1993), we employ the generalized least square model, GLS, to examine the significance of the performance variation between these three different forms of banks. This issue is important because the Turkish government plans to privatize its state enterprises. If it could be justified on efficiency and productivity grounds that those entities are wasting the scarce resources of the country, it will be easier both economically and politically to sell them off to the general public.
14 Since we run the GLS regressions next, we do not report these preliminary tests here. However, the complete results of the ANOVA tests are available from the authors upon request.
It is hypothesized that the ownership type or organizational form that produces stronger incentives to control inputs and/or boost outputs will have more efficient and productive operations.15 The property rights theory, agency cost theory, transaction costs theory, and contract theory, among others, suggest that publicly owned firms should perform less efficiently and less profitably than private firms. According to Beim and Calomiris (2001), private ownership of the means of production is the single credible form for higher productive efficiency. The cardinal goal of a successful private firm is to maximize shareholder value, which is closely connected to the efficient use of resources; whereas the goals of public firms are various, conflicting and rarely related to the efficient use of resources such as to maximize employment, promote regional development and reward loyalists. Also, state enterprises are not under strong market discipline, as they are not put out of business if they fail to earn a positive return on their funds. Moreover, the public staff usually exerts less effort because they do not have ownership incentives (Boycko, Shleifer, and Vishny, 1996). Foreign firms depending on their origin may have comparative cost advantages over their domestic peers stemming from their better technologies and access to international markets (Bhattacharya et al., 1997 and Hasan and Marton, 2000). There could also be a significant association between bank size and performance. The so-called shakeout theory posits that smaller banks may not be able to obtain enough capital and management ability to successfully operate in a complex environment that requires frequent technology updates, thus suggesting a positive relation between size and performance. Alternatively, the divisibility theory holds that there will be no such operational advantage accruing to large banks, if the technology is divisible, that is, small-scale banks can produce financial services at costs per unit output comparable to those of large banks, suggesting no (or a possible negative) association between size and performance. Advances in technology that reduce the size and cost of the automated equipment and small banks’ efforts to cooperatively purchase expensive technology imply more divisibility in technology in banking (Kolori and Zardkoohi, 1987).
Table 9 presents the GLS results to determine possible correlates of the Malmquist index (TFPCH, TECCH, EFFCH, PEFCH, and SCH) measures with (Model 2) and without non-traditional activities (Model 1). The dependent variables in the regressions are thus the productivity measures whereas independent factors are the ownership [private (excluded from the regressions as the base case), state and foreign banks], structure and size variables. All independent variables, except for the intercept and size (the log of the number of
15 Also, the nature of operations for these banks may lead to differences in performance. Most large private or public banks are respectively more involved in loan production than foreign banks and small private banks whose portfolios are tilted towards investment securities, which are less expensive to produce and service than loans that require operating large network of branches.
bank workers), are dummy variables.16 After controlling for size, we see that foreign banks experienced more significant productivity, technology and efficiency improvements than domestic public and private banks, implying that foreign banks began to overcome their lack of exposure in a new market and improved their performance over their domestic counterparts. The earlier results showed that like other forms of banks, public banks recorded higher productivity and efficiency in the post-liberal era. However, the GLS results suggest that the public bank’s productivity and efficiency improvements were significantly less than those of the private domestic and foreign banks, indicating that the performance gap between public and private banks tended to narrow in the new environment. The dummy structure variable is formed to examine whether there is a significant structural jump in Turkish bank performance between Period 2 (1987-1990) and Period 1 (1982-1986) as the reforms accelerated. The results indicate that after 1986, the performance of the Turkish banks have improved significantly whether their productivity is measured considering non-traditional banking services (Model 2) or ignoring those services (Model 1). Our results also suggest that there is a negative association between size and productivity change, implying that smaller size banks could be more productive. In other words, productivity measures do not yield any comparative advantage accruing to large banks, perhaps supporting the divisibility theory. The small banks in Turkey are mostly engaged in investing in government securities, which are less expensive to operate, and in wholesale banking, which does not call for expensive branch networking. Also, with their small size and more professional management, they are more adaptive to the changes in the financial environment, enhancing their performance. The R2 ’s of the models, with relatively parsimonious explanatory factors, are statistically significant.
5. Summary and Conclusion Utilizing the non-parametric technique of DEA-type Malmquist index, this paper measures productivity changes for public, private and foreign banks operating in Turkey over the initial post-deregulation period from 1981 to 1990. This model helps us to isolate the contributions of technological change, efficiency change and scale change to productivity change in Turkish banks. The results indicate that all forms of banks benefited from more liberal financial environment. The rate of productivity growth per year in the new era according the model that considers only traditional bank outputs (Model 1) was 1.2 percent for public banks, 3.9 percent for private banks and 14.2 percent for foreign banks. Whereas, the rate of productivity growth per year according to an alternative model that considers both traditional and non-traditional bank outputs (Model 2) was 2.9 16 Alternatively, we also tried the log of total assets for size variable, which generated almost identical results (available upon request).
percent for public banks, 9.5 percent for private banks and 17.0 percent for foreign banks. It appears that although these unconventional outputs boosted the productivity of all forms of banks, the magnitude of their impact is not uniform across banks. The exposure of banks to the non-traditional bank services varies substantially across different ownership forms in Turkey (see Table 1). Such services require qualified manpower and new technology. Private banks, especially foreign ones, are more active players in those activities than public banks. Less equipped, public banks are less active in these new services. Accordingly, the domestic and foreign private banks’ performance has improved more than that of public banks upon inclusion of these new services. These results underline the importance of accounting for off-balance sheet services in measuring bank performance especially in an era in which banks of all origins embrace increasingly non-traditional and innovative ways to deliver banking services.
Positive developments in Turkish banks’ efficiency are also noteworthy. The rate of efficiency increase per year during the period is 7.9 percent for public banks, 11.8 percent for private banks and 14.6 percent for foreign banks as calculated using Model 1. For those banks, the efficiency improvement is generally much stronger with Model 2. The trend of positive developments in bank productivity and efficiency was more acute in the second half of the period than the first. As the new reforms began to show their effects on banks more in the maturity stage of liberalization, all types of banks apparently demonstrated better performance. However, technological improvements in those banks are less than impressive during the period although incorporating off-balance sheet services provided some advancement, especially in foreign banks.
Overall our results indicate that, technology of domestic banks did not improve over the initial post-liberalization period. This conclusion is contrary to the expectations given the fact that Turkish banks made heavy investments in computerization and automation projects. Apparently, this capital investment did not pay off in the short term. Several factors could have played role in this unexpected outcome. Following liberalization, banks started a race to establish their own communication networks, information systems and ATMs. However, these investments were driven mostly by prestige and reputation concerns rather than the feasibility or profitability of these projects. Many banks lacked the required transaction capacity or customer base to justify these investments. This eventually resulted in idle capacity in these banks. Because they were experiencing increasing returns to scale, some banks with lack of transaction volume began to share their devices such as ATMs with others. In addition, these data processing and communication devices need strong information management systems and information economics. As mentioned before, if these new practices are subject to “learning by doing”, Turkish banks might need more time to learn how to utilize these costly high-tech investments to full extent.
The productivity growth in public banks is driven mostly by efficiency increases stemming mainly from scale improvements. Because these banks are the major producers of long-term loans in the Turkish financial system, their productivity growth is much more correlated with the changes in this output than in any output. The productivity growth in private banks is also mostly fueled with efficiency changes originating mainly from scale changes. However, unlike in public banks, the productivity growth of private banks is mostly correlated with the changes in short-term loans. In the highly inflationary environment of Turkey, most of the bank deposits lie in the short-term class. Thus, to cope with increasing interest rate risks arising from the large maturity gap between deposits and loans, private banks extend predominantly shorter-term loans. Therefore, their productivity growth must be mostly determined with the changes in their most important output, short-term loans. In contrast, foreign banks owe their productivity growth mostly to technological changes rather than efficiency changes. Further, unlike in domestic banks, efficiency increases in foreign banks mainly originate from better resource management practices rather than scale changes. Also, because foreign banks are the most active group of all in off-balance sheet services, the correlation between productivity growth and the changes in off-balance sheet services is greatest in foreign banks.
Prior to interest rate liberalization, Turkish commercial banks competed heavily through brick and mortar branching networks to attract cheap deposits. The interest rates on deposits were negative in real terms in the majorities of this period. This stimulated a frantic expansion effort among domestic banks to reach remote and rural territories. Once interest rates were freed, the value of operating extensive branching networks greatly diminished. The earlier expansion efforts, however, accentuated overhead costs and scale problems of Turkish banks. Increased funding costs, technical advances and competitive pressures forced domestic bank managers to contract the scale of their operations by trimming excess labor and unprofitable branches. The downsizing policies of domestic banks eventually resulted in higher productivity per employee, per dollar invested in capital, and per dollar of collected funds. On the other hand, foreign banks did not have diseconomies of scale problems, as they did not operate large networks of branches. Therefore, scale improvements play a lesser role in fueling foreign bank efficiency. Instead, their efficiency improvements seem to be coming mainly from technology investments and better management practices they exported from international markets. Apparently opening policies have been beneficial as lifting of entry barriers brought in efficient and productive foreign banks from which local banks could learn new systems and practices.
Finally, we looked at the significance of the performance differences across time and across different ownership forms after controlling for bank size. Our results indicate that the positive trend in the performance of Turkish banks was significant across time. In the advent of liberalization, the performance measures
of public banks exceeded those of private banks, whether domestic or foreign. However, productivity growth and efficiency change in the post liberal period in foreign banks was significantly higher than those in private banks, whose improvement was in turn significantly higher than those in public banks. One implication is that the performance gap between public and private banks began to disappear in the new environment.
References Aigner, D., Lovell, C.A.K., and Schimidt, P., 1977. “Formulation and estimation of
stochastic frontier production models.” Journal of Econometrics 6, 21-37. Akguc, O., 1992. Turkiye’de bankacilik, Gercek Yayinevi, Istanbul, Turkey. Altunbas, Y., Molyneux, P., and Murphy, N., 1994. “Privatization, efficiency and public
ownership in Turkey - An analysis of the banking industry 1991-1993,” Institute of European Finance, unpublished working paper.
Aly, H.Y., Grabowski, R., Pasurka, C. and Rangan, N., 1990. “Technical, scale, and allocative efficiencies in U.S. banking: An empirical investigation.” Review of Economics and Statistics 72, 211-218.
Banks in Turkey 1980-2000. Banks Association of Turkey: Istanbul, Turkey. Banks Association of Turkey (BAT) & BDDK, May 15, 2001. Towards a sound Turkish
banking sector, Beim, D.O. and Calomiris, C.W., 2001. Emerging Financial Markets, McGraw-
Hill/Irwin, New York, NY. Berg, S. A., Forsund, F. R. and Jansen, E. S., 1992. “Malmquist indices of productivity
growth during the deregulation of Norwegian banking, 198-89.” Scandinavian Journal of Economics 94, S211-S228.
Berger, A.N., Hancock, D, Humphrey, D.B., 1993. “Bank efficiency derived from the profit function.” Journal of Banking and Finance 17, 317-347.
Berger, A. N., Hunter, W.C., and Timme, S. G., 1993. “The efficiency of financial institutions: A review and preview of research past, present and future.” Journal of Banking and Finance 17, 221-49.
Berger, A. N., and Kashyap, A. K. and Scalise, J. M., 1995. “The transformation of the U.S. banking industry: What a long, strange trip it’s been.” Brooking Papers on Economic Activity 2, 55-218.
Berger A. N. and Humphrey, D.B., 1997. “Efficiency of financial institutions: International survey and directions for future research”. European Journal of Operational Research 98, 175-212.
Berger, A.N. and Mester, L.J., 1997. “Inside the black box: What explains differences in the efficiencies of financial institutions?” Journal of Banking and Finance 21, 895-947.
Berger, A.N., Demsetz, R. S., and Strahan, P. E., 1998. “The consolidation of the Financial Services Industry” Causes, consequences and implications for the future.” Federal Reserve Bank of New York Staff Reports, No: 55.
Bhattacharya, A., Lovell, C.A.K. and Sahay, P., 1997. “The impact of liberalization on the productive efficiency of Indian commercial banks.” European Journal of Operational Research 98, 332-345.
Boycko, M., Shleifer, A., and Vishny, R. W., 1996. “A theory of privatization.” The Economic Journal 106, 309-319.
Button, K.J., Weyman-Jones, T.G., 1992. “Ownership structure, institutional organization and measured X-efficiency.” The American Economic Review 82, 439-45.
Charnes, A., Cooper, W. W., and Rhodes, E., 1978. “Measuring the efficiency of decision making units.” European Journal of Operations Research 2, 429-444.
Charnes, A., Cooper, W. W., Lewin, A.Y., Seiford, L. M., 1994. Data Envelopment Analysis: Theory, Methodology and Applications, Kluwer.
Claessens, S., Demirguc-Kunt, A., and Huizinga, H., 1998. “How does foreign bank entry affect the domestic bank market?” Mimeo, World Bank.
Cummins, J.D., Tennyson, S., and Weiss, M. A., 1999. “Consolidation and efficiency in the US life insurance industry.’ Journal of Banking and Finance 23, 325-57.
Denizer, C., November 1997. “The effects of financial liberalization and new bank entry on market structure and competition in Turkey.” World Bank Development Research Group, working paper no: 1839.
Denizer, C., 1999. “Foreign entry in Turkey’s banking sector, 1980-97.” World Bank, working paper.
Demirguc-Kunt, A., Detragiache, E., May 1998. “Financial liberalization and financial fragility.” Working paper no: 1917. Development Research Group, World Bank, Washington D.C., US.
Demirguc-Kunt, A., Levine, R., June 1999. “Bank-based and market-based financial systems: Cross-country comparisons.” Working paper, Development Research Group, World Bank, Washington D.C., US.
DeYoung, R., Hasan, I. and Kirchhoff, B., 1998. “The impact of out-of-state entry on the cost efficiencies of local commercial banks.” Journal of Economics and Business 50, 191-203.
Elyasiani, E. and Mehdian, S., 1992. ‘Productive efficiency performance of minority and nonminority-owned banks: A nonparametric approach.” Journal of Banking and Finance 16, 933-48.
Export Promotion Center (IGEME). Banking and stock exchange in Turkey. Kizilay, Ankara, Turkey.
Fare, R., Grosskopf, S., Lindgren, B., and Roos, P., 1992. “Productivity changes in Swedish pharmacies 1980-1989: A nonparametric Malmquist approach.” Journal of Productivity Analysis 3(3), 85-101.
Fare, R., Grosskopf, S., Norris M. and Zhang, Z., March 1994. “Productivity growth, technical progress, and efficiency change in industrialized countries.” The American Economic Review, vol.84, no.1, 66-83.
Farrell, M.J., 1957. “The measurement of productive efficiency.” Journal of the Royal Statistical Society, A CXXX, Part 3, 253-290.
Gilbert, R. A. and Wilson, P. W., 1998. “Effects of deregulation on the productivity of Korean banks.” Journal of Economics and Business 50, 133-155.
Grabowski, R., Rangan, N. and Rezvanian, R., 1994. “The effect of deregulation on the efficiency of U.S. banking firms.” Journal of Economics and Business 46, 39-64.
Grifell-Tatje, E. and Lovell, C.A.K., 1996. “Deregulation and productivity decline: The case of Spanish savings banks.” European Economic Review 40, 1281-1303.
Hanson, J. and Neal, C., 1986. “Interest rate policies in selected countries, 1970-82.” World Bank research paper.
Hao, J., Hunter, W. C., and Yang, W. K., 2001. “Deregulation and efficiency: the case of private Korean banks.” Journal of Economics and Business 53, 237-54.
Hasan, I., Marton, K., 2001. “Development and efficiency of the banking sector in a transitional economy: Hungarian experience,” working paper, New Jersey Institute of Technology, Newark, NJ, US.
Humphrey, D.B. and Pulley, L.B., 1997. “Banks' responses to deregulation: Profits, technology, and efficiency.” Journal of Money, Credit, and Banking 29, 73-93.
Khumbakar, S.C., Lozana-Vivas, A., Lovell, C.A.K. and Hasan, I., forthcoming. “The effects of deregulation on the performance of financial institutions: The case of Spanish savings banks.” Journal of Money, Credit and Banking.
Kolori, J., and Zardkoohi, A., 1987. Bank Costs, Structure, and Performance, Lexington Books, USA.
Leibenstein, H., 1966. “Allocative efficiency vs. X-efficiency.” American Economic Review 56, 614-41.
Leibenstein, H., 1978. “On the basic propositions of X-efficiency theory.” American Economic Review 68, 328-32.
Leightner, J.E. and Lovell, C.A.K., 1998. “The impact of financial liberalization on the performance of Thai banks”. Journal of Economics and Business 50, 115-131.
Lozano, A., 1995. “Efficiency and technical change for Spanish banks.” Applied Financial Economics 8, 289-300.
Malmquist, S., 1953. “Index numbers and indifference surfaces.” Trabajos de Estadistica 4, 209-42.
Meeusen, W., and J. van den Broeck, 1977. “Efficiency estimation from Cobb-Douglass production functions with composed error.” International Economics Review 18, 435-444.
Mercan, M. and Yolalan, R., 2000. “Turk bankacilik sisteminde olcek ve mulkiyet yapilari ile finansal performansin iliskisi.” Yapi Kredi tartisma tebligleri serisi. No: 2000-01.
Mester, L.J., 1993. “Efficiency in the savings and loan industry.” Journal of Banking and Finance 17, 267-286.
Mukherjee, K., Ray, S. C., and Miller, S. M., 2001. “Productivity growth in large US commercial banks: The initial post-deregulation experience.” Journal of Banking and Finance 25, 913-39.
Okyar, O., 1965.”The concept of etatism.” The Economic Journal 75, 98-111. Ray, S.C., 1999. “Measurement and decomposition of the Malmquist productivity index:
A parametric approach.” Working paper, University of Connecticut. Sathye, M., 2001. “X-efficiency in Australian banking: An empirical investigation.”
Journal of Banking and Finance 25, 613-30. Saunders, A., Strock, E., and Travlos, N. G., 1990. “Ownership structure, deregulation,
and bank risk taking, “ Journal of Finance 2, 643-654. Saunders, A., 1993. “Panel discussion of ‘The efficiency of financial institutions around
the globe’, Comments on efficiency studies.” Journal of Banking and Finance 17, 551-52.
Sealey, C. and Lindley, J., 1977. “Inputs, outputs, and a theory of production and cost at depository financial institutions,” Journal of Finance 32, 1251-1266.
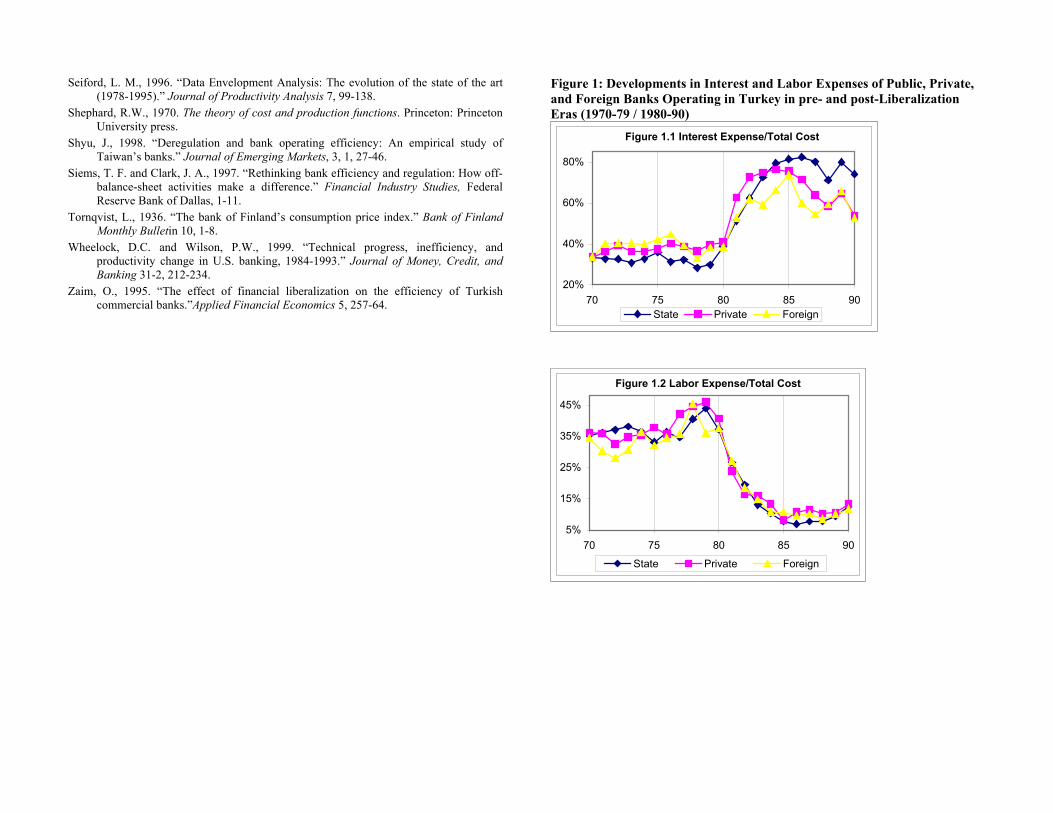
Seiford, L. M., 1996. “Data Envelopment Analysis: The evolution of the state of the art (1978-1995).” Journal of Productivity Analysis 7, 99-138.
Shephard, R.W., 1970. The theory of cost and production functions. Princeton: Princeton University press.
Shyu, J., 1998. “Deregulation and bank operating efficiency: An empirical study of Taiwan’s banks.” Journal of Emerging Markets, 3, 1, 27-46.
Siems, T. F. and Clark, J. A., 1997. “Rethinking bank efficiency and regulation: How off-balance-sheet activities make a difference.” Financial Industry Studies, Federal Reserve Bank of Dallas, 1-11.
Tornqvist, L., 1936. “The bank of Finland’s consumption price index.” Bank of Finland Monthly Bulletin 10, 1-8.
Wheelock, D.C. and Wilson, P.W., 1999. “Technical progress, inefficiency, and productivity change in U.S. banking, 1984-1993.” Journal of Money, Credit, and Banking 31-2, 212-234.
Zaim, O., 1995. “The effect of financial liberalization on the efficiency of Turkish commercial banks.”Applied Financial Economics 5, 257-64.
Figure 1: Developments in Interest and Labor Expenses of Public, Private, and Foreign Banks Operating in Turkey in pre- and post-Liberalization Eras (1970-79 / 1980-90)
Figure 1.1 Interest Expense/Total Cost
20%
40%
60%
80%
70 75 80 85 90State Private Foreign
Figure 1.2 Labor Expense/Total Cost
5%
15%
25%
35%
45%
70 75 80 85 90
State Private Foreign
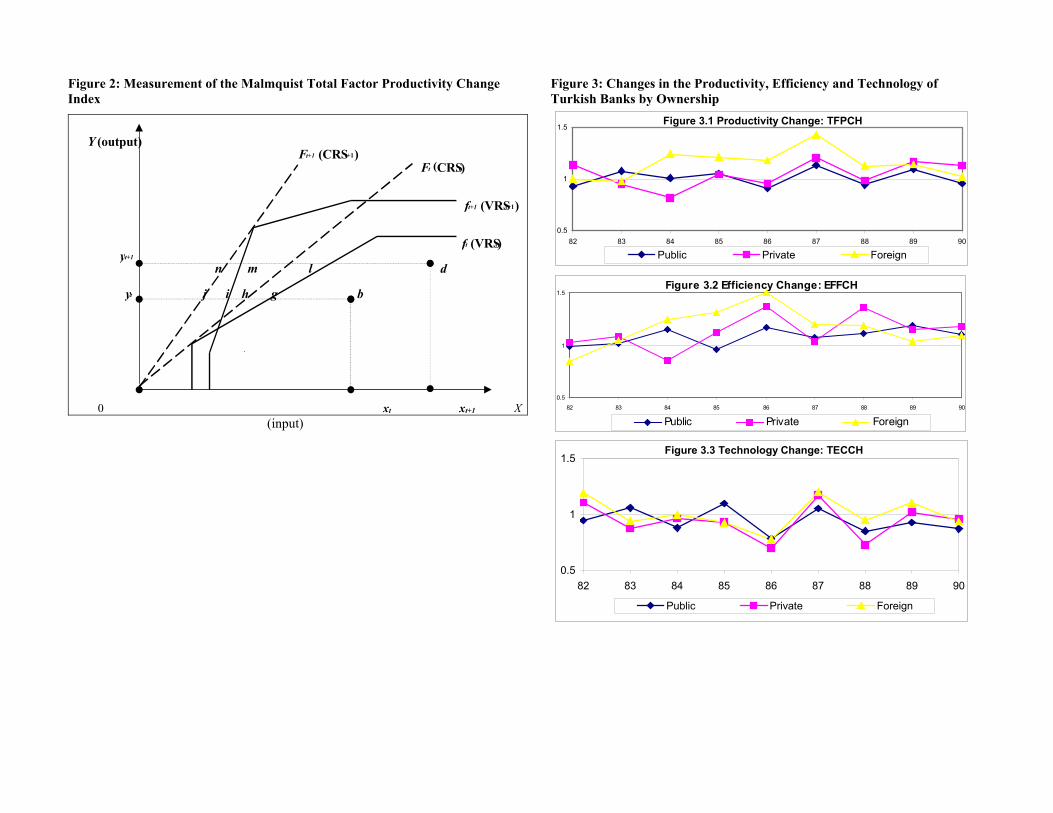
Figure 2: Measurement of the Malmquist Total Factor Productivity Change Index
Y (output) F t+1 (CRS t+1) Ft (CRSt) ft+1 (VRSt+1) ft (VRSt) y t+1 n m l d y t j i h g b
0 xt xt+1 X
(input)
Figure 3: Changes in the Productivity, Efficiency and Technology of Turkish Banks by Ownership
Figure 3.1 Productivity Change: TFPCH
0.5
1
1.5
82 83 84 85 86 87 88 89 90
Public Private Foreign
Figure 3.2 Efficiency Change: EFFCH
0.5
1
1.5
82 83 84 85 86 87 88 89 90
Public Private Foreign Figure 3.3 Technology Change: TECCH
0.5
1
1.5
82 83 84 85 86 87 88 89 90
Public Private Foreign
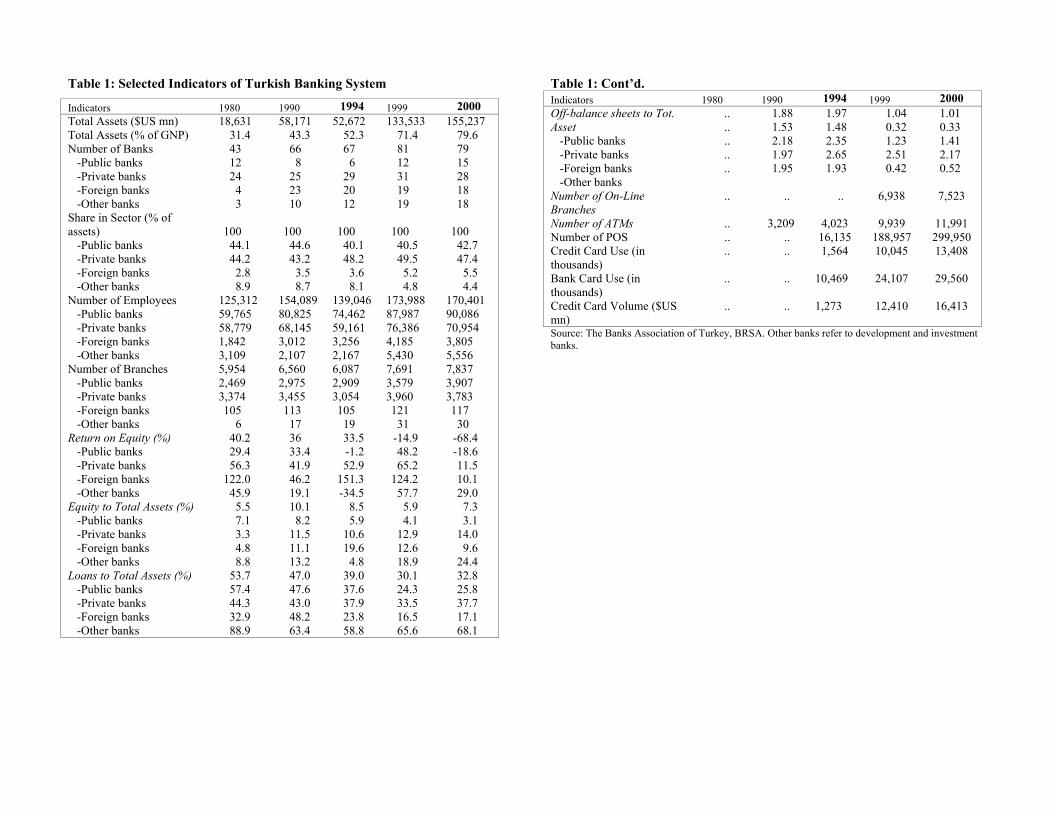
Table 1: Selected Indicators of Turkish Banking System Indicators 1980 1990 1994 1999 2000 Total Assets ($US mn) 18,631 58,171 52,672 133,533 155,237 Total Assets (% of GNP) 31.4 43.3 52.3 71.4 79.6 Number of Banks -Public banks -Private banks -Foreign banks -Other banks
43 12 24 4 3
66 8
25 23 10
67 6
29 20 12
81 12 31 19 19
79 15 28 18 18
Share in Sector (% of assets) -Public banks -Private banks -Foreign banks -Other banks
100 44.1 44.2 2.8 8.9
100 44.6 43.2 3.5 8.7
100 40.1 48.2 3.6 8.1
100 40.5 49.5 5.2 4.8
100 42.7 47.4 5.5 4.4
Number of Employees -Public banks -Private banks -Foreign banks -Other banks
125,312 59,765 58,779 1,842 3,109
154,089 80,825 68,145 3,012 2,107
139,046 74,462 59,161 3,256 2,167
173,988 87,987 76,386 4,185 5,430
170,401 90,086 70,954 3,805 5,556
Number of Branches -Public banks -Private banks -Foreign banks -Other banks
5,954 2,469 3,374 105
6
6,560 2,975 3,455 113 17
6,087 2,909 3,054 105 19
7,691 3,579 3,960 121 31
7,837 3,907 3,783 117 30
Return on Equity (%) -Public banks -Private banks -Foreign banks -Other banks
40.2 29.4 56.3
122.0 45.9
36 33.4 41.9 46.2 19.1
33.5 -1.2 52.9
151.3 -34.5
-14.9 48.2 65.2
124.2 57.7
-68.4 -18.6 11.5 10.1 29.0
Equity to Total Assets (%) -Public banks -Private banks -Foreign banks -Other banks
5.5 7.1 3.3 4.8 8.8
10.1 8.2
11.5 11.1 13.2
8.5 5.9
10.6 19.6 4.8
5.9 4.1
12.9 12.6 18.9
7.3 3.1
14.0 9.6
24.4 Loans to Total Assets (%) -Public banks -Private banks -Foreign banks -Other banks
53.7 57.4 44.3 32.9 88.9
47.0 47.6 43.0 48.2 63.4
39.0 37.6 37.9 23.8 58.8
30.1 24.3 33.5 16.5 65.6
32.8 25.8 37.7 17.1 68.1
Table 1: Cont’d. Indicators 1980 1990 1994 1999 2000 Off-balance sheets to Tot. Asset -Public banks -Private banks -Foreign banks -Other banks
..
..
..
..
..
1.88 1.53 2.18 1.97 1.95
1.97 1.48 2.35 2.65 1.93
1.04 0.32 1.23 2.51 0.42
1.01 0.33 1.41 2.17 0.52
Number of On-Line Branches
.. .. .. 6,938 7,523
Number of ATMs .. 3,209 4,023 9,939 11,991 Number of POS .. .. 16,135 188,957 299,950 Credit Card Use (in thousands)
.. .. 1,564 10,045 13,408
Bank Card Use (in thousands)
.. .. 10,469 24,107 29,560
Credit Card Volume ($US mn)
.. .. 1,273 12,410 16,413
Source: The Banks Association of Turkey, BRSA. Other banks refer to development and investment banks.
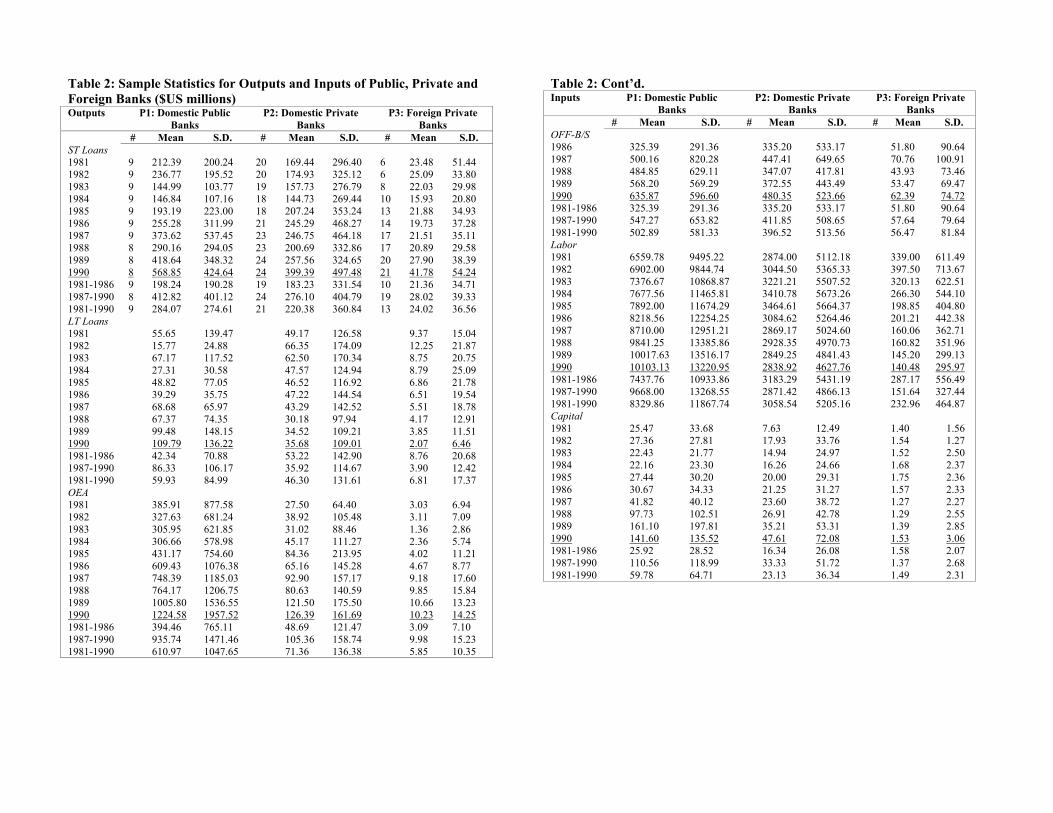
Table 2: Sample Statistics for Outputs and Inputs of Public, Private and Foreign Banks ($US millions) Outputs P1: Domestic Public
Banks P2: Domestic Private
Banks P3: Foreign Private
Banks # Mean S.D. # Mean S.D. # Mean S.D. ST Loans 1981 9 212.39 200.24 20 169.44 296.40 6 23.48 51.44 1982 9 236.77 195.52 20 174.93 325.12 6 25.09 33.80 1983 9 144.99 103.77 19 157.73 276.79 8 22.03 29.98 1984 9 146.84 107.16 18 144.73 269.44 10 15.93 20.80 1985 9 193.19 223.00 18 207.24 353.24 13 21.88 34.93 1986 9 255.28 311.99 21 245.29 468.27 14 19.73 37.28 1987 9 373.62 537.45 23 246.75 464.18 17 21.51 35.11 1988 8 290.16 294.05 23 200.69 332.86 17 20.89 29.58 1989 8 418.64 348.32 24 257.56 324.65 20 27.90 38.39 1990 8 568.85 424.64 24 399.39 497.48 21 41.78 54.24 1981-1986 9 198.24 190.28 19 183.23 331.54 10 21.36 34.71 1987-1990 8 412.82 401.12 24 276.10 404.79 19 28.02 39.33 1981-1990 9 284.07 274.61 21 220.38 360.84 13 24.02 36.56 LT Loans 1981 55.65 139.47 49.17 126.58 9.37 15.04 1982 15.77 24.88 66.35 174.09 12.25 21.87 1983 67.17 117.52 62.50 170.34 8.75 20.75 1984 27.31 30.58 47.57 124.94 8.79 25.09 1985 48.82 77.05 46.52 116.92 6.86 21.78 1986 39.29 35.75 47.22 144.54 6.51 19.54 1987 68.68 65.97 43.29 142.52 5.51 18.78 1988 67.37 74.35 30.18 97.94 4.17 12.91 1989 99.48 148.15 34.52 109.21 3.85 11.51 1990 109.79 136.22 35.68 109.01 2.07 6.46 1981-1986 42.34 70.88 53.22 142.90 8.76 20.68 1987-1990 86.33 106.17 35.92 114.67 3.90 12.42 1981-1990 59.93 84.99 46.30 131.61 6.81 17.37 OEA 1981 385.91 877.58 27.50 64.40 3.03 6.94 1982 327.63 681.24 38.92 105.48 3.11 7.09 1983 305.95 621.85 31.02 88.46 1.36 2.86 1984 306.66 578.98 45.17 111.27 2.36 5.74 1985 431.17 754.60 84.36 213.95 4.02 11.21 1986 609.43 1076.38 65.16 145.28 4.67 8.77 1987 748.39 1185.03 92.90 157.17 9.18 17.60 1988 764.17 1206.75 80.63 140.59 9.85 15.84 1989 1005.80 1536.55 121.50 175.50 10.66 13.23 1990 1224.58 1957.52 126.39 161.69 10.23 14.25 1981-1986 394.46 765.11 48.69 121.47 3.09 7.10 1987-1990 935.74 1471.46 105.36 158.74 9.98 15.23 1981-1990 610.97 1047.65 71.36 136.38 5.85 10.35
Table 2: Cont’d. Inputs P1: Domestic Public
Banks P2: Domestic Private
Banks P3: Foreign Private
Banks # Mean S.D. # Mean S.D. # Mean S.D. OFF-B/S 1986 325.39 291.36 335.20 533.17 51.80 90.64 1987 500.16 820.28 447.41 649.65 70.76 100.91 1988 484.85 629.11 347.07 417.81 43.93 73.46 1989 568.20 569.29 372.55 443.49 53.47 69.47 1990 635.87 596.60 480.35 523.66 62.39 74.72 1981-1986 325.39 291.36 335.20 533.17 51.80 90.64 1987-1990 547.27 653.82 411.85 508.65 57.64 79.64 1981-1990 502.89 581.33 396.52 513.56 56.47 81.84 Labor 1981 6559.78 9495.22 2874.00 5112.18 339.00 611.49 1982 6902.00 9844.74 3044.50 5365.33 397.50 713.67 1983 7376.67 10868.87 3221.21 5507.52 320.13 622.51 1984 7677.56 11465.81 3410.78 5673.26 266.30 544.10 1985 7892.00 11674.29 3464.61 5664.37 198.85 404.80 1986 8218.56 12254.25 3084.62 5264.46 201.21 442.38 1987 8710.00 12951.21 2869.17 5024.60 160.06 362.71 1988 9841.25 13385.86 2928.35 4970.73 160.82 351.96 1989 10017.63 13516.17 2849.25 4841.43 145.20 299.13 1990 10103.13 13220.95 2838.92 4627.76 140.48 295.97 1981-1986 7437.76 10933.86 3183.29 5431.19 287.17 556.49 1987-1990 9668.00 13268.55 2871.42 4866.13 151.64 327.44 1981-1990 8329.86 11867.74 3058.54 5205.16 232.96 464.87 Capital 1981 25.47 33.68 7.63 12.49 1.40 1.56 1982 27.36 27.81 17.93 33.76 1.54 1.27 1983 22.43 21.77 14.94 24.97 1.52 2.50 1984 22.16 23.30 16.26 24.66 1.68 2.37 1985 27.44 30.20 20.00 29.31 1.75 2.36 1986 30.67 34.33 21.25 31.27 1.57 2.33 1987 41.82 40.12 23.60 38.72 1.27 2.27 1988 97.73 102.51 26.91 42.78 1.29 2.55 1989 161.10 197.81 35.21 53.31 1.39 2.85 1990 141.60 135.52 47.61 72.08 1.53 3.06 1981-1986 25.92 28.52 16.34 26.08 1.58 2.07 1987-1990 110.56 118.99 33.33 51.72 1.37 2.68 1981-1990 59.78 64.71 23.13 36.34 1.49 2.31
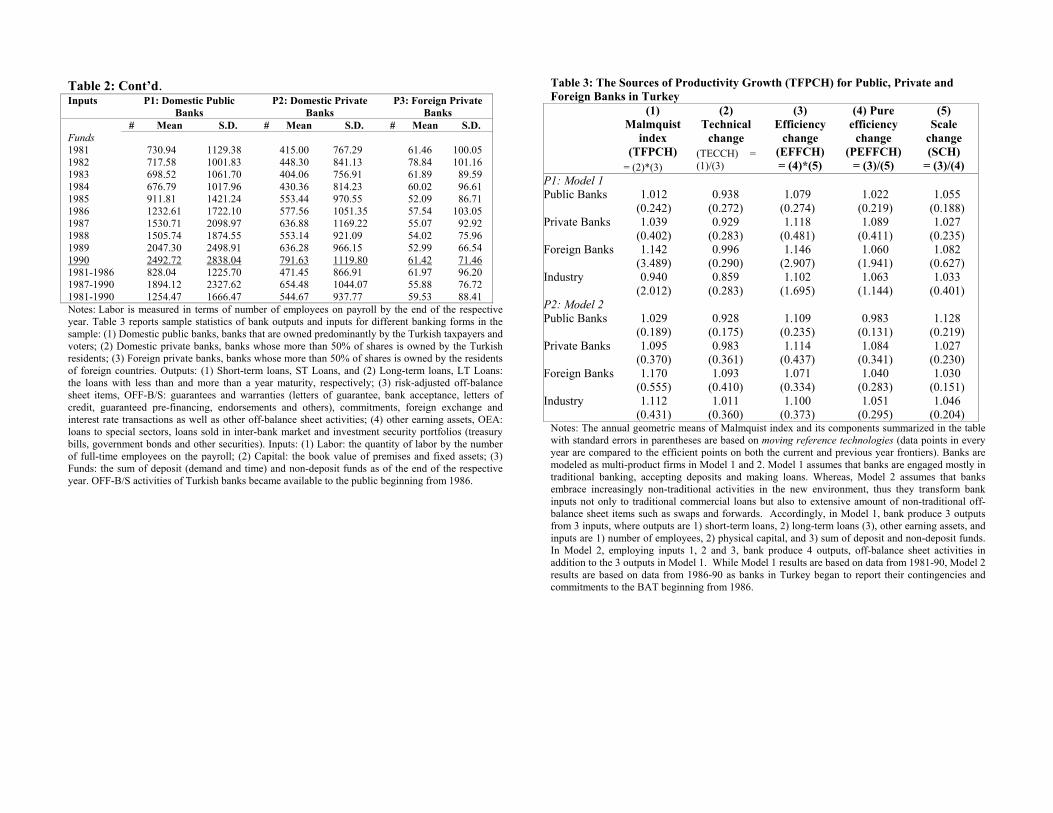
Table 2: Cont’d. Inputs P1: Domestic Public
Banks P2: Domestic Private
Banks P3: Foreign Private
Banks # Mean S.D. # Mean S.D. # Mean S.D. Funds 1981 730.94 1129.38 415.00 767.29 61.46 100.05 1982 717.58 1001.83 448.30 841.13 78.84 101.16 1983 698.52 1061.70 404.06 756.91 61.89 89.59 1984 676.79 1017.96 430.36 814.23 60.02 96.61 1985 911.81 1421.24 553.44 970.55 52.09 86.71 1986 1232.61 1722.10 577.56 1051.35 57.54 103.05 1987 1530.71 2098.97 636.88 1169.22 55.07 92.92 1988 1505.74 1874.55 553.14 921.09 54.02 75.96 1989 2047.30 2498.91 636.28 966.15 52.99 66.54 1990 2492.72 2838.04 791.63 1119.80 61.42 71.46 1981-1986 828.04 1225.70 471.45 866.91 61.97 96.20 1987-1990 1894.12 2327.62 654.48 1044.07 55.88 76.72 1981-1990 1254.47 1666.47 544.67 937.77 59.53 88.41 Notes: Labor is measured in terms of number of employees on payroll by the end of the respective year. Table 3 reports sample statistics of bank outputs and inputs for different banking forms in the sample: (1) Domestic public banks, banks that are owned predominantly by the Turkish taxpayers and voters; (2) Domestic private banks, banks whose more than 50% of shares is owned by the Turkish residents; (3) Foreign private banks, banks whose more than 50% of shares is owned by the residents of foreign countries. Outputs: (1) Short-term loans, ST Loans, and (2) Long-term loans, LT Loans: the loans with less than and more than a year maturity, respectively; (3) risk-adjusted off-balance sheet items, OFF-B/S: guarantees and warranties (letters of guarantee, bank acceptance, letters of credit, guaranteed pre-financing, endorsements and others), commitments, foreign exchange and interest rate transactions as well as other off-balance sheet activities; (4) other earning assets, OEA: loans to special sectors, loans sold in inter-bank market and investment security portfolios (treasury bills, government bonds and other securities). Inputs: (1) Labor: the quantity of labor by the number of full-time employees on the payroll; (2) Capital: the book value of premises and fixed assets; (3) Funds: the sum of deposit (demand and time) and non-deposit funds as of the end of the respective year. OFF-B/S activities of Turkish banks became available to the public beginning from 1986.
Table 3: The Sources of Productivity Growth (TFPCH) for Public, Private and Foreign Banks in Turkey (1)
Malmquist index
(TFPCH) = (2)*(3)
(2) Technical
change (TECCH) = (1)/(3)
(3) Efficiency
change (EFFCH) = (4)*(5)
(4) Pure efficiency
change (PEFFCH)
= (3)/(5)
(5) Scale
change (SCH)
= (3)/(4) P1: Model 1 Public Banks 1.012
(0.242) 0.938
(0.272) 1.079
(0.274) 1.022
(0.219) 1.055
(0.188) Private Banks 1.039
(0.402) 0.929
(0.283) 1.118
(0.481) 1.089
(0.411) 1.027
(0.235) Foreign Banks 1.142
(3.489) 0.996
(0.290) 1.146
(2.907) 1.060
(1.941) 1.082
(0.627) Industry 0.940
(2.012) 0.859
(0.283) 1.102
(1.695) 1.063
(1.144) 1.033
(0.401) P2: Model 2 Public Banks 1.029
(0.189) 0.928
(0.175) 1.109
(0.235) 0.983
(0.131) 1.128
(0.219) Private Banks 1.095
(0.370) 0.983
(0.361) 1.114
(0.437) 1.084
(0.341) 1.027
(0.230) Foreign Banks 1.170
(0.555) 1.093
(0.410) 1.071
(0.334) 1.040
(0.283) 1.030
(0.151) Industry 1.112
(0.431) 1.011
(0.360) 1.100
(0.373) 1.051
(0.295) 1.046
(0.204) Notes: The annual geometric means of Malmquist index and its components summarized in the table with standard errors in parentheses are based on moving reference technologies (data points in every year are compared to the efficient points on both the current and previous year frontiers). Banks are modeled as multi-product firms in Model 1 and 2. Model 1 assumes that banks are engaged mostly in traditional banking, accepting deposits and making loans. Whereas, Model 2 assumes that banks embrace increasingly non-traditional activities in the new environment, thus they transform bank inputs not only to traditional commercial loans but also to extensive amount of non-traditional off-balance sheet items such as swaps and forwards. Accordingly, in Model 1, bank produce 3 outputs from 3 inputs, where outputs are 1) short-term loans, 2) long-term loans (3), other earning assets, and inputs are 1) number of employees, 2) physical capital, and 3) sum of deposit and non-deposit funds. In Model 2, employing inputs 1, 2 and 3, bank produce 4 outputs, off-balance sheet activities in addition to the 3 outputs in Model 1. While Model 1 results are based on data from 1981-90, Model 2 results are based on data from 1986-90 as banks in Turkey began to report their contingencies and commitments to the BAT beginning from 1986.
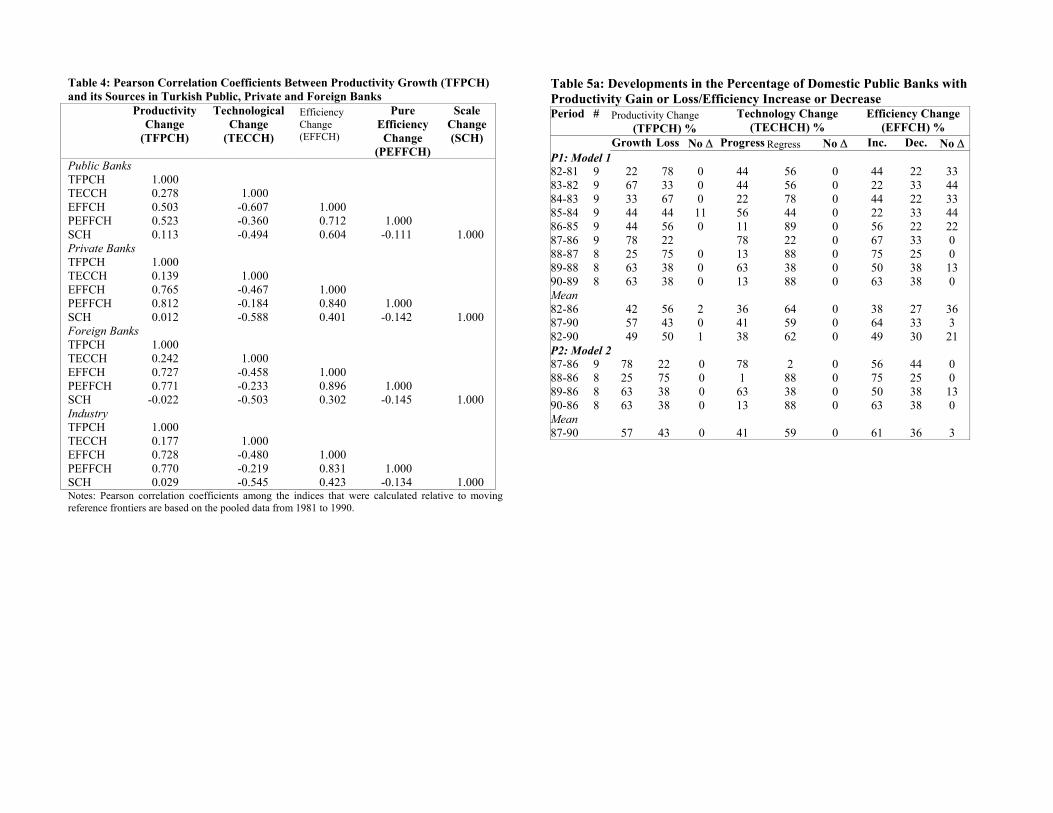
Table 4: Pearson Correlation Coefficients Between Productivity Growth (TFPCH) and its Sources in Turkish Public, Private and Foreign Banks Productivity
Change (TFPCH)
Technological Change
(TECCH)
Efficiency Change (EFFCH)
Pure Efficiency
Change (PEFFCH)
Scale Change (SCH)
Public Banks TFPCH 1.000 TECCH 0.278 1.000 EFFCH 0.503 -0.607 1.000 PEFFCH 0.523 -0.360 0.712 1.000 SCH 0.113 -0.494 0.604 -0.111 1.000 Private Banks TFPCH 1.000 TECCH 0.139 1.000 EFFCH 0.765 -0.467 1.000 PEFFCH 0.812 -0.184 0.840 1.000 SCH 0.012 -0.588 0.401 -0.142 1.000 Foreign Banks TFPCH 1.000 TECCH 0.242 1.000 EFFCH 0.727 -0.458 1.000 PEFFCH 0.771 -0.233 0.896 1.000 SCH -0.022 -0.503 0.302 -0.145 1.000 Industry TFPCH 1.000 TECCH 0.177 1.000 EFFCH 0.728 -0.480 1.000 PEFFCH 0.770 -0.219 0.831 1.000 SCH 0.029 -0.545 0.423 -0.134 1.000 Notes: Pearson correlation coefficients among the indices that were calculated relative to moving reference frontiers are based on the pooled data from 1981 to 1990.
Table 5a: Developments in the Percentage of Domestic Public Banks with Productivity Gain or Loss/Efficiency Increase or Decrease
Period # Productivity Change (TFPCH) %
Technology Change (TECHCH) %
Efficiency Change (EFFCH) %
Growth Loss No ∆ Progress Regress No ∆ Inc. Dec. No ∆P1: Model 1 82-81 9 22 78 0 44 56 0 44 22 33 83-82 9 67 33 0 44 56 0 22 33 44 84-83 9 33 67 0 22 78 0 44 22 33 85-84 9 44 44 11 56 44 0 22 33 44 86-85 9 44 56 0 11 89 0 56 22 22 87-86 9 78 22 78 22 0 67 33 0 88-87 8 25 75 0 13 88 0 75 25 0 89-88 8 63 38 0 63 38 0 50 38 13 90-89 8 63 38 0 13 88 0 63 38 0 Mean 82-86 42 56 2 36 64 0 38 27 36 87-90 57 43 0 41 59 0 64 33 3 82-90 49 50 1 38 62 0 49 30 21 P2: Model 2 87-86 9 78 22 0 78 2 0 56 44 0 88-86 8 25 75 0 1 88 0 75 25 0 89-86 8 63 38 0 63 38 0 50 38 13 90-86 8 63 38 0 13 88 0 63 38 0 Mean 87-90 57 43 0 41 59 0 61 36 3
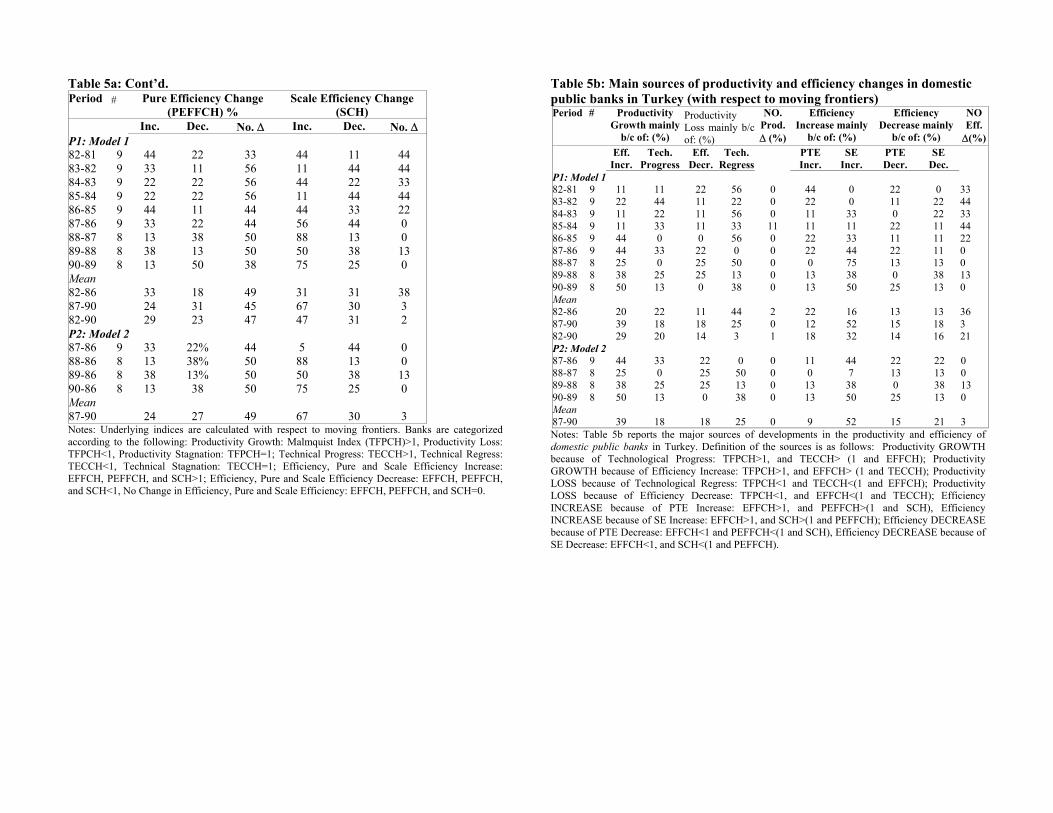
Table 5a: Cont’d. Period # Pure Efficiency Change
(PEFFCH) % Scale Efficiency Change
(SCH) Inc. Dec. No. ∆ Inc. Dec. No. ∆ P1: Model 1 82-81 9 44 22 33 44 11 44 83-82 9 33 11 56 11 44 44 84-83 9 22 22 56 44 22 33 85-84 9 22 22 56 11 44 44 86-85 9 44 11 44 44 33 22 87-86 9 33 22 44 56 44 0 88-87 8 13 38 50 88 13 0 89-88 8 38 13 50 50 38 13 90-89 8 13 50 38 75 25 0 Mean 82-86 33 18 49 31 31 38 87-90 24 31 45 67 30 3 82-90 29 23 47 47 31 2 P2: Model 2 87-86 9 33 22% 44 5 44 0 88-86 8 13 38% 50 88 13 0 89-86 8 38 13% 50 50 38 13 90-86 8 13 38 50 75 25 0 Mean 87-90 24 27 49 67 30 3 Notes: Underlying indices are calculated with respect to moving frontiers. Banks are categorized according to the following: Productivity Growth: Malmquist Index (TFPCH)>1, Productivity Loss: TFPCH<1, Productivity Stagnation: TFPCH=1; Technical Progress: TECCH>1, Technical Regress: TECCH<1, Technical Stagnation: TECCH=1; Efficiency, Pure and Scale Efficiency Increase: EFFCH, PEFFCH, and SCH>1; Efficiency, Pure and Scale Efficiency Decrease: EFFCH, PEFFCH, and SCH<1, No Change in Efficiency, Pure and Scale Efficiency: EFFCH, PEFFCH, and SCH=0.
Table 5b: Main sources of productivity and efficiency changes in domestic public banks in Turkey (with respect to moving frontiers) Period # Productivity
Growth mainly b/c of: (%)
Productivity Loss mainly b/c of: (%)
NO. Prod.∆ (%)
Efficiency Increase mainly
b/c of: (%)
Efficiency Decrease mainly
b/c of: (%)
NO Eff. ∆(%)
Eff. Incr.
Tech. Progress
Eff. Decr.
Tech. Regress
PTE Incr.
SE Incr.
PTE Decr.
SE Dec.
P1: Model 1 82-81 9 11 11 22 56 0 44 0 22 0 33 83-82 9 22 44 11 22 0 22 0 11 22 44 84-83 9 11 22 11 56 0 11 33 0 22 33 85-84 9 11 33 11 33 11 11 11 22 11 44 86-85 9 44 0 0 56 0 22 33 11 11 22 87-86 9 44 33 22 0 0 22 44 22 11 0 88-87 8 25 0 25 50 0 0 75 13 13 0 89-88 8 38 25 25 13 0 13 38 0 38 13 90-89 8 50 13 0 38 0 13 50 25 13 0 Mean 82-86 20 22 11 44 2 22 16 13 13 36 87-90 39 18 18 25 0 12 52 15 18 3 82-90 29 20 14 3 1 18 32 14 16 21 P2: Model 2 87-86 9 44 33 22 0 0 11 44 22 22 0 88-87 8 25 0 25 50 0 0 7 13 13 0 89-88 8 38 25 25 13 0 13 38 0 38 13 90-89 8 50 13 0 38 0 13 50 25 13 0 Mean 87-90 39 18 18 25 0 9 52 15 21 3 Notes: Table 5b reports the major sources of developments in the productivity and efficiency of domestic public banks in Turkey. Definition of the sources is as follows: Productivity GROWTH because of Technological Progress: TFPCH>1, and TECCH> (1 and EFFCH); Productivity GROWTH because of Efficiency Increase: TFPCH>1, and EFFCH> (1 and TECCH); Productivity LOSS because of Technological Regress: TFPCH<1 and TECCH<(1 and EFFCH); Productivity LOSS because of Efficiency Decrease: TFPCH<1, and EFFCH<(1 and TECCH); Efficiency INCREASE because of PTE Increase: EFFCH>1, and PEFFCH>(1 and SCH), Efficiency INCREASE because of SE Increase: EFFCH>1, and SCH>(1 and PEFFCH); Efficiency DECREASE because of PTE Decrease: EFFCH<1 and PEFFCH<(1 and SCH), Efficiency DECREASE because of SE Decrease: EFFCH<1, and SCH<(1 and PEFFCH).
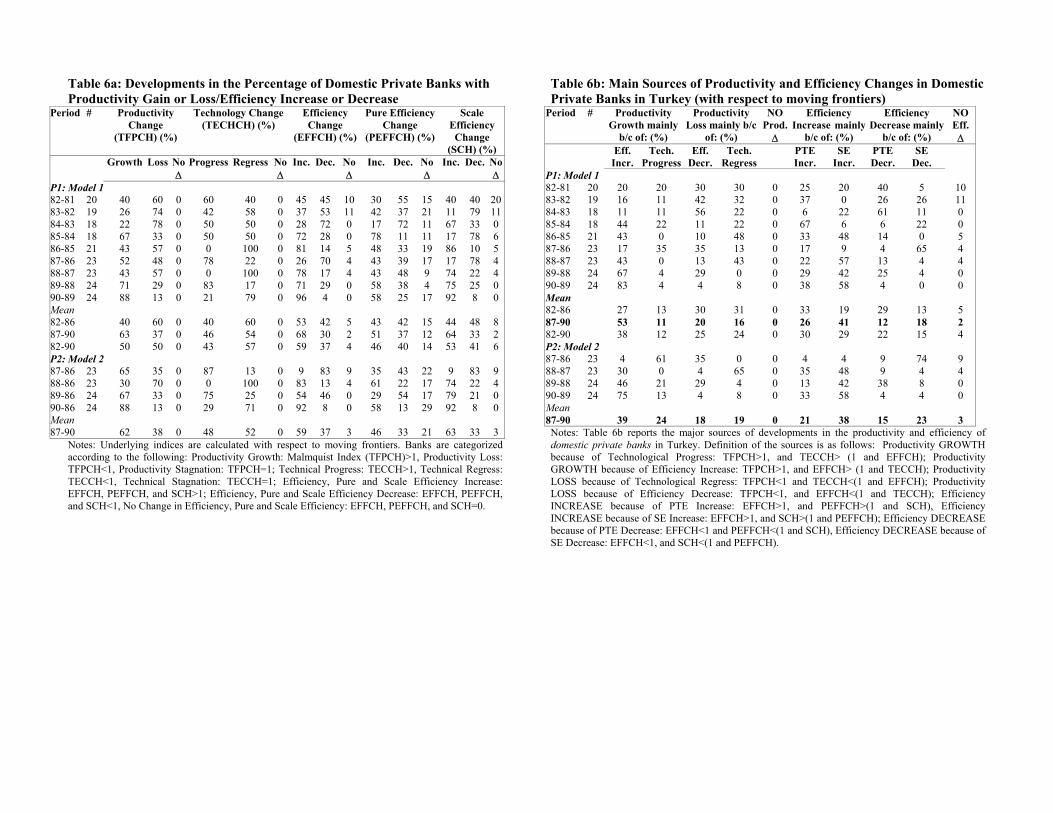
Table 6a: Developments in the Percentage of Domestic Private Banks with Productivity Gain or Loss/Efficiency Increase or Decrease
Period # Productivity Change
(TFPCH) (%)
Technology Change (TECHCH) (%)
Efficiency Change
(EFFCH) (%)
Pure Efficiency Change
(PEFFCH) (%)
Scale Efficiency Change
(SCH) (%) Growth Loss No
∆ Progress Regress No
∆ Inc. Dec. No
∆ Inc. Dec. No
∆ Inc. Dec. No
∆ P1: Model 1 82-81 20 40 60 0 60 40 0 45 45 10 30 55 15 40 40 2083-82 19 26 74 0 42 58 0 37 53 11 42 37 21 11 79 1184-83 18 22 78 0 50 50 0 28 72 0 17 72 11 67 33 0 85-84 18 67 33 0 50 50 0 72 28 0 78 11 11 17 78 6 86-85 21 43 57 0 0 100 0 81 14 5 48 33 19 86 10 5 87-86 23 52 48 0 78 22 0 26 70 4 43 39 17 17 78 4 88-87 23 43 57 0 0 100 0 78 17 4 43 48 9 74 22 4 89-88 24 71 29 0 83 17 0 71 29 0 58 38 4 75 25 0 90-89 24 88 13 0 21 79 0 96 4 0 58 25 17 92 8 0 Mean 82-86 40 60 0 40 60 0 53 42 5 43 42 15 44 48 8 87-90 63 37 0 46 54 0 68 30 2 51 37 12 64 33 2 82-90 50 50 0 43 57 0 59 37 4 46 40 14 53 41 6 P2: Model 2 87-86 23 65 35 0 87 13 0 9 83 9 35 43 22 9 83 9 88-86 23 30 70 0 0 100 0 83 13 4 61 22 17 74 22 4 89-86 24 67 33 0 75 25 0 54 46 0 29 54 17 79 21 0 90-86 24 88 13 0 29 71 0 92 8 0 58 13 29 92 8 0 Mean 87-90 62 38 0 48 52 0 59 37 3 46 33 21 63 33 3
Notes: Underlying indices are calculated with respect to moving frontiers. Banks are categorized according to the following: Productivity Growth: Malmquist Index (TFPCH)>1, Productivity Loss: TFPCH<1, Productivity Stagnation: TFPCH=1; Technical Progress: TECCH>1, Technical Regress: TECCH<1, Technical Stagnation: TECCH=1; Efficiency, Pure and Scale Efficiency Increase: EFFCH, PEFFCH, and SCH>1; Efficiency, Pure and Scale Efficiency Decrease: EFFCH, PEFFCH, and SCH<1, No Change in Efficiency, Pure and Scale Efficiency: EFFCH, PEFFCH, and SCH=0.
Table 6b: Main Sources of Productivity and Efficiency Changes in Domestic Private Banks in Turkey (with respect to moving frontiers)
Period # Productivity Growth mainly
b/c of: (%)
Productivity Loss mainly b/c
of: (%)
NO Prod.∆
Efficiency Increase mainly
b/c of: (%)
Efficiency Decrease mainly
b/c of: (%)
NO Eff. ∆
Eff. Incr.
Tech. Progress
Eff. Decr.
Tech. Regress
PTEIncr.
SE Incr.
PTEDecr.
SE Dec.
P1: Model 1 82-81 20 20 20 30 30 0 25 20 40 5 10 83-82 19 16 11 42 32 0 37 0 26 26 11 84-83 18 11 11 56 22 0 6 22 61 11 0 85-84 18 44 22 11 22 0 67 6 6 22 0 86-85 21 43 0 10 48 0 33 48 14 0 5 87-86 23 17 35 35 13 0 17 9 4 65 4 88-87 23 43 0 13 43 0 22 57 13 4 4 89-88 24 67 4 29 0 0 29 42 25 4 0 90-89 24 83 4 4 8 0 38 58 4 0 0 Mean 82-86 27 13 30 31 0 33 19 29 13 5 87-90 53 11 20 16 0 26 41 12 18 2 82-90 38 12 25 24 0 30 29 22 15 4 P2: Model 2 87-86 23 4 61 35 0 0 4 4 9 74 9 88-87 23 30 0 4 65 0 35 48 9 4 4 89-88 24 46 21 29 4 0 13 42 38 8 0 90-89 24 75 13 4 8 0 33 58 4 4 0 Mean 87-90 39 24 18 19 0 21 38 15 23 3 Notes: Table 6b reports the major sources of developments in the productivity and efficiency of domestic private banks in Turkey. Definition of the sources is as follows: Productivity GROWTH because of Technological Progress: TFPCH>1, and TECCH> (1 and EFFCH); Productivity GROWTH because of Efficiency Increase: TFPCH>1, and EFFCH> (1 and TECCH); Productivity LOSS because of Technological Regress: TFPCH<1 and TECCH<(1 and EFFCH); Productivity LOSS because of Efficiency Decrease: TFPCH<1, and EFFCH<(1 and TECCH); Efficiency INCREASE because of PTE Increase: EFFCH>1, and PEFFCH>(1 and SCH), Efficiency INCREASE because of SE Increase: EFFCH>1, and SCH>(1 and PEFFCH); Efficiency DECREASE because of PTE Decrease: EFFCH<1 and PEFFCH<(1 and SCH), Efficiency DECREASE because of SE Decrease: EFFCH<1, and SCH<(1 and PEFFCH).
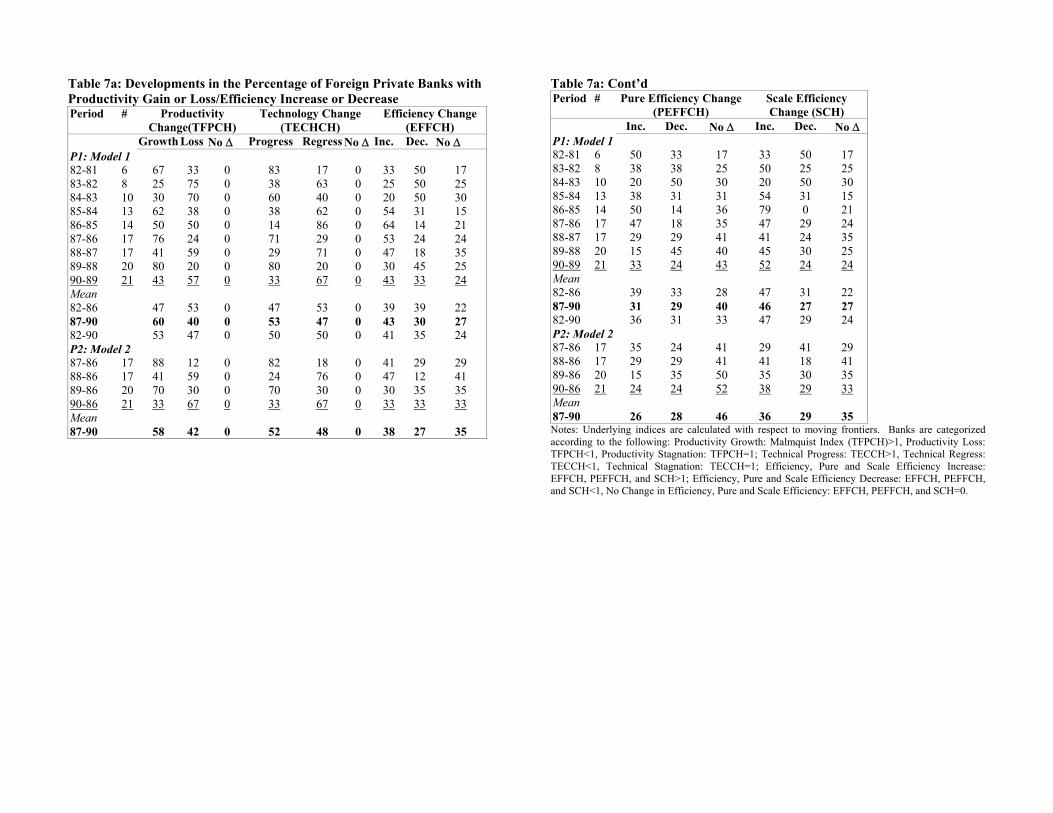
Table 7a: Developments in the Percentage of Foreign Private Banks with Productivity Gain or Loss/Efficiency Increase or Decrease Period # Productivity
Change(TFPCH) Technology Change
(TECHCH) Efficiency Change
(EFFCH) Growth Loss No ∆ Progress Regress No ∆ Inc. Dec. No ∆ P1: Model 1 82-81 6 67 33 0 83 17 0 33 50 17 83-82 8 25 75 0 38 63 0 25 50 25 84-83 10 30 70 0 60 40 0 20 50 30 85-84 13 62 38 0 38 62 0 54 31 15 86-85 14 50 50 0 14 86 0 64 14 21 87-86 17 76 24 0 71 29 0 53 24 24 88-87 17 41 59 0 29 71 0 47 18 35 89-88 20 80 20 0 80 20 0 30 45 25 90-89 21 43 57 0 33 67 0 43 33 24 Mean 82-86 47 53 0 47 53 0 39 39 22 87-90 60 40 0 53 47 0 43 30 27 82-90 53 47 0 50 50 0 41 35 24 P2: Model 2 87-86 17 88 12 0 82 18 0 41 29 29 88-86 17 41 59 0 24 76 0 47 12 41 89-86 20 70 30 0 70 30 0 30 35 35 90-86 21 33 67 0 33 67 0 33 33 33 Mean 87-90 58 42 0 52 48 0 38 27 35
Table 7a: Cont’d Period # Pure Efficiency Change
(PEFFCH) Scale Efficiency Change (SCH)
Inc. Dec. No ∆ Inc. Dec. No ∆ P1: Model 1 82-81 6 50 33 17 33 50 17 83-82 8 38 38 25 50 25 25 84-83 10 20 50 30 20 50 30 85-84 13 38 31 31 54 31 15 86-85 14 50 14 36 79 0 21 87-86 17 47 18 35 47 29 24 88-87 17 29 29 41 41 24 35 89-88 20 15 45 40 45 30 25 90-89 21 33 24 43 52 24 24 Mean 82-86 39 33 28 47 31 22 87-90 31 29 40 46 27 27 82-90 36 31 33 47 29 24 P2: Model 2 87-86 17 35 24 41 29 41 29 88-86 17 29 29 41 41 18 41 89-86 20 15 35 50 35 30 35 90-86 21 24 24 52 38 29 33 Mean 87-90 26 28 46 36 29 35 Notes: Underlying indices are calculated with respect to moving frontiers. Banks are categorized according to the following: Productivity Growth: Malmquist Index (TFPCH)>1, Productivity Loss: TFPCH<1, Productivity Stagnation: TFPCH=1; Technical Progress: TECCH>1, Technical Regress: TECCH<1, Technical Stagnation: TECCH=1; Efficiency, Pure and Scale Efficiency Increase: EFFCH, PEFFCH, and SCH>1; Efficiency, Pure and Scale Efficiency Decrease: EFFCH, PEFFCH, and SCH<1, No Change in Efficiency, Pure and Scale Efficiency: EFFCH, PEFFCH, and SCH=0.
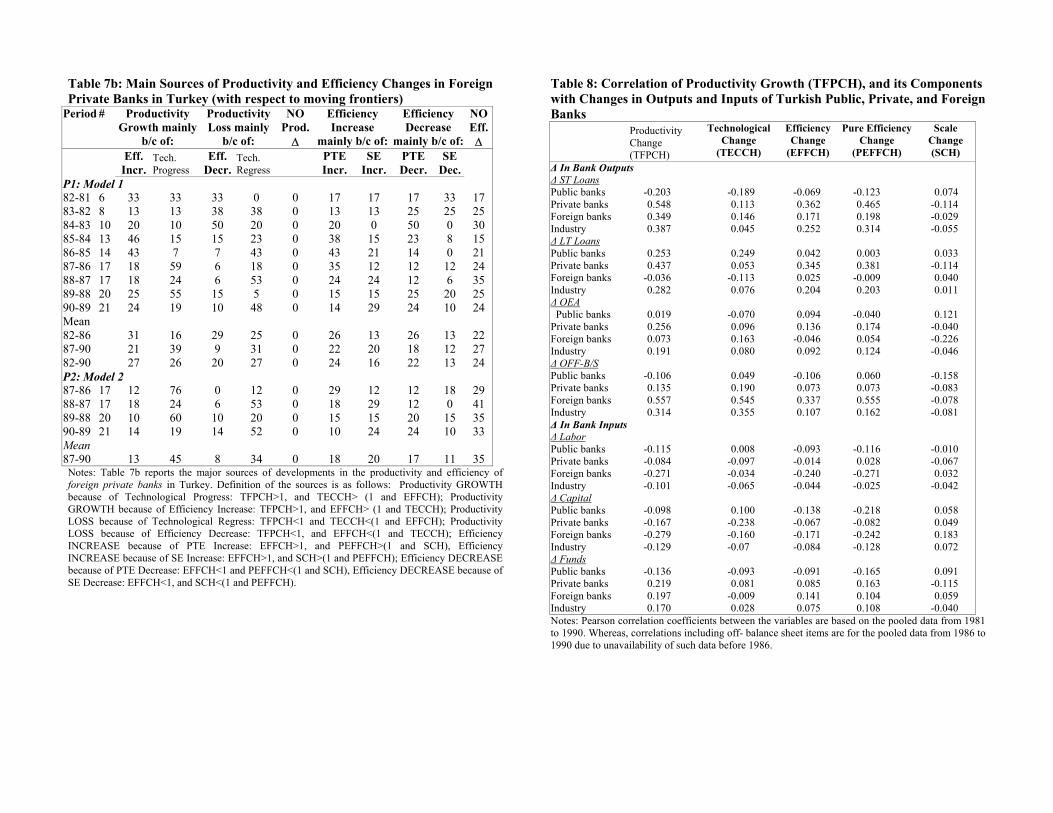
Table 7b: Main Sources of Productivity and Efficiency Changes in Foreign Private Banks in Turkey (with respect to moving frontiers)
Period # Productivity Growth mainly
b/c of:
Productivity Loss mainly
b/c of:
NO Prod. ∆
Efficiency Increase
mainly b/c of:
Efficiency Decrease
mainly b/c of:
NOEff.∆
Eff. Incr.
Tech. Progress
Eff. Decr.
Tech. Regress
PTE Incr.
SE Incr.
PTE Decr.
SE Dec.
P1: Model 1 82-81 6 33 33 33 0 0 17 17 17 33 17 83-82 8 13 13 38 38 0 13 13 25 25 25 84-83 10 20 10 50 20 0 20 0 50 0 30 85-84 13 46 15 15 23 0 38 15 23 8 15 86-85 14 43 7 7 43 0 43 21 14 0 21 87-86 17 18 59 6 18 0 35 12 12 12 24 88-87 17 18 24 6 53 0 24 24 12 6 35 89-88 20 25 55 15 5 0 15 15 25 20 25 90-89 21 24 19 10 48 0 14 29 24 10 24 Mean 82-86 31 16 29 25 0 26 13 26 13 22 87-90 21 39 9 31 0 22 20 18 12 27 82-90 27 26 20 27 0 24 16 22 13 24 P2: Model 2 87-86 17 12 76 0 12 0 29 12 12 18 29 88-87 17 18 24 6 53 0 18 29 12 0 41 89-88 20 10 60 10 20 0 15 15 20 15 35 90-89 21 14 19 14 52 0 10 24 24 10 33 Mean 87-90 13 45 8 34 0 18 20 17 11 35 Notes: Table 7b reports the major sources of developments in the productivity and efficiency of foreign private banks in Turkey. Definition of the sources is as follows: Productivity GROWTH because of Technological Progress: TFPCH>1, and TECCH> (1 and EFFCH); Productivity GROWTH because of Efficiency Increase: TFPCH>1, and EFFCH> (1 and TECCH); Productivity LOSS because of Technological Regress: TFPCH<1 and TECCH<(1 and EFFCH); Productivity LOSS because of Efficiency Decrease: TFPCH<1, and EFFCH<(1 and TECCH); Efficiency INCREASE because of PTE Increase: EFFCH>1, and PEFFCH>(1 and SCH), Efficiency INCREASE because of SE Increase: EFFCH>1, and SCH>(1 and PEFFCH); Efficiency DECREASE because of PTE Decrease: EFFCH<1 and PEFFCH<(1 and SCH), Efficiency DECREASE because of SE Decrease: EFFCH<1, and SCH<(1 and PEFFCH).
Table 8: Correlation of Productivity Growth (TFPCH), and its Components with Changes in Outputs and Inputs of Turkish Public, Private, and Foreign Banks Productivity
Change (TFPCH)
Technological Change
(TECCH)
Efficiency Change
(EFFCH)
Pure Efficiency Change
(PEFFCH)
Scale Change (SCH)
∆ In Bank Outputs ∆ ST Loans Public banks -0.203 -0.189 -0.069 -0.123 0.074 Private banks 0.548 0.113 0.362 0.465 -0.114 Foreign banks 0.349 0.146 0.171 0.198 -0.029 Industry 0.387 0.045 0.252 0.314 -0.055 ∆ LT Loans Public banks 0.253 0.249 0.042 0.003 0.033 Private banks 0.437 0.053 0.345 0.381 -0.114 Foreign banks -0.036 -0.113 0.025 -0.009 0.040 Industry 0.282 0.076 0.204 0.203 0.011 ∆ OEA Public banks 0.019 -0.070 0.094 -0.040 0.121 Private banks 0.256 0.096 0.136 0.174 -0.040 Foreign banks 0.073 0.163 -0.046 0.054 -0.226 Industry 0.191 0.080 0.092 0.124 -0.046 ∆ OFF-B/S Public banks -0.106 0.049 -0.106 0.060 -0.158 Private banks 0.135 0.190 0.073 0.073 -0.083 Foreign banks 0.557 0.545 0.337 0.555 -0.078 Industry 0.314 0.355 0.107 0.162 -0.081 ∆ In Bank Inputs ∆ Labor Public banks -0.115 0.008 -0.093 -0.116 -0.010 Private banks -0.084 -0.097 -0.014 0.028 -0.067 Foreign banks -0.271 -0.034 -0.240 -0.271 0.032 Industry -0.101 -0.065 -0.044 -0.025 -0.042 ∆ Capital Public banks -0.098 0.100 -0.138 -0.218 0.058 Private banks -0.167 -0.238 -0.067 -0.082 0.049 Foreign banks -0.279 -0.160 -0.171 -0.242 0.183 Industry -0.129 -0.07 -0.084 -0.128 0.072 ∆ Funds Public banks -0.136 -0.093 -0.091 -0.165 0.091 Private banks 0.219 0.081 0.085 0.163 -0.115 Foreign banks 0.197 -0.009 0.141 0.104 0.059 Industry 0.170 0.028 0.075 0.108 -0.040 Notes: Pearson correlation coefficients between the variables are based on the pooled data from 1981 to 1990. Whereas, correlations including off- balance sheet items are for the pooled data from 1986 to 1990 due to unavailability of such data before 1986.
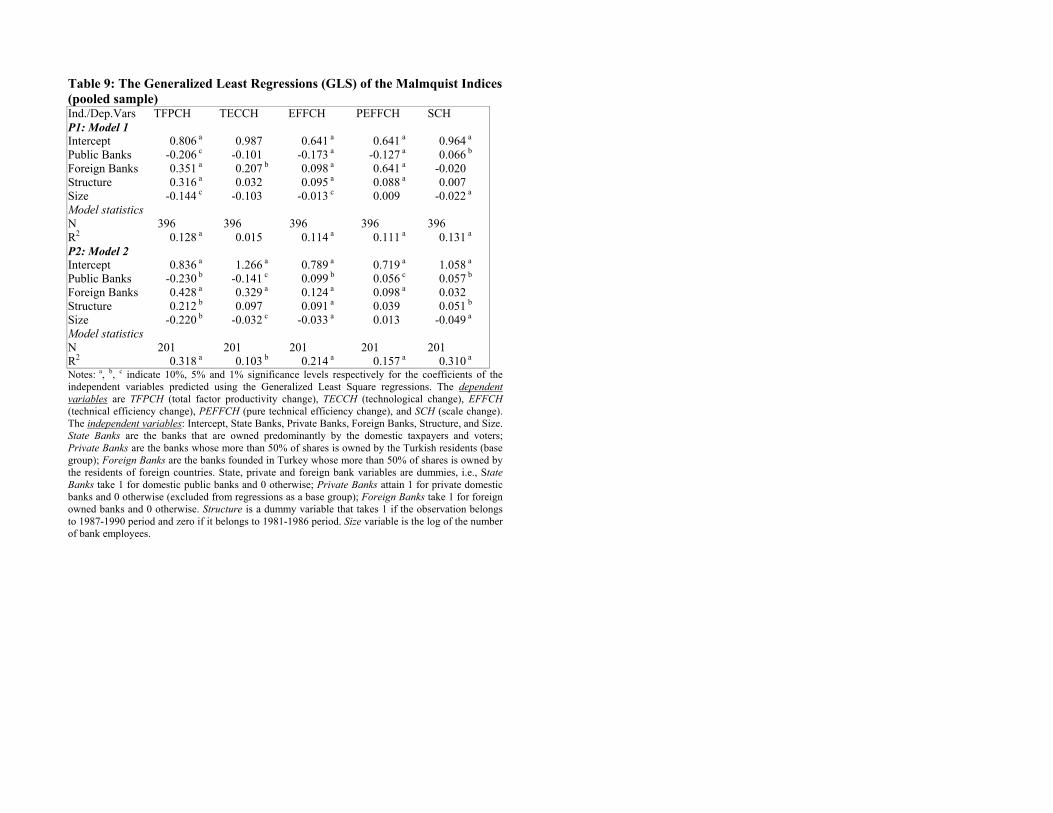
Table 9: The Generalized Least Regressions (GLS) of the Malmquist Indices (pooled sample) Ind./Dep.Vars TFPCH TECCH EFFCH PEFFCH SCH P1: Model 1 Intercept 0.806 a 0.987 0.641 a 0.641 a 0.964 a Public Banks -0.206 c -0.101 -0.173 a -0.127 a 0.066 b Foreign Banks 0.351 a 0.207 b 0.098 a 0.641 a -0.020 Structure 0.316 a 0.032 0.095 a 0.088 a 0.007 Size -0.144 c -0.103 -0.013 c 0.009 -0.022 a Model statistics N 396 396 396 396 396 R2 0.128 a 0.015 0.114 a 0.111 a 0.131 a P2: Model 2 Intercept 0.836 a 1.266 a 0.789 a 0.719 a 1.058 a Public Banks -0.230 b -0.141 c 0.099 b 0.056 c 0.057 b Foreign Banks 0.428 a 0.329 a 0.124 a 0.098 a 0.032 Structure 0.212 b 0.097 0.091 a 0.039 0.051 b Size -0.220 b -0.032 c -0.033 a 0.013 -0.049 a Model statistics N 201 201 201 201 201 R2 0.318 a 0.103 b 0.214 a 0.157 a 0.310 a Notes: a, b, c indicate 10%, 5% and 1% significance levels respectively for the coefficients of the independent variables predicted using the Generalized Least Square regressions. The dependent variables are TFPCH (total factor productivity change), TECCH (technological change), EFFCH (technical efficiency change), PEFFCH (pure technical efficiency change), and SCH (scale change). The independent variables: Intercept, State Banks, Private Banks, Foreign Banks, Structure, and Size. State Banks are the banks that are owned predominantly by the domestic taxpayers and voters; Private Banks are the banks whose more than 50% of shares is owned by the Turkish residents (base group); Foreign Banks are the banks founded in Turkey whose more than 50% of shares is owned by the residents of foreign countries. State, private and foreign bank variables are dummies, i.e., State Banks take 1 for domestic public banks and 0 otherwise; Private Banks attain 1 for private domestic banks and 0 otherwise (excluded from regressions as a base group); Foreign Banks take 1 for foreign owned banks and 0 otherwise. Structure is a dummy variable that takes 1 if the observation belongs to 1987-1990 period and zero if it belongs to 1981-1986 period. Size variable is the log of the number of bank employees.