attitudes toward immigrants: a cross-country perspective
TRANSCRIPT

Documentos de Trabajo
Attitudes toward immigrants: a cross-country perspective
R. Todd Jewell, Natalia Melgar, David J. Molina y Máximo Rossi
Documento No. 03/09
Febrero 2009
Attitudes toward immigrants:
a cross-country perspective
R. Todd Jewell University of North Texas
Denton, Texas, USA
Natalia Melgar University of the Republic
Montevideo, Uruguay
David J. Molina University of North Texas
Denton, Texas, USA
Máximo Rossi University of the Republic
Montevideo, Uruguay

ABSTRACT
This paper examines the foundations of attitudes towards immigrants by focusing on
individual characteristics and country-specific effects. We use a micro-level data set from
31 countries. In particular, we utilize the module on National Identity of the 2003
International Social Survey Program (ISSP). Results indicate that gender, education, age,
labor-market status, and political and religious affiliation are important indicators of the
attitude toward immigrants. The largest effect appears to be that of education, with more
education being positively correlated with a positive view of immigrants. Additionally, we
find that country of residence matters.
Key words: immigration, microeconomic behavior, comparative research.
JEL Classification: F22, J61, O15, A13
RESUMEN
Este trabajo analiza los fundamentos de las actitudes hacia los inmigrantes. Nos centramos
en las características de los individuos así como en los efectos específicos del país de
residencia. Para ello, se utilizan micro-datos de 31 países, en particular, se utiliza el
módulo sobre Identidad Nacional de la encuesta realizada en el año 2003 por el
International Social Survey Program (ISSP). Los resultados indican que el género, la
educación, la edad, el vínculo con el mercado laboral, la afiliación política y religiosa son
indicadores importantes de las actitudes hacia los inmigrantes. El efecto más importante es
el de la educación, encontrándose que incrementos en los años de educación generan
actitudes más favorables hacia los inmigrantes. Adicionalmente, se encuentra que el país
de residencia juega un rol relevante en la formación de estas actitudes.
Palabras clave: inmigración, comportamiento microeconómico, análisis comparativo.
Clasificación JEL: F22, J61, O15, A13
ii
I. Introduction
None of the components of globalization generates as much controversy as the movement
of people across borders (Facchini and Mayda, 2006). This large human capital movement
has been accompanied by an increase in anti-immigrant sentiments. What is not as clear,
however, is if these sentiments are based on economic or non-economic issues or some
combination of both (see for instance, Fetzer, 2000 or Mayda, 2006). Understanding the
nature of these sentiments has great policy implications. For instance, if the sentiments are
based on economic fears then policies geared towards improving the economic
environment would be sufficient to stem anti-immigrant sentiments. If on the other hand,
should the sentiments be based on non-economic factors then social policy would be
needed for no economic policy would alleviate the issue. On the other hand, there are
factors such as a crime that is both an economic and non-economic issue and that could
also affect the attitudes towards immigrants. This would be the case if there is evidence
and/or a belief that crime levels are related to immigrants (Nielsen and Smyth, 2008).
Furthermore, the sentiments towards immigrants is also compounded by the fact that
immigration policies that do not allow for free market of labor mobility has increased the
number of illegal immigrants which could result in additional dimension to the anti-
immigration sentiment. Consequently, recent research into anti-immigrant sentiment has
provided mixed results between the economic and non-economic foundations for anti-
immigration sentiment (Citrin et al., 1997, Scheve and Slaughter, 2001, Gang, et al, 2002,
Mayda, 2006, Malchow-Møller et al., 2008).
Traditional migration literature has focused on the decision to migrate. The result of these
studies has shown that the decision to migrate is not uni-dimensional (see for instance,
Davis and Winters, 2001, Jewell and Molina, forthcoming, Massey et al. 1993, and Massey
et al. 2002). Based on that finding, it would not be surprising that the more passive
behavior, that is the attitude by local nationals to the immigrants, is also going to be
multidimensional. Furthermore, the reactive nature of the local national to immigrants is
likely to be formed by conflicting attitudes based on the broad range of impacts the
immigrants may impose on their lives. Consequently, the actual behavior of the local
nationals would be based on the proportional strength and direction of these attitudes. This
study adds to this growing literature by examining systematically independent attitudes on
1
five societal aspects and their influence on the anti-immigrant sentiment. The five societal
aspects we investigate are: culture, the economy, jobs, social services (spend on
immigrants), crime and illegal (referring to their legal status). What sets our study apart
from previous studies is that we focus on the anti-immigrant sentiment based on these five
societal attitudes rather than on how an individual reacts to immigrants. In other words,
two individuals who feel strongly that immigrants add to the culture of the local society
may differ on the impact they have on the economy. Previous studies have compared the
overall view of immigrants by these two individuals. The model developed here, will
instead focus on the attitudes and hence we would have found similar pattern based on
their attitude of the impact of immigrants on culture but different on their impact on the
economy. Consequently, in theory, one could determine the position of each of these
societal aspects by an individual and if the proportionality and direction of each was
known, we could determine the overall attitude this individual would have towards
immigration.1 The reminder of this paper is structure in the following manner. The next
section provides a review of the attitudes towards immigrants’ literature. Section three
presents the data and the methodology used here. The results are found in section four and
the last section provides some concluding remarks.
1 Our approach here differs from the approach taken by Mayda (2006) where she focused on one of the questions for the individual and used the other questions regarding attitudes as independent variables.
2

II. Anti-immigrant attitude
Fetzer (2000) argues that the anti-immigrant sentiment can be categorized into three major
categories: marginality, self-interest, and contact. Marginality deals with the fact that
migrants do not quickly assimilate into the surrounding society and as well as to the clash
these new individuals bring to the local culture and lead to a distortion or evolutions of the
local culture. The self-interest is the economic impact the immigrant has on a native
individual. Contact is primarily the impact done to the neighborhood (proximity) by an
immigrant to the local national. This study, as well as many others, concentrates primarily
on the first two.2 A more common division of the first two categories is to label them non-
economic and economic factors. There is strong evidence that economic factors influence
the immigrant sentiment (Mayda, 2006, Malchow-Møller et al., 2008, and Scheve and
Slaughter, 2001). The impact of this influence, however, is based on some demographic
characteristics of the local national. However, even here the results so far have been mixed.
For instance, Mayda (2006), , and Scheve and Slaugther (2001) find that lower education
leads to more anti-migrant sentiment, where as Dustmann and Preston (2007). Malchow-
Møller et al.(2008) suggest that a composite question based on the local nationals’
understanding of the impact of the immigrants may provide a better understanding of the
impact of education on immigrant sentiment
Facchini and Mayda (2006) focus on economic determinants. In particular, they analyze
those linked to the social security system and the labor market. They employ the module
on National Identity of the International Social Survey Program this survey was carried out
in 1995. In fact, the authors restrict the dataset and they consider richest countries. The
analysis is based in the Heckscher Ohlin model (HO) with two factors (skilled and
unskilled workers) extended to incorporate the redistributive effects of immigration on the
social security system. The authors propose two ways in which the social security system
may adapt in response to immigration flows: 1) an increase in contributions and 2) a
decrease in pensions. The empirical evidence is consistent with the first scenario in the
presence of unskilled immigrants. In this case, authors concluded that richer people are
more likely to oppose to immigration because they bear the largest share of the variation in
2 Example of contact studies are Gang et al. (2002), Li, 1998, Nielsen et al. 2006, or Nielsen and Smyth, 2008.
3
taxes. The authors also find that unskilled workers are more likely to be against
immigration.
Mayda (2006) includes in her analysis undeveloped countries. She focuses on the level of
education of natives, the degree of economic development and attitudes towards
immigrants. She showed that in the case of diversified economies (the number of tradable
goods produced in the economy is greater than the number of factors of production),
education may be no significant in explaining attitudes towards immigrants because the
immigration effect on labor supply is small. However, if the economy is not diversified
immigration could change the relative price of factors and education may be relevant. On
the other hand, Moreover, Richardson (2005) analyzes the determinants of attitudes
towards immigration in the case of United States. Contrary to neoclassical theory, his
results indicate that individuals tend to oppose to immigration if they are skilled workers
and belong to union. He bases the explanation on the imperfect competition approach:
those individuals do not compete with immigrants but they feel threatened by them.
Finally, Malchow-Møller et al. (2008), finds strong evidence that it is not the global
economic conditions brought about by the immigrants that affect anti-migrant sentiment
but that it is the self-interest of the local national that influences their sentiments. In other
words, it is Fetzers (2000) interpretation of self-interest rather than a broad economic
impact that lies at the center of the non-economic impact on anti-migrant sentiment.
In terms of non-economic factors, the work by Dustmann and Preston (2007) provides
strong evidence that the racial component is stronger than the educational component in
deterring the anti-migrant attitude. Gang et al. (2002) also show that racial and ethnic
factors are a strong influence on immigrant sentiment. This approach may be based on
cultural differences among natives and immigrants are particularly relevant and they
predict that natives may be more hostile when cultural differences are more pronounced
and more general spread throughout society (Huntington, 2004). Citrin et al. (1997) for
instance, strongly argue that cultural issues are strong influence the desire to restrict
migration. The above discussion clearly indicated that many competing theories of anti-
migrant sentiment are currently being tested with no clear consensus; it is likely that
immigrant sentiment, like traditional migration theory, will have its roots in
4

multidimensional factors. In the next section, we discuss the data and our methodology. As
mentioned above, rather than focusing on individuals, we focused on the attitudes to get an
understanding of how different attitudes about the impact of migrants differ depending on
the explanatory variables.
5
III. Data and methodology
The source of individual-level data analyzed in this paper is the National Identity module
of the International Social Survey Program that was carried out in 2003 and covers more
than 44,000 respondents from 33 countries at different stages of economic development.
After excluding data for missing observations, our final data set includes 30,343
observations from 31 different countries, approximately 1,000 observations per country.3
We use responses to six statements to construct our independent variables. These
statements seek to grasp different dimensions of respondent’s attitudes towards
immigrants. Interviewees were asked to respond to these statements on a five-point scale:
(1) strongly agree; (2) agree; (3) neither agree nor disagree; (4) disagree; and (5) strongly
disagree. The responses were then scaled so that higher numbers are assigned to more
positive views of immigrants. This rescaling leads to the following categorization of
responses: (1) strongly negative; (2) negative; (3) neither negative nor positive; (4)
positive; and (5) strongly positive.4 The six statements are the following: (i) Immigrants
increase crime rates (variable name = crime); (ii) Immigrants are generally good for
[country]’s economy (variable name = economy); (iii) Immigrants take jobs away from
people who were born in [country] (variable name = jobs); (iv) Immigrants improve
[country]’s society by bringing in new ideas and culture (variable name = culture); (5) The
government spends too much money assisting immigrants (variable name = social
services); and (6) [Country] should take stronger measures to exclude illegal immigrants
(variable name = illegal).
Table One illustrates the distribution of responses to the six statements in terms of numbers
and percentages within categories. Recalling that the responses are rescaled so that “5”
indicates the most positive response to the statement (i.e., a “1” response to a positive
statement and a “5” response to a negative statement), it appears that attitudes toward 3 The 31 included countries are Australia, Austria, Bulgaria, Canada, Chile, Czech Republic, Finland, France, Denmark, Germany, Hungary, Ireland, Israel, Japan, Latvia, New Zealand, Norway, the Philippines, Poland, Portugal, Russia, Slovak Republic, Slovenia, Spain, Sweden, Switzerland, South Korea, Taiwan, Uruguay, United States, and Venezuela. Data also exist on the United Kingdom and South Africa, but these two countries are excluded due to a lack of responses to all six questions analyzed in this study. 4 The choice of scaling is somewhat arbitrary, as long as statement responses are consistently scaled. This scaling is chosen so that positive coefficients in the results indicate a more positive attitude towards immigrants.
6
crime, social services, and illegal are relatively negative, while attitudes toward culture are
more positive. Attitudes toward economy and jobs are not heavily weighted in either
direction. The weighted average responses indicate a similar trend: Where an average of
3.00 indicates “neither negative nor positive,” crime, social services, and illegal have
averages of 2.7, 2.7, and 2.0 respectively, culture’s average is 3.2, and the averages of
economy and jobs are 3.0 and 2.9 respectively.
[INSERT TABLE ONE HERE]
The data include a wealth of information on the individual respondent. In addition to
country of residence, the data include information on gender, age, marital status, income
level, education, working status, political and religious affiliation, and religious attendance.
The independent variables are created as a series of dummy variables. Male = 1 if
respondent is male. Married = 1 if respondent is currently married or living as married, and
separated = 1 if respondent was previously married and currently living separately,
divorced, or widowed. Urban = 1 if respondent lives in a rural area. Citizenship
information is included for both the respondent and his or her parents; citizen = 1 if the
respondent is a citizen, while parent a citizen = 1 if at least one parent is a citizen. Union =
1 if the respondent is a union member or was a member at some point.
Income information is included as the self-assessed income decile within each country.
Education information is included as a series of dummy variables measuring lowest formal
classification to university graduate. Age is measured as a series of dummy variables
indicating decade of life. Work full-time = 1 if respondent works full time, while work
part-time = 1 if he or she works part-time. Unemployed = 1 if respondent is currently
unemployed, student = 1 if respondent is a full-time student, and work at home = 1 if
respondent is employed in home care duties. Political affiliation is defined along a
spectrum of dummy variables from far left to far right. Religious attendance is a measured
as a series of dummy variables ranging from frequent attendance (weekly) to infrequent
attendance (infrequently). Religious affiliation is a series of dummy variables indicating
eight major world religions. Summary statistics are included in Table Two.
[INSERT TABLE TWO HERE]
7
IV. Results
The results from ordered probit estimations of the determinants of responses to the six
statements are given in Table Three (coefficients) and Table Four (marginal effects for
category “strongly positive” at sample means). The coefficients signs reported in Table
Three are remarkably similar across the six statements. For instance, individuals who are
married or separated are less likely than single respondent to have a positive view of
immigrants, and urban dwellers are more likely than rural dwellers to have a positive view
of immigrants. Respondents who are not citizens have a more positive view of immigrants
as do respondents whose parents were not citizens; these results are hardly surprising given
that such respondents are themselves immigrants. More education is correlated with a more
positive view of immigrants.
[INSERT TABLES THREE AND FOUR HERE]
Surprisingly, the work status categories are all correlated with a positive view of
immigrants, suggesting that being out of the labor force leads one to have a more negative
view of immigrants. As expected, the effect of political affiliation varies along a left/right
spectrum, with respondents who have more leftist leanings having a more positive attitude
toward immigrants. Interestingly, political centrists are shown to have a more positive view
of immigrants than those respondents who have no political affiliation. Catholics,
Protestants, Buddhists, and respondents who identify with other eastern religions have a
less favorable view of immigrants, while those respondents who identify themselves as
Jewish have a more favorable view.
Other variables appear to have inconsistent effects on immigrant attitudes. Gender has an
ambiguous effect, as does age and religious attendance. Furthermore, self-assessed income
only appears to significantly impact views relating to immigrants and the overall economy,
with higher income levels generally indicating more positive attitudes.
The marginal effects reported in Table Four are interpreted as the change in the probability
of a respondent having a “strongly positive” reply to each statement calculated at the
8

sample means.5 From these marginal effects, we learn that the variable with the largest
impact on immigrant attitudes is education, specifically university. For example, a
respondent with a university education is shown to have a 0.11 (11 percentage points)
higher probability of responding in a strongly positive manner to the jobs statement, the
largest marginal effect in Table Four. Another influential measure is neither parent a
citizen; if a respondent does not have at least one parent who is a citizen, he or she will be
7 percentage points more likely to respond in a strongly positive manner to the jobs
statement or to the culture statement. A Jewish respondent is 7.5 percentage points more
likely to respond in a strongly positive manner to the jobs statement and 7 percentage
points more likely to the social services statement.
5 An ordered probit estimation produces marginal effects for each category. We report only those marginal effects for the highest category for brevity. All other marginal effects are available from the authors.
9
V. Conclusion
There is a growing literature attempting to understand the attitude towards immigrants. The
trend towards globalization has increased the labor mobility and as a consequence there
appears to be a rise in anti—immigrant sentiment. This paper has added to this growing
literature by examining systematically independent attitudes on five societal aspects and
their influence on the anti-immigrant sentiment. The five societal aspects we investigate
are: culture, the economy, jobs, social services (spend on immigrants), crime and illegal
(referring to their legal status). Our finding suggest that religion increases anti-immigrant
sentiment (except for Jews), married or separated individuals have greater anti-immigrant
sentiment. On the other hand, higher education leads to lower anti-immigrant sentiment
most of the time.
10

References
Améndola, M.V. and M.P. Correa (2006) “Actitudes individuales hacia la inmigración:
comparación de resultados de Uruguay con otros países”, Trabajo de
Investigación Monográfico 180/06.
Brenner, J. and M. Ferting (2006) “Identifying the Determinants of Attitudes towards
Immigrants”, Discussion Paper nº 47, Rheinisch-Westfälisches Institut für
Wirtschaftsforschung RWI.
Citrin, J; D. Green, C. Muste, and C. Wong (1997) “Public Opinion Toward Immigration
Reform: The Role of Economic Motivation” in Journal of Political Science nº 59,
3: 858-81.
Davis, B; and P. Winters (2001) “Gender, Networks, and Mexico-US Migration” in
Journal of Development Studies nº 38: 1-26.
Dustmann, C. and I. Preston (2007) “Racial and Economic Factors in Attitudes to
Immigration” in The B. E. Journal of Economic Policy and Analysis nº 7(1): 1-39.
Fetzer, J.S. (2000) Public Attitudes Toward Immigration in the United States, France, and
Germany, Cambridge: Cambridge University Press.
Gang, I.N; F.L. Rivera-Batiz and M.S. Yun (2002) “Economic Strain, Ethnic
Concentration and Attitudes Towards Foreigners in the European Union”
Discussion Paper nº 578, IZA, Bonn.
Huntington, S.P. (2004) Who Are We?: The Challenges to America’s National Identity,
New York: Simon and Schuster.
Jewell, T. and D. Molina "Mexican migration to the US: a comparison of income and
network effects" in Eastern Economic Journal, forthcoming.
Mayda, A.M. (2004) “Who is against Immigration? A Cross-Country Investigation of
Individual Attitudes toward Immigrants” in Review of Economic and Statistics,
August, nº 88(3): 510-530.
Mayda, A.M. and G. Facchini (2006) “Individual Attitudes towards Immigrants: Welfare-
State Determinants Across Countries”, Working Paper Nº 1768 CESIFO.
Malchow-Møller, N; J.R. Munch, S. Schroll and J.R.Shaksen (2008) “Attitudes Towards
Immigration-Perceived Consequences and Economic Self Interest” in Economic
Letters 100: 254-257.
11

Massey, D.S; J. Arango, G. Hugo; A. Kouaouci; A. Pellegrino and J.E. Taylor (1993)
“Theories of International Migration: A Review and Appraisal” in Population and
Development Review nº 19: 431-466.
Massey, D.S; J. Durand and N.J. Malone (2002) Beyond Smoke and Mirrors: Mexican
Immigration in an Era of Economic Integration, New York: Russell Sage
Foundation.
Nielsen, I; C. Nyland, R. Smyth, M. Zhang and C.H. Zhu (2006) “Effect of Intergroup
Contract on Attitudes of Chinese Urban Residents to Migrant Workers” in Urban
Studies nº 43(3): 475-490.
Nielsen, I. and R. Smyth (2008) “Who Wants Safer Cities? Perceptions of Public Safety
and Attitudes towards Immigrants among China’s Urban Population” in
International Review of Law and Economics 28: 46-55.
Richardson, Gary (2005) “The origin of Anti-Immigrants Sentiments: Evidence from
Heartland in the Age of Mass Migration”, University of California, Topics in
Economic Analysis & Policy, Vol 5, Issue 1, Art 11.
Scheve, K. and M. Slaughter (2001) “Labor Market Competition and Individual
Preferences Over Immigration Policy” in Review of Economics and Statistics nº
83(1):133-145.
Scott Long, J. and J. Freese (2001) “Regression Models For Categorical Dependent
Variables Using STATA”, Texas: Stata Press Publication, Stata Corporation,
College Station.
12

Annex - tables
Table One - Statement Responses
Table economy jobs social services crime illegal
Strongly Negative 2,049 2,324 4,189 5,199 5,518 12,482
Negative 6,069 7,437 8,475 8,828 9,860 10,566
Neither Positive nor Negative 7,865 8,833 6,242 7,842 6,236 3,911
Positive 11,779 10,010 8,762 6,607 6,940 2,479
Strongly Positive 2,581 1,739 2,675 1,867 1,789 905
Weighted Average 3.223 3.046 2.910 2.707 2.658 1.970 Note: N = 30,343
i

Table Two - Summary Statistics: Independent Variables
Variable Mean Std. Dev. gender: excluded = female
male 0.4864 0.4998 marital status: excluded = single, never married
currently married 0.5921 0.4914 previously married but currently separated 0.1495 0.3565
location of household: excluded = rural area urban 0.4863 0.4998
respondent citizenship: excluded = citizen not a citizen 0.0500 0.2179
parental citizenship: excluded = at least one parent a citizen neither parent a citizen 0.1008 0.3011
union membership: excluded = never a union member past or current union member 0.4136 0.4925
income decile: excluded = decile 1 decile 2 0.0364 0.1874 decile 3 0.0971 0.2960 decile 4 0.1240 0.3296 decile 5 0.2482 0.4320 decile 6 0.2315 0.4218 decile 7 0.1281 0.3342 decile 8 0.0707 0.2563 decile 9 0.0153 0.1228 decile 10 0.0165 0.1276
education level: excluded = no formal education lowest classification 0.1870 0.3899
> lowest classification 0.2027 0.4020 secondary 0.2257 0.4180
> secondary 0.1770 0.3817 university 0.1681 0.3740
age categories: excluded = age < 20 age 20-29 0.1762 0.3810 age 30-39 0.1974 0.3980 age 40-49 0.2004 0.4003 age 50-59 0.1730 0.3782 age 60-69 0.1237 0.3292 age 70-79 0.0771 0.2667 age > 80 0.0185 0.1347
labor-market status: excluded = not in labor market work full-time 0.4806 0.4996 work part-time 0.0933 0.2909
unemployed 0.0542 0.2264 student 0.0597 0.2370
work at home 0.1003 0.3004 political affiliation: excluded = no affiliation
far left 0.0369 0.1886
ii

left 0.1836 0.3872 center 0.1528 0.3598 right 0.1943 0.3957
far right 0.0236 0.1517 religious attendance: excluded = never attend
weekly or more 0.1648 0.3710 between monthly and weekly 0.1090 0.3117 between yearly and monthly 0.2846 0.4513
infrequently (< once per year) 0.1596 0.3662 religious affiliation: excluded = no affiliation
Catholic 0.3810 0.4857 Protestant 0.2254 0.4178 Orthodox 0.0508 0.2196
Jewish 0.0321 0.1763 Buddhist 0.0291 0.1682
other eastern 0.0297 0.1698 other Christian 0.0157 0.1244
Islam 0.0130 0.1132 Note: N = 30,343
iii

Table Three - Ordered Probit Results: Coefficients N = 30,343
Variable culture economy jobs social services crime illegal
male -0.0300 0.0699*** -0.0046 0.0043 -0.0950*** -0.0854*** married -0.0724*** -0.0351* -0.0120 -0.0368* -0.0356* -0.0801***
separated -0.0856*** -0.0767*** -0.0515** -0.0911*** -0.0537* -0.0698** urban 0.0540** 0.0472** 0.0514** 0.0659*** 0.0096 0.0121
not a citizen 0.0670 0.1915*** 0.1420** 0.1930*** 0.1545*** 0.0986 neither parent a citizen 0.4090*** 0.4406*** 0.4414*** 0.4242*** 0.3767*** 0.0893*
union -0.0228 -0.0286 -0.0332 -0.0676*** -0.0332 -0.0100 decile 2 -0.0310 0.0578 -0.0318 0.0282 0.0415 -0.0144 decile 3 0.0129 0.0819** -0.0165 0.0283 0.0439 -0.0308 decile 4 0.0074 0.1160*** 0.0349 0.0653 0.0851* -0.0029 decile 5 -0.0062 0.0926** 0.0444 0.0877 0.0677 -0.0119 decile 6 0.0091 0.0979** 0.0540 0.1153* 0.0540 -0.0353 decile 7 0.0098 0.1039** 0.1007 0.1335** 0.0485 0.0224 decile 8 0.0588 0.1484*** 0.0924 0.1240* 0.0675 -0.0442 decile 9 0.0436 0.2375*** 0.0583 0.0862 -0.0114 0.0035 decile 10 -0.0013 0.1442** 0.0341 -0.0120 -0.0216 -0.0127
lowest 0.0424 -0.0022 -0.0301 -0.0151 -0.0069 -0.0763 > lowest 0.1015* 0.0919** 0.0788* 0.0786** 0.0714 -0.1025
secondary 0.1958*** 0.1996*** 0.2956*** 0.2605*** 0.2781*** 0.0170 > secondary 0.2832*** 0.2430*** 0.4025*** 0.3182*** 0.3353*** 0.0376
university 0.5024*** 0.4678*** 0.6708*** 0.6573*** 0.5690*** 0.2370** age 20-29 -0.0718* -0.0159 -0.0122 -0.1161*** -0.0491 -0.0931** age 30-39 0.0075 0.0460 0.0508 -0.0638* -0.0345 -0.0714 age 40-49 -0.0289 0.0580 0.0012 -0.0633 -0.0924 -0.1421*** age 50-59 -0.0067 0.1262** 0.0183 -0.0660 -0.1175* -0.1788*** age 60-69 0.0116 0.1539** -0.0110 -0.0753 -0.1950*** -0.2209*** age 70-79 -0.0289 0.1507** 0.0099 -0.0667 -0.2283*** -0.2195*** age > 80 -0.0179 0.1760** 0.0074 -0.0858 -0.1578* -0.2225**
work full-time 0.0389 0.0376 0.1406*** 0.0982*** 0.0996*** 0.0987*** work part-time 0.0889** 0.0381 0.1230*** 0.1661*** 0.1182*** 0.1419***
unemployed 0.0451 -0.0328 0.0512 0.0752* 0.1067*** 0.0946** student 0.1685*** 0.1563*** 0.2437*** 0.2539*** 0.2849*** 0.1821***
work at home 0.0112 0.0311 0.1128*** 0.0666** 0.0588** 0.1044*** far left 0.2733*** 0.2244*** 0.2446*** 0.3037** 0.2900*** 0.2979***
left 0.1669*** 0.1596*** 0.1840*** 0.2593*** 0.1706*** 0.1743*** center 0.1160*** 0.0893** 0.1082*** 0.1791*** 0.0688** 0.0279 right -0.0323 0.0008 0.0273 -0.0556 -0.1052*** -0.1723***
far right -0.2752* -0.1868* -0.2293** -0.3315* -0.3693** -0.3619*** weekly 0.0597 0.0886** 0.0008 0.0491 0.0302 0.0546 monthly 0.0248 0.0648* -0.0333 0.0242 -0.0050 0.0397 yearly 0.0438 0.0695** -0.0298 -0.0123 0.0024 -0.0136
infrequently 0.0536** 0.0692*** 0.0001 -0.0447* -0.0188 -0.0171 Catholic -0.0996*** -0.0921*** -0.0866** -0.1144*** -0.1381*** -0.1212**
iv
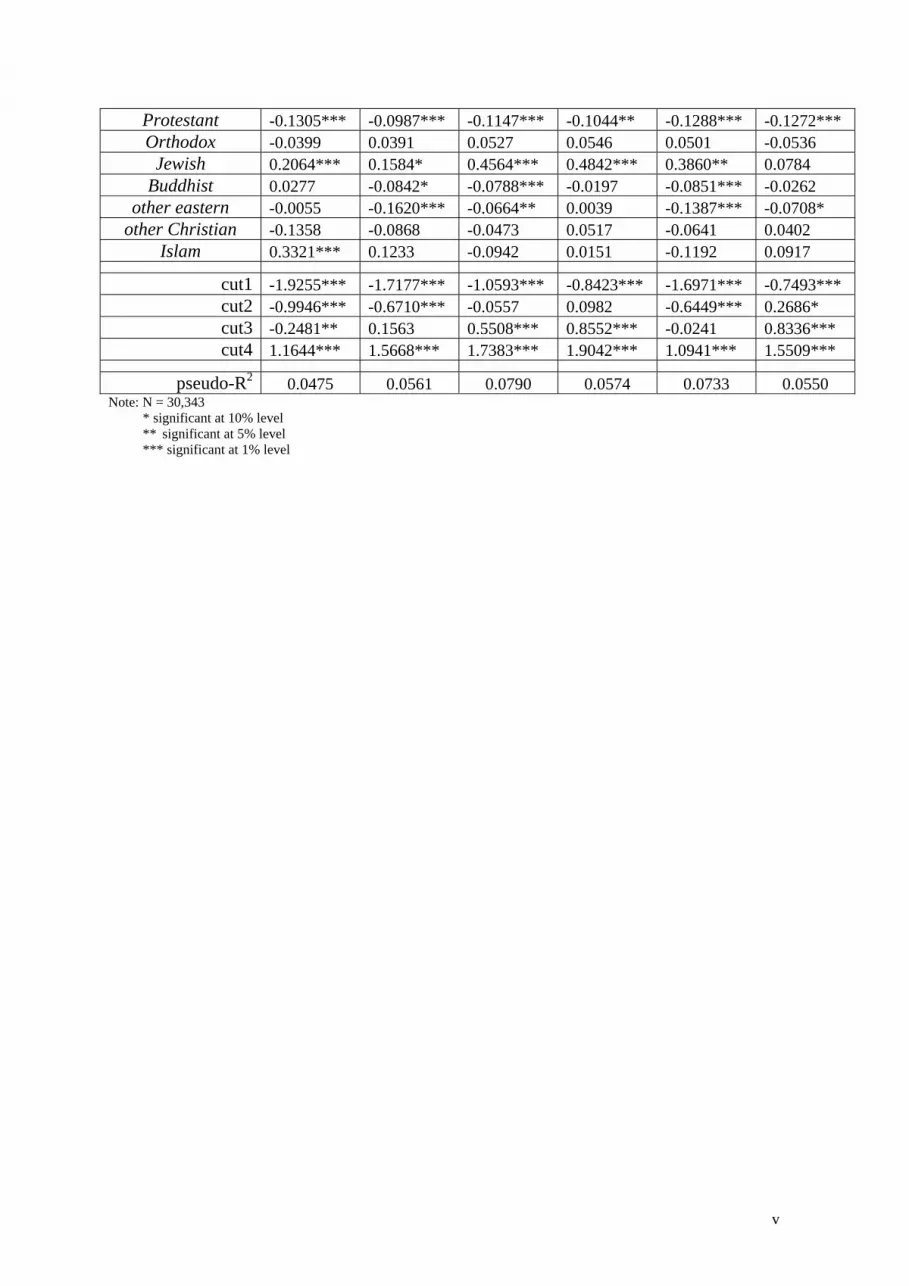
Protestant -0.1305*** -0.0987*** -0.1147*** -0.1044** -0.1288*** -0.1272*** Orthodox -0.0399 0.0391 0.0527 0.0546 0.0501 -0.0536
Jewish 0.2064*** 0.1584* 0.4564*** 0.4842*** 0.3860** 0.0784 Buddhist 0.0277 -0.0842* -0.0788*** -0.0197 -0.0851*** -0.0262
other eastern -0.0055 -0.1620*** -0.0664** 0.0039 -0.1387*** -0.0708* other Christian -0.1358 -0.0868 -0.0473 0.0517 -0.0641 0.0402
Islam 0.3321*** 0.1233 -0.0942 0.0151 -0.1192 0.0917
cut1 -1.9255*** -1.7177*** -1.0593*** -0.8423*** -1.6971*** -0.7493*** cut2 -0.9946*** -0.6710*** -0.0557 0.0982 -0.6449*** 0.2686* cut3 -0.2481** 0.1563 0.5508*** 0.8552*** -0.0241 0.8336*** cut4 1.1644*** 1.5668*** 1.7383*** 1.9042*** 1.0941*** 1.5509***
pseudo-R2 0.0475 0.0561 0.0790 0.0574 0.0733 0.0550 Note: N = 30,343 * significant at 10% level ** significant at 5% level *** significant at 1% level
v

Table Four - Ordered Probit Results: Marginal Effects for “Strongly Positive” Attitude
Variable culture economy jobs social services crime illegal
male 0.0063 -0.0080 -0.0042 married -0.0097 -0.0032 -0.0035 -0.0030 -0.0040
separated -0.0109 -0.0066 -0.0060 -0.0081 -0.0044 -0.0032 urban 0.0072 0.0043 0.0062 0.0062
not a citizen 0.0200 0.0118 0.0211 0.0148 neither parent a citizen 0.0687 0.0536 0.0692 0.0531 0.0415 0.0047
union -0.0063 decile 2 decile 3 0.0078 decile 4 0.0113 0.0076 decile 5 0.0087 decile 6 0.0092 0.0115 decile 7 0.0100 0.0137 decile 8 0.0149 0.0128 decile 9 0.0260 decile 10 0.0146
lowest > lowest 0.0141 0.0087 0.0098 0.0077
secondary 0.0282 0.0198 0.0404 0.0278 0.0270 > secondary 0.0431 0.0251 0.0591 0.0358 0.0345
university 0.0850 0.0552 0.1127 0.0896 0.0674 0.0136 age 20-29 -0.0009 -0.0103 -0.0043 age 30-39 -0.0058 age 40-49 -0.0064 age 50-59 0.0122 -0.0093 -0.0077 age 60-69 0.0153 -0.0145 -0.0091 age 70-79 0.0152 -0.0163 -0.0089 age > 80 0.0183 -0.0117 -0.0087
work full-time 0.0170 0.0093 0.0085 0.0048 work part-time 0.0125 0.0160 0.0176 0.0109 0.0078
unemployed 0.0075 0.0098 0.0050 student 0.0250 0.0159 0.0345 0.0289 0.0300 0.0105
work at home 0.0146 0.0066 0.0052 0.0055 far left 0.0436 0.0242 0.0349 0.0362 0.0310 0.0192
left 0.0240 0.0157 0.0242 0.0282 0.0159 0.0095 center 0.0164 0.0085 0.0138 0.0188 0.0061 right -0.0084 -0.0075
far right -0.0300 -0.0144 -0.0233 -0.0239 -0.0230 -0.0124 weekly 0.0084 monthly 0.0061 yearly 0.0064
infrequently 0.0073 0.0065 -0.0041 Catholic -0.0130 -0.0081 -0.0103 -0.0106 -0.0114 -0.0057
Protestant -0.0164 -0.0085 -0.0131 -0.0094 -0.0103 -0.0058
vi

Orthodox Jewish 0.0316 0.0162 0.0752 0.0662 0.0447
Buddhist -0.0071 -0.0089 -0.0067 other eastern -0.0128 -0.0076 -0.0105 -0.0032
other Christian Islam 0.0556
Note: N = 30,343 For significant coefficients in table three
vii