modeling migration dynamics of immigrants
TRANSCRIPT
TI 2008-070/4 Tinbergen Institute Discussion Paper
Modeling Migration Dynamics of Immigrants
Govert E. Bijwaard
Erasmus University Rotterdam, and Tinbergen Institute.

Tinbergen Institute The Tinbergen Institute is the institute for economic research of the Erasmus Universiteit Rotterdam, Universiteit van Amsterdam, and Vrije Universiteit Amsterdam. Tinbergen Institute Amsterdam Roetersstraat 31 1018 WB Amsterdam The Netherlands Tel.: +31(0)20 551 3500 Fax: +31(0)20 551 3555 Tinbergen Institute Rotterdam Burg. Oudlaan 50 3062 PA Rotterdam The Netherlands Tel.: +31(0)10 408 8900 Fax: +31(0)10 408 9031 Most TI discussion papers can be downloaded at http://www.tinbergen.nl.

Modeling Migration Dynamics of Immigrants:
The Case of The Netherlands
Govert E. Bijwaard∗
Econometric Institute
Erasmus University Rotterdam
Abstract
In this paper we analyze the demographic factors that influence the migration dynamicsof recent immigrants to The Netherlands. We show how we can allow for both permanentand temporary migrants. Based on data from Statistics Netherlands we analyze both thedeparture and the return from abroad for recent non-Dutch immigrants to The Netherlands.Results disclose differences among migrants by migration motive and by country of originand lend support to our analytical framework. Combining both models, for departure andreturning, provides the probability that a specific migrant ends-up in The Netherlands. Italso yields a framework for predicting the migration dynamics over the life-cycle. From theobtained insight in the dynamic composition of migrants in the country important policyimplications can be derived, including admission procedures for different countries and/ormigration motives.
JEL classification: F22, J10, C41.Key words: return migration, migration dynamics, mover-stayer model.
∗Erasmus University Econometric Institute, P.O. Box 1738, 3000 DR Rotterdam, The Netherlands; Phone:(+31) 10 40 81424; Fax: (+31) 10 40 89162; E-mail: [email protected] This research is based on a collabora-tion with Statistics Netherlands and financially supported by the Netherlands Organization for Scientific Research(NWO) nr. 451-04-011. I thank Ruben van Gaalen, Han Nicolaas, Arno Sprangers, Joop Hartog, Klarita Sadiraj,participants at the ESPE 2006 conference and the NVD 2008 conference and at Arhus University seminar forvaluable comments.
1

1 Introduction
The countries of Western Europe, including The Netherlands, have experienced considerable
immigration flows over the past decades and have changed from emigration to immigration
countries. In the last decade the majority of immigrants came to Europe for family reasons,
family reunification and family formation, while in the 1960s and 1970s the migrants were mainly
‘guestworkers’, invited low-skilled workers. Thus the distribution over the migration motives of
the immigrants has changed over the years. Although the motive to migrate have important
implications for the migration dynamics, most of the literature do not distinguish the migrants
by migratory motive and or they only focus on labor migrants.
The early theories on migration explain the migration flows as a result of wage differen-
tials or through differences in unemployment levels. Given the great and persistent wage and
unemployment gaps between most developing countries and the Western World, these conven-
tional migration theories are unable to explain the small size of migration flows and the presence
of extensive return-migration. For example, about 20% to 50% of immigrants to the Nether-
lands leave this country again (CBS 2003). Similar number have been found for other Western
European countries, see e.g. Jensen and Pedersen (2007) for Denmark.
Despite the knowledge that many migrations are temporary or repetitive the majority of the
literature on migration (implicitly) assumes migrations are permanent. On the other hand, the
literature that takes the temporal nature of migration into account by modeling the timing of
departure implicitly assumes that in the end all migrants leave, see e.g. Goldstein (1964), Duleep
(1994), Dustmann (1995, 2000, 2002) and Constant and Massey (2003). If migration is viewed
as an investment decision to maximize human capital and/or earnings over the life-time than
return and repetitive migration are not anomalies but common outcomes of a migration decision
(see Dustmann (1995, 2000, 2002) and Borjas and Bratsberg (1996)). Although some recent
literature has looked into the dynamics of repeat migration (see o.a. Nekby 2006; Constant and
Zimmermann 2003) no study has addressed the possibility of both permanent and temporary
migration.
The literature on re-immigration and repetitive migration is rather scarce. Constant and
Zimmermann (2007) and Massey and Espinosa (1997) study the probability of repeated round
1

trips between two countries. The optimal life cycle model can also provide suggestions why
immigrants who have left the host country re-immigrate again (see Dierx (1988)). With repeat
migration the migrant may take advantage of the opportunities in the host and the source
country as they appear over time in an optimal way.
The life–cycle theories imply that assimilation in the host country and migration decisions
are correlated over time. It is therefore more appropriate to base the analysis of migration on a
dynamic model that takes the timing of migration moves into account (Hill (1987) and Dustmann
(2002)). In this paper we apply mover-stayer duration models that account for both temporary
and permanent stay. We apply these models both on the departure from the Netherlands and
the return to the Netherlands of recent non-Dutch immigrants.
Reasons to use durations models are, first, that the longer the stay the more opportunities
the migrant has had to learn the language and the culture of the host country. Second, along
with the migration decisions other relevant characteristics of the individuals may also change
over time, like the labor market status and marital status of the migrant. Third, it is hardly ever
possible to observe migration decisions over the whole life time of a migrant. The knowledge
that the immigrant has been in the host country from his entry time up till the end, however,
contains valuable information. Duration models are very well suited to take these issues into
account.
Models for duration data were initially developed in the medical sciences and reliability
theory. Duration models or event history models have also been used extensively for demographic
analysis, for example in modeling time till birth of first child, time till marriage or time till death.
However, the number of empirical analyzes of migration decisions based on a duration model is
rather limited and duration analysis of return migration is even more scarce. A few exceptions
are Detang-Dessendre and Molho (1999), Longva (2001) and Constant and Zimmermann (2003).
Most migration data lack information on the exact timing of the migration moves and only reveal
whether the migrant is still in the country at the interview date. Therefore, a more common
approach is to estimate a probit or logit model for the probability to return (see a.o., Reagan
and Olsen (2000) and Constant and Massey (2003)). In a probit model part of the migration
dynamics is discarded because only the whereabouts of the migrants at fixed points in time are
2
considered. However, the choice of these fixed points has a big impact on the estimation results.
It is also not straightforward to include time varying covariates into a probit model.
In conventional duration models it is assumed that in the end all individuals experience the
event of interest. That is, all migrants are movers. This implies that eventually all immigrants
leave the host country. It is, however, very plausible that some of the immigrants never leave. To
account for the possibility that some of the immigrants are permanent and some are temporary
we use a mover-stayer approach. This approach was developed by Boag (1949) and applied
to model the recidivism of criminals (Schmidt and Witte 1989) and labor market transitions
(Dunsmuir et al. 1989).1 Upon using a mover-stayer (duration) model, we can, simultaneously,
identify the underlying determinants of the timing of this process and the probability to become
a permanent migrant (a stayer). To our knowledge a mover-stayer approach has never been used
for modeling the migration dynamics.
For the return from abroad we also use a mover-stayer model. Combining the two mover-
stayer models enables us to predict the migration dynamics over the life-cycle for a given cohort
of immigrants after the first arrival to The Netherlands. From the stayer probability of re-
maining in The Netherlands and the stayer probability of remaining abroad (after some time
in The Netherlands) we can deduce the long-run proportion of this cohort that ends up in The
Netherlands. The intensity to leave and the intensity to return together determine the time it
takes to reach this long run proportion.
The data from Statistics Netherlands used in this article have information on the migration
motive for recent (1995-2003) non-Dutch migrants. Apart from labor migrants we also consider
migrants who come for family reasons, either to join their spouse or to form a new family, and
students. It is obvious that migrants who enter for family reasons do not base their migration
decision solely on their economic prospects in the new country but also on cultural and emo-
tional aspects. For students a temporary stay abroad may increase their home-country specific
human capital. But, on the other hand, completing an education in the host will increase the
immigrant’s prospects on the host country’s labor market.
1Schmidt and Witte (1989) use the term ‘split-population’model. In the biomedical literature the mover-stayermodel is known as the cure-model.
3

The data further contain information on the timing of migration moves, both on the timing
of immigration and on the timing of (return) emigration. This allows us to identify return and
repetitive migrants and to estimate the proposed mover-stayer models. Some basic demographics
characteristics of the migrants are also available. We restrict our analysis to immigrants who are
in the potential labor force at the moment of entry, that is who are between 18 and 64 years of
age. Younger immigrants usually migrate with their parents and older immigrants have a high
probability to die before they have the possibility to leave.
The outline of the paper is as follows. The next section briefly discusses the recent migration
pattern to and from The Netherlands. In this section we also present the conceptual framework
for our analysis. In Section 3 we present the data on recent non–Dutch immigrants. Section 4
discusses the methodology of mover-stayers duration models. Section 5 discusses the empirical
results both for the departure from the country and the return to the country. In Section 6
we use the estimation results to predict migration dynamics from and to the country over the
life-cycle. Section 7 summarizes the results and states our conclusion.
2 Conceptual framework and the context of the Netherlands
In the early 1960s The Netherlands changed from an emigrant to an immigrant country.2 Im-
migration follows a European sequence of post World War II and post-colonial immigration,
unskilled manpower recruitment and the arrival of refugees. The first period is characterized
by the de-colonization of Indonesia in 1949, as a consequence many Indonesian people came
to The Netherlands. In the second period, starting in the beginning of the 1960s, a large flow
of ‘guestworkers’, mainly Turks and Moroccans arrived. The Dutch government regulated the
recruitment practices by bilateral agreements with the main countries. The total inflow of im-
migrants reached 235,000 in 1970s. The recruitment policy stopped during the first oil crisis.
However, the immigration from the recruitment countries continued as a follow-up migration,
first in the form of family reunification and later also family formation. In this period the in-
dependence of Surinam also caused large immigration. Starting in the 1980s, immigration is
2See Zorlu and Hartog (2001) and Van Ours and Veenman (2005) for a more detailed discussion on theimmigration to The Netherlands.
4
characterized by the family reunification/formation of ‘guestworkers’. Additionally, the flow of
political refugees, asylum seekers has increased dramatically.
In this paper we analyze the out–migration of recent immigrants (1995-2003) and their
possible return from abroad. Below, we briefly discuss the theoretical framework concerning
return- (out) and repeated migration. In this discussion we refer to the Dutch migration history
and the constitutional rules of migration of the Netherlands. We give special attention to the
importance of the migration motive and the country of origin, which are often ignored in the
literature.
An important contribution to the theoretical explanations of return emigration of immigrants
is provided by Borjas and Bratsberg (1996). They attribute return migration to an optimal
residential local plan over the life cycle where immigrants return to source countries due to
the realization of a savings goal or due to erroneous information about economic opportunities
in the host country. Other theories attribute return migration to region-specific preferences
(Hill 1987; Dustmann and Weiss 2007), higher purchasing power of host currency in source
countries (Dustmann and Weiss 2007) or to greater returns for human capital acquired in the
host country (Borjas and Bratsberg 1996; Dustmann and Weiss 2007). Borjas and Bratsberg
(1996) also show that the selection of emigrants from a particular country reinforces the initial
selection of immigrants to that country.
Dustmann and Weiss (2007) develop a framework, where the agent maximizes lifetime utility
abroad and at home. Lifetime utility includes consumption and locationally fixed factors that are
complementary to consumption, including family, culture, climate etc. In this set up preference
for the home country leads to return even though it is not necessarily economically advantageous
to do so. If the environment and preferences are allowed to change over time, this model can be
extended to repeated migration moves.
This framework may differ according to the migration motive, as the importance of economic
prospects differ with the migration motive. For migrants following their spouse who migrated
to host earlier (family reunion) the decision to re-migrate may not optimal from the individual
perspective but only from the household perspective. This also holds for a migrant who came
to form a family. As singles are more flexible we expect that those family-migrants are less
5

mobile and have therefore a lower re-migration rate. As family formation migrants often come
to the host to marry or cohabit with a native or second generation migrant the family is even
less inclined to move on.
If human capital accumulation is relatively easier in the host country this can motivate
a temporary stay abroad. Human capital accumulation can take place both through formal
education and work experience. As argued by Co et al. (2000) this accumulation will allow the
person to enter the source country wage distribution at a relatively higher point upon return,
which even though the source country could have a lower average wage level, will leave the person
better off. Following this argument, spending time abroad studying, can be a way of gaining
competitive edge. This induces that students would stay temporarily for a short period in the
host country. On the other hand, completion of education in the host enhances the migrant’s
host country specific human capital, thereby facilitating the participation in the host country’s
labor market. This would reduce the migration rate out of the host country.
Ethnic origin may also matter. The information problem for migrants may be bigger the
further, both in distance and in culture, the host and source are apart. Furthermore migrants
from further away could possess less host country specific human capital upon arrival. There
is a considerable body of evidence that distance matters in deterring migration, see Long et al.
(1988). The opportunity cost of remaining in the host are lower for countries close by. For
example, Borjas and Bratsberg (1996) find that immigrants to the US tend to return to rich and
to countries close to the US. Ethnicity is also important if immigrants of a certain ethnic group
systematically perceive a lower return than expected. For immigrants belonging to such groups
the re-migrate rate is higher. On the other hand, human capital accumulation in the host may be
more in demand in countries similar to the host. For example, for the Netherlands the demand
of high-skilled workers in other EU-countries or in the US is relevant for the re-migrate rate of
these workers. This may lead to higher return- and re-immigration rates for immigrants from
countries close to the Netherlands. Another issue is that immigrants from some countries may
find it easier to migrate than other. An example is that citizens of EU-countries are formally
allowed to migrate to and to work in other EU-countries. Following this argument EU-citizens
should have a higher return and re-immigration rate than none EU-citizens. Specific institutional
6

policies in the host country could also be important. In the Netherlands, for instance, family
formation migrants from non-EU countries have to leave the country if their relation ends within
three years of the formation. In addition for labor migrants the end of a temporary contract
may induce return migration.
The level of source country network matters as well. For single migrants the availability of
potential marriage candidates of the same ethnic origin may change the initial planned duration
of stay upward (or to permanent). Even for family migrants an extended ethnic network in the
host may increase their duration of stay, as this will increase their possibilities to find a new
partner if the relation with their current partner ends. For Turkey and Morocco these networks
in the Netherlands seems particularity important. The migrant flows in the sixties and seventies
have led to historical ties and a substantial stock of migrants from these countries. Most of
the second generation of these migrants still marry to a partner from their home country. We
therefore expect that these migrants are more inclined to stay longer in the Netherlands.
A major flaw of our data, described in detail in the next Section, is that the education level
of the immigrants is not available, neither the level they attained at home nor the level they
attained in the host. Based on the Roy model the literature puts much emphasis on the selection
of emigrants due to skill difference. In their seminal article Borjas and Bratsberg (1996) argue
that the migrants who return from a host country with low wage dispersion, like the Netherlands,
are in majority the more able among the below–average performers in the high wage dispersion
source country. Recently, Nekby (2006) finds that return migration from Sweden is positively
associated with education. Jensen and Pedersen (2007) find a similar result for the education
level obtained in Denmark. However, Constant and Massey (2003) find no effect of home country
schooling on the return migration. Edin et al. (2000), who infer the skill level from relative
income levels, find that the less skilled are more likely to emigrate from Sweden. A crucial point
in this context is whether education and skills acquired at home can be transferred into relevant
skills for the host country. This is often not the case between countries with different level of
economic development.
We argue that the country of origin in combination with the migration motive serves as a
rough approximation of the skill level of the immigrant. The country (group) of origin is an indi-
7

cator of the level of the host-country specific human capital, since it is from some countries easier
to accumulate host-country specific human capital. It is also an indicator of the opportunity
certain immigrant groups face abroad. it therefore captures some of the unobserved hetero-
geneity due to the unavailability of the (home-country) education level. In general immigrants
from developed countries bring the highest level of education. It is known that immigrants
from Turkey and Morocco have very low education levels. We also know that the home country
educational level is a concave function in the age at immigration. We can also be quite sure
that most students are highly educated.
To sum up, theory predicts that the migration motive and country of origin are important
factors in explaining return- and repeated migration of immigrants. However, only limited em-
pirical evidence on this issue is available. In particular, no analysis has disentangled temporary
migration and permanent migration. This study aims to fill that gap.
3 Data on immigrants to The Netherlands
We have data on recent immigration and emigration to and from The Netherlands. Since 1995
we know for all migrants when their migration move took place. All immigration by non-Dutch
citizens, immigrants who do not hold the Dutch nationality, who legally entered The Nether-
lands is registered in the Central Register Foreigners (Centraal Register Vreemdelingen, CRV),
using information from the Immigration Police (Vreemdelingen Politie) and the Immigration
and Naturalization Service (Immigratie- en Naturalisatie Dienst, IND).3 The CBS, Statistics
Netherlands, has linked these data to the Municipal Register of Population (Gemeentelijke Ba-
sisadministratie, GBA). These combined data contain information for all non-Dutch migrants
on the timing of migration moves and on some basic demographic characteristics.
All immigrants without the Dutch nationality have to register at the Immigration Police.
The people with a nationality that implies a visa to enter The Netherlands, fill in their migration
motive when they apply for the visa. Statistics Netherlands make the distinction between labor-
migrants, family reunification migrants, family-formation migrants, student immigrants, asylum
3The criterion for registration as an immigrant in the Netherlands is a four months time criterion. To be moreprecise: every person intending to stay in the Netherlands for at least two thirds of the forthcoming six months,should notify the local population register immediately after the arrival in the Netherlands.
8

seekers (and refugees), and immigrants for other reasons (including a.o. joining with labor
migrant, medical treatment and Au Pair). There are different requirements for different visas.
Migrants from the EU are free to move and work in the Netherlands, but still need to register.
Labor migrants from other countries need to have a labor contract before they can enter the
country. Employers can only hire somebody from outside the EU if they can prove they cannot
find a suitable native person or from the EU. For migrants who come for family reasons the
person they are connected to in the Netherlands must have a sufficient income, must be above
18 (21 for family formation) and have living permission or the Dutch nationality. For family
reunion a legal marriage or living–together–contract should exist. Family formation migrants
are expelled from the country if their relation ends within three years. Students need to prove
acceptance at a Dutch university or college before they are allowed to enter.
The migration motive is only available for those immigrants who are still registered at the
end of each year, starting 1997. Thus, the main migration motive for non-Dutch immigrants
is not available for those immigrants that leave, die or naturalize before January 1st 1998 or
before the end of the year of arrival. With these data we can identify important groups of
immigrants to the Netherlands. The distribution of the non–Dutch immigrants aged 18-64 over
the migration motives at first arrival to The Netherlands is depicted in Figure 1. Figure 2 shows
the development of the absolute numbers of immigrants over the years 1995 till 2003.4
From 1995 till 2001 the number of immigrants increased every year. In 2001 69,000 non-
Dutch immigrants between 18 and 64 years of age entered The Netherlands. In the last two years
the inflow of immigrants decreased to 57,000 in 2003. This decrease is most probably induced
by two phenomena. First, the more strict asylum policy of the Dutch government has reduced
the inflow of refugees from 15,000 in 2000 and 2001 to 5,000 in 2003. Second, the downfall of the
Dutch economy has led to a reduction in the number of labor immigrants. In the last 10 years
family-formation has been the most important reason to migrate to The Netherlands (26%).
Labor migrants (23%) and refugees (17%) are also important groups. Because the migration
motive is unknown for the immigrants that leave the country in the same year they entered we
have a relatively large number of immigrants with unknown migration motive.
4For more information on these data see Zorlu et al. (2004) and Nicolaas et al. (2004)
9

We focus our analysis on four migration motives: labor, family reunion, family formation and
study. Asylum seekers are removed from the sample because many of them are not immediately
registered in the Municipal Register of Population. Most of the asylum seekers are only registered
after they have received a living permission. It can take up to eight years until a living permission
is granted. Thus, the registered time in The Netherlands for asylum seekers is smaller than the
true duration in the country. Another issue is that some asylum seekers have a temporary permit
to stay, awaiting a permanent permit. If the permanent permit is not granted the asylum seeker
may be expelled from the country. Then, return migration is an exogenous event which is not
based on an individual decision.
The immigrants with other reasons to enter come for a plethora of reasons and therefore
they comprise a very heterogeneous group. The analysis would tell little about the migration
dynamics of a individual member of this group. Besides, they only amount to 7% of all immi-
grants. This made us decide not to include these immigrants in the analysis sample and focus
on the remaining four groups of immigrants.
In Table 1 we present some descriptive statistics for the data. Family formation migrants
and, of course, students are younger than other migrants. Labor migrants are mostly men,
while migrants who come for family reasons are mostly women. The difference between family
reunion immigrants and family formation migrants seems small, as both for both about 40%
is married. Many family reunion migrants are cohabiting and many family formation migrants
get married before they enter the country (because it can take more than half a year to get the
visa). Family reunion migrants are follow-up migrants from earlier labor and asylum migrants,
while family formation migrants are hardly follow-up migrants. Marriage to either natives or
second generation Turks and Moroccans are the main source of family formation migration.
Labor migrants and students are hardly ever married. The main countries of origin for each
migration motive are very distinct.5 The majority of labor migrants originates from a country
5EU15/EFTA are countries in the European Union, except for the 2002 new members and except for Belgium,Germany, UK and France plus the member countries of EFTA: Switzerland, Norway, Iceland. Former Yugoslaviaare Croatia, Serbia & Montenegro, Macedonia and Bosnia. New EU members are the countries that joined theEuropean Union in 2004: Cyprus, Czech Republic, Estonia, Hungary, Latvia, Lithuania, Malta, Poland, Sloveniaand, Slovakia. Rest of Asia are countries in Asia not Turkey, China, Iraq, Iran or Afghanistan. Rest of Africa areall countries in Africa except Morocco. Latin America are all countries in the Americas except USA and Canada.Australasia are Australia, New Zealand and other countries in the pacific
10

in the European Union. USA/Canada are other important countries of origin of labor migrants.
Family reunification migrants follow their labor migrants and therefore the EU15/EFTA region
is also an important region of origin for these migrants. Although Turkey and Morocco have
lost their importance as origin of labor migrants, the family reunion from these countries is
still important. The relatively high percentage of family reunion migrants from Iraq, Iran and
Afghanistan and other Asian countries is induced by reunification of asylum seekers. The fact
that second generation Turks and Moroccans get their partner from their home country is
reflected in the importance of these countries of sources for family migrants. As natives get
their foreign spouse mainly from Asia, Africa and Eastern Europe, these regions are important
regions of origin for family migrants. Finally, students origin mainly from EU countries, Asia
(China in particular) and Africa. Note that the relatively large number of immigrants from
Surinam is not reflected in the table because many of them have the Dutch nationality and in
this article we focus on the non-Dutch immigrants only.
Table 2 summarizes the dynamic aspect of migrantion. The average observed duration of
stay in The Netherlands is the longest for family reunification migrants and the shortest for
students. Of all labor migrants and students that arrive between January 1995 and December
2003, about 45% has left the country by the end of the observation period, December 31st 2003.
For migrants who came for family reasons less than 20% has left the country. A substantial
share, 6%–14%, of the migrants that have left the country returns to The Netherlands again
within the time frame. Those migrants who re-immigrate are very often repetitive movers, as,
for example, a third of re-immigrated labor migrants leaves the country again. These simple
descriptive statistics give an under-representation of the migration dynamics, because the recent
cohorts of immigrants are only followed for a very short period of time. When we only look at the
immigrants arriving in 1995 in The Netherlands, we observe that almost 40% of the immigrants
from that cohort have left the country within 7 years, see also Alders and Nicolaas (2003b) and
Nicolaas and Sprangers (2004).
11

4 A Duration Analysis of Migration Dynamics
In a duration model the timing of a particular event (or recurrent event) is modeled. For many
economic and demographic phenomena the timing of a transition from one state into another
state is important, see a.o. Lancaster (1990) and Van den Berg (2001). A very obvious reason
to use duration models for migration dynamics is that the timing of the migration events,
emigration or immigration, is relevant in understanding the migration. It is very likely that the
assimilation of the migrant in the host country depends on the length of stay in that country.
That will influence the decision to leave. Another reason to apply duration models is that
many relevant characteristics of the migrant may change over time. In duration models it is
straightforward to incorporate time-varying variables. A final reason to use duration models
is that in our data on newly arriving immigrants to The Netherlands we only observe the in-
and outflow of migrants from January 1995 till December 2003. For the migrants still in The
Netherlands in December 2003 we do not know their complete length of stay in the country. We
only know their migration history up till December 2003. This still contains valuable information
and duration models are perfectly fit to exploit the information of such right censored durations.
The key variables in duration analysis are the duration till the next event, the length of
stay of the migrant in The Netherlands, and the indicator of censoring. In duration analysis
the intensity, the hazard rate, is usually modelled.6 In the study of migration dynamics, the
intensity gives the instantaneous probability of leaving the country at a duration t months, given
that the individual stayed in the country for at least t months with λ(t) = f(t)S(t) where f(t) is
the probability density function, and S(t) is the survival function. The intensity is invariant to
censoring.
A common way to accommodate the presence of observed characteristics is to specify a
proportional intensity model λ(t|X) = λ0(t) exp(β′Xi(t)), where λ0(t) represents the baseline
intensity, that is, the duration dependence of the intensity common to all individuals. The
covariates affect the intensity proportionally, see Cox (1972). The survival function for this
model is S(t|xi) = exp(
−∫ t
0 λ0(s)eβ′xi(s) ds
)
.
6In the biomedical literature the accelerated failure time that models the log-duration is also often used. Inthese models is it more complicated to account for censoring.
12

4.1 Mover-stayer models
Up to this point we have assumed that all migrants are (potential) movers. We now account
for the possibility that some migrants never make a next migration move, they are permanent
migrants, by using a mover-stayer approach. A mover-stayer model (see Schmidt and Witte
(1989)) assumes that a latent group of individuals have a zero probability to leave, the stayers.
To incorporate the possibility of defective risks the survival function is redefined as
S(t|xi) =(
1 − p)
exp(
−
∫ t
0λ0(s)e
β′xi(s) ds)
+ p, (1)
where p is the proportion of stayers. Thus the survival function at t is given by the proportion
of stayers (permanent migrants), who never leave the country, plus the proportion of movers
(temporary migrants) multiplied by the probability to migrate after a duration of t months in
the country. It is important to realize that who is a stayer or who is a mover is not observed.
We only know that those who move are movers, but those who are at a given duration still in
the country are a mixture of stayers and movers who will leave later. In the end (i.e. t → ∞)
only the stayers remain. The proportion of stayers can also depend on observed characteristics
of the migrants. To guarantee that the proportion lies between zero and one we employ a
logit form: p(zi) = exp(γ′zi)/(
1 + exp(γ′zi))
. Note that the interpretation of the regression
coefficients β change. The coefficients are no longer equal to the elasticity of the intensity w.r.t.
the covariates. In the mover-stayer model the regression coefficients give the elasticity of the
conditional intensity, conditional on being a mover. The unconditional intensity is now
λ(t|xi) =
(
1 − p(zi))
λ0(tij)eβ′xi(tij ) exp
(
−∫ t
0 λ0(s)eβ′xi(s) ds
)
(
1 − p(zi))
exp(
−∫ tij0 λ0(s)eβ′xi(s) ds
)
+ p(zi)(2)
Many parametric functional forms exist for the baseline intensity. However, they all put
heavy restrictions of the shape of the baseline intensity. A more flexible approach is to assume
a piecewise constant baseline intensity. Let the intervals Im(t) = (tm−1 ≤ t < tm) for m =
1, . . . ,M+1 with t0 = 0 and tM+1 = ∞ be the intervals on which we define the piecewise constant
intensity. Then, the baseline intensity is λ0(t) = eα0 ·(
∑M+1m=1 eαmIm(t)
)
, with αM+1 = 0. Thus
α0 determines the intensity in the last interval. The other α’s determine the difference in
intensity at each interval compared to this last interval. The baseline intensity for a duration of
13

t ∈ [tm−1, tm) is higher than the baseline intensity to leave for a duration of t > tM if αm > 0
and lower if αm < 0.
If there is interdependence of the repeated migrations due to omitted covariates or individual-
specific effects, like being adventurous, the parameter estimates may be biased and/or the esti-
mated covariance matrix provides invalid standard errors. One approach is to explicitly model
the individual-specific effects using unobserved heterogeneity. In Cox survival models this kind
of model is called the mixed proportional hazard model, see for example Manton et al. (1981).
We attempted to fit both Gamma and discrete mixture models with either shared or un-
shared, differs unobserved heterogeneity. Shared unobserved heterogeneity assumes that the
heterogeneity term remains the same for each migration of one individual, while unshared un-
observed heterogeneity assumes that it differs for each migration of one individual. None of
these models lead to an indication of unobserved heterogeneity or change in the parameters. We
therefore do not present these models. The absence of unobserved heterogeneity in the model for
leaving the host and in the model for returning to the host rule out that both types of behavior
are correlated through unobserved characteristics. It is, however, important to point out that
the presence of stayers is compatible with a discrete mixture duration model. Heckman and
Walker (1987) recognize that some specifications of the latent intensity can deliver stayers. This
renders the interpretation of the coefficients (and the baseline intensity) conditional on being a
mover. The temporal dependence between the time in the Netherlands and the time abroad is
captured by including an indicator of repeated migration combined with either the time abroad
(for departure from the Netherlands) or the years spent in the Netherlands during the previous
stay (return to the Netherlands).
4.2 Additional left–censoring and left–truncation
Before estimating the mover-stayer models some data issues should be mentioned. Although in
principle the exact date of emigration (and second and repeated immigration) is known, some
migrants do not officially inform that they leave. Their departure is only registered as ”admin-
istrative removal” after the authorities have assessed that the migrant has left the municipality
without showing up in the files of another municipality in The Netherlands or as an emigrant.
14

These administrative removals are included among emigration and they amount to around 40%
of the emigration, see Alders and Nicolaas (2003a). It is quite possible that some migrants that
are ”administratively removed” remain in The Netherlands as an illegal immigrant. However, an
indication that ”administrative removal” is not only induced by people who try to stay illegally
in the country is that many Dutch nationals also administrative removed.
We assume that an administrative removal implies that the migrant has left before the date
the administrative removal is recorded and instead of the true duration we measure the upper
bound of the duration of stay. Such limited information is equivalent to left-censored data. For
left-censored data the exact start of a duration is unknown, but it is known that the duration
started after some observed time. Then the contribution to the likelihood of a left-censored
duration of length t is the probability the migrant has stayed at most t. This is equal to one
minus the survival probability up to t months of this migrant, see Appendix A.
Another data issue concerns the observation of the migration motive. The migration motive
is unknown for immigrants that entered the country between January 1995 and December 1997
and left the country before January 1998. This implies that the sample of immigrants that
came to The Netherlands in that specific period for whom we observe the migration motive is
conditional on ‘survival’ up to January 1998. In a duration model this is called left truncation
and by conditioning on ‘survival’ from the date of entry till January 1st, 1998 we account for
this selective observation. The migration motive is also unknown for the immigrants that leave
the country before the end of the year. This implies that the immigrants with known migration
motive have ‘survived’ up till the end of the year. Again, conditioning on the time till the end
of the year will correct for this selective observation. However, for immigrants that enter the
country in the last year of observation, 2003 the time till the end of the year equals the observed
duration and we cannot correct for this selection. We, therefore, exclude the immigrants that
arrived in 2003 from our analysis. The full likelihood function is given in Appendix A.
5 Empirical Findings
We consider three models: (1) a conventional duration model without stayers; (2) a mover-
stayer model; (3) a mover-stayer model with interaction terms. In Model 2 and 3 the stayer
15

probability changes with gender, migration motive and country of origin. We assume that the
stayer probability is determined at the moment the migrant enters the country. Thus, for the
time-varying variables age and marital status we include only the value at the moment of entry
in the host (or abroad). A comparison between the first two models indicates the importance of
permanent migration (stayers). In Model 3 we allow for a separate baseline intensity for each
migration motive. In Section 2 we have shown that the impact of ethnic origin on the migration
dynamics may differ with the migration motive. Therefore, model 3 also allows for interaction
between migration motive and country of origin. First, we discuss the empirical results for the
models for immigrant departure from the Netherlands. Next, the results for the return from
abroad for those immigrants that have left the country are discussed. In Section 6 we combine
the two model 3 results to simulate the migration dynamics of some typical immigrants to the
Netherlands.
5.1 Departure from The Netherlands
The mover-stayer models contain two components, the baseline intensity and the stayer-probability.
Table 3 with the estimation results is divided into three parts. The first two parts provide the
parameter estimates of the intensity to leave and the last part provides the logit coefficients
estimates of the stayer-probability. The stayer probabilities implied by the parameter estimates
of model 3 are shown in the first panel of Table 5.
We have tried a couple of different interval choices for the piecewise constant baseline in-
tensity and decided to use eleven intervals, one interval for every half a year till 5 years (and
the reference interval of 5 years and over). The number of intervals is a compromise between
flexibility and interpretation. The implied baseline intensities for model 3 are depicted in Fig-
ure 4 (conditional on being a mover) and Figure 5 (unconditionally, see (2)). Note that due to
different stayer-probabilities (see the last part of Table 3 and Table 5) the conditional baseline
intensity of family formation migrants is above the conditional baseline intensity of labor mi-
grants (the first 18 months), while the opposite holds for the unconditional baseline intensity.
Family formation migrants have a much higher stayer probability (about 70%). This dynamic
sorting is equivalent to the induced duration dependence if one neglects existing unobserved
16

heterogeneity.
The baseline intensity provides an indication of the assimilation and attachment to the home
country of the immigrants. Assimilation is usually defined as a cumulative learning process and
it therefore increasing over time. Attachment to the home country can be either decreasing over
time, as migrants may be unable to develop personal relationships in the host, or increasing
over time, as ties with the home country diminish. We cannot distinguish between these two
factors. The learning takes place during the first two years of stay as for all migrants we see a
sharp decline in the departure rate during this period. After this period the departure intensity
declines only a little, indicating the attachment and assimilation equalize. However, other factors
as temporary contracts (labor), end of study (students) or change in family may also cause this
pattern.
Students and labor migrants are more flexible than family migrants, because they are mostly
single. Their migration decision is therefore less complicated, which is reflected in their high
departure rate. Students show the least attachment to the Netherlands and leave fast. Only
20% of the students have either got a job and/or found a partner and decided to remain in
the country. The family reunion migrants show the lowest departure rate. And, when we take
the high percentage of stayers into account, the family formation migrants also have a very low
departure rate. Family formation migrants have to stay with their spouse for at least three years
to gain an individual living permission in the Netherlands. This is reflected in a lower departure
rate for those migrants after 3 years of stay.
The influence of the country of origin, gender, age (centered at the average age of 25 years
and divided by 10 and in a quadratic form) and, repeated migration on the departure intensity
are given in the second part of Table 3. We present only the results for a selection of the used
countries/regions of origin.7 The European Union/EFTA (excluding the neighbor countries
Belgium, Germany, France and UK) is reference region of origin. We see that the effect of
the covariates on the intensity differ in magnitude among the different migration motives. As
expected married migrants are less mobile than single migrants. The need to make joint decisions
makes a couple less flexible. The age pattern of the intensity of labor migrants is similar to the
7The parameters for other countries of origin can be obtained from the author upon request.
17

empirical finding in the literature that both the younger and the older leave faster than those in
their prime of their working age (35 year old). For family formation migrants the age pattern of
the intensity to leave increases with age. A reason may be that older family formation migrants
have accumulated more source specific human capital which could make it optimal for them to
return.
We have discussed already that the assimilation effect is captured by the baseline intensity.
However, migrants who come for a second time to the country have already accumulated host
country specific human capital. We therefore include an indicator of repeated migration and the
length of the previous stay in the model. The effect of migration experience is often attributed
to an unobserved propensity to move and to a lower opportunity cost of moving if the migrant
has less location–specific (human) capital. However, migration experience also implies a larger
accumulated information about the host country’s opportunities and therefore a higher assimila-
tion and a greater attachment to the host. We find that the latter explanation is more plausible
for the Netherlands. The quadratic form implies that ‘assimilation’ declines in the first months
till a ’minimal’ length of stay is reached, and then increases with the length of stay.
The country of origin is a very important factor in explaining the migration dynamics. The
effect of the country of origin on the intensity can not be compared separately from the effect
on the stayer probability. The stayer probability or probability to remain in the Netherlands
is the third component of the mover–stayer model. The logit coefficients of this probability are
given in the last part of Table 3.
The migrants from neighboring countries Germany and the UK show rather opposing migra-
tion dynamics. Despite the fact that the German culture is closer to the Dutch culture migrants
from Germany remain more often in the Netherlands and when they leave they leave slower. It
seems that Germans feel more at home in the Netherlands than the British. Migrants from the
new EU countries also remain more often in the country. However, labor migrants from these
countries are more mobile. Note that these migrants entered before the free-movement of people
from these accession-countries to the Netherlands came into force. Two possible reasons for
these higher dynamics are, first, that these migrants use the Netherlands as a stepping stone for
an international career and, second, as their home-countries experience fast development they
18

return home. This should be a point of concern for the Netherlands, as the need for employers in
agriculture (seasonal) and construction is growing and the ambition to work in these sectors is
declining among natives. In recent years (2006-2008) the inflow of migrants from these accession
countries increased, especially from Poland, but if the Netherlands cannot retain these migrants
labor supply shortage in the these sectors is expected. American migrants, who are also close
(in culture) to the Netherlands, remain much less in the country. These, mainly high-skilled,
workers face an international job-market and are therefore less attached to the Netherlands.
Migrants from countries further away show a tendency to remain in the country. Migrants
from Turkey and Morocco have a large ethnic network in the Netherlands, this increases their
attachment to the country despite their different (islam) culture. The family formation migrants
from these countries that leave do it faster. These migrants are mainly low-educated people from
the rural areas of these countries (often to assist cousins to come to a Western country), with a
very different culture compared to the Western society. Another reason for the faster return is
that those migrants are expelled from the country when their relation breaks up within 3 years.
Migrants from China, mostly students, seem to take the opportunity to enhance their human
capital and use it in the Netherlands.
The stayer probabilities implied by the parameter estimates of model 3, for a typical migrant
for each migration motive, are shown in the first panel of Table 5. For labor migrants this
reference migrant is 30 year old single male from an EU15 or EFTA country, for family reunion
migrants it is a 30 year old married female from Turkey, for family formation migrants it is a
29 year old unmarried female from Turkey and, finally, for the reference student migrant is a 21
year old single male from an EU15 or EFTA country. More than 23 of the family migrants remain
in the country, while only 14 of the labor migrants and 1
5 of the students stay permanently. It
shows that the importance of including both temporary and permanent migrants depends on
the migration motive.
5.2 Return to The Netherlands from abroad
About 16% of the migrants arriving in 1995 in The Netherlands leave the country and return
before the end of 2003. Thus, even in this relatively short period of nine years, repeated migra-
19

tion is an important phenomenon. For a full coverage of the migration dynamics understanding
the speed of return, if they return, of migrants abroad who first spent some time in the country
is imperative. In our data we only observe the migrants while officially registered in The Nether-
lands. Therefore, we cannot include home country characteristics, like the wage differential with
the Dutch wages or unemployment level, in the model to explain the return to The Netherlands.
However, if the migrant returns we observe the exact time of this new entry to the country and
we can link this with the earlier information on this migrant. If the migrant has not returned
within the observation period, (s)he may stay abroad or return later. This information is rich
enough to allow the estimation of mover-stayer models for returning to The Netherlands from
abroad.
For the return of recent immigrants to The Netherlands we also estimate three models; a
conventional duration model without stayers, a mover-stayer model and, a mover-stayer model
with interaction terms. The results are presented in Table 4. Again the table is divided into
three parts. The first two parts provide the parameter estimates of the intensity to return and
the last part provides the parameter estimates of the stayer-probability (of staying abroad).
We have tried a couple of different interval choices for the baseline intensity and decided
to use five intervals. These intervals are the first 6 months and, every half a year till 2 years
(and the reference interval beyond 2 years). We present the results in Table 4. The implied
baseline intensities for model 3 are depicted in Figure 6 (conditional on being a mover) and
Figure 5 (unconditionally). The intensity to return from abroad is much less then the intensity
to leave. This intensity decreases with the length of the time the migrants are abroad, which
indicates that the attachment to the Netherlands is decreasing over time. Students have the
highest intensity to return (conditional of being a mover), but if you take the high percentage of
students that never return into account they have the lowest return intensity. Thus, they just
come to the country to study and use their obtained education in other countries. In line with
the assimilation theory we find that migrants who have been in The Netherlands before have a
higher intensity to return.
The influence of the country of origin on the return intensity are given in the second part
20

of Table 4.8 Again the effect of the country of origin on the intensity can not be compared
separately from the effect on the stayer probability, see the third part of Table 4. Migrants
from neighbor countries have closer ties and therefore the opportunity cost of returning is lower.
Migrants from Turkey and Morocco also return more often. For those migrants the existing
network of countrymen in the Netherlands must induce this.
The probability to remain abroad implied by the parameter estimates of model 3, for a
typical migrant for each migration motive, are shown in the lower panel of Table 5. Students do
not return to the Netherlands for a second time, while family formation migrants often just go
temporarily abroad. About 23 of the labor migrants and 3
4 of the family reunion migrants returns
to the Netherlands again. A reason for family migrants to return is that their partner is still in
the Netherlands. Unfortunately, the data does not provide us the partner identification. Thus we
cannot tell how often this occurs. A changing environment, either at home or in the Netherlands
can induce labor migrants to return. The host specific human capital they accumulated during
their previous stay facilitates their chances on the Dutch labor market. As discussed above
the stayer probability also depends heavily on the country of origin of the migrant. Note that,
although a substantial amount of (non-student) migrants return to the Netherlands again, the
intensity to return is rather small.
6 Predicting Lifetime Migration Dynamics
In the previous section we have discussed the estimation of mover-stayer models for both the
departure from The Netherlands and the return from abroad back into the country. Some of the
migrants move back and forth, while other stay in The Netherlands or stay abroad (after some
time spend in The Netherlands). Migrants that repeatedly move back and forth can, each time
they enter, become a stayer. The intensity to leave determines how long the ‘movers’ stay in the
country. After they have left the country they either become a stayer abroad or return to The
Netherlands again. The intensity to return determines how long these ‘movers’ stay abroad. At
their, possible, second entry to the country they can become a stayer or a mover. In principle
8We present only a selection of countries of origin included in the models. The full estimation results areavailable from the author upon request.
21

this could repeat again and again.
Thus, the estimated stayer-probability to stay in The Netherlands underestimates the true
proportion of migrants that end-up in the country. This proportion can be derived from the
limit proportions of the implied Markov Chain of the combination of both mover-stayer models.
This Markov Chain consists of with two states, the migrant is in The Netherlands or the migrant
is abroad. If the probability to stay permanently in The Netherlands is denoted by Pi,NL and
the probability to stay permanently abroad is denoted by Pi,ab, both conditional on the observed
characteristics of the migrant available in our data, the long run probability to end-up in The
Netherlands is
πi,NL =Pi,NL
Pi,NL + Pi,ab − Pi,NL · Pi,ab. (3)
These implied long-run probabilities for a typical migrant for each migration motive are shown
in Table 6. A majority of the family migrants, about half of the labor migrants and 15 of the
students ends-up in The Netherlands. Next to the migration motive gender, marital status and
the country of origin play an important role in the size of the long-run probability.
Females and married migrants have a higher chance to end up in the the Netherlands,
because they are less prone to move while in the Netherlands and more prone to return to the
Netherlands. Migrants from Turkey and Morocco, which are mostly family migrants, end up
in the country very often. The existing network of countrymen makes it relatively easy to find
their way in the country, even though their assimilation rate is rather low (low language fluency
and high unemployment rates). Chinese students seem to take the opportunity to remain in the
country after completion of their education.
The importance of repeated migration can be derived directly from the stayer probabilities
Pi,NL and Pi,ab. In the long-run the probability to return to the country at least once is equal to(
1−Pi,NL
)
×(
1−Pi,ab
)
. Consider, for example, a cohort of unmarried male labor migrants from
Turkey entering The Netherlands. From this cohort 85% ends-up in the country (see Table 6).
Before they settle down forever, these migrants may have gone abroad temporarily. At first entry
48% of these Turkish migrants become a stayer (see upper panel of Table 5 ). The remaining
52% leave the country and 16% of them never return to the country (see lower panel of Table 5
). Thus, 44% = 52% × 84% of the original cohort eventually enters the country again. From
22

those Turkish migrants that enter again 48% decide to stay in The Netherland, etc.
The time it takes to reach the long-run proportion depends on the intensity to leave and on
the intensity to return from abroad. With the estimated stayer probabilities and the estimated
intensities to leave and return we can predict, for any cohort of migrants, the migration dynamics
after the first entry to The Netherlands. The prediction is based on simulation of a hypothetical
cohort of immigrants using the estimated coefficients of model 3 for both leaving and returning.
For the simulation we choose a fixed combination of covariate values (except for the endoge-
nous repeated migration indicator and the previous time in the country/abroad) and consider
10000 of such (hypothetical) migrants, e.g. 10000 unmarried 30 year old male labor migrant from
an EU country, who enter the country at the same time. Then, based on their implied stayer
probabilities, we simulate which of these migrants become a stayer in the country. Then for
the movers we simulate for each month whether the migrant leaves or not. When a (simulated)
migrant leaves we simulate whether (s)he remains abroad forever or stays abroad temporarily.
If the migrant does not remain abroad we simulate the return on a monthly basis. If a (sim-
ulated) migrant returns to the country we simulate whether (s)he remains in the country, etc.
In second and higher order migration moves we take the previous durations into account. We
stop simulating after 25 years (300 months). We repeat 100 of such simulations and take the
average percentage of the original cohort in the country at each month after entry to construct
our prediction.
We predict the migration dynamics for a typical immigrant for each of the four migration
motives (see the choice of the typical migrants in the previous section). From Figure 7 it is clear
that not only does the final percentage of the cohort that ends-up in The Netherlands differ but
also the pattern to this long-run probability. The students and family reunion migrants reach
their long-run probability relatively fast, while for the labor-migrants and family formation
migrants the long-run probability has not been reached within 25 years after entry. Thus,
students seem to decide rather fast whether to invest in staying in the Netherlands or use the
obtained education somewhere else. A small part of the labor migrants seem to foresee new
opportunities in another country (or in a country they once were) and continue to revise their
migration decision.
23
Thus, migration is for some a continuously dynamic process in which the migrant repeatedly
moves to and from a country, while for others it is a one-shot irreversible decision. Of course,
for many the migration dynamics is somewhere in between these extremes. For a complete
view of the migration dynamics it is therefore important to allow for both permanent (stayers)
migrants and temporary (movers) migrants. The analysis of this section also shows that both
the departure and the return should be considered for a full coverage of the migration dynamics.
7 Conclusion
Most previous studies treat migration as a once-and-for all event and the studies that take the
return migration into account neglect the fact that a some migrants remain in the host country.
For a dynamic analysis of migration from a life-cycle perspective both temporary migrants, who
leave the country and who may return or who make repetitive moves, and permanent migrants,
who stay forever in the host country, are important. In this paper a coherent modeling approach
is developed that includes both temporary and permanent migrants and both out-migration and
re-immigration.
Another contribution of this paper is that it provides insight in the difference in migration
dynamics by migration motive. Most of the literature has focused on labor migrants, but the
other migration motives are equally important. The decision to (re)-migrate may be less based
on economic grounds for family migrants and more on emotional and cultural factors. For
example, many import brides in the Netherlands are migrating to form a family with a native
or second generation migrant. For many of these migrants their individual economic prospects
are of minor importance in their migration decision.
By applying a mover-stayer model for the dynamic process of migration we can identify the
underlying determinants of the timing of this process, both for the timing of departure from
the host country and for the timing of the return from abroad back to the host country. It
also enables us to identify the characteristics of the migrants that influence the probability to
become a stayer (permanent migrant) in the host country or abroad.
Our empirical results based on data for recent non-Dutch immigrants to the Netherlands
provide compelling evidence that some immigrants to The Netherlands are permanent, while
24

other immigrants are prone to leave again. The estimation results show important differences
in the stayer probability and the intensity of departure by migration motive and by country
of origin of the migrant. Labor migrants have the highest mobility rate and family migrants
the lowest. Labor migrants from Western countries migrate more than labor migrants from
countries further away (both in distance and culture). For the first less institutional restrictions
to migrate exist and they are usually highly educated, while for the latter it more difficult to
migrate and assimilation into the country requires more effort. Not surprisingly, most students
come to the country for a temporary stay and when they leave they hardly return. However,
Chinese students seem to use their obtained education rather often in the Netherlands, as they
show a high permanent stay probability. Family formation migrants are the least prone to
leave (and return very frequently from abroad). Many of these migrants originate from Turkey
and Morocco, countries with a large ethnic network in the Netherlands due to guestworker
agreements in the 60s and 70s of the previous century. The migration dynamics of migrants
from these countries
By combining the stayer probabilities for remaining in the host country and remaining abroad
the long-run probability to end-up in the host country can be deduced. Some of these migrants
become a stayer at their first entry in the host country, while temporary migrants leave after
some time. Of those migrants that have left, some stay abroad and some return to the host
country again. In the long-run the migrant ends-up in the host country or abroad. The combined
models also provide a framework to predict the migration dynamics to and from The Netherlands
of a particular cohort of immigrants. The intensity to leave determines how long these migrants
stay in the country. The intensity to return determines how long these migrants stay abroad.
Thus, for a complete view of the migration dynamics it is important to allow for both permanent
(stayers) migrants and temporary (movers) migrants and that return from abroad should not
be neglected.
From the obtained insight in the dynamic composition of immigrants in the country impor-
tant policy implications can be derived. Consider, for example, the recent increased restriction
on family formation migration to the Netherlands. The Dutch government has increased the
minimum age of the migrant and the minimum income of the partner in the Netherlands and
25

now requires a proficiency test of these migrants. The impact of such measures will not only
be a reduction in the inflow of family migrants (from non-Western countries) but also, in the
long-run, a major reduction of the number of these migrants living in the country. The latter
can be directly derived from our results. Other possible policy measures for the Netherlands
should be aimed at retaining the (mostly highly-educated) labor migrants and students from
Western countries in the country. Similar stories can be derived for other European countries.
A drawback of the used data is that it lacks information on important factors that influence
migration decisions. In the future we hope to link the current data to data on socio-economic
characteristics of immigrants. Statistics Netherlands is building a huge dynamic individual based
database on social-economic variables, the SSB (Social Statistisch Bestand= Social statistical
database), that can be linked to the current data and many other data at Statistics Netherlands.
With the linked data it would be possible, for example, to infer how the labor-market status of
migrants in The Netherlands affects their migration dynamics.
References
Abbring, J. H. (2002). Stayers versus defecting movers: A note on the identification of defective
duration models. Economic Letters 74, 327–331.
Alders, M. and H. Nicolaas (2003a). Administratieve correcties in de bevolkingsstatistieken
(Administrative corrections in the population statistics). Bevolkingstrends 51(4), 36–42.
Alders, M. and H. Nicolaas (2003b). One in three immigrants leave within six years. CBS
Web Magazine 20 January 2003.
Boag, J. W. (1949). Maximum likelihood estimation of the proportion of patients cured by
cancer therapy. Journal of the Royal Statistical Society: Series B 11, 15–44.
Borjas, G. J. (1994). The economics of immigration. Journal of Economic Literature 32,
1667–1717.
Borjas, G. J. and B. Bratsberg (1996). Who leaves? the outmigration of the foreignborn. The
Review of Economics and Statistics 78, 165–176.
CBS (2003). Allochtonen in Nederland 2003. Voorburg.
26

Co, C. Y., I. N. Gang, and M. S. Yun (2000). Returns to returning. Journal of Population
Economics 13, 57–79.
Constant, A. and D. S. Massey (2003). Self-selection, earnings and out-migration: A longitu-
dinal study of immigrants to Germany. Journal of Population Economics 16, 631–653.
Constant, A. and K. F. Zimmermann (2003). The dynamic of repeat migration: A Markov
chain analysis. Discussion Paper 885, IZA, Bonn.
Constant, A. and K. F. Zimmermann (2007). Circular migration: Counts of exits and years
away from the host country. Discussion Paper 2999, IZA, Bonn.
Cox, D. R. (1972). Regression models and life–tables (with discussion). Journal of the Royal
Statistical Society: Series B 34, 187–220.
Detang-Dessendre, C. and I. Molho (1999). Migration and changing employment status: A
hazard function analysis. Journal of Regional Science 39, 103–123.
Dierx, A. H. (1988). A life–cycle model of repeat migration. Regional Science and Urban
Economics 18, 383–397.
Duleep, H. O. (1994). Social security and the emigration of immigrants. Social Security Bul-
letin 57, 37–52.
Dunsmuir, W., R. Tweedie, L. Flack, and K. Mengersen (1989). Modelling of transitions
between employment states for young Australians. Australian Journal of Statistics 31A,
165–196.
Dustmann, C. (1995). Return migration: The European experience. Economic Policy 22,
214–250.
Dustmann, C. (2000). Temporary migration and economic assimilation. Swedish Economic
Policy Review 7, 213–244.
Dustmann, C. (2002). Return migration, wage differentials, and the optimal migration dura-
tion. European Economic Review 47, 353–369.
Dustmann, C. and Y. Weiss (2007). Return migration: Theory and empirical evidence. Dis-
cussion Paper CDP No 02/07, CReAM, London.
27

Edin, P.-A., R. J. Lalonde, and O. Aslund (2000). Emigration of immigrants and measures of
immigrant assimilation: Evidence from Sweden. Swedish Economic Review 7, 163–204.
Goldstein, S. (1964). The extend of repeated migration: An analysis based on the Danish
population register. Journal of the American Statistical Association 59, 1121–1132.
Heckman, J. J. and J. R. Walker (1987). Using goodness of fit and other criteria to choose
among competing duration models: A case study of Hutterite data. In C. C. Clogg (Ed.),
Sociological Methodology (1987), pp. 247–308. American Sociological Association: Wash-
ington DC.
Hill, J. K. (1987). Immigrant decisions concerning durations of stay and migratory frequency.
Journal of Development Economics 25, 221–234.
Jensen, P. and P. J. Pedersen (2007). To stay or not to stay? out–migration of immigrants
from Denmark. International Migration 45, 87–113.
Lancaster, T. (1990). The Econometric Analysis of Transition Data. Cambridge University
Press.
Long, L. C., J. Tucker, and W. L. Urton (1988). Migration distances: An international com-
parison. Demography 25, 633–660.
Longva, P. (2001). Out–migration of immigrants: Implications for assimilation analysis. Mem-
orandum 04/2001, University of Oslo.
Manton, K. G., E. Stallard, and J. W. Vaupel (1981). Methods for the mortality experience
of heterogeous populations. Demography 18, 389–410.
Massey, D. S. and K. E. Espinosa (1997). What’s driving Mexico- U.S. migration? a theoret-
ical, empirical and policy analysis. American Journal of Sociology 102, 939–999.
Nekby, L. (2006). The emigration of immigrants, return, vs onward migration: Evidence from
Sweden. Journal of Population Economics 19, 197–226.
Nicolaas, H. and A. Sprangers (2004). Immigrants come and go. CBS Web Magazine 11
October 2004.
28

Nicolaas, H., A. Sprangers, A. Zorlu, and J. Hartog (2004). Migranten: Wie komen, wie gaan
terug en wie laten hun gezin overkomen? (Migrants: Who comes, who returns and who
will bring their family?). Bevolkingstrends 52(2), 36–42.
Reagan, P. B. and R. J. Olsen (2000). You can go home again: Evidence from longitudinal
data. Demography 37, 339–350.
Roodenburg, H., R. Euwals, and H. ter Rele (2003). Immigration and the Dutch Economy.
The Hague, The Netherlands: CPB Netherlands Bureau for Economic Policy.
Schmidt, P. and A. D. Witte (1989). Predicting criminal recidivism using ‘split population’
survival time models. Journal of Econometrics 40, 141–159.
Van den Berg, G. J. (2001). Duration models: Specification, identification, and multiple
duration. In J. Heckman and E. Leamer (Eds.), Handbook of Econometrics, Volume V,
Chapter 55, pp. 3381–3460. Amsterdam: North–Holland.
Van Ours, J. and J. Veenman (2005). The netherlands; old emigrants - young immigrant
country. In K. Zimmermann (Ed.), European Migration: What do we know?, pp. 173–196.
Oxford UP.
Zorlu, A. and J. Hartog (2001). Migration and immigrants: The case of The Netherlands.
Discussion paper 2001-042, Tinbergen Institute.
Zorlu, A., J. Hartog, A. Sprangers, and H. Nicolaas (2004). Retourmigratiegedrag van recente
immigranten (Return migration of recent immigrants). Economische Statistische Berichten
(ESB) August 20, 2004, 402–404.
A Likelihood function
In this appendix we present the full likelihood of the mover-stayer model with adjustment to
the data issues of left–censoring and left–truncation. We assume that the process of leaving
the host and returning back to the host are, apart from the indicator of repeated migration,
independent. Thus the parameters of these processes are estimated independently. The data
issues have, however, a different effect on the likelihood and we therefore present both the
likelihood of leaving the host and of returning to the host.
29

A mover-stayer model assumes that a latent group of individuals have a zero probability to
leave, the stayers, while the movers eventually leave according to their intensity to leave. With
probability p the individual is a stayer and with probability 1−p the individual is a mover. The
survival function of a mover-stayer model is
S(t|xi) =(
1 − p)
exp(
−
∫ t
0λ0(s)e
β′xi(s) ds)
+ p, (A.1)
We assume that the probability to be a stayer depends on observed characteristics of the migrants
through a logit form: p(zi) = exp(γ′zi)/(
1 + exp(γ′zi))
. A migrant may have multiple spells
(both in the host and abroad). Let khi be the number of spells in the host and ka
i the number
of spells abroad for individual i. Note that kai is equal to kh
i if the migrant is abroad by the end
of the observation period and is equal to khi − 1 if the migrant is in the host by the end of the
observation period. The end of the observation period induces right-censoring, but only for the
last spell. Let δij = 1 if the jth spell of individual i is censored and otherwise δij = 0. Without
the additional data issues the likelihood contribution of migrant i (both for leaving, m = h, and
returning, m = a) is
lmi =
kmi
∏
j=1
[
(
1 − p(zi))
λ0(tij)eβ′Xi(tij ) exp
(
−
∫ tij
0λ0(s)e
β′Xi(s) ds)
](1−δij)
×
[
(
1 − p(zi))
exp(
−
∫ tij
0λ0(s)e
β′Xi(s) ds)
+ p(zi)
]δij
(A.2)
In Section4.2 we discussed three data issues that lead to additional censoring and truncation.
We first focus on the implications for the model for leaving the host. The first data issue is that
some emigrations are recorded as an administrative removal. We assume that this implies left–
censoring. Then the contribution to the likelihood of a left-censored duration of length t is equal
to one minus the survival probability up to t months of this migrant.
The second and third data issue are both related to the observation of the migration motive.
The migration motive is unknown for immigrants that entered the country between January
1995 and December 1997 and left the country before January 1998. It is also unknown for the
immigrants that leave the country before the end of the year. These issues both imply that the
duration is only observed if the migrant is still in the host after either January 1998 or the end
30
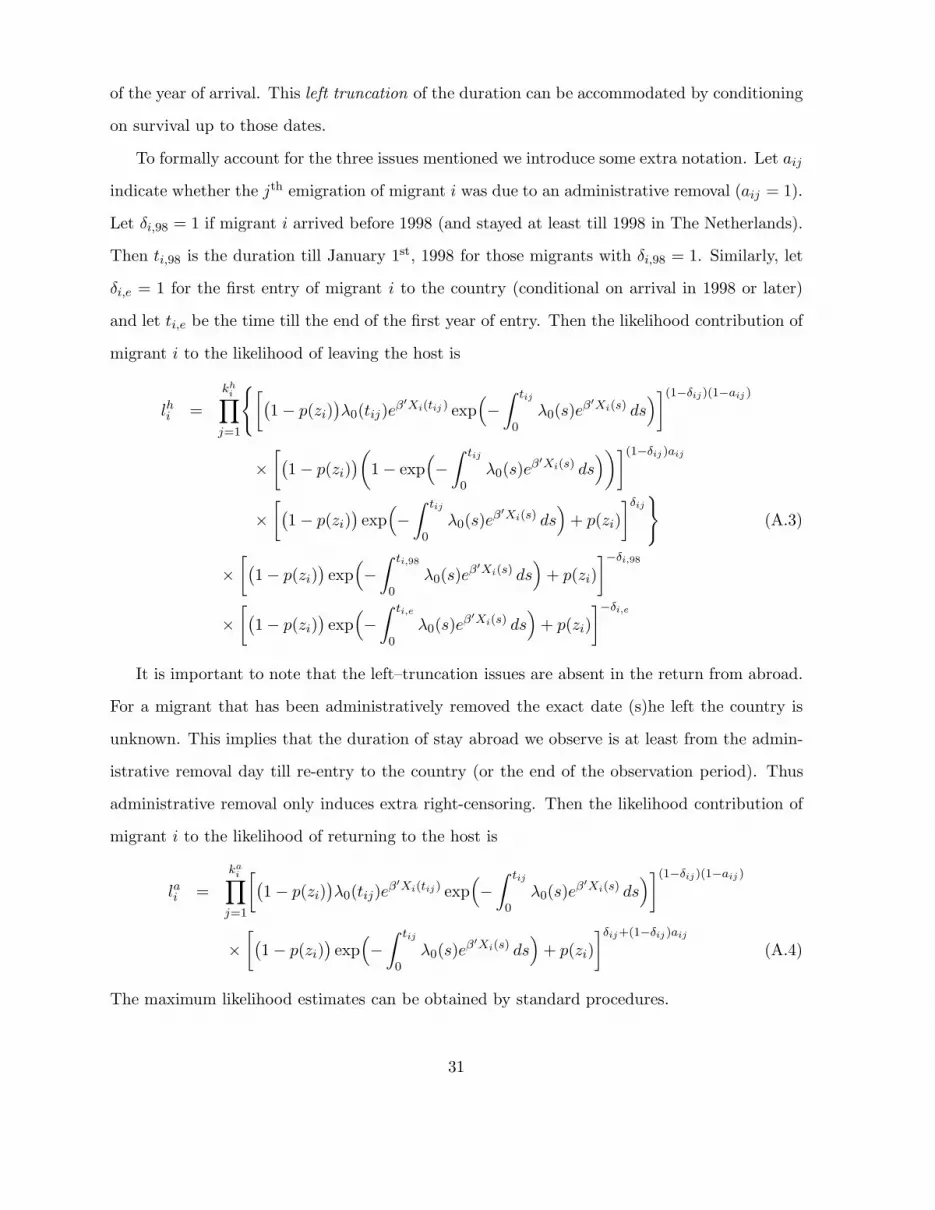
of the year of arrival. This left truncation of the duration can be accommodated by conditioning
on survival up to those dates.
To formally account for the three issues mentioned we introduce some extra notation. Let aij
indicate whether the jth emigration of migrant i was due to an administrative removal (aij = 1).
Let δi,98 = 1 if migrant i arrived before 1998 (and stayed at least till 1998 in The Netherlands).
Then ti,98 is the duration till January 1st, 1998 for those migrants with δi,98 = 1. Similarly, let
δi,e = 1 for the first entry of migrant i to the country (conditional on arrival in 1998 or later)
and let ti,e be the time till the end of the first year of entry. Then the likelihood contribution of
migrant i to the likelihood of leaving the host is
lhi =
khi
∏
j=1
{
[
(
1 − p(zi))
λ0(tij)eβ′Xi(tij ) exp
(
−
∫ tij
0λ0(s)e
β′Xi(s) ds)
](1−δij)(1−aij )
×
[
(
1 − p(zi))
(
1 − exp(
−
∫ tij
0λ0(s)e
β′Xi(s) ds)
)](1−δij )aij
×
[
(
1 − p(zi))
exp(
−
∫ tij
0λ0(s)e
β′Xi(s) ds)
+ p(zi)
]δij
}
(A.3)
×
[
(
1 − p(zi))
exp(
−
∫ ti,98
0λ0(s)e
β′Xi(s) ds)
+ p(zi)
]
−δi,98
×
[
(
1 − p(zi))
exp(
−
∫ ti,e
0λ0(s)e
β′Xi(s) ds)
+ p(zi)
]
−δi,e
It is important to note that the left–truncation issues are absent in the return from abroad.
For a migrant that has been administratively removed the exact date (s)he left the country is
unknown. This implies that the duration of stay abroad we observe is at least from the admin-
istrative removal day till re-entry to the country (or the end of the observation period). Thus
administrative removal only induces extra right-censoring. Then the likelihood contribution of
migrant i to the likelihood of returning to the host is
lai =
kai
∏
j=1
[
(
1 − p(zi))
λ0(tij)eβ′Xi(tij) exp
(
−
∫ tij
0λ0(s)e
β′Xi(s) ds)
](1−δij)(1−aij )
×
[
(
1 − p(zi))
exp(
−
∫ tij
0λ0(s)e
β′Xi(s) ds)
+ p(zi)
]δij+(1−δij )aij
(A.4)
The maximum likelihood estimates can be obtained by standard procedures.
31

Abbring (2002) shows that if none of the movers defect, i.e. limt→∞
∫ t
0 λ0(s) ds = ∞, then
the proportion of stayers and all the parameters of the mover-intensity are identified even if
both the stayer probability and the mover–intensity depend on the same set of covariates.
B Tables and Figures
Table 1: Basic statistics immigrants
Labour fam. reunification fam. formation Study
average age 32 30 29 21female 30.6% 71.2% 69.0% 46.6%married 12.4% 42.5% 41.7% 2.1%
Country of originEurope
Belgium 5.3% 1.4% 0.7% 1.5%Germany 11.3% 3.8% 2.1% 8.6%UK 18.0% 3.8% 1.2% 1.5%France 5.6% 1.2% 0.7% 2.6%EU15/EFTA 22.2% 5.1% 2.6% 12.9%Former Yugo. 0.6% 3.8% 2.5% 1.3%new EU 3.7% 2.9% 5.3% 5.3%rest of Europe 4.1% 4.8% 5.9% 6.3%
AsiaTurkey 1.8% 12.9% 17.6% 1.4%China 1.2% 2.0% 2.0% 11.6%Iraq < 0.1% 7.3% 0.5% < 0.1%Iran 0.3% 2.1% 0.8% 0.7%Afghanistan < 0.1% 3.5% 0.4% < 0.1%rest of Asia 8.9% 11.2% 14.0% 19.1%
AfricaMorocco 1.0% 11.9% 16.4% 3.7%rest of Africa 5.1% 10.4% 10.0% 11.1%
AmericaUSA/Can 7.1% 3.4% 3.6% 4.2%Surinam 0.3% 3.4% 6.1% 2.4%Latin America 2.0% 4.5% 6.8% 5.3%
AustralasiaAustralasia 1.6% 0.8% 0.9% 0.6%
# observations 104917 36702 116100 40677
Source: Statistics Netherlands, based on own calculations.
32

Table 2: Basic duration statistics immigrants
Labour fam. reunification fam. formation Study
% > 5 years in NL 20% 45% 39% 16%duration of stay (mos) 35 58 45 29return migration 44% 20% 13% 45%
Abroadduration of stay (mos) 29 32 27 31re-immigrationa 6% 9% 14% 6%
Repeated migration2nd return migrationb 33% 26% 19% 33%
Source: Statistics Netherlands, based on own calculations.a Percentage of those that have left the country.b Percentage of those that have left the country and have returned.
33

Table 3: Parameter estimates of the baseline intensity intensity to leave.
model 1 model 2 model 3labor family reunion family formation study
α1 (0 − 6) mos. 2.395∗∗ 1.215∗∗ 1.141∗∗ 1.977∗∗ 2.011∗∗ 1.010∗∗
(0.039) (0.049) (0.071) (0.136) (0.086) (0.174)α2 (6 − 12) mos. 2.016∗∗ 0.658∗∗ 0.570∗∗ 1.339∗∗ 1.275∗∗ 0.552∗∗
(0.036) (0.046) (0.066) (0.118) (0.082) (0.171)α3 (12 − 18) mos. 1.251∗∗ −0.066 −0.307∗∗ 0.661∗∗ 0.538∗∗ 0.130
(0.039) (0.048) (0.068) (0.121) (0.086) (0.170)α4 (18 − 24) mos. 1.220∗∗ −0.004 −0.188∗∗ 0.693∗∗ 0.400∗∗ 0.249
(0.039) (0.047) (0.067) (0.116) (0.087) (0.167)α5 (24 − 30) mos. 0.964∗∗ −0.130∗∗ −0.213∗∗ 0.643∗∗ 0.282∗∗ −0.214
(0.042) (0.048) (0.068) (0.114) (0.088) (0.169)α6 (30 − 36) mos. 0.860∗∗ −0.159∗∗ −0.183∗∗ 0.366∗∗ 0.024 −0.095
(0.044) (0.048) (0.068) (0.119) (0.093) (0.168)α7 (36 − 42) mos. 0.565∗∗ −0.280∗∗ −0.220∗∗ 0.171 −0.276∗ −0.353∗
(0.048) (0.053) (0.074) (0.134) (0.114) (0.179)α8 (42 − 48) mos. 0.476∗∗ −0.248∗∗ −0.208∗∗ 0.216 −0.172 −0.329
(0.051) (0.056) (0.077) (0.137) (0.116) (0.185)α9 (48 − 54) mos. 0.430∗∗ −0.130∗ −0.026 0.122 −0.097 −0.281
(0.054) (0.058) (0.079) (0.147) (0.120) (0.193)α10 (54 − 60) mos. 0.204∗∗ −0.191∗∗ −0.190∗ 0.119 −0.095 −0.124
(0.061) (0.064) (0.091) (0.154) (0.128) (0.199)
fam. reunion −0.448∗∗ 0.097∗ - −1.310∗∗ - -(0.029) (0.038) (0.180)
fam. formation −0.848∗∗ 0.161∗∗ - - −0.641∗∗ -(0.023) (0.033) (0.127)
study 0.317∗∗ 0.198∗∗ - - - 0.354∗
(0.020) (0.030) (0.177)intercept −5.131∗∗ −2.871∗∗ −2.761∗∗ - - -
(0.037) (0.054) (0.071)
Source: Statistics Netherlands, based on own calculations. Notes: Standard errors are shown in parentheses. ∗p <
0.05;∗∗ p < 0.01.
34

Table 3: (continued) Covariate effects on the intensity to leave
model 1 model 2 model 3(compared to base)
base family reunion family formation studyfemale −0.223∗∗ −0.369∗∗ −0.224∗∗ 0.364∗∗ −0.134∗ −0.030
(0.015) (0.025) (0.037) (0.116) (0.053) (0.057)married −0.160∗∗ −0.289∗∗ −0.510∗∗ 0.265∗∗ 0.486∗∗ −0.027
(0.021) (0.027) (0.042) (0.092) (0.056) (0.145)agea 0.099∗∗ −0.155∗∗ −0.078∗∗ 0.049 0.147∗∗ 0.166∗∗
(0.012) (0.018) (0.020) (0.089) (0.042) (0.063)age-squareda −0.021∗∗ 0.042∗∗ 0.025∗ −0.002 −0.028 −0.085∗
(0.007) (0.010) (0.013) (0.038) (0.022) (0.039)Repeated Migrationrepeat migrationb −0.330∗∗ −1.169∗∗ −1.109∗∗ - - -
(0.103) (0.138) (0.142)t−1
c −0.287∗ −0.198 −0.213 - - -(0.112) (0.155) (0.160)
t2−1
0.040 0.089∗∗ 0.090∗∗ - - -(0.022) (0.031) (0.032)
(selected) country of originGermany −0.194∗∗ −0.279∗∗ −0.159∗∗ −0.187 −0.179 −0.400∗∗
(0.029) (0.050) (0.060) (0.183) (0.176) (0.103)UK −0.009 0.259∗∗ 0.306∗∗ −0.195 −0.071 −0.173
(0.027) (0.040) (0.045) (0.148) (0.130) (0.119)new EU members −0.289∗∗ 0.110∗ 0.444∗∗ −1.494∗∗ −1.822∗∗ −0.673∗∗
(0.038) (0.056) (0.072) (0.252) (0.171) (0.123)rest of Europe −0.709∗∗ −0.072 −0.256∗∗ −0.992∗∗ 0.597∗∗ −0.005
(0.040) (0.062) (0.092) (0.244) (0.130) (0.143)Turkey −1.123∗∗ 0.368∗∗ 0.157 −1.799∗∗ 0.789∗∗ −0.470∗
(0.046) (0.057) (0.110) (0.219) (0.137) (0.229)China −0.837∗∗ 0.024 0.062 −1.335∗∗ 0.390 −0.746∗
(0.050) (0.082) (0.118) (0.428) (0.202) (0.328)rest of Asia −0.146∗∗ −0.257∗∗ −0.333∗∗ −0.424∗∗ −1.175∗∗ −0.396∗∗
(0.026) (0.041) (0.053) (0.154) (0.106) (0.113)Morocco −1.186∗∗ 0.811∗∗ 0.509∗∗ −2.753∗∗ 0.681∗∗ 0.176
(0.047) (0.052) (0.109) (0.211) (0.123) (0.128)rest of Africa −0.378∗∗ 0.084 0.269∗∗ 0.290 0.400∗∗ −0.650∗∗
(0.031) (0.046) (0.069) (0.152) (0.099) (0.096)USA/Can 0.305∗∗ 0.020 0.042 0.187 −0.323∗ 0.313∗∗
(0.029) (0.048) (0.056) (0.140) (0.130) (0.105)Log-likelihood −85831.358 −83410.756 −83081.194
a Centered at the average age of 25 years and divided by 10.b Indicator of repetitive entry.c years spent in The Netherlands during previous stay.
Source: Statistics Netherlands, based on own calculations. Notes: Standard errors are shown in parentheses. ∗p <
0.05;∗∗ p < 0.01. Base migration motive is labor
35

Table 3: (continued)Parameter estimates for probability to stay in the Netherlands
model 2 model 3female 0.382∗∗ 0.379∗∗
(0.024) (0.025)married 0.251∗∗ 0.187∗∗
(0.029) (0.033)agea −0.133∗∗ −0.142∗∗
(0.017) (0.018)age-squareda 0.027∗ 0.036∗∗
(0.011) (0.011)fam. reunion 0.579∗∗ 0.282∗∗
(0.040) (0.064)fam. formation 1.055∗∗ 0.682∗∗
(0.032) (0.043)study −0.449∗∗ −0.405∗∗
(0.033) (0.043)
(selected) country of originGermany 0.242∗∗ 0.276∗∗
(0.048) (0.046)UK −0.059 −0.084
(0.045) (0.046)new EU members 0.457∗∗ 0.231∗∗
(0.056) (0.077)rest of Europe 0.957∗∗ 0.921∗∗
(0.055) (0.060)Turkey 1.152∗∗ 1.068∗∗
(0.066) (0.075)China 1.236∗∗ 1.168∗∗
(0.069) (0.116)rest of Asia 0.226∗∗ −0.121
(0.040) (0.073)Morocco 0.802∗∗ 0.529∗∗
(0.076) (0.088)rest of Africa 0.509∗∗ 0.481∗∗
(0.047) (0.051)USA/Can −0.583∗∗ −0.533∗∗
(0.052) (0.054)
Constant −1.124∗∗ −1.086∗∗
(0.031) (0.032)a Centered at the average age of 25 years and divided by
10. Source: Statistics Netherlands, based on own cal-culations. Notes: Standard errors are shown in paren-theses. ∗
p < 0.05;∗∗ p < 0.01.
36

Table 4: Parameter estimates of intensity to return to The Netherlands
model 1 model 2 model 3labor family reunion family formation study
α1 (0 − 6) mos. 1.069∗∗ 0.913∗∗ 0.813∗∗ 1.035∗∗ 1.086∗∗ 0.636∗∗
(0.033) (0.041) (0.054) (0.119) (0.070) (0.130)α2 (6 − 12) mos. 0.839∗∗ 0.719∗∗ 0.683∗∗ 0.879∗∗ 0.868∗∗ 0.374∗∗
(0.036) (0.041) (0.057) (0.120) (0.072) (0.124)α3 (12 − 18) mos. 0.581∗∗ 0.487∗∗ 0.516∗∗ 0.579∗∗ 0.543∗∗ 0.190
(0.041) (0.043) (0.061) (0.131) (0.080) (0.126)α4 (18 − 24) mos. 0.440∗∗ 0.371∗∗ 0.388∗∗ 0.362∗ 0.405∗∗ 0.224
(0.045) (0.047) (0.068) (0.146) (0.087) (0.125)intercept −5.817∗∗ −5.106∗∗ −5.192∗∗ - - -
(0.048) (0.195) (0.211)fam. reunion 0.264∗∗ 1.039∗∗ - 1.480∗∗ - -
(0.046) (0.146) (0.266)fam. formation 0.522∗∗ 0.836∗∗ - - 0.386∗ -
(0.036) (0.087) (0.160)study −0.325∗∗ 1.455∗∗ - - - 2.123∗∗
(0.038) (0.152) (0.251)
base family reunion family formation study(compared to base)
female 0.011 −0.092 −0.011 −0.851∗∗ −0.181∗ −0.633∗∗
(0.027) (0.056) (0.076) (0.153) (0.081) (0.176)married 0.414∗∗ 0.113 0.253∗∗ - - -
(0.032) (0.095) (0.084)agea −0.283∗∗ −0.258∗∗ −0.254∗∗ - - -
(0.019) (0.034) (0.027)age-squareda 0.071∗∗ 0.076∗∗ 0.067∗∗ - - -
(0.012) (0.023) (0.017)
Repeated Migrationrepeat migrationb 0.162∗ 0.310∗∗ 0.295∗∗ - - -
(0.069) (0.077) (0.074)t−1
c −0.751∗∗ −0.804∗∗ −0.797∗∗ - - -(0.027) (0.028) (0.028)
t2−1 0.079∗∗ 0.085∗∗ 0.083∗∗ - - -
(0.005) (0.005) (0.005)
Log-likelihood −45287.21 −45145.03 −45055.75a Centered at the average age of 25 years and divided by 10.b Indicator of repetitive entry.c years spent in The Netherlands during previous stay.
Source: Statistics Netherlands, based on own calculations. Notes: Standard errors are shown in parentheses. ∗p < 0.05;∗∗ p <
0.01. Base country of origin is EU/EFTA. Base migration motive is labor.
37

Table 4: (continued) Covariate effects on the intensity to return to the Netherlands
model 1 model 2 model 3(compared to base)
base family reunion family formation study(selected) country of origin
Germany 0.125∗ −0.213∗ −0.128 - - -(0.052) (0.108) (0.094)
UK −0.023 −0.106 −0.252 −0.814∗∗ −0.445∗ −0.775(0.051) (0.115) (0.134) (0.271) (0.208) (0.540)
new EU members 0.436∗∗ 0.136 0.029 0.083 0.566∗∗ 0.012(0.057) (0.111) (0.118) (0.270) (0.124) (0.258)
rest of Europe 0.475∗∗ 0.036 0.205 - - -(0.061) (0.121) (0.106)
Turkey 0.112 −0.471∗∗ −0.173 - - -(0.070) (0.145) (0.132)
China 0.275∗∗ −0.235 −0.256 −0.147 0.571∗ 0.553(0.092) (0.186) (0.223) (0.401) (0.275) (0.343)
rest of Asia 0.051 −0.474∗∗ −0.556∗∗ 0.067 0.635∗∗ 0.563∗∗
(0.047) (0.121) (0.115) (0.154) (0.105) (0.178)Morocco 0.321∗∗ −0.232 0.007 - - -
(0.066) (0.130) (0.122)rest of Africa 0.204∗∗ −0.121 −0.019 - - -
(0.053) (0.109) (0.090)USA/Can −0.470∗∗ −0.812∗∗ −0.676∗∗ - - -
(0.064) (0.130) (0.111)
Source: Statistics Netherlands, based on own calculations. Notes: Standard errors are shown in parentheses.∗p < 0.05;∗∗ p < 0.01. Base country of origin is EU/EFTA. Base migration motive is labor
38

Table 4: (continued)Parameter estimates for probability to stay abroad
model 2 model 3female −0.208 −0.689∗∗
(0.110) (0.172)married −1.281∗∗ −1.038∗∗
(0.264) (0.186)agea 0.162∗ 0.205∗∗
(0.073) (0.062)age-squareda −0.017 −0.049
(0.059) (0.048)fam. reunion 2.025∗∗ 2.205∗∗
(0.445) (0.605)fam. formation 0.787∗ −0.464
(0.340) (0.999)study 3.091∗∗ 3.456∗∗
(0.487) (0.629)
(selected) country of originGermany −0.811∗∗ −0.689∗∗
(0.182) (0.165)UK −0.028 −1.218
(0.271) (0.631)new EU members −0.749∗∗ −0.606∗
(0.184) (0.248)rest of Europe −1.128∗∗ −0.931∗∗
(0.210) (0.184)Turkey −1.671∗∗ −1.002∗∗
(0.338) (0.292)China −1.041∗∗ −0.566∗
(0.278) (0.287)rest of Asia −1.236∗∗ −0.791∗∗
(0.177) (0.175)Morocco −1.513∗∗ −1.291∗∗
(0.275) (0.211)rest of Africa −0.753∗∗ −0.646∗∗
(0.173) (0.153)USA/Can −0.757∗∗ −0.537∗
(0.259) (0.238)
Constant −0.649 −0.733(0.518) (0.614)
a Centered at the average age of 25 years and divided by10. Source:Statistics Netherlands, based on own calcu-lations. Notes: Standard errors are shown in parenthe-ses. ∗
p < 0.05;∗∗ p < 0.01.
39

Table 5: Implied stayer probabilities
labor family reunion family formation studyIn the Netherlands
reference migrant1 24% 68% 73% 19%
male 60% 65%female 32% 26%married 28% 77% 23%single 64%
(selected) Country of originEU152 43% 48%Germany 30% 49% 55% 24%UK 23% 41% 46% 18%new EU members 29% 48% 54% 23%rest of Europe 44% 65% 70% 38%Turkey 48% 41%China 51% 70% 75% 44%rest of Asia 22% 40% 45% 18%Morocco 35% 56% 61% 29%rest of Africa 34% 55% 60% 28%USA/Canada 16% 30% 35% 12%
Abroad
reference migrant1 34% 24% 6% 93%
male 38% 11%female 21% 87%married 16% 2% 83%single 47%
Country of originEU152 46% 14%Germany 21% 30% 8% 87%UK 13% 20% 5 % 80%new EU members 22% 32% 8% 88%rest of Europe 17% 25% 6% 84%Turkey 16% 84%China 23% 32% 8% 89%rest of Asia 19% 28% 7% 86%Morocco 13% 19% 4 % 79%rest of Africa 22% 31% 8% 88%USA/Canada 23% 33% 9% 89%
Source: Statistics Netherlands, based on own calculations.1 Labor: male from EU15 or EFTA (excl. Belgium, Germany, UK and France) unmarried
30 years, Family reunion: female married from Turkey 30 years, Family formation:female unmarried from Turkey 29 years, Study: male EU15 or EFTA (excl. Belgium,Germany, UK and France) unmarried 21 years.
2 EU15 or EFTA (excl. Belgium, Germany, UK and France).
40

Table 6: Long-run probability to reside in The Netherlands
labor family reunion family formation studyreference migrant1 48% 90% 98% 21%
male 80% 95%female 69% 29%married 71% 99% 26%single 79%
Country of originEU152 62% 87%Germany 67% 77% 94% 27%UK 69% 77% 95% 22%new EU members 64% 75% 94% 26%rest of Europe 82% 88% 97% 42%Turkey 85% 46%China 82% 88% 97% 47%rest of Asia 60% 70% 92% 20%Morocco 81% 87% 97% 34%rest of Africa 71% 80% 95% 31%USA/Canada 44% 57% 86% 14%
Source: Statistics Netherlands, based on own calculations.1 Labor: male from EU15 or EFTA (excl. Belgium, Germany, UK and France)
unmarried 30 years, Family reunion: female married from Turkey 30 years, Familyformation: female unmarried from Turkey 29 years, Study: male EU15 or EFTA(excl. Belgium, Germany, UK and France) unmarried 21 years.
2 EU15 or EFTA (excl. Belgium, Germany, UK and France).
41

26%
23%
17%
10%
10%
6%
7%
family formation
labor
asylum
unknown migration motive
study
family reunion
other migration motives
Figure 1: Non-Dutch immigrants (18-64) by migration motive, 1995-2003
0
2,000
4,000
6,000
8,000
10,000
12,000
14,000
16,000
18,000
20,000
1997 1998 1999 2000 2001 2002 2003
Year of arrival
Nu
mb
er o
f ar
riva
ls
family formation labor asylum study family reunion other migration motives
Figure 2: Development of Non-Dutch immigrants (18-64) by migration motive, 1995-2003
42

0.00
0.02
0.04
0.06
0.08
0.10
0.12
0.14
0.16
0.18
0.20
0 6 12 18 24 30 36 42 48 54 60 66 72
Months in NL
labor (m1)
familiy reunion (m1)
family formation (m1)
study (m1)
labor (m2)
familiy reunion (m2)
family formation (m2)
study (m2)
Figure 3: Baseline intensity to leave The Netherlands (unconditional)m1: Model1; m2: unconditional baseline intensity to leave model 2
0.00
0.05
0.10
0.15
0.20
0.25
0.30
0 6 12 18 24 30 36 42 48 54 60 66 72
Months in NL
labor
familiy reunion
family formation
study
Figure 4: Baseline intensity to leave The Netherlands, movers
43

0.000
0.002
0.004
0.006
0.008
0.010
0.012
0.014
0.016
0.018
0 6 12 18 24 30
Months abroad
labor (m1)
familiy reunion (m1)
family formation (m1)
study (m1)
labor (m2)
familiy reunion (m2)
family formation (m2)
study (m2)
Figure 5: Baseline intensity to return form abroad to The Netherlands (unconditional)m1: Model1; m2: unconditional baseline intensity to return model 2
0.00
0.01
0.02
0.03
0.04
0.05
0.06
0.07
0.08
0.09
0.10
0 6 12 18 24 30
Months abroad
labor
familiy reunion
family formation
study
Figure 6: Baseline intensity to return form abroad to The Netherlands, movers
44

0
0.1
0.2
0.3
0.4
0.5
0.6
0.7
0.8
0.9
1
0 1 2 3 4 5 6 7 8 9 10 11 12 13 14 15 16 17 18 19 20 21 22 23 24 25
years since first entry
Labor
Family reunion
Family formation
Study
Figure 7: Simulated migration dynamics for a cohort of a typical immigrant.Labor: male EU/EFTA unmarried 30 years, Family reunion: female married Turkey 30 years,Family formation: female unmarried Turkey 29 years, Study: male EU/EFTA unmarried 21years
45