attitudes eng
TRANSCRIPT
Attitudes and Habits Regarding
Healthcare
Public Study Daedalus Consulting
Date: April 2007
2DATI – Healthcare – April07
Methodology
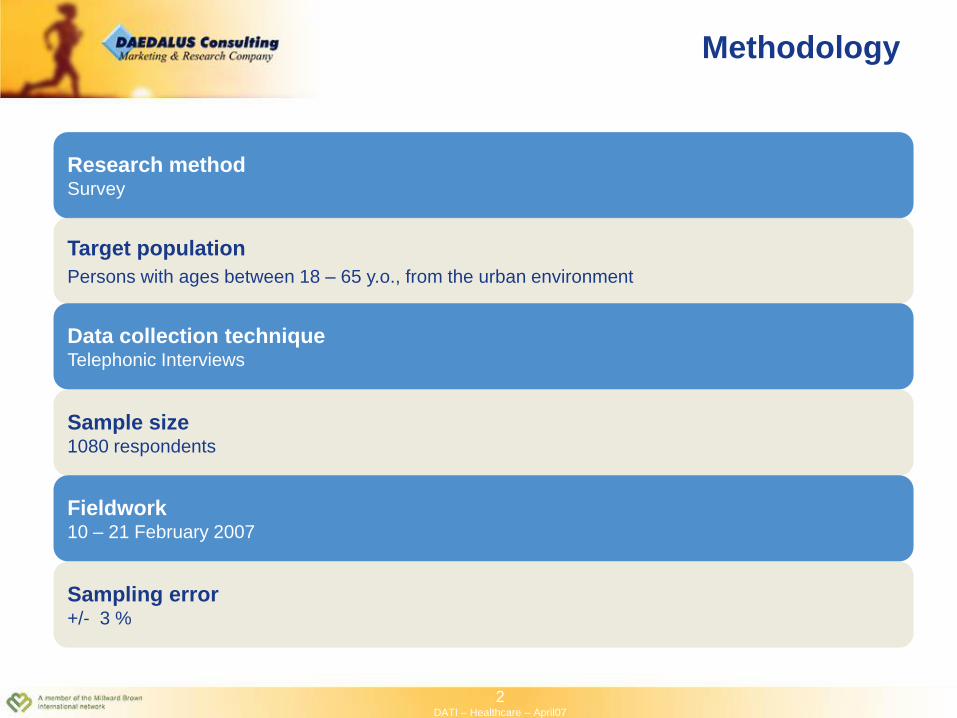
Research methodSurvey
Target population
Persons with ages between 18 – 65 y.o., from the urban environment
Sample size1080 respondents
Data collection techniqueTelephonic Interviews
Fieldwork10 – 21 February 2007
Sampling error+/- 3 %
3DATI – Healthcare – April07
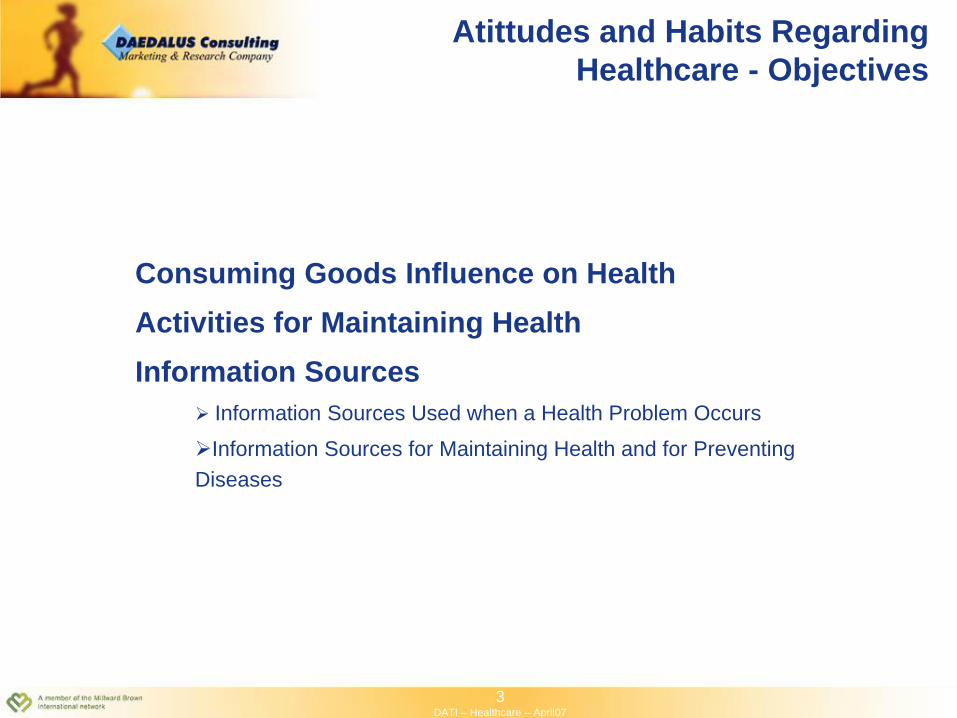
Consuming Goods Influence on Health
Activities for Maintaining Health
Information Sources
Information Sources Used when a Health Problem Occurs
Information Sources for Maintaining Health and for Preventing
Diseases
Atittudes and Habits Regarding
Healthcare - Objectives
4DATI – Healthcare – April07
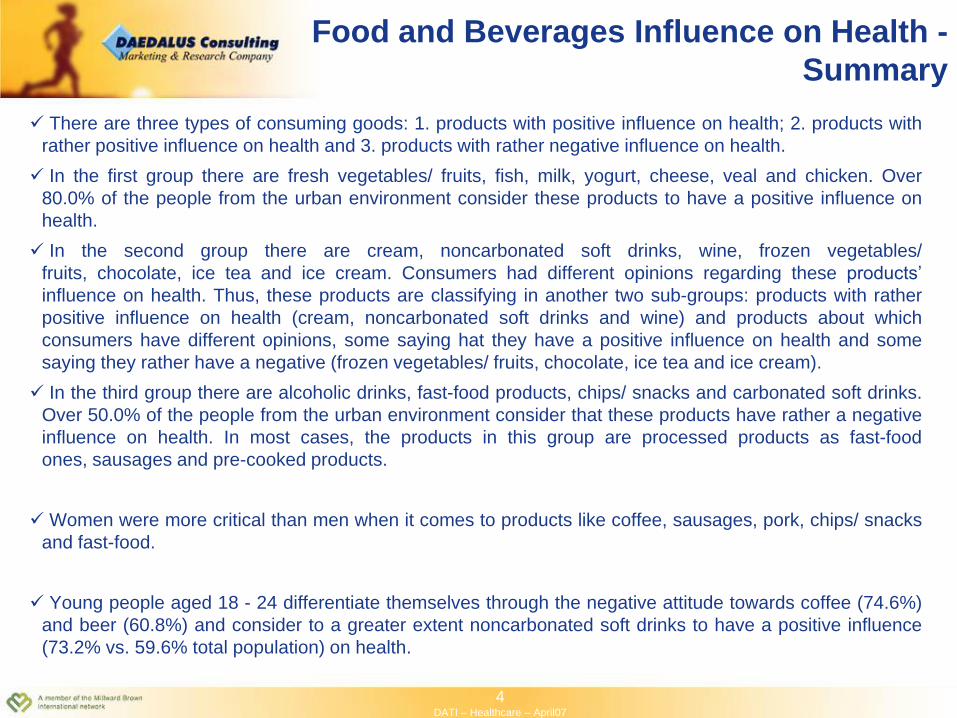
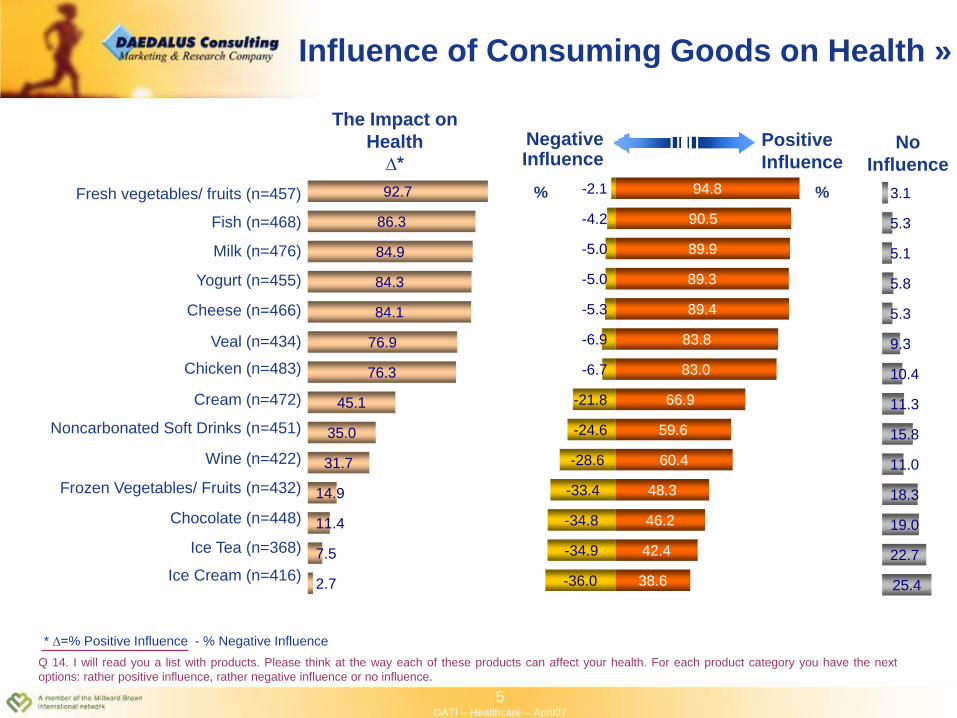
There are three types of consuming goods: 1. products with positive influence on health; 2. products with
rather positive influence on health and 3. products with rather negative influence on health.
In the first group there are fresh vegetables/ fruits, fish, milk, yogurt, cheese, veal and chicken. Over
80.0% of the people from the urban environment consider these products to have a positive influence on
health.
In the second group there are cream, noncarbonated soft drinks, wine, frozen vegetables/
fruits, chocolate, ice tea and ice cream. Consumers had different opinions regarding these products’
influence on health. Thus, these products are classifying in another two sub-groups: products with rather
positive influence on health (cream, noncarbonated soft drinks and wine) and products about which
consumers have different opinions, some saying hat they have a positive influence on health and some
saying they rather have a negative (frozen vegetables/ fruits, chocolate, ice tea and ice cream).
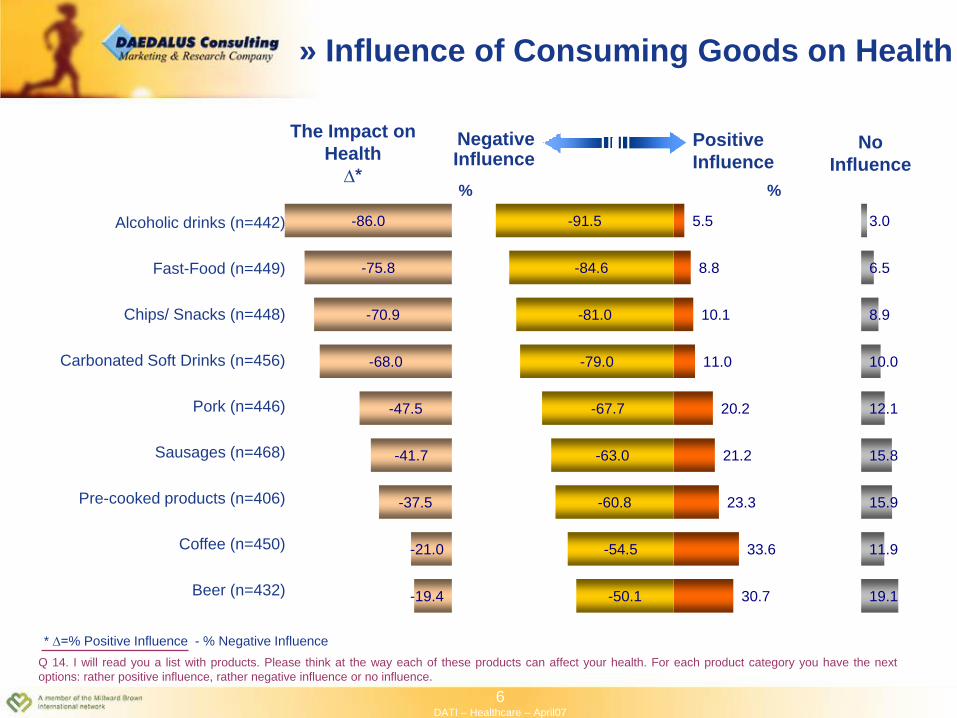
In the third group there are alcoholic drinks, fast-food products, chips/ snacks and carbonated soft drinks.
Over 50.0% of the people from the urban environment consider that these products have rather a negative
influence on health. In most cases, the products in this group are processed products as fast-food
ones, sausages and pre-cooked products.
Women were more critical than men when it comes to products like coffee, sausages, pork, chips/ snacks
and fast-food.
Young people aged 18 - 24 differentiate themselves through the negative attitude towards coffee (74.6%)
and beer (60.8%) and consider to a greater extent noncarbonated soft drinks to have a positive influence
(73.2% vs. 59.6% total population) on health.
Food and Beverages Influence on Health -
Summary
5DATI – Healthcare – April07
94.8
90.5
89.9
89.3
89.4
83.8
83.0
66.9
59.6
60.4
48.3
46.2
42.4
38.6
-2.1
-4.2
-5.0
-5.0
-5.3
-6.9
-6.7
-21.8
-24.6
-28.6
-33.4
-34.8
-34.9
-36.0
3.1
5.3
5.1
5.8
5.3
9.3
10.4
11.3
15.8
11.0
18.3
19.0
22.7
25.4
92.7
86.3
84.9
84.3
84.1
76.9
76.3
45.1
35.0
31.7
14.9
11.4
7.5
2.7
The Impact on
Health
∆*
Q 14. I will read you a list with products. Please think at the way each of these products can affect your health. For each product category you have the next
options: rather positive influence, rather negative influence or no influence.
%
* ∆=% Positive Influence - % Negative Influence
No
Influence
NegativeInfluence
Positive
Influence
Cheese (n=466)
Chicken (n=483)
Veal (n=434)
Yogurt (n=455)
Milk (n=476)
Cream (n=472)
Fresh vegetables/ fruits (n=457)
Frozen Vegetables/ Fruits (n=432)
Fish (n=468)
Wine (n=422)
Ice Tea (n=368)
Ice Cream (n=416)
Chocolate (n=448)
Noncarbonated Soft Drinks (n=451)
Influence of Consuming Goods on Health »
%
6DATI – Healthcare – April07
3.0
6.5
8.9
10.0
12.1
15.8
15.9
11.9
19.1
-86.0
-75.8
-70.9
-68.0
-47.5
-41.7
-37.5
-21.0
-19.4
5.5
8.8
10.1
11.0
20.2
21.2
23.3
33.6
30.7
-91.5
-84.6
-81.0
-79.0
-67.7
-63.0
-60.8
-54.5
-50.1
%
Coffee (n=450)
Beer (n=432)
Pre-cooked products (n=406)
Sausages (n=468)
Carbonated Soft Drinks (n=456)
Pork (n=446)
Chips/ Snacks (n=448)
Fast-Food (n=449)
Alcoholic drinks (n=442)
» Influence of Consuming Goods on Health
%
Q 14. I will read you a list with products. Please think at the way each of these products can affect your health. For each product category you have the next
options: rather positive influence, rather negative influence or no influence.
* ∆=% Positive Influence - % Negative Influence
The Impact on
Health
∆*
NegativeInfluence
Positive
InfluenceNo
Influence
7DATI – Healthcare – April07
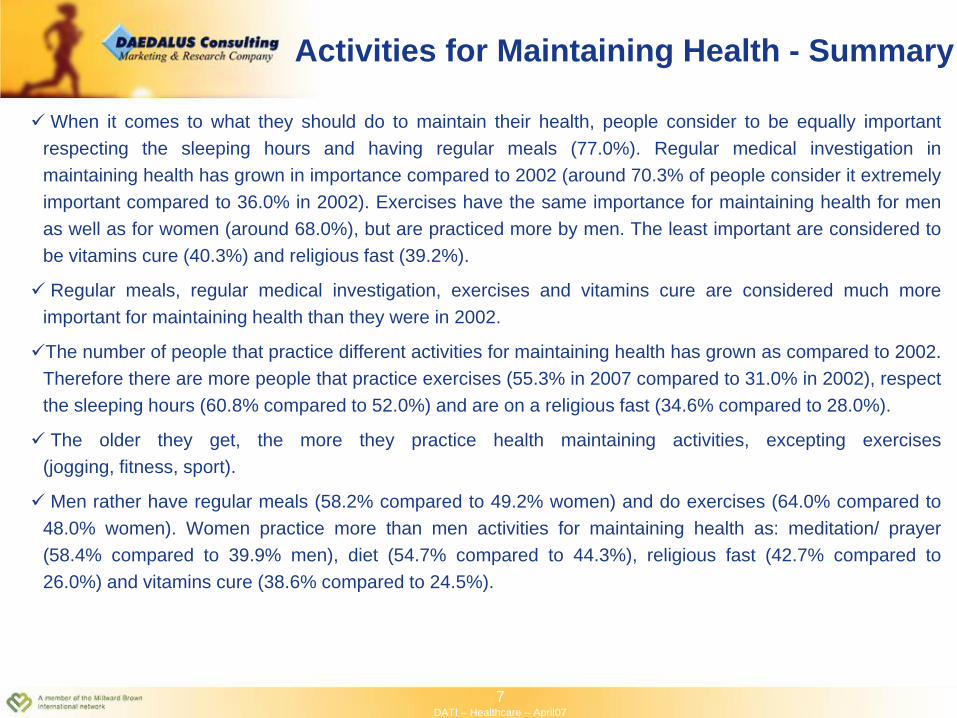
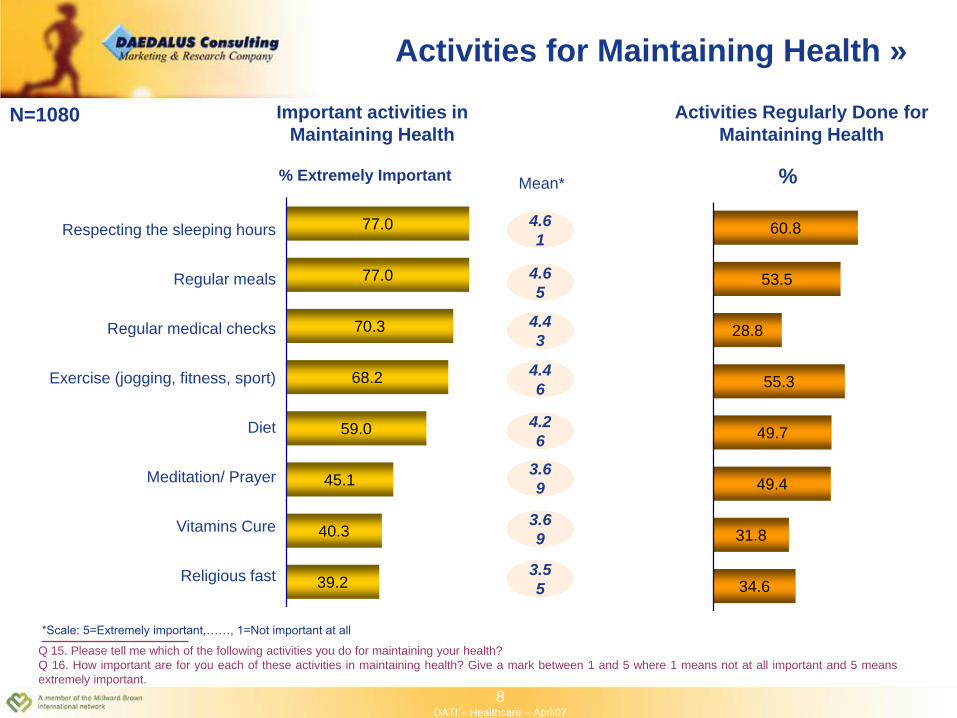
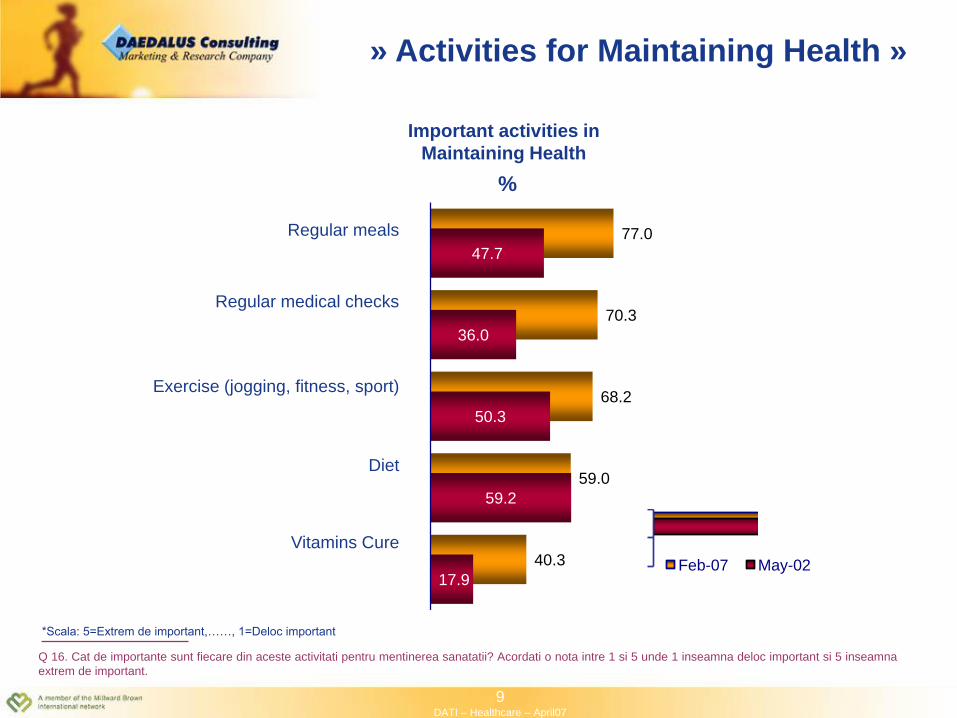
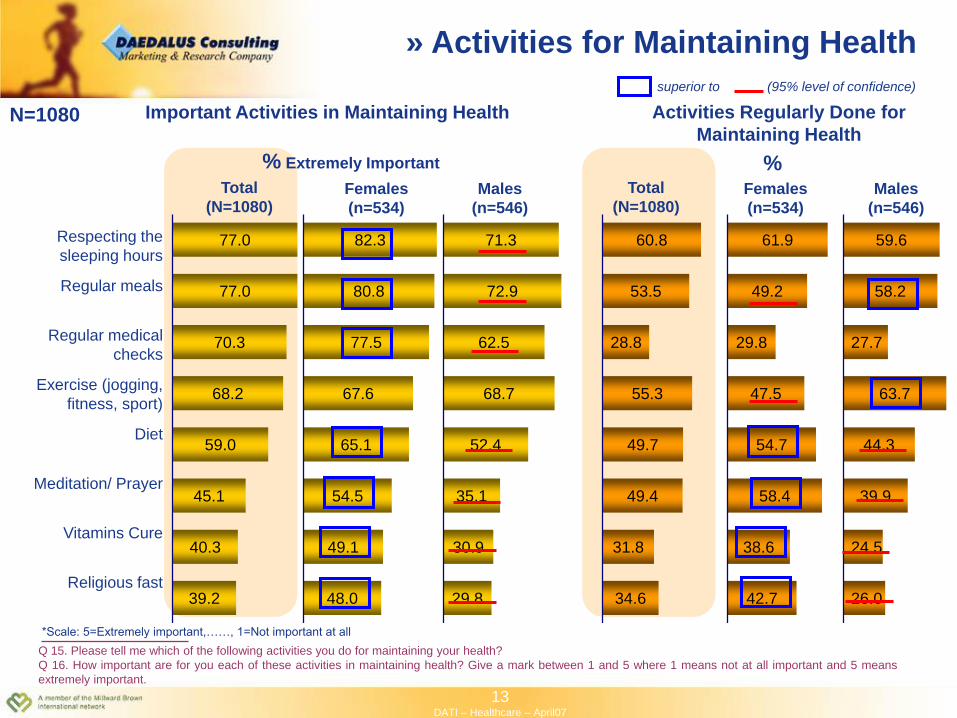
When it comes to what they should do to maintain their health, people consider to be equally important
respecting the sleeping hours and having regular meals (77.0%). Regular medical investigation in
maintaining health has grown in importance compared to 2002 (around 70.3% of people consider it extremely
important compared to 36.0% in 2002). Exercises have the same importance for maintaining health for men
as well as for women (around 68.0%), but are practiced more by men. The least important are considered to
be vitamins cure (40.3%) and religious fast (39.2%).
Regular meals, regular medical investigation, exercises and vitamins cure are considered much more
important for maintaining health than they were in 2002.
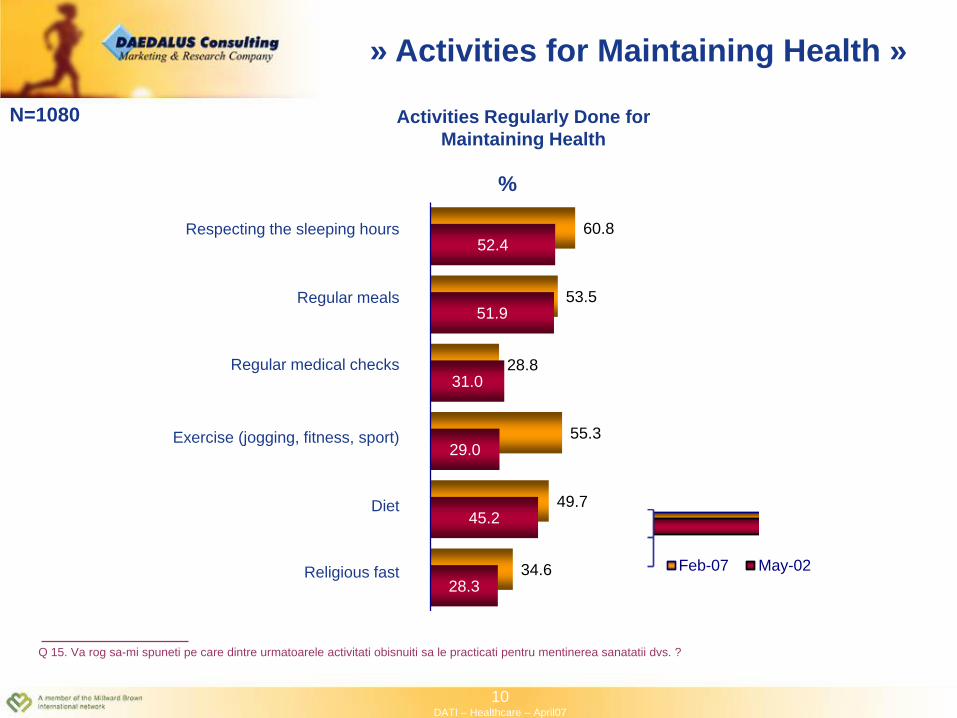
The number of people that practice different activities for maintaining health has grown as compared to 2002.
Therefore there are more people that practice exercises (55.3% in 2007 compared to 31.0% in 2002), respect
the sleeping hours (60.8% compared to 52.0%) and are on a religious fast (34.6% compared to 28.0%).
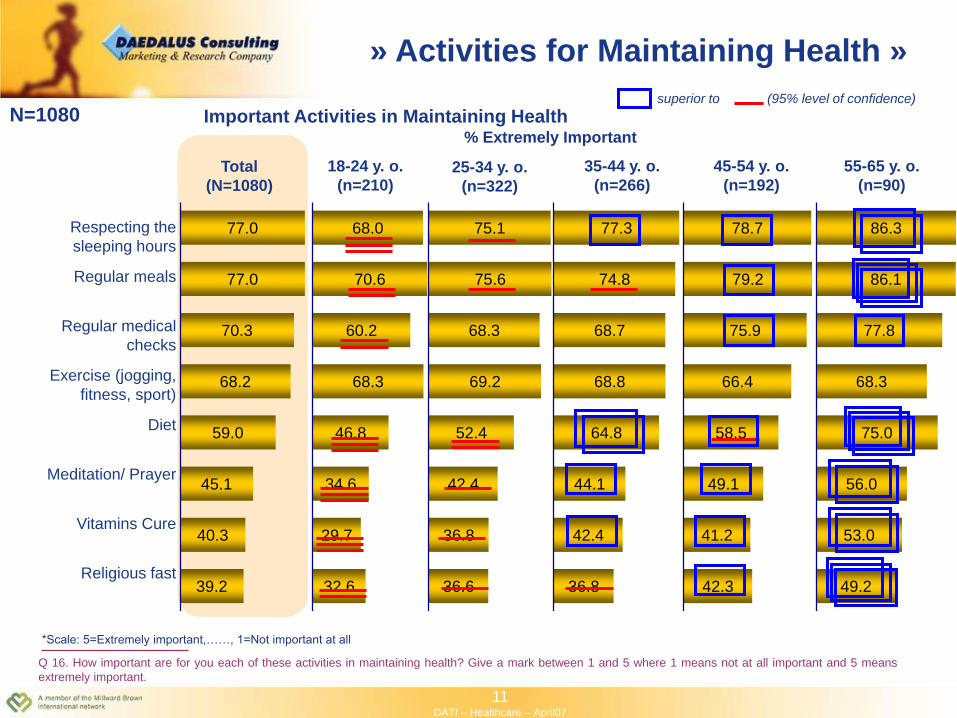
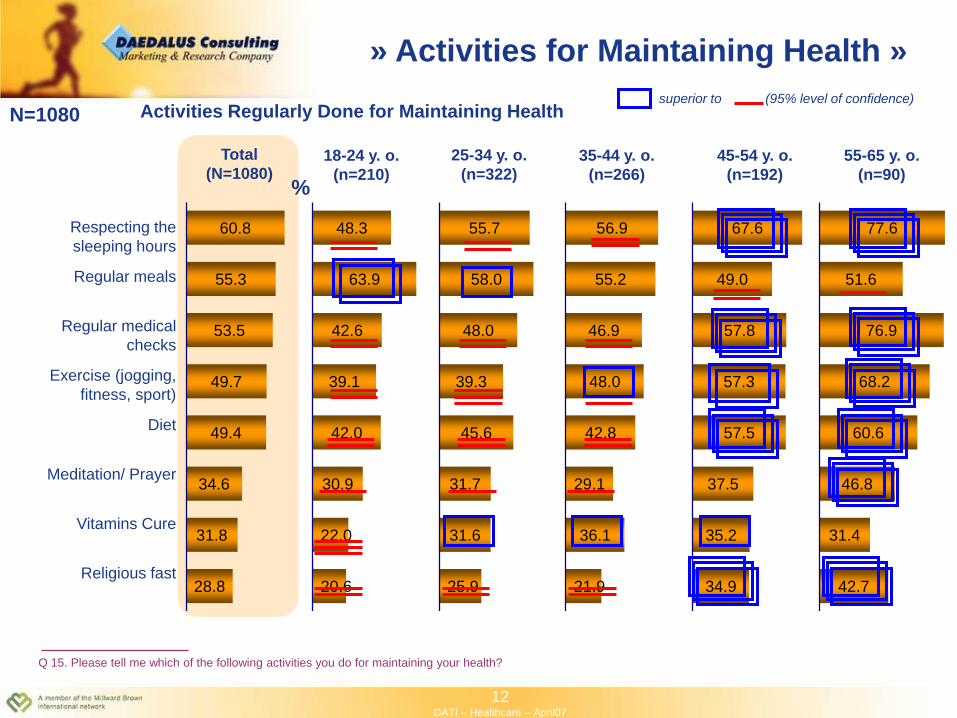
The older they get, the more they practice health maintaining activities, excepting exercises
(jogging, fitness, sport).
Men rather have regular meals (58.2% compared to 49.2% women) and do exercises (64.0% compared to
48.0% women). Women practice more than men activities for maintaining health as: meditation/ prayer
(58.4% compared to 39.9% men), diet (54.7% compared to 44.3%), religious fast (42.7% compared to
26.0%) and vitamins cure (38.6% compared to 24.5%).
Activities for Maintaining Health - Summary
8DATI – Healthcare – April07
77.0
77.0
70.3
68.2
59.0
45.1
40.3
39.2
60.8
53.5
28.8
55.3
49.7
49.4
31.8
34.6
Activities Regularly Done for
Maintaining Health
%
Q 15. Please tell me which of the following activities you do for maintaining your health?
Q 16. How important are for you each of these activities in maintaining health? Give a mark between 1 and 5 where 1 means not at all important and 5 means
extremely important.
*Scale: 5=Extremely important,……, 1=Not important at all
N=1080
% Extremely Important
Activities for Maintaining Health »
Important activities in
Maintaining Health
Respecting the sleeping hours
Regular meals
Regular medical checks
Exercise (jogging, fitness, sport)
Diet
Meditation/ Prayer
Vitamins Cure
Religious fast
Mean*
4.6
1
4.6
5
4.4
3
4.4
6
4.2
6
3.6
9
3.6
9
3.5
5
9DATI – Healthcare – April07
Q 16. Cat de importante sunt fiecare din aceste activitati pentru mentinerea sanatatii? Acordati o nota intre 1 si 5 unde 1 inseamna deloc important si 5 inseamna
extrem de important.
*Scala: 5=Extrem de important,……, 1=Deloc important
Regular meals
Regular medical checks
Exercise (jogging, fitness, sport)
Diet
Vitamins Cure
77.0
70.3
68.2
59.0
40.3
47.7
36.0
50.3
59.2
17.9Feb-07 May-02
%
Important activities in
Maintaining Health
» Activities for Maintaining Health »
10DATI – Healthcare – April07
60.8
53.5
28.8
55.3
49.7
34.6
52.4
51.9
31.0
29.0
45.2
28.3
%
Q 15. Va rog sa-mi spuneti pe care dintre urmatoarele activitati obisnuiti sa le practicati pentru mentinerea sanatatii dvs. ?
N=1080
Feb-07 May-02
Respecting the sleeping hours
Regular meals
Regular medical checks
Exercise (jogging, fitness, sport)
Diet
Religious fast
» Activities for Maintaining Health »
Activities Regularly Done for
Maintaining Health
11DATI – Healthcare – April07
Total
(N=1080)
68.0
70.6
60.2
68.3
46.8
34.6
29.7
32.6
N=1080
77.0
77.0
70.3
68.2
59.0
45.1
40.3
39.2
18-24 y. o.
(n=210)25-34 y. o.
(n=322)
35-44 y. o.
(n=266)
45-54 y. o.
(n=192)
55-65 y. o.
(n=90)
75.1
75.6
68.3
69.2
52.4
42.4
36.8
36.6
77.3
74.8
68.7
68.8
64.8
44.1
42.4
36.8
78.7
79.2
75.9
66.4
58.5
49.1
41.2
42.3
86.3
86.1
77.8
68.3
75.0
56.0
53.0
49.2
» Activities for Maintaining Health »
Important Activities in Maintaining Health% Extremely Important
superior to (95% level of confidence)
*Scale: 5=Extremely important,……, 1=Not important at all
Q 16. How important are for you each of these activities in maintaining health? Give a mark between 1 and 5 where 1 means not at all important and 5 means
extremely important.
Respecting the
sleeping hours
Regular meals
Regular medical
checks
Exercise (jogging,
fitness, sport)
Diet
Meditation/ Prayer
Vitamins Cure
Religious fast
12DATI – Healthcare – April07
%
N=1080
60.8
55.3
53.5
49.7
49.4
34.6
31.8
28.8
Total
(N=1080)18-24 y. o.
(n=210)
25-34 y. o.
(n=322)
35-44 y. o.
(n=266)
45-54 y. o.
(n=192)
55-65 y. o.
(n=90)
48.3
63.9
42.6
39.1
42.0
30.9
22.0
20.6
55.7
58.0
48.0
39.3
45.6
31.7
31.6
25.9
56.9
55.2
46.9
48.0
42.8
29.1
36.1
21.9
67.6
49.0
57.8
57.3
57.5
37.5
35.2
34.9
77.6
51.6
76.9
68.2
60.6
46.8
31.4
42.7
» Activities for Maintaining Health »
superior to (95% level of confidence)Activities Regularly Done for Maintaining Health
Q 15. Please tell me which of the following activities you do for maintaining your health?
Respecting the
sleeping hours
Regular meals
Regular medical
checks
Exercise (jogging,
fitness, sport)
Diet
Meditation/ Prayer
Vitamins Cure
Religious fast
13DATI – Healthcare – April07
77.0
77.0
70.3
68.2
59.0
45.1
40.3
39.2
N=1080
Total
(N=1080)Females
(n=534)
Males
(n=546)
Important Activities in Maintaining Health
» Activities for Maintaining Health
%Total
(N=1080)Females
(n=534)
Males
(n=546)
82.3
80.8
77.5
67.6
65.1
54.5
49.1
48.0
71.3
72.9
62.5
68.7
52.4
35.1
30.9
29.8
% Extremely Important
60.8
53.5
28.8
55.3
49.7
49.4
31.8
34.6
61.9
49.2
29.8
47.5
54.7
58.4
38.6
42.7
59.6
58.2
27.7
63.7
44.3
39.9
24.5
26.0
superior to (95% level of confidence)
*Scale: 5=Extremely important,……, 1=Not important at all
Q 15. Please tell me which of the following activities you do for maintaining your health?
Q 16. How important are for you each of these activities in maintaining health? Give a mark between 1 and 5 where 1 means not at all important and 5 means
extremely important.
Activities Regularly Done for
Maintaining Health
Respecting the
sleeping hours
Regular meals
Regular medical
checks
Exercise (jogging,
fitness, sport)
Diet
Meditation/ Prayer
Vitamins Cure
Religious fast
14DATI – Healthcare – April07
When a health problem appears, 88.9% of people ask the family doctor’s recommendation
while 39.0% ask the pharmacist recommendation. The pharmacist recommendation is the
second information source use by people after the doctor’s one.
Compared to other age categories, the young people, aged 18 – 34, rather ask their friends/
relatives/ acquaintances recommendation and browse the Internet, while persons aged 45 - 65
take into consideration to a higher extent mass-media (magazines, television, papers, radio) as
an information source when a health problem appears.
Women turn more than men to information sources both for maintaining health and prevention
of diseases as for the appearance of a health problem.
Romanians inform themselves more when there is a health problem. Still, the magazines and
the radio are use rather as information sources for maintaining and preventing health than for
when a health problem appears.
Information Sources - Summary
15DATI – Healthcare – April07
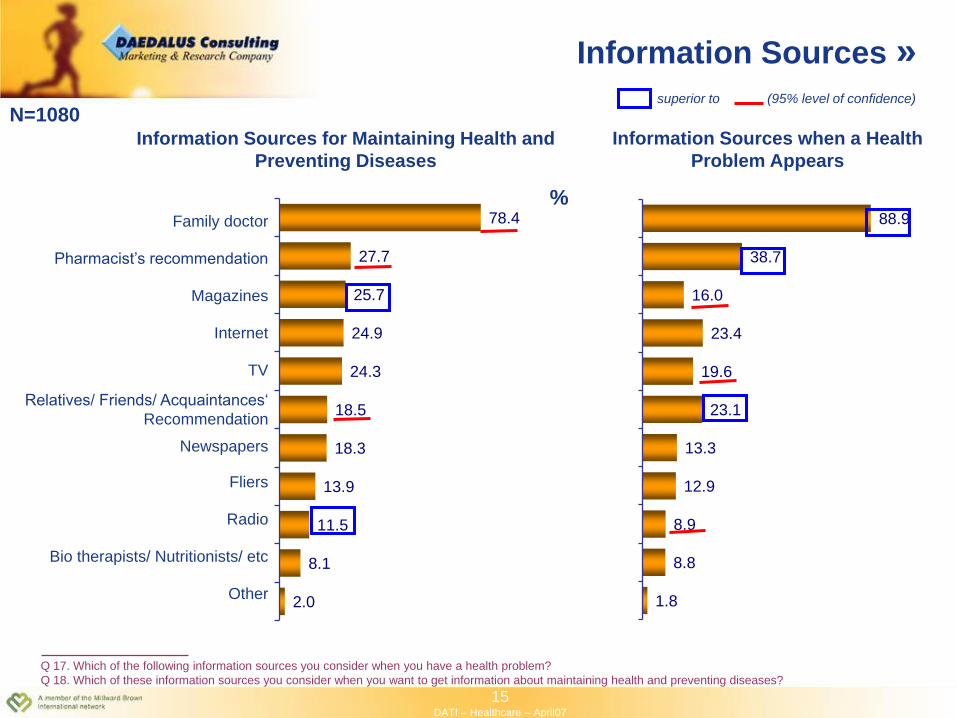
Q 17. Which of the following information sources you consider when you have a health problem?
Q 18. Which of these information sources you consider when you want to get information about maintaining health and preventing diseases?
78.4
27.7
25.7
24.9
24.3
18.5
18.3
13.9
11.5
8.1
2.0
Information Sources for Maintaining Health and
Preventing Diseases
Information Sources when a Health
Problem Appears
88.9
38.7
16.0
23.4
19.6
23.1
13.3
12.9
8.9
8.8
1.8
N=1080
%
Information Sources »
Family doctor
Pharmacist’s recommendation
Magazines
Internet
TV
Relatives/ Friends/ Acquaintances‘
Recommendation
Newspapers
Fliers
Radio
Bio therapists/ Nutritionists/ etc
Other
superior to (95% level of confidence)
16DATI – Healthcare – April07
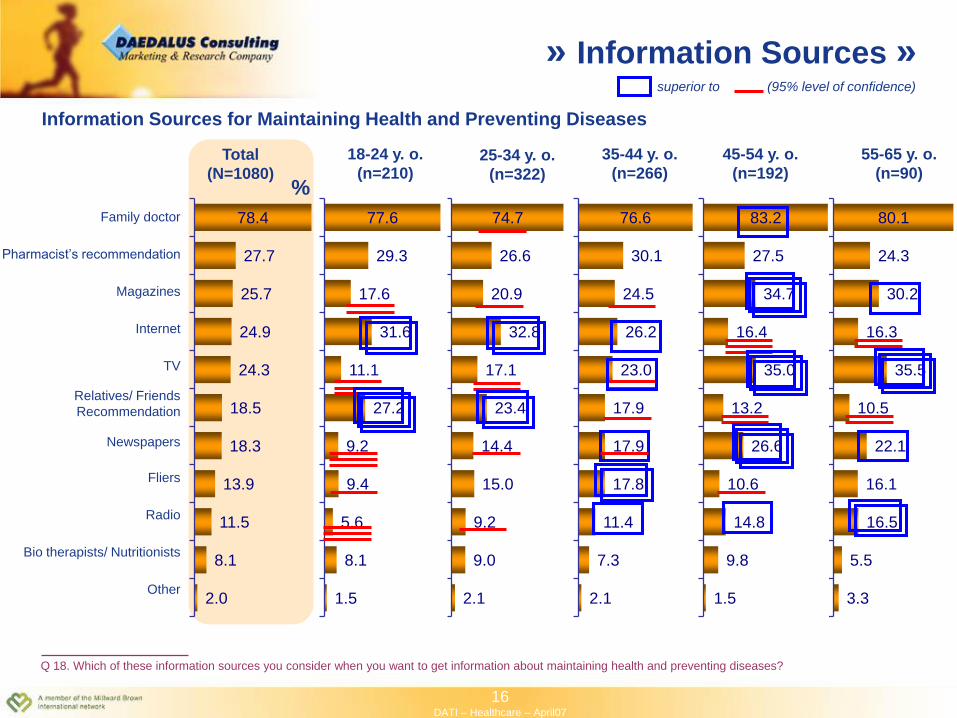
78.4
27.7
25.7
24.9
24.3
18.5
18.3
13.9
11.5
8.1
2.0
77.6
29.3
17.6
31.6
11.1
27.2
9.2
9.4
5.6
8.1
1.5
74.7
26.6
20.9
32.8
17.1
23.4
14.4
15.0
9.2
9.0
2.1
76.6
30.1
24.5
26.2
23.0
17.9
17.9
17.8
11.4
7.3
2.1
83.2
27.5
34.7
16.4
35.0
13.2
26.6
10.6
14.8
9.8
1.5
80.1
24.3
30.2
16.3
35.5
10.5
22.1
16.1
16.5
5.5
3.3
Total
(N=1080)
18-24 y. o.
(n=210)25-34 y. o.
(n=322)
35-44 y. o.
(n=266)
45-54 y. o.
(n=192)
55-65 y. o.
(n=90)%
» Information Sources »
Information Sources for Maintaining Health and Preventing Diseases
Q 18. Which of these information sources you consider when you want to get information about maintaining health and preventing diseases?
Family doctor
Pharmacist’s recommendation
Magazines
Internet
TV
Relatives/ Friends
Recommendation
Newspapers
Fliers
Radio
Bio therapists/ Nutritionists
Other
superior to (95% level of confidence)
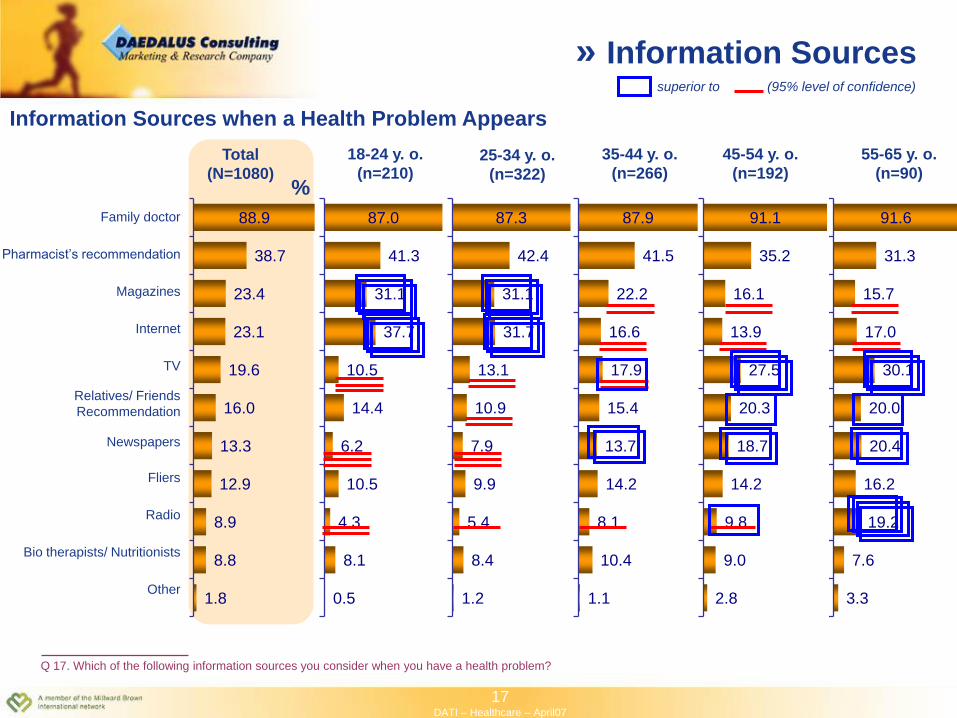
17DATI – Healthcare – April07
88.9
38.7
23.4
23.1
19.6
16.0
13.3
12.9
8.9
8.8
1.8
Total
(N=1080)
91.6
31.3
15.7
17.0
30.1
20.0
20.4
16.2
19.2
7.6
3.3
Information Sources when a Health Problem Appears
87.0
41.3
31.1
37.7
10.5
14.4
6.2
10.5
4.3
8.1
0.5
87.3
42.4
31.1
31.7
13.1
10.9
7.9
9.9
5.4
8.4
1.2
87.9
41.5
22.2
16.6
17.9
15.4
13.7
14.2
8.1
10.4
1.1
91.1
35.2
16.1
13.9
27.5
20.3
18.7
14.2
9.8
9.0
2.8
%
» Information Sources
18-24 y. o.
(n=210)25-34 y. o.
(n=322)
35-44 y. o.
(n=266)
45-54 y. o.
(n=192)
55-65 y. o.
(n=90)
Q 17. Which of the following information sources you consider when you have a health problem?
Family doctor
Pharmacist’s recommendation
Magazines
Internet
TV
Relatives/ Friends
Recommendation
Newspapers
Fliers
Radio
Bio therapists/ Nutritionists
Other
superior to (95% level of confidence)
18DATI – Healthcare – April07
Demographics
19DATI – Healthcare – April07
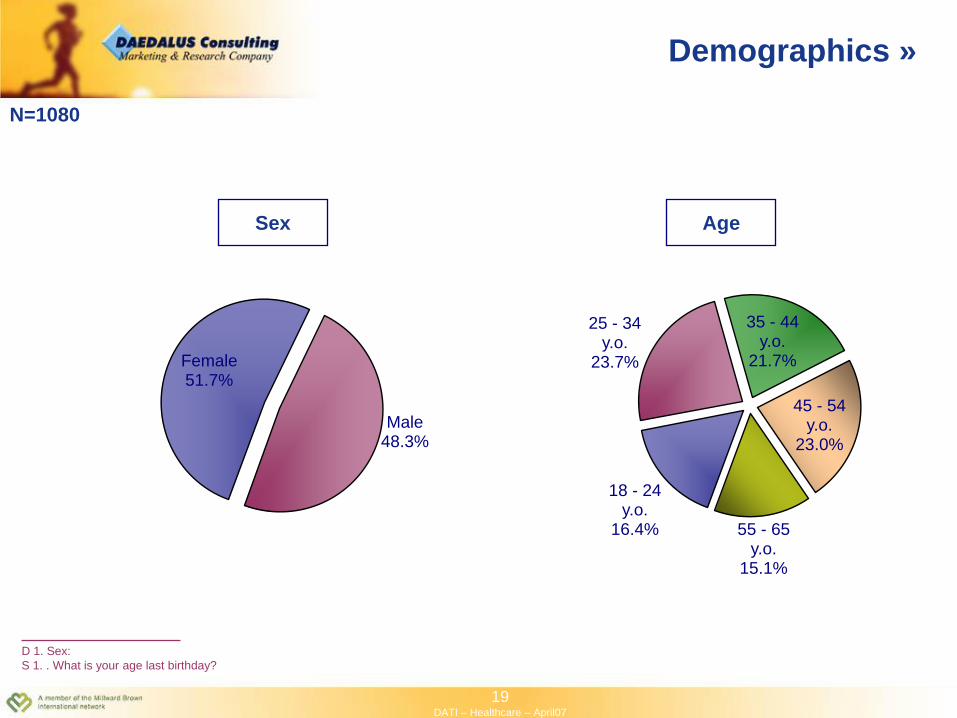
18 - 24 y.o.
16.4%
25 - 34 y.o.
23.7%
35 - 44 y.o.
21.7%
45 - 54 y.o.
23.0%
55 - 65 y.o.
15.1%
Sex Age
D 1. Sex:
S 1. . What is your age last birthday?
Female51.7%
Male48.3%
N=1080
Demographics »
20DATI – Healthcare – April07
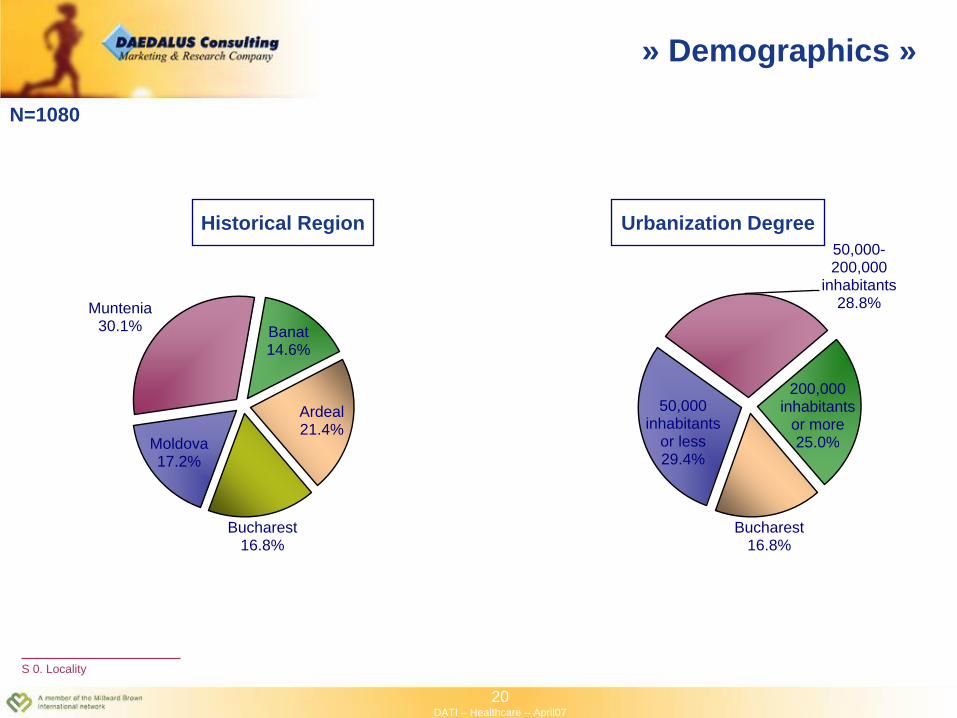
Historical Region Urbanization Degree
S 0. Locality
50,000 inhabitants
or less29.4%
50,000-200,000
inhabitants28.8%
200,000 inhabitants
or more25.0%
Bucharest16.8%
Moldova17.2%
Muntenia30.1% Banat
14.6%
Ardeal21.4%
Bucharest16.8%
N=1080
» Demographics »
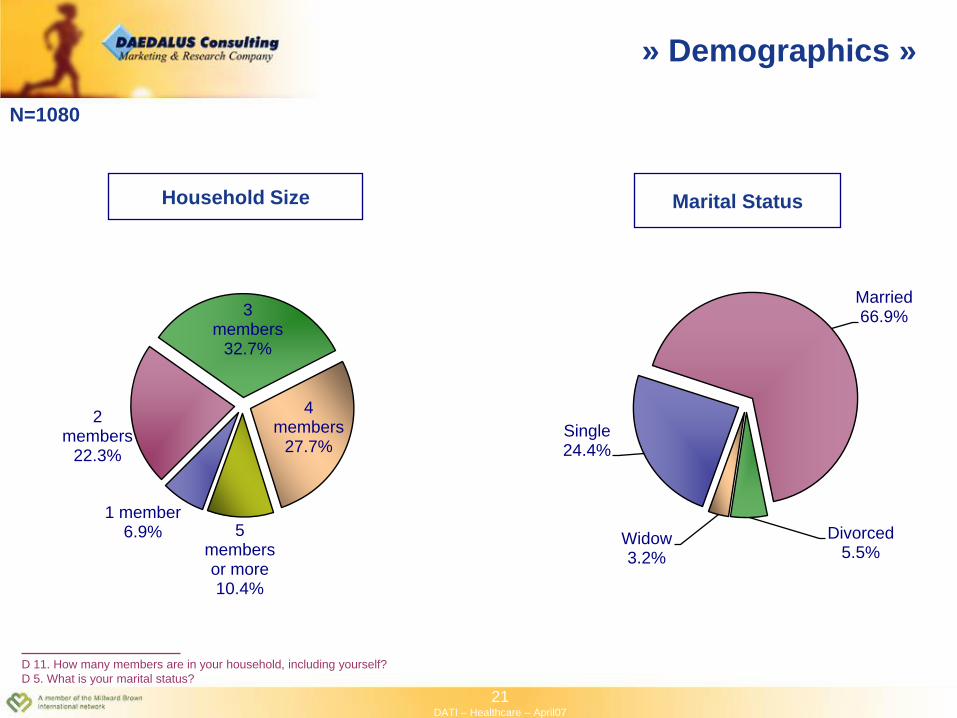
21DATI – Healthcare – April07
1 member6.9%
2 members
22.3%
3 members
32.7%
4 members
27.7%
5 members or more10.4%
Household Size Marital Status
D 11. How many members are in your household, including yourself?
D 5. What is your marital status?
Single24.4%
Married66.9%
Divorced5.5%
Widow3.2%
N=1080
» Demographics »
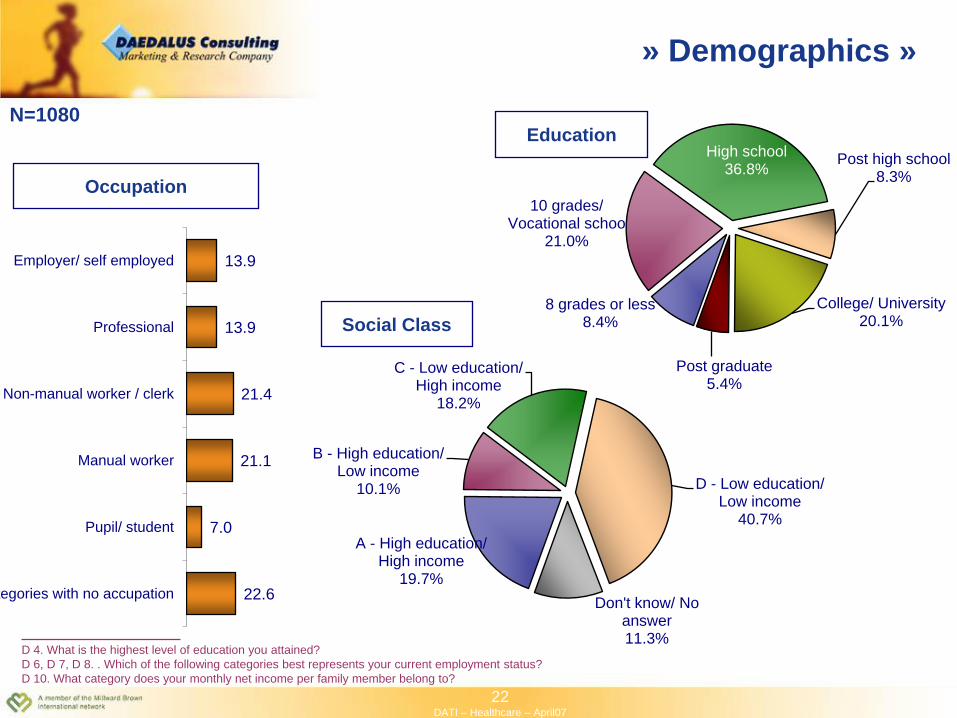
22DATI – Healthcare – April07
8 grades or less8.4%
10 grades/ Vocational schoo
21.0%
High school36.8%
Post high school8.3%
College/ University20.1%
Post graduate5.4%
A - High education/ High income
19.7%
B - High education/ Low income
10.1%
C - Low education/ High income
18.2%
D - Low education/ Low income
40.7%
Don't know/ No answer11.3%
Education
Occupation
13.9
13.9
21.4
21.1
7.0
22.6
Employer/ self employed
Professional
Non-manual worker / clerk
Manual worker
Pupil/ student
Other categories with no accupation
D 4. What is the highest level of education you attained?
D 6, D 7, D 8. . Which of the following categories best represents your current employment status?
D 10. What category does your monthly net income per family member belong to?
N=1080
Social Class
» Demographics »
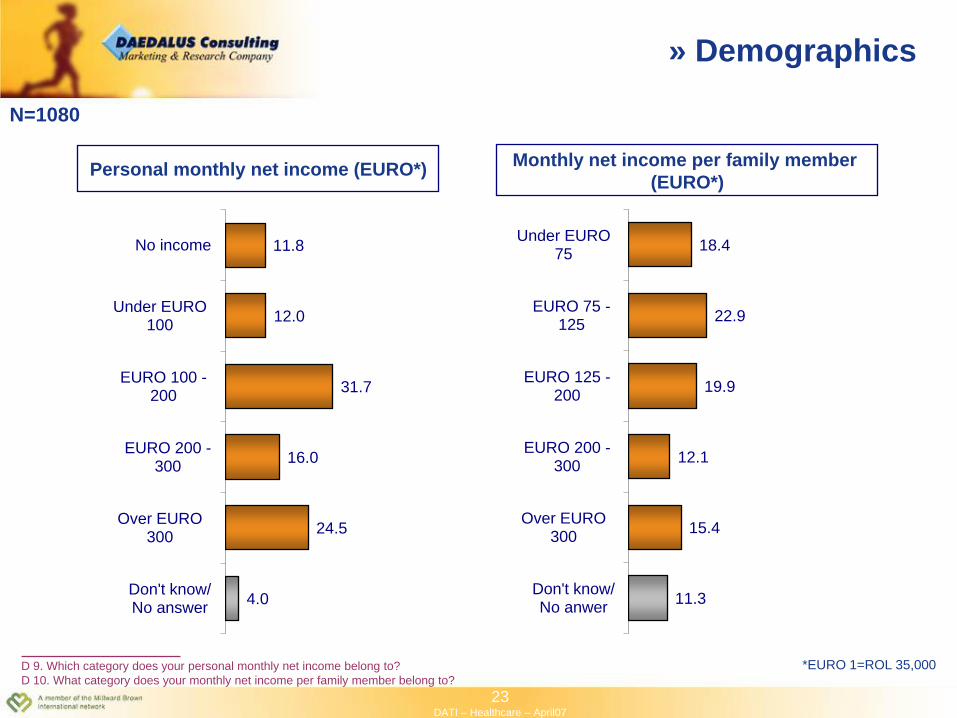
23DATI – Healthcare – April07
18.4
22.9
19.9
12.1
15.4
11.3
Under EURO 75
EURO 75 -125
EURO 125 -200
EURO 200 -300
Over EURO 300
Don't know/ No anwer
Personal monthly net income (EURO*)
11.8
12.0
31.7
16.0
24.5
4.0
No income
Under EURO 100
EURO 100 -200
EURO 200 -300
Over EURO 300
Don't know/ No answer
D 9. Which category does your personal monthly net income belong to?
D 10. What category does your monthly net income per family member belong to?
Monthly net income per family member
(EURO*)
*EURO 1=ROL 35,000
N=1080
» Demographics