semi-annual financial statements 2021
TRANSCRIPT

S E P T E M B E R 3 0 , 2 0 2 1
SEMI-ANNUAL FINANCIAL STATEMENTS 2021

Table of Contents
Semi-Annual Financial Statements - September 30, 2021
Equity Fund(s)
CI Canadian Dividend Private Pool ............................................................................................. 1
CI Canadian Equity Private Pool ................................................................................................. 9
CI Global Concentrated Equity Private Pool ............................................................................... 19
CI Global Equity Alpha Private Pool ........................................................................................... 31
CI Global Equity Core Private Pool ............................................................................................. 39
CI Global Equity Momentum Private Pool .................................................................................. 47
CI Global Infrastructure Private Pool .......................................................................................... 57
CI Global Real Asset Private Pool .............................................................................................. 67
CI Global REIT Private Pool ......................................................................................................... 76
CI Global Smaller Companies Private Pool ................................................................................ 87
CI International Equity Alpha Private Pool ................................................................................. 95
CI International Equity Growth Private Pool ............................................................................... 103
CI International Equity Value Private Pool ................................................................................. 112
CI North American Small / Mid Cap Equity Private Pool ........................................................... 122
CI U.S. Equity Private Pool .......................................................................................................... 133
Balanced Fund(s)
CI Global Asset Allocation Private Pool ..................................................................................... 143
CI Global Balanced Yield Private Pool ........................................................................................ 165
Income Fund(s)
CI Canadian Fixed Income Private Pool ...................................................................................... 175
CI Global Enhanced Government Bond Private Pool .................................................................. 192
CI Global High Yield Credit Private Pool .................................................................................... 204
CI Global Investment Grade Credit Private Pool ........................................................................ 220
CI Global Unconstrained Bond Private Pool ............................................................................... 236
Notes to the Financial Statements ...................................................................................... 251
Legal Notice ............................................................................................................................. 278
CI Investments Inc., the Manager of the Funds, appoints independent auditors to audit the Funds’
Annual Financial Statements. Under Canadian securities laws (National Instrument 81-106),
if an auditor has not reviewed the Semi-Annual Financial Statements, this must be disclosed in an
accompanying notice.
The Funds’ independent auditors have not performed a review of these Semi-Annual Financial
Statements in accordance with standards established by the Chartered Professional Accountants
of Canada.
To request an alternate format of this document, please contact us at [email protected] or
1-800-792-9355.

– 1 –
CI Canadian Dividend Private Pool
Semi-Annual Financial Statements - September 30, 2021
Statements of Financial Position (in $000’s except for per unit amounts and units outstanding)
as at as at Sept. 30, 2021 Mar. 31, 2021 22,329 10,876 - - 126 398
- - - - - - - - - - 72 32 - - - - - - 309 15 306 41 23,142 11,362
- - - -
- - - - - - - - - - - 88 - - - - - - - - - - - 88
23,142 11,274
Statements of Financial Position (cont’d)(in $000’s except for per unit amounts and units outstanding)
Net assets attributable to holders of redeemable units
per Series (Note 4):
Net assets attributable to holders of redeemable
units per unit: Number of redeemable
units outstanding:
as at Sept. 30, 2021
as at Mar. 31, 2021
as at Sept. 30, 2021
as at Mar. 31, 2021
as at Sept. 30, 2021
as at Mar. 31, 2021
Series A 11,127 7,409 11.75 10.86 947,223 682,433Series F 12,013 3,864 11.74 10.84 1,023,150 356,329Series I 2 1 11.67 10.77 138 135
AssetsCurrent assetsInvestmentsInvestments pledged as collateralCashUnrealized gain on futures and foreign currency forward contractsSwaps, swaptions and optionsDaily variation margin on derivative instrumentsFees rebate receivableCash collateral on deposit for short saleDividends receivableInterest receivableReceivable for distribution from investmentsSecurities lending revenue receivable (Note 6)Receivable for investments soldReceivable for unit subscriptions
LiabilitiesCurrent liabilitiesInvestments sold shortBank overdraftUnrealized loss on futures and foreign currency forward contractsSwaps, swaptions and options Dividends payable on investments sold shortInterest payable on investments sold shortDaily variation margin on derivative instrumentsPayable for investments purchasedPayable for unit redemptionsDistributions payable to holders of redeemable units Management fees payableAdministration fees payableAccounts payable and accrued liabilities
Net assets attributable to holders of redeemable units
The accompanying notes are an integral part of these financial statements.
Financial Statements (unaudited)
CIG - 2068

– 2 –
CI Canadian Dividend Private Pool
Semi-Annual Financial Statements - September 30, 2021
Statements of Comprehensive Incomefor the periods ended September 30(in $000’s except for per unit amounts and number of units)
2021 2020
257 95 1 1 - - - - - -
- - - -
1,338 (387)
(157) 1,407 1,439 1,116 - - - - 1 - - - 1 - 1,440 1,116
109 28 13 3 14 4 1 1 - - - - - - - - - - 17 4 - - 154 40
1,286 1,076
The accompanying notes are an integral part of these financial statements.
Financial Statements (unaudited)
Statements of Comprehensive Income (cont’d)for the periods ended September 30(in $000’s except for per unit amounts and number of units)
Increase (decrease) in net assets attributable to
holders of redeemable units per Series:
Increase (decrease) in net assets attributable to
holders of redeemable units per unit:
Weighted average number of units:
2021 2020 2021 2020 2021 2020Series A 731 376 0.88 1.47 832,548 255,889Series F 554 699 0.75 1.85 749,002 378,960Series I 1 1 1.12 2.66 137 337
Income Net gain (loss) on investments and derivatives Dividends Interest for distribution purposes Income distributions from investments Capital gain distributions from investments Derivative income (loss) Dividends expense on financial assets (liabilities) sold
short Interest expense on financial assets (liabilities) sold short Net realized gain (loss) on sale of investments and
derivatives Change in unrealized appreciation (depreciation) in value
of investments and derivativesTotal net gain (loss) on investments and derivativesOther income Foreign exchange gain (loss) on cash Commitment fee income Securities lending revenue (Note 6) Fees rebateTotal other incomeTotal incomeExpensesManagement fees (Note 5)Administration fees (Note 5)Commissions and other portfolio transaction costsIndependent review committee feesSecurities borrowing fees (Note 2)Margin feesService feesInterest expenseWithholding taxesHarmonized sales taxOther expensesTotal expensesIncrease (decrease) in net assets attributable to holders of redeemable units

– 3 –
CI Canadian Dividend Private Pool
Semi-Annual Financial Statements - September 30, 2021
Statements of Changes in Net Assets Attributable to Holders of Redeemable Unitsfor the periods ended September 30 (in $000’s)
Net assets attributable to holders of redeemable units at the beginning of periodIncrease (decrease) in net assets attributable to holders of redeemable unitsDistributions to holders of redeemable units From net investment income From net realized gains Return of capitalTotal distributions to holders of redeemable units
Redeemable unit transactions Proceeds from redeemable units issued Reinvestment of distributions to holders of redeemable units Redemption of redeemable unitsNet increase (decrease) from redeemable unit transactionsNet increase (decrease) in net assets attributable to holders of redeemable unitsNet assets attributable to holders of redeemable units at the end of period
The accompanying notes are an integral part of these financial statements.
Financial Statements (unaudited)
Series A 2021 2020 7,409 1,641 731 376
(2) (23) - (9) (99) - (101) (32)
3,314 1,178 101 31 (327) (348) 3,088 861 3,718 1,205 11,127 2,846
Series F 2021 2020 3,864 3,414 554 699
(35) (56) - (12) (107) - (142) (68)
7,952 536 130 42 (345) (1,445) 7,737 (867) 8,149 (236) 12,013 3,178
Series I 2021 2020 1 7 1 1
- - - - - - - -
- - - - - (7) - (7) 1 (6) 2 1
Total Fund 2021 2020 11,274 5,062 1,286 1,076
(37) (79) - (21) (206) - (243) (100)
11,266 1,714 231 73 (672) (1,800) 10,825 (13) 11,868 963 23,142 6,025

– 4 –
CI Canadian Dividend Private Pool
Semi-Annual Financial Statements - September 30, 2021
Statements of Cash Flowsfor the periods ended September 30 (in $000’s)
2021 2020
1,286 1,076
(1,338) 387 - - 14 4
157 (1,407) 7,715 2,441 (18,383) (1,839) - - - - - 205 (40) 14 - - - - - - - - - - (10,589) 881
(12) (27) 10,891 1,714 (562) (2,152) 10,317 (465)
- - (272) 416 398 (147) 126 269
212 109 1 1 - - - - - -
*Dividends and interest received as well as dividends and interest paid relate to operating activities of the Fund. The accompanying notes are an integral part of these financial statements.
Financial Statements (unaudited)
Cash flows from (used in) operating activitiesIncrease (decrease) in net assets attributable to holders of redeemable unitsAdjustments for: Net realized (gain) loss on sale of investments and derivatives Unrealized foreign exchange (gain) loss on cash Commissions and other portfolio transaction costs Change in unrealized (appreciation) depreciation in value of
investments and derivatives Proceeds from sale and maturity of investments and derivatives Purchase of investments and derivatives (Increase) decrease in cash collateral on deposit for short sale Non-cash distributions from investments Change in daily variation margin (Increase) decrease in dividends receivable (Increase) decrease in interest receivable (Increase) decrease in securities lending revenue receivable Increase (decrease) in management fees payable Increase (decrease) in administration fees payable Change in other accounts receivable and payableNet cash from (used in) operating activities
Cash flows from (used in) financing activitiesDistributions paid to holders of redeemable units, net of reinvested distributionsProceeds from issuance of redeemable unitsAmounts paid on redemption of redeemable unitsNet cash from (used in) financing activities Unrealized foreign exchange gain (loss) on cashNet increase (decrease) in cashCash (bank overdraft), beginning of periodCash (bank overdraft), end of period
Supplementary Information:Dividends received, net of withholding tax*Interest received, net of withholding tax*Dividends paid*Interest paid*Tax recoverable (paid)

– 5 –
CI Canadian Dividend Private Pool
Semi-Annual Financial Statements - September 30, 2021
Percentages shown relate investments at fair value to net assets attributable to holders of redeemable units of the Fund.
Schedule of Investment Portfolio as at September 30, 2021 (unaudited)
Number ofUnits/Sharesor Par Value Description
Average Cost($)
Fair Value($)
% of Net Assets
FINANCIALS 18,118 Brookfield Asset Management Inc., Class A 1,062,515 1,229,669 4,798 Canadian Imperial Bank of Commerce 701,138 676,518 24,102 CI Financial Corp. 502,517 619,662 2,091 Fairfax Financial Holdings Ltd., Sub-Voting Shares 1,078,208 1,069,149 4,947 Intact Financial Corp. 784,072 828,524 23,666 Manulife Financial Corp. 555,598 576,977 19,556 Power Corporation of Canada 665,406 816,463 10,930 Royal Bank of Canada 1,384,790 1,377,508 10,690 The Bank of Nova Scotia 833,859 833,392 7,568,103 8,027,862 34.69 CONSUMER STAPLES 16,898 Alimentation Couche-Tard Inc., Class B 732,276 818,877 20,709 Empire Co., Ltd., Class A 782,521 799,367 9,363 Loblaw Co., Ltd. 673,122 813,832 14,706 The North West Co., Inc. 491,642 497,357 2,679,561 2,929,433 12.66 UTILITIES 28,133 Algonquin Power & Utilities Corp. 560,427 522,430 10,154 Brookfield Infrastructure Partners L.P. 719,436 723,269 9,588 Emera Inc. 535,385 549,968 14,696 Fortis Inc. 798,053 825,768 2,613,301 2,621,435 11.33 ENERGY 20,204 Canadian Natural Resources Ltd. 761,726 935,647 21,880 Enbridge Inc. 1,023,266 1,104,065 9,176 TC Energy Corp. (CAD) 546,599 559,369 2,331,591 2,599,081 11.23 CONSUMER DISCRETIONARY 2,846 Canadian Tire Corp., Ltd., Class A, Non-Voting Shares 566,114 504,425 14,136 Dollarama Inc. 773,053 776,632 5,610 Magna International Inc., Class A 552,158 534,745 6,979 Restaurant Brands International Inc. 568,640 541,570 2,459,965 2,357,372 10.19 INFORMATION TECHNOLOGY 6,505 CGI Inc. 672,361 699,873 9,736 Open Text Corp. 581,984 601,880 10,998 Sylogist Ltd. 121,614 112,620 1,375,959 1,414,373 6.11 INDUSTRIALS 7,445 Canadian Pacific Railway Ltd. 638,482 615,776 22,111 Finning International Inc. 646,932 690,969 1,285,414 1,306,745 5.65 MATERIALS 3,599 CCL Industries Inc., Class B 231,707 236,094 5,443 Nutrien Ltd. 379,223 447,469 610,930 683,563 2.95 REAL ESTATE 2,403 Colliers International Group Inc. 301,779 389,598 1.68Commissions and other portfolio transaction costs (10,508)Total Investment Portfolio 21,216,095 22,329,462 96.49Other Net Assets (Liabilities) 812,269 3.51Net Assets Attributable to Holders of Redeemable Units 23,141,731 100.00

– 6 –
CI Canadian Dividend Private Pool
Semi-Annual Financial Statements - September 30, 2021
Redeemable Unit Transactions (Note 4)for the periods ended September 30
Number of redeemable units at the beginning of periodRedeemable units issued for cashRedeemable units issued for reinvested distributionsRedeemable units redeemedNumber of redeemable units at the end of period
Fund Specific Notes to Financial Statements (unaudited)
†A portion of brokerage commissions paid was used to cover research and market data services, termed soft dollar commissions. This amount has been estimated by the Manager of the Fund.The accompanying notes are an integral part of these financial statements.
Commissions (Note 2)for the periods ended September 30 (in $000’s)
2021 2020Brokerage commissions 13 4Soft dollar commissions† 5 2
Series A 2021 2020 682,433 224,131 283,536 134,979 8,627 3,721 (27,373) (41,288) 947,223 321,543
Series F 2021 2020 356,329 465,777 684,942 66,187 11,039 4,986 (29,160) (177,640) 1,023,150 359,310
Series I 2021 2020 135 1,026 - - 3 8 - (902) 138 132

– 7 –
CI Canadian Dividend Private Pool
Semi-Annual Financial Statements - September 30, 2021
The accompanying notes are an integral part of these financial statements.
Fund Specific Notes to Financial Statements (unaudited)
Securities Lending (Note 6)as at September 30 (in $000’s)
2021 2020Loaned 1,344 366Collateral (non-cash) 1,371 374
Securities Lending Revenue Reconciliation (Note 6)for the periods ended September 30 (in $000’s)
2021 2020Gross securities lending revenue 1 -Charges - -Securities lending revenue 1 -Charges as a % of gross securities lending revenue - -
Management and Administration Fees (Note 5) as at September 30, 2021 (%)
Annual management
fee rate:
Annual administration
fee rate:
Series A 1.650 0.15Series F 0.650 0.15Series I Paid directly by investor Paid directly by investor
Related Party Investments (Note 9)as at September 30 (in $000’s)
Investments 2021CI Financial Corp. 620
Investments 2020CI Financial Corp. 173

– 8 –
CI Canadian Dividend Private Pool
Semi-Annual Financial Statements - September 30, 2021
The accompanying notes are an integral part of these financial statements.
Currency RiskAs at September 30, 2021 and March 31, 2021, the Fund’s investments were denominated in Canadian dollars, the functional currency of the Fund. As a result, the Fund was not exposed to currency risk.
Interest Rate RiskAs at September 30, 2021 and March 31, 2021, the Fund did not have a significant exposure to interest rate risk as substantially all of its assets were invested in equities.
Fair Value Hierarchy
The tables below summarize the inputs used by the Fund in valuing the Fund’s investments and derivatives carried at fair value.
Long Positions at fair value as at September 30, 2021Level 1 Level 2 Level 3 Total
(in $000’s) (in $000’s) (in $000’s) (in $000’s)Equities 22,329 - - 22,329 Total 22,329 - - 22,329
There were no transfers between Level 1, 2 and 3 during the period ended September 30, 2021.
Long Positions at fair value as at March 31, 2021Level 1 Level 2 Level 3 Total
(in $000’s) (in $000’s) (in $000’s) (in $000’s)Equities 10,876 - - 10,876 Total 10,876 - - 10,876
There were no transfers between Level 1 and 2 and Level 2 and 3 during the year ended March 31, 2021.
Financial Instruments Risks (Note 10)
Concentration RiskFor Concentration Risk as at September 30, 2021, refer to the Schedule of Investment Portfolio.
The table below summarizes the Fund’s exposure to concentration risk.
as at March 31, 2021Categories Net Assets (%)Financials 23.9 Energy 21.0 Consumer Staples 12.9 Utilities 9.4 Industrials 8.8 Materials 6.8 Information Technology 6.2 Consumer Discretionary 5.5 Other Net Assets (Liabilities) 3.5 Real Estate 2.1 Total 100.0
Credit RiskAs at September 30, 2021 and March 31, 2021, the Fund did not have a significant exposure to credit risk as substantially all of its assets were invested in equities.
Other Price RiskAs at September 30, 2021 and March 31, 2021, the Fund was predominantly invested in Canadian equities and therefore was sensitive to changes in general economic conditions in Canada.
As at September 30, 2021, had the fair value of equities in the investment portfolio increased or decreased by 10% (March 31, 2021 - 10%), with all other variables held constant, net assets attributable to holders of redeemable units of the Fund would have increased or decreased, respectively, by approximately $2,233,000 (March 31, 2021 - $1,088,000). In practice, actual results may differ from this analysis and the difference may be material.
Fund Specific Notes to Financial Statements (unaudited)
Level 3 ReconciliationThe table below summarizes the movement in financial instruments classified as Level 3.
for the year ended March 31, 2021 Balance at
Mar. 31, 2020 Purchases SalesTransfers
InTransfers
(Out)Realized Gain
(Loss)Unrealized Gain
(Loss)*Balance at
Mar. 31, 2021(in $000’s) (in $000’s) (in $000’s) (in $000’s) (in $000’s) (in $000’s) (in $000’s) (in $000’s)
Long Positions/Assets:Equities 138 - - - (172) - 34 - Total 138 - - - (172) - 34 -
*Change in unrealized gain (loss) related to investments held at March 31, 2021 was $34,000.
During the year ended March 31, 2021, investments with a fair value of $172,000 were transferred out of Level 3 into Level 1 as observable market inputs became available for these investments.

– 9 –
CI Canadian Equity Private Pool
Semi-Annual Financial Statements - September 30, 2021
Statements of Financial Position (in $000’s except for per unit amounts and units outstanding)
as at as at Sept. 30, 2021 Mar. 31, 2021 7,686 5,545 - - - 3
- - - - - - - - - - - - - - - - - - 1 - - 26 7,687 5,574
- - - -
- - - - - - - - - - - - 32 - - - - - - - - - 32 -
7,655 5,574
Statements of Financial Position (cont’d)(in $000’s except for per unit amounts and units outstanding)
Net assets attributable to holders of redeemable units
per Series (Note 4):
Net assets attributable to holders of redeemable
units per unit: Number of redeemable
units outstanding:
as at Sept. 30, 2021
as at Mar. 31, 2021
as at Sept. 30, 2021
as at Mar. 31, 2021
as at Sept. 30, 2021
as at Mar. 31, 2021
Series A 4,861 3,469 14.65 12.85 331,896 269,983Series F 2,792 2,104 14.77 12.89 189,035 163,266Series I 2 1 14.87 12.92 110 110
AssetsCurrent assetsInvestmentsInvestments pledged as collateralCashUnrealized gain on futures and foreign currency forward contractsSwaps, swaptions and optionsDaily variation margin on derivative instrumentsFees rebate receivableCash collateral on deposit for short saleDividends receivableInterest receivableReceivable for distribution from investmentsSecurities lending revenue receivable (Note 6)Receivable for investments soldReceivable for unit subscriptions
LiabilitiesCurrent liabilitiesInvestments sold shortBank overdraftUnrealized loss on futures and foreign currency forward contractsSwaps, swaptions and options Dividends payable on investments sold shortInterest payable on investments sold shortDaily variation margin on derivative instrumentsPayable for investments purchasedPayable for unit redemptionsDistributions payable to holders of redeemable units Management fees payableAdministration fees payableAccounts payable and accrued liabilities
Net assets attributable to holders of redeemable units
The accompanying notes are an integral part of these financial statements.
Financial Statements (unaudited)
CIG - 2050
– 10 –
CI Canadian Equity Private Pool
Semi-Annual Financial Statements - September 30, 2021
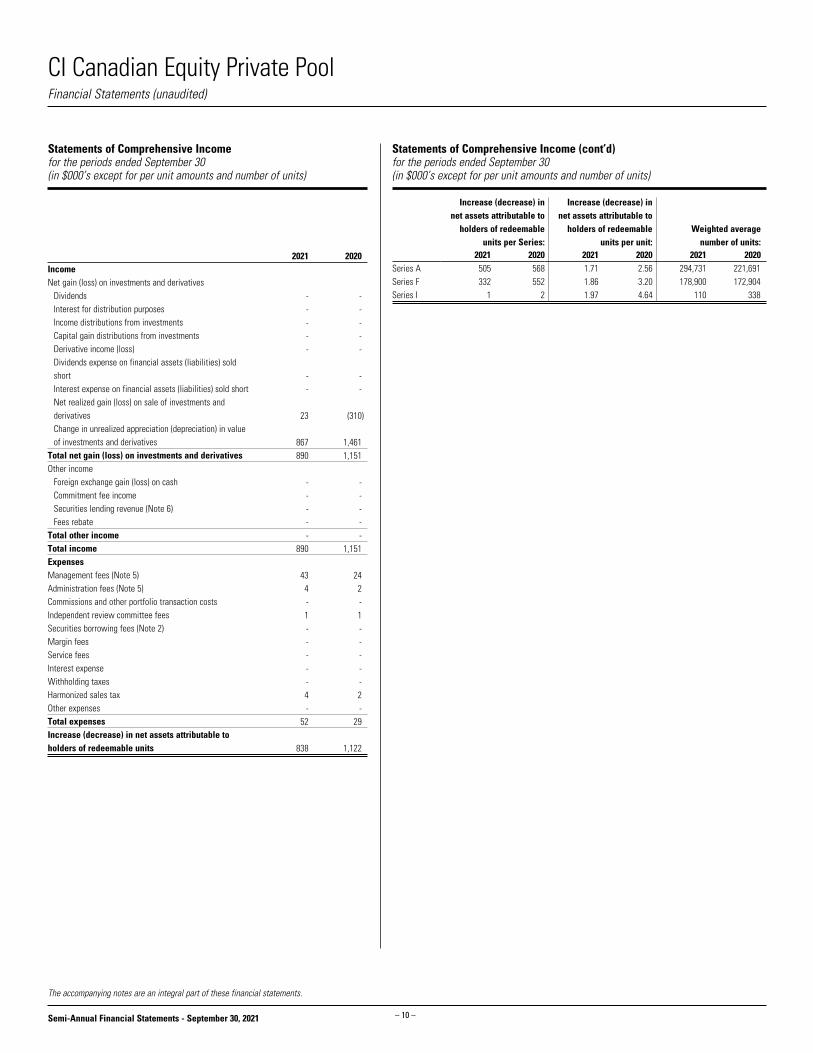
Statements of Comprehensive Incomefor the periods ended September 30 (in $000’s except for per unit amounts and number of units)
2021 2020
- - - - - - - - - -
- - - -
23 (310)
867 1,461 890 1,151 - - - - - - - - - - 890 1,151
43 24 4 2 - - 1 1 - - - - - - - - - - 4 2 - - 52 29
838 1,122
The accompanying notes are an integral part of these financial statements.
Financial Statements (unaudited)
Statements of Comprehensive Income (cont’d)for the periods ended September 30(in $000’s except for per unit amounts and number of units)
Increase (decrease) in net assets attributable to
holders of redeemable units per Series:
Increase (decrease) in net assets attributable to
holders of redeemable units per unit:
Weighted average number of units:
2021 2020 2021 2020 2021 2020Series A 505 568 1.71 2.56 294,731 221,691Series F 332 552 1.86 3.20 178,900 172,904Series I 1 2 1.97 4.64 110 338
Income Net gain (loss) on investments and derivatives Dividends Interest for distribution purposes Income distributions from investments Capital gain distributions from investments Derivative income (loss) Dividends expense on financial assets (liabilities) sold
short Interest expense on financial assets (liabilities) sold short Net realized gain (loss) on sale of investments and
derivatives Change in unrealized appreciation (depreciation) in value
of investments and derivativesTotal net gain (loss) on investments and derivativesOther income Foreign exchange gain (loss) on cash Commitment fee income Securities lending revenue (Note 6) Fees rebateTotal other incomeTotal incomeExpensesManagement fees (Note 5)Administration fees (Note 5)Commissions and other portfolio transaction costsIndependent review committee feesSecurities borrowing fees (Note 2)Margin feesService feesInterest expenseWithholding taxesHarmonized sales taxOther expensesTotal expensesIncrease (decrease) in net assets attributable to holders of redeemable units

– 11 –
CI Canadian Equity Private Pool
Semi-Annual Financial Statements - September 30, 2021
Statements of Changes in Net Assets Attributable to Holders of Redeemable Units for the periods ended September 30 (in $000’s)
Net assets attributable to holders of redeemable units at the beginning of periodIncrease (decrease) in net assets attributable to holders of redeemable unitsDistributions to holders of redeemable units From net investment income From net realized gains Return of capitalTotal distributions to holders of redeemable units
Redeemable unit transactions Proceeds from redeemable units issued Reinvestment of distributions to holders of redeemable units Redemption of redeemable unitsNet increase (decrease) from redeemable unit transactionsNet increase (decrease) in net assets attributable to holders of redeemable unitsNet assets attributable to holders of redeemable units at the end of period
The accompanying notes are an integral part of these financial statements.
Financial Statements (unaudited)
Series A 2021 2020 3,469 2,198 505 568
- - - - - - - -
930 432 - - (43) (585) 887 (153) 1,392 415 4,861 2,613
Series F 2021 2020 2,104 3,870 332 552
- - - - - - - -
416 156 - - (60) (3,287) 356 (3,131) 688 (2,579) 2,792 1,291
Series I 2021 2020 1 9 1 2
- - - - - - - -
- - - - - (10) - (10) 1 (8) 2 1
Total Fund 2021 2020 5,574 6,077 838 1,122
- - - - - - - -
1,346 588 - - (103) (3,882) 1,243 (3,294) 2,081 (2,172) 7,655 3,905

– 12 –
CI Canadian Equity Private Pool
Semi-Annual Financial Statements - September 30, 2021
Statements of Cash Flowsfor the periods ended September 30 (in $000’s)
2021 2020
838 1,122
(23) 310 - - - -
(867) (1,461) 119 3,917 (1,371) (555) - - - - - - - - - - - - - - - - - - (1,304) 3,333
- - 1,372 576 (71) (3,886) 1,301 (3,310)
- - (3) 23 3 (5) - 18
- - - - - - - - - -
*Dividends and interest received as well as dividends and interest paid relate to operating activities of the Fund. The accompanying notes are an integral part of these financial statements.
Financial Statements (unaudited)
Cash flows from (used in) operating activitiesIncrease (decrease) in net assets attributable to holders of redeemable unitsAdjustments for: Net realized (gain) loss on sale of investments and derivatives Unrealized foreign exchange (gain) loss on cash Commissions and other portfolio transaction costs Change in unrealized (appreciation) depreciation in value of
investments and derivatives Proceeds from sale and maturity of investments and derivatives Purchase of investments and derivatives (Increase) decrease in cash collateral on deposit for short sale Non-cash distributions from investments Change in daily variation margin (Increase) decrease in dividends receivable (Increase) decrease in interest receivable (Increase) decrease in securities lending revenue receivable Increase (decrease) in management fees payable Increase (decrease) in administration fees payable Change in other accounts receivable and payableNet cash from (used in) operating activities
Cash flows from (used in) financing activitiesDistributions paid to holders of redeemable units, net of reinvested distributionsProceeds from issuance of redeemable unitsAmounts paid on redemption of redeemable unitsNet cash from (used in) financing activities Unrealized foreign exchange gain (loss) on cashNet increase (decrease) in cashCash (bank overdraft), beginning of periodCash (bank overdraft), end of period
Supplementary Information:Dividends received, net of withholding tax*Interest received, net of withholding tax*Dividends paid*Interest paid*Tax recoverable (paid)

– 13 –
CI Canadian Equity Private Pool
Semi-Annual Financial Statements - September 30, 2021
Percentages shown relate investments at fair value to net assets attributable to holders of redeemable units of the Fund.
Schedule of Investment Portfolio as at September 30, 2021 (unaudited)
Number of Units Description Average Cost
($)Fair Value
($)% of Net
Assets
UNDERLYING FUND(S) 513,614 CI Canadian Equity Income Private Trust (Series I) 6,074,350 7,685,829 100.40Total Investment Portfolio 6,074,350 7,685,829 100.40Other Net Assets (Liabilities) (30,331) (0.40) Net Assets Attributable to Holders of Redeemable Units 7,655,498 100.00

– 14 –
CI Canadian Equity Private Pool
Semi-Annual Financial Statements - September 30, 2021
The accompanying notes are an integral part of these financial statements.
Fund Specific Notes to Financial Statements (unaudited)
Interest in Unconsolidated Structured Entities (Note 2)
The following tables present the Fund’s interest in Unconsolidated Structured Entities.
as at September 30, 2021 Fair Value of
the Underlying Fund(s) / ETF(s)Fair Value of the Fund’s Investment
in the Underlying Fund(s) / ETF(s)Ownership in the
Underlying Fund(s) / ETF(s)
Unconsolidated Structured Entities (in $000’s) (in $000’s) (%)CI Canadian Equity Income Private Trust 135,043 7,686 5.7
as at March 31, 2021 Fair Value of
the Underlying Fund(s) / ETF(s)Fair Value of the Fund’s Investment
in the Underlying Fund(s) / ETF(s)Ownership in the
Underlying Fund(s) / ETF(s)
Unconsolidated Structured Entities (in $000’s) (in $000’s) (%)Sentry Canadian Equity Income Private Trust 127,393 5,545 4.4

– 15 –
CI Canadian Equity Private Pool
Semi-Annual Financial Statements - September 30, 2021
Redeemable Unit Transactions (Note 4)for the periods ended September 30
Number of redeemable units at the beginning of periodRedeemable units issued for cashRedeemable units issued for reinvested distributionsRedeemable units redeemedNumber of redeemable units at the end of period
Fund Specific Notes to Financial Statements (unaudited)
†A portion of brokerage commissions paid was used to cover research and market data services, termed soft dollar commissions. This amount has been estimated by the Manager of the Fund.The accompanying notes are an integral part of these financial statements.
Commissions (Note 2)for the periods ended September 30 (in $000’s)
2021 2020Brokerage commissions - -Soft dollar commissions† - -
Series A 2021 2020 269,983 256,932 65,091 39,650 - - (3,178) (61,310) 331,896 235,272
Series F 2021 2020 163,266 455,746 29,844 15,618 - - (4,075) (354,828) 189,035 116,536
Series I 2021 2020 110 1,102 - - - - - (992) 110 110

– 16 –
CI Canadian Equity Private Pool
Semi-Annual Financial Statements - September 30, 2021
The accompanying notes are an integral part of these financial statements.
Fund Specific Notes to Financial Statements (unaudited)
Securities Lending (Note 6)as at September 30 (in $000’s)
2021 2020Loaned - -Collateral (non-cash) - -
Securities Lending Revenue Reconciliation (Note 6)for the periods ended September 30 (in $000’s)
2021 2020Gross securities lending revenue - -Charges - -Securities lending revenue - -Charges as a % of gross securities lending revenue - -
Management and Administration Fees (Note 5) as at September 30, 2021 (%)
Annual management
fee rate:
Annual administration
fee rate:
Series A 1.650 0.15Series F 0.650 0.15Series I Paid directly by investor Paid directly by investor
Related Party Investments (Note 9)as at September 30 (in $000’s)
Investments 2021CI Canadian Equity Income Private Trust (Series I) 7,686
Investments 2020Sentry Canadian Equity Income Private Trust (Series I) 3,898

– 17 –
CI Canadian Equity Private Pool
Semi-Annual Financial Statements - September 30, 2021
The accompanying notes are an integral part of these financial statements.
Other Price RiskAs at September 30, 2021 and March 31, 2021, the Fund indirectly bears the other price risk exposure of the Underlying Fund.
As at September 30, 2021 and March 31, 2021, the Underlying Fund was predominantly invested in Canadian equities and therefore was sensitive to changes in general economic conditions in Canada.
As at September 30, 2021, had the fair value of equities in the investment portfolio of the Underlying Fund increased or decreased by 10% (March 31, 2021 - 10%), with all other variables held constant, net assets attributable to holders of redeemable units of the Fund would have increased or decreased, respectively, by approximately $769,000 (March 31, 2021 - $554,000). In practice, actual results may differ from this analysis and the difference may be material.
Currency RiskAs at September 30, 2021 and March 31, 2021, the Fund had no significant direct exposure to currency risk.
As at September 30, 2021 and March 31, 2021, the Fund indirectly bears the currency risk exposure of the Underlying Fund.
The tables below summarize the Underlying Fund’s exposure to currency risk.
as at September 30, 2021~ Currency Net Assets (%)U.S. Dollar 9.7 Total 9.7
as at March 31, 2021~ Currency Net Assets (%)U.S. Dollar 9.9 Total 9.9
~Includes monetary and non-monetary instruments, if any.
As at September 30, 2021, had the Canadian dollar strengthened or weakened by 10% (March 31, 2021 - 10%) in relation to all other foreign currencies held in the Underlying Fund, with all other variables held constant, net assets attributable to holders of redeemable units of the Fund would have indirectly decreased or increased, respectively, by approximately $75,000 (March 31, 2021 - $55,000). In practice, actual results may differ from this analysis and the difference may be material.
Interest Rate RiskAs at September 30, 2021 and March 31, 2021, the Fund had no significant direct exposure to interest rate risk.
As at September 30, 2021 and March 31, 2021, the Fund indirectly bears the interest rate risk exposure of the Underlying Fund.
As at September 30, 2021 the Underlying Fund did not have a significant exposure to interest rate risk as substantially all of its assets were invested in equities.
As at March 31, 2021, the Underlying Fund did not have a significant exposure to interest rate risk as substantially all of its assets were invested in equities and option(s).
Financial Instruments Risks (Note 10)
Concentration RiskThe tables below summarize the Underlying Fund’s exposure to concentration risk.
as at September 30, 2021 Categories Net Assets (%)Financials 33.0Information Technology 18.7Industrials 14.6Energy 7.0Real Estate 7.0Consumer Staples 5.1Consumer Discretionary 5.0Health Care 4.6Communication Services 2.8Utilities 2.2Other Net Assets (Liabilities) 0.0 Total 100.0
as at March 31, 2021 Categories Net Assets (%)Long PositionsFinancials 34.4 Information Technology 18.2 Industrials 13.3 Real Estate 6.3 Energy 5.3 Consumer Staples 5.2 Health Care 4.9 Consumer Discretionary 4.8 Utilities 4.3 Communication Services 3.1 Other Net Assets (Liabilities) 0.2 Total Long Positions 100.0
Short PositionsOption Contract(s) (0.0)Total Short Positions (0.0)Total 100.0
Credit RiskAs at September 30, 2021 and March 31, 2021, the Fund had no significant direct exposure to credit risk.
As at September 30, 2021 and March 31, 2021, the Fund indirectly bears the credit risk exposure of the Underlying Fund.
As at September 30, 2021 the Underlying Fund did not have a significant exposure to credit risk as substantially all of its assets were invested in equities.
As at March 31, 2021, the Underlying Fund did not have a significant exposure to credit risk as substantially all of its assets were invested in equities and option(s).
Fund Specific Notes to Financial Statements (unaudited)
– 18 –
CI Canadian Equity Private Pool
Semi-Annual Financial Statements - September 30, 2021
The accompanying notes are an integral part of these financial statements.
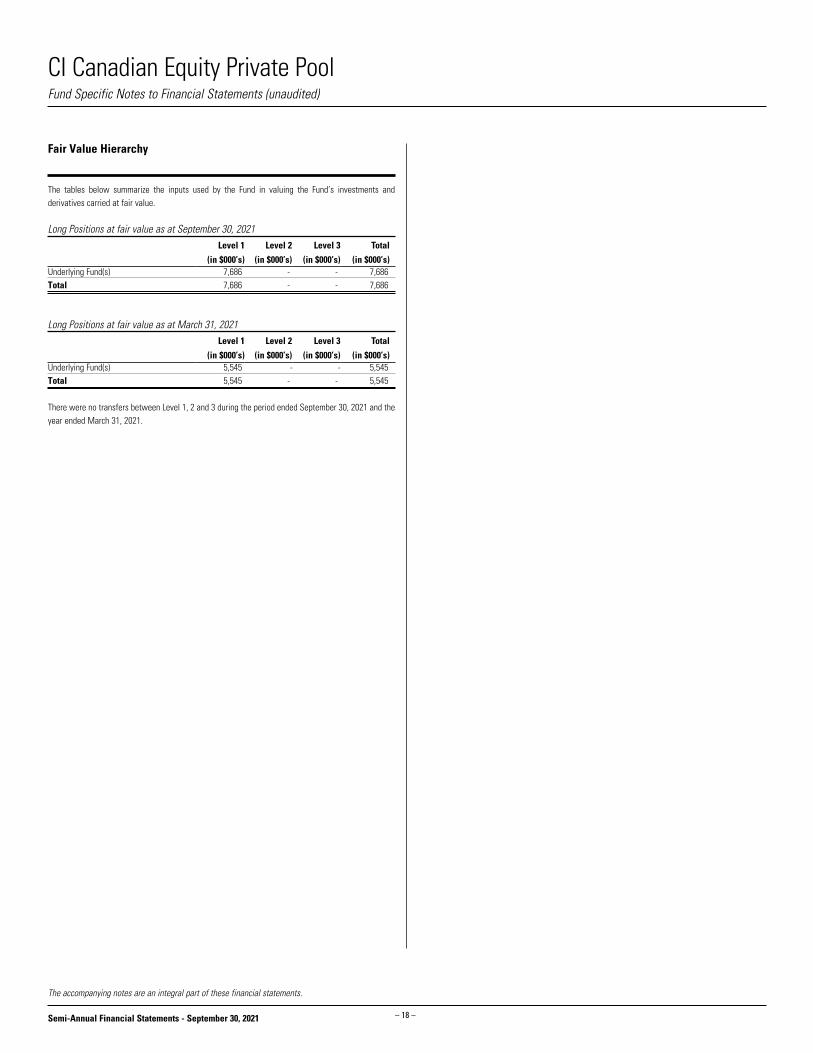
Fair Value Hierarchy
The tables below summarize the inputs used by the Fund in valuing the Fund’s investments and derivatives carried at fair value.
Long Positions at fair value as at September 30, 2021Level 1 Level 2 Level 3 Total
(in $000’s) (in $000’s) (in $000’s) (in $000’s)Underlying Fund(s) 7,686 - - 7,686 Total 7,686 - - 7,686
Long Positions at fair value as at March 31, 2021Level 1 Level 2 Level 3 Total
(in $000’s) (in $000’s) (in $000’s) (in $000’s)Underlying Fund(s) 5,545 - - 5,545 Total 5,545 - - 5,545
There were no transfers between Level 1, 2 and 3 during the period ended September 30, 2021 and the year ended March 31, 2021.
Fund Specific Notes to Financial Statements (unaudited)

– 19 –
CI Global Concentrated Equity Private Pool
Semi-Annual Financial Statements - September 30, 2021
Statements of Financial Position (in $000’s except for per unit amounts and units outstanding)
as at as at Sept. 30, 2021 Mar. 31, 2021 9,635 7,792 - - 303 197
3 18 - - - - - - - - 7 8 - - - - - - - 9 31 - 9,979 8,024
- - - -
14 - - - - - - - - - 11 40 - - - - - - - - - - 25 40
9,954 7,984
Statements of Financial Position (cont’d)(in $000’s except for per unit amounts and units outstanding)
Net assets attributable to holders of redeemable units
per Series (Note 4):
Net assets attributable to holders of redeemable
units per unit: Number of redeemable
units outstanding:
as at Sept. 30, 2021
as at Mar. 31, 2021
as at Sept. 30, 2021
as at Mar. 31, 2021
as at Sept. 30, 2021
as at Mar. 31, 2021
Series A 3,571 2,969 14.24 13.49 250,686 220,159Series F 6,382 5,014 14.40 13.56 443,226 369,677Series I 1 1 14.51 13.60 98 98
AssetsCurrent assetsInvestmentsInvestments pledged as collateralCashUnrealized gain on futures and foreign currency forward contractsSwaps, swaptions and optionsDaily variation margin on derivative instrumentsFees rebate receivableCash collateral on deposit for short saleDividends receivableInterest receivableReceivable for distribution from investmentsSecurities lending revenue receivable (Note 6)Receivable for investments soldReceivable for unit subscriptions
LiabilitiesCurrent liabilitiesInvestments sold shortBank overdraftUnrealized loss on futures and foreign currency forward contractsSwaps, swaptions and options Dividends payable on investments sold shortInterest payable on investments sold shortDaily variation margin on derivative instrumentsPayable for investments purchasedPayable for unit redemptionsDistributions payable to holders of redeemable units Management fees payableAdministration fees payableAccounts payable and accrued liabilities
Net assets attributable to holders of redeemable units
The accompanying notes are an integral part of these financial statements.
Financial Statements (unaudited)
CIG - 2054

– 20 –
CI Global Concentrated Equity Private Pool
Semi-Annual Financial Statements - September 30, 2021
Statements of Comprehensive Incomefor the periods ended September 30(in $000’s except for per unit amounts and number of units)
2021 2020
159 21 - - - - - - - -
- - - -
152 (50)
259 503 570 474 6 (3) - - - - - - 6 (3) 576 471
50 14 7 1 10 4 1 1 - - - - - 7 - - 13 3 7 2 - - 88 32
488 439
The accompanying notes are an integral part of these financial statements.
Financial Statements (unaudited)
Statements of Comprehensive Income (cont’d)for the periods ended September 30(in $000’s except for per unit amounts and number of units)
Increase (decrease) in net assets attributable to
holders of redeemable units per Series:
Increase (decrease) in net assets attributable to
holders of redeemable units per unit:
Weighted average number of units:
2021 2020 2021 2020 2021 2020Series A 171 178 0.71 2.01 239,813 89,075Series F 317 260 0.78 1.88 410,954 137,886Series I - 1 0.89 2.85 99 317
Income Net gain (loss) on investments and derivatives Dividends Interest for distribution purposes Income distributions from investments Capital gain distributions from investments Derivative income (loss) Dividends expense on financial assets (liabilities) sold
short Interest expense on financial assets (liabilities) sold short Net realized gain (loss) on sale of investments and
derivatives Change in unrealized appreciation (depreciation) in value
of investments and derivativesTotal net gain (loss) on investments and derivativesOther income Foreign exchange gain (loss) on cash Commitment fee income Securities lending revenue (Note 6) Fees rebateTotal other incomeTotal incomeExpensesManagement fees (Note 5)Administration fees (Note 5)Commissions and other portfolio transaction costsIndependent review committee feesSecurities borrowing fees (Note 2)Margin feesService feesInterest expenseWithholding taxesHarmonized sales taxOther expensesTotal expensesIncrease (decrease) in net assets attributable to holders of redeemable units

– 21 –
CI Global Concentrated Equity Private Pool
Semi-Annual Financial Statements - September 30, 2021
Statements of Changes in Net Assets Attributable to Holders of Redeemable Unitsfor the periods ended September 30 (in $000’s)
Net assets attributable to holders of redeemable units at the beginning of periodIncrease (decrease) in net assets attributable to holders of redeemable unitsDistributions to holders of redeemable units From net investment income From net realized gains Return of capitalTotal distributions to holders of redeemable units
Redeemable unit transactions Proceeds from redeemable units issued Reinvestment of distributions to holders of redeemable units Redemption of redeemable unitsNet increase (decrease) from redeemable unit transactionsNet increase (decrease) in net assets attributable to holders of redeemable unitsNet assets attributable to holders of redeemable units at the end of period
The accompanying notes are an integral part of these financial statements.
Financial Statements (unaudited)
Series A 2021 2020 2,969 1,025 171 178
- - - - - - - -
441 154 - - (10) (209) 431 (55) 602 123 3,571 1,148
Series F 2021 2020 5,014 1,304 317 260
- - - - - - - -
1,476 402 - - (425) (70) 1,051 332 1,368 592 6,382 1,896
Series I 2021 2020 1 11 - 1
- - - - - - - -
- - - - - (11) - (11) - (10) 1 1
Total Fund 2021 2020 7,984 2,340 488 439
- - - - - - - -
1,917 556 - - (435) (290) 1,482 266 1,970 705 9,954 3,045

– 22 –
CI Global Concentrated Equity Private Pool
Semi-Annual Financial Statements - September 30, 2021
Statements of Cash Flowsfor the periods ended September 30 (in $000’s)
2021 2020
488 439
(152) 50 - - 10 4
(259) (503) 2,226 1,143 (3,659) (1,351) - - - - - - 1 3 - - - - - - - - - - (1,345) (215)
- - 1,886 556 (435) (290) 1,451 266
- - 106 51 197 109 303 160
147 21 - - - - - - - -
*Dividends and interest received as well as dividends and interest paid relate to operating activities of the Fund. The accompanying notes are an integral part of these financial statements.
Financial Statements (unaudited)
Cash flows from (used in) operating activitiesIncrease (decrease) in net assets attributable to holders of redeemable unitsAdjustments for: Net realized (gain) loss on sale of investments and derivatives Unrealized foreign exchange (gain) loss on cash Commissions and other portfolio transaction costs Change in unrealized (appreciation) depreciation in value of
investments and derivatives Proceeds from sale and maturity of investments and derivatives Purchase of investments and derivatives (Increase) decrease in cash collateral on deposit for short sale Non-cash distributions from investments Change in daily variation margin (Increase) decrease in dividends receivable (Increase) decrease in interest receivable (Increase) decrease in securities lending revenue receivable Increase (decrease) in management fees payable Increase (decrease) in administration fees payable Change in other accounts receivable and payableNet cash from (used in) operating activities
Cash flows from (used in) financing activitiesDistributions paid to holders of redeemable units, net of reinvested distributionsProceeds from issuance of redeemable unitsAmounts paid on redemption of redeemable unitsNet cash from (used in) financing activities Unrealized foreign exchange gain (loss) on cashNet increase (decrease) in cashCash (bank overdraft), beginning of periodCash (bank overdraft), end of period
Supplementary Information:Dividends received, net of withholding tax*Interest received, net of withholding tax*Dividends paid*Interest paid*Tax recoverable (paid)

– 23 –
CI Global Concentrated Equity Private Pool
Semi-Annual Financial Statements - September 30, 2021
Percentages shown relate investments at fair value to net assets attributable to holders of redeemable units of the Fund.
Schedule of Investment Portfolio as at September 30, 2021 (unaudited)
Number ofUnits/Sharesor Par Value Description
Average Cost($)
Fair Value($)
% of Net Assets
U.S.A. 1,026 Abbott Laboratories Inc. 150,484 153,513 2,747 Advanced Micro Devices Inc. 262,672 358,023 95 Alphabet Inc., Class C 226,527 320,707 59 Amazon.com Inc. 226,399 245,488 2,359 Apple Inc. 345,543 422,787 1,422 CIGNA Corp. 380,705 360,507 2,040 Citigroup Inc. 151,854 181,334 988 Danaher Corp. 304,301 380,974 2,163 East West Bancorp Inc. 196,460 212,432 4,973 Equitable Holdings Inc. 169,574 186,695 721 Home Depot Inc. 261,522 299,771 1,147 Honeywell International Inc. 281,966 308,396 2,862 Invitation Homes Inc. 110,815 138,946 879 Microsoft Corp. 252,058 313,871 2,658 Mondelez International Inc. 190,683 195,869 971 NIKE Inc., Class B 153,737 178,613 937 NVIDIA Corp. 156,560 245,857 1,261 Procter & Gamble Co. 211,470 223,285 1,132 Prologis Inc. 143,160 179,839 1,003 QUALCOMM Inc. 188,476 163,855 1,021 Sempra Energy 165,638 163,589 1,346 Snap Inc. 102,736 125,936 2,904 Synchrony Financial 130,994 179,790 4,883 The Williams Co., Inc. 140,746 160,433 855 Zoetis Inc. 210,992 210,241 5,116,072 5,910,751 59.39 GERMANY 1,647 Daimler AG 173,376 185,387 6,066 Hensoldt AG 118,096 121,571 1,668 Siemens AG, Registered Shares 342,044 347,309 633,516 654,267 6.57 CANADA 9,062 Barrick Gold Corp. 261,619 207,248 13,113 Eupraxia Pharmaceuticals Inc. 94,783 35,405 5,194 Eupraxia Pharmaceuticals Inc., Warrants (09 March 2026) - 2,130 8,131 First Quantum Minerals Ltd. 166,030 190,672 1,521 Nutrien Ltd. 95,643 125,041 778 West Fraser Timber Co., Ltd. 68,784 82,997 686,859 643,493 6.46 NETHERLANDS 20,942 ING Groep N.V. 257,785 386,155 2,557 Koninklijke Vopak N.V. 162,062 127,552 1,955 STMicroelectronics N.V. 99,704 108,321 519,551 622,028 6.25 FRANCE 2,935 Sanofi S.A. 368,301 357,751 3.59 SWITZERLAND 1,779 Nestlé S.A., Registered Shares 255,012 272,487 2.74 IRELAND 3,605 CRH PLC 200,034 214,526 2.16 GUERNSEY 13,278 Burford Capital Ltd. 158,508 184,828 1.86 HONG KONG 12,530 AIA Group Ltd. 189,975 183,379 1.84

– 24 –
CI Global Concentrated Equity Private Pool
Semi-Annual Financial Statements - September 30, 2021
Percentages shown relate investments at fair value to net assets attributable to holders of redeemable units of the Fund.
Schedule of Investment Portfolio as at September 30, 2021 (unaudited) (cont’d)
NORWAY 18,363 Norsk Hydro ASA 117,217 174,323 1.75 BERMUDA 21,477 Conduit Holdings Ltd. 190,342 173,917 1.75 AUSTRALIA 20,738 Atlas Arteria Ltd. 122,976 123,242 1.24 MEXICO 10,901 Fomento Económico Mexicano, S.A.B. de C.V. 109,851 119,887 1.20Commissions and other portfolio transaction costs (5,016)Total Investment Portfolio before Derivative Instruments 8,663,198 9,634,879 96.80Foreign Currency Forward Contract(s) (see Schedule A) (11,006) (0.11)Total Investment Portfolio 8,663,198 9,623,873 96.69Other Net Assets (Liabilities) 329,656 3.31Net Assets Attributable to Holders of Redeemable Units 9,953,529 100.00
Number ofUnits/Sharesor Par Value Description
Average Cost($)
Fair Value($)
% of Net Assets

– 25 –
CI Global Concentrated Equity Private Pool
Semi-Annual Financial Statements - September 30, 2021
Schedule of Investment Portfolio as at September 30, 2021 (unaudited) (cont’d)
‡Credit ratings are obtained from S&P Global Ratings, where available, otherwise ratings are obtained from: Moody’s Investors Service or Dominion Bond Rating Service.
Schedule AForeign Currency Forward Contract(s)
CounterpartyCredit Rating of the Counterparty‡ Settlement Date
Currency Buy Position
Currency Sell Position
Contract(s) Rate
Unrealized Gain (Loss) ($)
Bank of Montreal A-1 November 18, 2021 CAD 73,175 USD 58,275 1.26 (641)Bank of Montreal A-1 December 15, 2021 CAD 87,487 USD 69,080 1.27 (8)Canadian Imperial Bank of Commerce A-1 October 20, 2021 CAD 37,333 USD 29,862 1.25 (491)Canadian Imperial Bank of Commerce A-1 October 20, 2021 CAD 5,031 USD 3,979 1.26 (9)Canadian Imperial Bank of Commerce A-1 November 18, 2021 CAD 73,291 USD 58,261 1.26 (507)Canadian Imperial Bank of Commerce A-1 December 15, 2021 CAD 62,289 USD 49,343 1.26 (208)Citigroup Inc. A-2 October 20, 2021 CAD 74,416 USD 59,724 1.25 (1,232)Citigroup Inc. A-2 November 18, 2021 CAD 73,124 USD 58,268 1.25 (683)Goldman Sachs Group Inc. A-2 October 20, 2021 CAD 49,789 USD 39,816 1.25 (643)Goldman Sachs Group Inc. A-2 November 18, 2021 CAD 45,546 USD 36,418 1.25 (583)Goldman Sachs Group Inc. A-2 December 15, 2021 CAD 62,161 USD 49,343 1.26 (335)HSBC Holdings PLC A-1 October 20, 2021 CAD 38,609 USD 30,986 1.25 (639)HSBC Holdings PLC A-1 November 18, 2021 CAD 45,655 USD 36,418 1.25 (474)HSBC Holdings PLC A-1 December 15, 2021 CAD 106,392 USD 83,534 1.27 590 JPMorgan Chase & Co. A-2 October 20, 2021 CAD 74,920 USD 59,724 1.25 (729)JPMorgan Chase & Co. A-2 November 18, 2021 CAD 41,122 USD 32,776 1.25 (394)JPMorgan Chase & Co. A-2 December 15, 2021 CAD 61,868 USD 49,343 1.25 (628)Morgan Stanley A-2 October 20, 2021 CAD 111,400 USD 89,586 1.24 (2,072)Morgan Stanley A-2 December 15, 2021 CAD 87,500 USD 69,080 1.27 5 Morgan Stanley A-2 December 14, 2021 USD 74,465 GBP 54,000 1.38 2,148 Royal Bank of Canada A-1+ October 20, 2021 CAD 74,415 USD 59,724 1.25 (1,233)Royal Bank of Canada A-1+ November 18, 2021 CAD 59,585 USD 47,720 1.25 (860)Royal Bank of Canada A-1+ December 15, 2021 CAD 62,165 USD 49,343 1.26 (331)Toronto-Dominion Bank A-1+ November 18, 2021 CAD 41,115 USD 32,776 1.25 (401)Toronto-Dominion Bank A-1+ December 15, 2021 CAD 61,848 USD 49,343 1.25 (648)Total Foreign Currency Forward Contract(s) Value (11,006)

– 26 –
CI Global Concentrated Equity Private Pool
Semi-Annual Financial Statements - September 30, 2021
The accompanying notes are an integral part of these financial statements.
Fund Specific Notes to Financial Statements (unaudited)
Offsetting of Financial Instruments (Note 2)
The following tables show the net impact on the Fund’s Statements of Financial Position if all rights to offset were exercised.
as at September 30, 2021Amounts Eligible for Offset
Gross Assets/(Liabilities)
FinancialInstruments
CollateralReceived/(Paid)
NetExposure
(in $000’s) (in $000’s) (in $000’s) (in $000’s)Derivative assets - Foreign currency forward contracts 3 (3) - -Derivative assets - Swaps and swaptions - - - -Total 3 (3) - -Derivative liabilities - Foreign currency forward contracts (14) 3 - (11)Derivative liabilities - Swaps and swaptions - - - -Total (14) 3 - (11)
as at March 31, 2021Amounts Eligible for Offset
Gross Assets/(Liabilities)
FinancialInstruments
CollateralReceived/(Paid)
NetExposure
(in $000’s) (in $000’s) (in $000’s) (in $000’s)Derivative assets - Foreign currency forward contracts 18 - - 18Derivative assets - Swaps and swaptions - - - -Total 18 - - 18Derivative liabilities - Foreign currency forward contracts - - - -Derivative liabilities - Swaps and swaptions - - - -Total - - - -

– 27 –
CI Global Concentrated Equity Private Pool
Semi-Annual Financial Statements - September 30, 2021
Redeemable Unit Transactions (Note 4)for the periods ended September 30
Number of redeemable units at the beginning of periodRedeemable units issued for cashRedeemable units issued for reinvested distributionsRedeemable units redeemedNumber of redeemable units at the end of period
Fund Specific Notes to Financial Statements (unaudited)
†A portion of brokerage commissions paid was used to cover research and market data services, termed soft dollar commissions. This amount has been estimated by the Manager of the Fund.The accompanying notes are an integral part of these financial statements.
Commissions (Note 2)for the periods ended September 30 (in $000’s)
2021 2020Brokerage commissions 5 2Soft dollar commissions† 2 1
Series A 2021 2020 220,159 105,640 31,299 13,428 - - (772) (20,394) 250,686 98,674
Series F 2021 2020 369,677 134,988 103,199 34,295 - - (29,650) (6,289) 443,226 162,994
Series I 2021 2020 98 1,049 - - - - - (951) 98 98

– 28 –
CI Global Concentrated Equity Private Pool
Semi-Annual Financial Statements - September 30, 2021
The accompanying notes are an integral part of these financial statements.
Fund Specific Notes to Financial Statements (unaudited)
Securities Lending (Note 6)as at September 30 (in $000’s)
2021 2020Loaned 12 153Collateral (non-cash) 12 156
Securities Lending Revenue Reconciliation (Note 6)for the periods ended September 30 (in $000’s)
2021 2020Gross securities lending revenue - -Charges - -Securities lending revenue - -Charges as a % of gross securities lending revenue - -
Management and Administration Fees (Note 5) as at September 30, 2021 (%)
Annual management
fee rate:
Annual administration
fee rate:
Series A 1.700 0.15Series F 0.700 0.15Series I Paid directly by investor Paid directly by investor

– 29 –
CI Global Concentrated Equity Private Pool
Semi-Annual Financial Statements - September 30, 2021
The accompanying notes are an integral part of these financial statements.
Currency RiskThe tables below summarize the Fund’s exposure to currency risk.
as at September 30, 2021~
Currency
Financial Instruments Exposure Derivatives
Net Exposure
Net Assets
(%)(in $000’s) (in $000’s) (in $000’s)U.S. Dollar 6,355 (1,429) 4,926 49.5 Euro 1,849 - 1,849 18.6 Swiss Franc 272 - 272 2.7 Hong Kong Dollar 181 - 181 1.8 Norwegian Krone 172 - 172 1.7 Australian Dollar 124 - 124 1.2 Mexican Peso 120 - 120 1.2 British Pound 174 (92) 82 0.8 Total 9,247 (1,521) 7,726 77.5
as at March 31, 2021~
Currency
Financial Instruments Exposure Derivatives
Net Exposure
Net Assets
(%)(in $000’s) (in $000’s) (in $000’s)U.S. Dollar 5,010 (1,220) 3,790 47.5 Euro 1,295 - 1,295 16.2 Swiss Franc 192 - 192 2.4 Norwegian Krone 180 - 180 2.3 British Pound 354 (175) 179 2.2 Hong Kong Dollar 177 - 177 2.2 Australian Dollar 92 - 92 1.2 Mexican Peso 80 - 80 1.0 Total 7,380 (1,395) 5,985 75.0
~Includes monetary and non-monetary instruments, if any.
As at September 30, 2021, had the Canadian dollar strengthened or weakened by 10% (March 31, 2021 - 10%) in relation to all other foreign currencies held in the Fund, with all other variables held constant, net assets attributable to holders of redeemable units of the Fund would have decreased or increased, respectively, by approximately $773,000 (March 31, 2021 - $599,000). In practice, actual results may differ from this analysis and the difference may be material.
Interest Rate RiskAs at September 30, 2021 and March 31, 2021, the Fund did not have a significant exposure to interest rate risk as substantially all of its assets were invested in equities and derivatives.
Fair Value Hierarchy
The tables below summarize the inputs used by the Fund in valuing the Fund’s investments and derivatives carried at fair value.
Long Positions at fair value as at September 30, 2021Level 1 Level 2 Level 3 Total
(in $000’s) (in $000’s) (in $000’s) (in $000’s)Equities 9,635 - - 9,635 Foreign currency forward contract(s), net - (11) - (11)Total 9,635 (11) - 9,624
Financial Instruments Risks (Note 10)
Concentration RiskFor Concentration Risk as at September 30, 2021, refer to the Schedule of Investment Portfolio.
The table below summarizes the Fund’s exposure to concentration risk.
as at March 31, 2021Categories Net Assets (%)U.S.A. 55.0 Canada 8.6 Netherlands 6.4 Germany 6.3 France 3.5 Cayman Islands 2.6 Switzerland 2.4 Bermuda 2.4 Norway 2.3 Other Net Assets (Liabilities) 2.2 Ireland 2.1 Guernsey 1.8 Italy 1.3 Australia 1.1 Mexico 1.0 Hong Kong 0.9 Foreign Currency Forward Contract(s) 0.2 Total 100.0
Credit RiskAs at September 30, 2021, the Fund’s exposure to credit risk through derivative instruments was insignificant.
The Fund was invested in fixed income securities, preferred securities and derivative instruments, if any, with the following credit ratings, as per the table below.
as at March 31, 2021Credit Rating^* Net Assets (%)AA/Aa/A+ 0.2Not Rated 2.5Total 2.7
^Credit ratings are obtained from S&P Global Ratings, where available, otherwise ratings are obtained from: Moody’s
Investors Service or Dominion Bond Rating Service, respectively.
*Refer to Note 10 for Credit Rating Chart reference.
Other Price RiskAs at September 30, 2021 and March 31, 2021, the Fund was predominantly invested in global equities and therefore was sensitive to changes in general economic conditions across the world.
As at September 30, 2021, had the fair value of equities in the investment portfolio increased or decreased by 10% (March 31, 2021 - 10%), with all other variables held constant, net assets attributable to holders of redeemable units of the Fund would have increased or decreased, respectively, by approximately $964,000 (March 31, 2021 - $779,000). In practice, actual results may differ from this analysis and the difference may be material.
Fund Specific Notes to Financial Statements (unaudited)

– 30 –
CI Global Concentrated Equity Private Pool
Semi-Annual Financial Statements - September 30, 2021
The accompanying notes are an integral part of these financial statements.
Fair Value Hierarchy (cont’d)
Long Positions at fair value as at March 31, 2021Level 1 Level 2 Level 3 Total
(in $000’s) (in $000’s) (in $000’s) (in $000’s)Equities 7,792 - - 7,792 Foreign currency forward contract(s), net - 18 - 18 Total 7,792 18 - 7,810
There were no transfers between Level 1, 2 and 3 during the period ended September 30, 2021 and the year ended March 31, 2021.
Fund Specific Notes to Financial Statements (unaudited)

– 31 –
CI Global Equity Alpha Private Pool
Semi-Annual Financial Statements - September 30, 2021
Statements of Financial Position (in $000’s except for per unit amounts and units outstanding)
as at as at Sept. 30, 2021 Mar. 31, 2021 126,858 94,979 - - 4,101 1,140
- - - - - - - - - - 200 122 - - - - - - - 879 456 504 131,615 97,624
- - - -
- - - - - - - - - - 3,330 510 138 240 - - - - - - - - 3,468 750
128,147 96,874
Statements of Financial Position (cont’d)(in $000’s except for per unit amounts and units outstanding)
Net assets attributable to holders of redeemable units
per Series (Note 4):
Net assets attributable to holders of redeemable
units per unit: Number of redeemable
units outstanding:
as at Sept. 30, 2021
as at Mar. 31, 2021
as at Sept. 30, 2021
as at Mar. 31, 2021
as at Sept. 30, 2021
as at Mar. 31, 2021
Series A 41,484 31,319 13.72 12.95 3,023,103 2,417,548Series F 86,662 65,554 13.93 13.08 6,221,547 5,013,044Series I 1 1 14.05 13.12 104 104
AssetsCurrent assetsInvestmentsInvestments pledged as collateralCashUnrealized gain on futures and foreign currency forward contractsSwaps, swaptions and optionsDaily variation margin on derivative instrumentsFees rebate receivableCash collateral on deposit for short saleDividends receivableInterest receivableReceivable for distribution from investmentsSecurities lending revenue receivable (Note 6)Receivable for investments soldReceivable for unit subscriptions
LiabilitiesCurrent liabilitiesInvestments sold shortBank overdraftUnrealized loss on futures and foreign currency forward contractsSwaps, swaptions and options Dividends payable on investments sold shortInterest payable on investments sold shortDaily variation margin on derivative instrumentsPayable for investments purchasedPayable for unit redemptionsDistributions payable to holders of redeemable units Management fees payableAdministration fees payableAccounts payable and accrued liabilities
Net assets attributable to holders of redeemable units
The accompanying notes are an integral part of these financial statements.
Financial Statements (unaudited)
CIG - 2056

– 32 –
CI Global Equity Alpha Private Pool
Semi-Annual Financial Statements - September 30, 2021
Statements of Comprehensive Incomefor the periods ended September 30(in $000’s except for per unit amounts and number of units)
2021 2020
1,374 859 4 1 - - - - - -
- - - -
2,350 (1,297)
3,867 16,591 7,595 16,154 (21) 107 - - 7 7 - - (14) 114 7,581 16,268
601 313 88 58 81 94 1 1 - - - - - - - 1 199 136 82 40 - - 1,052 643
6,529 15,625
The accompanying notes are an integral part of these financial statements.
Financial Statements (unaudited)
Statements of Comprehensive Income (cont’d)for the periods ended September 30(in $000’s except for per unit amounts and number of units)
Increase (decrease) in net assets attributable to
holders of redeemable units per Series:
Increase (decrease) in net assets attributable to
holders of redeemable units per unit:
Weighted average number of units:
2021 2020 2021 2020 2021 2020Series A 1,874 1,456 0.69 2.04 2,733,308 714,822Series F 4,655 14,168 0.80 2.14 5,790,762 6,614,458Series I - 1 0.92 2.97 104 316
Income Net gain (loss) on investments and derivatives Dividends Interest for distribution purposes Income distributions from investments Capital gain distributions from investments Derivative income (loss) Dividends expense on financial assets (liabilities) sold
short Interest expense on financial assets (liabilities) sold short Net realized gain (loss) on sale of investments and
derivatives Change in unrealized appreciation (depreciation) in value
of investments and derivativesTotal net gain (loss) on investments and derivativesOther income Foreign exchange gain (loss) on cash Commitment fee income Securities lending revenue (Note 6) Fees rebateTotal other incomeTotal incomeExpensesManagement fees (Note 5)Administration fees (Note 5)Commissions and other portfolio transaction costsIndependent review committee feesSecurities borrowing fees (Note 2)Margin feesService feesInterest expenseWithholding taxesHarmonized sales taxOther expensesTotal expensesIncrease (decrease) in net assets attributable to holders of redeemable units

– 33 –
CI Global Equity Alpha Private Pool
Semi-Annual Financial Statements - September 30, 2021
Statements of Changes in Net Assets Attributable to Holders of Redeemable Units for the periods ended September 30 (in $000’s)
Net assets attributable to holders of redeemable units at the beginning of periodIncrease (decrease) in net assets attributable to holders of redeemable unitsDistributions to holders of redeemable units From net investment income From net realized gains Return of capitalTotal distributions to holders of redeemable units
Redeemable unit transactions Proceeds from redeemable units issued Reinvestment of distributions to holders of redeemable units Redemption of redeemable unitsNet increase (decrease) from redeemable unit transactionsNet increase (decrease) in net assets attributable to holders of redeemable unitsNet assets attributable to holders of redeemable units at the end of period
The accompanying notes are an integral part of these financial statements.
Financial Statements (unaudited)
Series A 2021 2020 31,319 7,139 1,874 1,456
- - - - - - - -
9,164 3,585 - - (873) (2,048) 8,291 1,537 10,165 2,993 41,484 10,132
Series F 2021 2020 65,554 95,490 4,655 14,168
- - - - - - - -
20,253 7,766 - - (3,800) (49,492) 16,453 (41,726) 21,108 (27,558) 86,662 67,932
Series I 2021 2020 1 10 - 1
- - - - - - - -
- - - - - (10) - (10) - (9) 1 1
Total Fund 2021 2020 96,874 102,639 6,529 15,625
- - - - - - - -
29,417 11,351 - - (4,673) (51,550) 24,744 (40,199) 31,273 (24,574) 128,147 78,065

– 34 –
CI Global Equity Alpha Private Pool
Semi-Annual Financial Statements - September 30, 2021
Statements of Cash Flowsfor the periods ended September 30 (in $000’s)
2021 2020
6,529 15,625
(2,350) 1,297 (1) (9) 81 94
(3,867) (16,591) 14,058 61,833 (36,102) (27,062) - - - - - - (78) 51 - - - - - - - - - - (21,730) 35,238
- - 29,300 11,703 (4,610) (50,169) 24,690 (38,466)
1 9 2,960 (3,228) 1,140 6,402 4,101 3,183
1,097 774 4 1 - - - 1 - -
*Dividends and interest received as well as dividends and interest paid relate to operating activities of the Fund. The accompanying notes are an integral part of these financial statements.
Financial Statements (unaudited)
Cash flows from (used in) operating activitiesIncrease (decrease) in net assets attributable to holders of redeemable unitsAdjustments for: Net realized (gain) loss on sale of investments and derivatives Unrealized foreign exchange (gain) loss on cash Commissions and other portfolio transaction costs Change in unrealized (appreciation) depreciation in value of
investments and derivatives Proceeds from sale and maturity of investments and derivatives Purchase of investments and derivatives (Increase) decrease in cash collateral on deposit for short sale Non-cash distributions from investments Change in daily variation margin (Increase) decrease in dividends receivable (Increase) decrease in interest receivable (Increase) decrease in securities lending revenue receivable Increase (decrease) in management fees payable Increase (decrease) in administration fees payable Change in other accounts receivable and payableNet cash from (used in) operating activities
Cash flows from (used in) financing activitiesDistributions paid to holders of redeemable units, net of reinvested distributionsProceeds from issuance of redeemable unitsAmounts paid on redemption of redeemable unitsNet cash from (used in) financing activities Unrealized foreign exchange gain (loss) on cashNet increase (decrease) in cashCash (bank overdraft), beginning of periodCash (bank overdraft), end of period
Supplementary Information:Dividends received, net of withholding tax*Interest received, net of withholding tax*Dividends paid*Interest paid*Tax recoverable (paid)

– 35 –
CI Global Equity Alpha Private Pool
Semi-Annual Financial Statements - September 30, 2021
Percentages shown relate investments at fair value to net assets attributable to holders of redeemable units of the Fund.
Schedule of Investment Portfolio as at September 30, 2021 (unaudited)
Number ofUnits/Sharesor Par Value Description
Average Cost($)
Fair Value($)
% of Net Assets
U.S.A. 217,413 ANGI Homeservices Inc. 3,439,189 3,398,111 68,776 Booz Allen Hamilton Holding Corp. 6,471,673 6,912,270 30,064 FTI Consulting Inc. 4,158,865 5,129,219 39,279 Oracle Corp. 2,939,617 4,334,759 102,565 The Hain Celestial Group Inc. 5,155,945 5,557,466 118,823 Interpublic Group of Co., Inc. 3,331,219 5,518,846 25,496,508 30,850,671 24.08 U.K. 1,747,901 ConvaTec Group PLC 6,189,359 6,443,215 758,656 DS Smith PLC 4,547,700 5,345,912 139,805 GlaxoSmithKline PLC, ADR 6,978,253 6,766,072 178,490 Weir Group PLC 4,796,260 5,152,499 22,511,572 23,707,698 18.50 JAPAN 70,828 Ebara Corp. 3,213,445 4,473,621 78,570 Makita Corp. 4,187,505 5,499,118 280,553 Santen Pharmaceutical Co., Ltd. 4,858,807 5,031,904 12,259,757 15,004,643 11.71 FRANCE 164,084 Bureau Veritas S.A. 4,978,429 6,430,088 21,646 Schneider Electric S.A. 2,530,320 4,569,990 7,508,749 11,000,078 8.58 MEXICO 1,015,968 Becle S.A.B. de C.V. 2,385,401 2,794,135 64,082 Fomento Económico Mexicano, S.A.B. de C.V., ADR 6,350,043 7,038,696 8,735,444 9,832,831 7.67 CAYMAN ISLANDS 150,270 Alibaba Group Holding Ltd. 5,423,762 3,476,718 16,730 Baidu Inc., ADR 4,050,291 3,257,976 9,474,053 6,734,694 5.26 ISRAEL 17,422 NICE-Systems Ltd., ADR 5,542,273 6,267,789 4.89 SWITZERLAND 56,487 DKSH Holding AG 5,003,552 5,623,442 4.39 SINGAPORE 189,483 DBS Group Holdings Ltd. 4,941,215 5,359,208 4.18 GERMANY 48,521 HeidelbergCement AG 4,924,190 4,611,556 3.60 PORTUGAL 284,691 Galp Energia SGPS S.A. 4,907,613 4,093,329 3.19 CANADA 45,882 Nutrien Ltd. 2,440,509 3,771,959 2.94Commissions and other portfolio transaction costs (203,783)Total Investment Portfolio 113,541,652 126,857,898 98.99Other Net Assets (Liabilities) 1,289,357 1.01Net Assets Attributable to Holders of Redeemable Units 128,147,255 100.00
– 36 –
CI Global Equity Alpha Private Pool
Semi-Annual Financial Statements - September 30, 2021
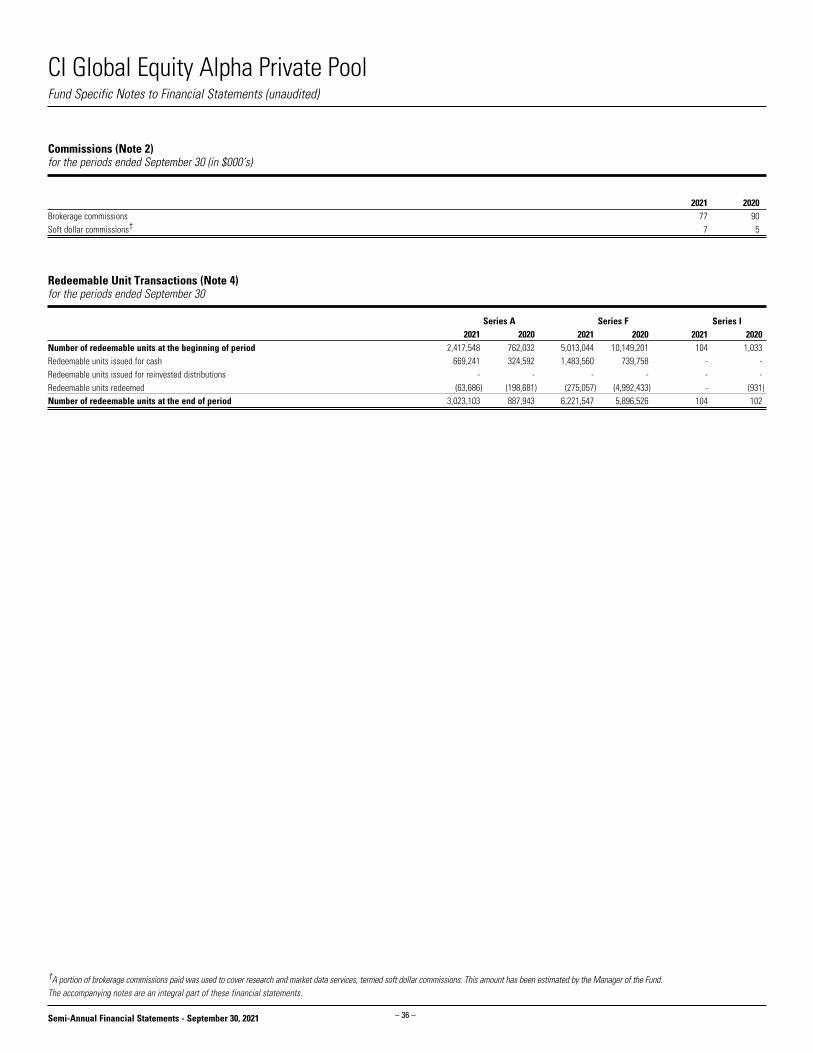
Redeemable Unit Transactions (Note 4)for the periods ended September 30
Number of redeemable units at the beginning of periodRedeemable units issued for cashRedeemable units issued for reinvested distributionsRedeemable units redeemedNumber of redeemable units at the end of period
Fund Specific Notes to Financial Statements (unaudited)
†A portion of brokerage commissions paid was used to cover research and market data services, termed soft dollar commissions. This amount has been estimated by the Manager of the Fund.The accompanying notes are an integral part of these financial statements.
Commissions (Note 2)for the periods ended September 30 (in $000’s)
2021 2020Brokerage commissions 77 90Soft dollar commissions† 7 5
Series A 2021 2020 2,417,548 762,032 669,241 324,592 - - (63,686) (198,681) 3,023,103 887,943
Series F 2021 2020 5,013,044 10,149,201 1,483,560 739,758 - - (275,057) (4,992,433) 6,221,547 5,896,526
Series I 2021 2020 104 1,033 - - - - - (931) 104 102

– 37 –
CI Global Equity Alpha Private Pool
Semi-Annual Financial Statements - September 30, 2021
The accompanying notes are an integral part of these financial statements.
Fund Specific Notes to Financial Statements (unaudited)
Securities Lending (Note 6)as at September 30 (in $000’s)
2021 2020Loaned 19,998 8,526Collateral (non-cash) 20,398 8,696
Securities Lending Revenue Reconciliation (Note 6)for the periods ended September 30 (in $000’s)
2021 2020Gross securities lending revenue 8 8Charges (1) (1)Securities lending revenue 7 7Charges as a % of gross securities lending revenue 12.5 12.5
Management and Administration Fees (Note 5) as at September 30, 2021 (%)
Annual management
fee rate:
Annual administration
fee rate:
Series A 1.700 0.15Series F 0.700 0.15Series I Paid directly by investor Paid directly by investor

– 38 –
CI Global Equity Alpha Private Pool
Semi-Annual Financial Statements - September 30, 2021
The accompanying notes are an integral part of these financial statements.
Currency Risk (cont’d)
as at March 31, 2021~
Currency
Financial Instruments Exposure Derivatives
Net Exposure
Net Assets
(%)(in $000’s) (in $000’s) (in $000’s)U.S. Dollar 36,308 - 36,308 37.5 Euro 19,786 - 19,786 20.4 British Pound 11,414 - 11,414 11.8 Japanese Yen 8,592 - 8,592 8.9 Swiss Franc 5,839 - 5,839 6.0 Hong Kong Dollar 3,575 - 3,575 3.7 Singapore Dollar 3,418 - 3,418 3.5 Mexican Peso 2,762 - 2,762 2.9 Total 91,694 - 91,694 94.7
~Includes monetary and non-monetary instruments, if any.
As at September 30, 2021, had the Canadian dollar strengthened or weakened by 10% (March 31, 2021 - 10%) in relation to all other foreign currencies held in the Fund, with all other variables held constant, net assets attributable to holders of redeemable units of the Fund would have decreased or increased, respectively, by approximately $11,996,000 (March 31, 2021 - $9,169,000). In practice, actual results may differ from this analysis and the difference may be material.
Interest Rate RiskAs at September 30, 2021 and March 31, 2021, the Fund did not have a significant exposure to interest rate risk as substantially all of its assets were invested in equities.
Fair Value Hierarchy
The tables below summarize the inputs used by the Fund in valuing the Fund’s investments and derivatives carried at fair value.
Long Positions at fair value as at September 30, 2021Level 1 Level 2 Level 3 Total
(in $000’s) (in $000’s) (in $000’s) (in $000’s)Equities 126,858 - - 126,858 Total 126,858 - - 126,858
Long Positions at fair value as at March 31, 2021Level 1 Level 2 Level 3 Total
(in $000’s) (in $000’s) (in $000’s) (in $000’s)Equities 94,979 - - 94,979 Total 94,979 - - 94,979
There were no transfers between Level 1, 2 and 3 during the period ended September 30, 2021 and the year ended March 31, 2021.
Financial Instruments Risks (Note 10)
Concentration RiskFor Concentration Risk as at September 30, 2021, refer to the Schedule of Investment Portfolio.
The table below summarizes the Fund’s exposure to concentration risk.
as at March 31, 2021Categories Net Assets (%)U.S.A. 23.1 U.K. 16.2 France 9.3 Japan 9.0 Mexico 8.9 Switzerland 5.8 Germany 4.5 Canada 4.2 Israel 3.7 Cayman Islands 3.7 Portugal 3.6 Singapore 3.5 Netherlands 2.4 Other Net Assets (Liabilities) 2.0 Total 100.0
Credit RiskAs at September 30, 2021 and March 31, 2021, the Fund did not have a significant exposure to credit risk as substantially all of its assets were invested in equities.
Other Price RiskAs at September 30, 2021 and March 31, 2021, the Fund was predominantly invested in global equities and therefore was sensitive to changes in general economic conditions across the world.
As at September 30, 2021, had the fair value of equities in the investment portfolio increased or decreased by 10% (March 31, 2021 - 10%), with all other variables held constant, net assets attributable to holders of redeemable units of the Fund would have increased or decreased, respectively, by approximately $12,686,000 (March 31, 2021 - $9,498,000). In practice, actual results may differ from this analysis and the difference may be material.
Currency RiskThe tables below summarize the Fund’s exposure to currency risk.
as at September 30, 2021~
Currency
Financial Instruments Exposure Derivatives
Net Exposure
Net Assets
(%)(in $000’s) (in $000’s) (in $000’s)U.S. Dollar 53,659 - 53,659 41.9 Euro 18,562 - 18,562 14.5 British Pound 15,721 - 15,721 12.3 Japanese Yen 15,056 - 15,056 11.7 Singapore Dollar 5,359 - 5,359 4.2 Swiss Franc 5,329 - 5,329 4.2 Hong Kong Dollar 3,477 - 3,477 2.7 Mexican Peso 2,794 - 2,794 2.2 Total 119,957 - 119,957 93.7
Fund Specific Notes to Financial Statements (unaudited)

– 39 –
CI Global Equity Core Private Pool
Semi-Annual Financial Statements - September 30, 2021
Statements of Financial Position (in $000’s except for per unit amounts and units outstanding)
as at as at Sept. 30, 2021 Mar. 31, 2021 2,007 1,888 - - - 10
- - - - - - - - - - 1 3 - - - - - - - - - - 2,008 1,901
- - 3 -
- - - - - - - - - - - - - - - - - - - - - - 3 -
2,005 1,901
Statements of Financial Position (cont’d)(in $000’s except for per unit amounts and units outstanding)
Net assets attributable to holders of redeemable units
per Series (Note 4):
Net assets attributable to holders of redeemable
units per unit: Number of redeemable
units outstanding:
as at Sept. 30, 2021
as at Mar. 31, 2021
as at Sept. 30, 2021
as at Mar. 31, 2021
as at Sept. 30, 2021
as at Mar. 31, 2021
Series I 2,005 1,901 12.53 11.88 160,065 160,065AssetsCurrent assetsInvestmentsInvestments pledged as collateralCashUnrealized gain on futures and foreign currency forward contractsSwaps, swaptions and optionsDaily variation margin on derivative instrumentsFees rebate receivableCash collateral on deposit for short saleDividends receivableInterest receivableReceivable for distribution from investmentsSecurities lending revenue receivable (Note 6)Receivable for investments soldReceivable for unit subscriptions
LiabilitiesCurrent liabilitiesInvestments sold shortBank overdraftUnrealized loss on futures and foreign currency forward contractsSwaps, swaptions and options Dividends payable on investments sold shortInterest payable on investments sold shortDaily variation margin on derivative instrumentsPayable for investments purchasedPayable for unit redemptionsDistributions payable to holders of redeemable units Management fees payableAdministration fees payableAccounts payable and accrued liabilities
Net assets attributable to holders of redeemable units
The accompanying notes are an integral part of these financial statements.
Financial Statements (unaudited)
CIG - 5069

– 40 –
CI Global Equity Core Private Pool
Semi-Annual Financial Statements - September 30, 2021
Statements of Comprehensive Incomefor the periods ended September 30(in $000’s except for per unit amounts and number of units)
2021 2020
59 12 - 1 - - - - - 19
- - - -
31 15
24 227 114 274 (1) (5) - - - - - - (1) (5) 113 269
- - - - 1 1 - - - - - - - - - - 8 - - - - - 9 1
104 268
The accompanying notes are an integral part of these financial statements.
Financial Statements (unaudited)
Statements of Comprehensive Income (cont’d)for the periods ended September 30(in $000’s except for per unit amounts and number of units)
Increase (decrease) in net assets attributable to
holders of redeemable units per Series:
Increase (decrease) in net assets attributable to
holders of redeemable units per unit:
Weighted average number of units:
2021 2020 2021 2020 2021 2020Series I 104 268 0.65 1.73 160,065 155,112Income
Net gain (loss) on investments and derivatives Dividends Interest for distribution purposes Income distributions from investments Capital gain distributions from investments Derivative income (loss) Dividends expense on financial assets (liabilities) sold
short Interest expense on financial assets (liabilities) sold short Net realized gain (loss) on sale of investments and
derivatives Change in unrealized appreciation (depreciation) in value
of investments and derivativesTotal net gain (loss) on investments and derivativesOther income Foreign exchange gain (loss) on cash Commitment fee income Securities lending revenue (Note 6) Fees rebateTotal other incomeTotal incomeExpensesManagement fees (Note 5)Administration fees (Note 5)Commissions and other portfolio transaction costsIndependent review committee feesSecurities borrowing fees (Note 2)Margin feesService feesInterest expenseWithholding taxesHarmonized sales taxOther expensesTotal expensesIncrease (decrease) in net assets attributable to holders of redeemable units

– 41 –
CI Global Equity Core Private Pool
Semi-Annual Financial Statements - September 30, 2021
Statements of Changes in Net Assets Attributable to Holders of Redeemable Units for the periods ended September 30 (in $000’s)
Net assets attributable to holders of redeemable units at the beginning of periodIncrease (decrease) in net assets attributable to holders of redeemable unitsDistributions to holders of redeemable units From net investment income From net realized gains Return of capitalTotal distributions to holders of redeemable units
Redeemable unit transactions Proceeds from redeemable units issued Reinvestment of distributions to holders of redeemable units Redemption of redeemable unitsNet increase (decrease) from redeemable unit transactionsNet increase (decrease) in net assets attributable to holders of redeemable unitsNet assets attributable to holders of redeemable units at the end of period
The accompanying notes are an integral part of these financial statements.
Financial Statements (unaudited)
Series I 2021 2020 1,901 1,417 104 268
- - - - - - - -
- - - - - - - - 104 268 2,005 1,685

– 42 –
CI Global Equity Core Private Pool
Semi-Annual Financial Statements - September 30, 2021
Statements of Cash Flowsfor the periods ended September 30 (in $000’s)
2021 2020
104 268
(31) (15) - (1) 1 1
(24) (227) 259 330 (324) (550) - - - - - - 2 1 - (1) - - - - - - - - (13) (194)
- - - - - - - -
- 1 (13) (194) 10 203 (3) 10
12 12 - - - - - - - -
*Dividends and interest received as well as dividends and interest paid relate to operating activities of the Fund. The accompanying notes are an integral part of these financial statements.
Financial Statements (unaudited)
Cash flows from (used in) operating activitiesIncrease (decrease) in net assets attributable to holders of redeemable unitsAdjustments for: Net realized (gain) loss on sale of investments and derivatives Unrealized foreign exchange (gain) loss on cash Commissions and other portfolio transaction costs Change in unrealized (appreciation) depreciation in value of
investments and derivatives Proceeds from sale and maturity of investments and derivatives Purchase of investments and derivatives (Increase) decrease in cash collateral on deposit for short sale Non-cash distributions from investments Change in daily variation margin (Increase) decrease in dividends receivable (Increase) decrease in interest receivable (Increase) decrease in securities lending revenue receivable Increase (decrease) in management fees payable Increase (decrease) in administration fees payable Change in other accounts receivable and payableNet cash from (used in) operating activities
Cash flows from (used in) financing activitiesDistributions paid to holders of redeemable units, net of reinvested distributionsProceeds from issuance of redeemable unitsAmounts paid on redemption of redeemable unitsNet cash from (used in) financing activities Unrealized foreign exchange gain (loss) on cashNet increase (decrease) in cashCash (bank overdraft), beginning of periodCash (bank overdraft), end of period
Supplementary Information:Dividends received, net of withholding tax*Interest received, net of withholding tax*Dividends paid*Interest paid*Tax recoverable (paid)

– 43 –
CI Global Equity Core Private Pool
Semi-Annual Financial Statements - September 30, 2021
Percentages shown relate investments at fair value to net assets attributable to holders of redeemable units of the Fund.
Schedule of Investment Portfolio as at September 30, 2021 (unaudited)
Number ofUnits/Sharesor Par Value Description
Average Cost($)
Fair Value($)
% of Net Assets
U.S.A. 160 Activision Blizzard Inc. 9,807 15,683 60 Adobe Systems Inc. 37,006 43,752 28 Alphabet Inc., Class A 41,470 94,815 2,274 Altice USA Inc. 96,135 59,678 13 Amazon.com Inc. 56,036 54,090 173 Anthem Inc. 68,657 81,688 580 Apollo Global Management Inc. 35,828 45,245 356 Baxter International Inc. 38,591 36,266 1,105 Berry Plastics Group Inc. 61,527 85,207 148 Boeing Co. 52,747 41,229 507 CSX Corp. 17,825 19,098 50 Danaher Corp. 20,999 19,280 913 DuPont de Nemours Inc. 69,904 78,624 112 Electronic Arts Inc. 18,002 20,179 229 Facebook Inc. 60,331 98,440 291 Intercontinental Exchange Inc. 36,121 42,320 174 Jacobs Engineering Group Inc. 21,496 29,208 1,465 LKQ Corp. 55,315 93,372 84 Mastercard Inc., Class A 29,698 36,991 196 McKesson Corp. 34,894 49,496 331 Microsoft Corp. 85,402 118,193 100 Parker Hannifin Corp. 35,496 35,416 551 Philip Morris International Inc. 56,877 66,153 85 S&P Global Inc. 37,489 45,744 85 Salesforce.com Inc. 25,642 29,200 583 Uber Technologies Inc. 43,337 33,081 185 Visa Inc., Class A 46,212 52,195 1,192,844 1,424,643 71.05 U.K. 951 Ashtead Group PLC 34,337 91,633 2,143 Imperial Brands PLC 68,845 56,998 209 London Stock Exchange Group PLC 30,672 26,573 133,854 175,204 8.74 NETHERLANDS 534 Takeaway.com N.V. 61,316 49,389 1,256 Universal Music Group N.V. 47,652 42,595 108,968 91,984 4.59 JERSEY ISLAND 473 Ferguson PLC 54,072 83,426 4.16 IRELAND 182 Linde PLC (EUR) 49,190 68,385 3.41 BERMUDA 599 Athene Holding Ltd. 34,973 52,251 2.61 JAPAN 68 Nintendo Co., Ltd. 35,314 42,029 2.10 CANADA 541 Enbridge Inc. 22,604 27,299 1.36 DENMARK 174 Novo Nordisk AS 11,956 21,332 1.06 FRANCE 1,256 Vivendi S.A. 55,888 20,095 1.00Commissions and other portfolio transaction costs (1,698)Total Investment Portfolio 1,697,965 2,006,648 100.08Other Net Assets (Liabilities) (1,521) (0.08)Net Assets Attributable to Holders of Redeemable Units 2,005,127 100.00

– 44 –
CI Global Equity Core Private Pool
Semi-Annual Financial Statements - September 30, 2021
Redeemable Unit Transactions (Note 4)for the periods ended September 30
Number of redeemable units at the beginning of periodRedeemable units issued for cashRedeemable units issued for reinvested distributionsRedeemable units redeemedNumber of redeemable units at the end of period
Fund Specific Notes to Financial Statements (unaudited)
†A portion of brokerage commissions paid was used to cover research and market data services, termed soft dollar commissions. This amount has been estimated by the Manager of the Fund.The accompanying notes are an integral part of these financial statements.
Commissions (Note 2)for the periods ended September 30 (in $000’s)
2021 2020Brokerage commissions - 1Soft dollar commissions† - -
Series I 2021 2020 160,065 155,112 - - - - - - 160,065 155,112

– 45 –
CI Global Equity Core Private Pool
Semi-Annual Financial Statements - September 30, 2021
The accompanying notes are an integral part of these financial statements.
Fund Specific Notes to Financial Statements (unaudited)
Securities Lending (Note 6)as at September 30 (in $000’s)
2021 2020Loaned 90 34Collateral (non-cash) 91 35
Securities Lending Revenue Reconciliation (Note 6)for the periods ended September 30 (in $000’s)
2021 2020Gross securities lending revenue - -Charges - -Securities lending revenue - -Charges as a % of gross securities lending revenue - -
Management and Administration Fees (Note 5) as at September 30, 2021 (%)
Annual management
fee rate:
Annual administration
fee rate: Series I Paid directly by investor Paid directly by investor

– 46 –
CI Global Equity Core Private Pool
Semi-Annual Financial Statements - September 30, 2021
The accompanying notes are an integral part of these financial statements.
Currency Risk (cont’d)
as at March 31, 2021~
Currency
Financial Instruments Exposure Derivatives
Net Exposure
Net Assets
(%)(in $000’s) (in $000’s) (in $000’s)U.S. Dollar 1,400 - 1,400 73.6 British Pound 237 - 237 12.5 Euro 128 - 128 6.7 Japanese Yen 49 - 49 2.6 Hong Kong Dollar 48 - 48 2.5 Danish Krone 15 - 15 0.8 Total 1,877 - 1,877 98.7
~Includes monetary and non-monetary instruments, if any.
As at September 30, 2021, had the Canadian dollar strengthened or weakened by 10% (March 31, 2021 - 10%) in relation to all other foreign currencies held in the Fund, with all other variables held constant, net assets attributable to holders of redeemable units of the Fund would have decreased or increased, respectively, by approximately $198,000 (March 31, 2021 - $188,000). In practice, actual results may differ from this analysis and the difference may be material.
Interest Rate RiskAs at September 30, 2021 and March 31, 2021, the Fund did not have a significant exposure to interest rate risk as substantially all of its assets were invested in equities.
Fair Value Hierarchy
The tables below summarize the inputs used by the Fund in valuing the Fund’s investments and derivatives carried at fair value.
Long Positions at fair value as at September 30, 2021Level 1 Level 2 Level 3 Total
(in $000’s) (in $000’s) (in $000’s) (in $000’s)Equities 2,007 - - 2,007 Total 2,007 - - 2,007
Long Positions at fair value as at March 31, 2021Level 1 Level 2 Level 3 Total
(in $000’s) (in $000’s) (in $000’s) (in $000’s)Equities 1,888 - - 1,888 Total 1,888 - - 1,888
There were no transfers between Level 1, 2 and 3 during the period ended September 30, 2021 and the year ended March 31, 2021.
Financial Instruments Risks (Note 10)
Concentration RiskFor Concentration Risk as at September 30, 2021, refer to the Schedule of Investment Portfolio.
The table below summarizes the Fund’s exposure to concentration risk.
as at March 31, 2021Categories Net Assets (%)U.S.A. 71.5 U.K. 8.6 Jersey Island 3.7 Ireland 3.4 France 2.7 Japan 2.5 Cayman Islands 2.1 Bermuda 2.0 Canada 1.3 Denmark 0.8 Other Net Assets (Liabilities) 0.7 Luxembourg 0.6 Total 100.0
Credit RiskAs at September 30, 2021 and March 31, 2021, the Fund did not have a significant exposure to credit risk as substantially all of its assets were invested in equities.
Other Price RiskAs at September 30, 2021 and March 31, 2021, the Fund was predominantly invested in global equities and therefore was sensitive to changes in general economic conditions across the world.
As at September 30, 2021, had the fair value of equities in the investment portfolio increased or decreased by 10% (March 31, 2021 - 10%), with all other variables held constant, net assets attributable to holders of redeemable units of the Fund would have increased or decreased, respectively, by approximately $201,000 (March 31, 2021 - $189,000). In practice, actual results may differ from this analysis and the difference may be material.
Currency RiskThe tables below summarize the Fund’s exposure to currency risk.
as at September 30, 2021~
Currency
Financial Instruments Exposure Derivatives
Net Exposure
Net Assets
(%)(in $000’s) (in $000’s) (in $000’s)U.S. Dollar 1,480 - 1,480 73.8 British Pound 260 - 260 13.0 Euro 173 - 173 8.6 Japanese Yen 42 - 42 2.1 Danish Krone 21 - 21 1.0 Total 1,976 - 1,976 98.5
Fund Specific Notes to Financial Statements (unaudited)

– 47 –
CI Global Equity Momentum Private Pool
Semi-Annual Financial Statements - September 30, 2021
Statements of Financial Position (in $000’s except for per unit amounts and units outstanding)
as at as at Sept. 30, 2021 Mar. 31, 2021 12,927 11,243 - - 424 393
- - - - - - - - - - 15 10 - - - - - - 66 181 - 7 13,432 11,834
- - - -
- - - - - - - - - - 73 190 - 1 - - - - - - - - 73 191
13,359 11,643
Statements of Financial Position (cont’d)(in $000’s except for per unit amounts and units outstanding)
Net assets attributable to holders of redeemable units
per Series (Note 4):
Net assets attributable to holders of redeemable
units per unit: Number of redeemable
units outstanding:
as at Sept. 30, 2021
as at Mar. 31, 2021
as at Sept. 30, 2021
as at Mar. 31, 2021
as at Sept. 30, 2021
as at Mar. 31, 2021
Series A 1,052 773 15.55 14.34 67,589 53,887Series F 1,335 852 15.87 14.55 84,164 58,583Series I 10,972 10,018 16.02 14.62 685,115 685,177
AssetsCurrent assetsInvestmentsInvestments pledged as collateralCashUnrealized gain on futures and foreign currency forward contractsSwaps, swaptions and optionsDaily variation margin on derivative instrumentsFees rebate receivableCash collateral on deposit for short saleDividends receivableInterest receivableReceivable for distribution from investmentsSecurities lending revenue receivable (Note 6)Receivable for investments soldReceivable for unit subscriptions
LiabilitiesCurrent liabilitiesInvestments sold shortBank overdraftUnrealized loss on futures and foreign currency forward contractsSwaps, swaptions and options Dividends payable on investments sold shortInterest payable on investments sold shortDaily variation margin on derivative instrumentsPayable for investments purchasedPayable for unit redemptionsDistributions payable to holders of redeemable units Management fees payableAdministration fees payableAccounts payable and accrued liabilities
Net assets attributable to holders of redeemable units
The accompanying notes are an integral part of these financial statements.
Financial Statements (unaudited)
CIG - 2058

– 48 –
CI Global Equity Momentum Private Pool
Semi-Annual Financial Statements - September 30, 2021
Statements of Comprehensive Incomefor the periods ended September 30(in $000’s except for per unit amounts and number of units)
2021 2020
117 57 - - - - - - - -
- - - -
720 49
321 1,995 1,158 2,101 - (20) - - 1 4 - - 1 (16) 1,159 2,085
12 - 1 1 25 17 1 - - - - - - - - - 15 7 1 - - - 55 25
1,104 2,060
The accompanying notes are an integral part of these financial statements.
Financial Statements (unaudited)
Statements of Comprehensive Income (cont’d)for the periods ended September 30(in $000’s except for per unit amounts and number of units)
Increase (decrease) in net assets attributable to
holders of redeemable units per Series:
Increase (decrease) in net assets attributable to
holders of redeemable units per unit:
Weighted average number of units:
2021 2020 2021 2020 2021 2020Series A 70 8 1.13 4.75 61,844 1,665Series F 79 18 1.12 3.04 70,964 5,940Series I 955 2,034 1.40 3.08 685,148 660,565
Income Net gain (loss) on investments and derivatives Dividends Interest for distribution purposes Income distributions from investments Capital gain distributions from investments Derivative income (loss) Dividends expense on financial assets (liabilities) sold
short Interest expense on financial assets (liabilities) sold short Net realized gain (loss) on sale of investments and
derivatives Change in unrealized appreciation (depreciation) in value
of investments and derivativesTotal net gain (loss) on investments and derivativesOther income Foreign exchange gain (loss) on cash Commitment fee income Securities lending revenue (Note 6) Fees rebateTotal other incomeTotal incomeExpensesManagement fees (Note 5)Administration fees (Note 5)Commissions and other portfolio transaction costsIndependent review committee feesSecurities borrowing fees (Note 2)Margin feesService feesInterest expenseWithholding taxesHarmonized sales taxOther expensesTotal expensesIncrease (decrease) in net assets attributable to holders of redeemable units

– 49 –
CI Global Equity Momentum Private Pool
Semi-Annual Financial Statements - September 30, 2021
Statements of Changes in Net Assets Attributable to Holders of Redeemable Units for the periods ended September 30 (in $000’s)
Net assets attributable to holders of redeemable units at the beginning of periodIncrease (decrease) in net assets attributable to holders of redeemable unitsDistributions to holders of redeemable units From net investment income From net realized gains Return of capitalTotal distributions to holders of redeemable units
Redeemable unit transactions Proceeds from redeemable units issued Reinvestment of distributions to holders of redeemable units Redemption of redeemable unitsNet increase (decrease) from redeemable unit transactionsNet increase (decrease) in net assets attributable to holders of redeemable unitsNet assets attributable to holders of redeemable units at the end of period
The accompanying notes are an integral part of these financial statements.
Financial Statements (unaudited)
Series A 2021 2020 773 67 70 8
- - - - - - - -
248 7 - - (39) (73) 209 (66) 279 (58) 1,052 9
Series F 2021 2020 852 61 79 18
- - - - - - - -
504 19 - - (100) (8) 404 11 483 29 1,335 90
Series I 2021 2020 10,018 6,428 955 2,034
- - - - - - - -
- 100 - - (1) (10) (1) 90 954 2,124 10,972 8,552
Total Fund 2021 2020 11,643 6,556 1,104 2,060
- - - - - - - -
752 126 - - (140) (91) 612 35 1,716 2,095 13,359 8,651

– 50 –
CI Global Equity Momentum Private Pool
Semi-Annual Financial Statements - September 30, 2021
Statements of Cash Flowsfor the periods ended September 30 (in $000’s)
2021 2020
1,104 2,060
(720) (49) (2) (3) 25 17
(321) (1,995) 6,979 6,653 (7,649) (6,607) - - - - - - (5) 9 - - - - - - - - - - (589) 85
- - 715 126 (97) (91) 618 35
2 3 29 120 393 202 424 325
97 44 - - - - - - - -
*Dividends and interest received as well as dividends and interest paid relate to operating activities of the Fund. The accompanying notes are an integral part of these financial statements.
Financial Statements (unaudited)
Cash flows from (used in) operating activitiesIncrease (decrease) in net assets attributable to holders of redeemable unitsAdjustments for: Net realized (gain) loss on sale of investments and derivatives Unrealized foreign exchange (gain) loss on cash Commissions and other portfolio transaction costs Change in unrealized (appreciation) depreciation in value of
investments and derivatives Proceeds from sale and maturity of investments and derivatives Purchase of investments and derivatives (Increase) decrease in cash collateral on deposit for short sale Non-cash distributions from investments Change in daily variation margin (Increase) decrease in dividends receivable (Increase) decrease in interest receivable (Increase) decrease in securities lending revenue receivable Increase (decrease) in management fees payable Increase (decrease) in administration fees payable Change in other accounts receivable and payableNet cash from (used in) operating activities
Cash flows from (used in) financing activitiesDistributions paid to holders of redeemable units, net of reinvested distributionsProceeds from issuance of redeemable unitsAmounts paid on redemption of redeemable unitsNet cash from (used in) financing activities Unrealized foreign exchange gain (loss) on cashNet increase (decrease) in cashCash (bank overdraft), beginning of periodCash (bank overdraft), end of period
Supplementary Information:Dividends received, net of withholding tax*Interest received, net of withholding tax*Dividends paid*Interest paid*Tax recoverable (paid)

– 51 –
CI Global Equity Momentum Private Pool
Semi-Annual Financial Statements - September 30, 2021
Percentages shown relate investments at fair value to net assets attributable to holders of redeemable units of the Fund.
Schedule of Investment Portfolio as at September 30, 2021 (unaudited)
Number ofUnits/Sharesor Par Value Description
Average Cost($)
Fair Value($)
% of Net Assets
U.S.A. 1,125 Abbott Laboratories Inc. 154,642 168,325 80 Alphabet Inc., Class A 189,905 270,901 70 Amazon.com Inc. 185,483 291,256 660 Analog Devices Inc. 147,895 140,005 3,600 AZEK Co Inc. 181,950 166,567 1,650 Blackstone Group Inc. 124,224 243,136 1,290 Catalent Inc. 135,205 217,424 2,850 Charles Schwab Corp. 242,317 262,937 2,000 Comcast Corp., Class A 145,055 141,681 555 Constellation Brands Inc., Class A 149,215 148,106 1,600 CoStar Group Inc. 134,659 174,405 700 Danaher Corp. 197,048 269,921 490 Deere & Co. 173,287 207,955 715 Eli Lilly and Co. 184,080 209,242 460 Estée Lauder Co., Inc. 169,337 174,749 485 Facebook Inc. 181,435 208,486 4,570 Freeport-McMoRan Inc. 143,248 188,294 615 Gartner Inc. 141,538 236,709 3,500 Hilton Grand Vacations Inc. 113,170 210,881 3,150 Marvell Technology Inc. 170,960 240,623 510 Mastercard Inc., Class A 201,884 224,588 1,360 Match Group Inc. 204,449 270,426 1,010 Microsoft Corp. 200,008 360,648 1,510 Morgan Stanley Corp. 133,749 186,111 645 Norfolk Southern Corp. 171,001 195,456 1,080 NVIDIA Corp. 116,077 283,378 520 Old Dominion Freight Line Inc. 134,196 188,354 400 RBC Bearings Inc. 107,647 107,508 1,450 Robert Half International Inc. 138,987 184,262 265 ServiceNow Inc. 105,057 208,863 810 Square Inc., Class A 212,305 246,061 310 SVB Financial Group 129,018 253,993 395 Twilio Inc. 150,061 159,622 5,800 WillScot Mobile Mini Holdings Corp. 126,328 233,023 5,395,420 7,273,896 54.46 JAPAN 3,000 Ebara Corp. 173,987 189,485 3,800 Hitachi Ltd. 199,013 287,153 19,000 Renesas Electronics Corp. 293,680 301,856 225 Tokyo Electron Ltd. 116,718 127,186 3,500 West Holdings Corp. 202,383 198,163 985,781 1,103,843 8.26 GERMANY 2,000 Covestro AG 176,860 174,122 2,300 Daimler AG 259,655 258,889 2,000 Deutsche Post AG 130,937 159,862 9,500 Deutsche Telekom AG 250,197 242,465 800 Volkswagen AG, Preferred 215,710 227,280 1,033,359 1,062,618 7.95 U.K. 28,000 Drax Group PLC 237,278 230,227 24,000 Redrow PLC 266,795 273,438 30,000 Royal Mail PLC 201,648 215,646 705,721 719,311 5.38

– 52 –
CI Global Equity Momentum Private Pool
Semi-Annual Financial Statements - September 30, 2021
Percentages shown relate investments at fair value to net assets attributable to holders of redeemable units of the Fund.
Schedule of Investment Portfolio as at September 30, 2021 (unaudited) (cont’d)
FRANCE 2,500 BNP Paribas S.A. 164,397 203,348 275 LVMH Moet Hennessy Louis Vuitton S.A. 255,195 250,191 500 Teleperformance S.E. 252,499 249,490 672,091 703,029 5.26 IRELAND 950 Eaton Corp. PLC 161,934 179,659 1,840 Johnson Controls International PLC 171,487 158,662 333,421 338,321 2.53 JERSEY ISLAND 43,500 Glencore PLC 209,789 261,203 1.96 BELGIUM 1,300 D’ieteren S.A. 257,574 242,228 1.81 SWEDEN 8,000 Volvo AB, Series B 248,423 228,086 1.71 HONG KONG 50,000 SITC International Holdings Co., Ltd. 272,250 227,378 1.70 ITALY 30,000 Unipol Gruppo Finanziario SpA 194,669 222,450 1.67 NETHERLANDS 200 ASML Holding N.V. 159,433 189,527 1.42 BERMUDA 1,820 Bunge Ltd. 156,597 187,459 1.40 MALTA 22,500 Media and Games Invest S.E. 186,377 168,137 1.26Commissions and other portfolio transaction costs (14,391)Total Investment Portfolio 10,796,514 12,927,486 96.77Other Net Assets (Liabilities) 431,354 3.23Net Assets Attributable to Holders of Redeemable Units 13,358,840 100.00
Number ofUnits/Sharesor Par Value Description
Average Cost($)
Fair Value($)
% of Net Assets

– 53 –
CI Global Equity Momentum Private Pool
Semi-Annual Financial Statements - September 30, 2021
Redeemable Unit Transactions (Note 4)for the periods ended September 30
Number of redeemable units at the beginning of periodRedeemable units issued for cashRedeemable units issued for reinvested distributionsRedeemable units redeemedNumber of redeemable units at the end of period
Fund Specific Notes to Financial Statements (unaudited)
†A portion of brokerage commissions paid was used to cover research and market data services, termed soft dollar commissions. This amount has been estimated by the Manager of the Fund.The accompanying notes are an integral part of these financial statements.
Commissions (Note 2)for the periods ended September 30 (in $000’s)
2021 2020Brokerage commissions 24 16Soft dollar commissions† 5 3
Series A 2021 2020 53,887 7,000 16,270 590 - - (2,568) (6,902) 67,589 688
Series F 2021 2020 58,583 6,261 32,104 1,489 - - (6,523) (669) 84,164 7,081
Series I 2021 2020 685,177 656,872 - 8,661 - - (62) (940) 685,115 664,593

– 54 –
CI Global Equity Momentum Private Pool
Semi-Annual Financial Statements - September 30, 2021
The accompanying notes are an integral part of these financial statements.
Fund Specific Notes to Financial Statements (unaudited)
Securities Lending (Note 6)as at September 30 (in $000’s)
2021 2020Loaned 1,003 573Collateral (non-cash) 1,023 584
Securities Lending Revenue Reconciliation (Note 6)for the periods ended September 30 (in $000’s)
2021 2020Gross securities lending revenue 1 4Charges - -Securities lending revenue 1 4Charges as a % of gross securities lending revenue - -
Management and Administration Fees (Note 5) as at September 30, 2021 (%)
Annual management
fee rate:
Annual administration
fee rate:
Series A 1.700 0.15Series F 0.700 0.15Series I Paid directly by investor Paid directly by investor

– 55 –
CI Global Equity Momentum Private Pool
Semi-Annual Financial Statements - September 30, 2021
The accompanying notes are an integral part of these financial statements.
Currency RiskThe tables below summarize the Fund’s exposure to currency risk.
as at September 30, 2021~
Currency
Financial Instruments Exposure Derivatives
Net Exposure
Net Assets
(%)(in $000’s) (in $000’s) (in $000’s)U.S. Dollar 8,216 - 8,216 61.5 Euro 2,373 - 2,373 17.8 Japanese Yen 1,137 - 1,137 8.5 British Pound 991 - 991 7.4 Swedish Krona 433 - 433 3.2 Hong Kong Dollar 204 - 204 1.5 Total 13,354 - 13,354 99.9
as at March 31, 2021~
Currency
Financial Instruments Exposure Derivatives
Net Exposure
Net Assets
(%)(in $000’s) (in $000’s) (in $000’s)U.S. Dollar 7,053 - 7,053 60.6 Euro 1,662 - 1,662 14.3 British Pound 1,076 - 1,076 9.2 Japanese Yen 990 - 990 8.5 Swedish Krona 442 - 442 3.8 Hong Kong Dollar 231 - 231 2.0 Swiss Franc 178 - 178 1.5 Total 11,632 - 11,632 99.9
~Includes monetary and non-monetary instruments, if any.
As at September 30, 2021, had the Canadian dollar strengthened or weakened by 10% (March 31, 2021 - 10%) in relation to all other foreign currencies held in the Fund, with all other variables held constant, net assets attributable to holders of redeemable units of the Fund would have decreased or increased, respectively, by approximately $1,335,000 (March 31, 2021 - $1,163,000). In practice, actual results may differ from this analysis and the difference may be material.
Interest Rate RiskAs at September 30, 2021 and March 31, 2021, the Fund did not have a significant exposure to interest rate risk as substantially all of its assets were invested in equities.
Fair Value Hierarchy
The tables below summarize the inputs used by the Fund in valuing the Fund’s investments and derivatives carried at fair value.
Long Positions at fair value as at September 30, 2021Level 1 Level 2 Level 3 Total
(in $000’s) (in $000’s) (in $000’s) (in $000’s)Equities 12,927 - - 12,927 Total 12,927 - - 12,927
Financial Instruments Risks (Note 10)
Concentration RiskFor Concentration Risk as at September 30, 2021, refer to the Schedule of Investment Portfolio.
The table below summarizes the Fund’s exposure to concentration risk.
as at March 31, 2021Categories Net Assets (%)U.S.A. 53.0 Japan 8.1 Germany 7.9 U.K. 7.6 Sweden 3.8 Cayman Islands 3.7 Other Net Assets (Liabilities) 3.4 Netherlands 1.9 Italy 1.8 Jersey Island 1.7 France 1.6 Bermuda 1.5 Switzerland 1.5 Finland 1.3 Ireland 1.2 Total 100.0
Credit RiskThe Fund was invested in fixed income securities, preferred securities and derivative instruments, if any, with the following credit ratings, as per the tables below.
as at September 30, 2021Credit Rating^* Net Assets (%)Not Rated 1.7Total 1.7
as at March 31, 2021Credit Rating^* Net Assets (%)Not Rated 2.7Total 2.7
^Credit ratings are obtained from S&P Global Ratings, where available, otherwise ratings are obtained from: Moody’s
Investors Service or Dominion Bond Rating Service, respectively.
*Refer to Note 10 for Credit Rating Chart reference.
Other Price RiskAs at September 30, 2021 and March 31, 2021, the Fund was predominantly invested in global equities and therefore was sensitive to changes in general economic conditions across the world.
As at September 30, 2021, had the fair value of equities in the investment portfolio increased or decreased by 10% (March 31, 2021 - 10%), with all other variables held constant, net assets attributable to holders of redeemable units of the Fund would have increased or decreased, respectively, by approximately $1,293,000 (March 31, 2021 - $1,124,000). In practice, actual results may differ from this analysis and the difference may be material.
Fund Specific Notes to Financial Statements (unaudited)

– 56 –
CI Global Equity Momentum Private Pool
Semi-Annual Financial Statements - September 30, 2021
The accompanying notes are an integral part of these financial statements.
Fair Value Hierarchy (cont’d)
Long Positions at fair value as at March 31, 2021Level 1 Level 2 Level 3 Total
(in $000’s) (in $000’s) (in $000’s) (in $000’s)Equities 11,243 - - 11,243 Total 11,243 - - 11,243
There were no transfers between Level 1, 2 and 3 during the period ended September 30, 2021 and the year ended March 31, 2021.
Fund Specific Notes to Financial Statements (unaudited)

– 57 –
CI Global Infrastructure Private Pool
Semi-Annual Financial Statements - September 30, 2021
Statements of Financial Position (in $000’s except for per unit amounts and units outstanding)
as at as at Sept. 30, 2021 Mar. 31, 2021 247,526 170,675 - - 7,532 11,349
507 339 - - - - 50 3 - - 243 206 - - - 526 129 1,260 255,987 184,358
- - - -
376 5 - - - - - - - - - 65 3 17 - - 5 4 1 - 131 113 516 204
255,471 184,154
Statements of Financial Position (cont’d)(in $000’s except for per unit amounts and units outstanding)
Net assets attributable to holders of redeemable units
per Series (Note 4):
Net assets attributable to holders of redeemable
units per unit: Number of redeemable
units outstanding:
as at Sept. 30, 2021
as at Mar. 31, 2021
as at Sept. 30, 2021
as at Mar. 31, 2021
as at Sept. 30, 2021
as at Mar. 31, 2021
Series A 5,590 3,142 11.08 10.62 504,363 295,857Series F 26,182 20,522 11.10 10.63 2,358,041 1,931,083Series I 12 11 11.13 10.64 1,063 1,040ETF C$ Series 223,687 160,479 22.20 21.26 10,075,000 7,550,000
AssetsCurrent assetsInvestmentsInvestments pledged as collateralCashUnrealized gain on futures and foreign currency forward contractsSwaps, swaptions and optionsDaily variation margin on derivative instrumentsFees rebate receivableCash collateral on deposit for short saleDividends receivableInterest receivableReceivable for investments soldReceivable for unit subscriptions
LiabilitiesCurrent liabilitiesInvestments sold shortBank overdraftUnrealized loss on futures and foreign currency forward contractsSwaps, swaptions and options Dividends payable on investments sold shortInterest payable on investments sold shortDaily variation margin on derivative instrumentsPayable for investments purchasedPayable for unit redemptionsDistributions payable to holders of redeemable units Management fees payableAdministration fees payableAccounts payable and accrued liabilities
Net assets attributable to holders of redeemable units
Financial Statements (unaudited)
CIG - 580530777
The accompanying notes are an integral part of these financial statements.

– 58 –
CI Global Infrastructure Private Pool
Semi-Annual Financial Statements - September 30, 2021
Financial Statements (unaudited)
The accompanying notes are an integral part of these financial statements.
Statements of Comprehensive Income (cont’d)for the periods ended September 30(in $000’s except for per unit amounts and number of units)
Increase (decrease) in net assets attributable to
holders of redeemable units per Series:
Increase (decrease) in net assets attributable to
holders of redeemable units per unit:
Weighted average number of units:
2021 2020 2021 2020 2021 2020Series A 195 1 0.49 0.03 399,841 31,748Series F 1,338 (117) 0.63 (0.43) 2,129,081 271,641Series I 1 - 0.73 0.40 1,050 1,006ETF C$ Series 13,267 (1,280) 1.38 (0.61) 9,647,131 2,093,182
Income Net gain (loss) on investments and derivatives Dividends Interest for distribution purposes Income distributions from investments Capital gain distributions from investments Derivative income (loss) Dividends expense on financial assets (liabilities) sold
short Interest expense on financial assets (liabilities) sold short Net realized gain (loss) on sale of investments and
derivatives Change in unrealized appreciation (depreciation) in value
of investments and derivativesTotal net gain (loss) on investments and derivativesOther income Foreign exchange gain (loss) on cash Securities lending revenue (Note 6) Fees rebate Other incomeTotal other incomeTotal incomeExpensesManagement fees (Note 5)Administration fees (Note 5)Commissions and other portfolio transaction costsIndependent review committee feesSecurities borrowing fees (Note 2)Interest expenseWithholding taxesHarmonized sales taxOther expensesTotal expensesIncrease (decrease) in net assets attributable to holders of redeemable units
Statements of Comprehensive Incomefor the periods ended September 30(in $000’s except for per unit amounts and number of units)
2021 2020
3,909 529 - - - - - - - -
- - - -
3,420 (103)
8,467 (1,593) 15,796 (1,167) (109) 17 4 - 686 68 - 1 581 86 16,377 (1,081)
876 118 137 25 130 102 - - - - 2 - 400 58 31 12 - - 1,576 315
14,801 (1,396)

– 59 –
CI Global Infrastructure Private Pool
Semi-Annual Financial Statements - September 30, 2021
The accompanying notes are an integral part of these financial statements.
Financial Statements (unaudited)
Statements of Changes in Net Assets Attributable to Holders of Redeemable Units for the periods ended September 30 (in $000’s)
Net assets attributable to holders of redeemable units at the beginning of periodIncrease (decrease) in net assets attributable to holders of redeemable unitsDistributions to holders of redeemable units From net investment income From net realized gains Return of capitalTotal distributions to holders of redeemable units
Redeemable unit transactions Proceeds from redeemable units issued Reinvestment of distributions to holders of redeemable units Redemption of redeemable unitsNet increase (decrease) from redeemable unit transactionsNet increase (decrease) in net assets attributable to holders of redeemable unitsNet assets attributable to holders of redeemable units at the end of period
Series A 2021 2020 3,142 - 195 1
(17) (4) (15) - (29) - (61) (4)
2,581 723 61 4 (328) - 2,314 727 2,448 724 5,590 724
Series F 2021 2020 20,522 - 1,338 (117)
(119) (49) (114) - (206) - (439) (49)
7,201 6,370 288 38 (2,728) (12) 4,761 6,396 5,660 6,230 26,182 6,230
Series I 2021 2020 11 - 1 -
- - - - - - - -
- 10 - - - - - 10 1 10 12 10
ETF C$ Series 2021 2020 160,479 - 13,267 (1,280)
(1,841) (845) (1,033) - (1,876) - (4,750) (845)
58,097 147,461 - - (3,406) - 54,691 147,461 63,208 145,336 223,687 145,336
Total Fund 2021 2020 184,154 - 14,801 (1,396)
(1,977) (898) (1,162) - (2,111) - (5,250) (898)
67,879 154,564 349 42 (6,462) (12) 61,766 154,594 71,317 152,300 255,471 152,300

– 60 –
CI Global Infrastructure Private Pool
Semi-Annual Financial Statements - September 30, 2021
*Dividends and interest received as well as dividends and interest paid relate to operating activities of the Fund. The accompanying notes are an integral part of these financial statements.
Financial Statements (unaudited)
Statements of Cash Flowsfor the periods ended September 30 (in $000’s)
2021 2020
14,801 (1,396)
(3,420) 103 21 - 130 102
(8,467) 1,593 18,467 2,116 (77,437) (105,599) - - - - - - (36) (181) - - 2 3 - - (29) 83 - - (55,968) (103,176)
(4,902) (855) 60,694 111,851 (3,620) (12) 52,172 110,984
(21) - (3,796) 7,808 11,349 - 7,532 7,808
3,472 290 - - - - (2) - - -
Cash flows from (used in) operating activitiesIncrease (decrease) in net assets attributable to holders of redeemable unitsAdjustments for: Net realized (gain) loss on sale of investments and derivatives Unrealized foreign exchange (gain) loss on cash Commissions and other portfolio transaction costs Change in unrealized (appreciation) depreciation in value of
investments and derivatives Proceeds from sale and maturity of investments and derivatives Purchase of investments and derivatives Non-cash distributions from investments Change in daily variation margin (Increase) decrease in cash collateral on deposit for short sale (Increase) decrease in dividends receivable (Increase) decrease in interest receivable Increase (decrease) in management fees payable Increase (decrease) in administration fees payable Change in other accounts receivable and payable Amortization interest earnedNet cash from (used in) operating activities
Cash flows from (used in) financing activitiesDistributions paid to holders of redeemable units, net of reinvested distributionsProceeds from issuance of redeemable unitsAmounts paid on redemption of redeemable unitsNet cash from (used in) financing activities Unrealized foreign exchange gain (loss) on cashNet increase (decrease) in cashCash (bank overdraft), beginning of periodCash (bank overdraft), end of period
Supplementary Information:Dividends received, net of withholding tax*Interest received, net of withholding tax*Dividends paid*Interest paid*Tax recoverable (paid)

– 61 –
CI Global Infrastructure Private Pool
Semi-Annual Financial Statements - September 30, 2021
Percentages shown relate investments at fair value to net assets attributable to holders of redeemable units of the Fund.
Schedule of Investment Portfolio as at September 30, 2021 (unaudited)
Number ofUnits/Sharesor Par Value Description
Average Cost($)
Fair Value($)
% of Net Assets
EQUITIES AUSTRALIA AUD 857,579 Atlas Arteria Ltd. 5,211,329 5,096,436 AUD 393,306 Sydney Airport 2,181,631 2,967,602 AUD 731,595 Transurban Group 9,654,984 9,408,260 17,047,944 17,472,298 6.84 CANADA 106,461 Boralex Inc., Class ‘A’ 3,880,745 3,981,641 35,201 Canadian National Railway Co. 4,774,805 5,166,802 102,790 Canadian Pacific Railway Ltd. 8,466,398 8,501,761 107,091 Emera Inc. 5,832,294 6,142,740 108,288 Enbridge Inc. 4,723,796 5,464,212 83,226 Keyera Corp. 2,075,102 2,652,413 85,937 Northland Power Inc. 3,374,380 3,420,293 313,241 TransAlta Corp. 2,776,647 4,191,165 35,904,167 39,521,027 15.47 FRANCE EUR 67,172 Vinci SA 8,643,165 8,884,506 3.48 GERMANY EUR 149,176 RWE AG 7,450,260 6,686,355 EUR 152,030 Vantage Towers AG 5,570,529 6,539,922 13,020,789 13,226,277 5.18 ITALY EUR 593,795 Enel SPA 7,006,157 5,794,324 EUR 745,018 Hera SPA 3,733,602 3,865,078 10,739,759 9,659,402 3.78 NETHERLANDS EUR 97,180 Koninklijke Vopak NV 6,537,918 4,847,693 1.90 PORTUGAL EUR 749,764 Energias de Portugal SA 5,119,793 4,988,628 1.95 SINGAPORE SGD 5,423,889 NetLink NBN Trust 5,024,886 5,034,282 1.97 SPAIN EUR 241,710 Ferrovial SA 8,537,328 8,947,283 EUR 369,318 Iberdrola SA 5,895,217 4,705,433 14,432,545 13,652,716 5.34 U.K. GBP 436,939 National Grid PLC 6,808,268 6,596,351 2.58 U.S.A. USD 119,424 Cheniere Energy Inc. 9,308,392 14,773,802 USD 41,746 Crown Castle International Corp. 9,131,617 9,164,379 USD 97,572 Entergy Corp. 12,730,560 12,273,196 USD 12,693 Equinix Inc. 12,196,890 12,702,884 USD 253,334 Hess Midstream L.P., Class ‘A’ 7,012,847 9,051,823 USD 157,703 NextEra Energy Inc. 14,673,951 15,684,105 USD 526,639 Plains GP Holdings L.P. 5,754,814 7,187,366 USD 41,428 SBA Communications Corp. 16,090,890 17,345,902 USD 70,781 Sempra Energy 11,657,771 11,340,879 USD 429,709 Williams Cos. Inc. (The) 12,345,110 14,118,349 110,902,842 123,642,685 48.40Total Equities 234,182,076 247,525,865 96.89 Adjustment for transaction costs (355,083)Total Investments 233,826,993 247,525,865 96.89Unrealized gain (loss) on forward foreign currency contract(s) 130,124 0.05Other Net Assets (Liabilities) 7,814,121 3.06Net Assets Attributable to Holders of Redeemable Units 255,470,110 100.00

– 62 –
CI Global Infrastructure Private Pool
Semi-Annual Financial Statements - September 30, 2021
Schedule of Investment Portfolio as at September 30, 2021 (unaudited) (cont’d)
Forward Foreign Currency Contract(s)
CounterpartyCredit Rating of the Counterparty* Settlement Date
Currency Buy Position
Currency Sell Position
Contract(s) Rate
Unrealized Gain (Loss) ($)
Bank of Montreal A-1 November 18, 2021 CAD 1,494,153 USD 1,189,921 1.26 (13,098)Bank of Montreal A-1 December 15, 2021 CAD 4,177,933 USD 3,275,500 1.28 29,116 Canadian Imperial Bank of Commerce A-1 October 20, 2021 CAD 1,255,136 USD 1,003,960 1.25 (16,509)Canadian Imperial Bank of Commerce A-1 October 20, 2021 USD 1,223,074 CAD 1,546,455 0.79 2,727 Canadian Imperial Bank of Commerce A-1 November 18, 2021 CAD 1,496,531 USD 1,189,630 1.26 (10,353)Citibank N.A., New York A-1 October 20, 2021 CAD 2,501,857 USD 2,007,920 1.25 (41,434)Citibank N.A., New York A-1 November 18, 2021 CAD 1,493,116 USD 1,189,775 1.25 (13,952)Goldman Sachs & Co., New York A-1 October 20, 2021 CAD 1,673,916 USD 1,338,614 1.25 (21,611)Goldman Sachs & Co., New York A-1 November 18, 2021 CAD 929,999 USD 743,610 1.25 (11,918)Goldman Sachs & Co., New York A-1 December 13, 2021 CAD 1,736,515 GBP 997,000 1.74 34,787 HSBC Bank, Toronto A-1 October 20, 2021 CAD 1,298,014 USD 1,041,745 1.25 (21,491)HSBC Bank, Toronto A-1 November 18, 2021 CAD 932,226 USD 743,610 1.25 (9,691)HSBC Bank, Toronto A-1 December 13, 2021 CAD 18,310,458 EUR 12,225,000 1.50 346,915 HSBC Bank, Toronto A-1 December 15, 2021 CAD 1,125,332 USD 882,001 1.28 8,172 HSBC Bank, Toronto A-1 December 15, 2021 CAD 1,176,614 USD 923,499 1.27 6,892 JPMorgan Chase Bank, New York A-1 October 20, 2021 CAD 1,719,964 USD 1,364,739 1.26 (8,654)JPMorgan Chase Bank, New York A-1 October 20, 2021 CAD 1,700,135 USD 1,354,122 1.26 (15,035)JPMorgan Chase Bank, New York A-1 October 20, 2021 CAD 1,764,211 USD 1,404,878 1.26 (15,249)JPMorgan Chase Bank, New York A-1 October 20, 2021 CAD 2,518,787 USD 2,007,920 1.25 (24,503)JPMorgan Chase Bank, New York A-1 November 18, 2021 CAD 839,670 USD 669,249 1.25 (8,056)JPMorgan Chase Bank, New York A-1 December 13, 2021 CAD 1,203,284 SGD 1,286,000 0.94 3,815 Morgan Stanley & Co. International PLC A-1 October 20, 2021 CAD 1,758,073 USD 1,394,261 1.26 (7,940)Morgan Stanley & Co. International PLC A-1 October 20, 2021 CAD 3,745,273 USD 3,011,880 1.24 (69,664)Morgan Stanley & Co. International PLC A-1 December 15, 2021 CAD 1,878,008 USD 1,470,001 1.28 16,074 Royal Bank of Canada A-1+ October 20, 2021 CAD 2,501,839 USD 2,007,920 1.25 (41,452)Royal Bank of Canada A-1+ November 18, 2021 CAD 1,216,670 USD 974,389 1.25 (17,571)Toronto-Dominion Bank (The) A-1+ November 18, 2021 CAD 839,526 USD 669,249 1.25 (8,200)Toronto-Dominion Bank (The) A-1+ December 13, 2021 CAD 3,183,481 AUD 3,412,000 0.93 58,007 Total Foreign Currency Forward Contract(s) Value 130,124
*Credit rating provided by S&P Global Ratings.

– 63 –
CI Global Infrastructure Private Pool
Semi-Annual Financial Statements - September 30, 2021
The accompanying notes are an integral part of these financial statements.
Fund Specific Notes to Financial Statements (unaudited)
Offsetting of Financial Instruments (Note 2)
The following tables show the net impact on the Fund’s Statements of Financial Position if all rights to offset were exercised.
as at September 30, 2021Amounts Eligible for Offset
Gross Assets/(Liabilities)
FinancialInstruments
CollateralReceived/(Paid)
NetExposure
(in $000’s) (in $000’s) (in $000’s) (in $000’s)Derivative assets - Foreign currency forward contracts 506 (109) - 397Derivative assets - Swaps and swaptions - - - -Total 506 (109) - 397Derivative liabilities - Foreign currency forward contracts (376) 109 - (267)Derivative liabilities - Swaps and swaptions - - - -Total (376) 109 - (267)
as at March 31, 2021Amounts Eligible for Offset
Gross Assets/(Liabilities)
FinancialInstruments
CollateralReceived/(Paid)
NetExposure
(in $000’s) (in $000’s) (in $000’s) (in $000’s)Derivative assets - Foreign currency forward contracts 339 (5) - 334Derivative assets - Swaps and swaptions - - - -Total 339 (5) - 334Derivative liabilities - Foreign currency forward contracts (5) 5 - -Derivative liabilities - Swaps and swaptions - - - -Total (5) 5 - -

– 64 –
CI Global Infrastructure Private Pool
Semi-Annual Financial Statements - September 30, 2021
Fund Specific Notes to Financial Statements (unaudited)
†A portion of brokerage commissions paid was used to cover research and market data services, termed soft dollar commissions. This amount has been estimated by the Manager of the Fund.The accompanying notes are an integral part of these financial statements.
Commissions (Note 2)for the periods ended September 30 (in $000’s)
2021 2020Brokerage commissions 134 87Soft dollar commissions† 56 39
Redeemable Unit Transactions (Note 4)for the periods ended September 30
Number of redeemable units at the beginning of periodRedeemable units issued for cashRedeemable units issued for reinvested distributionsRedeemable units redeemedNumber of redeemable units at the end of period
Series A 2021 2020 295,857 - 232,291 70,401 5,508 393 (29,293) - 504,363 70,794
Series F 2021 2020 1,931,083 - 649,537 606,372 25,857 3,704 (248,436) (1,183) 2,358,041 608,893
Series I 2021 2020 1,040 - - 1,000 23 16 - - 1,063 1,016
ETF C$ Series 2021 2020 7,550,000 - 2,675,000 7,100,000 - - (150,000) - 10,075,000 7,100,000

– 65 –
CI Global Infrastructure Private Pool
Semi-Annual Financial Statements - September 30, 2021
The accompanying notes are an integral part of these financial statements.
Fund Specific Notes to Financial Statements (unaudited)
Management and Administration Fees (Note 5) as at September 30, 2021 (%)
Annual management
fee rate:
Annual administration
fee rate:
Series A 1.700 0.15Series F 0.700 0.15Series I Paid directly by investor Paid directly by investorETF C$ Series 0.700 0.15
Securities Lending (Note 6)as at September 30 (in $000’s)
2021 2020Loaned 3,467 -Collateral (non-cash) 3,640 -
Securities Lending Revenue Reconciliation (Note 6)for the periods ended September 30 (in $000’s)
2021 2020Gross securities lending revenue 7 -Charges (3) -Securities lending revenue 4 -Charges as a % of gross securities lending revenue 40.6 -

– 66 –
CI Global Infrastructure Private Pool
Semi-Annual Financial Statements - September 30, 2021
The accompanying notes are an integral part of these financial statements.
Currency Risk (cont’d)
as at March 31, 2021~
Currency
Financial Instruments Exposure Derivatives
Net Exposure
Net Assets
(%)(in $000’s) (in $000’s) (in $000’s)U.S. Dollar 81,496 (22,437) 59,059 32.10Euro 39,951 - 39,951 21.70Australian Dollar 11,862 - 11,862 6.40Singapore Dollar 3,521 - 3,521 1.90British Pound 4,608 (2,195) 2,413 1.30Total 141,438 (24,632) 116,806 63.40
~Includes monetary and non-monetary instruments, if any.
As at September 30, 2021, had the Canadian dollar strengthened or weakened by 10% (March 31, 2021 - 10%) in relation to all other foreign currencies held in the Fund, with all other variables held constant, net assets attributable to holders of redeemable units of the Fund would have decreased or increased, respectively, by approximately $14,911,000 (March 31, 2021 - $11,681,000). In practice, actual results may differ from this analysis and the difference may be material.
Interest Rate RiskAs at September 30, 2021 and March 31, 2021, the Fund did not have a significant exposure to interest rate risk as substantially all of its assets were invested in equities and derivatives.
Fair Value Hierarchy
The tables below summarize the inputs used by the Fund in valuing the Fund’s investments and derivatives carried at fair value.
Long Positions at fair value as at September 30, 2021Level 1 Level 2 Level 3 Total
(in $000’s) (in $000’s) (in $000’s) (in $000’s)Equities 247,526 - - 247,526 Derivatives, net - 130 - 130 Total 247,526 130 - 247,656
Long Positions at fair value as at March 31, 2021Level 1 Level 2 Level 3 Total
(in $000’s) (in $000’s) (in $000’s) (in $000’s)Equities 162,290 - - 162,290 Limited partnership units 8,385 - - 8,385 Derivatives, net - 334 - 334 Total 170,675 334 - 171,009
There were no transfers between Level 1, 2 and 3 during the period ended September 30, 2021 and the year ended March 31, 2021.
Financial Instruments Risks (Note 10)
Concentration RiskFor Concentration Risk as at September 30, 2021, refer to the Schedule of Investment Portfolio.
The table below summarizes the Fund’s exposure to concentration risk.
as at March 31, 2021Categories Net Assets (%)Equities - U.S.A. 38.6 Equities - Canada 17.0 Other Net Assets (Liabilities) 7.1 Equities - Australia 6.3 Equities - Germany 5.0 Limited Partnership Units 4.5 Equities - Spain 4.6 Equities - Italy 4.1 Equities - France 3.4 Equities - U.K. 2.4 Equities - Portugal 2.3 Equities - Netherlands 2.1 Equities - Singapore 1.9 Equities - China 0.5 Unrealized gain (loss) on forward foreign currency contract(s) 0.2 Total 100.0
Credit RiskAs at September 30, 2021 and March 31, 2021, the Fund’s exposure to credit risk through derivative instruments was insignificant.
Other Price RiskAs at September 30, 2021 and March 31, 2021, the Fund was predominantly invested in global equities and therefore was sensitive to changes in general economic conditions across the world.
As at September 30, 2021, had the fair value of equities in the investment portfolio increased or decreased by 10% (March 31, 2021 - 10%), with all other variables held constant, net assets attributable to holders of redeemable units of the Fund would have increased or decreased, respectively, by approximately $24,753,000 (March 31, 2021 - $17,068,000). In practice, actual results may differ from this analysis and the difference may be material.
Currency RiskThe tables below summarize the Fund’s exposure to currency risk.
as at September 30, 2021~
Currency
Financial Instruments Exposure Derivatives
Net Exposure
Net Assets
(%)(in $000’s) (in $000’s) (in $000’s)U.S. Dollar 126,583 (38,804) 87,779 34.4 Euro 56,155 (17,964) 38,191 14.9 Australian Dollar 16,994 (3,125) 13,869 5.4 British Pound 6,925 (1,702) 5,223 2.0 Singapore Dollar 5,244 (1,199) 4,045 1.6 Total 211,901 (62,794) 149,107 58.3
Fund Specific Notes to Financial Statements (unaudited)

– 67 –
CI Global Real Asset Private Pool
Semi-Annual Financial Statements - September 30, 2021
Statements of Financial Position (in $000’s except for per unit amounts and units outstanding)
as at as at Sept. 30, 2021 Mar. 31, 2021 53,663 43,404 - - 1,628 1,560
- - - - - - 14 2 - - - - - - - - 30 11 55,335 44,977
- - - -
- - - - - - - - - - - - 1 - - - 1 - - - - - 2 -
55,333 44,977
Statements of Financial Position (cont’d)(in $000’s except for per unit amounts and units outstanding)
Net assets attributable to holders of redeemable units
per Series (Note 4):
Net assets attributable to holders of redeemable
units per unit: Number of redeemable
units outstanding:
as at Sept. 30, 2021
as at Mar. 31, 2021
as at Sept. 30, 2021
as at Mar. 31, 2021
as at Sept. 30, 2021
as at Mar. 31, 2021
Series A 5,630 4,015 11.15 10.36 504,968 387,399Series F 12,586 8,053 11.14 10.35 1,129,850 777,720Series I 33,772 30,319 11.15 10.36 3,028,501 2,926,716ETF C$ Series 3,345 2,590 22.30 20.72 150,000 125,000
AssetsCurrent assetsInvestmentsInvestments pledged as collateralCashUnrealized gain on futures and foreign currency forward contractsSwaps, swaptions and optionsDaily variation margin on derivative instrumentsFees rebate receivableCash collateral on deposit for short saleDividends receivableInterest receivableReceivable for investments soldReceivable for unit subscriptions
LiabilitiesCurrent liabilitiesInvestments sold shortBank overdraftUnrealized loss on futures and foreign currency forward contractsSwaps, swaptions and options Dividends payable on investments sold shortInterest payable on investments sold shortDaily variation margin on derivative instrumentsPayable for investments purchasedPayable for unit redemptionsDistributions payable to holders of redeemable units Management fees payableAdministration fees payableAccounts payable and accrued liabilities
Net assets attributable to holders of redeemable units
Financial Statements (unaudited)
CIG - 580530797
The accompanying notes are an integral part of these financial statements.

– 68 –
CI Global Real Asset Private Pool
Semi-Annual Financial Statements - September 30, 2021
Financial Statements (unaudited)
The accompanying notes are an integral part of these financial statements.
Statements of Comprehensive Income (cont’d)for the periods ended September 30(in $000’s except for per unit amounts and number of units)
Increase (decrease) in net assets attributable to
holders of redeemable units per Series:
Increase (decrease) in net assets attributable to
holders of redeemable units per unit:
Weighted average number of units:
2021 2020 2021 2020 2021 2020Series A 430 - 0.91 0.01 470,110 51,322Series F 895 (21) 0.92 (0.14) 968,682 147,100Series I 3,115 384 1.06 0.17 2,941,432 2,302,450ETF C$ Series 280 21 1.98 0.33 141,257 62,311
Income Net gain (loss) on investments and derivatives Dividends Interest for distribution purposes Income distributions from investments Capital gain distributions from investments Derivative income (loss) Dividends expense on financial assets (liabilities) sold
short Interest expense on financial assets (liabilities) sold short Net realized gain (loss) on sale of investments and
derivatives Change in unrealized appreciation (depreciation) in value
of investments and derivativesTotal net gain (loss) on investments and derivativesOther income Foreign exchange gain (loss) on cash Securities lending revenue (Note 6) Fees rebate Other incomeTotal other incomeTotal incomeExpensesManagement fees (Note 5)Administration fees (Note 5)Commissions and other portfolio transaction costsIndependent review committee feesSecurities borrowing fees (Note 2)Interest expenseWithholding taxesHarmonized sales taxOther expensesTotal expensesIncrease (decrease) in net assets attributable to holders of redeemable units
Statements of Comprehensive Incomefor the periods ended September 30(in $000’s except for per unit amounts and number of units)
2021 2020
- - - - 261 388 325 - - -
- - - -
(31) -
4,194 24 4,749 412 - - 1 - 72 3 27 - 100 3 4,849 415
93 10 14 2 9 17 - - - - - - - - 13 2 - - 129 31
4,720 384

– 69 –
CI Global Real Asset Private Pool
Semi-Annual Financial Statements - September 30, 2021
The accompanying notes are an integral part of these financial statements.
Financial Statements (unaudited)
Statements of Changes in Net Assets Attributable to Holders of Redeemable Units for the periods ended September 30 (in $000’s)
Net assets attributable to holders of redeemable units at the beginning of periodIncrease (decrease) in net assets attributable to holders of redeemable unitsDistributions to holders of redeemable units From net investment income From net realized gains Return of capitalTotal distributions to holders of redeemable units
Redeemable unit transactions Proceeds from redeemable units issued Reinvestment of distributions to holders of redeemable units Redemption of redeemable unitsNet increase (decrease) from redeemable unit transactionsNet increase (decrease) in net assets attributable to holders of redeemable unitsNet assets attributable to holders of redeemable units at the end of period
Net assets attributable to holders of redeemable units at the beginning of periodIncrease (decrease) in net assets attributable to holders of redeemable unitsDistributions to holders of redeemable units From net investment income From net realized gains Return of capitalTotal distributions to holders of redeemable units
Redeemable unit transactions Proceeds from redeemable units issued Reinvestment of distributions to holders of redeemable units Redemption of redeemable unitsNet increase (decrease) from redeemable unit transactionsNet increase (decrease) in net assets attributable to holders of redeemable unitsNet assets attributable to holders of redeemable units at the end of period
Series A 2021 2020 4,015 - 430 -
(17) (7) (14) - (51) - (82) (7)
1,587 784 77 7 (397) (26) 1,267 765 1,615 758 5,630 758
Series F 2021 2020 8,053 - 895 (21)
(46) (27) (38) - (147) - (231) (27)
4,596 2,178 202 25 (929) (193) 3,869 2,010 4,533 1,962 12,586 1,962
Series I 2021 2020 30,319 - 3,115 384
(169) (578) (138) - (522) - (829) (578)
1,430 33,161 828 577 (1,091) (1,821) 1,167 31,917 3,453 31,723 33,772 31,723
ETF C$ Series 2021 2020 2,590 - 280 21
(13) (19) (11) - (41) - (65) (19)
540 1,506 - - - - 540 1,506 755 1,508 3,345 1,508
Total Fund 2021 2020 44,977 - 4,720 384
(245) (631) (201) - (761) - (1,207) (631)
8,153 37,629 1,107 609 (2,417) (2,040) 6,843 36,198 10,356 35,951 55,333 35,951

– 70 –
CI Global Real Asset Private Pool
Semi-Annual Financial Statements - September 30, 2021
*Dividends and interest received as well as dividends and interest paid relate to operating activities of the Fund. The accompanying notes are an integral part of these financial statements.
Financial Statements (unaudited)
Statements of Cash Flowsfor the periods ended September 30 (in $000’s)
2021 2020
4,720 384
31 - - - 9 17
(4,194) (24) 426 - (6,529) (34,667) - - - - - - - - - - - - - - (12) 1 - - (5,549) (34,289)
(102) (21) 8,135 37,619 (2,416) (2,038) 5,617 35,560
- - 68 1,271 1,560 - 1,628 1,271
379 - - - - - - - - -
Cash flows from (used in) operating activitiesIncrease (decrease) in net assets attributable to holders of redeemable unitsAdjustments for: Net realized (gain) loss on sale of investments and derivatives Unrealized foreign exchange (gain) loss on cash Commissions and other portfolio transaction costs Change in unrealized (appreciation) depreciation in value of
investments and derivatives Proceeds from sale and maturity of investments and derivatives Purchase of investments and derivatives Non-cash distributions from investments Change in daily variation margin (Increase) decrease in cash collateral on deposit for short sale (Increase) decrease in dividends receivable (Increase) decrease in interest receivable Increase (decrease) in management fees payable Increase (decrease) in administration fees payable Change in other accounts receivable and payable Amortization interest earnedNet cash from (used in) operating activities
Cash flows from (used in) financing activitiesDistributions paid to holders of redeemable units, net of reinvested distributionsProceeds from issuance of redeemable unitsAmounts paid on redemption of redeemable unitsNet cash from (used in) financing activities Unrealized foreign exchange gain (loss) on cashNet increase (decrease) in cashCash (bank overdraft), beginning of periodCash (bank overdraft), end of period
Supplementary Information:Dividends received, net of withholding tax*Interest received, net of withholding tax*Dividends paid*Interest paid*Tax recoverable (paid)

– 71 –
CI Global Real Asset Private Pool
Semi-Annual Financial Statements - September 30, 2021
Percentages shown relate investments at fair value to net assets attributable to holders of redeemable units of the Fund.
Schedule of Investment Portfolio as at September 30, 2021 (unaudited)
Number of Units Description Average Cost
($)Fair Value
($)% of Net
Assets
UNDERLYING FUND(S) 1,210,903 CI Global Infrastructure Private Pool 24,751,498 27,208,991 1,083,954 CI Global REIT Private Pool 22,868,518 26,453,897 Total Underlying Fund(s) 47,620,016 53,662,888 96.98Adjustment for transaction costs (62,090)Total Investment Portfolio 47,557,926 53,662,888 96.98Other Net Assets (Liabilities) 1,670,515 3.02Net Assets Attributable to Holders of Redeemable Units 55,333,403 100.00

– 72 –
CI Global Real Asset Private Pool
Semi-Annual Financial Statements - September 30, 2021
The accompanying notes are an integral part of these financial statements.
Fund Specific Notes to Financial Statements (unaudited)
Interest in Unconsolidated Structured Entities (Note 2)
The following tables present the Fund’s interest in Unconsolidated Structured Entities.
as at September 30, 2021 Fair Value of
the Underlying Fund(s) / ETF(s)Fair Value of the Fund’s Investment
in the Underlying Fund(s) / ETF(s)Ownership in the
Underlying Fund(s) / ETF(s)
Unconsolidated Structured Entities (in $000’s) (in $000’s) (%)CI Global Infrastructure Private Pool 255,470 27,209 10.7CI Global REIT Private Pool 70,759 26,454 37.4
as at March 31, 2021 Fair Value of
the Underlying Fund(s) / ETF(s)Fair Value of the Fund’s Investment
in the Underlying Fund(s) / ETF(s)Ownership in the
Underlying Fund(s) / ETF(s)
Unconsolidated Structured Entities (in $000’s) (in $000’s) (%)CI Global Infrastructure Private Pool 184,154 22,475 12.2CI Global REIT Private Pool 46,284 20,929 45.2

– 73 –
CI Global Real Asset Private Pool
Semi-Annual Financial Statements - September 30, 2021
Fund Specific Notes to Financial Statements (unaudited)
†A portion of brokerage commissions paid was used to cover research and market data services, termed soft dollar commissions. This amount has been estimated by the Manager of the Fund.The accompanying notes are an integral part of these financial statements.
Commissions (Note 2)for the periods ended September 30 (in $000’s)
2021 2020Brokerage commissions 9 16Soft dollar commissions† 4 7
Redeemable Unit Transactions (Note 4)for the periods ended September 30
Number of redeemable units at the beginning of periodRedeemable units issued for cashRedeemable units issued for reinvested distributionsRedeemable units redeemedNumber of redeemable units at the end of period
Series A 2021 2020 387,399 - 145,609 77,291 6,944 712 (34,984) (2,576) 504,968 75,427
Series F 2021 2020 777,720 - 418,116 211,620 18,205 2,505 (84,191) (18,874) 1,129,850 195,251
Series I 2021 2020 2,926,716 - 127,762 3,277,991 74,798 57,366 (100,775) (178,844) 3,028,501 3,156,513
ETF C$ Series 2021 2020 125,000 - 25,000 75,000 - - - - 150,000 75,000

– 74 –
CI Global Real Asset Private Pool
Semi-Annual Financial Statements - September 30, 2021
The accompanying notes are an integral part of these financial statements.
Fund Specific Notes to Financial Statements (unaudited)
Related Party Investments (Note 9)as at September 30 (in $000’s)
Investments 2021CI Global Infrastructure Private Pool 27,209CI Global REIT Private Pool 26,454
Investments 2020CI Global Infrastructure Private Pool 16,886CI Global REIT Private Pool 17,788
Management and Administration Fees (Note 5) as at September 30, 2021 (%)
Annual management
fee rate:
Annual administration
fee rate:
Series A 1.700 0.15Series F 0.700 0.15Series I Paid directly by investor Paid directly by investorETF C$ Series 0.700 0.15
Securities Lending (Note 6)as at September 30 (in $000’s)
2021 2020Loaned 373 -Collateral (non-cash) 393 -
Securities Lending Revenue Reconciliation (Note 6)for the periods ended September 30 (in $000’s)
2021 2020Gross securities lending revenue 1 -Charges - -Securities lending revenue 1 -Charges as a % of gross securities lending revenue - -

– 75 –
CI Global Real Asset Private Pool
Semi-Annual Financial Statements - September 30, 2021
The accompanying notes are an integral part of these financial statements.
Financial Instruments Risks (Note 10)
Concentration RiskThe tables below summarize the Fund’s exposure to concentration risk.
as at September 30, 2021 Funds Net Assets (%)CI Global Infrastructure Private Pool 49.2 CI Global REIT Private Pool 47.8 Other Net Assets (Liabilities) 3.0 Total 100.0
as at March 31, 2021 Funds Net Assets (%)CI Global REIT Private Pool 50.0 CI Global Infrastructure Private Pool 46.5 Other Net Assets (Liabilities) 3.5 Total 100.0
Other Price RiskAs at September 30, 2021 and March 31, 2021, the Fund indirectly bears the other price risk exposure of the Underlying Funds.
As at September 30, 2021, had the fair value of the Underlying Funds increased or decreased by 10% (March 31, 2021 - 10%), with all other variables held constant, net assets attributable to holders of redeemable units of the Fund would have increased or decreased, respectively, by approximately $5,366,000 (March 31, 2021 - $4,340,000). In practice, actual results may differ from this analysis and the difference may be material.
Refer to Note 10 for discussion of other financial instrument risks.
Fair Value Hierarchy
The tables below summarize the inputs used by the Fund in valuing the Fund’s investments and derivatives carried at fair value.
Long Positions at fair value as at September 30, 2021Level 1 Level 2 Level 3 Total
(in $000’s) (in $000’s) (in $000’s) (in $000’s)Underlying Fund(s) 53,663 - - 53,663 Total 53,663 - - 53,663
Long Positions at fair value as at March 31, 2021Level 1 Level 2 Level 3 Total
(in $000’s) (in $000’s) (in $000’s) (in $000’s)Underlying Fund(s) 43,404 - - 43,404 Total 43,404 - - 43,404
There were no transfers between Level 1, 2 and 3 during the period ended September 30, 2021 and the year ended March 31, 2021.
Fund Specific Notes to Financial Statements (unaudited)

– 76 –
CI Global REIT Private Pool
Semi-Annual Financial Statements - September 30, 2021
Statements of Financial Position (in $000’s except for per unit amounts and units outstanding)
as at as at Sept. 30, 2021 Mar. 31, 2021 67,875 43,597 - - 2,758 1,995
14 67 - - - - - - - - 141 95 - - - - 63 563 70,851 46,317
- - - -
60 8 - - - - - - - - - - 16 19 - - 1 1 - - 15 5 92 33
70,759 46,284
Statements of Financial Position (cont’d)(in $000’s except for per unit amounts and units outstanding)
Net assets attributable to holders of redeemable units
per Series (Note 4):
Net assets attributable to holders of redeemable
units per unit: Number of redeemable
units outstanding:
as at Sept. 30, 2021
as at Mar. 31, 2021
as at Sept. 30, 2021
as at Mar. 31, 2021
as at Sept. 30, 2021
as at Mar. 31, 2021
Series A 1,163 736 12.18 11.06 95,516 66,574Series F 17,734 12,318 12.19 11.06 1,455,329 1,113,716Series I 13 12 12.20 11.07 1,076 1,049ETF C$ Series 51,849 33,218 24.40 22.15 2,125,000 1,500,000
AssetsCurrent assetsInvestmentsInvestments pledged as collateralCashUnrealized gain on futures and foreign currency forward contractsSwaps, swaptions and optionsDaily variation margin on derivative instrumentsFees rebate receivableCash collateral on deposit for short saleDividends receivableInterest receivableReceivable for investments soldReceivable for unit subscriptions
LiabilitiesCurrent liabilitiesInvestments sold shortBank overdraftUnrealized loss on futures and foreign currency forward contractsSwaps, swaptions and options Dividends payable on investments sold shortInterest payable on investments sold shortDaily variation margin on derivative instrumentsPayable for investments purchasedPayable for unit redemptionsDistributions payable to holders of redeemable units Management fees payableAdministration fees payableAccounts payable and accrued liabilities
Net assets attributable to holders of redeemable units
Financial Statements (unaudited)
CIG - 580530787
The accompanying notes are an integral part of these financial statements.

– 77 –
CI Global REIT Private Pool
Semi-Annual Financial Statements - September 30, 2021
Financial Statements (unaudited)
The accompanying notes are an integral part of these financial statements.
Statements of Comprehensive Income (cont’d)for the periods ended September 30(in $000’s except for per unit amounts and number of units)
Increase (decrease) in net assets attributable to
holders of redeemable units per Series:
Increase (decrease) in net assets attributable to
holders of redeemable units per unit:
Weighted average number of units:
2021 2020 2021 2020 2021 2020Series A 114 8 1.27 0.44 89,761 17,323Series F 1,652 139 1.28 0.35 1,293,681 393,235Series I 1 1 1.43 0.69 1,061 1,007ETF C$ Series 4,594 429 2.50 0.52 1,836,475 824,242
Income Net gain (loss) on investments and derivatives Dividends Interest for distribution purposes Income distributions from investments Capital gain distributions from investments Derivative income (loss) Dividends expense on financial assets (liabilities) sold
short Interest expense on financial assets (liabilities) sold short Net realized gain (loss) on sale of investments and
derivatives Change in unrealized appreciation (depreciation) in value
of investments and derivativesTotal net gain (loss) on investments and derivativesOther income Foreign exchange gain (loss) on cash Securities lending revenue (Note 6) Fees rebate Other incomeTotal other incomeTotal incomeExpensesManagement fees (Note 5)Administration fees (Note 5)Commissions and other portfolio transaction costsIndependent review committee feesSecurities borrowing fees (Note 2)Interest expenseWithholding taxesHarmonized sales taxOther expensesTotal expensesIncrease (decrease) in net assets attributable to holders of redeemable units
Statements of Comprehensive Incomefor the periods ended September 30(in $000’s except for per unit amounts and number of units)
2021 2020
661 238 - - - - - - - -
- - - -
(80) 187
6,111 300 6,692 725 - (11) 2 - 49 1 - - 51 (10) 6,743 715
221 55 46 12 32 38 - - - - - - 55 22 28 11 - - 382 138
6,361 577

– 78 –
CI Global REIT Private Pool
Semi-Annual Financial Statements - September 30, 2021
The accompanying notes are an integral part of these financial statements.
Financial Statements (unaudited)
Statements of Changes in Net Assets Attributable to Holders of Redeemable Units for the periods ended September 30 (in $000’s)
Net assets attributable to holders of redeemable units at the beginning of periodIncrease (decrease) in net assets attributable to holders of redeemable unitsDistributions to holders of redeemable units From net investment income From net realized gains Return of capitalTotal distributions to holders of redeemable units
Redeemable unit transactions Proceeds from redeemable units issued Reinvestment of distributions to holders of redeemable units Redemption of redeemable unitsNet increase (decrease) from redeemable unit transactionsNet increase (decrease) in net assets attributable to holders of redeemable unitsNet assets attributable to holders of redeemable units at the end of period
Net assets attributable to holders of redeemable units at the beginning of periodIncrease (decrease) in net assets attributable to holders of redeemable unitsDistributions to holders of redeemable units From net investment income From net realized gains Return of capitalTotal distributions to holders of redeemable units
Redeemable unit transactions Proceeds from redeemable units issued Reinvestment of distributions to holders of redeemable units Redemption of redeemable unitsNet increase (decrease) from redeemable unit transactionsNet increase (decrease) in net assets attributable to holders of redeemable unitsNet assets attributable to holders of redeemable units at the end of period
Series A 2021 2020 736 - 114 8
(4) (3) (7) - (7) - (18) (3)
533 262 18 3 (220) - 331 265 427 270 1,163 270
Series F 2021 2020 12,318 - 1,652 139
(83) (77) (130) - (127) - (340) (77)
4,825 5,209 174 40 (895) (57) 4,104 5,192 5,416 5,254 17,734 5,254
Series I 2021 2020 12 - 1 1
- - - - - - - -
- 10 - - - - - 10 1 11 13 11
ETF C$ Series 2021 2020 33,218 - 4,594 429
(293) (296) (371) - (365) - (1,029) (296)
15,066 22,939 - - - - 15,066 22,939 18,631 23,072 51,849 23,072
Total Fund 2021 2020 46,284 - 6,361 577
(380) (376) (508) - (499) - (1,387) (376)
20,424 28,420 192 43 (1,115) (57) 19,501 28,406 24,475 28,607 70,759 28,607

– 79 –
CI Global REIT Private Pool
Semi-Annual Financial Statements - September 30, 2021
*Dividends and interest received as well as dividends and interest paid relate to operating activities of the Fund. The accompanying notes are an integral part of these financial statements.
Financial Statements (unaudited)
Statements of Cash Flowsfor the periods ended September 30 (in $000’s)
2021 2020
6,361 577
80 (187) 1 - 32 38
(6,111) (300) 5,897 3,633 (9,211) (12,913) - - - - - - (46) (74) - - 1 1 - - 10 25 - - (2,986) (9,200)
(1,194) (333) 6,063 11,806 (1,119) (57) 3,750 11,416
(1) - 764 2,216 1,995 - 2,758 2,216
560 142 - - - - - - - -
Cash flows from (used in) operating activitiesIncrease (decrease) in net assets attributable to holders of redeemable unitsAdjustments for: Net realized (gain) loss on sale of investments and derivatives Unrealized foreign exchange (gain) loss on cash Commissions and other portfolio transaction costs Change in unrealized (appreciation) depreciation in value of
investments and derivatives Proceeds from sale and maturity of investments and derivatives Purchase of investments and derivatives Non-cash distributions from investments Change in daily variation margin (Increase) decrease in cash collateral on deposit for short sale (Increase) decrease in dividends receivable (Increase) decrease in interest receivable Increase (decrease) in management fees payable Increase (decrease) in administration fees payable Change in other accounts receivable and payable Amortization interest earnedNet cash from (used in) operating activities
Cash flows from (used in) financing activitiesDistributions paid to holders of redeemable units, net of reinvested distributionsProceeds from issuance of redeemable unitsAmounts paid on redemption of redeemable unitsNet cash from (used in) financing activities Unrealized foreign exchange gain (loss) on cashNet increase (decrease) in cashCash (bank overdraft), beginning of periodCash (bank overdraft), end of period
Supplementary Information:Dividends received, net of withholding tax*Interest received, net of withholding tax*Dividends paid*Interest paid*Tax recoverable (paid)

– 80 –
CI Global REIT Private Pool
Semi-Annual Financial Statements - September 30, 2021
Percentages shown relate investments at fair value to net assets attributable to holders of redeemable units of the Fund.
Schedule of Investment Portfolio as at September 30, 2021 (unaudited)
Number ofUnits/Sharesor Par Value Description
Average Cost($)
Fair Value($)
% of Net Assets
EQUITIES AUSTRALIAAUD 174,840 National Storage REIT 353,909 371,430 0.53 CANADA 15,376 Allied Properties REIT 628,319 618,423 USD 67,639 BSR REIT 958,642 1,353,611 34,140 Canadian Apartment Properties REIT 1,697,524 2,018,015 145,555 Chartwell Retirement Residences 1,612,634 1,755,393 29,345 Crombie REIT 407,410 510,016 51,327 Dream Office REIT 1,088,118 1,180,521 304,916 European Residential REIT 1,282,634 1,341,630 71,722 First Capital REIT 1,130,739 1,255,135 19,886 Granite REIT 1,488,854 1,791,331 78,775 H&R REIT 1,291,608 1,231,253 67,098 Minto Apartment REIT 1,356,715 1,500,311 77,430 Morguard North American Residential REIT 1,246,516 1,323,279 55,736 NorthWest Healthcare Properties REIT 625,480 719,552 178,174 StorageVault Canada Inc. 654,839 1,101,115 171,675 Tricon Residential Inc. 1,911,161 2,901,308 17,381,193 20,600,893 29.11 FRANCE EUR 2,140 ARGAN SA 356,878 335,952 0.48 GERMANY EUR 26,194 Deutsche Industrie REIT AG 621,665 672,542 EUR 6,775 LEG Immobilien SE 1,194,981 1,214,674 EUR 18,390 Vantage Towers AG 662,057 791,088 EUR 6,640 VIB Vermoegen AG 353,921 361,428 EUR 12,633 Vonovia SE 1,048,030 961,951 3,880,654 4,001,683 5.66 HONG KONG HKD 559,570 ESR Cayman Ltd. 2,010,201 2,153,208 3.04 JAPAN JPY 221 Nippon Prologis REIT Inc. 890,509 936,877 1.32 MEXICO MXN 659,794 Prologis Property Mexico SA de CV 1,789,215 1,805,683 2.55 NETHERLANDS EUR 28,350 CTP NV 583,607 781,970 1.11 SINGAPORE SGD 246,954 Parkway Life Real Estate Investment Trust 845,460 1,071,205 1.51 SWEDEN SEK 2,310 Catena AB 175,507 158,418 0.22 U.K. GBP 8,550 Segro PLC 180,187 174,369 GBP 122,361 Stenprop Ltd. 355,925 383,191 GBP 59,730 Urban Logistics REIT PLC 179,077 175,330 GBP 67,070 Warehouse REIT PLC 179,648 168,489 894,837 901,379 1.27 U.S.A. USD 8,481 Alexandria Real Estate Equities Inc. 1,886,725 2,052,481 USD 48,787 American Homes 4 Rent, Class ‘A’ 1,944,980 2,355,573 USD 6,011 American Tower Corp. 1,998,913 2,020,708 USD 36,844 Americold Realty Trust 1,769,927 1,355,665 USD 7,544 Camden Property Trust 1,015,725 1,409,110 USD 5,946 Crown Castle International Corp. 1,337,785 1,305,308 USD 19,714 Duke Realty Corp. 1,025,212 1,195,302 USD 2,011 Equinix Inc. 1,899,656 2,012,566 USD 15,835 Equity Lifestyle Properties Inc. 1,381,752 1,566,421

– 81 –
CI Global REIT Private Pool
Semi-Annual Financial Statements - September 30, 2021
Percentages shown relate investments at fair value to net assets attributable to holders of redeemable units of the Fund.
Schedule of Investment Portfolio as at September 30, 2021 (unaudited) (cont’d)
EQUITIES (cont’d) U.S.A. (cont’d)USD 15,704 Equity Residential 1,329,016 1,609,554 USD 7,010 Extra Space Storage Inc. 1,044,991 1,491,561 USD 17,802 First Industrial Realty Trust Inc. 989,231 1,174,301 USD 54,281 Host Hotels & Resorts Inc. 1,130,720 1,122,725 USD 50,305 Invitation Homes Inc. 1,989,052 2,442,246 USD 43,621 iStar Inc. 1,001,215 1,385,679 USD 8,778 Life Storage Inc. 945,721 1,275,704 USD 43,010 Medical Properties Trust Inc. 1,125,164 1,093,343 USD 16,390 Prologis Inc. 2,175,822 2,603,872 USD 4,294 SBA Communications Corp. 1,511,634 1,797,898 USD 8,581 Sun Communities Inc. 1,687,329 2,011,795 USD 45,851 Switch Inc., Class ‘A’ 1,098,998 1,474,521 30,289,568 34,756,333 49.12Total Equities 59,451,538 67,875,031 95.92 Adjustment for transaction costs (141,572)Total Investments 59,309,966 67,875,031 95.92Total unrealized gain on forward foreign currency contract(s) (45,615) (0.06)Other Net Assets (Liabilities) 2,930,016 4.14Net Assets Attributable to Holders of Redeemable Units 70,759,432 100.00
Number ofUnits/Sharesor Par Value Description
Average Cost($)
Fair Value($)
% of Net Assets

– 82 –
CI Global REIT Private Pool
Semi-Annual Financial Statements - September 30, 2021
Schedule of Investment Portfolio as at September 30, 2021 (unaudited) (cont’d)
Forward Foreign Currency Contract(s)
CounterpartyCredit Rating of the Counterparty* Settlement Date
Currency Buy Position
Currency Sell Position
Contract(s) Rate
Unrealized Gain (Loss) ($)
Bank of Montreal A-1 November 18, 2021 CAD 268,525 USD 213,849 1.26 (2,354)Bank of Montreal A-1 December 15, 2021 CAD 719,087 USD 567,793 1.27 (91)Canadian Imperial Bank of Commerce A-1 October 20, 2021 CAD 41,348 USD 32,701 1.26 (73)Canadian Imperial Bank of Commerce A-1 October 20, 2021 CAD 96,675 USD 77,329 1.25 (1,272)Canadian Imperial Bank of Commerce A-1 November 18, 2021 CAD 268,952 USD 213,797 1.26 (1,861)Canadian Imperial Bank of Commerce A-1 December 15, 2021 CAD 511,971 USD 405,566 1.26 (1,727)Citibank N.A., New York A-1 October 20, 2021 CAD 192,703 USD 154,658 1.25 (3,191)Citibank N.A., New York A-1 November 18, 2021 CAD 268,338 USD 213,823 1.25 (2,507)Goldman Sachs & Co., New York A-1 October 20, 2021 CAD 128,931 USD 103,105 1.25 (1,665)Goldman Sachs & Co., New York A-1 November 18, 2021 CAD 167,137 USD 133,639 1.25 (2,142)Goldman Sachs & Co., New York A-1 December 13, 2021 CAD 449,369 GBP 258,000 1.74 9,002 Goldman Sachs & Co., New York A-1 December 15, 2021 CAD 510,920 USD 405,566 1.26 (2,778)HSBC Bank, Toronto A-1 October 20, 2021 CAD 99,978 USD 80,239 1.25 (1,655)HSBC Bank, Toronto A-1 November 18, 2021 CAD 167,537 USD 133,639 1.25 (1,742)HSBC Bank, Toronto A-1 December 13, 2021 CAD 31,193 GBP 18,000 1.73 469 HSBC Bank, Toronto A-1 December 15, 2021 CAD 874,474 USD 686,597 1.27 4,816 JPMorgan Chase Bank, New York A-1 October 20, 2021 CAD 194,007 USD 154,658 1.25 (1,887)JPMorgan Chase Bank, New York A-1 November 18, 2021 CAD 150,903 USD 120,275 1.25 (1,448)JPMorgan Chase Bank, New York A-1 December 15, 2021 CAD 508,517 USD 405,566 1.25 (5,181)Morgan Stanley & Co. International PLC A-1 October 20, 2021 CAD 288,475 USD 231,987 1.24 (5,366)Morgan Stanley & Co. International PLC A-1 December 15, 2021 CAD 719,195 USD 567,793 1.27 17 Royal Bank of Canada A-1+ October 20, 2021 CAD 192,701 USD 154,658 1.25 (3,193)Royal Bank of Canada A-1+ October 20, 2021 CAD 1,156,966 USD 919,000 1.26 (7,066)Royal Bank of Canada A-1+ November 18, 2021 CAD 218,656 USD 175,114 1.25 (3,158)Royal Bank of Canada A-1+ December 15, 2021 CAD 510,957 USD 405,566 1.26 (2,742)Toronto-Dominion Bank (The) A-1+ November 18, 2021 CAD 150,877 USD 120,275 1.25 (1,474)Toronto-Dominion Bank (The) A-1+ December 15, 2021 CAD 508,353 USD 405,566 1.25 (5,346)Total Foreign Currency Forward Contract(s) Value (45,615)
*Credit rating provided by S&P Global Ratings.

– 83 –
CI Global REIT Private Pool
Semi-Annual Financial Statements - September 30, 2021
The accompanying notes are an integral part of these financial statements.
Fund Specific Notes to Financial Statements (unaudited)
Offsetting of Financial Instruments (Note 2)
The following tables show the net impact on the Fund’s Statements of Financial Position if all rights to offset were exercised.
as at September 30, 2021Amounts Eligible for Offset
Gross Assets/(Liabilities)
FinancialInstruments
CollateralReceived/(Paid)
NetExposure
(in $000’s) (in $000’s) (in $000’s) (in $000’s)Derivative assets - Foreign currency forward contracts 14 (10) - 4Derivative assets - Swaps and swaptions - - - -Total 14 (10) - 4Derivative liabilities - Foreign currency forward contracts (60) 10 - (50)Derivative liabilities - Swaps and swaptions - - - -Total (60) 10 - (50)
as at March 31, 2021Amounts Eligible for Offset
Gross Assets/(Liabilities)
FinancialInstruments
CollateralReceived/(Paid)
NetExposure
(in $000’s) (in $000’s) (in $000’s) (in $000’s)Derivative assets - Foreign currency forward contracts 67 (8) - 59Derivative assets - Swaps and swaptions - - - -Total 67 (8) - 59Derivative liabilities - Foreign currency forward contracts (8) 8 - -Derivative liabilities - Swaps and swaptions - - - -Total (8) 8 - -

– 84 –
CI Global REIT Private Pool
Semi-Annual Financial Statements - September 30, 2021
Fund Specific Notes to Financial Statements (unaudited)
†A portion of brokerage commissions paid was used to cover research and market data services, termed soft dollar commissions. This amount has been estimated by the Manager of the Fund.The accompanying notes are an integral part of these financial statements.
Commissions (Note 2)for the periods ended September 30 (in $000’s)
2021 2020Brokerage commissions 29 15Soft dollar commissions† 12 7
Redeemable Unit Transactions (Note 4)for the periods ended September 30
Number of redeemable units at the beginning of periodRedeemable units issued for cashRedeemable units issued for reinvested distributionsRedeemable units redeemedNumber of redeemable units at the end of period
Series A 2021 2020 66,574 - 44,955 25,616 1,464 252 (17,477) - 95,516 25,868
Series F 2021 2020 1,113,716 - 401,713 502,737 14,383 3,847 (74,483) (5,431) 1,455,329 501,153
Series I 2021 2020 1,049 - - 1,000 27 20 - - 1,076 1,020
ETF C$ Series 2021 2020 1,500,000 - 625,000 1,100,000 - - - - 2,125,000 1,100,000

– 85 –
CI Global REIT Private Pool
Semi-Annual Financial Statements - September 30, 2021
The accompanying notes are an integral part of these financial statements.
Fund Specific Notes to Financial Statements (unaudited)
Management and Administration Fees (Note 5) as at September 30, 2021 (%)
Annual management
fee rate:
Annual administration
fee rate:
Series A 1.700 0.15Series F 0.700 0.15Series I Paid directly by investor Paid directly by investorETF C$ Series 0.700 0.15
Securities Lending (Note 6)as at September 30 (in $000’s)
2021 2020Loaned 5,047 -Collateral (non-cash) 5,299 -
Securities Lending Revenue Reconciliation (Note 6)for the periods ended September 30 (in $000’s)
2021 2020Gross securities lending revenue 3 -Charges (1) -Securities lending revenue 2 -Charges as a % of gross securities lending revenue 42.3 -

– 86 –
CI Global REIT Private Pool
Semi-Annual Financial Statements - September 30, 2021
The accompanying notes are an integral part of these financial statements.
Currency Risk (cont’d)
as at March 31, 2021~
Currency
Financial Instruments Exposure Derivatives
Net Exposure
Net Assets
(%)(in $000’s) (in $000’s) (in $000’s)U.S. Dollar 25,108 (6,500) 18,608 40.20Euro 2,345 - 2,345 5.10Hong Kong Dollar 1,700 - 1,700 3.70Japanese Yen 1,518 - 1,518 3.30Singapore Dollar 961 - 961 2.10Mexican Peso 874 - 874 1.90 Total 32,506 (6,500) 26,006 56.30
~Includes monetary and non-monetary instruments, if any.
As at September 30, 2021, had the Canadian dollar strengthened or weakened by 10% (March 31, 2021 - 10%) in relation to all other foreign currencies held in the Fund, with all other variables held constant, net assets attributable to holders of redeemable units of the Fund would have decreased or increased, respectively, by approximately $3,999,000 (March 31, 2021 - $2,601,000). In practice, actual results may differ from this analysis and the difference may be material.
Interest Rate RiskAs at September 30, 2021 and March 31, 2021, the Fund did not have a significant exposure to interest rate risk as substantially all of its assets were invested in equities and derivatives.
Fair Value Hierarchy
The tables below summarize the inputs used by the Fund in valuing the Fund’s investments and derivatives carried at fair value.
Long Positions at fair value as at September 30, 2021Level 1 Level 2 Level 3 Total
(in $000’s) (in $000’s) (in $000’s) (in $000’s)Equities 67,875 - - 67,875 Derivatives, net - (46) - (46) Total 67,875 (46) - 67,829
Long Positions at fair value as at March 31, 2021Level 1 Level 2 Level 3 Total
(in $000’s) (in $000’s) (in $000’s) (in $000’s)Equities 43,597 - - 43,597 Derivatives, net - 59 - 59 Total 43,597 59 - 43,656
There were no transfers between Level 1, 2 and 3 during the period ended September 30, 2021 and the year ended March 31, 2021.
Financial Instruments Risks (Note 10)
Concentration RiskFor Concentration Risk as at September 30, 2021, refer to the Schedule of Investment Portfolio.
The table below summarizes the Fund’s exposure to concentration risk.
as at March 31, 2021Categories Net Assets (%)Equities - U.S.A. 49.8 Equities - Canada 24.7 Other Net Assets (Liabilities) 5.7 Equities - China 4.9 Equities - Germany 3.6 Equities - Japan 3.2 Equities - Hong Kong 2.7 Equities - Singapore 2.0 Equities - Mexico 1.9 Equities - Netherlands 1.4 Unrealized gain (loss) on forward foreign currency contract(s) 0.1 Total 100.0
Credit RiskAs at September 30, 2021 and March 31, 2021, the Fund’s exposure to credit risk through derivative instruments was insignificant.
Other Price RiskAs at September 30, 2021 and March 31, 2021, the Fund was predominantly invested in global equities and therefore was sensitive to changes in general economic conditions across the world.
As at September 30, 2021, had the fair value of equities in the investment portfolio increased or decreased by 10% (March 31, 2021 - 10%), with all other variables held constant, net assets attributable to holders of redeemable units of the Fund would have increased or decreased, respectively, by approximately $6,788,000 (March 31, 2021 - $4,360,000). In practice, actual results may differ from this analysis and the difference may be material.
Currency RiskThe tables below summarize the Fund’s exposure to currency risk.
as at September 30, 2021~
Currency
Financial Instruments Exposure Derivatives
Net Exposure
Net Assets
(%)(in $000’s) (in $000’s) (in $000’s)U.S. Dollar 36,676 (8,971) 27,705 39.2 Euro 5,254 - 5,254 7.4 Hong Kong Dollar 2,154 - 2,154 3.0 Mexican Peso 1,828 - 1,828 2.6 Singapore Dollar 1,106 - 1,106 1.6 Japanese Yen 968 - 968 1.4 British Pound 920 (471) 449 0.6 Australian Dollar 371 - 371 0.5 Swedish Krona 158 - 158 0.2 Total 49,435 (9,442) 39,993 56.5
Fund Specific Notes to Financial Statements (unaudited)

– 87 –
CI Global Smaller Companies Private Pool
Semi-Annual Financial Statements - September 30, 2021
Statements of Financial Position (in $000’s except for per unit amounts and units outstanding)
as at as at Sept. 30, 2021 Mar. 31, 2021 18,647 16,263 - - 322 943
- - - - - - - - - - 2 3 - - - - - - 292 - 139 166 19,402 17,375
- - - -
- - - - - - - - - - 40 65 17 15 - - - - - - - - 57 80
19,345 17,295
Statements of Financial Position (cont’d)(in $000’s except for per unit amounts and units outstanding)
Net assets attributable to holders of redeemable units
per Series (Note 4):
Net assets attributable to holders of redeemable
units per unit: Number of redeemable
units outstanding:
as at Sept. 30, 2021
as at Mar. 31, 2021
as at Sept. 30, 2021
as at Mar. 31, 2021
as at Sept. 30, 2021
as at Mar. 31, 2021
Series A 14,518 10,710 14.67 12.98 990,887 825,079Series F 4,825 6,583 15.13 13.33 319,279 493,946Series I 2 2 15.57 13.64 115 115
AssetsCurrent assetsInvestmentsInvestments pledged as collateralCashUnrealized gain on futures and foreign currency forward contractsSwaps, swaptions and optionsDaily variation margin on derivative instrumentsFees rebate receivableCash collateral on deposit for short saleDividends receivableInterest receivableReceivable for distribution from investmentsSecurities lending revenue receivable (Note 6)Receivable for investments soldReceivable for unit subscriptions
LiabilitiesCurrent liabilitiesInvestments sold shortBank overdraftUnrealized loss on futures and foreign currency forward contractsSwaps, swaptions and options Dividends payable on investments sold shortInterest payable on investments sold shortDaily variation margin on derivative instrumentsPayable for investments purchasedPayable for unit redemptionsDistributions payable to holders of redeemable units Management fees payableAdministration fees payableAccounts payable and accrued liabilities
Net assets attributable to holders of redeemable units
The accompanying notes are an integral part of these financial statements.
Financial Statements (unaudited)
CIG - 2061

– 88 –
CI Global Smaller Companies Private Pool
Semi-Annual Financial Statements - September 30, 2021
Statements of Comprehensive Incomefor the periods ended September 30(in $000’s except for per unit amounts and number of units)
2021 2020
89 17 - - - - - - - -
- - - -
1,404 126
1,424 1,437 2,917 1,580 (14) (18) - - 8 1 - - (6) (17) 2,911 1,563
145 22 16 3 27 12 1 1 - - - - - - - - 13 2 17 3 - - 219 43
2,692 1,520
The accompanying notes are an integral part of these financial statements.
Financial Statements (unaudited)
Statements of Comprehensive Income (cont’d)for the periods ended September 30(in $000’s except for per unit amounts and number of units)
Increase (decrease) in net assets attributable to
holders of redeemable units per Series:
Increase (decrease) in net assets attributable to
holders of redeemable units per unit:
Weighted average number of units:
2021 2020 2021 2020 2021 2020Series A 1,493 362 1.59 3.15 937,765 114,941Series F 1,199 1,156 2.09 3.30 573,863 349,660Series I - 2 1.92 5.49 115 318
Income Net gain (loss) on investments and derivatives Dividends Interest for distribution purposes Income distributions from investments Capital gain distributions from investments Derivative income (loss) Dividends expense on financial assets (liabilities) sold
short Interest expense on financial assets (liabilities) sold short Net realized gain (loss) on sale of investments and
derivatives Change in unrealized appreciation (depreciation) in value
of investments and derivativesTotal net gain (loss) on investments and derivativesOther income Foreign exchange gain (loss) on cash Commitment fee income Securities lending revenue (Note 6) Fees rebateTotal other incomeTotal incomeExpensesManagement fees (Note 5)Administration fees (Note 5)Commissions and other portfolio transaction costsIndependent review committee feesSecurities borrowing fees (Note 2)Margin feesService feesInterest expenseWithholding taxesHarmonized sales taxOther expensesTotal expensesIncrease (decrease) in net assets attributable to holders of redeemable units

– 89 –
CI Global Smaller Companies Private Pool
Semi-Annual Financial Statements - September 30, 2021
Statements of Changes in Net Assets Attributable to Holders of Redeemable Units for the periods ended September 30 (in $000’s)
Net assets attributable to holders of redeemable units at the beginning of periodIncrease (decrease) in net assets attributable to holders of redeemable unitsDistributions to holders of redeemable units From net investment income From net realized gains Return of capitalTotal distributions to holders of redeemable units
Redeemable unit transactions Proceeds from redeemable units issued Reinvestment of distributions to holders of redeemable units Redemption of redeemable unitsNet increase (decrease) from redeemable unit transactionsNet increase (decrease) in net assets attributable to holders of redeemable unitsNet assets attributable to holders of redeemable units at the end of period
The accompanying notes are an integral part of these financial statements.
Financial Statements (unaudited)
Series A 2021 2020 10,710 865 1,493 362
- - - - - - - -
2,666 573 - - (351) (70) 2,315 503 3,808 865 14,518 1,730
Series F 2021 2020 6,583 2,671 1,199 1,156
- - - - - - - -
2,373 412 - - (5,330) (281) (2,957) 131 (1,758) 1,287 4,825 3,958
Series I 2021 2020 2 7 - 2
- - - - - - - -
- - - - - (8) - (8) - (6) 2 1
Total Fund 2021 2020 17,295 3,543 2,692 1,520
- - - - - - - -
5,039 985 - - (5,681) (359) (642) 626 2,050 2,146 19,345 5,689

– 90 –
CI Global Smaller Companies Private Pool
Semi-Annual Financial Statements - September 30, 2021
Statements of Cash Flowsfor the periods ended September 30 (in $000’s)
2021 2020
2,692 1,520
(1,404) (126) 1 - 27 12
(1,424) (1,437) 13,174 3,442 (13,074) (3,750) - - - - - - 1 6 - - - - - - - - - - (7) (333)
- - 5,028 980 (5,641) (352) (613) 628
(1) - (620) 295 943 89 322 384
79 21 - - - - - - - -
*Dividends and interest received as well as dividends and interest paid relate to operating activities of the Fund. The accompanying notes are an integral part of these financial statements.
Financial Statements (unaudited)
Cash flows from (used in) operating activitiesIncrease (decrease) in net assets attributable to holders of redeemable unitsAdjustments for: Net realized (gain) loss on sale of investments and derivatives Unrealized foreign exchange (gain) loss on cash Commissions and other portfolio transaction costs Change in unrealized (appreciation) depreciation in value of
investments and derivatives Proceeds from sale and maturity of investments and derivatives Purchase of investments and derivatives (Increase) decrease in cash collateral on deposit for short sale Non-cash distributions from investments Change in daily variation margin (Increase) decrease in dividends receivable (Increase) decrease in interest receivable (Increase) decrease in securities lending revenue receivable Increase (decrease) in management fees payable Increase (decrease) in administration fees payable Change in other accounts receivable and payableNet cash from (used in) operating activities
Cash flows from (used in) financing activitiesDistributions paid to holders of redeemable units, net of reinvested distributionsProceeds from issuance of redeemable unitsAmounts paid on redemption of redeemable unitsNet cash from (used in) financing activities Unrealized foreign exchange gain (loss) on cashNet increase (decrease) in cashCash (bank overdraft), beginning of periodCash (bank overdraft), end of period
Supplementary Information:Dividends received, net of withholding tax*Interest received, net of withholding tax*Dividends paid*Interest paid*Tax recoverable (paid)
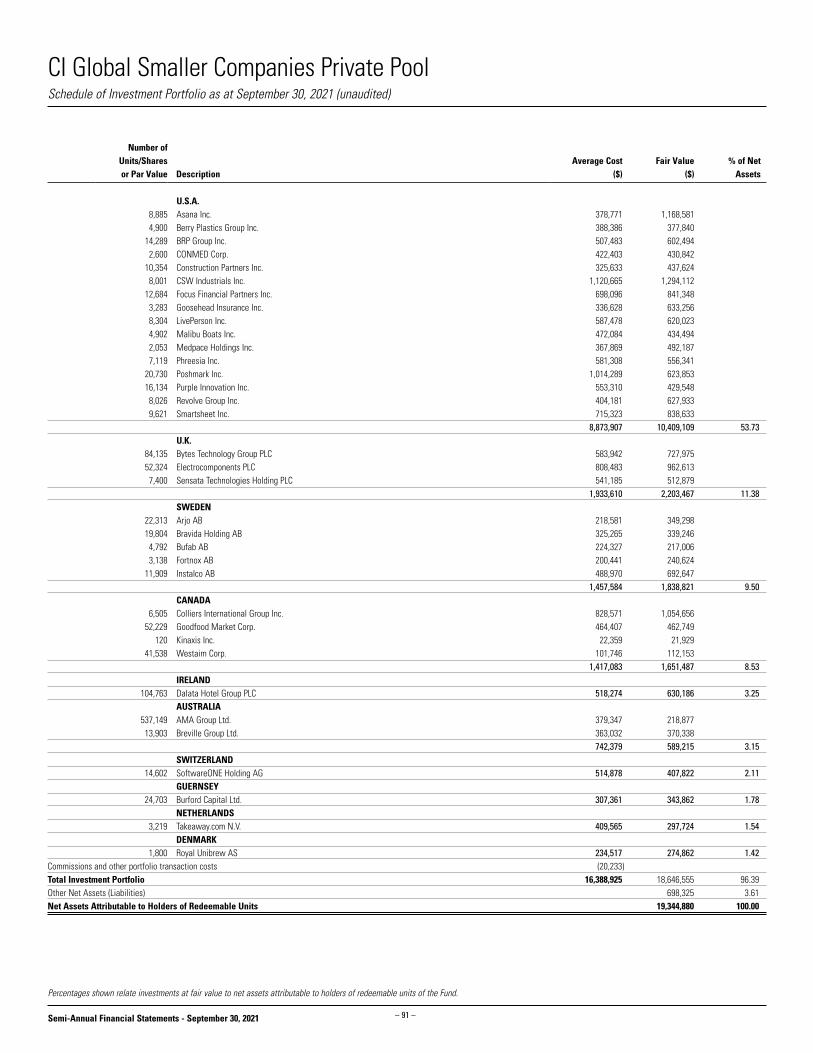
– 91 –
CI Global Smaller Companies Private Pool
Semi-Annual Financial Statements - September 30, 2021
Percentages shown relate investments at fair value to net assets attributable to holders of redeemable units of the Fund.
Schedule of Investment Portfolio as at September 30, 2021 (unaudited)
Number ofUnits/Sharesor Par Value Description
Average Cost($)
Fair Value($)
% of Net Assets
U.S.A. 8,885 Asana Inc. 378,771 1,168,581 4,900 Berry Plastics Group Inc. 388,386 377,840 14,289 BRP Group Inc. 507,483 602,494 2,600 CONMED Corp. 422,403 430,842 10,354 Construction Partners Inc. 325,633 437,624 8,001 CSW Industrials Inc. 1,120,665 1,294,112 12,684 Focus Financial Partners Inc. 698,096 841,348 3,283 Goosehead Insurance Inc. 336,628 633,256 8,304 LivePerson Inc. 587,478 620,023 4,902 Malibu Boats Inc. 472,084 434,494 2,053 Medpace Holdings Inc. 367,869 492,187 7,119 Phreesia Inc. 581,308 556,341 20,730 Poshmark Inc. 1,014,289 623,853 16,134 Purple Innovation Inc. 553,310 429,548 8,026 Revolve Group Inc. 404,181 627,933 9,621 Smartsheet Inc. 715,323 838,633 8,873,907 10,409,109 53.73 U.K. 84,135 Bytes Technology Group PLC 583,942 727,975 52,324 Electrocomponents PLC 808,483 962,613 7,400 Sensata Technologies Holding PLC 541,185 512,879 1,933,610 2,203,467 11.38 SWEDEN 22,313 Arjo AB 218,581 349,298 19,804 Bravida Holding AB 325,265 339,246 4,792 Bufab AB 224,327 217,006 3,138 Fortnox AB 200,441 240,624 11,909 Instalco AB 488,970 692,647 1,457,584 1,838,821 9.50 CANADA 6,505 Colliers International Group Inc. 828,571 1,054,656 52,229 Goodfood Market Corp. 464,407 462,749 120 Kinaxis Inc. 22,359 21,929 41,538 Westaim Corp. 101,746 112,153 1,417,083 1,651,487 8.53 IRELAND 104,763 Dalata Hotel Group PLC 518,274 630,186 3.25 AUSTRALIA 537,149 AMA Group Ltd. 379,347 218,877 13,903 Breville Group Ltd. 363,032 370,338 742,379 589,215 3.15 SWITZERLAND 14,602 SoftwareONE Holding AG 514,878 407,822 2.11 GUERNSEY 24,703 Burford Capital Ltd. 307,361 343,862 1.78 NETHERLANDS 3,219 Takeaway.com N.V. 409,565 297,724 1.54 DENMARK 1,800 Royal Unibrew AS 234,517 274,862 1.42Commissions and other portfolio transaction costs (20,233)Total Investment Portfolio 16,388,925 18,646,555 96.39Other Net Assets (Liabilities) 698,325 3.61Net Assets Attributable to Holders of Redeemable Units 19,344,880 100.00

– 92 –
CI Global Smaller Companies Private Pool
Semi-Annual Financial Statements - September 30, 2021
Redeemable Unit Transactions (Note 4)for the periods ended September 30
Number of redeemable units at the beginning of periodRedeemable units issued for cashRedeemable units issued for reinvested distributionsRedeemable units redeemedNumber of redeemable units at the end of period
Fund Specific Notes to Financial Statements (unaudited)
†A portion of brokerage commissions paid was used to cover research and market data services, termed soft dollar commissions. This amount has been estimated by the Manager of the Fund.The accompanying notes are an integral part of these financial statements.
Commissions (Note 2)for the periods ended September 30 (in $000’s)
2021 2020Brokerage commissions 26 11Soft dollar commissions† 11 6
Series A 2021 2020 825,079 114,121 189,689 53,902 - - (23,881) (7,554) 990,887 160,469
Series F 2021 2020 493,946 346,974 164,255 40,564 - - (338,922) (28,066) 319,279 359,472
Series I 2021 2020 115 1,000 - - - - - (885) 115 115

– 93 –
CI Global Smaller Companies Private Pool
Semi-Annual Financial Statements - September 30, 2021
The accompanying notes are an integral part of these financial statements.
Fund Specific Notes to Financial Statements (unaudited)
Securities Lending (Note 6)as at September 30 (in $000’s)
2021 2020Loaned 2,444 693Collateral (non-cash) 2,493 706
Securities Lending Revenue Reconciliation (Note 6)for the periods ended September 30 (in $000’s)
2021 2020Gross securities lending revenue 9 1Charges (1) -Securities lending revenue 8 1Charges as a % of gross securities lending revenue 11.1 -
Management and Administration Fees (Note 5) as at September 30, 2021 (%)
Annual management
fee rate:
Annual administration
fee rate:
Series A 1.700 0.15Series F 0.700 0.15Series I Paid directly by investor Paid directly by investor

– 94 –
CI Global Smaller Companies Private Pool
Semi-Annual Financial Statements - September 30, 2021
The accompanying notes are an integral part of these financial statements.
Currency Risk (cont’d)
as at March 31, 2021~
Currency
Financial Instruments Exposure Derivatives
Net Exposure
Net Assets
(%)(in $000’s) (in $000’s) (in $000’s)U.S. Dollar 7,398 - 7,398 42.8 British Pound 3,367 - 3,367 19.5 Swedish Krona 1,529 - 1,529 8.8 Euro 884 - 884 5.1 Australian Dollar 818 - 818 4.7 Swiss Franc 770 - 770 4.5 Japanese Yen 636 - 636 3.7 Danish Krone 510 - 510 2.9 Total 15,912 - 15,912 92.0
~Includes monetary and non-monetary instruments, if any.
As at September 30, 2021, had the Canadian dollar strengthened or weakened by 10% (March 31, 2021 - 10%) in relation to all other foreign currencies held in the Fund, with all other variables held constant, net assets attributable to holders of redeemable units of the Fund would have decreased or increased, respectively, by approximately $1,752,000 (March 31, 2021 - $1,591,000). In practice, actual results may differ from this analysis and the difference may be material.
Interest Rate RiskAs at September 30, 2021 and March 31, 2021, the Fund did not have a significant exposure to interest rate risk as substantially all of its assets were invested in equities.
Fair Value Hierarchy
The tables below summarize the inputs used by the Fund in valuing the Fund’s investments and derivatives carried at fair value.
Long Positions at fair value as at September 30, 2021Level 1 Level 2 Level 3 Total
(in $000’s) (in $000’s) (in $000’s) (in $000’s)Equities 18,647 - - 18,647 Total 18,647 - - 18,647
Long Positions at fair value as at March 31, 2021Level 1 Level 2 Level 3 Total
(in $000’s) (in $000’s) (in $000’s) (in $000’s)Equities 16,263 - - 16,263 Total 16,263 - - 16,263
There were no transfers between Level 1, 2 and 3 during the period ended September 30, 2021 and the year ended March 31, 2021.
Financial Instruments Risks (Note 10)
Concentration RiskFor Concentration Risk as at September 30, 2021, refer to the Schedule of Investment Portfolio.
The table below summarizes the Fund’s exposure to concentration risk.
as at March 31, 2021Categories Net Assets (%)U.S.A. 35.8 U.K. 14.3 Sweden 8.8 Canada 7.1 Other Net Assets (Liabilities) 6.0 Switzerland 4.8 Australia 4.7 Ireland 4.1 Netherlands 3.9 Japan 3.7 Denmark 3.0 Guernsey 1.6 Germany 1.3 Jersey Island 1.0 Total 100.0
Credit RiskAs at September 30, 2021 and March 31, 2021, the Fund did not have a significant exposure to credit risk as substantially all of its assets were invested in equities.
Other Price RiskAs at September 30, 2021 and March 31, 2021, the Fund was predominantly invested in global equities and therefore was sensitive to changes in general economic conditions across the world.
As at September 30, 2021, had the fair value of equities in the investment portfolio increased or decreased by 10% (March 31, 2021 - 10%), with all other variables held constant, net assets attributable to holders of redeemable units of the Fund would have increased or decreased, respectively, by approximately $1,865,000 (March 31, 2021 - $1,626,000). In practice, actual results may differ from this analysis and the difference may be material.
Currency RiskThe tables below summarize the Fund’s exposure to currency risk.
as at September 30, 2021~
Currency
Financial Instruments Exposure Derivatives
Net Exposure
Net Assets
(%)(in $000’s) (in $000’s) (in $000’s)U.S. Dollar 11,806 - 11,806 61.0 Swedish Krona 1,825 - 1,825 9.4 British Pound 1,691 - 1,691 8.7 Euro 928 - 928 4.8 Australian Dollar 591 - 591 3.1 Swiss Franc 408 - 408 2.1 Danish Krone 275 - 275 1.4 Total 17,524 - 17,524 90.5
Fund Specific Notes to Financial Statements (unaudited)

– 95 –
CI International Equity Alpha Private Pool
Semi-Annual Financial Statements - September 30, 2021
Statements of Financial Position (in $000’s except for per unit amounts and units outstanding)
as at as at Sept. 30, 2021 Mar. 31, 2021 31,040 28,645 - - 2,658 1,031
- - - - - - - - - - 23 17 - - - - - - - 116 - 47 33,721 29,856
- - - -
- - - - - - - - - - 136 117 - 474 - - - - - - - - 136 591
33,585 29,265
Statements of Financial Position (cont’d)(in $000’s except for per unit amounts and units outstanding)
Net assets attributable to holders of redeemable units
per Series (Note 4):
Net assets attributable to holders of redeemable
units per unit: Number of redeemable
units outstanding:
as at Sept. 30, 2021
as at Mar. 31, 2021
as at Sept. 30, 2021
as at Mar. 31, 2021
as at Sept. 30, 2021
as at Mar. 31, 2021
Series A 3,601 2,477 13.92 13.31 258,757 186,154Series F 29,982 26,787 14.15 13.45 2,118,515 1,991,226Series I 2 1 14.27 13.50 108 108
AssetsCurrent assetsInvestmentsInvestments pledged as collateralCashUnrealized gain on futures and foreign currency forward contractsSwaps, swaptions and optionsDaily variation margin on derivative instrumentsFees rebate receivableCash collateral on deposit for short saleDividends receivableInterest receivableReceivable for distribution from investmentsSecurities lending revenue receivable (Note 6)Receivable for investments soldReceivable for unit subscriptions
LiabilitiesCurrent liabilitiesInvestments sold shortBank overdraftUnrealized loss on futures and foreign currency forward contractsSwaps, swaptions and options Dividends payable on investments sold shortInterest payable on investments sold shortDaily variation margin on derivative instrumentsPayable for investments purchasedPayable for unit redemptionsDistributions payable to holders of redeemable units Management fees payableAdministration fees payableAccounts payable and accrued liabilities
Net assets attributable to holders of redeemable units
The accompanying notes are an integral part of these financial statements.
Financial Statements (unaudited)
CIG - 2063

– 96 –
CI International Equity Alpha Private Pool
Semi-Annual Financial Statements - September 30, 2021
Statements of Comprehensive Incomefor the periods ended September 30(in $000’s except for per unit amounts and number of units)
2021 2020
1,085 297 1 1 - - - - - -
- - - -
1,060 507
(437) 2,363 1,709 3,168 (6) 4 - - 1 1 - - (5) 5 1,704 3,173
124 79 22 16 19 12 1 1 - - - - - - - - 82 31 19 12 - - 267 151
1,437 3,022
The accompanying notes are an integral part of these financial statements.
Financial Statements (unaudited)
Statements of Comprehensive Income (cont’d)for the periods ended September 30(in $000’s except for per unit amounts and number of units)
Increase (decrease) in net assets attributable to
holders of redeemable units per Series:
Increase (decrease) in net assets attributable to
holders of redeemable units per unit:
Weighted average number of units:
2021 2020 2021 2020 2021 2020Series A 111 97 0.51 1.28 220,415 75,790Series F 1,325 2,924 0.67 1.46 1,984,891 2,009,726Series I 1 1 0.77 2.08 107 315
Income Net gain (loss) on investments and derivatives Dividends Interest for distribution purposes Income distributions from investments Capital gain distributions from investments Derivative income (loss) Dividends expense on financial assets (liabilities) sold
short Interest expense on financial assets (liabilities) sold short Net realized gain (loss) on sale of investments and
derivatives Change in unrealized appreciation (depreciation) in value
of investments and derivativesTotal net gain (loss) on investments and derivativesOther income Foreign exchange gain (loss) on cash Commitment fee income Securities lending revenue (Note 6) Fees rebateTotal other incomeTotal incomeExpensesManagement fees (Note 5)Administration fees (Note 5)Commissions and other portfolio transaction costsIndependent review committee feesSecurities borrowing fees (Note 2)Margin feesService feesInterest expenseWithholding taxesHarmonized sales taxOther expensesTotal expensesIncrease (decrease) in net assets attributable to holders of redeemable units

– 97 –
CI International Equity Alpha Private Pool
Semi-Annual Financial Statements - September 30, 2021
Statements of Changes in Net Assets Attributable to Holders of Redeemable Unitsfor the periods ended September 30 (in $000’s)
Net assets attributable to holders of redeemable units at the beginning of periodIncrease (decrease) in net assets attributable to holders of redeemable unitsDistributions to holders of redeemable units From net investment income From net realized gains Return of capitalTotal distributions to holders of redeemable units
Redeemable unit transactions Proceeds from redeemable units issued Reinvestment of distributions to holders of redeemable units Redemption of redeemable unitsNet increase (decrease) from redeemable unit transactionsNet increase (decrease) in net assets attributable to holders of redeemable unitsNet assets attributable to holders of redeemable units at the end of period
The accompanying notes are an integral part of these financial statements.
Financial Statements (unaudited)
Series A 2021 2020 2,477 1,036 111 97
- - - - - - - -
1,210 369 - - (197) (538) 1,013 (169) 1,124 (72) 3,601 964
Series F 2021 2020 26,787 19,994 1,325 2,924
- - - - - - - -
5,223 2,619 - - (3,353) (4,197) 1,870 (1,578) 3,195 1,346 29,982 21,340
Series I 2021 2020 1 9 1 1
- - - - - - - -
- - - - - (9) - (9) 1 (8) 2 1
Total Fund 2021 2020 29,265 21,039 1,437 3,022
- - - - - - - -
6,433 2,988 - - (3,550) (4,744) 2,883 (1,756) 4,320 1,266 33,585 22,305

– 98 –
CI International Equity Alpha Private Pool
Semi-Annual Financial Statements - September 30, 2021
Statements of Cash Flowsfor the periods ended September 30 (in $000’s)
2021 2020
1,437 3,022
(1,060) (507) - 1 19 12
437 (2,363) 3,459 3,690 (5,115) (1,914) - - - - - - (6) 2 - - - - - - - - - - (829) 1,943
- - 6,480 2,903 (4,024) (4,794) 2,456 (1,891)
- (1) 1,627 52 1,031 692 2,658 743
997 268 1 1 - - - - - -
*Dividends and interest received as well as dividends and interest paid relate to operating activities of the Fund. The accompanying notes are an integral part of these financial statements.
Financial Statements (unaudited)
Cash flows from (used in) operating activitiesIncrease (decrease) in net assets attributable to holders of redeemable unitsAdjustments for: Net realized (gain) loss on sale of investments and derivatives Unrealized foreign exchange (gain) loss on cash Commissions and other portfolio transaction costs Change in unrealized (appreciation) depreciation in value of
investments and derivatives Proceeds from sale and maturity of investments and derivatives Purchase of investments and derivatives (Increase) decrease in cash collateral on deposit for short sale Non-cash distributions from investments Change in daily variation margin (Increase) decrease in dividends receivable (Increase) decrease in interest receivable (Increase) decrease in securities lending revenue receivable Increase (decrease) in management fees payable Increase (decrease) in administration fees payable Change in other accounts receivable and payableNet cash from (used in) operating activities
Cash flows from (used in) financing activitiesDistributions paid to holders of redeemable units, net of reinvested distributionsProceeds from issuance of redeemable unitsAmounts paid on redemption of redeemable unitsNet cash from (used in) financing activities Unrealized foreign exchange gain (loss) on cashNet increase (decrease) in cashCash (bank overdraft), beginning of periodCash (bank overdraft), end of period
Supplementary Information:Dividends received, net of withholding tax*Interest received, net of withholding tax*Dividends paid*Interest paid*Tax recoverable (paid)

– 99 –
CI International Equity Alpha Private Pool
Semi-Annual Financial Statements - September 30, 2021
Percentages shown relate investments at fair value to net assets attributable to holders of redeemable units of the Fund.
Schedule of Investment Portfolio as at September 30, 2021 (unaudited)
Number ofUnits/Sharesor Par Value Description
Average Cost($)
Fair Value($)
% of Net Assets
FRANCE 9,600 Arkema S.A. 1,291,406 1,612,700 4,890 Cap Gemini S.A. 745,562 1,292,468 24,733 Criteo S.A., ADR 628,123 1,148,121 13,800 Ipsen S.A. 1,585,393 1,671,574 4,250,484 5,724,863 17.04 JAPAN 17,400 Horiba Ltd. 1,294,936 1,552,482 5,100 Hoshizaki Corp. 513,652 590,853 23,000 NOF Corp. 1,077,103 1,654,269 38,400 SCSK Corp. 862,958 1,033,968 26,000 Ushio Inc. 523,833 622,263 4,272,482 5,453,835 16.24 U.K. 167,342 BAE Systems PLC 1,432,138 1,614,132 238,925 Morgan Advanced Materials PLC 1,072,453 1,469,938 108,500 Tate & Lyle PLC 1,342,808 1,280,980 3,847,399 4,365,050 13.00 NETHERLANDS 29,727 Boskalis Westminster N.V. 994,501 1,146,181 26,366 Koninklijke Philips N.V. 1,524,831 1,483,109 18,919 STMicroelectronics N.V. 506,669 1,048,249 3,026,001 3,677,539 10.95 CHINA 308,071 Haier Smart Home Co., Ltd. 1,251,206 1,375,912 213,997 Sinopharm Group Co., Ltd., Shares H 1,022,678 706,808 2,273,884 2,082,720 6.20 PORTUGAL 139,220 Galp Energia SGPS S.A. 2,199,797 2,001,725 5.96 BERMUDA 1,317,750 Kunlun Energy Co., Ltd. 1,569,083 1,740,951 5.18 GERMANY 15,687 HeidelbergCement AG 1,413,374 1,490,931 4.44 INDIA 45,683 ICICI Bank Ltd., ADR 639,726 1,091,851 3.25 CAYMAN ISLANDS 47,151 Alibaba Group Holding Ltd. 1,591,331 1,090,908 3.25 SPAIN 56,656 Grifols S.A., ADR 1,440,269 1,048,414 3.12 IRELAND 30,918 Glanbia PLC 734,372 643,227 1.92 AUSTRIA 14,700 Wienerberger AG 318,727 628,469 1.87Commissions and other portfolio transaction costs (63,209)Total Investment Portfolio 27,513,720 31,040,483 92.42Other Net Assets (Liabilities) 2,544,277 7.58Net Assets Attributable to Holders of Redeemable Units 33,584,760 100.00

– 100 –
CI International Equity Alpha Private Pool
Semi-Annual Financial Statements - September 30, 2021
Redeemable Unit Transactions (Note 4)for the periods ended September 30
Number of redeemable units at the beginning of periodRedeemable units issued for cashRedeemable units issued for reinvested distributionsRedeemable units redeemedNumber of redeemable units at the end of period
Fund Specific Notes to Financial Statements (unaudited)
†A portion of brokerage commissions paid was used to cover research and market data services, termed soft dollar commissions. This amount has been estimated by the Manager of the Fund.The accompanying notes are an integral part of these financial statements.
Commissions (Note 2)for the periods ended September 30 (in $000’s)
2021 2020Brokerage commissions 16 9Soft dollar commissions† 2 1
Series A 2021 2020 186,154 113,590 87,003 34,402 - - (14,400) (56,191) 258,757 91,801
Series F 2021 2020 1,991,226 2,178,102 367,215 256,733 - - (239,926) (427,915) 2,118,515 2,006,920
Series I 2021 2020 108 1,020 - - - - - (914) 108 106

– 101 –
CI International Equity Alpha Private Pool
Semi-Annual Financial Statements - September 30, 2021
The accompanying notes are an integral part of these financial statements.
Fund Specific Notes to Financial Statements (unaudited)
Securities Lending (Note 6)as at September 30 (in $000’s)
2021 2020Loaned 632 273Collateral (non-cash) 645 278
Securities Lending Revenue Reconciliation (Note 6)for the periods ended September 30 (in $000’s)
2021 2020Gross securities lending revenue 1 1Charges - -Securities lending revenue 1 1Charges as a % of gross securities lending revenue - -
Management and Administration Fees (Note 5) as at September 30, 2021 (%)
Annual management
fee rate:
Annual administration
fee rate:
Series A 1.700 0.15Series F 0.700 0.15Series I Paid directly by investor Paid directly by investor

– 102 –
CI International Equity Alpha Private Pool
Semi-Annual Financial Statements - September 30, 2021
The accompanying notes are an integral part of these financial statements.
Currency Risk (cont’d)
as at March 31, 2021~
Currency
Financial Instruments Exposure Derivatives
Net Exposure
Net Assets
(%)(in $000’s) (in $000’s) (in $000’s)Euro 12,237 - 12,237 41.8 Hong Kong Dollar 4,503 - 4,503 15.4 Japanese Yen 4,181 - 4,181 14.3 U.S. Dollar 3,738 - 3,738 12.8 British Pound 3,705 - 3,705 12.7 Australian Dollar 296 - 296 1.0 Total 28,660 - 28,660 98.0
~Includes monetary and non-monetary instruments, if any.
As at September 30, 2021, had the Canadian dollar strengthened or weakened by 10% (March 31, 2021 - 10%) in relation to all other foreign currencies held in the Fund, with all other variables held constant, net assets attributable to holders of redeemable units of the Fund would have decreased or increased, respectively, by approximately $3,093,000 (March 31, 2021 - $2,866,000). In practice, actual results may differ from this analysis and the difference may be material.
Interest Rate RiskAs at September 30, 2021 and March 31, 2021, the Fund did not have a significant exposure to interest rate risk as substantially all of its assets were invested in equities.
Fair Value Hierarchy
The tables below summarize the inputs used by the Fund in valuing the Fund’s investments and derivatives carried at fair value.
Long Positions at fair value as at September 30, 2021Level 1 Level 2 Level 3 Total
(in $000’s) (in $000’s) (in $000’s) (in $000’s)Equities 31,040 - - 31,040 Total 31,040 - - 31,040
Long Positions at fair value as at March 31, 2021Level 1 Level 2 Level 3 Total
(in $000’s) (in $000’s) (in $000’s) (in $000’s)Equities 28,645 - - 28,645 Total 28,645 - - 28,645
There were no transfers between Level 1, 2 and 3 during the period ended September 30, 2021 and the year ended March 31, 2021.
Financial Instruments Risks (Note 10)
Concentration RiskFor Concentration Risk as at September 30, 2021, refer to the Schedule of Investment Portfolio.
The table below summarizes the Fund’s exposure to concentration risk.
as at March 31, 2021Categories Net Assets (%)France 17.9 Japan 14.2 U.K. 12.7 Netherlands 11.9 China 6.4 Bermuda 6.0 Germany 5.3 Portugal 5.1 India 4.7 Spain 3.9 Cayman Islands 3.4 Austria 3.1 Ireland 2.2 Other Net Assets (Liabilities) 2.1 Australia 1.0 Total 100.0
Credit RiskAs at September 30, 2021 and March 31, 2021, the Fund did not have a significant exposure to credit risk as substantially all of its assets were invested in equities.
Other Price RiskAs at September 30, 2021 and March 31, 2021, the Fund was predominantly invested in foreign equities and therefore was sensitive to changes in general economic conditions across the world.
As at September 30, 2021, had the fair value of equities in the investment portfolio increased or decreased by 10% (March 31, 2021 - 10%), with all other variables held constant, net assets attributable to holders of redeemable units of the Fund would have increased or decreased, respectively, by approximately $3,104,000 (March 31, 2021 - $2,865,000). In practice, actual results may differ from this analysis and the difference may be material.
Currency RiskThe tables below summarize the Fund’s exposure to currency risk.
as at September 30, 2021~
Currency
Financial Instruments Exposure Derivatives
Net Exposure
Net Assets
(%)(in $000’s) (in $000’s) (in $000’s)Euro 12,947 - 12,947 38.5 Japanese Yen 5,472 - 5,472 16.3 Hong Kong Dollar 4,915 - 4,915 14.6 British Pound 4,306 - 4,306 12.8 U.S. Dollar 3,287 - 3,287 9.8 Total 30,927 - 30,927 92.0
Fund Specific Notes to Financial Statements (unaudited)

– 103 –
CI International Equity Growth Private Pool
Semi-Annual Financial Statements - September 30, 2021
Statements of Financial Position (in $000’s except for per unit amounts and units outstanding)
as at as at Sept. 30, 2021 Mar. 31, 2021 11,187 9,459 - - 615 537
- - - - - - - - - - 5 8 - - - - - - - - - - 11,807 10,004
- - - -
- - - - - - - - - - 59 - - - - - - - - - - - 59 -
11,748 10,004
Statements of Financial Position (cont’d)(in $000’s except for per unit amounts and units outstanding)
Net assets attributable to holders of redeemable units
per Series (Note 4):
Net assets attributable to holders of redeemable
units per unit: Number of redeemable
units outstanding:
as at Sept. 30, 2021
as at Mar. 31, 2021
as at Sept. 30, 2021
as at Mar. 31, 2021
as at Sept. 30, 2021
as at Mar. 31, 2021
Series A 151 84 13.63 12.25 11,083 6,898Series F 2,762 2,218 14.03 12.54 196,742 176,925Series I 8,835 7,702 14.28 12.70 618,901 606,603
AssetsCurrent assetsInvestmentsInvestments pledged as collateralCashUnrealized gain on futures and foreign currency forward contractsSwaps, swaptions and optionsDaily variation margin on derivative instrumentsFees rebate receivableCash collateral on deposit for short saleDividends receivableInterest receivableReceivable for distribution from investmentsSecurities lending revenue receivable (Note 6)Receivable for investments soldReceivable for unit subscriptions
LiabilitiesCurrent liabilitiesInvestments sold shortBank overdraftUnrealized loss on futures and foreign currency forward contractsSwaps, swaptions and options Dividends payable on investments sold shortInterest payable on investments sold shortDaily variation margin on derivative instrumentsPayable for investments purchasedPayable for unit redemptionsDistributions payable to holders of redeemable units Management fees payableAdministration fees payableAccounts payable and accrued liabilities
Net assets attributable to holders of redeemable units
The accompanying notes are an integral part of these financial statements.
Financial Statements (unaudited)
CIG - 2064

– 104 –
CI International Equity Growth Private Pool
Semi-Annual Financial Statements - September 30, 2021
Statements of Comprehensive Incomefor the periods ended September 30(in $000’s except for per unit amounts and number of units)
2021 2020
362 16 - - - - - - - -
- - - -
(79) 14
1,054 238 1,337 268 (2) (1) - - 2 - - - - (1) 1,337 267
9 5 1 1 17 4 1 1 - - - - - 6 - - 60 3 1 - - - 89 20
1,248 247
The accompanying notes are an integral part of these financial statements.
Financial Statements (unaudited)
Statements of Comprehensive Income (cont’d)for the periods ended September 30(in $000’s except for per unit amounts and number of units)
Increase (decrease) in net assets attributable to
holders of redeemable units per Series:
Increase (decrease) in net assets attributable to
holders of redeemable units per unit:
Weighted average number of units:
2021 2020 2021 2020 2021 2020Series A 11 1 1.22 2.18 8,741 366Series F 266 245 1.48 1.85 180,716 132,443Series I 971 1 1.58 2.85 615,177 309
Income Net gain (loss) on investments and derivatives Dividends Interest for distribution purposes Income distributions from investments Capital gain distributions from investments Derivative income (loss) Dividends expense on financial assets (liabilities) sold
short Interest expense on financial assets (liabilities) sold short Net realized gain (loss) on sale of investments and
derivatives Change in unrealized appreciation (depreciation) in value
of investments and derivativesTotal net gain (loss) on investments and derivativesOther income Foreign exchange gain (loss) on cash Commitment fee income Securities lending revenue (Note 6) Fees rebateTotal other incomeTotal incomeExpensesManagement fees (Note 5)Administration fees (Note 5)Commissions and other portfolio transaction costsIndependent review committee feesSecurities borrowing fees (Note 2)Margin feesService feesInterest expenseWithholding taxesHarmonized sales taxOther expensesTotal expensesIncrease (decrease) in net assets attributable to holders of redeemable units

– 105 –
CI International Equity Growth Private Pool
Semi-Annual Financial Statements - September 30, 2021
Statements of Changes in Net Assets Attributable to Holders of Redeemable Unitsfor the periods ended September 30 (in $000’s)
Net assets attributable to holders of redeemable units at the beginning of periodIncrease (decrease) in net assets attributable to holders of redeemable unitsDistributions to holders of redeemable units From net investment income From net realized gains Return of capitalTotal distributions to holders of redeemable units
Redeemable unit transactions Proceeds from redeemable units issued Reinvestment of distributions to holders of redeemable units Redemption of redeemable unitsNet increase (decrease) from redeemable unit transactionsNet increase (decrease) in net assets attributable to holders of redeemable unitsNet assets attributable to holders of redeemable units at the end of period
The accompanying notes are an integral part of these financial statements.
Financial Statements (unaudited)
Series A 2021 2020 84 10 11 1
- - - - - - - -
56 1 - - - (9) 56 (8) 67 (7) 151 3
Series F 2021 2020 2,218 1,305 266 245
- - - - - - - -
285 - - - (7) (11) 278 (11) 544 234 2,762 1,539
Series I 2021 2020 7,702 10 971 1
- - - - - - - -
369 - - - (207) (10) 162 (10) 1,133 (9) 8,835 1
Total Fund 2021 2020 10,004 1,325 1,248 247
- - - - - - - -
710 1 - - (214) (30) 496 (29) 1,744 218 11,748 1,543

– 106 –
CI International Equity Growth Private Pool
Semi-Annual Financial Statements - September 30, 2021
Statements of Cash Flowsfor the periods ended September 30 (in $000’s)
2021 2020
1,248 247
79 (14) - - 17 4
(1,054) (238) 4,111 652 (4,822) (643) - - - - - - 3 1 - - - - - - - - - - (418) 9
- - 710 1 (214) (30) 496 (29)
- - 78 (20) 537 120 615 100
146 14 - - - - - - - -
*Dividends and interest received as well as dividends and interest paid relate to operating activities of the Fund. The accompanying notes are an integral part of these financial statements.
Financial Statements (unaudited)
Cash flows from (used in) operating activitiesIncrease (decrease) in net assets attributable to holders of redeemable unitsAdjustments for: Net realized (gain) loss on sale of investments and derivatives Unrealized foreign exchange (gain) loss on cash Commissions and other portfolio transaction costs Change in unrealized (appreciation) depreciation in value of
investments and derivatives Proceeds from sale and maturity of investments and derivatives Purchase of investments and derivatives (Increase) decrease in cash collateral on deposit for short sale Non-cash distributions from investments Change in daily variation margin (Increase) decrease in dividends receivable (Increase) decrease in interest receivable (Increase) decrease in securities lending revenue receivable Increase (decrease) in management fees payable Increase (decrease) in administration fees payable Change in other accounts receivable and payableNet cash from (used in) operating activities
Cash flows from (used in) financing activitiesDistributions paid to holders of redeemable units, net of reinvested distributionsProceeds from issuance of redeemable unitsAmounts paid on redemption of redeemable unitsNet cash from (used in) financing activities Unrealized foreign exchange gain (loss) on cashNet increase (decrease) in cashCash (bank overdraft), beginning of periodCash (bank overdraft), end of period
Supplementary Information:Dividends received, net of withholding tax*Interest received, net of withholding tax*Dividends paid*Interest paid*Tax recoverable (paid)

– 107 –
CI International Equity Growth Private Pool
Semi-Annual Financial Statements - September 30, 2021
Percentages shown relate investments at fair value to net assets attributable to holders of redeemable units of the Fund.
Schedule of Investment Portfolio as at September 30, 2021 (unaudited)
Number ofUnits/Sharesor Par Value Description
Average Cost($)
Fair Value($)
% of Net Assets
FRANCE 390 Antin Infrastructure Partners S.A. 13,913 16,651 5,745 BNP Paribas S.A. 450,842 467,294 930 Cap Gemini S.A. 221,270 245,807 2,405 Dassault Systèmes S.E. 124,071 160,424 155 Hermès International S.A. 205,638 272,095 733 L’Oréal S.A. 371,346 383,766 339 LVMH Moet Hennessy Louis Vuitton S.A. 278,555 308,417 1,174 Schneider Electric S.A. 222,957 247,860 7,388 Societe Generale S.A. 246,112 294,776 3,451 Total S.A. 208,225 209,286 4,530 Vivendi S.A. 196,773 72,477 2,539,702 2,678,853 22.78 NETHERLANDS 862 Airbus Group N.V. 131,080 145,566 437 ASML Holding N.V. 283,097 414,117 1,922 Euronext N.V. 216,728 275,502 7,991 Stellantis N.V. 175,988 193,705 5,635 STMicroelectronics N.V. 253,344 312,220 4,919 Universal Music Group N.V. 186,623 166,820 1,246,860 1,507,930 12.84 GERMANY 3,843 Deutsche Telekom AG 104,319 98,084 1,432 Evotec AG 64,960 86,581 2,832 Hugo Boss AG 142,873 216,392 2,226 Infineon Technologies AG 113,479 116,021 884 Jenoptik AG 36,841 38,001 191 Sartorius AG 107,834 154,069 829 Siemens AG, Registered Shares 181,677 172,614 4,954 Vantage Towers AG 194,117 213,107 946,100 1,094,869 9.32 U.K. 4,672 Ashtead Group PLC 315,880 450,169 3,874 Compass Group PLC 105,486 100,757 2,490 Croda International PLC 281,208 363,072 2,615 Softcat PLC 75,910 90,416 778,484 1,004,414 8.55 DENMARK 1,155 DSV AS 264,326 351,031 1,152 GN Store Nord AS 111,622 101,161 3,842 Novo Nordisk AS 370,653 471,010 746,601 923,202 7.86 SWEDEN 5,973 Assa Abloy AB 222,245 220,970 4,747 Atlas Copco AB, Class A 335,155 365,515 13,430 Svenska Handelsbanken AB, Shares A 191,574 191,042 2,149 Thule Group AB 111,892 137,302 860,866 914,829 7.79 JAPAN 400 Keyence Corp. 248,678 304,997 300 Lasertec Corp. 74,635 87,368 1,600 Mitsubishi Electric Corp. 27,704 28,351 29 Nippon Prologis REIT Inc. 132,230 122,938 300 Shimano Inc. 105,359 112,326 3,515 Unicharm Corp. 201,795 197,972 790,401 853,952 7.27

– 108 –
CI International Equity Growth Private Pool
Semi-Annual Financial Statements - September 30, 2021
Percentages shown relate investments at fair value to net assets attributable to holders of redeemable units of the Fund.
Schedule of Investment Portfolio as at September 30, 2021 (unaudited) (cont’d)
JERSEY ISLAND 1,329 Ferguson PLC 205,448 234,405 57,720 Glencore PLC 289,014 346,590 494,462 580,995 4.95 SPAIN 108,752 Criteria Caixacorp S.A. 406,828 428,249 1,224 Inditex S.A. 57,988 57,142 464,816 485,391 4.13 IRELAND 1,060 Linde PLC (EUR) 338,526 398,283 3.39 SWITZERLAND 189 Partners Group Holding AG 268,726 376,695 3.21 LUXEMBOURG 939 Eurofins Scientific S.E. 113,564 152,700 21,012 Samsonite International S.A. 52,596 57,435 166,160 210,135 1.79 HONG KONG 3,515 Techtronic Industries Co. 70,516 88,702 0.76 NORWAY 4,736 Sbanken ASA 57,643 69,169 0.59Commissions and other portfolio transaction costs (12,338)Total Investment Portfolio 9,757,525 11,187,419 95.23Other Net Assets (Liabilities) 560,189 4.77Net Assets Attributable to Holders of Redeemable Units 11,747,608 100.00
Number ofUnits/Sharesor Par Value Description
Average Cost($)
Fair Value($)
% of Net Assets

– 109 –
CI International Equity Growth Private Pool
Semi-Annual Financial Statements - September 30, 2021
Redeemable Unit Transactions (Note 4)for the periods ended September 30
Number of redeemable units at the beginning of periodRedeemable units issued for cashRedeemable units issued for reinvested distributionsRedeemable units redeemedNumber of redeemable units at the end of period
Fund Specific Notes to Financial Statements (unaudited)
†A portion of brokerage commissions paid was used to cover research and market data services, termed soft dollar commissions. This amount has been estimated by the Manager of the Fund.The accompanying notes are an integral part of these financial statements.
Commissions (Note 2)for the periods ended September 30 (in $000’s)
2021 2020Brokerage commissions 15 2Soft dollar commissions† 6 1
Series A 2021 2020 6,898 1,010 4,185 83 - - - (861) 11,083 232
Series F 2021 2020 176,925 132,940 20,331 - - - (514) (968) 196,742 131,972
Series I 2021 2020 606,603 1,014 27,158 - - - (14,860) (915) 618,901 99

– 110 –
CI International Equity Growth Private Pool
Semi-Annual Financial Statements - September 30, 2021
The accompanying notes are an integral part of these financial statements.
Fund Specific Notes to Financial Statements (unaudited)
Securities Lending (Note 6)as at September 30 (in $000’s)
2021 2020Loaned 706 78Collateral (non-cash) 720 79
Securities Lending Revenue Reconciliation (Note 6)for the periods ended September 30 (in $000’s)
2021 2020Gross securities lending revenue 2 -Charges - -Securities lending revenue 2 -Charges as a % of gross securities lending revenue - -
Management and Administration Fees (Note 5) as at September 30, 2021 (%)
Annual management
fee rate:
Annual administration
fee rate:
Series A 1.700 0.15Series F 0.700 0.15Series I Paid directly by investor Paid directly by investor

– 111 –
CI International Equity Growth Private Pool
Semi-Annual Financial Statements - September 30, 2021
The accompanying notes are an integral part of these financial statements.
Currency Risk (cont’d)
as at March 31, 2021~
Currency
Financial Instruments Exposure Derivatives
Net Exposure
Net Assets
(%)(in $000’s) (in $000’s) (in $000’s)Euro 5,376 - 5,376 53.7 British Pound 1,402 - 1,402 14.0 Swedish Krona 1,072 - 1,072 10.7 Danish Krone 678 - 678 6.8 Swiss Franc 341 - 341 3.4 Japanese Yen 289 - 289 2.9 Hong Kong Dollar 196 - 196 2.0 Norwegian Krone 111 - 111 1.1 U.S. Dollar 5 - 5 - Total 9,470 - 9,470 94.6
~Includes monetary and non-monetary instruments, if any.
As at September 30, 2021, had the Canadian dollar strengthened or weakened by 10% (March 31, 2021 - 10%) in relation to all other foreign currencies held in the Fund, with all other variables held constant, net assets attributable to holders of redeemable units of the Fund would have decreased or increased, respectively, by approximately $1,132,000 (March 31, 2021 - $947,000). In practice, actual results may differ from this analysis and the difference may be material.
Interest Rate RiskAs at September 30, 2021 and March 31, 2021, the Fund did not have a significant exposure to interest rate risk as substantially all of its assets were invested in equities.
Fair Value Hierarchy
The tables below summarize the inputs used by the Fund in valuing the Fund’s investments and derivatives carried at fair value.
Long Positions at fair value as at September 30, 2021Level 1 Level 2 Level 3 Total
(in $000’s) (in $000’s) (in $000’s) (in $000’s)Equities 11,187 - - 11,187 Total 11,187 - - 11,187
Long Positions at fair value as at March 31, 2021Level 1 Level 2 Level 3 Total
(in $000’s) (in $000’s) (in $000’s) (in $000’s)Equities 9,459 - - 9,459 Total 9,459 - - 9,459
There were no transfers between Level 1, 2 and 3 during the period ended September 30, 2021 and the year ended March 31, 2021.
Financial Instruments Risks (Note 10)
Concentration RiskFor Concentration Risk as at September 30, 2021, refer to the Schedule of Investment Portfolio.
The table below summarizes the Fund’s exposure to concentration risk.
as at March 31, 2021Categories Net Assets (%)France 18.7 Germany 13.6 Netherlands 11.6 Sweden 10.7 U.K. 10.3 Denmark 6.8 Spain 5.5 Other Net Assets (Liabilities) 5.4 Jersey Island 3.8 Switzerland 3.4 Ireland 3.4 Japan 2.9 Norway 1.1 Luxembourg 1.0 Hong Kong 1.0 Cayman Islands 1.0 Total 100.0
Credit RiskAs at September 30, 2021 and March 31, 2021, the Fund did not have a significant exposure to credit risk as substantially all of its assets were invested in equities.
Other Price RiskAs at September 30, 2021 and March 31, 2021, the Fund was predominantly invested in foreign equities and therefore was sensitive to changes in general economic conditions across the world.
As at September 30, 2021, had the fair value of equities in the investment portfolio increased or decreased by 10% (March 31, 2021 - 10%), with all other variables held constant, net assets attributable to holders of redeemable units of the Fund would have increased or decreased, respectively, by approximately $1,119,000 (March 31, 2021 - $946,000). In practice, actual results may differ from this analysis and the difference may be material.
Currency RiskThe tables below summarize the Fund’s exposure to currency risk.
as at September 30, 2021~
Currency
Financial Instruments Exposure Derivatives
Net Exposure
Net Assets
(%)(in $000’s) (in $000’s) (in $000’s)Euro 6,295 - 6,295 53.6 British Pound 1,581 - 1,581 13.5 Japanese Yen 985 - 985 8.4 Swedish Krona 948 - 948 8.1 Danish Krone 923 - 923 7.9 Swiss Franc 377 - 377 3.2 Hong Kong Dollar 146 - 146 1.2 Norwegian Krone 69 - 69 0.6 Total 11,324 - 11,324 96.5
Fund Specific Notes to Financial Statements (unaudited)

– 112 –
CI International Equity Value Private Pool
Semi-Annual Financial Statements - September 30, 2021
Statements of Financial Position (in $000’s except for per unit amounts and units outstanding)
as at as at Sept. 30, 2021 Mar. 31, 2021 6,648 6,367 - - 471 283
- - - - - - - - - - 22 24 - - - - - - - 22 - - 7,141 6,696
- - - -
- - - - - - - - - - - 5 - - - - - - - - - - - 5
7,141 6,691
Statements of Financial Position (cont’d)(in $000’s except for per unit amounts and units outstanding)
Net assets attributable to holders of redeemable units
per Series (Note 4):
Net assets attributable to holders of redeemable
units per unit: Number of redeemable
units outstanding:
as at Sept. 30, 2021
as at Mar. 31, 2021
as at Sept. 30, 2021
as at Mar. 31, 2021
as at Sept. 30, 2021
as at Mar. 31, 2021
Series A 488 398 11.34 11.08 43,045 35,924Series F 614 455 11.45 11.13 53,697 40,871Series I 6,039 5,838 11.47 11.09 526,243 526,243
AssetsCurrent assetsInvestmentsInvestments pledged as collateralCashUnrealized gain on futures and foreign currency forward contractsSwaps, swaptions and optionsDaily variation margin on derivative instrumentsFees rebate receivableCash collateral on deposit for short saleDividends receivableInterest receivableReceivable for distribution from investmentsSecurities lending revenue receivable (Note 6)Receivable for investments soldReceivable for unit subscriptions
LiabilitiesCurrent liabilitiesInvestments sold shortBank overdraftUnrealized loss on futures and foreign currency forward contractsSwaps, swaptions and options Dividends payable on investments sold shortInterest payable on investments sold shortDaily variation margin on derivative instrumentsPayable for investments purchasedPayable for unit redemptionsDistributions payable to holders of redeemable units Management fees payableAdministration fees payableAccounts payable and accrued liabilities
Net assets attributable to holders of redeemable units
The accompanying notes are an integral part of these financial statements.
Financial Statements (unaudited)
CIG - 2065

– 113 –
CI International Equity Value Private Pool
Semi-Annual Financial Statements - September 30, 2021
Statements of Comprehensive Incomefor the periods ended September 30(in $000’s except for per unit amounts and number of units)
2021 2020
114 116 - - - - - - - -
- - - -
215 (200)
(76) 798 253 714 (1) (2) - - 1 1 - - - (1) 253 713
5 10 - 1 4 5 1 1 - - - - - - - - 20 18 1 2 - - 31 37
222 676
The accompanying notes are an integral part of these financial statements.
Financial Statements (unaudited)
Statements of Comprehensive Income (cont’d)for the periods ended September 30(in $000’s except for per unit amounts and number of units)
Increase (decrease) in net assets attributable to
holders of redeemable units per Series:
Increase (decrease) in net assets attributable to
holders of redeemable units per unit:
Weighted average number of units:
2021 2020 2021 2020 2021 2020Series A 8 28 0.19 0.91 37,724 31,281Series F 13 203 0.26 0.87 47,942 232,911Series I 201 445 0.38 0.89 526,244 503,173
Income Net gain (loss) on investments and derivatives Dividends Interest for distribution purposes Income distributions from investments Capital gain distributions from investments Derivative income (loss) Dividends expense on financial assets (liabilities) sold
short Interest expense on financial assets (liabilities) sold short Net realized gain (loss) on sale of investments and
derivatives Change in unrealized appreciation (depreciation) in value
of investments and derivativesTotal net gain (loss) on investments and derivativesOther income Foreign exchange gain (loss) on cash Commitment fee income Securities lending revenue (Note 6) Fees rebateTotal other incomeTotal incomeExpensesManagement fees (Note 5)Administration fees (Note 5)Commissions and other portfolio transaction costsIndependent review committee feesSecurities borrowing fees (Note 2)Margin feesService feesInterest expenseWithholding taxesHarmonized sales taxOther expensesTotal expensesIncrease (decrease) in net assets attributable to holders of redeemable units

– 114 –
CI International Equity Value Private Pool
Semi-Annual Financial Statements - September 30, 2021
Statements of Changes in Net Assets Attributable to Holders of Redeemable Unitsfor the periods ended September 30 (in $000’s)
Net assets attributable to holders of redeemable units at the beginning of periodIncrease (decrease) in net assets attributable to holders of redeemable unitsDistributions to holders of redeemable units From net investment income From net realized gains Return of capitalTotal distributions to holders of redeemable units
Redeemable unit transactions Proceeds from redeemable units issued Reinvestment of distributions to holders of redeemable units Redemption of redeemable unitsNet increase (decrease) from redeemable unit transactionsNet increase (decrease) in net assets attributable to holders of redeemable unitsNet assets attributable to holders of redeemable units at the end of period
The accompanying notes are an integral part of these financial statements.
Financial Statements (unaudited)
Series A 2021 2020 398 334 8 28
- - - - - - - -
82 - - - - (66) 82 (66) 90 (38) 488 296
Series F 2021 2020 455 2,056 13 203
- - - - - - - -
152 131 - - (6) (10) 146 121 159 324 614 2,380
Series I 2021 2020 5,838 10 201 445
- - - - - - - -
- 4,736 - - - (10) - 4,726 201 5,171 6,039 5,181
Total Fund 2021 2020 6,691 2,400 222 676
- - - - - - - -
234 4,867 - - (6) (86) 228 4,781 450 5,457 7,141 7,857

– 115 –
CI International Equity Value Private Pool
Semi-Annual Financial Statements - September 30, 2021
Statements of Cash Flowsfor the periods ended September 30 (in $000’s)
2021 2020
222 676
(215) 200 - - 4 5
76 (798) 840 3,113 (969) (7,581) - - - - - - 2 (25) - - - - - - - - - - (40) (4,410)
- - 234 4,867 (6) (86) 228 4,781
- - 188 371 283 - 471 371
96 58 - - - - - - - -
*Dividends and interest received as well as dividends and interest paid relate to operating activities of the Fund. The accompanying notes are an integral part of these financial statements.
Financial Statements (unaudited)
Cash flows from (used in) operating activitiesIncrease (decrease) in net assets attributable to holders of redeemable unitsAdjustments for: Net realized (gain) loss on sale of investments and derivatives Unrealized foreign exchange (gain) loss on cash Commissions and other portfolio transaction costs Change in unrealized (appreciation) depreciation in value of
investments and derivatives Proceeds from sale and maturity of investments and derivatives Purchase of investments and derivatives (Increase) decrease in cash collateral on deposit for short sale Non-cash distributions from investments Change in daily variation margin (Increase) decrease in dividends receivable (Increase) decrease in interest receivable (Increase) decrease in securities lending revenue receivable Increase (decrease) in management fees payable Increase (decrease) in administration fees payable Change in other accounts receivable and payableNet cash from (used in) operating activities
Cash flows from (used in) financing activitiesDistributions paid to holders of redeemable units, net of reinvested distributionsProceeds from issuance of redeemable unitsAmounts paid on redemption of redeemable unitsNet cash from (used in) financing activities Unrealized foreign exchange gain (loss) on cashNet increase (decrease) in cashCash (bank overdraft), beginning of periodCash (bank overdraft), end of period
Supplementary Information:Dividends received, net of withholding tax*Interest received, net of withholding tax*Dividends paid*Interest paid*Tax recoverable (paid)

– 116 –
CI International Equity Value Private Pool
Semi-Annual Financial Statements - September 30, 2021
Percentages shown relate investments at fair value to net assets attributable to holders of redeemable units of the Fund.
Schedule of Investment Portfolio as at September 30, 2021 (unaudited)
Number ofUnits/Sharesor Par Value Description
Average Cost($)
Fair Value($)
% of Net Assets
JAPAN 8,815 Astellas Pharma Inc. 185,202 184,838 1,302 Daito Trust Construction Co., Ltd. 167,842 193,219 3,047 Japan Exchange Group Inc. 83,377 96,227 1,970 Makita Corp. 91,454 137,880 129 Nintendo Co., Ltd. 74,745 79,732 3,262 Sumitomo Mitsui Trust Holdings Inc. 130,830 143,184 3,035 Tokio Marine Holdings Inc. 194,368 207,964 927,818 1,043,044 14.58 SWITZERLAND 1,215 Chubb Ltd. 192,153 266,970 1,235 Julius Baer Group Ltd. 62,876 104,602 1,451 Nestlé S.A., Registered Shares 214,517 222,248 1,382 Novartis AG, Registered Shares 163,602 144,306 154 Roche Holding AG 70,307 71,570 375 Zurich Financial Services AG 172,824 195,504 876,279 1,005,200 14.08 U.K. 1,633 Antofagasta PLC 21,749 37,957 1,646 BP PLC, ADR 57,121 56,978 30,483 BT Group PLC 64,706 83,132 3,862 Diageo PLC 175,734 237,668 7,716 GlaxoSmithKline PLC 199,462 184,828 4,574 Liberty Global PLC, Series A 121,665 172,643 105,475 Lloyds Banking Group PLC 57,421 83,828 6,111 Vodafone Group PLC, ADR 120,742 119,585 818,600 976,619 13.68 FRANCE 1,434 Accor S.A. 60,247 65,116 5,619 AXA S.A. 132,653 198,556 3,809 Bureau Veritas S.A. 111,393 149,266 1,221 Danone S.A. 108,820 105,782 1,280 Sanofi S.A. 164,085 156,021 2,861 Total S.A. 152,869 173,505 730,067 848,246 11.88 GERMANY 144 Adidas AG 45,687 57,423 282 Continental AG 26,848 39,218 1,408 Fresenius Medical Care AG & Co., KGaA 138,133 125,722 996 Henkel AG & Co., KGaA, Preferred, Non-Voting Shares 131,803 117,166 838 SAP AG 133,450 143,701 662 Siemens AG, Registered Shares 85,348 137,841 673 Siemens Energy AG 22,885 22,937 56 Vitesco Technologies Group AG 3,148 4,190 587,302 648,198 9.08 NETHERLANDS 897 Akzo Nobel N.V. 103,084 124,208 1,386 Euronext N.V. 175,217 198,671 1,468 Heineken N.V. 168,286 194,272 446,587 517,151 7.24 IRELAND 374 Aon PLC 93,341 135,371 96 Linde PLC (EUR) 24,679 36,071 691 Medtronic PLC 91,335 109,708 551 Willis Towers Watson PLC 147,787 162,232 357,142 443,382 6.21

– 117 –
CI International Equity Value Private Pool
Semi-Annual Financial Statements - September 30, 2021
Percentages shown relate investments at fair value to net assets attributable to holders of redeemable units of the Fund.
Schedule of Investment Portfolio as at September 30, 2021 (unaudited) (cont’d)
CAYMAN ISLANDS 410 Alibaba Group Holding Ltd., ADR 108,822 76,883 402 Baidu Inc., ADR 79,069 78,285 10,863 Sands China Ltd. 57,971 28,279 2,176 Trip.com Group Ltd., ADR 78,713 84,750 324,575 268,197 3.76 SOUTH KOREA 2,572 KB Financial Group Inc. 113,521 152,153 23 Samsung Electronics Co., Ltd., GDR 33,407 45,518 146,928 197,671 2.77 BERMUDA 231 Credicorp Ltd. 29,450 32,459 415 Everest Re Group Ltd. 133,735 131,819 163,185 164,278 2.30 ISRAEL 1,097 Check Point Software Technologies Ltd. 162,236 157,064 2.20 SINGAPORE 13,420 Singapore Exchange Ltd. 126,054 124,935 1.75 CANADA 666 Agnico-Eagle Mines Ltd. (USD) 63,584 43,738 11,536 Kinross Gold Corp. 83,641 78,329 147,225 122,067 1.71 SWEDEN 4,024 Telefonaktiebolaget LM Ericsson, Class B 44,686 57,696 0.81 U.S.A. 19 Booking Holdings Inc. 36,593 57,128 0.80 MEXICO 2,074 Grupo Financiero Banorte S.A.B. de C.V. 8,583 16,871 0.24Commissions and other portfolio transaction costs (3,097)Total Investment Portfolio 5,900,763 6,647,747 93.09Other Net Assets (Liabilities) 493,687 6.91Net Assets Attributable to Holders of Redeemable Units 7,141,434 100.00
Number ofUnits/Sharesor Par Value Description
Average Cost($)
Fair Value($)
% of Net Assets

– 118 –
CI International Equity Value Private Pool
Semi-Annual Financial Statements - September 30, 2021
Redeemable Unit Transactions (Note 4)for the periods ended September 30
Number of redeemable units at the beginning of periodRedeemable units issued for cashRedeemable units issued for reinvested distributionsRedeemable units redeemedNumber of redeemable units at the end of period
Fund Specific Notes to Financial Statements (unaudited)
†A portion of brokerage commissions paid was used to cover research and market data services, termed soft dollar commissions. This amount has been estimated by the Manager of the Fund.The accompanying notes are an integral part of these financial statements.
Commissions (Note 2)for the periods ended September 30 (in $000’s)
2021 2020Brokerage commissions 2 4Soft dollar commissions† - 1
Series A 2021 2020 35,924 36,803 7,158 - - - (37) (7,066) 43,045 29,737
Series F 2021 2020 40,871 227,854 13,339 13,068 - - (513) (1,066) 53,697 239,856
Series I 2021 2020 526,243 1,069 - 522,843 - - - (960) 526,243 522,952

– 119 –
CI International Equity Value Private Pool
Semi-Annual Financial Statements - September 30, 2021
The accompanying notes are an integral part of these financial statements.
Fund Specific Notes to Financial Statements (unaudited)
Securities Lending (Note 6)as at September 30 (in $000’s)
2021 2020Loaned 1,278 1,245Collateral (non-cash) 1,303 1,269
Securities Lending Revenue Reconciliation (Note 6)for the periods ended September 30 (in $000’s)
2021 2020Gross securities lending revenue 1 1Charges - -Securities lending revenue 1 1Charges as a % of gross securities lending revenue - -
Management and Administration Fees (Note 5) as at September 30, 2021 (%)
Annual management
fee rate:
Annual administration
fee rate:
Series A 1.700 0.15Series F 0.700 0.15Series I Paid directly by investor Paid directly by investor

– 120 –
CI International Equity Value Private Pool
Semi-Annual Financial Statements - September 30, 2021
The accompanying notes are an integral part of these financial statements.
Currency RiskThe tables below summarize the Fund’s exposure to currency risk.
as at September 30, 2021~
Currency
Financial Instruments Exposure Derivatives
Net Exposure
Net Assets
(%)(in $000’s) (in $000’s) (in $000’s)Euro 2,052 - 2,052 28.7 U.S. Dollar 1,779 - 1,779 24.9 Japanese Yen 1,055 - 1,055 14.8 Swiss Franc 738 - 738 10.3 British Pound 632 - 632 8.9 Korean Won 152 - 152 2.1 Singapore Dollar 125 - 125 1.8 Swedish Krona 58 - 58 0.8 Hong Kong Dollar 28 - 28 0.4 Mexican Peso 17 - 17 0.2 Total 6,636 - 6,636 92.9
as at March 31, 2021~
Currency
Financial Instruments Exposure Derivatives
Net Exposure
Net Assets
(%)(in $000’s) (in $000’s) (in $000’s)Euro 2,001 - 2,001 29.9 U.S. Dollar 1,547 - 1,547 23.1 Japanese Yen 1,011 - 1,011 15.1 British Pound 750 - 750 11.2 Swiss Franc 695 - 695 10.4 Swedish Krona 134 - 134 2.0 Korean Won 114 - 114 1.7 Singapore Dollar 65 - 65 1.0 Mexican Peso 38 - 38 0.6 Hong Kong Dollar 36 - 36 0.5 Total 6,391 - 6,391 95.5
~Includes monetary and non-monetary instruments, if any.
As at September 30, 2021, had the Canadian dollar strengthened or weakened by 10% (March 31, 2021 - 10%) in relation to all other foreign currencies held in the Fund, with all other variables held constant, net assets attributable to holders of redeemable units of the Fund would have decreased or increased, respectively, by approximately $664,000 (March 31, 2021 - $639,000). In practice, actual results may differ from this analysis and the difference may be material.
Interest Rate RiskAs at September 30, 2021 and March 31, 2021, the Fund did not have a significant exposure to interest rate risk as substantially all of its assets were invested in equities.
Financial Instruments Risks (Note 10)
Concentration RiskFor Concentration Risk as at September 30, 2021, refer to the Schedule of Investment Portfolio.
The table below summarizes the Fund’s exposure to concentration risk.
as at March 31, 2021 Categories Net Assets (%)U.K. 15.6 Japan 14.9 Switzerland 14.0 France 12.3 Germany 8.7 Netherlands 7.1 Ireland 5.7 Other Net Assets (Liabilities) 4.8 U.S.A. 3.2 Cayman Islands 3.0 South Korea 2.5 Israel 2.3 Sweden 2.0 Canada 1.7 Singapore 1.0 Luxembourg 0.6 Mexico 0.6 Total 100.0
Credit RiskAs at September 30, 2021 and March 31, 2021, the Fund did not have a significant exposure to credit risk as substantially all of its assets were invested in equities.
The Fund was invested in fixed income securities, preferred securities and derivative instruments, if any, with the following credit ratings, as per the table below.
as at September 30, 2021Credit Rating^* Net Assets (%)Not Rated 1.6Total 1.6
^Credit ratings are obtained from S&P Global Ratings, where available, otherwise ratings are obtained from: Moody’s
Investors Service or Dominion Bond Rating Service, respectively.
*Refer to Note 10 for Credit Rating Chart reference.
Other Price RiskAs at September 30, 2021 and March 31, 2021, the Fund was predominantly invested in foreign equities and therefore was sensitive to changes in general economic conditions across the world.
As at September 30, 2021, had the fair value of equities in the investment portfolio increased or decreased by 10% (March 31, 2021 - 10%), with all other variables held constant, net assets attributable to holders of redeemable units of the Fund would have increased or decreased, respectively, by approximately $665,000 (March 31, 2021 - $637,000). In practice, actual results may differ from this analysis and the difference may be material.
Fund Specific Notes to Financial Statements (unaudited)

– 121 –
CI International Equity Value Private Pool
Semi-Annual Financial Statements - September 30, 2021
Fair Value Hierarchy
The tables below summarize the inputs used by the Fund in valuing the Fund’s investments and derivatives carried at fair value.
Long Positions at fair value as at September 30, 2021Level 1 Level 2 Level 3 Total
(in $000’s) (in $000’s) (in $000’s) (in $000’s)Equities 6,648 - - 6,648 Total 6,648 - - 6,648
Fair Value Hierarchy (cont’d)
Long Positions at fair value as at March 31, 2021Level 1 Level 2 Level 3 Total
(in $000’s) (in $000’s) (in $000’s) (in $000’s)Equities 6,367 - - 6,367 Total 6,367 - - 6,367
There were no transfers between Level 1, 2 and 3 during the period ended September 30, 2021 and the year ended March 31, 2021.
Fund Specific Notes to Financial Statements (unaudited)
The accompanying notes are an integral part of these financial statements.

– 122 –
CI North American Small / Mid Cap Equity Private Pool
Semi-Annual Financial Statements - September 30, 2021
Statements of Financial Position (in $000’s except for per unit amounts and units outstanding)
as at as at Sept. 30, 2021 Mar. 31, 2021 10,788 9,527 - - 753 408
- - - - - - - - - - 9 10 - - - - - - 37 2 - 25 11,587 9,972
- - - -
- - - - - - - - - - 63 3 - - - - - - - - - - 63 3
11,524 9,969
Statements of Financial Position (cont’d)(in $000’s except for per unit amounts and units outstanding)
Net assets attributable to holders of redeemable units
per Series (Note 4):
Net assets attributable to holders of redeemable
units per unit: Number of redeemable
units outstanding:
as at Sept. 30, 2021
as at Mar. 31, 2021
as at Sept. 30, 2021
as at Mar. 31, 2021
as at Sept. 30, 2021
as at Mar. 31, 2021
Series A 61 5 15.99 14.08 3,864 360Series F 295 235 16.46 14.41 17,893 16,321Series I 11,168 9,729 16.74 14.58 667,267 667,267
AssetsCurrent assetsInvestmentsInvestments pledged as collateralCashUnrealized gain on futures and foreign currency forward contractsSwaps, swaptions and optionsDaily variation margin on derivative instrumentsFees rebate receivableCash collateral on deposit for short saleDividends receivableInterest receivableReceivable for distribution from investmentsSecurities lending revenue receivable (Note 6)Receivable for investments soldReceivable for unit subscriptions
LiabilitiesCurrent liabilitiesInvestments sold shortBank overdraftUnrealized loss on futures and foreign currency forward contractsSwaps, swaptions and options Dividends payable on investments sold shortInterest payable on investments sold shortDaily variation margin on derivative instrumentsPayable for investments purchasedPayable for unit redemptionsDistributions payable to holders of redeemable units Management fees payableAdministration fees payableAccounts payable and accrued liabilities
Net assets attributable to holders of redeemable units
The accompanying notes are an integral part of these financial statements.
Financial Statements (unaudited)
CIG - 2066

– 123 –
CI North American Small / Mid Cap Equity Private Pool
Semi-Annual Financial Statements - September 30, 2021
Statements of Comprehensive Incomefor the periods ended September 30(in $000’s except for per unit amounts and number of units)
2021 2020
41 28 10 3 - - - - - -
- - - -
509 1
928 2,674 1,488 2,706 1 (6) - - 2 3 - - 3 (3) 1,491 2,703
2 - - - 7 7 - - - - - - - - - - 1 2 - - - - 10 9
1,481 2,694
The accompanying notes are an integral part of these financial statements.
Financial Statements (unaudited)
Statements of Comprehensive Income (cont’d)for the periods ended September 30(in $000’s except for per unit amounts and number of units)
Increase (decrease) in net assets attributable to
holders of redeemable units per Series:
Increase (decrease) in net assets attributable to
holders of redeemable units per unit:
Weighted average number of units:
2021 2020 2021 2020 2021 2020Series A 5 2 1.42 6.52 3,485 298Series F 37 24 1.96 4.04 18,937 6,010Series I 1,439 2,668 2.16 4.03 667,266 661,675
Income Net gain (loss) on investments and derivatives Dividends Interest for distribution purposes Income distributions from investments Capital gain distributions from investments Derivative income (loss) Dividends expense on financial assets (liabilities) sold
short Interest expense on financial assets (liabilities) sold short Net realized gain (loss) on sale of investments and
derivatives Change in unrealized appreciation (depreciation) in value
of investments and derivativesTotal net gain (loss) on investments and derivativesOther income Foreign exchange gain (loss) on cash Commitment fee income Securities lending revenue (Note 6) Fees rebateTotal other incomeTotal incomeExpensesManagement fees (Note 5)Administration fees (Note 5)Commissions and other portfolio transaction costsIndependent review committee feesSecurities borrowing fees (Note 2)Margin feesService feesInterest expenseWithholding taxesHarmonized sales taxOther expensesTotal expensesIncrease (decrease) in net assets attributable to holders of redeemable units

– 124 –
CI North American Small / Mid Cap Equity Private Pool
Semi-Annual Financial Statements - September 30, 2021
Statements of Changes in Net Assets Attributable to Holders of Redeemable Unitsfor the periods ended September 30 (in $000’s)
Net assets attributable to holders of redeemable units at the beginning of periodIncrease (decrease) in net assets attributable to holders of redeemable unitsDistributions to holders of redeemable units From net investment income From net realized gains Return of capitalTotal distributions to holders of redeemable units
Redeemable unit transactions Proceeds from redeemable units issued Reinvestment of distributions to holders of redeemable units Redemption of redeemable unitsNet increase (decrease) from redeemable unit transactionsNet increase (decrease) in net assets attributable to holders of redeemable unitsNet assets attributable to holders of redeemable units at the end of period
The accompanying notes are an integral part of these financial statements.
Financial Statements (unaudited)
Series A 2021 2020 5 8 5 2
- - - - - - - -
51 - - - - (9) 51 (9) 56 (7) 61 1
Series F 2021 2020 235 55 37 24
- - - - - - - -
88 - - - (65) (9) 23 (9) 60 15 295 70
Series I 2021 2020 9,729 5,594 1,439 2,668
- - - - - - - -
- - - - - (9) - (9) 1,439 2,659 11,168 8,253
Total Fund 2021 2020 9,969 5,657 1,481 2,694
- - - - - - - -
139 - - - (65) (27) 74 (27) 1,555 2,667 11,524 8,324

– 125 –
CI North American Small / Mid Cap Equity Private Pool
Semi-Annual Financial Statements - September 30, 2021
Statements of Cash Flowsfor the periods ended September 30 (in $000’s)
2021 2020
1,481 2,694
(509) (1) (1) (1) 7 7
(928) (2,674) 2,839 2,450 (2,645) (2,361) - - - - - - 1 (1) - - - - - - - - - - 245 113
- - 164 - (65) (27) 99 (27)
1 1 344 86 408 361 753 448
41 26 10 3 - - - - - -
*Dividends and interest received as well as dividends and interest paid relate to operating activities of the Fund. The accompanying notes are an integral part of these financial statements.
Financial Statements (unaudited)
Cash flows from (used in) operating activitiesIncrease (decrease) in net assets attributable to holders of redeemable unitsAdjustments for: Net realized (gain) loss on sale of investments and derivatives Unrealized foreign exchange (gain) loss on cash Commissions and other portfolio transaction costs Change in unrealized (appreciation) depreciation in value of
investments and derivatives Proceeds from sale and maturity of investments and derivatives Purchase of investments and derivatives (Increase) decrease in cash collateral on deposit for short sale Non-cash distributions from investments Change in daily variation margin (Increase) decrease in dividends receivable (Increase) decrease in interest receivable (Increase) decrease in securities lending revenue receivable Increase (decrease) in management fees payable Increase (decrease) in administration fees payable Change in other accounts receivable and payableNet cash from (used in) operating activities
Cash flows from (used in) financing activitiesDistributions paid to holders of redeemable units, net of reinvested distributionsProceeds from issuance of redeemable unitsAmounts paid on redemption of redeemable unitsNet cash from (used in) financing activities Unrealized foreign exchange gain (loss) on cashNet increase (decrease) in cashCash (bank overdraft), beginning of periodCash (bank overdraft), end of period
Supplementary Information:Dividends received, net of withholding tax*Interest received, net of withholding tax*Dividends paid*Interest paid*Tax recoverable (paid)

– 126 –
CI North American Small / Mid Cap Equity Private Pool
Semi-Annual Financial Statements - September 30, 2021
Percentages shown relate investments at fair value to net assets attributable to holders of redeemable units of the Fund.
Schedule of Investment Portfolio as at September 30, 2021 (unaudited)
Number ofUnits/Sharesor Par Value Description
Average Cost($)
Fair Value($)
% of Net Assets
FINANCIALS 425 Athene Holding Ltd. 19,621 37,073 2,600 Brookfield Asset Management Reinsurance Partners Ltd. 171,157 182,520 9,500 Canadian Western Bank 321,759 348,365 21,700 Element Fleet Management Corp. 232,454 277,326 700 Equitable Holdings Inc. 21,387 26,279 140 Evercore Partners Inc. 20,360 23,703 470 First Republic Bank 59,826 114,821 320 Flywire Corp. 12,885 17,769 7,300 Home Capital Group Inc. 262,235 270,903 165 LPL Financial Holdings Inc. 19,556 32,761 240 Morgan Stanley Corp. 10,913 29,580 445 Tradeweb Markets Inc. 26,228 45,530 11,650 Trisura Group Ltd. 93,605 503,746 1,271,986 1,910,376 16.58 INDUSTRIALS 205 AGCO Corp. 28,246 31,815 520 AZEK Co Inc. 27,336 24,060 840 Boyd Group Services Inc. 172,505 197,358 1,775 Cargojet Inc. 215,529 359,278 950 CoStar Group Inc. 77,190 103,553 200 Generac Holdings Inc. 21,236 103,524 4,500 Hardwoods Distribution Inc. 63,690 165,105 220 HEICO Corp. 40,805 36,746 195 Kornit Digital Ltd. 16,327 35,749 455 Lyft Inc. 21,265 30,884 165 MasTec Inc. 11,768 18,031 9,100 Mullen Group Ltd. 106,936 117,208 85 RBC Bearings Inc. 22,984 22,846 165 Regal-Beloit Corp. 24,066 31,419 160 Robert Half International Inc. 13,233 20,332 105 Saia Inc. 29,238 31,656 230 Triton International Ltd. 12,717 15,160 75 United Rentals Inc. 15,060 33,336 1,900 Westshore Terminals Investment Corp. 46,210 46,455 955 WillScot Mobile Mini Holdings Corp. 19,863 38,368 986,204 1,462,883 12.69 REAL ESTATE 4,200 Boardwalk REIT 137,937 198,618 6,900 BSR Real Estate Investment Trust 89,929 137,822 2,300 Colliers International Group Inc. 227,474 372,899 660 First Industrial Realty Trust Inc. 39,356 43,536 3,200 Flagship Communities REIT 63,532 73,361 1,900 Granite Real Estate Investment Trust 126,443 171,152 7,600 InterRent Real Estate Investment Trust 91,474 127,148 250 Lamar Advertising Co. 33,642 35,924 200 SBA Communications Corp. 70,472 83,739 160 Sun Communities Inc. 31,458 37,511 10,200 Tricon Capital Group Inc. 123,216 172,380 1,034,933 1,454,090 12.62 ENERGY 12,500 Advantage Energy Ltd. 33,240 80,000 14,400 Enerflex Ltd. 124,589 133,632 23,100 Enerplus Corp. 144,895 234,234 29,800 Freehold Royalties Ltd. 202,771 309,920 23,000 MEG Energy Corp. 203,006 227,470

– 127 –
CI North American Small / Mid Cap Equity Private Pool
Semi-Annual Financial Statements - September 30, 2021
Percentages shown relate investments at fair value to net assets attributable to holders of redeemable units of the Fund.
Schedule of Investment Portfolio as at September 30, 2021 (unaudited) (cont’d)
ENERGY (cont’d) 9,200 North American Construction Group Ltd. 138,076 169,740 4,600 Parkland Corp. 187,986 163,714 1,034,563 1,318,710 11.44 MATERIALS 440 Alcoa Corp. 17,062 27,274 340 CF Industries Holdings Inc. 21,259 24,038 44,700 Champion Iron Ltd. 94,927 195,339 400 Crown Holdings Inc. 41,159 51,059 6,900 Endeavour Mining PLC 198,623 196,719 6,500 ERO Copper Corp. 127,133 145,990 12,100 Hudbay Minerals Inc. 91,707 95,590 4,800 Intertape Polymer Group Inc. 119,713 132,240 23,500 K92 Mining Inc. 119,982 143,115 8,100 Karora Resources Inc. 32,659 26,811 9,600 Major Drilling Group International Inc. 51,971 81,120 4,900 SilverCrest Metals Inc. 40,577 43,365 956,772 1,162,660 10.09 CONSUMER DISCRETIONARY 455 American Eagle Outfitters Inc. 21,497 14,869 315 ARAMARK Holdings Corp. 14,227 13,110 5,800 AutoCanada Inc. 94,596 269,062 600 Bloomin’ Brands Inc. 19,968 18,999 1,000 BRP Inc. 53,225 117,240 90 Burlington Stores Inc. 24,291 32,325 200 Capri Holdings Ltd. 7,737 12,263 200 Darden Restaurants Inc. 21,791 38,370 80 Deckers Outdoor Corp. 16,273 36,498 185 Five Below Inc. 32,084 41,430 550 Hilton Grand Vacations Inc. 16,466 33,138 650 International Game Technology PLC 15,269 21,669 195 LKQ Corp. 8,635 12,428 9,800 Park Lawn Corp. 276,099 357,896 1,300 Pet Valu Holdings Ltd. 28,844 38,025 370 Skechers U.S.A. Inc., Class A 22,914 19,739 2,500 Uni-Select Inc. 39,321 44,350 713,237 1,121,411 9.73 INFORMATION TECHNOLOGY 380 2U Inc. 19,455 16,157 190 Avalara Inc. 18,328 42,059 185 Bill.com Holdings Inc. 22,504 62,552 525 Cadence Design Systems Inc. 49,919 100,702 385 Calix Inc 22,570 24,104 180 Cognex Corp. 11,226 18,289 180 Cree Inc. 22,638 18,405 170 Crowdstrike Holdings Inc. 12,130 52,922 1,900 Docebo Inc. 83,234 175,731 1,500 Dye & Durham Ltd. 31,234 61,710 315 Dynatrace Inc. 14,605 28,315 130 Five9 Inc. 19,121 26,302 2,160 Infinera Corp. 23,122 22,762 1,200 Magnet Forensics Inc. 21,543 51,060 300 Mitek Systems, Inc. 7,191 7,030 430 NCR Corp. 23,946 21,110 80 RingCentral Inc. 19,037 22,039 475 Sprout Social Inc. 28,696 73,369
Number ofUnits/Sharesor Par Value Description
Average Cost($)
Fair Value($)
% of Net Assets

– 128 –
CI North American Small / Mid Cap Equity Private Pool
Semi-Annual Financial Statements - September 30, 2021
Percentages shown relate investments at fair value to net assets attributable to holders of redeemable units of the Fund.
Schedule of Investment Portfolio as at September 30, 2021 (unaudited) (cont’d)
Number ofUnits/Sharesor Par Value Description
Average Cost($)
Fair Value($)
% of Net Assets
INFORMATION TECHNOLOGY (cont’d) 535 TELUS International Canada Inc. 19,900 23,724 565 Tenable Holdings Inc. 34,307 33,019 504,706 881,361 7.65 HEALTH CARE 165 AMN Healthcare Services Inc. 23,867 23,981 200 Axonics Inc. 14,091 16,488 420 BioLife Solutions Inc. 17,864 22,513 75 Bio-Techne Corp. 20,111 46,031 495 Catalent Inc. 47,129 83,430 140 Charles River Laboratories International Inc. 30,314 73,176 600 Covetrus Inc. 18,129 13,786 280 DermTech Inc. 14,792 11,388 420 Envista Holdings Corp. 18,817 22,242 95 Insulet Corp. 18,890 34,200 140 Jazz Pharmaceuticals PLC 25,550 23,089 20,600 Kneat.com Inc. 57,074 91,670 120 Neurocrine Biosciences Inc. 14,369 14,577 1,070 Option Care Health Inc. 27,987 32,878 200 PLx Pharma Inc. 4,206 4,889 105 Repligen Corp. 16,574 38,433 170 Syneos Health Inc. 19,298 18,836 215 Tenet Healthcare Corp. 14,902 18,093 403,964 589,700 5.12 CONSUMER STAPLES 315 Bunge Ltd. 27,216 32,445 620 elf Beauty Inc. 17,150 22,813 700 Hostess Brands, Inc. 15,281 15,400 245 Lamb Weston Holdings Inc. 24,728 19,044 345 Molson Coors Brewing Co., Class B (USD) 22,643 20,267 515 Performance Food Group Co. 28,199 30,306 710 Simply Good Foods Co. 21,721 31,016 340 The Hain Celestial Group Inc. 15,091 18,423 17,700 Waterloo Brewing Ltd. 60,272 122,484 232,301 312,198 2.71 UTILITIES 5,400 Polaris Infrastructure Inc. 114,682 93,420 14,900 TransAlta Corp. 140,124 199,362 254,806 292,782 2.54 COMMUNICATION SERVICES 375 Match Group Inc. 55,744 74,566 9,100 MDF Commerce Inc. 103,682 53,417 315 Take-Two Interactive Software Inc. 54,926 61,470 214,352 189,453 1.64 EXCHANGE-TRADED FUND(S) 1,900 VanEck Vectors Junior Gold Miners ETF 100,936 92,266 0.80Commissions and other portfolio transaction costs (9,078)Total Investment Portfolio 7,699,682 10,787,890 93.61Other Net Assets (Liabilities) 736,006 6.39Net Assets Attributable to Holders of Redeemable Units 11,523,896 100.00

– 129 –
CI North American Small / Mid Cap Equity Private Pool
Semi-Annual Financial Statements - September 30, 2021
The accompanying notes are an integral part of these financial statements.
Fund Specific Notes to Financial Statements (unaudited)
Interest in Unconsolidated Structured Entities (Note 2)
The following tables present the Fund’s interest in Unconsolidated Structured Entities.
as at September 30, 2021 Fair Value of
the Underlying Fund(s) / ETF(s)Fair Value of the Fund’s Investment
in the Underlying Fund(s) / ETF(s)Ownership in the
Underlying Fund(s) / ETF(s)
Unconsolidated Structured Entities (in $000’s) (in $000’s) (%)VanEck Vectors Junior Gold Miners ETF 5,258,196 92 -
as at March 31, 2021 Fair Value of
the Underlying Fund(s) / ETF(s)Fair Value of the Fund’s Investment
in the Underlying Fund(s) / ETF(s)Ownership in the
Underlying Fund(s) / ETF(s)
Unconsolidated Structured Entities (in $000’s) (in $000’s) (%)VanEck Vectors Junior Gold Miners ETF 7,912,431 107 -

– 130 –
CI North American Small / Mid Cap Equity Private Pool
Semi-Annual Financial Statements - September 30, 2021
Redeemable Unit Transactions (Note 4)for the periods ended September 30
Number of redeemable units at the beginning of periodRedeemable units issued for cashRedeemable units issued for reinvested distributionsRedeemable units redeemedNumber of redeemable units at the end of period
Fund Specific Notes to Financial Statements (unaudited)
†A portion of brokerage commissions paid was used to cover research and market data services, termed soft dollar commissions. This amount has been estimated by the Manager of the Fund.The accompanying notes are an integral part of these financial statements.
Commissions (Note 2)for the periods ended September 30 (in $000’s)
2021 2020Brokerage commissions 7 6Soft dollar commissions† 1 1
Series A 2021 2020 360 984 3,519 - - - (15) (878) 3,864 106
Series F 2021 2020 16,321 6,583 5,724 - - - (4,152) (909) 17,893 5,674
Series I 2021 2020 667,267 662,368 - - - - - (899) 667,267 661,469

– 131 –
CI North American Small / Mid Cap Equity Private Pool
Semi-Annual Financial Statements - September 30, 2021
The accompanying notes are an integral part of these financial statements.
Fund Specific Notes to Financial Statements (unaudited)
Securities Lending (Note 6)as at September 30 (in $000’s)
2021 2020Loaned 1,092 994Collateral (non-cash) 1,114 1,013
Securities Lending Revenue Reconciliation (Note 6)for the periods ended September 30 (in $000’s)
2021 2020Gross securities lending revenue 2 4Charges - (1)Securities lending revenue 2 3Charges as a % of gross securities lending revenue - 25.0
Management and Administration Fees (Note 5) as at September 30, 2021 (%)
Annual management
fee rate:
Annual administration
fee rate:
Series A 1.700 0.15Series F 0.700 0.15Series I Paid directly by investor Paid directly by investor

– 132 –
CI North American Small / Mid Cap Equity Private Pool
Semi-Annual Financial Statements - September 30, 2021
The accompanying notes are an integral part of these financial statements.
Currency Risk (cont’d)
as at March 31, 2021~
Currency
Financial Instruments Exposure Derivatives
Net Exposure
Net Assets
(%)(in $000’s) (in $000’s) (in $000’s)U.S. Dollar 2,994 - 2,994 30.0 Total 2,994 - 2,994 30.0
~Includes monetary and non-monetary instruments, if any.
As at September 30, 2021, had the Canadian dollar strengthened or weakened by 10% (March 31, 2021 - 10%) in relation to all other foreign currencies held in the Fund, with all other variables held constant, net assets attributable to holders of redeemable units of the Fund would have decreased or increased, respectively, by approximately $335,000 (March 31, 2021 - $299,000). In practice, actual results may differ from this analysis and the difference may be material.
Interest Rate RiskAs at September 30, 2021 and March 31, 2021, the Fund did not have a significant exposure to interest rate risk as substantially all of its assets were invested in equities and Exchange-Traded Fund(s).
Fair Value Hierarchy
The tables below summarize the inputs used by the Fund in valuing the Fund’s investments and derivatives carried at fair value.
Long Positions at fair value as at September 30, 2021Level 1 Level 2 Level 3 Total
(in $000’s) (in $000’s) (in $000’s) (in $000’s)Equities 10,696 - - 10,696 Exchange-Traded Fund(s) 92 - - 92 Total 10,788 - - 10,788
Long Positions at fair value as at March 31, 2021Level 1 Level 2 Level 3 Total
(in $000’s) (in $000’s) (in $000’s) (in $000’s)Equities 9,420 - - 9,420 Exchange-Traded Fund(s) 107 - - 107 Total 9,527 - - 9,527
There were no transfers between Level 1, 2 and 3 during the period ended September 30, 2021 and the year ended March 31, 2021.
Financial Instruments Risks (Note 10)
Concentration RiskFor Concentration Risk as at September 30, 2021, refer to the Schedule of Investment Portfolio.
The table below summarizes the Fund’s exposure to concentration risk.
as at March 31, 2021Categories Net Assets (%)Materials 16.5 Industrials 14.4 Financials 13.6 Real Estate 10.0 Energy 9.5 Consumer Discretionary 9.5 Information Technology 8.8 Other Net Assets (Liabilities) 4.4 Health Care 4.1 Utilities 3.1 Consumer Staples 2.8 Communication Services 2.4 Exchange-Traded Fund(s) 1.1 Total 100.0
Credit RiskAs at September 30, 2021 and March 31, 2021, the Fund did not have a significant exposure to credit risk as substantially all of its assets were invested in equities and Exchange-Traded Fund(s).
Other Price RiskAs at September 30, 2021 and March 31, 2021, the Fund was predominantly invested in U.S. equities and therefore was sensitive to changes in general economic conditions in the United States.
As at September 30, 2021, had the fair value of equities in the investment portfolio increased or decreased by 10% (March 31, 2021 - 10%), with all other variables held constant, net assets attributable to holders of redeemable units of the Fund would have increased or decreased, respectively, by approximately $1,079,000 (March 31, 2021 - $953,000). In practice, actual results may differ from this analysis and the difference may be material.
Currency RiskThe tables below summarize the Fund’s exposure to currency risk.
as at September 30, 2021~
Currency
Financial Instruments Exposure Derivatives
Net Exposure
Net Assets
(%)(in $000’s) (in $000’s) (in $000’s)U.S. Dollar 3,350 - 3,350 29.1 Total 3,350 - 3,350 29.1
Fund Specific Notes to Financial Statements (unaudited)

– 133 –
CI U.S. Equity Private Pool
Semi-Annual Financial Statements - September 30, 2021
Statements of Financial Position (in $000’s except for per unit amounts and units outstanding)
as at as at Sept. 30, 2021 Mar. 31, 2021 28,947 22,692 - - 12 15
- - - - - - - - - - - - - - - - - - 17 2 26 31 29,002 22,740
- - - -
- - - - - - - - - - 27 16 27 16 - - - - - - - - 54 32
28,948 22,708
Statements of Financial Position (cont’d)(in $000’s except for per unit amounts and units outstanding)
Net assets attributable to holders of redeemable units
per Series (Note 4):
Net assets attributable to holders of redeemable
units per unit: Number of redeemable
units outstanding:
as at Sept. 30, 2021
as at Mar. 31, 2021
as at Sept. 30, 2021
as at Mar. 31, 2021
as at Sept. 30, 2021
as at Mar. 31, 2021
Series A 13,158 8,687 12.00 11.24 1,096,337 772,914Series F 15,789 14,020 12.06 11.23 1,309,656 1,248,699Series I 1 1 12.02 11.14 113 113
AssetsCurrent assetsInvestmentsInvestments pledged as collateralCashUnrealized gain on futures and foreign currency forward contractsSwaps, swaptions and optionsDaily variation margin on derivative instrumentsFees rebate receivableCash collateral on deposit for short saleDividends receivableInterest receivableReceivable for distribution from investmentsSecurities lending revenue receivable (Note 6)Receivable for investments soldReceivable for unit subscriptions
LiabilitiesCurrent liabilitiesInvestments sold shortBank overdraftUnrealized loss on futures and foreign currency forward contractsSwaps, swaptions and options Dividends payable on investments sold shortInterest payable on investments sold shortDaily variation margin on derivative instrumentsPayable for investments purchasedPayable for unit redemptionsDistributions payable to holders of redeemable units Management fees payableAdministration fees payableAccounts payable and accrued liabilities
Net assets attributable to holders of redeemable units
The accompanying notes are an integral part of these financial statements.
Financial Statements (unaudited)
CIG - 2067

– 134 –
CI U.S. Equity Private Pool
Semi-Annual Financial Statements - September 30, 2021
Statements of Comprehensive Incomefor the periods ended September 30(in $000’s except for per unit amounts and number of units)
2021 2020
- - - - - - - - - -
- - - -
195 (341)
1,677 3,591 1,872 3,250 - - - - - - - - - - 1,872 3,250
141 98 19 15 - - 1 1 - - - - - - - - - - 13 7 - - 174 121
1,698 3,129
The accompanying notes are an integral part of these financial statements.
Financial Statements (unaudited)
Statements of Comprehensive Income (cont’d)for the periods ended September 30(in $000’s except for per unit amounts and number of units)
Increase (decrease) in net assets attributable to
holders of redeemable units per Series:
Increase (decrease) in net assets attributable to
holders of redeemable units per unit:
Weighted average number of units:
2021 2020 2021 2020 2021 2020Series A 683 929 0.72 1.35 952,619 685,806Series F 1,015 2,199 0.81 1.51 1,256,391 1,457,623Series I - 1 0.87 2.78 114 359
Income Net gain (loss) on investments and derivatives Dividends Interest for distribution purposes Income distributions from investments Capital gain distributions from investments Derivative income (loss) Dividends expense on financial assets (liabilities) sold
short Interest expense on financial assets (liabilities) sold short Net realized gain (loss) on sale of investments and
derivatives Change in unrealized appreciation (depreciation) in value
of investments and derivativesTotal net gain (loss) on investments and derivativesOther income Foreign exchange gain (loss) on cash Commitment fee income Securities lending revenue (Note 6) Fees rebateTotal other incomeTotal incomeExpensesManagement fees (Note 5)Administration fees (Note 5)Commissions and other portfolio transaction costsIndependent review committee feesSecurities borrowing fees (Note 2)Margin feesService feesInterest expenseWithholding taxesHarmonized sales taxOther expensesTotal expensesIncrease (decrease) in net assets attributable to holders of redeemable units

– 135 –
CI U.S. Equity Private Pool
Semi-Annual Financial Statements - September 30, 2021
Statements of Changes in Net Assets Attributable to Holders of Redeemable Unitsfor the periods ended September 30 (in $000’s)
Net assets attributable to holders of redeemable units at the beginning of periodIncrease (decrease) in net assets attributable to holders of redeemable unitsDistributions to holders of redeemable units From net investment income From net realized gains Return of capitalTotal distributions to holders of redeemable units
Redeemable unit transactions Proceeds from redeemable units issued Reinvestment of distributions to holders of redeemable units Redemption of redeemable unitsNet increase (decrease) from redeemable unit transactionsNet increase (decrease) in net assets attributable to holders of redeemable unitsNet assets attributable to holders of redeemable units at the end of period
The accompanying notes are an integral part of these financial statements.
Financial Statements (unaudited)
Series A 2021 2020 8,687 5,726 683 929
- - - - - - - -
4,411 1,095 - - (623) (1,105) 3,788 (10) 4,471 919 13,158 6,645
Series F 2021 2020 14,020 14,060 1,015 2,199
- - - - - - - -
2,169 1,011 - - (1,415) (4,591) 754 (3,580) 1,769 (1,381) 15,789 12,679
Series I 2021 2020 1 10 - 1
- - - - - - - -
- - - - - (10) - (10) - (9) 1 1
Total Fund 2021 2020 22,708 19,796 1,698 3,129
- - - - - - - -
6,580 2,106 - - (2,038) (5,706) 4,542 (3,600) 6,240 (471) 28,948 19,325

– 136 –
CI U.S. Equity Private Pool
Semi-Annual Financial Statements - September 30, 2021
Statements of Cash Flowsfor the periods ended September 30 (in $000’s)
2021 2020
1,698 3,129
(195) 341 - - - -
(1,677) (3,591) 1,721 4,869 (6,107) (1,664) - - - - - - - - - - - - - - - - - - (4,560) 3,084
- - 6,585 2,066 (2,027) (5,045) 4,558 (2,979)
- - (2) 105 15 98 13 203
- - - - - - - - - -
*Dividends and interest received as well as dividends and interest paid relate to operating activities of the Fund. The accompanying notes are an integral part of these financial statements.
Financial Statements (unaudited)
Cash flows from (used in) operating activitiesIncrease (decrease) in net assets attributable to holders of redeemable unitsAdjustments for: Net realized (gain) loss on sale of investments and derivatives Unrealized foreign exchange (gain) loss on cash Commissions and other portfolio transaction costs Change in unrealized (appreciation) depreciation in value of
investments and derivatives Proceeds from sale and maturity of investments and derivatives Purchase of investments and derivatives (Increase) decrease in cash collateral on deposit for short sale Non-cash distributions from investments Change in daily variation margin (Increase) decrease in dividends receivable (Increase) decrease in interest receivable (Increase) decrease in securities lending revenue receivable Increase (decrease) in management fees payable Increase (decrease) in administration fees payable Change in other accounts receivable and payableNet cash from (used in) operating activities
Cash flows from (used in) financing activitiesDistributions paid to holders of redeemable units, net of reinvested distributionsProceeds from issuance of redeemable unitsAmounts paid on redemption of redeemable unitsNet cash from (used in) financing activities Unrealized foreign exchange gain (loss) on cashNet increase (decrease) in cashCash (bank overdraft), beginning of periodCash (bank overdraft), end of period
Supplementary Information:Dividends received, net of withholding tax*Interest received, net of withholding tax*Dividends paid*Interest paid*Tax recoverable (paid)

– 137 –
CI U.S. Equity Private Pool
Semi-Annual Financial Statements - September 30, 2021
Percentages shown relate investments at fair value to net assets attributable to holders of redeemable units of the Fund.
Schedule of Investment Portfolio as at September 30, 2021 (unaudited)
Number of Units Description Average Cost
($)Fair Value
($)% of Net
Assets
UNDERLYING FUND(S) 2,152,759 CI U.S. Equity Private Trust (Series I) 25,405,598 28,947,079 100.00Total Investment Portfolio 25,405,598 28,947,079 100.00Other Net Assets (Liabilities) 691 0.00 Net Assets Attributable to Holders of Redeemable Units 28,947,770 100.00

– 138 –
CI U.S. Equity Private Pool
Semi-Annual Financial Statements - September 30, 2021
The accompanying notes are an integral part of these financial statements.
Fund Specific Notes to Financial Statements (unaudited)
Interest in Unconsolidated Structured Entities (Note 2)
The following tables present the Fund’s interest in Unconsolidated Structured Entities.
as at September 30, 2021 Fair Value of
the Underlying Fund(s) / ETF(s)Fair Value of the Fund’s Investment
in the Underlying Fund(s) / ETF(s)Ownership in the
Underlying Fund(s) / ETF(s)
Unconsolidated Structured Entities (in $000’s) (in $000’s) (%)CI U.S. Equity Private Trust 186,536 28,947 15.5
as at March 31, 2021 Fair Value of
the Underlying Fund(s) / ETF(s)Fair Value of the Fund’s Investment
in the Underlying Fund(s) / ETF(s)Ownership in the
Underlying Fund(s) / ETF(s)
Unconsolidated Structured Entities (in $000’s) (in $000’s) (%)Sentry U.S. Equity Income Private Trust 175,944 22,692 12.9

– 139 –
CI U.S. Equity Private Pool
Semi-Annual Financial Statements - September 30, 2021
Redeemable Unit Transactions (Note 4)for the periods ended September 30
Number of redeemable units at the beginning of periodRedeemable units issued for cashRedeemable units issued for reinvested distributionsRedeemable units redeemedNumber of redeemable units at the end of period
Fund Specific Notes to Financial Statements (unaudited)
†A portion of brokerage commissions paid was used to cover research and market data services, termed soft dollar commissions. This amount has been estimated by the Manager of the Fund.The accompanying notes are an integral part of these financial statements.
Commissions (Note 2)for the periods ended September 30 (in $000’s)
2021 2020Brokerage commissions - -Soft dollar commissions† - -
Series A 2021 2020 772,914 675,604 377,057 113,474 - - (53,634) (114,352) 1,096,337 674,726
Series F 2021 2020 1,248,699 1,673,159 181,941 105,995 - - (120,984) (487,539) 1,309,656 1,291,615
Series I 2021 2020 113 1,185 - - - - - (1,073) 113 112
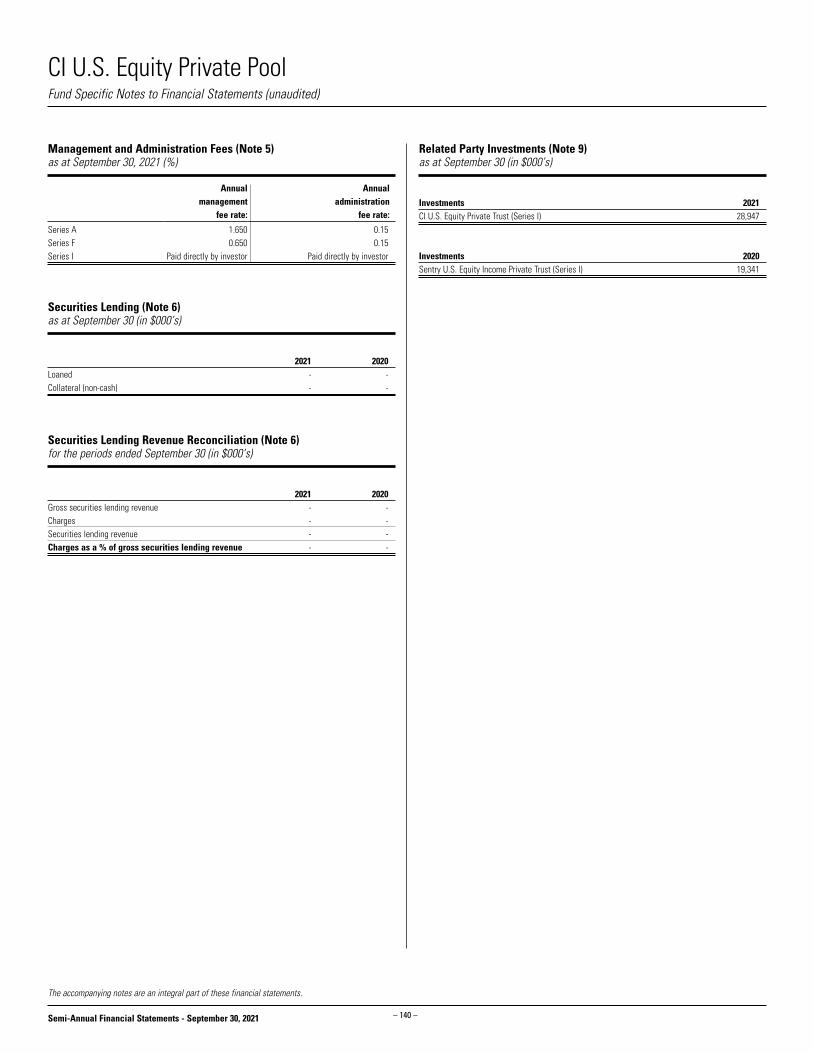
– 140 –
CI U.S. Equity Private Pool
Semi-Annual Financial Statements - September 30, 2021
The accompanying notes are an integral part of these financial statements.
Fund Specific Notes to Financial Statements (unaudited)
Securities Lending (Note 6)as at September 30 (in $000’s)
2021 2020Loaned - -Collateral (non-cash) - -
Securities Lending Revenue Reconciliation (Note 6)for the periods ended September 30 (in $000’s)
2021 2020Gross securities lending revenue - -Charges - -Securities lending revenue - -Charges as a % of gross securities lending revenue - -
Management and Administration Fees (Note 5) as at September 30, 2021 (%)
Annual management
fee rate:
Annual administration
fee rate:
Series A 1.650 0.15Series F 0.650 0.15Series I Paid directly by investor Paid directly by investor
Related Party Investments (Note 9)as at September 30 (in $000’s)
Investments 2021CI U.S. Equity Private Trust (Series I) 28,947
Investments 2020Sentry U.S. Equity Income Private Trust (Series I) 19,341

– 141 –
CI U.S. Equity Private Pool
Semi-Annual Financial Statements - September 30, 2021
The accompanying notes are an integral part of these financial statements.
Other Price RiskAs at September 30, 2021 and March 31, 2021, the Fund indirectly bears the other price risk exposure of the Underlying Fund.
As at September 30, 2021 and March 31, 2021, the Underlying Fund was predominantly invested in U.S. equities and therefore was sensitive to changes in general economic conditions in the United States.
As at September 30, 2021, had the fair value of equities in the investment portfolio of the Underlying Fund increased or decreased by 10% (March 31, 2021 - 10%), with all other variables held constant, net assets attributable to holders of redeemable units of the Fund would have increased or decreased, respectively, by approximately $2,906,000 (March 31, 2021 - $2,269,000). In practice, actual results may differ from this analysis and the difference may be material.
Currency RiskAs at September 30, 2021 and March 31, 2021, the Fund had no significant direct exposure to currency risk.
As at September 30, 2021 and March 31, 2021, the Fund indirectly bears the currency risk exposure of the Underlying Fund.
The tables below summarize the Underlying Fund’s exposure to currency risk.
as at September 30, 2021~
Currency Net Assets (%)U.S. Dollar 100.3 Total 100.3
as at March 31, 2021~
Currency Net Assets (%)U.S. Dollar 100.8 Total 100.8
~Includes monetary and non-monetary instruments, if any.
As at September 30, 2021, had the Canadian dollar strengthened or weakened by 10% (March 31, 2021 - 10%) in relation to all other foreign currencies held in the Underlying Fund, with all other variables held constant, net assets attributable to holders of redeemable units of the Fund would have indirectly decreased or increased, respectively, by approximately $2,903,000 (March 31, 2021 - $2,287,000). In practice, actual results may differ from this analysis and the difference may be material.
Interest Rate RiskAs at September 30, 2021 and March 31, 2021, the Fund had no significant direct exposure to interest rate risk.
As at September 30, 2021 and March 31, 2021, the Fund indirectly bears the interest rate risk exposure of the Underlying Fund.
As at September 30, 2021 and March 31, 2021, the Underlying Fund did not have a significant exposure to interest rate risk as substantially all of its assets were invested in equities and option(s).
Financial Instruments Risks (Note 10)
Concentration RiskThe tables below summarize the Underlying Fund’s exposure to concentration risk.
as at September 30, 2021 Categories Net Assets (%)Long PositionsInformation Technology 21.9Communication Services 18.8Financials 17.3Health Care 13.2Industrials 11.3Consumer Discretionary 10.0Utilities 3.3Real Estate 1.9Energy 1.5Consumer Staples 1.3Other Net Assets (Liabilities) 0.5 Total Long Positions 101.0
Short PositionsOption Contract(s) (1.0)Total Short Positions (1.0)Total 100.0
as at March 31, 2021 Categories Net Assets (%)Long PositionsInformation Technology 22.1 Communication Services 17.3 Financials 17.0 Health Care 15.5 Consumer Discretionary 10.8 Industrials 9.0 Utilities 3.5 Real Estate 1.8 Energy 1.7 Other Net Assets (Liabilities) 1.4 Consumer Staples 1.3 Total Long Positions 101.4
Short PositionsOption Contract(s) (1.4)Total Short Positions (1.4)Total 100.0
Credit RiskAs at September 30, 2021 and March 31, 2021, the Fund had no significant direct exposure to credit risk.
As at September 30, 2021 and March 31, 2021, the Fund indirectly bears the credit risk exposure of the Underlying Fund.
As at September 30, 2021 and March 31, 2021, the Underlying Fund did not have a significant exposure to credit risk as substantially all of its assets were invested in equities and option(s).
Fund Specific Notes to Financial Statements (unaudited)

– 142 –
CI U.S. Equity Private Pool
Semi-Annual Financial Statements - September 30, 2021
The accompanying notes are an integral part of these financial statements.
Fair Value Hierarchy
The tables below summarize the inputs used by the Fund in valuing the Fund’s investments and derivatives carried at fair value.
Long Positions at fair value as at September 30, 2021Level 1 Level 2 Level 3 Total
(in $000’s) (in $000’s) (in $000’s) (in $000’s)Underlying Fund(s) 28,947 - - 28,947 Total 28,947 - - 28,947
Long Positions at fair value as at March 31, 2021Level 1 Level 2 Level 3 Total
(in $000’s) (in $000’s) (in $000’s) (in $000’s)Underlying Fund(s) 22,692 - - 22,692 Total 22,692 - - 22,692
There were no transfers between Level 1, 2 and 3 during the period ended September 30, 2021 and the year ended March 31, 2021.
Fund Specific Notes to Financial Statements (unaudited)

– 143 –
CI Global Asset Allocation Private Pool
Semi-Annual Financial Statements - September 30, 2021
Statements of Financial Position (cont’d)(in $000’s except for per unit amounts and units outstanding)
Net assets attributable to holders of redeemable units
per Series (Note 4):
Net assets attributable to holders of redeemable
units per unit: Number of redeemable
units outstanding:
as at Sept. 30, 2021
as at Mar. 31, 2021
as at Sept. 30, 2021
as at Mar. 31, 2021
as at Sept. 30, 2021
as at Mar. 31, 2021
Series A 284,687 204,640 12.26 11.75 23,225,570 17,418,635Series F 280,929 199,812 12.34 11.80 22,764,337 16,930,207Series I 1 1 12.40 11.84 103 102ETF C$ Series 15,961 15,267 24.46 23.40 652,392 652,392
AssetsCurrent assetsInvestmentsInvestments pledged as collateralCashUnrealized gain on futures and foreign currency forward contractsSwaps, swaptions and optionsDaily variation margin on derivative instrumentsFees rebate receivableCash collateral on deposit for short saleDividends receivableInterest receivableReceivable for distribution from investmentsSecurities lending revenue receivable (Note 6)Receivable for investments soldReceivable for unit subscriptions
LiabilitiesCurrent liabilitiesInvestments sold shortBank overdraftUnrealized loss on futures and foreign currency forward contractsSwaps, swaptions and options Dividends payable on investments sold shortInterest payable on investments sold shortDaily variation margin on derivative instrumentsPayable for investments purchasedPayable for unit redemptionsDistributions payable to holders of redeemable units Management fees payableAdministration fees payableAccounts payable and accrued liabilities
Net assets attributable to holders of redeemable units
The accompanying notes are an integral part of these financial statements.
Financial Statements (unaudited)
CIG - 2052
Statements of Financial Position (in $000’s except for per unit amounts and units outstanding)
as at as at Sept. 30, 2021 Mar. 31, 2021
528,534 373,654 - - 57,705 43,370
94 1,201 46 - - - - - - - 289 284 1,159 794 - - - - 1,285 388 1,811 2,701 590,923 422,392
- - - -
1,216 280 - - - - - - - - 7,775 2,038 323 318 - - 18 12 2 - 11 24 9,345 2,672
581,578 419,720

– 144 –
CI Global Asset Allocation Private Pool
Semi-Annual Financial Statements - September 30, 2021
The accompanying notes are an integral part of these financial statements.
Financial Statements (unaudited)
Statement of Comprehensive Income (cont’d)for the periods ended September 30(in $000’s except for per unit amounts and number of units)
Increase (decrease) in net assets attributable to
holders of redeemable units per Series:
Increase (decrease) in net assets attributable to
holders of redeemable units per unit:
Weighted average number of units:
2021 2020 2021 2020 2021 2020Series A 9,295 8,122 0.45 1.26 20,461,485 6,452,724Series F 10,492 13,256 0.53 1.35 19,936,719 9,812,122Series I - - 0.64 0.58 102 543ETF C$ Series 763 304 1.17 0.40 652,392 752,392
Income Net gain (loss) on investments and derivatives Dividends Interest for distribution purposes Income distributions from investments Capital gain distributions from investments Derivative income (loss) Dividends expense on financial assets (liabilities) sold
short Interest expense on financial assets (liabilities) sold short Net realized gain (loss) on sale of investments and
derivatives Change in unrealized appreciation (depreciation) in value
of investments and derivativesTotal net gain (loss) on investments and derivativesOther income Foreign exchange gain (loss) on cash Securities lending revenue (Note 6) Fees rebate Other incomeTotal other incomeTotal incomeExpensesManagement fees (Note 5)Administration fees (Note 5)Commissions and other portfolio transaction costsIndependent review committee feesSecurities borrowing fees (Note 2)Interest expenseWithholding taxesHarmonized sales taxOther expensesTotal expensesExpenses absorbed by the Manager (Note 5)Increase (decrease) in net assets attributable to holders of redeemable units
Statements of Comprehensive Incomefor the periods ended September 30(in $000’s except for per unit amounts and number of units)
2021 2020
5,743 797 1,929 893 30 130 - - - -
- - - -
7,436 1,274
9,632 21,386 24,770 24,480 (90) (1,439) 25 9 - - - - (65) (1,430) 24,705 23,050
2,798 881 385 135 266 124 - - - - 25 1 345 126 331 95 5 6 4,155 1,368 - -
20,550 21,682

– 145 –
CI Global Asset Allocation Private Pool
Semi-Annual Financial Statements - September 30, 2021
The accompanying notes are an integral part of these financial statements.
Financial Statements (unaudited)
Statements of Changes in Net Assets Attributable to Holders of Redeemable Units for the periods ended September 30 (in $000’s)
Net assets attributable to holders of redeemable units at the beginning of periodIncrease (decrease) in net assets attributable to holders of redeemable unitsDistributions to holders of redeemable units From net investment income From net realized gains Return of capitalTotal distributions to holders of redeemable units
Redeemable unit transactions Proceeds from redeemable units issued Reinvestment of distributions to holders of redeemable units Acquisition of assets from terminated funds Redemption of redeemable unitsNet increase (decrease) from redeemable unit transactionsNet increase (decrease) in net assets attributable to holders of redeemable unitsNet assets attributable to holders of redeemable units at the end of period
Series A 2021 2020 204,640 58,969 9,295 8,122
(26) (66) (158) - - - (184) (66)
87,019 27,248 182 65 - - (16,265) (9,866) 70,936 17,447 80,047 25,503 284,687 84,472
Series F 2021 2020 199,812 89,991 10,492 13,256
(139) (522) (851) - (1) - (991) (522)
87,208 34,161 818 422 - - (16,410) (15,648) 71,616 18,935 81,117 31,669 280,929 121,660
Series I 2021 2020 1 10 - -
- - - - - - - -
- 101 - - - - - (109) - (8) - (8) 1 2
ETF C$ Series 2021 2020 15,267 - 763 304
(10) (43) (60) - - - (70) (43)
1 1 - - - 15,875 - - 1 15,876 694 16,137 15,961 16,137
Total Fund 2021 2020 419,720 148,970 20,550 21,682
(175) (631) (1,069) - (1) - (1,245) (631)
174,228 61,511 1,000 487 - 15,875 (32,675) (25,623) 142,553 52,250 161,858 73,301 581,578 222,271

– 146 –
CI Global Asset Allocation Private Pool
Semi-Annual Financial Statements - September 30, 2021
*Dividends and interest received as well as dividends and interest paid relate to operating activities of the Fund. The accompanying notes are an integral part of these financial statements.
Financial Statements (unaudited)
Statements of Cash Flowsfor the periods ended September 30 (in $000’s)
2021 2020
20,550 21,682
(7,436) (1,274) (52) (76) 266 124
(9,632) (21,386) 299,742 97,495 (430,982) (118,706) - - - - - - (4) 8 (365) (100) 5 6 1 - (11) 9 - - (127,918) (22,218)
(245) (144) 175,117 59,406 (32,671) (22,257) - 15,875 142,201 52,880
52 76 14,283 30,662 43,370 6,498 57,705 37,236
5,428 684 1,559 787 - - (25) (1) - -
Cash flows from (used in) operating activitiesIncrease (decrease) in net assets attributable to holders of redeemable unitsAdjustments for: Net realized (gain) loss on sale of investments and derivatives Unrealized foreign exchange (gain) loss on cash Commissions and other portfolio transaction costs Change in unrealized (appreciation) depreciation in value of
investments and derivatives Proceeds from sale and maturity of investments and derivatives Purchase of investments and derivatives Non-cash distributions from investments Change in daily variation margin (Increase) decrease in cash collateral on deposit for short sale (Increase) decrease in dividends receivable (Increase) decrease in interest receivable Increase (decrease) in management fees payable Increase (decrease) in administration fees payable Change in other accounts receivable and payable Amortization interest earnedNet cash from (used in) operating activities
Cash flows from (used in) financing activitiesDistributions paid to holders of redeemable units, net of reinvested distributionsProceeds from issuance of redeemable unitsAmounts paid on redemption of redeemable unitsAcquisition of assets from terminated fundsNet cash from (used in) financing activities Unrealized foreign exchange gain (loss) on cashNet increase (decrease) in cashCash (bank overdraft), beginning of periodCash (bank overdraft), end of period
Supplementary Information:Dividends received, net of withholding tax*Interest received, net of withholding tax*Dividends paid*Interest paid*Tax recoverable (paid)

– 147 –
CI Global Asset Allocation Private Pool
Semi-Annual Financial Statements - September 30, 2021
Percentages shown relate investments at fair value to net assets attributable to holders of redeemable units of the Fund.
Schedule of Investment Portfolio as at September 30, 2021 (unaudited)
Number ofUnits/Sharesor Par Value Description
Average Cost($)
Fair Value($)
% of Net Assets
EQUITIES AUSTRALIAAUD 783,746 Atlas Arteria Ltd. 4,725,297 4,657,660 0.80 BERMUDA GBP 814,801 Conduit Holdings Ltd. 7,188,944 6,598,175 1.13 CANADA 343,391 Barrick Gold Corp. 9,829,222 7,853,352 30,781 Calfrac Well Services Ltd. 207,227 107,734 472,139 Eupraxia Pharmaceuticals Inc. 3,154,630 1,274,775 166,681 Eupraxia Pharmaceuticals Inc., Warrants, March 09, 2026 210,546 100,842 308,113 First Quantum Minerals Ltd. 6,138,631 7,225,250 16,846 Granite REIT 1,273,957 1,517,488 57,586 Nutrien Ltd. 3,613,322 4,734,145 29,484 West Fraser Timber Co. Ltd. 2,594,584 3,145,353 27,022,119 25,958,939 4.46 FRANCE EUR 113,220 Sanofi SA 14,428,856 13,800,630 2.37 GUERNSEY USD 503,544 Burford Capital Ltd. 6,213,487 7,009,299 1.21 GERMANY EUR 63,554 Daimler AG, Registered 6,698,707 7,153,701 EUR 199,398 Hensoldt AG 3,728,771 3,996,233 EUR 64,330 Siemens AG, Registered 13,237,312 13,394,806 23,664,790 24,544,740 4.22 HONG KONG HKD 474,514 AIA Group Ltd. 7,231,460 6,944,654 1.19 IRELAND EUR 139,033 CRH PLC 7,758,928 8,273,612 1.42 MEXICO MXN 411,987 Fomento Economico Mexicano SAB de CV 4,170,884 4,526,938 0.78 NETHERLANDS EUR 808,224 ING Groep NV 10,201,107 14,903,120 EUR 98,608 Koninklijke Vopak NV 6,146,325 4,918,927 16,347,432 19,822,047 3.41 NORWAY NOK 694,102 Norsk Hydro ASA 4,559,956 6,589,285 1.13 SWITZERLAND CHF 68,614 Nestle SA, Registered 9,989,875 10,509,535 EUR 75,373 STMicroelectronics NV 3,814,836 4,176,232 13,804,711 14,685,767 2.53 U.S.A. USD 39,568 Abbott Laboratories 5,761,449 5,920,301 USD 105,961 Advanced Micro Devices Inc. 9,963,646 13,810,230 USD 4,286 Alexandria Real Estate Equities Inc. 942,298 1,037,252 USD 3,664 Alphabet Inc., Class ‘C’ 8,842,212 12,369,229 USD 2,260 Amazon.com Inc. 8,839,655 9,403,480 USD 57,417 American Homes 4 Rent, Class ‘A’ 2,347,834 2,772,253 USD 27,508 Apartment Income REIT Corp. 1,421,027 1,700,620 USD 90,991 Apple Inc. 13,335,520 16,307,761 USD 1,094 California Resources Corp., Warrants, October 23, 2024 143 16,628 USD 54,852 CIGNA Corp. 14,800,103 13,906,224 USD 7,100 Citigroup Capital XIII, 7.87%, Preferred, Callable 244,175 249,552 USD 78,632 Citigroup Inc. 5,919,812 6,989,598 USD 38,127 Danaher Corp. 11,960,421 14,701,912 USD 83,431 East West Bancorp Inc. 7,594,282 8,193,939 USD 191,767 Equitable Holdings Inc. 6,553,783 7,199,321 USD 59 GMAC Capital Trust I, Preferred, Series ‘2’, Variable Rate, Callable 2,013 1,886

– 148 –
CI Global Asset Allocation Private Pool
Semi-Annual Financial Statements - September 30, 2021
Schedule of Investment Portfolio as at September 30, 2021 (unaudited) (cont’d)
Percentages shown relate investments at fair value to net assets attributable to holders of redeemable units of the Fund.
EQUITIES (cont’d) U.S.A. (cont’d)USD 27,834 Home Depot Inc. (The) 10,221,629 11,572,657 USD 44,247 Honeywell International Inc. 10,952,094 11,896,861 USD 110,366 Invitation Homes Inc. 4,361,495 5,358,134 USD 33,917 Microsoft Corp. 9,876,496 12,111,078 USD 102,491 Mondelez International Inc., Class ‘A’ 7,462,490 7,552,643 USD 37,464 Nike Inc., Class ‘B’ 5,943,189 6,891,440 USD 36,139 NVIDIA Corp. 6,113,947 9,482,471 USD 48,652 Procter & Gamble Co. (The) 8,221,339 8,614,843 USD 63,454 Prologis Inc. 8,347,933 10,080,914 USD 3,941 Pyxus International Inc. 14,468 11,057 USD 38,713 QUALCOMM Inc. 7,182,495 6,324,391 USD 39,374 Sempra Energy 6,423,611 6,308,695 USD 9,762 SkillSoft Corp. 122,054 144,542 USD 51,889 Snap Inc., Class ‘A’ 3,960,221 4,854,929 USD 111,964 Synchrony Financial 5,105,357 6,931,849 USD 188,298 Williams Cos. Inc. (The) 5,536,099 6,186,645 USD 32,982 Zoetis Inc. 8,153,597 8,110,199 206,526,887 237,013,534 40.76Total Equities 343,643,751 380,425,280 65.41
BONDS BERMUDA USD 98,000 Aircastle Ltd., Perpetual, 5.25%, June 15, 2026 118,619 127,050 USD 276,000 NCL Corp. Ltd., 3.63%, December 15, 2024 329,214 332,540 USD 344,000 NCL Corp. Ltd., 5.88%, March 15, 2026 437,677 447,189 USD 9,000 NCL Corp. Ltd., 10.25%, February 01, 2026 12,214 13,100 USD 77,000 NCL Finance Ltd., 6.13%, March 15, 2028 97,510 101,353 USD 336,000 VOC Escrow Ltd., 5%, February 15, 2028 421,254 420,490 1,416,488 1,441,722 0.25 BRITISH VIRGIN ISLANDS USD 780,000 Studio City Finance Ltd., 5%, January 15, 2029 918,144 912,386 USD 95,000 Studio City Finance Ltd., 6%, July 15, 2025 118,343 119,749 USD 540,000 Studio City Finance Ltd., 6.5%, January 15, 2028 728,943 671,789 1,765,430 1,703,924 0.29 CANADA USD 154,000 Air Canada 2020-1 Class C Pass Through Trust, 10.5%, July 15, 2026 238,447 240,992 USD 146,000 Air Canada, 4%, July 01, 2025 205,014 265,279 358,000 Air Canada, 4.63%, August 15, 2029 359,295 359,939 2,000 Air Canada, 4.75%, October 06, 2023 1,870 2,029 USD 154,000 Bank of Montreal, 3.8%, December 15, 2032 221,941 213,750 USD 200,000 Bank of Montreal, 4.34%, October 05, 2028 276,558 270,523 USD 215,000 Brookfield Finance Inc., 4.25%, June 02, 2026 311,786 304,618 USD 223,000 Brookfield Finance Inc., 4.35%, April 15, 2030 329,906 326,088 USD 128,000 Brookfield Residential Properties Inc. / Brookfield Residential US Corp, 4.88%, February 15, 2030 169,655 165,570 150,000 Brookfield Residential Properties Inc. / Brookfield Residential US Corp, 5.13%, June 15, 2029 150,000 151,375 USD 330,000 Brookfield Residential Properties Inc. / Brookfield Residential US Corp, 6.25%, September 15, 2027 434,851 439,930 67,000 Calfrac Well Services Ltd., 10%, December 18, 2023 54,000 67,000 USD 23,000 Canadian National Railway Co., 4.5%, November 07, 2043 36,774 35,408 USD 162,000 Canadian Natural Resources Ltd., 3.85%, June 01, 2027 231,143 224,459 201,000 Canadian Western Bank, 5%, July 31, 2081 201,205 204,554 70,000 Canadian Western Bank, Series ‘1’, 6%, April 30, 2081 70,377 75,009 USD 405,000 CCL Industries Inc., 3.05%, June 01, 2030 549,624 537,629 USD 180,000 Cenovus Energy Inc., 2.65%, January 15, 2032 226,774 223,554 USD 100,000 Cenovus Energy Inc., 5.38%, July 15, 2025 140,446 144,278 USD 238,000 Cenovus Energy Inc., 5.4%, June 15, 2047 343,782 369,729
Number ofUnits/Sharesor Par Value Description
Average Cost($)
Fair Value($)
% of Net Assets

– 149 –
CI Global Asset Allocation Private Pool
Semi-Annual Financial Statements - September 30, 2021
Schedule of Investment Portfolio as at September 30, 2021 (unaudited) (cont’d)
Percentages shown relate investments at fair value to net assets attributable to holders of redeemable units of the Fund.
BONDS (cont’d) CANADA (cont’d) 610,000 CES Energy Solutions Corp., 6.38%, October 21, 2024 591,874 627,093 518,000 Crew Energy Inc., 6.5%, March 14, 2024 472,302 509,798 USD 15,000 Eldorado Gold Corp., 6.25%, September 01, 2029 18,774 18,808 USD 124,000 Element Fleet Management Corp., 1.6%, April 06, 2024 155,648 159,364 USD 403,000 Emera Inc., Series ‘2016-A’, 6.75%, June 15, 2076 587,873 607,809 USD 207,000 Empire Communities Corp., 7%, December 15, 2025 273,349 274,312 188,000 Empire Communities Corp., 7.38%, December 15, 2025 189,349 197,283 USD 195,000 Enbridge Inc., 4.5%, June 10, 2044 287,933 288,493 USD 236,000 Enbridge Inc., 5.5%, July 15, 2077 260,709 320,272 USD 300,000 Enbridge Inc., 6%, January 15, 2077 407,683 421,063 USD 360,000 Enbridge Inc., 6.25%, March 01, 2078 482,779 508,140 USD 439,000 Fairfax India Holdings Corp., 5%, February 26, 2028 549,391 555,423 USD 365,000 First Quantum Minerals Ltd., 6.5%, March 01, 2024 475,514 468,666 USD 646,000 First Quantum Minerals Ltd., 6.88%, March 01, 2026 813,571 851,975 USD 47,000 First Quantum Minerals Ltd., 6.88%, October 15, 2027 61,730 63,070 USD 500,000 First Quantum Minerals Ltd., 7.25%, April 01, 2023 649,659 645,174 USD 441,000 First Quantum Minerals Ltd., 7.5%, April 01, 2025 589,231 573,697 USD 187,000 Glencore Finance Canada Ltd., Step Rate 274,442 304,540 USD 208,000 goeasy Ltd., 4.38%, May 01, 2026 260,485 271,027 USD 419,000 Husky III Holding Ltd., 13%, February 15, 2025 570,409 565,623 572,000 Inter Pipeline Ltd., Series ‘19-B’, 6.63%, November 19, 2079 617,134 621,264 51,000 Keyera Corp., Floating Rate, June 13, 2079 51,057 56,835 USD 60,000 Magna International Inc., 2.45%, June 15, 2030 80,275 77,315 USD 355,000 Manulife Financial Corp., 4.06%, February 24, 2032 501,450 493,565 357,000 Mattamy Group Corp., 4.63%, March 01, 2028 356,629 366,148 USD 110,000 Mattamy Group Corp., 4.63%, March 01, 2030 148,338 142,610 USD 117,000 MEG Energy Corp., 5.88%, February 01, 2029 149,820 151,778 USD 87,000 MEG Energy Corp., 6.5%, January 15, 2025 113,734 113,524 USD 190,000 MEG Energy Corp., 7.13%, February 01, 2027 242,263 252,975 USD 7,000 Methanex Corp., 5.13%, October 15, 2027 9,207 9,598 USD 76,000 New Gold Inc., 7.5%, July 15, 2027 102,408 99,201 USD 122,000 Northriver Midstream Finance L.P., 5.63%, February 15, 2026 160,026 161,028 USD 51,000 NOVA Chemicals Corp., 4.25%, May 15, 2029 63,230 64,677 USD 382,000 NOVA Chemicals Corp., 5.25%, June 01, 2027 509,308 509,863 100,000 NuVista Energy Ltd., 7.88%, July 23, 2026 98,989 101,487 125,000 Parkland Corp., 4.38%, March 26, 2029 125,000 127,240 USD 100,000 Parkland Corp., 4.5%, October 01, 2029 125,940 128,541 220,000 Parkland Corp., 6%, June 23, 2028 220,484 237,004 75,000 Parkland Corp., Restricted, 3.88%, June 16, 2026 75,000 76,328 USD 42,000 Precision Drilling Corp., 6.88%, January 15, 2029 50,670 55,644 USD 598,000 Rockpoint Gas Storage Canada Ltd., 7%, March 31, 2023 766,434 769,736 USD 66,000 Strathcona Resources Ltd., 6.88%, August 01, 2026 82,719 82,954 USD 273,000 Superior Plus L.P. / Superior General Partner Inc., 4.5%, March 15, 2029 351,436 357,452 100,000 Superior Plus L.P., 4.25%, May 18, 2028 100,000 102,833 USD 60,000 Teine Energy Ltd., 6.88%, April 15, 2029 75,510 77,460 USD 116,000 TransCanada Trust, 5.5%, September 15, 2079 156,451 162,536 USD 239,000 TransCanada Trust, Series ‘16-A’, 5.88%, August 15, 2076 335,862 339,943 18,195,527 18,592,882 3.20 CAYMAN ISLANDS USD 237,000 Avolon Holdings Funding Ltd., 2.75%, February 21, 2028 293,522 299,368 USD 110,000 Avolon Holdings Funding Ltd., 4.38%, May 01, 2026 148,028 150,434 USD 389,000 Avolon Holdings Funding Ltd., 5.25%, May 15, 2024 516,813 538,350 USD 396,000 Global Aircraft Leasing Co. Ltd., Series ‘2021’, Payment-In-Kind, 6.5%, September 15, 2024 449,876 468,555
Number ofUnits/Sharesor Par Value Description
Average Cost($)
Fair Value($)
% of Net Assets

– 150 –
CI Global Asset Allocation Private Pool
Semi-Annual Financial Statements - September 30, 2021
Schedule of Investment Portfolio as at September 30, 2021 (unaudited) (cont’d)
Percentages shown relate investments at fair value to net assets attributable to holders of redeemable units of the Fund.
BONDS (cont’d) CAYMAN ISLANDS (cont’d)USD 720,232 Global Aircraft Leasing Co. Ltd., Payment-In-Kind, 6.5%, September 15, 2024 902,373 897,421 USD 21,200 Spirit Loyalty Cayman Ltd. / Spirit IP Cayman Ltd., 8%, September 20, 2025 29,122 30,148 2,339,734 2,384,276 0.41 FRANCE USD 88,000 Altice France SA, 5.5%, January 15, 2028 113,849 112,681 USD 55,000 Altice France SA, 5.5%, October 15, 2029 69,603 69,048 USD 144,000 BNP Paribas SA, 3.8%, January 10, 2024 199,585 194,538 383,037 376,267 0.06 GERMANY USD 215,000 Cheplapharm Arzneimittel GmbH, 5.5%, January 15, 2028 284,084 282,482 USD 20,000 Commerzbank AG, 8.13%, September 19, 2023 29,827 28,551 USD 20,000 Deutsche Bank AG, 4.25%, October 14, 2021 26,308 25,359 340,219 336,392 0.06 IRELAND USD 8,000 AerCap Ireland Capital DAC / AerCap Global Aviation Trust, 6.5%, July 15, 2025 10,681 11,749 0.00 JAPAN USD 315,000 Nissan Motor Co. Ltd., 4.81%, September 17, 2030 451,926 448,533 0.08 LIBERIA USD 14,000 Royal Caribbean Cruises Ltd., 3.7%, March 15, 2028 15,883 17,012 USD 400,000 Royal Caribbean Cruises Ltd., 5.25%, November 15, 2022 512,201 519,939 USD 357,000 Royal Caribbean Cruises Ltd., 5.5%, August 31, 2026 446,357 465,377 USD 1,109,000 Royal Caribbean Cruises Ltd., 5.5%, April 01, 2028 1,430,566 1,438,764 USD 453,000 Royal Caribbean Cruises Ltd., 9.13%, June 15, 2023 628,385 624,293 3,033,392 3,065,385 0.53 LUXEMBOURG USD 50,000 Altice France Holding SA, 6%, February 15, 2028 65,655 60,487 USD 174,000 Intelsat Jackson Holdings SA, 5.5%, August 01, 2023 202,419 123,262 268,074 183,749 0.03 NETHERLANDS USD 56,000 AerCap Holdings NV, 5.88%, October 10, 2079 72,931 74,118 USD 149,000 Fiat Chrysler Automobiles NV, 5.25%, April 15, 2023 204,211 201,534 USD 291,000 LBC Tank Terminals Holding Netherlands BV, 6.88%, May 15, 2023 379,929 368,754 USD 200,000 UPC Broadband Finco BV, 4.88%, July 15, 2031 252,400 259,681 909,471 904,087 0.16 PANAMA USD 1,139,000 Carnival Corp., 4%, August 01, 2028 1,453,696 1,458,887 USD 143,000 Carnival Corp., 5.75%, March 01, 2027 181,546 187,237 USD 28,000 Carnival Corp., 7.2%, October 01, 2023 33,900 38,162 USD 419,000 Carnival Corp., 7.63%, March 01, 2026 559,845 567,191 USD 23,000 Carnival Corp., 9.88%, August 01, 2027 33,486 33,658 2,262,473 2,285,135 0.39 SPAIN USD 200,000 Grifols Escrow Issuer SA, 4.75%, October 15, 2028 253,500 259,070 0.04 SWITZERLAND USD 130,000 Credit Suisse AG of New York, 0.5%, February 02, 2024 165,022 164,079 USD 384,000 Credit Suisse AG of New York, 2.95%, April 09, 2025 530,293 515,971 USD 100,000 Credit Suisse Group AG, 1.31%, February 02, 2027 126,940 123,906 USD 170,000 Credit Suisse Group AG, Perpetual, 4.5%, September 03, 2030 219,383 211,554 USD 350,000 Credit Suisse Group AG, Perpetual, 5.25%, February 11, 2027 469,903 464,921 USD 150,000 Credit Suisse Group AG, Perpetual, 6.38%, August 21, 2026 200,570 208,989 USD 247,000 Credit Suisse Group AG, Perpetual, 7.5%, July 17, 2023 338,683 335,297 USD 304,000 UBS Group AG, 4.25%, March 23, 2028 445,338 433,023 USD 100,000 UBS Group AG, Perpetual, 3.88%, June 02, 2026 120,675 126,741 USD 180,000 UBS Group AG, Perpetual, 4.38%, February 10, 2031 231,516 230,883 2,848,323 2,815,364 0.48
Number ofUnits/Sharesor Par Value Description
Average Cost($)
Fair Value($)
% of Net Assets

– 151 –
CI Global Asset Allocation Private Pool
Semi-Annual Financial Statements - September 30, 2021
Schedule of Investment Portfolio as at September 30, 2021 (unaudited) (cont’d)
Percentages shown relate investments at fair value to net assets attributable to holders of redeemable units of the Fund.
BONDS (cont’d) U.K. USD 364,000 Barclays Bank PLC, 1.7%, May 12, 2022 485,678 464,723 USD 309,000 Barclays Bank PLC, Perpetual, 6.28%, December 15, 2034 451,496 543,038 USD 146,000 Barclays PLC, 1.01%, December 10, 2024 186,573 185,812 USD 148,000 Barclays PLC, 4.97%, May 16, 2029 223,754 217,912 USD 15,000 Barclays PLC, Perpetual, 6.13%, December 15, 2025 19,913 21,053 USD 161,000 Barclays PLC, Perpetual, 8%, June 15, 2024 223,396 230,434 USD 170,000 Brookfield Finance I (UK) PLC, 2.34%, January 30, 2032 213,622 211,860 USD 281,000 HSBC Holdings PLC, 4.29%, September 12, 2026 402,012 392,614 USD 142,000 Lloyds Banking Group PLC, 3.87%, July 09, 2025 197,635 193,945 USD 275,000 Merlin Entertainments PLC, 5.75%, June 15, 2026 361,077 360,257 USD 51,000 Royal Bank of Scotland Group PLC, Perpetual, 6%, December 29, 2025 69,662 72,453 USD 100,000 Standard Chartered PLC, Perpetual, 1.66%, January 30, 2027 124,270 124,123 USD 246,000 Virgin Media Secured Finance PLC, 5.5%, May 15, 2029 331,608 330,313 USD 299,000 Vmed O2 UK Financing I PLC, 4.25%, January 31, 2031 384,763 378,240 3,675,459 3,726,777 0.64 U.S.A. USD 28,000 Abercrombie & Fitch Management Co., 8.75%, July 15, 2025 38,354 38,755 USD 159,000 Academy Ltd., 6%, November 15, 2027 212,506 217,752 USD 5,985 Academy Ltd., Variable Rate, November 05, 2027 7,711 7,588 USD 73,000 AerCap Global Aviation Trust, 6.5%, June 15, 2045 95,789 100,374 USD 275,000 Air Canada, Variable Rate, August 11, 2028 352,378 349,475 USD 243,000 Air Lease Corp., 2.3%, February 01, 2025 314,972 316,057 USD 408,000 Air Lease Corp., 3.63%, April 01, 2027 562,472 556,035 USD 149,000 Air Lease Corp., 4.25%, February 01, 2024 208,993 202,576 USD 206,000 Ally Financial Inc., Series ‘C’, Perpetual, 4.7%, May 15, 2028 249,422 273,313 USD 31,791 Alterra Mountain Co., Variable Rate, August 17, 2028 40,750 40,116 USD 139,000 AMC Entertainment Holdings Inc., 10.5%, April 15, 2025 187,594 188,601 USD 59,231 AMC Entertainment Holdings Inc., Variable Rate, April 22, 2026 78,300 69,437 USD 500,000 American Airlines Group Inc., 5%, June 01, 2022 629,547 634,883 USD 160,000 American Airlines Inc. / AAdvantage Loyalty IP Ltd, 5.75%, April 20, 2029 206,519 218,625 USD 200,000 American Express Co., Series ‘B’, Perpetual, 3.6%, November 15, 2021 251,326 253,631 USD 50,000 AmWINS Group Inc., 4.88%, June 30, 2029 62,538 64,359 USD 115,000 Anheuser-Busch Cos. LLC / Anheuser-Busch InBev Worldwide Inc, 4.9%, February 01, 2046 187,178 181,008 USD 388,000 Anheuser-Busch InBev Worldwide Inc., 4.35%, June 01, 2040 576,702 572,034 USD 202,000 Anheuser-Busch InBev Worldwide Inc., 4.6%, June 01, 2060 308,297 309,591 USD 598,000 Apple Inc., 1.2%, February 08, 2028 758,619 741,977 USD 153,000 AT&T Inc., 1.7%, March 25, 2026 190,664 196,565 USD 323,000 AT&T Inc., 2.3%, June 01, 2027 433,416 423,528 USD 42,000 AT&T Inc., 3.1%, February 01, 2043 56,003 50,980 USD 401,000 AT&T Inc., 3.65%, June 01, 2051 523,272 515,602 USD 47,000 Bank of America Corp., 2.59%, April 29, 2031 66,672 60,729 USD 211,000 Bank of America Corp., Series ‘JJ’, Floating Rate, Perpetual, June 20, 2024 288,849 283,635 USD 100,000 Bank of America Corp., Series ‘MM’, Perpetual, 4.3%, January 28, 2025 131,344 129,035 USD 120,000 Bank of America Corp., Series ‘U’, Perpetual, 5.2%, June 01, 2023 160,148 156,457 USD 437,000 Bank of America Corp., Series ‘X’, 6.25%, September 29, 2049 624,552 609,201 USD 100,000 Bank of America Corp., Series ‘Z’, Perpetual, 6.5%, October 23, 2024 146,945 142,049 USD 38,000 Big River Steel LLC / BRS Finance Corp., 6.63%, January 31, 2029 51,135 52,130 USD 800,000 Brookfield Property REIT Inc. / BPR Cumulus LLC / BPR Nimbus LLC / GGSI Sellco LLC, 4.5%, April 01, 2027 1,020,959 1,003,097 USD 101,000 Brookfield Property REIT Inc. / BPR Cumulus LLC /BPR Nimbus LLC / GGSI Sellco LLC, 5.75%, May 15, 2026 135,749 133,204 USD 204,000 Burford Capital Global Finance LLC, 6.25%, April 15, 2028 256,676 274,169 USD 400,000 Cablevision Lightpath LLC, 5.63%, September 15, 2028 512,724 509,264 USD 374,100 Calfrac Holdings L.P., 10.88%, March 15, 2026 413,368 363,633 USD 35,000 Cargill Inc., 1.38%, July 23, 2023 49,117 45,159 USD 128,000 Cargill Inc., 2.13%, April 23, 2030 174,769 163,240 USD 27,000 Carvana Co., 5.5%, April 15, 2027 34,071 34,949
Number ofUnits/Sharesor Par Value Description
Average Cost($)
Fair Value($)
% of Net Assets

– 152 –
CI Global Asset Allocation Private Pool
Semi-Annual Financial Statements - September 30, 2021
Schedule of Investment Portfolio as at September 30, 2021 (unaudited) (cont’d)
Percentages shown relate investments at fair value to net assets attributable to holders of redeemable units of the Fund.
BONDS (cont’d) U.S.A. (cont’d)USD 77,000 Carvana Co., 5.63%, October 01, 2025 102,022 100,945 USD 160,000 Carvana Co., 5.88%, October 01, 2028 214,064 209,537 USD 75,000 CCO Holdings LLC / CCO Holdings Capital Corp., 4.25%, February 01, 2031 99,162 96,539 USD 100,000 CCO Holdings LLC / CCO Holdings Capital Corp., 4.5%, May 01, 2032 137,687 130,460 USD 263,000 CCO Holdings LLC / CCO Holdings Capital Corp., 5%, February 01, 2028 364,394 347,690 USD 223,000 Charter Communications Operating LLC / Charter Communications Operating Capital Corp, 2.8%, April 01, 2031 292,596 282,995 USD 339,000 Charter Communications Operating LLC / Charter Communications Operating Capital Corp, 3.5%, June 01, 2041 428,498 423,630 USD 128,000 Charter Communications Operating LLC / Charter Communications Operating Capital Corp, 4.8%, March 01, 2050 188,266 181,865 USD 150,000 Chemours Co. (The), 4.63%, November 15, 2029 188,220 185,772 USD 59,000 Cinemark Holdings Inc., 4.5%, August 15, 2025 99,125 119,500 USD 57,000 Cinemark USA Inc., 5.25%, July 15, 2028 67,771 71,217 USD 197,000 Citigroup Inc., 0.98%, May 01, 2025 244,241 250,354 USD 285,000 Citigroup Inc., 3.11%, April 08, 2026 399,253 383,271 USD 165,000 Citigroup Inc., 3.67%, July 24, 2028 230,826 229,749 USD 108,000 Citigroup Inc., 4.45%, September 29, 2027 162,162 155,632 USD 100,000 Citigroup Inc., Floating Rate, May 01, 2025 123,980 127,874 USD 90,000 Citigroup Inc., Perpetual, 3.88%, February 18, 2026 114,332 116,821 USD 535,000 Citigroup Inc., Series ‘P’, Perpetual, 5.95%, May 15, 2025 751,283 741,159 USD 235,000 Citigroup Inc., Series ‘U’, Perpetual, 5%, September 12, 2024 309,937 311,633 USD 13,000 Coeur Mining Inc., 5.13%, February 15, 2029 16,405 15,832 USD 502,000 Coinbase Global Inc., 3.38%, October 01, 2028 634,588 612,784 USD 1,110,000 Coinbase Global Inc., 3.63%, October 01, 2031 1,395,334 1,347,932 USD 371,000 Comcast Corp., 3.7%, April 15, 2024 518,844 505,402 USD 190,000 CommScope Inc., 7.13%, July 01, 2028 254,219 246,430 USD 18,000 Consolidated Communications Inc., 6.5%, October 01, 2028 23,758 24,794 USD 179,000 Costco Wholesale Corp., 1.38%, June 20, 2027 235,805 228,292 USD 128,000 CQP Holdco L.P. / BIP-V Chinook Holdco LLC, 5.5%, June 15, 2031 155,311 172,630 USD 70,000 Crown Castle International Corp., 3.3%, July 01, 2030 98,622 94,474 USD 115,000 Crown Castle International Corp., 4.15%, July 01, 2050 160,378 165,420 USD 84,000 CrownRock L.P. / CrownRock Finance Inc., 5.63%, October 15, 2025 107,805 109,022 USD 36,000 CSC Holdings LLC, 4.5%, November 15, 2031 44,199 45,085 USD 113,000 CSC Holdings LLC, 4.63%, December 01, 2030 141,708 135,798 USD 36,000 CSC Holdings LLC, 5%, November 15, 2031 44,199 43,817 USD 250,000 Darden Restaurants Inc., 3.85%, May 01, 2027 344,973 351,387 USD 6,000 Delta Air Lines Inc. / SkyMiles IP Ltd., 4.5%, October 20, 2025 7,892 8,133 USD 64,000 Delta Air Lines Inc., 7%, May 01, 2025 89,945 94,565 USD 503,000 Diamond Sports Group LLC / Diamond Sports Finance Co, 5.38%, August 15, 2026 649,530 421,282 USD 263,500 Dresdner Funding Trust I, 8.15%, June 30, 2031 466,877 478,012 USD 109,000 Emera U.S. Finance L.P., 3.55%, June 15, 2026 149,335 149,249 USD 32,000 Enact Holdings Inc., 6.5%, August 15, 2025 42,286 44,301 USD 36,000 Encino Acquisition Partners Holdings LLC, 8.5%, May 01, 2028 44,921 46,682 USD 64,000 Endeavor Energy Resources L.P. / EER Finance Inc., 5.75%, January 30, 2028 83,907 85,420 USD 58,000 Energy Transfer L.P., 3.75%, May 15, 2030 78,937 79,346 USD 223,000 Energy Transfer Operating L.P., 2.9%, May 15, 2025 297,780 296,083 USD 223,000 Estee Lauder Cos. Inc. (The), 2.6%, April 15, 2030 301,988 296,171 USD 209,000 Exelon Corp., 4.7%, April 15, 2050 352,402 334,201 USD 164,000 Exxon Mobil Corp., 1.57%, April 15, 2023 221,760 211,790 USD 131,000 Exxon Mobil Corp., 2.61%, October 15, 2030 176,575 173,741 USD 101,145 Fannie Mae, 2%, December 01, 2050 137,018 128,506 USD 86,493 Fannie Mae, 2.5%, September 01, 2050 119,952 113,023 USD 269 Fannie Mae, 3.5%, September 01, 2049 366 361 USD 50,459 Fannie Mae, 4%, January 01, 2050 70,638 68,535 USD 126,000 Florida Gas Transmission Co. LLC, 2.55%, July 01, 2030 169,711 161,527 USD 43,000 Florida Power & Light Co., 3.15%, October 01, 2049 60,949 57,599 USD 40,000 Fortress Transportation and Infrastructure Investors LLC, 5.5%, May 01, 2028 50,652 51,237
Number ofUnits/Sharesor Par Value Description
Average Cost($)
Fair Value($)
% of Net Assets

– 153 –
CI Global Asset Allocation Private Pool
Semi-Annual Financial Statements - September 30, 2021
Schedule of Investment Portfolio as at September 30, 2021 (unaudited) (cont’d)
Percentages shown relate investments at fair value to net assets attributable to holders of redeemable units of the Fund.
BONDS (cont’d) U.S.A. (cont’d)USD 402,000 Fortress Transportation and Infrastructure Investors LLC, 6.5%, October 01, 2025 525,915 525,777 USD 115,000 Fortress Transportation and Infrastructure Investors LLC, 9.75%, August 01, 2027 159,391 165,141 USD 91,705 Freddie Mac, 2.5%, August 01, 2050 127,269 119,835 USD 405,000 General Motors Co., 5.4%, October 02, 2023 554,801 559,563 USD 34,000 Genesis Energy L.P. / Genesis Energy Finance Corp, 8%, January 15, 2027 44,055 43,776 USD 70,000 Genworth Holdings Inc., 4.9%, August 15, 2023 81,082 90,752 USD 181,000 Glencore Funding LLC, 1.63%, April 27, 2026 225,490 228,137 USD 201,000 Glencore Funding LLC, 3.88%, April 27, 2051 259,650 266,112 USD 333,000 Glencore Funding LLC, 4.13%, May 30, 2023 458,261 446,140 USD 200,000 H&E Equipment Services Inc., 3.88%, December 15, 2028 252,681 253,003 USD 173,000 HCA Inc., 3.5%, September 01, 2030 230,146 232,355 USD 350,000 HCA Inc., 3.5%, July 15, 2051 430,459 440,713 USD 121,000 HCA Inc., 5.25%, June 15, 2049 186,321 195,525 USD 42,000 HCA Inc., 5.38%, September 01, 2026 61,985 60,932 USD 200,000 HCA Inc., 7.05%, December 01, 2027 295,798 316,200 USD 150,000 Hilton Domestic Operating Co. Inc., 3.63%, February 15, 2032 191,048 187,378 USD 170,000 Home Depot Inc. (The), 1.88%, September 15, 2031 213,691 211,249 USD 275,000 Home Depot Inc. (The), 2.75%, September 15, 2051 344,153 338,680 USD 229,000 Howard Hughes Corp. (The), 4.13%, February 01, 2029 294,497 291,139 USD 85,000 Howard Hughes Corp. (The), 4.38%, February 01, 2031 107,169 108,432 USD 34,000 Howard Hughes Corp. (The), 5.38%, August 01, 2028 45,433 45,433 USD 75,000 Hughes Satellite Systems Corp., 5.25%, August 01, 2026 99,542 107,226 USD 300,000 Imola Merger Corp., 4.75%, May 15, 2029 376,365 393,416 USD 7,000 International Flavors & Fragrances Inc., 1.83%, October 15, 2027 9,140 8,880 USD 3,000 International Flavors & Fragrances Inc., 3.47%, December 01, 2050 4,109 3,985 USD 70,000 Intuit Inc., 0.95%, July 15, 2025 95,264 88,575 USD 69,000 Intuit Inc., 1.65%, July 15, 2030 93,954 85,163 USD 15,000 Iron Mountain Inc., 4.5%, February 15, 2031 20,029 19,294 USD 104,000 Iron Mountain Inc., 4.88%, September 15, 2029 132,483 138,148 USD 60,000 Iron Mountain Inc., 5%, July 15, 2028 80,532 79,306 USD 123,000 Iron Mountain Inc., 5.25%, July 15, 2030 160,085 165,526 USD 164,000 iStar Inc., 4.25%, August 01, 2025 217,075 216,027 USD 97,000 iStar Inc., 5.5%, February 15, 2026 127,846 128,542 USD 350,000 JPMorgan Chase & Co., 1.58%, April 22, 2027 446,718 444,276 USD 241,000 JPMorgan Chase & Co., 2.78%, April 25, 2023 316,935 309,371 USD 161,000 JPMorgan Chase & Co., 3.9%, July 15, 2025 233,985 223,019 USD 297,000 JPMorgan Chase & Co., Series ‘HH’, Perpetual, 4.6%, February 01, 2025 383,798 385,114 USD 150,000 JPMorgan Chase & Co., Series ‘R’, Floating Rate, Perpetual, August 01, 2023 201,622 200,701 USD 100,000 JPMorgan Chase & Co., Series ‘S’, Perpetual, 6.75%, February 01, 2024 144,345 139,089 USD 30,000 Kennedy-Wilson Inc., 4.75%, March 01, 2029 38,430 38,710 USD 28,000 Kennedy-Wilson Inc., 5%, March 01, 2031 35,868 36,307 USD 110,000 Land O’Lakes Capital Trust I, 7.45%, March 15, 2028 164,115 161,751 USD 19,000 Lannett Co. Inc., 7.75%, April 15, 2026 23,870 22,177 USD 41,000 Laredo Petroleum Inc., 7.75%, July 31, 2029 51,322 52,125 USD 15,000 Leeward Renewable Energy Operations LLC, 4.25%, July 01, 2029 18,464 19,335 USD 20,000 Level 3 Financing Inc., 3.63%, January 15, 2029 25,237 24,597 USD 363,000 Marathon Oil Corp., 5.2%, June 01, 2045 490,313 548,380 USD 204,000 Marathon Petroleum Corp., 4.7%, May 01, 2025 289,923 288,463 USD 50,000 Match Group Holdings II LLC, 3.63%, October 01, 2031 63,810 62,592 USD 264,000 McDonald’s Corp., 3.35%, April 01, 2023 359,582 348,349 USD 129,000 MetLife Capital Trust IV, 7.88%, December 15, 2067 224,237 227,508 USD 222,000 Metropolitan Life Global Funding I, 0.9%, June 08, 2023 290,069 283,961 USD 65,000 MGM Growth Properties Operating Partnership L.P / MGP Finance Co-Issuer Inc, 4.5%, January 15, 2028 88,569 90,106 USD 98,000 MGM Resorts International, 4.63%, September 01, 2026 129,209 130,333 USD 130,000 MGM Resorts International, 4.75%, October 15, 2028 171,613 173,714
Number ofUnits/Sharesor Par Value Description
Average Cost($)
Fair Value($)
% of Net Assets

– 154 –
CI Global Asset Allocation Private Pool
Semi-Annual Financial Statements - September 30, 2021
Schedule of Investment Portfolio as at September 30, 2021 (unaudited) (cont’d)
Percentages shown relate investments at fair value to net assets attributable to holders of redeemable units of the Fund.
BONDS (cont’d) U.S.A. (cont’d)USD 315,000 MGM Resorts International, 5.5%, April 15, 2027 411,878 433,391 USD 188,000 Microsoft Corp., 3.3%, February 06, 2027 273,423 263,397 USD 50,000 Millennium Escrow Corp., 6.63%, August 01, 2026 63,000 65,306 USD 130,000 Morgan Stanley, Series ‘H’, Perpetual, 3.79%, July 15, 2021 164,937 166,145 USD 679,000 MPH Acquisition Holdings LLC, 5.5%, September 01, 2028 867,160 867,654 USD 311,000 MPH Acquisition Holdings LLC, 5.75%, November 01, 2028 405,551 371,653 USD 50,000 Nationstar Mortgage Holdings Inc., 5.13%, December 15, 2030 64,688 64,287 USD 98,000 Nationstar Mortgage Holdings Inc., 5.5%, August 15, 2028 130,570 128,019 USD 169,000 Nationstar Mortgage Holdings Inc., 6%, January 15, 2027 223,755 223,688 USD 210,000 Navient Corp., 4.88%, March 15, 2028 267,598 269,997 USD 333,000 Navient Corp., 5%, March 15, 2027 431,163 434,330 USD 180,000 Netflix Inc., 4.88%, June 15, 2030 262,424 268,741 USD 226,000 NextEra Energy Capital Holdings Inc., 2.25%, June 01, 2030 302,135 287,720 USD 366,000 NextEra Energy Capital Holdings Inc., 2.75%, May 01, 2025 510,410 488,961 USD 287,000 NGL Energy Operating LLC / NGL Energy Finance Corp, 7.5%, February 01, 2026 367,031 370,848 USD 254,000 NGL Energy Partners L.P. / NGL Energy Finance Corp, 7.5%, April 15, 2026 344,578 287,698 USD 60,000 Nielsen Finance LLC / Nielsen Finance Co., 4.5%, July 15, 2029 72,384 74,404 USD 60,000 Nielsen Finance LLC / Nielsen Finance Co., 4.75%, July 15, 2031 72,384 74,024 USD 40,000 Nielsen Finance LLC / Nielsen Finance Co., 5.63%, October 01, 2028 52,780 52,557 USD 24,000 Nielsen Finance LLC / Nielsen Finance Co., 5.88%, October 01, 2030 31,668 32,044 USD 211,000 NMI Holdings Inc., 7.38%, June 01, 2025 285,454 305,376 USD 30,000 Northern Oil and Gas Inc., 8.13%, March 01, 2028 37,879 40,654 USD 150,000 NVIDIA Corp., 2.85%, April 01, 2030 211,183 203,491 USD 13,000 Occidental Petroleum Corp., 3%, February 15, 2027 12,559 16,483 USD 25,000 Occidental Petroleum Corp., 3.2%, August 15, 2026 26,069 32,368 USD 50,000 Occidental Petroleum Corp., 6.13%, January 01, 2031 64,095 76,075 USD 10,000 Occidental Petroleum Corp., 6.63%, September 01, 2030 13,258 15,643 USD 4,000 Occidental Petroleum Corp., 8%, July 15, 2025 5,471 6,059 USD 208,000 Ortho-Clinical Diagnostics Inc. / Ortho-Clinical Diagnostics SA, 7.25%, February 01, 2028 278,242 282,353 USD 20,000 Outfront Media Capital LLC / Outfront Media Capital Corp, 4.25%, January 15, 2029 25,554 25,141 USD 100,000 Park Intermediate Holdings LLC / PK Domestic Property LLC / PK Finance Co-Issuer, 4.88%, May 15, 2029 120,965 129,985 USD 271,000 Park Intermediate Holdings LLC / PK Domestic Property LLC / PK Finance Co-Issuer, 5.88%, October 01, 2028 351,388 362,622 USD 27,000 Penn National Gaming Inc., 4.13%, July 01, 2029 33,269 33,844 USD 200,000 PennyMac Financial Services Inc., 4.25%, February 15, 2029 254,820 241,556 USD 333,000 PennyMac Financial Services Inc., 5.38%, October 15, 2025 450,068 434,305 USD 100,000 PennyMac Financial Services Inc., 5.75%, September 15, 2031 126,555 126,632 USD 54,000 Penske Truck Leasing Co. L.P. / PTL Finance Corp.,Callable, 3.95%, March 10, 2025 77,064 74,125 USD 73,000 PepsiCo Inc., 3.88%, March 19, 2060 115,677 112,275 USD 293,000 Pilgrim’s Pride Corp., 4.25%, April 15, 2031 394,191 399,226 USD 102,000 PNC Bank National Association, 2.7%, October 22, 2029 143,872 135,501 USD 315,000 PNC Financial Services Group Inc., Series ‘T’, Perpetual, 3.4%, September 15, 2026 399,641 398,979 USD 485,000 Rayonier A.M. Products Inc., 5.5%, June 01, 2024 584,128 615,069 USD 85,000 Rayonier AM Products Inc., 7.63%, January 15, 2026 110,447 113,919 USD 72,000 RHP Hotel Properties L.P. / RHP Finance Corp., 4.5%, February 15, 2029 91,928 91,502 USD 175,000 Rite Aid Corp., 7.7%, February 15, 2027 214,449 203,094 USD 203,000 Rite Aid Corp., 8%, November 15, 2026 270,965 259,429 USD 55,000 Rockcliff Energy II LLC, 5.5%, October 15, 2029 69,713 70,795 USD 169,000 Scientific Games International Inc., 5%, October 15, 2025 220,445 220,477 USD 602,000 Scientific Games International Inc., 7%, May 15, 2028 821,406 823,493 USD 266,000 Scientific Games International Inc., 7.25%, November 15, 2029 352,489 378,992 USD 413,000 Scientific Games International Inc., 8.25%, March 15, 2026 561,306 555,800 USD 14,000 Scientific Games International Inc., 8.63%, July 01, 2025 18,952 19,225 USD 241,000 Sempra Energy, Perpetual, 4.88%, October 15, 2025 325,475 331,960 USD 30,000 Service Properties Trust, 5.5%, December 15, 2027 39,776 40,508 USD 15,000 Six Flags Theme Parks Inc., 7%, July 01, 2025 20,863 20,258
Number ofUnits/Sharesor Par Value Description
Average Cost($)
Fair Value($)
% of Net Assets
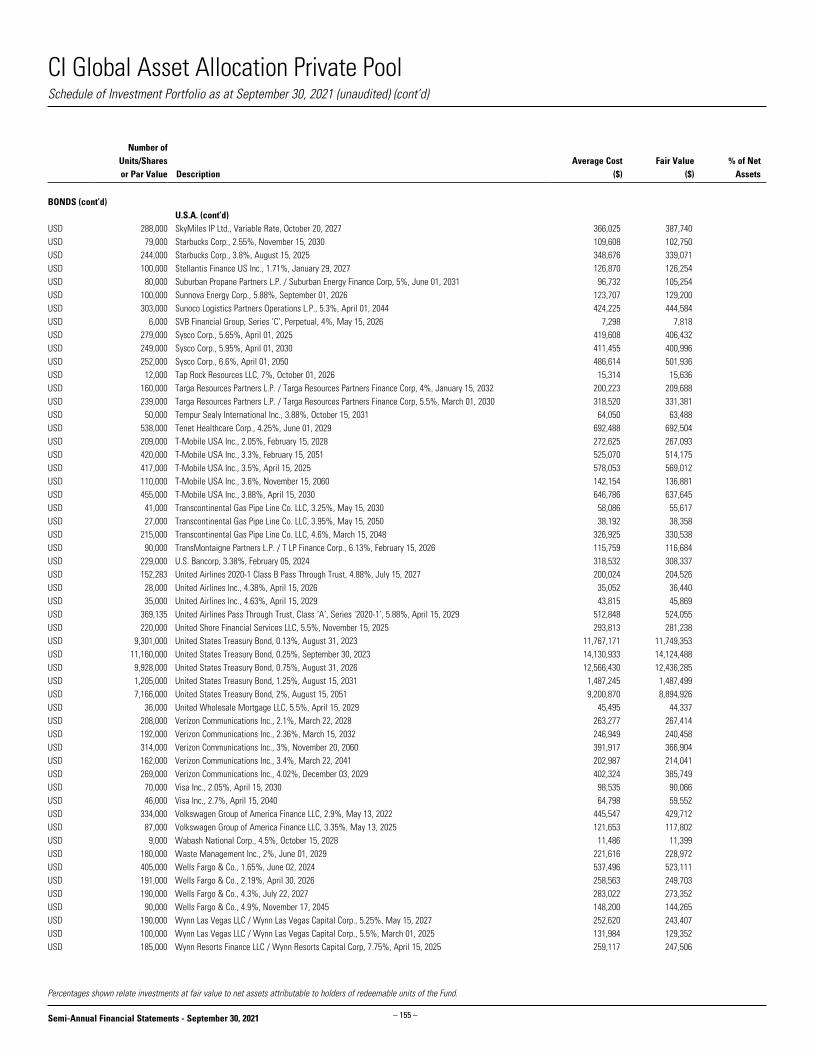
– 155 –
CI Global Asset Allocation Private Pool
Semi-Annual Financial Statements - September 30, 2021
Schedule of Investment Portfolio as at September 30, 2021 (unaudited) (cont’d)
BONDS (cont’d) U.S.A. (cont’d)USD 288,000 SkyMiles IP Ltd., Variable Rate, October 20, 2027 366,025 387,740 USD 79,000 Starbucks Corp., 2.55%, November 15, 2030 109,608 102,750 USD 244,000 Starbucks Corp., 3.8%, August 15, 2025 348,676 339,071 USD 100,000 Stellantis Finance US Inc., 1.71%, January 29, 2027 126,870 126,254 USD 80,000 Suburban Propane Partners L.P. / Suburban Energy Finance Corp, 5%, June 01, 2031 96,732 105,254 USD 100,000 Sunnova Energy Corp., 5.88%, September 01, 2026 123,707 129,200 USD 303,000 Sunoco Logistics Partners Operations L.P., 5.3%, April 01, 2044 424,225 444,584 USD 6,000 SVB Financial Group, Series ‘C’, Perpetual, 4%, May 15, 2026 7,298 7,818 USD 279,000 Sysco Corp., 5.65%, April 01, 2025 419,608 406,432 USD 249,000 Sysco Corp., 5.95%, April 01, 2030 411,455 400,996 USD 252,000 Sysco Corp., 6.6%, April 01, 2050 486,614 501,936 USD 12,000 Tap Rock Resources LLC, 7%, October 01, 2026 15,314 15,636 USD 160,000 Targa Resources Partners L.P. / Targa Resources Partners Finance Corp, 4%, January 15, 2032 200,223 209,688 USD 239,000 Targa Resources Partners L.P. / Targa Resources Partners Finance Corp, 5.5%, March 01, 2030 318,520 331,381 USD 50,000 Tempur Sealy International Inc., 3.88%, October 15, 2031 64,050 63,488 USD 538,000 Tenet Healthcare Corp., 4.25%, June 01, 2029 692,488 692,504 USD 209,000 T-Mobile USA Inc., 2.05%, February 15, 2028 272,625 267,093 USD 420,000 T-Mobile USA Inc., 3.3%, February 15, 2051 525,070 514,175 USD 417,000 T-Mobile USA Inc., 3.5%, April 15, 2025 578,053 569,012 USD 110,000 T-Mobile USA Inc., 3.6%, November 15, 2060 142,154 136,881 USD 455,000 T-Mobile USA Inc., 3.88%, April 15, 2030 646,786 637,645 USD 41,000 Transcontinental Gas Pipe Line Co. LLC, 3.25%, May 15, 2030 58,086 55,617 USD 27,000 Transcontinental Gas Pipe Line Co. LLC, 3.95%, May 15, 2050 38,192 38,358 USD 215,000 Transcontinental Gas Pipe Line Co. LLC, 4.6%, March 15, 2048 326,925 330,538 USD 90,000 TransMontaigne Partners L.P. / T LP Finance Corp., 6.13%, February 15, 2026 115,759 116,684 USD 229,000 U.S. Bancorp, 3.38%, February 05, 2024 318,532 308,337 USD 152,283 United Airlines 2020-1 Class B Pass Through Trust, 4.88%, July 15, 2027 200,024 204,526 USD 28,000 United Airlines Inc., 4.38%, April 15, 2026 35,052 36,440 USD 35,000 United Airlines Inc., 4.63%, April 15, 2029 43,815 45,869 USD 369,135 United Airlines Pass Through Trust, Class ‘A’, Series ‘2020-1’, 5.88%, April 15, 2029 512,848 524,055 USD 220,000 United Shore Financial Services LLC, 5.5%, November 15, 2025 293,813 281,238 USD 9,301,000 United States Treasury Bond, 0.13%, August 31, 2023 11,767,171 11,749,353 USD 11,160,000 United States Treasury Bond, 0.25%, September 30, 2023 14,130,933 14,124,488 USD 9,928,000 United States Treasury Bond, 0.75%, August 31, 2026 12,566,430 12,436,285 USD 1,205,000 United States Treasury Bond, 1.25%, August 15, 2031 1,487,245 1,487,499 USD 7,166,000 United States Treasury Bond, 2%, August 15, 2051 9,200,870 8,894,926 USD 36,000 United Wholesale Mortgage LLC, 5.5%, April 15, 2029 45,495 44,337 USD 208,000 Verizon Communications Inc., 2.1%, March 22, 2028 263,277 267,414 USD 192,000 Verizon Communications Inc., 2.36%, March 15, 2032 246,949 240,458 USD 314,000 Verizon Communications Inc., 3%, November 20, 2060 391,917 366,904 USD 162,000 Verizon Communications Inc., 3.4%, March 22, 2041 202,987 214,041 USD 269,000 Verizon Communications Inc., 4.02%, December 03, 2029 402,324 385,749 USD 70,000 Visa Inc., 2.05%, April 15, 2030 98,535 90,066 USD 46,000 Visa Inc., 2.7%, April 15, 2040 64,798 59,552 USD 334,000 Volkswagen Group of America Finance LLC, 2.9%, May 13, 2022 445,547 429,712 USD 87,000 Volkswagen Group of America Finance LLC, 3.35%, May 13, 2025 121,653 117,802 USD 9,000 Wabash National Corp., 4.5%, October 15, 2028 11,486 11,399 USD 180,000 Waste Management Inc., 2%, June 01, 2029 221,616 228,972 USD 405,000 Wells Fargo & Co., 1.65%, June 02, 2024 537,496 523,111 USD 191,000 Wells Fargo & Co., 2.19%, April 30, 2026 258,563 249,703 USD 190,000 Wells Fargo & Co., 4.3%, July 22, 2027 283,022 273,352 USD 90,000 Wells Fargo & Co., 4.9%, November 17, 2045 148,200 144,265 USD 190,000 Wynn Las Vegas LLC / Wynn Las Vegas Capital Corp., 5.25%, May 15, 2027 252,620 243,407 USD 100,000 Wynn Las Vegas LLC / Wynn Las Vegas Capital Corp., 5.5%, March 01, 2025 131,984 129,352 USD 185,000 Wynn Resorts Finance LLC / Wynn Resorts Capital Corp, 7.75%, April 15, 2025 259,117 247,506
Percentages shown relate investments at fair value to net assets attributable to holders of redeemable units of the Fund.
Number ofUnits/Sharesor Par Value Description
Average Cost($)
Fair Value($)
% of Net Assets

– 156 –
CI Global Asset Allocation Private Pool
Semi-Annual Financial Statements - September 30, 2021
Schedule of Investment Portfolio as at September 30, 2021 (unaudited) (cont’d)
BONDS (cont’d) U.S.A. (cont’d)USD 205,000 XHR L.P., 4.88%, June 01, 2029 251,151 267,012 USD 303,000 Zayo Group Holdings Inc., 4%, March 01, 2027 399,415 382,429 108,524,622 107,481,029 18.49Total Bonds 146,678,356 146,016,341 25.11 EXCHANGE-TRADED FUND(S) USD 12,417 iShares iBoxx $ Investment Grade Corporate Bond ETF 2,111,043 2,092,212 0.36Adjustment for transaction costs (189,309)Total Investments 492,243,841 528,533,833 90.88 Fair value of long option contract(s) 45,852 0.01Unrealized gain (loss) on forward foreign currency contract(s) (1,121,240) (0.19)Other Net Assets (Liabilities) 54,119,176 9.30Net Assets Attributable to Holders of Redeemable Units 581,577,621 100.00
Percentages shown relate investments at fair value to net assets attributable to holders of redeemable units of the Fund.
Number ofUnits/Sharesor Par Value Description
Average Cost($)
Fair Value($)
% of Net Assets

– 157 –
CI Global Asset Allocation Private Pool
Semi-Annual Financial Statements - September 30, 2021
*Credit rating provided by S&P Global Ratings.
Forward Foreign Currency Contract(s)
CounterpartyCredit Rating of the Counterparty* Settlement Date
Currency Buy Position
Currency Sell Position
Contract(s) Rate
Unrealized Gain (Loss) ($)
Bank of Montreal A-1 November 18, 2021 CAD 4,230,229 USD 3,368,889 1.26 (37,083)Bank of Montreal A-1 December 15, 2021 CAD 2,137,850 USD 1,688,051 1.27 (271)Canadian Imperial Bank of Commerce A-1 October 20, 2021 CAD 122,926 USD 97,221 1.26 (217)Canadian Imperial Bank of Commerce A-1 October 20, 2021 CAD 3,595,770 USD 2,876,190 1.25 (47,297)Canadian Imperial Bank of Commerce A-1 November 18, 2021 CAD 4,236,961 USD 3,368,067 1.26 (29,311)Canadian Imperial Bank of Commerce A-1 December 14, 2021 EUR 6,200,000 USD 7,362,469 0.84 (214,939)Canadian Imperial Bank of Commerce A-1 December 15, 2021 CAD 1,522,094 USD 1,205,751 1.26 (5,135)Citibank N.A., New York A-1 October 20, 2021 CAD 7,167,432 USD 5,752,381 1.25 (118,702)Citibank N.A., New York A-1 November 18, 2021 CAD 4,227,291 USD 3,368,478 1.25 (39,500)Goldman Sachs & Co., New York A-1 October 20, 2021 CAD 4,795,511 USD 3,834,920 1.25 (61,912)Goldman Sachs & Co., New York A-1 November 18, 2021 CAD 2,633,002 USD 2,105,299 1.25 (33,743)Goldman Sachs & Co., New York A-1 December 15, 2021 CAD 1,518,969 USD 1,205,751 1.26 (8,260)HSBC Bank, Toronto A-1 October 20, 2021 CAD 3,718,610 USD 2,984,438 1.25 (61,567)HSBC Bank, Toronto A-1 November 18, 2021 CAD 2,639,308 USD 2,105,299 1.25 (27,437)HSBC Bank, Toronto A-1 December 15, 2021 CAD 2,599,818 USD 2,041,258 1.27 14,318 JPMorgan Chase Bank, New York A-1 October 20, 2021 CAD 7,215,936 USD 5,752,381 1.25 (70,198)JPMorgan Chase Bank, New York A-1 November 18, 2021 CAD 2,377,262 USD 1,894,769 1.25 (22,808)JPMorgan Chase Bank, New York A-1 December 14, 2021 GBP 119,000 USD 165,412 0.72 (6,399)JPMorgan Chase Bank, New York A-1 December 15, 2021 CAD 1,511,825 USD 1,205,751 1.25 (15,404)Morgan Stanley & Co. International PLC A-1 October 20, 2021 CAD 10,729,628 USD 8,628,571 1.24 (199,574)Morgan Stanley & Co. International PLC A-1 December 14, 2021 USD 2,768,982 GBP 2,008,000 1.38 79,911 Morgan Stanley & Co. International PLC A-1 December 15, 2021 CAD 2,138,170 USD 1,688,051 1.27 49 Royal Bank of Canada A-1+ October 20, 2021 CAD 7,167,380 USD 5,752,381 1.25 (118,754)Royal Bank of Canada A-1+ November 18, 2021 CAD 3,444,622 USD 2,758,677 1.25 (49,746)Royal Bank of Canada A-1+ December 15, 2021 CAD 1,519,077 USD 1,205,751 1.26 (8,152)Toronto-Dominion Bank (The) A-1+ November 18, 2021 CAD 2,376,855 USD 1,894,769 1.25 (23,216)Toronto-Dominion Bank (The) A-1+ December 15, 2021 CAD 1,511,337 USD 1,205,751 1.25 (15,893)Total Foreign Currency Forward Contract(s) Value (1,121,240)
Long Option Contract(s)
Number of Contract(s) Underlying Security (100 shares per contract)
Strike Price($) Expiry Date
Proceeds ($)
Fair Value($)
1,097 SPDR Gold Shares 170.00 October 15, 2021 569,345 45,852Total Long Option Contract(s) Value 569,345 45,852
Schedule of Investment Portfolio as at September 30, 2021 (unaudited) (cont’d)

– 158 –
CI Global Asset Allocation Private Pool
Semi-Annual Financial Statements - September 30, 2021
The accompanying notes are an integral part of these financial statements.
Fund Specific Notes to Financial Statements (unaudited)
Offsetting of Financial Instruments (Note 2)
The following tables show the net impact on the Fund’s Statements of Financial Position if all rights to offset were exercised.
as at September 30, 2021Amounts Eligible for Offset
Gross Assets/(Liabilities)
FinancialInstruments
CollateralReceived/(Paid)
NetExposure
(in $000’s) (in $000’s) (in $000’s) (in $000’s)Derivative assets - Foreign currency forward contracts 94 (94) - -Derivative assets - Swaps and swaptions - - - -Total 94 (94) - -Derivative liabilities - Foreign currency forward contracts (1,215) 94 - (1,121)Derivative liabilities - Swaps and swaptions - - - -Total (1,215) 94 - (1,121)
as at March 31, 2021Amounts Eligible for Offset
Gross Assets/(Liabilities)
FinancialInstruments
CollateralReceived/(Paid)
NetExposure
(in $000’s) (in $000’s) (in $000’s) (in $000’s)Derivative assets - Foreign currency forward contracts 1,201 (273) - 928Derivative assets - Swaps and swaptions - - - -Total 1,201 (273) - 928Derivative liabilities - Foreign currency forward contracts (280) 273 - (7)Derivative liabilities - Swaps and swaptions - - - -Total (280) 273 - (7)

– 159 –
CI Global Asset Allocation Private Pool
Semi-Annual Financial Statements - September 30, 2021
The accompanying notes are an integral part of these financial statements.
Fund Specific Notes to Financial Statements (unaudited)
Interest in Unconsolidated Structured Entities (Note 2)
The following tables present the Fund’s interest in Unconsolidated Structured Entities.
as at September 30, 2021 Fair Value of
the Underlying Fund(s) / ETF(s)Fair Value of the Fund’s Investment
in the Underlying Fund(s) / ETF(s)Ownership in the
Underlying Fund(s) / ETF(s)
Unconsolidated Structured Entities (in $000’s) (in $000’s) (%)iShares iBoxx $ Investment Grade Corporate Bond ETF 50,245,447 2,092 -
as at March 31, 2021 Fair Value of
the Underlying Fund(s) / ETF(s)Fair Value of the Fund’s Investment
in the Underlying Fund(s) / ETF(s)Ownership in the
Underlying Fund(s) / ETF(s)
Unconsolidated Structured Entities (in $000’s) (in $000’s) (%)iShares iBoxx $ Investment Grade Corporate Bond ETF 52,658,382 2,209 -

– 160 –
CI Global Asset Allocation Private Pool
Semi-Annual Financial Statements - September 30, 2021
Fund Specific Notes to Financial Statements (unaudited)
†A portion of brokerage commissions paid was used to cover research and market data services, termed soft dollar commissions. This amount has been estimated by the Manager of the Fund.The accompanying notes are an integral part of these financial statements.
Commissions (Note 2)for the periods ended September 30 (in $000’s)
2021 2020Brokerage commissions 239 113Soft dollar commissions† 100 50
Redeemable Unit Transactions (Note 4)for the periods ended September 30
Number of redeemable units at the beginning of periodRedeemable units issued for cashRedeemable units issued for reinvested distributionsRedeemable units issued due to acquisition of assets from terminated fundsRedeemable units redeemedNumber of redeemable units at the end of period
Series A 2021 2020 17,418,635 6,106,498 7,117,587 2,528,600 15,148 6,289 - - (1,325,800) (931,478) 23,225,570 7,709,909
Series F 2021 2020 16,930,207 9,229,962 7,101,943 3,156,106 66,870 39,972 - - (1,334,683) (1,444,421) 22,764,337 10,981,619
Series I 2021 2020 102 1,039 - 9,301 1 12 - - - (10,254) 103 98
ETF C$ Series 2021 2020 652,392 - - - - - - 752,392 - - 652,392 752,392

– 161 –
CI Global Asset Allocation Private Pool
Semi-Annual Financial Statements - September 30, 2021
The accompanying notes are an integral part of these financial statements.
Fund Specific Notes to Financial Statements (unaudited)
Management and Administration Fees (Note 5) as at September 30, 2021 (%)
Annual management
fee rate:
Annual administration
fee rate:
Series A 1.600 0.15Series F 0.600 0.15Series I Paid directly by investor Paid directly by investorETF C$ Series 0.600 0.15
Securities Lending (Note 6)as at September 30 (in $000’s)
2021 2020Loaned 17,071 -Collateral (non-cash) 17,933 -
Securities Lending Revenue Reconciliation (Note 6)for the periods ended September 30 (in $000’s)
2021 2020Gross securities lending revenue 43 10Charges (18) (1)Securities lending revenue 25 9Charges as a % of gross securities lending revenue 41.7 88.5

– 162 –
CI Global Asset Allocation Private Pool
Semi-Annual Financial Statements - September 30, 2021
The accompanying notes are an integral part of these financial statements.
Credit RiskThe Fund was invested in fixed income securities, preferred securities and derivative instruments, if any, with the following credit ratings, as per the tables below.
as at September 30, 2021Credit Rating^* Net Assets (%)AAA/Aaa/A++ 8.4AA/Aa/A+ 0.2A 1.4BBB/Baa/B++ 5.3BB/Ba/B+ 4.6B 4.2CCC/Caa/C++ 0.7Not Rated 0.1Total 24.9
as at March 31, 2021Credit Rating^* Net Assets (%)AAA/Aaa/A++ 8.5AA/Aa/A+ 0.6A 1.1BBB/Baa/B++ 6.3BB/Ba/B+ 3.8B 3.7CCC/Caa/C++ 1.2Not Rated 0.2Total 25.4
^Credit ratings are obtained from S&P Global Ratings, where available, otherwise ratings are obtained from: Moody’s
Investors Service or Dominion Bond Rating Service, respectively.
*Refer to Note 10 for Credit Rating Chart reference.
Other Price RiskAs at September 30, 2021 and March 31, 2021, the Fund was invested in global equities and therefore was sensitive to changes in general economic conditions across the world.
As at September 30, 2021, had the fair value of equities in the investment portfolio increased or decreased by 10% (March 31, 2021 - 10%), with all other variables held constant, net assets attributable to holders of redeemable units of the Fund would have increased or decreased, respectively, by approximately $38,252,000 (March 31, 2021 - $27,516,000). In practice, actual results may differ from this analysis and the difference may be material.
Financial Instruments Risks (Note 10)
Concentration RiskFor Concentration Risk as at September 30, 2021, refer to the Schedule of Investment Portfolio.
The table below summarizes the Fund’s exposure to concentration risk.
as at March 31, 2021Categories Net Assets (%)Equities - U.S.A. 37.1 Bonds - U.S.A. 17.2 Other Net Assets (Liabilities) 10.8 Equities - Canada 5.9 Equities - Germany 4.1 Equities - Netherlands 3.5 Bonds - Canada 3.1 Equities - France 2.3 Equities - Switzerland 2.2 Equities - China 1.7 Equities - Bermuda 1.5 Equities - Norway 1.5 Equities - Ireland 1.4 Equities - Guernsey 1.2 Equities - Italy 0.9 Equities - Australia 0.8 Bonds - U.K. 0.7 Equities - Mexico 0.7 Equities - Macau 0.6 Exchange-Traded Fund(s) 0.5 Bonds - Switzerland 0.5 Bonds - Cayman Islands 0.4 Bonds - Liberia 0.3 Bonds - Panama 0.3 Unrealized gain (loss) on forward foreign currency contract(s) 0.2 Bonds - British Virgin Islands 0.2 Bonds - Netherlands 0.2 Bonds - Bermuda 0.1 Bonds - Asset-Backed Securities - U.S.A 0.1 Bonds -Term Loans - U.S.A. 0.1 Bonds - Bahamas 0.1 Bonds - Germany 0.1 Bonds - Luxembourg 0.1 Bonds - France 0.1 Bonds - Ireland 0.0 Total 100.0
Fund Specific Notes to Financial Statements (unaudited)

– 163 –
CI Global Asset Allocation Private Pool
Semi-Annual Financial Statements - September 30, 2021
The accompanying notes are an integral part of these financial statements.
Interest Rate Risk (cont’d)
as at March 31, 2021
Less than1 Year
1 - 3Years
3 - 5Years
Greaterthan
5 Years Total
(in $000’s) (in $000’s) (in $000’s) (in $000’s) (in $000’s)Interest Rate Exposure 282 6,117 47,433 44,663 98,495
As at September 30, 2021, had the prevailing interest rates increased or decreased by 0.25% (March 31, 2021 - 0.25%), with all other variables held constant, net assets attributable to holders of redeemable units of the Fund would have decreased or increased, respectively, by approximately $2,560,000 (March 31, 2021 - $1,758,000). In practice, actual results may differ from this analysis and the difference may be material.
Fair Value Hierarchy
The tables below summarize the inputs used by the Fund in valuing the Fund’s investments and derivatives carried at fair value.
Long Positions at fair value as at September 30, 2021Level 1 Level 2 Level 3 Total
(in $000’s) (in $000’s) (in $000’s) (in $000’s)Equities 380,425 - - 380,425 Bonds - 145,949 67 146,016 Exchange-Traded Fund(s) 2,092 - - 2,092 Derivatives, net 46 (1,121) - (1,075) Total 382,563 144,828 67 527,458
Long Positions at fair value as at March 31, 2021Level 1 Level 2 Level 3 Total
(in $000’s) (in $000’s) (in $000’s) (in $000’s)Equities 272,650 - 299 272,949 Bonds - 98,429 67 98,496 Exchange-Traded Fund(s) 2,209 - - 2,209 Derivatives, net - 921 - 921 Total 274,859 99,350 366 374,575
There were no transfers between Level 1, 2 and 3 during the period ended September 30, 2021 and the year ended March 31, 2021.
Currency RiskThe tables below summarize the Fund’s exposure to currency risk.
as at September 30, 2021~
Currency
Financial Instruments Exposure Derivatives
Net Exposure
Net Assets
(%)(in $000’s) (in $000’s) (in $000’s)U.S. Dollar 375,239 (92,100) 283,139 48.7 Euro 71,547 9,111 80,658 13.9 Swiss Franc 10,630 - 10,630 1.8 Hong Kong Dollar 6,993 - 6,993 1.2 Norwegian Krone 6,687 - 6,687 1.1 Australian Dollar 4,841 - 4,841 0.8 Mexican Peso 4,582 - 4,582 0.8 British Pound 6,958 (3,224) 3,734 0.6 Japanese Yen 22 - 22 0.0 Total 487,499 (86,213) 401,286 68.9
as at March 31, 2021~
Currency
Financial Instruments Exposure Derivatives
Net Exposure
Net Assets
(%)(in $000’s) (in $000’s) (in $000’s)U.S. Dollar 274,150 (87,361) 186,789 44.50Euro 50,263 9,149 59,412 14.20Swiss Franc 6,570 - 6,570 1.60Norwegian Krone 6,152 - 6,152 1.50Hong Kong Dollar 6,039 - 6,039 1.40Australian Dollar 3,200 - 3,200 0.80British Pound 6,592 (3,254) 3,338 0.80Mexican Peso 2,754 - 2,754 0.70Japanese Yen 21 - 21 0.00Total 355,741 (81,466) 274,275 65.50
~Includes monetary and non-monetary instruments, if any.
As at September 30, 2021, had the Canadian dollar strengthened or weakened by 10% (March 31, 2021 - 10%) in relation to all other foreign currencies held in the Fund, with all other variables held constant, net assets attributable to holders of redeemable units of the Fund would have decreased or increased, respectively, by approximately $40,129,000 (March 31, 2021 - $27,428,000). In practice, actual results may differ from this analysis and the difference may be material.
Interest Rate RiskThe tables below summarize the Fund’s exposure to interest rate risk, categorized by the contractual maturity date.
as at September 30, 2021
Less than1 Year
1 - 3Years
3 - 5Years
Greaterthan
5 Years Total
(in $000’s) (in $000’s) (in $000’s) (in $000’s) (in $000’s)Interest Rate Exposure 1,554 37,113 32,121 75,228 146,016
Fund Specific Notes to Financial Statements (unaudited)

– 164 –
CI Global Asset Allocation Private Pool
Semi-Annual Financial Statements - September 30, 2021
Level 3 ReconciliationThe tables below summarize the movement in financial instruments classified as Level 3.
for the period ended September 30, 2021 Balance at
Mar. 31, 2021 Purchases SalesTransfers
InTransfers
(Out)Realized Gain
(Loss)Unrealized Gain
(Loss)*Balance at
Sept. 30, 2021(in $000’s) (in $000’s) (in $000’s) (in $000’s) (in $000’s) (in $000’s) (in $000’s) (in $000’s)
Long Positions/Assets:Equities 299 - (389) - - 133 (43) - Bonds 67 - - - - - - 67 Total 366 - (389) - - 133 (43) 67
*Change in unrealized gain (loss) related to investments held at September 30, 2021 was ($13,000).
for the year ended March 31, 2021 Balance at
Mar. 31, 2021 Purchases SalesTransfers
InTransfers
(Out)Realized Gain
(Loss)Unrealized Gain
(Loss)**Balance at
Sept. 30, 2021(in $000’s) (in $000’s) (in $000’s) (in $000’s) (in $000’s) (in $000’s) (in $000’s) (in $000’s)
Long Positions/Assets:Equities - 259 (3) - - - 43 299 Bonds - 54 - - - - 13 67Total - 313 (3) - - - 56 366
**Change in unrealized gain (loss) related to investments held at March 31, 2021 was $56,000.
Investments classified as Level 3 are valued at fair value based on unobservable inputs and assumptions, which may include credit spreads, industry multipliers, and discount rates. Management has assessed that the effect of changing these inputs to reasonably possible alternatives would not have a significant impact on the net assets attributable to holders of redeemable units of the Fund as at September 30, 2021 and March 31, 2021.
Fund Specific Notes to Financial Statements (unaudited)
The accompanying notes are an integral part of these financial statements.

– 165 –
CI Global Balanced Yield Private Pool
Semi-Annual Financial Statements - September 30, 2021
Statements of Financial Position (in $000’s except for per unit amounts and units outstanding)
as at as at Sept. 30, 2021 Mar. 31, 2021 51,302 42,983 - - 89 70
- 53 - - - - - - - - - - - - - - - - 6 3 430 260 51,827 43,369
- - - -
43 6 - - - - - - - - - 178 2 7 - - - - - - - - 45 191
51,782 43,178
Statements of Financial Position (cont’d)(in $000’s except for per unit amounts and units outstanding)
Net assets attributable to holders of redeemable units
per Series (Note 4):
Net assets attributable to holders of redeemable
units per unit: Number of redeemable
units outstanding:
as at Sept. 30, 2021
as at Mar. 31, 2021
as at Sept. 30, 2021
as at Mar. 31, 2021
as at Sept. 30, 2021
as at Mar. 31, 2021
Series A 29,271 26,327 11.06 10.47 2,647,158 2,515,631Series F 22,510 16,850 11.21 10.59 2,007,651 1,591,488Series I 1 1 11.31 10.67 108 107
AssetsCurrent assetsInvestmentsInvestments pledged as collateralCashUnrealized gain on futures and foreign currency forward contractsSwaps, swaptions and optionsDaily variation margin on derivative instrumentsFees rebate receivableCash collateral on deposit for short saleDividends receivableInterest receivableReceivable for distribution from investmentsSecurities lending revenue receivable (Note 6)Receivable for investments soldReceivable for unit subscriptions
LiabilitiesCurrent liabilitiesInvestments sold shortBank overdraftUnrealized loss on futures and foreign currency forward contractsSwaps, swaptions and options Dividends payable on investments sold shortInterest payable on investments sold shortDaily variation margin on derivative instrumentsPayable for investments purchasedPayable for unit redemptionsDistributions payable to holders of redeemable units Management fees payableAdministration fees payableAccounts payable and accrued liabilities
Net assets attributable to holders of redeemable units
The accompanying notes are an integral part of these financial statements.
Financial Statements (unaudited)
CIG - 2053

– 166 –
CI Global Balanced Yield Private Pool
Semi-Annual Financial Statements - September 30, 2021
Statements of Comprehensive Incomefor the periods ended September 30(in $000’s except for per unit amounts and number of units)
2021 2020
- - - - - - - - - -
- - - -
235 (128)
2,936 4,728 3,171 4,600 - - - - - - - - - - 3,171 4,600
287 198 36 25 - - 1 1 - - - - - - - - - - 26 16 - - 350 240
2,821 4,360
The accompanying notes are an integral part of these financial statements.
Financial Statements (unaudited)
Statements of Comprehensive Income (cont’d)for the periods ended September 30(in $000’s except for per unit amounts and number of units)
Increase (decrease) in net assets attributable to
holders of redeemable units per Series:
Increase (decrease) in net assets attributable to
holders of redeemable units per unit:
Weighted average number of units:
2021 2020 2021 2020 2021 2020Series A 1,631 2,239 0.63 1.17 2,582,564 1,914,569Series F 1,190 2,120 0.65 1.41 1,798,862 1,500,771Series I - 1 0.75 2.35 108 336
Income Net gain (loss) on investments and derivatives Dividends Interest for distribution purposes Income distributions from investments Capital gain distributions from investments Derivative income (loss) Dividends expense on financial assets (liabilities) sold
short Interest expense on financial assets (liabilities) sold short Net realized gain (loss) on sale of investments and
derivatives Change in unrealized appreciation (depreciation) in value
of investments and derivativesTotal net gain (loss) on investments and derivativesOther income Foreign exchange gain (loss) on cash Commitment fee income Securities lending revenue (Note 6) Fees rebateTotal other incomeTotal incomeExpensesManagement fees (Note 5)Administration fees (Note 5)Commissions and other portfolio transaction costsIndependent review committee feesSecurities borrowing fees (Note 2)Margin feesService feesInterest expenseWithholding taxesHarmonized sales taxOther expensesTotal expensesIncrease (decrease) in net assets attributable to holders of redeemable units

– 167 –
CI Global Balanced Yield Private Pool
Semi-Annual Financial Statements - September 30, 2021
Statements of Changes in Net Assets Attributable to Holders of Redeemable Unitsfor the periods ended September 30 (in $000’s)
Net assets attributable to holders of redeemable units at the beginning of periodIncrease (decrease) in net assets attributable to holders of redeemable unitsDistributions to holders of redeemable units From net investment income From net realized gains Return of capitalTotal distributions to holders of redeemable units
Redeemable unit transactions Proceeds from redeemable units issued Reinvestment of distributions to holders of redeemable units Redemption of redeemable unitsNet increase (decrease) from redeemable unit transactionsNet increase (decrease) in net assets attributable to holders of redeemable unitsNet assets attributable to holders of redeemable units at the end of period
The accompanying notes are an integral part of these financial statements.
Financial Statements (unaudited)
Series A 2021 2020 26,327 16,765 1,631 2,239
(116) (899) - (46) - - (116) (945)
3,142 3,789 113 923 (1,826) (1,319) 1,429 3,393 2,944 4,687 29,271 21,452
Series F 2021 2020 16,850 21,121 1,190 2,120
(144) (725) - (57) - - (144) (782)
5,734 3,039 136 697 (1,256) (11,849) 4,614 (8,113) 5,660 (6,775) 22,510 14,346
Series I 2021 2020 1 11 - 1
- - - - - - - -
- - - - - (11) - (11) - (10) 1 1
Total Fund 2021 2020 43,178 37,897 2,821 4,360
(260) (1,624) - (103) - - (260) (1,727)
8,876 6,828 249 1,620 (3,082) (13,179) 6,043 (4,731) 8,604 (2,098) 51,782 35,799

– 168 –
CI Global Balanced Yield Private Pool
Semi-Annual Financial Statements - September 30, 2021
Statements of Cash Flowsfor the periods ended September 30 (in $000’s)
2021 2020
2,821 4,360
(235) 128 - - - -
(2,936) (4,728) 2,990 13,018 (8,229) (6,521) - - - - - - - - - - - - - - - - - - (5,589) 6,257
(11) (107) 8,159 6,884 (2,540) (13,067) 5,608 (6,290)
- - 19 (33) 70 261 89 228
- - - - - - - - - -
*Dividends and interest received as well as dividends and interest paid relate to operating activities of the Fund. The accompanying notes are an integral part of these financial statements.
Financial Statements (unaudited)
Cash flows from (used in) operating activitiesIncrease (decrease) in net assets attributable to holders of redeemable unitsAdjustments for: Net realized (gain) loss on sale of investments and derivatives Unrealized foreign exchange (gain) loss on cash Commissions and other portfolio transaction costs Change in unrealized (appreciation) depreciation in value of
investments and derivatives Proceeds from sale and maturity of investments and derivatives Purchase of investments and derivatives (Increase) decrease in cash collateral on deposit for short sale Non-cash distributions from investments Change in daily variation margin (Increase) decrease in dividends receivable (Increase) decrease in interest receivable (Increase) decrease in securities lending revenue receivable Increase (decrease) in management fees payable Increase (decrease) in administration fees payable Change in other accounts receivable and payableNet cash from (used in) operating activities
Cash flows from (used in) financing activitiesDistributions paid to holders of redeemable units, net of reinvested distributionsProceeds from issuance of redeemable unitsAmounts paid on redemption of redeemable unitsNet cash from (used in) financing activities Unrealized foreign exchange gain (loss) on cashNet increase (decrease) in cashCash (bank overdraft), beginning of periodCash (bank overdraft), end of period
Supplementary Information:Dividends received, net of withholding tax*Interest received, net of withholding tax*Dividends paid*Interest paid*Tax recoverable (paid)

– 169 –
CI Global Balanced Yield Private Pool
Semi-Annual Financial Statements - September 30, 2021
‡Credit ratings are obtained from S&P Global Ratings, where available, otherwise ratings are obtained from: Moody’s Investors Service or Dominion Bond Rating Service.Percentages shown relate investments at fair value to net assets attributable to holders of redeemable units of the Fund.
Schedule of Investment Portfolio as at September 30, 2021 (unaudited)
Number of Units Description Average Cost
($)Fair Value
($)% of Net
Assets
UNDERLYING FUND(S) 371,161 CI Canadian Equity Income Private Trust (Series I) 4,292,209 5,554,130 1,827,131 CI Global Core Fixed Income Private Trust (Series I) 19,056,357 17,631,635 391,908 CI Global High Yield Fixed Income Private Trust (Series I) 3,877,352 3,962,030 815,794 CI International Equity Income Private Trust (Series I) 9,895,510 11,877,880 912,955 CI U.S. Equity Private Trust (Series I) 10,654,857 12,276,051 47,776,285 51,301,726 99.07Total Investment Portfolio before Derivative Instruments 47,776,285 51,301,726 99.07Foreign Currency Forward Contract(s) (see Schedule A) (43,468) (0.08)Total Investment Portfolio 47,776,285 51,258,258 98.99Other Net Assets (Liabilities) 523,674 1.01Net Assets Attributable to Holders of Redeemable Units 51,781,932 100.00
Schedule AForeign Currency Forward Contract(s)
CounterpartyCredit Rating of the Counterparty‡ Settlement Date
Currency Buy Position
Currency Sell Position
Contract(s) Rate
Unrealized Gain (Loss) ($)
Bank of Montreal A-1 November 18, 2021 CAD 403,682 USD 321,486 1.26 (3,537)Bank of Montreal A-1 December 15, 2021 CAD 2,724 USD 2,151 1.27 0 Canadian Imperial Bank of Commerce A-1 October 20, 2021 CAD 97,345 USD 77,865 1.25 (1,280)Canadian Imperial Bank of Commerce A-1 October 20, 2021 CAD 157 USD 124 1.26 0 Canadian Imperial Bank of Commerce A-1 November 18, 2021 CAD 404,325 USD 321,408 1.26 (2,795)Canadian Imperial Bank of Commerce A-1 December 15, 2021 CAD 1,939 USD 1,536 1.26 (6)Citigroup Inc. A-2 October 20, 2021 CAD 194,038 USD 155,729 1.25 (3,213)Citigroup Inc. A-2 November 18, 2021 CAD 403,402 USD 321,447 1.25 (3,767)Goldman Sachs Group Inc. A-2 October 20, 2021 CAD 129,825 USD 103,819 1.25 (1,676)Goldman Sachs Group Inc. A-2 November 18, 2021 CAD 251,262 USD 200,904 1.25 (3,218)Goldman Sachs Group Inc. A-2 December 15, 2021 CAD 1,935 USD 1,536 1.26 (10)HSBC Holdings PLC A-1 October 20, 2021 CAD 100,671 USD 80,795 1.25 (1,667)HSBC Holdings PLC A-1 November 18, 2021 CAD 251,864 USD 200,904 1.25 (2,617)HSBC Holdings PLC A-1 December 15, 2021 CAD 3,313 USD 2,601 1.27 18 JPMorgan Chase & Co. A-2 October 20, 2021 CAD 195,351 USD 155,729 1.25 (1,900)JPMorgan Chase & Co. A-2 November 18, 2021 CAD 226,857 USD 180,814 1.25 (2,175)JPMorgan Chase & Co. A-2 December 15, 2021 CAD 1,926 USD 1,536 1.25 (20)Morgan Stanley A-2 October 20, 2021 CAD 290,474 USD 233,594 1.24 (5,402)Morgan Stanley A-2 December 15, 2021 CAD 2,724 USD 2,151 1.27 0 Royal Bank of Canada A-1+ October 20, 2021 CAD 194,036 USD 155,729 1.25 (3,214)Royal Bank of Canada A-1+ November 18, 2021 CAD 328,713 USD 263,255 1.25 (4,745)Royal Bank of Canada A-1+ December 15, 2021 CAD 1,936 USD 1,536 1.26 (10)Toronto-Dominion Bank A-1+ November 18, 2021 CAD 226,818 USD 180,814 1.25 (2,214)Toronto-Dominion Bank A-1+ December 15, 2021 CAD 1,926 USD 1,536 1.25 (20) Total Foreign Currency Forward Contract(s) Value (43,468)

– 170 –
CI Global Balanced Yield Private Pool
Semi-Annual Financial Statements - September 30, 2021
The accompanying notes are an integral part of these financial statements.
Fund Specific Notes to Financial Statements (unaudited)
Offsetting of Financial Instruments (Note 2)
The following tables show the net impact on the Fund’s Statements of Financial Position if all rights to offset were exercised.
as at September 30, 2021Amounts Eligible for Offset
Gross Assets/(Liabilities)
FinancialInstruments
CollateralReceived/(Paid)
NetExposure
(in $000’s) (in $000’s) (in $000’s) (in $000’s)Derivative assets - Foreign currency forward contracts - - - -Derivative assets - Swaps and swaptions - - - -Total - - - -Derivative liabilities - Foreign currency forward contracts (43) - - (43)Derivative liabilities - Swaps and swaptions - - - -Total (43) - - (43)
as at March 31, 2021Amounts Eligible for Offset
Gross Assets/(Liabilities)
FinancialInstruments
CollateralReceived/(Paid)
NetExposure
(in $000’s) (in $000’s) (in $000’s) (in $000’s)Derivative assets - Foreign currency forward contracts 53 (6) - 47Derivative assets - Swaps and swaptions - - - -Total 53 (6) - 47Derivative liabilities - Foreign currency forward contracts (6) 6 - -Derivative liabilities - Swaps and swaptions - - - -Total (6) 6 - -

– 171 –
CI Global Balanced Yield Private Pool
Semi-Annual Financial Statements - September 30, 2021
Fund Specific Notes to Financial Statements (unaudited)
The accompanying notes are an integral part of these financial statements.
Interest in Unconsolidated Structured Entities (Note 2)
The following tables present the Fund’s interest in Unconsolidated Structured Entities.
as at September 30, 2021 Fair Value of
the Underlying Fund(s) / ETF(s)Fair Value of the Fund’s Investment
in the Underlying Fund(s) / ETF(s)Ownership in the
Underlying Fund(s) / ETF(s)
Unconsolidated Structured Entities (in $000’s) (in $000’s) (%)CI Global Core Fixed Income Private Trust 29,990 17,632 58.8CI International Equity Income Private Trust 113,045 11,878 10.5CI Global High Yield Fixed Income Private Trust 47,405 3,962 8.4CI U.S. Equity Private Trust 186,536 12,276 6.6CI Canadian Equity Income Private Trust 135,043 5,554 4.1
as at March 31, 2021 Fair Value of
the Underlying Fund(s) / ETF(s)Fair Value of the Fund’s Investment
in the Underlying Fund(s) / ETF(s)Ownership in the
Underlying Fund(s) / ETF(s)
Unconsolidated Structured Entities (in $000’s) (in $000’s) (%)Sentry Global Core Fixed Income Private Trust 26,509 14,970 56.5Sentry International Equity Income Private Trust 105,950 9,674 9.1Sentry Global High Yield Fixed Income Private Trust 47,033 3,477 7.4Sentry U.S. Equity Income Private Trust 175,944 10,293 5.9Sentry Canadian Equity Income Private Trust 127,393 4,569 3.6

– 172 –
CI Global Balanced Yield Private Pool
Semi-Annual Financial Statements - September 30, 2021
Redeemable Unit Transactions (Note 4)for the periods ended September 30
Number of redeemable units at the beginning of periodRedeemable units issued for cashRedeemable units issued for reinvested distributionsRedeemable units redeemedNumber of redeemable units at the end of period
Fund Specific Notes to Financial Statements (unaudited)
†A portion of brokerage commissions paid was used to cover research and market data services, termed soft dollar commissions. This amount has been estimated by the Manager of the Fund.The accompanying notes are an integral part of these financial statements.
Commissions (Note 2)for the periods ended September 30 (in $000’s)
2021 2020Brokerage commissions - -Soft dollar commissions† - -
Series A 2021 2020 2,515,631 1,783,379 289,079 377,118 10,156 93,084 (167,708) (131,440) 2,647,158 2,122,141
Series F 2021 2020 1,591,488 2,222,751 518,263 299,827 12,138 69,654 (114,238) (1,187,939) 2,007,651 1,404,293
Series I 2021 2020 107 1,110 - - 1 16 - (1,020) 108 106

– 173 –
CI Global Balanced Yield Private Pool
Semi-Annual Financial Statements - September 30, 2021
The accompanying notes are an integral part of these financial statements.
Fund Specific Notes to Financial Statements (unaudited)
Securities Lending (Note 6)as at September 30 (in $000’s)
2021 2020Loaned - -Collateral (non-cash) - -
Securities Lending Revenue Reconciliation (Note 6)for the periods ended September 30 (in $000’s)
2021 2020Gross securities lending revenue - -Charges - -Securities lending revenue - -Charges as a % of gross securities lending revenue - -
Management and Administration Fees (Note 5) as at September 30, 2021 (%)
Annual management
fee rate:
Annual administration
fee rate:
Series A 1.600 0.15Series F 0.600 0.15Series I Paid directly by investor Paid directly by investor
Related Party Investments (Note 9)as at September 30 (in $000’s)
Investments 2021CI Canadian Equity Income Private Trust (Series I) 5,554CI Global Core Fixed Income Private Trust (Series I) 17,632CI Global High Yield Fixed Income Private Trust (Series I) 3,962CI International Equity Income Private Trust (Series I) 11,878CI U.S. Equity Private Trust (Series I) 12,276
Investments 2020Sentry Canadian Equity Income Private Trust (Series I) 3,424Sentry Global Core Fixed Income Private Trust (Series I) 13,906Sentry Global High Yield Fixed Income Private Trust (Series I) 2,824Sentry International Equity Income Private Trust (Series I) 7,796Sentry U.S. Equity Income Private Trust (Series I) 7,755

– 174 –
CI Global Balanced Yield Private Pool
Semi-Annual Financial Statements - September 30, 2021
The accompanying notes are an integral part of these financial statements.
Currency Risk (cont’d)As at September 30, 2021, had the Canadian dollar strengthened or weakened by 10% (March 31, 2021 - 10%) in relation to all other foreign currencies held in the Fund, with all other variables held constant, net assets attributable to holders of redeemable units of the Fund would have indirectly decreased or increased, respectively, by approximately $376,000 (March 31, 2021 - $255,000). In practice, actual results may differ from this analysis and the difference may be material.
Refer to Note 10 for discussion of other financial instrument risks.
Fair Value Hierarchy
The tables below summarize the inputs used by the Fund in valuing the Fund’s investments and derivatives carried at fair value.
Long Positions at fair value as at September 30, 2021Level 1 Level 2 Level 3 Total
(in $000’s) (in $000’s) (in $000’s) (in $000’s)Underlying Fund(s) 51,302 - - 51,302 Foreign currency forward contract(s), net - (43) - (43)Total 51,302 (43) - 51,259
Long Positions at fair value as at March 31, 2021Level 1 Level 2 Level 3 Total
(in $000’s) (in $000’s) (in $000’s) (in $000’s)Underlying Fund(s) 42,983 - - 42,983 Foreign currency forward contract(s), net - 47 - 47 Total 42,983 47 - 43,030
There were no transfers between Level 1, 2 and 3 during the period ended September 30, 2021 and the year ended March 31, 2021.
Financial Instruments Risks (Note 10)
Concentration RiskThe tables below summarize the Fund’s exposure to concentration risk.
as at September 30, 2021 Funds Net Assets (%)CI Global Core Fixed Income Private Trust (Series I) 34.1 CI U.S. Equity Private Trust (Series I) 23.7 CI International Equity Income Private Trust (Series I) 22.9 CI Canadian Equity Income Private Trust (Series I) 10.7 CI Global High Yield Fixed Income Private Trust (Series I) 7.7 Other Net Assets (Liabilities) 1.0 Foreign Currency Forward Contract(s) (0.1)Total 100.0
as at March 31, 2021 Funds Net Assets (%)Sentry Global Core Fixed Income Private Trust (Series I) 34.7 Sentry U.S. Equity Income Private Trust (Series I) 23.8 Sentry International Equity Income Private Trust (Series I) 22.4 Sentry Canadian Equity Income Private Trust (Series I) 10.6 Sentry Global High Yield Fixed Income Private Trust (Series I) 8.1 Other Net Assets (Liabilities) 0.3 Foreign Currency Forward Contract(s) 0.1 Total 100.0
Other Price RiskAs at September 30, 2021 and March 31, 2021, the Fund indirectly bears the other price risk exposure of the Underlying Funds.
As at September 30, 2021, had the fair value of the Underlying Funds increased or decreased by 10% (March 31, 2021 - 10%), with all other variables held constant, net assets attributable to holders of redeemable units of the Fund would have increased or decreased, respectively, by approximately $5,130,000 (March 31, 2021 - $4,298,000). In practice, actual results may differ from this analysis and the difference may be material.
Currency RiskThe tables below summarize the Fund’s exposure to currency risk.
as at September 30, 2021~
Currency
Financial Instruments Exposure Derivatives
Net Exposure
Net Assets
(%)(in $000’s) (in $000’s) (in $000’s)U.S. Dollar - (3,761) (3,761) (7.3)Total - (3,761) (3,761) (7.3)
as at March 31, 2021~
Currency
Financial Instruments Exposure Derivatives
Net Exposure
Net Assets
(%)(in $000’s) (in $000’s) (in $000’s)U.S. Dollar - (2,546) (2,546) (5.9)Total - (2,546) (2,546) (5.9)
~Includes monetary and non-monetary instruments, if any.
Fund Specific Notes to Financial Statements (unaudited)

– 175 –
CI Canadian Fixed Income Private Pool
Semi-Annual Financial Statements - September 30, 2021
Statements of Financial Position (in $000’s except for per unit amounts and units outstanding)
as at as at Sept. 30, 2021 Mar. 31, 2021 5,545 5,766 - - 21 41
1 15 - - - - - - - - 1 1 35 40 - - - - 3 7 19 - 5,625 5,870
- - - -
4 3 - - - - - - - - 7 18 4 - - - - - - - - - 15 21
5,610 5,849
Statements of Financial Position (cont’d)(in $000’s except for per unit amounts and units outstanding)
Net assets attributable to holders of redeemable units
per Series (Note 4):
Net assets attributable to holders of redeemable
units per unit: Number of redeemable
units outstanding:
as at Sept. 30, 2021
as at Mar. 31, 2021
as at Sept. 30, 2021
as at Mar. 31, 2021
as at Sept. 30, 2021
as at Mar. 31, 2021
Series A 946 787 10.34 10.29 91,503 76,439Series F 1,272 1,322 10.41 10.33 122,254 127,925Series I 1 1 10.49 10.39 98 97Series S 3,391 3,739 10.05 9.95 337,215 375,591
AssetsCurrent assetsInvestmentsInvestments pledged as collateralCashUnrealized gain on futures and foreign currency forward contractsSwaps, swaptions and optionsDaily variation margin on derivative instrumentsFees rebate receivableCash collateral on deposit for short saleDividends receivableInterest receivableReceivable for distribution from investmentsSecurities lending revenue receivable (Note 6)Receivable for investments soldReceivable for unit subscriptions
LiabilitiesCurrent liabilitiesInvestments sold shortBank overdraftUnrealized loss on futures and foreign currency forward contractsSwaps, swaptions and options Dividends payable on investments sold shortInterest payable on investments sold shortDaily variation margin on derivative instrumentsPayable for investments purchasedPayable for unit redemptionsDistributions payable to holders of redeemable units Management fees payableAdministration fees payableAccounts payable and accrued liabilities
Net assets attributable to holders of redeemable units
The accompanying notes are an integral part of these financial statements.
Financial Statements (unaudited)
CIG - 2051

– 176 –
CI Canadian Fixed Income Private Pool
Semi-Annual Financial Statements - September 30, 2021
Statements of Comprehensive Incomefor the periods ended September 30(in $000’s except for per unit amounts and number of units)
2021 2020
21 - 72 96 - - - - - -
- - - -
(10) (22)
62 406 145 480 (1) - - - - - - - (1) - 144 480
8 5 1 1 1 - 1 1 - - - - - - - - 1 2 1 1 - - 13 10
131 470
The accompanying notes are an integral part of these financial statements.
Financial Statements (unaudited)
Statements of Comprehensive Income (cont’d)for the periods ended September 30(in $000’s except for per unit amounts and number of units)
Increase (decrease) in net assets attributable to
holders of redeemable units per Series:
Increase (decrease) in net assets attributable to
holders of redeemable units per unit:
Weighted average number of units:
2021 2020 2021 2020 2021 2020Series A 17 33 0.17 0.70 95,800 46,134Series F 30 86 0.22 0.68 128,306 126,939Series I - 1 0.25 1.38 99 319Series S 84 350 0.25 0.73 343,240 477,758
Income Net gain (loss) on investments and derivatives Dividends Interest for distribution purposes Income distributions from investments Capital gain distributions from investments Derivative income (loss) Dividends expense on financial assets (liabilities) sold
short Interest expense on financial assets (liabilities) sold short Net realized gain (loss) on sale of investments and
derivatives Change in unrealized appreciation (depreciation) in value
of investments and derivativesTotal net gain (loss) on investments and derivativesOther income Foreign exchange gain (loss) on cash Commitment fee income Securities lending revenue (Note 6) Fees rebateTotal other incomeTotal incomeExpensesManagement fees (Note 5)Administration fees (Note 5)Commissions and other portfolio transaction costsIndependent review committee feesSecurities borrowing fees (Note 2)Margin feesService feesInterest expenseWithholding taxesHarmonized sales taxOther expensesTotal expensesIncrease (decrease) in net assets attributable to holders of redeemable units

– 177 –
CI Canadian Fixed Income Private Pool
Semi-Annual Financial Statements - September 30, 2021
The accompanying notes are an integral part of these financial statements.
Financial Statements (unaudited)
Statements of Changes in Net Assets Attributable to Holders of Redeemable Unitsfor the periods ended September 30 (in $000’s)
Net assets attributable to holders of redeemable units at the beginning of periodIncrease (decrease) in net assets attributable to holders of redeemable unitsDistributions to holders of redeemable units From net investment income From net realized gains Return of capitalTotal distributions to holders of redeemable units
Redeemable unit transactions Proceeds from redeemable units issued Reinvestment of distributions to holders of redeemable units Redemption of redeemable unitsNet increase (decrease) from redeemable unit transactionsNet increase (decrease) in net assets attributable to holders of redeemable unitsNet assets attributable to holders of redeemable units at the end of period
Series A 2021 2020 787 524 17 33
(13) (4) - - - - (13) (4)
350 320 12 4 (207) (164) 155 160 159 189 946 713
Series F 2021 2020 1,322 1,165 30 86
(18) (16) - - - - (18) (16)
79 486 15 11 (156) (12) (62) 485 (50) 555 1,272 1,720
Series I 2021 2020 1 11 - 1
- - - - - - - -
- - - - - (11) - (11) - (10) 1 1
Series S 2021 2020 3,739 4,679 84 350
(48) (70) - - - - (48) (70)
448 4 2 3 (834) (52) (384) (45) (348) 235 3,391 4,914
Total Fund 2021 2020 5,849 6,379 131 470
(79) (90) - - - - (79) (90)
877 810 29 18 (1,197) (239) (291) 589 (239) 969 5,610 7,348

– 178 –
CI Canadian Fixed Income Private Pool
Semi-Annual Financial Statements - September 30, 2021
Statements of Cash Flowsfor the periods ended September 30 (in $000’s)
2021 2020
131 470
10 22 - - 1 -
(62) (406) 1,964 1,158 (1,684) (1,407) - - - - - - - - 5 (2) - - - - - - - - 365 (165)
(50) (72) 858 813 (1,193) (235) (385) 506
- - (20) 341 41 93 21 434
20 - 77 92 - - - - - -
*Dividends and interest received as well as dividends and interest paid relate to operating activities of the Fund. The accompanying notes are an integral part of these financial statements.
Financial Statements (unaudited)
Cash flows from (used in) operating activitiesIncrease (decrease) in net assets attributable to holders of redeemable unitsAdjustments for: Net realized (gain) loss on sale of investments and derivatives Unrealized foreign exchange (gain) loss on cash Commissions and other portfolio transaction costs Change in unrealized (appreciation) depreciation in value of
investments and derivatives Proceeds from sale and maturity of investments and derivatives Purchase of investments and derivatives (Increase) decrease in cash collateral on deposit for short sale Non-cash distributions from investments Change in daily variation margin (Increase) decrease in dividends receivable (Increase) decrease in interest receivable (Increase) decrease in securities lending revenue receivable Increase (decrease) in management fees payable Increase (decrease) in administration fees payable Change in other accounts receivable and payableNet cash from (used in) operating activities
Cash flows from (used in) financing activitiesDistributions paid to holders of redeemable units, net of reinvested distributionsProceeds from issuance of redeemable unitsAmounts paid on redemption of redeemable unitsNet cash from (used in) financing activities Unrealized foreign exchange gain (loss) on cashNet increase (decrease) in cashCash (bank overdraft), beginning of periodCash (bank overdraft), end of period
Supplementary Information:Dividends received, net of withholding tax*Interest received, net of withholding tax*Dividends paid*Interest paid*Tax recoverable (paid)

– 179 –
CI Canadian Fixed Income Private Pool
Semi-Annual Financial Statements - September 30, 2021
Percentages shown relate investments at fair value to net assets attributable to holders of redeemable units of the Fund.
Schedule of Investment Portfolio as at September 30, 2021 (unaudited)
Number ofUnits/Sharesor Par Value Description
Average Cost($)
Fair Value($)
% of Net Assets
FINANCIALS USD 3,000 Ally Financial Inc., FRN, 4.7%, December 31, 2049 3,620 3,980 USD 30,000 American Express Co., 3.55275%, December 31, 2049 39,880 38,044 75,000 Bank of America Corp., 3.228%, June 22, 2022 77,185 76,472 8,000 Bank of America Corp., FRN, 1.035%, September 15, 2027 8,000 8,139 5,000 Bank of America Corp., FRN, 1.978%, September 15, 2027 5,000 4,998 USD 15,000 Bank of Montreal, FRN, 4.338%, October 05, 2028 21,165 20,289 250 Bank of Montreal, Preferred 3.9%, Series 29 5,039 6,102 400 Bank of Montreal, Preferred 4%, Series 27 8,402 9,832 300 Bank of Montreal, Preferred 4.5%, Series 40 7,534 7,689 200 Brookfield Asset Management Inc., Preferred 4.75%, Series 17 4,725 5,146 200 Brookfield Asset Management Inc., Preferred 4.8%, Series 46 5,101 5,112 375 Brookfield Asset Management Inc., Preferred, Series 2 3,958 4,969 USD 2,000 Brookfield Finance I UK PLC 2.34%, January 30, 2032 2,513 2,492 USD 5,000 Burford Capital Global Finance LLC 6.25%, April 15, 2028 6,443 6,720 10,000 Canada Life Capital Trust 7.529%, June 30, 2032 14,877 14,334 20,000 Canadian Imperial Bank of Commerce 4.375%, October 28, 2080 20,724 21,150 3,000 Canadian Imperial Bank of Commerce, FRN, 4%, January 28, 2082 3,018 3,030 925 Canadian Imperial Bank of Commerce, Preferred 4.5%, Series 47 20,882 23,310 7,000 Canadian Western Bank 1.926%, April 16, 2026 7,000 7,003 50,000 Canadian Western Bank 2.597%, September 06, 2024 49,686 51,569 25,000 Canadian Western Bank 2.924%, December 15, 2022 24,841 25,640 26,000 Canadian Western Bank 5%, July 31, 2081 26,005 26,460 50,000 Canadian Western Bank 6%, April 30, 2081 50,000 53,688 USD 75,000 Deutsche Bank AG 4.25%, October 14, 2021 101,718 95,097 USD 1,000 Element Fleet Management Corp., 1.6%, April 06, 2024 1,255 1,285 USD 6,000 Fairfax India Holdings Corp., 5%, February 26, 2028 7,507 7,591 100,000 GE Capital Canada Funding Co., 4.6%, January 26, 2022 104,019 101,244 USD 5,361 Global Aircraft Leasing Co., Ltd., 6.5%, September 15, 2024 6,123 6,680 USD 2,000 goeasy Ltd., 4.375%, May 01, 2026 2,500 2,606 15,000 Goldman Sachs Group Inc., FRN, 0.81%, April 29, 2025 15,000 15,040 5,000 Great-West Lifeco Inc., FRN, 3.6%, December 31, 2081 5,000 5,001 450 Great-West Lifeco Inc., Preferred 5.8%, Series M 11,491 11,714 9,000 IGM Financial Inc., 4.56%, January 25, 2047 11,092 10,384 300 Intact Financial Corp., Preferred 5.2%, Series 5 7,832 8,061 7,000 JPMorgan Chase & Co., 1.896%, March 05, 2028 7,000 6,963 USD 2,000 JPMorgan Chase & Co., 2.776%, April 25, 2023 2,613 2,567 USD 80,000 JPMorgan Chase & Co., FRN, Callable, 3.5985%, December 31, 2049 107,075 101,883 4,000 Manulife Bank of Canada 1.337%, February 26, 2026 4,000 3,953 USD 15,000 Manulife Financial Corp., 4.061%, February 24, 2032 20,811 20,855 300 Manulife Financial Corp., Preferred 3.8%, Series 13 6,669 7,332 200 Manulife Financial Corp., Preferred 4%, Series 11 4,845 5,052 300 Manulife Financial Corp., Preferred 4.40%, Series 9 7,449 7,572 275 Manulife Financial Corp., Preferred 4.65%, Series 2, Class A 6,830 6,996 400 Manulife Financial Corp., Preferred 4.7%, Series 25 9,531 10,140 100 Manulife Financial Corp., Preferred 4.85%, Series 23 2,561 2,553 7,000 Metropolitan Life Global Funding I Inc., 3.394%, April 09, 2030 7,900 7,519 15,000 Morgan Stanley 0.77875%, March 21, 2025 15,000 15,013 USD 30,000 Morgan Stanley, FRN, 3.73613%, December 31, 2049 39,974 38,341 175 National Bank of Canada, Preferred 3.9%, Series 32 3,511 4,286 350 National Bank of Canada, Preferred 4.45%, Series 38 8,752 9,093 275 National Bank of Canada, Preferred 4.95%, Series 42 6,574 7,092 USD 2,000 NatWest Group PLC, FRN, 4.6%, December 31, 2049 2,462 2,552 USD 3,000 Navient Corp., 4.875%, March 15, 2028 3,871 3,857 USD 9,000 Navient Corp., 5%, March 15, 2027 11,601 11,739 USD 3,000 PNC Financial Services Group Inc., FRN, 3.4%, December 31, 2049 3,806 3,800 325 Power Financial Corp., Preferred 4.95%, Series K 8,084 8,395

– 180 –
CI Canadian Fixed Income Private Pool
Semi-Annual Financial Statements - September 30, 2021
Percentages shown relate investments at fair value to net assets attributable to holders of redeemable units of the Fund.
Number ofUnits/Sharesor Par Value Description
Average Cost($)
Fair Value($)
% of Net Assets
Schedule of Investment Portfolio as at September 30, 2021 (unaudited) (cont’d)
FINANCIALS (cont’d) 150 Power Financial Corp., Preferred, Series H 3,818 3,900 35,000 Royal Bank of Canada 2.949%, May 01, 2023 36,948 36,243 25,000 Royal Bank of Canada, FRN, 2.74%, July 25, 2029 24,944 25,866 30,000 Royal Bank of Canada, FRN, 4.5%, November 24, 2080 31,530 31,829 400 Royal Bank of Canada, Preferred 3.9%, Series BB 8,582 9,716 4,000 Sagen MI Canada Inc., 3.261%, March 05, 2031 4,000 4,028 7,000 Sagen MI Canada Inc., 4.95%, March 24, 2081 7,000 7,087 200 Sagen MI Canada Inc., Preferred 5.40%, Series 1 5,000 5,512 4,000 Sun Life Financial Inc., FRN, 3.6%, June 30, 2081 4,000 4,052 375 Sun Life Financial Inc., Preferred 4.45%, Series A 9,088 9,529 75,000 The Bank of Nova Scotia 2.38%, May 01, 2023 76,208 76,792 5,000 The Bank of Nova Scotia, FRN, 3.7%, July 27, 2081 5,000 5,005 25,000 Toronto-Dominion Bank 3.06%, January 26, 2032 26,192 26,226 25,000 Toronto-Dominion Bank 3.105%, April 22, 2030 25,000 26,196 175,000 Toronto-Dominion Bank 3.226%, July 24, 2024 185,361 185,529 9,000 Toronto-Dominion Bank, FRN, 3.6%, October 31, 2081 9,000 8,994 400 Toronto-Dominion Bank, Preferred 3.9%, Series 1 8,600 9,792 650 Toronto-Dominion Bank, Preferred 4.75%, Series 18 15,408 16,692 400 Toronto-Dominion Bank, Preferred 4.75%, Series 20 9,365 10,248 500 Toronto-Dominion Bank, Preferred 5.2%, Series 22 12,815 13,440 300 Toronto-Dominion Bank, Preferred, Series 3 6,398 7,347 1,494,311 1,502,447 26.78 PROVINCIAL BONDS 56,000 Province of Alberta 2.55%, June 01, 2027 61,164 59,085 17,000 Province of Alberta 3.1%, June 01, 2050 17,739 17,832 67,000 Province of Manitoba 2.05%, September 05, 2052 61,840 56,257 79,000 Province of New Brunswick 2.6%, August 14, 2026 83,659 83,575 109,000 Province of New Brunswick 3.05%, August 14, 2050 124,041 113,221 379,000 Province of Ontario 1.9%, December 02, 2051 348,568 312,214 522,000 Province of Ontario 2.4%, June 02, 2026 562,673 547,359 28,000 Province of Saskatchewan 2.8%, December 02, 2052 27,953 27,895 35,000 Province of Saskatchewan 3.75%, March 05, 2054 41,526 41,837 1,329,163 1,259,275 22.45 CANADIAN GOVERNMENT BONDS 463,000 Government of Canada 0.25%, March 01, 2026 448,559 447,220 111,000 Government of Canada 2%, December 01, 2051 116,710 111,383 27,000 Government of Canada 2%, June 01, 2028 28,393 28,305 55,000 Government of Canada Real Return Bond 6.23004%, December 01, 2031 118,830 124,156 712,492 711,064 12.68 ENERGY 2,000 ARC Resources Ltd., 2.354%, March 10, 2026 2,000 2,014 3,000 ARC Resources Ltd., 3.465%, March 10, 2031 3,000 3,062 USD 1,000 Cenovus Energy Inc., 2.65%, January 15, 2032 1,260 1,242 USD 1,000 Cenovus Energy Inc., 5.375%, July 15, 2025 1,375 1,443 USD 1,000 Cenovus Energy Inc., 5.4%, June 15, 2047 1,409 1,553 USD 4,000 CQP Holdco L.P./BIP-V Chinook Holdco LLC 5.5%, June 15, 2031 4,882 5,395 3,000 Crew Energy Inc., 6.5%, March 14, 2024 2,974 2,952 USD 4,000 CrownRock L.P./CrownRock Finance Inc., 5.625%, October 15, 2025 5,190 5,192 5,000 Enbridge Inc., 4.1%, September 21, 2051 4,984 4,901 USD 50,000 Enbridge Inc., 6.25%, March 01, 2078 71,489 70,575 850 Enbridge Inc., Preferred 4%, Series 1 21,421 24,342 175 Enbridge Inc., Preferred 4%, Series 3 2,630 3,146 450 Enbridge Inc., Preferred 4%, Series D 6,716 8,298 600 Enbridge Inc., Preferred 4%, Series F 9,483 11,988 425 Enbridge Inc., Preferred 4%, Series N 7,223 8,810

– 181 –
CI Canadian Fixed Income Private Pool
Semi-Annual Financial Statements - September 30, 2021
Percentages shown relate investments at fair value to net assets attributable to holders of redeemable units of the Fund.
Number ofUnits/Sharesor Par Value Description
Average Cost($)
Fair Value($)
% of Net Assets
Schedule of Investment Portfolio as at September 30, 2021 (unaudited) (cont’d)
ENERGY (cont’d) 700 Enbridge Inc., Preferred 4.4%, Series 9 11,274 13,727 650 Enbridge Inc., Preferred, Series P 10,156 12,448 2,000 Enbridge Pipelines Inc., 4.2%, May 12, 2051 1,999 2,053 USD 6,000 Endeavor Energy Resources L.P./EER Finance Inc., 5.75%, January 30, 2028 8,207 8,008 USD 2,000 Exxon Mobil Corp., 1.571%, April 15, 2023 2,608 2,583 39,000 Inter Pipeline Ltd., 6.625%, November 19, 2079 39,670 42,359 USD 1,000 Laredo Petroleum Inc., 7.75%, July 31, 2029 1,170 1,271 USD 3,000 Marathon Oil Corp., 5.2%, June 01, 2045 4,481 4,532 USD 1,000 MEG Energy Corp., 5.875%, February 01, 2029 1,274 1,297 USD 4,000 MEG Energy Corp., 6.5%, January 15, 2025 5,232 5,219 17,000 Pembina Pipeline Corp., 3.71%, August 11, 2026 18,979 18,187 300 Pembina Pipeline Corp., Preferred 4.9%, Series 21 7,248 7,674 400 Pembina Pipeline Corp., Preferred 5%, Series 5 7,182 9,360 100 Pembina Pipeline Corp., Preferred 5.25%, Series 23 2,498 2,599 4,000 Suncor Energy Inc., 3.95%, March 04, 2051 3,942 3,889 25,000 Suncor Energy Inc., 5%, April 09, 2030 24,924 29,121 400 TC Energy Corp., Preferred 4.9%, Series 15 10,026 10,268 USD 1,000 Teine Energy Ltd., 6.875%, April 15, 2029 1,258 1,291 3,000 Tourmaline Oil Corp., 2.529%, February 12, 2029 3,000 2,985 12,000 TransCanada PipeLines Ltd., 4.18%, July 03, 2048 13,401 12,037 6,000 TransCanada PipeLines Ltd., 4.33%, September 16, 2047 6,135 6,157 330,700 351,978 6.27 INDUSTRIALS 110,000 407 International Inc., 2.84%, March 07, 2050 112,468 99,820 100,000 407 International Inc., 3.6%, May 21, 2047 111,354 104,193 2,000 Air Canada 4.625%, August 15, 2029 2,000 2,011 USD 2,000 Air Lease Corp., 2.3%, February 01, 2025 2,641 2,601 USD 3,000 Air Lease Corp., 3.625%, April 01, 2027 4,057 4,088 USD 1,000 Aircastle Ltd., FRN, 5.25%, December 31, 2049 1,210 1,296 USD 2,000 American Airlines Inc./AAdvantage Loyalty IP Ltd., 5.75%, April 20, 2029 2,584 2,733 USD 3,000 Avolon Holdings Funding Ltd., 2.75%, February 21, 2028 3,762 3,789 USD 1,000 Fortress Transportation and Infrastructure Investors LLC 5.5%, May 01, 2028 1,262 1,281 50,000 Greater Toronto Airports Authority 2.73%, April 03, 2029 52,077 52,156 4,000 Greater Toronto Airports Authority 3.15%, October 05, 2051 3,993 3,885 USD 2,000 H&E Equipment Services Inc., 3.875%, December 15, 2028 2,455 2,530 2,000 Heathrow Funding Ltd., 2.694%, October 13, 2027 2,000 2,027 USD 5,000 Husky III Holding Ltd., 13%, February 15, 2025 6,897 6,750 USD 3,000 Imola Merger Corp., 4.75%, May 15, 2029 3,764 3,934 USD 5,565 United Airlines 2020-1 Class A Pass Through Trust 5.875%, October 15, 2027 7,647 7,900 USD 1,868 United Airlines 2020-1 Class B Pass Through Trust 4.875%, January 15, 2026 2,454 2,509 322,625 303,503 5.41 EXCHANGE-TRADED FUND(S) 2,112 iShares J.P. Morgan USD Emerging Markets Bond ETF (Common Units) 305,550 294,415 5.25 COMMUNICATION SERVICES USD 5,000 Altice France Holding S.A., 6%, February 15, 2028 6,442 6,049 USD 1,000 Altice France S.A., 5.5%, January 15, 2028 1,293 1,280 USD 1,000 AT&T Inc., 1.7%, March 25, 2026 1,250 1,285 125 BCE Inc., Preferred 4.4%, Series AF 16 2,057 2,498 1,125 BCE Inc., Preferred 5.319%, Series Z 17,601 21,105 525 BCE Inc., Preferred 5.45%, Series AA 8,319 10,075 600 BCE Inc., Preferred 5.54%, Series AC 10,071 12,096 1,550 BCE Inc., Preferred 5.55%, Series 19 23,397 29,466 525 BCE Inc., Preferred 6.174%, Series R 7,993 9,712 600 BCE Inc., Preferred, Series AB 9,051 11,154 20,000 Bell Canada Inc., 3.5%, September 30, 2050 20,480 18,309 35,000 Bell Canada Inc., 4.7%, September 11, 2023 38,341 37,118

– 182 –
CI Canadian Fixed Income Private Pool
Semi-Annual Financial Statements - September 30, 2021
Percentages shown relate investments at fair value to net assets attributable to holders of redeemable units of the Fund.
Number ofUnits/Sharesor Par Value Description
Average Cost($)
Fair Value($)
% of Net Assets
Schedule of Investment Portfolio as at September 30, 2021 (unaudited) (cont’d)
COMMUNICATION SERVICES (cont’d) USD 4,000 CCO Holdings LLC/CCO Holdings Capital Corp., 4.5%, May 01, 2032 5,356 5,218 USD 4,000 CCO Holdings LLC/CCO Holdings Capital Corp., 4.75%, March 01, 2030 5,430 5,300 USD 2,000 Charter Communications Operating LLC 3.5%, June 01, 2041 2,524 2,499 6,000 Cineplex Inc., 7.5%, February 26, 2026 6,028 6,352 3,000 Cogeco Communications Inc., 2.991%, September 22, 2031 3,000 2,971 USD 2,000 CSC Holdings LLC 4.5%, November 15, 2031 2,455 2,505 USD 2,000 CSC Holdings LLC 5%, November 15, 2031 2,455 2,434 USD 6,000 Diamond Sports Group LLC/Diamond Sports Finance Co., 5.375%, August 15, 2026 6,170 5,025 USD 1,000 Netflix Inc., 4.875%, June 15, 2030 1,460 1,493 9,000 Shaw Communications Inc., 4.25%, December 09, 2049 10,008 8,962 4,000 TELUS Corp., 2.85%, November 13, 2031 3,990 3,993 6,000 TELUS Corp., 4.1%, April 05, 2051 6,198 5,998 USD 2,000 T-Mobile USA Inc., 3.6%, November 15, 2060 2,553 2,489 USD 1,000 Verizon Communications Inc., 2.1%, March 22, 2028 1,252 1,286 5,000 Verizon Communications Inc., 2.375%, March 22, 2028 4,992 5,034 USD 1,000 Verizon Communications Inc., 3.4%, March 22, 2041 1,252 1,321 211,418 223,027 3.98 UTILITIES 675 AltaGas Ltd., Preferred 4.75%, Series G 13,301 16,376 600 Brookfield Infrastructure Partners L.P., Preferred 5%, Series 7 14,883 15,318 925 Brookfield Renewable Partners L.P., Preferred 5%, Series 11 23,093 24,096 100 Brookfield Renewable Partners L.P., Preferred 5%, Series 13 2,476 2,590 700 Capital Power Corp., Preferred 4.5%, Series 5 13,164 16,940 325 Capital Power Corp., Preferred 5.75%, Series 9 8,253 8,320 275 Capital Power Corp., Preferred 6%, Series 7 6,992 6,958 12,000 CU Inc., 2.609%, September 28, 2050 12,188 10,413 150 CU Inc., Preferred 4.6%, Series 1 3,571 3,825 USD 40,000 Emera Inc., 6.75%, June 15, 2076 57,972 60,328 250 Emera Inc., Preferred 4.60%, Series L 6,250 6,400 USD 1,000 Emera U.S. Finance L.P., 3.55%, June 15, 2026 1,370 1,369 14,000 EPCOR Utilities Inc., 2.899%, May 19, 2050 14,595 12,945 USD 3,000 Exelon Corp., 4.7%, April 15, 2050 4,933 4,797 13,000 Nova Scotia Power Inc., 3.307%, April 25, 2050 14,235 12,715 USD 2,000 Sunnova Energy Corp., 5.875%, September 01, 2026 2,474 2,584 275 TransAlta Corp., Preferred 5%, Series E 5,174 6,182 425 TransAlta Corp., Preferred, Series C 6,811 7,922 211,735 220,078 3.92 CONSUMER DISCRETIONARY USD 5,000 Academy Ltd., 6%, November 15, 2027 6,687 6,848 USD 6,000 Brookfield Residential Properties Inc., 4.875%, February 15, 2030 7,922 7,761 USD 5,000 Carnival Corp., 4%, August 01, 2028 6,322 6,404 USD 3,000 Carnival Corp., 5.75%, March 01, 2027 3,811 3,928 USD 14,000 Carnival Corp., 7.625%, March 01, 2026 19,142 18,951 USD 4,000 Carvana Co., 5.625%, October 01, 2025 5,204 5,244 USD 9,000 Carvana Co., 5.875%, October 01, 2028 11,886 11,786 USD 2,000 Fiat Chrysler Automobiles N.V., 5.25%, April 15, 2023 2,786 2,705 USD 2,000 General Motors Co., 5.4%, October 02, 2023 2,720 2,763 5,000 General Motors Financial of Canada Ltd., 1.75%, April 15, 2026 4,997 4,937 USD 2,000 Hilton Domestic Operating Co., Inc., 3.625%, February 15, 2032 2,547 2,498 USD 1,000 Home Depot Inc., 1.875%, September 15, 2031 1,257 1,243 USD 2,000 Home Depot Inc., 2.75%, September 15, 2051 2,503 2,463 3,000 Hyundai Capital Canada Inc., 2.008%, May 12, 2026 3,000 3,005 USD 2,000 McDonald’s Corp., 3.35%, April 01, 2023 2,694 2,639 USD 4,000 MGM Resorts International 4.625%, September 01, 2026 5,353 5,320 USD 6,000 MPH Acquisition Holdings LLC 5.75%, November 01, 2028 7,368 7,170

– 183 –
CI Canadian Fixed Income Private Pool
Semi-Annual Financial Statements - September 30, 2021
Percentages shown relate investments at fair value to net assets attributable to holders of redeemable units of the Fund.
Schedule of Investment Portfolio as at September 30, 2021 (unaudited) (cont’d)
CONSUMER DISCRETIONARY (cont’d) USD 4,000 NCL Corp., Ltd., 3.625%, December 15, 2024 4,767 4,819 USD 3,000 NCL Corp., Ltd., 5.875%, March 15, 2026 3,826 3,900 5,000 Nissan Canada Inc., 1.626%, March 18, 2024 5,000 4,993 6,000 Nissan Canada Inc., 2.103%, September 22, 2025 6,000 5,979 USD 2,000 Nissan Motor Co., Ltd., 4.81%, September 17, 2030 2,862 2,848 4,000 Reliance L.P., 2.67%, August 01, 2028 3,997 4,014 USD 4,000 Royal Caribbean Cruises Ltd., 5.5%, April 01, 2028 5,030 5,189 USD 1,000 Royal Caribbean Cruises Ltd., 9.125%, June 15, 2023 1,373 1,378 USD 10,000 Six Flags Theme Parks Inc., 7%, July 01, 2025 13,759 13,505 USD 1,000 Stellantis Finance US Inc., 1.711%, January 29, 2027 1,269 1,263 USD 12,000 Studio City Finance Ltd., 5%, January 15, 2029 15,210 14,037 1,000 Superior Plus L.P., 4.25%, May 18, 2028 1,000 1,028 USD 3,000 Superior Plus L.P./Superior General Partner Inc., 4.5%, March 15, 2029 3,822 3,928 USD 3,000 Wynn Las Vegas LLC/Wynn Las Vegas Capital Corp., 5.25%, May 15, 2027 3,953 3,843 168,067 166,389 2.97 CONSUMER STAPLES 25,000 Anheuser-Busch InBev Finance Inc., 4.32%, May 15, 2047 28,494 26,261 USD 2,000 Costco Wholesale Corp., 1.375%, June 20, 2027 2,604 2,551 250 George Weston Ltd., Preferred 5.2%, Series IV 6,306 6,468 325 Loblaw Co., Ltd., Preferred 5.3%, Series B 8,513 8,544 12,000 Metro Inc., 3.413%, February 28, 2050 12,248 11,154 12,000 Metro Inc., 4.27%, December 04, 2047 14,330 12,882 USD 9,000 Rite Aid Corp., 8%, November 15, 2026 12,164 11,502 35,000 Sobeys Inc., 5.79%, October 06, 2036 40,747 42,100 13,000 Sysco Canada Inc., 3.65%, April 25, 2025 14,216 13,792 USD 2,000 Sysco Corp., 5.65%, April 01, 2025 3,022 2,913 142,644 138,167 2.46 FOREIGN GOVERNMENT BONDS USD 67,000 United States Treasury Note/Bond 0.125%, August 31, 2023 84,765 84,636 USD 15,000 United States Treasury Note/Bond 1.25%, August 15, 2031 18,940 18,516 103,705 103,152 1.84 REAL ESTATE 4,000 Allied Properties Real Estate Investment Trust 1.726%, February 12, 2026 4,000 3,936 4,000 Allied Properties Real Estate Investment Trust 3.095%, February 06, 2032 4,000 3,925 475 Brookfield Office Properties Inc., Preferred 4.75%, Series AA 7,973 9,452 400 Brookfield Office Properties Inc., Preferred 5.1%, Series EE 8,714 9,616 150 Brookfield Office Properties Inc., Preferred 5.1%, Series R 2,476 2,960 350 Brookfield Office Properties Inc., Preferred 5.15%, Series P 5,119 6,478 30,000 Choice Properties Real Estate Investment Trust 3.827%, March 04, 2050 31,370 28,186 7,000 First Capital Real Estate Investment Trust 3.447%, March 01, 2028 7,442 7,223 10,000 First Capital Real Estate Investment Trust 3.456%, January 22, 2027 10,472 10,384 3,000 H&R Real Estate Investment Trust 2.633%, February 19, 2027 3,000 3,001 USD 3,000 Howard Hughes Corp., 4.125%, February 01, 2029 3,863 3,814 USD 1,000 Howard Hughes Corp., 4.375%, February 01, 2031 1,274 1,276 USD 4,000 Park Intermediate Holdings LLC/PK Domestic Property LLC 5.875%, October 01, 2028 5,159 5,352 2,000 Smart Real Estate Investment Trust 3.985%, May 30, 2023 2,122 2,093 USD 3,000 XHR L.P., 4.875%, June 01, 2029 3,667 3,907 100,651 101,603 1.81 MATERIALS USD 1,000 Big River Steel LLC/BRS Finance Corp., 6.625%, January 31, 2029 1,371 1,372 USD 5,000 First Quantum Minerals Ltd., 7.5%, April 01, 2025 6,615 6,504 USD 12,000 Glencore Finance Canada Ltd., 5.55%, October 25, 2042 19,468 19,543 USD 1,000 Glencore Funding LLC 1.625%, April 27, 2026 1,248 1,260 USD 1,000 Glencore Funding LLC 3.875%, April 27, 2051 1,257 1,324
Number ofUnits/Sharesor Par Value Description
Average Cost($)
Fair Value($)
% of Net Assets

– 184 –
CI Canadian Fixed Income Private Pool
Semi-Annual Financial Statements - September 30, 2021
Percentages shown relate investments at fair value to net assets attributable to holders of redeemable units of the Fund.
Schedule of Investment Portfolio as at September 30, 2021 (unaudited) (cont’d)
MATERIALS (cont’d) USD 6,000 New Gold Inc., 7.5%, July 15, 2027 8,417 7,832 USD 10,000 Rayonier AM Products Inc., 7.625%, January 15, 2026 13,215 13,402 51,591 51,237 0.91 ASSET-BACKED SECURITIES 2,000 BMW Canada Auto Trust 0.502%, July 20, 2024 2,000 1,994 2,000 BMW Canada Auto Trust 0.755%, December 20, 2025 2,000 1,985 13,000 BMW Canada Auto Trust 1.99%, September 20, 2023 13,202 13,123 8,000 Classic RMBS Trust (Series 2021-1) 1.563%, November 15, 2051 6,234 6,241 3,000 CNH Capital Canada Receivables Trust 0.386%, March 15, 2024 1,855 1,855 2,000 CNH Capital Canada Receivables Trust 1.001%, November 16, 2026 2,000 1,999 8,000 Ford Auto Securitization Trust 2.841%, January 15, 2024 5,835 5,817 3,000 GMF Canada Leasing Trust 0.422%, February 21, 2023 1,564 1,564 4,000 GMF Canada Leasing Trust 0.641%, March 20, 2024 4,000 4,000 3,000 GMF Canada Leasing Trust 1.264%, May 20, 2026 3,000 3,042 4,000 MBARC Credit Canada Inc., 0.932%, February 17, 2026 4,000 3,998 45,690 45,618 0.81 MUNICIPAL BONDS 4,000 Edmonton Regional Airports Authority 3.715%, May 20, 2051 4,000 4,041 39,000 Municipal Finance Authority of British Columbia 1.35%, June 30, 2026 38,956 38,985 42,956 43,026 0.77 HEALTH CARE USD 6,000 Cheplapharm Arzneimittel GmbH 5.5%, January 15, 2028 7,919 7,883 USD 3,000 Ortho-Clinical Diagnostics Inc./Ortho-Clinical Diagnostics S.A., 7.25%, February 01, 2028 4,038 4,072 5,000 Sienna Senior Living Inc., 2.82%, March 31, 2027 4,998 5,074 USD 2,000 Trulieve Cannabis Corp., 8%, October 06, 2026 2,552 2,533 19,507 19,562 0.35 INFORMATION TECHNOLOGY USD 5,000 Apple Inc., 1.2%, February 08, 2028 6,416 6,204 4,000 CGI Inc., 2.1%, September 18, 2028 3,994 3,950 10,410 10,154 0.18Commissions and other portfolio transaction costs (215)Total Investment Portfolio before Derivative Instruments 5,603,000 5,544,695 98.84Foreign Currency Forward Contract(s) (see Schedule A) (2,876) (0.05)Total Investment Portfolio 5,603,000 5,541,819 98.79Other Net Assets (Liabilities) 67,775 1.21Net Assets Attributable to Holders of Redeemable Units 5,609,594 100.00
Principal amounts stated in:USD U.S. Dollar
Number ofUnits/Sharesor Par Value Description
Average Cost($)
Fair Value($)
% of Net Assets

– 185 –
CI Canadian Fixed Income Private Pool
Semi-Annual Financial Statements - September 30, 2021
‡Credit ratings are obtained from S&P Global Ratings, where available, otherwise ratings are obtained from: Moody’s Investors Service or Dominion Bond Rating Service.
Schedule of Investment Portfolio as at September 30, 2021 (unaudited) (cont’d)
Schedule AForeign Currency Forward Contract(s)
CounterpartyCredit Rating of the Counterparty‡ Settlement Date
Currency Buy Position
Currency Sell Position
Contract(s) Rate
Unrealized Gain (Loss) ($)
Bank of Montreal A-1 December 15, 2021 CAD 161,366 USD 127,415 1.27 (14)Canadian Imperial Bank of Commerce A-1 October 20, 2021 CAD 9,279 USD 7,338 1.26 (16)Canadian Imperial Bank of Commerce A-1 December 15, 2021 CAD 114,889 USD 91,011 1.26 (383)Canadian Imperial Bank of Commerce A-1 December 15, 2021 USD 47,000 CAD 59,507 0.79 22 Goldman Sachs Group Inc. A-2 December 15, 2021 CAD 114,653 USD 91,011 1.26 (619)HSBC Holdings PLC A-1 December 15, 2021 CAD 196,236 USD 154,076 1.27 1,088 JPMorgan Chase & Co. A-2 December 15, 2021 CAD 114,114 USD 91,011 1.25 (1,158)Morgan Stanley A-2 December 15, 2021 CAD 161,391 USD 127,415 1.27 10 Royal Bank of Canada A-1+ December 15, 2021 CAD 114,661 USD 91,011 1.26 (611)Toronto-Dominion Bank A-1+ December 15, 2021 CAD 114,077 USD 91,011 1.25 (1,195)Total Foreign Currency Forward Contract(s) Value (2,876)

– 186 –
CI Canadian Fixed Income Private Pool
Semi-Annual Financial Statements - September 30, 2021
The accompanying notes are an integral part of these financial statements.
Offsetting of Financial Instruments (Note 2)
The following tables show the net impact on the Fund’s Statements of Financial Position if all rights to offset were exercised.
as at September 30, 2021Amounts Eligible for Offset
Gross Assets/(Liabilities)
FinancialInstruments
CollateralReceived/(Paid)
NetExposure
(in $000’s) (in $000’s) (in $000’s) (in $000’s)Derivative assets - Foreign currency forward contracts 1 - - 1Derivative assets - Swaps and swaptions - - - -Total 1 - - 1Derivative liabilities - Foreign currency forward contracts (4) - - (4)Derivative liabilities - Swaps and swaptions - - - -Total (4) - - (4)
as at March 31, 2021Amounts Eligible for Offset
Gross Assets/(Liabilities)
FinancialInstruments
CollateralReceived/(Paid)
NetExposure
(in $000’s) (in $000’s) (in $000’s) (in $000’s)Derivative assets - Foreign currency forward contracts 15 (3) - 12Derivative assets - Swaps and swaptions - - - -Total 15 (3) - 12Derivative liabilities - Foreign currency forward contracts (3) 3 - -Derivative liabilities - Swaps and swaptions - - - -Total (3) 3 - -
Fund Specific Notes to Financial Statements (unaudited)

– 187 –
CI Canadian Fixed Income Private Pool
Semi-Annual Financial Statements - September 30, 2021
Interest in Unconsolidated Structured Entities (Note 2)
The following tables present the Fund’s interest in Unconsolidated Structured Entities.
as at September 30, 2021 Fair Value of
the Underlying Fund(s) / ETF(s)Fair Value of the Fund’s Investment
in the Underlying Fund(s) / ETF(s)Ownership in the
Underlying Fund(s) / ETF(s)
Unconsolidated Structured Entities (in $000’s) (in $000’s) (%)iShares J.P. Morgan USD Emerging Markets Bond ETF 24,310,126 294 -
as at March 31, 2021 Fair Value of
the Underlying Fund(s) / ETF(s)Fair Value of the Fund’s Investment
in the Underlying Fund(s) / ETF(s)Ownership in the
Underlying Fund(s) / ETF(s)
Unconsolidated Structured Entities (in $000’s) (in $000’s) (%)iShares J.P. Morgan USD Emerging Markets Bond ETF 28,145,746 302 -
The accompanying notes are an integral part of these financial statements.
Fund Specific Notes to Financial Statements (unaudited)

– 188 –
CI Canadian Fixed Income Private Pool
Semi-Annual Financial Statements - September 30, 2021
Fund Specific Notes to Financial Statements (unaudited)
†A portion of brokerage commissions paid was used to cover research and market data services, termed soft dollar commissions. This amount has been estimated by the Manager of the Fund.The accompanying notes are an integral part of these financial statements.
Commissions (Note 2)for the periods ended September 30 (in $000’s)
2021 2020Brokerage commissions - -Soft dollar commissions† - -
Redeemable Unit Transactions (Note 4)for the periods ended September 30
Number of redeemable units at the beginning of periodRedeemable units issued for cashRedeemable units issued for reinvested distributionsRedeemable units redeemedNumber of redeemable units at the end of period
Class A 2021 2020 76,439 51,598 33,724 29,819 1,163 332 (19,823) (15,376) 91,503 66,373
Class F 2021 2020 127,925 114,620 7,682 45,064 1,402 1,059 (14,755) (1,094) 122,254 159,649
Class I 2021 2020 97 1,068 - - 1 4 - (976) 98 96
Class S 2021 2020 375,591 478,741 44,494 383 220 254 (83,090) (5,105) 337,215 474,273

– 189 –
CI Canadian Fixed Income Private Pool
Semi-Annual Financial Statements - September 30, 2021
The accompanying notes are an integral part of these financial statements.
Fund Specific Notes to Financial Statements (unaudited)
Securities Lending (Note 6)as at September 30 (in $000’s)
2021 2020Loaned - -Collateral (non-cash) - -
Securities Lending Revenue Reconciliation (Note 6)for the periods ended September 30 (in $000’s)
2021 2020Gross securities lending revenue - -Charges - -Securities lending revenue - -Charges as a % of gross securities lending revenue - -
Management and Administration Fees (Note 5) as at September 30, 2021 (%)
Annual management
fee rate:
Annual administration
fee rate:
Series A 0.950 0.15Series F 0.450 0.15Series I Paid directly by investor Paid directly by investorSeries S Paid directly by investor Paid directly by investor

– 190 –
CI Canadian Fixed Income Private Pool
Semi-Annual Financial Statements - September 30, 2021
The accompanying notes are an integral part of these financial statements.
Credit Risk (cont’d)
as at March 31, 2021Credit Rating^* Net Assets (%)AAA/Aaa/A++ 17.4AA/Aa/A+ 4.4A 31.3BBB/Baa/B++ 25.6BB/Ba/B+ 10.5B 3.4CCC/Caa/C++ 1.0Not Rated 0.1Total 93.7
^Credit ratings are obtained from S&P Global Ratings, where available, otherwise ratings are obtained from: Moody’s
Investors Service or Dominion Bond Rating Service, respectively.
*Refer to Note 10 for Credit Rating Chart reference.
Other Price RiskAs at September 30, 2021 and March 31, 2021, the Fund was exposed to other price risk as some of its assets were invested in equities and Exchange-Traded Fund(s).
As at September 30, 2021, had the fair value of equities in the investment portfolio increased or decreased by 10% (March 31, 2021 - 10%), with all other variables held constant, net assets attributable to holders of redeemable units of the Fund would have increased or decreased, respectively, by approximately $90,000 (March 31, 2021 - $90,000). In practice, actual results may differ from this analysis and the difference may be material.
Currency RiskThe tables below summarize the Fund’s exposure to currency risk.
as at September 30, 2021~
Currency
Financial Instruments Exposure Derivatives
Net Exposure
Net Assets
(%)(in $000’s) (in $000’s) (in $000’s)U.S. Dollar 1,321 (1,044) 277 4.9 Total 1,321 (1,044) 277 4.9
as at March 31, 2021~
Currency
Financial Instruments Exposure Derivatives
Net Exposure
Net Assets
(%)(in $000’s) (in $000’s) (in $000’s)U.S. Dollar 1,750 (1,239) 511 8.7 Total 1,750 (1,239) 511 8.7
~Includes monetary and non-monetary instruments, if any.
Financial Instruments Risks (Note 10)
Concentration RiskFor Concentration Risk as at September 30, 2021, refer to the Schedule of Investment Portfolio.
The table below summarizes the Fund’s exposure to concentration risk.
as at March 31, 2021 Categories Net Assets (%)Financials 29.5 Provincial Bonds 17.6 Canadian Government Bonds 16.1 Energy 7.7 Industrials 5.3 Exchange-Traded Fund(s) 5.2 Communication Services 3.8 Utilities 3.4 Consumer Staples 3.0 Consumer Discretionary 2.7 Real Estate 1.8 Other Net Assets (Liabilities) 1.2 Foreign Government Bonds 1.2 Materials 0.8 Health Care 0.3 Foreign Currency Forward Contract(s) 0.2 Information Technology 0.2 Asset-Backed Securities 0.1 Total 100.0
Credit RiskThe Fund was invested in fixed income securities, preferred securities and derivative instruments, if any, with the following credit ratings, as per the tables below.
as at September 30, 2021Credit Rating^* Net Assets (%)AAA/Aaa/A++ 14.5AA/Aa/A+ 5.6A 34.4BBB/Baa/B++ 24.0BB/Ba/B+ 9.1B 3.0CCC/Caa/C++ 0.9Not Rated 2.1Total 93.6
Fund Specific Notes to Financial Statements (unaudited)

– 191 –
CI Canadian Fixed Income Private Pool
Semi-Annual Financial Statements - September 30, 2021
The accompanying notes are an integral part of these financial statements.
Fair Value Hierarchy
The tables below summarize the inputs used by the Fund in valuing the Fund’s investments and derivatives carried at fair value.
Long Positions at fair value as at September 30, 2021Level 1 Level 2 Level 3 Total
(in $000’s) (in $000’s) (in $000’s) (in $000’s)Equities 604 - - 604 Bonds - 4,598 3 4,601 Asset-backed securities - 46 - 46 Exchange-Traded Fund(s) 294 - - 294 Foreign currency forward contract(s), net - (3) - (3) Total 898 4,641 3 5,542
Long Positions at fair value as at March 31, 2021Level 1 Level 2 Level 3 Total
(in $000’s) (in $000’s) (in $000’s) (in $000’s)Equities 612 - - 612 Bonds - 4,848 - 4,848 Asset-backed securities - 4 - 4 Exchange-Traded Fund(s) 302 - - 302 Foreign currency forward contract(s), net - 12 - 12 Total 914 4,864 - 5,778
There were no transfers between Level 1, 2 and 3 during the period ended September 30, 2021 and the year ended March 31, 2021.
Currency Risk (cont’d)As at September 30, 2021, had the Canadian dollar strengthened or weakened by 10% (March 31, 2021 - 10%) in relation to all other foreign currencies held in the Fund, with all other variables held constant, net assets attributable to holders of redeemable units of the Fund would have decreased or increased, respectively, by approximately $28,000 (March 31, 2021 - $51,000). In practice, actual results may differ from this analysis and the difference may be material.
Interest Rate RiskThe tables below summarize the Fund’s exposure to interest rate risk, categorized by the contractual maturity date.
as at September 30, 2021
Less than1 Year
1 - 3Years
3 - 5Years
Greaterthan
5 Years Total
(in $000’s) (in $000’s) (in $000’s) (in $000’s) (in $000’s)Interest Rate Exposure 273 559 1,338 2,477 4,647
as at March 31, 2021
Less than1 Year
1 - 3Years
3 - 5Years
Greaterthan
5 Years Total
(in $000’s) (in $000’s) (in $000’s) (in $000’s) (in $000’s)Interest Rate Exposure 199 634 869 3,150 4,852
As at September 30, 2021, had the prevailing interest rates increased or decreased by 0.25% (March 31, 2021 - 0.25%), with all other variables held constant, net assets attributable to holders of redeemable units of the Fund would have decreased or increased, respectively, by approximately $84,000 (March 31, 2021 - $87,000). In practice, actual results may differ from this analysis and the difference may be material.
Fund Specific Notes to Financial Statements (unaudited)
Level 3 ReconciliationThe table below summarizes the movement in financial instruments classified as Level 3.
for the period ended September 30, 2021 Balance at
Mar. 31, 2021 Purchases SalesTransfers
InTransfers
(Out)Realized Gain
(Loss)Unrealized Gain
(Loss)*Balance at
Sept. 30, 2021(in $000’s) (in $000’s) (in $000’s) (in $000’s) (in $000’s) (in $000’s) (in $000’s) (in $000’s)
Long Positions/Assets:Bonds - 3 - - - - - 3 Total - 3 - - - - - 3
*Change in unrealized gain (loss) related to investments held at September 30, 2021 was ($19).
Investments classified as Level 3 are valued at fair value based on unobservable inputs and assumptions, which may include credit spreads, industry multipliers, and discount rates. Management has assessed that the effect of changing these inputs to reasonably possible alternatives would not have a significant impact on the net assets attributable to holders of redeemable units of the Fund as at September 30, 2021.

– 192 –
CI Global Enhanced Government Bond Private Pool
Semi-Annual Financial Statements - September 30, 2021
Statements of Financial Position (in $000’s except for per unit amounts and units outstanding)
as at as at Sept. 30, 2021 Mar. 31, 2021 30,529 37,645 - - 6,347 6,832
27 150 - - 161 198 - - - - - - 96 146 - - - - 110 432 - 45 37,270 45,448
- - - -
56 - - - - - - - - - - 201 132 587 - - - - - - - - 188 788
37,082 44,660
Statements of Financial Position (cont’d)(in $000’s except for per unit amounts and units outstanding)
Net assets attributable to holders of redeemable units
per Series (Note 4):
Net assets attributable to holders of redeemable
units per unit: Number of redeemable
units outstanding:
as at Sept. 30, 2021
as at Mar. 31, 2021
as at Sept. 30, 2021
as at Mar. 31, 2021
as at Sept. 30, 2021
as at Mar. 31, 2021
Series A 3,650 5,967 9.99 9.93 365,222 600,985Series F 32,200 38,470 10.07 10.00 3,196,877 3,846,400Series I 1,232 223 10.18 10.11 121,064 22,053
AssetsCurrent assetsInvestmentsInvestments pledged as collateralCashUnrealized gain on futures and foreign currency forward contractsSwaps, swaptions and optionsDaily variation margin on derivative instrumentsFees rebate receivableCash collateral on deposit for short saleDividends receivableInterest receivableReceivable for distribution from investmentsSecurities lending revenue receivable (Note 6)Receivable for investments soldReceivable for unit subscriptions
LiabilitiesCurrent liabilitiesInvestments sold shortBank overdraftUnrealized loss on futures and foreign currency forward contractsSwaps, swaptions and options Dividends payable on investments sold shortInterest payable on investments sold shortDaily variation margin on derivative instrumentsPayable for investments purchasedPayable for unit redemptionsDistributions payable to holders of redeemable units Management fees payableAdministration fees payableAccounts payable and accrued liabilities
Net assets attributable to holders of redeemable units
The accompanying notes are an integral part of these financial statements.
Financial Statements (unaudited)
CIG - 2055

– 193 –
CI Global Enhanced Government Bond Private Pool
Semi-Annual Financial Statements - September 30, 2021
Statements of Comprehensive Incomefor the periods ended September 30(in $000’s except for per unit amounts and number of units)
2021 2020
- - 235 309 - - - - - -
- - - -
(246) 2,072
532 (1,625) 521 756 15 (46) - - 5 6 - - 20 (40) 541 716
117 200 29 49 1 1 1 1 6 6 - - - - - - - - 17 26 - - 171 283
370 433
The accompanying notes are an integral part of these financial statements.
Financial Statements (unaudited)
Statements of Comprehensive Income (cont’d)for the periods ended September 30(in $000’s except for per unit amounts and number of units)
Increase (decrease) in net assets attributable to
holders of redeemable units per Series:
Increase (decrease) in net assets attributable to
holders of redeemable units per unit:
Weighted average number of units:
2021 2020 2021 2020 2021 2020Series A 35 72 0.07 0.11 459,159 669,122Series F 322 357 0.10 0.07 3,287,526 5,537,124Series I 13 4 0.14 0.18 92,322 21,496
Income Net gain (loss) on investments and derivatives Dividends Interest for distribution purposes Income distributions from investments Capital gain distributions from investments Derivative income (loss) Dividends expense on financial assets (liabilities) sold
short Interest expense on financial assets (liabilities) sold short Net realized gain (loss) on sale of investments and
derivatives Change in unrealized appreciation (depreciation) in value
of investments and derivativesTotal net gain (loss) on investments and derivativesOther income Foreign exchange gain (loss) on cash Commitment fee income Securities lending revenue (Note 6) Fees rebateTotal other incomeTotal incomeExpensesManagement fees (Note 5)Administration fees (Note 5)Commissions and other portfolio transaction costsIndependent review committee feesSecurities borrowing fees (Note 2)Margin feesService feesInterest expenseWithholding taxesHarmonized sales taxOther expensesTotal expensesIncrease (decrease) in net assets attributable to holders of redeemable units

– 194 –
CI Global Enhanced Government Bond Private Pool
Semi-Annual Financial Statements - September 30, 2021
Statements of Changes in Net Assets Attributable to Holders of Redeemable Unitsfor the periods ended September 30 (in $000’s)
Net assets attributable to holders of redeemable units at the beginning of periodIncrease (decrease) in net assets attributable to holders of redeemable unitsDistributions to holders of redeemable units From net investment income From net realized gains Return of capitalTotal distributions to holders of redeemable units
Redeemable unit transactions Proceeds from redeemable units issued Reinvestment of distributions to holders of redeemable units Redemption of redeemable unitsNet increase (decrease) from redeemable unit transactionsNet increase (decrease) in net assets attributable to holders of redeemable unitsNet assets attributable to holders of redeemable units at the end of period
The accompanying notes are an integral part of these financial statements.
Financial Statements (unaudited)
Series A 2021 2020 5,967 5,302 35 72
(1) (4) - - - - (1) (4)
263 5,988 1 4 (2,615) (3,411) (2,351) 2,581 (2,317) 2,649 3,650 7,951
Series F 2021 2020 38,470 41,031 322 357
(65) (39) - - - - (65) (39)
10,216 64,938 60 35 (16,803) (7,571) (6,527) 57,402 (6,270) 57,720 32,200 98,751
Series I 2021 2020 223 238 13 4
(7) - - - - - (7) -
1,000 - 7 - (4) (11) 1,003 (11) 1,009 (7) 1,232 231
Total Fund 2021 2020 44,660 46,571 370 433
(73) (43) - - - - (73) (43)
11,479 70,926 68 39 (19,422) (10,993) (7,875) 59,972 (7,578) 60,362 37,082 106,933

– 195 –
CI Global Enhanced Government Bond Private Pool
Semi-Annual Financial Statements - September 30, 2021
Statements of Cash Flowsfor the periods ended September 30 (in $000’s)
2021 2020
370 433
246 (2,072) (2) 5 1 1
(532) 1,625 59,618 102,709 (51,917) (135,058) - - - - 37 78 - - 50 (29) - - - - - - - - 7,871 (32,308)
(5) (4) 11,449 70,453 (19,802) (11,618) (8,358) 58,831
2 (5) (487) 26,523 6,832 5,467 6,347 31,985
- - 285 280 - - - - - -
*Dividends and interest received as well as dividends and interest paid relate to operating activities of the Fund. The accompanying notes are an integral part of these financial statements.
Financial Statements (unaudited)
Cash flows from (used in) operating activitiesIncrease (decrease) in net assets attributable to holders of redeemable unitsAdjustments for: Net realized (gain) loss on sale of investments and derivatives Unrealized foreign exchange (gain) loss on cash Commissions and other portfolio transaction costs Change in unrealized (appreciation) depreciation in value of
investments and derivatives Proceeds from sale and maturity of investments and derivatives Purchase of investments and derivatives (Increase) decrease in cash collateral on deposit for short sale Non-cash distributions from investments Change in daily variation margin (Increase) decrease in dividends receivable (Increase) decrease in interest receivable (Increase) decrease in securities lending revenue receivable Increase (decrease) in management fees payable Increase (decrease) in administration fees payable Change in other accounts receivable and payableNet cash from (used in) operating activities
Cash flows from (used in) financing activitiesDistributions paid to holders of redeemable units, net of reinvested distributionsProceeds from issuance of redeemable unitsAmounts paid on redemption of redeemable unitsNet cash from (used in) financing activities Unrealized foreign exchange gain (loss) on cashNet increase (decrease) in cashCash (bank overdraft), beginning of periodCash (bank overdraft), end of period
Supplementary Information:Dividends received, net of withholding tax*Interest received, net of withholding tax*Dividends paid*Interest paid*Tax recoverable (paid)

– 196 –
CI Global Enhanced Government Bond Private Pool
Semi-Annual Financial Statements - September 30, 2021
Percentages shown relate investments at fair value to net assets attributable to holders of redeemable units of the Fund.
Schedule of Investment Portfolio as at September 30, 2021 (unaudited)
Number ofUnits/Sharesor Par Value Description
Average Cost($)
Fair Value($)
% of Net Assets
CANADA 55,000 Bank of Montreal 1.551%, May 28, 2026 55,062 54,550 75,000 Bell Canada Inc., 1.65%, August 16, 2027 73,336 72,984 75,000 Bell Canada Inc., 2.5%, May 14, 2030 77,534 74,155 90,000 Bell Canada Inc., 2.7%, February 27, 2024 93,156 92,913 75,000 Canadian Imperial Bank of Commerce 2.35%, August 28, 2024 77,551 77,198 40,000 Canadian National Railway Co., 3%, February 08, 2029 42,281 42,246 15,000 Canadian Natural Resources Ltd., 1.45%, November 16, 2023 15,082 15,069 10,000 Canadian Tire Corp., Ltd., 3.167%, July 06, 2023 10,188 10,346 95,000 Corus Entertainment Inc., 5%, May 11, 2028 95,000 95,950 710,000 Government of Canada 0.25%, August 01, 2022 709,831 709,794 1,155,000 Government of Canada 0.25%, February 01, 2023 1,156,278 1,152,603 2,405,000 Government of Canada 0.25%, March 01, 2026 2,337,620 2,323,035 875,000 Government of Canada 0.25%, November 01, 2022 876,269 874,061 1,350,000 Government of Canada 0.5%, December 01, 2030 1,248,153 1,238,474 260,000 Government of Canada 0.5%, September 01, 2025 261,753 255,413 590,000 Government of Canada 1%, June 01, 2027 590,284 585,050 1,520,000 Government of Canada 1.25%, June 01, 2030 1,605,195 1,500,611 1,585,000 Government of Canada 1.25%, March 01, 2025 1,644,348 1,605,746 190,000 Government of Canada 1.25%, November 01, 2021 192,677 190,152 65,000 Government of Canada 1.5%, June 01, 2026 67,825 66,340 980,000 Government of Canada 1.5%, May 01, 2022 1,002,947 987,130 2,155,000 Government of Canada 1.5%, September 01, 2024 2,180,821 2,201,655 1,515,000 Government of Canada 2%, December 01, 2051 1,613,744 1,520,227 825,000 Government of Canada 2%, June 01, 2028 866,082 864,863 40,000 Government of Canada 2%, September 01, 2023 41,518 41,093 510,000 Government of Canada 2.25%, June 01, 2029 570,778 544,965 45,000 Government of Canada 2.5%, June 01, 2024 48,269 47,147 400,000 Government of Canada 2.75%, December 01, 2048 479,484 466,472 45,000 Hydro One Inc., 2.16%, February 28, 2030 46,833 44,873 30,000 Kruger Products L.P., 5.375%, April 09, 2029 30,000 30,712 135,000 OMERS Realty Corp., 1.298%, September 22, 2023 135,001 135,738 55,000 Parkland Corp., 3.875%, June 16, 2026 55,000 55,974 100,000 Penske Truck Leasing Canada Inc., 2.7%, September 30, 2024 98,861 103,034 45,000 Rogers Communications Inc., 3.65%, March 31, 2027 48,406 47,838 30,000 Royal Bank of Canada 1.589%, May 04, 2026 30,117 29,831 80,000 Royal Bank of Canada 2.609%, November 01, 2024 83,481 83,060 45,000 Royal Bank of Canada, FRN, 4.5%, November 24, 2080 45,000 47,743 155,000 Saputo Inc., 1.415%, June 19, 2026 155,000 151,338 80,000 Saputo Inc., 1.939%, June 13, 2022 80,980 80,642 25,000 Superior Plus L.P., 4.25%, May 18, 2028 25,000 25,708 15,000 TELUS Corp., 3.15%, February 19, 2030 15,881 15,569 60,000 The Bank of Nova Scotia 2.16%, February 03, 2025 61,766 61,475 50,000 Thomson Reuters Corp., 2.239%, May 14, 2025 50,000 51,063 95,000 Toronto-Dominion Bank, FRN, 3.6%, October 31, 2081 95,000 94,938 100,000 Videotron Ltd., 3.125%, January 15, 2031 98,525 94,708 35,000 Videotron Ltd., 3.625%, June 15, 2028 35,000 35,277 19,222,917 18,899,763 50.98 U.S.A. USD 120,000 Activision Blizzard Inc., 1.35%, September 15, 2030 148,826 140,876 USD 215,000 Amazon.com Inc., 2.5%, June 03, 2050 267,423 254,772 USD 65,000 American Tower Corp., 1.875%, October 15, 2030 83,154 79,036 USD 15,000 American Tower Corp., 2.3%, September 15, 2031 18,877 18,749 10,000 Apple Inc., 2.513%, August 19, 2024 10,253 10,378 USD 60,000 Apple Inc., 2.7%, August 05, 2051 74,780 73,781 USD 50,000 Bank of America Corp., 1.898%, July 23, 2031 62,426 61,039 USD 35,000 Bank of America Corp., 2.496%, February 13, 2031 46,847 44,840

– 197 –
CI Global Enhanced Government Bond Private Pool
Semi-Annual Financial Statements - September 30, 2021
Percentages shown relate investments at fair value to net assets attributable to holders of redeemable units of the Fund.
Schedule of Investment Portfolio as at September 30, 2021 (unaudited) (cont’d)
U.S.A. (cont’d) USD 30,000 Bank of America Corp., 2.651%, March 11, 2032 37,921 38,671 USD 10,000 Bank of America Corp., FRN, 2.299%, July 21, 2032 12,610 12,486 USD 5,000 Broadcom Inc., 2.45%, February 15, 2031 6,325 6,140 USD 180,000 Cablevision Lightpath LLC 3.875%, September 15, 2027 227,923 224,031 USD 55,000 Carrier Global Corp., 2.242%, February 15, 2025 72,943 72,182 USD 205,000 CCO Holdings LLC/CCO Holdings Capital Corp., 4%, March 01, 2023 271,163 261,191 USD 40,000 Cox Communications Inc., 2.6%, June 15, 2031 48,058 51,258 USD 20,000 Crown Castle International Corp., 3.7%, June 15, 2026 28,798 27,649 USD 90,000 CSC Holdings LLC 4.5%, November 15, 2031 114,741 112,711 USD 65,000 CVS Health Corp., 1.75%, August 21, 2030 84,201 78,896 USD 15,000 CVS Health Corp., 2.125%, September 15, 2031 18,633 18,658 USD 80,000 Freeport-McMoRan Inc., 4.125%, March 01, 2028 100,989 105,127 USD 35,000 Goldman Sachs Group Inc., FRN, 2.383%, July 21, 2032 44,100 43,907 USD 55,000 Goldman Sachs Group Inc., FRN, 2.615%, April 22, 2032 71,216 70,420 USD 45,000 Humana Inc., 2.15%, February 03, 2032 56,032 55,656 USD 35,000 Intercontinental Exchange Inc., 3%, June 15, 2050 46,033 44,004 100,000 JPMorgan Chase & Co., 1.896%, March 05, 2028 100,000 99,470 USD 45,000 JPMorgan Chase & Co., FRN, 1.953%, February 04, 2032 56,396 54,960 USD 160,000 Kraft Heinz Foods Co., 3.875%, May 15, 2027 220,102 221,293 USD 35,000 Oracle Corp., 2.875%, March 25, 2031 47,029 45,687 USD 130,000 Oracle Corp., 3.6%, April 01, 2050 191,849 164,795 USD 75,000 PepsiCo Inc., 2.875%, October 15, 2049 105,067 96,598 USD 30,000 Pharmacia & Upjohn Inc., 1.125%, June 22, 2022 40,686 38,204 USD 120,000 SBA Communications Corp., 3.125%, February 01, 2029 147,649 147,051 USD 75,000 Scripps Escrow II Inc., 3.875%, January 15, 2029 91,268 95,445 USD 40,000 TerraForm Power Operating LLC 4.75%, January 15, 2030 51,864 53,149 USD 200,000 United States Treasury Inflation Indexed Bonds 0.94604%, January 15, 2029 278,523 316,371 USD 10,000 United States Treasury Note/Bond 0.375%, December 31, 2025 12,752 12,409 USD 200,000 United States Treasury Note/Bond 0.625%, July 31, 2026 249,832 249,182 USD 475,000 United States Treasury Note/Bond 0.75%, April 30, 2026 580,626 596,884 USD 385,000 United States Treasury Note/Bond 0.75%, January 31, 2028 482,763 473,314 USD 90,000 United States Treasury Note/Bond 0.75%, May 31, 2026 111,264 113,000 USD 25,000 United States Treasury Note/Bond 0.875%, November 15, 2030 31,290 30,026 USD 90,000 United States Treasury Note/Bond 1.125%, February 29, 2028 112,731 113,223 USD 2,510,000 United States Treasury Note/Bond 1.25%, August 15, 2031 3,122,138 3,098,426 USD 60,000 United States Treasury Note/Bond 1.25%, May 31, 2028 74,747 75,832 USD 25,000 United States Treasury Note/Bond 1.625%, November 15, 2050 27,779 28,373 USD 175,000 United States Treasury Note/Bond 1.75%, June 30, 2024 230,290 229,481 USD 165,000 United States Treasury Note/Bond 1.875%, February 15, 2051 202,486 198,800 USD 150,000 United States Treasury Note/Bond 1.875%, June 30, 2026 197,283 198,167 USD 355,000 United States Treasury Note/Bond 2%, August 15, 2051 460,122 440,647 55,000 Verizon Communications Inc., 2.375%, March 22, 2028 54,915 55,378 80,000 Verizon Communications Inc., 2.5%, May 16, 2030 79,828 79,518 USD 135,000 Verizon Communications Inc., 2.875%, November 20, 2050 175,945 159,290 105,000 Verizon Communications Inc., 3.625%, May 16, 2050 110,260 99,806 USD 40,000 Waste Management Inc., 1.5%, March 15, 2031 52,049 47,578 9,653,805 9,538,815 25.72 U.K. USD 75,000 AstraZeneca PLC 1.375%, August 06, 2030 100,080 90,363 0.24
Number ofUnits/Sharesor Par Value Description
Average Cost($)
Fair Value($)
% of Net Assets

– 198 –
CI Global Enhanced Government Bond Private Pool
Semi-Annual Financial Statements - September 30, 2021
‡Credit ratings are obtained from S&P Global Ratings, where available, otherwise ratings are obtained from: Moody’s Investors Service or Dominion Bond Rating Service.Percentages shown relate investments at fair value to net assets attributable to holders of redeemable units of the Fund.
Schedule of Investment Portfolio as at September 30, 2021 (unaudited) (cont’d)
SHORT-TERM INVESTMENT(S) 2,000,000 Royal Bank of Canada 0.214%, October 15, 2021 1,999,660 1,999,660 5.39Commissions and other portfolio transaction costs - Total Investment Portfolio before Derivative Instruments 30,976,462 30,528,601 82.33Foreign Currency Forward Contract(s) (see Schedule A) (55,507) (0.15)Short Futures Contract(s) (see Schedule B) 26,888 0.07Total Investment Portfolio 30,976,462 30,499,982 82.25Other Net Assets (Liabilities) 6,581,975 17.75Net Assets Attributable to Holders of Redeemable Units 37,081,957 100.00
Principal amounts stated in:USD U.S. Dollar
Number ofUnits/Sharesor Par Value Description
Average Cost($)
Fair Value($)
% of Net Assets
Schedule AForeign Currency Forward Contract(s)
CounterpartyCredit Rating of the Counterparty‡ Settlement Date
Currency Buy Position
Currency Sell Position
Contract(s) Rate
Unrealized Gain (Loss) ($)
Royal Bank of Canada A-1+ October 15, 2021 CAD 12,785,649 USD 10,138,120 1.26 (55,507) Total Foreign Currency Forward Contract(s) Value (55,507)
Schedule BShort Futures Contract(s)
Contract(s) Future(s) Expiry Date Price ($) Currency Contract Value ($) Fair Value ($)(6) CBOT US Long Bond December 21, 2021 159.22 USD (1,236,887) (1,209,999) (1,236,887) (1,209,999)Exercise Price ($) (1,236,887)Total Short Futures Contract(s) Value 26,888

– 199 –
CI Global Enhanced Government Bond Private Pool
Semi-Annual Financial Statements - September 30, 2021
The accompanying notes are an integral part of these financial statements.
Offsetting of Financial Instruments (Note 2)
The following tables show the net impact on the Fund’s Statements of Financial Position if all rights to offset were exercised.
as at September 30, 2021Amounts Eligible for Offset
Gross Assets/(Liabilities)
FinancialInstruments
CollateralReceived/(Paid)
NetExposure
(in $000’s) (in $000’s) (in $000’s) (in $000’s)Derivative assets - Foreign currency forward contracts - - - -Derivative assets - Swaps and swaptions - - - -Total - - - -Derivative liabilities - Foreign currency forward contracts (56) - - (56)Derivative liabilities - Swaps and swaptions - - - -Total (56) - - (56)
as at March 31, 2021Amounts Eligible for Offset
Gross Assets/(Liabilities)
FinancialInstruments
CollateralReceived/(Paid)
NetExposure
(in $000’s) (in $000’s) (in $000’s) (in $000’s)Derivative assets - Foreign currency forward contracts 104 - - 104Derivative assets - Swaps and swaptions - - - -Total 104 - - 104Derivative liabilities - Foreign currency forward contracts - - - -Derivative liabilities - Swaps and swaptions - - - -Total - - - -
Fund Specific Notes to Financial Statements (unaudited)

– 200 –
CI Global Enhanced Government Bond Private Pool
Semi-Annual Financial Statements - September 30, 2021
Redeemable Unit Transactions (Note 4)for the periods ended September 30
Number of redeemable units at the beginning of periodRedeemable units issued for cashRedeemable units issued for reinvested distributionsRedeemable units redeemedNumber of redeemable units at the end of period
Fund Specific Notes to Financial Statements (unaudited)
†A portion of brokerage commissions paid was used to cover research and market data services, termed soft dollar commissions. This amount has been estimated by the Manager of the Fund.The accompanying notes are an integral part of these financial statements.
Commissions (Note 2)for the periods ended September 30 (in $000’s)
2021 2020Brokerage commissions - -Soft dollar commissions† - -
Series A 2021 2020 600,985 500,410 26,153 560,344 60 348 (261,976) (318,489) 365,222 742,613
Series F 2021 2020 3,846,400 3,859,338 1,015,767 6,018,304 5,939 3,282 (1,671,229) (708,931) 3,196,877 9,171,993
Series I 2021 2020 22,053 22,245 98,788 - 637 37 (414) (1,035) 121,064 21,247

– 201 –
CI Global Enhanced Government Bond Private Pool
Semi-Annual Financial Statements - September 30, 2021
The accompanying notes are an integral part of these financial statements.
Fund Specific Notes to Financial Statements (unaudited)
Securities Lending (Note 6)as at September 30 (in $000’s)
2021 2020Loaned 13,959 35,839Collateral (non-cash) 14,238 36,556
Securities Lending Revenue Reconciliation (Note 6)for the periods ended September 30 (in $000’s)
2021 2020Gross securities lending revenue 6 7Charges (1) (1)Securities lending revenue 5 6Charges as a % of gross securities lending revenue 16.7 14.3
Management and Administration Fees (Note 5) as at September 30, 2021 (%)
Annual management
fee rate:
Annual administration
fee rate:
Series A 1.050 0.15Series F 0.550 0.15Series I Paid directly by investor Paid directly by investor

– 202 –
CI Global Enhanced Government Bond Private Pool
Semi-Annual Financial Statements - September 30, 2021
The accompanying notes are an integral part of these financial statements.
Other Price RiskAs at September 30, 2021 and March 31, 2021, the Fund did not invest in equities and therefore was not subject to other price risk.
Currency RiskThe tables below summarize the Fund’s exposure to currency risk.
as at September 30, 2021~
Currency
Financial Instruments Exposure Derivatives
Net Exposure
Net Assets
(%)(in $000’s) (in $000’s) (in $000’s)U.S. Dollar 12,505 (12,841) (336) (0.9)Total 12,505 (12,841) (336) (0.9)
as at March 31, 2021~
Currency
Financial Instruments Exposure Derivatives
Net Exposure
Net Assets
(%)(in $000’s) (in $000’s) (in $000’s)U.S. Dollar 17,449 (17,749) (300) (0.7)Total 17,449 (17,749) (300) (0.7)
~Includes monetary and non-monetary instruments, if any.
As at September 30, 2021, had the Canadian dollar strengthened or weakened by 10% (March 31, 2021 - 10%) in relation to all other foreign currencies held in the Fund, with all other variables held constant, net assets attributable to holders of redeemable units of the Fund would have decreased or increased, respectively, by approximately $34,000 (March 31, 2021 - $30,000). In practice, actual results may differ from this analysis and the difference may be material.
Interest Rate RiskThe tables below summarize the Fund’s exposure to interest rate risk, categorized by the contractual maturity date.
as at September 30, 2021
Less than1 Year
1 - 3Years
3 - 5Years
Greaterthan
5 Years Total
(in $000’s) (in $000’s) (in $000’s) (in $000’s) (in $000’s)Interest Rate Exposure 4,006 5,252 6,007 15,264 30,529
as at March 31, 2021
Less than1 Year
1 - 3Years
3 - 5Years
Greaterthan
5 Years Total
(in $000’s) (in $000’s) (in $000’s) (in $000’s) (in $000’s)Interest Rate Exposure 2,803 5,321 7,492 22,029 37,645
As at September 30, 2021, had the prevailing interest rates increased or decreased by 0.25% (March 31, 2021 - 0.25%), with all other variables held constant, net assets attributable to holders of redeemable units of the Fund would have decreased or increased, respectively, by approximately $383,000 (March 31, 2021 - $544,000). In practice, actual results may differ from this analysis and the difference may be material.
Financial Instruments Risks (Note 10)
Concentration RiskFor Concentration Risk as at September 30, 2021, refer to the Schedule of Investment Portfolio.
The table below summarizes the Fund’s exposure to concentration risk.
as at March 31, 2021Categories Net Assets (%)Long PositionsCanada 48.3 U.S.A. 31.2 Other Net Assets (Liabilities) 15.4 Short-Term Investment(s) 4.5 U.K. 0.3 Foreign Currency Forward Contract(s) 0.2 Total Long Positions 99.9
Short PositionsFutures Contract(s) 0.1 Total Short Positions 0.1 Total 100.0
Credit RiskThe Fund was invested in fixed income securities, preferred securities and derivative instruments, if any, with the following credit ratings, as per the tables below.
as at September 30, 2021Credit Rating^* Net Assets (%)AAA/Aaa/A++ 68.4AA/Aa/A+ 1.7A 2.7BBB/Baa/B++ 5.8BB/Ba/B+ 3.5B 0.7Total 82.8
as at March 31, 2021Credit Rating^* Net Assets (%)AAA/Aaa/A++ 64.1AA/Aa/A+ 3.4A 3.5BBB/Baa/B++ 6.0BB/Ba/B+ 7.1B 1.0Total 85.1
^Credit ratings are obtained from S&P Global Ratings, where available, otherwise ratings are obtained from: Moody’s
Investors Service or Dominion Bond Rating Service, respectively.
*Refer to Note 10 for Credit Rating Chart reference.
Fund Specific Notes to Financial Statements (unaudited)

– 203 –
CI Global Enhanced Government Bond Private Pool
Semi-Annual Financial Statements - September 30, 2021
The accompanying notes are an integral part of these financial statements.
Fair Value Hierarchy
The tables below summarize the inputs used by the Fund in valuing the Fund’s investments and derivatives carried at fair value.
Long Positions at fair value as at September 30, 2021Level 1 Level 2 Level 3 Total
(in $000’s) (in $000’s) (in $000’s) (in $000’s)Bonds - 28,529 - 28,529 Short-term investment(s) - 2,000 - 2,000 Foreign currency forward contract(s), net - (56) - (56)Total - 30,473 - 30,473
Short Positions at fair value as at September 30, 2021Level 1 Level 2 Level 3 Total
(in $000’s) (in $000’s) (in $000’s) (in $000’s)Futures contract(s), net 27 - - 27 Total 27 - - 27
Long Positions at fair value as at March 31, 2021Level 1 Level 2 Level 3 Total
(in $000’s) (in $000’s) (in $000’s) (in $000’s)Bonds - 35,645 - 35,645 Short-term investment(s) - 2,000 - 2,000 Foreign currency forward contract(s), net - 104 - 104 Total - 37,749 - 37,749
Short Positions at fair value as at March 31, 2021Level 1 Level 2 Level 3 Total
(in $000’s) (in $000’s) (in $000’s) (in $000’s)Futures contracts, net 46 - - 46 Total 46 - - 46
There were no transfers between Level 1, 2 and 3 during the period ended September 30, 2021 and the year ended March 31, 2021.
Fund Specific Notes to Financial Statements (unaudited)

– 204 –
CI Global High Yield Credit Private Pool
Semi-Annual Financial Statements - September 30, 2021
Statements of Financial Position (in $000’s except for per unit amounts and units outstanding)
as at as at Sept. 30, 2021 Mar. 31, 2021 11,509 11,508 - - 251 1,546
12 17 - - - - - - - - 1 - 135 129 - - - - - 13 25 - 11,933 13,213
- - - -
38 24 - - - - - - - - 136 1,005 - - - - - - - - - - 174 1,029
11,759 12,184
Statements of Financial Position (cont’d)(in $000’s except for per unit amounts and units outstanding)
Net assets attributable to holders of redeemable units
per Series (Note 4):
Net assets attributable to holders of redeemable
units per unit: Number of redeemable
units outstanding:
as at Sept. 30, 2021
as at Mar. 31, 2021
as at Sept. 30, 2021
as at Mar. 31, 2021
as at Sept. 30, 2021
as at Mar. 31, 2021
Series A 1,212 1,343 10.48 10.31 115,652 130,266Series F 10,546 10,840 10.50 10.32 1,003,990 1,050,348Series I 1 1 10.54 10.34 128 125
AssetsCurrent assetsInvestmentsInvestments pledged as collateralCashUnrealized gain on futures and foreign currency forward contractsSwaps, swaptions and optionsDaily variation margin on derivative instrumentsFees rebate receivableCash collateral on deposit for short saleDividends receivableInterest receivableReceivable for distribution from investmentsSecurities lending revenue receivable (Note 6)Receivable for investments soldReceivable for unit subscriptions
LiabilitiesCurrent liabilitiesInvestments sold shortBank overdraftUnrealized loss on futures and foreign currency forward contractsSwaps, swaptions and options Dividends payable on investments sold shortInterest payable on investments sold shortDaily variation margin on derivative instrumentsPayable for investments purchasedPayable for unit redemptionsDistributions payable to holders of redeemable units Management fees payableAdministration fees payableAccounts payable and accrued liabilities
Net assets attributable to holders of redeemable units
The accompanying notes are an integral part of these financial statements.
Financial Statements (unaudited)
CIG - 2059

– 205 –
CI Global High Yield Credit Private Pool
Semi-Annual Financial Statements - September 30, 2021
Statements of Comprehensive Incomefor the periods ended September 30(in $000’s except for per unit amounts and number of units)
2021 2020
13 1 321 41 - - - - - -
- - - -
(9) (48)
214 237 539 231 7 (3) - - - - - - 7 (3) 546 228
37 6 8 - 1 1 1 1 - - - - - - - - 1 - 5 - - - 53 8
493 220
The accompanying notes are an integral part of these financial statements.
Financial Statements (unaudited)
Statements of Comprehensive Income (cont’d)for the periods ended September 30(in $000’s except for per unit amounts and number of units)
Increase (decrease) in net assets attributable to
holders of redeemable units per Series:
Increase (decrease) in net assets attributable to
holders of redeemable units per unit:
Weighted average number of units:
2021 2020 2021 2020 2021 2020Series A 51 158 0.40 1.38 126,638 114,555Series F 442 62 0.43 1.62 1,033,313 38,027Series I - - 0.48 1.77 126 343
Income Net gain (loss) on investments and derivatives Dividends Interest for distribution purposes Income distributions from investments Capital gain distributions from investments Derivative income (loss) Dividends expense on financial assets (liabilities) sold
short Interest expense on financial assets (liabilities) sold short Net realized gain (loss) on sale of investments and
derivatives Change in unrealized appreciation (depreciation) in value
of investments and derivativesTotal net gain (loss) on investments and derivativesOther income Foreign exchange gain (loss) on cash Commitment fee income Securities lending revenue (Note 6) Fees rebateTotal other incomeTotal incomeExpensesManagement fees (Note 5)Administration fees (Note 5)Commissions and other portfolio transaction costsIndependent review committee feesSecurities borrowing fees (Note 2)Margin feesService feesInterest expenseWithholding taxesHarmonized sales taxOther expensesTotal expensesIncrease (decrease) in net assets attributable to holders of redeemable units

– 206 –
CI Global High Yield Credit Private Pool
Semi-Annual Financial Statements - September 30, 2021
Statements of Changes in Net Assets Attributable to Holders of Redeemable Units for the periods ended September 30 (in $000’s)
Net assets attributable to holders of redeemable units at the beginning of periodIncrease (decrease) in net assets attributable to holders of redeemable unitsDistributions to holders of redeemable units From net investment income From net realized gains Return of capitalTotal distributions to holders of redeemable units
Redeemable unit transactions Proceeds from redeemable units issued Reinvestment of distributions to holders of redeemable units Redemption of redeemable unitsNet increase (decrease) from redeemable unit transactionsNet increase (decrease) in net assets attributable to holders of redeemable unitsNet assets attributable to holders of redeemable units at the end of period
The accompanying notes are an integral part of these financial statements.
Financial Statements (unaudited)
Series A 2021 2020 1,343 880 51 158
(28) (27) - - - - (28) (27)
44 317 28 27 (226) (67) (154) 277 (131) 408 1,212 1,288
Series F 2021 2020 10,840 376 442 62
(246) (9) - - - - (246) (9)
695 - 246 9 (1,431) (282) (490) (273) (294) (220) 10,546 156
Series I 2021 2020 1 9 - -
- - - - - - - -
- - - - - (8) - (8) - (8) 1 1
Total Fund 2021 2020 12,184 1,265 493 220
(274) (36) - - - - (274) (36)
739 317 274 36 (1,657) (357) (644) (4) (425) 180 11,759 1,445

– 207 –
CI Global High Yield Credit Private Pool
Semi-Annual Financial Statements - September 30, 2021
Statements of Cash Flowsfor the periods ended September 30 (in $000’s)
2021 2020
493 220
9 48 6 - 1 1
(214) (237) 2,716 667 (3,350) (678) - - - - - - (1) - (6) (1) - - - - - - - - (346) 20
- - 714 317 (1,657) (357) (943) (40)
(6) - (1,289) (20) 1,546 75 251 55
12 1 314 43 - - - - - -
*Dividends and interest received as well as dividends and interest paid relate to operating activities of the Fund. The accompanying notes are an integral part of these financial statements.
Financial Statements (unaudited)
Cash flows from (used in) operating activitiesIncrease (decrease) in net assets attributable to holders of redeemable unitsAdjustments for: Net realized (gain) loss on sale of investments and derivatives Unrealized foreign exchange (gain) loss on cash Commissions and other portfolio transaction costs Change in unrealized (appreciation) depreciation in value of
investments and derivatives Proceeds from sale and maturity of investments and derivatives Purchase of investments and derivatives (Increase) decrease in cash collateral on deposit for short sale Non-cash distributions from investments Change in daily variation margin (Increase) decrease in dividends receivable (Increase) decrease in interest receivable (Increase) decrease in securities lending revenue receivable Increase (decrease) in management fees payable Increase (decrease) in administration fees payable Change in other accounts receivable and payableNet cash from (used in) operating activities
Cash flows from (used in) financing activitiesDistributions paid to holders of redeemable units, net of reinvested distributionsProceeds from issuance of redeemable unitsAmounts paid on redemption of redeemable unitsNet cash from (used in) financing activities Unrealized foreign exchange gain (loss) on cashNet increase (decrease) in cashCash (bank overdraft), beginning of periodCash (bank overdraft), end of period
Supplementary Information:Dividends received, net of withholding tax*Interest received, net of withholding tax*Dividends paid*Interest paid*Tax recoverable (paid)

– 208 –
CI Global High Yield Credit Private Pool
Semi-Annual Financial Statements - September 30, 2021
Percentages shown relate investments at fair value to net assets attributable to holders of redeemable units of the Fund.
Schedule of Investment Portfolio as at September 30, 2021 (unaudited)
Number ofUnits/Sharesor Par Value Description
Average Cost($)
Fair Value($)
% of Net Assets
CANADA USD 30,000 Air Canada 2021-1 Class C Pass Through Trust 10.5%, July 15, 2026 46,390 46,832 USD 5,000 Air Canada 3.875%, August 15, 2026 6,297 6,394 USD 84,000 Air Canada 4%, July 01, 2025 169,243 152,625 50,000 Air Canada 4.625%, August 15, 2029 50,138 50,271 USD 20,000 Air Canada, Term Loan B, Private Placement, variable rate, July 27, 2028 24,934 25,469 100 Bank of Montreal, Preferred 3.9%, Series 29 2,068 2,441 100 Bank of Montreal, Preferred 4.4%, Series 42 2,530 2,571 75 Bank of Montreal, Preferred 4.5%, Series 40 1,905 1,922 725 BCE Inc., Preferred 4.4%, Series AF 16 13,054 14,486 50 BCE Inc., Preferred 5.54%, Series AC 940 1,008 1,025 BCE Inc., Preferred 5.55%, Series 19 16,409 19,485 75 BCE Inc., Preferred 6.174%, Series R 1,291 1,388 2,200 BCE Inc., Preferred, Series AB 36,802 40,898 50 Brookfield Asset Management Inc., Preferred, Series 3, Class A 1,146 1,260 50 Brookfield Office Properties Inc., Preferred 4.85%, Series GG 1,021 1,158 100 Brookfield Office Properties Inc., Preferred 5.1%, Series EE 2,156 2,404 50 Brookfield Office Properties Inc., Preferred 5.15%, Series P 824 926 100 Brookfield Office Properties Inc., Preferred 6%, Series CC 2,482 2,643 400 Brookfield Renewable Power Preferred Equity Inc., Preferred 5%, Series 6 9,538 10,220 USD 11,000 Brookfield Residential Properties Inc., 4.875%, February 15, 2030 14,669 14,229 30,000 Brookfield Residential Properties Inc., 5.125%, June 15, 2029 30,000 30,275 1,208 Calfrac Well Services Ltd. 19,864 4,228 USD 190,562 Canada Goose Inc., Term Loan, Private Placement, variable rate, October 07, 2027 239,821 242,270 150 Canadian Utilities Ltd., Preferred 4.5%, Series FF 3,916 4,016 175 Canadian Utilities Ltd., Preferred 4.9%, Series BB 4,358 4,504 15,000 Canadian Western Bank 5%, July 31, 2081 15,000 15,265 2,000 Canadian Western Bank 6%, April 30, 2081 2,013 2,148 150 Capital Power Corp., Preferred 4.5%, Series 5 3,181 3,630 100 Capital Power Corp., Preferred 4.6%, Series 3 2,190 2,525 50 Capital Power Corp., Preferred 5.75%, Series 9 1,271 1,280 14,000 CES Energy Solutions Corp., 6.375%, October 21, 2024 13,556 14,392 123,000 Cineplex Inc., 5.75%, September 30, 2025 175,446 170,970 141,000 Cineplex Inc., 7.5%, February 26, 2026 145,668 149,284 100,000 Dye & Durham Ltd., 3.75%, March 01, 2026 101,625 101,096 400 Element Financial Corp., Preferred 6.6%, Series A 10,321 10,512 500 Emera Inc., Preferred 4.60%, Series L 12,500 12,800 USD 94,000 Empire Communities Corp., 7%, December 15, 2025 123,343 124,566 229,000 Empire Communities Corp., 7.375%, December 15, 2025 237,094 240,307 USD 194,000 Enbridge Inc., 5.5%, July 15, 2077 243,110 263,272 50 Enbridge Inc., Preferred 4%, Series 1 1,274 1,432 125 Enbridge Inc., Preferred 4%, Series 3 2,047 2,248 75 Enbridge Inc., Preferred 4%, Series D 1,239 1,383 100 Enbridge Inc., Preferred 4%, Series N 1,880 2,073 75 Enbridge Inc., Preferred 4%, Series R 1,277 1,418 100 Enbridge Inc., Preferred 4.4%, Series 9 1,746 1,961 75 Enbridge Inc., Preferred, Series P 1,287 1,436 USD 195,000 Fairfax India Holdings Corp., 5%, February 26, 2028 243,448 246,713 60,000 Falcon Holding Acquisition Corp., 6.125%, June 30, 2031 60,000 60,312 USD 187,000 First Quantum Minerals Ltd., 6.875%, March 01, 2026 241,003 246,623 243,000 Gibson Energy Inc., 5.25%, December 22, 2080 239,668 247,202 USD 45,000 goeasy Ltd., 4.375%, May 01, 2026 56,259 58,635 375 Great-West Lifeco Inc., Preferred 4.85%, Series H 9,369 9,611 100 Great-West Lifeco Inc., Preferred 5.15%, Series T 2,584 2,699 100 Great-West Lifeco Inc., Preferred 5.25%, Series S 2,574 2,699 USD 88,000 Husky III Holding Ltd., 13%, February 15, 2025 119,866 118,794 17,000 Inter Pipeline Ltd., 6.625%, November 19, 2079 17,000 18,464

– 209 –
CI Global High Yield Credit Private Pool
Semi-Annual Financial Statements - September 30, 2021
Percentages shown relate investments at fair value to net assets attributable to holders of redeemable units of the Fund.
Schedule of Investment Portfolio as at September 30, 2021 (unaudited) (cont’d)
Number ofUnits/Sharesor Par Value Description
Average Cost($)
Fair Value($)
% of Net Assets
CANADA (cont’d) 223,000 Inter Pipeline Ltd., 6.875%, March 26, 2079 233,768 245,936 4,000 Keyera Corp., 5.95%, March 10, 2081 4,006 4,189 222,000 Keyera Corp., 6.875%, June 13, 2079 236,907 247,399 100 Manulife Financial Corp., Preferred 4.40%, Series 9 2,483 2,524 600 Manulife Financial Corp., Preferred 4.65%, Series 2, Class A 14,974 15,264 350 Manulife Financial Corp., Preferred, Series 3, Class A 8,663 8,900 USD 195,000 Mattamy Group Corp., 4.625%, March 01, 2030 242,261 252,807 USD 4,000 MEG Energy Corp., 5.875%, February 01, 2029 5,095 5,189 USD 4,000 MEG Energy Corp., 7.125%, February 01, 2027 5,059 5,326 50 National Bank of Canada, Preferred 4.45%, Series 38 1,260 1,299 75 National Bank of Canada, Preferred 4.95%, Series 42 1,856 1,934 USD 97,000 Northriver Midstream Finance L.P., 5.625%, February 15, 2026 124,675 128,029 USD 8,000 NOVA Chemicals Corp., 5%, May 01, 2025 10,860 10,734 250,000 NuVista Energy Ltd., 7.875%, July 23, 2026 247,472 253,718 13,000 Parkland Corp., 3.875%, June 16, 2026 13,000 13,230 5,000 Parkland Corp., 4.375%, March 26, 2029 5,000 5,090 USD 40,000 Parkland Corp., 4.5%, October 01, 2029 50,376 51,416 6,000 Parkland Corp., 6%, June 23, 2028 6,000 6,464 249,000 Pembina Pipeline Corp., 4.8%, January 25, 2081 242,395 249,205 750 Pembina Pipeline Corp., Preferred 4.9%, Series 21 18,286 19,185 250 Pembina Pipeline Corp., Preferred 5.25%, Series 23 6,301 6,498 100 Power Financial Corp., Preferred 4.2%, Series T 2,230 2,465 USD 13,000 Precision Drilling Corp., 6.875%, January 15, 2029 15,580 17,223 USD 182,000 Rockpoint Gas Storage Canada Ltd., 7%, March 31, 2023 232,084 234,266 50 Royal Bank of Canada, Preferred 3.6%, Series BD 1,198 1,254 325 Sagen MI Canada Inc., Preferred 5.40%, Series 1 8,272 8,957 300 Sun Life Financial Inc., Preferred 4.45%, Series 4 7,400 7,635 USD 194,000 Superior Plus L.P./Superior General Partner Inc., 4.5%, March 15, 2029 244,182 254,012 800 TC Energy Corp., Preferred 2.152%, Series 3 11,272 10,880 600 TC Energy Corp., Preferred 3.266%, Series 1 10,266 11,298 75 TC Energy Corp., Preferred 3.903%, Series 7 1,418 1,608 375 TC Energy Corp., Preferred 4.9%, Series 15 9,420 9,626 USD 16,000 Teine Energy Ltd., 6.875%, April 15, 2029 20,136 20,656 500 Toronto-Dominion Bank, Preferred 3.6%, Series 7 11,895 12,515 100 Toronto-Dominion Bank, Preferred 3.9%, Series 1 2,150 2,448 450 Toronto-Dominion Bank, Preferred 4.75%, Series 18 11,122 11,556 100 Toronto-Dominion Bank, Preferred 4.75%, Series 20 2,383 2,562 925 Toronto-Dominion Bank, Preferred 5.1%, Series 24 24,251 25,142 600 Toronto-Dominion Bank, Preferred, Series 3 13,532 14,694 75 TransAlta Corp., Preferred 5%, Series E 1,493 1,686 50 TransAlta Corp., Preferred, Series C 855 932 USD 66,000 Trulieve Cannabis Corp., 8%, October 06, 2026 84,229 83,595 4,986,700 5,089,019 43.27 U.S.A. USD 5,000 Academy Ltd., 6%, November 15, 2027 6,658 6,848 USD 45,000 Ally Financial Inc., FRN, 4.7%, December 31, 2049 54,304 59,704 USD 192,000 Alterra Mountain Co., Term Loan B, Private Placement, variable rate, July 30, 2028 242,562 242,959 USD 175,000 AMC Entertainment Holdings Inc., 10.5%, April 15, 2025 235,135 237,446 USD 81,000 American Airlines Group Inc., 6.5%, July 01, 2025 182,070 157,296 USD 181,000 American Airlines Inc./AAdvantage Loyalty IP Ltd., 5.75%, April 20, 2029 239,275 247,318 USD 10,000 AmWINS Group Inc., 4.875%, June 30, 2029 12,508 12,872 USD 86,000 Burford Capital Global Finance LLC 6.25%, April 15, 2028 109,841 115,580 USD 52,150 Calfrac Holdings L.P., 10.875%, March 15, 2026 51,091 50,691 110 California Resources Corp., Warrants (27 October 2024) - 1,672 USD 8,000 Carvana Co., 5.5%, April 15, 2027 10,095 10,355 USD 92,000 Carvana Co., 5.875%, October 01, 2028 117,605 120,483

– 210 –
CI Global High Yield Credit Private Pool
Semi-Annual Financial Statements - September 30, 2021
Percentages shown relate investments at fair value to net assets attributable to holders of redeemable units of the Fund.
Schedule of Investment Portfolio as at September 30, 2021 (unaudited) (cont’d)
Number ofUnits/Sharesor Par Value Description
Average Cost($)
Fair Value($)
% of Net Assets
U.S.A. (cont’d) USD 8,000 CCO Holdings LLC/CCO Holdings Capital Corp., 4.5%, May 01, 2032 11,015 10,437 USD 25,000 Cinemark Holdings Inc., 4.5%, August 15, 2025 44,337 50,635 USD 50,000 Cinemark USA Inc., 5.25%, July 15, 2028 58,812 62,471 USD 34,000 Coinbase Global Inc., 3.375%, October 01, 2028 42,938 41,503 USD 34,000 Coinbase Global Inc., 3.625%, October 01, 2031 42,810 41,288 USD 3,000 Colgate Energy Partners III LLC 5.875%, July 01, 2029 3,678 3,833 USD 4,000 CrownRock L.P./CrownRock Finance Inc., 5%, May 01, 2029 5,012 5,296 USD 214,000 DCP Midstream LLC, FRN, 5.85%, May 21, 2043 239,078 252,737 USD 144,500 Dresdner Funding Trust I 8.151%, June 30, 2031 254,728 262,134 USD 36,000 Fortress Transportation and Infrastructure Investors LLC 5.5%, May 01, 2028 45,556 46,113 USD 15,000 Fortress Transportation and Infrastructure Investors LLC 6.5%, October 01, 2025 20,254 19,618 USD 29,000 Fortress Transportation and Infrastructure Investors LLC 9.75%, August 01, 2027 40,670 41,644 USD 5,000 Genesis Energy L.P./Genesis Energy Finance Corp., 8%, January 15, 2027 6,500 6,438 USD 24,000 Genworth Holdings Inc., 4.9%, August 15, 2023 30,852 31,115 USD 75,000 H&E Equipment Services Inc., 3.875%, December 15, 2028 90,355 94,876 USD 5,000 Hilton Domestic Operating Co., Inc., 3.625%, February 15, 2032 6,368 6,246 USD 2,000 Howard Hughes Corp., 4.125%, February 01, 2029 2,547 2,543 USD 14,000 Howard Hughes Corp., 4.375%, February 01, 2031 17,519 17,859 USD 132,000 Howard Hughes Corp., 5.375%, August 01, 2028 171,626 176,386 USD 100,000 Imola Merger Corp., 4.75%, May 15, 2029 125,455 131,138 USD 2,000 LCM Investments Holdings II LLC 4.875%, May 01, 2029 2,523 2,602 USD 5,000 Leeward Renewable Energy Operations LLC 4.25%, July 01, 2029 6,155 6,445 USD 10,000 Match Group Holdings II, LLC 3.625%, October 01, 2031 12,762 12,518 USD 19,000 MetLife Capital Trust IV 7.875%, December 15, 2037 32,990 33,509 USD 8,000 MGM Growth Properties Operating Partnership L.P./MGP Finance 4.5%, January 15, 2028 10,467 11,090 USD 187,000 MGM Resorts International 4.75%, October 15, 2028 239,454 249,880 USD 11,000 MPH Acquisition Holdings LLC 5.5%, September 01, 2028 13,885 14,056 USD 103,000 MPH Acquisition Holdings LLC 5.75%, November 01, 2028 125,506 123,087 USD 2,000 Nationstar Mortgage Holdings Inc., 5.5%, August 15, 2028 2,677 2,613 USD 23,000 Navient Corp., 4.875%, March 15, 2028 30,113 29,571 USD 177,000 Navient Corp., 5%, March 15, 2027 218,305 230,859 USD 188,000 NGL Energy Operating LLC/NGL Energy Finance Corp., 7.5%, February 01, 2026 240,209 242,923 USD 193,000 Northern Oil and Gas Inc., 8.125%, March 01, 2028 237,073 261,540 USD 2,000 Occidental Petroleum Corp., 3.2%, August 15, 2026 2,063 2,589 USD 20,000 Park Intermediate Holdings LLC/PK Domestic Property LLC 4.875%, May 15, 2029 24,193 25,997 USD 92,000 Park Intermediate Holdings LLC/PK Domestic Property LLC 5.875%, October 01, 2028 118,712 123,103 USD 7,000 Penn National Gaming Inc., 4.125%, July 01, 2029 8,625 8,774 USD 9,000 PennyMac Financial Services Inc., 5.375%, October 15, 2025 12,084 11,738 USD 5,000 PennyMac Financial Services Inc., 5.75%, September 30, 2031 6,328 6,332 USD 8,000 Pilgrim’s Pride Corp., 4.25%, April 15, 2031 10,014 10,900 580 Pyxus International Inc. 2,128 1,627 USD 100,000 Quotient Ltd., 4.75%, January 01, 2026 120,675 126,659 USD 11,000 Rockcliff Energy II LLC 5.5%, October 15, 2029 13,943 14,159 USD 16,000 Scientific Games International Inc., 7%, May 15, 2028 20,376 21,887 USD 40,000 Suburban Propane Partners L.P./Suburban Energy Finance Corp., 5%, June 01, 2031 48,668 52,627 USD 20,000 Sunnova Energy Corp., 5.875%, September 01, 2026 24,741 25,840 USD 2,000 Targa Resources Partners L.P./Targa Resources Partners 4%, January 15, 2032 2,547 2,621 USD 15,000 Tempur Sealy International Inc., 3.875%, October 15, 2031 19,215 19,046 USD 25,000 Tenet Healthcare Corp., 4.25%, June 01, 2029 30,152 32,179 USD 10,000 United Airlines Inc., 4.375%, April 15, 2026 12,518 13,014 USD 10,000 United Airlines Inc., 4.625%, April 15, 2029 12,518 13,105 USD 39,900 United Airlines Inc., Term Loan B, Private Placement, variable rate, April 21, 2028 49,699 50,999 USD 4,000 United Shore Financial Services LLC 5.5%, November 15, 2025 5,326 5,113 USD 11,000 VOC Escrow Ltd., 5%, February 15, 2028 13,775 13,766

– 211 –
CI Global High Yield Credit Private Pool
Semi-Annual Financial Statements - September 30, 2021
Percentages shown relate investments at fair value to net assets attributable to holders of redeemable units of the Fund.
Schedule of Investment Portfolio as at September 30, 2021 (unaudited) (cont’d)Schedule of Investment Portfolio as at September 30, 2021 (unaudited) (cont’d)
U.S.A. (cont’d) USD 91,000 Wynn Las Vegas LLC/Wynn Las Vegas Capital Corp., 5.25%, May 15, 2027 116,613 116,578 USD 44,000 XHR L.P., 4.875%, June 01, 2029 53,781 57,309 4,422,067 4,544,189 38.64 LIBERIA USD 106,000 Royal Caribbean Cruises Ltd., 4.25%, June 15, 2023 178,136 189,305 USD 75,000 Royal Caribbean Cruises Ltd., 5.5%, April 01, 2028 94,319 97,301 USD 87,000 Royal Caribbean Cruises Ltd., 9.125%, June 15, 2023 119,900 119,897 392,355 406,503 3.46 BERMUDA USD 26,000 Aircastle Ltd., FRN, 5.25%, December 31, 2049 31,471 33,707 50 Brookfield Infrastructure Partners L.P., Preferred 5%, Series 7 1,249 1,276 100 Brookfield Renewable Partners L.P., Preferred 5%, Series 13 2,480 2,590 USD 31,000 NCL Corp., Ltd., 3.625%, December 15, 2024 36,781 37,350 USD 2,000 NCL Corp., Ltd., 5.875%, March 15, 2026 2,531 2,600 USD 236,000 NCL Finance Ltd., 6.125%, March 15, 2028 304,700 310,638 379,212 388,161 3.30 PANAMA USD 141,000 Carnival Corp., 5.75%, March 01, 2027 181,978 184,617 USD 2,000 Carnival Corp., 7.2%, October 01, 2023 2,429 2,726 USD 16,000 Carnival Corp., 7.625%, March 01, 2026 20,934 21,659 USD 82,000 Carnival Corp., 9.875%, August 01, 2027 119,664 119,996 325,005 328,998 2.80 BRITISH VIRGIN ISLANDS USD 198,000 Studio City Finance Ltd., 5%, January 15, 2029 248,684 231,604 1.97 NETHERLANDS USD 12,000 AerCap Holdings N.V., 5.875%, October 10, 2079 16,214 15,882 USD 141,000 ING Groep N.V., 4.875%, December 31, 2049 179,266 186,331 USD 20,000 UPC Broadband Finco B.V., 4.875%, July 15, 2031 25,240 25,968 220,720 228,181 1.94 SWITZERLAND USD 8,000 Credit Suisse Group AG 4.5%, December 31, 2049 10,338 9,955 USD 44,000 Credit Suisse Group AG 5.25%, December 31, 2049 57,393 58,447 USD 10,000 Credit Suisse Group AG 6.375%, December 31, 2049 13,314 13,933 USD 3,000 Credit Suisse Group AG 7.5%, December 31, 2049 4,114 4,072 USD 20,000 UBS Group AG, FRN, 3.875%, December 31, 2049 24,135 25,348 109,294 111,755 0.95 CAYMAN ISLANDS USD 53,000 Global Aircraft Leasing Co., Ltd., 6.5%, September 15, 2024 62,199 62,710 USD 5,000 Spirit Loyalty Cayman Ltd./Spirit IP Cayman Ltd., 8%, September 20, 2025 6,774 7,110 68,973 69,820 0.59 U.K. USD 2,000 Barclays PLC 6.125%, December 31, 2049 2,655 2,807 USD 15,000 Barclays PLC 6.278%, December 31, 2049 22,283 26,361 USD 15,000 NatWest Group PLC, FRN, 4.6%, December 31, 2049 18,464 19,138 43,402 48,306 0.41 FRANCE USD 15,000 Altice France S.A., 5.125%, July 15, 2029 18,794 18,684 USD 11,000 Altice France S.A., 5.5%, October 15, 2029 13,921 13,809 32,715 32,493 0.28 GERMANY USD 14,000 Cheplapharm Arzneimittel GmbH 5.5%, January 15, 2028 18,481 18,394 0.16
Number ofUnits/Sharesor Par Value Description
Average Cost($)
Fair Value($)
% of Net Assets

– 212 –
CI Global High Yield Credit Private Pool
Semi-Annual Financial Statements - September 30, 2021
Schedule of Investment Portfolio as at September 30, 2021 (unaudited) (cont’d)
‡Credit ratings are obtained from S&P Global Ratings, where available, otherwise ratings are obtained from: Moody’s Investors Service or Dominion Bond Rating Service.Percentages shown relate investments at fair value to net assets attributable to holders of redeemable units of the Fund.
Schedule AForeign Currency Forward Contract(s)
CounterpartyCredit Rating of the Counterparty‡ Settlement Date
Currency Buy Position
Currency Sell Position
Contract(s) Rate
Unrealized Gain (Loss) ($)
Bank of Montreal A-1 November 18, 2021 CAD 50,442 USD 40,171 1.26 (442)Bank of Montreal A-1 December 15, 2021 CAD 1,160,567 USD 916,387 1.27 (103)Bank of Montreal A-1 October 20, 2021 USD 309,000 CAD 387,099 0.80 4,288 Canadian Imperial Bank of Commerce A-1 October 20, 2021 CAD 31,560 USD 25,244 1.25 (415)Canadian Imperial Bank of Commerce A-1 October 20, 2021 CAD 66,733 USD 52,778 1.26 (118)Canadian Imperial Bank of Commerce A-1 November 18, 2021 CAD 50,522 USD 40,162 1.26 (349)Canadian Imperial Bank of Commerce A-1 December 15, 2021 CAD 826,294 USD 654,562 1.26 (2,755)Citigroup Inc. A-2 October 20, 2021 CAD 62,909 USD 50,489 1.25 (1,042)Citigroup Inc. A-2 November 18, 2021 CAD 50,407 USD 40,167 1.25 (471)Goldman Sachs Group Inc. A-2 October 20, 2021 CAD 42,090 USD 33,659 1.25 (543)Goldman Sachs Group Inc. A-2 November 18, 2021 CAD 31,397 USD 25,104 1.25 (402)Goldman Sachs Group Inc. A-2 December 15, 2021 CAD 824,598 USD 654,562 1.26 (4,450)HSBC Holdings PLC A-1 October 20, 2021 CAD 32,638 USD 26,195 1.25 (540)HSBC Holdings PLC A-1 November 18, 2021 CAD 31,472 USD 25,104 1.25 (327)HSBC Holdings PLC A-1 December 15, 2021 CAD 1,411,354 USD 1,108,131 1.27 7,823 JPMorgan Chase & Co. A-2 October 20, 2021 CAD 63,335 USD 50,489 1.25 (616)JPMorgan Chase & Co. A-2 November 18, 2021 CAD 28,347 USD 22,594 1.25 (272)JPMorgan Chase & Co. A-2 December 15, 2021 CAD 820,719 USD 654,562 1.25 (8,327)Morgan Stanley A-2 October 20, 2021 CAD 94,175 USD 75,733 1.24 (1,751)Morgan Stanley A-2 December 15, 2021 CAD 1,160,741 USD 916,387 1.27 71 Royal Bank of Canada A-1+ October 20, 2021 CAD 62,908 USD 50,489 1.25 (1,042)Royal Bank of Canada A-1+ November 18, 2021 CAD 41,074 USD 32,895 1.25 (593)Royal Bank of Canada A-1+ December 15, 2021 CAD 824,657 USD 654,562 1.26 (4,392)Toronto-Dominion Bank A-1+ November 18, 2021 CAD 28,342 USD 22,594 1.25 (277)Toronto-Dominion Bank A-1+ December 15, 2021 CAD 820,454 USD 654,562 1.25 (8,592)Total Foreign Currency Forward Contract(s) Value (25,637)
SPAIN USD 9,000 Grifols Escrow Issuer, S.A., 4.75%, October 15, 2028 11,408 11,658 0.10Commissions and other portfolio transaction costs (129)Total Investment Portfolio before Derivative Instruments 11,258,887 11,509,081 97.87Foreign Currency Forward Contract(s) (see Schedule A) (25,637) (0.22)Total Investment Portfolio 11,258,887 11,483,444 97.65Other Net Assets (Liabilities) 275,860 2.35Net Assets Attributable to Holders of Redeemable Units 11,759,304 100.00
Principal amounts stated in:USD U.S. Dollar
Number ofUnits/Sharesor Par Value Description
Average Cost($)
Fair Value($)
% of Net Assets

– 213 –
CI Global High Yield Credit Private Pool
Semi-Annual Financial Statements - September 30, 2021
The accompanying notes are an integral part of these financial statements.
Fund Specific Notes to Financial Statements (unaudited)
Offsetting of Financial Instruments (Note 2)
The following tables show the net impact on the Fund’s Statements of Financial Position if all rights to offset were exercised.
as at September 30, 2021Amounts Eligible for Offset
Gross Assets/(Liabilities)
FinancialInstruments
CollateralReceived/(Paid)
NetExposure
(in $000’s) (in $000’s) (in $000’s) (in $000’s)Derivative assets - Foreign currency forward contracts 12 (2) - 10Derivative assets - Swaps and swaptions - - - -Total 12 (2) - 10Derivative liabilities - Foreign currency forward contracts (38) 2 - (36)Derivative liabilities - Swaps and swaptions - - - -Total (38) 2 - (36)
as at March 31, 2021Amounts Eligible for Offset
Gross Assets/(Liabilities)
FinancialInstruments
CollateralReceived/(Paid)
NetExposure
(in $000’s) (in $000’s) (in $000’s) (in $000’s)Derivative assets - Foreign currency forward contracts 17 (6) - 11Derivative assets - Swaps and swaptions - - - -Total 17 (6) - 11Derivative liabilities - Foreign currency forward contracts (24) 6 - (18)Derivative liabilities - Swaps and swaptions - - - -Total (24) 6 - (18)

– 214 –
CI Global High Yield Credit Private Pool
Semi-Annual Financial Statements - September 30, 2021
The accompanying notes are an integral part of these financial statements.
Fund Specific Notes to Financial Statements (unaudited)
Interest in Unconsolidated Structured Entities (Note 2)
The following tables present the Fund’s interest in Unconsolidated Structured Entities.
as at September 30, 2021 Fair Value of
the Underlying Fund(s) / ETF(s)Fair Value of the Fund’s Investment
in the Underlying Fund(s) / ETF(s)Ownership in the
Underlying Fund(s) / ETF(s)
Unconsolidated Structured Entities (in $000’s) (in $000’s) (%) - - -
as at March 31, 2021 Fair Value of
the Underlying Fund(s) / ETF(s)Fair Value of the Fund’s Investment
in the Underlying Fund(s) / ETF(s)Ownership in the
Underlying Fund(s) / ETF(s)
Unconsolidated Structured Entities (in $000’s) (in $000’s) (%)CI First Asset Preferred Share ETF 81,339 109 0.1

– 215 –
CI Global High Yield Credit Private Pool
Semi-Annual Financial Statements - September 30, 2021
Redeemable Unit Transactions (Note 4)for the periods ended September 30
Number of redeemable units at the beginning of periodRedeemable units issued for cashRedeemable units issued for reinvested distributionsRedeemable units redeemedNumber of redeemable units at the end of period
Fund Specific Notes to Financial Statements (unaudited)
†A portion of brokerage commissions paid was used to cover research and market data services, termed soft dollar commissions. This amount has been estimated by the Manager of the Fund.The accompanying notes are an integral part of these financial statements.
Commissions (Note 2)for the periods ended September 30 (in $000’s)
2021 2020Brokerage commissions - -Soft dollar commissions† - -
Series A 2021 2020 130,266 107,276 4,241 34,072 2,708 2,996 (21,563) (7,787) 115,652 136,557
Series F 2021 2020 1,050,348 45,878 66,285 - 23,435 1,037 (136,078) (30,369) 1,003,990 16,546
Series I 2021 2020 125 1,088 - - 3 11 - (976) 128 123

– 216 –
CI Global High Yield Credit Private Pool
Semi-Annual Financial Statements - September 30, 2021
The accompanying notes are an integral part of these financial statements.
Fund Specific Notes to Financial Statements (unaudited)
Securities Lending (Note 6)as at September 30 (in $000’s)
2021 2020Loaned 7 -Collateral (non-cash) 7 -
Securities Lending Revenue Reconciliation (Note 6)for the periods ended September 30 (in $000’s)
2021 2020Gross securities lending revenue - -Charges - -Securities lending revenue - -Charges as a % of gross securities lending revenue - -
Management and Administration Fees (Note 5) as at September 30, 2021 (%)
Annual management
fee rate:
Annual administration
fee rate:
Series A 1.050 0.15Series F 0.550 0.15Series I Paid directly by investor Paid directly by investor
Related Party Investments (Note 9)as at September 30 (in $000’s)
Investments 2021 -
Investments 2020CI First Asset Preferred Share ETF (Common Units) 13

– 217 –
CI Global High Yield Credit Private Pool
Semi-Annual Financial Statements - September 30, 2021
The accompanying notes are an integral part of these financial statements.
Other Price RiskAs at September 30, 2021 and March 31, 2021, the Fund was invested in global equities and therefore was sensitive to changes in general economic conditions across the world.
As at September 30, 2021, had the fair value of equities in the investment portfolio increased or decreased by 10% (March 31, 2021 - 10%), with all other variables held constant, net assets attributable to holders of redeemable units of the Fund would have increased or decreased, respectively, by approximately $36,000 (March 31, 2021 - $52,000). In practice, actual results may differ from this analysis and the difference may be material.
Currency RiskThe tables below summarize the Fund’s exposure to currency risk.
as at September 30, 2021~
Currency
Financial Instruments Exposure Derivatives
Net Exposure
Net Assets
(%)(in $000’s) (in $000’s) (in $000’s)U.S. Dollar 9,249 (8,256) 993 8.4 Total 9,249 (8,256) 993 8.4
as at March 31, 2021~
Currency
Financial Instruments Exposure Derivatives
Net Exposure
Net Assets
(%)(in $000’s) (in $000’s) (in $000’s)U.S. Dollar 9,871 (7,222) 2,649 21.7 Total 9,871 (7,222) 2,649 21.7
~Includes monetary and non-monetary instruments, if any.
As at September 30, 2021, had the Canadian dollar strengthened or weakened by 10% (March 31, 2021 - 10%) in relation to all other foreign currencies held in the Fund, with all other variables held constant, net assets attributable to holders of redeemable units of the Fund would have decreased or increased, respectively, by approximately $99,000 (March 31, 2021 - $265,000). In practice, actual results may differ from this analysis and the difference may be material.
Interest Rate RiskThe tables below summarize the Fund’s exposure to interest rate risk, categorized by the contractual maturity date.
as at September 30, 2021
Less than1 Year
1 - 3Years
3 - 5Years
Greaterthan
5 Years Total
(in $000’s) (in $000’s) (in $000’s) (in $000’s) (in $000’s)Interest Rate Exposure - 640 2,849 7,659 11,148
as at March 31, 2021
Less than1 Year
1 - 3Years
3 - 5Years
Greaterthan
5 Years Total
(in $000’s) (in $000’s) (in $000’s) (in $000’s) (in $000’s)Interest Rate Exposure - 1,232 2,655 7,098 10,985
Financial Instruments Risks (Note 10)
Concentration RiskFor Concentration Risk as at September 30, 2021, refer to the Schedule of Investment Portfolio.
The table below summarizes the Fund’s exposure to concentration risk.
as at March 31, 2021Categories Net Assets (%)Canada 42.2 U.S.A. 36.4 Other Net Assets (Liabilities) 5.6 Liberia 4.2 Panama 2.9 Bermuda 2.6 British Virgin Islands 2.0 Netherlands 1.6 Exchange-Traded Fund(s) 0.9 Switzerland 0.8 Cayman Islands 0.4 U.K. 0.2 Luxembourg 0.2 Germany 0.2 Foreign Currency Forward Contract(s) (0.1)Total 100.0
Credit RiskThe Fund was invested in fixed income securities, preferred securities and derivative instruments, if any, with the following credit ratings, as per the tables below.
as at September 30, 2021Credit Rating^* Net Assets (%)AA/Aa/A+ 0.1A 0.3BBB/Baa/B++ 6.9BB/Ba/B+ 42.4B 34.5CCC/Caa/C++ 2.1Not Rated 11.6Total 97.9
as at March 31, 2021Credit Rating^* Net Assets (%)AA/Aa/A+ 0.1A 0.3BBB/Baa/B++ 7.2BB/Ba/B+ 41.9B 27.8CCC/Caa/C++ 7.9Not Rated 8.4Total 93.6
^Credit ratings are obtained from S&P Global Ratings, where available, otherwise ratings are obtained from: Moody’s
Investors Service or Dominion Bond Rating Service, respectively.
*Refer to Note 10 for Credit Rating Chart reference.
Fund Specific Notes to Financial Statements (unaudited)

– 218 –
CI Global High Yield Credit Private Pool
Semi-Annual Financial Statements - September 30, 2021
The accompanying notes are an integral part of these financial statements.
Interest Rate Risk (cont’d)As at September 30, 2021, had the prevailing interest rates increased or decreased by 0.25% (March 31, 2021 - 0.25%), with all other variables held constant, net assets attributable to holders of redeemable units of the Fund would have decreased or increased, respectively, by approximately $118,000 (March 31, 2021 - $109,000). In practice, actual results may differ from this analysis and the difference may be material.
Fair Value Hierarchy
The tables below summarize the inputs used by the Fund in valuing the Fund’s investments and derivatives carried at fair value.
Long Positions at fair value as at September 30, 2021Level 1 Level 2 Level 3 Total
(in $000’s) (in $000’s) (in $000’s) (in $000’s)Equities 361 - - 361 Bonds - 10,891 257 11,148 Foreign currency forward contract(s), net - (26) - (26)Total 361 10,865 257 11,483
Long Positions at fair value as at March 31, 2021Level 1 Level 2 Level 3 Total
(in $000’s) (in $000’s) (in $000’s) (in $000’s)Equities 414 - - 414 Bonds - 10,985 - 10,985 Exchange-Traded Fund(s) 109 - - 109 Foreign currency forward contract(s), net - (7) - (7) Total 523 10,978 - 11,501
There were no transfers between Level 1, 2 and 3 during the period ended September 30, 2021 and the year ended March 31, 2021.
Fund Specific Notes to Financial Statements (unaudited)

– 219 –
CI Global High Yield Credit Private Pool
Semi-Annual Financial Statements - September 30, 2021
The accompanying notes are an integral part of these financial statements.
Fund Specific Notes to Financial Statements (unaudited)
Level 3 ReconciliationThe table below summarizes the movement in financial instruments classified as Level 3.
for the period ended September 30, 2021 Balance at
Mar. 31, 2021 Purchases SalesTransfers
InTransfers
(Out)Realized Gain
(Loss)Unrealized Gain
(Loss)*Balance at
Sept. 30, 2021(in $000’s) (in $000’s) (in $000’s) (in $000’s) (in $000’s) (in $000’s) (in $000’s) (in $000’s)
Long Positions/Assets:Bonds - 251 - - - - 6 257Total - 251 - - - - 6 257
*Change in unrealized gain (loss) related to investments held at September 30, 2021 was $5,792.
The following section discusses the significant unobservable inputs for individually material Level 3 positions and quantitatively outlines the inputs used to calculate fair value in accordance with IFRS 13, Fair Value Measurement.
The table below presents the valuation technique and the nature of significant input used to determine the fair value of the Level 3 investments:
as at September 30, 2021
Asset Type Fair Value Valuation Techniques Significant Unobservable Inputs
Fixed income securities $126,659 Market comparable analysis Estimated sale price, discount rate
The above investment is valued using the valuation techniques detailed below:
Market comparable analysis: The fixed income investment is valued based on comparable companies bond valuation.
The range of reasonably possible alternative assumptions would result in an increase or decrease in a fair value of approximately $6,000.
Investments classified as Level 3 are valued at fair value based on unobservable inputs and assumptions, which may include credit spreads, industry multipliers, and discount rates. Management has assessed that the effect of changing these inputs to reasonably possible alternatives would not have a significant impact on the net assets attributable to holders of redeemable units of the Fund as at September 30, 2021.

– 220 –
CI Global Investment Grade Credit Private Pool
Semi-Annual Financial Statements - September 30, 2021
Statements of Financial Position (in $000’s except for per unit amounts and units outstanding)
as at as at Sept. 30, 2021 Mar. 31, 2021 65,200 65,120 - - 279 8,590
12 108 - - 229 351 - - - - - - 413 396 - - - - 42 - 26 154 66,201 74,719
- - - -
62 - - - - - - - - - 50 - 40 131 - - - - - - - - 152 131
66,049 74,588
Statements of Financial Position (cont’d)(in $000’s except for per unit amounts and units outstanding)
Net assets attributable to holders of redeemable units
per Series (Note 4):
Net assets attributable to holders of redeemable
units per unit: Number of redeemable
units outstanding:
as at Sept. 30, 2021
as at Mar. 31, 2021
as at Sept. 30, 2021
as at Mar. 31, 2021
as at Sept. 30, 2021
as at Mar. 31, 2021
Series A 17,380 18,711 10.31 10.25 1,686,253 1,825,330Series F 48,668 55,876 10.33 10.27 4,712,430 5,439,095Series I 1 1 10.38 10.33 98 97
AssetsCurrent assetsInvestmentsInvestments pledged as collateralCashUnrealized gain on futures and foreign currency forward contractsSwaps, swaptions and optionsDaily variation margin on derivative instrumentsFees rebate receivableCash collateral on deposit for short saleDividends receivableInterest receivableReceivable for distribution from investmentsSecurities lending revenue receivable (Note 6)Receivable for investments soldReceivable for unit subscriptions
LiabilitiesCurrent liabilitiesInvestments sold shortBank overdraftUnrealized loss on futures and foreign currency forward contractsSwaps, swaptions and options Dividends payable on investments sold shortInterest payable on investments sold shortDaily variation margin on derivative instrumentsPayable for investments purchasedPayable for unit redemptionsDistributions payable to holders of redeemable units Management fees payableAdministration fees payableAccounts payable and accrued liabilities
Net assets attributable to holders of redeemable units
The accompanying notes are an integral part of these financial statements.
Financial Statements (unaudited)
CIG - 2060

– 221 –
CI Global Investment Grade Credit Private Pool
Semi-Annual Financial Statements - September 30, 2021
Statements of Comprehensive Incomefor the periods ended September 30(in $000’s except for per unit amounts and number of units)
2021 2020
- - 849 547 - - - - - -
- - - -
(231) 1,873
581 343 1,199 2,763 93 (94) - - 5 6 - - 98 (88) 1,297 2,675
238 149 52 37 2 3 1 1 6 6 - - - - - - - - 35 22 - - 334 218
963 2,457
The accompanying notes are an integral part of these financial statements.
Financial Statements (unaudited)
Statements of Comprehensive Income (cont’d)for the periods ended September 30(in $000’s except for per unit amounts and number of units)
Increase (decrease) in net assets attributable to
holders of redeemable units per Series:
Increase (decrease) in net assets attributable to
holders of redeemable units per unit:
Weighted average number of units:
2021 2020 2021 2020 2021 2020Series A 203 180 0.12 0.42 1,754,850 439,112Series F 760 2,277 0.16 0.54 4,949,059 4,280,432Series I - - 0.18 1.02 98 313
Income Net gain (loss) on investments and derivatives Dividends Interest for distribution purposes Income distributions from investments Capital gain distributions from investments Derivative income (loss) Dividends expense on financial assets (liabilities) sold
short Interest expense on financial assets (liabilities) sold short Net realized gain (loss) on sale of investments and
derivatives Change in unrealized appreciation (depreciation) in value
of investments and derivativesTotal net gain (loss) on investments and derivativesOther income Foreign exchange gain (loss) on cash Commitment fee income Securities lending revenue (Note 6) Fees rebateTotal other incomeTotal incomeExpensesManagement fees (Note 5)Administration fees (Note 5)Commissions and other portfolio transaction costsIndependent review committee feesSecurities borrowing fees (Note 2)Margin feesService feesInterest expenseWithholding taxesHarmonized sales taxOther expensesTotal expensesIncrease (decrease) in net assets attributable to holders of redeemable units

– 222 –
CI Global Investment Grade Credit Private Pool
Semi-Annual Financial Statements - September 30, 2021
Statements of Changes in Net Assets Attributable to Holders of Redeemable Unitsfor the periods ended September 30 (in $000’s)
Net assets attributable to holders of redeemable units at the beginning of periodIncrease (decrease) in net assets attributable to holders of redeemable unitsDistributions to holders of redeemable units From net investment income From net realized gains Return of capitalTotal distributions to holders of redeemable units
Redeemable unit transactions Proceeds from redeemable units issued Reinvestment of distributions to holders of redeemable units Redemption of redeemable unitsNet increase (decrease) from redeemable unit transactionsNet increase (decrease) in net assets attributable to holders of redeemable unitsNet assets attributable to holders of redeemable units at the end of period
The accompanying notes are an integral part of these financial statements.
Financial Statements (unaudited)
Series A 2021 2020 18,711 3,302 203 180
(95) (15) - - - - (95) (15)
1,581 5,456 94 14 (3,114) (621) (1,439) 4,849 (1,331) 5,014 17,380 8,316
Series F 2021 2020 55,876 42,369 760 2,277
(424) (262) - - - - (424) (262)
6,858 12,849 360 231 (14,762) (7,187) (7,544) 5,893 (7,208) 7,908 48,668 50,277
Series I 2021 2020 1 11 - -
- - - - - - - -
- - - - - (10) - (10) - (10) 1 1
Total Fund 2021 2020 74,588 45,682 963 2,457
(519) (277) - - - - (519) (277)
8,439 18,305 454 245 (17,876) (7,818) (8,983) 10,732 (8,539) 12,912 66,049 58,594

– 223 –
CI Global Investment Grade Credit Private Pool
Semi-Annual Financial Statements - September 30, 2021
Statements of Cash Flowsfor the periods ended September 30 (in $000’s)
2021 2020
963 2,457
231 (1,873) 6 1 2 3
(581) (343) 26,570 30,164 (26,136) (35,421) - - - - 122 155 - - (17) (38) - - - - - - - - 1,160 (4,895)
(65) (32) 8,489 17,062 (17,889) (8,427) (9,465) 8,603
(6) (1) (8,305) 3,708 8,590 3,377 279 7,084
- - 832 509 - - - - - -
*Dividends and interest received as well as dividends and interest paid relate to operating activities of the Fund. The accompanying notes are an integral part of these financial statements.
Financial Statements (unaudited)
Cash flows from (used in) operating activitiesIncrease (decrease) in net assets attributable to holders of redeemable unitsAdjustments for: Net realized (gain) loss on sale of investments and derivatives Unrealized foreign exchange (gain) loss on cash Commissions and other portfolio transaction costs Change in unrealized (appreciation) depreciation in value of
investments and derivatives Proceeds from sale and maturity of investments and derivatives Purchase of investments and derivatives (Increase) decrease in cash collateral on deposit for short sale Non-cash distributions from investments Change in daily variation margin (Increase) decrease in dividends receivable (Increase) decrease in interest receivable (Increase) decrease in securities lending revenue receivable Increase (decrease) in management fees payable Increase (decrease) in administration fees payable Change in other accounts receivable and payableNet cash from (used in) operating activities
Cash flows from (used in) financing activitiesDistributions paid to holders of redeemable units, net of reinvested distributionsProceeds from issuance of redeemable unitsAmounts paid on redemption of redeemable unitsNet cash from (used in) financing activities Unrealized foreign exchange gain (loss) on cashNet increase (decrease) in cashCash (bank overdraft), beginning of periodCash (bank overdraft), end of period
Supplementary Information:Dividends received, net of withholding tax*Interest received, net of withholding tax*Dividends paid*Interest paid*Tax recoverable (paid)

– 224 –
CI Global Investment Grade Credit Private Pool
Semi-Annual Financial Statements - September 30, 2021
Percentages shown relate investments at fair value to net assets attributable to holders of redeemable units of the Fund.
Schedule of Investment Portfolio as at September 30, 2021 (unaudited)
Number ofUnits/Sharesor Par Value Description
Average Cost($)
Fair Value($)
% of Net Assets
CANADA 150,000 407 International Inc., 2.47%, September 08, 2022 153,822 152,006 75,000 407 International Inc., 3.14%, March 06, 2030 78,466 80,273 165,000 407 International Inc., 3.67%, March 08, 2049 174,107 174,188 80,000 Aeroports de Montreal 3.03%, April 21, 2050 80,000 76,009 150,000 Aeroports de Montreal 3.36%, April 24, 2047 170,793 151,581 100,000 Aeroports de Montreal 3.441%, April 26, 2051 100,000 102,624 190,000 Alectra Inc., 1.751%, February 11, 2031 190,000 181,479 255,000 Algonquin Power Co., 2.85%, July 15, 2031 254,980 257,839 USD 80,000 Alimentation Couche-Tard Inc., 2.95%, January 25, 2030 104,986 105,378 75,000 Alimentation Couche-Tard Inc., 3.6%, June 02, 2025 78,586 79,853 USD 110,000 Alimentation Couche-Tard Inc., 3.8%, January 25, 2050 143,964 149,129 90,000 Allied Properties Real Estate Investment Trust 3.095%, February 06, 2032 90,000 88,323 110,000 Allied Properties Real Estate Investment Trust 3.117%, February 21, 2030 110,000 111,141 100,000 Allied Properties Real Estate Investment Trust 3.394%, August 15, 2029 100,000 103,719 70,000 AltaGas Ltd., 2.075%, May 30, 2028 70,000 68,160 70,000 AltaGas Ltd., 2.157%, June 10, 2025 70,000 70,938 105,000 AltaGas Ltd., 2.477%, November 30, 2030 105,000 101,373 220,000 AltaGas Ltd., 2.609%, December 16, 2022 221,503 224,462 55,000 AltaLink L.P., 1.509%, September 11, 2030 55,000 51,724 100,000 AltaLink L.P., 3.717%, December 03, 2046 119,460 108,283 605,000 ARC Resources Ltd., 2.354%, March 10, 2026 605,000 609,278 805,000 ARC Resources Ltd., 3.465%, March 10, 2031 805,000 821,625 160,000 Bank of Montreal 1.551%, May 28, 2026 160,000 158,690 100,000 Bank of Montreal 2.7%, September 11, 2024 102,828 104,669 125,000 Bank of Montreal 2.85%, March 06, 2024 129,441 130,090 170,000 Bank of Montreal, FRN, 4.3%, November 26, 2080 170,000 179,775 65,000 BCI QuadReal Realty 1.056%, March 12, 2024 65,000 64,928 200,000 BCI QuadReal Realty 1.073%, February 04, 2026 200,000 195,474 240,000 BCI QuadReal Realty 1.747%, July 24, 2030 240,000 229,830 100,000 Bell Canada 2.2%, May 29, 2028 99,877 99,621 40,000 Bell Canada Inc., 1.65%, August 16, 2027 39,715 38,925 25,000 Bell Canada Inc., 2.7%, February 27, 2024 23,881 25,809 160,000 Bell Canada Inc., 2.9%, September 10, 2029 159,794 164,413 90,000 Bell Canada Inc., 3.5%, September 30, 2050 89,912 82,389 150,000 Bell Canada Inc., 4.45%, February 27, 2047 171,499 161,140 175,000 Brookfield Infrastructure Finance ULC 2.855%, September 01, 2032 173,594 171,036 155,000 Brookfield Infrastructure Finance ULC 3.315%, February 22, 2024 164,139 161,965 60,000 Brookfield Infrastructure Finance ULC 4.193%, September 11, 2028 60,331 66,069 170,000 Brookfield Property Finance ULC 3.926%, August 24, 2025 170,000 173,432 110,000 Brookfield Property Finance ULC 3.93%, January 15, 2027 110,000 111,308 305,000 Brookfield Property Finance ULC 4.115%, October 19, 2021 315,022 305,397 110,000 Brookfield Renewable Partners ULC 3.33%, August 13, 2050 109,918 103,055 30,000 Bruce Power L.P., 4.01%, June 21, 2029 30,350 33,049 190,000 Bruce Power L.P., 4.746%, June 21, 2049 207,844 223,855 140,000 Canadian Imperial Bank of Commerce 2%, April 17, 2025 139,894 142,452 315,000 Canadian Imperial Bank of Commerce 2.01%, July 21, 2030 317,549 316,896 170,000 Canadian Imperial Bank of Commerce 4.375%, October 28, 2080 170,000 179,775 215,000 Canadian Imperial Bank of Commerce, FRN, 1.96%, April 21, 2031 214,929 214,434 135,000 Canadian National Railway Co., 3.05%, February 08, 2050 125,743 126,239 75,000 Canadian National Railway Co., 3.6%, August 01, 2047 86,312 77,418 350,000 Canadian Natural Resources Ltd., 1.45%, November 16, 2023 349,601 351,600 310,000 Canadian Natural Resources Ltd., 2.5%, January 17, 2028 309,944 312,977 140,000 Canadian Natural Resources Ltd., 4.85%, May 30, 2047 165,647 154,298 260,000 Canadian Tire Corp., Ltd., 3.167%, July 06, 2023 266,542 269,001 260,000 Capital Power Corp., 3.147%, October 01, 2032 250,190 254,911 150,000 CCL Industries Inc., 3.864%, April 13, 2028 161,937 162,183

– 225 –
CI Global Investment Grade Credit Private Pool
Semi-Annual Financial Statements - September 30, 2021
Percentages shown relate investments at fair value to net assets attributable to holders of redeemable units of the Fund.
Schedule of Investment Portfolio as at September 30, 2021 (unaudited) (cont’d)
CANADA (cont’d) 630,000 Cenovus Energy Inc., 3.5%, February 07, 2028 632,820 661,010 325,000 Central 1 Credit Union 2.584%, December 06, 2023 327,594 334,815 155,000 Central 1 Credit Union 2.6%, November 07, 2022 159,276 158,096 150,000 CGI Inc., 2.1%, September 18, 2028 149,766 148,111 290,000 Choice Properties Real Estate Investment Trust 2.981%, March 04, 2030 290,928 294,358 80,000 Choice Properties Real Estate Investment Trust 3.532%, June 11, 2029 80,000 84,897 410,000 Choice Properties Real Estate Investment Trust 3.556%, September 09, 2024 432,292 433,116 410,000 Choice Properties Real Estate Investment Trust 4.178%, March 08, 2028 449,716 451,536 120,000 CNH Industrial Capital Canada Ltd., 1.5%, October 01, 2024 119,923 119,975 90,000 Cogeco Communications Inc., 2.991%, September 22, 2031 90,000 89,129 765,000 Co-operators Financial Services Ltd., 3.327%, May 13, 2030 765,000 772,183 140,000 Corus Entertainment Inc., 5%, May 11, 2028 140,000 141,400 115,000 Daimler Canada Finance Inc., 1.65%, September 22, 2025 114,824 114,917 230,000 Dollarama Inc., 1.505%, September 20, 2027 230,000 222,261 210,000 Dream Industrial Real Estate Investment Trust 1.662%, December 22, 2025 210,000 208,163 310,000 Dream Industrial Real Estate Investment Trust 2.057%, June 17, 2027 310,000 307,762 30,000 Edmonton Regional Airports Authority 3.715%, May 20, 2051 30,000 30,310 190,000 Empire Life Insurance Co., 3.625%, April 17, 2081 190,000 192,512 155,000 Enbridge Gas Inc., 3.65%, April 01, 2050 156,421 163,097 165,000 Enbridge Inc., 3.2%, June 08, 2027 169,033 173,388 90,000 Enbridge Inc., 4.1%, September 21, 2051 89,707 88,223 270,000 Fairfax Financial Holdings Ltd., 3.95%, March 03, 2031 270,664 281,249 340,000 Fairfax Financial Holdings Ltd., 4.23%, June 14, 2029 347,386 366,590 90,000 First Capital Realty Inc., 4.323%, July 31, 2025 90,364 96,766 170,000 First National Financial Corp., 2.961%, November 17, 2025 170,000 173,423 145,000 First National Financial Corp., 3.582%, November 25, 2024 145,000 151,442 151,460 First Nations ETF L.P., 4.136%, December 31, 2041 166,138 161,869 350,000 Ford Credit Canada Co., 3.5%, November 30, 2023 350,000 359,698 230,000 Fortis Inc., 2.18%, May 15, 2028 229,880 230,662 115,000 General Motors Financial of Canada Ltd., 1.7%, July 09, 2025 114,702 114,493 110,000 General Motors Financial of Canada Ltd., 1.75%, April 15, 2026 109,931 108,616 130,000 Genworth MI Canada Inc., 2.955%, March 01, 2027 130,481 132,924 50,000 Gibson Energy Inc., 2.45%, July 14, 2025 49,902 51,024 235,000 Gibson Energy Inc., 2.85%, July 14, 2027 236,728 240,638 215,000 Gibson Energy Inc., 5.25%, December 22, 2080 215,000 218,718 750,000 Government of Canada 0.25%, February 01, 2023 750,772 748,443 360,000 Government of Canada 0.5%, December 01, 2030 326,048 330,260 2,580,000 Government of Canada 0.5%, March 01, 2022 2,585,432 2,583,328 355,000 Government of Canada 1%, June 01, 2027 356,964 352,022 32,000 Government of Canada 1.25%, June 01, 2030 33,468 31,592 790,000 Government of Canada 1.25%, March 01, 2025 805,554 800,340 830,000 Government of Canada 1.5%, June 01, 2023 851,040 844,287 350,000 Government of Canada 1.5%, September 01, 2024 358,936 357,577 1,325,000 Government of Canada 1.75%, March 01, 2023 1,340,396 1,349,821 345,000 Government of Canada 2%, December 01, 2051 343,179 346,190 514,000 Government of Canada 2%, June 01, 2028 524,832 538,836 1,275,000 Government of Canada 2%, September 01, 2023 1,292,450 1,309,825 35,000 Government of Canada 2.25%, June 01, 2025 38,285 36,703 45,000 Government of Canada 2.25%, June 01, 2029 48,071 48,085 20,000 Government of Canada 2.25%, March 01, 2024 21,070 20,769 1,290,000 Government of Canada 2.75%, December 01, 2048 1,648,484 1,504,372 70,000 Greater Toronto Airports Authority 1.54%, May 03, 2028 69,956 68,121 150,000 Greater Toronto Airports Authority 2.75%, October 17, 2039 149,793 142,439 50,000 Greater Toronto Airports Authority 3.15%, October 05, 2051 49,913 48,564 80,000 H&R Real Estate Investment Trust 3.369%, January 30, 2024 83,276 82,953 285,000 Halifax International Airport Authority 3.678%, May 03, 2051 285,000 288,563
Number ofUnits/Sharesor Par Value Description
Average Cost($)
Fair Value($)
% of Net Assets

– 226 –
CI Global Investment Grade Credit Private Pool
Semi-Annual Financial Statements - September 30, 2021
Percentages shown relate investments at fair value to net assets attributable to holders of redeemable units of the Fund.
Schedule of Investment Portfolio as at September 30, 2021 (unaudited) (cont’d)
CANADA (cont’d) 300,000 Honda Canada Finance Inc., 1.646%, February 25, 2028 298,505 292,376 310,000 HSBC Bank Canada 1.782%, May 20, 2026 310,000 310,201 315,000 HSBC Bank Canada 2.542%, January 31, 2023 324,582 322,660 390,000 Hydro One Inc., 1.41%, October 15, 2027 388,421 378,442 60,000 Hydro One Inc., 2.71%, February 28, 2050 52,721 53,667 120,000 Hyundai Capital Canada Inc., 2.008%, May 12, 2026 120,000 120,211 310,000 Independent Order of Foresters Inc., 2.885%, October 15, 2035 310,037 312,338 90,000 Intact Financial Corp., 2.954%, December 16, 2050 90,000 81,295 65,000 Intact Financial Corp., 3.765%, May 20, 2053 65,000 68,169 115,000 Intact Financial Corp., 4.125%, March 31, 2081 115,000 118,333 225,000 Inter Pipeline Ltd., 4.232%, June 01, 2027 225,000 244,443 110,000 Inter Pipeline Ltd., 6.875%, March 26, 2079 113,804 121,314 110,000 Ivanhoe Cambridge II Inc., 2.296%, December 12, 2024 110,000 113,295 50,000 John Deere Financial Inc., 2.41%, January 14, 2025 49,988 51,661 105,000 Keyera Corp., 3.934%, June 21, 2028 112,904 113,019 80,000 Keyera Corp., 3.959%, May 29, 2030 80,000 85,307 90,000 Keyera Corp., 6.875%, June 13, 2079 90,000 100,297 40,000 Loblaw Co., Ltd., 2.284%, May 07, 2030 40,000 39,205 40,000 Manulife Bank of Canada 2.082%, May 26, 2022 39,856 40,431 115,000 Manulife Bank of Canada 2.378%, November 19, 2024 115,000 118,889 700,000 Manulife Financial Corp., 3.375%, June 19, 2081 700,000 687,883 210,000 MCAP Commercial L.P., 3.384%, November 26, 2027 210,174 213,261 140,000 MCAP Commercial L.P., 3.743%, August 25, 2025 141,308 145,909 270,000 Metro Inc., 3.413%, February 28, 2050 263,974 250,969 200,000 Metro Inc., 4.27%, December 04, 2047 223,193 214,697 130,000 Montreal Port Authority 3.24%, March 22, 2051 130,000 131,486 280,000 National Bank of Canada 1.573%, August 18, 2026 280,273 279,795 160,000 National Bank of Canada, FRN, 4.05%, August 15, 2081 160,000 161,000 90,000 NAV Canada 3.209%, September 29, 2050 97,785 91,488 165,000 Nissan Canada Inc., 1.626%, March 18, 2024 165,000 164,762 120,000 Nissan Canada Inc., 2.103%, September 22, 2025 120,000 119,575 60,000 North West Redwater Partnership/NWR Financing Co., Ltd., 2%, December 01, 2026 59,887 60,102 60,000 North West Redwater Partnership/NWR Financing Co., Ltd., 2.8%, June 01, 2031 59,887 60,076 745,000 OMERS Finance Trust 1.55%, April 21, 2027 743,541 742,405 150,000 OMERS Finance Trust 2.6%, May 14, 2029 149,842 156,859 145,000 OMERS Realty Corp., 1.298%, September 22, 2023 145,001 145,792 110,000 Ontario Teachers’ Finance Trust 1.1%, October 19, 2027 109,698 106,531 100,000 Parkland Corp., 3.875%, June 16, 2026 100,000 101,771 165,000 Pembina Pipeline Corp., 3.31%, February 01, 2030 164,875 170,930 110,000 Pembina Pipeline Corp., 4.54%, April 03, 2049 116,623 112,432 455,000 Pembina Pipeline Corp., 4.8%, January 25, 2081 455,000 455,375 250,000 Penske Truck Leasing Canada Inc., 2.7%, September 30, 2024 249,490 257,586 255,000 Penske Truck Leasing Canada Inc., 2.85%, December 07, 2022 261,648 260,176 65,000 Reliance L.P., 2.68%, December 01, 2027 65,124 65,713 290,000 RioCan Real Estate Investment Trust 2.361%, March 10, 2027 290,000 290,486 95,000 Rogers Communications Inc., 3.65%, March 31, 2027 102,185 100,991 145,000 Rogers Communications Inc., 6.56%, March 22, 2041 205,287 188,969 335,000 Royal Bank of Canada 1.67%, January 28, 2033 335,000 323,504 95,000 Royal Bank of Canada, FRN, 2.74%, July 25, 2029 95,000 98,291 145,000 Royal Bank of Canada, FRN, 2.88%, December 23, 2029 144,987 150,781 65,000 Royal Bank of Canada, FRN, 3.65%, November 24, 2081 65,000 65,175 550,000 Royal Bank of Canada, FRN, 4%, February 24, 2081 550,000 573,898 520,000 Royal Bank of Canada, FRN, 4.5%, November 24, 2080 525,795 551,697 600,000 Sagen MI Canada Inc., 3.261%, March 05, 2031 600,000 604,273 735,000 Saputo Inc., 1.415%, June 19, 2026 734,739 717,636 420,000 Saputo Inc., 2.242%, June 16, 2027 420,278 421,581
Number ofUnits/Sharesor Par Value Description
Average Cost($)
Fair Value($)
% of Net Assets

– 227 –
CI Global Investment Grade Credit Private Pool
Semi-Annual Financial Statements - September 30, 2021
Percentages shown relate investments at fair value to net assets attributable to holders of redeemable units of the Fund.
Schedule of Investment Portfolio as at September 30, 2021 (unaudited) (cont’d)
CANADA (cont’d) 145,000 Shaw Communications Inc., 3.3%, December 10, 2029 144,314 150,332 220,000 Shaw Communications Inc., 4.25%, December 09, 2049 218,854 219,074 240,000 Shaw Communications Inc., 6.75%, November 09, 2039 321,324 314,933 85,000 SmartCentres Real Estate Investment Trust 3.192%, June 11, 2027 85,992 88,520 75,000 SmartCentres Real Estate Investment Trust 3.526%, December 20, 2029 75,586 78,324 140,000 SmartCentres Real Estate Investment Trust 3.648%, December 11, 2030 140,679 146,060 160,000 Summit Industrial Income REIT 2.25%, January 12, 2027 159,976 160,493 150,000 Suncor Energy Inc., 3.1%, May 24, 2029 151,151 155,738 140,000 Suncor Energy Inc., 5%, April 09, 2030 139,576 163,075 240,000 Suncor Energy Inc., 5.39%, March 26, 2037 289,720 282,919 50,000 Superior Plus L.P., 4.25%, May 18, 2028 50,000 51,417 235,000 Sysco Canada Inc., 3.65%, April 25, 2025 246,210 249,321 265,000 TELUS Corp., 3.15%, February 19, 2030 267,797 275,056 55,000 TELUS Corp., 3.3%, May 02, 2029 54,546 58,056 170,000 Teranet Holdings L.P., 3.544%, June 11, 2025 170,000 179,816 95,000 The Bank of Nova Scotia 2.836%, July 03, 2029 95,000 98,400 285,000 The Bank of Nova Scotia 3.1%, February 02, 2028 307,428 306,803 320,000 The Bank of Nova Scotia, FRN, 3.7%, July 27, 2081 320,000 320,333 725,000 Thomson Reuters Corp., 2.239%, May 14, 2025 729,131 740,407 160,000 Toronto-Dominion Bank 1.888%, March 08, 2028 160,000 158,715 55,000 Toronto-Dominion Bank 2.85%, March 08, 2024 55,000 57,289 690,000 Toronto-Dominion Bank 3.105%, April 22, 2030 697,560 723,020 175,000 Toronto-Dominion Bank, FRN, 3.6%, October 31, 2081 175,000 174,886 310,000 Tourmaline Oil Corp., 2.077%, January 25, 2028 310,000 303,523 355,000 TransCanada PipeLines Ltd., 3.8%, April 05, 2027 361,295 383,632 245,000 TransCanada Trust 4.65%, May 18, 2077 253,784 254,813 60,000 Transcontinental Inc., 2.28%, July 13, 2026 60,000 60,077 395,000 Videotron Ltd., 3.125%, January 15, 2031 393,781 374,098 65,000 Videotron Ltd., 3.625%, June 15, 2028 65,000 65,515 600,000 Waste Management of Canada Corp., 2.6%, September 23, 2026 600,064 622,645 160,000 WSP Global Inc., 2.408%, April 19, 2028 160,000 160,457 48,708,675 48,834,104 73.93 U.S.A. USD 55,000 Activision Blizzard Inc., 1.35%, September 15, 2030 68,704 64,568 USD 60,000 Amazon.com Inc., 2.5%, June 03, 2050 63,775 71,099 USD 150,000 American Tower Corp., 1.875%, October 15, 2030 199,790 182,390 USD 50,000 American Tower Corp., 3.1%, June 15, 2050 68,214 61,948 USD 100,000 American Tower Corp., 3.8%, August 15, 2029 142,731 140,393 180,000 Anheuser-Busch InBev Finance Inc., 4.32%, May 15, 2047 192,558 189,081 USD 40,000 Apple Inc., 1.25%, August 20, 2030 50,750 47,969 USD 155,000 Apple Inc., 1.65%, February 08, 2031 198,276 191,183 USD 40,000 Apple Inc., 2.4%, August 20, 2050 52,734 46,409 120,000 Apple Inc., 2.513%, August 19, 2024 123,769 124,530 USD 40,000 Apple Inc., 2.55%, August 20, 2060 52,316 46,155 USD 125,000 Apple Inc., 2.65%, February 08, 2051 158,894 151,366 USD 40,000 AT&T Inc., 3.3%, February 01, 2052 53,405 49,042 170,000 Athene Global Funding 2.1%, September 24, 2025 169,791 171,698 USD 135,000 Bank of America Corp., 1.898%, July 23, 2031 169,277 164,806 USD 70,000 Bank of America Corp., 1.922%, October 24, 2031 91,117 85,260 USD 45,000 Bank of America Corp., 2.651%, March 11, 2032 56,882 58,006 USD 30,000 Bank of America Corp., 2.831%, October 24, 2051 39,573 36,288 230,000 Bank of America Corp., 2.932%, April 25, 2025 236,445 239,506 195,000 Bank of America Corp., 3.301%, April 24, 2024 204,381 202,145 USD 45,000 BlackRock Inc., 1.9%, January 28, 2031 62,933 56,521 USD 190,000 Boeing Co., 2.196%, February 04, 2026 242,877 242,797 USD 60,000 Boeing Co., 2.95%, February 01, 2030 78,853 77,453
Number ofUnits/Sharesor Par Value Description
Average Cost($)
Fair Value($)
% of Net Assets

– 228 –
CI Global Investment Grade Credit Private Pool
Semi-Annual Financial Statements - September 30, 2021
Percentages shown relate investments at fair value to net assets attributable to holders of redeemable units of the Fund.
Schedule of Investment Portfolio as at September 30, 2021 (unaudited) (cont’d)
U.S.A. (cont’d) USD 40,000 Bristol-Myers Squibb Co., 1.45%, November 13, 2030 51,402 48,565 USD 112,000 Bristol-Myers Squibb Co., 2.9%, July 26, 2024 150,390 150,635 USD 110,000 Broadcom Inc., 2.45%, February 15, 2031 139,153 135,079 USD 35,000 Burlington Northern Santa Fe, LLC 3.9%, August 01, 2046 50,874 51,623 USD 70,000 Carrier Global Corp., 2.722%, February 15, 2030 92,122 91,692 USD 20,000 Charter Communications Operating LLC 2.8%, April 01, 2031 27,677 25,381 USD 95,000 Charter Communications Operating LLC 5.375%, May 01, 2047 130,359 144,705 USD 85,000 Citigroup Inc., FRN, 2.561%, May 01, 2032 104,660 108,850 USD 50,000 Coca-Cola Co., 1.65%, June 01, 2030 66,707 61,855 USD 25,000 Coca-Cola Co., 2.6%, June 01, 2050 34,684 30,223 USD 40,000 Coca-Cola Co., 3%, March 05, 2051 49,672 52,398 USD 95,000 Comcast Corp., 2.45%, August 15, 2052 125,460 106,093 USD 90,000 Comcast Corp., 2.887%, November 01, 2051 112,112 109,186 USD 55,000 Costco Wholesale Corp., 1.6%, April 20, 2030 74,582 68,050 USD 40,000 Costco Wholesale Corp., 1.75%, April 20, 2032 56,352 49,656 USD 70,000 Cox Communications Inc., 2.6%, June 15, 2031 84,101 89,702 USD 40,000 Cox Communications Inc., 2.95%, October 01, 2050 52,353 47,604 USD 40,000 Crown Castle International Corp., 3.7%, June 15, 2026 58,190 55,299 USD 150,000 Equinix Inc., 1.55%, March 15, 2028 200,502 185,698 USD 30,000 Glencore Funding LLC 1.625%, September 01, 2025 39,477 38,125 USD 90,000 Glencore Funding LLC 2.5%, September 01, 2030 118,517 111,565 250,000 Goldman Sachs Group Inc., 3.307%, October 31, 2025 267,195 263,714 USD 30,000 Great-West Lifeco U.S. Finance 2020 L.P., 0.904%, August 12, 2025 40,058 37,431 USD 80,000 Humana Inc., 2.15%, February 03, 2032 99,612 98,943 USD 200,000 Hyundai Capital America 1.3%, January 08, 2026 253,092 249,339 USD 80,000 Johnson & Johnson, 2.1%, September 01, 2040 104,700 95,598 USD 155,000 Johnson & Johnson, 2.25%, September 01, 2050 202,402 181,525 155,000 JPMorgan Chase & Co., 1.896%, March 05, 2028 155,000 154,179 USD 65,000 JPMorgan Chase & Co., 2.522%, April 22, 2031 89,489 83,950 USD 85,000 Lowe’s Co., Inc., 4.05%, May 03, 2047 111,543 123,501 USD 30,000 Mars Inc., 0.875%, July 16, 2026 40,770 37,221 USD 30,000 Mars Inc., 1.625%, July 16, 2032 40,760 36,016 USD 30,000 Mars Inc., 2.45%, July 16, 2050 40,595 34,755 USD 120,000 Masco Corp., 1.5%, February 15, 2028 151,221 147,871 USD 80,000 Masco Corp., 3.125%, February 15, 2051 100,961 99,363 25,000 McDonald’s Corp., 3.125%, March 04, 2025 24,195 26,373 USD 275,000 Molson Coors Brewing Co., 4.2%, July 15, 2046 381,112 385,384 USD 80,000 Morgan Stanley 1.794%, February 13, 2032 104,112 96,465 90,000 PACCAR Financial Corp., 0.985%, May 14, 2024 90,000 89,555 USD 50,000 Pharmacia & Upjohn Inc., 1.65%, June 22, 2025 67,691 63,974 USD 30,000 Pharmacia & Upjohn Inc., 2.3%, June 22, 2027 40,686 38,810 USD 110,000 Pharmacia & Upjohn Inc., 2.7%, June 22, 2030 145,655 140,793 USD 50,000 Pharmacia & Upjohn Inc., 4%, June 22, 2050 67,663 67,294 USD 100,000 Starbucks Corp., 3.55%, August 15, 2029 134,376 140,274 USD 80,000 Starbucks Corp., 4.45%, August 15, 2049 107,554 123,776 USD 30,000 Teachers Insurance & Annuity Association of America 3.3%, May 15, 2050 42,215 39,909 USD 55,000 The Hershey Co., 2.65%, June 01, 2050 75,420 68,051 USD 65,000 T-Mobile USA Inc., 3.75%, April 15, 2027 92,074 90,715 USD 110,000 T-Mobile USA Inc., 3.875%, April 15, 2030 153,874 154,155 USD 85,000 T-Mobile USA Inc., 4.5%, April 15, 2050 120,026 125,434 USD 55,000 Travelers Co., Inc., 2.55%, April 27, 2050 76,792 66,598 25,000 United Parcel Service Inc., 2.125%, May 21, 2024 23,468 25,623 USD 200,000 United States Treasury Inflation Indexed Bonds 0.13109%, January 15, 2031 278,704 291,473 USD 195,000 United States Treasury Inflation Indexed Bonds 0.1331%, July 15, 2030 279,211 289,981 USD 210,000 United States Treasury Note/Bond 0.25%, June 15, 2024 262,258 264,488 USD 180,000 United States Treasury Note/Bond 0.5%, February 28, 2026 225,717 224,095
Number ofUnits/Sharesor Par Value Description
Average Cost($)
Fair Value($)
% of Net Assets

– 229 –
CI Global Investment Grade Credit Private Pool
Semi-Annual Financial Statements - September 30, 2021
Percentages shown relate investments at fair value to net assets attributable to holders of redeemable units of the Fund.
Schedule of Investment Portfolio as at September 30, 2021 (unaudited) (cont’d)
U.S.A. (cont’d) USD 300,000 United States Treasury Note/Bond 0.625%, August 15, 2030 367,559 353,223 USD 255,000 United States Treasury Note/Bond 0.875%, June 30, 2026 321,627 321,738 USD 5,000 United States Treasury Note/Bond 0.875%, November 15, 2030 6,255 6,005 USD 195,000 United States Treasury Note/Bond 1.25%, August 15, 2031 248,231 240,714 USD 60,000 United States Treasury Note/Bond 1.875%, June 30, 2026 79,005 79,267 USD 405,000 United States Treasury Note/Bond 2%, August 15, 2051 519,538 502,711 USD 1,050,000 United States Treasury Note/Bond 2%, November 30, 2022 1,364,124 1,359,144 USD 100,000 United States Treasury Note/Bond 2.375%, May 15, 2051 141,023 134,813 USD 265,000 United States Treasury Note/Bond 2.625%, December 31, 2023 351,726 352,764 USD 85,000 United States Treasury Note/Bond 3.125%, November 15, 2028 116,863 120,895 USD 65,000 UnitedHealth Group Inc., 2.3%, May 15, 2031 78,389 83,885 USD 60,000 UnitedHealth Group Inc., 3.25%, May 15, 2051 71,899 80,938 USD 20,000 UnitedHealth Group Inc., 3.7%, August 15, 2049 26,194 28,741 USD 35,000 Verizon Communications Inc., 1.75%, January 20, 2031 45,526 42,118 155,000 Verizon Communications Inc., 2.375%, March 22, 2028 154,761 156,066 85,000 Verizon Communications Inc., 2.5%, May 16, 2030 84,843 84,488 USD 540,000 Verizon Communications Inc., 2.875%, November 20, 2050 700,843 637,161 55,000 Verizon Communications Inc., 3.625%, May 16, 2050 54,355 52,279 USD 30,000 Visa Inc., 2.7%, April 15, 2040 41,911 38,838 USD 35,000 Walmart Inc., 2.85%, July 08, 2024 46,696 46,994 USD 35,000 Walmart Inc., 3.05%, July 08, 2026 46,691 48,151 USD 55,000 Walt Disney Co., 2.65%, January 13, 2031 77,032 72,763 USD 100,000 Waste Management Inc., 1.15%, March 15, 2028 130,349 121,962 295,000 Wells Fargo & Co., 2.493%, February 18, 2027 295,000 301,106 140,000 Wells Fargo & Co., 2.568%, May 01, 2026 140,000 144,256 USD 40,000 Western Midstream Operating L.P., 5.25%, February 01, 2050 52,457 59,712 14,650,489 14,389,955 21.79 U.K. 565,000 Aviva PLC 4%, October 02, 2030 564,446 611,605 315,000 BP Capital Markets PLC 3.47%, May 15, 2025 335,876 336,061 310,000 National Grid Electricity Transmission PLC 2.301%, June 22, 2029 310,000 308,375 1,210,322 1,256,041 1.90 NETHERLANDS USD 60,000 ING Groep N.V., FRN, 3.875%, December 31, 2049 76,122 73,898 USD 40,000 NXP B.V./NXP Funding LLC/NXP USA Inc., 3.4%, May 01, 2030 55,390 54,974 USD 65,000 Viterra Finance B.V., 2%, April 21, 2026 81,243 82,928 USD 125,000 Viterra Finance B.V., 3.2%, April 21, 2031 156,176 160,838 368,931 372,638 0.56 MEXICO USD 150,000 Fomento Económico Mexicano, S.A.B. de C.V., 3.5%, January 16, 2050 192,027 198,301 0.30 AUSTRALIA 150,000 Macquarie Group Ltd., FRN, 2.723%, August 21, 2029 150,000 149,047 0.23Commissions and other portfolio transaction costs - Total Investment Portfolio before Derivative Instruments 65,280,444 65,200,086 98.71Foreign Currency Forward Contract(s) (see Schedule A) (61,918) (0.09)Short Futures Contract(s) (see Schedule B) 12,270 0.02Total Investment Portfolio 65,280,444 65,150,438 98.64Other Net Assets (Liabilities) 898,485 1.36Net Assets Attributable to Holders of Redeemable Units 66,048,923 100.00
Principal amounts stated in:USD U.S. Dollar
Number ofUnits/Sharesor Par Value Description
Average Cost($)
Fair Value($)
% of Net Assets

– 230 –
CI Global Investment Grade Credit Private Pool
Semi-Annual Financial Statements - September 30, 2021
Schedule of Investment Portfolio as at September 30, 2021 (unaudited) (cont’d)
Schedule AForeign Currency Forward Contract(s)
CounterpartyCredit Rating of the Counterparty‡ Settlement Date
Currency Buy Position
Currency Sell Position
Contract(s) Rate
Unrealized Gain (Loss) ($)
Royal Bank of Canada A-1+ October 15, 2021 CAD 13,995,669 USD 11,097,580 1.26 (60,760)Royal Bank of Canada A-1+ October 15, 2021 USD 94,907 CAD 120,000 0.79 212 Royal Bank of Canada A-1+ October 15, 2021 USD 77,843 CAD 100,000 0.78 (1,402)Royal Bank of Canada A-1+ October 15, 2021 USD 78,975 CAD 100,000 0.79 32 Total Foreign Currency Forward Contract(s) Value (61,918)
Schedule BShort Futures Contract(s)
Contract(s) Future(s) Expiry Date Price ($) Currency Contract Value ($) Fair Value ($)(2) CBOT US Long Bond December 21, 2021 159.22 USD (415,603) (403,333) (415,603) (403,333)Exercise Price ($) (415,603)Total Short Futures Contract(s) Value 12,270
‡Credit ratings are obtained from S&P Global Ratings, where available, otherwise ratings are obtained from: Moody’s Investors Service or Dominion Bond Rating Service.

– 231 –
CI Global Investment Grade Credit Private Pool
Semi-Annual Financial Statements - September 30, 2021
The accompanying notes are an integral part of these financial statements.
Fund Specific Notes to Financial Statements (unaudited)
Offsetting of Financial Instruments (Note 2)
The following tables show the net impact on the Fund’s Statements of Financial Position if all rights to offset were exercised.
as at September 30, 2021Amounts Eligible for Offset
Gross Assets/(Liabilities)
FinancialInstruments
CollateralReceived/(Paid)
NetExposure
(in $000’s) (in $000’s) (in $000’s) (in $000’s)Derivative assets - Foreign currency forward contracts - - - -Derivative assets - Swaps and swaptions - - - -Total - - - -Derivative liabilities - Foreign currency forward contracts (62) - - (62)Derivative liabilities - Swaps and swaptions - - - -Total (62) - - (62)
as at March 31, 2021Amounts Eligible for Offset
Gross Assets/(Liabilities)
FinancialInstruments
CollateralReceived/(Paid)
NetExposure
(in $000’s) (in $000’s) (in $000’s) (in $000’s)Derivative assets - Foreign currency forward contracts 108 - - 108Derivative assets - Swaps and swaptions - - - -Total 108 - - 108Derivative liabilities - Foreign currency forward contracts - - - -Derivative liabilities - Swaps and swaptions - - - -Total - - - -

– 232 –
CI Global Investment Grade Credit Private Pool
Semi-Annual Financial Statements - September 30, 2021
Redeemable Unit Transactions (Note 4)for the periods ended September 30
Number of redeemable units at the beginning of periodRedeemable units issued for cashRedeemable units issued for reinvested distributionsRedeemable units redeemedNumber of redeemable units at the end of period
Fund Specific Notes to Financial Statements (unaudited)
†A portion of brokerage commissions paid was used to cover research and market data services, termed soft dollar commissions. This amount has been estimated by the Manager of the Fund.The accompanying notes are an integral part of these financial statements.
Commissions (Note 2)for the periods ended September 30 (in $000’s)
2021 2020Brokerage commissions - -Soft dollar commissions† - -
Series A 2021 2020 1,825,330 323,296 152,825 511,330 9,022 1,334 (300,924) (58,798) 1,686,253 777,162
Series F 2021 2020 5,439,095 4,136,532 661,978 1,205,134 34,653 21,692 (1,423,296) (676,230) 4,712,430 4,687,128
Series I 2021 2020 97 1,041 - - 1 2 - (948) 98 95

– 233 –
CI Global Investment Grade Credit Private Pool
Semi-Annual Financial Statements - September 30, 2021
The accompanying notes are an integral part of these financial statements.
Fund Specific Notes to Financial Statements (unaudited)
Securities Lending (Note 6)as at September 30 (in $000’s)
2021 2020Loaned 14,354 18,004Collateral (non-cash) 14,652 18,375
Securities Lending Revenue Reconciliation (Note 6)for the periods ended September 30 (in $000’s)
2021 2020Gross securities lending revenue 6 7Charges (1) (1)Securities lending revenue 5 6Charges as a % of gross securities lending revenue 16.7 14.3
Management and Administration Fees (Note 5) as at September 30, 2021 (%)
Annual management
fee rate:
Annual administration
fee rate:
Series A 1.050 0.15Series F 0.550 0.15Series I Paid directly by investor Paid directly by investor

– 234 –
CI Global Investment Grade Credit Private Pool
Semi-Annual Financial Statements - September 30, 2021
The accompanying notes are an integral part of these financial statements.
Other Price RiskAs at September 30, 2021 and March 31, 2021, the Fund did not invest in equities and therefore was not subject to other price risk.
Currency RiskThe tables below summarize the Fund’s exposure to currency risk.
as at September 30, 2021~
Currency
Financial Instruments Exposure Derivatives
Net Exposure
Net Assets
(%)(in $000’s) (in $000’s) (in $000’s)U.S. Dollar 13,228 (13,737) (509) (0.8) Total 13,228 (13,737) (509) (0.8)
as at March 31, 2021~
Currency
Financial Instruments Exposure Derivatives
Net Exposure
Net Assets
(%)(in $000’s) (in $000’s) (in $000’s)U.S. Dollar 18,060 (18,547) (487) (0.7)Total 18,060 (18,547) (487) (0.7)
~Includes monetary and non-monetary instruments, if any.
As at September 30, 2021, had the Canadian dollar strengthened or weakened by 10% (March 31, 2021 - 10%) in relation to all other foreign currencies held in the Fund, with all other variables held constant, net assets attributable to holders of redeemable units of the Fund would have decreased or increased, respectively, by approximately $51,000 (March 31, 2021 - $49,000). In practice, actual results may differ from this analysis and the difference may be material.
Interest Rate RiskThe tables below summarize the Fund’s exposure to interest rate risk, categorized by the contractual maturity date.
as at September 30, 2021
Less than1 Year
1 - 3Years
3 - 5Years
Greaterthan
5 Years Total
(in $000’s) (in $000’s) (in $000’s) (in $000’s) (in $000’s)Interest Rate Exposure 3,081 11,156 9,999 40,964 65,200
as at March 31, 2021
Less than1 Year
1 - 3Years
3 - 5Years
Greaterthan
5 Years Total
(in $000’s) (in $000’s) (in $000’s) (in $000’s) (in $000’s)Interest Rate Exposure 3,750 9,708 8,956 42,706 65,120
As at September 30, 2021, had the prevailing interest rates increased or decreased by 0.25% (March 31, 2021 - 0.25%), with all other variables held constant, net assets attributable to holders of redeemable units of the Fund would have decreased or increased, respectively, by approximately $1,081,000 (March 31, 2021 - $1,054,000). In practice, actual results may differ from this analysis and the difference may be material.
Financial Instruments Risks (Note 10)
Concentration RiskFor Concentration Risk as at September 30, 2021, refer to the Schedule of Investment Portfolio.
The table below summarizes the Fund’s exposure to concentration risk.
as at March 31, 2021Categories Net Assets (%)Canada 57.6 U.S.A. 24.0 Other Net Assets (Liabilities) 12.6 Short-Term Investment(s) 4.0 U.K. 1.2 Mexico 0.3 Jersey Island 0.2 Foreign Currency Forward Contract(s) 0.1 Netherlands 0.1 Total 100.0
Credit RiskThe Fund was invested in fixed income securities, preferred securities and derivative instruments, if any, with the following credit ratings, as per the tables below.
as at September 30, 2021Credit Rating^* Net Assets (%)AAA/Aaa/A++ 24.3AA/Aa/A+ 5.0A 15.9BBB/Baa/B++ 49.3BB/Ba/B+ 4.6Total 99.1
as at March 31, 2021Credit Rating^* Net Assets (%)AAA/Aaa/A++ 25.6AA/Aa/A+ 5.6A 12.6BBB/Baa/B++ 41.1BB/Ba/B+ 3.0Total 87.9
^Credit ratings are obtained from S&P Global Ratings, where available, otherwise ratings are obtained from: Moody’s
Investors Service or Dominion Bond Rating Service, respectively.
*Refer to Note 10 for Credit Rating Chart reference.
Fund Specific Notes to Financial Statements (unaudited)

– 235 –
CI Global Investment Grade Credit Private Pool
Semi-Annual Financial Statements - September 30, 2021
The accompanying notes are an integral part of these financial statements.
Fair Value Hierarchy
The tables below summarize the inputs used by the Fund in valuing the Fund’s investments and derivatives carried at fair value.
Long Positions at fair value as at September 30, 2021Level 1 Level 2 Level 3 Total
(in $000’s) (in $000’s) (in $000’s) (in $000’s)Bonds - 65,200 - 65,200 Foreign currency forward contract(s), net - (62) - (62)Total - 65,138 - 65,138
Short Positions at fair value as at September 30, 2021Level 1 Level 2 Level 3 Total
(in $000’s) (in $000’s) (in $000’s) (in $000’s)Futures contract(s), net 12 - - 12 Total 12 - - 12
Long Positions at fair value as at March 31, 2021Level 1 Level 2 Level 3 Total
(in $000’s) (in $000’s) (in $000’s) (in $000’s)Bonds - 62,120 - 62,120 Short-term investment(s) - 3,000 - 3,000 Foreign currency forward contract(s), net - 108 - 108 Total - 65,228 - 65,228
There were no transfers between Level 1, 2 and 3 during the period ended September 30, 2021 and the year ended March 31, 2021.
Fund Specific Notes to Financial Statements (unaudited)

– 236 –
CI Global Unconstrained Bond Private Pool
Semi-Annual Financial Statements - September 30, 2021
Statements of Financial Position (in $000’s except for per unit amounts and units outstanding)
as at as at Sept. 30, 2021 Mar. 31, 2021 7,481 7,281 - - 517 141
- 74 - - - - - - - - 1 1 68 60 - - - - - - - - 8,067 7,557
- - - -
59 4 - - - - - - - - 20 77 - 22 - - - - - - - - 79 103
7,988 7,454
Statements of Financial Position (cont’d)(in $000’s except for per unit amounts and units outstanding)
Net assets attributable to holders of redeemable units
per Series (Note 4):
Net assets attributable to holders of redeemable
units per unit: Number of redeemable
units outstanding:
as at Sept. 30, 2021
as at Mar. 31, 2021
as at Sept. 30, 2021
as at Mar. 31, 2021
as at Sept. 30, 2021
as at Mar. 31, 2021
Series A 3,700 3,547 10.44 10.26 354,425 345,734Series F 4,287 3,906 10.44 10.26 410,677 380,691Series I 1 1 10.47 10.29 117 115
AssetsCurrent assetsInvestmentsInvestments pledged as collateralCashUnrealized gain on futures and foreign currency forward contractsSwaps, swaptions and optionsDaily variation margin on derivative instrumentsFees rebate receivableCash collateral on deposit for short saleDividends receivableInterest receivableReceivable for distribution from investmentsSecurities lending revenue receivable (Note 6)Receivable for investments soldReceivable for unit subscriptions
LiabilitiesCurrent liabilitiesInvestments sold shortBank overdraftUnrealized loss on futures and foreign currency forward contractsSwaps, swaptions and options Dividends payable on investments sold shortInterest payable on investments sold shortDaily variation margin on derivative instrumentsPayable for investments purchasedPayable for unit redemptionsDistributions payable to holders of redeemable units Management fees payableAdministration fees payableAccounts payable and accrued liabilities
Net assets attributable to holders of redeemable units
The accompanying notes are an integral part of these financial statements.
Financial Statements (unaudited)
CIG - 2062

– 237 –
CI Global Unconstrained Bond Private Pool
Semi-Annual Financial Statements - September 30, 2021
Statements of Comprehensive Incomefor the periods ended September 30(in $000’s except for per unit amounts and number of units)
2021 2020
26 49 139 337 - - - - - -
- - - -
54 (440)
70 1,996 289 1,942 5 1 - - - - - - 5 1 294 1,943
30 45 5 11 1 2 1 1 - - - - - - - - 4 7 4 7 - - 45 73
249 1,870
The accompanying notes are an integral part of these financial statements.
Financial Statements (unaudited)
Statements of Comprehensive Income (cont’d)for the periods ended September 30(in $000’s except for per unit amounts and number of units)
Increase (decrease) in net assets attributable to
holders of redeemable units per Series:
Increase (decrease) in net assets attributable to
holders of redeemable units per unit:
Weighted average number of units:
2021 2020 2021 2020 2021 2020Series A 113 214 0.32 1.10 350,090 195,547Series F 136 1,656 0.36 1.21 384,678 1,362,743Series I - - 0.40 1.47 117 331
Income Net gain (loss) on investments and derivatives Dividends Interest for distribution purposes Income distributions from investments Capital gain distributions from investments Derivative income (loss) Dividends expense on financial assets (liabilities) sold
short Interest expense on financial assets (liabilities) sold short Net realized gain (loss) on sale of investments and
derivatives Change in unrealized appreciation (depreciation) in value
of investments and derivativesTotal net gain (loss) on investments and derivativesOther income Foreign exchange gain (loss) on cash Commitment fee income Securities lending revenue (Note 6) Fees rebateTotal other incomeTotal incomeExpensesManagement fees (Note 5)Administration fees (Note 5)Commissions and other portfolio transaction costsIndependent review committee feesSecurities borrowing fees (Note 2)Margin feesService feesInterest expenseWithholding taxesHarmonized sales taxOther expensesTotal expensesIncrease (decrease) in net assets attributable to holders of redeemable units

– 238 –
CI Global Unconstrained Bond Private Pool
Semi-Annual Financial Statements - September 30, 2021
The accompanying notes are an integral part of these financial statements.
Financial Statements (unaudited)
Statements of Changes in Net Assets Attributable to Holders of Redeemable Unitsfor the periods ended September 30 (in $000’s)
Net assets attributable to holders of redeemable units at the beginning of periodIncrease (decrease) in net assets attributable to holders of redeemable unitsDistributions to holders of redeemable units From net investment income From net realized gains Return of capitalTotal distributions to holders of redeemable units
Redeemable unit transactions Proceeds from redeemable units issued Reinvestment of distributions to holders of redeemable units Redemption of redeemable unitsNet increase (decrease) from redeemable unit transactionsNet increase (decrease) in net assets attributable to holders of redeemable unitsNet assets attributable to holders of redeemable units at the end of period
Series A 2021 2020 3,547 1,770 113 214
(52) (40) - - - - (52) (40)
1,285 96 30 8 (1,223) (325) 92 (221) 153 (47) 3,700 1,723
Series F 2021 2020 3,906 13,034 136 1,656
(68) (291) - - - - (68) (291)
1,222 1,236 58 122 (967) (12,271) 313 (10,913) 381 (9,548) 4,287 3,486
Series I 2021 2020 1 9 - -
- - - - - - - -
- - - - - (8) - (8) - (8) 1 1
Total Fund 2021 2020 7,454 14,813 249 1,870
(120) (331) - - - - (120) (331)
2,507 1,332 88 130 (2,190) (12,604) 405 (11,142) 534 (9,603) 7,988 5,210

– 239 –
CI Global Unconstrained Bond Private Pool
Semi-Annual Financial Statements - September 30, 2021
Statements of Cash Flowsfor the periods ended September 30 (in $000’s)
2021 2020
249 1,870
(54) 440 - 4 1 2
(70) (1,996) 3,241 15,614 (3,246) (5,263) - - - - - - - - (8) 133 - - - - - - - - 113 10,804
(32) (201) 2,507 1,345 (2,212) (12,596) 263 (11,452)
- (4) 376 (648) 141 722 517 70
25 46 128 473 - - - - - -
*Dividends and interest received as well as dividends and interest paid relate to operating activities of the Fund. The accompanying notes are an integral part of these financial statements.
Financial Statements (unaudited)
Cash flows from (used in) operating activitiesIncrease (decrease) in net assets attributable to holders of redeemable unitsAdjustments for: Net realized (gain) loss on sale of investments and derivatives Unrealized foreign exchange (gain) loss on cash Commissions and other portfolio transaction costs Change in unrealized (appreciation) depreciation in value of
investments and derivatives Proceeds from sale and maturity of investments and derivatives Purchase of investments and derivatives (Increase) decrease in cash collateral on deposit for short sale Non-cash distributions from investments Change in daily variation margin (Increase) decrease in dividends receivable (Increase) decrease in interest receivable (Increase) decrease in securities lending revenue receivable Increase (decrease) in management fees payable Increase (decrease) in administration fees payable Change in other accounts receivable and payableNet cash from (used in) operating activities
Cash flows from (used in) financing activitiesDistributions paid to holders of redeemable units, net of reinvested distributionsProceeds from issuance of redeemable unitsAmounts paid on redemption of redeemable unitsNet cash from (used in) financing activities Unrealized foreign exchange gain (loss) on cashNet increase (decrease) in cashCash (bank overdraft), beginning of periodCash (bank overdraft), end of period
Supplementary Information:Dividends received, net of withholding tax*Interest received, net of withholding tax*Dividends paid*Interest paid*Tax recoverable (paid)

– 240 –
CI Global Unconstrained Bond Private Pool
Semi-Annual Financial Statements - September 30, 2021
Percentages shown relate investments at fair value to net assets attributable to holders of redeemable units of the Fund.
Schedule of Investment Portfolio as at September 30, 2021 (unaudited)
Number ofUnits/Sharesor Par Value Description
Average Cost($)
Fair Value($)
% of Net Assets
CANADA USD 15,000 Air Canada 2021-1 Class C Pass Through Trust 10.5%, July 15, 2026 23,400 23,416 30,000 Air Canada 4.625%, August 15, 2029 30,000 30,162 USD 5,780 Air Canada, 2013-1 Class A Pass Through Certificates 4.125%, May 15, 2025 7,180 7,489 575 Artis Real Estate Investment Trust, Preferred 4.75%, Series E 12,239 13,599 675 Artis Real Estate Investment Trust, Preferred 5.662%, Series A 15,093 16,821 80,000 Bank of Montreal, FRN, 4.3%, November 26, 2080 80,000 84,600 1,300 Bank of Montreal, Preferred 5.1%, Series 46 32,937 35,087 225 BCE Inc., Preferred 4.4%, Series AF 16 3,413 4,496 1,800 BCE Inc., Preferred 4.6%, Series Y 26,675 33,660 2,300 BCE Inc., Preferred 5.55%, Series 19 34,176 43,723 300 BCE Inc., Preferred 6.174%, Series R 4,512 5,550 60,000 Bell Canada Inc., 4.7%, September 11, 2023 65,727 63,632 725 Brookfield Asset Management Inc., Preferred 4.6%, Series 2 11,085 12,832 150 Brookfield Asset Management Inc., Preferred, Series 2 1,666 1,988 1,400 Brookfield Office Properties Inc., Preferred 4.75%, Series AA 24,264 27,860 3,425 Brookfield Office Properties Inc., Preferred 5.15%, Series P 51,653 63,397 100,000 Brookfield Property Finance ULC 4.115%, October 19, 2021 100,250 100,130 155,000 Brookfield Property Finance ULC 4.3%, March 01, 2024 160,204 159,975 8,000 Brookfield Residential Properties Inc., 5.125%, June 15, 2029 8,000 8,073 11,417 Calfrac Well Services Ltd. 179,416 39,960 USD 99,251 Canada Goose Inc., Term Loan, Private Placement, variable rate, October 07, 2027 130,478 126,182 113,000 Canadian Imperial Bank of Commerce 4.375%, October 28, 2080 113,206 119,498 25,000 Canadian Imperial Bank of Commerce, FRN, 4%, January 28, 2082 25,150 25,250 850 Canadian Imperial Bank of Commerce, Preferred 4.4%, Series 45 19,055 21,641 700 Canadian Imperial Bank of Commerce, Preferred 5.15%, Series 51 17,702 18,690 100,000 Canadian Natural Resources Ltd., 3.31%, February 11, 2022 101,005 100,919 100,000 Canadian Western Bank 5%, July 31, 2081 100,000 101,768 125,000 Canadian Western Bank 6%, April 30, 2081 125,683 134,219 275 Capital Power Corp., Preferred 4.5%, Series 5 4,842 6,655 100,000 CARDS II Trust 2.427%, November 15, 2024 104,432 103,468 31,000 Cineplex Inc., 7.5%, February 26, 2026 31,082 32,821 75,000 Classic RMBS Trust (Series 2021-1) 1.563%, November 15, 2051 58,442 58,508 1,000 Element Financial Corp., Preferred 6.6%, Series A 26,188 26,280 USD 50,000 Emera Inc., 6.75%, June 15, 2076 72,198 75,410 350 Emera Inc., Preferred 4.60%, Series L 8,750 8,960 USD 12,000 Empire Communities Corp., 7%, December 15, 2025 15,770 15,902 78,000 Empire Communities Corp., 7.375%, December 15, 2025 81,170 81,851 USD 53,000 Enbridge Inc., 5.5%, July 15, 2077 67,182 71,925 700 Enbridge Inc., Preferred 4%, Series 3 10,308 12,586 425 Enbridge Inc., Preferred 4%, Series F 6,860 8,492 1,200 Enbridge Inc., Preferred 4%, Series R 18,264 22,692 600 Enbridge Inc., Preferred 4.4%, Series 9 9,360 11,766 125,000 Equitable Bank 1.774%, September 21, 2023 126,118 125,975 USD 35,000 Fairfax India Holdings Corp., 5%, February 26, 2028 43,790 44,282 25,000 Fairstone Financial Issuance Trust I 2.509%, October 20, 2039 25,000 25,294 25,000 Fairstone Financial Issuance Trust I 3.735%, October 20, 2039 25,000 25,049 100,000 Falcon Holding Acquisition Corp., 6.125%, June 30, 2031 100,000 100,520 USD 3,000 First Quantum Minerals Ltd., 6.5%, March 01, 2024 3,859 3,852 USD 14,000 First Quantum Minerals Ltd., 6.875%, October 15, 2027 18,013 18,787 USD 23,000 First Quantum Minerals Ltd., 7.25%, April 01, 2023 30,805 29,678 35,000 Ford Auto Securitization Trust 2.354%, June 15, 2023 5,765 5,783 125,000 Ford Auto Securitization Trust 2.841%, January 15, 2024 91,179 90,891 250 George Weston Ltd., Preferred 5.2%, Series IV 6,120 6,468 USD 12,000 goeasy Ltd., 4.375%, May 01, 2026 15,002 15,636 63,000 Great-West Lifeco Inc., FRN, 3.6%, December 31, 2081 63,000 63,011 32,000 Inter Pipeline Ltd., 6.625%, November 19, 2079 32,751 34,756

– 241 –
CI Global Unconstrained Bond Private Pool
Semi-Annual Financial Statements - September 30, 2021
Percentages shown relate investments at fair value to net assets attributable to holders of redeemable units of the Fund.
Schedule of Investment Portfolio as at September 30, 2021 (unaudited) (cont’d)
CANADA (cont’d) 64,000 Inter Pipeline Ltd., 6.875%, March 26, 2079 66,100 70,583 162,000 Keyera Corp., 6.875%, June 13, 2079 166,401 180,535 USD 25,000 Manitoulin USD Ltd., 3.61575%, December 10, 2025 33,063 31,883 400 Manulife Financial Corp., Preferred 4.65%, Series 2, Class A 9,299 10,176 575 Manulife Financial Corp., Preferred 4.85%, Series 23 14,669 14,680 USD 5,000 MEG Energy Corp., 6.5%, January 15, 2025 6,874 6,524 USD 28,000 New Gold Inc., 6.375%, May 15, 2025 36,183 36,595 900 Pembina Pipeline Corp., Preferred 4.9%, Series 21 21,754 23,022 800 Power Financial Corp., Preferred 4.95%, Series K 18,988 20,664 250 Power Financial Corp., Preferred, Series H 6,435 6,500 USD 5,000 Precision Drilling Corp., 6.875%, January 15, 2029 5,972 6,624 USD 42,000 Rockpoint Gas Storage Canada Ltd., 7%, March 31, 2023 56,505 54,061 60,000 Royal Bank of Canada 2.949%, May 01, 2023 63,339 62,131 100,000 Royal Bank of Canada, FRN, 3.65%, November 24, 2081 100,000 100,268 60,000 Royal Bank of Canada, FRN, 4%, February 24, 2081 60,000 62,607 106,000 Royal Bank of Canada, FRN, 4.5%, November 24, 2080 106,650 112,461 500 Royal Bank of Canada, Preferred 3.6%, Series BD 11,090 12,535 1,375 Sun Life Financial Inc., Preferred 4.45%, Series 4 30,285 34,994 8,000 Superior Plus L.P., 4.25%, May 18, 2028 8,000 8,227 93,000 Sysco Canada Inc., 3.65%, April 25, 2025 101,205 98,667 800 TC Energy Corp., Preferred 2.152%, Series 3 11,272 10,880 1,000 TC Energy Corp., Preferred 4.9%, Series 15 25,117 25,670 88,000 Toronto-Dominion Bank, FRN, 3.6%, October 31, 2081 88,000 87,943 200 Toronto-Dominion Bank, Preferred 3.6%, Series 7 3,842 5,006 800 Toronto-Dominion Bank, Preferred 3.9%, Series 1 17,222 19,584 800 Toronto-Dominion Bank, Preferred 4.75%, Series 18 19,298 20,544 400 Toronto-Dominion Bank, Preferred 4.75%, Series 20 9,160 10,248 2,639 Toronto-Dominion Bank, Preferred 5.1%, Series 24 66,361 71,728 275 Toronto-Dominion Bank, Preferred 5.2%, Series 22 7,048 7,392 USD 20,000 TransCanada Trust 5.5%, September 15, 2079 27,346 28,023 3,802,897 3,792,670 47.50 U.S.A. USD 20,000 Ally Financial Inc., FRN, 4.7%, December 31, 2049 24,135 26,535 USD 3,970 Alterra Mountain Co., Term Loan B, Private Placement, variable rate, July 30, 2028 5,207 5,023 USD 17,000 AMC Entertainment Holdings Inc., Term Loan B, Private Placement, variable rate, March 20, 2026 19,129 20,022 USD 13,000 American Airlines Inc./AAdvantage Loyalty IP Ltd., 5.75%, April 20, 2029 16,764 17,763 USD 40,000 American Express Co., 3.55275%, December 31, 2049 50,496 50,726 USD 34,000 Bank of America Corp., 5.125%, December 31, 2049 45,604 45,704 USD 69,000 Bank of America Corp., FRN, 6.25%, December 31, 2049 98,949 96,189 USD 20,000 Burford Capital Global Finance LLC 6.25%, April 15, 2028 25,571 26,879 24,000 Calfrac Holdings L.P., 10%, December 18, 2023 24,000 24,000 USD 74,250 Calfrac Holdings L.P., 10.875%, March 15, 2026 95,456 72,172 354 California Resources Corp., Warrants (27 October 2024) - 5,380 1,500 Citigroup Capital XIII, Preferred 7.875% 53,022 52,722 USD 35,000 Citigroup Inc., 4.7%, December 31, 2049 45,668 45,411 USD 40,000 Citigroup Inc., 5%, December 31, 2049 52,940 53,044 USD 15,000 CQP Holdco L.P./BIP-V Chinook Holdco LLC 5.5%, June 15, 2031 18,244 20,230 USD 4,000 CrownRock L.P./CrownRock Finance Inc., 5.625%, October 15, 2025 5,223 5,192 1,500 Delphi Financial Group Inc., Preferred 40,786 44,885 USD 25,000 Dresdner Funding Trust I 8.151%, June 30, 2031 43,797 45,352 USD 29,000 Everest Reinsurance Holdings Inc., 2.50975%, May 15, 2037 34,222 35,149 USD 63,000 Fortress Transportation and Infrastructure Investors LLC 6.5%, October 01, 2025 79,135 82,397 USD 90,000 General Motors Financial Co., Inc., 5.7%, December 31, 2049 118,409 131,520 USD 2,000 Genesis Energy L.P./Genesis Energy Finance Corp., 8%, January 15, 2027 2,600 2,575 USD 10,000 Genworth Holdings Inc., 4.9%, August 15, 2023 13,045 12,964 64 GMAC Capital Trust, Preferred 8.125%, Series 2 2,172 2,046
Number ofUnits/Sharesor Par Value Description
Average Cost($)
Fair Value($)
% of Net Assets
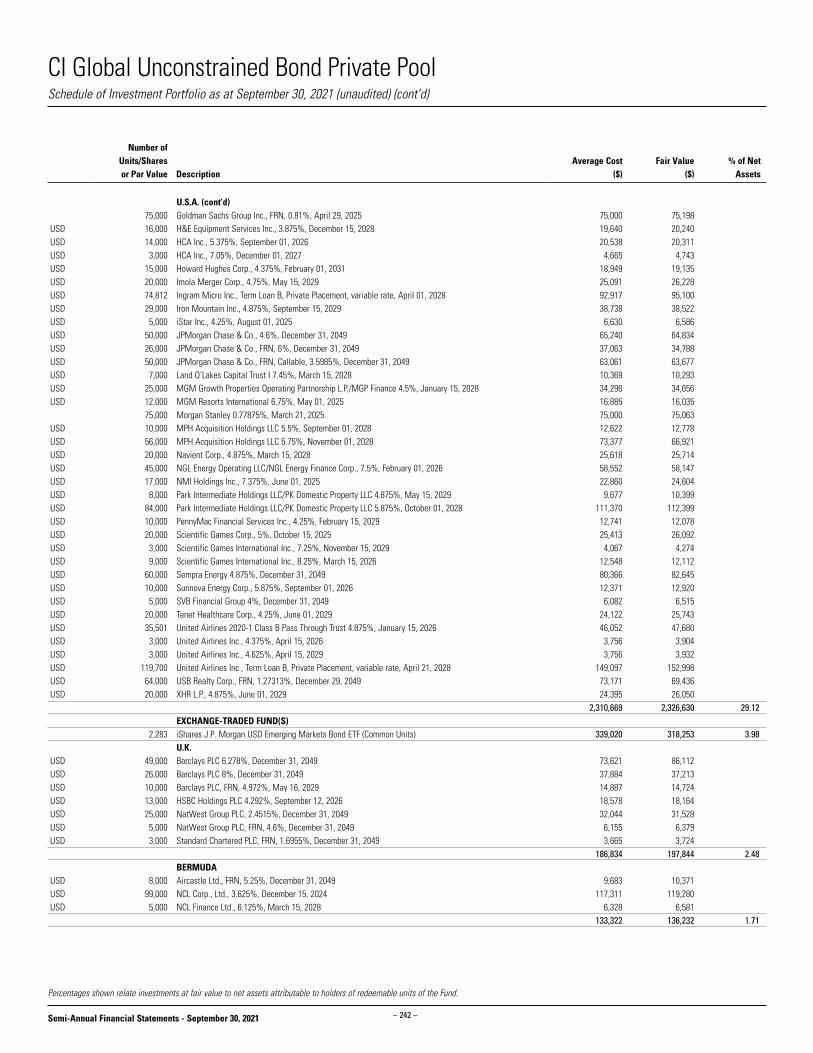
– 242 –
CI Global Unconstrained Bond Private Pool
Semi-Annual Financial Statements - September 30, 2021
Percentages shown relate investments at fair value to net assets attributable to holders of redeemable units of the Fund.
Schedule of Investment Portfolio as at September 30, 2021 (unaudited) (cont’d)
U.S.A. (cont’d) 75,000 Goldman Sachs Group Inc., FRN, 0.81%, April 29, 2025 75,000 75,198 USD 16,000 H&E Equipment Services Inc., 3.875%, December 15, 2028 19,640 20,240 USD 14,000 HCA Inc., 5.375%, September 01, 2026 20,538 20,311 USD 3,000 HCA Inc., 7.05%, December 01, 2027 4,665 4,743 USD 15,000 Howard Hughes Corp., 4.375%, February 01, 2031 18,949 19,135 USD 20,000 Imola Merger Corp., 4.75%, May 15, 2029 25,091 26,228 USD 74,812 Ingram Micro Inc., Term Loan B, Private Placement, variable rate, April 01, 2028 92,917 95,100 USD 29,000 Iron Mountain Inc., 4.875%, September 15, 2029 38,738 38,522 USD 5,000 iStar Inc., 4.25%, August 01, 2025 6,630 6,586 USD 50,000 JPMorgan Chase & Co., 4.6%, December 31, 2049 65,240 64,834 USD 26,000 JPMorgan Chase & Co., FRN, 6%, December 31, 2049 37,063 34,788 USD 50,000 JPMorgan Chase & Co., FRN, Callable, 3.5985%, December 31, 2049 63,061 63,677 USD 7,000 Land O’Lakes Capital Trust I 7.45%, March 15, 2028 10,369 10,293 USD 25,000 MGM Growth Properties Operating Partnership L.P./MGP Finance 4.5%, January 15, 2028 34,296 34,656 USD 12,000 MGM Resorts International 6.75%, May 01, 2025 16,885 16,035 75,000 Morgan Stanley 0.77875%, March 21, 2025 75,000 75,063 USD 10,000 MPH Acquisition Holdings LLC 5.5%, September 01, 2028 12,622 12,778 USD 56,000 MPH Acquisition Holdings LLC 5.75%, November 01, 2028 73,377 66,921 USD 20,000 Navient Corp., 4.875%, March 15, 2028 25,618 25,714 USD 45,000 NGL Energy Operating LLC/NGL Energy Finance Corp., 7.5%, February 01, 2026 58,552 58,147 USD 17,000 NMI Holdings Inc., 7.375%, June 01, 2025 22,860 24,604 USD 8,000 Park Intermediate Holdings LLC/PK Domestic Property LLC 4.875%, May 15, 2029 9,677 10,399 USD 84,000 Park Intermediate Holdings LLC/PK Domestic Property LLC 5.875%, October 01, 2028 111,370 112,399 USD 10,000 PennyMac Financial Services Inc., 4.25%, February 15, 2029 12,741 12,078 USD 20,000 Scientific Games Corp., 5%, October 15, 2025 25,413 26,092 USD 3,000 Scientific Games International Inc., 7.25%, November 15, 2029 4,067 4,274 USD 9,000 Scientific Games International Inc., 8.25%, March 15, 2026 12,548 12,112 USD 60,000 Sempra Energy 4.875%, December 31, 2049 80,366 82,645 USD 10,000 Sunnova Energy Corp., 5.875%, September 01, 2026 12,371 12,920 USD 5,000 SVB Financial Group 4%, December 31, 2049 6,082 6,515 USD 20,000 Tenet Healthcare Corp., 4.25%, June 01, 2029 24,122 25,743 USD 35,501 United Airlines 2020-1 Class B Pass Through Trust 4.875%, January 15, 2026 46,052 47,680 USD 3,000 United Airlines Inc., 4.375%, April 15, 2026 3,756 3,904 USD 3,000 United Airlines Inc., 4.625%, April 15, 2029 3,756 3,932 USD 119,700 United Airlines Inc., Term Loan B, Private Placement, variable rate, April 21, 2028 149,097 152,998 USD 64,000 USB Realty Corp., FRN, 1.27313%, December 29, 2049 73,171 69,436 USD 20,000 XHR L.P., 4.875%, June 01, 2029 24,395 26,050 2,310,669 2,326,630 29.12 EXCHANGE-TRADED FUND(S) 2,283 iShares J.P. Morgan USD Emerging Markets Bond ETF (Common Units) 339,020 318,253 3.98 U.K. USD 49,000 Barclays PLC 6.278%, December 31, 2049 73,621 86,112 USD 26,000 Barclays PLC 8%, December 31, 2049 37,884 37,213 USD 10,000 Barclays PLC, FRN, 4.972%, May 16, 2029 14,887 14,724 USD 13,000 HSBC Holdings PLC 4.292%, September 12, 2026 18,578 18,164 USD 25,000 NatWest Group PLC, 2.4515%, December 31, 2049 32,044 31,528 USD 5,000 NatWest Group PLC, FRN, 4.6%, December 31, 2049 6,155 6,379 USD 3,000 Standard Chartered PLC, FRN, 1.6955%, December 31, 2049 3,665 3,724 186,834 197,844 2.48 BERMUDA USD 8,000 Aircastle Ltd., FRN, 5.25%, December 31, 2049 9,683 10,371 USD 99,000 NCL Corp., Ltd., 3.625%, December 15, 2024 117,311 119,280 USD 5,000 NCL Finance Ltd., 6.125%, March 15, 2028 6,328 6,581 133,322 136,232 1.71
Number ofUnits/Sharesor Par Value Description
Average Cost($)
Fair Value($)
% of Net Assets

– 243 –
CI Global Unconstrained Bond Private Pool
Semi-Annual Financial Statements - September 30, 2021
Percentages shown relate investments at fair value to net assets attributable to holders of redeemable units of the Fund.
Schedule of Investment Portfolio as at September 30, 2021 (unaudited) (cont’d)
PANAMA USD 20,000 Carnival Corp., 4%, August 01, 2028 25,259 25,617 USD 7,000 Carnival Corp., 7.625%, March 01, 2026 9,426 9,476 USD 63,000 Carnival Corp., 9.875%, August 01, 2027 91,722 92,192 126,407 127,285 1.59 LIBERIA USD 26,000 Royal Caribbean Cruises Ltd., 5.25%, November 15, 2022 33,626 33,796 USD 17,000 Royal Caribbean Cruises Ltd., 5.5%, April 01, 2028 21,379 22,055 USD 46,000 Royal Caribbean Cruises Ltd., 9.125%, June 15, 2023 63,343 63,394 118,348 119,245 1.49 LUXEMBOURG USD 36,339 Altice Financing S.A., Term Loan B, Private Placement, variable rate, January 31, 2026 47,420 45,325 USD 50,000 Altice France Holding S.A., 10.5%, May 15, 2027 70,149 69,108 117,569 114,433 1.43 SWITZERLAND USD 8,000 Credit Suisse Group AG 4.5%, December 31, 2049 10,338 9,955 USD 38,000 Credit Suisse Group AG 6.375%, December 31, 2049 52,624 52,944 USD 26,000 Credit Suisse Group AG 7.5%, December 31, 2049 37,404 35,294 USD 10,000 UBS Group AG, FRN, 3.875%, December 31, 2049 12,068 12,674 112,434 110,867 1.39 GERMANY USD 15,000 Commerzbank AG 8.125%, September 19, 2023 23,102 21,413 USD 52,000 Deutsche Bank AG 4.25%, October 14, 2021 70,525 65,934 93,627 87,347 1.09 BRITISH VIRGIN ISLANDS USD 18,000 Studio City Finance Ltd., 6.5%, January 15, 2028 24,671 22,393 0.28 BRAZIL USD 15,000 Federative Republic of Brazil International Bond 2.875%, June 06, 2025 20,129 19,433 0.24 CAYMAN ISLANDS USD 7,000 Global Aircraft Leasing Co., Ltd., 6.5%, September 15, 2024 8,215 8,282 0.10 SHORT-TERM INVESTMENT(S) 100,000 Enbridge Inc., 0.79619%, October 12, 2021 99,915 99,915 1.25Commissions and other portfolio transaction costs (515)Total Investment Portfolio before Derivative Instruments 7,493,542 7,480,829 93.65Foreign Currency Forward Contract(s) (see Schedule A) (58,702) (0.73)Total Investment Portfolio 7,493,542 7,422,127 92.92Other Net Assets (Liabilities) 566,342 7.08Net Assets Attributable to Holders of Redeemable Units 7,988,469 100.00
Principal amounts stated in:USD U.S. Dollar
Number ofUnits/Sharesor Par Value Description
Average Cost($)
Fair Value($)
% of Net Assets

– 244 –
CI Global Unconstrained Bond Private Pool
Semi-Annual Financial Statements - September 30, 2021
Schedule of Investment Portfolio as at September 30, 2021 (unaudited) (cont’d)
‡Credit ratings are obtained from S&P Global Ratings, where available, otherwise ratings are obtained from: Moody’s Investors Service or Dominion Bond Rating Service.
Schedule AForeign Currency Forward Contract(s)
CounterpartyCredit Rating of the Counterparty‡ Settlement Date
Currency Buy Position
Currency Sell Position
Contract(s) Rate
Unrealized Gain (Loss) ($)
Bank of Montreal A-1 November 18, 2021 CAD 74,851 USD 59,610 1.26 (656)Canadian Imperial Bank of Commerce A-1 October 20, 2021 CAD 288,726 USD 230,947 1.25 (3,797)Canadian Imperial Bank of Commerce A-1 November 18, 2021 CAD 74,970 USD 59,595 1.26 (518)Canadian Imperial Bank of Commerce A-1 October 20, 2021 USD 170,753 CAD 215,900 0.79 381 Citigroup Inc. A-2 October 20, 2021 CAD 575,516 USD 461,893 1.25 (9,530)Citigroup Inc. A-2 November 18, 2021 CAD 74,799 USD 59,603 1.25 (699)Goldman Sachs Group Inc. A-2 October 20, 2021 CAD 385,060 USD 307,929 1.25 (4,971)Goldman Sachs Group Inc. A-2 November 18, 2021 CAD 46,589 USD 37,252 1.25 (597)HSBC Holdings PLC A-1 October 20, 2021 CAD 298,589 USD 239,638 1.25 (4,943)HSBC Holdings PLC A-1 November 18, 2021 CAD 46,701 USD 37,252 1.25 (485)JPMorgan Chase & Co. A-2 October 20, 2021 CAD 579,411 USD 461,893 1.25 (5,636)JPMorgan Chase & Co. A-2 November 18, 2021 CAD 42,064 USD 33,527 1.25 (403)Morgan Stanley A-2 October 20, 2021 CAD 861,546 USD 692,840 1.24 (16,023)Royal Bank of Canada A-1+ October 20, 2021 CAD 575,512 USD 461,893 1.25 (9,534)Royal Bank of Canada A-1+ November 18, 2021 CAD 60,950 USD 48,813 1.25 (880)Toronto-Dominion Bank A-1+ November 18, 2021 CAD 42,057 USD 33,527 1.25 (411)Total Foreign Currency Forward Contract(s) Value (58,702)

– 245 –
CI Global Unconstrained Bond Private Pool
Semi-Annual Financial Statements - September 30, 2021
The accompanying notes are an integral part of these financial statements.
Fund Specific Notes to Financial Statements (unaudited)
Offsetting of Financial Instruments (Note 2)
The following tables show the net impact on the Fund’s Statements of Financial Position if all rights to offset were exercised.
as at September 30, 2021Amounts Eligible for Offset
Gross Assets/(Liabilities)
FinancialInstruments
CollateralReceived/(Paid)
NetExposure
(in $000’s) (in $000’s) (in $000’s) (in $000’s)Derivative assets - Foreign currency forward contracts - - - -Derivative assets - Swaps and swaptions - - - -Total - - - -Derivative liabilities - Foreign currency forward contracts (59) - - (59)Derivative liabilities - Swaps and swaptions - - - -Total (59) - - (59)
as at March 31, 2021Amounts Eligible for Offset
Gross Assets/(Liabilities)
FinancialInstruments
CollateralReceived/(Paid)
NetExposure
(in $000’s) (in $000’s) (in $000’s) (in $000’s)Derivative assets - Foreign currency forward contracts 74 (4) - 70Derivative assets - Swaps and swaptions - - - -Total 74 (4) - 70Derivative liabilities - Foreign currency forward contracts (4) 4 - -Derivative liabilities - Swaps and swaptions - - - -Total (4) 4 - -

– 246 –
CI Global Unconstrained Bond Private Pool
Semi-Annual Financial Statements - September 30, 2021
The accompanying notes are an integral part of these financial statements.
Fund Specific Notes to Financial Statements (unaudited)
Interest in Unconsolidated Structured Entities (Note 2)
The following tables present the Fund’s interest in Unconsolidated Structured Entities.
as at September 30, 2021 Fair Value of
the Underlying Fund(s) / ETF(s)Fair Value of the Fund’s Investment
in the Underlying Fund(s) / ETF(s)Ownership in the
Underlying Fund(s) / ETF(s)
Unconsolidated Structured Entities (in $000’s) (in $000’s) (%)iShares J.P. Morgan USD Emerging Markets Bond ETF 24,310,126 318 -
as at March 31, 2021 Fair Value of
the Underlying Fund(s) / ETF(s)Fair Value of the Fund’s Investment
in the Underlying Fund(s) / ETF(s)Ownership in the
Underlying Fund(s) / ETF(s)
Unconsolidated Structured Entities (in $000’s) (in $000’s) (%)iShares J.P. Morgan USD Emerging Markets Bond ETF 28,145,746 312 -

– 247 –
CI Global Unconstrained Bond Private Pool
Semi-Annual Financial Statements - September 30, 2021
Fund Specific Notes to Financial Statements (unaudited)
†A portion of brokerage commissions paid was used to cover research and market data services, termed soft dollar commissions. This amount has been estimated by the Manager of the Fund.The accompanying notes are an integral part of these financial statements.
Commissions (Note 2)for the periods ended September 30 (in $000’s)
2021 2020Brokerage commissions - 1Soft dollar commissions† - -
Redeemable Unit Transactions (Note 4)for the periods ended September 30
Number of redeemable units at the beginning of periodRedeemable units issued for cashRedeemable units issued for reinvested distributionsRedeemable units redeemedNumber of redeemable units at the end of period
Series A 2021 2020 345,734 199,682 123,541 10,107 2,855 848 (117,705) (33,577) 354,425 177,060
Series F 2021 2020 380,691 1,469,085 117,332 133,783 5,618 12,860 (92,964) (1,257,599) 410,677 358,129
Series I 2021 2020 115 1,065 - - 2 8 - (960) 117 113

– 248 –
CI Global Unconstrained Bond Private Pool
Semi-Annual Financial Statements - September 30, 2021
The accompanying notes are an integral part of these financial statements.
Fund Specific Notes to Financial Statements (unaudited)
Securities Lending (Note 6)as at September 30 (in $000’s)
2021 2020Loaned - -Collateral (non-cash) - -
Securities Lending Revenue Reconciliation (Note 6)for the periods ended September 30 (in $000’s)
2021 2020Gross securities lending revenue - -Charges - -Securities lending revenue - -Charges as a % of gross securities lending revenue - -
Management and Administration Fees (Note 5) as at September 30, 2021 (%)
Annual management
fee rate:
Annual administration
fee rate:
Series A 1.050 0.15Series F 0.550 0.15Series I Paid directly by investor Paid directly by investor

– 249 –
CI Global Unconstrained Bond Private Pool
Semi-Annual Financial Statements - September 30, 2021
The accompanying notes are an integral part of these financial statements.
Other Price RiskAs at September 30, 2021 and March 31, 2021, the Fund was exposed to other price risk as some of its assets were invested in equities and Exchange-Traded Fund(s).
As at September 30, 2021, had the fair value of equities in the investment portfolio increased or decreased by 10% (March 31, 2021 - 10%), with all other variables held constant, net assets attributable to holders of redeemable units of the Fund would have increased or decreased, respectively, by approximately $116,000 (March 31, 2021 - $116,000). In practice, actual results may differ from this analysis and the difference may be material.
Currency RiskThe tables below summarize the Fund’s exposure to currency risk.
as at September 30, 2021~
Currency
Financial Instruments Exposure Derivatives
Net Exposure
Net Assets
(%)(in $000’s) (in $000’s) (in $000’s)U.S. Dollar 4,121 (3,870) 251 3.1 Total 4,121 (3,870) 251 3.1
as at March 31, 2021~
Currency
Financial Instruments Exposure Derivatives
Net Exposure
Net Assets
(%)(in $000’s) (in $000’s) (in $000’s)U.S. Dollar 4,352 (4,047) 305 4.1 Total 4,352 (4,047) 305 4.1
~Includes monetary and non-monetary instruments, if any.
As at September 30, 2021, had the Canadian dollar strengthened or weakened by 10% (March 31, 2021 - 10%) in relation to all other foreign currencies held in the Fund, with all other variables held constant, net assets attributable to holders of redeemable units of the Fund would have decreased or increased, respectively, by approximately $25,000 (March 31, 2021 - $31,000). In practice, actual results may differ from this analysis and the difference may be material.
Interest Rate RiskThe tables below summarize the Fund’s exposure to interest rate risk, categorized by the contractual maturity date.
as at September 30, 2021
Less than1 Year
1 - 3Years
3 - 5Years
Greaterthan
5 Years Total
(in $000’s) (in $000’s) (in $000’s) (in $000’s) (in $000’s)Interest Rate Exposure 367 760 1,224 3,970 6,321
as at March 31, 2021
Less than1 Year
1 - 3Years
3 - 5Years
Greaterthan
5 Years Total
(in $000’s) (in $000’s) (in $000’s) (in $000’s) (in $000’s)Interest Rate Exposure 136 1,289 1,088 3,604 6,117
Financial Instruments Risks (Note 10)
Concentration RiskFor Concentration Risk as at September 30, 2021, refer to the Schedule of Investment Portfolio.
The table below summarizes the Fund’s exposure to concentration risk.
as at March 31, 2021Categories Net Assets (%)Canada 48.7 U.S.A. 30.2 Exchange-Traded Fund(s) 4.2 Luxembourg 3.4 U.K. 2.4 Liberia 2.3 Cayman Islands 1.6 Other Net Assets (Liabilities) 1.4 Panama 1.4 Switzerland 1.3 Germany 1.2 Foreign Currency Forward Contract(s) 0.9 Bermuda 0.6 British Virgin Islands 0.3 Brazil 0.3 Total 100.0
Credit RiskThe Fund was invested in fixed income securities, preferred securities and derivative instruments, if any, with the following credit ratings, as per the tables below.
as at September 30, 2021Credit Rating^* Net Assets (%)AAA/Aaa/A++ 3.2AA/Aa/A+ 1.1A 3.8BBB/Baa/B++ 29.4BB/Ba/B+ 32.5B 14.0CCC/Caa/C++ 0.9Not Rated 4.3Total 89.2
as at March 31, 2021Credit Rating^* Net Assets (%)AAA/Aaa/A++ 7.6AA/Aa/A+ 2.1A 2.2BBB/Baa/B++ 29.9BB/Ba/B+ 32.8B 13.7CCC/Caa/C++ 2.4Not Rated 3.1Total 93.8
^Credit ratings are obtained from S&P Global Ratings, where available, otherwise ratings are obtained from: Moody’s
Investors Service or Dominion Bond Rating Service, respectively.
*Refer to Note 10 for Credit Rating Chart reference.
Fund Specific Notes to Financial Statements (unaudited)

– 250 –
CI Global Unconstrained Bond Private Pool
Semi-Annual Financial Statements - September 30, 2021
The accompanying notes are an integral part of these financial statements.
Fair Value Hierarchy (cont’d)
Long Positions at fair value as at March 31, 2021Level 1 Level 2 Level 3 Total
(in $000’s) (in $000’s) (in $000’s) (in $000’s)Equities 852 - - 852 Bonds - 6,061 56 6,117 Exchange-Traded Fund(s) 312 - - 312 Foreign currency forward contract(s), net - 70 - 70 Total 1,164 6,131 56 7,351
There were no transfers between Level 1 and 2 and Level 1 and 3 during the year ended March 31, 2021.
Interest Rate Risk (cont’d)As at September 30, 2021, had the prevailing interest rates increased or decreased by 0.25% (March 31, 2021 - 0.25%), with all other variables held constant, net assets attributable to holders of redeemable units of the Fund would have decreased or increased, respectively, by approximately $58,000 (March 31, 2021 - $63,000). In practice, actual results may differ from this analysis and the difference may be material.
Fair Value Hierarchy
The tables below summarize the inputs used by the Fund in valuing the Fund’s investments and derivatives carried at fair value.
Long Positions at fair value as at September 30, 2021Level 1 Level 2 Level 3 Total
(in $000’s) (in $000’s) (in $000’s) (in $000’s)Equities 842 - - 842 Bonds - 6,142 79 6,221 Exchange-Traded Fund(s) 318 - - 318 Short-term investment(s) - 100 - 100 Foreign currency forward contract(s), net - (59) - (59) Total 1,160 6,183 79 7,422
There were no transfers between Level 1, 2 and 3 during the period ended September 30, 2021.
Fund Specific Notes to Financial Statements (unaudited)
Level 3 ReconciliationThe tables below summarize the movement in financial instruments classified as Level 3.
for the period ended September 30, 2021 Balance at
Mar. 31, 2021 Purchases SalesTransfers
InTransfers
(Out)Realized Gain
(Loss)Unrealized Gain
(Loss)*Balance at
Sept. 30, 2021(in $000’s) (in $000’s) (in $000’s) (in $000’s) (in $000’s) (in $000’s) (in $000’s) (in $000’s)
Long Positions/Assets:Bonds 56 23 - - - - - 79 Total 56 23 - - - - - 79
*Change in unrealized gain (loss) related to investments held at September 30, 2021 was $315.
for the year ended March 31, 2021 Balance at
Mar. 31, 2020 Purchases SalesTransfers
InTransfers
(Out)Realized Gain
(Loss)Unrealized Gain
(Loss)**Balance at
Mar. 31, 2021(in $000’s) (in $000’s) (in $000’s) (in $000’s) (in $000’s) (in $000’s) (in $000’s) (in $000’s)
Long Positions/Assets:Bonds 33 - - 24 - - (1) 56 Total 33 - - 24 - - (1) 56
**Change in unrealized gain (loss) related to investments held at March 31, 2021 was ($1,156).
During the year ended March 31, 2021, investments with a fair value of $24,000 were transferred out of Level 2 into Level 3 as observable market inputs were no longer available for these investments.
Investments classified as Level 3 are valued at fair value based on unobservable inputs and assumptions, which may include credit spreads, industry multipliers, and discount rates. Management has assessed that the effect of changing these inputs to reasonably possible alternatives would not have a significant impact on the net assets attributable to holders of redeemable units of the Fund as at September 30, 2021 and March 31, 2021.

CI Mutual Funds
Semi-Annual Financial Statements - September 30, 2021 – 251 –
Notes to the Financial Statements (unaudited)
1. THE FUNDS
The following Funds are open-ended mutual fund trusts created under the laws of Province of Ontario by declarations of trust. The address of the Funds’ registered office is 15 York Street, Second Floor, Toronto,
Ontario M5J 0A3 CI Investments Inc. is the manager and the trustee (the Manager and the Trustee) to the Funds. RBC Investor Services Trust is the custodian (the Custodian) of the Funds except for CI High Interest
Savings Fund, CI MSCI World ESG Impact Fund, CI Munro Global Growth Equity Fund, CI Global Longevity Economy Fund, CI Global Asset Allocation Private Pool, CI Global Infrastructure Private Pool, CI Global REIT
Private Pool, CI Global Real Asset Private Pool, CI Bitcoin Fund, CI Ethereum Fund, and CI Global Climate Leaders Fund which engage CIBC Mellon Trust Company as the custodian (the Custodian) of these Funds.
CIBC Mellon Trust Company is the custodian (the Custodian) of the following Funds: CI High Interest Savings Fund, CI Munro Global Growth Equity Fund, CI MSCI World ESG Impact Fund, CI Global Longevity Economy
Fund, CI Global Asset Allocation Private Pool, CI Global Infrastructure Private Pool, CI Global REIT Private Pool and CI Global Real Asset Private Pool. The Bank of New York Mellon is a lending agent (the Lending
Agent) for Funds for which CIBC Mellon Trust Company is the Custodian.
These financial statements were authorized for issue by the Manager on November 15, 2021. CI Investments Inc. is a subsidiary of CI Financial Corp.
Effective after the close of business on August 2, 2019, the series of the Funds that were eligible for CI Preferred Pricing Program (CIPP) transitioned from a tiered pricing model to a fee distribution model.
Effective July 29, 2020, units that were previously issued as Class A, Class AH, Class AT5, Class AT6, Class AT8, Class C, Class D, Class E, Class ET5, Class ET8, Class EF, Class EFT5, Class EFT8, Class F, Class FH,
Class FT5, Class FT8, Class H, Class I, Class IH, Insight Class, Class IT8, Class IU, Class O, Class OO, Class OT5, Class OT8, Class P, Class PH, Class PP, Class PT5, Class PT8, Class S, Class U, Class UT6, Class W,
Class WH, Class X, Class Y and Class Z, were renamed as Series A, Series AH, Series AT5, Series AT6, Series AT8, Series C, Series D, Series E, Series ET5, Series ET8, Series EF, Series EFT5, Series EFT8, Series F,
Series FH, Series FT5, Series FT8, Series H, Series I, Series IH, Insight Series, Series IT8, Series IU, Series O, Series OO, Series OT5, Series OT8, Series P, Series PH, Series PP, Series PT5, Series PT8, Series S,
Series U, Series UT6, Series W, Series WH, Series X, Series Y, and Series Z, respectively.
The objective of each Fund is to pool and manage money contributed by investors (Unitholders) with similar investment goals. The Funds may invest in equities, fixed income securities, derivatives, underlying fund(s)
or some combination thereof according to their specific investment objectives and strategies. Investments may be held for income or capital appreciation or both. Unitholders share a Fund’s income, expenses and
any gains or losses the Fund makes on its investments generally in proportion to the value of the securities they own.
The “Inception Date” is the date upon which units of a series of a Fund commenced operations.
Inception Date:Series A Series AH Series AT5 Series C Series E Series EF Series F
CI American Small Companies Fund Apr. 29, 91 - - - Aug. 04, 15 Aug. 04, 15 Aug. 08, 00
CI Bitcoin Fund Apr. 05, 21 - - - - - Apr. 05, 21
CI Canadian Investment Fund Jan. 29, 77 - - - Jul. 27, 11 Aug. 04, 15 Nov. 17, 00
CI Canadian Small/Mid Cap Managed Fund
(formerly CI Canadian Small/Mid Cap Fund) Nov. 27, 92 - - - Aug. 04, 15 Aug. 04, 15 Jun. 29, 05
CI Emerging Markets Bond Fund - - - - - - -
CI Ethereum Fund Apr. 26, 21 - - - - - Apr. 26, 21
CI Global Climate Leaders Fund Jul.08, 21 Jul.08, 21 - - - - Jul.08, 21
CI Global Longevity Economy Fund Jun. 11, 20 - - - - - Jun. 11, 20
CI Global Quality Dividend Managed Fund
(formerly CI Global High Dividend Advantage Fund) Feb. 28, 06* - - - Jul. 27, 11 - Feb. 28, 06
CI Global Stock Selection Fund - - - - - - -
CI Global Value Fund Jun. 12, 96 - - - Aug. 04, 15 Aug. 04, 15 Aug. 08, 00
CI High Interest Savings Fund Jul. 30, 19 - - - Jul. 30, 19 - Jul. 30, 19
CI Income Fund Oct. 05, 10 - - Sep. 20, 10* Aug. 04, 15 Nov. 27, 14 Oct. 05, 10
CI International Value Fund Jun. 12, 96 - - - Aug. 04, 15 Aug. 04, 15 Dec. 18, 01
*These Series are no longer available for new purchases.

CI Mutual Funds
Semi-Annual Financial Statements - September 30, 2021 – 252 –
Notes to the Financial Statements (unaudited) (cont’d)
Inception Date:Series A Series AH Series AT5 Series C Series E Series EF Series F
CI Investment Grade Bond Fund Dec. 24, 14 Mar. 09, 20 Mar. 05, 21 - Dec. 24, 14 Aug. 04, 15 Dec. 24, 14
CI Marret Short Duration High Yield Fund
(formerly Marret Short Duration High Yield Fund) Feb. 14, 14 - - - Feb. 14, 14 Aug. 04, 15 Feb. 14, 14
CI Money Market Fund Oct. 01, 90 - - - Jul. 27, 11 Aug. 04, 15 Dec. 18, 01
CI MSCI World ESG Impact Fund Sept.17, 19 - - - Sep. 17, 19 - Sep. 17, 19
CI Munro Global Growth Equity Fund Aug. 10, 20 Jan. 12, 21 - - - - Aug. 10, 20
CI U.S. Income US$ Fund
(formerly CI U.S. Income US$ Pool) Aug. 04, 15 - - - Aug. 04, 15 Aug. 04, 15 May. 01, 17
CI U.S. Stock Selection Fund
(formerly CI American Value Fund) Feb. 01, 77 - - - Jul. 27, 11 Aug. 04, 15 Nov. 17, 00
CI US Money Market Fund Jan. 30, 95 - - - - - May 01, 17
Series FT5 Series FH Series I Series IH Series IT5 Insight Series Series O
CI American Small Companies Fund - - Dec. 17, 01 - - - Aug. 04, 15
CI Bitcoin Fund - - Apr. 05, 21 - - - -
CI Canadian Investment Fund - - Oct. 31, 96 - - Aug. 29, 03 Jul. 27, 11
CI Canadian Small/Mid Cap Managed Fund
(formerly CI Canadian Small/Mid Cap Fund) - - Jun. 29, 05 - - - Jul. 30, 13
CI Emerging Markets Bond Fund - - Dec. 30, 20 - - - -
CI Ethereum Fund - - Apr. 26, 21 - - - -
CI Global Climate Leaders Fund - Jul.08, 21 Jul.08, 21 Jul.08, 21 - - -
CI Global Longevity Economy Fund - - Jun. 11, 20 - - - -
CI Global Quality Dividend Managed Fund
(formerly CI Global High Dividend Advantage Fund) - - Feb. 28, 06 - - - Jul. 27, 11
CI Global Stock Selection Fund - - Jun. 01, 17 - - - -
CI Global Value Fund - - Dec. 17, 01 - - - Jul. 30, 13
CI High Interest Savings Fund - - Jul. 30, 19 - - - Jul. 30, 19
CI Income Fund - - Oct. 05, 10 - - - Jul. 30, 13
CI International Value Fund - - Dec. 17, 01 - - Aug. 29, 03 Jul. 30, 13
CI Investment Grade Bond Fund Mar. 05, 21 Mar. 09, 20 Dec. 24, 14 Mar. 09, 20 Mar. 05, 21 - Dec. 24, 14
CI Marret Short Duration High Yield Fund
(formerly Marret Short Duration High Yield Fund) - - Feb. 14, 14 - - - Feb. 14, 14
CI Money Market Fund - - Dec. 18, 01 - - Aug. 29, 03 Jul. 27, 11
CI MSCI World ESG Impact Fund - - Sept. 17, 19 - - - Sept. 17, 19
CI Munro Global Growth Equity Fund - Jan. 12, 21 Jan. 14, 19 Jan. 12, 21 - - -

CI Mutual Funds
Semi-Annual Financial Statements - September 30, 2021 – 253 –
Notes to the Financial Statements (unaudited) (cont’d)
Inception Date:Series FT5 Series FH Series I Series IH Series IT5 Insight Series Series O
CI U.S. Income US$ Fund
(formerly CI U.S. Income US$ Pool) - - Aug. 04, 15 - - - Aug. 04, 15
CI U.S. Stock Selection Fund
(formerly CI American Value Fund) - - Oct. 31, 96 - - Aug. 29, 03 Jul. 27, 11
CI US Money Market Fund - - Jul. 04, 16 - - - -
Series P Series PH Series PP Series W Series WH Series X Series Y
CI American Small Companies Fund May. 01, 17 - - Jul. 27, 17^ - - -
CI Bitcoin Fund Apr. 05, 21 - - Apr. 05, 21 - - -
CI Canadian Investment Fund May. 01, 17 - - Nov. 22, 19^ - - -
CI Canadian Small/Mid Cap Managed Fund
(formerly CI Canadian Small/Mid Cap Fund) May. 01, 17 - - Sept. 27, 19^ - - -
CI Emerging Markets Bond Fund - - - - - - -
CI Ethereum Fund Apr. 26, 21 - - Apr. 26, 21 - - -
CI Global Climate Leaders Fund Jul.08, 21 Jul.08, 21 - Aug. 12, 21 Aug. 12, 21 - -
CI Global Longevity Economy Fund Jun. 11, 20 - - Jun. 11, 20 - - -
CI Global Quality Dividend Managed Fund
(formerly CI Global High Dividend Advantage Fund) - - - - - - -
CI Global Stock Selection Fund - - - - - - -
CI Global Value Fund May. 01, 17 - - Jul. 27, 17^ - - -
CI High Interest Savings Fund Jul. 30, 19 - - Jul. 30, 19^ - - -
CI Income Fund May. 01, 17 - - Jul. 27, 17^ - - -
CI International Value Fund May. 01, 17 - - Jul. 27, 17^ - - -
CI Investment Grade Bond Fund May. 01, 17 Mar. 09, 20 - Jul. 27, 17^ Mar. 9, 20 - -
CI Marret Short Duration High Yield Fund
(formerly Marret Short Duration High Yield Fund) May. 01, 17 - - Sept. 27, 19^ - - -
CI Money Market Fund May. 01, 17 - Nov. 22, 19 Jul. 27, 17^ - Nov. 22, 19 Nov. 22, 19
CI MSCI World ESG Impact Fund Sept. 17, 19 - - Sept. 17, 19^ - - -
CI Munro Global Growth Equity Fund Aug. 10, 20 Jan. 12, 21 - Aug. 10, 20^ Aug. 10, 20 - -
CI U.S. Income US$ Fund
(formerly CI U.S. Income US$ Pool) May. 01, 17 - - Jul. 27, 17^ - - -
CI U.S. Stock Selection Fund
(formerly CI American Value Fund) May. 01, 17 - - Jul. 27, 17^ - - -
CI US Money Market Fund May. 01, 17 - - - - - -
^Private Client Managed Portfolios are made available through Assante Private Client, a division of CI Private Counsel LP. The pools used in the Private Client Managed Portfolios are managed by CI Investments Inc., and affiliate of CI Private Counsel LP.

CI Mutual Funds
Semi-Annual Financial Statements - September 30, 2021 – 254 –
Notes to the Financial Statements (unaudited) (cont’d)
Inception Date:
Series Z ETF C$ Series
ETF US$
Hedged Series
CI American Small Companies Fund - - -
CI Bitcoin Fund - - -
CI Canadian Investment Fund - - -
CI Canadian Small/Mid Cap Managed Fund
(formerly CI Canadian Small/Mid Cap Fund) - - -
CI Emerging Markets Bond Fund - - -
CI Ethereum Fund - - -
CI Global Climate Leaders Fund - Jul.08, 21 Jul.08, 21
CI Global Longevity Economy Fund - Jun. 11, 20 -
CI Global Quality Dividend Managed Fund
(formerly CI Global High Dividend Advantage Fund) - - -
CI Global Stock Selection Fund - - -
CI Global Value Fund - - -
CI High Interest Savings Fund - - -
CI Income Fund - - -
CI International Value Fund - - -
CI Investment Grade Bond Fund - - -
CI Marret Short Duration High Yield Fund
(formerly Marret Short Duration High Yield Fund) - - -
CI Money Market Fund Sept. 17, 10* - -
CI MSCI World ESG Impact Fund - - -
CI Munro Global Growth Equity Fund - Jan. 12, 21 Jan. 12, 21
CI U.S. Income US$ Fund
(formerly CI U.S. Income US$ Pool) - - -
CI U.S. Stock Selection Fund
(formerly CI American Value Fund) - - -
CI US Money Market Fund - - -
Series A Series F Series I Series W
CI Select Canadian Equity Managed Fund
(formerly Select Canadian Equity Managed Fund) - - Nov. 22, 06 -
CI Select International Equity Managed Fund
(formerly Select International Equity Managed Fund) - - Nov. 22, 06 -
*These Series are no longer available for new purchases.

CI Mutual Funds
Semi-Annual Financial Statements - September 30, 2021 – 255 –
Notes to the Financial Statements (unaudited) (cont’d)
*These Series are no longer available for new purchases.
Inception Date:Series A Series F Series I Series W
CI Select Staging Fund
(formerly Select Staging Fund) Nov. 07, 05 Dec. 30, 05 Mar. 22, 06 Dec. 30, 05
CI Select U.S. Equity Managed Fund
(formerly Select U.S. Equity Managed Fund) - - Nov. 22, 06 -
Series A Series AT5 Series AT6 Series AT8 Series D Series E Series ET5
CI Canadian Asset Allocation Fund
(formerly Cambridge Asset Allocation Fund) Jul. 27, 17 - - - - Jul. 27, 17 -
CI Canadian Core Plus Bond Fund
(formerly Cambridge Bond Fund) Dec. 12, 18 - - - - - -
CI Canadian Dividend Fund
(formerly Cambridge Canadian Dividend Fund) Feb. 01, 05 - - - Aug. 31, 04* Jan. 07, 14 -
CI Canadian Equity Fund
(formerly Cambridge Canadian Equity Fund) Jul. 27, 17 - - - - Jul. 27, 17 -
CI Canadian Long-Term Bond Pool
(formerly Cambridge Canadian Long-Term Bond Pool) - - - - - - -
CI Canadian Short-Term Bond Pool
(formerly Cambridge Canadian Short-Term Bond Pool) - - - - - - -
CI Global Analysts Selection Fund
(formerly Cambridge Stock Selection Fund) - - - - - - -
CI Global Dividend Opportunities Fund
(formerly Cambridge Global Dividend Fund) Jul. 30, 13 - - - - Jul. 30, 13 -
CI Global Equity & Income Fund
(formerly Cambridge Global High Income Fund) Jul. 02, 04 Jul. 23, 21 - Jul. 23, 21 - Jul. 30, 13 Jul. 23, 21
CI Global Equity Fund
(formerly Cambridge Global Equity Fund) Jul. 27, 17 - - - - Jul. 27, 17 -
CI Global Smaller Companies Fund
(formerly Cambridge Global Smaller Companies Fund) Jul. 27, 17 Nov. 22, 19 - - - Jul. 27, 17 -
CI Pure Canadian Small/Mid Cap Equity Fund
(formerly Cambridge Pure Canadian Equity Fund) Feb. 14, 11 - - - - Jul. 30, 13 -
CI U.S. Dividend Fund
(formerly Cambridge U.S. Dividend Fund) Jun. 13, 06 - Jul. 07, 08* - Jun. 13, 06* Jan. 07, 14 -
CI U.S. Dividend Registered Fund
(formerly Cambridge U.S. Dividend Registered Fund) Dec. 24, 14 - - - - Dec. 24, 14 -
CI U.S. Dividend US$ Fund
(formerly Cambridge U.S. Dividend US$ Fund) Mar. 27, 15 - - Jul. 24, 17 - Mar. 27, 15 -

CI Mutual Funds
Semi-Annual Financial Statements - September 30, 2021 – 256 –
Notes to the Financial Statements (unaudited) (cont’d)
*These Series are no longer available for new purchases.^Private Client Managed Portfolios are made available through Assante Private Client, a division of CI Private Counsel LP. The pools used in the Private Client Managed Portfolios are managed by CI Investments Inc., and affiliate of CI Private Counsel LP.~Effective December 31, 2017, Series C units were re-designated as Series I units.
Inception Date:Series ET8 Series EF Series F Series FT5 Series FT8 Series I Series IT8
CI Canadian Asset Allocation Fund
(formerly Cambridge Asset Allocation Fund) - Jul. 27, 17 Jul. 27, 17 - - Jul. 27, 17 -
CI Canadian Core Plus Bond Fund
(formerly Cambridge Bond Fund) - - Dec. 12, 18 - - Mar. 27, 15*~ -
CI Canadian Dividend Fund
(formerly Cambridge Canadian Dividend Fund) - Nov. 27, 14 Jun. 12, 06 - - Jun. 07, 06 -
CI Canadian Equity Fund
(formerly Cambridge Canadian Equity Fund) - Jul. 27, 17 Jul. 27, 17 - - Jul. 27, 17 -
CI Canadian Long-Term Bond Pool
(formerly Cambridge Canadian Long-Term Bond Pool) - - - - - Nov. 15, 18 -
CI Canadian Short-Term Bond Pool
(formerly Cambridge Canadian Short-Term Bond Pool) - - - - - Jun. 01, 17* -
CI Global Analysts Selection Fund
(formerly Cambridge Stock Selection Fund) - - - - - Dec. 21, 15 -
CI Global Dividend Opportunities Fund
(formerly Cambridge Global Dividend Fund) - Aug. 04, 15 Jul. 30, 13 - - Jul. 30, 13 -
CI Global Equity & Income Fund
(formerly Cambridge Global High Income Fund) Jul. 23, 21 Nov. 27, 14 Jul. 20, 04 Jul. 23, 21 Jul. 23, 21 Sept. 03, 04 -
CI Global Equity Fund
(formerly Cambridge Global Equity Fund) - Jul. 27, 17 Jul. 27, 17 - - Jul. 27, 17 -
CI Global Smaller Companies Fund
(formerly Cambridge Global Smaller Companies Fund) - Jul. 27, 17 Jul. 27, 17 - - Jul. 27, 17 -
CI Pure Canadian Small/Mid Cap Equity Fund
(formerly Cambridge Pure Canadian Equity Fund) - Aug. 04, 15 Feb. 14, 11 - - Jan. 05, 12 -
CI U.S. Dividend Fund
(formerly Cambridge U.S. Dividend Fund) - Nov. 27, 14 Jun. 13, 06 - - Jun. 13, 06 -
CI U.S. Dividend Registered Fund
(formerly Cambridge U.S. Dividend Registered Fund) - Aug. 04, 15 Dec. 24, 14 - - Dec. 24, 14 -
CI U.S. Dividend US$ Fund
(formerly Cambridge U.S. Dividend US$ Fund) - Mar. 27, 15 Mar. 27, 15 - Jul. 24, 17 Mar. 27, 15 Jun. 24, 17
Series IU Series O Series OT8 Series P Series PP Series PT8 Series W
CI Canadian Asset Allocation Fund
(formerly Cambridge Asset Allocation Fund) - Jul. 27, 17 - Jul. 27, 17 - - -
CI Canadian Core Plus Bond Fund
(formerly Cambridge Bond Fund) - - - Dec. 12, 18 - - Sept. 27, 19^
CI Canadian Dividend Fund
(formerly Cambridge Canadian Dividend Fund) - Jul. 30, 13 - May 01, 17 - - Sept. 27, 19^

CI Mutual Funds
Semi-Annual Financial Statements - September 30, 2021 – 257 –
Notes to the Financial Statements (unaudited) (cont’d)
^Private Client Managed Portfolios are made available through Assante Private Client, a division of CI Private Counsel LP. The pools used in the Private Client Managed Portfolios are managed by CI Investments Inc., and affiliate of CI Private Counsel LP.
Inception Date:Series IU Series O Series OT8 Series P Series PP Series PT8 Series W
CI Canadian Equity Fund
(formerly Cambridge Canadian Equity Fund) - Jul. 27, 17 - Jul. 27, 17 - - -
CI Canadian Long-Term Bond Pool
(formerly Cambridge Canadian Long-Term Bond Pool) - - - - - - -
CI Canadian Short-Term Bond Pool
(formerly Cambridge Canadian Short-Term Bond Pool) - - - - - - -
CI Global Analysts Selection Fund
(formerly Cambridge Stock Selection Fund) - - - - - - -
CI Global Dividend Opportunities Fund
(formerly Cambridge Global Dividend Fund) - Jul. 30, 13 - May. 01, 17 Nov. 22, 19 - Jul. 27, 17^
CI Global Equity & Income Fund
(formerly Cambridge Global High Income Fund) - Jul. 30, 13 Jul. 23, 21 May 01, 17 - - Sept. 27, 19^
CI Global Equity Fund
(formerly Cambridge Global Equity Fund) - Jul. 27, 17 - Jul. 27, 17 - - -
CI Global Smaller Companies Fund
(formerly Cambridge Global Smaller Companies Fund) Nov. 22, 19 Jul. 27, 17 - Jul. 27, 17 Nov. 22, 19 - -
CI Pure Canadian Small/Mid Cap Equity Fund
(formerly Cambridge Pure Canadian Equity Fund) - Jul. 30, 13 - May 01, 17 - - Sept. 27, 19^
CI U.S. Dividend Fund
(formerly Cambridge U.S. Dividend Fund) - Jul. 30, 13 - May 01, 17 - - Sept. 27, 19^
CI U.S. Dividend Registered Fund
(formerly Cambridge U.S. Dividend Registered Fund) - Dec. 24, 14 - May 01, 17 - - -
CI U.S. Dividend US$ Fund
(formerly Cambridge U.S. Dividend US$ Fund) - Mar. 27, 15 - May 01, 17 - - -
Series Y Series Z
CI Canadian Asset Allocation Fund
(formerly Cambridge Asset Allocation Fund) - -
CI Canadian Core Plus Bond Fund
(formerly Cambridge Bond Fund) - -
CI Canadian Dividend Fund
(formerly Cambridge Canadian Dividend Fund) - -
CI Canadian Equity Fund
(formerly Cambridge Canadian Equity Fund) - -
CI Canadian Long-Term Bond Pool
(formerly Cambridge Canadian Long-Term Bond Pool) - -
CI Canadian Short-Term Bond Pool
(formerly Cambridge Canadian Short-Term Bond Pool) - -

CI Mutual Funds
Semi-Annual Financial Statements - September 30, 2021 – 258 –
Notes to the Financial Statements (unaudited) (cont’d)
*These Series are no longer available for new purchases.^Private Client Managed Portfolios are made available through Assante Private Client, a division of CI Private Counsel LP. The pools used in the Private Client Managed Portfolios are managed by CI Investments Inc., and affiliate of CI Private Counsel LP.
Inception Date:Series Y Series Z
CI Global Analysts Selection Fund
(formerly Cambridge Stock Selection Fund) - -
CI Global Dividend Opportunities Fund
(formerly Cambridge Global Dividend Fund) Nov. 22, 19 Nov. 22, 19
CI Global Equity & Income Fund
(formerly Cambridge Global High Income Fund) - -
CI Global Equity Fund
(formerly Cambridge Global Equity Fund) - -
CI Global Smaller Companies Fund
(formerly Cambridge Global Smaller Companies Fund) - -
CI Pure Canadian Small/Mid Cap Equity Fund
(formerly Cambridge Pure Canadian Equity Fund) - -
CI U.S. Dividend Fund
(formerly Cambridge U.S. Dividend Fund) - -
CI U.S. Dividend Registered Fund
(formerly Cambridge U.S. Dividend Registered Fund) - -
CI U.S. Dividend US$ Fund
(formerly Cambridge U.S. Dividend US$ Fund) - -
Series A Series AT6 Series D Series E Series EF Series F Series H
CI Black Creek Global Balanced Fund
(formerly Black Creek Global Balanced Fund) Jan. 29, 07 Jul. 07, 08* Jan. 29, 07* Aug. 04, 15 Aug. 04, 15 Jan. 29, 07 -
CI Black Creek Global Leaders Fund
(formerly Black Creek Global Leaders Fund) Feb. 01, 05 Jul. 07, 08* May 01, 00* Aug. 04, 15 Aug. 04, 15 Jun. 12, 06 -
CI Black Creek International Equity Fund
(formerly Black Creek International Equity Fund) Sept. 30, 08 Sept. 25, 08* - Aug. 04, 15 Aug. 04, 15 Sept. 30, 08 Feb. 21, 18^
Series I Series O Series P
CI Black Creek Global Balanced Fund
(formerly Black Creek Global Balanced Fund) Jan. 29, 07 Jul. 30, 13 May 01, 17
CI Black Creek Global Leaders Fund
(formerly Black Creek Global Leaders Fund) Jun. 07, 06 Aug. 04, 15 May 01, 17
CI Black Creek International Equity Fund
(formerly Black Creek International Equity Fund) Sept. 30, 08 Aug. 04, 15 May 01, 17

CI Mutual Funds
Semi-Annual Financial Statements - September 30, 2021 – 259 –
Notes to the Financial Statements (unaudited) (cont’d)
*These Series are no longer available for new purchases.
Inception Date:Series A Series AH Series AT6 Series C Series D Series E Series EF
CI Asian Opportunities Fund
(formerly Signature Asian Opportunities Fund) Oct. 30, 81 - - - - Aug. 04, 15 Aug. 04, 15
CI Canadian Balanced Fund
(formerly Signature Canadian Balanced Fund) Jun. 25, 97 - Jul. 26, 12* - Jul. 26, 12* Aug. 04, 15 Aug. 04, 15
CI Canadian Bond Fund
(formerly Signature Canadian Bond Fund) Jan. 20, 93 - - - - Jul. 27, 11 Dec. 05, 14
CI Canadian Income & Growth Fund
(formerly Signature Income & Growth Fund) Feb. 26, 07 - Jul. 26, 12* - - Jul. 27, 11 Dec. 05, 14
CI Corporate Bond Fund
(formerly Signature Corporate Bond Fund) Dec. 17, 01 - - - - Jul. 27, 11 Dec. 05, 14
CI Diversified Yield Fund
(formerly Signature Diversified Yield Fund) Feb. 14, 11 - - - - Aug. 29, 12 Dec. 05, 14
CI Dividend Income & Growth Fund
(formerly Signature Dividend Fund) Oct. 29, 96 - - - - Jul. 27, 11 Aug. 04, 15
CI Emerging Markets Fund
(formerly Signature Emerging Markets Fund) Sept. 10, 91 Aug. 31, 21 - - - Aug. 04, 15 Aug. 04, 15
CI Floating Rate Income Fund
(formerly Signature Floating Rate Income Fund) Jun. 07, 17 - - - - Jun. 01, 17 Jun. 01, 17
CI Global Bond Fund
(formerly Signature Global Bond Fund) Aug. 31, 92 - - - - Jul. 27, 11 Aug. 04, 15
CI Global Core Plus Bond Fund
(formerly Signature Core Bond Plus Fund) Dec. 21, 15 - - - - Dec. 21, 15 Dec. 21, 15
CI Global Dividend Fund
(formerly Signature Global Dividend Fund) Dec. 20, 12 - - - - Dec. 20, 12 Aug. 04, 15
CI Global Income & Growth Fund
(formerly Signature Global Income & Growth Fund) Nov. 13, 00 - - - - Jul. 27, 11 Dec. 05, 14
CI Global Resource Fund
(formerly Signature Global Resource Fund) Apr. 11, 97 - - - - Aug. 04, 15 Aug. 04, 15
CI High Income Fund
(formerly Signature High Income Fund) Dec. 18, 96 - - - - Jul. 27, 11 Dec. 05, 14
CI High Yield Bond Fund
(formerly Signature High Yield Bond Fund) Jul. 30, 13 - - - - Jul. 30, 13 Aug. 04, 15
CI Preferred Share Fund
(formerly Signature Preferred Share Fund) Dec. 21, 15 - - - - Dec. 21, 15 Dec. 21, 15
CI Select Canadian Equity Fund
(formerly Signature Select Canadian Fund) May. 13, 98 - - - - Jul. 27, 11 Aug. 04, 15
CI Select Global Equity Fund
(formerly Signature Global Equity Fund) Jun. 03, 86 - - - - Aug. 04, 15 Aug. 04, 15

CI Mutual Funds
Semi-Annual Financial Statements - September 30, 2021 – 260 –
Notes to the Financial Statements (unaudited) (cont’d)
Inception Date:Series A Series AH Series AT6 Series C Series D Series E Series EF
CI Short-Term Bond Fund
(formerly Signature Short-Term Bond Fund) Feb. 01, 77 - - - - Aug. 04, 15 Aug. 04, 15
CI Systematic Yield Pool
(formerly Signature Systematic Yield Pool) - - - - - - -
Series F Series FH Series I Series IH Insight Series Series O Series OO
CI Asian Opportunities Fund
(formerly Signature Asian Opportunities Fund) Aug. 08, 00 - Dec. 17, 01 - - Jul. 30, 13 -
CI Canadian Balanced Fund
(formerly Signature Canadian Balanced Fund) Aug. 08, 00 - Jul. 15, 03 - - Jul. 30, 13 -
CI Canadian Bond Fund
(formerly Signature Canadian Bond Fund) Aug. 08, 00 - Nov. 01, 01 - Aug. 29, 03 Jul. 27, 11 -
CI Canadian Income & Growth Fund
(formerly Signature Income & Growth Fund) Feb. 26, 07 - Feb. 26, 07 - - Jul. 27, 11 -
CI Corporate Bond Fund
(formerly Signature Corporate Bond Fund) Jul. 15, 03 - Jul. 15, 03 - Aug. 29, 03 Jul. 27, 11 -
CI Diversified Yield Fund
(formerly Signature Diversified Yield Fund) Feb. 14, 11 - Feb. 14, 11 - - Aug. 29, 12 Nov. 22, 19
CI Dividend Income & Growth Fund
(formerly Signature Dividend Fund) Sept. 28, 01 - Jul. 15, 03 - - Jul. 27, 11 -
CI Emerging Markets Fund
(formerly Signature Emerging Markets Fund) Aug. 08, 00 Aug. 31, 21 Oct. 01, 01 Aug. 31, 21 - Jul. 30, 13 -
CI Floating Rate Income Fund
(formerly Signature Floating Rate Income Fund) Jun. 01, 17 - Jun. 01, 17 - - Jun. 01, 17 -
CI Global Bond Fund
(formerly Signature Global Bond Fund) Aug. 08, 00 - Sep. 26, 01 - Aug. 29, 03 Jul. 27, 11 -
CI Global Core Plus Bond Fund
(formerly Signature Core Bond Plus Fund) Dec. 21, 15 - Dec. 21, 15 - - Dec. 21, 15 -
CI Global Dividend Fund
(formerly Signature Global Dividend Fund) Dec. 20, 12 - Jul. 30, 13 - - Dec. 20, 12 -
CI Global Income & Growth Fund
(formerly Signature Global Income & Growth Fund) Nov. 30, 00 - Nov. 30, 00 - - Jul. 27, 11 -
CI Global Resource Fund
(formerly Signature Global Resource Fund) Dec. 18, 01 - - - - Aug. 04, 15 -
CI High Income Fund
(formerly Signature High Income Fund) Dec. 18, 01 - Nov. 08, 02 - - Jul. 27, 11 -
CI High Yield Bond Fund
(formerly Signature High Yield Bond Fund) Jul. 30, 13 - Jul. 30, 13 - - Jul. 30, 13 -

CI Mutual Funds
Semi-Annual Financial Statements - September 30, 2021 – 261 –
Notes to the Financial Statements (unaudited) (cont’d)
*These Series are no longer available for new purchases.^Private Client Managed Portfolios are made available through Assante Private Client, a division of CI Private Counsel LP. The pools used in the Private Client Managed Portfolios are managed by CI Investments Inc., and affiliate of CI Private Counsel LP.
Inception Date:Series F Series FH Series I Series IH Insight Series Series O Series OO
CI Preferred Share Fund
(formerly Signature Preferred Share Fund) Dec. 21, 15 - Dec. 21, 15 - - Dec. 21, 15 -
CI Select Canadian Equity Fund
(formerly Signature Select Canadian Fund) Aug. 08, 00 - Dec. 17, 01 - Aug. 29, 03 Jul. 27, 11 -
CI Select Global Equity Fund
(formerly Signature Global Equity Fund) Aug. 08, 00 - Sep. 26, 01 - Aug. 29, 03 Jul. 30, 13 -
CI Short-Term Bond Fund
(formerly Signature Short-Term Bond Fund) Nov. 17, 00 - Nov. 17, 00 - - Jul. 30, 13 -
CI Systematic Yield Pool
(formerly Signature Systematic Yield Pool) - - Oct. 31, 18 - - - -
Series P Series PH Series PP Series U Series W Series X Series Y
CI Asian Opportunities Fund
(formerly Signature Asian Opportunities Fund) May 01, 17 - - - - - -
CI Canadian Balanced Fund
(formerly Signature Canadian Balanced Fund) May 01, 17 - - Aug. 14, 09* - - -
CI Canadian Bond Fund
(formerly Signature Canadian Bond Fund) May 01, 17 - - - Jul. 27, 17^ - Jul. 26, 12*
CI Canadian Income & Growth Fund
(formerly Signature Income & Growth Fund) May 01, 17 - - - - - Nov. 03, 17
CI Corporate Bond Fund
(formerly Signature Corporate Bond Fund) May 01, 17 - - - Sept. 27, 19^ - -
CI Diversified Yield Fund
(formerly Signature Diversified Yield Fund) May 01, 17 - Nov. 22, 19 - Sept. 27, 19^ - Nov. 22, 19
CI Dividend Income & Growth Fund
(formerly Signature Dividend Fund) May 01, 17 - - - Jul. 27, 17^ Aug. 29, 03* -
CI Emerging Markets Fund
(formerly Signature Emerging Markets Fund) May 01, 17 Aug. 31, 21 - - - - -
CI Floating Rate Income Fund
(formerly Signature Floating Rate Income Fund) Jun. 07, 17 - - - Sept. 27, 19^ - -
CI Global Bond Fund
(formerly Signature Global Bond Fund) May 01, 17 - - - Jul. 27, 17^ - -
CI Global Core Plus Bond Fund
(formerly Signature Core Bond Plus Fund) May 01, 17 - - - Sept. 27, 19^ - -
CI Global Dividend Fund
(formerly Signature Global Dividend Fund) May 01, 17 - - - - - -
CI Global Income & Growth Fund
(formerly Signature Global Income & Growth Fund) May 01, 17 - - - - - -

CI Mutual Funds
Semi-Annual Financial Statements - September 30, 2021 – 262 –
Notes to the Financial Statements (unaudited) (cont’d)
*These Series are no longer available for new purchases.^Private Client Managed Portfolios are made available through Assante Private Client, a division of CI Private Counsel LP. The pools used in the Private Client Managed Portfolios are managed by CI Investments Inc., and affiliate of CI Private Counsel LP.
Inception Date:Series P Series PH Series PP Series U Series W Series X Series Y
CI Global Resource Fund
(formerly Signature Global Resource Fund) May 01, 17 - - - - - -
CI High Income Fund
(formerly Signature High Income Fund) May 01, 17 - - - Sept. 27, 19^ - -
CI High Yield Bond Fund
(formerly Signature High Yield Bond Fund) May 01, 17 - - - Sept. 27, 19^ - -
CI Preferred Share Fund
(formerly Signature Preferred Share Fund) May 01, 17 - - - Sept. 27, 19^ - -
CI Select Canadian Equity Fund
(formerly Signature Select Canadian Fund) May 01, 17 - - - Jul. 27, 17^ - -
CI Select Global Equity Fund
(formerly Signature Global Equity Fund) May 01, 17 - - - Jul. 27, 17^ - -
CI Short-Term Bond Fund
(formerly Signature Short-Term Bond Fund) May 01, 17 - - - Sept. 27, 19^ - -
CI Systematic Yield Pool
(formerly Signature Systematic Yield Pool) - - - - - - -
Series Z
CI Asian Opportunities Fund
(formerly Signature Asian Opportunities Fund) -
CI Canadian Balanced Fund
(formerly Signature Canadian Balanced Fund) Jun. 29, 05*
CI Canadian Bond Fund
(formerly Signature Canadian Bond Fund) Jul. 26, 12*
CI Canadian Income & Growth Fund
(formerly Signature Income & Growth Fund) Nov. 03, 17
CI Corporate Bond Fund
(formerly Signature Corporate Bond Fund) Jul. 26, 12*
CI Diversified Yield Fund
(formerly Signature Diversified Yield Fund) Nov. 22, 19
CI Dividend Income & Growth Fund
(formerly Signature Dividend Fund) Aug. 29, 03*
CI Emerging Markets Fund
(formerly Signature Emerging Markets Fund) -
CI Floating Rate Income Fund
(formerly Signature Floating Rate Income Fund) -
CI Global Bond Fund
(formerly Signature Global Bond Fund) -

CI Mutual Funds
Semi-Annual Financial Statements - September 30, 2021 – 263 –
Notes to the Financial Statements (unaudited) (cont’d)
*These Series are no longer available for new purchases.^Private Client Managed Portfolios are made available through Assante Private Client, a division of CI Private Counsel LP. The pools used in the Private Client Managed Portfolios are managed by CI Investments Inc., and affiliate of CI Private Counsel LP.
Inception Date:Series Z
CI Global Core Plus Bond Fund
(formerly Signature Core Bond Plus Fund) -
CI Global Dividend Fund
(formerly Signature Global Dividend Fund) -
CI Global Income & Growth Fund
(formerly Signature Global Income & Growth Fund) -
CI Global Resource Fund
(formerly Signature Global Resource Fund) -
CI High Income Fund
(formerly Signature High Income Fund) -
CI High Yield Bond Fund
(formerly Signature High Yield Bond Fund) -
CI Preferred Share Fund
(formerly Signature Preferred Share Fund) -
CI Select Canadian Equity Fund
(formerly Signature Select Canadian Fund) Jun. 29, 05
CI Select Global Equity Fund
(formerly Signature Global Equity Fund) -
CI Short-Term Bond Fund
(formerly Signature Short-Term Bond Fund) -
CI Systematic Yield Pool
(formerly Signature Systematic Yield Pool) -
Series A Series E Series EF Series F Series I Series O Series P
CI Synergy American Fund
(formerly Synergy American Fund) Aug. 31, 92 Aug. 04, 15 Aug. 04, 15 Aug. 08, 00 Dec. 17, 01 Jul. 30, 13 May 1, 17
Series W
CI Synergy American Fund
(formerly Synergy American Fund) Jul. 27, 17^
Series A Series AT5 Series AT6 Series AT8 Series E Series ET5 Series ET8
CI Portfolio Series Balanced Fund
(formerly Portfolio Series Balanced Fund) Nov. 09, 88 Sept. 28, 07 - Sep. 28, 07 Aug. 04, 15 Aug. 04, 15 Aug. 04, 15
CI Portfolio Series Balanced Growth Fund
(formerly Portfolio Series Balanced Growth Fund) Dec. 17, 01 Sept. 28, 07 Sept. 9, 12* Sep. 28, 07 Aug. 04, 15 Aug. 04, 15 Aug. 04, 15
CI Portfolio Series Conservative Balanced Fund
(formerly Portfolio Series Conservative Balanced Fund) Dec. 17, 01 - Sept. 9, 12* - Aug. 04, 15 - -

CI Mutual Funds
Semi-Annual Financial Statements - September 30, 2021 – 264 –
Notes to the Financial Statements (unaudited) (cont’d)
*These Series are no longer available for new purchases.
Inception Date:Series A Series AT5 Series AT6 Series AT8 Series E Series ET5 Series ET8
CI Portfolio Series Conservative Fund
(formerly Portfolio Series Conservative Fund) Nov. 17, 97 - Jul. 26, 12* - Aug. 04, 15 - -
CI Portfolio Series Growth Fund
(formerly Portfolio Series Growth Fund) Dec. 18, 01 Sept. 28, 07 Sept. 9, 12* Sep. 28, 07 Aug. 04, 15 Aug. 04, 15 Aug. 04, 15
CI Portfolio Series Income Fund
(formerly Portfolio Series Income Fund) Nov. 17, 97 - - - Aug. 04, 15 - -
CI Portfolio Series Maximum Growth Fund
(formerly Portfolio Series Maximum Growth Fund) Dec. 18, 01 Sept. 28, 07 - Sep. 28, 07 Aug. 04, 15 Aug. 04, 15 Aug. 04, 15
Series EF Series EFT5 Series EFT8 Series F Series FT5 Series FT8 Series I
CI Portfolio Series Balanced Fund
(formerly Portfolio Series Balanced Fund) Aug. 04, 15 Aug. 04, 15 Aug. 04, 15 Nov. 17, 00 Sept. 28, 07 Sept. 28, 07 Oct. 31, 96
CI Portfolio Series Balanced Growth Fund
(formerly Portfolio Series Balanced Growth Fund) Aug. 04, 15 Aug. 04, 15 Aug. 04, 15 Dec. 18, 01 - Sept. 28, 07 Jun. 29, 05
CI Portfolio Series Conservative Balanced Fund
(formerly Portfolio Series Conservative Balanced Fund) Aug. 04, 15 - - Dec. 18, 01 - - Jun. 29, 05
CI Portfolio Series Conservative Fund
(formerly Portfolio Series Conservative Fund) Aug. 04, 15 - - Nov. 17, 00 - - Nov. 17, 97
CI Portfolio Series Growth Fund
(formerly Portfolio Series Growth Fund) Aug. 04, 15 Aug. 04, 15 Aug. 04, 15 Dec. 18, 01 - Sept. 28, 07 Oct. 09, 02
CI Portfolio Series Income Fund
(formerly Portfolio Series Income Fund) Aug. 04, 15 - - Nov. 17, 00 - - Nov. 17, 97
CI Portfolio Series Maximum Growth Fund
(formerly Portfolio Series Maximum Growth Fund) Aug. 04, 15 Aug. 04, 15 Aug. 04, 15 Dec. 18, 01 - Sept. 28, 07 Jun. 29, 05
Series O Series OT5 Series OT8 Series P Series PT5 Series PT8 Series U
CI Portfolio Series Balanced Fund
(formerly Portfolio Series Balanced Fund) Jul. 30, 13 Aug. 04, 15 Aug. 04, 15 May 01, 17 May 01, 17 May 01, 17 -
CI Portfolio Series Balanced Growth Fund
(formerly Portfolio Series Balanced Growth Fund) Jul. 30, 13 Aug. 04, 15 Aug. 04, 15 May 01, 17 - May 01, 17 -
CI Portfolio Series Conservative Balanced Fund
(formerly Portfolio Series Conservative Balanced Fund) Jul. 30, 13 - - May 01, 17 - - -
CI Portfolio Series Conservative Fund
(formerly Portfolio Series Conservative Fund) Jul. 30, 13 - - May 01, 17 - - Jul. 26, 12*
CI Portfolio Series Growth Fund
(formerly Portfolio Series Growth Fund) Jul. 30, 13 Aug. 04, 15 Aug. 04, 15 May 01, 17 - May 01, 17 -
CI Portfolio Series Income Fund
(formerly Portfolio Series Income Fund) Jul. 30, 13 - - May 01, 17 - - -

CI Mutual Funds
Semi-Annual Financial Statements - September 30, 2021 – 265 –
Notes to the Financial Statements (unaudited) (cont’d)
*These Series are no longer available for new purchases.
Inception Date:Series O Series OT5 Series OT8 Series P Series PT5 Series PT8 Series U
CI Portfolio Series Maximum Growth Fund
(formerly Portfolio Series Maximum Growth Fund) Jul. 30, 13 Aug. 04, 15 Aug. 04, 15 May 01, 17 - May 01, 17 -
Series UT6 Series Y Series Z
CI Portfolio Series Balanced Fund
(formerly Portfolio Series Balanced Fund) - - -
CI Portfolio Series Balanced Growth Fund
(formerly Portfolio Series Balanced Growth Fund) - - -
CI Portfolio Series Conservative Balanced Fund
(formerly Portfolio Series Conservative Balanced Fund) - - -
CI Portfolio Series Conservative Fund
(formerly Portfolio Series Conservative Fund) Jul. 26, 12* - Sept. 17, 10*
CI Portfolio Series Growth Fund
(formerly Portfolio Series Growth Fund) - - -
CI Portfolio Series Income Fund
(formerly Portfolio Series Income Fund) - Nov. 22, 19 Nov. 22, 19
CI Portfolio Series Maximum Growth Fund
(formerly Portfolio Series Maximum Growth Fund) - - -
Series A Series AT5 Series E Series ET5 Series F Series FT5 Series I
CI Mosaic Balanced ETF Portfolio Jan. 21, 19 Jan. 21, 19 Jan. 21, 19 Jan. 21, 19 Jan. 21, 19 Jan. 21, 19 Jan. 21, 19
CI Mosaic Balanced Growth ETF Portfolio Jan. 21, 19 Jan. 21, 19 Jan. 21, 19 Jan. 21, 19 Jan. 21, 19 Jan. 21, 19 Jan. 21, 19
CI Mosaic Balanced Income ETF Portfolio Jan. 21, 19 Jan. 21, 19 Jan. 21, 19 Jan. 21, 19 Jan. 21, 19 Jan. 21, 19 Jan. 21, 19
CI Mosaic ESG Balanced ETF Portfolio Aug. 03, 21 Aug. 03, 21 - - Aug. 03, 21 Aug. 03, 21 Aug. 03, 21
CI Mosaic ESG Balanced Growth ETF Portfolio Aug. 03, 21 Aug. 03, 21 - - Aug. 03, 21 Aug. 03, 21 Aug. 03, 21
CI Mosaic ESG Balanced Income ETF Portfolio Aug. 03, 21 Aug. 03, 21 - - Aug. 03, 21 Aug. 03, 21 Aug. 03, 21
CI Mosaic Growth ETF Portfolio Jan. 21, 19 Jan. 21, 19 Jan. 21, 19 Jan. 21, 19 Jan. 21, 19 Jan. 21, 19 Jan. 21, 19
CI Mosaic Income ETF Portfolio Jan. 21, 19 Jan. 21, 19 Jan. 21, 19 Jan. 21, 19 Jan. 21, 19 Jan. 21, 19 Jan. 21, 19
Series P Series PT5 Series O Series OT5
CI Mosaic Balanced ETF Portfolio Jan. 21, 19 Jan. 21, 19 Jan. 21, 19 Jan. 21, 19
CI Mosaic Balanced Growth ETF Portfolio Jan. 21, 19 Jan. 21, 19 Jan. 21, 19 Jan. 21, 19
CI Mosaic Balanced Income ETF Portfolio Jan. 21, 19 Jan. 21, 19 Jan. 21, 19 Jan. 21, 19
CI Mosaic ESG Balanced ETF Portfolio Aug. 03, 21 Aug. 03, 21 - -
CI Mosaic ESG Balanced Growth ETF Portfolio Aug. 03, 21 Aug. 03, 21 - -

CI Mutual Funds
Semi-Annual Financial Statements - September 30, 2021 – 266 –
Notes to the Financial Statements (unaudited) (cont’d)
Inception Date:Series P Series PT5 Series O Series OT5
CI Mosaic ESG Balanced Income ETF Portfolio Aug. 03, 21 Aug. 03, 21 - -
CI Mosaic Growth ETF Portfolio Jan. 21, 19 Jan. 21, 19 Jan. 21, 19 Jan. 21, 19
CI Mosaic Income ETF Portfolio Jan. 21, 19 Jan. 21, 19 Jan. 21, 19 Jan. 21, 19
Series A Series F Series I Series S ETF C$ Series
CI Canadian Dividend Private Pool Jun. 17, 19 Jun. 17, 19 Jun. 17, 19 - -
CI Canadian Equity Private Pool Oct. 29, 18 Oct. 29, 18 Oct. 29, 18 - -
CI Canadian Fixed Income Private Pool Oct. 29, 18 Oct. 29, 18 Oct. 29, 18 Nov. 22, 19 -
CI Global Asset Allocation Private Pool Oct. 29, 18 Oct. 29, 18 Oct. 29, 18 - Jul 17, 20
CI Global Balanced Yield Private Pool Oct. 29, 18 Oct. 29, 18 Oct. 29, 18 - -
CI Global Concentrated Equity Private Pool Oct. 29, 18 Oct. 29, 18 Oct. 29, 18 - -
CI Global Enhanced Government Bond Private Pool Oct. 29, 18 Oct. 29, 18 Oct. 29, 18 - -
CI Global Equity Alpha Private Pool Oct. 29, 18 Oct. 29, 18 Oct. 29, 18 - -
CI Global Equity Core Private Pool - - Jun. 17, 19 - -
CI Global Equity Momentum Private Pool Oct. 29, 18 Oct. 29, 18 Oct. 29, 18 - -
CI Global High Yield Credit Private Pool Oct. 29, 18 Oct. 29, 18 Oct. 29, 18 - -
CI Global Infrastructure Private Pool May 21, 20 May 21, 20 May 21, 20 - May 21, 20
CI Global Investment Grade Credit Private Pool Oct. 29, 18 Oct. 29, 18 Oct. 29, 18 - -
CI Global Real Asset Private Pool May 21, 20 May 21, 20 May 21, 20 - May 21, 20
CI Global REIT Private Pool May 21, 20 May 21, 20 May 21, 20 - May 21, 20
CI Global Smaller Companies Private Pool Oct. 29, 18 Oct. 29, 18 Oct. 29, 18 - -
CI Global Unconstrained Bond Private Pool Oct. 29, 18 Oct. 29, 18 Oct. 29, 18 - -
CI International Equity Alpha Private Pool Oct. 29, 18 Oct. 29, 18 Oct. 29, 18 - -
CI International Equity Growth Private Pool Oct. 29, 18 Oct. 29, 18 Oct. 29, 18 - -
CI International Equity Value Private Pool Oct. 29, 18 Oct. 29, 18 Oct. 29, 18 - -
CI North American Small / Mid Cap Equity Private Pool Oct. 29, 18 Oct. 29, 18 Oct. 29, 18 - -
CI U.S. Equity Private Pool Oct. 29, 18 Oct. 29, 18 Oct. 29, 18 - -

CI Mutual Funds
Semi-Annual Financial Statements - September 30, 2021 – 267 –
Notes to the Financial Statements (unaudited) (cont’d)
Effective as of close of business on April 16, 2021, the following Funds merged:
Terminating Fund Continuing Fund
Cambridge Monthly Income Fund CI Global Equity & Income Fund
Cambridge Monthly Income Corporate Class CI Global Equity & Income Fund
The Manager adopted the acquisition method of accounting for the merger of the Funds. Under this
method, one of the Funds is identified as the acquiring Fund and is referred to as the “Continuing
Fund”, and the other Fund involved in the merger is referred to as the “Terminating Fund”. This
identification is based on a comparison of the relative net asset value of the Funds as well as
consideration of the continuation of such aspects of the Continuing Fund as investment objectives and
practices and type of portfolio securities.
Effective as of the close of business on April 16, 2021, the Continuing Fund acquired all of the net assets
of the Terminating Fund in exchange for securities in the Continuing Fund. The value of the securities of
the Continuing Fund issued in connection with this merger, was equal to the net assets transferred from
the Terminating Fund. The cost associated with the merger was borne by the Manager.
The following mergers occurred on a taxable basis.
Net Assets Units
Terminating Fund Continuing Fund Acquired ($) Issued
Cambridge Monthly Income Fund CI Global Equity & Income Fund 72,483,028 6,467,098
Cambridge Monthly Income CI Global Equity & Income Fund
Corporate Class 22,371,111 2,174,468
Effective as of close of business on July 17, 2020, the following Fund merged:
Terminating Fund Continuing Fund
CI First Asset Global Asset Allocation ETF CI Global Asset Allocation Private Pool
The Manager adopted the acquisition method of accounting for the merger of the Funds. Under this
method one of the Funds is identified as the acquiring Fund and is referred to as the “Continuing Fund”,
and the other Fund involved in the merger is referred to as the “Terminating Fund”. This identification
is based on a comparison of the relative net asset value (NAV) of the Funds as well as consideration
of the continuation of such aspects of the Continuing Fund as: investment objectives and practices
and type of portfolio securities.
Effective as of the close of business on July 17, 2020, the Continuing Fund acquired all of the assets
of the Terminating Fund in exchange for units in the Continuing Fund. The value of the units of the
Continuing Fund issued in connection with the merger, was equal to the net assets transferred from
the Terminating Fund. The cost associated with the merger was borne by the Manager.
Net Assets Units
Terminating Fund Continuing Fund Acquired ($) Issued
CI First Asset Global CI Global Asset
Asset Allocation ETF Allocation Private Pool 15,874,898 752,392
Effective as of close of business on November 22, 2019, the following Funds merged:
Terminating Fund Continuing Fund
Sentry Global Growth and Income Fund CI Global Dividend Opportunities Fund
Cambridge Canadian Growth Companies Fund CI Global Smaller Companies Fund
CI Global Small Companies Fund CI Global Smaller Companies Fund
Sentry Global Mid Cap Income Fund CI Global Smaller Companies Fund
Sentry Canadian Fixed Income Private Pool CI Canadian Fixed Income Private Pool
Harbour Fund CI Canadian Investment Fund
Sentry Global Tactical Fixed Income Private Pool CI Global Unconstrained Bond Private Pool
Harbour Global Equity Fund CI Global Value Fund
Lawrence Park Strategic Income Fund CI Investment Grade Bond Fund
Sentry Money Market Fund CI Money Market Fund
Harbour Canadian Dividend Fund CI North American Dividend Fund
Sentry Conservative Monthly Income Fund CI Portfolio Series Income Fund
CI American Equity Fund CI U.S. Equity Fund
Harbour Growth & Income Fund CI Canadian Balanced Fund
Sentry Canadian Bond Fund CI Global Core Plus Bond Fund
Sentry Corporate Bond Fund CI Corporate Bond Fund
Sentry Alternative Asset Income Fund CI Diversified Yield Fund
Harbour Global Growth & Income Fund CI Global Income & Growth Fund
Signature Real Estate Pool CI Global REIT Fund
Marret High Yield Bond Fund CI High Yield Bond Fund
Sentry Global High Yield Bond Fund CI High Yield Bond Fund
The Manager adopted the acquisition method of accounting for the merger of the Funds. Under this
method one of the Funds is identified as the acquiring Fund and is referred to as the “Continuing Fund”,
and the other Fund involved in the merger is referred to as the “Terminating Fund”. This identification
is based on a comparison of the relative net asset value of the Funds as well as consideration of the
continuation of such aspects of the Continuing Fund as: investment objectives and practices and type
of portfolio securities.
Effective as of the close of business on November 22, 2019, the Continuing Fund acquired all of the
assets of the Terminating Fund in exchange for units in the Continuing Fund. The value of the units of
the Continuing Fund issued in connection with this merger, were equal to the net assets transferred
from the Terminating Fund. The cost associated with the merger was borne by the Manager.
Net Assets Units
Terminating Fund Continuing Fund Acquired ($) Issued
Sentry Global Growth and CI Global Dividend
Income Fund Opportunities Fund 254,250,912 23,012,486
Cambridge Canadian CI Global Smaller
Growth Companies Fund Companies Fund 422,739,628 42,148,924
CI Global Small Companies Fund CI Global Smaller
Companies Fund 61,936,994 6,180,285
Sentry Global Mid Cap Income Fund CI Global Smaller
Companies Fund 11,710,296 1,168,029
Sentry Canadian Fixed Income CI Canadian Fixed Income
Private Pool Private Pool 5,523,361 551,747
Harbour Fund CI Canadian Investment Fund 862,687,614 28,412,223

CI Mutual Funds
Semi-Annual Financial Statements - September 30, 2021 – 268 –
Notes to the Financial Statements (unaudited) (cont’d)
Net Assets Units
Terminating Fund Continuing Fund Acquired ($) Issued
Sentry Global Tactical Fixed CI Global Unconstrained Bond
Income Private Pool Private Pool 3,542,075 355,351
Harbour Global Equity Fund CI Global Value Fund 562,555 41,838
Lawrence Park Strategic Income Fund CI Investment Grade Bond Fund 5,419,331 507,813
Sentry Money Market Fund CI Money Market Fund 237,509,611 23,750,961
Harbour Canadian Dividend Fund CI North American
Dividend Fund 62,308,768 5,815,919
Sentry Conservative Monthly CI Portfolio Series
Income Fund Income Fund 7,301,507 727,289
CI American Equity Fund CI U.S. Equity Fund 254,780,003 10,971,471
Harbour Growth & Income Fund CI Canadian Balanced Fund 1,187,244,475 97,856,466
Sentry Canadian Bond Fund CI Global Core Plus Bond Fund 21,762,289 2,217,496
Sentry Corporate Bond Fund CI Corporate Bond Fund 110,412,861 10,315,527
Sentry Alternative Asset
Income Fund CI Diversified Yield Fund 37,525,221 3,752,524
Harbour Global Growth & CI Global Income
Income Fund & Growth Fund 4,075,301 425,106
Signature Real Estate Pool CI Global REIT Fund 56,418,601 2,987,543
Marret High Yield Bond Fund CI High Yield Bond Fund 1,010,134 98,146
Sentry Global High Yield Bond Fund CI High Yield Bond Fund 128,907,013 12,438,172
The Terminating Fund’s results are not included in these financial statements.
The Statements of Financial Position are as at September 30, 2021 and March 31,2021, as applicable.
The Statements of Comprehensive Income, Statements of Changes in Net Assets Attributable to
Holders of Redeemable Units and Statements of Cash Flows are for the periods ended September 30,
2021 and 2020, except for Funds established during either period, in which case the information
provided relates to the period from inception to September 30, 2021 and 2020, as applicable.
2. SUMMARY OF SIGNIFICANT ACCOUNTING POLICIES
These financial statements have been prepared in compliance with International Financial Reporting
Standards (IFRS) as published by the International Accounting Standards Board.
The following is a summary of the significant accounting policies of the Funds:
a. Classification and recognition of financial instruments
The Funds classify and measure their investments (such as fixed-income securities, equity securities,
investment fund(s), exchange-traded fund(s) and derivatives) based on both the Funds’ business model
for managing those financial assets and the contractual cash flow characteristics of the financial
assets. The Funds’ portfolios of financial assets are managed, and performance is evaluated on a fair
value basis. The Funds are primarily focused on fair value information and use that information to
assess the assets’ performance and to make decisions. The contractual cash flows of the Funds’ debt
securities are solely principal and interest, however, these securities are neither held for the purpose
of collecting contractual cash flows nor held both for collecting contractual cash flows and for sale.
The collection of contractual cash flows is only incidental to achieving the Funds’ business model’s
objective. Consequently, all investments and derivatives are measured at fair value through profit or
loss (FVTPL). Short sales are held for trading and are consequently classified as financial liabilities
at FVTPL. Derivative contracts that have a negative fair value are presented as liabilities at FVTPL.
The Funds’ obligations for net assets attributable to holders of redeemable units are presented at the
redemption amount, which approximates their fair value. All other financial assets and liabilities are
measured at amortized cost, which approximates their fair value. Under this method, financial assets
and liabilities reflect the amount required to be received or paid, discounted, when appropriate, at the
effective rate of interest.
Financial assets and liabilities are offset, and the net amounts are presented in the Statements of
Financial Position when, and only when, the Funds have a legal right to offset the amounts and
intend either to settle on a net basis or to realize the asset and settle the liability simultaneously.
In the normal course of business, the Funds enter into various master netting agreements or similar
agreements that do not meet the criteria for offsetting in the Statements of Financial Position, but still
allow for the related amounts to be offset in certain circumstances, such as bankruptcy or termination
of the contracts.
b. Fair value of financial instruments
At the financial reporting date, listed securities are valued based on the last traded market price
for financial assets and financial liabilities where the last traded price falls within the day’s bid-ask
spread. In circumstances where the last traded price is not within the bid-ask spread, the Manager
determines the point within the bid-ask spread that is most representative of fair value based on the
existing market conditions. Unlisted securities are valued based on price quotations from recognized
investment dealers, or failing that, their fair value is determined by the Manager based on the
latest reported information available. Unlisted warrants, if any, are valued based on a pricing model
which considers factors such as the market value of the underlying security, strike price and terms
of the warrant. Fixed income securities, debentures and other debt instruments including short-term
investments, are valued at the quotation received from recognized investment dealers. Underlying
fund(s) are valued on each business day at their net asset value as reported by the underlying fund(s)’
managers.
The fair value of securities where no market price exists is determined by using valuation models that
may be based, in part, on assumptions that are not supported by observable market inputs. These
methods and procedures may include, but are not limited to, performing comparisons with prices of
comparable or similar securities, obtaining valuation related information from issuers and/or other
analytical data relating to the investment and using other available indications of value. These values
are independently assessed by the Manager to ensure that they are reasonable. However, because of
the inherent uncertainty of valuation, the estimated fair values for these securities may be materially
different from the values that would have been used had a ready market for the investment existed.
The fair values of securities where no market price exists are affected by the perceived credit risks of
the issuer, predictability of cash flows and the length of time to maturity.
c. Cash
Cash is comprised of cash on deposit and bank overdraft.
d. Cost of investments
Cost of investments represents the amount paid for each security and is determined on an average
cost basis excluding commissions and transactions costs. Average cost does not include amortization
of premiums or discounts on fixed income securities with the exception of zero-coupon bonds.
e. Investment transactions and income recognition
Investment transactions are recorded on the trade date the date on which a Fund commits to purchase or
sell an investment. The interest for distribution purposes disclosed in the Statements of Comprehensive
Income, represents the coupon interest received by the Funds and is accounted for on an accrual
basis. The Funds do not amortize premiums paid or discounts received on the purchase of fixed income
securities, except for zero coupon bonds which are amortized on a straight-line basis.

CI Mutual Funds
Semi-Annual Financial Statements - September 30, 2021 – 269 –
Notes to the Financial Statements (unaudited) (cont’d)
Dividends and distributions from investments are recognized on the ex-dividend/ex-distribution date.
Distributions received from income trust(s) and underlying fund(s) holdings are recorded as income,
capital gains or a return of capital based on the best information available to the Manager. Due to the
nature of these investments, actual allocations could vary from this information. Distributions from
income trust(s) and underlying fund(s) that are treated as a return of capital for income tax purposes
reduce the average cost of the income trust(s) and underlying fund(s).
f. Functional and presentation currency
The Funds’ functional and presentation currency is the Canadian dollar, except for CI US Money Market
Fund, CI U.S. Income US$ Fund, CI U.S. Dividend US$ Fund, CI Bitcoin Fund and CI Ethereum Fund as
those Funds’ functional and presentation currency is U.S. dollar. For Funds that offer Series AH, Series
FH, Series IH, Series PH and Series WH units, the Net Asset Value per unit for those Series is stated
in U.S. dollars.
g. Foreign exchange
Foreign currency amounts are translated into the functional currency as follows: fair value of
investments, foreign currency forward contracts and other assets and liabilities at the closing rate
of exchange on each business day; income and expenses, purchases and sales and settlements of
investments at the rate of exchange prevailing on the respective dates of such transactions. Foreign
exchange gains (losses) relating to cash are presented as “Foreign exchange gain (loss) on cash” and
those relating to other financial assets and liabilities are presented within “Net realized gain (loss) on
sale of investments and derivatives” and “Change in unrealized appreciation (depreciation) in value of
investments and derivatives” in the Statements of Comprehensive Income.
h. Unit valuation
NAV per unit of each series is calculated at the end of each day on which the Toronto Stock Exchange
is open for business by dividing the total NAV of each series of a Fund by the number of units of that
series outstanding.
The NAV of each series is computed by calculating the value of that series’ proportionate share of the
Fund’s assets less that series’ proportionate share of the Fund’s common liabilities and less series
specific liabilities. Expenses directly attributable to a series are charged to that series. Other income,
expenses, gains and losses, are allocated to each series proportionately based upon the relative total
NAV of each series.
As at September 30, 2021, March 31, 2021 and September 30, 2020, there were no differences
between the NAV used for transactions with unitholders and the net assets attributable to holders of
redeemable units used for reporting purposes under IFRS.
i. Classification of units
The units of each of the Funds are classified as financial liabilities in accordance with IAS 32 –
Financial Instruments: Presentation (IAS 32), as they do not meet the definition of puttable instruments
to be classified as equity in accordance with IAS 32 for financial reporting purposes.
j. Commissions and other portfolio transaction costs
Transaction costs, such as brokerage commissions, incurred in the purchase and sale of securities, are
included in “Commissions and other portfolio transaction costs” in the Statements of Comprehensive
Income. Funds that only invest in units of underlying fund(s) are not subject to transaction costs.
k. Increase (decrease) in net assets attributable to holders of redeemable units per unit
“Increase (decrease) in net assets attributable to holders of redeemable units per unit” in the
Statements of Comprehensive Income is calculated by dividing the increase (decrease) in net assets
attributable to holders of redeemable units of each series of a Fund by the weighted average number
of units of that series outstanding during the period.
l. Foreign currency forward contract(s)
A Fund may, from time to time, enter into foreign currency forward contracts. Foreign currency forward
contracts are valued on each valuation day based on the difference between the contract rate and the
current forward rate at the measurement date applied to the contract’s notional amount and adjusted
for counterparty risk. All unrealized gains (losses) arising from foreign currency forward contracts are
recorded as part of “Change in unrealized appreciation (depreciation) in value of investments and
derivatives” in the Statements of Comprehensive Income and “Unrealized gain (loss) on futures and
foreign currency forward contracts” in the Statements of Financial Position until the contracts are
closed out or expire, at which time the gains (losses) are realized and reported as “Net realized gain
(loss) on sale of investments and derivatives” in the Statements of Comprehensive Income.
m. Future contract(s)
Future contracts are valued on each valuation day using the closing price posted on the relevant
public exchange. Cash and cash equivalents are held as margin against futures contracts which are
reflected in the “Daily variation margin on derivative instruments” in the Statements of Financial
Position. All unrealized gains (losses) arising from futures contracts are recorded as part of “Change
in unrealized appreciation (depreciation) in value of investments and derivatives” in the Statements of
Comprehensive Income and “Unrealized gain (loss) on futures and foreign currency forward contracts”
in the Statements of Financial Position until the contracts are closed out or expire, at which time
the gains (losses) are realized and reported as “Net realized gain (loss) on sale of investments and
derivatives” in the Statements of Comprehensive Income.
n. Option contract(s)
Over-the-counter (OTC) options are valued using the Black Scholes model, whereas, exchange traded
options are valued at last traded price taken from the exchange. Options contracts are valued each
valuation day according to the gain or loss that would be realized if the contracts were closed
out. All unrealized gains (losses) arising from option contracts are recorded as part of “Change in
unrealized appreciation (depreciation) in value of investments and derivatives” in the Statements of
Comprehensive Income until the contracts are closed out or expire, at which time the gains (losses)
are realized and reflected in the Statements of Comprehensive Income in “Net realized gain (loss) on
sale of investments and derivatives”. Any expired option premiums are recorded as part of “Derivative
income (loss)” in the Statements of Comprehensive Income.
o. Interest rate swap contract(s)
The fair value of interest rate swaps is determined using indicative closing market values obtained
from third-party broker-dealers. The broker-dealers determine the fair value using valuation models
that are based on assumptions that are supported by observable market inputs, including the interest
rates for that day. The indicative closing market values are independently assessed internally to ensure
that they are reasonable. Any income (expense) received (incurred) for interest rate swaps contracts
is recorded as “Derivative income (loss)” in the Statements of Comprehensive Income. The unrealized
gain or loss on interest rate swaps is reflected in the Statements of Comprehensive Income as part
of “Change in unrealized appreciation (depreciation) in value of investments and derivatives”. When
the interest rate swaps contracts are closed out, any gains (losses) are recorded as “Net realized gain
(loss) on sale of investments and derivatives” in the Statements of Comprehensive Income.

CI Mutual Funds
Semi-Annual Financial Statements - September 30, 2021 – 270 –
Notes to the Financial Statements (unaudited) (cont’d)
p. Total return swap contract(s)
A total return swap is an agreement between a Fund and a counterparty where single or multiple
cash flows are exchanged based on the price of an underlying reference asset and based on a fixed
or variable rate. Over the term of the contract, the Fund will pay to the counterparty a periodic stream
of payments based on fixed or variable rate. Such periodic payments paid are accrued daily and are
included in the Statement of Comprehensive Income in “Interest expense”. At the maturity date, a net
cash flow is exchanged where the total return is equivalent to the return of the underlying reference
asset less a rate, if any. As a receiver, the Fund would receive payments based on any net positive
total return and would owe payments in the event of a net negative total return.
The unrealized gain or loss on total return swaps is reflected in the Statements of Comprehensive
Income as part of “Change in unrealized appreciation (depreciation) in value of investments and
derivatives”. When the total return swaps contracts are closed out, any gains (losses) are recorded as
“Net realized gain (loss) on sale of investments and derivatives” in the Statements of Comprehensive
Income.
q. Credit default swaps contract(s)
Credit default swaps are agreements that help to mitigate credit risk exposure to certain issuing
entities (Referenced Entity) or to increase credit risk exposure to the Referenced Entity by creating a
notional investment position. When a notional investment position is created, the credit risk exposure
is comparable to the exposure that would have resulted had a Fund invested directly in the Referenced
Entity. Under a credit default swap agreement, the protection buyer, whose intention is to reduce its
credit risk exposure to the Referenced Entity, pays a premium to the protection seller, who assumes
the credit risk of a default of the bond of a Referenced Entity. This premium is paid at regular intervals
over the term of the credit default swap agreement. In return for the premium paid, the protection
buyer is entitled to receive from the protection seller full payment for a loss arising from a credit
default event of the Referenced Entity. A credit default event may be triggered by bankruptcy, failure
to pay or restructuring of the Referenced Entity. If a credit default event occurs, the credit default
swap may be settled by either the physical delivery of the bond for proceeds equal to par value or
a cash payment equal to the loss amount. Credit default swaps are valued based on dealer-supplied
valuations.
Changes in value of credit default swap agreements are recorded as part of “Change in
unrealized appreciation (depreciation) in value of investments and derivatives” in the Statements of
Comprehensive Income. Premiums paid or received from credit default swap agreements are included
in “Derivative income (loss)” in the Statements of Comprehensive Income. When credit default swap
agreements expire or are closed out, gains or losses are included in “Net realized gain (loss) on sale
of investments and derivatives” in the Statements of Comprehensive Income.
r. Mortgage-backed and asset-backed securities
Certain Funds invest in mortgage-related and other asset-backed securities. These securities may
include: mortgage pass-through securities, collateralized mortgage obligations, commercial mortgage-
backed securities, asset-backed securities, collateralized debt obligations and other securities that
directly or indirectly represent a participation in, or are secured by and payable from, mortgage loans
on real property. The debt and equity securities issued by these securities may include tranches with
varying levels of subordination. These securities may provide a monthly payment which consists of
both interest and principal payments.
Mortgage-related securities are created from pools of residential or commercial mortgage loans,
including mortgage loans made by savings and loan institutions, mortgage bankers, commercial banks
and others. Asset-backed securities are created from many types of assets, including auto loans, credit
card receivables, home equity loans and student loans.
Mortgage-related and asset-backed securities are issued as separate tranches, or classes, of
securities within each deal. The securities are also normally valued by pricing service providers
that use broker-dealer quotations or valuation estimates from their internal pricing models. The
pricing models for these securities usually consider tranche-level attributes, current market data,
estimated cash-flows, and market-based yield spreads for each tranche and incorporate deal collateral
performance, as available. The carrying values of mortgage-related and other asset-backed securities
are included in “Investments” in the Statements of Financial Position. The change in fair values of
mortgage-related and other asset-backed securities are included in the Statements of Comprehensive
Income in “Change in unrealized appreciation (depreciation) in value of investments and derivatives”.
s. Short selling
When a Fund sells a security short, it will borrow that security from a broker to complete the sale. As
the Fund borrows a security from the broker, the Fund is required to maintain a margin account with
the broker containing cash or liquid securities. The cash held on margin in respect of short sale activity
is included in the “Collateral on deposit for short sale” in the Statements of Financial Position. The
maximum loss on securities sold short can be unlimited. The Fund will incur a loss as a result of a short
sale if the price of the borrowed security increases between the date of the short sale and the date on
which the Fund closes out its short position by buying that security. The Fund will realize a gain if the
security declines in price between those dates. The gain or loss that would be realized if the position
was to be closed out on the valuation date is reflected in the Statements of Comprehensive Income as
part of “Change in unrealized appreciation (depreciation) in value of investments and derivatives” and
in the Statements of Financial Position in “Investments sold short”. When the short position is closed
out, gains and losses are realized and included in “Net realized gain (loss) on sale of investments
and derivatives” in the Statements of Comprehensive Income. Fees paid to a broker for borrowing
a security are included in “Securities borrowing fees” in the Statements of Comprehensive Income.
t. Offsetting of financial instruments
The disclosures set out in the Offsetting of Financial Instruments tables in the Fund Specific Notes
to Financial Statements of each Fund, where applicable, include foreign currency forward contracts
assets and liabilities that are subject to an enforceable master netting arrangement. Transactions
with individual Counterparties are governed by separate master netting agreements. Each agreement
allows for net settlement of certain open contracts where the Funds and respective counterparty both
elect to settle on a net basis. In the absence of such an election, contracts will be settled on a gross
basis. However, each party to the master netting agreement will have the option to settle all open
contracts on a net basis in the event of default of the other party.
International Swaps and Derivatives Association Inc. Master Agreements (ISDA Master Agreements)
govern OTC financial derivative transactions entered into by the Funds and select counterparties. The
ISDA Master Agreements maintain provisions for general obligations, representations, agreements,
collateral and events of default or termination. Events of termination include conditions that may
entitle counterparties to elect to terminate early and cause settlement of all outstanding transactions
under the applicable ISDA Master Agreement. Any election to terminate early could be material to the
financial statements. The fair value of OTC financial derivative transactions net of collateral received
in or pledged by counterparty is disclosed in the Fund Specific Notes to Financial Statements.
Funds may be subject to various master agreements or netting arrangements with select counterparties.
These master agreements reduce the counterparty risk associated with relevant transactions by
specifying credit protection mechanisms and providing standardization that improves legal certainty.
Since different types of transactions have different mechanics and are sometimes traded out of
different legal entities of a particular counterparty organization, each type of transaction may be
covered by a different master agreement resulting in the need for multiple agreements with a single

CI Mutual Funds
Semi-Annual Financial Statements - September 30, 2021 – 271 –
Notes to the Financial Statements (unaudited) (cont’d)
counterparty. As the master agreements are specific to unique operations of different asset types, they
allow the Funds to close out and net their total exposure to a counterparty in the event of a default
with respect to the transactions governed under a single agreement with a counterparty.
u. Investments in associates, joint ventures, subsidiaries and unconsolidated structured
entities
Subsidiaries are entities, including investments in other investment entities, over which a Fund has
control. A Fund controls an entity when it is exposed to, or has rights to, variable returns from its
involvement with the entity, and has the ability to affect those returns through its power over the
entity. Associates and joint ventures are investments over which a Fund has significant influence
or joint control. A structured entity is an entity that has been designed so that voting or similar
rights are not the dominant factors in deciding, who controls the entity, or when voting rights
relate to administrative tasks only and the relevant activities are directed by means of contractual
arrangements.
The Manager has determined that underlying fund(s) or exchange-traded fund(s) (ETF(s)) held typically
by the Funds meet the definition of structured entities. Mortgage-backed securities or asset- backed
securities are also considered to be unconsolidated structured entities. The Funds account for their
investments in unconsolidated structured entities at FVTPL.
The Funds that invest in underlying fund(s) are subject to the terms and conditions of the respective
underlying fund’s offering documents and are susceptible to market price risk arising from uncertainties
about future values of those underlying fund(s). All of the underlying fund(s) in the investment portfolio
are managed by portfolio managers who are compensated by the respective underlying fund for
their services. Such compensation generally consists of an asset-based fee and is reflected in the
valuation of each of the underlying fund(s), except when the Funds invest in certain series/classes of
the underlying fund(s) where the compensation to portfolio managers is negotiated and paid outside
of respective underlying fund. The underlying fund(s) finance their operations by issuing redeemable
units that entitle the holders to an equal beneficial interest in a respective underlying fund. The Funds
can redeem their investments in the underlying fund(s) on daily basis.
Certain Funds invest in ETF(s). The ETF(s) finance their operations by issuing redeemable shares which
are puttable at the holder’s option and entitle the holder to a proportional stake in each ETF’s net asset
value. The ETF(s) are domiciled in Canada, the U.S. and Japan and listed on recognized public stock
exchanges. The Funds’ maximum exposure to loss from their interest in ETF(s) is equal to the total fair
value of their investments in ETF(s).
The Funds’ investments in underlying fund(s) or ETF(s) are accounted for at FVTPL and included in
“Investments” in the Statements of Financial Position. All unrealized gains (losses) arising from these
investments are recorded as part of “Change in unrealized appreciation (depreciation) in value of
investments and derivatives” in the Statements of Comprehensive Income until these investments are
sold, at which time the gains (losses) are realized and reflected in the Statements of Comprehensive
Income in “Net realized gain (loss) on sale of investments and derivatives”.
The Funds’ maximum exposure to loss from their interest in ETF(s), underlying fund(s) and mortgage/
asset-backed securities is equal to the total fair value of their investments in these unconsolidated
structured entities.
Additional information related to Interest in Unconsolidated Structured Entities for each of the Funds
appears under the Fund Specific Notes to Financial Statements, where applicable.
v. Withholding taxes
A Fund may, from time to time, incur withholding taxes imposed by certain countries on investment
income and capital gains. Such income and gains are recorded on a gross basis and the related
withholding taxes are shown separately in the Statements of Comprehensive Income.
w. Harmonized sales tax
Certain provinces including Ontario, Prince Edward Island, Nova Scotia, New Brunswick and
Newfoundland and Labrador (each a Participating Tax Jurisdiction) have harmonized their provincial
sales tax (PST) with the federal goods and services tax (GST). The Harmonized Sales Tax (HST)
combines the federal GST rate of 5% with the PST rate of the participating provinces. The province
of Quebec also applies the Quebec sales tax (QST) of 9.975%. The Provincial HST liability or refund is
calculated using the residency of unitholders and the value of their interest in the Fund as at specific
times, rather than the physical location of the Fund. The effective sales tax rate charged to each
series of the Fund is based on the unitholders’ proportionate investments by province, using each
province’s HST rate, GST rate in the case of non-participating provinces and/or QST rate. All amounts
are presented as “Harmonized sales tax” in the Statements of Comprehensive Income.
x. Non-cash transactions
Non-cash transactions included in the Statements of Cash Flows include reinvested distributions from
the underlying mutual fund(s) and stock dividends from equity investments as well as acquisition of
assets from terminated funds. Reinvested distributions from the underlying mutual fund(s) and stock
dividends from equity investments amounts represent non-cash income recognized in the Statements
of Comprehensive Income.
The “Proceeds from issuance of redeemable units” and “Amounts paid on redemption of redeemable
units” in the Statements of Cash Flow exclude non-cash transactions.
3. CRITICAL ACCOUNTING JUDGMENTS AND ESTIMATES
The preparation of these financial statements in accordance with IFRS requires management to
make judgments, estimates and assumptions that affect the application of accounting policies and
reported amounts of assets and liabilities at the reporting date and the reported amounts of income
and expenses during the reporting period. The following discusses the most significant accounting
judgments and estimates that the Funds have made in preparing their financial statements:
Fair value measurement of investments and derivatives not quoted in active market
The Funds may, from time to time, hold financial instruments that are not quoted in active
markets, such as unlisted securities, private securities or derivatives. Unlisted securities are
valued based on price quotations from recognized investment dealers, or failing that, their fair
value is determined by the Manager based on the latest reported information available. The
fair value of private securities is determined by using valuation models that may be based, in
part, on assumptions that are not supported by observable market inputs. These methods and
procedures may include, but are not limited to, performing comparisons with prices of comparable
or similar securities, obtaining valuation related information from issuers and/or other analytical
data relating to the investment and using other available indications of value. These values were
independently assessed by the Manager based on assumptions and estimates on parameters
available when the financial statements were prepared. However, because of the inherent
uncertainty of valuation, the estimated fair values for these securities may be materially different
from the values that would have been used had a ready market for the investment existed. The fair
values of private securities are affected by the perceived credit risks of the issuer, predictability of
cash flows and the length of time to maturity.

CI Mutual Funds
Semi-Annual Financial Statements - September 30, 2021 – 272 –
Notes to the Financial Statements (unaudited) (cont’d)
Valuation models use observable data, to the extent practicable. Since the outbreak of coronavirus 19
(COVID-19), market volatility has increased significantly which results in fluctuation in quoted
securities prices, widening of bid ask spreads and reduced liquidity in the market. These changes
may also impact the observability of some of the model valuation inputs used, which may have an
implication on classification of certain financial instruments within the fair value hierarchy. Areas
such as credit risk (both own and counterparty); volatilities, correlations and key assumptions
concerning future developments require the Manager to make estimates. Changes in assumptions
about these factors could affect the reported fair values of financial instruments.
The Funds consider observable data to be market data that is readily available, regularly distributed
and updated, reliable and verifiable, not proprietary, and provided by independent sources that are
actively involved in the relevant market.
IFRS 10 Consolidated Financial Statements (IFRS 10)
In accordance with IFRS 10, the Manager has determined that the Funds meet the definition of an
Investment Entity which requires that the Funds obtain funds from one or more investors for the
purpose of providing investment management services, commit to their investors that their business
purpose is to invest funds solely for returns from capital appreciation, investment income, or both; and
measure and evaluate the performance of their investments on a fair value basis. Consequently, the
Funds do not consolidate their investment in subsidiaries, if any, but instead measure these at FVTPL,
as required by the accounting standard.
4. REDEEMABLE UNITS
Redeemable units issued and outstanding represent the capital of each Fund.
Mutual Funds Series
Each Fund is authorized to issue an unlimited number of redeemable, transferable units of each series.
Generally, the Funds have no restrictions or specific capital requirements, except for the minimum
subscription/redemption amounts.
ETF Series
Each Fund is authorized to issue an unlimited number of ETF Series units. The ETF Series units are
listed on TSX and unitholders can buy or sell such units on the TSX through registered brokers and
dealers.
On any trading day, a Designated Broker or an ETF Dealer may place a subscription order for prescribed
number of ETF Series units (PNS) or integral multiple PNU of each Fund. A trading day is each day on
which the TSX is open for business.
If the subscription order is accepted, the Fund will generally issue units to an ETF Dealer or the
Designated Broker the PNU (or an integral multiple thereof) within two trading days from the
effective day of the subscription order. For each PNS issued, an ETF Dealer or the Designated Broker
must deliver subscription proceeds consisting of a group of securities and/or assets determined by
the Manager from time to time representing the constituent securities of the Fund (a “Basket of
Securities”) and cash in an amount sufficient so that the value of the Basket of Securities and cash
delivered is equal to the NAV of the PNU of the Fund determined at the valuation time on the effective
date of the subscription order plus any applicable subscription fee determined by the Manager.
ETF Series units of each Fund may also be issued to unitholders of such Fund on the automatic
reinvestment of certain distributions in accordance with the distribution policy of the Fund.
Unitholders may exchange PNS (or an integral multiple thereof) of each Fund on any trading day for
Baskets of Securities and cash, or in the discretion of the Manager, cash only. The exchange price will
be equal to the NAV of the applicable PNU tendered for exchange determined at the valuation time on
the effective date of the exchange request, payable by delivery of a Basket of Securities (constituted
as most recently published prior to the effective date of the exchange request) and cash. The ETF
Series units will be redeemed in the exchange.
On any trading day, unitholders of ETF Series units of each Fund may redeem (i) ETF Series units for
cash at a redemption price per ETF Series unit equal to 95% of the closing price for the ETF Series units
on the TSX on the effective day of the redemption less any applicable redemption fee determined by
the Manager, in its sole discretion, from time to time, or (ii) a PNU of the Fund or a multiple PNU of
the Fund for cash equal to the NAV of that number of ETF Series units less any applicable redemption
fee determined by the Manager, in its sole discretion, from time to time.
Unitholders of ETF Series units that have delivered a redemption request prior to the Distribution
Record Date (as defined hereinafter) for any distribution will not be entitled to receive that distribution.
The relevant changes pertaining to subscription and redemption of each Fund’s units are disclosed in
the Statement of Changes in Net Assets Attributable to Holders of Redeemable Units. In accordance
with the objectives and risk management policies outlined in Notes 1 and 10, the Funds endeavour
to invest subscriptions received in appropriate investments while maintaining sufficient liquidity to
meet redemptions through utilizing a short-term borrowing facility or disposal of investments when
necessary.
Redeemable unit transactions information appears in the Fund Specific Notes to Financial Statements
of each of the Funds.
In order to establish each individual series, the Manager has made initial investments in certain Funds.
As at September 30, the Manager held investments in the following Funds:
2021 2020
Funds (in $) (in $)
CI American Small Companies Fund 5,147 3,464
CI Bitcoin Fund 139,763 n/a
CI Canadian Investment Fund 1,453 1,163
CI Canadian Small/Mid Cap Managed Fund 4,953 3,677
CI Emerging Markets Bond Fund 947 n/a
CI Ethereum Fund 216,894 n/a
CI Global Climate Leaders Fund 182,546 n/a
CI Global Longevity Economy Fund 56,780 168,288
CI Global Stock Selection Fund 1,673,462 1,286,345
CI Global Value Fund 3,783 3,173
CI Income Fund 1,112 1,059
CI International Value Fund 4,985 4,326
CI Investment Grade Bond Fund 67,096 67,779
CI Marret Short Duration High Yield Fund 4,376 5,229
CI Money Market Fund 11,091 11,042
CI MSCI World ESG Impact Fund 8,413 7,831
CI Munro Global Growth Equity Fund 89,940 31,562
CI U.S. Income US$ Fund 5,500 4,212

CI Mutual Funds
Semi-Annual Financial Statements - September 30, 2021 – 273 –
Notes to the Financial Statements (unaudited) (cont’d)
2021 2020
Funds (cont’d) (in $) (in $)
CI U.S. Stock Selection Fund 2,964 2,234
CI US Money Market Fund 1,284 1,347
CI Portfolio Series Balanced Fund 10,087 8,825
CI Portfolio Series Balanced Growth Fund 11,936 10,197
CI Portfolio Series Conservative Fund 1,143 1,066
CI Portfolio Series Growth Fund 11,981 9,202
CI Portfolio Series Maximum Growth Fund 14,255 11,646
CI Canadian Asset Allocation Fund 2,375 2,145
CI Canadian Core Plus Bond Fund 2,092 2,101
CI Canadian Dividend Fund 1,545 1,127
CI Canadian Equity Fund 5,646 4,441
CI Global Analysts Selection Fund 2,781,237 2,004,147
CI Global Dividend Opportunities Fund 1,366 1,092
CI Global Equity & Income Fund 8,927 1,062
CI Global Equity Fund 6,726 5,598
CI Global Smaller Companies Fund 5,339 5,113
CI Pure Canadian Small/Mid Cap Equity Fund 1,939 1,283
CI U.S. Dividend Fund 2,712 2,142
CI U.S. Dividend Registered Fund 4,022 3,189
CI U.S. Dividend US$ Fund 26,975 20,380
CI Black Creek Global Balanced Fund 1,244 1,056
CI Asian Opportunities Fund 4,159 3,680
CI Canadian Income & Growth Fund 1,285 1,092
CI Corporate Bond Fund 1,192 1,092
CI Diversified Yield Fund 2,611 2,188
CI Dividend Income & Growth Fund 1,498 1,139
CI Emerging Markets Fund 49,229 -
CI Floating Rate Income Fund 4,644 3,254
CI Global Bond Fund 953 1,014
CI Global Core Plus Bond Fund 3,264 3,186
CI Global Resource Fund 3,590 2,376
CI High Income Fund 1,367 1,113
CI High Yield Bond Fund 2,538 2,240
CI Preferred Share Fund 3,064 2,324
CI Select Canadian Equity Fund 1,618 1,172
CI Select Global Equity Fund 1,491 1,152
CI Short-Term Bond Fund 2,091 2,073
CI Synergy American Fund 4,122 3,538
CI Select Staging Fund 23,314 23,109
CI Mosaic Balanced ETF Portfolio 8,755 7,752
CI Mosaic Balanced Growth ETF Portfolio 10,558 9,032
CI Mosaic Balanced Income ETF Portfolio 9,446 8,684
CI Mosaic ESG Balanced ETF Portfolio 490,020 n/a
CI Mosaic ESG Balanced Growth ETF Portfolio 489,785 n/a
CI Mosaic ESG Balanced Income ETF Portfolio 491,347 n/a
CI Mosaic Growth ETF Portfolio 12,514 10,430
CI Mosaic Income ETF Portfolio 8,879 8,482
CI Canadian Dividend Private Pool 3,176 2,316
CI Canadian Equity Private Pool 1,636 1,216
2021 2020
Funds (cont’d) (in $) (in $)
CI Canadian Fixed Income Private Pool 2,071 2,089
CI Global Asset Allocation Private Pool 1,273 1,097
CI Global Balanced Yield Private Pool 1,233 1,098
CI Global Concentrated Equity Private Pool 2,828 2,287
CI Global Enhanced Government Bond Private Pool 998 1,016
CI Global Equity Alpha Private Pool 1,458 1,188
CI Global Equity Core Private Pool 2,005,137 1,684,754
CI Global Equity Momentum Private Pool 3,123 2,457
CI Global High Yield Credit Private Pool 4,008 3,462
CI Global Infrastructure Private Pool 24,625 155,089
CI Global Investment Grade Credit Private Pool 1,022 1,034
CI Global Real Asset Private Pool 24,917 152,584
CI Global REIT Private Pool 27,314 159,356
CI Global Smaller Companies Private Pool 3,536 2,572
CI Global Unconstrained Bond Private Pool 1,236 1,106
CI International Equity Alpha Private Pool 3,021 2,255
CI International Equity Growth Private Pool 2,780 2,313
CI International Equity Value Private Pool 2,484 2,154
CI North American Small / Mid Cap Equity Private Pool 3,453 2,578
CI U.S. Equity Private Pool 1,365 1,098
5. FEES AND OTHER EXPENSES
Management fees
The Manager of each Fund in consideration for management fees, provides management services
required in the day-to-day operations of the Funds, including management of the investment portfolios
of the Funds and provision of key management personnel.
The management fees are calculated based on a percentage of the net asset values of each series of
a Fund (other than Series I, IT8, IH, O, OO, OT5, OT8, P, PH, PP, PT5, PT8, S and series offered under
Private Client Managed Portfolios) at the end of each business day and are subjected to application
taxes including HST, GST and QST.
Investors in Series I, IT8, IH, O, OO, OT5, OT8, P, PH, PP, PT5, PT8, S and series offered under Private
Client Managed Portfolios are charged management fees directly as negotiated between the investor
and the Manager.
During the period ended September 30, 2021, the Manager of the Funds absorbed a total of $1,755,000
(2020 - $876,000), $836,000 (2020 - $1,111,000) and U.S. $50,000 (2020 - U.S. $15,000) in management
fees due to the declining yields generated by the following funds: CI Money Market Fund, CI High
Interest Savings Fund and CI US Money Market Fund, respectively.
Administration fees
The Manager bears all of the operating expenses of the Funds (other than certain taxes, borrowing
costs and new governmental fees) in return for an annual administration fee. Administration fees are
calculated as an annual percentage of the net asset value of each series of a Fund (other than Series I,
IT8, IH and S) at the end of each business day and are subjected to application taxes including HST,
GST and QST.
Investors in Series I, IT8, IH and S units are charged administration fees directly as negotiated
between the investor and the Manager.

CI Mutual Funds
Semi-Annual Financial Statements - September 30, 2021 – 274 –
Notes to the Financial Statements (unaudited) (cont’d)
Administration fees are not applicable to CI Money Market Fund, CI US Money Market Fund and
Select Staging Fund.
Fees rebates
The Manager may reduce the management and/or administration fees based on size of a unitholder
investment or participation in a program offered by the Manager for larger accounts. The Manager
may also reduce management fee if a reduced trailing commission has been negotiated between
a unitholder and the unitholder representative based on relevant documentation provided to the
Manager. Following the end of each quarter, the amount of any management and/or administration
fees reduction is distributed to qualified unitholders by the Fund in the form of a reinvestment in
additional units of the respective series of the Fund. The management and/or administration fee
rebates, if applicable, are included in “Fees rebate receivable” and in “Fees rebate” as reflected
in the Statements of Financial Position and Statements of Comprehensive Income of each Fund, if
applicable. The Manager may reduce or waive the management and/or administration fees without
giving notice to unitholders.
A unitholder investing in Series A, AH, AT5, AT8, F, FH, FT5, FT8, Y and/or Z units of the Funds
available under CI Preferred Pricing with minimum account investment of $100,000 in qualifying
investments, may be eligible for CI Preferred Pricing, which offers the potential for lower management
and administration fees in the form of distributions. The Manager may vary the terms, conditions
and the unitholders qualifications for CI Preferred Pricing from time to time or the Manager may
discontinue the program based on the Manger sole discretion.
A unitholder investing in Series E, ET5, ET8, EF, EFT5 and/or EFT8 units with minimum investment
of $250,000 in Private Investment Management account(s) with the Manager, the Manager may,
based on the Manager sole discretion, offer the unitholder the opportunity to participate in the Fee
Reduction Program. The Fee Reduction Program will allow the unitholder to benefit from management
fee distributions. The Manager may vary the terms, conditions and unitholders qualifications for the
Fee Reduction Program from time to time or the Manager may discontinue the program based on the
Manager sole discretion.
Investments in underlying fund(s)
A Fund that invests in units/shares of underlying fund(s) will not pay a duplicate management and
administration fees on the portion of assets that are invested in units/shares of underlying fund(s).
During the reporting period, a Fund may have received a management and/or administration fee
rebates from the underlying fund(s)’ Manager relating to its investment in the underlying fund(s). The
management and/or administration fee rebates are included in “Fees rebate receivable” and in “Fees
rebate” as reflected in the Statements of Financial Position and Statements of Comprehensive Income
of each Fund, as applicable.
Refer to the Management and Administration Fees table in the Fund Specific Notes to the Financial
Statements for the management and administrative fee rates applicable to each series of each of
the Funds.
6. SECURITIES LENDING
Certain Funds have entered into a securities lending program with their Custodian or Lending Agent,
as applicable. The aggregate market value of all securities loaned by a Fund cannot exceed 50% of the
assets of the Fund. A Fund will receive collateral of at least 102% of the value of securities on loan.
Collateral will generally be comprised of cash and obligations of or guaranteed by the Government
of Canada or a province thereof, or by the United States government or its agencies, but may include
obligations of other governments with appropriate credit ratings. For those Funds participating in the
program, amounts for securities loaned and the collateral received as well as reconciliation between
gross securities lending revenue and securities lending revenue received by each Fund appear on
the Fund Specific Notes to Financial Statements. Revenue from securities lending is included in
“Securities lending revenue” in the Statements of Comprehensive Income.
7. INCOME TAXES
The Funds, except for CI Emerging Markets Bond Fund, CI Global Stock Selection Fund, CI Select
Canadian Equity Managed Fund, CI Select International Equity Managed Fund, CI Select Staging Fund,
CI Select U.S. Equity Managed Fund, CI Canadian Long-Term Bond Pool, CI Canadian Short-Term Bond
Pool, CI Global Analysts Selection Fund, CI Systematic Yield Pool, CI Global Equity Core Private Pool,
and CI International Equity Value Private Pool qualify as a mutual fund trust under the Income Tax Act
(Canada). All of the Funds’ net income for tax purposes and sufficient net capital gains realized in
any year are required to be distributed to unitholders such that no income tax is payable by each of
the Funds. As a result, the Funds do not record income taxes. Since the Funds do not record income
taxes, the tax benefit of capital and non-capital losses has not been reflected in the Statements of
Financial Position as a deferred income tax asset. Income tax on net realized capital gains not paid or
payable will generally be recoverable by virtue of refunding provisions contained in the Income Tax
Act (Canada) and provincial income tax legislation, as redemptions occur. Occasionally, the Funds
may distribute more than they earn. This excess distribution is a return of capital and is not taxable
to unitholders.
The CI Emerging Markets Bond Fund, CI Global Stock Selection Fund, CI Select Canadian Equity
Managed Fund, CI Select International Equity Managed Fund, CI Select Staging Fund, CI Select
U.S. Equity Managed Fund, CI Canadian Long-Term Bond Pool, CI Canadian Short-Term Bond Pool,
CI Global Analysts Selection Fund, CI Systematic Yield Pool, CI Global Equity Core Private Pool, and
CI International Equity Value Private Pool qualify as a unit trust under the Income Tax Act (Canada)
and are not subject to tax on their net income, including net realized capital gains for the taxation
year, which is paid or payable to their unitholders at the end of the taxation year. However, such
part of each Fund’s taxable income and net realized capital gains that is not so paid or payable to its
unitholders will be taxable to that Fund. It is the intention of each Fund to distribute all net taxable
income and sufficient net realized capital gains so that the Funds will not be subject to income tax. As
a result, the Funds do not record income taxes. Since the Funds do not record income taxes, the tax
benefit of capital and non-capital losses has not been reflected in the Statements of Financial Position
as a deferred income tax asset. Occasionally, a Fund may distribute more than it earns. This excess
distribution is a return of capital and is not taxable to unitholders.
CI Select Canadian Fund under distributed net realizable capital gains during the year ended March 31,
2017, which resulted in a tax payable. Under the terms of an agreement dated March 1, 2018, a third-
party administrator has acknowledged its responsibility and unconditionally assumed the tax liability,
and the Fund has agreed to undertake all commercially reasonable and legally permissible measures,
not to the detriment of unitholders, to recover tax payments and remit such recovered amounts, if any,
to the third-party administrator as they occur. In 2016, the taxes were paid in accordance with the
agreement. The under distribution of realized capital gains did not adversely impact the unitholders of
the Fund as the balance was paid by the 3rd party administrator.
The remaining tax payable and tax recoverable amounts are included in “Other” in the Statements
of Financial Position.
8. REINVESTMENT OF DISTRIBUTIONS
When a Fund pays a distribution to a unitholder, it will be paid in the same currency in which the units
are held. Distributions are automatically reinvested without charge in the same Fund or paid out in
cash to the unitholder. The Manager may change the distribution policy at its discretion.

CI Mutual Funds
Semi-Annual Financial Statements - September 30, 2021 – 275 –
Notes to the Financial Statements (unaudited) (cont’d)
9. RELATED PARTY TRANSACTIONS
The Funds may have direct or indirect holdings in CI Financial Corp., or its affiliates or other funds
managed by the Manager.
The Manager of the Funds may, from time to time, make initial investments in certain series of
certain Funds to help establish a series or a Fund. Details of the investments made by the Manager
are disclosed in Note 4.
Related Issuer Trading
Related issuer trading occurs when a Fund purchases or sells securities of CI Financial Corp. These
transactions are executed through market intermediaries and under prevailing market terms and
conditions. The Independent Review Committee (IRC) reviews such transactions during scheduled
meetings. During the periods ended September 30, 2021 and 2020, certain Funds engaged in related
issuer trading or held position(s) in CI Financial Corp. at the end of each period.
Related Fund Trading
Related fund trading occurs when a Fund purchases or sells units/shares of another Fund managed
by the Manager. During the periods ended September 30, 2021 and 2020, certain Funds engaged in
related fund trading or held position(s) in related fund(s) at the end of each period.
Inter Fund Trading
Inter fund trading occurs when a Fund purchases or sells a security of any issuer from or to another
Fund managed by the Manager. These transactions are executed through market intermediaries and
under prevailing market terms and conditions. The IRC reviews such transactions during scheduled
meetings. During the periods ended September 30, 2021 and 2020, the Funds executed inter fund
trades.
10. FINANCIAL INSTRUMENTS RISK
COVID-19 Impact
Since the outbreak of COVID-19, emergency measures taken in response to the spread of COVID-19
have resulted in significant disruption to business operations globally, resulting in an economic
slowdown. Global equity and capital markets have also experienced significant volatility and
weakness. The governments have reacted with significant monetary and fiscal interventions designed
to stabilize economic conditions. These developments are constantly evolving and the duration and
impact of the COVID-19 pandemic is highly uncertain and cannot be predicted at this time but could
have a material impact on the future performance of the Funds. In the face of the current environment
of heightened uncertainty and market volatility, the Manager continues to closely monitor its impact
on the Funds’ risk exposures from the portfolio holdings.
Risk management
The Funds are exposed to a variety of financial instruments risks: leverage and short selling risk,
concentration risk, credit risk, liquidity risk and market risk (including other price risk, currency risk
and interest rate risk). The level of risk to which each Fund is exposed to depends on the investment
objective and the type of investments the Fund holds. The value of investments within a portfolio can
fluctuate daily as a result of changes in prevailing interest rates, economic and market conditions,
political changes, global pandemics and company specific news related to investments held by the
Fund. The Manager of the Funds may minimize potential adverse effects of these risks on the Funds’
performance by, but not limited to, regular monitoring of the Funds’ positions and market events,
diversification of the investment portfolio by asset type, country, sector, term to maturity within
the constraints of the stated objectives, and through the usage of derivatives to hedge certain risk
exposures.
Leverage and short selling risk
When a Fund makes investments in derivatives, borrows cash for investment purposes, or uses
physical short sales on equities or other portfolio assets, leverage may be introduced into the Fund.
Leverage occurs when the Fund’s notional exposure to underlying assets is greater than the amount
invested. It is an investment technique the magnifies gains and losses. Consequently, any adverse
change in the value or level of the underlying asset, rate or index may amplify losses compared to
those that would have been incurred if the underlying asset had been directly held by the Fund and
may result in losses greater than the amount invested in the derivative itself. Leverage may increase
volatility, may impair the Fund’s liquidity and may cause the Fund to liquidate positions at unfavorable
times.
To achieve its investment objective the CI Investment Grade Bond Fund exercise leverage through
participating in short selling transactions.
The Fund may borrow cash up to a maximum of 20% of the Fund’s net assets and may sell securities
short, whereby the aggregate market value of securities sold short will be limited to 20% of the Fund’s
net assets. The combined use of short selling and cash borrowing by the Fund is subject to an overall
limit of 20% of the Fund’s net assets.
During the period ended September 30, 2021, the lowest aggregated fair value amount of the leverage
exercised by the Fund was $0.0 million (0.0% of net assets), (March 31, 2021 - $4.6 million, 0.5% of
net assets) and the highest aggregated fair value amount of the leverage used during the period was
$0.0 million (0.0% of net assets), (March 31, 2021 - $6.9 million, 0.7% of net assets).
Concentration risk
Concentration risk arises as a result of the concentration of exposures within the same category,
whether it is a geographical allocation, asset type, industry sector or counterparty.
Details of each Fund’s exposure to concentration risk are available in the Fund Specific Notes to
Financial Statements of each of the Funds.
Credit risk
Credit risk is the risk that a security issuer or counterparty to a financial instrument will fail to meet
its financial obligations. The fair value of a debt instrument includes consideration for the credit
worthiness of the debt issuer. The carrying amount of debt instruments as shown on the Schedule
of Investment Portfolio represents the credit risk exposure of each Fund. Credit risk exposure for
derivative instruments is based on each Fund’s unrealized gain on the contractual obligations with the
counterparty as at the reporting date. The credit rating of a counterparty to a derivative instrument is
disclosed in Schedule of Investment Portfolio or in Fund Specific Notes to Financial Statements of each
Fund, if applicable. The credit risk exposure of the Fund’s other assets is represented by their carrying
amount as disclosed in the Statements of Financial Position.
The Funds that only invest in units/shares of underlying fund(s) and may be exposed to indirect
credit risk in the event that the underlying fund(s) invest in debt instruments, preferred securities
and derivatives.
Credit ratings for debt securities, preferred securities and derivative instruments are obtained from
S&P Global Ratings, where available, otherwise ratings are obtained from: Moody’s Investors Service
or Dominion Bond Rating Service, respectively.

CI Mutual Funds
Semi-Annual Financial Statements - September 30, 2021 – 276 –
Notes to the Financial Statements (unaudited) (cont’d)
Credit ratings can be either long-term or short-term. Short-term credit ratings are generally assigned
to those obligations and derivative instruments considered short-term in nature. The table below
provides a cross-reference between the long-term credit ratings disclosed in the Credit Rating table
inclusive of the short-term credit ratings disclosed in the derivatives schedules in the Schedule of
Investment Portfolio.
Credit Rating as per Credit Risk Table Credit Rating as per Derivative Schedules
AAA/Aaa/A++ A-1+
AA/Aa/A+ A-1, A-2, A-3
A B, B-1
BBB/Baa/B++ B-2
BB/Ba/B+ B-3
B C
CCC/Caa/C++ -
CC/Ca/C+ -
C and Lower D
Not Rated WR
Cash balances, with exception of restricted cash balances and margin accounts, as disclosed in the
Statements of Financial Position are maintained by the Custodians. The Manager monitors the credit
worthiness of the Custodians on a regular basis. As at September 30, 2021, the credit rating of the
RBC Investor Services Trust was AA- (March 31, 2021 – AA-and the credit rating of the CIBC Mellon
Trust Company was A-1).
All transactions executed by a Fund in listed securities are settled/paid for upon delivery using
approved brokers. The risk of default is considered minimal, as delivery of securities sold is only made
once the broker has received payment. Payment is made on a purchase once the securities have been
received by the broker. The trade will fail if either party fails to meet its obligation.
Liquidity risk
Liquidity risk is the risk that a Fund may not be able to settle or meet its obligations, on time or at
a reasonable price. The Funds are exposed to daily cash redemption of redeemable units. Therefore,
the Funds invest the majority of their assets in investments that are traded in active markets and can
be readily disposed of. In addition, the Funds retain sufficient cash and cash equivalents positions to
maintain liquidity. From time to time, the Funds may enter into derivative contracts or invest in unlisted
securities that may not trade in an organized market and may be illiquid. All financial liabilities are
due within three months.
Market risk
The Funds’ investments are subject to market risk which is the risk that the fair value of future cash
flows of a financial instrument will fluctuate due to changes in market conditions.
Other price risk
Other price risk is the risk that the value of financial instruments will fluctuate as a result of
changes in market prices (other than those arising from currency risk or interest rate risk). The
value of each investment is influenced by the outlook of the issuer and by general economic and
political conditions, as well as industry and market trends. All securities present a risk of loss of
capital. Except for options written, future contracts sold short and investments sold short, the
maximum risk resulting from financial instruments is equivalent to their fair value. On written call
options, short future positions and on equity and debt sold short, the maximum loss of capital can
be unlimited.
Other assets and liabilities are monetary items that are short-term in nature and therefore are not
subject to significant other price risk.
Currency risk
Currency risk arises from financial instruments that are denominated in a currency other than the
functional currency of the Funds. As a result, the Funds may be exposed to the risk that the value
of securities denominated in other currencies will fluctuate due to changes in exchange rates.
The Schedule of Investment Portfolio identifies all bonds and derivative instruments denominated
in foreign currencies. Equities traded in foreign markets are also exposed to currency risk as
the prices denominated in foreign currencies are converted to the Funds’ functional currency to
determine their fair value.
The Funds that only invest in units/shares of underlying fund(s) and may be exposed to indirect
currency risk in the event that the underlying fund(s) invest in financial instruments that are
denominated in a currency other than the functional currency of the Fund.
Interest rate risk
Interest rate risk is the risk that the fair value of interest-bearing investments will fluctuate due to
changes in prevailing levels of market interest rates. As a result, the value of the Funds that invest
in debt securities and/or income trusts will be affected by changes in applicable interest rates.
If interest rates fall, the fair value of existing debt securities may increase due to the increase in
yield. Alternatively, if interest rates rise, the yield of existing debt securities may decrease which
may then lead to a decrease in their fair value. The magnitude of the decline will generally be
greater for long-term debt securities than for short-term debt securities.
Interest rate risk also applies to Funds that invest in convertible securities. The fair value of these
securities varies inversely with interest rates, similar to other debt securities. However, since they
may be converted into common units, convertible securities are generally less affected by interest
rate fluctuations than other debt securities.
The Funds that only invest in units/shares of underlying fund(s) and may be exposed to indirect
interest rate risk in the event that the underlying fund(s) invest in interest bearing financial
instruments.
Fair value hierarchy
The Funds are required to classify financial instruments measured at fair value using a fair value
hierarchy. Investments whose values are based on quoted market prices in active markets are
classified as Level 1. This Level includes publicly traded equities, exchange-traded and retail mutual
funds, exchange-traded warrants, futures contracts and traded options.
Financial instruments that trade in markets that are not considered to be active but are valued based
on quoted market prices, dealer quotations or alternative pricing sources supported by observable
inputs are classified as Level 2. These include fixed income securities, mortgage-backed securities,
short-term instruments, non-traded warrants, over-the-counter options, structured notes of indexed
securities, foreign currency forward contracts, swap instruments, American depositary receipts and
Global depositary receipts, if quoted market price is not available.
Investments classified as Level 3 have significant unobservable inputs. Level 3 instruments include
private equities, private term-loans, private equity funds and certain derivatives. As observable prices
are not available for these securities, the Funds may use a variety of valuation techniques to derive
the fair value.

CI Mutual Funds
Semi-Annual Financial Statements - September 30, 2021 – 277 –
Notes to the Financial Statements (unaudited) (cont’d)
The Funds’ policy is to recognize transfers into and out of the fair value hierarchy levels as of the date
of the event or change in circumstances giving rise to the transfer.
Details of each Fund’s exposure to financial instruments risks including concentration risk and fair
value hierarchy classification are available in the Fund Specific Notes to Financial Statements for
each Fund.

Semi-Annual Financial Statements - September 30, 2021 – 278 –
SEND TO DAVIA WANG - FOR REVIEW AND SIGN OFF - EACH QUARTER
Certain names, words, phrases, graphics or designs in this document may constitute trade names,
registered or unregistered trademarks or service marks of CI Global Asset Management. CI Funds,
CI Financial, CI Investments and CI Investments design are registered trademarks of CI Global
Asset Management. The CI and CI Icon logo trademarks and names are owned by CI Global Asset
Management and used under license. CI Global Asset Management is a registered business name
of CI Investments Inc.
You can get additional copies of these Financial Statements at your request, and at no cost, by calling
1-800-792-9355, by emailing [email protected] or by asking your representative.
This document, and other information about the Funds, is available at www.firstasset.com and/or
www.ci.com or at www.sedar.com.
Legal Notice

SA_E 11/21For more information, please visit www.firstasset.com and/or www.ci.com.