determinants of financial statements' format
TRANSCRIPT
WHY DO YOU SPEAK ENGLISH (IN YOUR ANNUAL REPORT)?
Thomas Jeanjean1, Cédric Lesage1 and Hervé Stolowy1 1Department of Accounting and Management Control, HEC School of Management, Paris, France
Correspondence: Professor H. Stolowy, Department of Accounting and Management Control,
HEC School of Management, Paris, 1, rue de la Libération, 78351, Jouy-en-Josas, France.
Tél: + 33 1 39 67 94 42;
Fax: + 33 1 39 67 70 86;
E-mail: [email protected]
Acknowledgments The authors are grateful to Infinancials (www.infinancials.com) for having extracted the data on annual report for the purpose of this study. The authors are members of the GREGHEC, CNRS unit, UMR 2959.
1
WHY DO YOU SPEAK ENGLISH (IN YOUR ANNUAL REPORT)?
Abstract
The dominance of English as a lingua franca in international business is commonly accepted
as a fact (Chang et al., 1983; House, 2002). If previous research has documented the
consequences of using English within firms, little is known on the use of English as the
financial reporting language in non-English speaking countries. However, using English
rather than a local language may have some economic consequences in terms of ability to
raise funds, analyst monitoring and the understandability of financial statements by market
participants. In this study we analyze the factors associated with the use of English as the
reporting language in the annual report in non-English speaking countries. Using a sample of
4,383 firms from 27 countries in 2004, we find that almost 50% of the sample-firms use
English as their external reporting language. The use of English in the annual report increases
with size, internationalization of sales, diffusion of ownership structure and need for external
financial resources. These findings are robust to alternative specifications and omitted
variables checks. Taken together, our findings suggest that the use of English in the annual
report in non-English speaking countries is related either to the internationalization process
(via foreign sales) or to financial concerns (via the need for external financing).
2
Introduction
The dominance of English as a lingua franca in international business exchanges is
commonly accepted as a fact. House (2002) explains that the spread of English was first
promoted by the worldwide extension of the British Empire; then by the political and
economic influence of the USA, the development of modern information and communication
technologies and the growth of international mergers and acquisitions.
Previous research has documented the consequences of using English within firms (e.g.,
Fredriksson et al., 2006). For instance, Barner-Rasmussen and Björkman (2005) look at the
use (or non-use) of a common corporate language in international management processes.
However, to the best of our knowledge, no prior work investigated the use of English for
external communication purposes. This study aims at filling this gap by investigating the
determinants of the use of English as the annual report language for firms from non-English
speaking countries. Annual reports are an important way for companies to communicate both
past events and plans for the future to investors and analysts. Chang et al. (1983) confirm that
financial statements and the annual report are important for investment decisions in various
countries.
We believe that it is useful to understand factors associated with the choice of English as
the financial reporting language because it may have economic consequences. First, the
language of annual report is a crucial ingredient of financial information comparability.
Proponents of accounting harmonization argue that common standards will enhance the
comparability of financial statements, improve corporate transparency, and increase the
quality of financial reporting (Ball, 2006). For instance, as early as 1985, Doupnik and Taylor
(1985, 27) pointed out that “differences in accounting practices among countries impede the
flow of capital across borders necessary for the optimal allocation of scarce resources
worldwide”. Accounting harmonization has certainly intensified over the last years with the
European Union’s adoption of IAS/IFRS from 2005 and the SEC acceptance in November
2007 of non-reconciliation to US GAAP for financial statements prepared in accordance with
IAS/IFRS. This association between accounting harmonization and an increased
comparability of financial statements relies on the assumption that market participants are
able to read and understand any set of financial statements as long as they are governed by the
same accounting rules. However, there is another implicit assumption: that all market
participants are able to understand the language used in the annual report, which supposes that
the annual report is in English. This is consistent with Dhir (2005, 358), who studies the
3
“value of language” and acknowledges that “with increased globalization of trade and
business in a knowledge-based economy, the use of an appropriate language has become
increasingly critical for the acquisition of competitive advantage” and reminds that
“economists and the decision analysts regard a language as an asset” and “seek use language
to create economic value” (2005, 374).
Second, the annual report language may explain, in part, the home bias phenomenon. It is
widely recognized that investors benefit from cross-border diversification (Sharpe, 1964;
Lintner, 1965). However, prior research finds that investors tend to allocate a
disproportionately large fraction of their capital to domestic equities, a phenomenon
commonly referred to as “home bias” (Dahlquist et al., 2003; Karolyi & Stulz, 2003). The
term bias suggests that investors are irrational when they eschew the potential gains to
diversification. But the underweighting of foreign assets may well be due to rational reasons.
Past research suggest that high information costs are an important factor helping to explain
home bias (Kang & Stulz, 1997; Ahearne et al., 2004; Chan et al., 2005): investors only hold
stocks that they know. For example, Kang and Stulz (1997) document that U.S. investors
make greater investments in Japanese firms that are larger and have more export sales,
characteristics that are likely to reduce information costs. This study and others (Coval &
Moskowitz, 1999; Portes & Rey, 1999) suggest that asymmetric information between local
and non-local investors may be an important factor for investment decisions and may thus
explain home bias. Covrig, DeFond and Hung (2007)’s findings are consistent with voluntary
IAS adoption reducing home bias among foreign investors and thereby improving capital
allocation efficiency. However, if IAS home bias can be reduced through the adoption of IAS,
it is not annihilated. This suggests that other information costs, beyond accounting rules, may
explain investment bias. We argue that the language used by firms for their corporate reports
is a potential candidate.
Finally, the annual report language may also be associated with the efficiency of analysts.
Based on a sample of European financial analysts, Sonney (Forthcoming) finds that analysts
specialized by country outperform industry specialists in terms of forecast accuracy. One
explanation for this finding is that country-specialized analysts benefit from “informational
advantages due to proximity, a good knowledge of country-specific factors such as culture,
language, fiscal policies, and accounting rules”. Past research has shown that analyst coverage
is associated with positive outcome at least in the most financially developed countries
(Degeorge et al., 2004; Yu, forthcoming). Given that accounting rules are now largely
4
harmonized in Europe, it seems that language is an important factor to explain analyst
performance.
From a sample of annual reports for 2004 published by 4,383 non-financial companies
listed in non-English speaking countries, we observe that 47.9% publish their annual reports
both in their local language and in English. We find that the use of English in the annual
report in related to firm-specific factors as well as country factors. Large firms, with diffuse
ownership, enjoying a high degree of sales’ internationalization, and large external financing
needs (proxied by return, growth opportunities, and leverage ratio) tend to communicate their
annual report in English. Country’s cultural factors, proxied by the main country religion (as
in Stulz & Williamson, 2003), and economic factors, proxied by the size of equity markets,
also influence the use of English as a reporting language in the annual reports. We also
analyze the change from a local to English language and vice-versa, using the firm-specific
determinants. The same factors explain the change.
To the best of our knowledge, this is the first study that empirically analyzes the
determinants of the decision of companies in non-English speaking countries to publish an
English-language version of their annual report1. The use of English as external reporting
language may have implications in terms of fund raising. According to Choi (1991, p. 106),
“firms [that attempt] to raise funds abroad at reasonable costs face the choice of how much
they wish to accommodate the information needs of investors who are used to providing
capital on the basis of reports prepared according to local accounting and reporting norms. In
attempting to court investors who may be less tolerant of accounting differences, management
can opt to provide foreign readers with 1) accounts that have been restated to the accounting
principles of the reader’s country-of-domicile, 2) additional disclosure, 3) enhanced audits, or
any combination of the above”. In addition to these three approaches (or any approach
combining two or all of them), our study provides some empirical evidence on a fourth
possible way of making the disclosed financial information more “decision relevant” (a term
developed by Choi (1991)): reporting an English annual report. Our study also shows that the
annual report language is a mean to manage agency costs. The association between the
diffusion of ownership structure and the choice of English in the annual report illustrates the
importance of studying the channels through which agents (managers) can communicate to
principals (shareholders) about their financial performance.
The rest of the paper is organized as follows. In the two following sections, we provide
some background on annual report language and develop our hypotheses. We then present our
5
sample and research design, followed by our empirical findings. Finally, we conclude the
paper and provide directions for future research.
Annual report research: Some background
While the use of a common corporate language within multinationals has already been
studied, we have not identified any works related to the reasons for the choice of a specific
language for external financial reporting. The annual report being the major tool of external
financial reporting, its readability has been the focus of extensive prior research. The graphics
of the annual reports have also been studied (Moriarity, 1979; Frownfelter-Lohrke &
Fulkerson, 2001). However, there are a very limited number of studies focusing on the
language of the annual report.
The use of a common corporate language within multinationals
In this section, we examine language as a key factor in multinational companies (“MNC”)
management. In the internationalization process, unifying the MNC is commonly recognized
as a major management task, and a challenging one given the diversity of activities, locations
and cultures. In this context, language should be considered as an important issue to create the
“corporate glue”, as it permeates almost every aspect of the MCN business activities
(Marschan et al., 1997). Two research streams have focused on questions associated with a
common language in the corporate context (Fredriksson et al., 2006): one in international
management and the other in international business communication. Both focus on the use of
English as a common corporate language.
Research in international management has tended to look at the use (or non-use) of a
common corporate language in international management processes (Feely & Harzing, 2003;
Barner-Rasmussen & Björkman, 2005; Piekkari & Zander, 2005). Much of this work is
concerned with language proficiency and its implications for social exclusion/inclusion,
communication, and power and control in headquarters-subsidiary and inter-subsidiary
relationships within the MNC. For instance, in a field study on Kone, Marschan et al. (1997)
demonstrate the pervasive impact of language by identifying many different individual
behaviors towards language constraints. Given the prominent role of English in international
business, it is not surprising that many companies opt for English as their common corporate
language. Therefore, the second research stream (international business communication) has
more focused on English as a lingua franca on internal purposes. With a close perspective to
6
international management, the role of English in the internal communication of MNC has
been studied (Louhiala-Salminen et al., 2005).
Overall, literature on the use of an internal common corporate language (and more precisely
English) demonstrates that language appears to be an even more important factor, as a shared
company language is a common tool used not only for formal internal reporting but as part of
the general process of communication/coordination at all levels throughout the global
corporation. However, such language standardization does not necessarily ensure that
meaningful formal and informal communication occurs (Marschan et al., 1997): the choice of
a common language does not seem to be as obvious as it could appear at first sight.
It should be noticed that very few studies have investigated the language use in external
relationships. We have found some works in sales negotiations (Planken, 2005) or distributor
meetings (Poncini, 2003), but nothing on external financial reporting.
Annual report’s readability
Flesch (1943, 1948) initiates a significant research stream in the area of texts’ readability. He
proposes a formula, namely based on the average sentence length, which was aimed at
measuring and predicting readability. Numerous measures have been designed since then, in
particular the Dale and Chall Index (1948a, 1948b), which uses the average sentence length
(in words) and the number of unfamiliar words, the WORDS measure (Frazier et al., 1984),
the CLOZE procedure (Taylor, 1953; Adelberg & Razek, 1984), the FOG index (Gunning,
1968) and the LIX index (Anderson, 1983) (see Smith & Smith, 1971; Jones & Shoemaker,
1994; Courtis, 1995, for a review). Since 1952, these measures have been applied to many
documents, including annual reports, and in various countries (Pashalian & Crissy, 1952;
Soper & Dolphin Jr, 1964; Smith & Smith, 1971; Barnett & Leoffler, 1979; Jones, 1988;
Smith & Taffler, 1992)2.
After having studied the readability per se, several researchers have been interested in the
consequences of the annual report’s readability: corporate risk and return levels (Courtis,
1986), financial performance (Baker & Kare, 1992; Subramanian et al., 1993), effect on
decision-making (Smith & Taffler, 1995).
Some researchers have even raised the possibility of an obfuscation hypothesis (emphasis
on good news and obfuscation of bad news) (Adelberg, 1979; Courtis, 1998; Clatworthy &
Jones, 2001).
7
The publication of an English language version of the annual report
There is a limited number of studies focusing on the English-language version of the annual
report or on bilingual studies of the annual report. However, these few studies show that the
choice of a given language for financial reporting is not neutral. Campbell et al. (2005)
explore the issue of content analysis of voluntary disclosures in an international comparative
context. They work on the determination of the validity of volumetric comparison by
recording word and sentence counts using both German and English translations of
disclosures published by the German companies themselves. This study has two main
outcomes. First, it finds that the English rendering of German environmental narrative, the
specific topic covered by the research, is generally accurate (suggesting that companies do not
discriminate by reporting jurisdiction). Second, the study concludes that German–English
comparative international volumetric content analyses should be carried out using same
language versions where possible due to differences in syntactic and textual renderings in the
two languages yielding unrepresentative volumetric separation statistics.
Courtis (1995) examines the readability of the English sections of Hong Kong annual
reports. Hong Kong is especially suitable as a region of study because of its high profile as an
important commercial and financial centre of the world. A priori, one would therefore expect
public companies to make a special effort in writing English prose which is easy to read.
However, the study shows that selected prose passages within Hong Kong annual reports are
classified as very difficult-to-read literature. These results are consistent with the article of
Courtis and Hassan (2002) who have carried a bilingual readability study reporting on
different language versions of narrative disclosures within annual reports. They compare the
English and Chinese versions for Hong-Kong firms and English and Malay versions for
Malaysian firms. Results provide some tentative impression that the indigenous language
version is easier to read than the English-written counterparts. In addition, evidence suggested
that the English passages in Malaysian annual reports are easier to read than the English
passages in Hong Kong annual reports. Taken overall, the results suggest that different
language versions could produce different reading behavior and may have resource allocation
decision-making implications.
Hypothesis development
As mentioned in the previous section, there are no previous studies analyzing the features of
firms deciding to publish an English annual report. This study is exploratory in nature. In this
8
section, since we consider the publication of an English-language version as a signal of
internationalization in a firm’s financial communication, we will refer to the literature on
corporate internationalization to identify the features of firms more likely to adopt such
practices.
The previous literature shows that in order to internationalize, “firms must possess superior
assets and skills that can earn economic rents that are high enough to counter the higher cost
of servicing these markets. A firm’s asset power is reflected by its size and multinational
experience, and skills by its ability to develop differentiated products” (Agarwal &
Ramaswami, 1992, 4). In our particular case of the publication of an English annual report,
our general hypothesis is based on Choi’s (1991) theory, referred to earlier, on how
multinationals could handle the problem of international accounting differences in order to
better serve foreign users. We assume that if a company located in a non-English speaking
country decides to publish an English annual report, its aim is to make its annual report more
accessible to English speakers.
Size
In this study, the publication of an English annual report is regarded as a signal that firms are
devoting extra effort to internationalize their financial communication. Firms need asset
power to engage in international expansion and the size of the firm reflects its capability for
absorption of the internationalization costs (Agarwal & Ramaswami, 1992). In his study on
more than 14,000 Canadian manufacturers, Calof (1994) indicates that firm size is positively
related to the degree of firm internationalization. The same results are also found in Nadkarni
and Perez’s study (2007). Furthermore, Bonaccorsi develops a more theoretical analysis on
the obstacles preventing small firms becoming more international: limited resources, lack of
scale economies and high risk perception in international activity (1985). Another reason can
be derived from Dumontier and Raffournier (1998) who refer to Singhvi and Desai (1971):
disclosing alternative (i.e., “different” or “unusual”) information is costly in general, but less
costly for large firms.
The first hypothesis is therefore as follows:
H1: The publication of an English annual report is positively related to size.
Degree of sales internationalization
According to Choi (1991), business internationalization leads the firm into a faster-changing
and more competitive context. Raffournier (1995) states that companies are induced to
9
comply with the usual practices of countries in which they operate. “The more international
the operations of a firm, the larger is the inducement” (1995, p. 266).
Many previous studies in international business use international sales as an indicator for
the degree of internationalization of a firm (Sullivan, 1994). We think that companies with
international sales will be more inclined to publish an English annual report, which as noted
above is “more international”. This is consistent with the signaling theory, which is supported
by Dumontier and Raffournier (1998) who explain that because they are more visible on
foreign markets, firms which operate internationally may have an interest in preparing
financial statements which can easily be understood by local customers, suppliers and
governments. This leads to the following hypothesis:
H2: The publication of an English annual report is positively related to the degree of sales
internationalization.
Ownership concentration
Ownership concentration refers to the extent to which a small number of shareholders own a
large proportion of share capital. According to Macharzina (1992), “reporting practices are
heavily influenced by the ownership patterns of companies”. In case of diffuse ownership,
with no major shareholder, we can assume the presence of institutional shareholders such as
pension funds. These shareholders might be tempted to require a more “international”
reporting with an English annual report. Conversely, a concentrated ownership may be
satisfied with an internal reporting and the publication of an English annual report would not
be necessary. In the same vein, Ang et al. (2000) have provided evidence that agency costs are
inversely related to the manager’s ownership share and increase with the number of
nonmanager shareholders. Although not dealing specifically with ownership concentration,
we could infer from these results that companies with diffuse ownership will try to reduce
information risk and agency cost and are more likely to publish an English annual report. On
this basis, our next hypothesis is as follows:
H3: The publication of an English annual report is negatively related to the ownership
concentration.
10
External financing needs
In this section, we analyze the firm-specific factors that capture the external financing
needs of firms that influence the use of English in their annual report. Given that most
institutional investors are Anglo-Saxon and U.K. or U.S. based, we predict that
communicating in English helps firms to raise funds. The firm-based characteristics proxies
used to measure external financing needs incentives are: (1) profitability, (2) expected future
growth opportunities and (3) the leverage ratio.
All other things being equal, a highly profitable firm generates large free cash flows. This
in turn lowers the need for external financing and the need for English in the annual report.
Moreover, for profitable firms, communicating in English is less necessary to raise funds as
their financial performance should attract investors.
H4a: The publication of an English annual report is negatively related to return on assets.
Prior research has divided firm value into two components (Myers, 1977): the assets-in-
place, which are valued independently of the firm’s future investment opportunities, and the
growth options, which are valued on the basis of the firm’s future investment decisions. Given
that the value of growth options depends on further discretionary expenditures by managers,
the value of growth options is subject to far more uncertainty than the value of assets-in-place.
Myers (1977) notes that firms with abundant growth opportunities are more likely to be in
need of external financing to fund the current and future profitable projects. The use of
English rather than local language may ease the raising of funds by enlarging the base of
potential investors:
H4b: The publication of an English annual report is positively related to growth
opportunities.
Myers and Majluf (1984) show that firms may refuse to issue stock, and therefore may pass
up valuable investment opportunities. Their findings are based on the assumptions that
managers (1) know more about the firm’s value than potential investors, (2) act in the interest
of existing shareholders, (3) investors interpret the firm’s actions rationally. This model
implies that highly leveraged firms will not seek equity external financing. As we expect that
the use of English as the reporting language is linked to the desire to raise equity, we can state
the following hypothesis:
11
H4c: The publication of an English annual report is negatively related to leverage.
Capital market size
When the local capital market is important, companies do not need to search for investors
outside of their home country. Conversely, if the local capital market is not developed,
companies may be tempted to search for foreign listing and may then publish an English
annual report. We therefore include the following hypothesis:
H5: The publication of an English annual report is negatively related to the capital market
size.
Religion
Stulz and Williamson (2003) proxy cultural differences with religion. They find that
differences in religion explain why investor protection differs across countries. We can also
relate religion to the publication of an English annual report. For example, these authors find
that creditor rights are stronger in countries where the main religion is Protestant rather than
Catholic. We could then assume that Protestant countries do not need to publish an English
annual report whereas Catholic do, to compensate the weakness of the investor protection.
However, as recalled by Stulz and Williamson (2003, p. 320), “religion has played a role in
the transmission of innovations too. The greater tolerance in England of religious minorities
late in the 17th century partly explains why England was such a hotbed of financial
innovation”. From this idea, we could assume that Protestant countries, more open to financial
innovation, are more willing to attract investors and consequently decide more often to
publish an English annual report.
It results from this brief discussion that the direction of the relationship between religion
and the publication of an English annual report is not clear. Consequently, we can state the
following non-directional hypothesis:
H6: The publication of an English annual report is related to the religion, although the
direction of the relationship will depend on the nature of the religion.
12
Control Variables:
Economic Sector
Extant international business research shows that the decision to internationalize is often
industry-specific (Kotha et al., 2001). Especially since the competition between firms varies
considerably from one industry to another, firms in different sectors may position themselves
differently against their competitors (Mascarenhas, 1986).
This leads us to believe that the sector can influence the decision to publish an English
annual report, even if only due to mimicry, but we have no prediction regarding the type of
influence. We will therefore include the economic sector as a control variable3.
Country
In the specifications where we only include firm-level variables, we can also include the
country as control variable.
Sample and research design
Sample
Our basic sample comprises all companies in the Infinancials database4 with the annual report
available in 2003 and 2004. We voluntarily chose to limit the period of study to 2004 because
the implementation of IFRS in 2005 in several countries of our sample may have created a
confounding effect. It is likely that by adopting IFRS some firms also adopted English for
reporting purposes. To avoid this artificial increase in the use of English in the annual report
due to IFRS adoption, we collected data only for 2003 and 2004.
From this initial sample, we first excluded the financial, insurance and real estate
companies, as their account formats are very different from those of the industrial and
commercial companies. Second, we deleted all companies from English-speaking countries,
where obviously, our research question is not relevant, and also many countries with zero or
only one company with annual report in local language. (These companies are often from
countries where the British influence has been historically important, e.g., Pakistan or where
the English language is very much practiced). This yields a sample of 4,383 companies with
annual report data available in 2004 and 4,630 companies in 2003.
Finally, we faced several data availability problems. First, as Raffournier (1995), we lost
data because the breakdown of sales by geographical area is not always disclosed and,
consequently, not included in Infinancials, our main source for this data. Second, a similar
issue arose for ownership concentration. Third, other financial variables are not available for
all firms, either in Infinancials or in Global, our secondary source. This yields a final sample
13
of 1,884 observations for 2004 and 1,966 observations for 2003. Details of determination of
the final sample are shown in table 1.
Insert Table 1 about here
Research design
This study seeks to explain the choice made by firms as to the annual report language. As the
outcome is categorical (publication of an annual report in English or not), the binary logistic
regression model can be used for our statistical analysis. We will use a basic model with firm-
level data, and control variables including the country.
∑∑ +++
+++
++=
=−
=
kk
jj ountryC sectorEconomiceverageL
iesopportunit GrowtheturnRionconcentrat Ownership
salesnalInternatioSizeAR English
AR EnglishLog
,8,76
543
210)1Pr(1)1Pr(
ααα
ααα
ααα
(1)
However, we have developed some hypotheses related to country-level data. We will
include these variables in a second model, but not the control variable for the country,
because of multicollinearity.
∑∑ ++++
+++
++=
=−
=
kk
jj sectorEconomicReligion sizeMarketeverageL
iesopportunit GrowtheturnRionconcentrat Ownership
salesnalInternatioSizeAR English
AR EnglishLog
,9,876
543
210)1Pr(1)1Pr(
αααα
ααα
ααα
(2)
The variables, proxies used for their computation and predicted signs are presented in table 2.
Insert Table 2 about here
Empirical findings
Descriptive statistics
We present in Table 3, Panel A, the descriptive statistics on the dependent variable, English
AR, by country, for the year 2004 and in Panel B the equivalent data for year 2003.
14
Insert Table 3 about here
47.9% of the companies in our sample have issued a report in English in 2004 (48.9% in
2003). It could be noticed that some countries tend to report significantly more in English,
mainly the Nordic countries (Denmark, Finland, Norway, Sweden) or other countries like
Switzerland, or Israel. Conversely, some countries use their local language to communicate in
the annual report like in South America (Argentina, Brazil, Chile, Peru) and some Asian
countries (Japan, Taiwan).
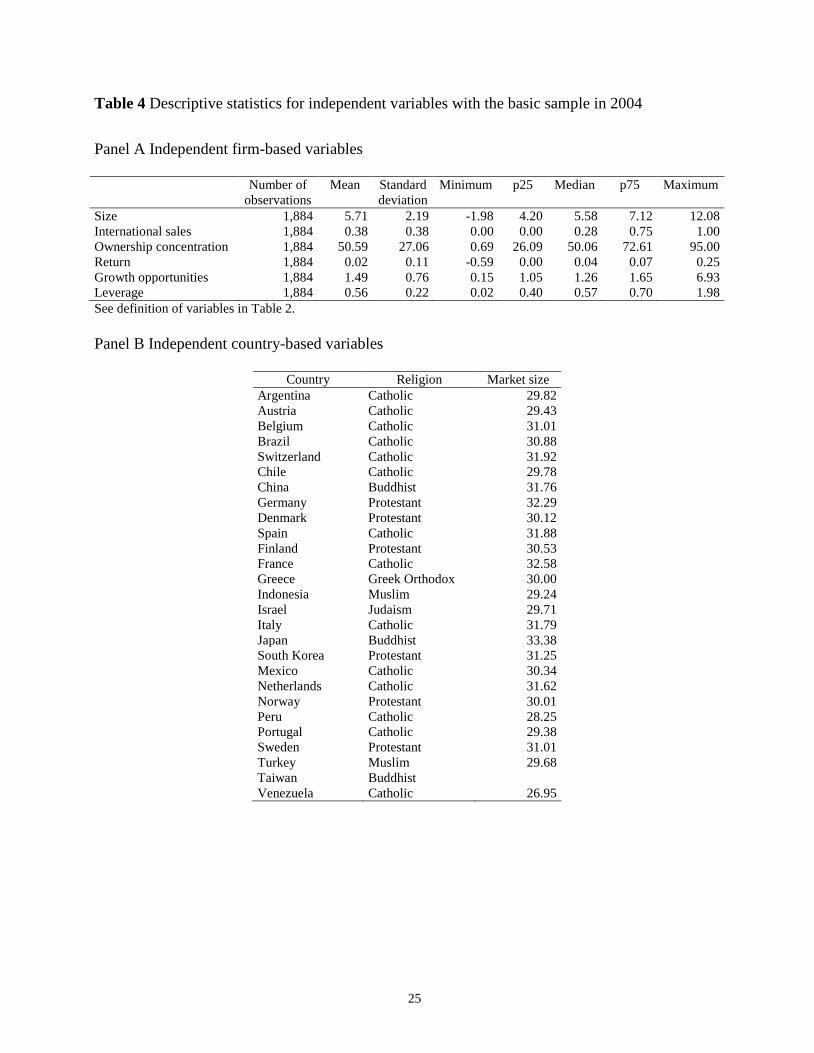
In Table 4, we present descriptive statistics on the independent variables for the basic sample
in 2004. We split the variables into two panels: firm-based variables (Panel A) and country-
based variables (Panel B).
Insert Table 4 about here
Descriptive statistics for our sample are consistent with figures reported in previous research.
For instance the variable international sale (% of international sales into total sales) in Table
4 exhibits a mean of 38% and a median of 28%, as compared with the 36% of average in
Sullivan’s sample (1994, p. 334).
Our descriptive statistics for ownership concentration are consistent with La Porta et al.
(1998). On average (median) the three main shareholders owns 50.59% (50.06%) of the
shares versus 47% (51%) in La Porta et al. (1998). Note however that our statistics are based
on the ownership structure of all sampled firms (when available) whereas La Porta et al.
(1998) only provide the median percentage of common shares owned by the largest three
shareholders in the ten largest privately owned non-financial firms.
Besides other variables cover a wide range, which illustrates the diversity of companies
selected in our sample. For instance variable leverage (resp. variable growth opportunities)
exhibits a range from 0.00 (resp. 0.02) to 1.98 (resp. 6.93), with a mean of 0.56 (resp. 1.49).
Panel B exhibits the predominance in our 27-country sample of catholic countries (14),
followed by protestant (6), buddhist (3), muslim (2), jewish (1) and greek orthodox (1).
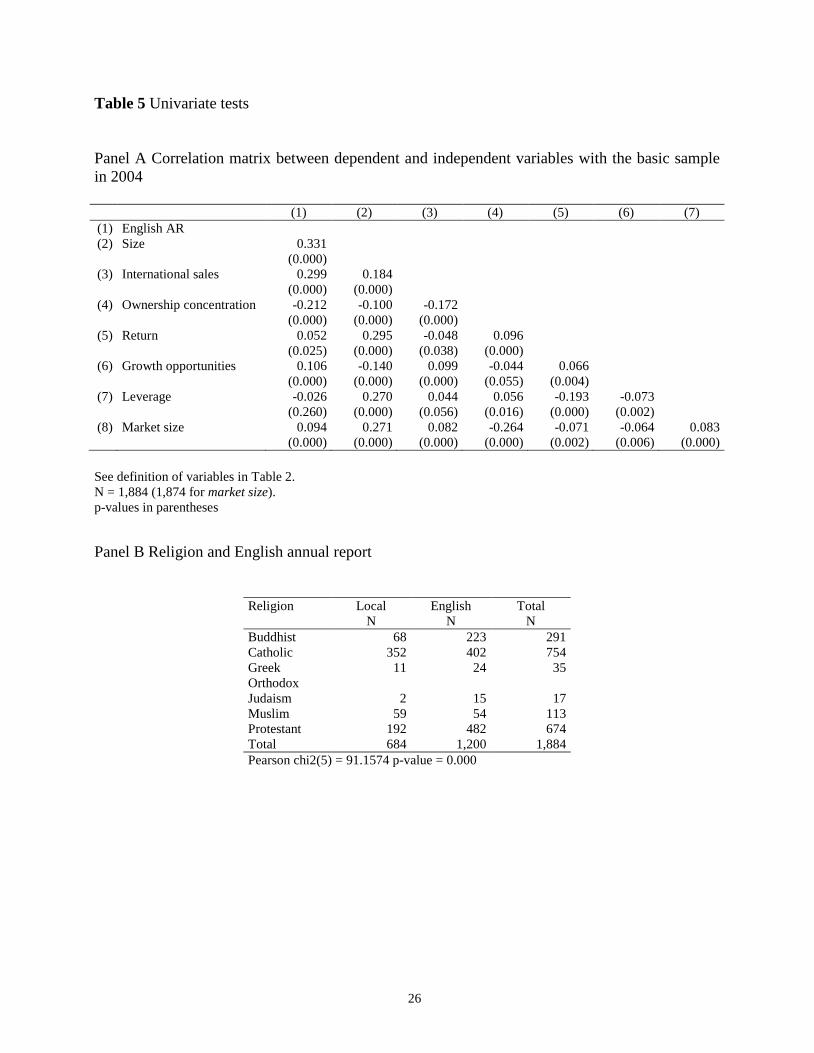
Univariate tests
In Table 5, Panel A, we present a correlation matrix in the basic sample with the independent
variable, the firm-based dependent variables and the numerical country-based variable.
Insert Table 5 about here
This matrix shows that the independent variable (English AR) is positively and
significantly (at the 0.01 level) correlated with size, international sales, growth opportunities
15
and market size and negatively and significantly (at the 0.01 level) correlated with ownership
concentration. English AR is also positively and significantly (although at the 0.05 level)
correlated with return. The direction of the correlation is consistent with our hypotheses, with
the exception of return and market size. However, the correlation coefficients are low. Any
conclusion should not be drawn before the multivariate analysis.
The independent variables also exhibit some correlation but no significant correlation
coefficient is higher that 27%, which leads to assume no real multicollinearity problem5.
In Panel B, we present a Pearson chi-square test of independence between the religion and
the publication of an English annual report. The result of this test is significant at the 0.01
level, leading to think that religion matters in explaining the publication of an English annual
report.
Multivariate Analysis
Basic analysis
In Table 6, we present the results of our multivariate analysis, based on a logistic regression.
In Panel A, we only include firm-based variables. We display three specifications of the basic
model (1):
- Basic sample
- Extended sample without international sales and ownership concentration
- Basic sample with dummy variables (industry and country).
We present these three specifications so as to maximize sample size (model 2) and the
number of firm-level characteristics (models 1 and 3).
Insert Table 6 about here
We find that all hypotheses are confirmed in the predicted direction (p-value significant at the
0.01 level). Size, international sales and growth opportunities explain positively the decision
to publish an English annual report while ownership concentration, return and leverage have
a negative impact on this decision6.
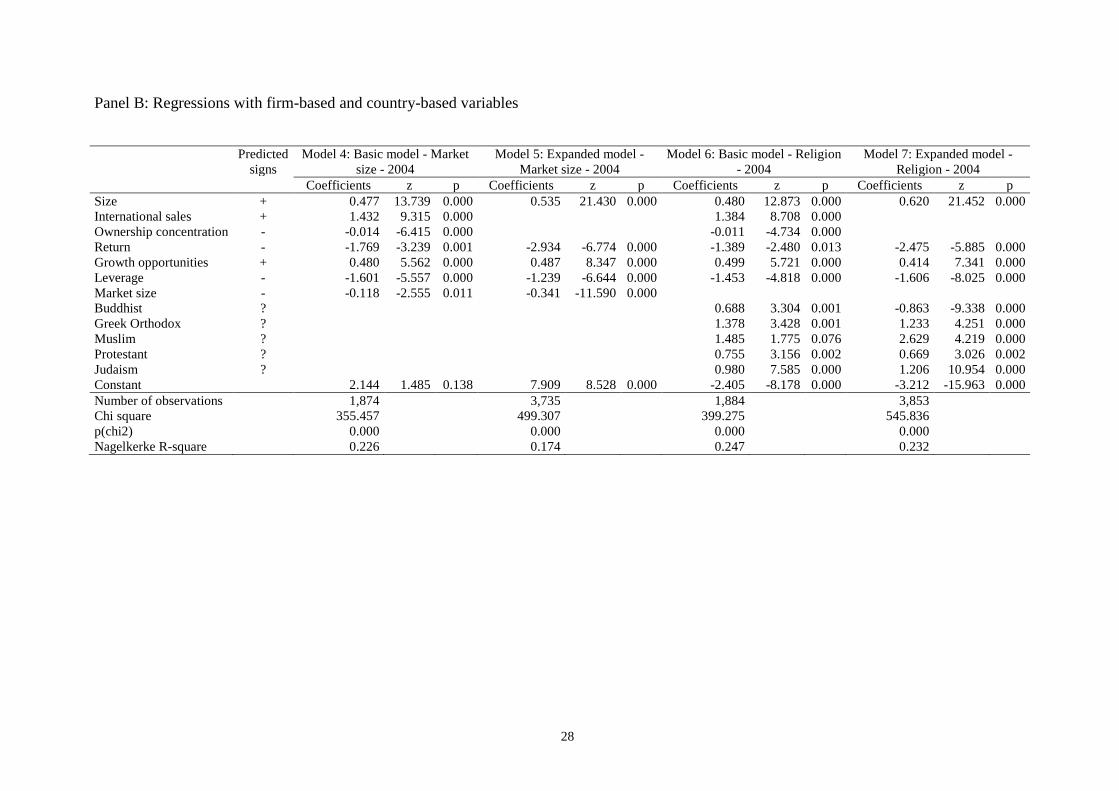
In Table 6, Panel B, we exhibit two alternative7 country-based variables: religion and market
size. We run four specifications:
- Basic sample with religion
- Extended sample with religion and without international sales and ownership
concentration
- Basic sample with market size
16
- Extended sample with market size and without international sales and ownership
concentration.
In addition to the preceding variables, which are all significant in the same directions, capital
market size has, in conformity with the predictions, a negative impact on the decision to
publish an English annual report (significance level between 0.01 and 0.5 across models).
Globally, the coefficients on the different religions are also statistically significant (generally
at the 0.01 level), which shows that religion, a proxy for culture, matters.
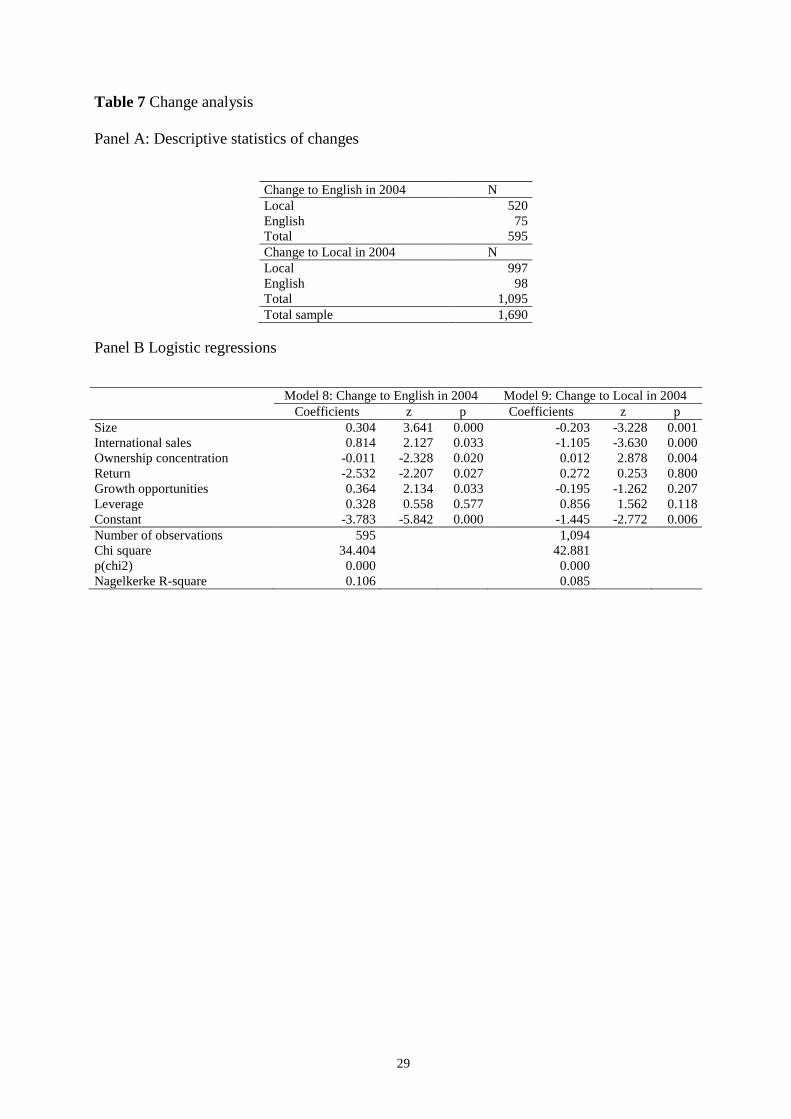
Change analysis
The previous analyses are purely cross-sectional carrying the risk of omitted variables that is
endemic in this line of work. That is why we decided to analyze changes in the use of English
in the annual report rather than the use of English. We carry out a change analysis to
determine the profile of companies which switched from a non-English annual report to an
English one, and vice-versa. We restrict our analysis to companies common the 2003 and
2004 samples (1,690 companies). In Table 7, Panel A, we describe the sample in two parts;
companies which switched from Local to English in 2004 and companies which switched
from English to Local in 2004.
Insert Table 7 about here
The percentage of companies which switched to English (14.4%) is slightly higher than the
corresponding percentage applied to companies which switched to a local language only
(9.8%).
In Table 7, Panel B, we rerun the basic model on the two sub-samples. Model 8 analyzes the
characteristics of firms that switch from Local language only in 2003 to English in 2004
(these observations are coded one) with firms that stayed in local language (observations
coded zero). All coefficients (in significance and sign) are consistent with those reported in
Table 6 with one exception: leverage. Whereas the coefficient on leverage is negative and
significant in Table 6, it does not show up in table 7, model 8. Model 9 compares firms that
switch from English in 2003 to local language in 2004 (observations coded 1) with firms that
published their annual report in English both in 2003 and 2004. Again, sign and significance
levels are consistent with those reported in table 6 only for size, international sales and
ownership concentration. Variables related to financial needs (return, growth opportunities
and leverage) no longer show up. Taken together, these results validate the picture depicted in
17
Table 6 and suggest that the financial needs variables act asymmetrically to explain the use of
English and the stop of using English.
Robustness checks
In order to strengthen our findings, we ran the four additional regressions:
- Basic model (1) in 2003
- Basic model (1) in 2003 without international sales and ownership concentration
- Basic model (1) in 2004 with dummies for industries
- Basic model (1) in 2004 with dummies for countries.
Our untabulated findings show that the main results hold for the change to English. However,
to explain the move to a local-language annual report, only three variables are significant:
size, international sales and ownership concentration.
Conclusion and future research
In this paper, we analyzed the factors associated with the use of English as the reporting
language in the annual report in non-English speaking countries. Using a sample of 4,383
firms from 27 countries in 2004 we find that the use of English in the annual report increases
with size, the internationalization of sales, the diffusion of ownership structure and the need
for financial resources. These findings are robust to alternative specification and omitted
variables checks. Taken together, our findings suggest that the use of English in the annual
report in non English speaking countries is related either to the internationalization process
(via foreign sales) or to financial concerns (via the need for external financing).
A premise for conducting this study is that choosing English rather than another language is
important for firms because it may have some economic consequences, mainly in terms of
ability to raise funds. Communicating in English should help firms from non-English
countries to enlarge their base of potential shareholders as their financial statements would be
more easily understood by investors. Our findings are consistent with the view: firm with
higher financial needs (high growth opportunities firms, less profitable, highly leveraged)
communicate more in English. In the same vein, firms with diffuse ownership, that is: more
likely to welcome institutional investors, use more often English in their annual report.
Future research would be useful to quantify the economic benefits from using English in
the annual reports, for instance by analyzing whether or not companies which publish an
English annual report enjoy greater “international” ownership, or a reduction of their cost of
capital.

18
Notes
1 For the sake of simplicity, we will use the expression “English annual report” in the rest of this paper, to mean the English-language version of the annual report. 2 Clatworthy and Jones (2001) study the effect of thematic structure on the variability of annual report readibility. 3 All hypotheses are summarized in table 2. 4 Available at www.infancials.com. 5 We will check the multicollinearity with the VIF. 6 The VIF measures the degree to which each explanatory variable is explained by the other explanatory variables. Traditionally, collinearity is not considered to be a problem when the VIF does not exceed 10 (Neter et al., 1983). In all our models, the VIFs are lower than this threshold. 7 We cannot include religion and market size in the same model because of the negative and significant correlation between the two variables (p<0.01).
19
References
Adelberg, A. H. (1979). Narrative disclosures contained in financial reprots: Means of communication or manipulation? Accounting & Business Research, 9 (35), 179-189.
Adelberg, A. H. & Razek, J. R. (1984). The Cloze procedure: A methodology for determining the understandability of accounting textbooks. The Accounting Review, 59 (1), 109-122.
Agarwal, S. & Ramaswami, S. N. (1992). Choice of foreign market entry mode: Impact of ownership, location and internationalization factors. Journal of International Business Studies, 23 (1), 1-27.
Ahearne, A. G., Griever, W. L. & Warnock, F. E. (2004). Information costs and home bias: An analysis of US holdings of foreign equities. Journal of International Economics, 62 (2), 313.
Anderson, J. (1983). Lix and Rix: Variations on a little-known readability index. Journal of Reading, March, 490-496.
Ang, J. S., Cole, R. A. & Lin, J. W. (2000). Agency costs and ownership structure. Journal of Finance, 55 (1), 81-106.
Baker, H. E. I. & Kare, D. D. (1992). Relationship between annual report readability and corporate financial performance. Management Research News, 15 (1), 1-4.
Ball, R. (2006). International financial reporting standards (IFRS): Pros and cons for investors. Accounting & Business Research, 36, 5-27.
Barner-Rasmussen, W. & Björkman, I. (2005). Surmounting interunit barriers. International Studies of Management & Organization, 35 (1), 28-46.
Barnett, A. & Leoffler, K. (1979). Readability of accounting and auditing messages. Journal of Business Communication, 16 (3), 49-59.
Calof, J. L. (1994). The relationship between firm size and export behavior revisited. Journal of International Business Studies, 25 (2), 367-387.
Campbell, D., Cornelia Beck, A. & Shrives, P. (2005). A note on comparative language interrogation for content analysis: The example of English vs. German. British Accounting Review, 37 (3), 339-350.
Chan, K., Covrig, V. & Ng, L. (2005). What determines the domestic bias and foreign bias? Evidence from mutual fund equity allocations worldwide. Journal of Finance, 60 (3), 1495-1534.
Chang, L. S., Most, K. S. & Brain, C. W. (1983). The utility of annual reports: An international study. Journal of International Business Studies, 14 (1), 63-84.
Choi, F. D. S. (1991). Accounting and control for multinational activities: Perspective on the 1990's. Management International Review, 31 (1), 97-110.
Clatworthy, M. & Jones, M. J. (2001). The effect of thematic structure on the variability of annual report readability. Accounting, Auditing & Accountability Journal, 14 (3), 311-326.
Courtis, J. K. (1986). An investigation into annual report readability and corporate risk-return relationships. Accounting & Business Research, 16 (64), 285-294.
Courtis, J. K. (1995). Readability of the annual report: Western versus Asian evidence. Accounting, Auditing & Accountability Journal, 8 (2), 4-17.
Courtis, J. K. (1998). Annual report readability variability: Tests of the obfuscation hypothesis. Accounting, Auditing & Accountability Journal, 11 (4), 459-471.
Courtis, J. K. & Hassan, S. (2002). Reading ease of bilingual annual reports. Journal of Business Communication, 39 (4), 394-413.
Coval, J. & Moskowitz, T. (1999). Home bias at home: Local equity preference in domestic portfolios. Journal of Finance, 54 (6), 2045-2073.
Covrig, V. M., DeFond, M. L. & Hung, M. (2007). Home bias, foreign mutual fund holdings, and the voluntary adoption of international accounting standards. Journal of Accounting Research, 45 (1), 41-70.
Dahlquist, M., Pinkowitz, L., Stulz, R. M. & Williamson, R. (2003). Corporate governance and the home bias. Journal of Financial & Quantitative Analysis, 38 (1), 87-110.
Dale, E. & Chall, J. S. (1948a). A formula for predicting readability. Educational Research Bulletin, 27 (1), 11-20+28.
Dale, E. & Chall, J. S. (1948b). A formula for predicting readability: Instructions. Educational Research Bulletin, 27 (2), 37-54.
Degeorge, F., Ding, Y., Jeanjean, T. & Stolowy, H. (2004). Do financial analysts curb earnings management? International evidence. Working paper, University of Lugano and HEC School of Management, Paris.
20
Dhir, K. S. (2005). The value of language: Concept, perspectives, and policies. Corporate Communications, 10 (4), 358.
Doupnik, T. S. & Taylor, M. E. (1985). An empirical investigation of the observance of iasc standards in Western Europe. Management International Review, 25 (1), 27-33.
Dumontier, P. & Raffournier, B. (1998). Why firms comply voluntarily with IAS: An empirical analysis with Swiss data. Journal of International Financial Management and Accounting, 9 (3), 216-245.
Feely, A. J. & Harzing, A.-W. (2003). Language management in multinational companies. Cross Cultural Management, 10 (2), 37.
Flesch, R. (1943). Marks of readable style. Teachers College, Columbia University, Contributions to Education, No. 897, New York.
Flesch, R. (1948). A new readability yardstick. Journal of Applied Psychology, 32 (June), 221-233. Frazier, K. B., Ingram, R. W. & Tennyson, B. M. (1984). A methodology for the analysis of narrative accounting
disclosures. Journal of Accounting Research, 22 (1), 318-331. Fredriksson, R., Barner-Rasmussen, W. & Piekkari, R. (2006). The multinational corporation as a multilingual
organization. Corporate Communications, 11 (4), 406. Frownfelter-Lohrke, C. & Fulkerson, C. L. (2001). The incidence and quality of graphics in annual reports: An
international comparison. Journal of Business Communication, 38 (3), 337-358. Gunning, R. (1968). The fog index after twenty years. Journal of Business Communication, 6 (2), 3-13. Hirschey, M. & Weygandt, J. (1985). Amortization policy for advertising and research and development
expenditures. Journal of Accounting Research, 23 (1), 326-335. House, J. (2002). Communicating in English as a lingua franca. EUROSLA Yearbook, 2, 243-261. Jones, M. J. (1988). A longitudinal study of the readability of the chairman's narratives in the corporate reports of a
UK company. Accounting & Business Research, 18 (72), 297-305. Jones, M. J. & Shoemaker, P. A. (1994). Accounting narratives: A review of empirical studies of content and
readability. Journal of Accounting Literature, 13, 142. Kang, J.-K. & Stulz, R. M. (1997). Why is there a home bias? An analysis of foreign portfolio equity ownership in
Japan. Journal of Financial Economics, 46 (1), 3-28. Karolyi, G. A. & Stulz, R. (2003). Are financial assets priced locally or globally? In Handbook of the economics of
finance (Eds, Constantinides, G., Harris, M. and Stulz, R.). North-Holland, Amsterdam. Klein, A. (2002). Economic determinants of audit committee independence. The Accounting Review, 77 (2), 435-
452. Kotha, S., Rindova, V. P. & Rothaermel, F. T. (2001). Assets and actions: Firm-specific factors in the
internationalization of U.S. Internet firms. Journal of International Business Studies, 32 (2), 769-791. La Porta, R., Lopez-De-Silanes, F., Shleifer, A. & Vishny, R. (1998). Law and finance. Journal of Political
Economy, 106 (6), 1113-1155. Lintner, J. (1965). The valuation of risk assets and the selection of risky investments in stock portfolios and capital
budgets. Review of Economics and Statistics, 47 (1), 13-37. Louhiala-Salminen, L., Charles, M. & Kankaanranta, A. (2005). English as a lingua franca in nordic corporate
mergers: Two case companies. English for Specific Purposes, 24 (4), 401-421. Macharzina, K. (1992). Keeping score on the world's accounting firms and practice. Management International
Review, 32 (3), 195-197. Marschan, R., Welch, D. & Welch, L. (1997). Language: The forgotten factor in multinational management.
European Management Journal, 15 (5), 591-598. Mascarenhas, B. (1986). International strategies of non-dominant firms. Journal of International Business Studies,
17 (2), 1-25. Moriarity, S. (1979). Communicating financial information through multidimensional graphics. Journal of
Accounting Research, 17 (1), 205-224. Myers, S. C. (1977). Determinants of corporate borrowing. Journal of Financial Economics, 5 (2), 147-175. Myers, S. C. & Majluf, N. S. (1984). Corporate financing and investment decisions when firms have information that
investors do not have. Journal of Financial Economics, 13, 187-221. Nadkarni, S. & Perez, P. D. (2007). Prior conditions and early international commitment: The mediating role of
domestic mindset. Journal of International Business Studies, 38 (1), 160-176. Neter, J., Wasserman, W. & Kutner, M. (1983). Applied linear regression models. Irwin (Homewood). Pashalian, S. & Crissy, W. J. E. (1952). Corporate annual reports are difficult, dull reading, human interest value
low, survey shows. Journal of Accountancy, 94 (2), 215.
21
Piekkari, R. & Zander, L. (2005). Language and communication in international management. International Studies of Management & Organization, 35 (1), 3-9.
Planken, B. (2005). Managing rapport in lingua franca sales negotiations: A comparison of professional and aspiring negotiators. English for Specific Purposes, 24 (4), 381-400.
Poncini, G. (2003). Multicultural business meetings and the role of languages other than English. Journal of Intercultural Studies, 24 (1), 17-32.
Portes, R. & Rey, H. (1999). The determinants of cross-border equity flows: The geography of information. NBER Working Paper 7336.
Raffournier, B. (1995). The determinants of voluntary financial disclosure by Swiss listed companies. European Accounting Review, 4 (2), 261-280.
Sharpe, W. F. (1964). Capital asset prices: A theory of market equilibrium under conditions of risk. Journal of Finance, 19 (3), 425-442.
Singhvi, S. & Desai, H. (1971). An empirical analysis of the quality of corporate financial disclosure. The Accounting Review, 46 (1), 129-138.
Smith, J. E. & Smith, N. P. (1971). Readability: A measure of the performance of the communication function of financial reporting. The Accounting Review, 46 (3), 552-561.
Smith, M. & Taffler, R. J. (1992). Readability and understandability: Different measures of the textual complexity of accounting narrative. Accounting, Auditing & Accountability Journal, 5 (4), 84-98.
Smith, M. & Taffler, R. J. (1995). The incremental effect of narrative accounting information in corporate annual reports. Journal of Business Finance & Accounting, 22 (8), 1195-1210.
Sonney, F. (Forthcoming). Financial analysts' performance: Sector versus country specialization. Review of Financial Studies.
Soper, F. J. & Dolphin Jr, R. (1964). Readability and corporate annual reports. The Accounting Review, 39 (2), 358. Stulz, R. M. & Williamson, R. (2003). Culture, openness, and finance. Journal of Financial Economics, 70 (3), 313-
349. Subramanian, R., Insley, R. G. & Blackwell, R. D. (1993). Performance and readability: A comparison of annual
reports of profitable and unprofitable corporations. Journal of Business Communication, 30 (1), 49-61. Sullivan, D. (1994). Measuring the degree of internationalization of a firm. Journal of International Business
Studies, 25 (2), 325-342. Taylor, W. L. (1953). Cloze procedure: A tool for measuring readability. Journalism Quarterly, Fall, 415-433. Yu, F. (forthcoming). Analyst coverage and earnings management. Journal of Financial Economics.
22
Table 1 Sample data Number of
observations 2004
Number of observations
2003
Number of
countries Companies with data on annual report language available 13,211 13,860 44 Elimination of financial and insurance companies (SIC code classification: 6)
-861 -931
Non-financial companies with data on annual report language available 12,350 12,929 44 Elimination of companies in English-speaking countries (Australia, Canada, Hong Kong, India, Ireland, Kenya, Malaysia, New Zealand, Philippines, South Africa, United Kingdom, USA) or countries with zero on only one annual report in the local language (Netherlands Antilles, Egypt, Pakistan, Singapore, Thailand)
-7,963 -8,295 -17
Non-financial companies in non-English speaking countries with data on annual report language available
4,387 4,634 27
Elimination of outliers (on international sales) -4 -4 Non-financial companies in non-English speaking countries with data on annual report language available
4,383 4,630 27
Firms with missing data (financial variables) -530 -625 Extended sample 3,853 4,005 27 Firms with missing data (international sales and ownership concentration) -1,969 -2,039 Main sample 1,884 1,966 27
23
Table 2 Summary of hypotheses, variables, proxies and predicted signs
Hypotheses Name of variables Proxies (and sources) Predicted
signs
Dependent variable Publication of an English-language version of the annual report
English AR Dummy variable coded one if an English language version of the annual report has been published, zero otherwise. Source: Infinancials database.
N/A
Explanatory variables H1 Size of the firm Size Natural logarithm of sales.
Sources: Infinancials database (code: 53002) and Global (Standard and Poors) database (mnemonic: SALE).
+
H2 Internationalization International sales International sales/Total sales. Source: Infinancials database. (Geographic segment sales: codes: 13540-13549 and 13570-13579).
+
H3 Ownership concentration
Ownership concentration
Sum of the percentages of ownership of the first three shareholders. Source: Infinancials database (codes: 11400-11409).
-
H4a Profitability Return Return on assets. Sources: Infinancials database (code: 5020) and Global database (mnemonic: ROA). Data winsorized at 0.01.
-
H4b Growth opportunities
Growth opportunities
(Market value + Total debts)/Assets (simplified version of the definition provided by Klein (2002)) Sources: Datastream (market value). Infinancials database (Total debts: code 54022) and Global database (mnemonic: [MKVAL + DT]/AT).
+
H4c Leverage Leverage Ratio of financial debts (sum of total long-term debt plus debt in current liabilities) over total assets. Source: Infinancials database (codes: 54022/53077).
-
H5 Capital market size Market size Natural logarithm of (Market capitalization of listed companies [% of GDP] * GDP [current US$]) Source: World Bank Development Indicators (Average 2001-2005).
-
H6 Religion Religion Primary religion defined as the one practiced by the largest fraction of the population of a country. (Stulz & Williamson, 2003, p. 322). Original data source: 2000 CIA Factbook. As China was missing in Stulz and Williamson (2003), we searched for the religion directly in the CIA World Factbook, available at the following internet address: (https://www.cia.gov/library/publications/the-world-factbook/docs/profileguide.html). In the regressions, the most prevalent religion in number of observations, the Catholic religion, is taken as the base outcome.
?
Control variables Sector Economic sector Dummy variables.
Source: Infinancials (Standard Industrial Classification (SIC) Code) (code: 20004).
N/A
Country Country. Dummy variables. N/A
24
Table 3 Descriptive statistics on the dependent variable: Companies publishing an English annual report in 2004 or 2003by country
Panel A: 2004 Country Local English Total Local English Total N N N % % % Argentina 52 8 60 86.7 13.3 100 Austria 11 33 44 25.0 75.0 100 Belgium 13 54 67 19.4 80.6 100 Brazil 188 22 210 89.5 10.5 100 Chile 103 8 111 92.8 7.2 100 China 78 114 192 40.6 59.4 100 Denmark 24 58 82 29.3 70.7 100 Finland 12 81 93 12.9 87.1 100 France 189 138 327 57.8 42.2 100 Germany 209 280 489 42.7 57.3 100 Greece 37 57 94 39.4 60.6 100 Indonesia 65 46 111 58.6 41.4 100 Israel 9 64 73 12.3 87.7 100 Italy 67 87 154 43.5 56.5 100 Japan 766 466 1,232 62.2 37.8 100 Mexico 43 24 67 64.2 35.8 100 Netherlands 17 122 139 12.2 87.8 100 Norway 26 84 110 23.6 76.4 100 Peru 59 1 60 98.3 1.7 100 Portugal 21 11 32 65.6 34.4 100 South Korea 12 26 38 31.6 68.4 100 Spain 58 30 88 65.9 34.1 100 Sweden 80 139 219 36.5 63.5 100 Switzerland 27 112 139 19.4 80.6 100 Taiwan 107 17 124 86.3 13.7 100 Turkey 7 17 24 29.2 70.8 100 Venezuela 3 1 4 75.0 25.0 100 Total 2,283 2,100 4,383 52.1 47.9 100 Panel B: 2003 Country Local English Total Local English Total N N N % % % Argentina 55 6 61 90.2 9.8 100 Austria 12 33 45 26.7 73.3 100 Belgium 15 58 73 20.5 79.5 100 Brazil 196 27 223 87.9 12.1 100 Chile 102 12 114 89.5 10.5 100 China 75 111 186 40.3 59.7 100 Denmark 33 57 90 36.7 63.3 100 Finland 12 89 101 11.9 88.1 100 France 253 159 412 61.4 38.6 100 Germany 233 293 526 44.3 55.7 100 Greece 47 69 116 40.5 59.5 100 Indonesia 72 41 113 63.7 36.3 100 Israel 7 69 76 9.2 90.8 100 Italy 69 90 159 43.4 56.6 100 Japan 742 497 1,239 59.9 40.1 100 Mexico 39 33 72 54.2 45.8 100 Netherlands 21 140 161 13.0 87.0 100 Norway 23 84 107 21.5 78.5 100 Peru 70 2 72 97.2 2.8 100 Portugal 28 8 36 77.8 22.2 100 South Korea 4 35 39 10.3 89.7 100 Spain 52 41 93 55.9 44.1 100 Sweden 79 142 221 35.7 64.3 100 Switzerland 29 113 142 20.4 79.6 100 Taiwan 89 35 124 71.8 28.2 100 Turkey 7 17 24 29.2 70.8 100 Venezuela 4 1 5 80.0 20.0 100 Total 2,368 2,262 4,630 51.1 48.9 100
Local = local-language annual report. English = local-language annual report + English annual report.
25
Table 4 Descriptive statistics for independent variables with the basic sample in 2004
Panel A Independent firm-based variables
Number of observations
Mean Standard deviation
Minimum p25 Median p75 Maximum
Size 1,884 5.71 2.19 -1.98 4.20 5.58 7.12 12.08 International sales 1,884 0.38 0.38 0.00 0.00 0.28 0.75 1.00 Ownership concentration 1,884 50.59 27.06 0.69 26.09 50.06 72.61 95.00 Return 1,884 0.02 0.11 -0.59 0.00 0.04 0.07 0.25 Growth opportunities 1,884 1.49 0.76 0.15 1.05 1.26 1.65 6.93 Leverage 1,884 0.56 0.22 0.02 0.40 0.57 0.70 1.98 See definition of variables in Table 2. Panel B Independent country-based variables
Country Religion Market size Argentina Catholic 29.82 Austria Catholic 29.43 Belgium Catholic 31.01 Brazil Catholic 30.88 Switzerland Catholic 31.92 Chile Catholic 29.78 China Buddhist 31.76 Germany Protestant 32.29 Denmark Protestant 30.12 Spain Catholic 31.88 Finland Protestant 30.53 France Catholic 32.58 Greece Greek Orthodox 30.00 Indonesia Muslim 29.24 Israel Judaism 29.71 Italy Catholic 31.79 Japan Buddhist 33.38 South Korea Protestant 31.25 Mexico Catholic 30.34 Netherlands Catholic 31.62 Norway Protestant 30.01 Peru Catholic 28.25 Portugal Catholic 29.38 Sweden Protestant 31.01 Turkey Muslim 29.68 Taiwan Buddhist Venezuela Catholic 26.95
26
Table 5 Univariate tests
Panel A Correlation matrix between dependent and independent variables with the basic sample in 2004
(1) (2) (3) (4) (5) (6) (7) (1) English AR (2) Size 0.331 (0.000) (3) International sales 0.299 0.184 (0.000) (0.000) (4) Ownership concentration -0.212 -0.100 -0.172 (0.000) (0.000) (0.000) (5) Return 0.052 0.295 -0.048 0.096 (0.025) (0.000) (0.038) (0.000) (6) Growth opportunities 0.106 -0.140 0.099 -0.044 0.066 (0.000) (0.000) (0.000) (0.055) (0.004) (7) Leverage -0.026 0.270 0.044 0.056 -0.193 -0.073 (0.260) (0.000) (0.056) (0.016) (0.000) (0.002) (8) Market size 0.094 0.271 0.082 -0.264 -0.071 -0.064 0.083 (0.000) (0.000) (0.000) (0.000) (0.002) (0.006) (0.000) See definition of variables in Table 2. N = 1,884 (1,874 for market size). p-values in parentheses
Panel B Religion and English annual report
Religion Local English Total N N N Buddhist 68 223 291 Catholic 352 402 754 Greek Orthodox
11 24 35
Judaism 2 15 17 Muslim 59 54 113 Protestant 192 482 674 Total 684 1,200 1,884 Pearson chi2(5) = 91.1574 p-value = 0.000
27
Table 6 Logistic regressions – Dependent variable: English annual report Panel A: Regressions with firm-based variables
Predic-ted signs
Model 1: Basic model - 2004 Model 2: Expanded model - 2004 Model 3: Basic model with dummies - 2004
Coefficients z p Coefficients z p Coefficients z p Size + 0.443 13.414 0.000 0.441 20.217 0.000 0.634 13.282 0.000 International sales + 1.414 9.357 0.000 1.065 5.020 0.000 Ownership concentration - -0.012 -5.719 0.000 -0.017 -6.040 0.000 Return - -1.506 -2.852 0.004 -2.187 -5.265 0.000 -1.877 -2.891 0.004 Growth opportunities + 0.476 5.622 0.000 0.525 8.914 0.000 0.618 5.862 0.000 Leverage - -1.521 -5.384 0.000 -0.846 -4.806 0.000 -1.991 -5.665 0.000 Industry effects Not included Not included Included Country effects Not included Not included Included Constant -1.533 -5.583 0.000 -2.768 -15.739 0.000 -3.322 -2.912 0.004 Number of observations 1,884 3,853 1,791 Chi square 353.007 431.940 492.244 p(chi2) 0.000 0.000 0.000 Nagelkerke R-square 0.219 0.137 0.357
28
Panel B: Regressions with firm-based and country-based variables Predicted
signs Model 4: Basic model - Market
size - 2004 Model 5: Expanded model -
Market size - 2004 Model 6: Basic model - Religion
- 2004 Model 7: Expanded model -
Religion - 2004 Coefficients z p Coefficients z p Coefficients z p Coefficients z p Size + 0.477 13.739 0.000 0.535 21.430 0.000 0.480 12.873 0.000 0.620 21.452 0.000 International sales + 1.432 9.315 0.000 1.384 8.708 0.000 Ownership concentration - -0.014 -6.415 0.000 -0.011 -4.734 0.000 Return - -1.769 -3.239 0.001 -2.934 -6.774 0.000 -1.389 -2.480 0.013 -2.475 -5.885 0.000 Growth opportunities + 0.480 5.562 0.000 0.487 8.347 0.000 0.499 5.721 0.000 0.414 7.341 0.000 Leverage - -1.601 -5.557 0.000 -1.239 -6.644 0.000 -1.453 -4.818 0.000 -1.606 -8.025 0.000 Market size - -0.118 -2.555 0.011 -0.341 -11.590 0.000 Buddhist ? 0.688 3.304 0.001 -0.863 -9.338 0.000 Greek Orthodox ? 1.378 3.428 0.001 1.233 4.251 0.000 Muslim ? 1.485 1.775 0.076 2.629 4.219 0.000 Protestant ? 0.755 3.156 0.002 0.669 3.026 0.002 Judaism ? 0.980 7.585 0.000 1.206 10.954 0.000 Constant 2.144 1.485 0.138 7.909 8.528 0.000 -2.405 -8.178 0.000 -3.212 -15.963 0.000 Number of observations 1,874 3,735 1,884 3,853 Chi square 355.457 499.307 399.275 545.836 p(chi2) 0.000 0.000 0.000 0.000 Nagelkerke R-square 0.226 0.174 0.247 0.232
29
Table 7 Change analysis Panel A: Descriptive statistics of changes
Change to English in 2004 N Local 520 English 75 Total 595 Change to Local in 2004 N Local 997 English 98 Total 1,095 Total sample 1,690
Panel B Logistic regressions Model 8: Change to English in 2004 Model 9: Change to Local in 2004 Coefficients z p Coefficients z p Size 0.304 3.641 0.000 -0.203 -3.228 0.001 International sales 0.814 2.127 0.033 -1.105 -3.630 0.000 Ownership concentration -0.011 -2.328 0.020 0.012 2.878 0.004 Return -2.532 -2.207 0.027 0.272 0.253 0.800 Growth opportunities 0.364 2.134 0.033 -0.195 -1.262 0.207 Leverage 0.328 0.558 0.577 0.856 1.562 0.118 Constant -3.783 -5.842 0.000 -1.445 -2.772 0.006 Number of observations 595 1,094 Chi square 34.404 42.881 p(chi2) 0.000 0.000 Nagelkerke R-square 0.106 0.085