consolidated financial statements nabtesco corporation
TRANSCRIPT
Nabtesco Group Integrated Report 20141
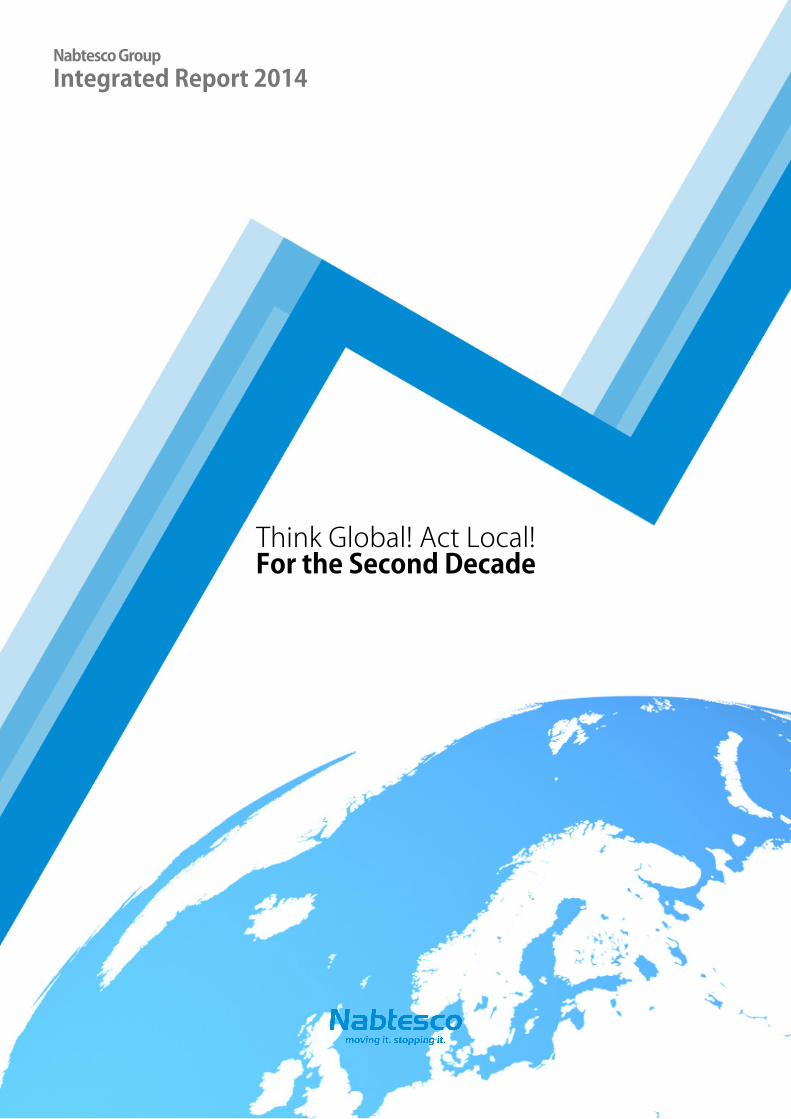
Think Global! Act Local!For the Second Decade
Nabtesco GroupIntegrated Report 2014
Nabtesco Group Integrated Report 2014
INDEX
1
02 12 16
38 75
93 96101
Think Global! Act Local!For the Second Decade

Nabtesco Group Integrated Report 20142
Snapshot of Nabtesco
�&RUSRUDWH�3KLORVRSK\
�+LVWRU\�RI�1DEWHVFR
�7RSLFV�IRU�)LVFDO�<HDU������
�2XU�%XVLQHVV�DQG�6WUHQJWKV
�)LQDQFLDO��1RQ�)LQDQFLDO�+LJKOLJKWV�
Nabtesco Group Integrated Report 20143
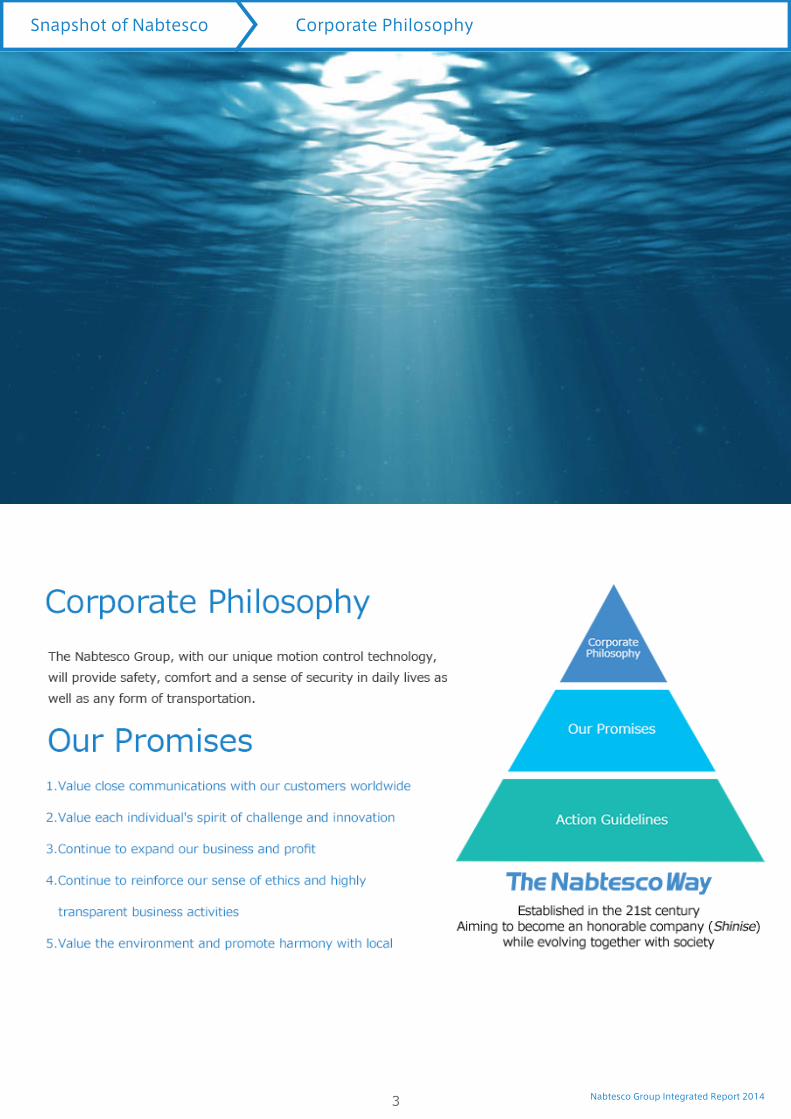
Snapshot of Nabtesco Corporate Philosophy
Nabtesco Group Integrated Report 20144
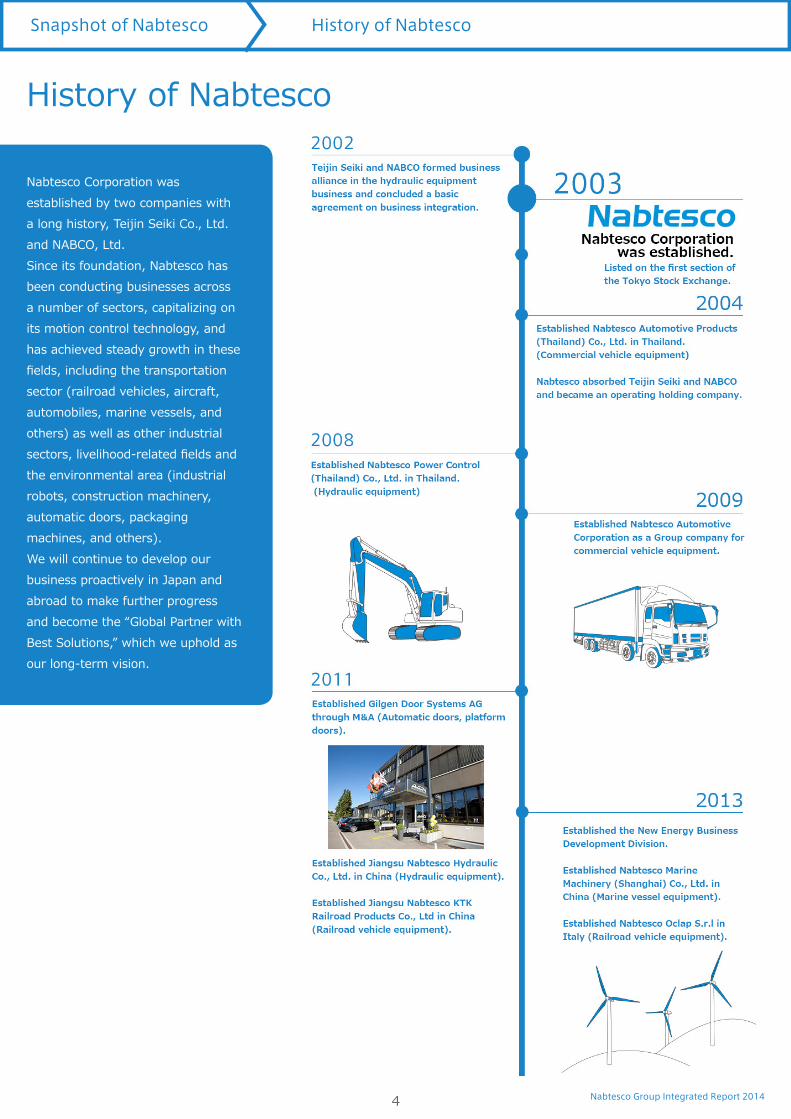
Nabtesco Corporation was established by two companies with a long history, Teijin Seiki Co., Ltd. and NABCO, Ltd.Since its foundation, Nabtesco has been conducting businesses across a number of sectors, capitalizing on its motion control technology, and has achieved steady growth in these rHOGV��LQFOXGLQJ�WKH�WUDQVSRUWDWLRQ�sector (railroad vehicles, aircraft, automobiles, marine vessels, and others) as well as other industrial VHFWRUV��OLYHOLKRRG�UHODWHG�rHOGV�DQG�the environmental area (industrial robots, construction machinery, automatic doors, packaging machines, and others).We will continue to develop our business proactively in Japan and abroad to make further progress and become the “Global Partner with Best Solutions,” which we uphold as our long-term vision.
History of Nabtesco
Snapshot of Nabtesco History of Nabtesco
Nabtesco Group Integrated Report 20145
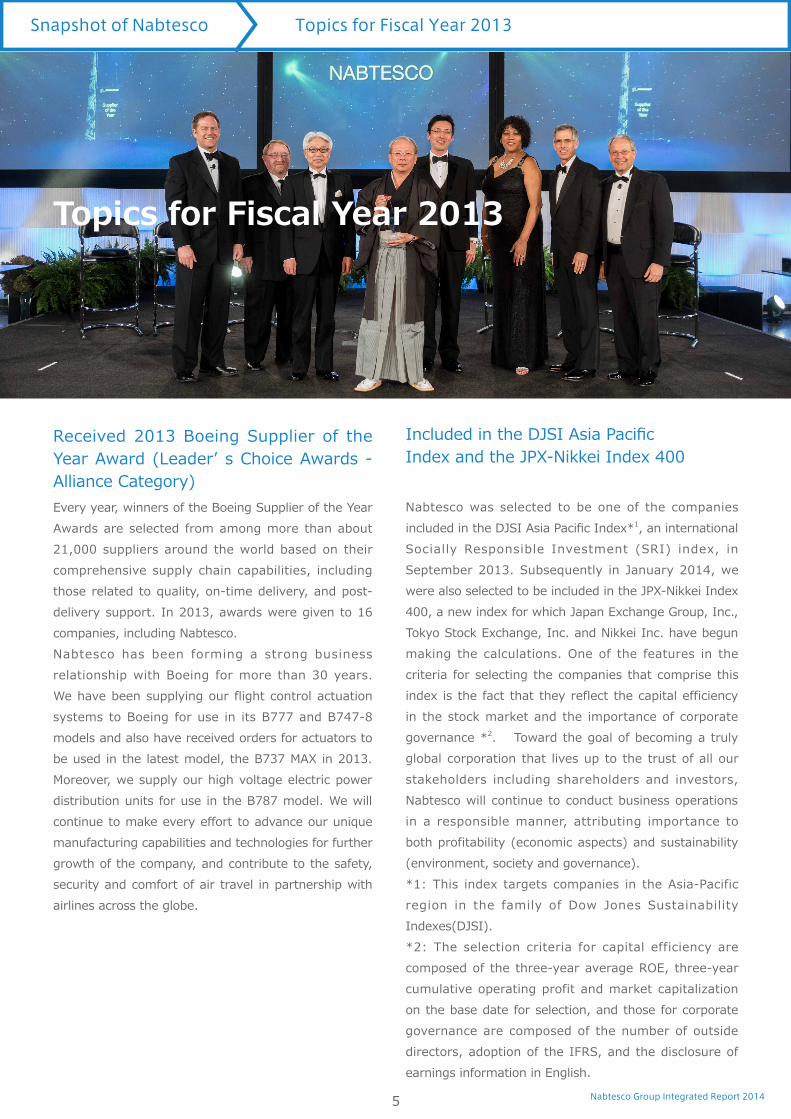
Received 2013 Boeing Supplier of the <HDU�$ZDUG��/HDGHUb V�&KRLFH�$ZDUGV���Alliance Category)Every year, winners of the Boeing Supplier of the Year Awards are selected from among more than about 21,000 suppliers around the world based on their comprehensive supply chain capabilities, including those related to quality, on-time delivery, and post-delivery support. In 2013, awards were given to 16 companies, including Nabtesco.Nabtesco has been forming a strong business relationship with Boeing for more than 30 years. We have been supplying our flight control actuation systems to Boeing for use in its B777 and B747-8 models and also have received orders for actuators to be used in the latest model, the B737 MAX in 2013. Moreover, we supply our high voltage electric power distribution units for use in the B787 model. We will FRQWLQXH�WR�PDNH�HYHU\�HíRUW�WR�DGYDQFH�RXU�XQLTXH�manufacturing capabilities and technologies for further growth of the company, and contribute to the safety, security and comfort of air travel in partnership with airlines across the globe.
,QFOXGHG�LQ�WKH�'-6,�$VLD�3DFLrFIndex and the JPX-Nikkei Index 400
Nabtesco was selected to be one of the companies LQFOXGHG�LQ�WKH�'-6,�$VLD�3DFLrF�,QGH[ 1, an international Socially Responsible Investment (SRI) index, in September 2013. Subsequently in January 2014, we were also selected to be included in the JPX-Nikkei Index 400, a new index for which Japan Exchange Group, Inc., Tokyo Stock Exchange, Inc. and Nikkei Inc. have begun making the calculations. One of the features in the criteria for selecting the companies that comprise this index is the fact that they reflect the capital efficiency in the stock market and the importance of corporate JRYHUQDQFH� 2��7RZDUG�WKH�JRDO�RI�EHFRPLQJ�D� WUXO\�global corporation that lives up to the trust of all our stakeholders including shareholders and investors, Nabtesco will continue to conduct business operations in a responsible manner, attributing importance to both profitability (economic aspects) and sustainability (environment, society and governance). ���7KLV� LQGH[� WDUJHWV� FRPSDQLHV� LQ� WKH�$VLD�3DFLILF�region in the family of Dow Jones Sustainability Indexes(DJSI). ��� 7KH� VHOHFWLRQ� FULWHULD� IRU� FDSLWDO� HIILFLHQF\� DUH�composed of the three-year average ROE, three-year cumulative operating profit and market capitalization on the base date for selection, and those for corporate governance are composed of the number of outside directors, adoption of the IFRS, and the disclosure of earnings information in English.
Topics for Fiscal Year 2013
Snapshot of Nabtesco Topics for Fiscal Year 2013
Nabtesco Group Integrated Report 20146
Joint Research on Power Electronics with the Swiss Federal Institute of Technology in Zurich Launched
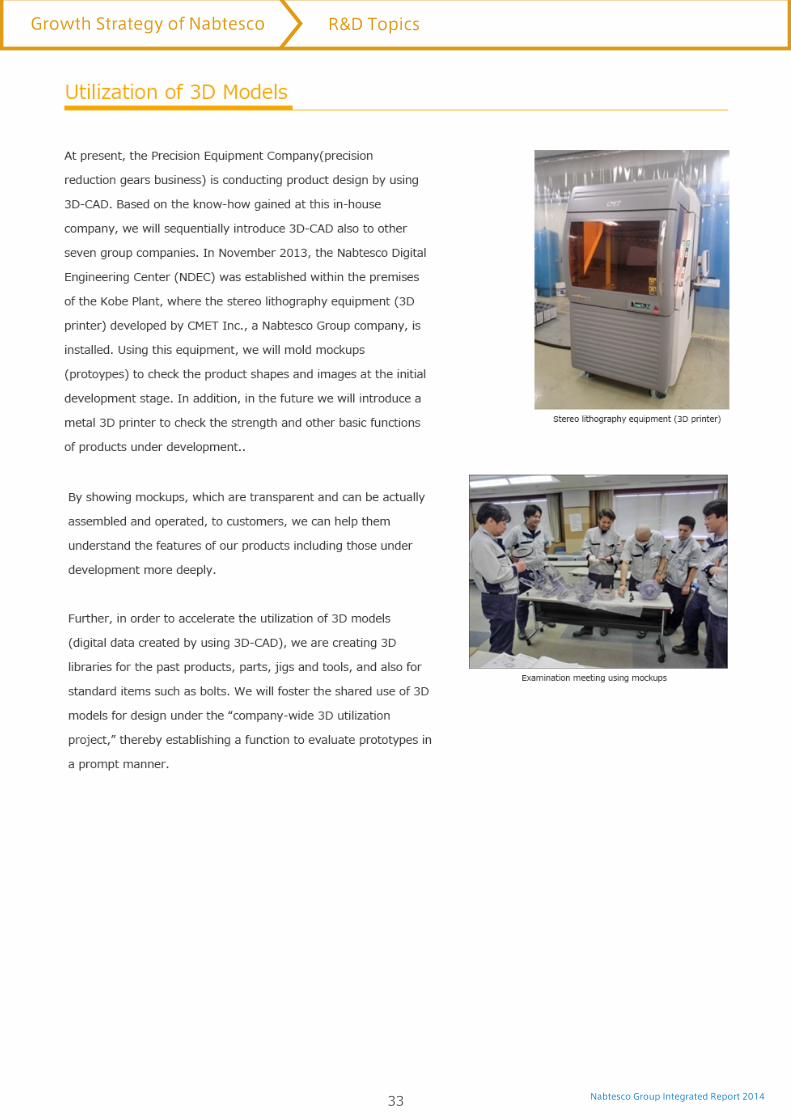
In cultivating growth in oversea markets, Nabtesco deems it important to develop unique products that incorporate a range of technologies as well as human resources with world-class technological capabilities. Accordingly, we are Nabtesco is conducting in-house development activities while also fostering joint research with overseas universities. Following the launch of joint research with the University of Washington in the United States (for actuators) and with the Technical University of Denmark (for drive units for wind turbines), Nabtesco began conducting a joint activity with the Swiss Federal Institute RI� 7HFKQRORJ\� LQ� =XULFK� �(7+=�� (LGJHQØVVLVFKH�Technische Hochschule Zürich) in March 2014, which will be continued for three years. The ETHZ has one RI� WKH�ZRUOGb V�EHVW�SRZHU�HOHFWURQLFV� ODERUDWRULHV��and by combining our control technologies with the ,QVWLWXWHb V� WHFKQRORJLHV��ZH�ZLOO�DFKLHYH�UHVXOWV�DQG�utilize them for our products in a range of fields, including drive units for wind turbines and door operating systems for railroad vehicles. We are also aiming to apply the results to develop new products, such as precision equipment and railroad vehicle equipment.
Cumulative Production of the RVTM Series Precision Reduction Gears Reached 5 Million Units
1DEWHVFRb V�3UHFLVLRQ�(TXLSPHQW�&RPSDQ\�DFKLHYHG�the cumulative production of 5 million units for the VIGO DRIVE RV series precision reduction gears. These gears began to be manufactured in 1985 and now represent one of our major product items.The gears are highly rigid despite being compact and light, and are also excellent in terms of accelerating performance and positional accuracy. Due to these strengths, they are widely used in industrial robots, machine tools, assembly equipment, transportation equipment and other machines. In the industrial robot rHOG� LQ�SDUWLFXODU�� WKH�JHDUV�PDLQWDLQ�D�ZRUOG�PDUNHW�share of 60%.Nabtesco has developed the RV N series as the latest leading reduction gear model for industrial robots as well as the RD2 gearhead series and the RS series in recent years. Under the continuous support from our customers, the cumulative production of the RV series has successfully reached 5 million units.
Snapshot of Nabtesco Topics for Fiscal Year 2013

Nabtesco Group Integrated Report 2014
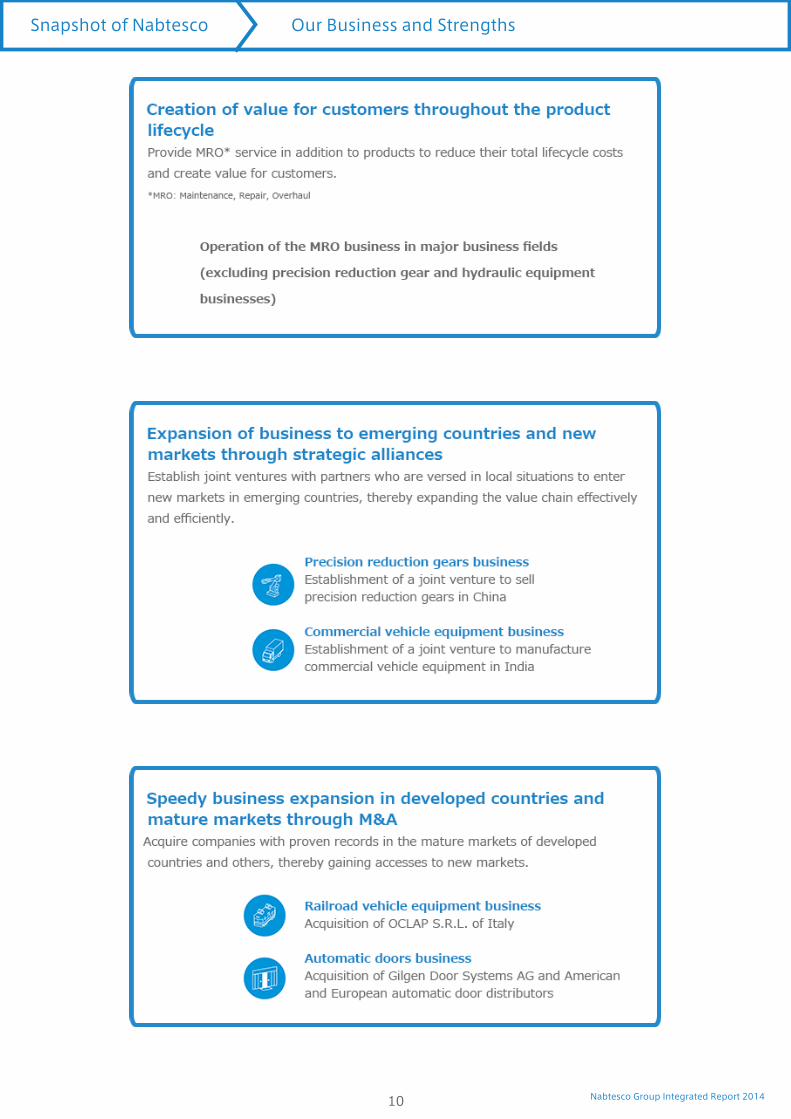
Our Business and Strengths
7
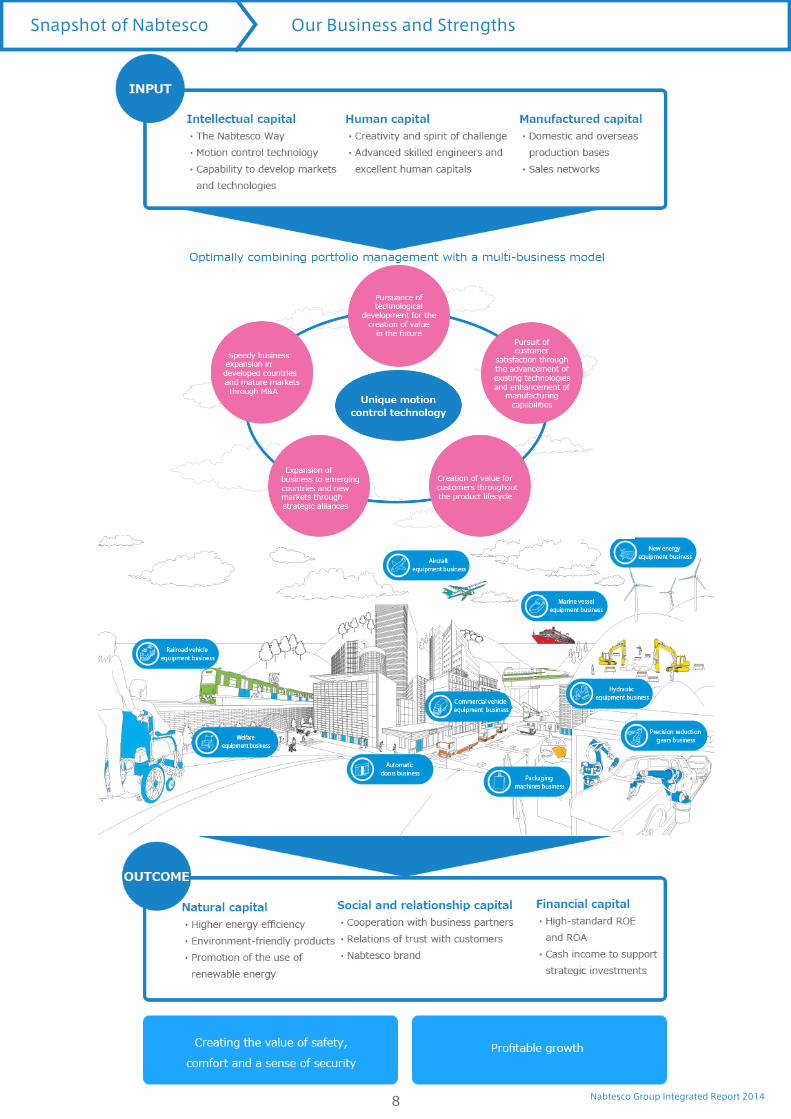
Global Partner with Best Solutions for Industrial Leaders Creating the Value of Safety,Comfort and a Sense of Security in a Range of SocialInfrastructure-Related Fields with Unique Motion Control Technology
1DEWHVFR�RSHUDWHV� LQ�D�UDQJH�RI� ILHOGV�UHODWHG�WR� WKH� LQGXVWU\��SHRSOHb V� OLYHV�DQG�WKH�HQYLURQPHQW�E\�XVLQJ� LWV�
motion control technology to move and stop objects in a precise manner as the mainstay for its businesses. Most of
our products function in a manner not clearly visible to people, but these products display high performance to help
them lead their lives with safety, comfort and a sense of security and to support social infrastructure. At present,
we are taking top spots in both Japanese and overseas markets with regard to a variety of products, and are further
H[SDQGLQJ�RXU�EXVLQHVV�UDQJH�WR�LQFOXGH�QHZ�JURZWK�rHOGV�E\�PDNLQJ�XVH�RI�RXU�FRUH�WHFKQRORJ\��:H�ZLOO�FRQWLQXH�
IXOrOOLQJ�RXU�FRUSRUDWH�PLVVLRQ�WR�VXSSRUW�VRFLHW\�WKURXJK�WKH�SURYLVLRQ�RI�KLJKO\�UHOLDEOH�SURGXFWV�DQG�VHUYLFHV�
Snapshot of Nabtesco Our Business and Strengths
Nabtesco Group Integrated Report 20148
Snapshot of Nabtesco Our Business and Strengths
Nabtesco Group Integrated Report 20149
Snapshot of Nabtesco Our Business and Strengths
Nabtesco Group Integrated Report 201410
Snapshot of Nabtesco Our Business and Strengths

Nabtesco Group Integrated Report 2014
Financial &Non-Financial Highlights
11
Snapshot of Nabtesco Financial & Non-Financial Highlights

Nabtesco Group Integrated Report 2014
Top Message
Dear Stakeholders,
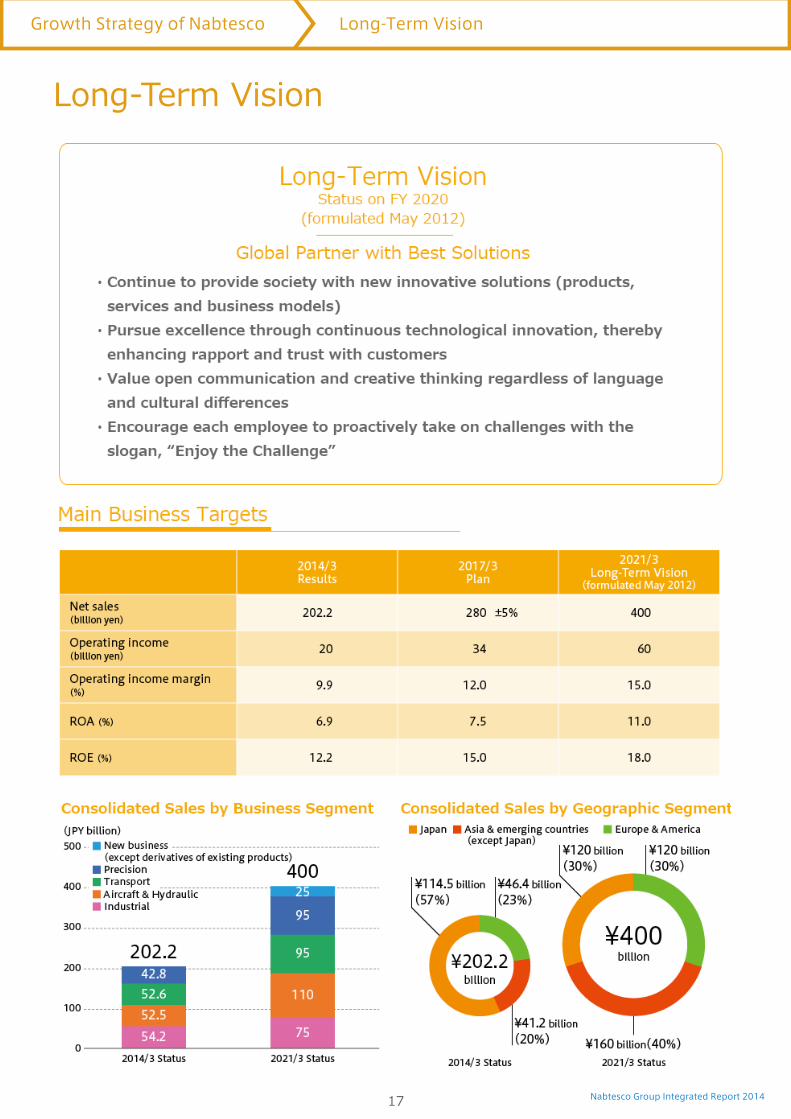
Nabtesco celebrates the 11th anniversary of its foundation in 2014. Also, in May 2014 we launched our New Mid–Term Management Plan “Think Global! Act Local! For the Second Decade,” following the end of the previous plan “Global Challenge” formulated in May 2011.
Under the new plan, we aim to build the growth foundation to achieve our Long–Term Vision set for )<������7DNLQJ�DGYDQWDJH�RI�RXU�GLYHUVLrHG�EXVLQHVV�portfolio, we will implement measures focusing on expanding our existing businesses and linking them horizontally to create new businesses. Moreover, we will attribute even more importance to capital HîFLHQF\�LQ�RXU�EXVLQHVV�PDQDJHPHQW�ZLWK�D�YLHZ�WR�DFKLHYLQJ�SURrWDEOH�JURZWK�
Review of the Previous Mid–Term Management Plan “ Global Challenge – Advance to
the Next Stage” Formulated in May 2011
The previous Mid-Term Management Plan “Global Challenge” was formulated in 2011, when I became president of the company and began leading the management of the company as its top executive. During the formulation of the plan, the Great East Japan Earthquake occurred and subsequently we faced hardships in our business environment, including the historically high appreciation of yen, debt crisis in Europe, and economic slowdown in China. Mainly due to drops in sales of our railroad vehicle equipment and hydraulic equipment businesses, in particular in China, as well as stagnant sales in the industrial robot market,
we were unable to achieve the numerical targets set in the management plan, including “net sales of 240 billion yen.” In response, in the New Mid–Term Management Plan, we focus on building up a corporate structure that enables us to pursue growth while minimizing the impact caused by changes in the business environment.
The Japanese market is recovering, and climbing out of the long-standing economic depression caused by the high yen. The world economy is also improving, with the United States achieving resurgence and Europe showing signs of recovery, albeit moderate.
12
Top Message
Nabtesco Group Integrated Report 2014
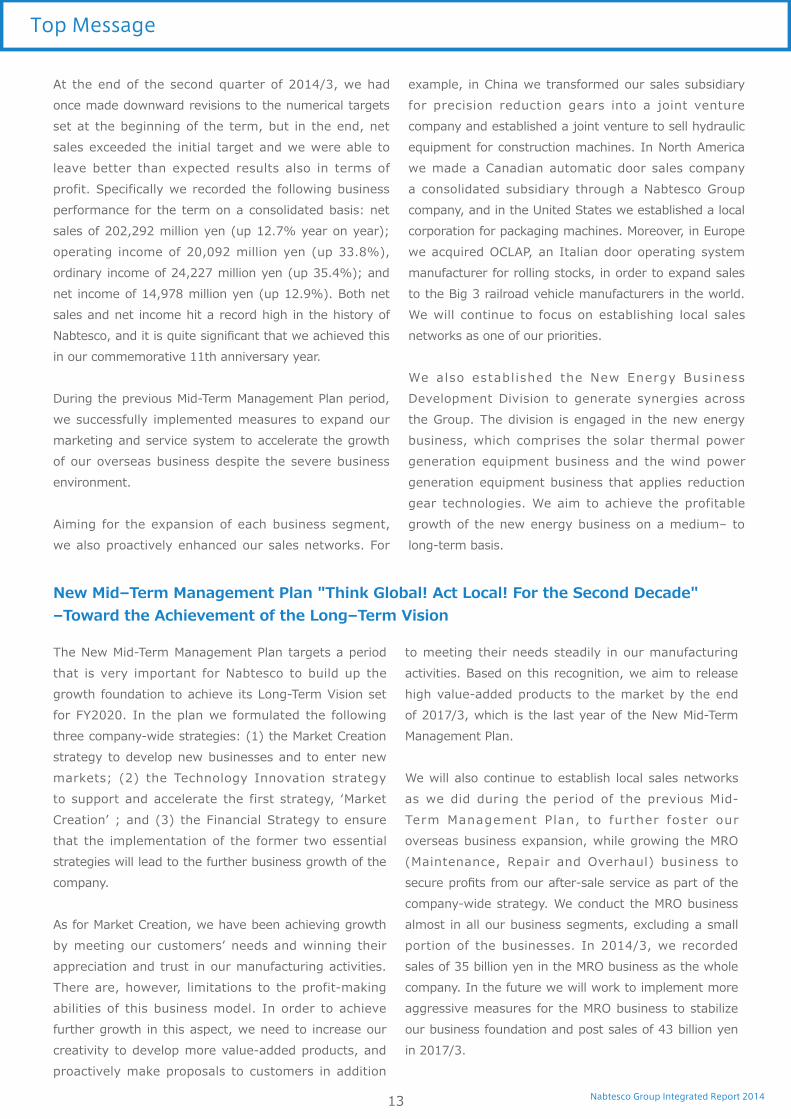
At the end of the second quarter of 2014/3, we had once made downward revisions to the numerical targets set at the beginning of the term, but in the end, net sales exceeded the initial target and we were able to leave better than expected results also in terms of profit. Specifically we recorded the following business SHUIRUPDQFH� IRU� WKH� WHUP�RQ�D�FRQVROLGDWHG�EDVLV��QHW�sales of 202,292 million yen (up 12.7% year on year); operating income of 20,092 million yen (up 33.8%), ordinary income of 24,227 million yen (up 35.4%); and net income of 14,978 million yen (up 12.9%). Both net sales and net income hit a record high in the history of 1DEWHVFR��DQG�LW�LV�TXLWH�VLJQLrFDQW�WKDW�ZH�DFKLHYHG�WKLV�in our commemorative 11th anniversary year.
During the previous Mid-Term Management Plan period, we successfully implemented measures to expand our marketing and service system to accelerate the growth of our overseas business despite the severe business environment.
Aiming for the expansion of each business segment, we also proactively enhanced our sales networks. For
example, in China we transformed our sales subsidiary for precision reduction gears into a joint venture company and established a joint venture to sell hydraulic equipment for construction machines. In North America we made a Canadian automatic door sales company a consolidated subsidiary through a Nabtesco Group company, and in the United States we established a local corporation for packaging machines. Moreover, in Europe we acquired OCLAP, an Italian door operating system manufacturer for rolling stocks, in order to expand sales to the Big 3 railroad vehicle manufacturers in the world. We will continue to focus on establishing local sales networks as one of our priorities.
We a lso establ ished the New Energy Bus iness Development Division to generate synergies across the Group. The division is engaged in the new energy business, which comprises the solar thermal power generation equipment business and the wind power generation equipment business that applies reduction gear technologies. We aim to achieve the profitable growth of the new energy business on a medium– to long-term basis.
New Mid–Term Management Plan "Think Global! Act Local! For the Second Decade"
–Toward the Achievement of the Long–Term Vision
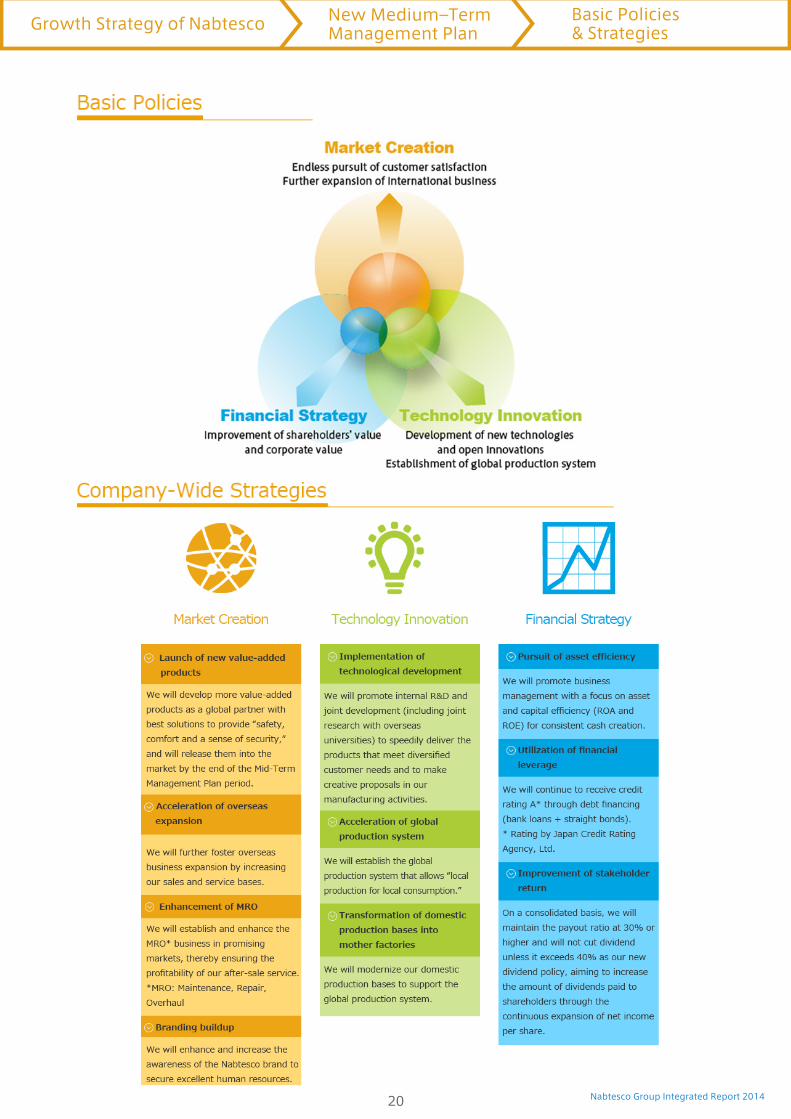
The New Mid-Term Management Plan targets a period that is very important for Nabtesco to build up the growth foundation to achieve its Long-Term Vision set for FY2020. In the plan we formulated the following WKUHH�FRPSDQ\�ZLGH�VWUDWHJLHV������WKH�0DUNHW�&UHDWLRQ�strategy to develop new businesses and to enter new markets; (2) the Technology Innovation strategy WR� VXSSRUW� DQG�DFFHOHUDWH� WKH� ILUVW� VWUDWHJ\�� d0DUNHW�&UHDWLRQb �� DQG� ���� WKH�)LQDQFLDO� 6WUDWHJ\� WR� HQVXUH�that the implementation of the former two essential strategies will lead to the further business growth of the company.
As for Market Creation, we have been achieving growth E\�PHHWLQJ�RXU� FXVWRPHUVb� QHHGV�DQG�ZLQQLQJ� WKHLU�appreciation and trust in our manufacturing activities. There are, however, limitations to the profit-making abilities of this business model. In order to achieve further growth in this aspect, we need to increase our creativity to develop more value-added products, and proactively make proposals to customers in addition
to meeting their needs steadily in our manufacturing activities. Based on this recognition, we aim to release high value-added products to the market by the end of 2017/3, which is the last year of the New Mid-Term Management Plan.
We will also continue to establish local sales networks as we did during the period of the previous Mid-Term Management P lan, to fur ther foster our overseas business expansion, while growing the MRO (Maintenance, Repair and Overhaul) business to VHFXUH�SURrWV�IURP�RXU�DIWHU�VDOH�VHUYLFH�DV�SDUW�RI�WKH�company-wide strategy. We conduct the MRO business almost in all our business segments, excluding a small portion of the businesses. In 2014/3, we recorded sales of 35 billion yen in the MRO business as the whole company. In the future we will work to implement more aggressive measures for the MRO business to stabilize our business foundation and post sales of 43 billion yen in 2017/3.
13
Top Message

Nabtesco Group Integrated Report 2014
In addition, as a means to build a foundation for our future business expansion, we will proactively make investments in advertisement activities to increase SHRSOHb V�DZDUHQHVV�DQG� UHFRJQLWLRQ�RI� WKH�1DEWHVFR�brand, with an eye to securing the employment of excellent and capable human capital.
The pursuit of Technology Innovation is critical for Market Creation. To further enhance our existing technologies, which are the source of our competitiveness, and thereby develop new technologies, we will foster internal GHYHORSPHQW�DFWLYLWLHV�rUVW�RI�DOO��:H�ZLOO�DOVR�LPSOHPHQW�joint research projects with overseas universities, which will allow us to take broader views than focusing on short-term results. In addition to starting cooperation with the University of Washington and the Technical University of Denmark, we also launched a joint research project in the power electronics technology field with the Swiss Federal Institute of Technology in Zurich in March 2014. We aim to utilize the research results in the development of diverse products, including precision equipment , railroad vehicle equipment, commercial
vehicle equipment and drive units for wind turbines. We believe that these initiatives will help us create innovations and develop globally competitive human capital who will support the foundation of our overseas business expansion.
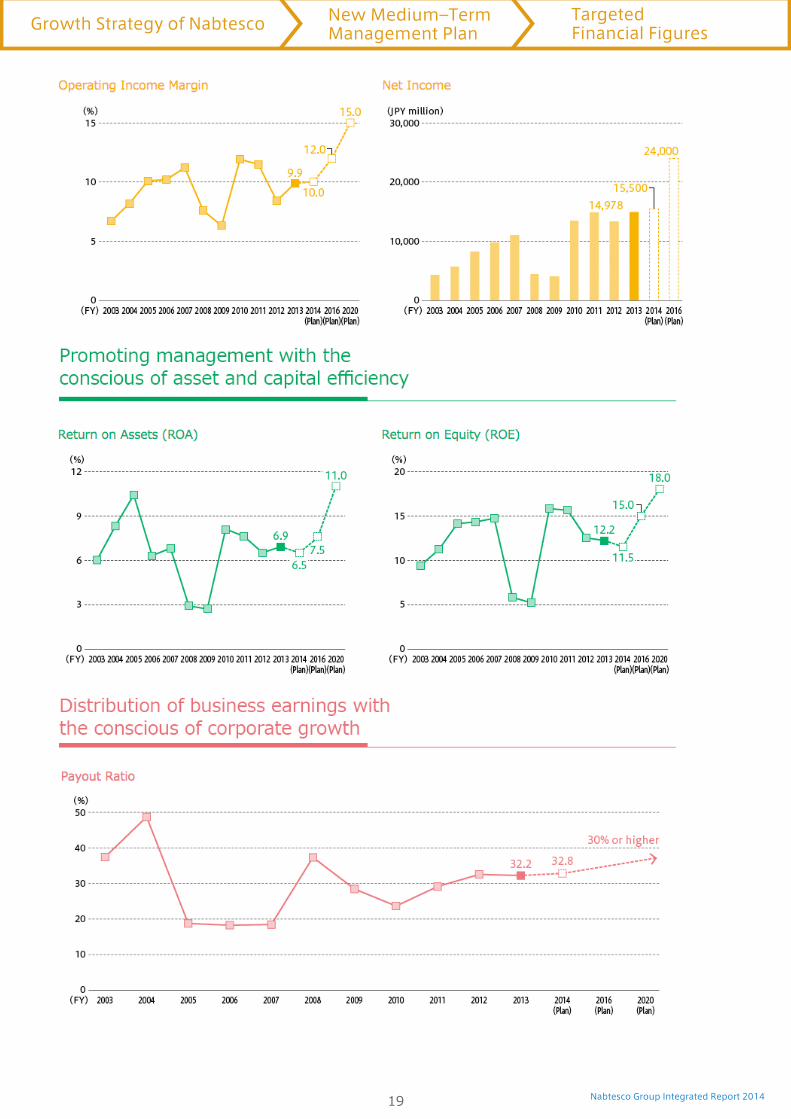
With regard to the Financial Strategy, we will focus PRUH�RQ�FDSLWDO�HîFLHQF\�LQ�RXU�EXVLQHVV�PDQDJHPHQW��with a view to creating cash income to sustain strategic investment and realize stable returns for shareholders. In the New Mid-Term Management Plan, we deem earnings per share (EPS) as one of our most important numerical targets along with the ROE and ROA. We aim to increase the EPS to 190 yen by 2017/3, which is the last year of the management plan.
Accordingly we have set a new dividend distribution SROLF\��ZH�ZLOO�ZRUN�WR�PDLQWDLQ�VWDEOH�SD\PHQW�ZLWK�WKH�consolidated payout ratio of 30% or higher. Moreover, we will not decrease the rate unless it exceeds 40% as our new dividend policy. We are also targeting the continuous increasing of EPS.
14
Top Message

Nabtesco Group Integrated Report 2014
Value Creation by the Nabtesco Group
Since its foundation, the Nabtesco Group has been continuing growth to create synergies across the Group XQGHU� WKH�&RUSRUDWH�3KLORVRSK\�� d7KH�1DEWHVFR�*URXS��with unique motion control technology, will provide safety, comfort and a sense of security in daily lives DV�ZHOO�DV�DQ\� IRUP�RI� WUDQVSRUWDWLRQ�b�7KH�*URXS�KDV�successfully developed over the decade through the drastic pursuit of customer satisfaction and the incentive RI�LWV�VWURQJ�FRPPLWPHQW�WR�dVDIHW\��FRPIRUW�DQG�D�VHQVH�of security.'
Nabtesco operates a wide range of businesses, including those related to the transportation of people and goods (railroad vehicle equipment, aircraft equipment, marine vessel equipment and commercial vehicle equipment); to manufacture and urban development (precision reduction gears for industrial robots, hydraulic equipment for FRQVWUXFWLRQ�PDFKLQHU\�DQG�RWKHU�GHYLFHV��� WR�SHRSOHVb�daily lives, welfare and medical care (automatic doors, welfare equipment, packaging machines and others); and to the environment and energy (equipment for wind power and solar thermal power generation). In all of these businesses, we deliver products that support SHRSOHb V� GDLO\� OLYHV� DQG� VRFLDO� LQIUDVWUXFWXUHV��$V� D�component manufacturer, we create high value–added WHFKQRORJLHV�DQG�SURGXFWV� WKDW�GHOLYHU� dVDIHW\��FRPIRUW�DQG�D�VHQVH�RI�VHFXULW\b�E\�IRVWHULQJ�PDUNHW�FUHDWLRQ�DQG�product development, hand in hand with our customers. By doing this, we contribute to the development of society and the economy, which we believe createing shared value between Nabtesco and society at large.
For Nabtesco to achieve sustainable development together with society and continue providing value we
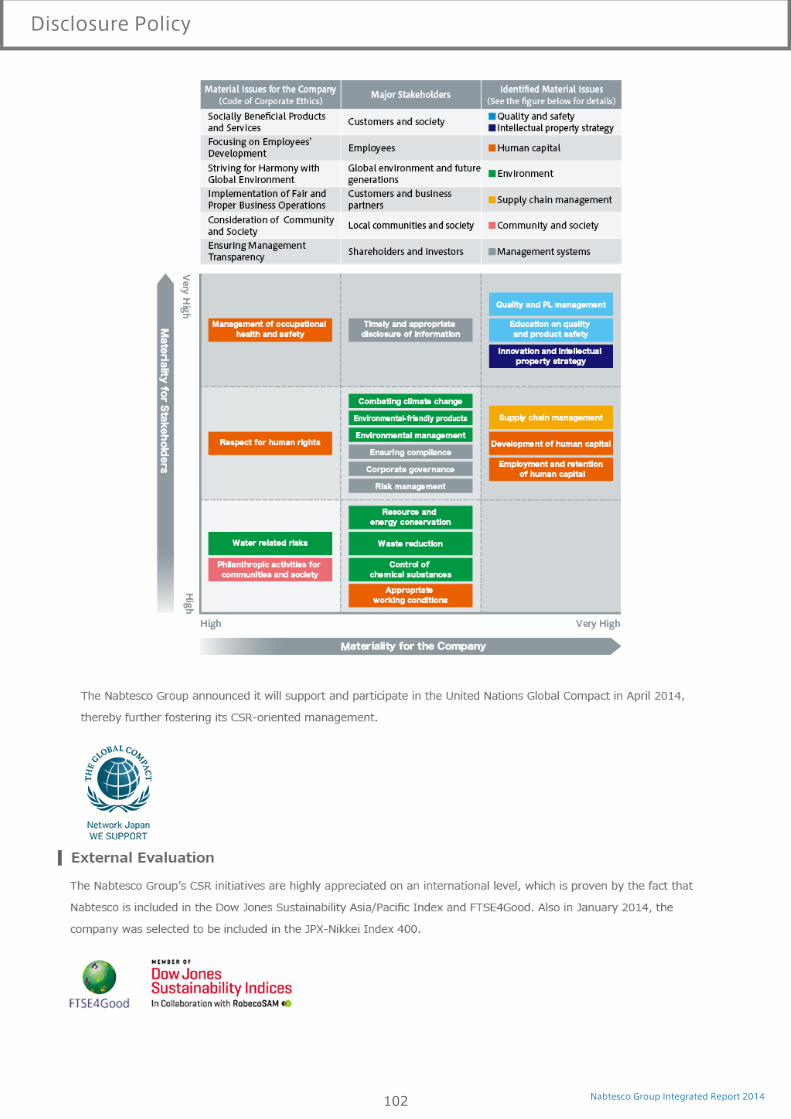
deem it important to address the issues of sustainability, mainly by fostering measures regarding the following LWHPV�
1. Promotion of quality and safety2. Cultivation of human capital3. Consideration for environment4. Supply chain management5. Consideration for communities and society
We are also working to enhance our compliance and risk management systems and ensure corporate governance and management transparency across the board, LQFOXGLQJ�*URXS�FRPSDQLHV�RXWVLGH�-DSDQ�
In September 2013, as a result of making continuous efforts for these issues of sustainability, Nabtesco was selected to be one of the companies included in the '-6,�$VLD�3DFLrF�,QGH[��7KLV� LQGH[�WDUJHWV�FRPSDQLHV� LQ�the Asia–Pacific region in the Dow Jones Sustainability Indexes (DJSI), which is a family of international Socially Responsible Investment (SRI) indexes. Subsequently in April 2014, Nabtesco signed the United Nations Global Compact. We will continue to make progress in CSR related activities.
The Nabtesco Group has made a fresh start toward its second decade. We will strive to achieve our Long–7HUP�9LVLRQ��ZKLOH�PDNLQJ�D�FRQFHUWHG�HíRUW�DFURVV�WKH�Group to implement “Challenge & Creation” to build even better relations of trust with our customers and all of our stakeholders and to foster value creation.
15
Top Message

Nabtesco Group Integrated Report 201416
Growth Strategy of Nabtesco
�/RQJ�7HUP�9LVLRQ
�1HZ�0LG�7HUP�0DQDJHPHQW�3ODQ
�*URZWK�6WUDWHJ\�E\�%XVLQHVV
�5'�7RSLFV
�,QWHOOHFWXDO�3URSHUW\�6WUDWHJ\
Nabtesco Group Integrated Report 2014
ॼঈॸ५॥ঝشউभகୗ
Long-Term Vision
17
Growth Strategy of Nabtesco Long-Term Vision

Nabtesco Group Integrated Report 2014
ॼঈॸ५॥ঝشউभகୗ
New Medium–Term Management Plan
18
Growth Strategy of Nabtesco New Medium‒Term Management Plan
Targeted Financial Figures
Nabtesco Group Integrated Report 2014
ॼঈॸ५॥ঝشউभகୗ
19
Growth Strategy of Nabtesco New Medium‒Term Management Plan
Targeted Financial Figures
Nabtesco Group Integrated Report 201420
Growth Strategy of Nabtesco New Medium‒Term Management Plan
Basic Policies & Strategies

Nabtesco Group Integrated Report 201421
Growth Strategy of Nabtesco Growth Strategy by Business
Precision Reduction Gears Business
Worldwide Annual Shipment of
Industrial Robots
Forecast for Sales of Chinese Local
Robot Manufacturers
Growth Strategy by BusinessPrecision Reduction Gears Business
Strengths and Competitive Advantages
1DEWHVFRb V�KLJK�TXDOLW\�SUHFLVLRQ�UHGXFWLRQ�JHDUV�59�H[FHO� LQ�WKHLU�GXUDELOLW\�DQG�SRVLWLRQDO�DFFXUDF\��ZKLOH�WKH\�are also lightweight and compact.Nabtesco began the mass production of precision reduction gears in 1985 as a follower company and now enjoys a 60% share of the global market for industrial robots. We have maintained this position, although the period of the basic patent expired in 2006. As one of our strengths, we have built relations of trust with our customers, who are PDLQO\� LQGXVWULDO� URERW�PDQXIDFWXUHUV��DFURVV�WKH�JOREH�E\�RíHULQJ�DGYDQFHG�WHFKQRORJLHV�DQG�PDNLQJ�H[FHOOHQW�proposals to them.
Results for the Year Ended March 31, 2014 and
the Plan for the Year Ending March 31, 2015
Sales of precision reduction gears decreased only slightly in 2014/3 due to the recovery of demand for industrial robots, despite zero sales of solar tracking equipment, which had been posted in 2013/3.For 2015/3, we expect an increase in sales due to the expansion of demand for the industrial robot.
Business Environment
Demand for industrial robots will further increase in the future, due to increases in the needs for automation across the world. According to a prediction made by the International Federation of 5RERWLFV��,)5���WKH�ZRUOGb V�URERW�PDUNHW�ZLOO�JURZ�DW�&$*5�RI����on a medium- to long-term basis.The machine tool market, which represents the second largest user of precision reduction gears following the industrial robot industry, is also showing an upward trend in line with the growth of the world economy. Particularly in Europe and China, there are high needs for systemization and it is expected that sales of new actuators that integrate precision reduction gears and servomotors as one unit will expand in the future.
Mid-Term Strategies
:H�ZLOO�FRQWLQXH�WR�UHFHLYH�RUGHUV�IURP�H[LVWLQJ�FXVWRPHUV��without fail in the industrial robot industry, while further improving the quality of our products and shortening the time required for delivery in order to achieve higher customer satisfaction.We will promote the establishment of a global production system based on the “local production for local consumption” policy.We will proactively expand our business to new fields and markets by releasing new products.
؞
؞
؞

Nabtesco Group Integrated Report 201422
Growth Strategy of Nabtesco Growth Strategy by Business
New Energy Equipment Business
New Energy Equipment Business
Strengths and Competitive Advantages
Nabtesco provides drive units for wind turbines, which respond quickly to changes in wind conditions to control turbine rotation. We have developed the units based on our technologies for reduction gears used in industrial robots. They are highly evaluated in the market because they provide low backlash and excellent rigidity against severe natural conditions, such as gusty winds, while also being light weight and compact.Our solar tracking equipment for solar thermal power plants can track the sun in an accurate manner, thanks to the DSSOLFDWLRQ�RI�RXU�WHFKQRORJLHV�XVHG�WR�FUHDWH�KLJKO\�SUHFLVH��ULJLG��DQG�HîFLHQW�SUHFLVLRQ�UHGXFWLRQ�JHDUV�IRU�WKH�industrial robotics sector. The equipment is highly resistant to shocks and uses only a small amount of electricity. It is also maintenance-free, helping to reduce the life cycle cost of solar thermal power generation.
Results for the Year Ended March 31, 2014 and
the Plan for the Year Ending March 31, 2015
For 2014/3, sales of our drive units for wind turbines increased on a year-on-year basis, thanks to the extension of the federal renewable electricity production tax credit (PTC) period and to the renewable energy introduction policies enhanced by the Obama Administration in the United States. As for VRODU�WUDFNLQJ�HTXLSPHQW��ZH�UHFRUGHG�QR�VDOHV�IRU�WKH�rVFDO�\HDU�In 2015/3, sales of our drive units for wind turbines will continue to increase, but for solar tracking equipment, we expect no sales due to delays of the expected projects.
Business Environment
There are three major markets for our drive units for wind WXUELQHV��1RUWK�$PHULFD��(XURSH�DQG�&KLQD��0DUNHW�GHPDQG� LV�recovering in Europe due to the rapid increase of offshore wind farms, while in China the government is implementing measures to foster the use of renewable energy. We therefore expect that the business will return to the growth path and achieve further development.For our solar tracking equipment, demand will substantially increase in Africa, the Middle East and Asia. Africa and the Middle East represent the largest market for the equipment.
Mid-Term Strategies
We are targeting new customers for our drive units for wind turbines in the North American and European markets, while enhancing our marketing activities to receive orders from large RíVKRUH�ZLQG�IDUPV��ZKLFK�DUH�H[SHFWHG�WR�JURZ�IXUWKHU�LQ�WKH�future.As for solar tracking equipment, technological innovations will continue to be made in the market, and in response we will work to increase our competitiveness by combining our capabilities, technology & product development and excellence in manufacturing.
؞
؞

Nabtesco Group Integrated Report 201423
Growth Strategy of Nabtesco Growth Strategy by Business
Railroad Vehicle Equipment Business
Comparison of New Car Demand by Region
Railroad Vehicle Equipment Business
Strengths and Competitive Advantages
Since receiving the first order for our air brake equipment from the former Ministry of Railways in 1925, we have been delivering highly reliable brake systems over nearly a century, with an eye to contributing to higher safety technologies for rail transportation in Japan. Our brake units, which comprise multiple brake mechanisms, contribute to space saving as well.Moreover, our door operating systems have been installed on all the Shinkansen bullet train N700 series carriages, being recognized for their proven performance and technologies and for the high–quality after–sale service. We are also proactively expanding the business overseas, and our products are being increasingly used on railway lines across the globe, including high–speed trains in China and Taiwan.
Results for the Year Ended March 31, 2014 and
the Plan for the Year Ending March 31, 2015
For 2014/3, sales increased from the previous year due to increases in sales for high–speed trains in China and growing demand for repair parts in Japan.Also for 2015/3, we expect a year–on–year increase in sales, since the Maintenance, Repair and Overhaul (MRO) business will expand in Japan and demand for Chinese high–speed trains will continue to increase, despite a decrease in the number of newly–installed trains.
Business Environment
We will continue to focus on replacement demand within Japan since the domestic market is mature.In China, while the demand for high–speed trains will reach a peak in 2015 and then stabilize, the subway market will reliably expand in the future.European market is expected to achieve stable growth as the ZRUOGb V�ODUJHVW�UDLOURDG�PDUNHW�
Mid-Term Strategies
In Japan, we will work to improve customer satisfaction towards the expansion of the MRO business. In Southeast Asia, we will win orders for our MRO business in the second–hand railroad vehicle market, while endeavoring to increase sales for subway by making full uses of local resources in China.We will further expand our business globally by fostering the optimization of our development, procurement and production activities based on the tripolar manufacturing system – Japan, China and Europe.
؞
؞
Nabtesco Group Integrated Report 201424
Growth Strategy of Nabtesco Growth Strategy by Business
Commercial Vehicle Equipment Business
-DSDQb V��PW��7UXFN�6DOHV
Commercial Vehicle Equipment Business
Strengths and Competitive Advantages
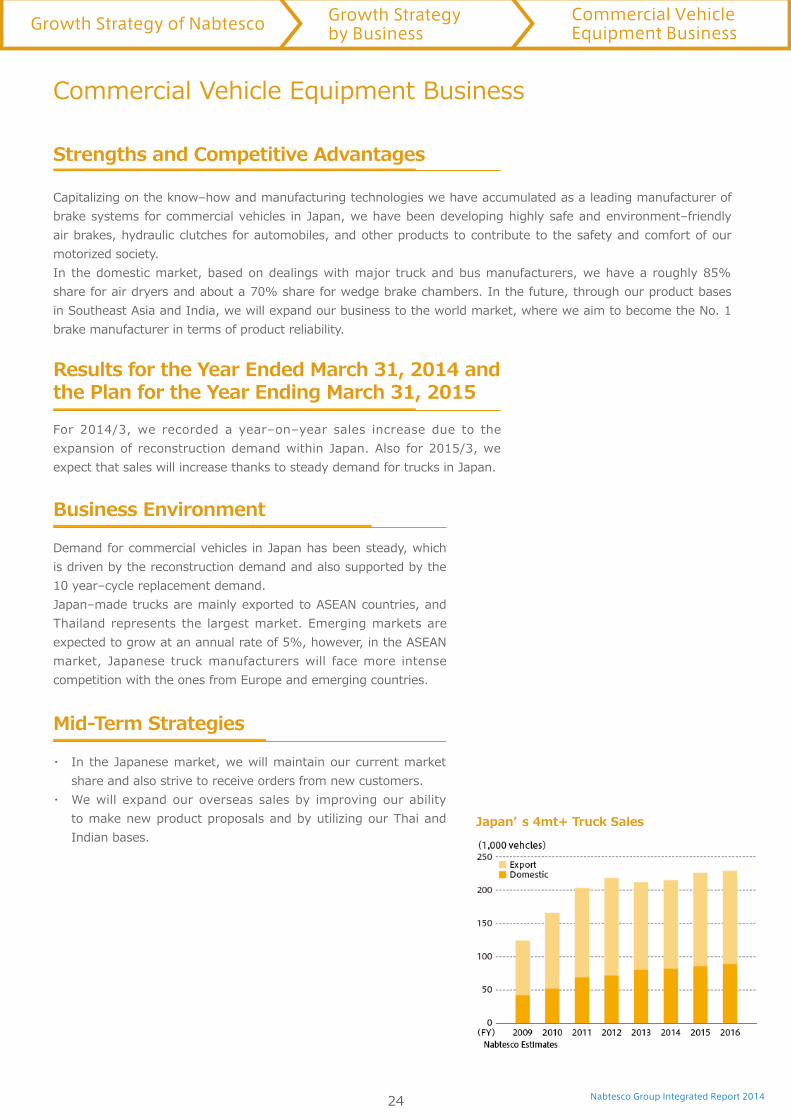
Capitalizing on the know–how and manufacturing technologies we have accumulated as a leading manufacturer of brake systems for commercial vehicles in Japan, we have been developing highly safe and environment–friendly air brakes, hydraulic clutches for automobiles, and other products to contribute to the safety and comfort of our motorized society.In the domestic market, based on dealings with major truck and bus manufacturers, we have a roughly 85% share for air dryers and about a 70% share for wedge brake chambers. In the future, through our product bases in Southeast Asia and India, we will expand our business to the world market, where we aim to become the No. 1 brake manufacturer in terms of product reliability.
Results for the Year Ended March 31, 2014 and
the Plan for the Year Ending March 31, 2015
For 2014/3, we recorded a year–on–year sales increase due to the expansion of reconstruction demand within Japan. Also for 2015/3, we expect that sales will increase thanks to steady demand for trucks in Japan.
Business Environment
Demand for commercial vehicles in Japan has been steady, which is driven by the reconstruction demand and also supported by the 10 year–cycle replacement demand.Japan–made trucks are mainly exported to ASEAN countries, and Thailand represents the largest market. Emerging markets are expected to grow at an annual rate of 5%, however, in the ASEAN market, Japanese truck manufacturers will face more intense competition with the ones from Europe and emerging countries.
Mid-Term Strategies
In the Japanese market, we will maintain our current market share and also strive to receive orders from new customers.We will expand our overseas sales by improving our ability to make new product proposals and by utilizing our Thai and Indian bases.
؞
؞

Nabtesco Group Integrated Report 201425
Growth Strategy of Nabtesco Growth Strategy by Business
Marine Vessel Equipment Business
Global Production of 2–stroke Engines
for Marine Vessels
Marine Vessel Equipment Business
Strengths and Competitive Advantages
Nabtesco supplies main engine remote control systems which are mounted on medium– to large–sized marine vessels. Diesel engines represent the core component of vessels, and we focus on the development of electronic control systems for engines, which will become mainstream in the future, in addition to supplying conventional mechanical control systems. Our electronically controlled high–speed hydraulic valves optimize fuel injection and H[KDXVW�YDOYH�FRQWURO�IRU�KLJKHU�IXHO�HîFLHQF\�DQG�D�ORZHU�HQYLURQPHQWDO�LPSDFW�In addition to engineers stationed at our major bases in Japan, Singapore, the Netherlands, China, and South Korea, we also have a global network of service engineers with excellent technical skills to support the safe navigation of vessels.
Results for the Year Ended March 31, 2014 and
the Plan for the Year Ending March 31, 2015
For 2014/3, sales increased from the previous year thanks to recovery of orders for new shipbuilding. Sales will continue to increase through 2015/3, driven by orders for new shipbuilding, including the existing backlog.
Business Environment
'XH� WR� WKH� UHFRYHU\�RI� WKH�ZRUOGb V�QHZ�VKLSEXLOGLQJ�PDUNHW��demand for new shipbuilding and for engines will remain high until the middle of 2017/3. Demand for electronically controlled engines will also expand due to the enforcement of Tier 3 Vehicle Emission and Fuel Standards globally.
Mid-Term Strategies
In order to flexibly response to the market needs, we will create new technologies and products, including those for electronically controlled engines and exhaust gas emission treatment systems.Based on the concept of “ local product ion for loca l consumption,” we will put our global tripolar (Japan, China and South Korea) manufacturing system into gear, thereby improving our quality, cost and delivery (QCD).We will offer services with even higher quality by making proposals for preventive maintenance and expanding our service network.
؞
؞
؞

Nabtesco Group Integrated Report 201426
Growth Strategy of Nabtesco Growth Strategy by Business
Aircraft Equipment Business
Transition of Delivery of Aircrafts
Aircraft Equipment Business
Strengths and Competitive Advantages
:H�DUH�FRQGXFWLQJ�WKH�DLUFUDIW�HTXLSPHQW�EXVLQHVV�ZLGHO\��WDUJHWLQJ�ERWK�-DSDQb V�QDWLRQDO�GHIHQVH�rHOG�DQG�WKH�JOREDO�FLYLO�DYLDWLRQ�rHOG��6SHFLrFDOO\�ZH�VXSSO\�sLJKW�FRQWURO�DFWXDWLRQ�V\VWHPV�� WKH�FRUH�FRPSRQHQW� WR�FRQWURO�WKH�sLJKW�DWWLWXGH�RI�DLUFUDIW��DQG�YDULRXV�RWKHU�HTXLSPHQW�WR�WKH�ZRUOGb V�OHDGLQJ�DLUFUDIW�PDQXIDFWXUHUV��:H�DOVR�provide them with parts as aftermarket support.,Q� WKH�ZRUOG�RI�DYLDWLRQ��ZKHUH� VDIHW\�PXVW� FRPH� ILUVW��ZH�KDYH�DFFXPXODWHG� WKH�ZRUOGb V�EHVW�SURGXFWLRQ�technologies and know-how,. The expertise is incorporated into our products including the high voltage electric power distribution unit, which is adopted for the leading-edge Boeing 787 aircraft, along with other aircraft equipment. We will accelerate the development of systems for new aircraft models to be operated in the future, thereby supporting aircraft safety and security.
Results for the Year Ended March 31, 2014 and
the Plan for the Year Ending March 31, 2015
For 2014/3, sales increased from the previous year due to the expansion of GHPDQG�IRU�FLYLO�DLUFUDIW�DQG�WKH�IRUHLJQ�H[FKDQJH�HíHFW�In 2015/3, demand from the Japanese Ministry of Defense will remain on the same level, while the civil aviation market will enter a period of change toward the next phase of growth. Accordingly, sales will remain on the same level as the previous year.
Business Environment
,Q�WKH�QDWLRQDO�GHIHQVH�rHOG��WKH�EXVLQHVV�ZLOO�UHPDLQ�VWDEOH�In the civil aviation field, aircraft production will increase only slightly during the current mid-term management plan period, although aircraft operation is expected to double over the next two decades. From FY2017 we will start supplying our products fully in progress under the new civil aircraft programs, for the Boeing 737 MAX and for MRJ of Mitsubishi Aircraft Corporation.We also expect for the recovery of the Maintenance, Repair and Overhaul (MRO) market.
Mid-Term Strategies
We will maintain our business with the Japanese Ministry of Defense, while working on more proposals for new civil aircraft projects.We will establish and enhance our MRO system through a customer-oriented approach. Moreover, improvement of profitability through cost reduction and productivity enhancement is targeted as well.We will increase our production capacity for the new programs for Boeing and Mitsubishi Aircraft Corporation, which will be implemented on a full scale in and after FY2017.
؞
؞
؞
Nabtesco Group Integrated Report 201427
Growth Strategy of Nabtesco Growth Strategy by Business
Hydraulic Equipment Business
Sales by Geographic Segment
World Demand for Excavators
Hydraulic Equipment Business
Strengths and Competitive Advantages
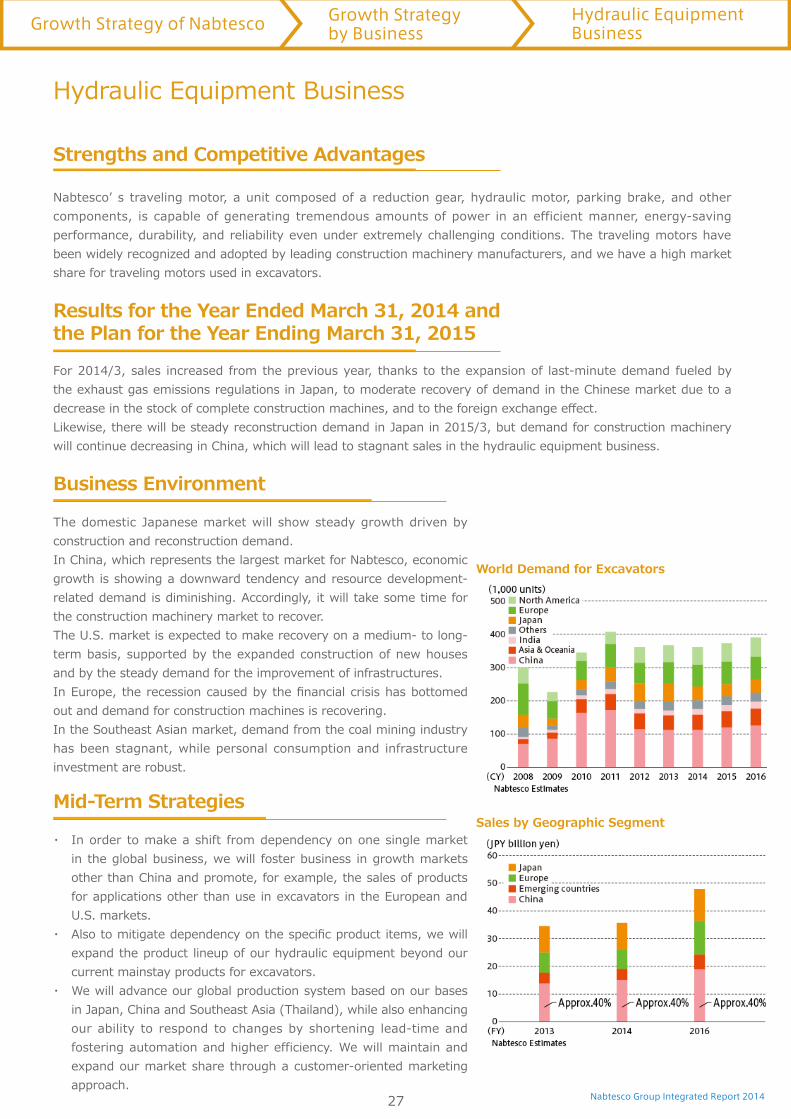
1DEWHVFRb V� WUDYHOLQJ�PRWRU��D�XQLW� FRPSRVHG�RI�D� UHGXFWLRQ�JHDU��K\GUDXOLF�PRWRU��SDUNLQJ�EUDNH��DQG�RWKHU�components, is capable of generating tremendous amounts of power in an efficient manner, energy-saving performance, durability, and reliability even under extremely challenging conditions. The traveling motors have been widely recognized and adopted by leading construction machinery manufacturers, and we have a high market share for traveling motors used in excavators.
Results for the Year Ended March 31, 2014 and
the Plan for the Year Ending March 31, 2015
For 2014/3, sales increased from the previous year, thanks to the expansion of last-minute demand fueled by the exhaust gas emissions regulations in Japan, to moderate recovery of demand in the Chinese market due to a GHFUHDVH�LQ�WKH�VWRFN�RI�FRPSOHWH�FRQVWUXFWLRQ�PDFKLQHV��DQG�WR�WKH�IRUHLJQ�H[FKDQJH�HíHFW�Likewise, there will be steady reconstruction demand in Japan in 2015/3, but demand for construction machinery will continue decreasing in China, which will lead to stagnant sales in the hydraulic equipment business.
Business Environment
The domestic Japanese market will show steady growth driven by construction and reconstruction demand.In China, which represents the largest market for Nabtesco, economic growth is showing a downward tendency and resource development-related demand is diminishing. Accordingly, it will take some time for the construction machinery market to recover. The U.S. market is expected to make recovery on a medium- to long-term basis, supported by the expanded construction of new houses and by the steady demand for the improvement of infrastructures.,Q�(XURSH��WKH�UHFHVVLRQ�FDXVHG�E\�WKH�rQDQFLDO�FULVLV�KDV�ERWWRPHG�out and demand for construction machines is recovering.In the Southeast Asian market, demand from the coal mining industry has been stagnant, while personal consumption and infrastructure investment are robust.
Mid-Term Strategies
In order to make a shift from dependency on one single market in the global business, we will foster business in growth markets other than China and promote, for example, the sales of products for applications other than use in excavators in the European and U.S. markets.$OVR�WR�PLWLJDWH�GHSHQGHQF\�RQ�WKH�VSHFLrF�SURGXFW�LWHPV��ZH�ZLOO�expand the product lineup of our hydraulic equipment beyond our current mainstay products for excavators.We will advance our global production system based on our bases in Japan, China and Southeast Asia (Thailand), while also enhancing our ability to respond to changes by shortening lead-time and fostering automation and higher efficiency. We will maintain and expand our market share through a customer-oriented marketing approach.
؞
؞
؞

Nabtesco Group Integrated Report 201428
Growth Strategy of Nabtesco Growth Strategy by Business
Automatic Doors Business
GDP Growth Rate
Automatic Doors Business
Strengths and Competitive Advantages
6LQFH�EHFRPLQJ�WKH�rUVW�FRPSDQ\�WR�UHOHDVH�-DSDQ�PDGH�DXWRPDWLF�GRRUV�WR�WKH�PDUNHW� LQ�������ZH�KDYH�NHSW�1$%&2�GRRUVb�QLFKH�DV�WKH�WRS�DXWRPDWLF�GRRU�EUDQG�LQ�-DSDQ�ZLWK�DERXW�D�����PDUNHW�VKDUH��$OVR�LQ�WKH�ZRUOG�market, we are one of the leading automatic door manufacturers with about a 20% share, operating the business under the GILGEN brand in Switzerland and other European countries and under the GYRO TECH brand in North America.We supply a range of products in addition to automatic doors for buildings, such as automatic doors for special applications and for industrial use. We also offer entire value chain services integrating supply, installation, PDLQWHQDQFH�DQG�PDQDJHPHQW��)RU�WKH�DXWRPDWLF�GRRU�EXVLQHVV��D�dFDVK�FRZb�EXVLQHVV�IRU�WKH�FRPSDQ\��ZH�KDYH�established a system that can greatly withstand economic changes.
Results for the Year Ended March 31, 2014 and
the Plan for the Year Ending March 31, 2015
For 2014/3, sales increased from the previous year due to the robust demand in Japanese and overseas markets DQG�WKH�IRUHLJQ�H[FKDQJH�HíHFW�For 2015/3, we expect a slight increase in sales in light of the fact that Japan and Switzerland, which are the main markets for our automatic door business, have already matured.
Business Environment
7KH� -DSDQHVH�DQG�(XURSHDQ�PDUNHWV�DUH�QRW�YXOQHUDEOH� WR�HFRQRPLF� FKDQJHV��ZKLOH�ZH�GRQb W� H[SHFW� WKHLU�TXDQWLWDWLYH�H[SDQVLRQ��7KH�VLJQLrFDQFH�RI� WKH�PDLQWHQDQFH��VHUYLFH�DQG�UHSODFHPHQW�EXVLQHVVHV� LV� LQFUHDVLQJ� LQ�these markets and they provide us with a stable revenue source. We therefore regard them as the most important markets.In the United States, the real property market is showing more stability toward recovery after the Financial Crisis. Automatic door market is expanding, albeit at a moderate pace.,Q�&KLQD�� WKHUH�PLJKW�EH�VHWEDFNV�DV�HFRQRPLF�JURZWK�VORZV�GRZQ�� LQ�SDUWLFXODU� WKH�DGYHUVH�HíHFW�RI�H[FHVVLYH�investments in the real property market. Actual demand, including demand for automatic doors, however, will continue to expand at a steady pace,.The automatic door market is expected to grow on a long-term basis not only in China but also in other emerging countries, including India and other Asian countries, the Middle East, and Russia.
Mid-Term Strategies
We will expand the business scale through M&A of overseas sales companies.In addition to promoting the sales of automatic doors, we will win more orders in the maintenance and repair business and enhance our business foundation through value chain management.We will expand the product lineup according to the market and regional characteristics and globally conduct business operations LQ�WKH�ZRUOGb V�IRXU�UHJLRQV��-DSDQ��(XURSH��1RUWK�$PHULFD�DQG�China).We will offer reliable after-sale service to improve customer VDWLVIDFWLRQ��ZKLFK�ZLOO�LQ�WXUQ�LQFUHDVH�RXU�SURrWDELOLW\�
؞
؞
؞
؞

Nabtesco Group Integrated Report 201429
Growth Strategy of Nabtesco Growth Strategy by Business
Packaging Machines Business
Packaging Machines Business
Strengths and Competitive Advantages
Nabtesco has long years of experience in the manufacture of automated weighing equipment, packaging machines, packaging-related systems, and even entire packaging plants, which are essential for filling and packaging SURFHVVHV��2XU�DXWRPDWLF�rOOHUV�VHDOHUV�IRU�UHWRUW�SRXFK�IRRGV��ZKLFK�VKRZ�KLJK�SHUIRUPDQFH�LQ�D�FRPSDFW�VSDFH�and provide high sealing tightness to protect the safety and hygiene of food, make up the largest share in the Japanese market and have garnered a high level of trust from food manufacturers.In Japan, following the enforcement of the Act on the Promotion of Sorted Collection and Recycling of Containers DQG�3DFNDJLQJ�LQ�������GHPDQG�IRU�SDFNDJLQJ�PDFKLQHV�IRU�UHrOOV��LQFOXGLQJ�WKRVH�IRU�FKHPLFDO�SURGXFWV��KDV�EHHQ�rapidly expanding. Demand for spout pouches has also increased recently. Further, more and more food plants are introducing X-ray or infrared camera testing equipment to ensure food safety. In response to these contemporary needs, we are constantly working to innovate and develop more advanced technologies.
Results for the Year Ended March 31, 2014 and
the Plan for the Year Ending March 31, 2015
For 2014/3, sales decreased from the previous year following the end of the special demand from the Japanese sugar industry since 2013/3 and due to a decrease in sales to overseas customers. For 2015/3, however, we expect an increase in sales due to an increase in overseas sales.
Business Environment
The domestic market for packaging machines for retort pouch products has matured as a whole, but demand for machines for retort pouch foods will steadily increase in accordance with the increased tendency of the home meal replacement and solitary PHDO�DQG�WKH�JURZWK�RI�VR�FDOOHG�b SULYDWH�EUDQGb�IRRG�SURGXFWV�Outside Japan, the retort pouch packaging machine market is growing, and the demand for the machines is expected to increase in North America and other regions, where more products will be sold in retort pouches. Also in emerging economies including &KLQD��UHWRUW�SRXFK�SDFNDJLQJ�PDFKLQHV�ZLOO�JURZ� LQ�XVH��rUVW� LQ�WKH�rHOG�WKDW�JLYHV�SULRULW\�WR�TXDOLW\�
Mid-Term Strategies
In North America and China where the mass production market will rapidly grow, we will utilize our local bases and enhance our sales networks to promote sales and increase our shares in overseas markets.:H�ZLOO� HVWDEOLVK� DFRPPXQLW\�EDVHG� VHUYLFH� V\VWHP� WR�develop the Maintenance, Repair and Overhaul (MRO) business DQG�LQFUHDVH�SURrWDELOLW\�
؞
؞
Nabtesco Group Integrated Report 2014
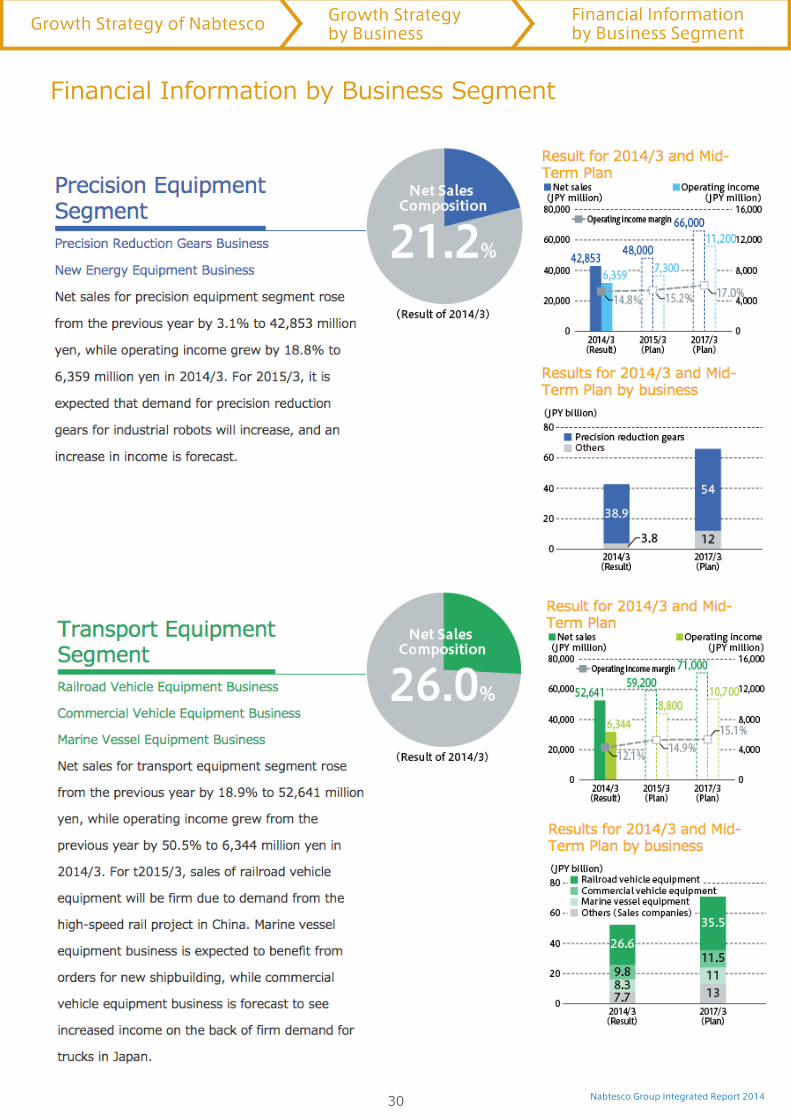
Financial Information by Business Segment
30
Growth Strategy of Nabtesco Growth Strategy by Business
Financial Information by Business Segment
Nabtesco Group Integrated Report 201431
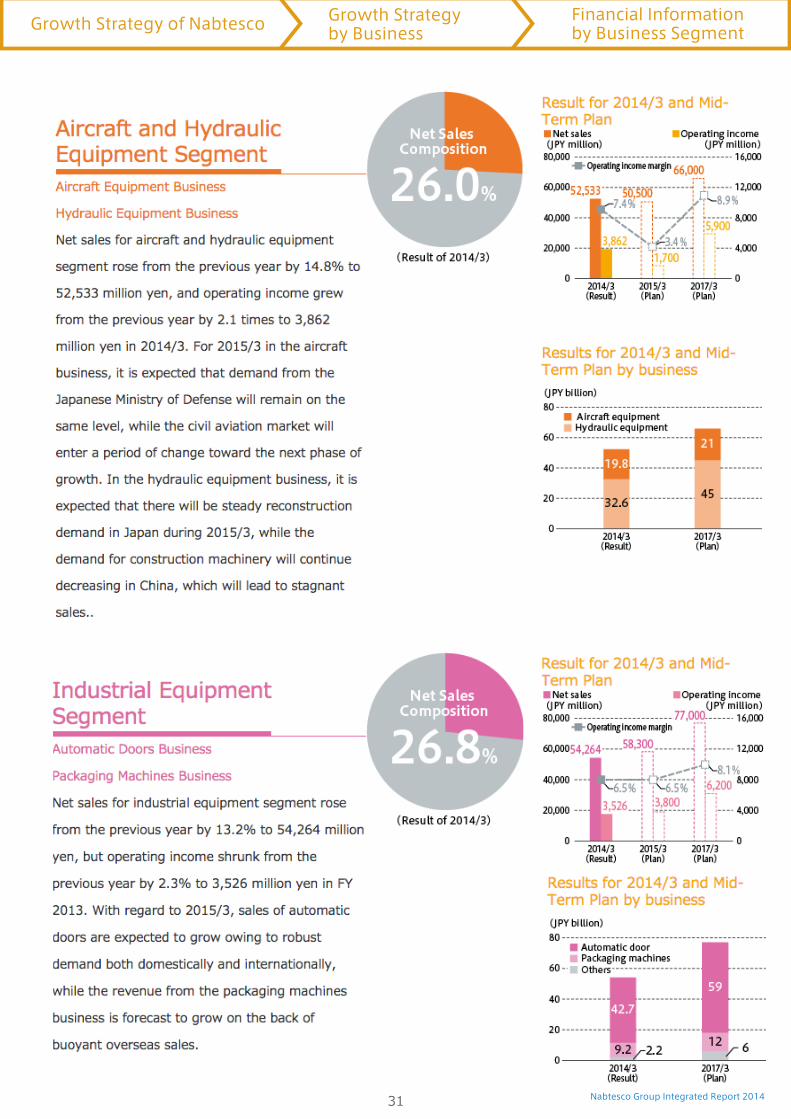
Growth Strategy of Nabtesco Growth Strategy by Business
Financial Information by Business Segment

Nabtesco Group Integrated Report 2014
ॼঈॸ५॥ঝشউभகୗ
R&D Topics
32
Growth Strategy of Nabtesco R&D Topics
Nabtesco Group Integrated Report 2014
ॼঈॸ५॥ঝشউभகୗ
33
Growth Strategy of Nabtesco R&D Topics

Nabtesco Group Integrated Report 2014
ॼঈॸ५॥ঝشউभகୗ
34
Growth Strategy of Nabtesco R&D Topics

Nabtesco Group Integrated Report 2014
ॼঈॸ५॥ঝشউभகୗ
35
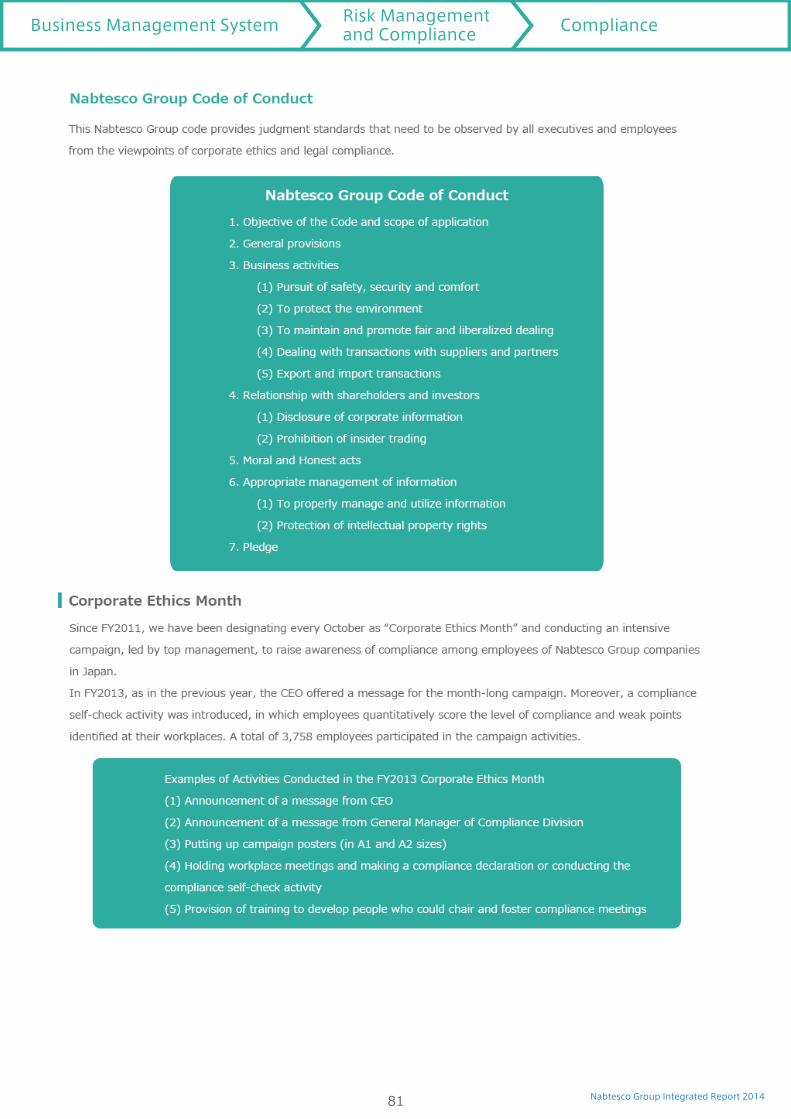
Intellectual Property StrategyImplementing Intellectual Property Strategy to Lead the Business Strategy
Growth Strategy of Nabtesco Intellectual Property Strategy
Nabtesco Group Integrated Report 2014
ॼঈॸ५॥ঝشউभகୗ
36
Growth Strategy of Nabtesco Intellectual Property Strategy
Nabtesco Group Integrated Report 201437
Growth Strategy of Nabtesco Intellectual Property Strategy

Nabtesco Group Integrated Report 201438
Supporting the Growth Strategy
�4XDOLW\�DQG�6DIHW\
�+XPDQ�&DSLWDO
(QYLURQPHQW
�6XSSO\�&KDLQ�0DQDJHPHQW
�&RPPXQLW\�DQG�6RFLHW\
�7KLUG�3DUW\�9HULrFDWLRQ�5HSRUW
Nabtesco Group Integrated Report 2014
Quality and SafetyQuality and PL management
Supporting the Growth Strategy Quality and Safety Quality and PL management
39

Nabtesco Group Integrated Report 201440
Supporting the Growth Strategy Quality and Safety Quality and PL management
Nabtesco Group Integrated Report 201441
Supporting the Growth Strategy Quality and Safety Quality and PL management
Nabtesco Group Integrated Report 201442
Supporting the Growth Strategy Quality and Safety Quality and PL management

Nabtesco Group Integrated Report 201443
Supporting the Growth Strategy Quality and Safety Quality and PL management

Nabtesco Group Integrated Report 2014
Education and Training (R&D and Manufacturing Quality)
44
Supporting the Growth Strategy Quality and Safety Education and Training

Nabtesco Group Integrated Report 201445
Supporting the Growth Strategy Quality and Safety Education and Training
Nabtesco Group Integrated Report 201446
Supporting the Growth Strategy Quality and Safety Education and Training

Nabtesco Group Integrated Report 2014
Human Capital(íRUWV�WR�3URWHFW�+XPDQ�5LJKWV
47
Supporting the Growth Strategy Human Capital Efforts to Protect Human Rights
Nabtesco Group Integrated Report 2014
Management of Occupational Health and Safety
48
Supporting the Growth Strategy Human Capital Management of Occupational Health and Safety

Nabtesco Group Integrated Report 2014
Health Management
49
Supporting the Growth Strategy Human Capital Management of Occupational Health and Safety

Nabtesco Group Integrated Report 201450
Supporting the Growth Strategy Human Capital Management of Occupational Health and Safety
Nabtesco Group Integrated Report 201451
Supporting the Growth Strategy Human Capital Management of Occupational Health and Safety
Nabtesco Group Integrated Report 2014
Fostering Workplace Diversity
52
Supporting the Growth Strategy Human Capital Fostering Workplace Diversity
Nabtesco Group Integrated Report 201453
Supporting the Growth Strategy Human Capital Fostering Workplace Diversity

Nabtesco Group Integrated Report 2014
Labor Management Relations
54
Supporting the Growth Strategy Human Capital Fostering Workplace Diversity
Nabtesco Group Integrated Report 2014
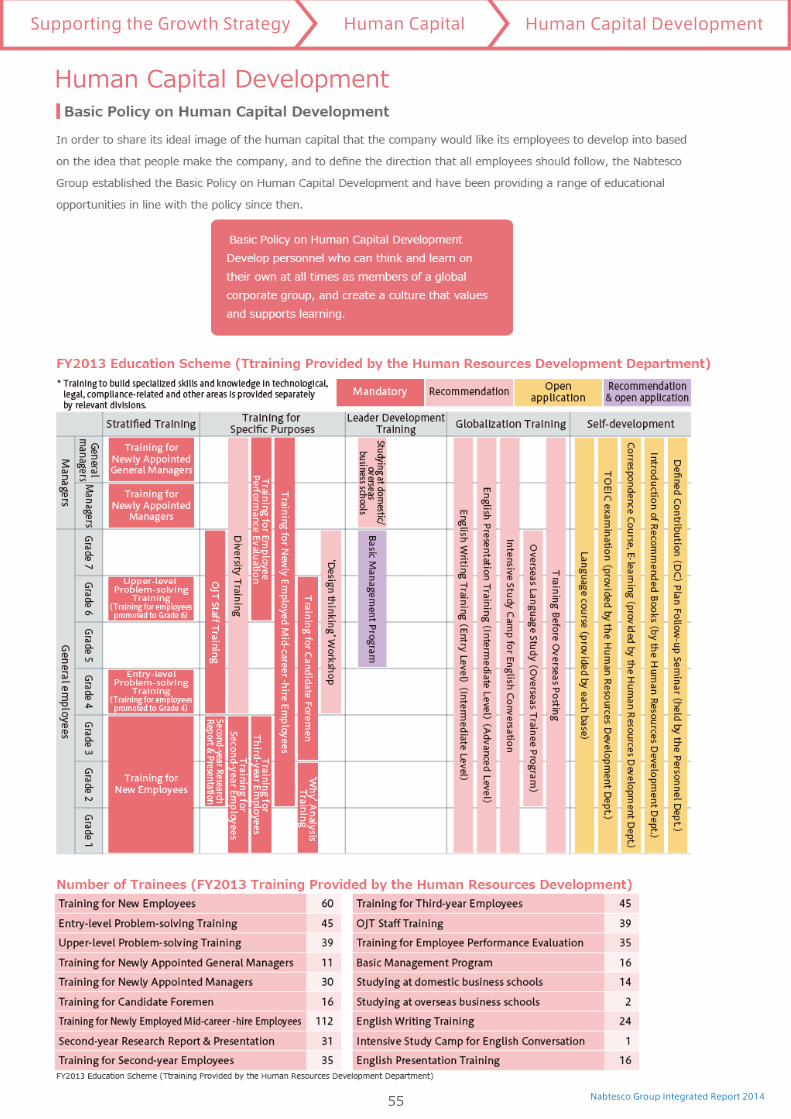
Human Capital Development
55
Supporting the Growth Strategy Human Capital Human Capital Development

Nabtesco Group Integrated Report 2014
Education
56
Supporting the Growth Strategy Human Capital Human Capital Development

Nabtesco Group Integrated Report 2014
EnvironmentEnvironmental Management
57
Supporting the Growth Strategy Environment Environmental Management
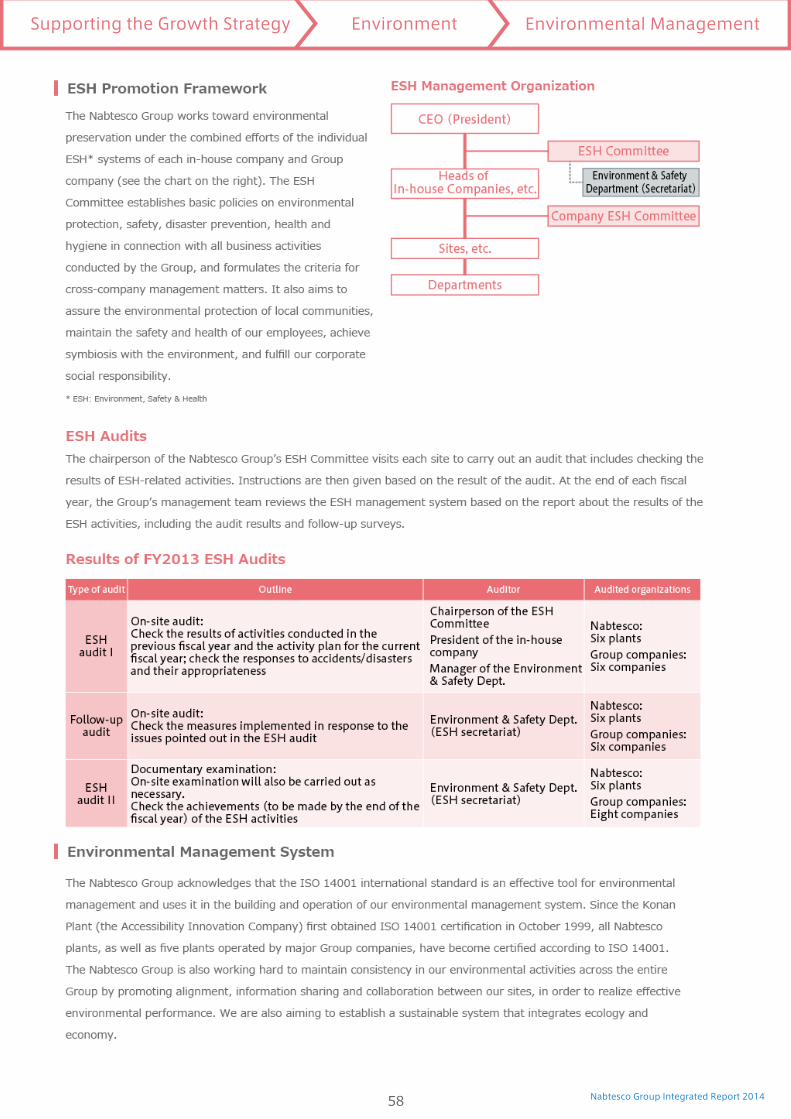
Nabtesco Group Integrated Report 201458
Supporting the Growth Strategy Environment Environmental Management

Nabtesco Group Integrated Report 201459
Supporting the Growth Strategy Environment Environmental Management

Nabtesco Group Integrated Report 2014
Combating Climate Change
60
Supporting the Growth Strategy Environment Combating Climate Change
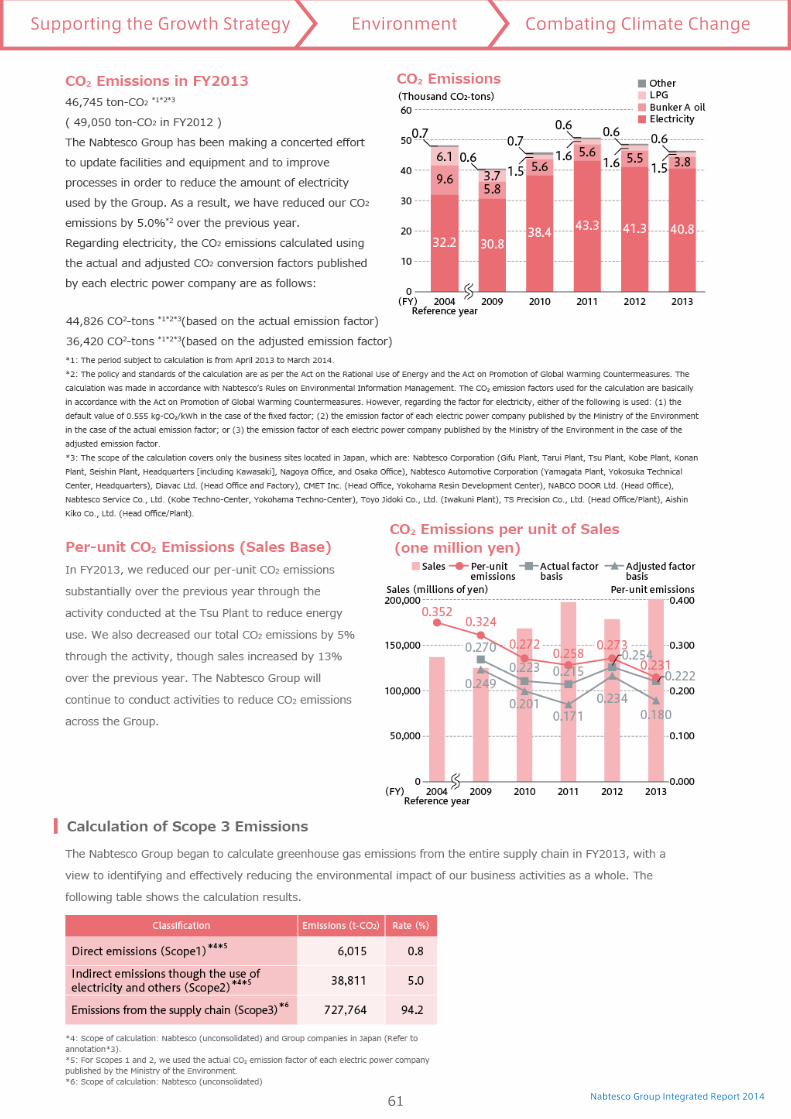
Nabtesco Group Integrated Report 201461
Supporting the Growth Strategy Environment Combating Climate Change
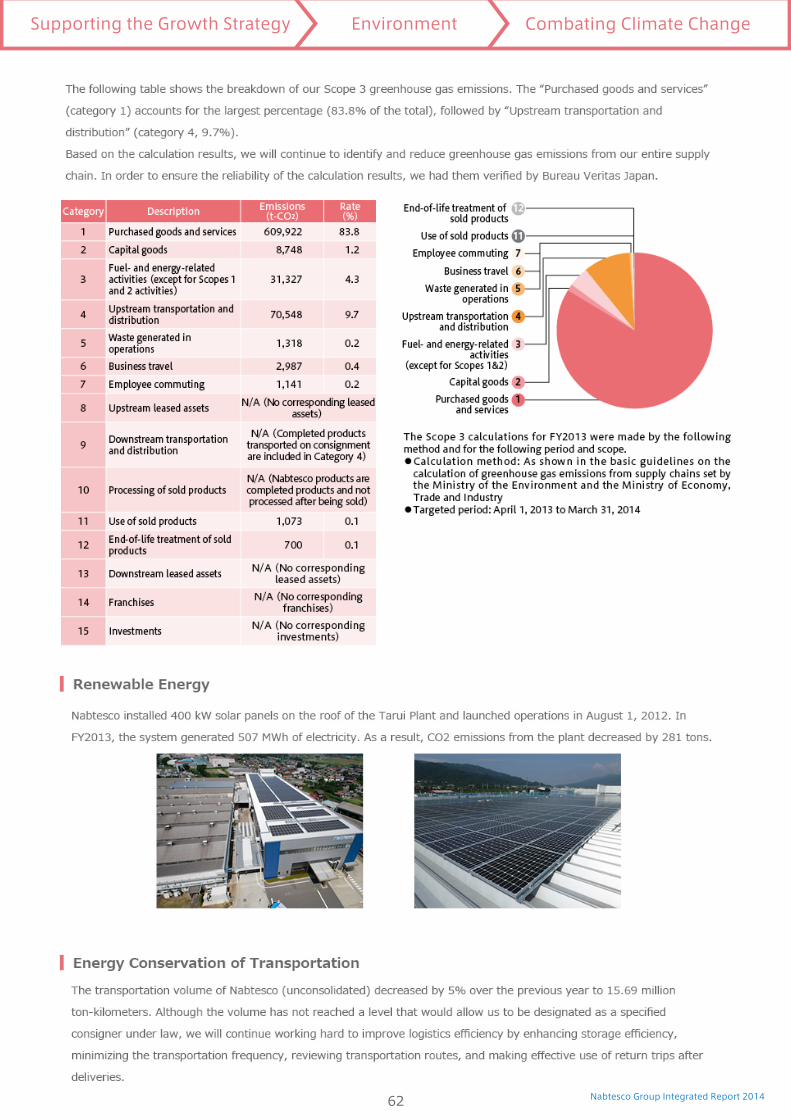
Nabtesco Group Integrated Report 201462
Supporting the Growth Strategy Environment Combating Climate Change
Nabtesco Group Integrated Report 201463
Supporting the Growth Strategy Environment Combating Climate Change
Nabtesco Group Integrated Report 201464
Supporting the Growth Strategy Environment Combating Climate Change
Nabtesco Group Integrated Report 2014
Management of Waste and Other Emissions
65
Supporting the Growth Strategy Environment Management of Waste and Other Emissions
Nabtesco Group Integrated Report 201466
Supporting the Growth Strategy Environment Management of Waste and Other Emissions
Nabtesco Group Integrated Report 201467
Supporting the Growth Strategy Environment Management of Waste and Other Emissions

Nabtesco Group Integrated Report 2014
Supply Chain Management
Supporting the Growth Strategy Supply Chain Management
68

Nabtesco Group Integrated Report 201469
Supporting the Growth Strategy Supply Chain Management

Nabtesco Group Integrated Report 201470
Supporting the Growth Strategy Supply Chain Management
Nabtesco Group Integrated Report 2014
Community and Society
71
Supporting the Growth Strategy Community and Society
Nabtesco Group Integrated Report 201472
Supporting the Growth Strategy Community and Society
Nabtesco Group Integrated Report 2014
7KLUG�3DUW\�9HULrFDWLRQ�5HSRUW
73
Supporting the Growth Strategy Third-Party Verification Report
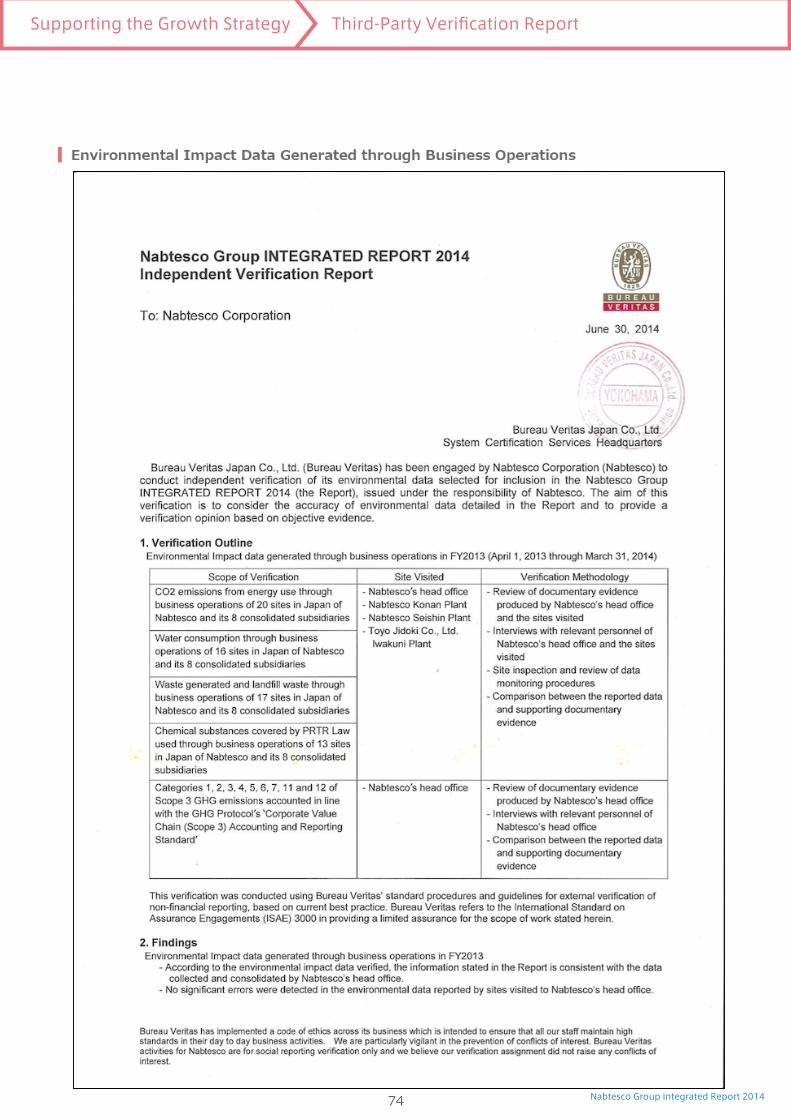
Nabtesco Group Integrated Report 201474
Supporting the Growth Strategy Third-Party Verification Report

Nabtesco Group Integrated Report 201475
Business Management System
�&RUSRUDWH�*RYHUQDQFH
�5LVN�0DQDJHPHQW��&RPSOLDQFH
�(QVXULQJ�0DQDJHPHQW�7UDQVSDUHQF\
�0DQDJHPHQW

Nabtesco Group Integrated Report 2014
Corporate Governance
76
Business Management System Corporate Governance
Nabtesco Group Integrated Report 2014
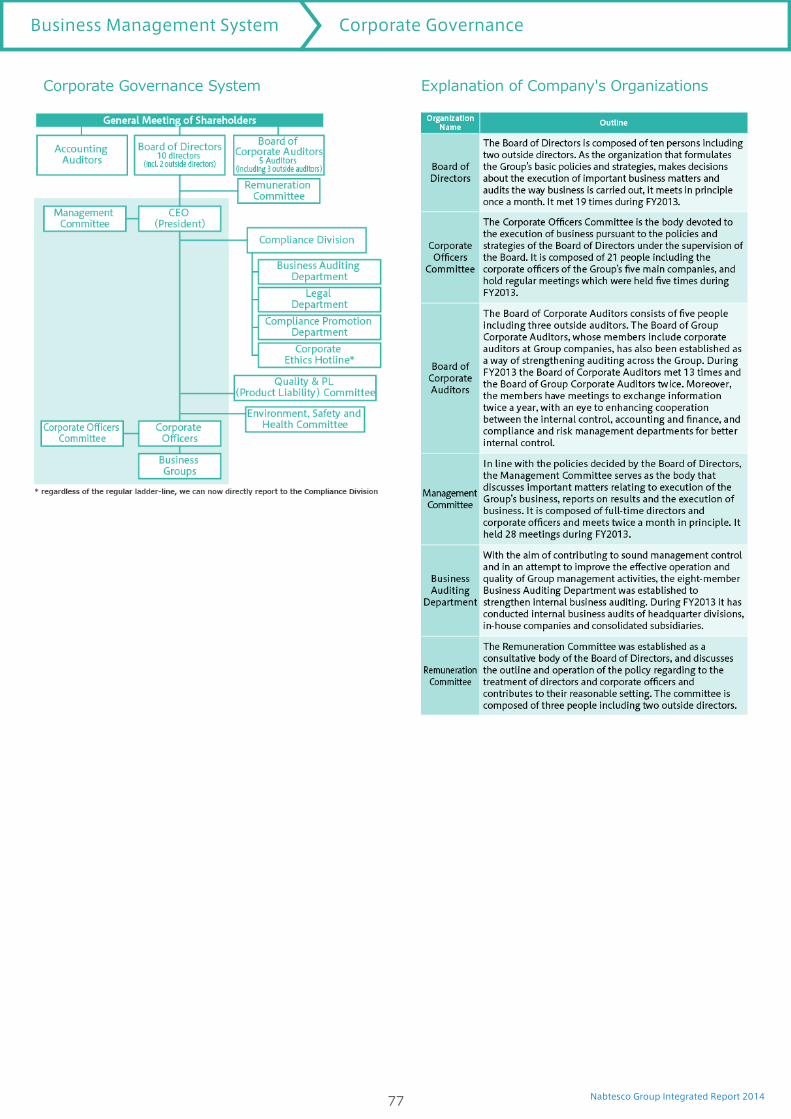
Corporate Governance System Explanation of Company's Organizations
77
Business Management System Corporate Governance

Nabtesco Group Integrated Report 201478
Business Management System Corporate Governance
Nabtesco Group Integrated Report 2014
Risk Management
79
Business Management System Risk Management and Compliance Risk Management

Nabtesco Group Integrated Report 2014
Compliance
80
Business Management System Risk Management and Compliance Compliance
Nabtesco Group Integrated Report 201481
Business Management System Risk Management and Compliance Compliance

Nabtesco Group Integrated Report 201482
Business Management System Risk Management and Compliance Compliance
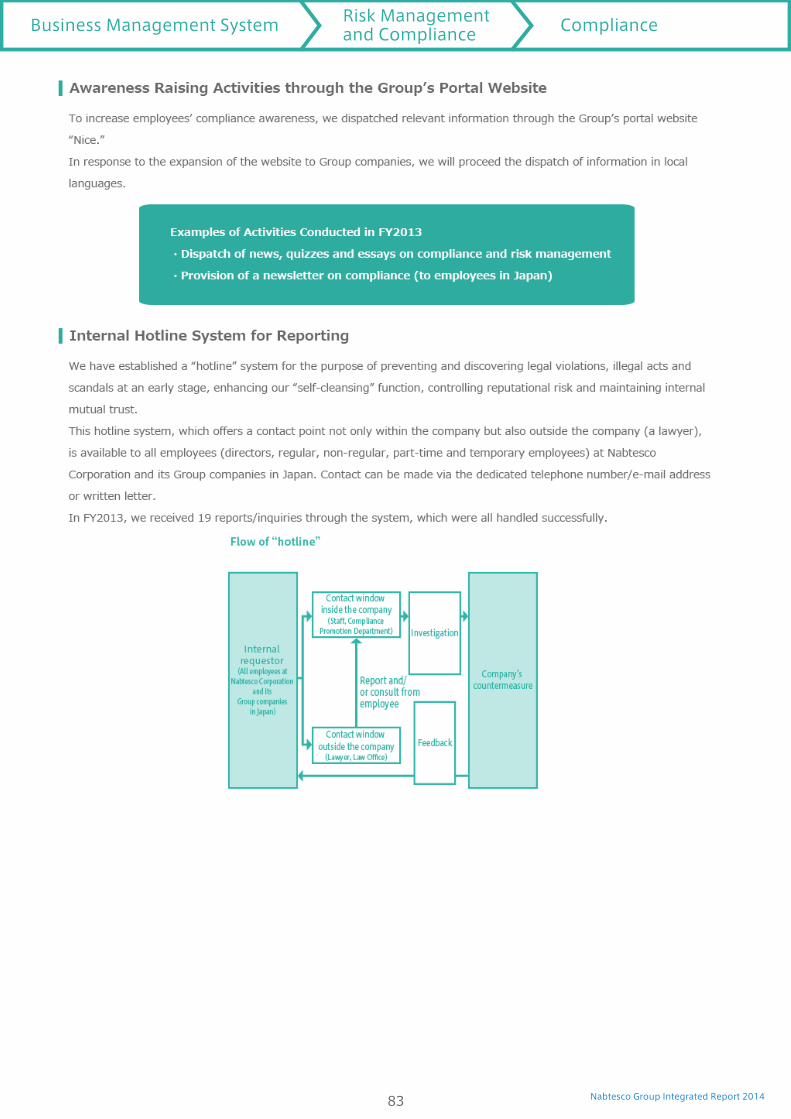
Nabtesco Group Integrated Report 201483
Business Management System Risk Management and Compliance Compliance

Nabtesco Group Integrated Report 2014
Activities at Overseas Group Companies
84
Business Management System Risk Management and Compliance
Activities at Overseas Group Companies

Nabtesco Group Integrated Report 2014
Ensuring Management Transparency
85
Business Management System Ensuring Management Transparency
Nabtesco Group Integrated Report 201486
Business Management System Ensuring Management Transparency
Nabtesco Group Integrated Report 201487
Business Management System Ensuring Management Transparency
Nabtesco Group Integrated Report 201488
Business Management System Ensuring Management Transparency
Nabtesco Group Integrated Report 2014
Management
89
Business Management System Management
Nabtesco Group Integrated Report 201490
Business Management System Management
Nabtesco Group Integrated Report 201491
Business Management System Management
Nabtesco Group Integrated Report 201492
Business Management System Management
Nabtesco Group Integrated Report 2014
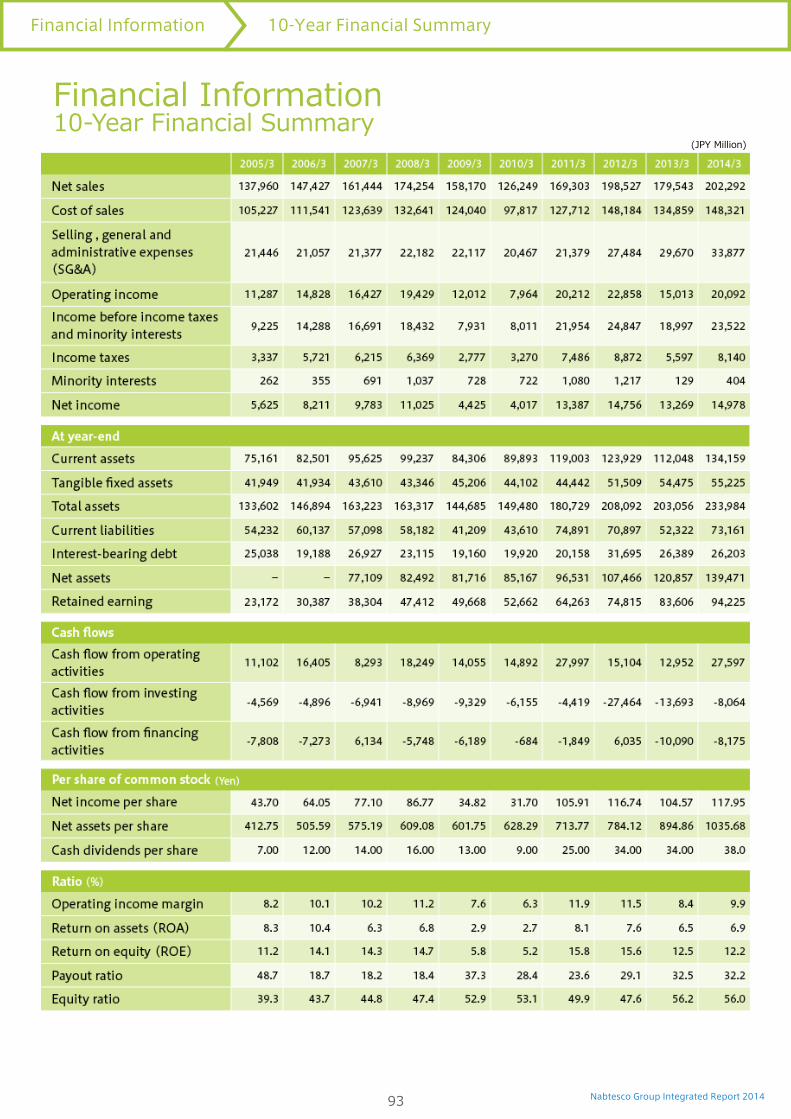
Financial Information10-Year Financial Summary
(JPY Million)
93
Financial Information 10-Year Financial Summary
Nabtesco Group Integrated Report 2014
Financial Perfomance
Operating Results
Despite the moderate rebound of the European economy in addition to the recovery trend in the U.S. economy, the outlook for business conditions surrounding Nabtesco of the year ended March 31, 2014 remained uncertain due to a slowdown in the Chinese HFRQRP\�DQG�D�GRZQZDUG�HFRQRPLF�WUHQG�UHsHFWLQJ�WKH�FXUUHQF\�GHSUHFLDWLRQ�LQ�6RXWKHDVW�$VLD��DPRQJ�RWKHU�IDFWRUV�
Meanwhile, the Japanese economy saw signs of a moderate pickup on the back of an upward trend in equipment spending by companies resulting from the cheaper yen and higher stock prices, which were boosted by the economic policies of the Japanese government as well as the monetary measures adopted by the Bank of Japan.
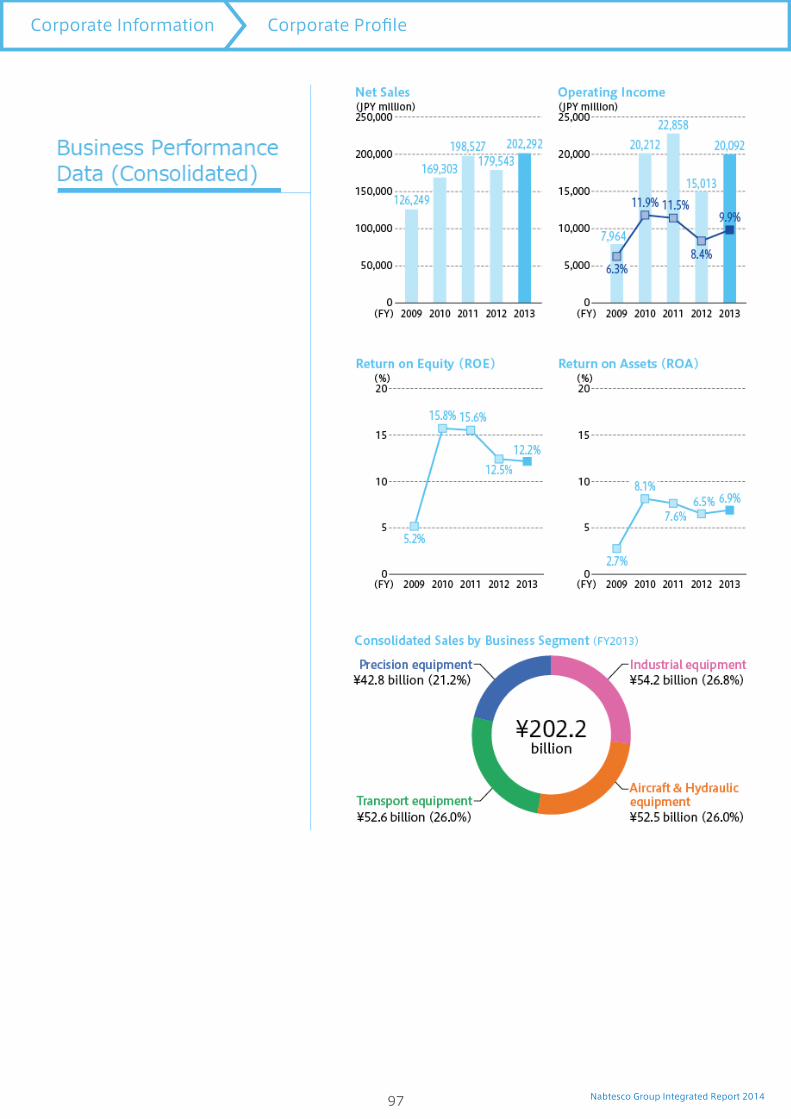
Under these circumstances, although sales declined for packaging machines and precision reduction gears, net sales increased IURP�WKH�SUHYLRXV�\HDU��UHsHFWLQJ�WKH�JURZWK� LQ�VDOHV�RI�UDLOURDG�YHKLFOH�HTXLSPHQW��FRPPHUFLDO�YHKLFOH�HTXLSPHQW��DQG�PDULQH�YHVVHO�HTXLSPHQW��,Q�DGGLWLRQ��WKHUH�ZHUH�EHQHrWV�IURP�WKH�GHSUHFLDWLRQ�LQ�WKH�\HQb V�YDOXH�DJDLQVW�PDMRU�FXUUHQFLHV�LQ�DXWRPDWLF�doors, hydraulic equipment, and aircraft equipment businesses. As a result, consolidated net sales increased by 22,748 million yen (12.7%) to 202,292 million yen.
Operating income rose 5,079 million yen (up 33.8%) to 20,092 million yen. At the same time, the operating margin ended up 1.5 percentage points to 9.9%.
Non-operating income came to 4,642million yen, while non-operating expenses stood at 508 million yen. As a result, ordinary income grew 6,337 million yen (up 35.4%) on a year-on-year basis to 24,227 million yen. At the same time, non-operating income URVH�������PLOOLRQ�\HQ�WR�������PLOOLRQ�\HQ��UHsHFWLQJ�DQ�LQFUHDVH�LQ�LQYHVWPHQW�JDLQV�IURP�HTXLW\�PHWKRG�DîOLDWHV�DQG�WKH�SRVWLQJ�of gains on foreign exchange translations.
Extraordinary gains decreased 947million yen from the previous year to 342 million yen, primarily attributable to the disappearance of negative goodwill posted in the same period a year earlier after the conversion of a group company into a wholly owned VXEVLGLDU\�YLD�D�VWRFN�WUDQVIHU��$W�WKH�VDPH�WLPH��H[WUDRUGLQDU\�ORVVHV�URVH�����PLOOLRQ�\HQ�WR�������PLOOLRQ�\HQ��PDLQO\�UHsHFWLQJ�D�ORVV�RQ�UHYLVLRQV�WR�WKH�UHWLUHPHQW�EHQHrW�SODQ�
$V�D�UHVXOW��QHW�LQFRPH�IRU�WKH�FRQVROLGDWHG�rVFDO�\HDU�XQGHU�UHYLHZ�LQFUHDVHG�������PLOOLRQ�\HQ�IURP�WKH�SUHYLRXV�\HDU�WR��������million yen. Net income per share came to 117.95 yen, while the rate of return on equity decreased 0.3 point year on year to 12.2%
94
Financial Information Financial Perfomance
Nabtesco Group Integrated Report 2014
Financial Position
Assets
Total assets as of 2014/3 were 233,984 million yen, an LQFUHDVH�RI��������PLOOLRQ�\HQ�IURP�WKH�SUHYLRXV�\HDU��UHsHFWLQJ�increases of 11,821million yen in cash and time deposits, 7,708 million yen in notes and accounts receivable, 1,704million yen in inventory assets and 4,282 million yen in investment securities. Current assets and fixed assets came to 134,159 million yen and 99,824 million yen, respectively.
Liabilities
Total liabilities as of 2014/3 were 94,513 million yen, an LQFUHDVH�RI��������PLOOLRQ�\HQ�IURP�WKH�SUHYLRXV�\HDU��UHsHFWLQJ�a rise of 7,239 million yen in trade notes and accounts payable. Current liabilities and long-term liabilities came to 73,161million yen and 21,351 million yen, respectively.
Net Assets
Total net assets as of 2014/3 stood at 139,471 million yen, LQFOXGLQJ� VKDUHKROGHUVb� HTXLW\� RI� �������PLOOLRQ� \HQ�� DQ�increase of 17,004 million yen from the previous year. The increase was mainly attributable to increases in earned surplus arising from net income of 14,978 million yen, 8,470 million yen in translation adjustments due to changes in foreign exchange at overseas subsidiaries, and 1,606 million yen in minority interests. Primary negative contributing factors included a decrease of 4,356 million yen in earned surplus due to dividend payments and an increase of 2,247 million yen in WUHDVXU\�VWRFN��$V�D�UHVXOW��VKDUHKROGHUVb�HTXLW\�UDWLR�GHFUHDVHG�0.2 point year on year to 56.0% and net assets per share came to 1,035.68 yen. ROE dropped 0.3 point to 12.2% while ROA increased 0.4 point to 6.9%.
Cash Flows
Cash and cash equivalents as of 2014/3 were 53,052 million yen, an increase of 12,852 million yen from the previous year, as a result of having applied 27,597 million yen generated from operating activities, mainly to capital expenditure and dividend payments.
Cash Flow from Operating Activities
Net cash generated from operating activities for the current consolidated fiscal year totaled 27,597 million yen. Principal positive factors included increases in income before income taxes and accounts payable. Negative factors consisted mainly of an increase in notes and accounts receivable and income tax payments.
Cash Flow from Investing Activities
Net cash used in investing activities for 2014/3 amounted to 8,064 PLOOLRQ�\HQ��PDLQO\�GXH�WR�WKH�DFTXLVLWLRQ�RI�WDQJLEOH�r[HG�DVVHWV�
Cash Flow from Financing Activities
Net cash used in financing activities for 2014/3 stood at 8,175 million yen, mainly reflecting the negative factors of dividend payments and payments for purchases of treasury stock.
Capital Expenditure
We made investments to introduce new equipment to increase our productivity, including automation systems and the updating of existing equipment in Japan, and also launched a new factory in China and implemented other measures outside Japan, mainly targeting the Asian market. As a result, our capital expenditure �LQYHVWPHQWV�LQ�WDQJLEOH�DQG�LQWDQJLEOH�r[HG�DVVHWV��WRWDOHG�������million yen.
95
Financial Information Financial Perfomance

Nabtesco Group Integrated Report 2014
Corporate Information
Corporate Information Corporate Profile
96
Nabtesco Group Integrated Report 201497
Corporate Information Corporate Profile

Nabtesco Group Integrated Report 2014
Stock Information
Component ratio of shareholders (as of March 31, 2014)
Stock Price Transition
(Thousand shares)
98
Corporate Information Stock Information
Nabtesco Group Integrated Report 2014
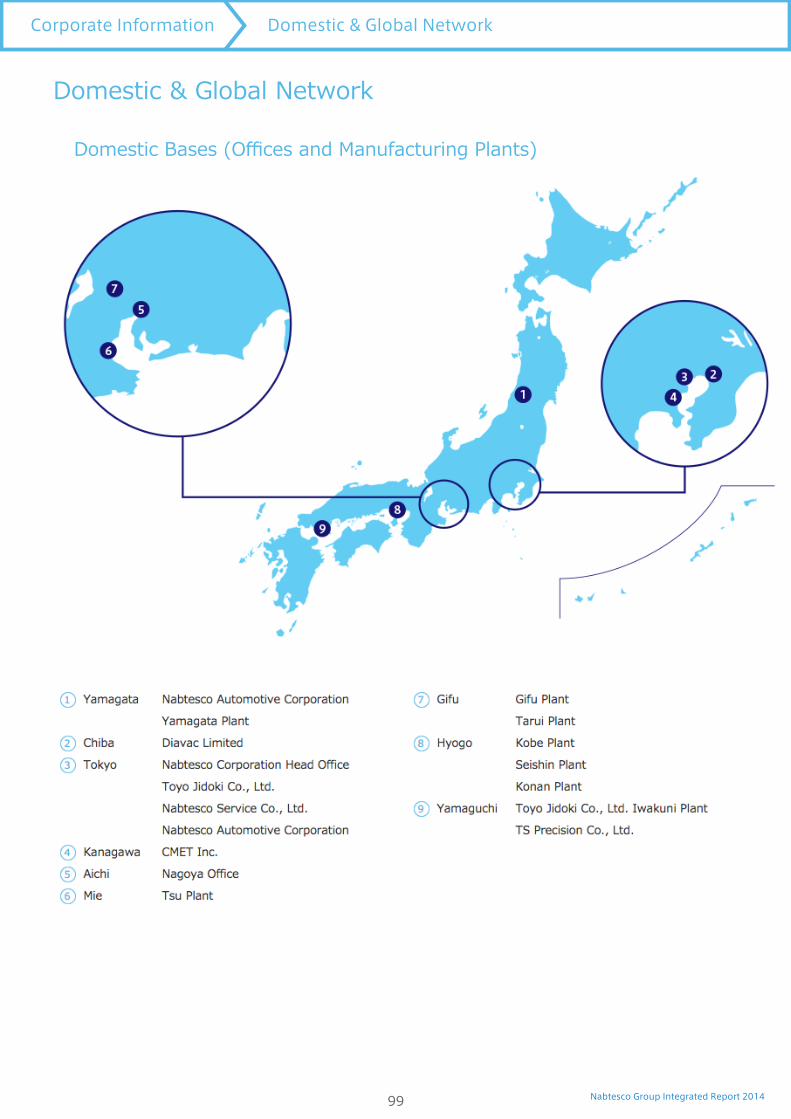
Domestic & Global Network
'RPHVWLF�%DVHV��2îFHV�DQG�0DQXIDFWXULQJ�3ODQWV�
99
Corporate Information Domestic & Global Network
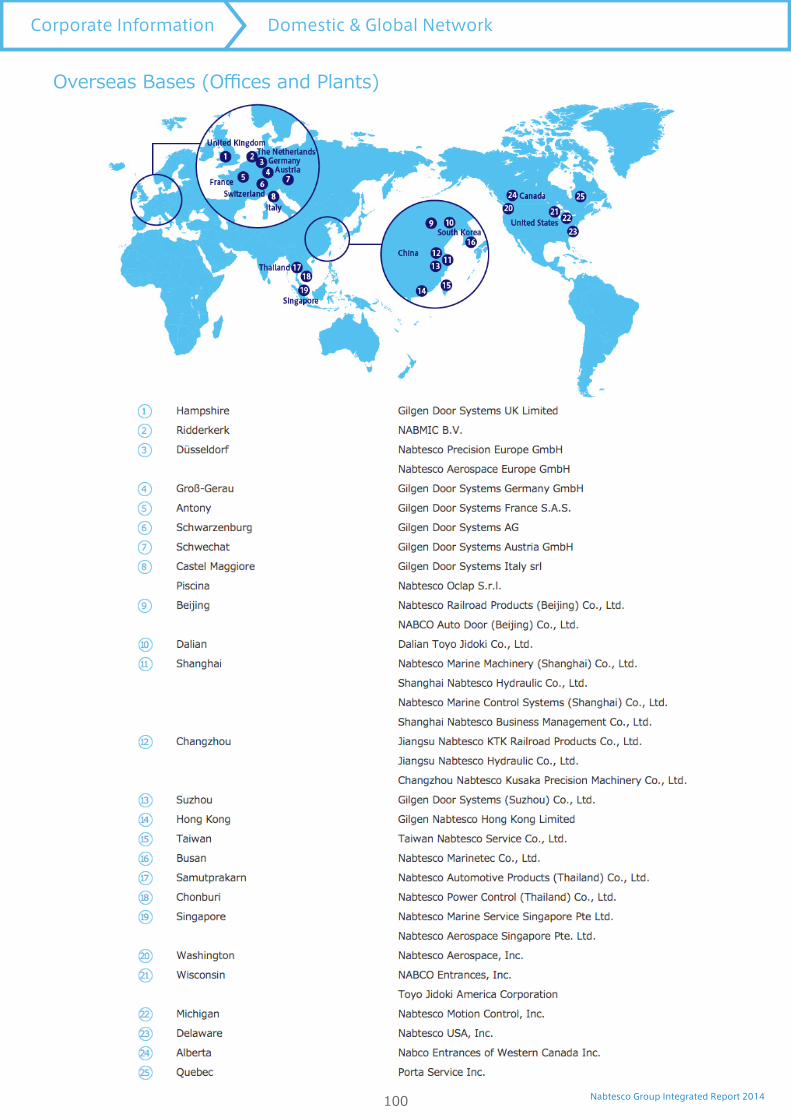
Nabtesco Group Integrated Report 2014
2YHUVHDV�%DVHV��2îFHV�DQG�3ODQWV�
100
Corporate Information Domestic & Global Network
Nabtesco Group Integrated Report 2014
Disclosure Policy
Disclosure Policy
101
Nabtesco Group Integrated Report 2014102
Disclosure Policy

Nabtesco Group Integrated Report 2014103
Nabtesco Corporation and Consolidated Subsidiaries
Consolidated Financial Statements
March 31, 2014 and 2013
(With Independent Auditors’ Report)

106 Nabtesco Group Integrated Report 2014
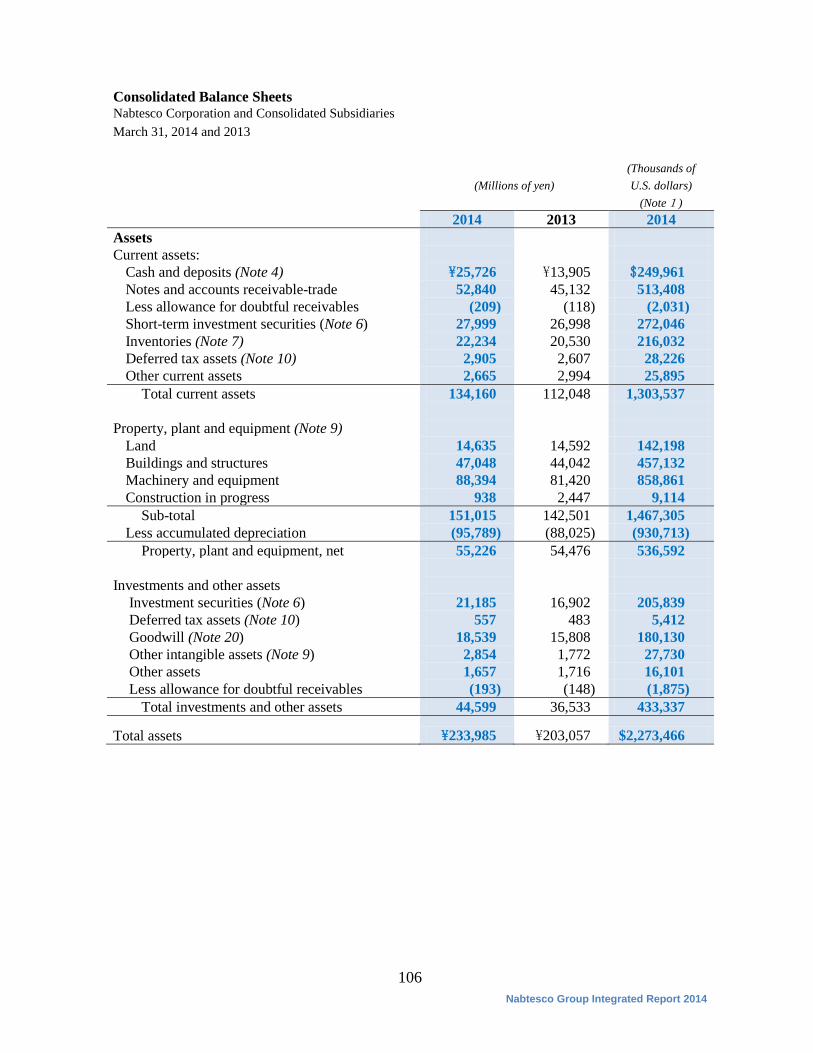
Consolidated Balance Sheets Nabtesco Corporation and Consolidated Subsidiaries March 31, 2014 and 2013
(Millions of yen)
(Thousands of U.S. dollars)
(Note1) 2014 2013 2014
Assets Current assets:
Cash and deposits (Note 4) \25,726 \13,905 $249,961 Notes and accounts receivable-trade 52,840 45,132 513,408 Less allowance for doubtful receivables (209) (118) (2,031) Short-term investment securities (Note 6) 27,999 26,998 272,046 Inventories (Note 7) 22,234 20,530 216,032 Deferred tax assets (Note 10) 2,905 2,607 28,226 Other current assets 2,665 2,994 25,895
Total current assets 134,160 112,048 1,303,537 Property, plant and equipment (Note 9)
Land 14,635 14,592 142,198 Buildings and structures 47,048 44,042 457,132 Machinery and equipment 88,394 81,420 858,861 Construction in progress 938 2,447 9,114
Sub-total 151,015 142,501 1,467,305 Less accumulated depreciation (95,789) (88,025) (930,713)
Property, plant and equipment, net 55,226 54,476 536,592 Investments and other assets
Investment securities (Note 6) 21,185 16,902 205,839 Deferred tax assets (Note 10) 557 483 5,412 Goodwill (Note 20) 18,539 15,808 180,130 Other intangible assets (Note 9) 2,854 1,772 27,730 Other assets 1,657 1,716 16,101 Less allowance for doubtful receivables (193) (148) (1,875)
Total investments and other assets 44,599 36,533 433,337
Total assets \233,985 \203,057 $2,273,466
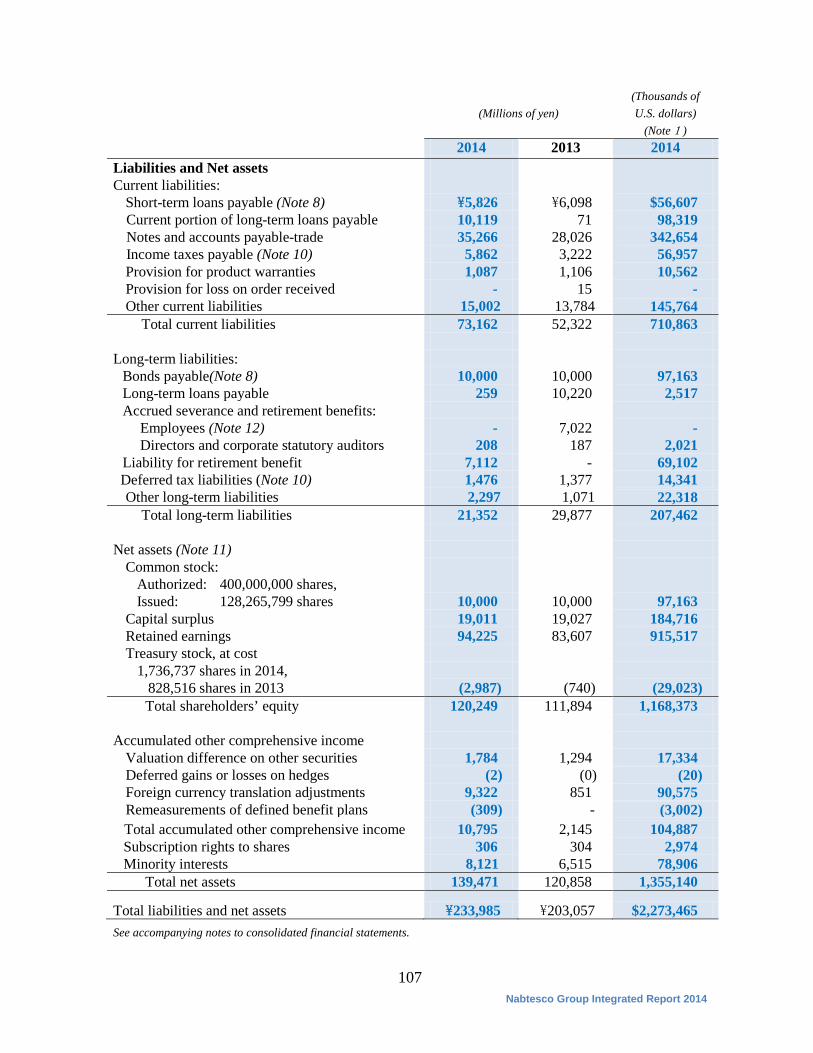
107 Nabtesco Group Integrated Report 2014
(Millions of yen)
(Thousands of U.S. dollars)
(Note1) 2014 2013 2014
Liabilities and Net assets Current liabilities:
Short-term loans payable (Note 8) \5,826 \6,098 $56,607 Current portion of long-term loans payable 10,119 71 98,319 Notes and accounts payable-trade 35,266 28,026 342,654 Income taxes payable (Note 10) 5,862 3,222 56,957 Provision for product warranties 1,087 1,106 10,562 Provision for loss on order received - 15 - Other current liabilities 15,002 13,784 145,764
Total current liabilities 73,162 52,322 710,863 Long-term liabilities:
Bonds payable(Note 8) 10,000 10,000 97,163 Long-term loans payable 259 10,220 2,517 Accrued severance and retirement benefits:
Employees (Note 12) - 7,022 - Directors and corporate statutory auditors 208 187 2,021
Liability for retirement benefit 7,112 - 69,102 Deferred tax liabilities (Note 10) 1,476 1,377 14,341 Other long-term liabilities 2,297 1,071 22,318
Total long-term liabilities 21,352 29,877 207,462 Net assets (Note 11)
Common stock: Authorized: 400,000,000 shares, Issued: 128,265,799 shares 10,000 10,000 97,163
Capital surplus 19,011 19,027 184,716 Retained earnings 94,225 83,607 915,517 Treasury stock, at cost
1,736,737 shares in 2014, 828,516 shares in 2013
(2,987)
(740)
(29,023)
Total shareholders’ equity 120,249 111,894 1,168,373
Accumulated other comprehensive income Valuation difference on other securities 1,784 1,294 17,334 Deferred gains or losses on hedges (2) (0) (20) Foreign currency translation adjustments 9,322 851 90,575 Remeasurements of defined benefit plans (309) - (3,002)
Total accumulated other comprehensive income 10,795 2,145 104,887 Subscription rights to shares 306 304 2,974 Minority interests 8,121 6,515 78,906
Total net assets 139,471 120,858 1,355,140
Total liabilities and net assets \233,985 \203,057 $2,273,465 See accompanying notes to consolidated financial statements.
108 Nabtesco Group Integrated Report 2014
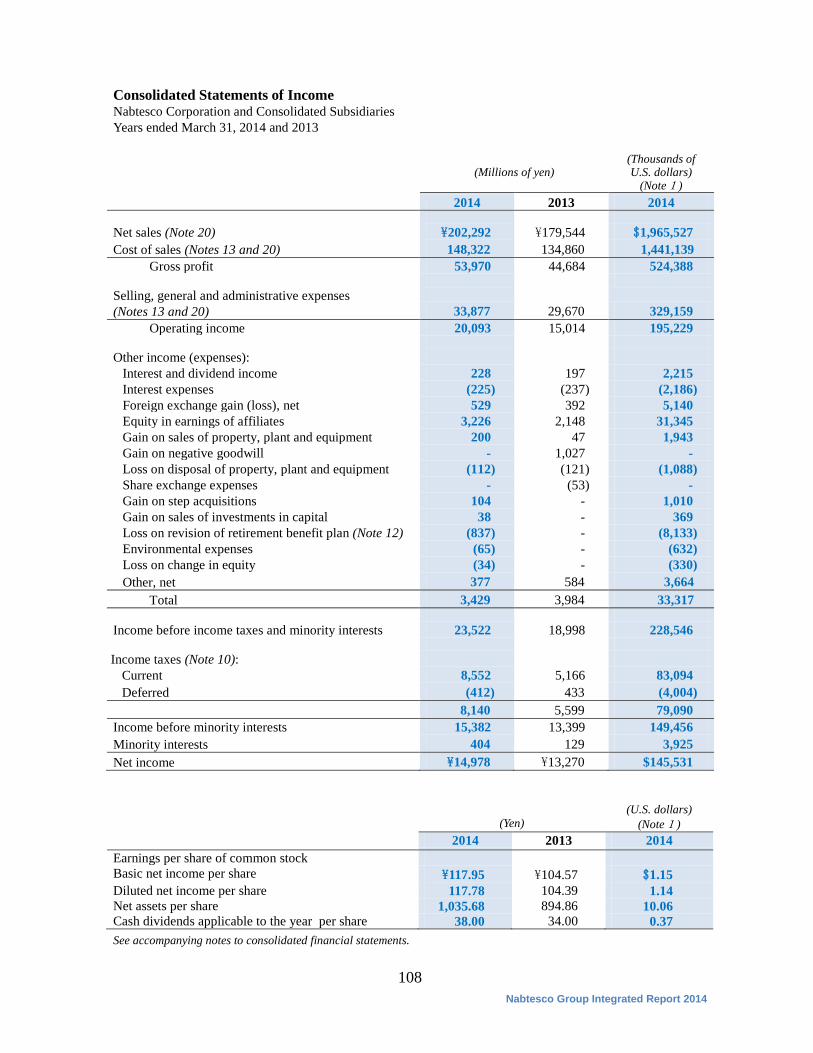
Consolidated Statements of Income Nabtesco Corporation and Consolidated Subsidiaries Years ended March 31, 2014 and 2013
(Millions of yen)
(Thousands of U.S. dollars)
(Note1) 2014 2013 2014 Net sales (Note 20) \202,292 \179,544 $1,965,527 Cost of sales (Notes 13 and 20) 148,322 134,860 1,441,139
Gross profit 53,970 44,684 524,388 Selling, general and administrative expenses (Notes 13 and 20) 33,877 29,670 329,159
Operating income 20,093 15,014 195,229 Other income (expenses):
Interest and dividend income 228 197 2,215 Interest expenses (225) (237) (2,186) Foreign exchange gain (loss), net 529 392 5,140 Equity in earnings of affiliates 3,226 2,148 31,345 Gain on sales of property, plant and equipment 200 47 1,943 Gain on negative goodwill - 1,027 - Loss on disposal of property, plant and equipment (112) (121) (1,088) Share exchange expenses - (53) - Gain on step acquisitions 104 - 1,010 Gain on sales of investments in capital 38 - 369 Loss on revision of retirement benefit plan (Note 12) (837) - (8,133) Environmental expenses (65) - (632) Loss on change in equity (34) - (330) Other, net 377 584 3,664
Total 3,429 3,984 33,317 Income before income taxes and minority interests 23,522 18,998 228,546 Income taxes (Note 10):
Current 8,552 5,166 83,094 Deferred (412) 433 (4,004)
8,140 5,599 79,090 Income before minority interests 15,382 13,399 149,456 Minority interests 404 129 3,925 Net income \14,978 \13,270 $145,531
(Yen) (U.S. dollars)
(Note1) 2014 2013 2014 Earnings per share of common stock Basic net income per share \117.95 \104.57 $1.15 Diluted net income per share 117.78 104.39 1.14 Net assets per share 1,035.68 894.86 10.06 Cash dividends applicable to the year per share 38.00 34.00 0.37 See accompanying notes to consolidated financial statements.
109 Nabtesco Group Integrated Report 2014
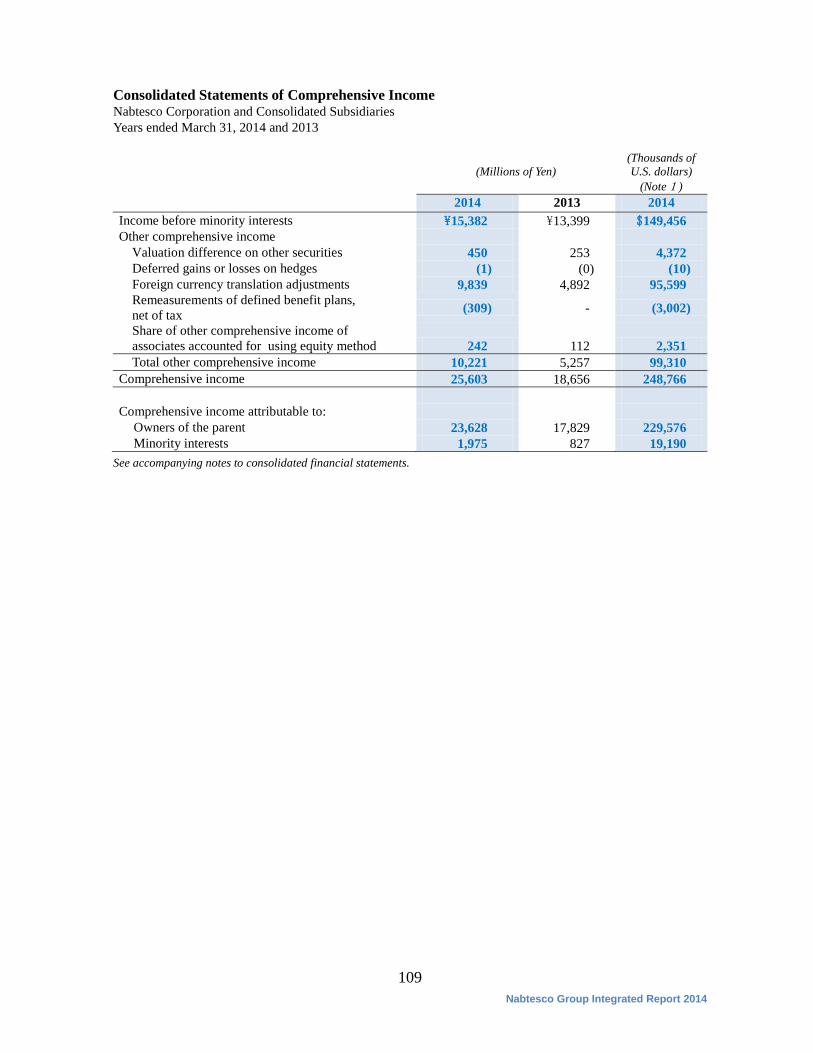
Consolidated Statements of Comprehensive Income Nabtesco Corporation and Consolidated Subsidiaries Years ended March 31, 2014 and 2013
(Millions of Yen) (Thousands of U.S. dollars)
(Note1) 2014 2013 2014 Income before minority interests \15,382 \13,399 $149,456 Other comprehensive income
Valuation difference on other securities 450 253 4,372 Deferred gains or losses on hedges (1) (0) (10) Foreign currency translation adjustments 9,839 4,892 95,599 Remeasurements of defined benefit plans, net of tax (309) - (3,002)
Share of other comprehensive income of associates accounted for using equity method 242 112 2,351 Total other comprehensive income 10,221 5,257 99,310
Comprehensive income 25,603 18,656 248,766 Comprehensive income attributable to:
Owners of the parent 23,628 17,829 229,576 Minority interests 1,975 827 19,190
See accompanying notes to consolidated financial statements.
110 Nabtesco Group Integrated Report 2014
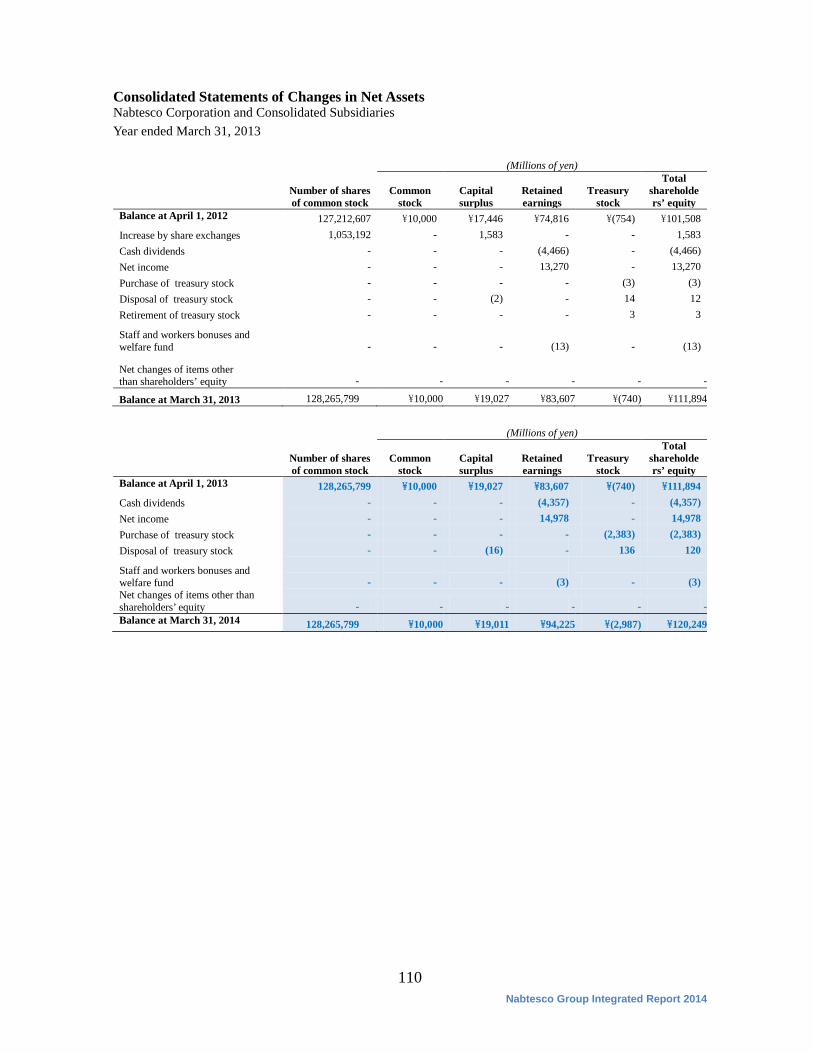
Consolidated Statements of Changes in Net Assets Nabtesco Corporation and Consolidated Subsidiaries Year ended March 31, 2013
(Millions of yen)
Number of shares of common stock
Common stock
Capital surplus
Retained earnings
Treasury stock
Total shareholders’ equity
Balance at April 1, 2012 127,212,607 \10,000 \17,446 \74,816 \(754) \101,508 Increase by share exchanges 1,053,192 - 1,583 - - 1,583 Cash dividends - - - (4,466) - (4,466) Net income - - - 13,270 - 13,270 Purchase of treasury stock - - - - (3) (3) Disposal of treasury stock - - (2) - 14 12 Retirement of treasury stock - - - - 3 3
Staff and workers bonuses and welfare fund -
- -
(13) - (13)
Net changes of items other than shareholders’ equity -
- -
- - -
Balance at March 31, 2013 128,265,799 \10,000 \19,027 \83,607 \(740) \111,894
(Millions of yen)
Number of shares of common stock
Common stock
Capital surplus
Retained earnings
Treasury stock
Total shareholders’ equity
Balance at April 1, 2013 128,265,799 \10,000 \19,027 \83,607 \(740) \111,894 Cash dividends - - - (4,357) - (4,357) Net income - - - 14,978 - 14,978 Purchase of treasury stock - - - - (2,383) (2,383) Disposal of treasury stock - - (16) - 136 120
Staff and workers bonuses and welfare fund -
- -
(3) - (3)
Net changes of items other than shareholders’ equity - - - - - - Balance at March 31, 2014 128,265,799 \10,000 \19,011 \94,225 \(2,987) \120,249
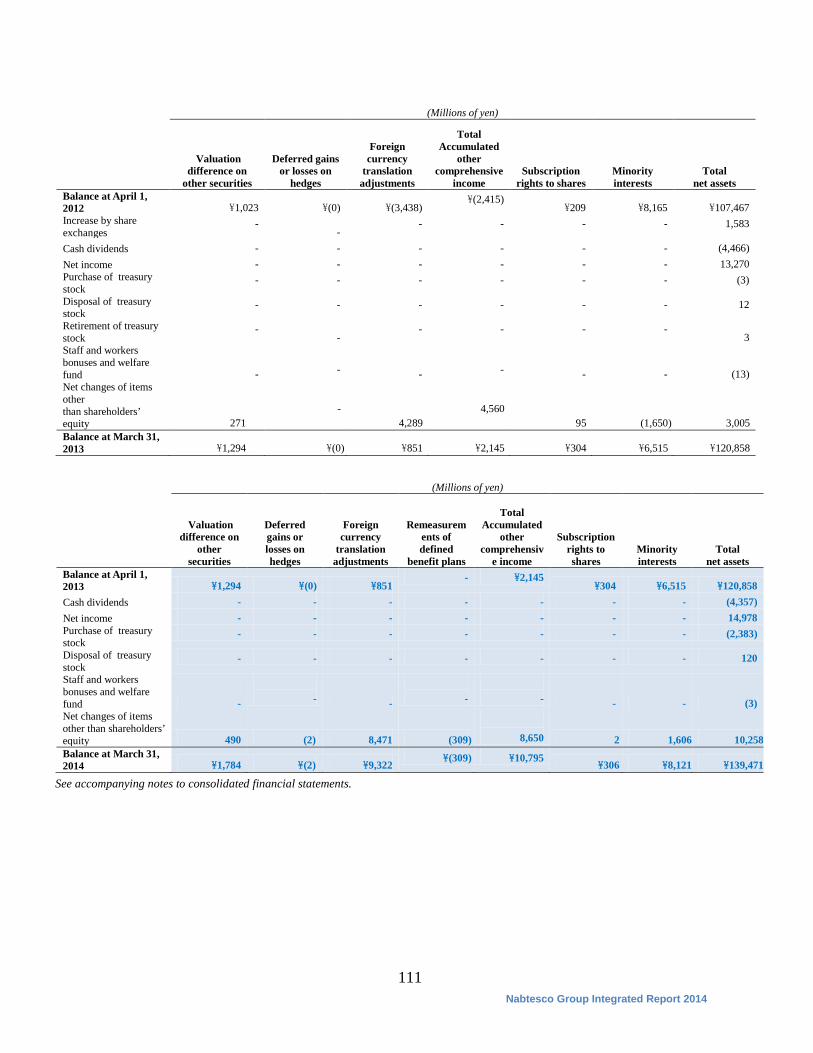
111 Nabtesco Group Integrated Report 2014
(Millions of yen)
Valuation difference on
other securities
Deferred gains or losses on
hedges
Foreign currency
translation adjustments
Total Accumulated
other comprehensive
income Subscription
rights to shares Minority interests
Total net assets
Balance at April 1, 2012 \1,023 \(0) \(3,438)
\(2,415) \209 \8,165 \107,467
Increase by share exchanges
- -
- - - - 1,583
Cash dividends - - - - - - (4,466) Net income - - - - - - 13,270 Purchase of treasury stock
- - - - - - (3)
Disposal of treasury stock
- - - - - - 12
Retirement of treasury stock
- -
- - - - 3
Staff and workers bonuses and welfare fund -
- -
- - - (13)
Net changes of items other than shareholders’ equity 271
-
4,289
4,560
95 (1,650) 3,005 Balance at March 31, 2013 \1,294 \(0) \851 \2,145 \304 \6,515 \120,858
(Millions of yen)
Valuation difference on
other securities
Deferred gains or losses on hedges
Foreign currency
translation adjustments
Remeasurements of defined
benefit plans
Total
Accumulated other
comprehensive income
Subscription rights to shares
Minority interests
Total net assets
Balance at April 1, 2013 \1,294 \(0) \851
- \2,145 \304 \6,515 \120,858
Cash dividends - - - - - - - (4,357) Net income - - - - - - - 14,978 Purchase of treasury stock
- - - - - - - (2,383)
Disposal of treasury stock
- - - - - - - 120
Staff and workers bonuses and welfare fund -
- -
-
- - - (3)
Net changes of items other than shareholders’ equity 490 (2) 8,471 (309)
8,650 2 1,606 10,258
Balance at March 31, 2014 \1,784 \(2) \9,322
\(309) \10,795 \306 \8,121 \139,471
See accompanying notes to consolidated financial statements.
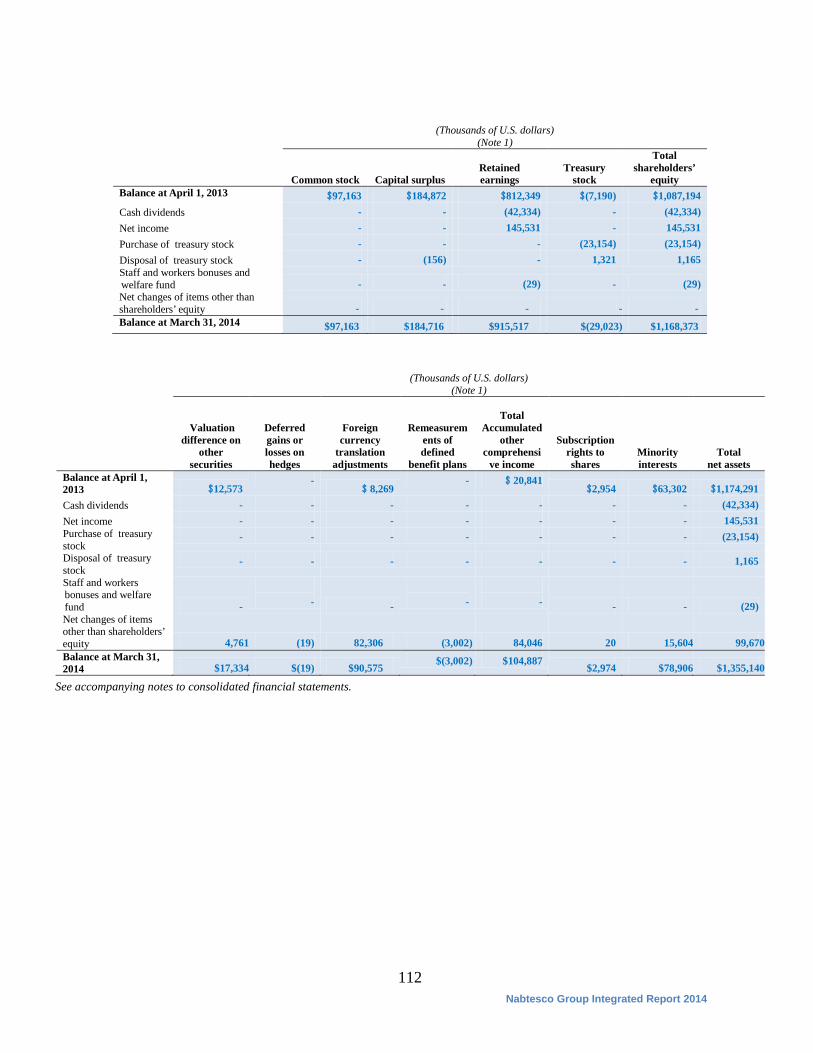
112 Nabtesco Group Integrated Report 2014
(Thousands of U.S. dollars)
(Note 1)
Common stock Capital surplus Retained earnings
Treasury stock
Total shareholders’
equity Balance at April 1, 2013 $97,163 $184,872 $812,349 $(7,190) $1,087,194 Cash dividends - - (42,334) - (42,334) Net income - - 145,531 - 145,531 Purchase of treasury stock - - - (23,154) (23,154) Disposal of treasury stock - (156) - 1,321 1,165 Staff and workers bonuses and welfare fund - - (29) - (29) Net changes of items other than shareholders’ equity - - - - - Balance at March 31, 2014 $97,163 $184,716 $915,517 $(29,023) $1,168,373
(Thousands of U.S. dollars)
(Note 1)
Valuation difference on
other securities
Deferred gains or losses on hedges
Foreign currency
translation adjustments
Remeasurements of defined
benefit plans
Total
Accumulated other
comprehensive income
Subscription rights to shares
Minority interests
Total net assets
Balance at April 1, 2013 $12,573
- $ 8,269
- $ 20,841 $2,954 $63,302 $1,174,291
Cash dividends - - - - - - - (42,334) Net income - - - - - - - 145,531 Purchase of treasury stock
- - - - - - - (23,154)
Disposal of treasury stock
- - - - - - - 1,165
Staff and workers bonuses and welfare fund -
- -
-
- - - (29)
Net changes of items other than shareholders’ equity 4,761 (19) 82,306 (3,002) 84,046 20 15,604 99,670 Balance at March 31, 2014 $17,334 $(19) $90,575
$(3,002) $104,887 $2,974 $78,906 $1,355,140
See accompanying notes to consolidated financial statements.
113 Nabtesco Group Integrated Report 2014
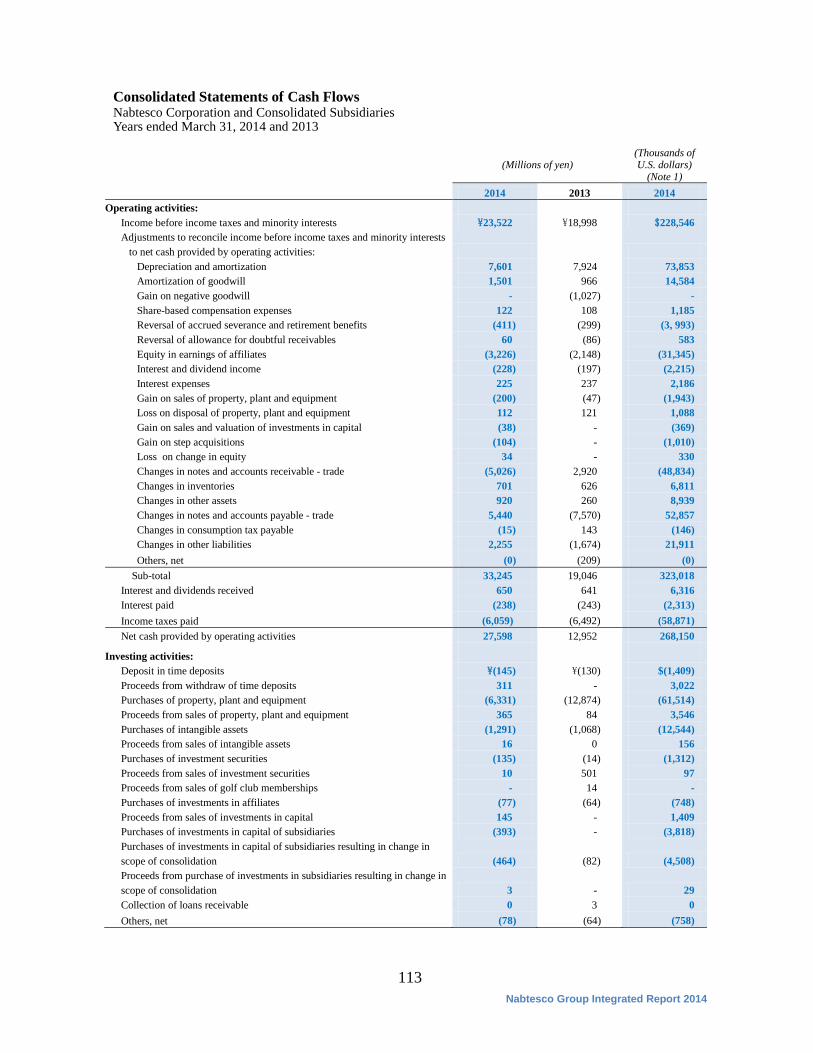
Consolidated Statements of Cash Flows Nabtesco Corporation and Consolidated Subsidiaries Years ended March 31, 2014 and 2013
(Millions of yen)
(Thousands of U.S. dollars)
(Note 1) 2014 2013 2014
Operating activities: Income before income taxes and minority interests \23,522 \18,998 $228,546 Adjustments to reconcile income before income taxes and minority interests
to net cash provided by operating activities: Depreciation and amortization 7,601 7,924 73,853 Amortization of goodwill 1,501 966 14,584 Gain on negative goodwill - (1,027) - Share-based compensation expenses 122 108 1,185 Reversal of accrued severance and retirement benefits (411) (299) (3, 993) Reversal of allowance for doubtful receivables 60 (86) 583 Equity in earnings of affiliates (3,226) (2,148) (31,345) Interest and dividend income (228) (197) (2,215) Interest expenses 225 237 2,186 Gain on sales of property, plant and equipment (200) (47) (1,943) Loss on disposal of property, plant and equipment 112 121 1,088 Gain on sales and valuation of investments in capital (38) - (369) Gain on step acquisitions (104) - (1,010) Loss on change in equity 34 - 330 Changes in notes and accounts receivable - trade (5,026) 2,920 (48,834) Changes in inventories 701 626 6,811 Changes in other assets 920 260 8,939 Changes in notes and accounts payable - trade 5,440 (7,570) 52,857 Changes in consumption tax payable (15) 143 (146) Changes in other liabilities 2,255 (1,674) 21,911 Others, net (0) (209) (0)
Sub-total 33,245 19,046 323,018 Interest and dividends received 650 641 6,316 Interest paid (238) (243) (2,313) Income taxes paid (6,059) (6,492) (58,871) Net cash provided by operating activities 27,598 12,952 268,150
Investing activities: Deposit in time deposits \(145) \(130) $(1,409) Proceeds from withdraw of time deposits 311 - 3,022 Purchases of property, plant and equipment (6,331) (12,874) (61,514) Proceeds from sales of property, plant and equipment 365 84 3,546 Purchases of intangible assets (1,291) (1,068) (12,544) Proceeds from sales of intangible assets 16 0 156 Purchases of investment securities (135) (14) (1,312) Proceeds from sales of investment securities 10 501 97 Proceeds from sales of golf club memberships - 14 - Purchases of investments in affiliates (77) (64) (748) Proceeds from sales of investments in capital 145 - 1,409 Purchases of investments in capital of subsidiaries (393) - (3,818) Purchases of investments in capital of subsidiaries resulting in change in scope of consolidation (464) (82) (4,508) Proceeds from purchase of investments in subsidiaries resulting in change in scope of consolidation 3 - 29 Collection of loans receivable 0 3 0 Others, net (78) (64) (758)
114 Nabtesco Group Integrated Report 2014
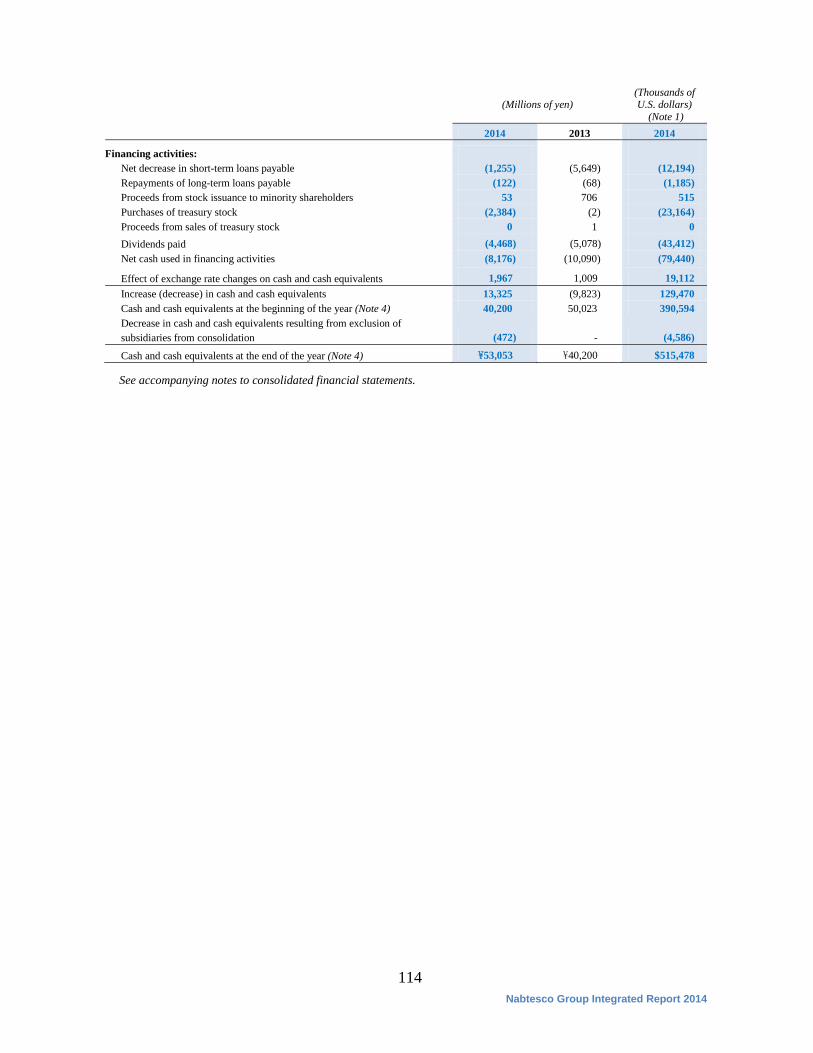
(Millions of yen)
(Thousands of U.S. dollars)
(Note 1) 2014 2013 2014
Financing activities: Net decrease in short-term loans payable (1,255) (5,649) (12,194) Repayments of long-term loans payable (122) (68) (1,185) Proceeds from stock issuance to minority shareholders 53 706 515 Purchases of treasury stock (2,384) (2) (23,164) Proceeds from sales of treasury stock 0 1 0 Dividends paid (4,468) (5,078) (43,412) Net cash used in financing activities (8,176) (10,090) (79,440)
Effect of exchange rate changes on cash and cash equivalents 1,967 1,009 19,112 Increase (decrease) in cash and cash equivalents 13,325 (9,823) 129,470 Cash and cash equivalents at the beginning of the year (Note 4) 40,200 50,023 390,594 Decrease in cash and cash equivalents resulting from exclusion of subsidiaries from consolidation (472) - (4,586)
Cash and cash equivalents at the end of the year (Note 4) \53,053 \40,200 $515,478
See accompanying notes to consolidated financial statements.
Nabtesco Group Integrated Report 2014
115
Notes to Consolidated Financial Statements Nabtesco Corporation and Consolidated Subsidiaries Years ended March 31, 2014 and 2013
1. Description of Business and Basis of Presenting Consolidated Financial Statements
(1) Description of business
Nabtesco Corporation (the “Company”), a Japanese corporation, was established as a holding company on September 29, 2003, through a stock transfer process, by TS Corporation (formerly Teijin Seiki Co., Ltd.) and NABCO Ltd. As a result of the stock transfer, both TS Corporation and NABCO Ltd. became wholly owned subsidiaries of the Company.
The Company completed its business integration through the acquisition of the two wholly owned subsidiaries on October 1, 2004.
The main products of the Company and its consolidated subsidiaries (the “Companies”) include precision equipment, transport equipment, aircraft and oil hydraulic equipment, and industrial equipment.
(2) Basis of presenting consolidated financial statements
The accompanying consolidated financial statements have been prepared in accordance with the provisions set forth in the Japanese Financial Instruments and Exchange Law and its related accounting regulations, and in conformity with accounting principles generally accepted in Japan (“Japanese GAAP”), which are different in certain respects as to application and disclosure requirements of International Financial Reporting Standards.
The accounts of consolidated overseas subsidiaries are based on their accounting records maintained in conformity with generally accepted principles prevailing in the respective countries of domicile. The accounts of consolidated overseas subsidiaries are prepared in accordance with either International Financial Reporting Standard or U.S. generally accepted accounting principles, with adjustment for the specific five items as applicable.
The accompanying consolidated financial statements have been restructured and translated into English from the consolidated financial statements of the Company prepared in accordance with Japanese GAAP and filed with the appropriate Local Finance Bureau of the Ministry of Finance as required by the Financial Instruments and Exchange Law. Certain supplementary information included in the statutory Japanese language consolidated financial statements, but not required for fair presentation, is not presented in the accompanying consolidated financial statements.
The translation of the Japanese yen amounts into U.S. dollars is included solely for the convenience of readers outside Japan, using the prevailing exchange rate at March 31, 2014, which is ¥102.92 to U.S. $1. The convenience translations should not be construed as representations that the Japanese yen amounts have been, could have been, or could in the future be, converted into U.S. dollars at this or any other rate of exchange.
Nabtesco Group Integrated Report 2014
116 Nabtesco Group Integrated Report 2014
2. Summary of Significant Accounting Policies
(1) Principles of consolidation
The consolidated financial statements include the accounts of the Company and its 47 subsidiaries. All significant inter-company transactions, account balances and unrealized profits are eliminated in consolidation.
Investments in 10 affiliated companies (generally 20% to 50% owned), over which the Company has the ability to exercise significant influence over operating and financial policy, are accounted for by the equity method.
(2) Cash and cash equivalents For the purpose of the consolidated statements of cash flows, cash and cash equivalents consist of
cash on hand, deposits with banks withdrawable on demand and short-term investments which are readily convertible to cash subject to an insignificant risk of changes in value and which are purchased with an original maturity of three months or less. See Note 5 as to reconciliation to cash and deposits on the balance sheets.
(3) Allowance for doubtful receivables
The allowance for doubtful receivables is provided in amounts management considers sufficient to cover possible losses on collection. The allowance is based on past collection experience and management estimate of the collectability of individual receivables.
(4) Provision for loss on order received
To cover the future losses relating to order received, the provision is recorded when the future losses are anticipated and the losses are reasonably estimated. (5) Securities
The Companies are required to examine the intent of holding each security and classify those securities as (a) securities held for trading purposes (hereafter, “trading securities”), (b) debt securities intended to be held to maturity, (c) equity securities issued by subsidiaries and affiliated companies, and (d) for all other securities that are not classified in any of the above categories (hereafter, “other securities”) The Companies have no trading securities at March 31, 2014 and 2013.
Held-to-maturity debt securities are expected to be held to maturity and are recognized at amortized cost computed based on the straight-line method. Other securities with available fair market values are stated at fair market value. Unrealized gains and losses on these securities are reported, net of applicable income taxes, as a separate component of Net assets. Realized gains
Nabtesco Group Integrated Report 2014
117 Nabtesco Group Integrated Report 2014
and losses on sale of such securities are computed using the moving-average cost method. Other securities with no available fair market value are stated at moving-average cost.
If the market value of equity securities issued by unconsolidated subsidiaries and affiliated companies, and other securities declines significantly, such securities are written down to their fair market value and the difference between fair market value and the carrying amount is recognized as loss in the period of the decline. For equity securities with no available fair market value, if the net asset amount of the investee declines significantly, such securities are written down to the net asset amount in the income statement in the period of decline. In these cases, such fair market value or net asset amount will be the carrying amount of the securities at the beginning of the next year.
(6) Inventories
Inventories of the Company and its consolidated domestic subsidiaries are stated at the lower of the cost or net realizable value, while inventories of its consolidated foreign subsidiaries are principally stated at the lower of cost or market.
The evaluation methods for the cost of inventories are as follows:
Inventories Evaluation method Finished goods and Work in process Mainly weighted average method
(however certain finished goods and work in process are determined by the specific identification method)
Raw materials and Supplies Mainly weighted average method (however certain raw materials and supplies are determined by moving average method)
(7) Property, plant and equipment
Property, plant and equipment are stated at cost. The Company and its consolidated domestic subsidiaries calculate depreciation mainly by the declining-balance method over the estimated useful lives of the respective assets, except for the buildings acquired on or after April 1, 1998, and owned by the Company, which are depreciated by the straight-line method over the estimated useful lives of the respective assets. In addition, the Company and its consolidated domestic subsidiaries depreciate Machinery and equipment, whose acquisition cost is \100 thousand or more but less than \200 thousand, over a period of three years on a straight-line basis. The consolidated foreign subsidiaries calculate depreciation mainly by the straight-line method over the estimated useful lives of the respective assets.
Depreciation of assets acquired by the domestic companies after March 31, 2007 is calculated mainly by the straight-line method under the amended tax code for building, not including building fixtures and by the declining-balance method under the amended tax code for the remaining assets.
Nabtesco Group Integrated Report 2014
118 Nabtesco Group Integrated Report 2014
(8) Lease assets
Property, plant and equipment capitalized under finance lease arrangements are depreciated over the lease term of the respective assets. Finance leases which do not transfer ownership of the leased property to the lessee commenced prior to April 1, 2008 and have been accounted for as operating leases, continue to be accounted for as operating leases with disclosure of certain “as if capitalized” information.
(9) Derivative financial instruments and hedging transactions
The Companies use derivative financial instruments only for the purpose of mitigating fluctuation risk of interest rates with respect to loans payable and future risk of fluctuation of foreign currency exchange rates with respect to foreign currency receivables and payables.
The basic policies for executing the derivative transactions are managed by the Board of Directors of the Company. Based on such policies, the finance departments of each company establish the internal regulations which prescribe the specified limits and procedures on the derivative transactions. After execution, each finance department has to report certain information on derivative transactions to the Board of Directors of the Company. The following summarizes hedging derivative financial instruments used by the Companies and items hedged:
Hedging instruments Hedged items
Interest rate swap contracts: Loans payable
Forward foreign exchange contracts: Foreign currency trade receivables and trade payables
The Companies evaluate hedge effectiveness by comparing the cumulative changes in cash flows from or the changes in fair value of hedged items and the corresponding changes in fair value of the hedging derivative instruments.
The Companies are required to state derivative financial instruments at fair value and to recognize changes in the fair value as gains or losses unless derivative financial instruments meet the criteria for hedge accounting. If derivative financial instruments are used as hedges and meet certain hedging criteria, the Companies defer recognition of gains or losses resulting from changes in fair value of derivative financial instruments until the related losses or gains on the hedged items are recognized. If interest rate swap contracts are used as hedges and meet certain hedging criteria, the net amount to be paid or received under the interest rate swap contract is added to or deducted from the interest on the assets or liabilities for which the swap contract is executed.
Nabtesco Group Integrated Report 2014
119 Nabtesco Group Integrated Report 2014
If forward foreign exchange contracts are used as hedges and meet certain hedging criteria, hedging instruments and hedged items are accounted for in the following manner:
1) When a forward foreign exchange contract is executed to hedge an existing foreign
currency receivable or payable, (a) the difference, if any, between the Japanese yen amount of the hedged foreign currency receivable or payable translated using the spot rate at the inception date of the contract and the book value of the receivable or payable is recognized in the income statement in the period which includes the inception date, and (b) the discount or premium on the contract (that is, the difference between the Japanese yen amount of the contract translated using the contracted forward rate and that translated using the spot rate at the inception date of the contract) is recognized over the term of the contract
2) When a forward foreign exchange contract is executed to hedge a future transaction denominated in a foreign currency, the future transaction will be recorded using the contracted forward rate, and no gains or losses on the forward foreign exchange contract or the forward foreign currency options are recognized.
(10) Amortization Goodwill is amortized using straight-line method over a period within twenty years. However, if the amount is insignificant, it is expensed as incurred. Software is amortized using the straight-line method over the estimated useful lives (five years).
(11) Research and development costs
Research and development costs are expensed as incurred.
(12) Income taxes
The Companies recognize tax effects of timing differences between the carrying amounts of assets and liabilities for financial reporting purposes and the amounts for tax reporting purpose. Income taxes comprise of corporation tax, enterprise tax and prefectural and municipal inhabitants taxes.
(13) Provision for product warranties
Provision for product warranties is provided to cover the estimated cost for customers’ claims relating to after sales repairs.
Nabtesco Group Integrated Report 2014
120 Nabtesco Group Integrated Report 2014
(14) Translation of foreign currencies
Monetary assets and liabilities denominated in foreign currencies are translated into Japanese yen at the year-end rates. Financial statements of consolidated foreign subsidiaries are translated into Japanese yen at the year-end rates, except that shareholders’ equity are translated at historical rates and income statement items resulting from transactions with the Company are translated at the rates used by the Company when the transactions occurred. Foreign currency transaction adjustment is reported in net assets.
(15) Appropriation of retained earnings
Under the Japanese Corporate law, the appropriation of retained earnings with respect to a given financial period is made by a resolution of the shareholders at a general meeting held subsequent to the close of such financial period. Therefore, the accounts for that period do not reflect such appropriations. (See Note 22)
(16) Retirement benefits
The Company and certain of its consolidated subsidiaries provide two types of retirement and severance benefit plans, unfunded lump-sum payment plans and funded non-contributory pension plans, under which all eligible employees are entitled to benefits based on the level of wages and salaries at the time of retirement or termination, length of service and certain other factors. The Company and certain of its consolidated subsidiaries provide allowance for employees’ severance and retirement benefits at the end of year based on estimated amounts of projected benefit obligations, actuarially calculated using certain assumptions and the fair value of the plan assets at the date. Past service costs are recognized as expense when incurred, and actuarial gains and losses are recognized as expense from the following fiscal year using the declining-balance method over a certain period (10 years) not exceeding the average of estimated remaining service period.
(Change in accounting policy) Effective from the year ended March 31, 2014, the Company and its consolidated domestic subsidiaries have applied the Accounting Standard for Retirement Benefits (ASBJ Statement No. 26, May 17, 2012 (hereinafter, the “Statement No.26”)) and Guidance on Accounting Standard for Retirement Benefits (ASBJ Guidance No. 25, May 17, 2012 (hereinafter, the “Guidance No.25”)) except the article 35 of the Statement No.26 and the article 67 of the Guidance No.25 and actuarial gains and losses that are yet to be recognized have been recognized and the difference between retirement benefit obligations and plan assets has been recognized as a liability for retirement benefits. In accordance with the article 37 of the Statement No.26, the effect of the change in accounting policies arising from initial application has been recognized in accumulated adjustments for retirement benefit in accumulated other comprehensive income. As a result of the application, a liability for retirement benefits in the amount of ¥7,112 million ($69,102 thousand) has been recognized and accumulated other comprehensive income has decreased by ¥309 million ($3,002 thousand), at the end of the current fiscal year. The effects of this change on earnings per share are described in the related note.
Nabtesco Group Integrated Report 2014
121 Nabtesco Group Integrated Report 2014
(Additional information) The Company amended its retirement benefit plan on July 1, 2013. The purpose of this amendment is to raise the proportion of defined contributions in the overall retirement benefit plan from the 30% to 60% by terminating the defined-benefit pension plan and to transfer the entire amount to the defined-contribution pension plan. Following this amendment to the pension plan, an extraordinary loss of \837million ($8,133 thousand) has been recognized at the current fiscal year end.
(17) Earnings per share
The computation of basic net income per share is calculated based on the weighted average number of shares of common stock outstanding during the year. Diluted net income per share is calculated based on the weighted average number of shares of common stock after consideration of dilution that securities or other contracts to issue common stock are exercised or converted into common stock, or resulted into issuance of common stock. Amounts per share of net assets are calculated based on the number of shares of common stock outstanding at the year-end. Cash dividends per share include interim dividends of the Company proposed by the Board of Directors in addition to year-end dividends approved by shareholders at the annual meeting held subsequent to the end of fiscal year.
(18) Recognition of significant revenues and expenses
Accounting for construction of completions When the construction work is in progress at year end and the progress rate of construction work up to that time is deemed certain, the percentage-of-completion method is applied. The progress rate is estimated using cost-to-cost method. When the above condition is not met, the completed-contract method is applied.
3. Accounting standards issued but not yet applied
・Accounting Standard for Retirement Benefits (ASBJ Statement No. 26, May 17, 2012) ・Guidance on Accounting Standard for Retirement Benefits (ASBJ Guidance No. 25, May 17,
2012) (Please also refer to the ASBJ homepage , which has a summary in English of the accounting
standard.) 1) Summary From the viewpoint of improvements to financial reporting and international convergence, accounting treatment for actuarial gains and losses and past service costs that are yet to be recognized in profit or loss, determination of retirement benefit obligations and current service costs, and enhanced disclosures have been amended.
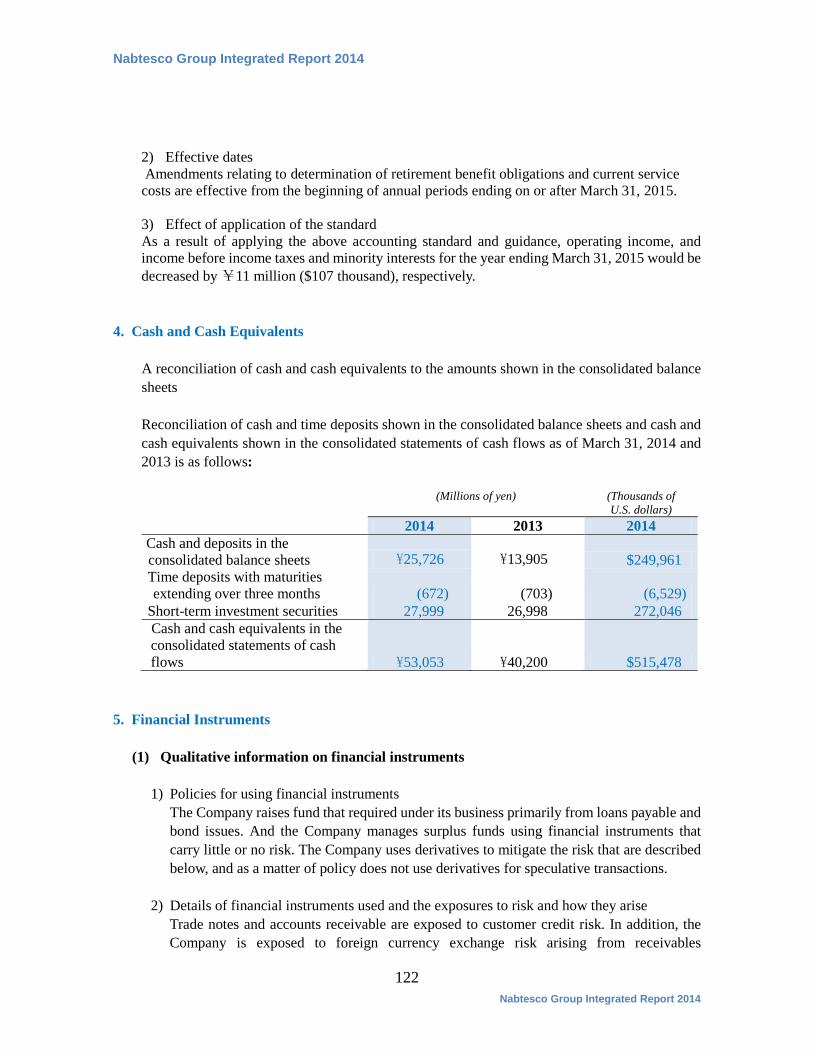
Nabtesco Group Integrated Report 2014
122 Nabtesco Group Integrated Report 2014
2) Effective dates Amendments relating to determination of retirement benefit obligations and current service costs are effective from the beginning of annual periods ending on or after March 31, 2015. 3) Effect of application of the standard As a result of applying the above accounting standard and guidance, operating income, and income before income taxes and minority interests for the year ending March 31, 2015 would be decreased by ¥11 million ($107 thousand), respectively.
4. Cash and Cash Equivalents
A reconciliation of cash and cash equivalents to the amounts shown in the consolidated balance sheets
Reconciliation of cash and time deposits shown in the consolidated balance sheets and cash and cash equivalents shown in the consolidated statements of cash flows as of March 31, 2014 and 2013 is as follows:
(Millions of yen) (Thousands of
U.S. dollars) 2014 2013 2014
Cash and deposits in the consolidated balance sheets \25,726 \13,905 $249,961 Time deposits with maturities extending over three months (672) (703) (6,529)
Short-term investment securities 27,999 26,998 272,046 Cash and cash equivalents in the consolidated statements of cash flows \53,053 \40,200 $515,478
5. Financial Instruments
(1) Qualitative information on financial instruments
1) Policies for using financial instruments The Company raises fund that required under its business primarily from loans payable and bond issues. And the Company manages surplus funds using financial instruments that carry little or no risk. The Company uses derivatives to mitigate the risk that are described below, and as a matter of policy does not use derivatives for speculative transactions.
2) Details of financial instruments used and the exposures to risk and how they arise
Trade notes and accounts receivable are exposed to customer credit risk. In addition, the Company is exposed to foreign currency exchange risk arising from receivables
Nabtesco Group Integrated Report 2014
123 Nabtesco Group Integrated Report 2014
denominated in foreign currencies. The Company uses a derivative transaction including forward foreign exchange contracts to hedge the risk of exchange fluctuations associated with receivables denominated in foreign currencies. Short-term investment securities and other securities are mainly consist of held-to-maturity debt securities and securities for strengthening of the relationship with counterparty and exposed to market price risk. Loans payable and bonds payable are taken out principally for the purpose of making capital investments. The repayment dates of long term loans payable extend up to five years beyond the date of the closing of accounts. The Company uses foreign exchange forward contracts to reduce the risk of foreign exchange rate fluctuation that arise from receivables and payables denominated in foreign currencies.
3) Policies and processes for managing the risk
(a) Credit risk management (counterparty risk)
The Company has prepared regulations for managing its credit exposure and business receivables. The Company manages amounts and settlement dates by counterparty and works to early identify and mitigate payment risk that may result from situations including deterioration of the financial condition of counterparties. Consolidated subsidiaries are subject to the same risk management rules. Held-to-maturity debts securities carry little credit risk because are intended highly-rated company under the fund management. The Company conducts only with highly credit financial institution under the risk management policy when using derivatives.
(b) Market risk management
The Company and some consolidated subsidiaries use a derivative transaction including forward foreign exchange contract to hedge the risk of exchange fluctuations associated with receivables denominated in foreign currencies. For short-term investment securities, the Company examines fair value and the financial condition of the issuing entities. In addition, for all securities other than those classified as held-to-maturity debt securities the Company regularly revises its portfolio based on its relationships with issuing entities, and interest rate swap transactions to hedge against interest rate risks on long-term loans payable. For derivative transactions, the basic policies for executing the derivative transactions are managed by the Board of Directors of the Company. Based on such policies, the finance departments of each company establish the internal policies which prescribe the specified limits and procedures on the derivative transactions. After execution, each finance department has to report certain information on derivative transactions to the Board of Directors of the Company.
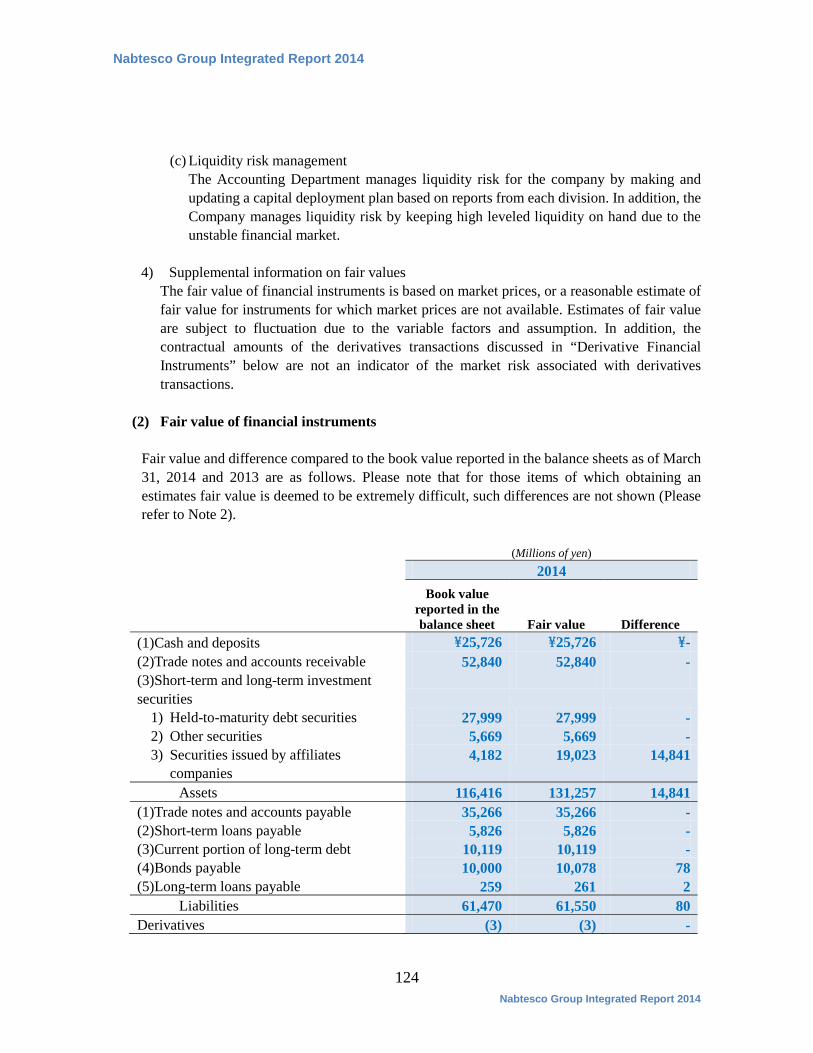
Nabtesco Group Integrated Report 2014
124 Nabtesco Group Integrated Report 2014
(c) Liquidity risk management
The Accounting Department manages liquidity risk for the company by making and updating a capital deployment plan based on reports from each division. In addition, the Company manages liquidity risk by keeping high leveled liquidity on hand due to the unstable financial market.
4) Supplemental information on fair values
The fair value of financial instruments is based on market prices, or a reasonable estimate of fair value for instruments for which market prices are not available. Estimates of fair value are subject to fluctuation due to the variable factors and assumption. In addition, the contractual amounts of the derivatives transactions discussed in “Derivative Financial Instruments” below are not an indicator of the market risk associated with derivatives transactions.
(2) Fair value of financial instruments
Fair value and difference compared to the book value reported in the balance sheets as of March 31, 2014 and 2013 are as follows. Please note that for those items of which obtaining an estimates fair value is deemed to be extremely difficult, such differences are not shown (Please refer to Note 2).
(Millions of yen) 2014 Book value
reported in the balance sheet
Fair value
Difference (1)Cash and deposits \25,726 \25,726 \- (2)Trade notes and accounts receivable 52,840 52,840 - (3)Short-term and long-term investment securities
1) Held-to-maturity debt securities 27,999 27,999 - 2) Other securities 5,669 5,669 - 3) Securities issued by affiliates
companies 4,182
19,023 14,841
Assets 116,416 131,257 14,841 (1)Trade notes and accounts payable 35,266 35,266 - (2)Short-term loans payable 5,826 5,826 - (3)Current portion of long-term debt 10,119 10,119 - (4)Bonds payable 10,000 10,078 78 (5)Long-term loans payable 259 261 2
Liabilities 61,470 61,550 80 Derivatives (3) (3) -
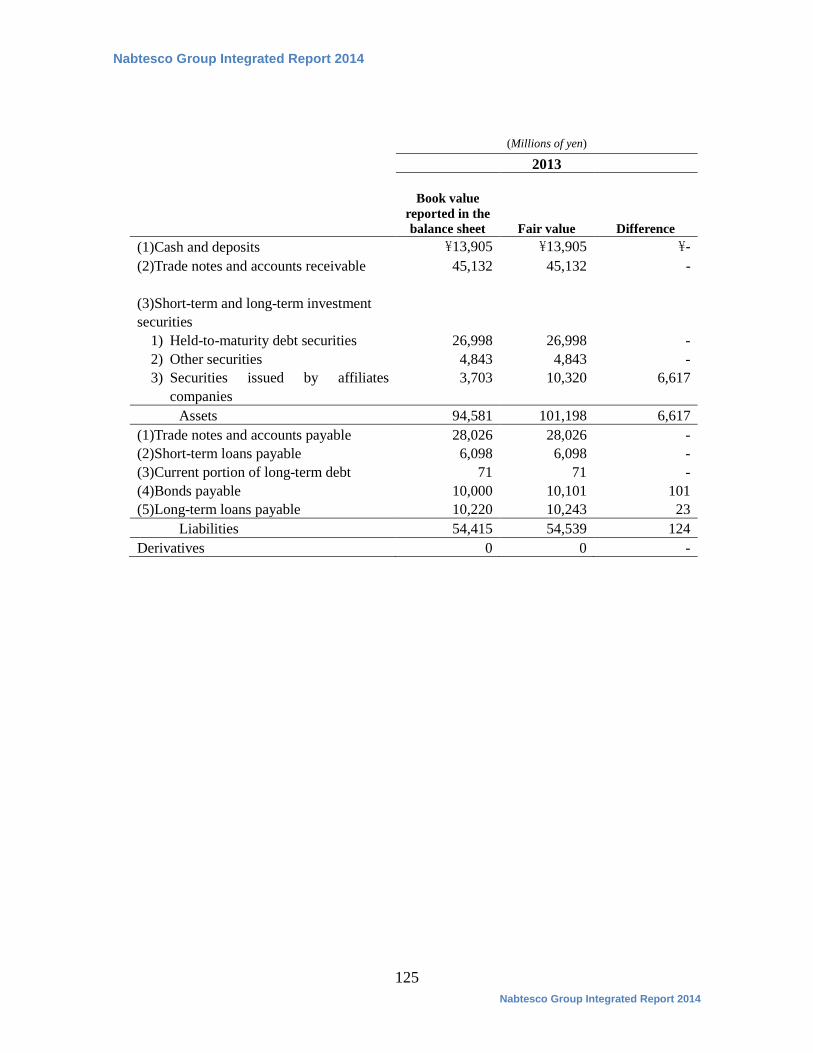
Nabtesco Group Integrated Report 2014
125 Nabtesco Group Integrated Report 2014
(Millions of yen) 2013
Book value reported in the balance sheet
Fair value
Difference (1)Cash and deposits \13,905 \13,905 \- (2)Trade notes and accounts receivable 45,132 45,132
-
(3)Short-term and long-term investment securities
1) Held-to-maturity debt securities 26,998 26,998 - 2) Other securities 4,843 4,843 - 3) Securities issued by affiliates
companies 3,703
10,320 6,617
Assets 94,581 101,198 6,617 (1)Trade notes and accounts payable 28,026 28,026 - (2)Short-term loans payable 6,098 6,098 - (3)Current portion of long-term debt 71 71 - (4)Bonds payable 10,000 10,101 101 (5)Long-term loans payable 10,220 10,243 23
Liabilities 54,415 54,539 124 Derivatives 0 0 -

Nabtesco Group Integrated Report 2014
126 Nabtesco Group Integrated Report 2014
(Thousands of U.S. dollars) 2014 Book value
reported in the balance sheet
Fair value
Difference (1)Cash and deposits $249,961 $249,961 $ - (2)Trade notes and accounts receivable 513,408 513,408 - (3)Short-term and long-term investment securities
1) Held-to-maturity debt securities 272,046 272,046 - 2) Other securities 55,082 55,082 - 3) Securities issued by affiliates
companies 40,634 184,833
144,199
Assets 1,131,131 1,275,330 144,199 (1)Trade notes and accounts payable 342,654 342,654 - (2)Short-term loans payable 56,607 56,607 - (3)Current portion of long-term debt 98,319 98,319 -
(4)Bonds payable 97,163 97,921 758 (5)Long-term loans payable 2,517 2,536 19
Liabilities 597,260 598,037 777 Derivatives (29) (29) - Note: The value of assets and liabilities arising from derivatives is shown at net value.
Note1: Methods for computing the estimated fair value of financial instruments and securities and derivative transactions Assets (1) Cash and deposits and (2)Trade notes and account receivable
Since these items are settled in a short period of time and have estimated values that are virtually the same as book value, the book value is used.
(3) Short-term and long-term investment securities Stocks are valued at the exchange trading price. Bonds are valued at the exchange trading price or at the price provided by the financial institutions. For information on securities classified as purpose of holding, please refer to the “Securities” section of the notes to the financial statement.
Liabilities (1) Trade notes and accounts payable, (2) Short-term loans payable and (3) Current portion of
long-term debt Since these items are settled in a short period of time and have estimated fair values that are virtually the same as the book value, the book value is used.

Nabtesco Group Integrated Report 2014
127 Nabtesco Group Integrated Report 2014
(4)Bonds payable Bonds payable is valued at the exchange trading price or at the price provided by the financial institutions.
(5) Long-term loans payable The fair values of long-term bank loans are calculated by the total sum of the principal discounted by the interest rates that would apply if similar borrowings were conducted anew. The fair values of long-term bank loans for which the special accounting method for interest-rate swaps is applied are calculated by the total sum of the principal (accounted for together with the interest-rate swaps) discounted by interest rates that would apply if similar borrowings were conducted anew.
Derivatives Please refer to the “Derivatives” section of the notes to the financial statement.
Note2: Items for which obtaining an estimated fair value is deemed to be extremely difficult
(Millions of yen) (Thousands of U.S. dollars)
2014 Items Book value
Unlisted stocks \122 $1,186 Securities issued by affiliate companies 11,211 108,929
(Millions of yen) (Thousands of U.S. dollars)
2013 Items Book value
Unlisted stocks \122 $1,297 Securities issued by affiliate companies 8,233 87,539
The unlisted stocks and securities issued by affiliate companies in the below table are not included in the above table because there is no fair value available.
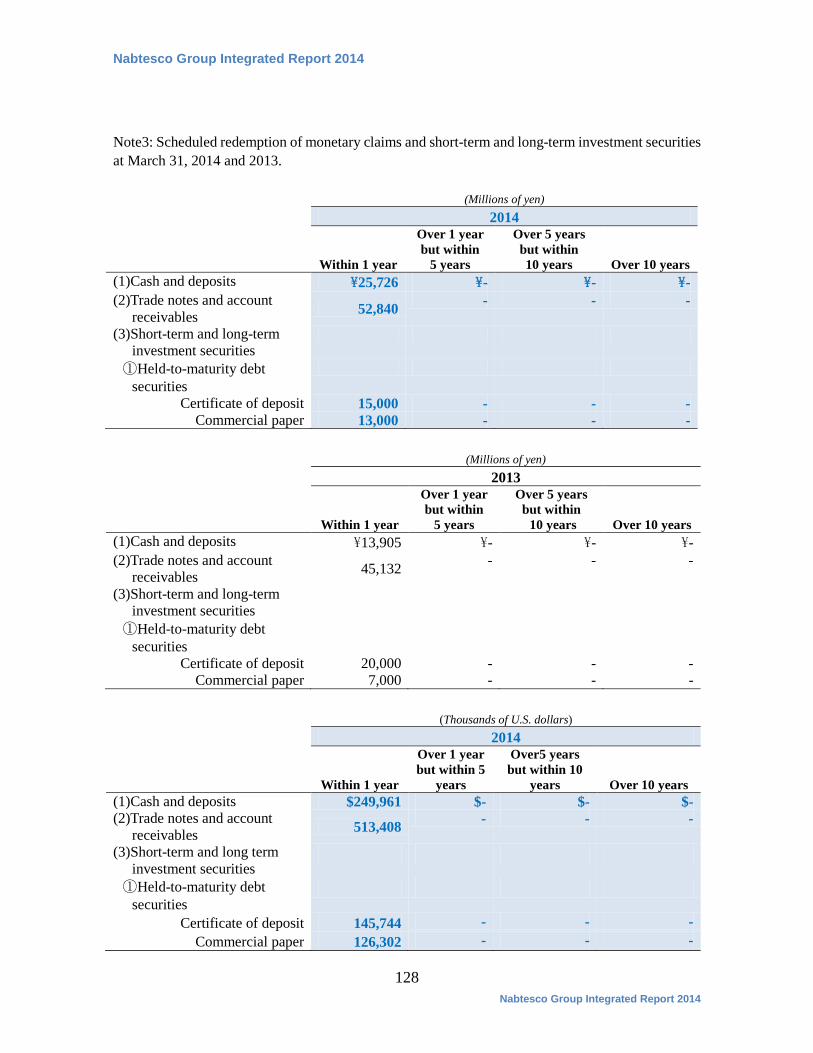
Nabtesco Group Integrated Report 2014
128 Nabtesco Group Integrated Report 2014
Note3: Scheduled redemption of monetary claims and short-term and long-term investment securities at March 31, 2014 and 2013. (Millions of yen) 2014
Within 1 year
Over 1 year but within
5 years
Over 5 years but within 10 years
Over 10 years (1)Cash and deposits \25,726 \- \- \- (2)Trade notes and account
receivables 52,840 - - -
(3)Short-term and long-term investment securities
①Held-to-maturity debt securities
Certificate of deposit 15,000 - - - Commercial paper 13,000 - - -
(Millions of yen) 2013
Within 1 year
Over 1 year but within
5 years
Over 5 years but within 10 years
Over 10 years (1)Cash and deposits \13,905 \- \- \- (2)Trade notes and account
receivables 45,132 - - -
(3)Short-term and long-term investment securities
①Held-to-maturity debt securities
Certificate of deposit 20,000 - - - Commercial paper 7,000 - - -
(Thousands of U.S. dollars) 2014
Within 1 year
Over 1 year but within 5
years
Over5 years but within 10
years
Over 10 years (1)Cash and deposits $249,961 $- $- $- (2)Trade notes and account
receivables 513,408 - - -
(3)Short-term and long term investment securities
①Held-to-maturity debt securities
Certificate of deposit 145,744 - - - Commercial paper 126,302 - - -
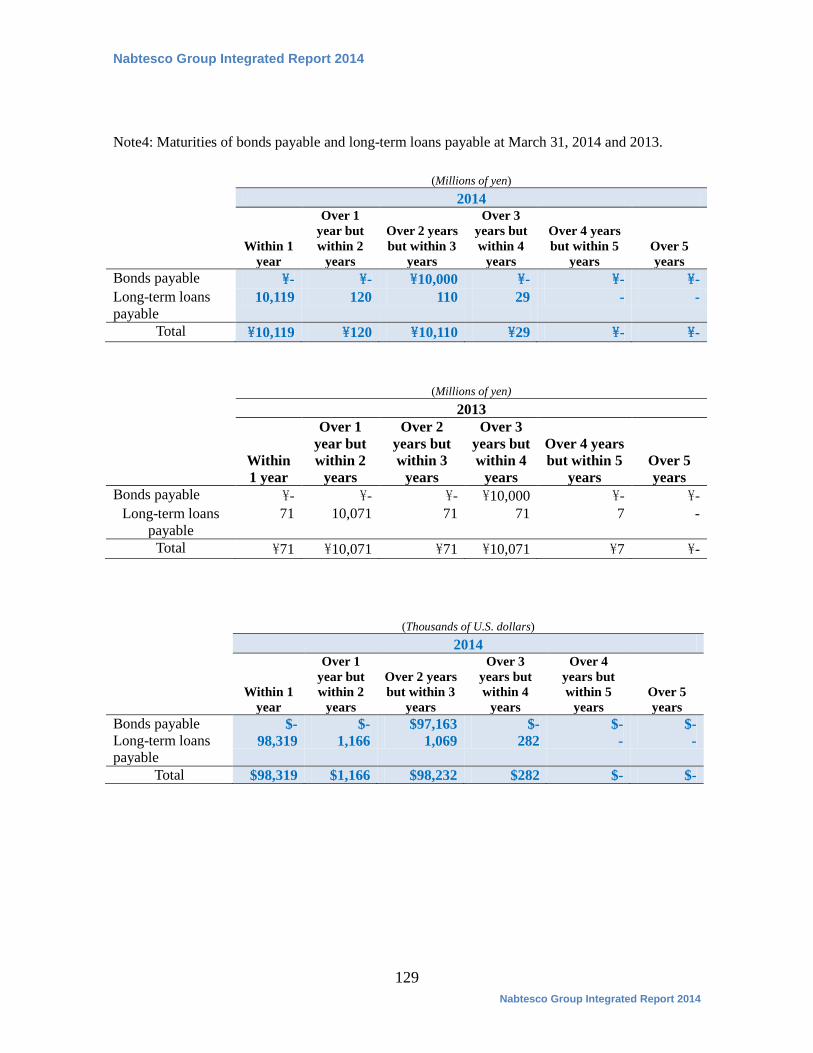
Nabtesco Group Integrated Report 2014
129 Nabtesco Group Integrated Report 2014
Note4: Maturities of bonds payable and long-term loans payable at March 31, 2014 and 2013. (Millions of yen) 2014
Within 1
year
Over 1 year but within 2
years
Over 2 years but within 3
years
Over 3 years but within 4
years
Over 4 years but within 5
years
Over 5 years
Bonds payable \- \- \10,000 \- \- \- Long-term loans payable
10,119 120 110 29
- -
Total \10,119 \120 \10,110 \29 \- \-
(Millions of yen) 2013
Within 1 year
Over 1 year but within 2
years
Over 2 years but within 3
years
Over 3 years but within 4
years
Over 4 years but within 5
years
Over 5 years
Bonds payable \- \- \- \10,000 \- \- Long-term loans
payable 71 10,071 71 71 7 -
Total \71 \10,071 \71 \10,071 \7 \- (Thousands of U.S. dollars) 2014
Within 1
year
Over 1 year but within 2
years
Over 2 years but within 3
years
Over 3 years but within 4
years
Over 4 years but within 5
years
Over 5 years
Bonds payable $- $- $97,163 $- $- $- Long-term loans payable
98,319 1,166 1,069 282 - -
Total $98,319 $1,166 $98,232 $282 $- $-
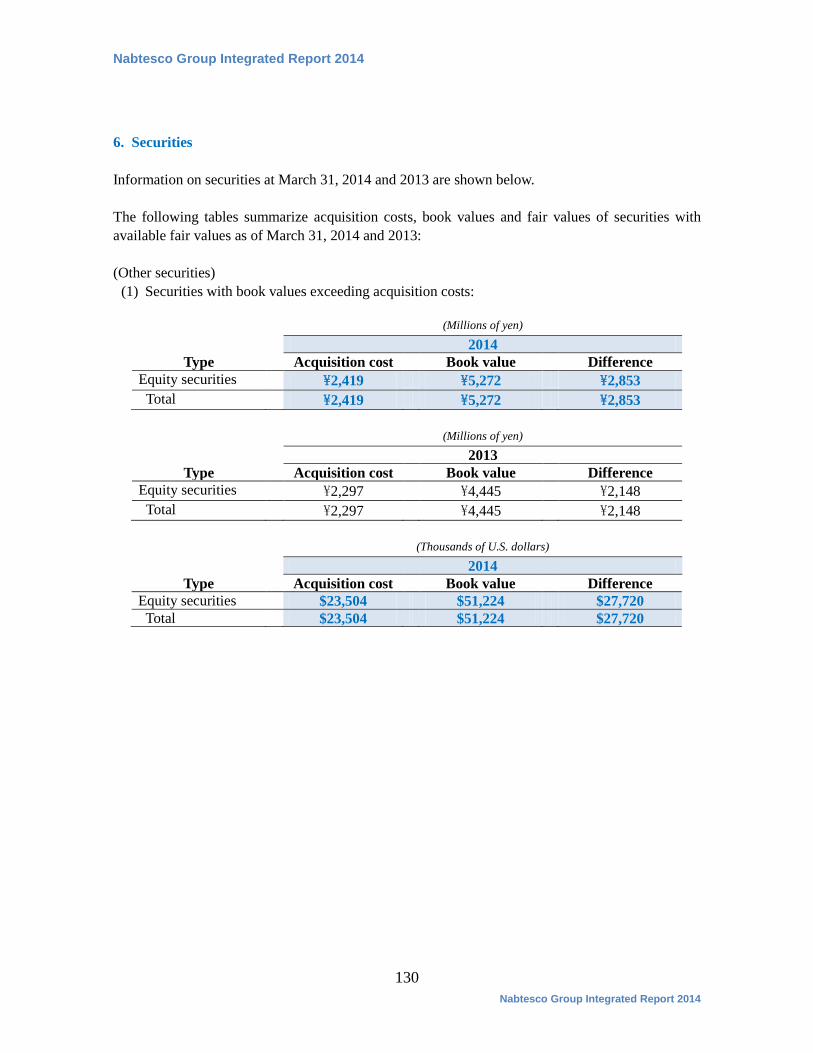
Nabtesco Group Integrated Report 2014
130 Nabtesco Group Integrated Report 2014
6. Securities
Information on securities at March 31, 2014 and 2013 are shown below. The following tables summarize acquisition costs, book values and fair values of securities with available fair values as of March 31, 2014 and 2013: (Other securities)
(1) Securities with book values exceeding acquisition costs:
(Millions of yen)
2014 Type Acquisition cost Book value Difference
Equity securities \2,419 \5,272 \2,853 Total \2,419 \5,272 \2,853
(Millions of yen) 2013
Type Acquisition cost Book value Difference Equity securities \2,297 \4,445 \2,148 Total \2,297 \4,445 \2,148
(Thousands of U.S. dollars)
2014 Type Acquisition cost Book value Difference
Equity securities $23,504 $51,224 $27,720 Total $23,504 $51,224 $27,720
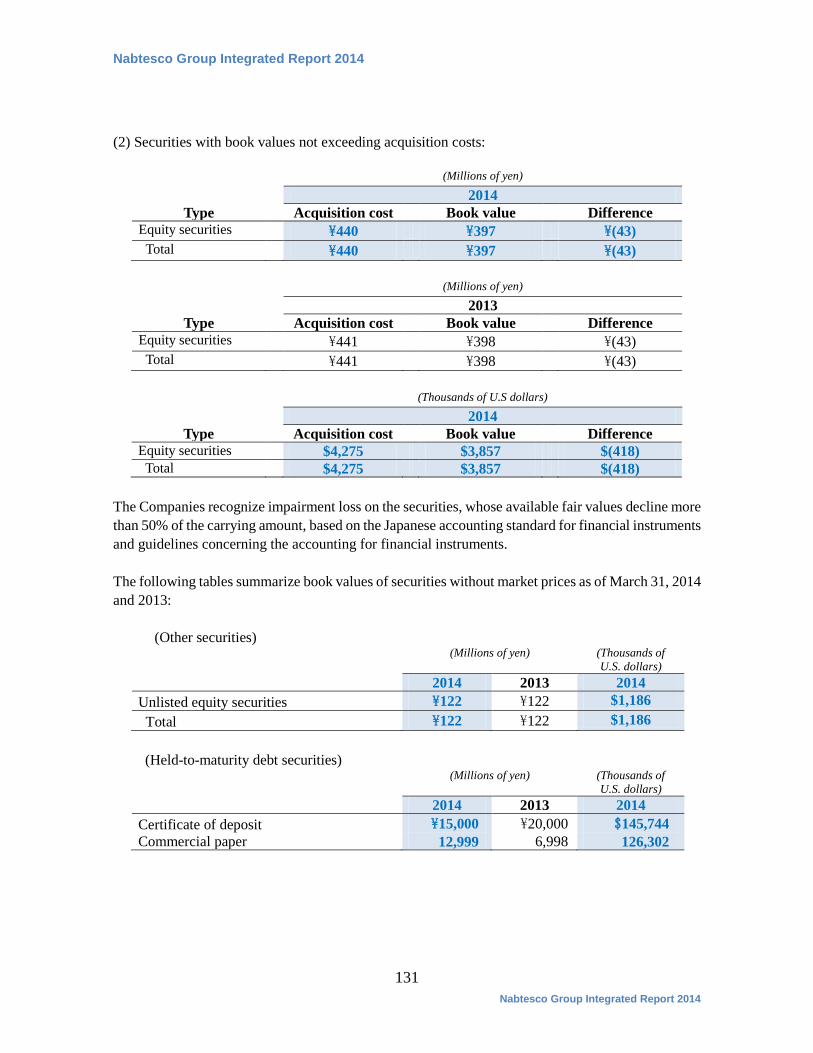
Nabtesco Group Integrated Report 2014
131 Nabtesco Group Integrated Report 2014
(2) Securities with book values not exceeding acquisition costs:
(Millions of yen)
2014 Type Acquisition cost Book value Difference
Equity securities \440 \397 \(43) Total \440 \397 \(43)
(Millions of yen)
2013 Type Acquisition cost Book value Difference
Equity securities \441 \398 \(43) Total \441 \398 \(43)
(Thousands of U.S dollars)
2014 Type Acquisition cost Book value Difference
Equity securities $4,275 $3,857 $(418) Total $4,275 $3,857 $(418)
The Companies recognize impairment loss on the securities, whose available fair values decline more than 50% of the carrying amount, based on the Japanese accounting standard for financial instruments and guidelines concerning the accounting for financial instruments.
The following tables summarize book values of securities without market prices as of March 31, 2014 and 2013:
(Other securities)
(Millions of yen) (Thousands of
U.S. dollars) 2014 2013 2014
Unlisted equity securities \122 \122 $1,186 Total \122 \122 $1,186
(Held-to-maturity debt securities)
(Millions of yen) (Thousands of
U.S. dollars) 2014 2013 2014
Certificate of deposit \15,000 \20,000 $145,744 Commercial paper 12,999 6,998 126,302
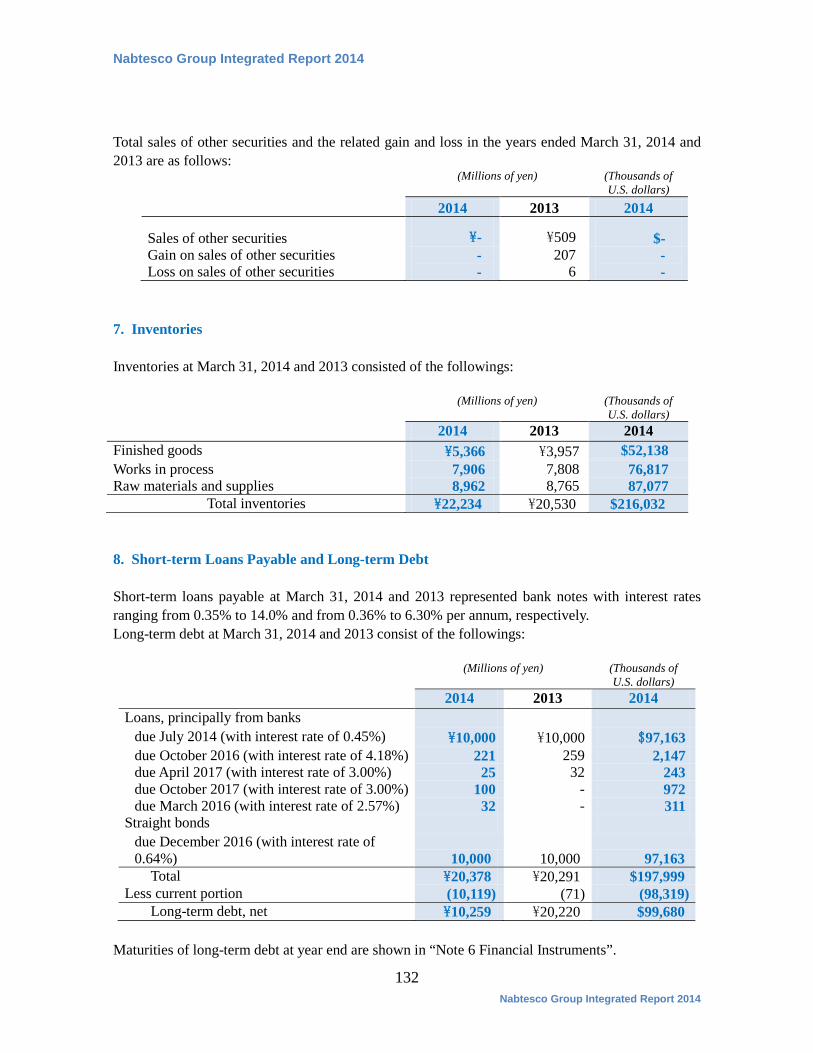
Nabtesco Group Integrated Report 2014
132 Nabtesco Group Integrated Report 2014
Total sales of other securities and the related gain and loss in the years ended March 31, 2014 and 2013 are as follows:
(Millions of yen) (Thousands of
U.S. dollars) 2014 2013 2014
Sales of other securities \- \509 $- Gain on sales of other securities Loss on sales of other securities
- -
207 6
- -
7. Inventories
Inventories at March 31, 2014 and 2013 consisted of the followings:
(Millions of yen) (Thousands of U.S. dollars)
2014 2013 2014 Finished goods \5,366 \3,957 $52,138 Works in process 7,906 7,808 76,817 Raw materials and supplies 8,962 8,765 87,077
Total inventories \22,234 \20,530 $216,032 8. Short-term Loans Payable and Long-term Debt
Short-term loans payable at March 31, 2014 and 2013 represented bank notes with interest rates ranging from 0.35% to 14.0% and from 0.36% to 6.30% per annum, respectively. Long-term debt at March 31, 2014 and 2013 consist of the followings:
(Millions of yen) (Thousands of U.S. dollars)
2014 2013 2014 Loans, principally from banks
due July 2014 (with interest rate of 0.45%) \10,000 \10,000 $97,163 due October 2016 (with interest rate of 4.18%) 221 259 2,147 due April 2017 (with interest rate of 3.00%) 25 32 243 due October 2017 (with interest rate of 3.00%) 100 - 972 due March 2016 (with interest rate of 2.57%) 32 - 311
Straight bonds due December 2016 (with interest rate of 0.64%) 10,000 10,000 97,163
Total \20,378 \20,291 $197,999 Less current portion (10,119) (71) (98,319)
Long-term debt, net \10,259 \20,220 $99,680
Maturities of long-term debt at year end are shown in “Note 6 Financial Instruments”.
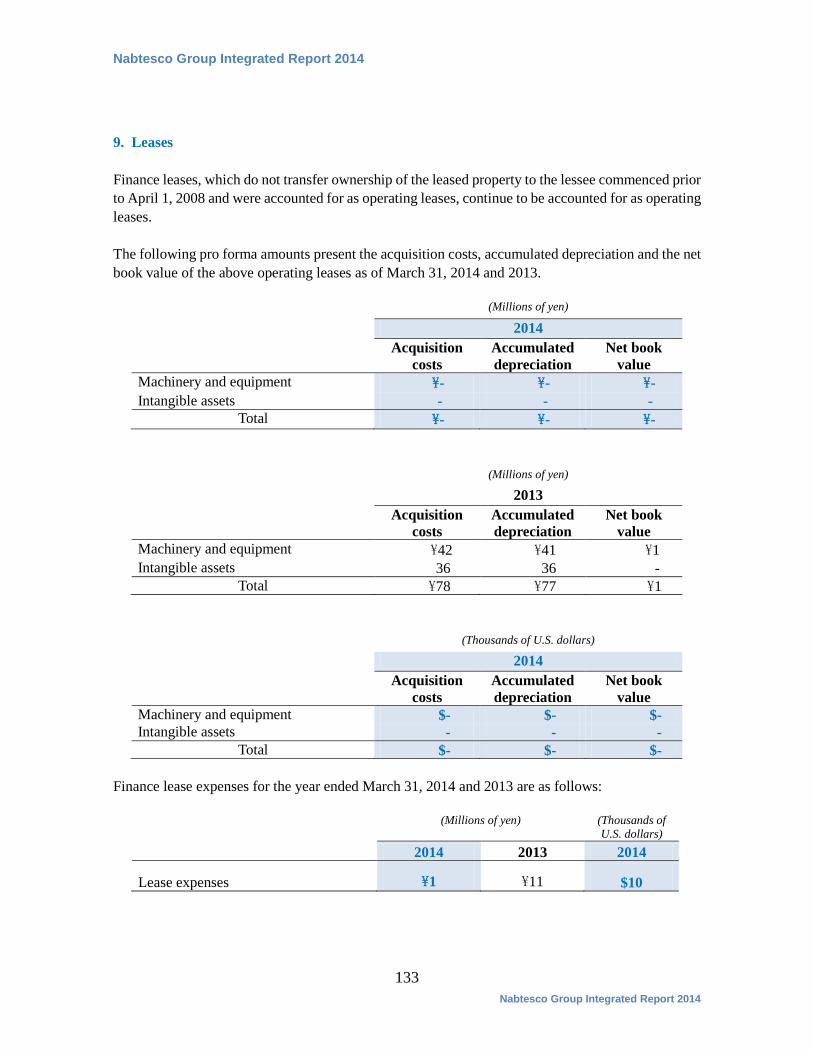
Nabtesco Group Integrated Report 2014
133 Nabtesco Group Integrated Report 2014
9. Leases
Finance leases, which do not transfer ownership of the leased property to the lessee commenced prior to April 1, 2008 and were accounted for as operating leases, continue to be accounted for as operating leases. The following pro forma amounts present the acquisition costs, accumulated depreciation and the net book value of the above operating leases as of March 31, 2014 and 2013.
(Millions of yen)
2014 Acquisition
costs Accumulated depreciation
Net book value
Machinery and equipment \- \- \- Intangible assets - - -
Total \- \- \-
(Millions of yen)
2013 Acquisition
costs Accumulated depreciation
Net book value
Machinery and equipment \42 \41 \1 Intangible assets 36 36 -
Total \78 \77 \1
(Thousands of U.S. dollars)
2014 Acquisition
costs Accumulated depreciation
Net book value
Machinery and equipment $- $- $- Intangible assets - - -
Total $- $- $- Finance lease expenses for the year ended March 31, 2014 and 2013 are as follows:
(Millions of yen)
(Thousands of U.S. dollars)
2014 2013 2014
Lease expenses \1 \11 $10
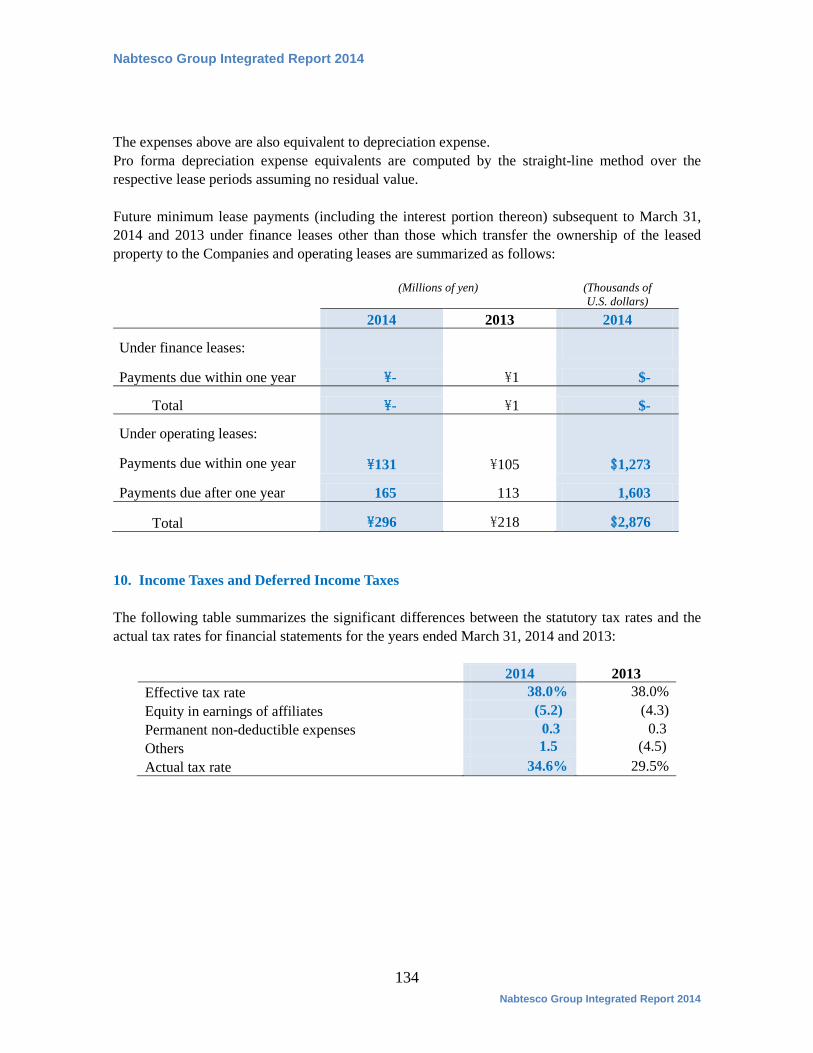
Nabtesco Group Integrated Report 2014
134 Nabtesco Group Integrated Report 2014
The expenses above are also equivalent to depreciation expense. Pro forma depreciation expense equivalents are computed by the straight-line method over the respective lease periods assuming no residual value. Future minimum lease payments (including the interest portion thereon) subsequent to March 31, 2014 and 2013 under finance leases other than those which transfer the ownership of the leased property to the Companies and operating leases are summarized as follows: (Millions of yen)
(Thousands of U.S. dollars)
2014 2013 2014
Under finance leases:
Payments due within one year \- \1 $-
Total \- \1 $-
Under operating leases:
Payments due within one year \131 \105 $1,273
Payments due after one year 165 113 1,603
Total \296 \218 $2,876
10. Income Taxes and Deferred Income Taxes
The following table summarizes the significant differences between the statutory tax rates and the actual tax rates for financial statements for the years ended March 31, 2014 and 2013:
2014 2013 Effective tax rate 38.0% 38.0% Equity in earnings of affiliates (5.2) (4.3) Permanent non-deductible expenses 0.3 0.3 Others 1.5 (4.5) Actual tax rate 34.6% 29.5%
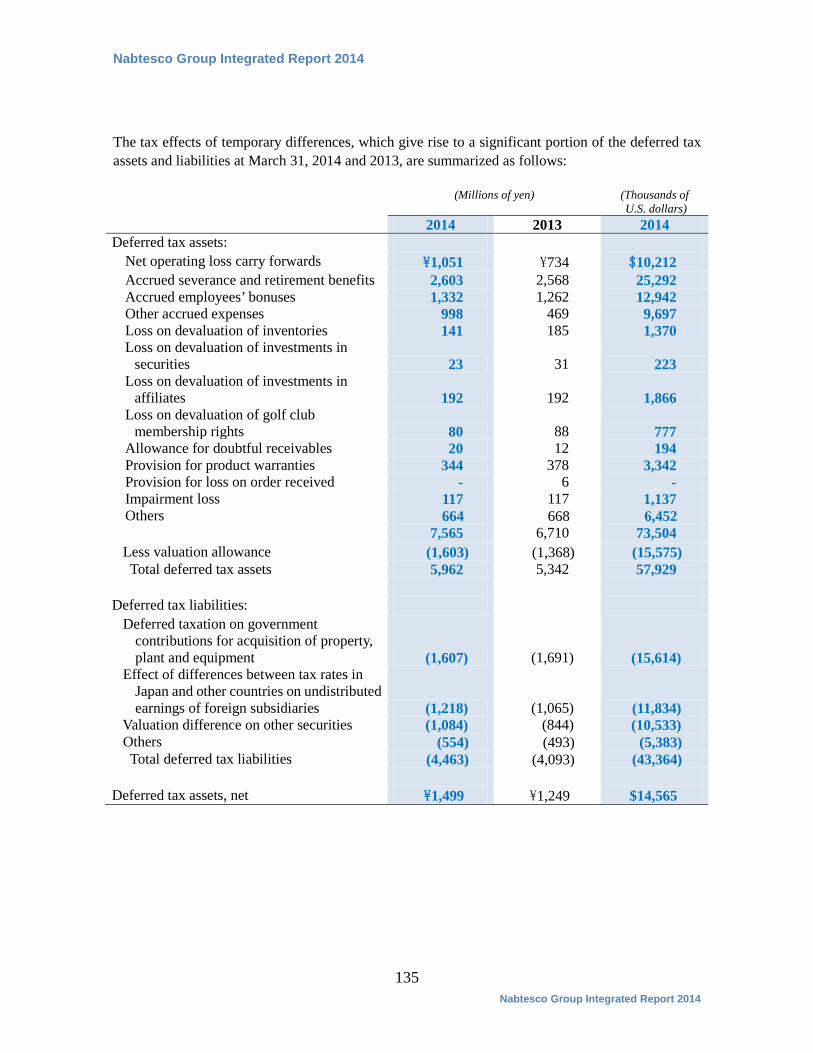
Nabtesco Group Integrated Report 2014
135 Nabtesco Group Integrated Report 2014
The tax effects of temporary differences, which give rise to a significant portion of the deferred tax assets and liabilities at March 31, 2014 and 2013, are summarized as follows: (Millions of yen) (Thousands of
U.S. dollars) 2014 2013 2014 Deferred tax assets:
Net operating loss carry forwards \1,051 \734 $10,212 Accrued severance and retirement benefits 2,603 2,568 25,292 Accrued employees’ bonuses 1,332 1,262 12,942 Other accrued expenses 998 469 9,697 Loss on devaluation of inventories 141 185 1,370 Loss on devaluation of investments in
securities 23 31 223 Loss on devaluation of investments in
affiliates 192 192 1,866 Loss on devaluation of golf club
membership rights 80 88 777 Allowance for doubtful receivables 20 12 194 Provision for product warranties 344 378 3,342 Provision for loss on order received - 6 - Impairment loss 117 117 1,137 Others 664 668 6,452
7,565 6,710 73,504 Less valuation allowance (1,603) (1,368) (15,575) Total deferred tax assets 5,962 5,342 57,929 Deferred tax liabilities: Deferred taxation on government
contributions for acquisition of property, plant and equipment (1,607) (1,691) (15,614)
Effect of differences between tax rates in Japan and other countries on undistributed earnings of foreign subsidiaries (1,218) (1,065) (11,834)
Valuation difference on other securities (1,084) (844) (10,533) Others (554) (493) (5,383) Total deferred tax liabilities (4,463) (4,093) (43,364) Deferred tax assets, net \1,499 \1,249 $14,565
Nabtesco Group Integrated Report 2014
136 Nabtesco Group Integrated Report 2014
Adjustment of deferred tax assets and liabilities for enacted changes in tax laws and rates In accordance with the promulgation of Act on Partial Revision of the income Tax Act on March 31, 2014, special corporate tax for reconstruction shall cease to impose on the Company from the year beginning on or after April 1, 2014. Due to this, in calculation of deferred tax assets and deferred tax liabilities for the year ended March 31, 2014, the effective tax rate was changed from 38.0% of the previous year to 35.6% for temporary difference that are expected to be eliminated in the period beginning from April 1, 2014. As a result, deferred tax assets less deferred tax liabilities have decreased by \155 million ($1,506 thousand), and income taxes (deferred) have increased by \155 million ($1,506 thousand) for the year ended March 31, 2014, respectively. 11. Net Assets
Under the Japanese Corporate Law, upon issuance of common stock, the entire amount of the issue price is required to be accounted for as common stock, although companies may, by resolution of the Board of Directors, account for an amount not exceeding one-half of the issue price of the new shares as additional paid-in capital, which is included in capital surplus.
Under the Japanese Corporate Law, in cases where a dividend distribution of surplus is made, the smaller of an amount equal to 10% of the dividend or the excess, if any, of 25% of common stock over the total of additional paid-in-capital and legal earnings reserve must be set aside as additional paid-in-capital or legal earnings reserve. Legal earnings reserve is included in retained earnings in the accompanying consolidated balance sheets. Under the Japanese Corporate Law, legal earnings reserve and additional paid-in capital could be used to eliminate or reduce a deficit by a resolution of the shareholders' meeting. Additional paid-in capital and legal earnings reserve may not be distributed as dividends. Under the Japanese Corporate Law, however, all additional paid-in-capital and all legal earnings reserve may be transferred to other capital surplus and retained earnings, respectively, which are potentially available for dividends. The maximum amount that the Company can distribute as dividends is calculated based on the non-consolidated financial statements of the Company in accordance with the Japanese Corporate Law.

Nabtesco Group Integrated Report 2014
137 Nabtesco Group Integrated Report 2014
12. Employee’s Severance and Retirement Benefits
The liabilities for severance and retirement benefits include in the liability section of the consolidated balance sheets as of March 31, 2014 are consisted of the followings: Retirement benefit obligations (1) Movement in retirement benefit obligations, except for the plan applied simplified method
(Millions of yen) (Thousands of U.S. dollars)
2014 2014 Balance at April 1, 2013 \21,712 $210,960 Service cost 1,145 11,125 Interest cost 281 2,730 Actuarial loss (gain) (920) (8,939) Benefits paid (1,890) (18,363) Past service cost (233) (2,264) Decrease from termination of a plan (4,558) (44,287) The effect of changes in foreign exchange rates 2,216 21,531
Balance at March 31, 2014 \17,753 $172,493
(2) Movement in plan assets, except for the plan applied simplified method (Millions of yen) (Thousands of
U.S. dollars) 2014 2014 Balance at April 1, 2013 \13,706 $133,171
Expected return on plan assets 195 1,895 Actuarial loss (gain) 659 6,403 Contributions by the employer 505 4,907 Contributions by the employee 319 3,099 Benefits paid (1,282) (12,456) Decrease from termination of a plan (3,279) (31,860) The effect of changes in foreign exchange rates 2,229 21,658
Balance at March 31, 2014 \13,052 $126,817 (3) Movement in liability for retirement benefits plan applying simplified method
(Millions of yen) (Thousands of U.S. dollars)
2014 2014 Balance at April 1, 2013 \911 $8,851
Retirement benefit costs 101 981 Benefits paid (63) (612) Contributions to the plans - - The effect of changes in foreign exchange rates 1 10
Balance at March 31, 2014 \950 $9,230
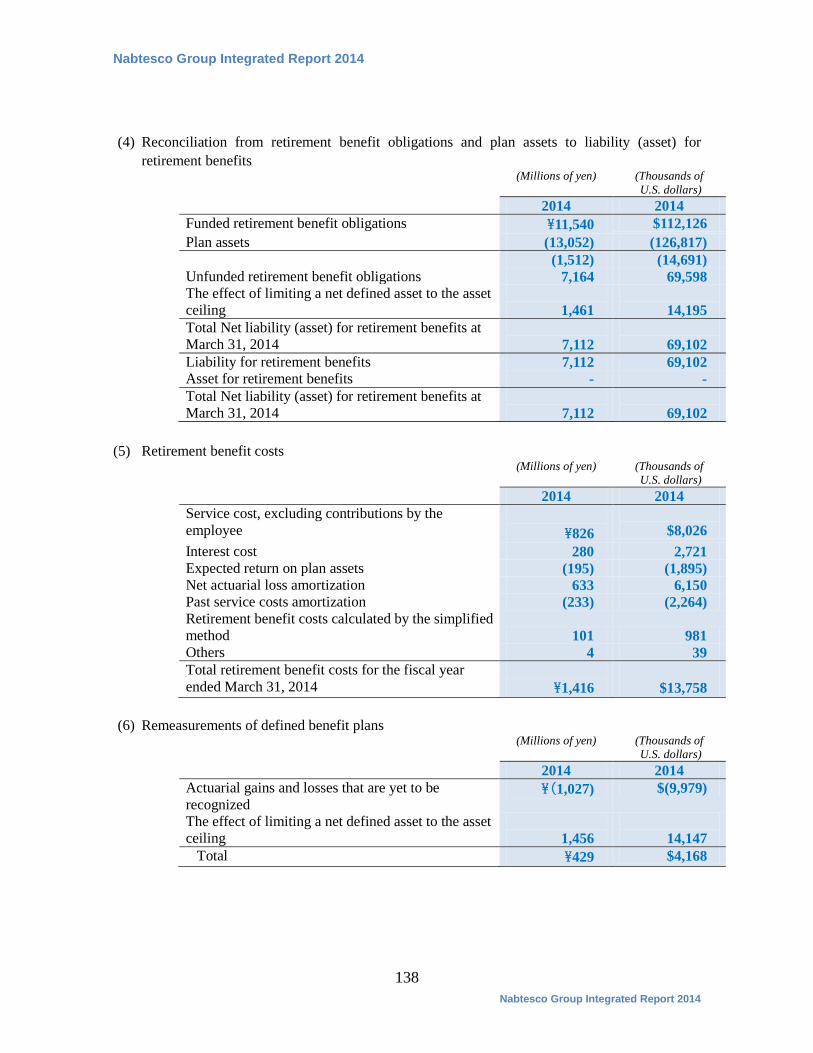
Nabtesco Group Integrated Report 2014
138 Nabtesco Group Integrated Report 2014
(4) Reconciliation from retirement benefit obligations and plan assets to liability (asset) for retirement benefits
(Millions of yen) (Thousands of U.S. dollars)
2014 2014 Funded retirement benefit obligations \11,540 $112,126 Plan assets (13,052) (126,817)
(1,512) (14,691) Unfunded retirement benefit obligations 7,164 69,598 The effect of limiting a net defined asset to the asset ceiling
1,461
14,195
Total Net liability (asset) for retirement benefits at March 31, 2014
7,112
69,102
Liability for retirement benefits 7,112 69,102 Asset for retirement benefits - - Total Net liability (asset) for retirement benefits at March 31, 2014
7,112
69,102
(5) Retirement benefit costs
(Millions of yen) (Thousands of U.S. dollars)
2014 2014 Service cost, excluding contributions by the employee
\826
$8,026 Interest cost 280 2,721 Expected return on plan assets (195) (1,895) Net actuarial loss amortization 633 6,150 Past service costs amortization (233) (2,264) Retirement benefit costs calculated by the simplified method 101 981 Others 4 39 Total retirement benefit costs for the fiscal year ended March 31, 2014
\1,416
$13,758
(6) Remeasurements of defined benefit plans
(Millions of yen) (Thousands of U.S. dollars)
2014 2014 Actuarial gains and losses that are yet to be recognized
\(1,027) $(9,979)
The effect of limiting a net defined asset to the asset ceiling
1,456
14,147
Total \429 $4,168
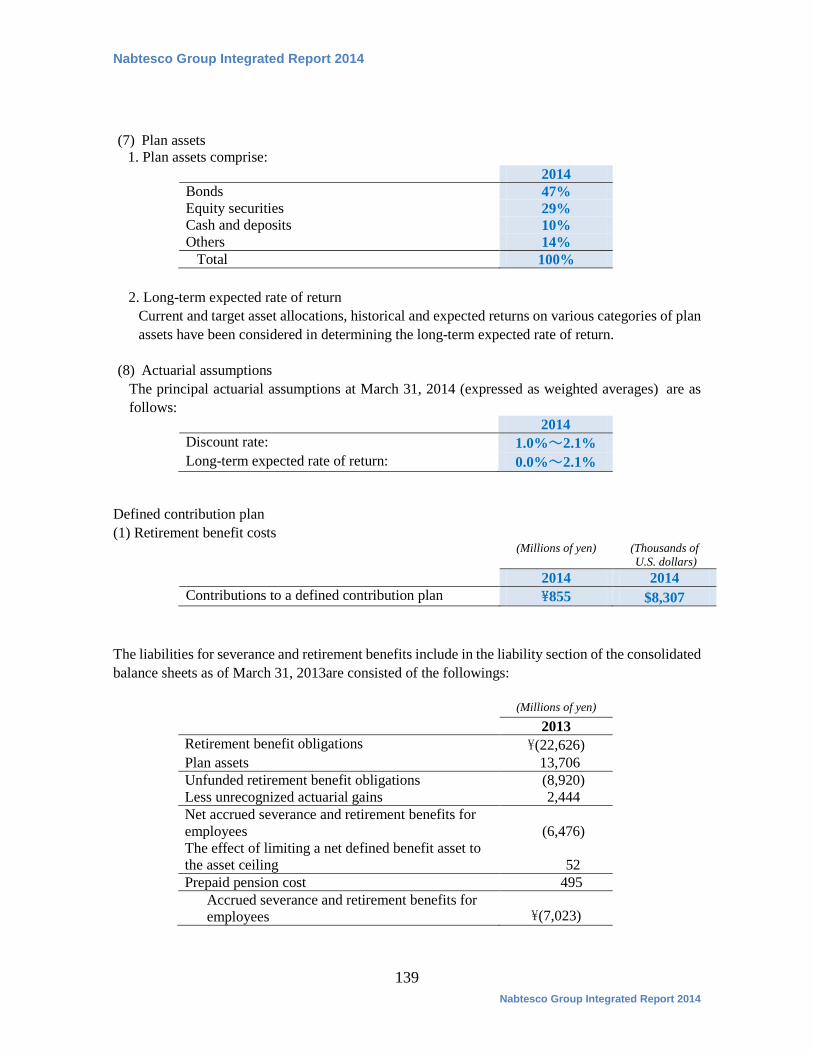
Nabtesco Group Integrated Report 2014
139 Nabtesco Group Integrated Report 2014
(7) Plan assets 1. Plan assets comprise:
2014 Bonds 47% Equity securities 29% Cash and deposits 10% Others 14% Total 100%
2. Long-term expected rate of return
Current and target asset allocations, historical and expected returns on various categories of plan assets have been considered in determining the long-term expected rate of return.
(8) Actuarial assumptions
The principal actuarial assumptions at March 31, 2014 (expressed as weighted averages) are as follows:
2014 Discount rate: 1.0%~2.1% Long-term expected rate of return: 0.0%~2.1%
Defined contribution plan (1) Retirement benefit costs
(Millions of yen) (Thousands of U.S. dollars)
2014 2014 Contributions to a defined contribution plan \855 $8,307
The liabilities for severance and retirement benefits include in the liability section of the consolidated balance sheets as of March 31, 2013are consisted of the followings:
(Millions of yen) 2013 Retirement benefit obligations \(22,626) Plan assets 13,706 Unfunded retirement benefit obligations (8,920) Less unrecognized actuarial gains 2,444 Net accrued severance and retirement benefits for employees (6,476) The effect of limiting a net defined benefit asset to the asset ceiling 52 Prepaid pension cost 495
Accrued severance and retirement benefits for employees \(7,023)
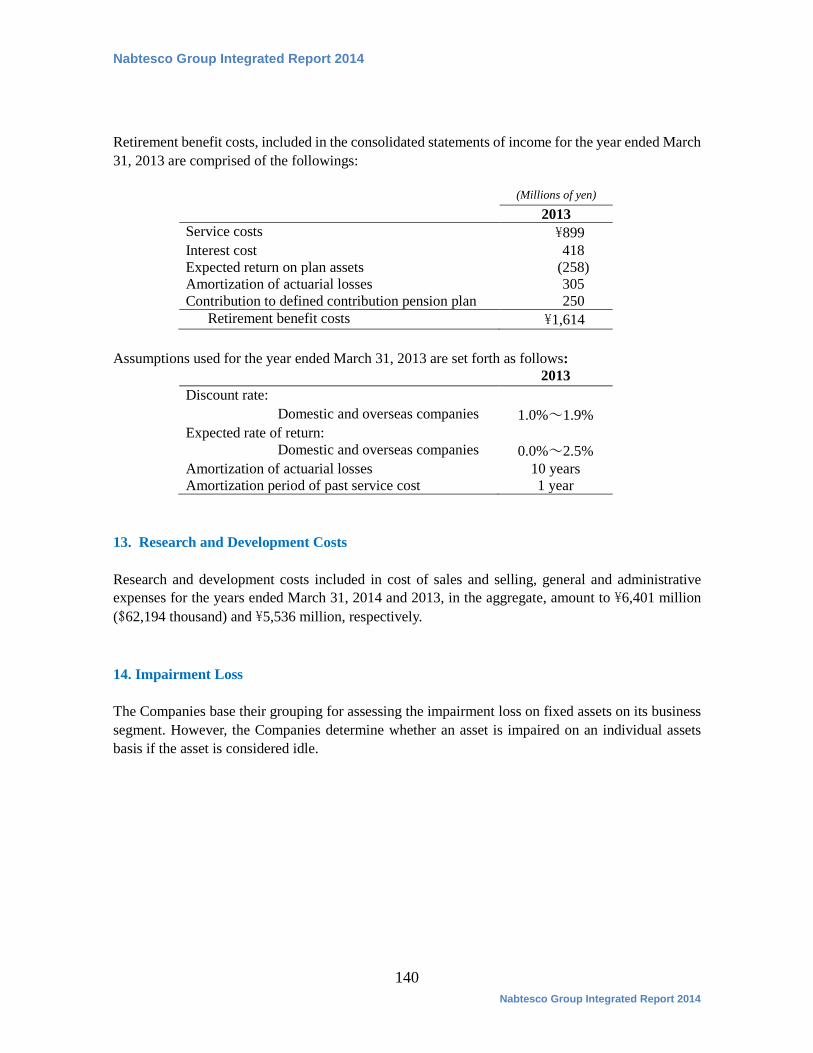
Nabtesco Group Integrated Report 2014
140 Nabtesco Group Integrated Report 2014
Retirement benefit costs, included in the consolidated statements of income for the year ended March 31, 2013 are comprised of the followings:
(Millions of yen)
2013 Service costs \899 Interest cost 418 Expected return on plan assets (258) Amortization of actuarial losses 305 Contribution to defined contribution pension plan 250
Retirement benefit costs \1,614 Assumptions used for the year ended March 31, 2013 are set forth as follows:
2013 Discount rate:
Domestic and overseas companies 1.0%~1.9% Expected rate of return:
Domestic and overseas companies 0.0%~2.5% Amortization of actuarial losses 10 years Amortization period of past service cost 1 year
13. Research and Development Costs
Research and development costs included in cost of sales and selling, general and administrative expenses for the years ended March 31, 2014 and 2013, in the aggregate, amount to \6,401 million ($62,194 thousand) and \5,536 million, respectively.
14. Impairment Loss The Companies base their grouping for assessing the impairment loss on fixed assets on its business segment. However, the Companies determine whether an asset is impaired on an individual assets basis if the asset is considered idle.
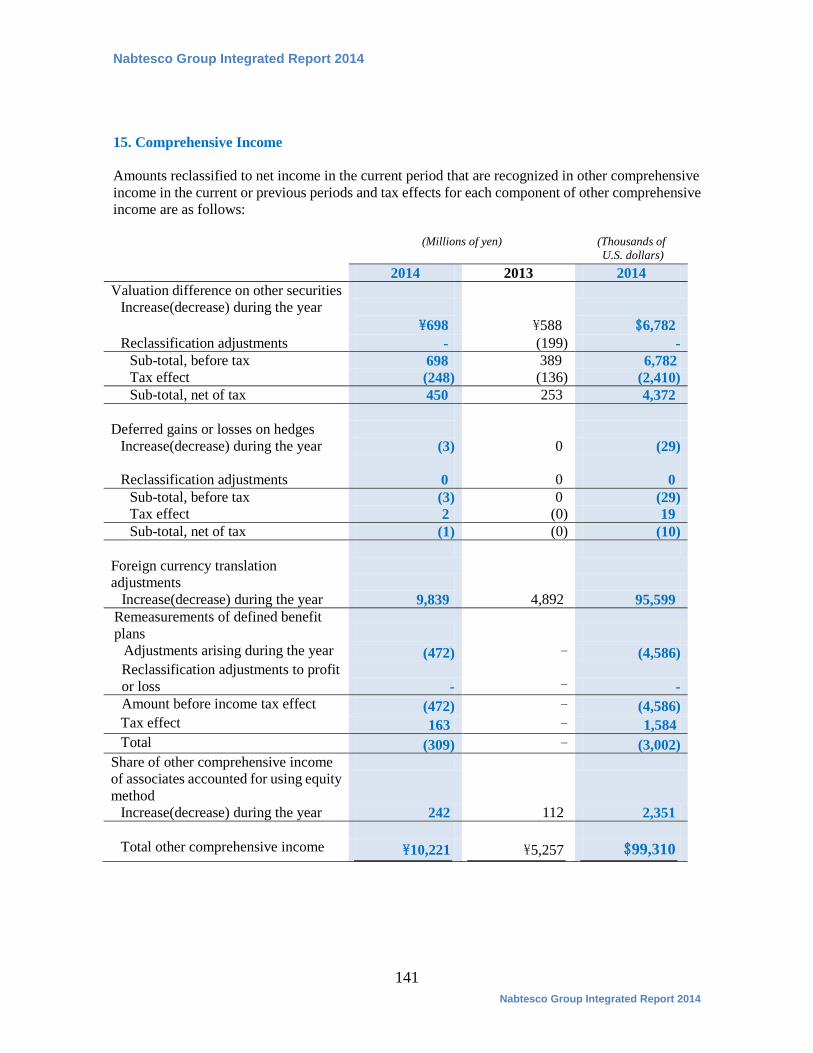
Nabtesco Group Integrated Report 2014
141 Nabtesco Group Integrated Report 2014
15. Comprehensive Income Amounts reclassified to net income in the current period that are recognized in other comprehensive income in the current or previous periods and tax effects for each component of other comprehensive income are as follows: (Millions of yen)
(Thousands of U.S. dollars)
2014 2013 2014 Valuation difference on other securities
Increase(decrease) during the year \698
\588 $6,782
Reclassification adjustments - (199) - Sub-total, before tax 698 389 6,782 Tax effect (248) (136) (2,410) Sub-total, net of tax 450 253 4,372
Deferred gains or losses on hedges
Increase(decrease) during the year (3) 0 (29) Reclassification adjustments 0 0 0
Sub-total, before tax (3) 0 (29) Tax effect 2 (0) 19 Sub-total, net of tax (1) (0) (10)
Foreign currency translation adjustments
Increase(decrease) during the year 9,839 4,892 95,599 Remeasurements of defined benefit plans
Adjustments arising during the year (472) - (4,586) Reclassification adjustments to profit or loss - - - Amount before income tax effect (472) - (4,586) Tax effect 163 - 1,584 Total (309) - (3,002)
Share of other comprehensive income of associates accounted for using equity method
Increase(decrease) during the year 242 112 2,351 Total other comprehensive income \10,221 \5,257 $99,310
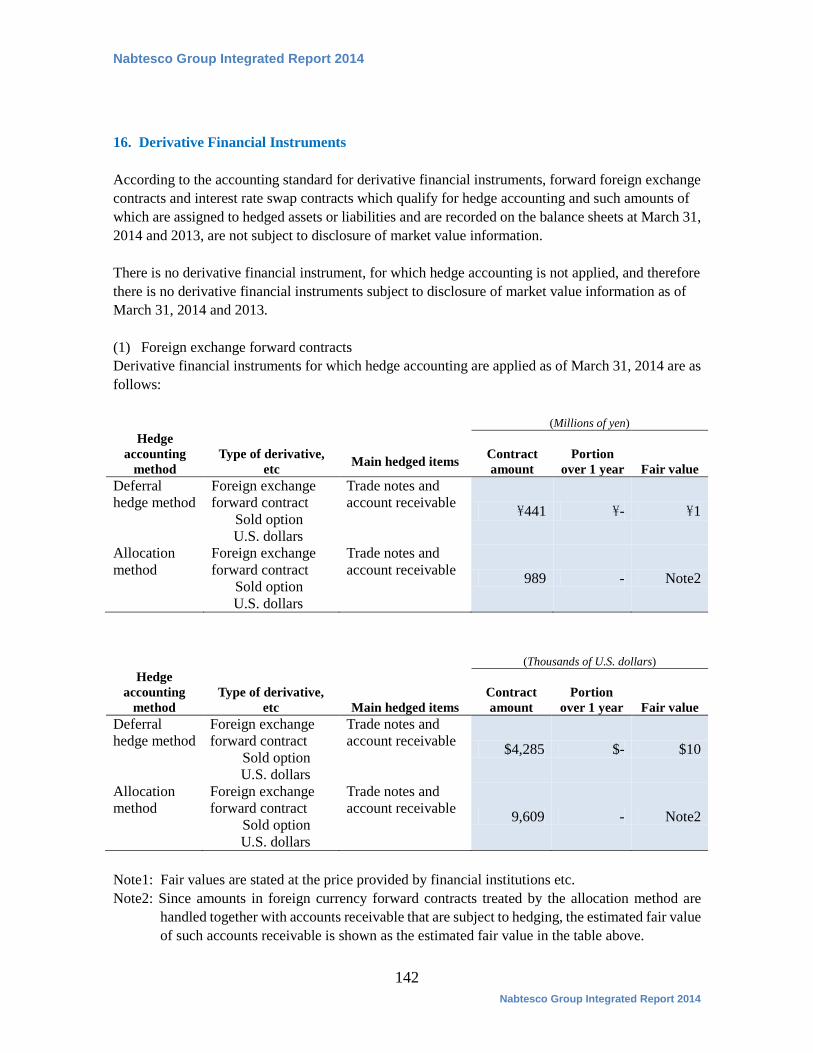
Nabtesco Group Integrated Report 2014
142 Nabtesco Group Integrated Report 2014
16. Derivative Financial Instruments
According to the accounting standard for derivative financial instruments, forward foreign exchange contracts and interest rate swap contracts which qualify for hedge accounting and such amounts of which are assigned to hedged assets or liabilities and are recorded on the balance sheets at March 31, 2014 and 2013, are not subject to disclosure of market value information. There is no derivative financial instrument, for which hedge accounting is not applied, and therefore there is no derivative financial instruments subject to disclosure of market value information as of March 31, 2014 and 2013. (1) Foreign exchange forward contracts Derivative financial instruments for which hedge accounting are applied as of March 31, 2014 are as follows:
(Millions of yen)
Hedge accounting
method
Type of derivative,
etc
Main hedged items
Contract amount
Portion
over 1 year
Fair value Deferral hedge method
Foreign exchange forward contract
Sold option U.S. dollars
Trade notes and account receivable
\441 \- \1
Allocation method
Foreign exchange forward contract
Sold option U.S. dollars
Trade notes and account receivable 989 - Note2
(Thousands of U.S. dollars) Hedge
accounting method
Type of derivative,
etc
Main hedged items
Contract amount
Portion
over 1 year
Fair value Deferral hedge method
Foreign exchange forward contract
Sold option U.S. dollars
Trade notes and account receivable $4,285 $- $10
Allocation method
Foreign exchange forward contract
Sold option U.S. dollars
Trade notes and account receivable 9,609 - Note2
Note1: Fair values are stated at the price provided by financial institutions etc. Note2: Since amounts in foreign currency forward contracts treated by the allocation method are
handled together with accounts receivable that are subject to hedging, the estimated fair value of such accounts receivable is shown as the estimated fair value in the table above.
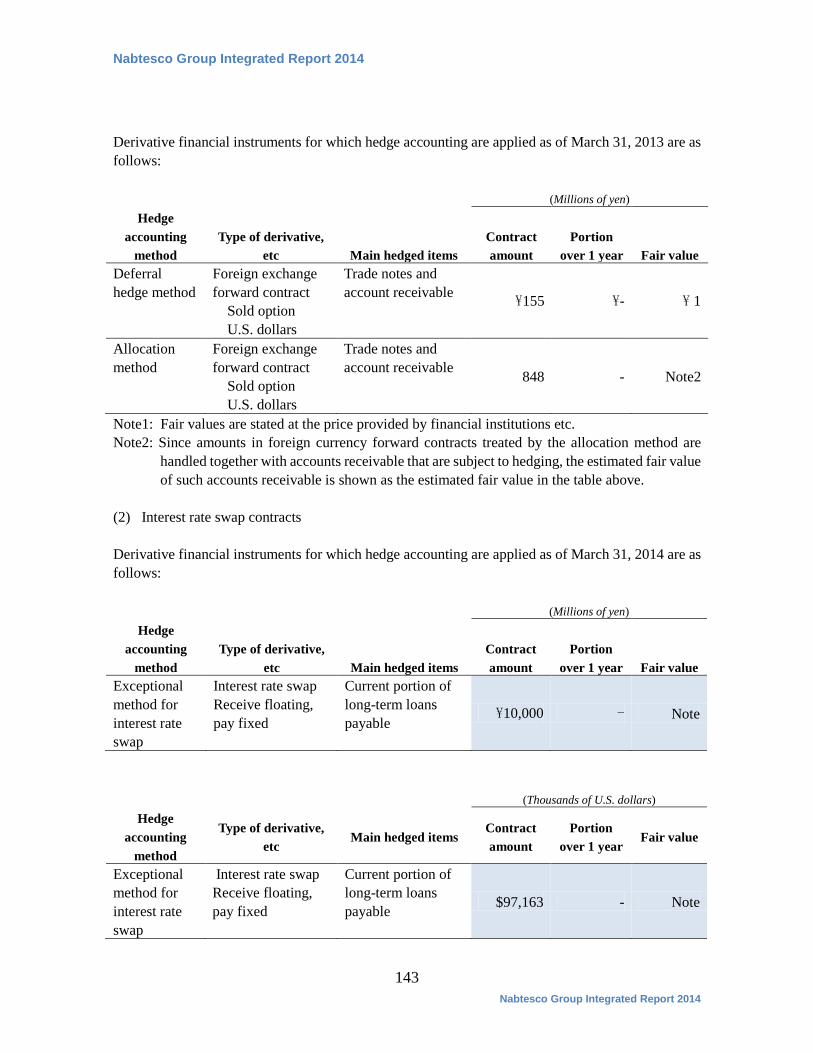
Nabtesco Group Integrated Report 2014
143 Nabtesco Group Integrated Report 2014
Derivative financial instruments for which hedge accounting are applied as of March 31, 2013 are as follows:
(Millions of yen) Hedge
accounting method
Type of derivative,
etc
Main hedged items
Contract amount
Portion
over 1 year
Fair value Deferral hedge method
Foreign exchange forward contract
Sold option U.S. dollars
Trade notes and account receivable
\155 \- \ 1
Allocation method
Foreign exchange forward contract
Sold option U.S. dollars
Trade notes and account receivable 848 - Note2
Note1: Fair values are stated at the price provided by financial institutions etc. Note2: Since amounts in foreign currency forward contracts treated by the allocation method are
handled together with accounts receivable that are subject to hedging, the estimated fair value of such accounts receivable is shown as the estimated fair value in the table above.
(2) Interest rate swap contracts Derivative financial instruments for which hedge accounting are applied as of March 31, 2014 are as follows:
(Millions of yen)
Hedge accounting
method
Type of derivative,
etc
Main hedged items
Contract amount
Portion
over 1 year
Fair value Exceptional method for interest rate swap
Interest rate swap Receive floating, pay fixed
Current portion of long-term loans payable
\10,000 - Note
(Thousands of U.S. dollars) Hedge
accounting method
Type of derivative, etc
Main hedged items Contract amount
Portion over 1 year
Fair value
Exceptional method for interest rate swap
Interest rate swap Receive floating, pay fixed
Current portion of long-term loans payable $97,163 - Note
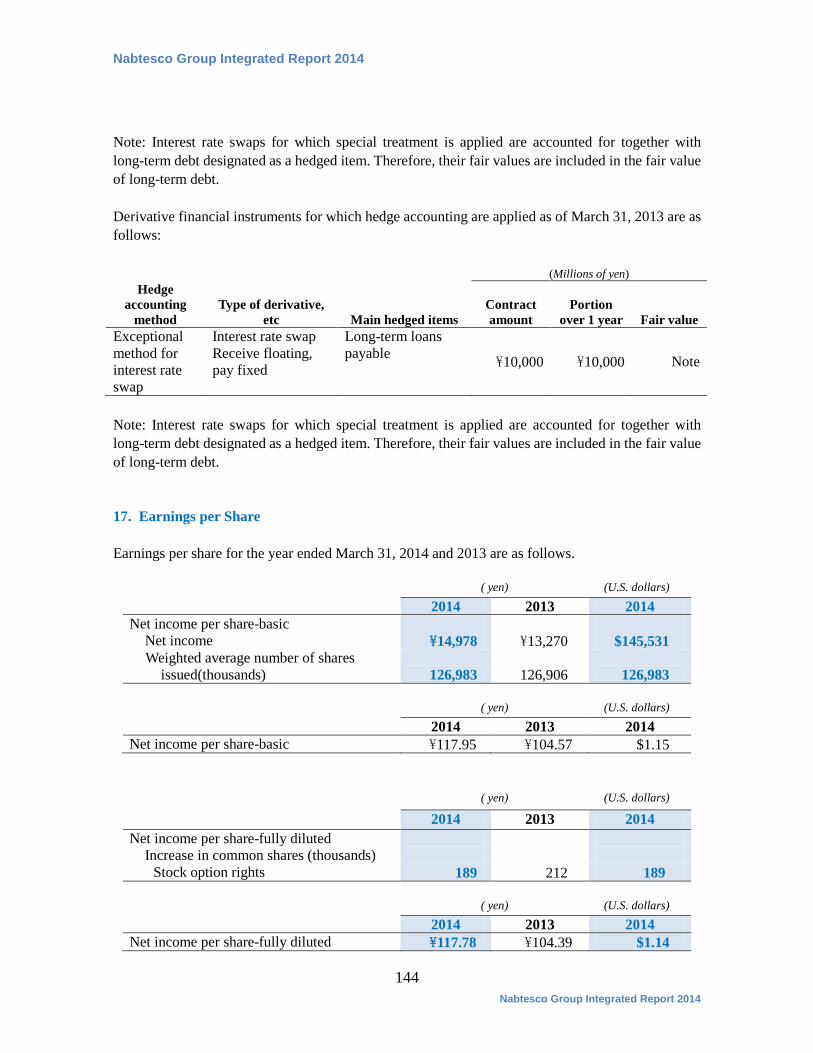
Nabtesco Group Integrated Report 2014
144 Nabtesco Group Integrated Report 2014
Note: Interest rate swaps for which special treatment is applied are accounted for together with long-term debt designated as a hedged item. Therefore, their fair values are included in the fair value of long-term debt. Derivative financial instruments for which hedge accounting are applied as of March 31, 2013 are as follows:
(Millions of yen)
Hedge accounting
method
Type of derivative,
etc
Main hedged items
Contract amount
Portion
over 1 year
Fair value Exceptional method for interest rate swap
Interest rate swap Receive floating, pay fixed
Long-term loans payable
\10,000 \10,000 Note
Note: Interest rate swaps for which special treatment is applied are accounted for together with long-term debt designated as a hedged item. Therefore, their fair values are included in the fair value of long-term debt. 17. Earnings per Share Earnings per share for the year ended March 31, 2014 and 2013 are as follows.
( yen) (U.S. dollars)
2014 2013 2014 Net income per share-basic
Net income \14,978 \13,270 $145,531 Weighted average number of shares
issued(thousands) 126,983 126,906 126,983 ( yen) (U.S. dollars) 2014 2013 2014 Net income per share-basic \117.95 \104.57 $1.15
( yen) (U.S. dollars)
2014 2013 2014 Net income per share-fully diluted
Increase in common shares (thousands) Stock option rights 189 212 189
( yen) (U.S. dollars) 2014 2013 2014 Net income per share-fully diluted \117.78 \104.39 $1.14
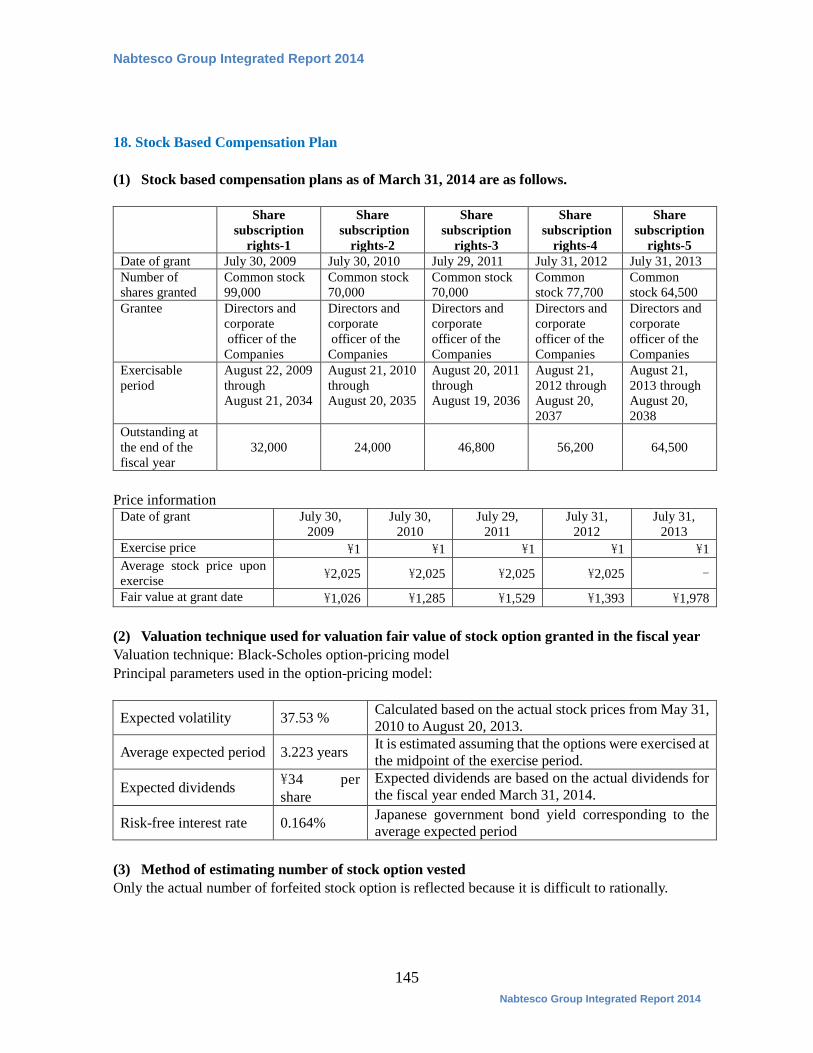
Nabtesco Group Integrated Report 2014
145 Nabtesco Group Integrated Report 2014
18. Stock Based Compensation Plan (1) Stock based compensation plans as of March 31, 2014 are as follows.
Share subscription
rights-1
Share subscription
rights-2
Share subscription
rights-3
Share subscription
rights-4
Share subscription
rights-5 Date of grant July 30, 2009 July 30, 2010 July 29, 2011 July 31, 2012 July 31, 2013 Number of shares granted
Common stock 99,000
Common stock 70,000
Common stock 70,000
Common stock 77,700
Common stock 64,500
Grantee
Directors and corporate officer of the Companies
Directors and corporate officer of the Companies
Directors and corporate officer of the Companies
Directors and corporate officer of the Companies
Directors and corporate officer of the Companies
Exercisable period
August 22, 2009 through August 21, 2034
August 21, 2010 through August 20, 2035
August 20, 2011 through August 19, 2036
August 21, 2012 through August 20, 2037
August 21, 2013 through August 20, 2038
Outstanding at the end of the fiscal year
32,000 24,000 46,800
56,200
64,500
Price information
Date of grant July 30, 2009
July 30, 2010
July 29, 2011
July 31, 2012
July 31, 2013
Exercise price \1 \1 \1 \1 \1 Average stock price upon exercise \2,025 \2,025 \2,025 \2,025 -
Fair value at grant date \1,026 \1,285 \1,529 \1,393 \1,978 (2) Valuation technique used for valuation fair value of stock option granted in the fiscal year Valuation technique: Black-Scholes option-pricing model Principal parameters used in the option-pricing model:
(3) Method of estimating number of stock option vested Only the actual number of forfeited stock option is reflected because it is difficult to rationally.
Expected volatility 37.53 % Calculated based on the actual stock prices from May 31, 2010 to August 20, 2013.
Average expected period 3.223 years It is estimated assuming that the options were exercised at the midpoint of the exercise period.
Expected dividends \34 per share
Expected dividends are based on the actual dividends for the fiscal year ended March 31, 2014.
Risk-free interest rate 0.164% Japanese government bond yield corresponding to the average expected period
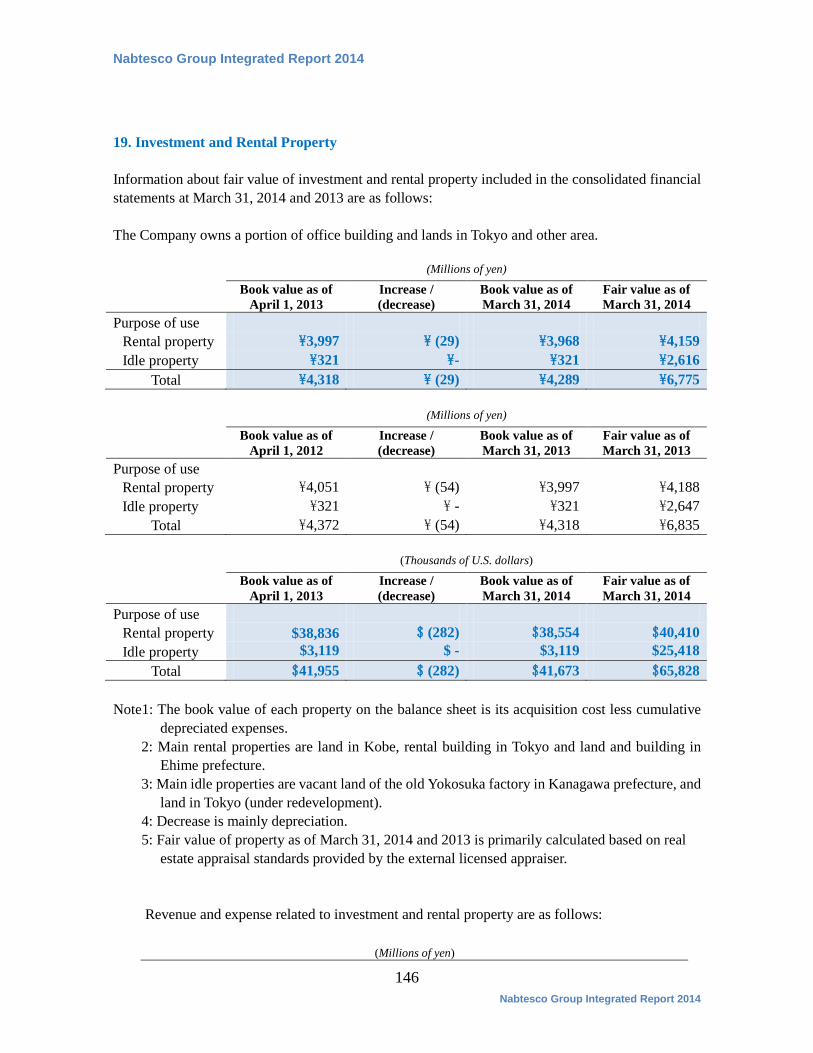
Nabtesco Group Integrated Report 2014
146 Nabtesco Group Integrated Report 2014
19. Investment and Rental Property Information about fair value of investment and rental property included in the consolidated financial statements at March 31, 2014 and 2013 are as follows: The Company owns a portion of office building and lands in Tokyo and other area. (Millions of yen)
Book value as of April 1, 2013
Increase / (decrease)
Book value as of March 31, 2014
Fair value as of March 31, 2014
Purpose of use Rental property \3,997 \ (29) \3,968 \4,159 Idle property \321 \- \321 \2,616
Total \4,318 \ (29) \4,289 \6,775 (Millions of yen)
Book value as of April 1, 2012
Increase / (decrease)
Book value as of March 31, 2013
Fair value as of March 31, 2013
Purpose of use Rental property \4,051 \ (54) \3,997 \4,188 Idle property \321 \ - \321 \2,647
Total \4,372 \ (54) \4,318 \6,835 (Thousands of U.S. dollars)
Book value as of April 1, 2013
Increase / (decrease)
Book value as of March 31, 2014
Fair value as of March 31, 2014
Purpose of use Rental property $38,836 $ (282) $38,554 $40,410 Idle property $3,119 $ - $3,119 $25,418
Total $41,955 $ (282) $41,673 $65,828 Note1: The book value of each property on the balance sheet is its acquisition cost less cumulative
depreciated expenses. 2: Main rental properties are land in Kobe, rental building in Tokyo and land and building in
Ehime prefecture. 3: Main idle properties are vacant land of the old Yokosuka factory in Kanagawa prefecture, and
land in Tokyo (under redevelopment). 4: Decrease is mainly depreciation. 5: Fair value of property as of March 31, 2014 and 2013 is primarily calculated based on real
estate appraisal standards provided by the external licensed appraiser. Revenue and expense related to investment and rental property are as follows:
(Millions of yen)
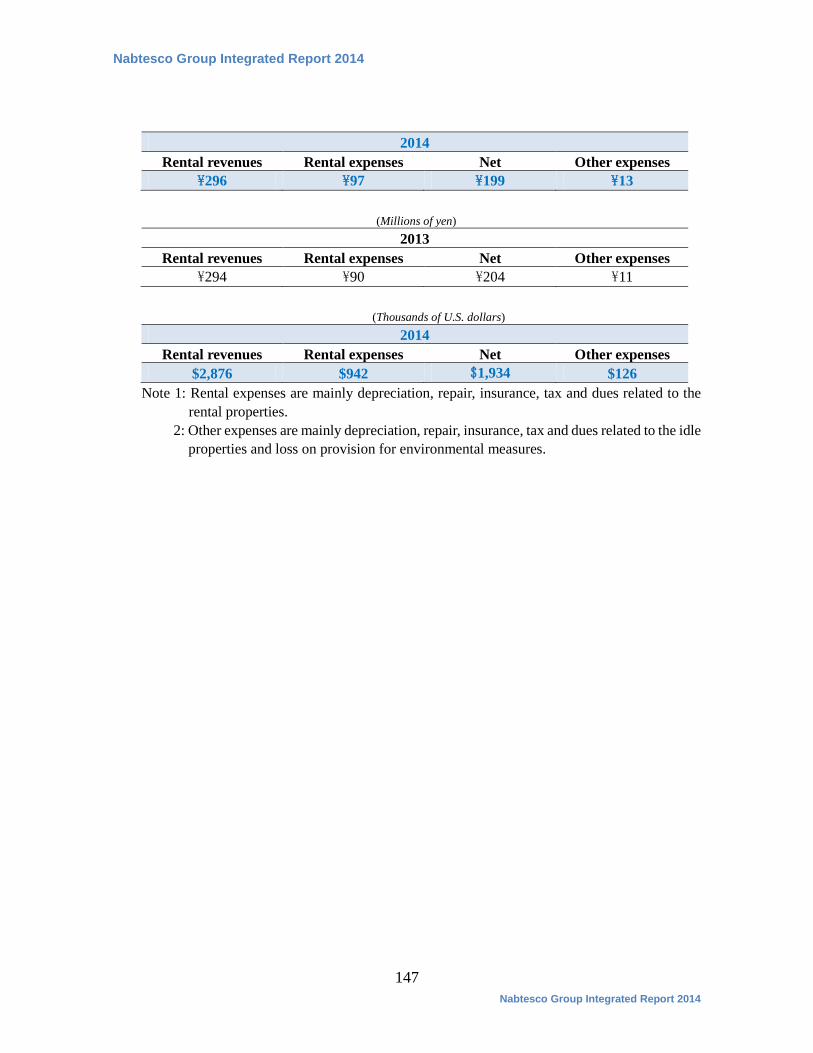
Nabtesco Group Integrated Report 2014
147 Nabtesco Group Integrated Report 2014
2014 Rental revenues Rental expenses Net Other expenses
\296 \97 \199 \13
(Millions of yen) 2013
Rental revenues Rental expenses Net Other expenses \294 \90 \204 \11
(Thousands of U.S. dollars)
2014 Rental revenues Rental expenses Net Other expenses
$2,876 $942 $1,934 $126 Note 1: Rental expenses are mainly depreciation, repair, insurance, tax and dues related to the
rental properties. 2: Other expenses are mainly depreciation, repair, insurance, tax and dues related to the idle
properties and loss on provision for environmental measures.
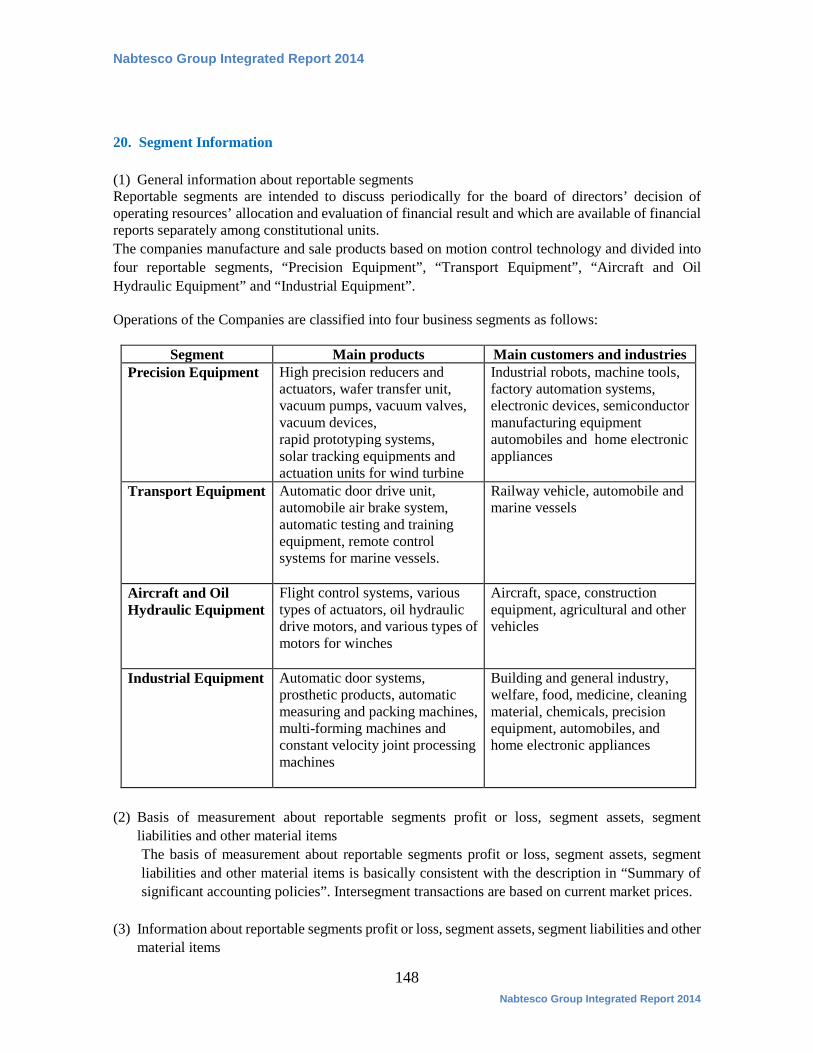
Nabtesco Group Integrated Report 2014
148 Nabtesco Group Integrated Report 2014
20. Segment Information
(1) General information about reportable segments Reportable segments are intended to discuss periodically for the board of directors’ decision of operating resources’ allocation and evaluation of financial result and which are available of financial reports separately among constitutional units. The companies manufacture and sale products based on motion control technology and divided into four reportable segments, “Precision Equipment”, “Transport Equipment”, “Aircraft and Oil Hydraulic Equipment” and “Industrial Equipment”. Operations of the Companies are classified into four business segments as follows:
Segment Main products Main customers and industries Precision Equipment High precision reducers and
actuators, wafer transfer unit, vacuum pumps, vacuum valves, vacuum devices, rapid prototyping systems, solar tracking equipments and actuation units for wind turbine
Industrial robots, machine tools, factory automation systems, electronic devices, semiconductor manufacturing equipment automobiles and home electronic appliances
Transport Equipment
Automatic door drive unit, automobile air brake system, automatic testing and training equipment, remote control systems for marine vessels.
Railway vehicle, automobile and marine vessels
Aircraft and Oil Hydraulic Equipment
Flight control systems, various types of actuators, oil hydraulic drive motors, and various types of motors for winches
Aircraft, space, construction equipment, agricultural and other vehicles
Industrial Equipment Automatic door systems, prosthetic products, automatic measuring and packing machines, multi-forming machines and constant velocity joint processing machines
Building and general industry, welfare, food, medicine, cleaning material, chemicals, precision equipment, automobiles, and home electronic appliances
(2) Basis of measurement about reportable segments profit or loss, segment assets, segment
liabilities and other material items The basis of measurement about reportable segments profit or loss, segment assets, segment liabilities and other material items is basically consistent with the description in “Summary of significant accounting policies”. Intersegment transactions are based on current market prices.
(3) Information about reportable segments profit or loss, segment assets, segment liabilities and other material items
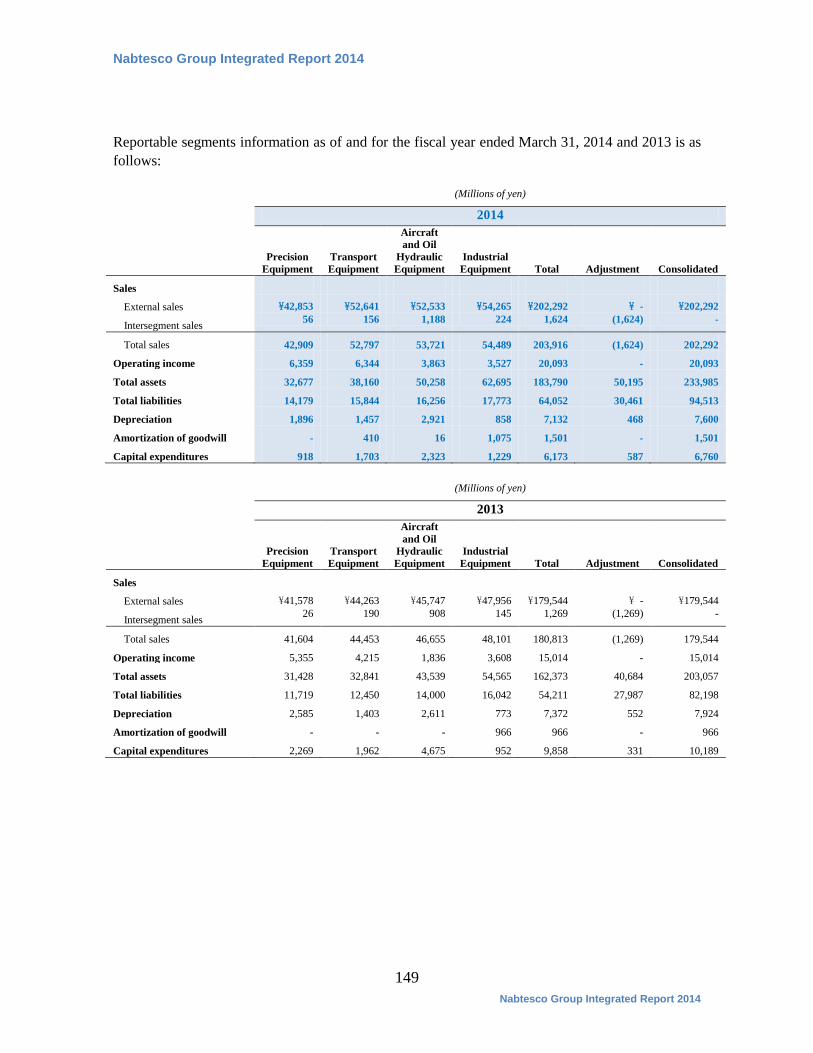
Nabtesco Group Integrated Report 2014
149 Nabtesco Group Integrated Report 2014
Reportable segments information as of and for the fiscal year ended March 31, 2014 and 2013 is as follows: (Millions of yen)
2014
Precision Equipment
Transport Equipment
Aircraft and Oil
Hydraulic Equipment
Industrial Equipment Total Adjustment Consolidated
Sales
External sales \42,853 \52,641 \52,533 \54,265 \202,292 \ - \202,292
Intersegment sales 56 156 1,188 224 1,624 (1,624) -
Total sales 42,909 52,797 53,721 54,489 203,916 (1,624) 202,292
Operating income 6,359 6,344 3,863 3,527 20,093 - 20,093
Total assets 32,677 38,160 50,258 62,695 183,790 50,195 233,985
Total liabilities 14,179 15,844 16,256 17,773 64,052 30,461 94,513
Depreciation 1,896 1,457 2,921 858 7,132 468 7,600
Amortization of goodwill - 410 16 1,075 1,501 - 1,501
Capital expenditures 918 1,703 2,323 1,229 6,173 587 6,760
(Millions of yen)
2013
Precision Equipment
Transport Equipment
Aircraft and Oil
Hydraulic Equipment
Industrial Equipment Total Adjustment Consolidated
Sales
External sales \41,578 \44,263 \45,747 \47,956 \179,544 \ - \179,544
Intersegment sales 26 190 908 145 1,269 (1,269) -
Total sales 41,604 44,453 46,655 48,101 180,813 (1,269) 179,544
Operating income 5,355 4,215 1,836 3,608 15,014 - 15,014
Total assets 31,428 32,841 43,539 54,565 162,373 40,684 203,057
Total liabilities 11,719 12,450 14,000 16,042 54,211 27,987 82,198
Depreciation 2,585 1,403 2,611 773 7,372 552 7,924
Amortization of goodwill - - - 966 966 - 966
Capital expenditures 2,269 1,962 4,675 952 9,858 331 10,189
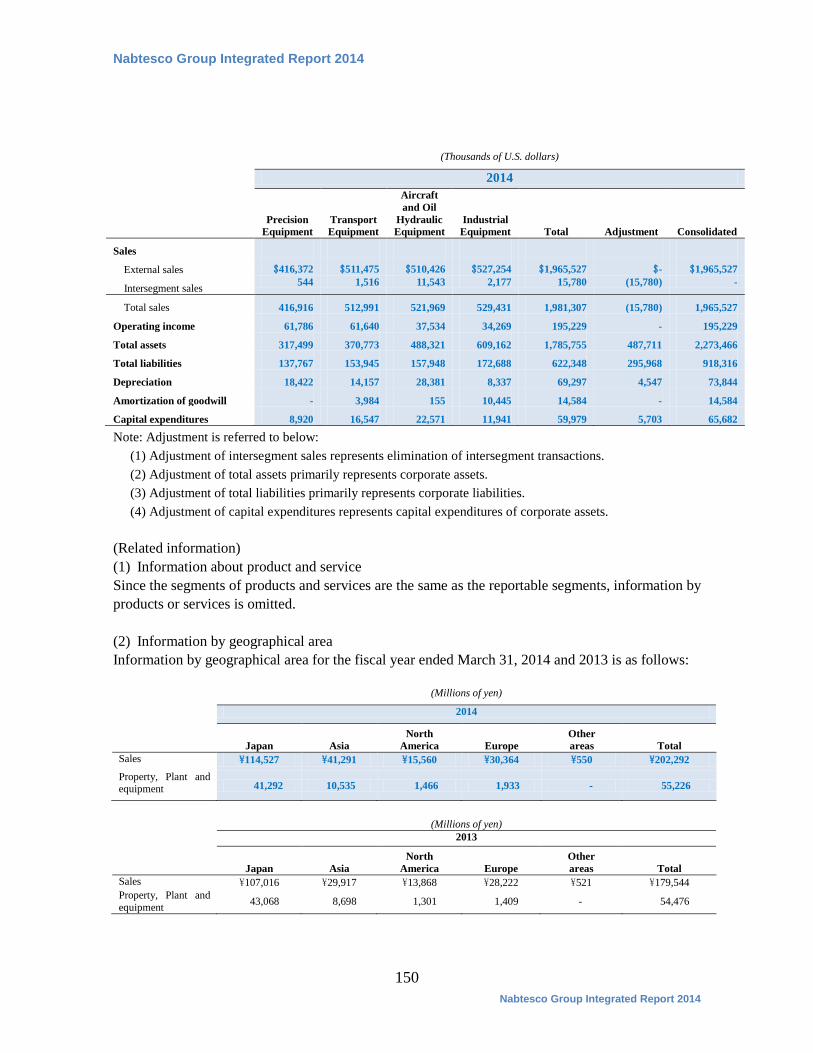
Nabtesco Group Integrated Report 2014
150 Nabtesco Group Integrated Report 2014
(Thousands of U.S. dollars)
2014
Precision Equipment
Transport Equipment
Aircraft and Oil
Hydraulic Equipment
Industrial Equipment Total Adjustment Consolidated
Sales
External sales $416,372 $511,475 $510,426 $527,254 $1,965,527 $- $1,965,527
Intersegment sales 544 1,516 11,543 2,177 15,780 (15,780) -
Total sales 416,916 512,991 521,969 529,431 1,981,307 (15,780) 1,965,527
Operating income 61,786 61,640 37,534 34,269 195,229 - 195,229
Total assets 317,499 370,773 488,321 609,162 1,785,755 487,711 2,273,466
Total liabilities 137,767 153,945 157,948 172,688 622,348 295,968 918,316
Depreciation 18,422 14,157 28,381 8,337 69,297 4,547 73,844
Amortization of goodwill - 3,984 155 10,445 14,584 - 14,584
Capital expenditures 8,920 16,547 22,571 11,941 59,979 5,703 65,682
Note: Adjustment is referred to below: (1) Adjustment of intersegment sales represents elimination of intersegment transactions. (2) Adjustment of total assets primarily represents corporate assets. (3) Adjustment of total liabilities primarily represents corporate liabilities. (4) Adjustment of capital expenditures represents capital expenditures of corporate assets.
(Related information) (1) Information about product and service Since the segments of products and services are the same as the reportable segments, information by products or services is omitted. (2) Information by geographical area Information by geographical area for the fiscal year ended March 31, 2014 and 2013 is as follows:
(Millions of yen)
2014
Japan Asia
North America Europe
Other areas Total
Sales \114,527 \41,291 \15,560 \30,364 \550 \202,292 Property, Plant and equipment 41,292 10,535 1,466 1,933 - 55,226
(Millions of yen) 2013
Japan Asia North
America Europe Other areas Total
Sales \107,016 \29,917 \13,868 \28,222 \521 \179,544 Property, Plant and equipment 43,068 8,698 1,301 1,409 - 54,476
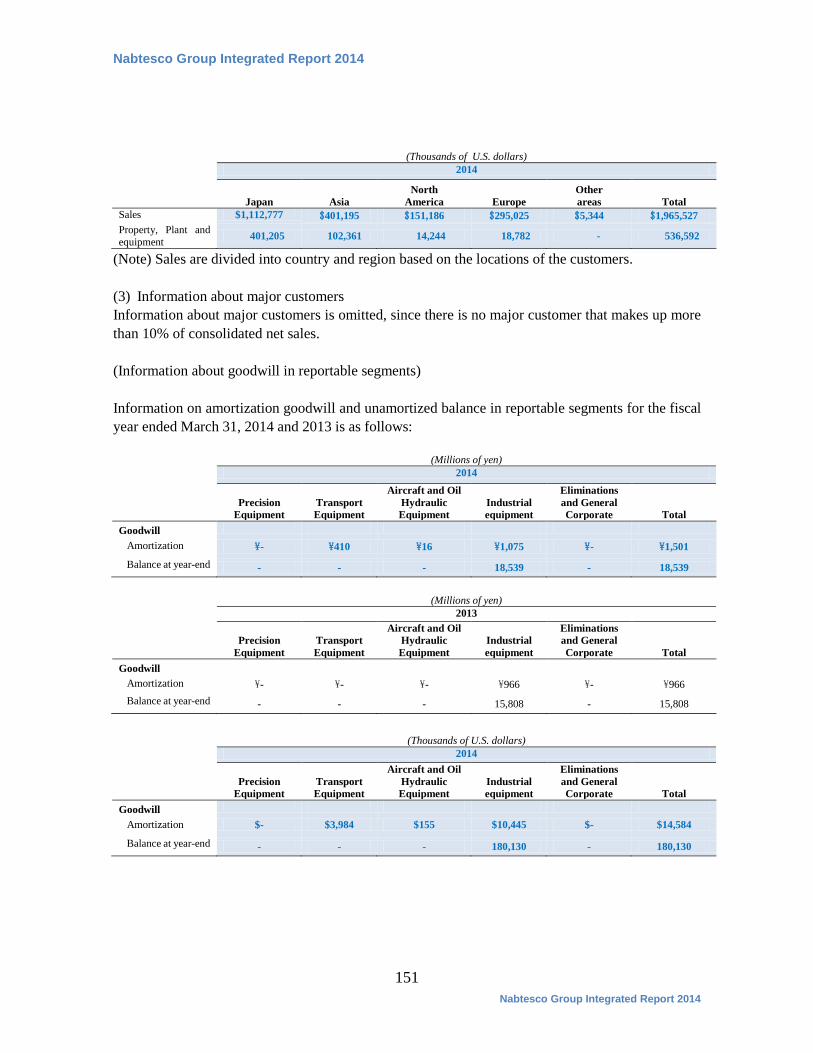
Nabtesco Group Integrated Report 2014
151 Nabtesco Group Integrated Report 2014
(Thousands of U.S. dollars) 2014
Japan Asia North
America Europe Other areas Total
Sales $1,112,777 $401,195 $151,186 $295,025 $5,344 $1,965,527 Property, Plant and equipment 401,205 102,361 14,244 18,782 - 536,592
(Note) Sales are divided into country and region based on the locations of the customers. (3) Information about major customers Information about major customers is omitted, since there is no major customer that makes up more than 10% of consolidated net sales. (Information about goodwill in reportable segments) Information on amortization goodwill and unamortized balance in reportable segments for the fiscal year ended March 31, 2014 and 2013 is as follows:
(Millions of yen) 2014
Precision Equipment
Transport Equipment
Aircraft and Oil Hydraulic Equipment
Industrial equipment
Eliminations and General Corporate Total
Goodwill
Amortization \- \410 \16 \1,075 \- \1,501
Balance at year-end - - - 18,539 - 18,539
(Millions of yen) 2013
Precision Equipment
Transport Equipment
Aircraft and Oil Hydraulic Equipment
Industrial equipment
Eliminations and General Corporate Total
Goodwill
Amortization \- \- \- \966 \- \966 Balance at year-end - - - 15,808 - 15,808
(Thousands of U.S. dollars) 2014
Precision Equipment
Transport Equipment
Aircraft and Oil Hydraulic Equipment
Industrial equipment
Eliminations and General Corporate Total
Goodwill
Amortization $- $3,984 $155 $10,445 $- $14,584
Balance at year-end - - - 180,130 - 180,130
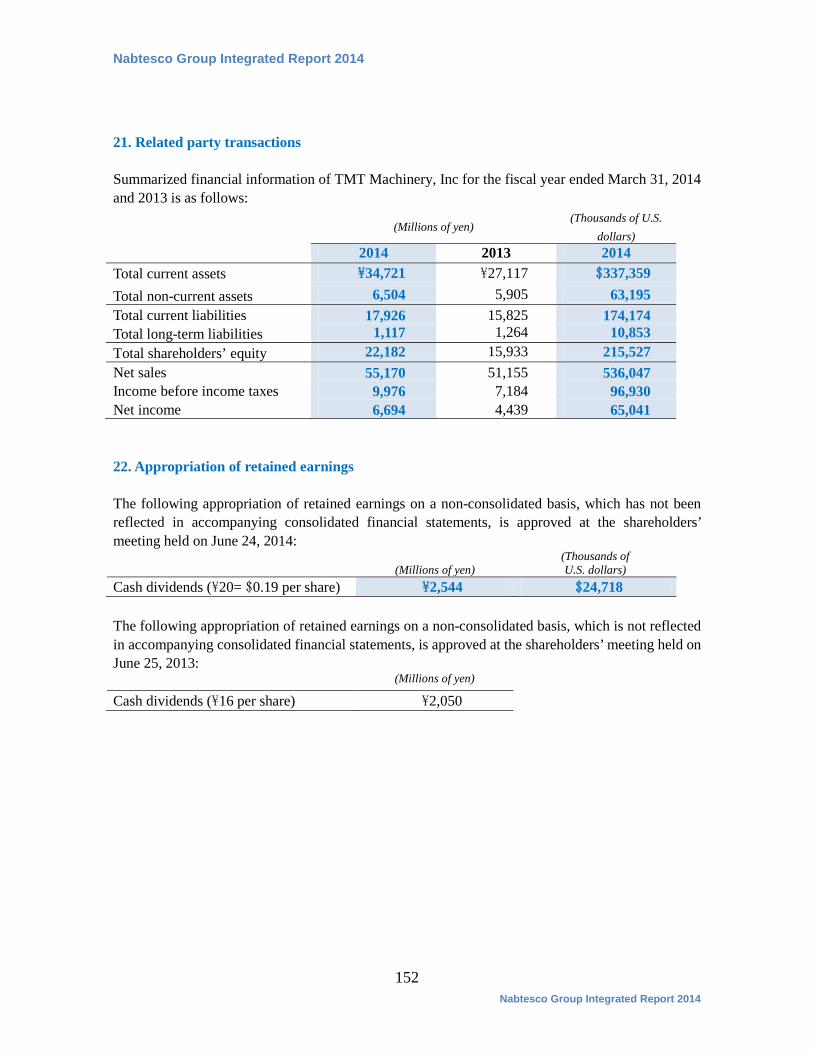
Nabtesco Group Integrated Report 2014
152 Nabtesco Group Integrated Report 2014
21. Related party transactions
Summarized financial information of TMT Machinery, Inc for the fiscal year ended March 31, 2014 and 2013 is as follows:
(Millions of yen) (Thousands of U.S.
dollars) 2014 2013 2014 Total current assets \34,721 \27,117 $337,359 Total non-current assets 6,504 5,905 63,195 Total current liabilities 17,926 15,825 174,174 Total long-term liabilities 1,117 1,264 10,853 Total shareholders’ equity 22,182 15,933 215,527 Net sales 55,170 51,155 536,047 Income before income taxes 9,976 7,184 96,930 Net income 6,694 4,439 65,041
22. Appropriation of retained earnings The following appropriation of retained earnings on a non-consolidated basis, which has not been reflected in accompanying consolidated financial statements, is approved at the shareholders’ meeting held on June 24, 2014:
(Millions of yen) (Thousands of U.S. dollars)
Cash dividends (\20= $0.19 per share) \2,544 $24,718 The following appropriation of retained earnings on a non-consolidated basis, which is not reflected in accompanying consolidated financial statements, is approved at the shareholders’ meeting held on June 25, 2013: (Millions of yen)
Cash dividends (\16 per share) \2,050
