consolidated financial statements - colbún
TRANSCRIPT

a
Consolidated Financial Statements for the periods ended December 31, 2021 and 2020
COLBÚN S.A. AND SUBSIDIARIES Thousand of U.S. dollars
This report contains the following:
- Independent Auditor’s Report - Consolidated Financial Statements - Notes to the Consolidated Financial Statement

EY ChileAvda. PresidenteRiesco 5435, piso 4,Las Condes, Santiago
Tel: +56 (2) 2676 1000www.eychile.cl
Independent Auditor´s Report(Translation of a report originally issued in Spanish)
To Shareholders and DirectorsColbún S.A.
We have audited the accompanying consolidated financial statements of Colbún S.A. andsubsidiaries, which comprise the consolidated statements of financial position as of December 31,2021 and 2020, and the related consolidated statements of comprehensive income, shareholders'equity and cash flows for the years then ended and their corresponding notes to the consolidatedfinancial statements.
Management’s Responsibility for the Consolidated Financial Statements
Management is responsible for the preparation and fair presentation of these consolidatedfinancial statements in accordance with International Financial Reporting Standards (IFRS).This includes the design, implementation and maintenance of internal control that is adequateto provide a reasonable basis for the preparation and fair presentation of consolidatedfinancial statements that are free of material misstatement, whether due to error or fraud.
Auditor’s Responsibility
Our responsibility is to express an opinion on the Company’s consolidated financial statementsbased on our audits. We conducted our audits in accordance with Generally Accepted AuditingStandards in Chile. Such standards require that we plan and carry out our work in order to achieve areasonable degree of assurance that the consolidated financial statements are free from materialmisstatement.
An audit involves performing procedures to obtain audit evidence about the amounts anddisclosures in the consolidated financial statements. The procedures selected depend on theauditor's judgment, including the assessment of the risks of material misstatement of the financialstatements, whether due to fraud or error. In order to do these risk assessments, the auditorconsiders the relevant internal control for the preparation and fair presentation of the entity'sconsolidated financial statements to design audit procedures that are appropriate in thecircumstances, but without the purpose of expressing an opinion on the effectiveness of the entity'sinternal control. Consequently, we express no such opinion. An audit also includes evaluating theappropriateness of the accounting policies used and the reasonableness of the significantaccounting estimates made by Management, as well as an evaluating the overall presentation of theconsolidated financial statements.

We believe that the audit evidence we have obtained is sufficient and appropriate to provide us witha basis for our audit opinion.
Opinion
In our opinion, the consolidated financial statements present fairly, in all material respects, thefinancial position of Colbún S.A. and subsidiaries as of December 31, 2021 and 2020, and theresults of its operations and its cash flows for the years then ended in accordance with InternationalFinancial Reporting Standards.
Santiago, ChileJanuary 25, 2022

1
Colbún S.A. and Subsidiaries Consolidated Classified Statements of Financial Position as of December 31, 2021 and December 31, 2020 (In thousands of U.S. dollars) (Translation of the report originally issued in Spanish – See note 2)
The accompanying notes are integral part of these consolidated financial statements
December 31, December 31,
2021 2020
N° ThUS$ ThUS$
Current assets
Cash and cash equivalents 9 392,418 254,107
Other financial assets, current 10 931,663 714,655
Other non-financial assets, current 22 57,478 37,900
Trade and other receivables, current 11 307,190 201,171
Receivables due from related parties, current 13.b 48 75
Inventories, current 14 70,598 33,646
Current tax assets 21.a 7,041 17,630
Total current assets 1,766,436 1,259,184
Non-current assets
Other financial assets, non-current 10 99,931 10,283
Other non-financial assets, non-current 22 43,222 47,668
Trade and other receivables, non-current 11 3,356 109,282
Equity-accounted investees 17.a 14,195 26,849
Intangible assets other than goodwill 18 68,152 122,110
Goodwill 7 5,573 5,573
Property, plant and equipment 19 4,421,566 4,848,004
Right-of-use assets 20 113,387 123,491
Deferred tax assets 23.b 66,690 81,423
4,836,072 5,374,683
6,602,508 6,633,867
Total non-current assets
ASSETS
TOTAL ASSETS
Note

2
Colbún S.A. and Subsidiaries Consolidated Classified Statements of Financial Position as of December 31, 2021 and December 31, 2020 (In thousands of U.S. dollars) (Translation of the report originally issued in Spanish – See note 2)
The accompanying notes are integral part of these consolidated financial statements
December 31, 31 de Diciembre,
2021 2020
N° ThUS$ ThUS$
Current liabilities
Other financial liabilities, current 24.a 279,118 103,108
Short-term lease liabilities 25 9,746 9,308
Trade and other payables 26 205,706 117,728
Payables due to related parties, current 13.b 12,574 161
Other current provisions 27 43,344 29,370
Current tax liabilities 21.b 89,232 7
Current provisions for employee benefits 28 23,426 24,154
Other non-financial liabilities, current 29 15,858 22,696
Total current liabilities 679,004 306,532
Non-current liabilities
Other financial liabilities, non-current 24.a 1,944,259 1,559,266
Long-term lease liabilities 25 116,572 125,449
Trade and other payables, non-current 26 9,475 12,952
Other provisions, non-current 27 56,858 46,785
Deferred tax liabilities 23.b 922,647 933,742
Provisions for employee benefits, non-current 28 25,941 42,998
Other non-financial liabilities, non-current 29 6,326 20,775
Total non-current liabilities 3,082,078 2,741,967
Total liabilities 3,761,082 3,048,499
Equity
Share capital 30.a 1,282,793 1,282,793
Retained earnings 30.f 833,180 1,414,284
Share premium 30.c 52,595 52,595
Other reserves 30.e 552,059 709,779
2,720,627 3,459,451
Non-controlling interests - 120,799 125,917
Total equity 2,841,426 3,585,368
6,602,508 6,633,867
LIABILITIES AND EQUITYNote
TOTAL LIABILITIES AND EQUITY
Equity attributable to the shareholders of the Parent

3
Colbún S.A. and Subsidiaries Consolidated Statements of Income for the Period and Other Comprehensive Income for the periods ended December 31, 2021 and 2020 (In thousands of U.S. dollars) (Translation of the report originally issued in Spanish – See note 2)
The accompanying notes are integral part of these consolidated financial statements
2021 2020
N° ThUS$ ThUS$
Revenue 8 y 31 1,439,744 1,348,868
Raw materials and consumables 32 (781,973) (575,796)
Employee benefit expenses 33 (79,672) (65,357)
Depreciation and amortization expenses 34 (213,163) (246,615)
Other expenses, by nature - (57,903) (25,203)
Other gains (losses) 38 606,647 (240,136)
Income from operations - 913,680 195,761
Finance income 35 4,968 11,242
Finance costs 35 (86,347) (90,459)
Share of profit of equity-accounted investees and joint ventures 17 and 37 6,697 9,950
Foreign currency translation differences 36 (13,826) 5,725
Profit before income taxes - 825,172 132,219
Tax expense (benefit) from continuing operations 23.a (284,992) (42,751)
540,180 89,468
PROFIT (LOSS) 540,180 89,468
Net profit attributable to
Shareholders of the Parent 30.h 545,298 162,893
Non-controlling interests - (5,118) (73,425)
PROFIT (LOSS) 540,180 89,468
Earnings per share
Basic earnings per share - Continuing operations US$/share 30.h 0.03110 0.00929
Basic earnings per share 0.03110 0.00929
Diluted earnings per share - Continuing operations US$/ share 30.h 0.03110 0.00929
Diluted earnings per share 0.03110 0.00929
Profit (loss) from continuing operations
STATEMENTS OF COMPREHENSIVE INCOME BY NATURENote
January - December

4
Colbún S.A. and Subsidiaries Consolidated Statements of Income for the Period and Other Comprehensive Income (continued) for the periods ended December 31, 2021 and 2020 (In thousands of U.S. dollars) (Translation of the report originally issued in Spanish – See note 2)
The accompanying notes are integral part of these consolidated financial statements
2021 2020
N° ThUS$ ThUS$
Net profit 540,180 89,468
Components of other comprehensive income that will not be reclassified to
profit or loss for the period, before taxes
Profit (loss) for new measurements of defined benefit plans - 13,808 (3,963)
Total other comprehensive (loss) income that will not be reclassified to profit or
loss for the period, before taxes - 13,808 (3,963)
Components of other comprehensive income (loss) that will be reclassified to
profit or loss for the period, before taxes
Gain (loss) for foreign currency translation differences 17.a 2,941 516
Gain (loss) from cash flow hedges - (32,407) (5,993)
Share of comprehensive income (loss) on associates and joint ventures using the equity - 246 (18)
(29,220) (5,495)
(15,412) (9,458)
Income tax related to components of other comprehensive income that will not
be reclassified to profit or loss for the period
Income tax related to new measurements of defined benefit plans 23.c (3,728) 1,070
Income tax related to components of other comprehensive income that will be
reclassified to profit or loss for the period
Income tax related to share of other comprehensive income (loss) on associates and
joint ventures using the equity method 23.c (66) 5
Income tax related to cash flow hedges 23.c 8,750 1,618
4,956 2,693
(10,456) (6,765)
529,724 82,703
Comprehensive income (loss) attributable to:
534,842 156,128
(5,118) (73,425)
TOTAL COMPREHENSIVE INCOME 529,724 82,703
January - December
Total other comprehensive income (loss)
Total comprehensive income (loss)
NoteSTATEMENTS OF OTHER COMPREHENSIVE INCOME
Shareholders of the Parent
Non-controlling interests
Other components of other comprehensive income (loss), before taxes
Income tax related to components of other comprehensive income (loss)
Total other comprehensive income (loss) that will be reclassified to profit or loss for
the period, before taxes

5
Colbún S.A. and Subsidiaries Consolidated Statements of Cash Flows - Direct Method for the periods ended December 31, 2021 and 2020 (In thousands of U.S. dollars) (Translation of the report originally issued in Spanish – See note 2)
The accompanying notes are integral part of these consolidated financial statements
December 31, December 31,
2021 2020
N° ThUS$ ThUS$
Cash flows from (used in) operating activities
Cash receipts from operating activities
Cash receipts from sale of goods and rendering of services - 1,708,846 1,609,272
Cash receipts from premiums and services, annuities and other benefits of subscribed policies - - 21,792
Other cash receipts from operating activities - 1,689 4,720
Cash payments for operating activities
Cash payments to suppliers for goods and services - (1,098,903) (778,145)
Cash payments to and on behalf of employees - (72,102) (59,438)
Cash payments for premiums and services, annuities and other benefits of subscribed policies - (16,747) (21,166)
Other cash payments for operating activities - (89,117) (164,934)
Cash generated from operating activities - 433,666 612,101
Dividends received - 15,697 9,146
Interest received - 3,441 10,201
Income taxes refunded (payments) - (117,423) (99,921)
Other cash receipts (payments) - (963) (5,903)
334,418 525,624
Cash flows from (used in) investing activities
Other payments to acquire interests in joint ventures - - (5,336)
Proceeds from the sale of other long-term assets, classified as investing activities - 1,186,362 -
Acquisition of property, plant and equipment - (253,738) (112,556)
Other cash receipts (payments) - (317,111) (242,702)
615,513 (360,594)
Proceeds from borrowings - 600,000 546,913
Amounts proceeds from long-term loans - 600,000 500,000
Amounts proceeds from short-term loans - - 46,913
Payment of lease liabilities - (10,425) (9,946)
Payment of loans - (68,957) (416,562)
Dividends paid - (1,244,739) (241,319)
Interest paid - (76,476) (81,266)
Other cash (payments) receipts - 405 (44,181)
Net cash used in financing activities 9.c (800,192) (246,361)
138,311 (72,779)
254,107 326,886
Cash and cash equivalents as of December 31 9 392,418 254,107
(11,428)
149,739 (81,331)
8,552Effects of movements in exchange rates on cash and cash equivalents
Net increase (decrease) in cash and cash equivalents
Cash and cash equivalents as of January 1
Note
Cash flows from (used in) financing activities
Effects of movements in exchange rates on cash and cash equivalents
Net cash flows from (used in) investing activities
Net increase (decrease) in cash and cash equivalents before the effect of movements in exchange rates on
cash held
STATEMENTS OF CASH FLOWS - DIRECT METHOD
Net cash flows from operating activities

6
Colbún S.A. and Subsidiaries Statements of Changes in Equity for the periods ended December 31, 2021 and 2020 (In thousands of U.S. dollars) (Translation of the report originally issued in Spanish – See note 2)
The accompanying notes are integral part of these consolidated financial statements
ThUS$ ThUS$ ThUS$ ThUS$ ThUS$ ThUS$ ThUS$ ThUS$ ThUS$ ThUS$ ThUS$
Balance as of January 1, 2021 1,282,793 52,595 (256,115) 8,953 - 956,941 709,779 1,414,284 3,459,451 125,917 3,585,368
Increase (decrease) of equity due an error - - - - - - - - - - -
Balance as of January 1, 2021, adjusted 1,282,793 52,595 (256,115) 8,953 - 956,941 709,779 1,414,284 3,459,451 125,917 3,585,368
Changes in equity
Comprehensive income
Profit (loss) for the period 545,298 545,298 (5,118) 540,180
Other comprehensive income 2,941 (23,477) 10,080 - (10,456) - (10,456) - (10,456)
Dividends (1,273,666) (1,273,666) - (1,273,666)
Increase (decrease) from other changes - - - - (10,080) (137,184) (147,264) 147,264 - - -
Total changes in equity - - 2,941 (23,477) - (137,184) (157,720) (581,104) (738,824) (5,118) (743,942)
Equity as of December 31, 2021 30 1,282,793 52,595 (253,174) (14,524) - 819,757 552,059 833,180 2,720,627 120,799 2,841,426
ThUS$ ThUS$ ThUS$ ThUS$ ThUS$ ThUS$ ThUS$ ThUS$ ThUS$ ThUS$ ThUS$
Balance as of January 1, 2020 1,282,793 52,595 (256,631) 13,341 - 985,863 742,573 1,458,332 3,536,293 199,342 3,735,635
Increase (decrease) of equity due an error - - - - - - - - - - -
Balance as of January 1, 2020, adjusted 1,282,793 52,595 (256,631) 13,341 - 985,863 742,573 1,458,332 3,536,293 199,342 3,735,635
Changes in equity
Comprehensive income
Profit (loss) for the period 162,893 162,893 (73,425) 89,468
Other comprehensive income 516 (4,388) (2,893) - (6,765) (6,765) - (6,765)
Dividends (232,970) (232,970) - (232,970)
Increase (decrease) from other changes - - - - 2,893 (28,922) (26,029) 26,029 - - -
Total changes in equity - - 516 (4,388) - (28,922) (32,794) (44,048) (76,842) (73,425) (150,267)
Equity as of December 31, 2020 30 1,282,793 52,595 (256,115) 8,953 - 956,941 709,779 1,414,284 3,459,451 125,917 3,585,368
Equity attributable to shareholders of the Parent
Changes in other reserves
Statement of Changes in Equity Note
Actuarial profit
or loss reserve
of defined
benefit plans
Share capital Share premium
Equity
attributable to
shareholders of
the Parent
Hedging reserve Other reserves
Retained
earnings
(accumulated
deficit)
Non-controlling
interests Equity
Other
miscellaneous
reserves
Translation
difference
reserve
Share capital
Share premium
Translation
difference
reserve
Changes in other reserves
Equity attributable to shareholders of the Parent
EquityStatement of Changes in Equity Note
Actuarial profit
or loss reserve
of defined
benefit plans
Non-controlling
interests Hedging reserve
Other
miscellaneous
reserves
Other reserves
Retained
earnings
(accumulated
deficit)
Equity
attributable to
shareholders of
the Parent

7
COLBÚN S.A. AND SUBSIDIARIES NOTES TO THE CONSOLIDATED FINANCIAL STATEMENTS
Contents page
1. General information 9
2. Business description 10
3. Significant Accounting policies 13
4. Risk management 29
5. Critical Accounting policies 37
6. Non-current assets clasified as held for sale 39
7. Goodwill 40
8. Segment reporting 40
9. Cash and cash equivalents 45
10. Other financial assets 46
11. Trade and other receivables 46
12. Financial Instruments 48
13. Related parties disclosures 50
14. Inventories 55
15. Derivative instruments 55
16. Investment in subsidiaries 57
17. Equity-accounted investees 58
18. Intangible assets other than goodwill 61
19. Property, plant and equipment 63
20. Right-of-use assets 69
21. Current taxes 71
22. Other non-financial assets 71
23. Income taxes 72
24. Other financial liabilities 76

8
25. Lease Liabilities 82
26. Trade and other payables 85
27. Other provisions 86
28. Provisions for employee benefits 87
29. Other non-financial liabilities 89
30. Disclosures on equity 89
31. Revenue 94
32. Raw materials and consumable 94
33. Employee benefits expenses 95
34. Depreciation and amortization expenses 95
35. Total Financial income and financial cost 95
36. Foreign currency translation and income (expense) from inflation-adjusted units 96
37. Income (expense) from investments accounted for using the equity method 96
38. Other gains (losses) 97
39. Guarantees with third parties and contingent assets and liabilities 98
40. Commitments 103
41. Environment 103
42. Events occurred after the date of the financial position 108
43. Foreign currency 109
44. Headcount (unaudited) 110
45. Exhibit 1 Additional information required for XBRL taxonomy 110
9
COLBÚN S.A. AND SUBSIDIARIES NOTES TO THE CONSOLIDATED FINANCIAL STATEMENTS
(In thousands of U.S. dollars) (Translation of the report originally issued in Spanish – See note 2)
1. General information Colbún S.A. was incorporated via public deed on April 30, 1986, witnessed by the Public Notary Mr. Mario Baros G. and registered at sheet 86 with the Trade Register of the Real Estate Registry of Talca on May 30, 1986. The Company’s Tax Identification Number is 96.505.760-9. The Company is registered as a publicly held shareholders' corporation in the Securities Registry under number 0295 on September 1, 1986, and subject to the inspection by the Financial Market Commission. The Company's shares are traded on the Santiago Stock Exchange and Santiago Electronic Stock Exchange. As of December 31, 2021, Colbún is a power generation company and the Parent of the Group (hereinafter, the Company, the Entity or Colbún), which is composed of ten entities: Colbún S.A. and nine Subsidiaries. The Company's registered address is located at Avenida Apoquindo 4775, 11th floor, Las Condes, Santiago. The Company’s line of business is the generation, transportation and distribution of energy, as explained in Note 2. The control of the Company is performed in accordance with a control and joint venture agreement entered into by Forestal O'Higgins S.A. and other companies. It is hereby expressly established that the aforementioned joined control and operation agreement considers limitations to the free disposal of shares. The Parent is controlled by the members of the Larraín Matte, Matte Capdevila and Matte Izquierdo families, in the form and proportional interests indicated below.
• Patricia Matte Larraín, Taxpayer ID 4.333.299-6 (6,49%) and his children María Patricia Larraín Matte, Taxpayer ID 9.000.338-0 (2,56%); María Magdalena Larraín Matte, Taxpayer ID 6.376.977-0 (2,56%); Jorge Bernardo Larraín Matte, Taxpayer ID 7.025.583-9 (2,56%), and Jorge Gabriel Larraín Matte, Taxpayer ID 10.031.620-K (2,56%).
• Eliodoro Matte Larraín, Taxpayer ID 4.336.502-2 (7,22%) and his children Eliodoro Matte Capdevila, Taxpayer ID 13.921.597-4 (3,26%); Jorge Matte Capdevila, Taxpayer ID 14.169.037-K (3,26%), and María del Pilar Matte Capdevila, Taxpayer ID 15.959.356-8 (3,26%).
• Bernardo Matte Larraín, Taxpayer ID 6.598.728-7 (8,05%) and his children Bernardo Matte Izquierdo, Taxpayer ID 15.637.711-2 (3,35%); Sofía Matte Izquierdo, Taxpayer ID 16.095.796-4 (3,35%), and Francisco Matte Izquierdo, Taxpayer ID 16.612.252-K (3,35%).
Natural persons indicated above are part of the same corporate group due to family relationship.

10
As of December 31, 2021, in accordance with Title XV of Law No. 18,045, shareholders representing 49.96% of the voting right shares are detailed as follows:
2. Business description
Corporate purpose of the Company
The Company’s line of business is the production, transportation, distribution, and supply of energy and capacity, for which it may acquire and exploit concessions and grants or use rights obtained. Likewise, it is empowered to transport, distribute, supply and commercialize natural gas for sale to industrial or generating processes. It can provide advisories in the field of engineering both domestically and abroad. For the convenience of the reader, the financial statements and their accompanying notes have been translated from Spanish to English.
Description of business in Chile
Main assets
The power generation matrix is composed of hydroelectric power plants (reservoir and run-of-the-river) and coal-fired, diesel and gas power plants (combined and conventional cycles), and renewable energies from variable sources, which in total provide an installed capacity of 3,236 MW to the National Power System ("SEN" for its Spanish acronym). Hydroelectric power plants have an installed capacity of 1,626 MW distributed among 17 plants: Colbún, Machicura, San Ignacio, Chiburgo, San Clemente and La Mina, located in the Maule Region; Rucúe, Quilleco and Angostura, located in the Biobío Region; Carena, in the Metropolitan Region; Los Quilos, Blanco, Juncal, Juncalito, Chacabuquito and Hornitos, in the Valparaíso Region; and Canutillar, in Los Lagos Region. Colbún, Machicura, Canutillar and Angostura power plants have their own reservoirs, whereas the remaining hydroelectric power plants are run-of-the-river. Thermal power plants have an installed capacity of 1,601 MW and are distributed in the Nehuenco located in the Valparaíso Region; Candelaria power plant in the O'Higgins Region; and Los Pinos and Santa María power plants, located in the Biobío Region. Ovejería photovoltaic park (9 MW) located in the district of Tiltil, Metropolitan Region.
Minera Valparaíso S.A. 6,166,879,733 35.17
Forestal Cominco S.A. 2,454,688,263 14.00
Forestal Bureo S.A. 49,078,961 0.28
Forestal Constructora y Comercial del Pacífico Sur S.A. 34,126,083 0.19
Forestal Cañada S.A. 22,308,320 0.13
Inversiones Orinoco S.A. 17,846,000 0.10
Inversiones Coillanca Ltda. 16,473,762 0.09
Inmobiliaria Bureo S.A. 38,224 0.00
Total ownership interest 8,761,439,346 49.96
Controlling Group No of shares Ownership %

11
Business policy The Company's commercial policy is to achieve a proper balance between commitments to sell power and its own efficient generation capacity with the objective of increasing and stabilizing operation margins, with acceptable levels of risk in the events of droughts. In addition, this requires an appropriate combination of thermal and hydro power generation. As a result of this policy, the Company intends to maintain sales or purchases in the spot market from reaching significant volumes, since prices in this market experience significant variations, the hydrologic condition being the most relevant variable. Main customers Customer's portfolio is composed of regulated and unregulated customers:
The regulated customers supplied during 2021 are: CGE Distribución S.A. and Enel Distribución Chile S.A.
The main unregulated customers supplied during 2021 are: Codelco for its divisions Salvador, Andina, Ventanas and El Teniente, Compañía Minera Zaldivar SpA, Cartulinas CMPC.S.A., CMPC Pulp S.A., CMPC Maderas S.A., Cementos Polpaico S.A., Walmart Chile S.A., Bio-Bío Cementos S.A., Cementos Bio Bio del sur S.A., Comercial ECCSA S.A (Ripley Store), Grupo Camanchaca (Camanchaca Cultivos Sur S.A., Camanchaca Pesca Sur S.A., Compañía Pesquera Camanchaca S.A. and Salmones Camanchaca S.A.), Sociedad Contractual Minera Franke, Minera Meridian Ltda, Molibdenos y Metales S.A., Inacal S.A., Concha y Toro S.A., Nuevo Sur S.A., Sonda S.A., Atacama Kozan and Essbio S.A., Grupo Errázuriz, Magotteaux Andino S.A. y Magotteaux Chile S.A.. The Energy Market
The Chilean power sector has a regulatory framework of almost three decades of operations. Such framework allowed developing a highly dynamic industry with significant private equity interest. This sector has been able to comply with the increasing power demand, which has grown at an annual average rate of approximately 2.4% during the last 10 years, slightly lower compared to the GDP during the same period. Chile has three interconnected systems and Colbún operates in the largest, the National Power System (SEN), which comprises Arica in the north and Isla Grande de Chiloé in the south. The consumption in this zone represents 99% of total power demand in Chile. Colbún has a market share of approximately 13% in power generation. The pricing system identifies different mechanisms for the short and long-term. For short-term pricing, the sector is based on a marginal cost scheme, including security and efficiency criteria in distributing resources. Power marginal costs result from the actual operation of the electric system in accordance with the financial merit programming conducted by the National Electrical Coordinator (CEN, for its Spanish acronym) and relate to the variable cost of production of the most expensive unit under operation at all times. Capacity payments are calculated based on the sufficiency power of plants, i.e., the reliable level of capacity that could be provided to supply the system at the point of high demand, considering the uncertainty associated with the availability of supplies, forced and programmed unavailabilities, and unavailability of the facility which connects the unit to the Transmission and Distribution System. The Power capacity price is determined as an economic indicator, which represents the investment in most efficient units to address power demand during high demand hours. For long-term pricing, power generation companies may have two types of customers: regulated and unregulated.
As a result of Law No. 20,018 passed on January 1, 2010, in the market of regulated customers, composed of distribution companies, generation companies’ sale power at the price resulting from competitive and public tenders.
Unregulated customers comprise those with a connection power exceeding 5,000 kW, and they freely negotiate their prices with suppliers.

12
Note that the regulation allows users with connection power between 500 kW and 5,000 kW to select between systems of regulated or unregulated prices, with a minimum of four years in each system. Spot market is where power generation companies trade at marginal cost energy and capacity (on an hourly basis) surplus or deficit resulting from their commercial position, net of production capacity, since dispatch orders relate to financial merit and are exogenous to each power generation company. To inject energy into the system and supply energy and capacity to its customers, Colbún uses transmission facilities as per the rights granted by the power legislation.
In this context, on July 20, 2016, a new law was published in the Official Gazette that establishes a new Power Transmission System and also creates a coordinating agency independent to the National Power System. The principal amendments included in this law indicate that the transmission remuneration will be charged fully in connection with power demand. Additionally, a new Coordinator with its own legal personality is established to operate the National Electric System, which began to exercise its functions as of January 1, 2017.
Description of business in Peru
Main assets
Combined cycle gas-fired thermoelectric power plant of 573 MW located in Las Salinas, Chilca district, 64 kilometers south of Lima, owned by the subsidiary Fenix Power Peru. Its location is considered strategic, since it is near the Camisea gas pipeline and Chilca power substation, allowing power generation at an efficient cost.
This power plant begun its commercial operation in December 2014 and is composed of two General Electric dual (gas or diesel) turbines generating 60% of its power, and a General Electric steam turbine generating the remaining 40%. This plant is considered a strategic asset in the Peruvian power market since it is one of the most efficient in the country and the third largest at domestic level.
Fenix has capacity of 573 MW, which results in a market share of approximately 8% in the SEIN. Main customers Regulated customers with long-term contracts: Grupo Distriluz, formed by Electro Norte S.A., Electro Noreste S.A. and Electrocentro S.A. e Hidrandina, COELVISAC, Enel Distribución S.A.A., Electricidad del Oriente S.A., Electro Dunas S.A.A. and Luz del Sur S.A.A. Customers with short-term contracts: Celepsa S.A., Atria Energía (Ex GCZ), Enel Distribución S.A.A, SEAL Distribución S.A, Grupo Distriluz S.A.A., COELVISAC and Adinelsa. Unregulated customers: Pamolsa, Austral, Minera Luren, B Braun, Garment, Del Ande, Grupo Patio, UTP, Chavimochic, Fabricaciones Rema, Logística AQP, Laboratorio Portugal, Modipsa, Idat, Fibraforte, Océano Seafood, Cetus y Pesquera Altair, Induamerica Chiclayo, Cerámicos Lambayeque, Tejidos San Jacinto, Koplast, Minera Huinac, Procesadora Comercializadora Montenegro, Grupo Patio Oficinas, Clínicas Auna and Empresa Metal Mecanica. The Energy Market Peru restructured the power market in 1992 (The Electricity Act No. 25,844: Energy Concessions Act), and during the last 4 years significant reforms have been made to the sector’s regulatory framework. As of December 31, 2021, the Peruvian power market has an installed capacity, at a domestic level, of approximately 15.4 GW, of which 13.3 GW corresponds to the capacity installed in the National Interconnected Power System (SEIN); out of this amount, nearly 55% relates to thermal power, 40% to hydro power, and the remaining 5% to renewable energies. Accordingly, natural gas is critical at the domestic thermal power generation level, because of its significant reserves and exploration wells, being Camisea the main deposit with

13
approximately 10.0 trillion cubic feet. The pricing system identifies two types of customers: regulated users that consume less than 200 kW and unregulated customers (large private users that consume more than 2,500 kW). Customers with a demand between 200 kW and 2,500 kW have the option to be considered as regulated or unregulated. The National Interconnected Power System (SEIN for its Spanish acronym) is managed by a System Economic Operation Committee (COES for its Spanish acronym), incorporated as a nonprofit private entity and as a legal personality under public law. The COES is composed of other SEIN agents (Power Generation Companies, Transmitters, Distribution Companies and Unregulated Customers) and their decisions are mandatory for all agents. Its objective is to coordinate SEIN's short, medium, and long-term operations, ensuring system security, use of power resources, as well as planning the development of SEIN transmission and managing the Short-Term Market, the latter based on marginal costs. In terms of energy consumption, the annual energy demand until the fourth quarter of 2021 was approximately 54 TWh, concentrated in the mining and residential sectors. In 2020, the system´s demand was 49.2 TWh. 3. Significant Accounting policies 3.1 Accounting policies These Consolidated Financial Statements of Colbún S.A. and subsidiaries as of December 31, 2021, have been prepared in accordance with International Financial Standards (IFRS) as issued by International Accounting Standards Board (IASB). These Consolidated Financial Statements have been prepared assuming that the company will continue as a going concern and were approved by the Board of Directors for issue at their Meeting held on January 25, 2022. The accounting policies set out below have been used in the preparation of these Consolidated Financial Statements. a. Basis of preparation and period – These Consolidated Financial Statements of Colbún S.A. and subsidiaries comprise the following:
• Statements of Financial Position as of December 31, 2021 and 2020.
• Statement of Comprehensive Income as of December 31, 2021 and 2020.
• Statement of Cash Flows as of December 31, 2021 and 2020.
• Statements of Changes in Equity as of December 31, 2021 and 2020.
• Notes to the Financial Statements. The information contained in these Consolidated Financial Statements is the responsibility of the Company. These Consolidated Financial Statements have been prepared under the historical cost basis, except for those assets and liabilities recognized at fair value (note 3 h. and 3 i). a.1 Functional currency - The Company's functional currency is the United States dollar, which is the currency that mainly impacts sale prices of goods and services in the markets in which the Company operates. All financial information in these Consolidated Financial Statements has been rounded in Thousands of United States dollar (ThUS$) to the nearest number, except otherwise indicated.

14
b. Consolidation basis - The Consolidated Financial Statements include the financial statements of the Parent and controlled companies. Control is established as the base for determining which entities are consolidated in the Consolidated Financial Statements. Subsidiaries are those in which Colbún S.A. is exposed to, or has rights to, variable returns from its interests in those entities and has the ability to affect those returns through its power over the entities. In general, the Company's power over its subsidiary arises from holding the majority of the voting rights provided by the subsidiary's equity instruments. The detail of subsidiaries is as follows:
Variations in the consolidation perimeter During the 2021 period, we can see the following variations in the consolidation perimeter: (1) On February 12, 2021, the liquidation of the company was carried out. (2) On September 30, 2021, the sale of all Colbún Transmisión S.A. shares to Alfa Desarrollo SpA was completed,
with which a purchase agreement was signed on March 30, 2021 and the Chilean National Economic Office granted the approval through resolution to carry out the sale on August 3, 2021.
During the 2020 period, we can see the following variations in the consolidation perimeter: (3) On September 3, 2020, Colbún S.A. acquired 100% of the shares of Sociedad Efizity Ingeniería SpA, a joint-
stock company incorporated in accordance with the Chilean laws. a) Efizity SpA is a join stock company constituted in accordance with the Chilean laws, Efizity Ingeniería SpA is the only and exclusive owner of all the shares. b) Efizity S.A.C is a closed stock company organized in accordance with the laws of the Republic of Peru, Efizity Ingeniería SpA and Colbún Perú S.A. are owners of all its shares. (3) On October 27, 2020, Fenix Power Perú S.A. and Colbún Perú S.A. constituted Sociedad Desaladora del Sur SA, a stock company incorporated in accordance with the laws of Peru, whose objective is the desalination of sea water, purification, conduction, marketing and provision of drinking water supply services to the Potable Water Service and Sewerage of Lima (SEDAPAL for its Spanish acronym) or to third parties. All intercompany transactions and balances have been eliminated in consolidation, as well as non-controlling interest have been recognized which relates to the ownership interest percentage of third parties in subsidiaries, which is included separately in Colbún's consolidated equity.
12.31.2020 12.31.2020
Direct Indirect Total Total Total
Termoeléctrica Nehuenco S.A., in liquidation (1) Chile US$ 76.528.870-3 - - - 100 100
Colbún Transmisión S.A. (2) Chile US$ 76.218.856-2 - - - 100 100
Colbún Desarrollo SpA Chile US$ 76.442.095-0 100 - 100 100 100
Santa Sofía SpA Chile US$ 76.487.616-4 100 - 100 100 100
Colbún Perú S.A. Peru US$ 0-E 100 - 100 100 100
Inversiones de Las Canteras S.A. Peru US$ 0-E - 51 51 51 51
Fenix Power Perú S.A. Peru US$ 0-E - 51 51 51 51
Desaladora del Sur S.A. (4) Peru PEN 0-E - 51 51 - 51
Efizity Ingeniería SpA . (3) Chile Ch$ 76.362.527-3 100 - 100 - 100
Efizity SpA Chile Ch$ 76.236.821-8 - 100 100 - 100
Efizity S.A.C. Peru PEN 0-E - 100 100 - 100
Ownership % as of
12.31.2021Consolidated company Country Funcional currency Tax ID No.

15
b.1 Business combinations and goodwill – Business combinations are recognized using the acquisition method. The acquisition cost is the sum of the consideration transferred, measured at fair value at the acquisition date, and the amount of the acquire non-controlling interest, if any. For each business combination, the Company determines whether the non-controlling interest of the acquire is measured at fair value or proportional to the net identifiable assets of the acquire. Related acquisition costs are accounted for as incurred in other expenses. When the Company acquires a business, it assesses the financial assets and financial liabilities acquired for their appropriate classification based on contractual terms, economic conditions and other related conditions at the acquisition date. This includes separating the embedded derivatives of the acquired business´ main contracts. If the business combination is conducted by stages, ownership interests previously maintained in the acquired equity are measured at fair value at the acquisition date, and gains or losses are recognized in the income statement. Any contingent consideration transferable by the acquired is recognized at fair value at the acquisition date. Contingent considerations which are classified as financial assets or financial liabilities in accordance with IFRS 9 Financial Instruments are measured at fair value, accounting for changes in fair value as gain or loss or through comprehensive income. In the events contingent considerations are not within the scope of IFRS 9, these are measured in accordance with the related IFRS. If the contingent consideration classified as equity, this is not revalued, and any subsequent settlement is recorded in net equity. Goodwill is the excess of the sum of the consideration transferred recognized on the net value of assets acquired and liabilities assumed. If the fair value of net assets acquired exceeds the amount of the transferred consideration, the Company conducts a new assessment to ensure that all assets acquired and liabilities assumed have been appropriately identified, and reviews all procedures applied to conduct the measurement of the amount recognized at the acquisition date. If the new assessment results in an excess of fair value of net assets acquired on the aggregate amount of the consideration transferred, the difference is recognized as profit in the income statement. Subsequent to initial recognition, goodwill is recognized at cost less any accumulated impairment losses. For impairment testing, goodwill acquired in a business combination is allocated, at the acquisition date, to each Company's cash-generating unit which is expected to receive benefits, regardless if there are other assets or liabilities of the acquire allocated to those units. Once the business combination is completed (concludes the measurement process) goodwill is not amortized and the Company reviews on a regular basis it´s carrying amounts to recognize any impairment losses. When goodwill is part of the cash-generating unit and a portion of such unit is derecognized, goodwill related to such disposed operations is included in the carrying amount of the operations when determining gains or losses obtained at disposal. Goodwill derecognized is measured based on the relative value of the disposed operation and the portion of the cash-generating unit maintained. b.2 Non-controlling interest - The value of non-controlling interest in subsidiaries' equity and comprehensive income is presented under captions "Total Equity: Non-controlling interest” of the interim consolidated statement of financial position and “Net profit attributable to non-controlling interests” and "Comprehensive income attributable to non-controlling interest" in the statement of comprehensive income. b.3 Interest in unconsolidated structured entities - On May 17, 2010, as per the D.E. N°.3,024, the Ministry of Justice grants legal personality and approves the Colbún Foundation's bylaws (hereinafter the "Foundation"). Main objectives of the Foundation address the following: The promotion, encouragement and support of all type of projects and activities that aim to improve living conditions in the neediest sectors. Research, development and dissemination of culture and arts. The Foundation will be able to participate in the formation, organization, management and support of all entities, institutions, associations, groups and organizations, either public or private, which have the same goals.
16
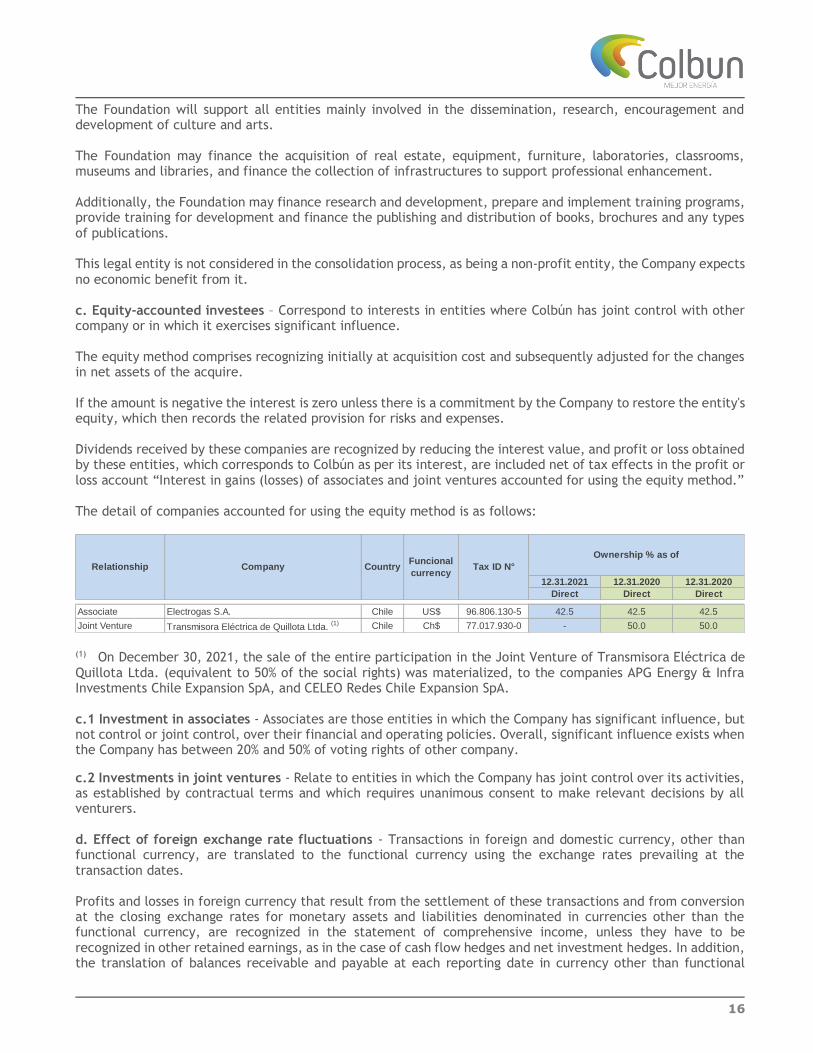
The Foundation will support all entities mainly involved in the dissemination, research, encouragement and development of culture and arts. The Foundation may finance the acquisition of real estate, equipment, furniture, laboratories, classrooms, museums and libraries, and finance the collection of infrastructures to support professional enhancement. Additionally, the Foundation may finance research and development, prepare and implement training programs, provide training for development and finance the publishing and distribution of books, brochures and any types of publications. This legal entity is not considered in the consolidation process, as being a non-profit entity, the Company expects no economic benefit from it. c. Equity-accounted investees – Correspond to interests in entities where Colbún has joint control with other company or in which it exercises significant influence. The equity method comprises recognizing initially at acquisition cost and subsequently adjusted for the changes in net assets of the acquire. If the amount is negative the interest is zero unless there is a commitment by the Company to restore the entity's equity, which then records the related provision for risks and expenses. Dividends received by these companies are recognized by reducing the interest value, and profit or loss obtained by these entities, which corresponds to Colbún as per its interest, are included net of tax effects in the profit or loss account “Interest in gains (losses) of associates and joint ventures accounted for using the equity method.” The detail of companies accounted for using the equity method is as follows:
(1) On December 30, 2021, the sale of the entire participation in the Joint Venture of Transmisora Eléctrica de Quillota Ltda. (equivalent to 50% of the social rights) was materialized, to the companies APG Energy & Infra Investments Chile Expansion SpA, and CELEO Redes Chile Expansion SpA. c.1 Investment in associates - Associates are those entities in which the Company has significant influence, but not control or joint control, over their financial and operating policies. Overall, significant influence exists when the Company has between 20% and 50% of voting rights of other company.
c.2 Investments in joint ventures - Relate to entities in which the Company has joint control over its activities, as established by contractual terms and which requires unanimous consent to make relevant decisions by all venturers. d. Effect of foreign exchange rate fluctuations - Transactions in foreign and domestic currency, other than functional currency, are translated to the functional currency using the exchange rates prevailing at the transaction dates. Profits and losses in foreign currency that result from the settlement of these transactions and from conversion at the closing exchange rates for monetary assets and liabilities denominated in currencies other than the functional currency, are recognized in the statement of comprehensive income, unless they have to be recognized in other retained earnings, as in the case of cash flow hedges and net investment hedges. In addition, the translation of balances receivable and payable at each reporting date in currency other than functional
12.31.2021 12.31.2020 12.31.2020
Direct Direct Direct
Associate Electrogas S.A. Chile US$ 96.806.130-5 42.5 42.5 42.5
Joint Venture Transmisora Eléctrica de Quillota Ltda. (1) Chile Ch$ 77.017.930-0 - 50.0 50.0
Ownership % as of
Relationship Company CountryFuncional
currencyTax ID N°

17
currency of the financial statements which are part of the consolidation perimeter, is conducted at closing exchange rates. Differences in measurement are recognized as finance income and finance costs under foreign currency translation differences. e. Translation Basis - Assets and liabilities denominated in Chilean pesos, Euros, Peruvian soles and inflation adjusted units have been translated into United States dollars at the exchange rates at the reporting date, as per the following:
f. Property, plant and equipment - Property, plant and equipment held for the generation of power services or administrative purposes, are presented at cost less subsequent depreciation and impairment losses, if applicable. This cost value includes, separate from the acquisition price of assets, the following concepts as permitted by IFRS:
• Finance cost of loans intended to finance assets under construction is capitalized during the construction period.
• Personnel expenses directly related to assets under construction.
• Costs of extensions, modernization or improvements representing an increase in the productivity, capacity or efficiency or lengthening of the useful lives of assets, are capitalized as higher cost of the related assets.
• Substitutions or renovations of assets that increase their useful lives, or their economic capacity, are recorded as the higher value of the respective assets, with the consequent accounting derecognition of the substituted or renovated assets.
• Dismantling, removal and restoration costs of property, plant and equipment are recognized based on the legal obligation of each project (note 3.n.2).
Assets under construction will be transferred to property, plant and equipment in operation after the end of the test period, from which date their depreciation commences. Periodic maintenance, conservation and repair expenses are recorded directly in profit or loss as costs for the period in which they are incurred. Items of property, plant and equipment, net of their residual value is depreciated by allocating, on a straight- line basis, the cost of different items comprising over their estimated useful life (note 5 a. (i)). The residual values and useful lives of items of property, plant and equipment are reviewed at each reporting date and adjusted if required. g. Intangible assets other than goodwill – Intangible assets acquired individually are measured initially at cost. The cost of intangible assets acquired in business combinations is their fair value at the date of acquisition. Subsequent to initial recognition, are measured at cost less accumulated amortization and impairment losses. The Company assesses at initial recognition if the useful life of intangible assets is definite or indefinite.
Chilean pesos 844.69 710.95
Euros 0.8839 0.8141
Peruvian soles 3.9980 3.6240
Inflation adjusted units 0.0273 0.0245
Exchange rate 12.31.2021 12.31.2020
18
Assets with finite useful life are amortized throughout their remaining economic useful life and assessed for impairment when such indicators exist. The amortization period and amortization of intangible assets with definite useful life are reviewed at least at each reporting date. The criteria used for the recognition of impairment losses of these assets and their recoveries are recorded in note 5 b. Changes in expected useful life or consumption pattern of future economic benefits materialized in the asset are considered to change the period or amortization method, if applicable, and treated as a change in the accounting estimate. Amortization expenses of intangible assets with definite useful life are recognized in the statement of comprehensive income. h. Financial instruments h.1 Financial assets - Financial assets are classified at initial recognition in three measurement categories: a) At amortized cost b) Fair value through other comprehensive income (equity) c) Fair value through profit or loss
h.1.1 Amortized cost - It is intended to maintain a financial asset until obtaining contractual cash flows on an established date. Expected cash flows relate mainly to payments of principal and interest on the principal amount outstanding. h.1.2 Fair value through other comprehensive income (equity) - To classify an asset at fair value through other comprehensive income as principle it has to comply with the requirement of the sale of financial assets for which the principal owed amount is expected to be recovered in a given term in addition to interests, if applicable.
h.1.3 Fair value through profit or loss - The last classification provided as an option by IFRS 9 is financial assets at fair value through profit or loss for the year. Based on its business model, the Company holds financial assets at amortized costs as the main financial asset as it aims to recover its future cash flows on a given date seeking the collection of principals owed plus interests on the principal, if applicable. Loans and receivables are the main financial assets non-derivative from the Group, with fixed or determinable payments that are not quoted in an active market. Loans and receivables are included in the caption Trade and other receivables in the Statement of Financial Position. They must initially be recognized at fair value and subsequently at amortized cost in accordance with the effective interest method less the allowance account for impairment losses. h.1.4 Derecognition of financial assets - The Company derecognizes financial assets only when the rights to receive the cash flows have been canceled, voided, expired or have been transferred. h.1.5 Impairment of non-derivative financial assets – The Company applies a simplified approach and records expected credit losses in all its debt securities, loans and trade receivables, whether for a 12-month period or for lifetime, as established by IFRS 9. Objective evidence of impairment includes significant financial difficulties of the debtor, probability that the debtor will enter bankruptcy or financial reorganization, and default or arrears in the payment, are considered indicators that the trade receivable is impaired. Impairment is the difference between the carrying amount of the asset and the real value of estimated future cash flows discounted at the effective interest rate. Losses are recognized in the statement of comprehensive income and reflected in a provision account. When a receivable is classified as a doubtful account, after all reasonable mechanisms of collection, either judicial or pre-judicial, have been exhausted as per the related legal report; and its related write-off applies, this is recorded against the impaired trade receivables account.

19
When the fair value of an asset is lower than the acquisition cost, if objective evidence exists that the asset is impaired and such impairment is not temporal, the difference is recorded directly in losses for the year. Financial assets at fair value through profit or loss are not subject to impairment tests. h.2. Financial liabilities h.2.1 Classification as debt or equity - Debt instruments and equity instruments are classified as either financial liabilities or equity, as per their contractual terms. h.2.2 Equity instruments - Correspond to any agreement representing a residual interest in the net assets of an entity after all its liabilities are deduced. Equity instruments issued by Colbún S.A. are recognized at the amount of the consideration received, net of direct costs of issuance. Currently, the Company only issues single series shares. h.2.3 Financial liabilities - Financial liabilities are classified as financial liability at "fair value through profit or loss" or "other financial liabilities". h.2.4 Financial liabilities at fair value through profit or loss - Financial liabilities are classified at fair value through profit or loss when the financial liability is either held for trading or it is designated at fair value through profit or loss. These are measured at fair value and changes therein, including any interest expenses, are recognized in profit or loss. h.2.5 Other financial liabilities - Other financial liabilities, including bank borrowings and bonds payable and promissory notes, are measured initially at the amount of cash received, net of transaction costs. Other financial liabilities are subsequently measured at amortized cost using the effective interest method. The effective interest method is a method for calculating the amortized cost of a financial liability and allocating interest expense throughout the relevant period. The effective interest rate corresponds to the rate that discounts estimated future cash flows payable throughout the expected life of the financial liability or, if appropriate, a shorter period when the associated liability has a prepayment option to be applied. h.2.6 Derecognition of financial liabilities - The Company derecognizes financial liabilities only when obligations are canceled, voided or expired. i. Derivatives - The Company entered into derivative instruments to mitigate its exposure to interest rate fluctuation related to exchange rates and fuel prices. Changes in fair value of these instruments at the reporting date are recognized in the consolidated statement of comprehensive income unless these are designated as hedge accounting and meet the conditions established in IAS 39 to apply such criterion. For hedge accounting purposes, the Company continues to apply the criteria established in IAS 39. Hedges are classified as follows:
• Fair value hedges: correspond to a hedge of the exposure to changes in fair value of a recognized asset or liability or an unrecognized firm commitment attributable to a particular risk. For this hedge, both the hedge instrument value and the hedged item are recognized in the statement of comprehensive income, offsetting both effects in the same caption.
• Cash flow hedges: correspond to a hedge of the exposure to the fluctuation in cash flows attributable to a particular risk associated with a recognized asset or liability, or a highly probable forecasted transaction. Changes in the fair value of derivatives are recognized, with respect to the effective portion of the hedges, in equity reserve under "Cash flow hedges." Retained earnings or an accumulated deficit in such caption are transferred to the statement of comprehensive income to the extent that the underlying portion has an impact on the statement of comprehensive income for the hedged risk, netting

20
such effect in the same heading in the statement of comprehensive income. Any ineffective portion of changes in the fair value of the derivative is recognized immediately in the statement of comprehensive income.
A hedge is considered to be highly effective when changes in fair value or in cash flows of the underlying asset directly attributable to the hedged risk are offset by the changes in the fair value or cash flows of the hedged instrument with an effectiveness within a range between 80% and 125%. For the period covered by these Consolidated Financial Statements, the Company designated certain derivatives as hedging instruments of highly probable forecasted transactions or hedging instruments related to foreign currency risks of a firm commitment (cash flow hedging instruments). The Company has designated all its derivatives as hedge accounting instruments. j. Inventory - This caption includes gas, oil and coal stock, and warehouse inventory (spare parts and materials), which are valued at cost, net of possible obsolescence determined in each period. Cost is determined using their weighted average purchase price.
j.1 Impairment of spare parts (obsolescence) basis - The impairment of spare parts estimate (obsolescence) is established based on an individual and general assessment performed by specialists of the Company, who assess turnover and technological obsolescence criteria on the stock held in warehouses of each Power plant.
k. Statement of cash flows - For the preparation of the statement of cash flows, the Company uses the following definitions: Cash and cash equivalents comprise cash on hand, term deposits in credit institutions and other highly liquid short-term investment with original maturities up to three months and subject to an insignificant risk of changes in their valuation. Bank overdrafts are classified as current liabilities in the statement of financial position. Operating activities: are the principal revenue-producing activities usually conducted by the Company and other activities that are not investing or financing activities. Investing activities: Correspond to acquisition, disposal or sale activities by other means of long-term assets and other investments not included in cash and cash equivalents. Financing activities: Activities that generate changes in the size and composition of net equity and financial liabilities. l. Income tax - The Company determines the taxable basis and calculates income tax in accordance with current tax legislation in each period. Deferred taxes arising from temporary differences and other events generating differences between the accounting and tax basis of assets and liabilities are recorded in accordance with IAS 12 "Income Taxes." Current income tax is recognized in the statement of income or in the statement of other comprehensive income based on where the profit or loss from which they arose are recorded. Differences between the carrying amount of the assets and liabilities and their tax base generate the basis on which deferred taxes are calculated using the tax rates that are expected to be in force when the assets are realized, and liabilities are settled. Changes in deferred tax assets or liabilities generated are recorded in profit or loss in the consolidated statement of comprehensive income or in total equity captions under the statement of financial position, based on where the profit or loss from which they arose are recorded. A deferred tax asset is recognized only to the extent that is probable that future taxable profits will be available against which the temporary difference can be utilized to recover temporary difference deductions and use the tax losses.

21
At each reporting date, the Company reviews the deferred tax assets and liabilities recorded to verify that they remain effective and adjusted on a timely basis based on the results of such analysis. For the interim consolidated financial statement balances, the Company and its subsidiaries offset deferred tax assets and liabilities if, and only if, they relate to the income tax, which corresponds to that same tax administration, only to the extent that the Company is legally entitled to offset current tax assets with current tax liabilities. m. Severance indemnity payments - Obligations recognized as severance indemnity payments arise as a result of collective and individual agreements subscribed by employees of the Company, in which the Company's commitment is established, and are classified as "Defined post-employment benefits." The Company recognizes employee benefit costs based on an actuarial calculation in accordance with IAS 19 "Employee benefits", which includes variables such as life expectancy, salary increases and turnover, among others. At the reporting date, the amount of net actuarial liabilities accrued is presented in the item Provisions for employee benefits, current and Provisions for employee benefits, non-current in the consolidated statement of financial position. The Company recognizes all actuarial gains and losses arising from the valuation of defined benefit plans in other comprehensive income. Accordingly, all costs related to benefit plans are recorded as personnel expenses in the statement of comprehensive income. n. Provisions - Obligations maintained at the reporting date in the statement of financial position, arising as a result of past events which may generate highly-probable equity losses to the Company, which amount and timing can be reliably estimated, are recorded as provisions at the amount which it is estimated that the Company would have to disburse to settle the obligation. Provisions are reviewed on a regular basis and are quantified considering the best information available at the reporting date of these consolidated financial statements.
n.1 Restructuring - A provision for restructuring expenses is recognized when the Company approves a detailed and formal restructuring plan, and such restructuring has commenced or is publicly announced. The Company accrues no future operating costs.
n.2 Dismantling - Future disbursements by the Company related to the closure of its facilities are included at the asset amount at fair value, recognizing the related provision for dismantling or remediation at the commencement of the plant's operations. The Company assesses on an annual basis its estimate on future disbursements indicated above, increasing or decreasing the asset value based on the results of such estimate (see Note 27 c).
o. Accrued vacations - Vacation expenses are recorded in the year the right is accrued, in conformity with IAS
19. p. Revenue from contracts with customers - Revenue from the sale of power in Chile and Peru is recognized at the fair value of the amount received or receivable and represents the amount for services rendered during the normal course of business, less any related discount or tax, in accordance with IFRS 15. Revenue is classified in the following categories: Sale of goods - For contracts with customers in which the sale of equipment is the unique obligation, the adoption of IFRS 15 has no impact on the Company's revenue or profit or loss because revenue is recognized at a point in time when the control of the asset is transferred to the customer upon delivering the goods. The Company has impact associated with the individual sale of goods, because it is not currently engaged in the sale of goods as a single contract for the sale of goods.

22
Rendering of services - Colbún provides power supply and capacity to both unregulated and regulated customers. The Company recognizes revenue for services based on the physical delivery of energy and capacity. Services are satisfied over time because the customer simultaneously receives and consumes the benefits provided by the Company. Consequently, the Company recognizes revenue from such service contracts over time instead of at a point in time. A description of the Company's main revenue recognition policies for each type of customer is presented below.
• Regulated customers - distribution companies: Revenue from the sale of power is recorded based on physical delivery of energy and capacity in conformity with long-term agreements at a bid price. • Unregulated customers - Connection capacity exceeding 5,000 KW in Chile and between 200 KW and 2,500 KW in Peru: Revenue from the sale of power for these customers is recorded based on the physical delivery of energy and capacity, at fees established in the related contracts. • Spot market customers: Revenue from the sale of power is recorded based on the physical delivery of energy and capacity to other power-generation companies at the marginal cost of energy and capacity. The spot market is legally organized through Delivery Centers (CEN in Chile and COES in Peru) where energy and capacity surplus and deficit is traded. Energy and capacity surpluses are recognized as revenue, and deficits are recorded as costs in the consolidated statement of comprehensive income.
The Company only receives short-term prepayments from its customers related to operations and maintenance services. These are recognized as other financial liabilities. However, the Company may receive long-term prepayments from customers from time to time. In accordance with the current accounting policies, the Company recognizes such prepayments as deferred revenue by virtue of non-current liabilities classified in the statement of financial position. No interests were accrued on long-term prepayments received by virtue of the accounting policy currently in force. The Company should determine whether a significant finance component exists in its contracts. However, the Company decided to use the practical expedient provided by IFRS 15, and will not adjust the amount committed in the consideration for the effects of a significant financing component in the contracts, when the Company expects, at the onset of the contract, that the period between the time in which the entity transfers an asset or service committed with the customer and the time in which the customer pays for such good or service is one year or less. Consequently, at short-term the Company shall not account for a financing component, even if this is a significant component. Based on the nature of the services offered and the objective of the payment terms, the Company has concluded that there is no significant financing component in these contracts. The Company does not record under revenue the gross income from economic benefits received when it acts as agent or commission agent on behalf of third parties, and it only records the payment or commission it expects to receive. Any tax received by customers and forwarded to government authorities (e.g. VAT, taxes on sales and tributes, etc.) is recorded on a net basis, and therefore excluded from revenue in the consolidated statement of comprehensive income. Finance income is composed of interest income in funds invested, gains from the sale of available-for-sale financial assets, changes in the fair value of financial assets at fair value through profit or loss and gains from hedge instruments that are recognized in comprehensive income. Interest income is recognized as it accrues in profit or loss at the amortized cost using the effective interest method. q. Dividends - Article No. 79 of the Chilean Public Company Act establishes that, except otherwise unanimously agreed in at the Annual Shareholder’s Meeting, by unanimity of the issued shares, publicly traded companies must annually distribute as cash dividend to their shareholders, at pro rata of their interests or in the proportional amount established by the Company’s by-laws, in the event preference shares exist, at least 30% of net profit for each year, except if the Company has to absorb accumulated losses from prior years.

23
At each reporting date, the Company estimates the amount of the obligation with its shareholders, net of provisional dividends that have been approved during the year, and recognizes them as "Trade and other payables, current" and as "Trade payables due to related parties", as appropriate, with a charge to equity. Provisional and definitive dividends are recorded as decreases in equity at their approval by the relevant individuals which, in the first case, generally corresponds to the Company's Board of Directors, and in the second case the responsibility relates to the Shareholders' Ordinary Meeting. r. Environment - In the event of environmental liabilities, these are recognized on based on the current interpretation of environmental laws and regulations, when is probable that a current obligation will be produced and the amount of such liability can be estimated reliably. Investments in infrastructure projects intended to comply with environmental requirements are performed in conformity with the general accounting criteria related to property, plant and equipment. s. Classification of balances as current or non-current - Balances in the accompanying consolidated statement of financial position are classified on the basis of their maturities – i.e., balances maturing within twelve months or less are classified as current; whereas balances maturing in periods exceeding twelve months are classified as non-current. t. Leases - The implementation of IFRS 16 implies that, for lessees, most of the leases are recognized in the balance sheet, which significantly changes the companies' financial statements and related ratios. Colbún maintains lease agreements for its offices, parking lots, warehouses, pickup trucks and printers.
t.1 Lessee - From the lessee's standpoint, in the commencement date of a lease, the Company recognizes an asset representing the right to use the underlying asset during the lease term (right-of-use asset) and a liability representing its obligation to make lease payments (lease liability), except leases which term is less than 12 months (with no renewal), and leases where the underlying asset amounts to less than US$5,000. The lessee shall recognize interest expense on the lease liability separately from the amortization expense for the right-of-use asset.
t.1.1 Initial recognition - At the commencement date, a lessee shall measure the right-of-use asset at cost; whereas a lessee shall measure the lease liability at the present value of the lease payments that are not paid at that date. The lease payments shall be discounted using the interest rate implicit in the lease, if that rate can be readily determined. If that rate cannot be readily determined, the lessee shall use the lessee’s incremental borrowing rate. t.1.2 Classification - All leases are classified as finance lease, as the lessee records a right-of-use asset and a lease liability at the commencement date.
t.1.3 Remeasurement - In addition, lessees will be required to remeasure the lease liability if certain events occur (e.g. a change in the lease term, a change in future lease payments resulting from a change in an index or a rate used to determine those payments). A lessee shall recognize the amount of the lease liability as an adjustment to the right-of-use asset. t.1.4 Depreciation charge - A lessee shall apply the depreciation requirements in IAS 16 Property, Plant and Equipment in depreciating the right-of-use asset.
t.1.5 Impairment - A lessee shall apply IAS 36 Impairment of Assets to determine whether the right-of-use asset is impaired and to account for any impairment loss identified.
t.2 Lessor - Lessor accounting in accordance with IFRS 16 is substantially similar to the accounting under IAS 17. Lessors will continue to classify leases as finance or operating leases at the commencement date, based on the substance of the transaction. Leases in which substantially all the risks and rewards inherent to the ownership of the underlying asset are transferred are classified as finance leases. The remaining leases are classified as operating leases.
24
Operating lease payments are expended on a straight-line basis over the term of the lease, unless another systematic basis of distribution is more representative.
u. Transactions with related parties - The transactions between the Company and its dependent subsidiaries, which are related parties, are part of the Company's usual transactions with respect to its objective and conditions, and these are eliminated in the consolidation process. The identification of the relationship between the Parent, Subsidiaries, Joint Ventures and Related Parties are detailed in Note 3.1 and section b and c. All transactions are performed under the market terms and conditions. v. Government grants - Government grants are measured at the fair value of the asset received or receivable. A grant with no specific future performance conditions is recognized in income when the amount obtained for the grant is received. A grant establishing specific future performance conditions is recognized in income when such conditions are met. Government grants are presented separated from the asset to which they relate. Government grants recognized in income are presented separately in the notes. Government grants received before the compliance with the revenue recognition criteria are presented as a separate liability in the statement of financial position. The Company recognizes no amount for types of government aid to which no fair value can be allocated. However, if these exist, the Company discloses the information of such aid. w. Interest costs - Interest costs directly attributable to the acquisition, construction or development of an asset which implementation or sale requires an extended period, are capitalized as part of the cost of such asset. The Company has established as a policy the capitalization of interests based on the construction phase. The remaining interest costs are recognized as expenses in the period they are incurred. Financial expenses include interests and other costs incurred by the Company with respect to the financing obtained. x. Contingent assets and liabilities - A contingent liability is a possible obligation that arises from past events and whose existence will be confirmed only by the occurrence of one or more uncertain future events not wholly under the Company's control, or a present obligation arising from past events which has not been recognized because:
• It is not probable that an outflow of resources embodying economic benefits will be required to
settle the obligation; or
• The amount of the obligation cannot be measured with sufficient reliability. A contingent asset is a possible asset that arises from past events and whose existence will be confirmed only by the occurrence or non-occurrence of one or more uncertain future events not wholly within the control of the Company. These will not be recognized in the financial statements but will have to be disclosed in the notes to the consolidated financial statements. y. Non-current assets held for sale - Non-current assets or groups of assets for their disposal are classified as available for sale when their book value will be recovered mainly through a sale transaction and the sale is considered highly probable within the next 12 months. These assets are recorded at book value or at fair value less the costs necessary to carry out their sale, whichever is lower, in accordance with IFRS 5.

25
3.2 New accounting pronouncements A number of new standards, amendments to standards and interpretations are effective for annual periods beginning after January 1, 2021. Those that may be relevant for the Group are indicated below: 3.2.1. Standards effective from January 1, 2021
IFRS 9, IAS 39 and IFRS 7 Interest Rate Benchmark Reform – Phase 2: In August 2020, the IASB published the second phase of the Interest Rate Benchmark Reform comprising amendments to IFRS 9, IAS 39, IFRS 7, IFRS 4 and IFRS 16. With this publication, the IASB has completed its work in response to the effects of the reform of interbank offered rate (IBOR, for its acronym in English) on financial information. The amendments provide temporary reliefs which address the financial reporting effects when an interbank offered rate (IBOR) is replaced with an alternative nearly risk-free interest rate (RFR) The amendments are mandatory, with earlier application permitted. Hedging relationships must be reinstated if the hedging relationship was discontinued solely due to changes required by IBOR reform and it would not have been applied at that time. While application is retrospective, and entity is not required to restate prior periods. This standard is effective as of January 1, 2021. Covid-19-Related Rent Concessions beyond 30 June 2021: In May 2020, the IASB issued an amendment to IFRS 16 Leases to provide relief to lessees in applying IFRS 16 guidance related to lease modifications due to rent reductions that occur as a direct consequence of the Covid-19 pandemic. The amendment does not apply to landlords. As a practical solution, a tenant may choose not to assess whether the Covid-19-related rent reduction granted by a landlord is a lease modification. A lessee who makes this choice will recognize changes in lease payments from Covid-19-related rent reductions in the same way that it would recognize the change under IFRS 16 as if the change were not a lease modification. In March 2021, the IASB issued an amendment to IFRS 16 Leases to extend the availability of the practical solution that considers the assessment of Covid-19 related rent decreases for one more year. The practical solution of 2021 applies to rental concessions where the reduction in the lease corresponds only to payments that are originally due before June 30, 2022, provided that the other conditions established for the application of the practical solution are met. The amendment will apply to annual periods beginning on or after April 1, 2021. A lessee will apply this practical solution retrospectively, recognizing the cumulative effect of the initial application of the amendment as an adjustment to the beginning balance of retained earnings (or other component of equity, as applicable) at the beginning of the annual period over which it is reported in which the tenant applies the amendment for the first time. The lessee is not required to disclose the information required by paragraph 28 (f) of IAS 8. In accordance with paragraph 2 of IFRS 16, the lessee is required to apply the practical solution consistently with eligible contracts with similar characteristics and in similar circumstances, regardless of whether the contract became eligible for practical solution as a result of the application of the 2020 or 2021 amendment.
Mandatory application
date
IFRS 9, IAS 39,
IFRS 7, IFRS 4
and IFRS 16
Interest Rate Benchmark Reform – Phase 2 January 1, 2021
IFRS 16 Covid-19-Related Rent Concessions beyond 30 June 2021 April 1, 2021
Adopted Standards

26
This Standard is effective as of April 1, 2021. 3.2.2. Accounting pronouncements effective starting from January 1, 2022 and thereafter:
Reference to the Conceptual Framework (Amendments to IFRS 3): In May 2020, the IASB issued Amendments to IFRS 3 Business Combinations - Reference to the Conceptual Framework. The amendments are intended to replace the reference to a previous version of the IASB’s Conceptual Framework (the 1989 Framework) with a reference to the current version issued in March 2018 without significantly changing its requirements. The amendments will be effective for annual periods beginning on or after 1 January 2022 and must be applied retrospectively. Earlier application is permitted if, at the same time or earlier, an entity also applies all the amendments contained the Amendments to Reference to the Conceptual Framework in IFRS Standards issued in March 2018. The amendments will promote consistency in financial reporting and avoid potential confusion from having more than one version of the Conceptual Framework in use. Property, Plant and Equipment: Proceeds before Intended Use (Amendment to IAS 16): The amendment prohibits entities from deducting from the cost of an item of property, plant and equipment (PP&E), any proceeds of the sale of items produced while bringing that asset to the location and condition necessary for it to be capable of operating in the manner intended by management. Instead, an entity recognizes the proceeds from selling such items, and the costs of producing those items, in profit or loss in accordance with the applicable standards. The amendment will be effective for annual periods beginning on or after 1 January 2022. The amendment must be applied retrospectively only to items of PP&E made available for use on or after the beginning of the earliest period presented when the entity first applies the amendment. Onerous Contracts – costs of fulfilling a contract (Amendment to IAS 37): In May 2020, the IASB issued amendments to IAS 37 Provisions, Contingent Liabilities and Contingent Assets to specify which costs an entity needs to include when assessing whether a contract is onerous or loss-making. The amendments will be effective for annual periods beginning on or after 1 January 2022. The amendments must be applied retrospectively to contracts for which and entity has not yet fulfilled all of its obligation at the beginning of the annual reporting period in which it first applies the amendments (the date of initial application). Earlier application is permitted and must be disclosed. The amendments are intended to provide clarity and help ensure consistent application of the standard. Entities that previously applied the incremental cost approach will see provisions increase to reflect the inclusion of costs related directly to contract activities, whilst entities that previously recognized contract loss provisions using the guidance from the former standard, IAS 11 Construction Contracts, will be required to exclude the allocation of indirect overheads from their provisions.
Mandatory application
date
IFRS 3 Reference to the Conceptual Framework January 1, 2022
IAS 16 Property, Plant and Equipment - Proceeds before Intended Use January 1, 2022
IAS 37 Onerous Contracts - Costs of Fulfilling a Contract January 1, 2022
IFRS 17 Insurance Contracts January 1, 2023
IAS 1 Classification of Liabilities as Current or Non-Current January 1, 2023
IAS 1 Material accounting policies January 1, 2023
IAS 8 Definition of an accounting estimate January 1, 2023
IAS 12 Deferred Tax related to Assets and Liabilities arising from a Single Transaction January 1, 2023
IFRS 10 - IAS 8Sale or Contribution of Assets between an Investor and its Associate or Joint Venture
(Amendments to IFRS 10 and IAS 28)
Mandatory date deferred
indefinitely
IFRS 17 - IFRS 9 Comparative InformationWhen IFRS 17 is first
applied
Standards issued by the IASB yet to be adopted

27
IFRS 17 Insurance Contracts: Issued in May 2017, this Standard requires that insurance liabilities be measured at a current compliance value and provides a more consistent approach for presenting and measuring all insurance contracts. Such requirements are designed to provide a consistent principle-based accounting treatment. This standard is effective for annual periods beginning on or after January 1, 2023. Early adoption is permitted if IFRS 9 and IFRS 15 have been adopted. Classification of Liabilities as Current or Non-Current (Amendments to IAS 1 Presentation of Financial Statements: In January 2020, the Board issued amendments to paragraphs 69 to 76 of IAS 1 to specify the requirements for classifying liabilities as current or non-current. The amendments will be effective for annual periods beginning on or after 1 January 2023. The entities need to carefully consider whether there are any aspects of the amendments that suggest that terms of their existing loan agreements should be renegotiated. In this context, it is important to highlight that the amendments must be applied retrospectively. Disclosure of Accounting Policies (Amendment IAS 1 Presentation of Financial Statements): In February 2021, the IASB issued amendments to IAS 1 and IFRS Practice Statement No. 2 Make materiality judgments, in which it provides guidance and examples to help entities apply material judgments to accounting policy disclosures. The amendments are intended to help entities provide accounting policy disclosures that are most useful by: • Replace the requirement that entities disclose their "significant" accounting policies with the requirement to disclose their "material" accounting policies. • Include guidance on how entities apply the concept of materiality in making decisions about accounting policy disclosures. When evaluating the relative importance of information on accounting policies, entities should consider both the size of the transactions and other events or conditions and the nature of these. The amendment will be effective for annual periods beginning on or after January 1, 2023. Changes in Accounting Estimates and Errors - Definition of Accounting Estimates (Amendment to IAS 8 Accounting Policies): In February 2021, the IASB issued amendments to IAS 8, introducing a new definition of "accounting estimates". The amendments clarify the distinction between changes in accounting estimates and changes in accounting policies and correction of errors. In addition, they clarify how entities use measurement techniques and inputs to develop the accounting of estimates. The amended standard clarifies that the effects on an accounting estimate resulting from a change in an input or a change in a measurement technique are changes in accounting estimates, provided that these are not the result of correcting errors from previous periods. This definition of a change in accounting estimate specified that changes in accounting estimates may result from new information or new developments. Therefore, such changes are not bug fixes. The amendment will be effective for annual periods beginning on or after January 1, 2023. Deferred tax related to assets and liabilities arising from a single transaction (Amendment to IAS 12 Income Taxes): The amendment establishes that the main change in deferred tax related to assets and liabilities arising from a single transaction (amendments to the IAS 12) is an exemption from initial recognition of the exemption provided for in IAS 12.15 (b) and IAS 12.24. Consequently, the initial recognition of the exemption does not apply to transactions in which equal amounts of deductible and taxable temporary differences arise on initial recognition. This is also explained in the newly inserted paragraph IAS 12.22A. The amendment will be effective for annual periods beginning on or after January 1, 2023.

28
Sale or Contributions of Assets between an Investor and its Associate or Joint Venture (Amendments to IFRS 10 and IAS 28): The amendments to IFRS 10 Consolidated Financial Statements and IAS 28 Investments in Associates and Joint Ventures (2011) address a recognized inconsistency between the requirements of IFRS 10 and those of IAS 28 (2011) in the treatment of the sale or contribution of assets between an investor and its associate or joint venture. The amendments, issued in September 2014, establish that when the transaction involves a business (whether it is in a subsidiary or not), all the profit or loss generated is recognized. A partial gain or loss is recognized when the transaction involves assets that do not constitute a business, even when the assets are in a subsidiary. The mandatory application date of these amendments is yet to be determined as the IASB is awaiting the results of its research project on accounting under the equity method. These amendments must be applied retrospectively, and early adoption is allowed, which must be disclosed. This modification does not have significant effects for the Company. Comparative Information (IFRS 17 and IFRS 9): The amendment addresses the transition requirements of IFRS 17 for entities that apply IFRS 17 and IFRS 9 for the first time at the same time. The amendment refers to financial assets for which comparative information is presented in the initial application of IFRS 17 and IFRS 9, but it has not been restated for IFRS 9. According to the amendment, an entity can present comparative information on a financial asset as if the classification and measurement requirements of IFRS 9 had previously been applied to that financial asset. The option is applied instrument by instrument. When applying the classification overlay to a financial asset, an entity is not required to apply the impairment requirements of IFRS 9. On the other hand, there are no changes in the transition requirements of IFRS 9. 3.3 Responsibility for the information and estimates made The information contained in the accompanying Consolidated Financial Statements is responsibility of the Company's Board of Directors which expressly indicates that it has fully implemented the principles and criteria contained in IFRS, as issued by the IASB. The preparation of the consolidated financial statements requires the use of judgments, estimates and assumptions that affect assets and liabilities at the reporting date, and income and expense amounts during the reporting period. These estimates are based on the best knowledge of Management on the reported amounts, events, and actions. In the preparation of these Consolidated Financial Statements, the following estimates have been used:
• Useful lives and residual values of property, plant and equipment, and intangible assets (see Note 3.1.f and 5.a).
• Valuation of assets to determine the existence of impairment losses (see Note 5.b)
• Assumptions used to calculate the fair value of financial instruments (see Note 3.1.h)
• Assumptions used in the actuarial calculation of liabilities and employee obligations (see Note 3.1.m)
• Probability of occurrence and the amount of undetermined or contingent liabilities (see Note 3.1.n)
• The tax returns of the Company and its subsidiaries, which will be submitted to relevant tax authorities in the future and which have been used as a basis for recording different income tax-related amounts in the accompanying consolidated financial statements (see Note 3.1.l).
• Financial assumptions and estimated economic life for calculating the provision for dismantling (see note 3.n.2)

29
• Measurement of the allowance for expected credit losses for trade receivables and contract assets (3.h.1.5).
Although such estimates have been made considering the best information available at the reporting date, it is possible that future events require changes (increases or decreases) in such estimates for subsequent periods; this would be applied prospectively at the date in which such change is acknowledged, recognizing the effects of changes in estimates in the subsequent consolidated financial statements, in conformity with IAS 8. 4. Risk management 4.1 Risk management policy The risk management policy is oriented to safeguard the Company's stability and sustainability principles, identifying and managing sources of uncertainty that affect or may affect the Company. A comprehensive risk management policy involves identifying, measuring, analyzing, mitigating, and controlling different risks of the Company's different management departments, as well as estimating the impact on the Company's consolidated position, and its follow-up and control over time. This process involves both the Company's Senior Management and the areas that take such risks. The acceptable risk limits, risk measurement metrics, and risk analysis periodicity are policies regulated by the Company's Board of Directors. The risk management function is the CEO´s responsibility as well as o each division and department of the Company and has the support of the Risk Management and the supervision, monitoring and coordination of the Risk and Sustainability Committee. 4.2 Risk factors The Company's activities are exposed to different risks, which have been classified as electric business risks and financial risks. 4.2.1 Electric business risks a. Hydrological risk To comply with its commitments in dry hydrologic conditions, Colbún must operate its combined thermal cycle plants or by default operate its back-up thermal plants or even buy energy on the spot market. This situation could raise Colbún’s costs, increasing earnings variability depending on the hydrological conditions. The Company's exposure to hydrological risk is reasonably mitigated by a commercial policy aimed at maintaining a balance between competitive power generation (hydraulic in an average-to-dry year, or cost-efficient coal- based or natural gas-based thermal power generation, other cost-efficient renewable energy properly supported by other power generation sources given their intermittence and volatility) and commercial commitments. Under extreme conditions and continuous droughts, a possible lack of water for cooling could affect the power- generating capacity of the combined cycles. For the purpose of minimizing the use of water and ensuring operational availability during water shortage periods, Colbún built a Reverse Osmosis Plant in 2017, which allows reducing up to 50% the water used in the cooling process of combined cycles of the Nehuenco Complex. In Peru, Colbún owns combined cycle power plant and has a commercial policy oriented towards committing such energy base on short and long-term contracts. Exposure to dry hydrology is limited, as it would have an impact only in case of eventual operational failures which would force the Company to resort to the spot market. In addition, the Peruvian power business has an efficient thermal power offering and availability of natural gas sufficient to cover such risk.
30
b. Fuel price risk In Chile, in situatuons of low water availability in its hydraulic plants, Colbún mainly uses its thermal plants and purchases energy in the spot market at marginal cost. The aforementioned generates a risk due to possible fluctuations in the international fuel prices. Part of this risk is mitigated through contracts with sale prices indexed to fuel price fluctuations. In addition, the Company performs hedging programs with different derivative instruments, such as call and put options, among others. On the contrary, in case of water surplus, the Company may be in a selling position in the spot market, whose price would be, in part, determined by fuel prices. In Peru, the cost of natural gas has a lower dependence to international prices, given the significant domestic natural gas production, which allows it to limit exposure to this risk. As in Chile, the remaining portion exposed to international price fluctuations is mitigated through indexation formulas in its energy sales contracts. Accordingly, exposure to risk related to fuel prices fluctuations is partly mitigated. c. Fuel supply risk The Company entered into a contract with Enap Refinerías S.A. ("ERSA"), which includes a reserved regassification capacity and supply for 13 years which became effective on January 1, 2018. This agreement allows the Company to have natural gas to operate two combined cycle units during a large part of the first semester which is the period of the year in which the availability of water resources is lower. Colbún has also the possibility to access to additional natural gas through spot purchases allowing to have an efficient support under adverse hydrological conditions during the second half of the year. In addition, gas supply contracts have been entered with Argentine producers (Pampa, PAE and Total), to complement the gas supply of LNG. Considering these new contracts, Colbún has agreements to import from Argentina totaling 2,500,000 m3 of gas per day, for the following months (January - April 2022). On its part, in Peru, Fenix has long-term contracts with the ECL88 Consortium (Pluspetrol, Pluspetrol Camisea, Hunt, SK, Sonatrach, Tecpetrol and Repsol) and gas transportation agreements with TGP. With respect to purchases of coal for Santa María thermal power plant, the Company conducts tender processes (the most recent conducted in March 2021), inviting significant international suppliers and awarding such supply to competitive, financially stable companies. This is performed in accordance with an early purchase policy and an inventory management policy to substantially mitigate the risk of fuel unavailability. d. Equipment malfunction and maintenance risk The availability and reliability of the Company's power-generating units and transmission facilities are critical to the business. Accordingly, Colbún holds a policy of conducting regular maintenance, preventive and predictive maintenance to its equipment, based on its suppliers' recommendations, and has a hedge policy for this type of risk through insurances for its physical assets, including coverage for physical damages and damages due to stoppages. e. Project construction risk The development of new generation and transmission projects may be affected by factors such as: delays in obtaining permits, regulatory framework changes, litigation, increase in equipment and labor prices, opposition from local and international stakeholders, adverse geographical conditions, natural disasters, accidents and other unforeseen events. The Company's exposure to these risks is managed through a commercial policy that considers the effects of possible delays in projects. In addition, the Company includes certain flexibility to term estimates and construction costs. Additionally, the Company's exposure to these risks is partially mitigated through subscribing "All Construction Risk" insurance policies which cover both physical damages and profit losses due to a delay in service resulting from a casualty, both with standard deductibles for this type of insurance.

31
The companies in the industry face a very challenging power market, with considerable involvement from different interest groups, mainly neighboring communities and NGOs, which legitimately demand more participation and spotlight. As part of this complex scenario, environmental processing deadlines have become uncertain, which are usually followed by extensive judicial processes. The above has resulted in a decrease in construction of projects of relevant sizes. Colbún has a policy which calls for integrating social and environmental considerations to the development of its projects. In addition, the Company has developed a social bonding model which allows it to work jointly with neighboring communities and society in general, starting with a transparent citizen participation and trust- building process in the early stages of projects, and throughout their life cycle. f. Regulatory risks Regulatory stability is essential for the energy sector where investment projects require significant terms to obtain permits, investment development, performance and return. Colbún believes regulatory changes must be made considering the complexities of the energy system and maintaining adequate incentives for investments. It is important that the regulations provide clear and transparent rules, which consolidate the trust of the sector's agents. Chile In the context of the constitutional process originated from the commitment called "Agreement for Peace and the New Constitution" (“Acuerdo por la Paz y la Nueva Constitución”), and the subsequent approval by plebiscite of a new Constitution, on May 15 and 16, 2021, the election of the 155 constituents in charge of its drafting. On October 7, 2021, the Constitutional Convention approved the regulations to begin the work of preparing a new Constitution. The Constitutional Convention must draft and approve a text proposal for a new Constitution within a maximum period of nine months, counted from its installation (July 4, 2021), a period that can be extended for three additional months, but only once. The constitutional process may result in changes to the institutional framework applicable to business activity in the country. In the framework of the health crisis affecting the country, on January 5, 2021, Law No. 21,301 was enacted, which extending the effects of Law No. 21,249, which provides for exceptional measures in favor of the end users of health services, electricity and gas network that establishes the prohibition of the cut for non-payment of basic services and allows prorating bad debts. Later, through extensions, this initiative extends the term of benefits to end users (non-cut of supply due to late payment and the accumulation of debts with distribution companies) until December 31, 2021. This rule also increases the maximum number of installments in which the debt payment can be prorated from 36 to 48 installments and expands the universe of beneficiaries to 80% vulnerability according to the Social Registry of Households. In response to the debt problem that has been accumulating among users of basic services, are currently being processed in the Senate two bills related to the Basic Services Law were entered:
i. On August 19, 2021, a bill was entered that establishes a third extension of the Basic Services Law, the purpose of which is to extend the term until December 31, 2022 to prevent cuts and expand the coverage of the population protected to 100% vulnerability. This initiative was approved by the Chamber of Deputies and sent to the Senate.
ii. On January 4, 2022, the Executive submitted a bill to the Senate that regulates the apportionment and payment of debts for basic services and establishes subsidies for vulnerable customers, the latter defined in the electricity sector as those who registered an average consumption during the year 2021 of up to 250 kWh/month. The initiative extends the term to receive the benefits of the Basic Services Law until March 31, 2022 and regulates the debt contracted between March 18, 2020 and December 31, 2021 by users benefited by said Law, for which it establishes an additional benefit for vulnerable clients that consists of an automatic proration in 48 months of the contracted debt. These monthly installments may not exceed 15% of the client's average account and will be covered by a state subsidy. The balance not covered during the period is extinguished. In this initiative, there is no warning of a burden on generating companies. This bill was reviewed and approved by the Senate's

32
Finance and Economy Committees, so it is expected to be voted on in the Chamber before being dispatched to the Chamber of Deputies.
Additionally, the Chamber of Deputies sent the Senate to its second constitutional process the Bill that seeks to advance the decommissioning of coal-fired plants. This bill, initiated by a parliamentary motion, seeks to prohibit the installation and operation of coal-fired thermoelectric generation plants throughout the national territory as of January 1, 2026. Currently, this bill is being reviewed by the Mining and Energy Senate Committee, which has received various guests to present their appreciations. It is important to remember that in 2019 the generators signed a voluntary agreement with the government, by which they committed not to build new coal-fired plants and agreed to the progressive closure of the coal-fired plants until 2040 along with reviews every 5 years in conjunction with the regulator. In relation to this discussion, a bill that prohibits injecting energy from fossil sources into the System as of January 1, 2030, recently entered the Senate for processing via motion. This initiative was approved by the Mining and Energy Commission of the Senate to be reviewed and voted on in Chamber. Also, a parliamentary motion that regulates the construction, installation and operation, its environmental impact and the control of Wind Turbine Complexes continues to be processed in the Chamber of Deputies. The Bill, which establishes requirements in the design of projects, defines compensation for neighboring communities and includes an amendment to the law on general environmental bases, has no urgency and is under review by the Commission of Environment. Later, it will reviewed by the Chamber's Mining and Energy Commission. So far, there have been no major advances in this discussion. Futhermore, it should be noted that the legislative agenda will be altered by the parliamentary recess during February and, later, by the installation in March of the government of the new President Elect. However, the recent entry by the Executive of 3 bills related to the promotion of storage systems and electromobility, the promotion of renewable energies and the impulse for the creation of a green hydrogen market in Chile stands out. These bills entered the Chamber of Deputies last December, they will be reviewed by the M&E Commission and by the Chamber's Finance Commission. However, it is highly likely that its processing will extend to the next parliamentary term. On the other hand, the outgoing Government will transfer to the next administration other proposal regulatory changes that, depending on the way they are implemented, could represent opportunities or risks for the Company:
i. The “Modernization of the Distribution Segment" which aims to update the regulation of the
distribution sector to better address the technological and market advances that have taken place and that are foreseen for the future, promote investment and improve the quality of service to end users. In the context of modernization and comprehensive reform, the Executive submitted to the Chamber of Deputies' Mining and Energy Commission a bill that establishes the right to electricity portability, creating the figure of the marketer as a new market agent, in addition to considering the modernization of the supply bidding mechanism and the introduction of the role of the information manager to reduce information asymmetries and protect customers' consumption data.
This bill corresponds to the first of three initiatives in which the Executive sub-divided the Long Distribution Law. The other two bills that have not yet been introduced in Congress are: a) Quality of Service, which seeks to improve the efficient pricing scheme, define a long-term strategic
quality of service plan and establish compensation in favor of clients for excessive time interruptions b) Distributed Generation, the purpose of which is to promote distributed generation, define new actors
and enable pilot projects with a coordinated expansion of the distribution and transmission networks.
ii. The “Flexibility Strategy”, which has the objective of addressing the systemic and market consequences that will arise as a result of the increasing incorporation of renewable energy from variable sources. The Strategy defined by the Ministry of Energy considers three axes or pillars: (a) Market design for the development of a Flexible System, (b) Regulatory framework for Storage Systems, and (c) Flexible operation of the System. Within the framework of this Strategy, normative

33
modifications are being developed at the regulatory and technical standards level, among which stands out the process of elaboration of a new Power Transfer Regulation that seeks to improve the mechanism for remuneration of sufficiency and introduce long-term market signals that encourage investment in technologies that provide flexibility to the electrical system. In the context of the Flexibility Strategy, in particular with regard to the measures related to the improvement of the adequacy remuneration mechanism and the introduction of long-term market signals that encourage investment in technologies that provide flexibility to the electricity system. The final proposal for this new regulation considers modifications such as the redefinition of peak hours of the system, the use of a probabilistic methodology for the recognition of power, the incorporation of a cost-efficiency signal within the recognition of power, the modification of the theoretical power reserve margin, a transitory regime for its application, among others. In accordance with the Ministry's schedule and based on the Public Consultation performed, a final version of the new regulation should be released coming soon to be submitted to the Controller's Office for the record.
In August 2021, a "Preventive" Rationing Decree (DS No. 51/2021) was published by the Ministry of Energy that establishes a series of preventive measures to avoid electricity rationing, which will be in force until March 31, 2022, in order to "avoid, manage, reduce or overcome generation deficits that may occur in the National Electric System, thereby preserving safety." This Decree considered initiatives applicable to generation, transmission and distribution, in addition to other actions applicable to demand. The main measures include: the acceleration of the connection of advanced projects, the acceleration of the connection of small distributed generation facilities ("PMGD") and self-dispatch of small-scale generation facilities, the use of stored energy, the definition of the hydrological condition to be used in the programming of the operation by the Coordinator, the optimization of the maintenance of generating units, the registration of additional generation capacity, maximizing the availability of infrastructure for LNG, the monitoring of unavailability of fuels, the special treatment of transmission facilities, relaxation of service quality standards (voltage) in distribution systems, etc. In addition, the Decree authorizes generation and distribution companies to adopt measures such as promoting reductions in electricity consumption, agreeing with their customers to reduce consumption, suspend supply, in the cases indicated in the Decree. Finally, a procedure is established for deficit management and compensation payments, in addition to considerations on quality and continuity of supply and rationing conditions. In this context, the Ministry of Energy is preparing to send a modification to the "Preventive" Rationing Decree to extend its validity period until September 30, 2022 and establish new measures that seek to implement a new acquisition scheme and special remuneration for the purchase of safety diesel, to ensure supply and reduce generation risk. In this scheme, it is considered that the exceptional requirements that are established will be remunerated in proportion to the withdrawals made by the generators in the system. Additionally, the new Decree establishes new rules for the recognition of power of thermoelectric plants that use diesel fuel and natural gas for their operation.
Peru
On May 4, 2021, a resolution was published that modifies the COES Technical Procedure "Calculation of Variable Costs of Generation Units", establishing a change in the methodology for calculating Marginal Costs in the short-term market. The regulator (OSINERGMIN) established that all the costs of the supply chain be used to determine the variable costs of gas, that is, cost of gas supply, transportation and distribution, a scheme that became fully effective as of July 1, 2021. On the other hand, on May 19, 2021, Supreme Decree No. 012-2021-EM was published in the Official Gazette El Peruano, which (i) approves the Regulations to optimize the use of Natural Gas and creates the Gas Manager; and (ii) modifies and incorporates new provisions to the Regulation of the Natural Gas Secondary Market, approved by Supreme Decree No. 046-2010-EM. However, to start the operation of the Natural Gas Secondary Market requires the issuance of operating procedures by the Ministry of Energy and Mines. In this context, on September 21, 2021, Directorial Resolution N ° 368-2021-MINEM / DGH was published in the Official Gazette El Peruano, which provides for the publication of the project of the “Operational Procedure of the electronic market for transfer auctions of supply volume and / or natural gas transportation capacity (MECAP)” and its Legal Technical Report, for the issuance of comments by the interested parties.

34
Finally, on December 18, the Resolution of the Board of Directors No. 244-2021-OS/CD was published in the Official Gazette El Peruano, which modified the Technical Procedure of the COES No. 07 "Determination of Short-Term Marginal Costs" (PR-07) (Res. No. 244-2021-OS/CD). The modifications will come into force from July 1, 2022.
g. Risk of variation in demand/supply and sales price of electricity The projection of future power demand is very relevant information for determining the market price. In Chile, a low demand growth, as well as a decrease in fuel prices and an increase in solar and wind renewable energy projects, resulted in a decrease in the short-term price of power (marginal cost) during the last years. Regarding long-term prices, the bidding processes for the supply of regulated customers finished in August 2016, October 2017 and August 2021 resulted in an important decrease in prices offered and granted, which reflects the greater competitive dynamics present in this market, and the impact of the introduction of new technologies - mainly solar and wind power- with a significant decrease in costs as a result of their widespread growth. Although the Company expects that these factors triggering such competitive dynamics and price trends will remain in the future, it is difficult to determine their precise impact on the long-term power prices. In addition, and because of the difference in power prices between regulated and unregulated customers, certain customers have adopted the unregulated customer regime. The above may occur given the option included in power laws which allow customers with power connections between 500 kW and 5,000 kW to be categorized as regulated or unregulated customers. Colbún has one of the most efficient power generation plants in Chile, and therefore it has the capacity of offering competitive conditions to these customers. In Peru, there is also a temporary imbalance between supply and demand, mainly generated from the increase in efficient supply (hydroelectric and natural gas plants). The growth in renewable energy from variable sources in the Chilean market (and potentially in Peru) such as solar and wind power generation, may generate integration costs, and therefore may affect the operating conditions of the remaining portion of the power system, particularly in the absence of a complementary services market which adequately remunerates the services required to manage the variability of such power generation sources. Regarding the impact of COVID19 on energy demand, there is still uncertainty about how and for how long this contingency will extend. Energy demand in Chile has grown about 5.5% during 4Q21 compared to 3Q20, while Peru has experienced an increase of approximately 3.0% compared to 2Q20. Additionally, there is a complex world economic outlook, which may lead to a contraction of the economies in Chile and Peru, which will surely have effects on future electricity demand. 4.2.2 Financial risks Financial risks are related to the Company's inability to perform transactions or comply with obligations from its operations due to lack of funding, changes in interest rates, exchange rates, bankruptcy of related parties, or other financial variables of the market that may materially affect Colbún. a. Exchange rate risk Exchange rate risk relates mainly to fluctuations in currency coming from two sources. The first source of exposure is cash flows related to investment revenues, costs and expenses denominated in foreign currencies other than the functional currency (United States dollars). The second source of exposure relates to the accounting mismatch between assets and liabilities in the Statement of Financial Position denominated in a currency other than the functional currency.

35
The exposure to cash flows in currencies other than the U.S. dollar is limited, as practically all the Company's sales are denominated directly or adjusted to the U.S. dollar. Likewise, its main costs relate to purchases of natural gas and coal, which incorporate pricing formulas based on international prices denominated in U.S. dollars. With respect to disbursements related to investment projects, the Company incorporates inflation-adjusted rates in its contracts with suppliers, and resorts to the use of derivatives to determine cash outflows in currencies other than the U.S. dollar. The accounting mismatch exposure is mitigated by applying a policy of maximum mismatch between assets and liabilities for structural items denominated in currencies other than U.S. dollar. Accordingly, Colbún maintains a relevant share of its cash surpluses in U.S. dollars and occasionally resorts to the use of derivatives, mainly currency swaps and forwards.
b. Interest rate risk Is related to changes in interest rates affecting the value of future cash flows based on variable interest rates, and variances in the fair value of assets and liabilities based on fixed interest rates that are accounted for at fair value. To mitigate such risk, the Company uses fixed interest rate swaps. As of December 31, 2021, the Company's financial debt is 100% denominated in fixed rate. c. Credit risk The Company's exposure to this risk is derived from the possibility that a counterparty fails to comply with its contractual obligations and generates financial or economic losses. Historically, all counterparties Colbún has engaged with to render energy services have complied with their payments. Colbún has recently expanded its presence in the medium and small unregulated customer segment, for which it has implemented new procedures and controls related to the risk assessment of these type of customers and a follow-up of their collection. Allowance for doubtful accounts calculations are performed on a quarterly basis based on the risk analysis of each customer considering, among other factors, its credit rating, payment behavior and industry. With respect to placements in cash and derivatives, Colbún performs transactions with high credit rated entities. In addition, the Company has established interest limits by counterparty, which are regularly approved by the Board of Directors and periodically reviewed. As of December 31, 2021, the Company invests its cash surpluses in interest-bearing current account, mutual funds (of bank subsidiaries) and in time deposits in local and foreign banks. The former are short-term mutual fund deposits, at 90 days and known as "money market". Information on customer's credit ratings is disclosed in note 12.b to these Consolidated Financial Statements. d. Liquidity risk Such risk is derived from several fund needs to address investment commitments and business expenses, debt maturities, among others. The required funds to meet such outflows are obtained from Colbún's own revenue and by engaging credit revolving facilities to ensure sufficient funds will be available to support expected needs for a period. As of December 31, 2021, Colbún has cash surpluses of approximately US$1.419 million, invested in interest-bearing checking accounts, time deposits and Mutual funds with an average duration of 80 days and fixed-income investments with a term of 2 to 3 years that are estimated to be held until maturity. Time deposits with a

36
duration of less than and greater than 90 days, where the latter are recorded as "Other financial assets, current" in the Consolidated Financial Statements). Likewise, to date, the Company has the following additional sources of liquidity available: (i) three line of bonds registered with the local market, two for UF 7 million as a whole and one for UF 7 million, and (ii) uncommitted credit revolving facilities for approximately US$150 million. For its part, Fenix Power has uncommitted lines for a total of US $25 million, contracted with three local banks. Within the next twelve months, the Company will have to disburse approximately US$100 million associated with interests on financial debt and debt repayments (excluding all local bonds, which were prepaid on January 24, 2022). The payment of interests and repayments are expected to be covered by the Company's internally generated cash flows. As of December 31, 2021, Colbún has the following local risk ratings: AA by Fitch Ratings and Feller Rate, with stable outlook. At international level, the Company's ratings are Baa2 by Moody’s, BBB by S&P and BBB+ by Fitch Ratings, all with stable outlooks. As of December 31, 2021, Fenix Power risk ratings are BBB- by S&P and by Fitch Ratings, all with stable outlooks. Considering the foregoing, it is assessed that the Company’s liquidity risk is currently limited. Information on contractual maturities of the main financial liabilities is disclosed in Note 24.c.2 of the Financial Statements. 4.3 Risk measurement The Company regularly analyzes and measures its exposure to several risk variables. Risk management is performed by a Risk Committee, supported by the Corporate Risk Management and coordinated with the other divisions of the Company. With respect to business risks, specifically those related to variances in commodity prices, Colbún has implemented mitigating actions consisting of index-adjustments in energy sales contracts and hedges through derivative instruments to hedge any possible remaining exposure. Because of this reason, the Company performs no sensitivity analysis. The Company has insurance policies in force to cover damages to its physical assets, disruptions and loss of profits due to delays in the commencement of a project to mitigate the risk of equipment failure or project development. Such risk is currently considered to be reasonably controlled. For measuring the financial risk exposure, Colbún performs a sensitivity analysis and value at risk analysis to monitor possible losses assumed by the Company in the event such exposure exists. Foreign currency exchange risk is considered low because the Company's main cash flows (project revenue, costs and expenditures) are directly denominated in, or adjusted to, U.S. dollars. The accounting mismatch exposure is mitigated by applying a policy of maximum mismatch between assets and liabilities for structural items in the Balance Sheet denominated in currencies other than U.S. dollar. As of December 31, 2021, the Company's exposure to this risk relates to a potential impact of approximately US$4.7 million for quarterly foreign currency exchange differences, based on a sensitivity analysis with a 95% reliance. There is no interest rate variance risk because 100% of the financial debt is assumed to be at a fixed rate. The credit risk is low because Colbún operates solely with domestic and foreign bank counterparties with high credit rating and has established the maximum exposure policies for each counterparty, which limit the specific concentration with such institutions. For banks, the local institutions have risk ratings equal to or of more than BBB and foreign entities have investment grade international risk ratings.

37
At the closing date, the financial institution which accounts for the highest share of cash surpluses has 25%. For existing derivatives, the Company's foreign counterparties have risk ratings equivalent to BBB+ or higher and domestic counterparties have local ratings of BBB+ or higher. It should be noted that in derivatives, the counterparty that concentrates the largest share in notional terms reaches 51%. Liquidity risk is low by virtue of the Company's significant cash position, the amount of financial obligations for the following twelve months and access to additional sources of financing. 5. Critical Accounting policies Management necessarily makes judgments and estimates that have a significant effect on the amounts recorded in the Consolidated Financial Statements. Changes in the assumptions and estimates could have a significant impact on the financial statements. The key estimations and judgments used by Management for the preparation of these consolidated financial statements are detailed below. a. Calculation of depreciation and amortization, and estimation of the related useful lives Property, plant and equipment, and intangible assets other than goodwill with finite useful lives, are depreciated and amortized on a straight-line basis over the estimated useful lives of the assets. Useful lives have been estimated and determined considering technical aspects, their nature and status. Estimated useful lives as of December 31, 2021 are as follows: (i) Useful lives of property, plant and equipment: The detail of the useful lives of the main items of Property, plant and equipment is as follows:
Additional detail per class of plants is presented below
Buildings 10 - 65 31
Machinery 4 - 20 10
Transport equipment 5 - 15 6
Office equipment 5 - 12 8
IT equipment 3 - 10 6
Power-generating asset 2 - 100 42
Transmission line operation and maintenance 20 12
Right-of-use assets 2 - 14 11
Other property, plant and equipment 10 - 43 24
Average remaining
useful life (years) Useful life (years) Classes of property, plant and equipment

38
(ii) Useful lives of intangible assets other than goodwill (with finite useful lives): Intangible assets from contracts with customers are mainly acquired contracts for energy supply. Other material intangible assets refer to software, rights, concessions and other easements with finite useful lives. These assets are amortized in accordance with their expected useful lives.
At the closing date of each period, the Company assesses whether there is any indicator of impairment of assets. If any such indication exists, then the asset's recoverable amount is estimated to determine the impairment amount. (iii) Intangible assets with indefinite useful lives: The Company analyzed the useful lives of intangible assets, with indefinite useful lives (e.g., certain right-of- way easements or water rights, among others), and concluded there is no foreseeable time limit in which the asset would generate net cash inflows. For these intangible assets, the Company determined that their useful lives are indefinite. b. Impairment of non-financial assets (tangible and intangible assets other than goodwill, excluding goodwill) At the closing date of each year, or at any date as deemed necessary, the value of assets is assessed to determine whether there is any indication of impairment. If any such indication exists, then the asset’s recoverable amount is estimated to determine the amount of any impairment. For identifiable assets that do not generate cash flows independently, the recovery of the cash-generating unit (CGU) of the asset is estimated. Accordingly, it has been determined that assets located in Chile represent two CGUs, the Generation and Transmission business, whereas all assets located in Peru represent another CGU. For CGUs that have required possible impairment losses analysis, future cash flows are based on the updated Strategic Plan approved by Colbún, as applicable, for most recent long-term budgets or estimates approved, considering the regulation and expectations for market development per the available sector forecasts and the historical experience on price evolution and volumes produced. Likewise, to estimate future cash flows in the calculation of residual values, the Company uses and compares different valuation techniques, including all maintenance investments, and, if applicable, renewal investments required to maintain the CGU production capacity. Parameters considered by the Company to determine growth rates, which represent each business long-term growth, are adjusted per the long-term growth in Chile. Additionally, parameters considered for the calculation of discount rates before taxes are determined based on historical and updated market information and considering indebtedness level and capital structure assumptions consistent with the market context and the Company's financing policy. For CGUs assigned to intangible assets with an indefinite useful life, the recoverability analysis is conducted systematically at each reporting date, or at any date deemed necessary, except if considered that the most recent calculations of a CGU's recoverable amount from the prior period may be used for verifying the amount of the impairment of such unit in the current period, as it complies with the following criteria:
a) Assets and liabilities comprising such unit have not significantly changed since the latest recoverable amount calculation.
Customer contractual relationships 2 - 15 10
Software 1 - 15 6
Intangible assets Useful life (years)Average remaining
useful life (years)

39
b) The latest recoverable amount calculation resulted in an amount that significantly exceeded the unit's carrying amount; and
c) Based on an analysis performed on the events and circumstances that had changed since the latest recoverable amount was calculated, it is unlikely that the current recoverable amount determination will be less than the unit's current carrying amount.
The recoverable amount of an asset is the higher of its fair value less costs to sell and its value in use, which comprises the current value of future estimated cash flows generated by the asset or a CGU. For calculating the tangible or intangible asset recoverable amount, the Company uses the value in use criterion. To estimate the value in use, the Company prepares its estimate of future pre-tax cash flows based on the most recent budgets approved by Management. These budgets include the best estimates available on the income and costs of the cash-generating units, using the best available information, such as experience and future expectations. Such cash flows are discounted to calculate their current amount at a pre-tax rate which considers the capital cost of the business in which it operates. Their calculation considers the current cost of money and risk premiums generally used for business purposes. In the event the recoverable amount is less than the asset's carrying amount, the related allowance for impairment losses is recognized as "Other Gains (losses)" in the Statement of Comprehensive Income. Impairment losses recognized in an asset in prior years will be reversed if there has been a change in the estimations on their recoverable amount increasing the value of the asset with a credit to profit or loss with the limit of the carrying amount that the asset would have had no unwinding been conducted. As of December 31, 2020, the Company carried out an impairment assessment in the Peru CGU and recorded an impairment provision in the subsidiary Fenix Power S.A in Peru for a gross amount (before deferred taxes) of ThUS$ 179,615. The foregoing, to reflect the lower recoverable amount compare to the carrying amount of the assets as a result of the lower marginal costs and energy prices observed during the last years as a consequence of lower than expected growth rates as a result of a lower dynamism of economic activity , delays in the regulatory matters processing and exogenous events (political, natural disasters). This condition intensified during 2020 as a result of the COVID-19 impact, and a 7% decrease was recorded in energy demand compared to 2019. This has deepened a situation of oversupply in the Peruvian market of electricity generation, negatively impacting the level of energy prices in that market and it is likely that the reestablishment of the balance between supply and demand will take more time than previously considered. c. Fair value of derivatives and other financial instruments As described in Note 3.1, Management uses its criteria to select an appropriate valuation technique for financial instruments that are not quoted in an active market. The Company applies valuation techniques commonly used by market professionals. For derivative financial instruments, Management makes assumptions based on rates quoted in the market and adjusted according to the instrument specific characteristics. Other financial instruments are valued using a cash flow update analysis based on supported assumptions, and on market prices or rates, if possible. 6. Non-current assets clasified as held for sale On March 30, 2021, Colbún S.A., together with its subsidiary Colbún Desarrollo SpA, entered into with Alfa Desarrollo SpA, 80% controlled by APG Energy and Infra Investments, S.L. (part of APG, Dutch pension fund) and 20% by Celeo Redes, S.L.U. (subsidiary of Celeo, Concesiones e Inversiones S.L.), a Purchase Price Agreement for the transfer to the last one, all the shares of the company Colbún Transmission S.A. (the “Transaction"). The closing of the Transaction and the transfer of the shares of Colbún Transmission S.A. was subject to certain usual conditions for this type of operations, including the approval that the National Economic Prosecutor's Office must grant in accordance with the provisions of D.L. 211 of 1973.

40
The company Colbún Transmission S.A. operates and owns of 899 kilometers of transmission lines and 27 electrical substations, divided into 37% of “national” assets, 8% of “zonal” and 55% of “dedicated” in the National Electric System (SEN). On August 3, 2021, the National Economic Prosecutor's Office granted the necessary approval to materialize the transaction, which was carried out on September 30, 2021, in compliance with the clauses of the Purchase Agreement. The transaction price amounted to approximately US $ 1,185 million, with which the effect on income before taxes amounted to approximately US $ 830 million.
7. Goodwill On September 3, 2020, Colbún S.A. acquired 100% of the voting shares of Efizity Ingeniería SpA ("Efizity"), a company organized under Chilean law. Efizity is a company whose business is the provision of value-added services complementary to the energy supply in any form, including the design and implementation of energy efficiency solutions, carrying out installations and land works for monitoring and control of electrical installations. In accordance with IFRS 3, the measurement period is the period after the acquisition date during which the acquirer can adjust the provisional amounts recognized in a business combination. This period shall not exceed one year from the date of acquisition. The fair values of Efizity's identifiable assets acquired and assumed liabilities, at the acquisition date, were ThUS$243, generating a goodwill of ThUS $ 5,573. 8. Segment reporting
Colbún's main line of business is the power generation and sale. Accordingly, the Company has assets that generate such power, which is sold to several customers under power purchase agreements and others without contracts in accordance with the regulations in force. Additionally, the Company had, until the sale of Colbún Transmisión S.A., transmission lines and substations through which it traded transport and power transformation capacity in the Chilean National Electric System (SEN). Colbún's management control system analyzes generation business from the perspective of a mix of hydraulic/thermal assets that produce power to serve a customer portfolio and assesses the transmission business distinguishing three types of transmission lines operated by the Company: national, zonal and dedicated. Consequently, resource allocation and performance measures are analyzed separately per each business. Certain classification criteria are, for example, the type of asset: generation or transmission; production technology: hydroelectric power plants (which can be run-of-the-river or dam-based) and thermal power plants (which can be coal-based, combined cycle, open-cycle, etc.). Customers are classified in accordance with the concepts included in the Chilean electric regulation for unregulated and regulated customers and spot market; and in accordance with electric regulations currently in force in Peru for regulated and unregulated customers (see note 2). In general, there is no direct relation between each power generation company and the supply agreements, but these are established according to Colbún's total capacity, fully supplying them at any moment with the most efficient generation on its own or on behalf of third parties purchasing energy in the spot market from other power generation companies. An exception is Codelco in Chile, which has entered into two power purchase agreements with the Company. One of these agreements is covered by the full power generation fleet and the other has its preferential supply from the generation of Santa María power plant.

41
Colbún is part of the SEN dispatch system in Chile and SEIN dispatch system in Peru. The generation of each of power plants within the systems are defined by its dispatch order, in accordance with the definition of economic optimum for both systems. The electricity regulation for the power generation business for both systems in which Colbún is involved, contemplates a conceptual division of power and capacity, not for being two different physical elements, but for economically efficient pricing. This is the reason for distinguishing energy priced in monetary units for energy unit (KWh, MWh, etc.) and capacity priced in monetary units for capacity unit – time unit (KW-month). The electricity regulation for the transmission business establishes a functional definition and differentiates remuneration between the transmission systems, both for the regulated segment (National System, Zonal and Development Hubs), and the Dedicated system segment, in which is possible to enter into contracts with unregulated customers and power generators. As Colbún operates in two different businesses: generation, in which it is also involved in two electric systems, the National Electric System in Chile and the National Interconnected Electric System in Peru; and transmission, for the purpose of applying IFRS 8, information by segments has been organized in accordance with the generation segment, differentiated by geographical distribution by country, and the transmission segment. Operating segments: Power generation and sales (Chile and Peru) and transmission are reviewed on a regular basis and differentiated by the highest authority responsible for making decisions at the Company (Board of Directors and Senior Management). The Transmission segment is a new operating segment since 2019. The decision to provide more focus on this segment was made after the reorganization of these type of assets within Colbún, in which all of the Transmission Assets were transferred to Colbún Transmisión S.A. At that time the Company decided to start monitoring the transmission business separately from the generation business, including a specific section in our Managerial Internal Reports and also providing more information to Colbún’s investors and the financial markets in general. Before 2019, the majority of the transmission assets were part of Colbún’s Balance Sheet and therefore reported consolidated as part of the Generation Business.

42
The table below presents information by operating segment:
(*) The company Colbún Transmission S.A. was disposed on September 30, 2021 as indicated in Note 6.
Segment operating results as of 12.31.2021Chile
Generation
Chile
Transmission
(*)
Peru
Generation
Operating
segments
Elimination of
intersegment
revenue
Total operating
segments
Revenue
Revenue 1,231,576 19,383 171,821 1,422,780 16,964 1,439,744
Revenue from transactions with other operating segments 5,648 26,364 - 32,012 (32,012) -
Total revenue from third parties and transactions with other operating segments 1,237,224 45,747 171,821 1,454,792 (15,048) 1,439,744
Raw materials and consumables (716,583) (8,930) (88,472) (813,985) 32,012 (781,973)
Employee benefit expenses (73,289) - (6,383) (79,672) - (79,672)
Interest expenses (60,563) (301) (25,483) (86,347) - (86,347)
Interest income 4,775 7 186 4,968 - 4,968
Depreciation and amortization expenses (174,948) (8,718) (35,448) (219,114) 5,951 (213,163)
Share of profit or loss of equity-accounted associates and joint ventures 21,014 - - 21,014 (14,317) 6,697
Income tax expense from continuing operations (262,815) (7,252) (14,925) (284,992) - (284,992)
Profit (loss) before taxes 808,005 26,783 4,701 839,489 (14,317) 825,172
Profit (loss) from continuing operations 545,190 19,531 (10,224) 554,497 (14,317) 540,180
Profit (loss) 545,190 19,531 (10,224) 554,497 (14,317) 540,180
Assets 6,022,948 - 704,694 6,727,642 (125,134) 6,602,508
Equity-accounted investees 139,329 - - 139,329 (125,134) 14,195
Incorporation of non-current assets other than financial instruments, deferred tax assets, assets
related to defined benefit plans and rights arising from insurance contracts 269,914 - 6,595 276,509 - 276,509
Liabilities 3,301,748 - 459,334 3,761,082 - 3,761,082
Equity 2,841,426
Liabilities and equity 6,602,508
Impairment losses recognized in profit or loss for the year (144,190) - - (144,190) - (144,190)
Cash flows from (used in) operating activities 301,417 58,319 65,569 425,305 (90,887) 334,418
Cash flows from (used in) investing activities 654,962 (27,190) (12,259) 615,513 - 615,513
Cash flows from (used in) financing activities (797,436) (37,966) (55,677) (891,079) 90,887 (800,192)

43
Continued
Segment operating results as of 12.31.2020Chile
Generation
Chile
Transmission
Peru
Generation
Operating
segments
Elimination of
intersegment
revenue
Total operating
segments
Revenue
Revenue 1,134,028 51,400 159,440 1,344,868 4,000 1,348,868
Revenue from transactions with other operating segments 250 28,818 - 29,068 (29,068) -
Total revenue from third parties and transactions with other operating segments 1,134,278 80,218 159,440 1,373,936 (25,068) 1,348,868
Raw materials and consumables (502,075) (12,283) (86,506) (600,864) 25,068 (575,796)
Employee benefit expenses (59,295) - (6,062) (65,357) - (65,357)
Interest expenses (63,507) (110) (26,842) (90,459) - (90,459)
Interest income 10,431 94 717 11,242 - 11,242
Depreciation and amortization expenses (188,996) (11,047) (46,572) (246,615) - (246,615)
Share of profit or loss of equity-accounted associates and joint ventures 128,171 - - 128,171 (118,221) 9,950
Income tax expense from continuing operations (70,621) (15,519) 43,389 (42,751) - (42,751)
Profit (loss) before taxes 386,039 57,426 (193,025) 250,440 (118,221) 132,219
Profit (loss) from continuing operations 315,418 41,907 (149,636) 207,689 (118,221) 89,468
Profit (loss) 315,418 41,907 (149,636) 207,689 (118,221) 89,468
Assets 5,907,891 417,727 757,215 7,082,833 (448,966) 6,633,867
Equity-accounted investees 475,815 - - 475,815 (448,966) 26,849
Incorporation of non-current assets other than financial instruments, deferred tax assets, assets
related to defined benefit plans and rights arising from insurance contracts 23,577 12,633 28,562 64,772 - 64,772
Liabilities 2,452,878 94,005 501,616 3,048,499 - 3,048,499
Equity 3,585,368
Liabilities and equity 6,633,867
Impairment losses recognized in profit or loss for the year (4,517) - (179,615) (184,132) - (184,132)
Cash flows from (used in) operating activities 422,775 39,347 63,502 525,624 - 525,624
Cash flows from (used in) investing activities (318,587) (11,994) (30,013) (360,594) - (360,594)
Cash flows from (used in) financing activities (184,778) (36,290) (25,293) (246,361) - (246,361)

44
Information about products and services
Information on sales to main customers
2021 2020
ThUS$ ThUS$
Chile Generation
Energy sales 966,381 855,655
Power sales 128,226 139,569
Other income 142,617 139,054
Subtotal 1,237,224 1,134,278
Chile Transmission
Sales from tolls 45,747 80,218
Subtotal 45,747 80,218
Peru
Energy sales 125,407 113,127
Power sales 40,729 40,697
Other income 5,685 5,616
Subtotal 171,821 159,440
Total reportable segments 1,454,792 1,373,936
Elimination of inter-segment revenue (15,048) (25,068)
Total sales 1,439,744 1,348,868
Sales in the main geographical markets
January - December
ThUS$ % ThUS$ %
Chile Generation
Corporación Nacional del Cobre Chile 457,587 31% 374,498 27%
CGE Distribución S.A. 156,297 11% 174,057 13%
Enel Distribución Chile S.A. 101,385 7% 108,037 8%
Anglo American S.A. 518 0% 77,230 6%
Sociedad Austral del Sur S.A. 1,983 0% 3,013 0%
Colbún Transmisión S.A 5,648 1% 250 0%
Otros 513,806 33% 397,193 29%
Subtotal 1,237,224 83% 1,134,278 83%
Chile Transmission
Colbún S.A. 26,364 2% 28,818 2%
Corporación Nacional del Cobre Chile 7,444 1% 8,793 1%
Anglo American S.A. 3,129 0% 3,281 0%
Otros 8,810 1% 39,326 3%
Subtotal 45,747 4% 80,218 6%
Peru
Luz del Sur S.A.A. 75,224 5% 75,063 5%
Enel Distribución Perú S.A.A. 19,572 1% 19,974 1%
Comité de Operación Económica del Sistema
Interconectado Nacional1,990 0% 7,348 1%
Compañía Electrica El Platanal 8,640 1% 9,947 1%
Atria Energía S.A.C. 7,941 1% 9,276 1%
Electro Oriente S.A. 4,705 0% - 0%
Kallpa Generación S.A 7,291 1% - 0%
Otros 46,459 3% 37,832 2%
Subtotal 171,821 12% 159,440 11%
Total reportable segments 1,454,792 99% 1,373,936 100%
Elimination of inter-segment revenue (15,048) (25,068)
Total sales 1,439,744 1,348,868
Main customers 2021 2020
January - December

45
9. Cash and cash equivalents a. Detail As of December 31, 2021, and 2020, this caption is composed of the following:
Term deposits have maturities of less than three months from the acquisition date and accrue market interest applicable to these types of short-term investments. Other liquid instruments relate to fixed income mutual fund deposits in Chilean pesos, Euros and U.S. dollars, of low risk, which are recognized at deposit value at the reporting date of these consolidated financial statements. As of December 31, 2021, and 2020, in addition to these instruments, the Company has other term deposits with a maturity of more than three months from the acquisition date, which are presented in Note 10. b. Detail by currency The detail of cash and cash equivalents by currency, considering the effects of derivatives, is as follows:
(1) Considers the subscribed exchange rate forward effect to re-denominate in U.S. dollars certain term deposits in Chilean pesos.
12.31.2021 12.31.2020
ThUS$ ThUS$
Cash on hand 45 45
Cash in banks 346,545 192,327
Time deposits 22,922 22,208
Other cash equivalents 22,906 39,527
Total cash and cash equivalents 392,418 254,107
Cash and cash equivalents
Currency Currency Currency Currency
with derivative (1)
with derivative (1)
ThUS$ ThUS$ ThUS$ ThUS$
EUR 300 300 2,042 2,042
CLP 80,972 80,972 79,005 79,005
PEN 7,088 7,088 7,124 7,124
USD 304,058 304,058 165,936 165,936
Total 392,418 392,418 254,107 254,107
Currency
12.31.2021 12.31.2020

46
c. Reconciliation of liabilities arising from financial activities
(1) See note 25.a (2) See note 24.a
10. Other financial assets As of December 31, 2021, and 2020, this caption is composed of the following:
(1) As of December 31, 2021, investments in term deposits that were classified in this caption have an original average investment term less than
six months and the remaining average maturity term was 80 days. Cash flows related to these investments are presented in the statements of
cash flows as cash flows from investing activities in other cash receipts (payments).
(2) Relates to the current positive mark-to-market adjustments of hedging derivatives in place at each reporting date.
11. Trade and other receivables As of December 31, 2021, and 2020, this caption is composed of the following:
(1) As of December 31, 2021, the current balance comprises recoverable taxes for ThUS$ 3,533 and other minor items for ThUS$ 18,151. (ThUS$ 6,582 and ThUS$ 2,849 as of December 31, 2020, respectively). Company believes these assets are recoverable within 12 months.
The average collection period is 30 days.
ThUS$ ThUS$ ThUS$ ThUS$ ThUS$ ThUS$ ThUS$
Finance lease liabilities (1) 134,757 (21,050) - 9,618 1,341 1,652 126,318
Banks payable 25,531 (990) - 608 (103) - 25,046
Bonds Payable (2) 1,635,985 466,587 - 67,555 (1,990) (8,982) 2,159,155
Dividends payable 254 (1,244,739) 1,246,392 - - - 1,907
Total 1,796,527 (800,192) 1,246,392 77,781 (752) (7,330) 2,312,426
ThUS$ ThUS$ ThUS$ ThUS$ ThUS$ ThUS$ ThUS$
Finance lease liabilities (1) 143,872 (20,698) - 11,623 (158) 118 134,757
Banks payable - 24,650 - 442 - 439 25,531
Bonds Payable (2) 1,534,791 (8,994) - 80,393 18,349 11,446 1,635,985
Dividends payable - (241,319) 241,573 - - - 254
Total 1,678,663 (246,361) 241,573 92,458 18,191 12,003 1,796,527
Liabilities arising from financing activitiesCash flow
Balance as of
01.01.2021
Balance as of
12.31.2021Interests Valuation Other
Changes that do not represent cash flows
Dividends
Liabilities arising from financing activities
Balance as of
01.01.2020Cash flow
Changes that do not represent cash flows
Balance as of
12.31.2020Dividends Interests Valuation Other
12.31.2021 12.31.2020 12.31.2021 12.31.2020
ThUS$ ThUS$ ThUS$ ThUS$
Time deposits (1) 926,961 713,293 - -
Hedge derivative instruments (2)
(see note 15.1) 4,702 1,362 - 10,199
Investment for share offering - - 126 84
Bonds fixed-income investments - - 99,805 -
Total 931,663 714,655 99,931 10,283
Current Non-current
12.31.2021 12.31.2020 12.31.2021 12.31.2020
ThUS$ ThUS$ ThUS$ ThUS$
Trade receivables by contract 285,506 191,740 3,356 109,282
Other receivables (1) 21,684 9,431 - -
Total 307,190 201,171 3,356 109,282
Current
Caption
Non-current
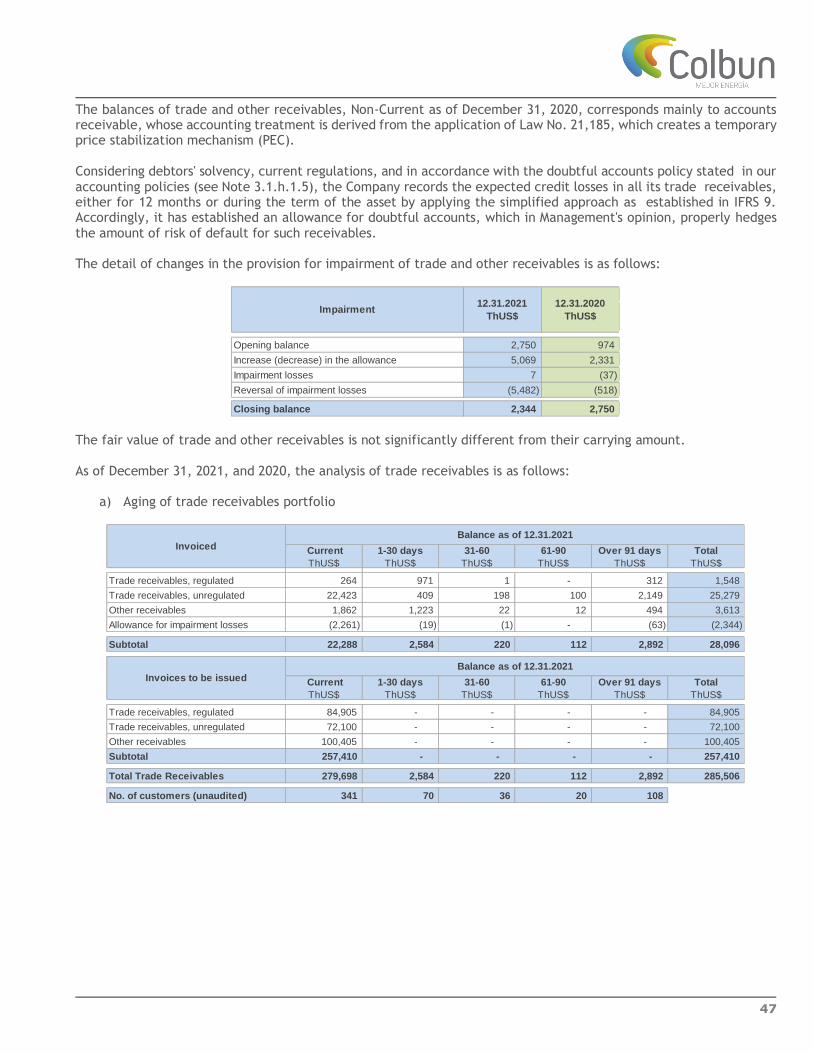
47
The balances of trade and other receivables, Non-Current as of December 31, 2020, corresponds mainly to accounts receivable, whose accounting treatment is derived from the application of Law No. 21,185, which creates a temporary price stabilization mechanism (PEC). Considering debtors' solvency, current regulations, and in accordance with the doubtful accounts policy stated in our accounting policies (see Note 3.1.h.1.5), the Company records the expected credit losses in all its trade receivables, either for 12 months or during the term of the asset by applying the simplified approach as established in IFRS 9. Accordingly, it has established an allowance for doubtful accounts, which in Management's opinion, properly hedges the amount of risk of default for such receivables. The detail of changes in the provision for impairment of trade and other receivables is as follows:
The fair value of trade and other receivables is not significantly different from their carrying amount. As of December 31, 2021, and 2020, the analysis of trade receivables is as follows:
a) Aging of trade receivables portfolio
Opening balance 2,750 974
Increase (decrease) in the allowance 5,069 2,331
Impairment losses 7 (37)
Reversal of impairment losses (5,482) (518)
Closing balance 2,344 2,750
Impairment12.31.2021
ThUS$
12.31.2020
ThUS$
Current
ThUS$
1-30 days
ThUS$
31-60
ThUS$
61-90
ThUS$
Over 91 days
ThUS$
Total
ThUS$
Trade receivables, regulated 264 971 1 - 312 1,548
Trade receivables, unregulated 22,423 409 198 100 2,149 25,279
Other receivables 1,862 1,223 22 12 494 3,613
Allowance for impairment losses (2,261) (19) (1) - (63) (2,344)
Subtotal 22,288 2,584 220 112 2,892 28,096
Current
ThUS$
1-30 days
ThUS$
31-60
ThUS$
61-90
ThUS$
Over 91 days
ThUS$
Total
ThUS$
Trade receivables, regulated 84,905 - - - - 84,905
Trade receivables, unregulated 72,100 - - - - 72,100
Other receivables 100,405 - - - - 100,405
Subtotal 257,410 - - - - 257,410
Total Trade Receivables 279,698 2,584 220 112 2,892 285,506
No. of customers (unaudited) 341 70 36 20 108
Invoiced
Invoices to be issuedBalance as of 12.31.2021
Balance as of 12.31.2021
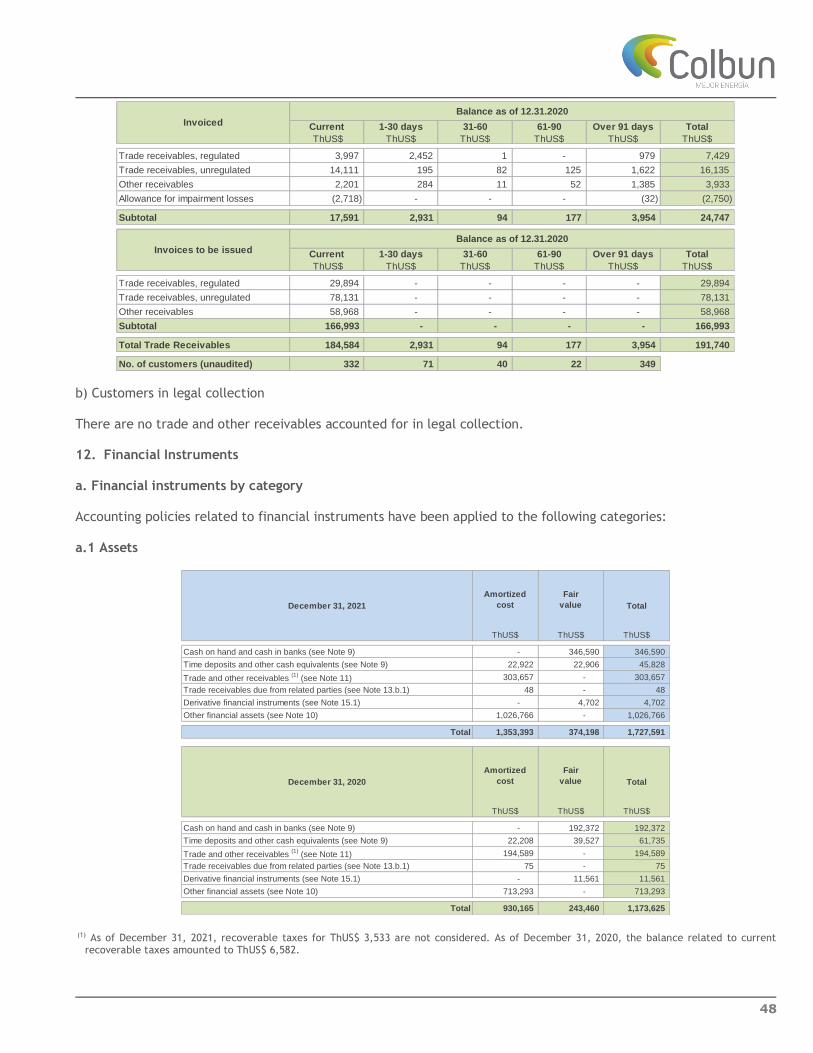
48
b) Customers in legal collection There are no trade and other receivables accounted for in legal collection. 12. Financial Instruments a. Financial instruments by category Accounting policies related to financial instruments have been applied to the following categories: a.1 Assets
(1) As of December 31, 2021, recoverable taxes for ThUS$ 3,533 are not considered. As of December 31, 2020, the balance related to current recoverable taxes amounted to ThUS$ 6,582.
Current
ThUS$
1-30 days
ThUS$
31-60
ThUS$
61-90
ThUS$
Over 91 days
ThUS$
Total
ThUS$
Trade receivables, regulated 3,997 2,452 1 - 979 7,429
Trade receivables, unregulated 14,111 195 82 125 1,622 16,135
Other receivables 2,201 284 11 52 1,385 3,933
Allowance for impairment losses (2,718) - - - (32) (2,750)
Subtotal 17,591 2,931 94 177 3,954 24,747
Current
ThUS$
1-30 days
ThUS$
31-60
ThUS$
61-90
ThUS$
Over 91 days
ThUS$
Total
ThUS$
Trade receivables, regulated 29,894 - - - - 29,894
Trade receivables, unregulated 78,131 - - - - 78,131
Other receivables 58,968 - - - - 58,968
Subtotal 166,993 - - - - 166,993
Total Trade Receivables 184,584 2,931 94 177 3,954 191,740
No. of customers (unaudited) 332 71 40 22 349
Invoiced
Invoices to be issued
Balance as of 12.31.2020
Balance as of 12.31.2020
ThUS$ ThUS$ ThUS$
Cash on hand and cash in banks (see Note 9) - 346,590 346,590
Time deposits and other cash equivalents (see Note 9) 22,922 22,906 45,828
Trade and other receivables (1)
(see Note 11) 303,657 - 303,657
Trade receivables due from related parties (see Note 13.b.1) 48 - 48
Derivative financial instruments (see Note 15.1) - 4,702 4,702
Other financial assets (see Note 10) 1,026,766 - 1,026,766
Total 1,353,393 374,198 1,727,591
ThUS$ ThUS$ ThUS$
Cash on hand and cash in banks (see Note 9) - 192,372 192,372
Time deposits and other cash equivalents (see Note 9) 22,208 39,527 61,735
Trade and other receivables (1)
(see Note 11) 194,589 - 194,589
Trade receivables due from related parties (see Note 13.b.1) 75 - 75
Derivative financial instruments (see Note 15.1) - 11,561 11,561
Other financial assets (see Note 10) 713,293 - 713,293
Total 930,165 243,460 1,173,625
TotalDecember 31, 2021
Fair
value
Amortized
cost
December 31, 2020
Fair
value
Amortized
cost Total

49
a.2 Liabilites
b. Credit quality of financial assets Credit quality of financial assets that have not expired or have no impairment losses can be assessed by credit classification ("rating") provided to the Company's counterparties by renowned domestic and foreign risk rating.
(*) Foreign Risk classification
ThUS$ ThUS$ ThUS$
Interest-bearing borrowings (see Note 24.c.1 and c.2) 2,184,201 - 2,184,201
Lease liabilities (see Note 25) 126,318 - 126,318
Derivative financial instruments (see Note 15.1) - 39,176 39,176
Trade and other payables (see Note 26) 215,181 - 215,181
Payables due to related parties (see Note 13.b.2) 12,574 - 12,574
Total 2,538,274 39,176 2,577,450
ThUS$ ThUS$ ThUS$Interest-bearing borrowings (see Note 24.c.1 and c.2) 1,661,516 - 1,661,516
Lease liabilities (see Note 25) 134,757 - 134,757
Derivative financial instruments (see Note 15.1) - 858 858
Trade and other payables (see Note 26) 130,680 - 130,680
Payables due to related parties (see Note 13.b.2) 161 - 161
Total 1,927,114 858 1,927,972
December 31, 2021Amortized
cost
Fair
value Total
December 31, 2020Amortized
cost
Fair
value Total
12.31.2021 12.31.2020
ThUS$ ThUS$
Customers with local risk rating
AAA 77,650 65,679
AA+ 35,243 17,979
AA 1,371 289
AA- 11,649 33,875
A+ 44,649 3,894
A - 2,754
A- - 26
Total 170,562 124,496
Customers with no local risk rating
Total 114,944 67,244
Cash in banks and bank short-term deposits, local market
AAA 808,912 661,639
AA 43,563 198
A+o inferior 27 -
Total 852,502 661,837
Cash in banks and bank short-term deposits, international market (*)
AA- 5,318 -
A+o inferior 461,559 266,036
Total 466,877 266,036
Cash in international fixed-income investments (*)
A 23,633 -
BBB+ 20,369 -
BBB o inferior 55,803 -
Total 99,805 -
Counterparty derivative financial assets, national market
AAA 720 10,429
AA 430 24
Total 1,150 10,453
AA- 1,776 817
A+o inferior 1,776 291
Total 3,552 1,108
Counterparty derivative financial assets, international market (*)
Credit quality of financial assets

50
13. Related parties disclosures
Operations between the Company and its subsidiaries, which are related parties, are part of the Company's customary transactions associated with its line of business and conditions, which have been eliminated on the consolidation process. Relationships between the Controller, subsidiaries, associates, joint ventures, and special purpose entities, are detailed in Note 3.1, section b. and c.
a. Controlling interests
As of December 31, 2021, the distribution of ownership interest is as follows:
(*) Entities owned by Parent Group (Matte Group). (**) It relates to the consolidated interest for each Pension Fund Administrator.
b. Balances and transactions with related parties
Receivables from, payables due to and transactions with related parties were conducted under market terms and conditions and are adjusted in accordance with Article No. 44 of Law No. 18,046 (the “Public Company Act"). b. 1. Trade receivables due from related parties
b. 2. Trade payables due from related parties
There are no guarantees granted to or received from related parties for transactions with related parties.
Minera Valparaíso S.A. (*) 35.17
Forestal Cominco S.A. (*) 14.00
Antarchile S.A. 9.58
AFP Habitat S.A. (**) 5.05
AFP Cuprum S.A. (**) 5.90
Banco de Chile por cuenta de State Street 2.42
Banco Santander - JP Morgan 1.92
Banchile Corredores de Bolsa S.A 1.78
Other shareholders 24.18
Total 100.00
ShareholdersOwnership
%

51
b. 3. Disclosures of transactions with related parties
(1) Dividends declared by Electrogas S.A
- In March 2021, Electrogas declared a provisional dividend charged to the profits of the year 2020 for ThUS$ 14,090, of which to Colbún corresponds to ThUS$ 5,988 (42,5%).
- In December 2021, Electrogas declared a provisional dividend charged to the profits of the year 2021 for ThUS$8,000, of which Colbún corresponds to
ThUS$3,400 (42.5%).
(2) Dividends paid by Electrogas S.A
- In May 2021, a dividend payment of ThUS $ 3,825 is received, leaving a balance pending collection of ThUS $ 2,163.
(3) Dividends declared and paid to Minera Valparaíso S.A. and Forestal Cominco S.A.
- Corresponds to the final dividend agreed at the Shareholders' Meeting dated April 29, 2021 and paid on May 12, 2021.
- Corresponds to the interim dividend and eventual dividend agreed at the Extraordinary Shareholders' Meeting on September 15, 2021 and paid on October
12, 2021. - Corresponds to the final dividend agreed at the Shareholders' Meeting dated April 30, 2020 and paid on May 12, 2020.

52
c. Management personnel and senior management Members of senior management and other individuals that are considered members of the Company's Management, as well as the shareholders or natural persons or legal entities they represent have entered into no unusual and/or significant transactions as of December 31, 2021 and 2020 The Company is managed by the Board of Directors which is composed of 9 members, who remain in their position for a 3-year period and may be re-elected. At the Ordinary Shareholders' Meeting held on April 29, 2021, the Company's Board of Directors was renewed, resulting in the election of Vivianne Blanlot Soza, María Emilia Correa Pérez and Marcela Angulo González, Rodrigo Donoso Munita, Bernardo Larraín Matte, Andrés Lehuedé Bromley, Bernardo Larraín Matte, Juan Carlos Altmann Martín and Hernán Rodríguez Wilson. Mrs. María Emilia Correa Pérez and Marcela Angulo González were elected as independent directors. On April 29, 2021, in an Extraordinary Session of the Board of Directors, Hernán Rodríguez Wilson was appointed as Chairman of the Board and Bernardo Larraín Matte as Vice Chairman. d. Board of Directors’ Committee As per Article 50 bis of Law No. 18.046 the “Public Company Act,” Colbún and its subsidiaries have a Directors' Committee composed of 3 members, who are invested with the powers provided by such article. On April 29, 2021, in an Extraordinary Board Meeting, Mr. Rodrigo Donoso Munita was appointed as members of the Directors' Committee, Mrs. María Emilia Correa Peréz and Mrs. Marcela Angulo Gonzalez. e. Compensation and other benefits As per Article 33 of Law No. 18.046 (the "Public Company Act"), the Board will be compensated for the performance of their duties and the amount of such compensation is established annually by the shareholders at the Company's General Ordinary Shareholders' Meeting. As of December 31, 2021, and 2020, the amounts paid, including amounts paid to the members of the Directors' Committee, are detailed as follows:

53
e.1 Board of Directors' remuneration
(1) Current Directors as of December 31, 2021.
e.2 Board Counseling Expenses For the periods ended December 31, 2021 and 2020, the Board of Directors did not incur in advisory expenses.
Colbún Directors Colbún Directors
Board Comittee Board Comittee
ThUS$ ThUS$ ThUS$ ThUS$ ThUS$ ThUS$
Hernán Rodríguez Wilson (1) Chairman 142 100 - 130 131 -
Bernardo Larraín Matte (1) Deputy-chairwoman 71 50 - 65 79 -
Vivianne Blanlot Soza (1) Director 71 50 - 65 79 -
Luz Granier Bulnes Director 25 50 8 65 79 22
Juan Eduardo Correa García Director 25 50 - 65 105 -
Francisco Matte Izquierdo Director - 33 - 42 79 14
Andrés Lehuedé Bromley (1) Director 71 50 - 65 79 -
María Emilia Correa (1) Director 71 50 24 65 52 22
Rodrigo José Donoso Munita (1) Director 71 50 24 65 52 8
Jorge Matte Capdevila Director - - - - 26 -
Bernardo Matte Larraín (1)Director 71 17 - 23 - -
Marcela Alejandra Angulo González (1) Director 46 - 16 - - -
Juan Carlos Altmann Martin (1) Director 46 - - - - -
María Ignacia Benítez Pereira Director - - - - 13 -
710 500 72 650 774 66 TOTAL
2021 2020
Name Position
January - December
Variable
remuneration
Variable
remuneration

54
e.3 Compensation of Senior Management members who are not Directors
The remuneration earned by key management personnel amounts to:
e.4 Receivables and payables and other transactions As of December 31, 2021, and 2020, there are no receivables and payables between the Company and its Directors and Managers. e.5 Other transactions There are no other transactions conducted between the Group's Directors and Managers. e.6 Guarantees pledged by the Company in favor of its Directors As of December 31, 2021, and 2020, the Company records no such operations. e.7 Incentive plans for Senior Executives and Managers The Company has benefits for all the executive area, in accordance with the individual performance and goal achievement assessments at the divisional and corporate level. e.8 Indemnities paid to Senior Executives and Managers During the period ended December 31, 2021 and 2020, there were no payments for such concept. e.9 Guarantee clauses: Company's Board of Directors and Management The Company has no guarantee clauses agreed with Directors and Managements. e.10 Consideration plans associated with shares' quote. The Company has no such operations.
Name Position
Thomas Keller Lippold Chief Executive Officer
Juan Eduardo Vásquez Moya Business and Energy Officer
Sebastián Moraga Zúñiga Finance and Administration Officer
Eduardo Lauer Rodríguez Engineering and Project Officer
Rodrigo Pérez Stiepovic Legal Affair Officer
Paula Martínez Osorio Organization and People Officer
Olivia Heuts Goen Development Officer
Heraldo Alvarez Arenas Internal Audit Officer
Heinz Müller Court Innovation and Development Officer
Daniel Gordon Adam Environmental Officer
Pedro Vial Lyon Public Affair Officer
Luis Le Fort Pizarro Transmission Officer
2021 2020
ThUS$ ThUS$
3,887 4,807
377 856
135 546
4,399 6,209
Termination benefits
Total
Concept
Short-term employee benefits
Other long-term benefits
January - December

55
14. Inventories As of December 31, 2021, and 2020, this caption is composed of the following:
(1) Relates to the impairment estimate on the spare part stock, which is applied in accordance with the Policy.
There is no inventory pledged as collateral to secure compliance with debt obligations. Inventory costs recognized as expense As of December 31, 2021, and 2020, the use of inventory recognized as expenses is detailed as follows:
15. Derivative instruments Following the financial risk management policy described in Note 4, the Company enters into contracts with financial derivatives to hedge its exposure to interest rate variances, currency (exchange rate) and fuel prices. Interest rate derivatives are used to determine or limit the variable interest rate of financial obligations and relate to interest rate swaps. Currency derivatives are used to establish the U.S. dollar exchange for Chilean peso (Ch$), inflation-adjusted units (UF) and Peruvian sol (PEN), as a result of its existing obligations denominated in currencies other than U.S. dollar. Such instruments are mainly Forwards and Cross Currency Swaps. Derivatives on fuel prices are used to mitigate the Company's fluctuations in sales revenue and energy production cost risk derived from a change in fuel prices used for such purposes. Instruments used are mainly options and forwards. As of December 31, 2021, the Company classified all its hedges as "Cash flow hedges".
12.31.2021 12.31.2020
ThUS$ ThUS$
Spare parts for maintenance 22,806 19,204
Coal 43,955 14,054
Oil 4,910 3,732
Gas Line Pack 1,866 630
Allowance for obsolescence (1) (2,939) (3,974)
Total 70,598 33,646
Inventory
2021 2020
ThUS$ ThUS$
Warehouse consumption 8,906 8,203
Oil (see note 32) 49,346 9,523
Gas (see note 32) 394,380 245,413
Coal (see note 32) 89,660 70,351
Total 542,292 333,490
Inventory Cost
January - December

56
15.1 Hedging instruments As of December 31, 2021, and 2020, this caption includes the valuation of financial instruments for such periods, detailed as follows:
The portfolio of hedging instruments at Colbún S.A. and subsidiaries is as follows:
As of December 31, 2021, the Company determined no gains or losses associated with ineffective cash flow hedges that should be recognized in profit or loss. 15.2 Fair value hierarchy The fair value of financial instruments recognized in the Statements of Financial Position has been determined based on the following hierarchy, in accordance with inputs used to conduct such measurement: Level 1: Quoted prices in active markets for identical assets or liabilities. Level 2: Inputs other than quoted prices included in Level 1 that are observable for the asset or liability, either directly (i.e. as prices) or indirectly (i.e. derived from prices). Level 3: Inputs for the asset or liability that are not based on observable market data (unobservable inputs). As of December 31, 2021, the calculation of fair value of all financial instruments subject to measurement, has been determined based on Level 2 of the hierarchy.
12.31.2021 12.31.2020 12.31.2021 12.31.2020
ThUS$ ThUS$ ThUS$ ThUS$
Currency hedging instrument Cash flow hedges 1,151 1,355 - 10,199
Fuel price hedge Cash flow hedges 3,551 7 - -
4,702 1,362 - 10,199
12.31.2021 12.31.2020 12.31.2021 12.31.2020
ThUS$ ThUS$ ThUS$ ThUS$
Currency hedging instrument Cash flow hedges 39,176 858 - -
Interest rate hedging instrument Cash flow hedges - - - -
39,176 858 - -
(34,474) 504 - 10,199
Non-current
Hedging assets
Hedging liabilities
Hedging instruments, net
Current Non-current
Current
Total (see note 24.a)
Total (see note 10)
12.31.2021 12.31.2020
ThUS$ ThUS$
Currency forwards (17,931) 24 Future Project Disbursements Exchange rate Cash flow
Currency forwards (16) (763) Customers Exchange rate Cash flow
Currency forwards 1,151 1,355 Financial Investments Exchange rate Cash flow
Currency forwards (46) - Remuneration Exchange rate Cash flow
Cross Currency Swaps (21,183) 10,080 Bonds payable Exchange rate and interest rate Cash flow
Coal options 3,551 7 Oil and gas purchases Coal price Cash flow
Total (34,474) 10,703
Hedging instrument Type of hedge
Fair value
Hedginig instrumentUnderlying asset hedged Hedged risk

57
16. Investment in subsidiaries The consolidated financial statements include the financial statements of the Parent and subsidiaries. Information on subsidiaries as of December 31, 2021, and 2020, is detailed below.
ThUS$ ThUS$ ThUS$ ThUS$ ThUS$ ThUS$ ThUS$
Colbún Desarrollo SpA 160 - 1 - 159 - (1)
Santa Sofía SpA - 14,988 180 - 14,808 - 17
Colbún Perú S.A. 21,260 125,722 1,033 - 145,949 - (6,015)
Inversiones de Las Canteras S.A. 742 247,018 658 589 246,513 - (10,445)
Fenix Power Perú S.A. 65,125 639,569 86,174 373,160 245,360 171,821 (10,224)
Desaladora Del Sur S.A. 224 1 6 - 219 - (6)
Efizity Ingenería SpA 1,570 597 1,470 - 697 3,111 (292)
ThUS$ ThUS$ ThUS$ ThUS$ ThUS$ ThUS$ ThUS$
Termoeléctrica Nehuenco S.A., en liquidación 7 - - 41 (34) - -
Colbún Transmisión S.A. 39,073 378,653 7,233 86,771 323,722 80,218 41,907
Colbún Desarrollo SpA 11 149 - - 160 - -
Santa Sofía SpA - 156 - 180 (24) - 2
Colbún Perú S.A. 21,023 131,056 107 - 151,972 - (75,893)
Inversiones de Las Canteras S.A. 794 257,534 684 671 256,973 - (149,848)
Fenix Power Perú S.A. 74,502 682,714 91,142 410,474 255,600 159,440 (149,636)
Desaladora Del Sur S.A. 250 - - - 250 - -
Efizity Ingenería SpA 907 520 1,134 248 45 641 (180)
RevenueNet profit
(loss)
12.31.2020
12.31.2021
Current
assets
Non-current
assets
Current
liabilities
Non-current
liabilitiesRevenue
Net profit
(loss)
EquityNon-current
liabilities
EquitySubsidiary
SubsidiaryCurrent
assets
Non-current
assets
Current
liabilities

58
17. Equity-accounted investees a. Equity-accounted investees The detail of equity-accounted investees and its movements as of December 31, 2021, and 2020, is described below.
(1) On December 30, 2021, the sale of the total share of the Joint Venture of Transmisora Eléctrica de Quillota Ltda. (equivalent to 50% of the social rights) was made, to the companies APG
Energy & Infra Investments Chile Expansion SpA, and CELEO Redes Chile Expansion SpA.
12.31.2021 01.01.2021 12.31.2021
% ThUS$ ThUS$ ThUS$ ThUS$ ThUS$ ThUS$ ThUS$ ThUS$
Associate Electrogas S.A. 175,076 42.5% 16,368 7,035 (9,388) - 180 - - 14,195
Joint Venture Transmisora Eléctrica de Quillota Ltda. (1) - 50.0% 10,481 (338) (6,171) (1,844) - (2,128) - -
26,849 6,697 (15,559) (1,844) 180 (2,128) - 14,195
12.31.2020 01.01.2020 12.31.2020
% ThUS$ ThUS$ ThUS$ ThUS$ ThUS$ ThUS$ ThUS$ ThUS$
Associate Electrogas S.A. 175,076 42.5% 16,572 8,149 (8,353) - - - - 16,368
Joint Venture Transmisora Eléctrica de Quillota Ltda. - 50.0% 8,146 1,801 - 534 - - - 10,481
24,718 9,950 (8,353) 534 - - - 26,849
Relationship
Relationship
Total
Total
Dividends
Dividends
Equity Reserve
Foreign
currency
transaction
difference
Equity Reserve
Foreign
currency
transaction
difference
Reserve in
hedge
derivatives
Reserve in
hedge
derivatives
Number of
shares
Number of
shares
Total
Company
Company
Ownership
percentage
Ownership
percentage
Total
Balance as of
Balance as ofAccrued profit
or loss
Accrued profit
or loss
Settlement
Settlement
Other increase
(decrease)
Other increase
(decrease)
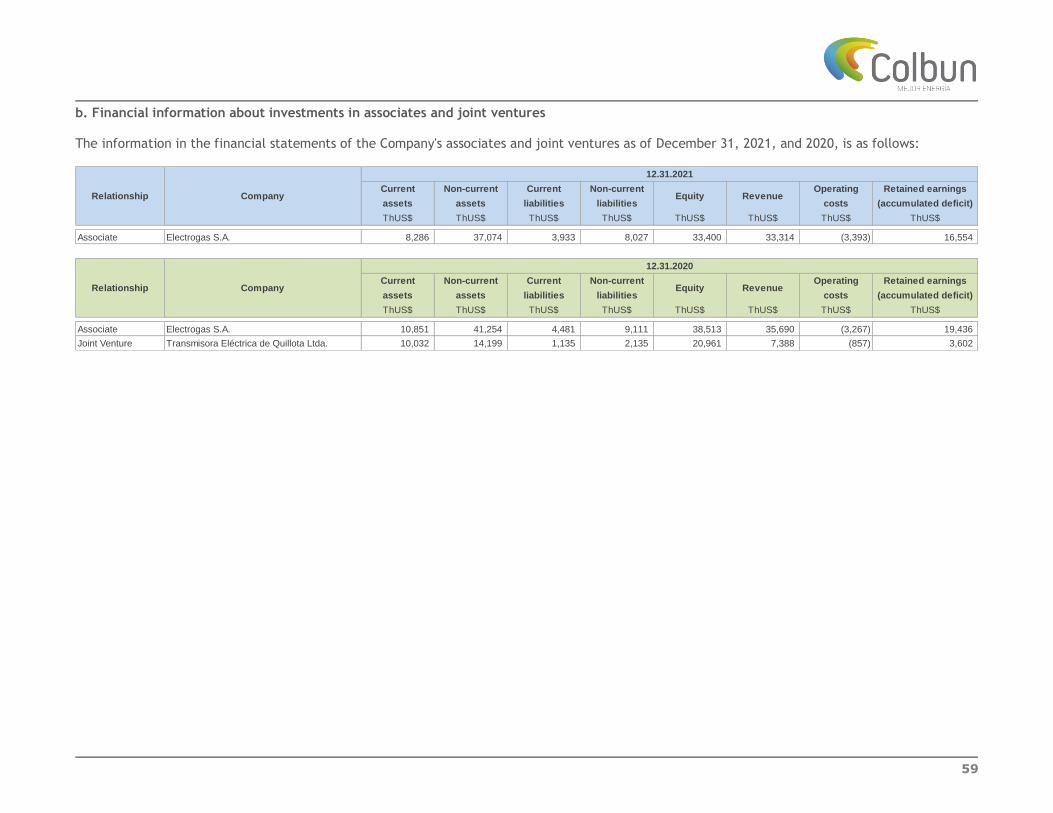
59
b. Financial information about investments in associates and joint ventures The information in the financial statements of the Company's associates and joint ventures as of December 31, 2021, and 2020, is as follows:
Current Non-current Current Non-current Operating Retained earnings
assets assets liabilities liabilities costs (accumulated deficit)
ThUS$ ThUS$ ThUS$ ThUS$ ThUS$ ThUS$ ThUS$ ThUS$
Associate Electrogas S.A. 8,286 37,074 3,933 8,027 33,400 33,314 (3,393) 16,554
Current Non-current Current Non-current Operating Retained earnings
assets assets liabilities liabilities costs (accumulated deficit)
ThUS$ ThUS$ ThUS$ ThUS$ ThUS$ ThUS$ ThUS$ ThUS$
Associate Electrogas S.A. 10,851 41,254 4,481 9,111 38,513 35,690 (3,267) 19,436
Joint Venture Transmisora Eléctrica de Quillota Ltda. 10,032 14,199 1,135 2,135 20,961 7,388 (857) 3,602
Relationship Company
12.31.2021
Relationship Company
12.31.2020
Equity
Equity
Revenue
Revenue

60
Additional information i) Electrogas S.A.: Electrogas S.A. is a company engaged in the transportation of natural gas and other fuels. It has a pipeline between "City Gate III" located in San Bernardo, Santiago, Chile and "Plant Gate" located in Quillota, Valparaíso, Chile, and a pipeline from "Plant Gate" to Colmo, Concón, Valparaíso, Chile. Its main customers are Gas Atacama Chile S.A., Colbún S.A., Empresa de Gas Quinta Región (Gasvalpo), Energas S.A. and Enap Refinerías Concón. Colbún has a direct ownership interest of 42.5% in such company. ii) Transmisora Eléctrica de Quillota Ltda.: This company was incorporated by Colbún S.A. and San Isidro S.A. (currently, Enel Generación Chile S.A.), in June 1997, with the purpose of jointly developing and operating the required installations to transport the capacity and energy generated by their respective plants to the Quillota Substation owned by Transelec S.A. Transmisora Eléctrica de Quillota Ltda. is the owner of San Luis substation, located beside the Nehuenco and San Isidro combined-cycle plants. In addition, it owns the high voltage line of 220 KV that links the substation with Quillota substation of SIC. On December 30, 2021, the sale of the total share of the Joint Business of Transmisora Eléctrica de Quillota Ltda. (equivalent to 50% of the social rights) was made, to the companies APG Energy & Infra Investments Chile Expansion SpA, and CELEO Redes Chile Expansion SpA.

61
18. Intangible assets other than goodwill a. Detail by classes of intangible assets The detail, as of December 31, 2021, and 2020, is as follows:
12.31.2021 12.31.2020
ThUS$ ThUS$
Emission rights for particulate matter 9,582 9,582
Concessions 202 202
Water rights 10,074 17,436
Easements 15,667 58,288
Intangible assets related to customers 30,658 33,834
Licenses Software 1,969 2,768
68,152 122,110
12.31.2021 12.31.2020
ThUS$ ThUS$
Emission rights for particulate matter 9,582 9,582
Concessions 228 228
Water rights 10,093 17,455
Easements 16,849 60,140
Intangible assets related to customers 46,815 46,815
Licenses Software 17,110 17,069
100,677 151,289
12.31.2021 12.31.2020
ThUS$ ThUS$
Concessions (26) (26)
Water rights (19) (19)
Easements (1,182) (1,852)
Intangible assets related to customers (16,157) (12,981)
Licenses Software (15,141) (14,301)
(32,525) (29,179)Total
Intangible assets, net
Intangible assets, gross
Accumulated amortization
Total
Total
Rights not
internally
generated
Rights not
internally
generated
Rights not
internally
generated

62
b. Movements in intangible assets As of December 31, 2021, and 2020, this caption comprises the following:
As detailed in Note 5.b, the Company's Management, in its assessment, determined that there is no impairment of intangible assets' carrying amount. The Company has no intangible assets pledged as collateral to secure compliance with its debt obligations.
Licenses
Emission
rights for
particulate
matter
Concessions Water rights Easements
Intangible
assets related
to customers
Software
ThUS$ ThUS$ ThUS$ ThUS$ ThUS$ ThUS$ ThUS$
9,582 202 17,436 58,288 33,834 2,768 122,110
- - - 790 - - 790
- - - - - -
- - - - - - -
- - - (39,644) - - (39,644)
Accumulated depreciation of disposals - - - 802 - - 802
- - - - -
(7,362) (4,437) (11,799)
- - - - - 41 41
- - - (132) (3,176) (840) (4,148)
9,582 202 10,074 15,667 30,658 1,969 68,152
- - - - - -
Licenses
Emission
rights for
particulate
matter
Concessions Water rights Easements
Intangible
assets related
to customers
Software
ThUS$ ThUS$ ThUS$ ThUS$ ThUS$ ThUS$ ThUS$
9,582 202 17,436 58,060 37,010 2,072 124,362
- - - 1,714 - 1,030 2,744
- - - - - 13 13
- - - (296) - (296)
- - - (1,280) - - (1,280)
- - - 264 - 930 1,194
- - - (174) (3,176) (1,277) (4,627)
9,582 202 17,436 58,288 33,834 2,768 122,110
Amortization expenses (see note 34)
Rights not internally generated
Closing balance as of 12.31.2020
Movements for the period 2021
Acquisition made through business combinations (see note 7)
Additions
Transfer between assets
Transport from assets under construction
Rights not internally generated
Opening balance as of 01.01.2020
Increase (decrease) resulting from other movements
Disposals
Intangibles
assets, net
Movements for the period 2020
Intangibles
assets, net
Closing balance as of 12.31.2021
Additions
Amortization expenses (see Note 34)
Transport from assets under construction
Acquisition made through business combinations (see note 7)
Opening balance as of 01.01.2021
Increase (decrease) resulting from other movements
Disposals
Impairment losses recognized in other comprehensive income
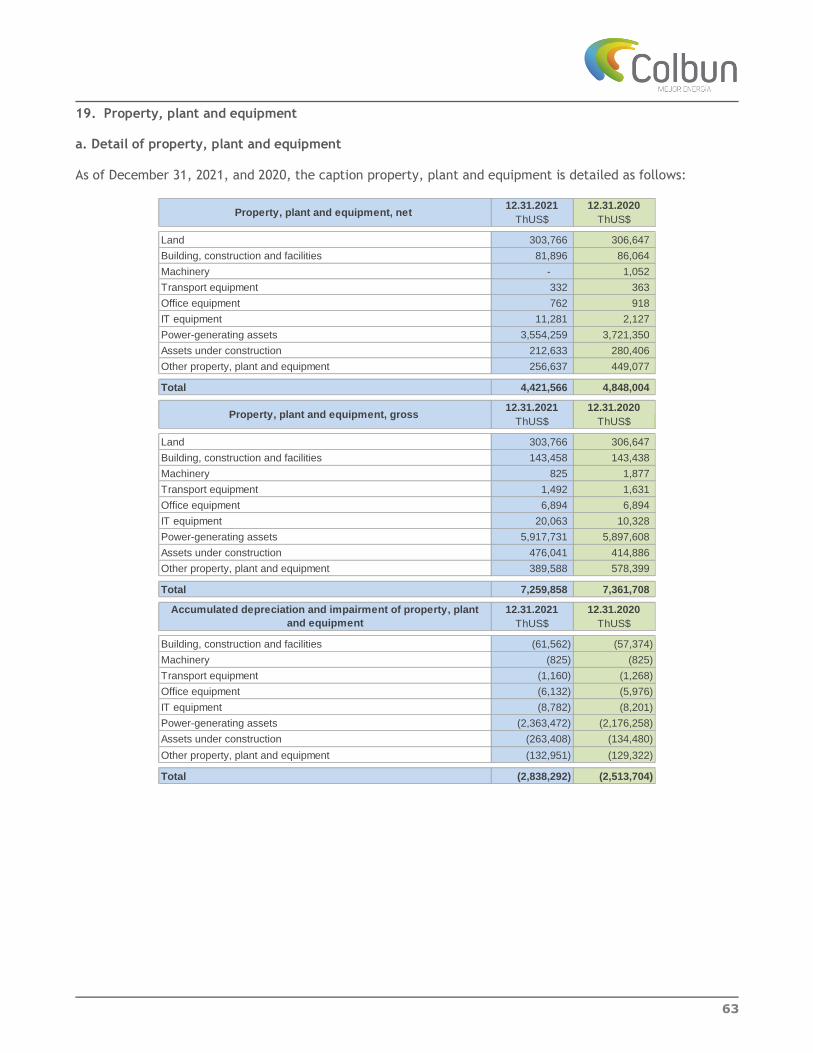
63
19. Property, plant and equipment a. Detail of property, plant and equipment As of December 31, 2021, and 2020, the caption property, plant and equipment is detailed as follows:
12.31.2021 12.31.2020
ThUS$ ThUS$
Land 303,766 306,647
Building, construction and facilities 81,896 86,064
Machinery - 1,052
Transport equipment 332 363
Office equipment 762 918
IT equipment 11,281 2,127
Power-generating assets 3,554,259 3,721,350
Assets under construction 212,633 280,406
Other property, plant and equipment 256,637 449,077
Total 4,421,566 4,848,004
12.31.2021 12.31.2020
ThUS$ ThUS$
Land 303,766 306,647
Building, construction and facilities 143,458 143,438
Machinery 825 1,877
Transport equipment 1,492 1,631
Office equipment 6,894 6,894
IT equipment 20,063 10,328
Power-generating assets 5,917,731 5,897,608
Assets under construction 476,041 414,886
Other property, plant and equipment 389,588 578,399
Total 7,259,858 7,361,708
12.31.2021 12.31.2020
ThUS$ ThUS$
Building, construction and facilities (61,562) (57,374)
Machinery (825) (825)
Transport equipment (1,160) (1,268)
Office equipment (6,132) (5,976)
IT equipment (8,782) (8,201)
Power-generating assets (2,363,472) (2,176,258)
Assets under construction (263,408) (134,480)
Other property, plant and equipment (132,951) (129,322)
Total (2,838,292) (2,513,704)
Property, plant and equipment, net
Property, plant and equipment, gross
Accumulated depreciation and impairment of property, plant
and equipment
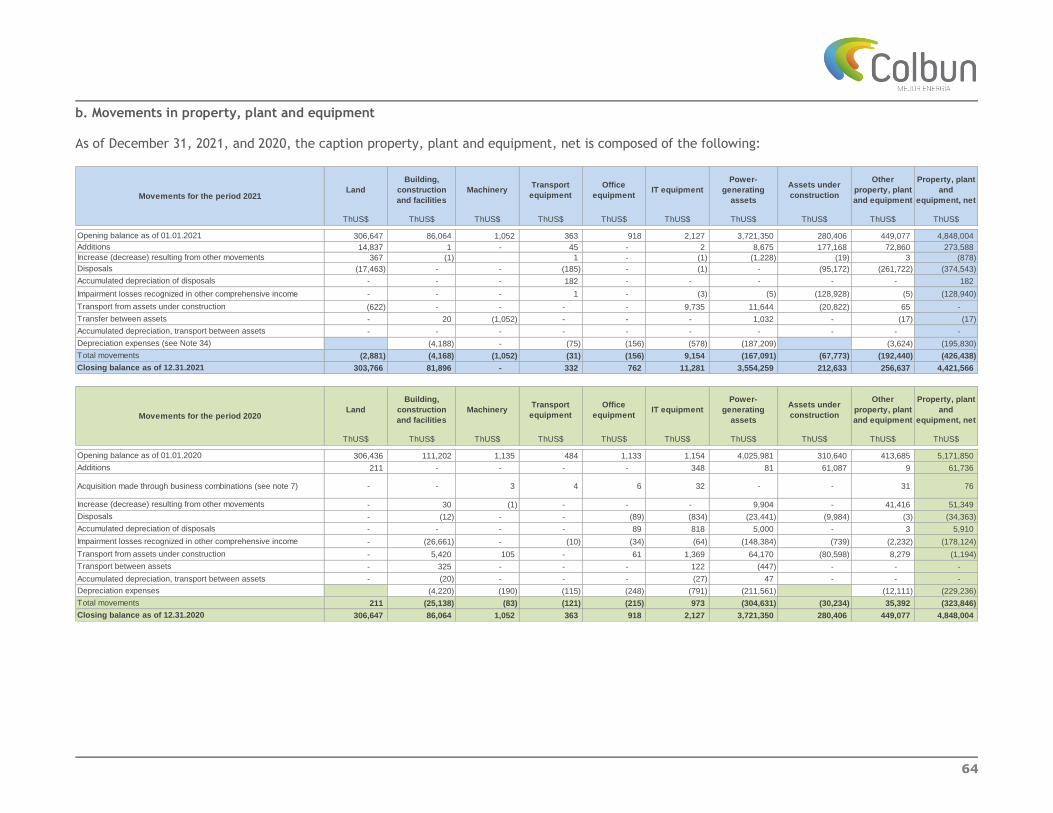
64
b. Movements in property, plant and equipment As of December 31, 2021, and 2020, the caption property, plant and equipment, net is composed of the following:
Land
Building,
construction
and facilities
Machinery Transport
equipment
Office
equipment IT equipment
Power-
generating
assets
Assets under
construction
Other
property, plant
and equipment
Property, plant
and
equipment, net
ThUS$ ThUS$ ThUS$ ThUS$ ThUS$ ThUS$ ThUS$ ThUS$ ThUS$ ThUS$
306,647 86,064 1,052 363 918 2,127 3,721,350 280,406 449,077 4,848,004
14,837 1 - 45 - 2 8,675 177,168 72,860 273,588
367 (1) 1 - (1) (1,228) (19) 3 (878)
(17,463) - - (185) - (1) - (95,172) (261,722) (374,543)
- - - 182 - - - - - 182
- - - 1 - (3) (5) (128,928) (5) (128,940)
(622) - - - - 9,735 11,644 (20,822) 65 -
- 20 (1,052) - - - 1,032 - (17) (17)
- - - - - - - - - -
(4,188) - (75) (156) (578) (187,209) (3,624) (195,830)
(2,881) (4,168) (1,052) (31) (156) 9,154 (167,091) (67,773) (192,440) (426,438)
303,766 81,896 - 332 762 11,281 3,554,259 212,633 256,637 4,421,566
- - - - - - - - -
Land
Building,
construction
and facilities
Machinery Transport
equipment
Office
equipment IT equipment
Power-
generating
assets
Assets under
construction
Other
property, plant
and equipment
Property, plant
and
equipment, net
ThUS$ ThUS$ ThUS$ ThUS$ ThUS$ ThUS$ ThUS$ ThUS$ ThUS$ ThUS$
306,436 111,202 1,135 484 1,133 1,154 4,025,981 310,640 413,685 5,171,850
211 - - - - 348 81 61,087 9 61,736
- - 3 4 6 32 - - 31 76
- 30 (1) - - - 9,904 - 41,416 51,349
- (12) - - (89) (834) (23,441) (9,984) (3) (34,363)
- - - - 89 818 5,000 - 3 5,910
- (26,661) - (10) (34) (64) (148,384) (739) (2,232) (178,124)
- 5,420 105 - 61 1,369 64,170 (80,598) 8,279 (1,194)
- 325 - - - 122 (447) - - -
Accumulated depreciation, transport between assets - (20) - - - (27) 47 - - -
(4,220) (190) (115) (248) (791) (211,561) (12,111) (229,236)
211 (25,138) (83) (121) (215) 973 (304,631) (30,234) 35,392 (323,846)
306,647 86,064 1,052 363 918 2,127 3,721,350 280,406 449,077 4,848,004Closing balance as of 12.31.2020
Total movements
Movements for the period 2021
Movements for the period 2020
Total movements
Impairment losses recognized in other comprehensive income
Increase (decrease) resulting from other movements
Acquisition made through business combinations (see note 7)
Increase (decrease) resulting from other movements
Impairment losses recognized in other comprehensive income
Transfer between assets
Transport between assets
Opening balance as of 01.01.2021
Additions
Disposals
Accumulated depreciation of disposals
Disposals
Accumulated depreciation of disposals
Transport from assets under construction
Accumulated depreciation, transport between assets
Depreciation expenses
Transport from assets under construction
Depreciation expenses (see Note 34)
Opening balance as of 01.01.2020
Additions
Closing balance as of 12.31.2021

65
c. Other disclosures i) Colbún S.A. and its subsidiaries have entered into insurance policies to cover the possible risks to which the different items of property, plant and equipment may be exposed, as well as possible claims that might be presented because of the performance of their business activities. Such policies sufficiently cover the risks to which they are exposed. Additionally, loss of profit that may result from a claim is covered by insurance policies engaged by the Company. ii) As of December 31, 2021, and 2020, the Company had commitments associated with the acquisition of property, plant and equipment for construction agreements for ThUS$ 727,412 and ThUS$ 40,751, respectively. The companies with which it operates are Enercon Gmbh, Enercon Chile SpA, Strabag spa, Promet Servicios SpA, Ing.Y Construccion Sigdo Koppers S.A., Wärtsila Finland OY, Siemens Energy Spa, Echeverria Izquierdo Montajes Industriales, Zimmermann Solar Chile SpA, among others.
iii) As of December 31, 2021, and 2020, the accrued capitalized interest costs (IAS 23), are as follows:
iv) Operating leases - Lessor As of December 31, 2021, and 2020, the Company holds embedded operating leases corresponding to:
1. Transmission line contracts (Alto Jahuel-Candelaria 220 KV and Candelaria-Minero 220 KV) entered into between the Company and Corporación Nacional del Cobre de Chile. Such contracts have a term of 30 years.
2. Additional toll contracts (transmission lines - Polpaico substation-substation Maitenes) entered into between the Company and Anglo American Sur. Such contracts have a term of 21 years.
3. Energy supply and electric power contract entered into between Colbún and Corporación Nacional del Cobre de Chile. Such contract has a term of 30 years.
The estimated future charges derived from such contracts are detailed as follows:
Interest costs
Capitalized interest costs 6,087 165
Interest expenses - -
Total interest costs incurred 6,087 165
Cost capitalization rate for loans eligible for capitalization 8.68% 0.08%
Concept 2020
ThUS$
2021
ThUS$
January - December
ThUS$ ThUS$ ThUS$ ThUS$
Minimum lease payments under operating non-cancellable leases 124,506 522,163 2,104,448 2,751,117
Total 124,506 522,163 2,104,448 2,751,117
ThUS$ ThUS$ ThUS$ ThUS$
Minimum lease payments under operating non-cancellable leases 124,328 497,299 2,116,330 2,737,957
Total 124,328 497,299 2,116,330 2,737,957
Total
Total December 31, 2021
December 31, 2020
0-1 year 1-5 years Over 5 years
0-1 year 1-5 years Over 5 years

66
v) Additional information required for XBRL taxonomy
1. Disbursements recognized during the construction
2. Assets fully depreciated still in use
12.31.2021 12.31.2020
ThUS$ ThUS$
Building, construction and facilities 1,596 1,407
Machinery - 156
Transport equipment 678 676
Office equipment 5,139 5,035
IT equipment 7,208 6,762
Power-generating assets 129,414 124,468
Other property, plant and equipment 1,536 1,506
Total 145,571 140,010
12.31.2021 12.31.2020
ThUS$ ThUS$
Building, construction and facilities (1,444) (1,407)
Machinery - (156)
Transport equipment (676) (676)
Office equipment (5,139) (5,035)
IT equipment (7,208) (6,762)
Power-generating assets (116,694) (110,475)
Other property, plant and equipment (1,536) (1,506)
Total (132,697) (126,017)
Assets fully depreciated still in use, gross
Assets fully depreciated still in use, accumulated
depreciation
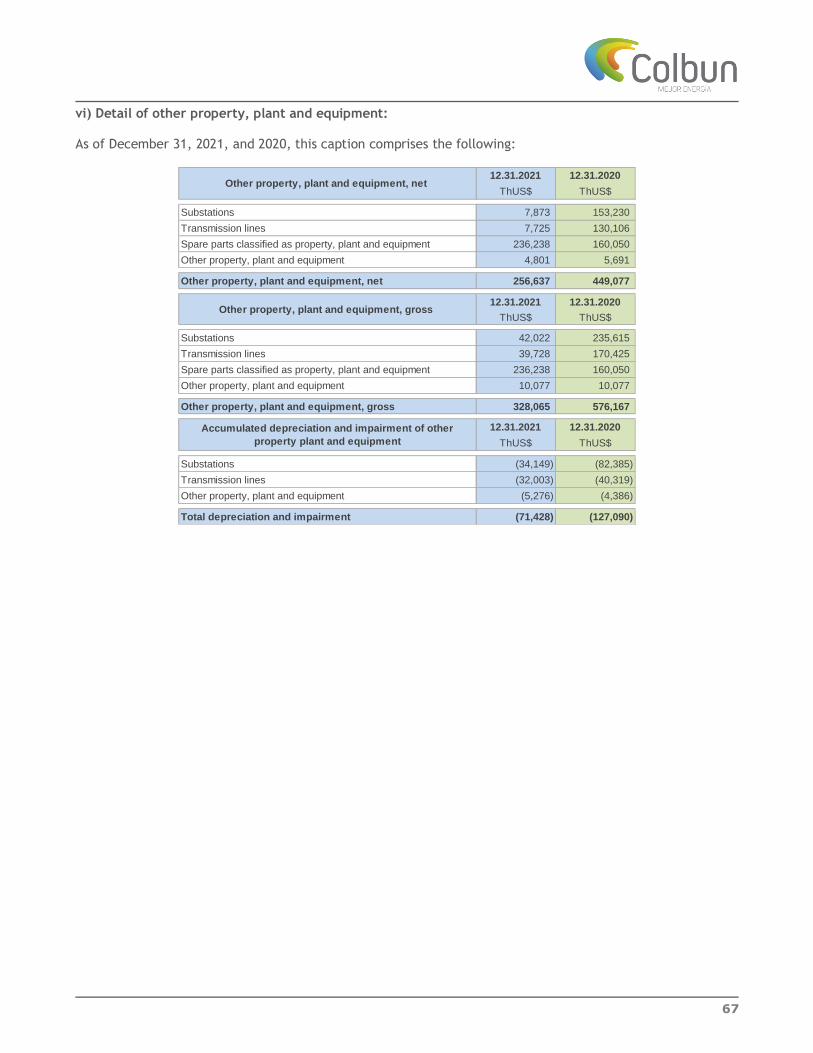
67
vi) Detail of other property, plant and equipment: As of December 31, 2021, and 2020, this caption comprises the following:
12.31.2021 12.31.2020
ThUS$ ThUS$
Substations 7,873 153,230
Transmission lines 7,725 130,106
Spare parts classified as property, plant and equipment 236,238 160,050
Other property, plant and equipment 4,801 5,691
Other property, plant and equipment, net 256,637 449,077
12.31.2021 12.31.2020
ThUS$ ThUS$
Substations 42,022 235,615
Transmission lines 39,728 170,425
Spare parts classified as property, plant and equipment 236,238 160,050
Other property, plant and equipment 10,077 10,077
Other property, plant and equipment, gross 328,065 576,167
12.31.2021 12.31.2020
ThUS$ ThUS$
Substations (34,149) (82,385)
Transmission lines (32,003) (40,319)
Other property, plant and equipment (5,276) (4,386)
Total depreciation and impairment (71,428) (127,090)
Other property, plant and equipment, gross
Accumulated depreciation and impairment of other
property plant and equipment
Other property, plant and equipment, net

68
vii) Detail of power-generating assets
12.31.2021 12.31.2020
ThUS$ ThUS$
Hydropower 1,607,622 1,634,448
Coal-fired thermal power 248,263 260,519
Oil and gas-fired thermal power 44,583 46,451
Solar power 131 145
Hydropower 530,119 568,974
Coal-fired thermal power 411,848 432,248
Oil and gas-fired thermal power 703,845 770,277
Solar power 7,848 8,288
3,554,259 3,721,350
12.31.2021 12.31.2020
ThUS$ ThUS$
Hydropower 2,232,780 2,232,362
Coal-fired thermal power 359,190 359,193
Oil and gas-fired thermal power 59,395 59,404
Solar power 162 162
Hydropower 954,700 952,033
Coal-fired thermal power 639,658 632,120
Oil and gas-fired thermal power 1,662,420 1,652,908
Solar power 9,426 9,426
5,917,731 5,897,608
12.31.2021 12.31.2020
ThUS$ ThUS$
Hydropower (625,158) (597,914)
Coal-fired thermal power (110,927) (98,674)
Oil and gas-fired thermal power (14,812) (12,953)
Solar power (31) (17)
Hydropower (424,581) (383,059)
Coal-fired thermal power (227,810) (199,872)
Oil and gas-fired thermal power (958,575) (882,631)
Solar power (1,578) (1,138)
(2,363,472) (2,176,258)Total depreciation and impairment
Power-generating assets, net
Power-
generating
civil works
Power-
generating
equipment and
machinery
Balance of power-generating assets, net
Power-generating assets, gross
Power-
generating
civil works
Power-
generating
equipment and
machinery
Balance of power-generating assets, gross
Accumulated depreciation and impairment of power-generating assets
Power-
generating
civil works
Power-
generating
equipment and
machinery

69
20. Right-of-use assets a. Detail Right-of-Use assets The right-of-use assets recognized as of December 31, 2021, and 2020, are as follows:
As of December 31, 2021, and 2020, the company maintain in its records leases related to its offices, warehouse, parking lots, vehicles, computers and printers. The subsidiary Fenix maintains contracts with:
1. Consorcio Transmantaro S.A. (hereinafter CTM), in which CTM is obliged to provide maintenance and operating services to the 8-km transmission line between the substation Chilca and the thermoelectric power plant Fenix. Such contract has a term of 20 years (with 13 years remaining) and accrues an annual interest of 12%. Additionally, CTM is obliged to build facilities for the rendering of transmission line services.
2. Contract entered into with Gas Natural de Lima y Callao (Calidda), by which Calidda agrees to provide the gas distribution service from the City Gate located in the city of Chilca, for which a regulation and control plant has been installed (ERC, for its acronym in Spanish), which is an iron pipeline. Such contract is effective for 20 years (with 13 years remaining), per a volume of 84.1 MMpcd. It includes a Take or Pay of 100% equivalent to 84.1MMpcd which should be paid in the month the service is rendered. The interest rate associated with the finance lease amounts to 7% per year.
12.31.2021 12.31.2020
ThUS$ ThUS$
Transmission line operation and maintenance 9,449 9,067
Right-of-use office equipment 86 59
Right-of-use facilities 3,246 4,458
Right-of-use vehicles 366 364
Right-of-use Calidda gas pipeline 100,121 109,223
Right-of-use IT equipment 119 320
Total 113,387 123,491
12.31.2021 12.31.2020
ThUS$ ThUS$
Transmission line operation and maintenance 18,081 16,853
Right-of-use office equipment 377 239
Right-of-use facilities 8,267 7,860
Right-of-use vehicles 3,451 2,247
Right-of-use Calidda gas pipeline 127,427 127,427
Right-of-use IT equipment 603 603
Total 158,206 155,229
12.31.2021 12.31.2020
ThUS$ ThUS$
Transmission line operation and maintenance (8,632) (7,786)
Right-of-use office equipment (291) (180)
Right-of-use facilities (5,021) (3,402)
Right-of-use vehicles (3,085) (1,883)
Right-of-use Calidda gas pipeline (27,306) (18,204)
Right-of-use IT equipment (484) (283)
Total (44,819) (31,738)
Right-of-use assets, Net
Right-of-use assets, Gross
Accumulated depreciation right-of-use assets
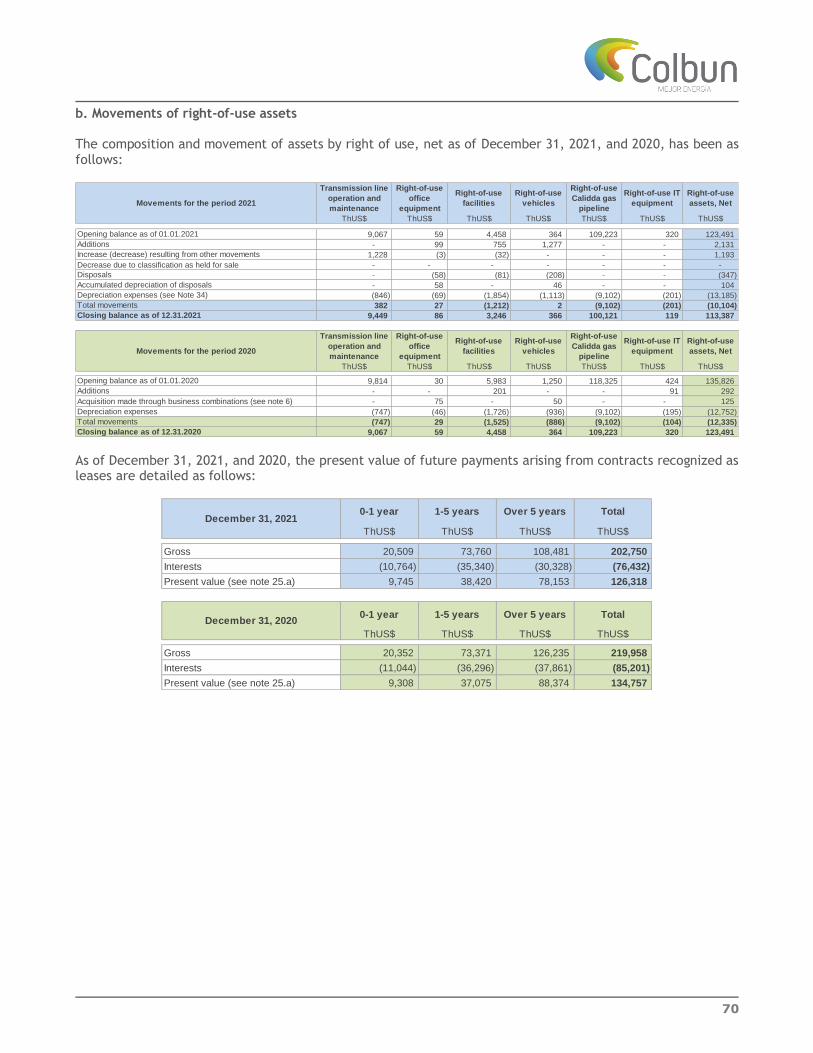
70
b. Movements of right-of-use assets The composition and movement of assets by right of use, net as of December 31, 2021, and 2020, has been as follows:
As of December 31, 2021, and 2020, the present value of future payments arising from contracts recognized as leases are detailed as follows:
Transmission line
operation and
maintenance
Right-of-use
office
equipment
Right-of-use
facilities
Right-of-use
vehicles
Right-of-use
Calidda gas
pipeline
Right-of-use IT
equipment
Right-of-use
assets, Net
ThUS$ ThUS$ ThUS$ ThUS$ ThUS$ ThUS$ ThUS$
9,067 59 4,458 364 109,223 320 123,491
- 99 755 1,277 - - 2,131
1,228 (3) (32) - - - 1,193
Decrease due to classification as held for sale - - - - - - -
- (58) (81) (208) - - (347)
- 58 - 46 - - 104
(846) (69) (1,854) (1,113) (9,102) (201) (13,185)
382 27 (1,212) 2 (9,102) (201) (10,104)
9,449 86 3,246 366 100,121 119 113,387
Transmission line
operation and
maintenance
Right-of-use
office
equipment
Right-of-use
facilities
Right-of-use
vehicles
Right-of-use
Calidda gas
pipeline
Right-of-use IT
equipment
Right-of-use
assets, Net
ThUS$ ThUS$ ThUS$ ThUS$ ThUS$ ThUS$ ThUS$
9,814 30 5,983 1,250 118,325 424 135,826
- - 201 - - 91 292
- 75 - 50 - - 125
(747) (46) (1,726) (936) (9,102) (195) (12,752)
(747) 29 (1,525) (886) (9,102) (104) (12,335)
9,067 59 4,458 364 109,223 320 123,491
Depreciation expenses (see Note 34)
Total movements
Closing balance as of 12.31.2021
Movements for the period 2021
Opening balance as of 01.01.2021
Additions
Increase (decrease) resulting from other movements
Disposals
Accumulated depreciation of disposals
Depreciation expenses
Total movements
Closing balance as of 12.31.2020
Movements for the period 2020
Opening balance as of 01.01.2020
Additions
Acquisition made through business combinations (see note 6)
ThUS$ ThUS$ ThUS$ ThUS$
Gross 20,509 73,760 108,481 202,750
Interests (10,764) (35,340) (30,328) (76,432)
Present value (see note 25.a) 9,745 38,420 78,153 126,318
ThUS$ ThUS$ ThUS$ ThUS$
Gross 20,352 73,371 126,235 219,958
Interests (11,044) (36,296) (37,861) (85,201)
Present value (see note 25.a) 9,308 37,075 88,374 134,757
December 31, 20210-1 year 1-5 years Over 5 years Total
Over 5 years Total December 31, 2020
0-1 year 1-5 years

71
21. Current taxes The balance of current taxes receivable and payable presented in current assets and liabilities as of December 31, 2021, and 2020, respectively, are detailed below:
a. Current tax assets
b. Current tax liabilities
22. Other non-financial assets As of December 31, 2021, and 2020, this caption comprises the following:
(1) Corresponds to advance payments to domestic and foreign suppliers.
(2) Credit under Article No.129 bis 20 of the Chilean Water Code, Decree Law No.1.122. The payment of these patents relates to the
implementation of projects that will use such water rights; accordingly, is an economic variable under permanent assessment by the
Company. Within this context, the Company accurately controls the payments made and acknowledges the estimates of project start-ups
to recognize the impairment of an asset, if it is foreseen that its use will be subsequent to the leverage ratio of the Fiscal Credit.
12.31.2021 12.31.2020
ThUS$ ThUS$
Recovarble taxes from previous years 3,130 991
Recverable taxes for the year (See note 23.a.1) 1,381 16,639
Other taxes to be recovered 2,530 -
Total 7,041 17,630
Current
12.31.2021 12.31.2020
ThUS$ ThUS$
Payable taxes for the year (See note 23.a.1) 89,232 7
Total 89,232 7
Current
12.31.2021 12.31.2020 12.31.2021 12.31.2020
ThUS$ ThUS$ ThUS$ ThUS$
Insurance premium for facilities and civil
responsibility 16,207 15,191 - -
Prepayments (1) 41,121 22,451 41,589 41,519
Patent for non-use of water rights (2) - - - 4,366
Other miscellaneous assets 150 258 1,633 1,783
Total 57,478 37,900 43,222 47,668
Current Non-current

72
23. Income taxes a. Income tax benefit (expense)
As of December 31, 2021, and 2020, income tax benefit (expense) and deferred taxes from foreign and domestic parties is detailed as follows:
2021 2020
ThUS$ ThUS$
Current income taxes (221,998) (74,386)
Adjustments to prior-year current income tax expense (96) 169
Total current income tax expense, net (222,094) (74,217)
Deferred income tax (expense) benefit
Deferred income tax benefit arising from temporary differences (62,898) 31,466
Total deferred income tax benefit, net (62,898) 31,466
Income tax benefit (expense) (284,992) (42,751)
Current income tax (expense) benefit
Income tax benefit (expense)
January - December
2021 2020
ThUS$ ThUS$
Domestic current income tax (expense) benefit (220,964) (74,125)
Foreign current income tax (expense) benefit (1,018) (92)
Total current income tax (expense) benefit, net (221,982) (74,217)
Domestic deferred income tax benefit (expense) (48,166) (12,083)
Foreign deferred income tax benefit (expense) (14,844) 43,549
Total deferred income tax benefit (expense) (63,010) 31,466
Income tax expense charged to profit or loss (284,992) (42,751)
Income tax benefit (expense)
January - December

73
a.1 Reconciliation of current taxes As of December 31, 2021, and 2020, the reconciliation of current taxes to income tax is as follows:
(1) Current tax result corresponds to balances recorded in the takeover balance sheet (See note 7). As of December 31, 2021, Colbún S.A., together with its subsidiaries, it generated tax profits, for which a tax expense was recorded, regarding the Provision for Consolidated Income Tax, net of monthly provisional payments (PPM) and credits for ThUS$ 89,232 In the case of the foreign subsidiary Fenix Power Perú S.A., as of December 31, 2021, it recognizes accumulated tax losses of ThUS$ 193,096, which are expected to be reversed in the future; accordingly, a deferred tax asset was recognized. In accordance with IAS 12, a deferred tax asset for tax losses is recognized when Management has determined that is probable that future taxable income will be available against which they can be offset. This situation occurs in subsidiaries that recognize tax losses.
Current taxes
(profit or loss)
Current taxes
for equity
adjustments
Monthly
provisional
income tax
payments
Other credits
Tax under
Article No. 21
(profit or
loss)
Tax assets Tax liabilities
ThUS$ ThUS$ ThUS$ ThUS$ ThUS$ ThUS$ ThUS$
Colbún S.A. (217,661) 7,584 120,876 932 - - (88,269)
Efizity Ingeniería SpA. (1) - - 7 10 - 17 -
Efizity SpA. (106) - 19 7 - - (80)
Efizity Perú SAC 1 1 -
Colbún Perú S.A. (1,018) - 135 - - - (883)
Inversiones Las Canteras S.A. - - 9 - - 9 -
Fenix Power S.A. - - 1,354 - - 1,354 -
Totales (218,785) 7,584 122,401 949 - 1,381 (89,232)
Current taxes
(profit or loss)
Current taxes
for equity
adjustments
Monthly
provisional
income tax
payments
Other credits
Tax under
Article No. 21
(profit or
loss)
Tax assets Tax liabilities
ThUS$ ThUS$ ThUS$ ThUS$ ThUS$ ThUS$ ThUS$
Colbún S.A. (58,207) 1,278 63,743 1,506 (99) 8,221 -
Colbún Transmisión S.A. (15,926) - 20,415 - - 4,489 -
Efizity Ingeniería SpA. (1) (6) - 21 - - 15 -
Colbún Perú S.A. (154) - 147 - - - (7)
Inversiones Las Canteras S.A. - - 4 - - 4 -
Fenix Power S.A. - - 864 3,046 - 3,910 -
Totales (74,293) 1,278 85,194 4,552 (99) 16,639 (7)
Current tax reconciliation
Current tax reconciliation
Company
12.31.2020
12.31.2021
Company

74
a.2 Reconciliation of consolidated tax expense and calculation of effective rate
(1) As of December 31, 2021, and 2020, the income tax expense was calculated using the tax rate of 27% (Law No. 20.780) that applies in
Chile. Regarding the differences in tax rates with foreign subsidiaries (29.5%), they are presented in other differences.
(2) In accordance with the International Financial Reporting Standards (IFRS), the Company and its subsidiaries recognize their tax and
financial operations at their functional currency which is the U.S. dollar, except for the subsidiaries of the Efizity Group. With respect to
the foreign subsidiaries, the local currency is used for tax purposes. (3) As of December 31, 2021, deferred income tax is recognized for the difference between the tax cost and the financial cost associated
with the sale of the investment of Colbún Transmisión S.A. for (ThUS$ 46,057) and other effects for ThUS$ 2,596
b. Deferred taxes At each reporting period, deferred tax assets and liabilities are detailed as follows:
(1) As of December 31, 2021, includes deferred tax for impairment in fixed assets.
Amount Rate Amount Rate
ThUS$ % ThUS$ %
Profit before income taxes 825,173 132,200
Tax expense using the legal rate (1) (222,797) 27.0% (35,694) 27.0%
Differences between US dollars and tax financial
accounting in local currency through deferred taxes (2) (13,542) 1.6% (13,500) 10.2%
Other differences (3) (48,653) 5.9% 6,443 -4.9%
Income tax expense (284,992) 34.5% (42,751) 32.3%
Income tax benefit (expense)
January - December
2021 2020
12.31.2021 12.31.2020
ThUS$ ThUS$
Deferred taxes related to tax losses 57,132 57,162
Deferred taxes related to provisions 29,245 24,857
Deferred taxes related to obligations for post-employment benefits 8,060 12,152
Deferred taxes related to anticipated income 1,774 5,938
Deferred taxes related to rights-of-use 2,766 1,998
Deferred taxes related to investments in subsidiaries and associates - 4,735
Deferred taxes related to contingencies 2,772 535
Deferred taxes related to unrealized gain or loss 292 292
Deferred tax assets 102,041 107,669
12.31.2021 12.31.2020
ThUS$ ThUS$
Deferred taxes related to depreciation (1) (929,851) (928,422)
Deferred taxes related to finance costs (18,246) (19,044)
Deferred taxes related to intangible assets (9,849) (11,787)
Deferred taxes related to inventory (1,636) (518)
Deferred taxes related to hedging instruments 1,584 (217)
Deferred tax liabilities (957,998) (959,988)
Total deferred tax assets and liabilities, net (855,957) (852,319)
Deferred tax assets
Deferred tax liabilities

75
(1) See note 3.1.c
The net position of deferred taxes per company is as follows:
12.31.2021 12.31.2020
ThUS$ ThUS$
Deferred taxes as of January 1 (852,319) (885,155)
Tax losses (30) 9,058
Hedging instruments 1,801 (884)
Intangible assets 1,938 909
Rights-of-use assets 768 937
Contingencies 2,237 489
Obligations for post-employment benefits (4,092) 2,316
Unearned revenue (4,164) (296)
Investments in associates (1) (4,735) -
Inventory (848) (2,008)
Provisions 4,118 3,554
Finance costs 798 (5,204)
Property, plant and equipment (1,429) 23,965
Closing balance (855,957) (852,319)
Deferred taxes movements
12.31.2021 12.31.2020 12.31.2021 12.31.2020
ThUS$ ThUS$ ThUS$ ThUS$
Fenix Power Perú S.A. 66,191 81,122 - -
Santa Sofía SpA. 173 156 - -
Efizity SpA. 175 63 - -
Efizity Ingeniería SpA. 130 49 - -
Efizity Perú SAC 20 33 - -
Desaladora del Sur S.A. 1
Inversiones de Las Canteras S.A. - - (489) (570)
Colbún Transmisión S.A. - - - (57,193)
Colbún S.A. - - (922,158) (875,979)
Total 66,690 81,423 (922,647) (933,742)
(855,957) (852,319)Net deferred taxes
Net deferred tax position by company
Company
Net position
Non-current asset Non-current liability

76
c. Income taxes in other comprehensive income
24. Other financial liabilities As of December 31, 2021, and 2020, this caption comprises the following: a. Obligations with financial institutions
(1) Interest accrued for bonds payable have been determined using the effective rate.
(2) See note 15.1
b. Financial debt by currency The financial debt value of Colbún (bank liabilities and bonds), considering only the effect of derivative instruments (liability position) is as follows:
2021 2020
ThUS$ ThUS$
Related to cash flow hedges 8,750 1,618
Related to defined benefit plans (3,728) 1,070
Income tax related to components of other comprehensive income 5,022 2,688
Related to share of other comprehensive profit or loss on equity-accounted
associates and joint ventures using the equity method(66) 5
Income tax related to components of other comprehensive income 4,956 2,693
January - December
12.31.2021 12.31.2020 12.31.2021 12.31.2020
ThUS$ ThUS$ ThUS$ ThUS$
Interest-Bearing Loans 25,046 25,313 - 218
Bond payables (Bonds, bills of exchange) (1) 214,896 76,937 1,944,259 1,559,048
Hedging derivatives (2) 39,176 858 - -
Total 279,118 103,108 1,944,259 1,559,266
Corrientes No corrientes
Other financial liabilities
12.31.2021 12.31.2020
ThUS$ ThUS$
U.S. Dollar 2,186,236 1,606,384
Inflation-adjusted units 37,141 55,571
Pesos - 419
Total 2,223,377 1,662,374
Financial debt by currency

77
c. Maturity and currency of the obligations with financial institutions c.1 Bank borrowings
Debtor's Tax ID No. 0-E 0-E
Debtor's name Fenix Power
Perú S.A.
Fenix Power
Perú S.A.
Debtor's country Perú Perú
Creditor's ID number 0-E 0-E
Creditor´s name
Banco de
Credito del
Perú
Scotiabank
Country of the creditor company Peru Peru
Currency or inflation-adjusted unit US$ US$
Amortization frequency Annual Annual
Interest type Variable Fixed
Basis - -
Effective rate 2.02% 2.1%
Nominal rate 2.02% 2.1%
Nominal amounts Total
Up to 90 days - - -
90 days to 1 year 10,002 15,044 25,046
1-3 years - - -
1-2 years - - -
2-3 years - - -
3-5 years - - -
3-4 years - - -
4-5 years - - -
Over 5 years - - -
Subtotal nominal amounts 10,002 15,044 25,046
Carrying amounts Total
Up to 90 days - - -
90 days to 1 year 10,002 15,044 25,046
Current Interest-Bearing
Loans10,002 15,044 25,046
1-3 years - - -
1-2 years - - -
2-3 years - - -
3-5 years - - -
3-4 years - - -
4-5 years - - -
Over 5 years - - -
Non-current Interest-Bearing
Loans- - -
Total Interest-Bearing Loans 10,002 15,044 25,046
As of December 31, 2021
ThUS$
ThUS$
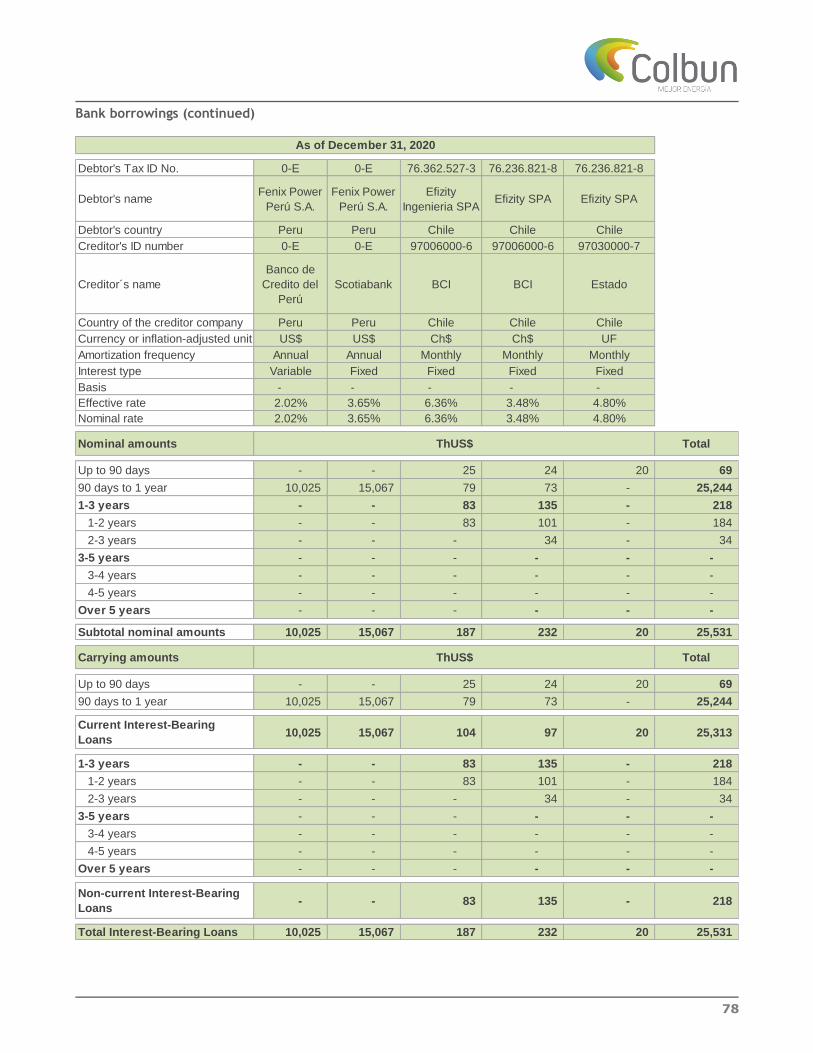
78
Bank borrowings (continued)
Debtor's Tax ID No. 0-E 0-E 76.362.527-3 76.236.821-8 76.236.821-8
Debtor's name Fenix Power
Perú S.A.
Fenix Power
Perú S.A.
Efizity
Ingenieria SPAEfizity SPA Efizity SPA
Debtor's country Peru Peru Chile Chile Chile
Creditor's ID number 0-E 0-E 97006000-6 97006000-6 97030000-7
Creditor´s name
Banco de
Credito del
Perú
Scotiabank BCI BCI Estado
Country of the creditor company Peru Peru Chile Chile Chile
Currency or inflation-adjusted unit US$ US$ Ch$ Ch$ UF
Amortization frequency Annual Annual Monthly Monthly Monthly
Interest type Variable Fixed Fixed Fixed Fixed
Basis - - - - -
Effective rate 2.02% 3.65% 6.36% 3.48% 4.80%
Nominal rate 2.02% 3.65% 6.36% 3.48% 4.80%
Nominal amounts Total
Up to 90 days - - 25 24 20 69
90 days to 1 year 10,025 15,067 79 73 - 25,244
1-3 years - - 83 135 - 218
1-2 years - - 83 101 - 184
2-3 years - - - 34 - 34
3-5 years - - - - - -
3-4 years - - - - - -
4-5 years - - - - - -
Over 5 years - - - - - -
Subtotal nominal amounts 10,025 15,067 187 232 20 25,531
Carrying amounts Total
Up to 90 days - - 25 24 20 69
90 days to 1 year 10,025 15,067 79 73 - 25,244
Current Interest-Bearing
Loans10,025 15,067 104 97 20 25,313
1-3 years - - 83 135 - 218
1-2 years - - 83 101 - 184
2-3 years - - - 34 - 34
3-5 years - - - - - -
3-4 years - - - - - -
4-5 years - - - - - -
Over 5 years - - - - - -
Non-current Interest-Bearing
Loans- - 83 135 - 218
Total Interest-Bearing Loans 10,025 15,067 187 232 20 25,531
ThUS$
As of December 31, 2020
ThUS$

79
c.2 Bonds payable
Debtor's Tax ID No. 96.505.760-9 96.505.760-9 96.505.760-9 96.505.760-9 96.505.760-9 96.505.760-9 0-E
Debtor's name Colbún S.A. Colbún S.A. Colbún S.A. Colbún S.A. Colbún S.A. Colbún S.A.Fenix Power
Peru S.A.
Debtor's country Chile Chile Chile Chile Chile Chile Peru
Creditor's ID number 499 538 - - - - -
Serie Serie F Serie I 144A/RegS 144A/RegS 144A/RegS 144A/RegS 144A/RegS
Maturity date 05-01-2028 06-10-2029 10-10-2027 07-10-2024 03-06-2030 01-19-2032 09-20-2027
Currency or inflation-adjusted unit UF UF US$ US$ US$ US$ US$
Amortization frequency Biannual Biannual Biannual Bullet Bullet Bullet Biannual
Interest type Fixed Fixed Fixed Fixed Fixed Fixed Fixed
Basis Fixed Fixed Fixed Fixed Fixed Fixed Fixed
Effective rate 4.46% 5.02% 5.11% 4.80% 3.89% 3.33% 4.57%
Nominal rate 3.40% 4.50% 3.95% 4.50% 3.15% 3.15% 4.32%
Nominal amounts Total ThUS$
Up to 90 days 95,902 75,223 - 3,345 4,988 - 13,500 192,958
90 days to 1 year - - 4,334 - - 3,728 13,500 21,562
1-3 years - - - 157,410 - - 52,000 209,410
1-2 years - - - - - 28,000 28,000
2-3 years - - - 157,410 - 24,000 181,410
3-5 years - - - - - - 34,000 34,000
3-4 years - - - - - 16,000 16,000
4-5 years - - - - - 18,000 18,000
Over 5 years - - 500,000 - 500,000 600,000 168,000 1,768,000
Subtotal nominal amounts 95,902 75,223 504,334 160,755 504,988 603,728 281,000 2,225,930
Carrying amounts Total ThUS$
Up to 90 days 93,850 74,282 - 3,345 4,988 - 16,870 193,335
90 days to 1 year - - 4,334 - - 3,727 13,500 21,561
Current performance bonds 93,850 74,282 4,334 3,345 4,988 3,727 30,370 214,896
1-3 years - - - 156,513 - - 50,981 207,494
1-2 years - - - - - - 27,468 27,468
2-3 years - - - 156,513 - - 23,513 180,026
3-5 years - - - - - - 33,117 33,117
3-4 years - - - - - - 15,548 15,548
4-5 years - - - - - - 17,569 17,569
Over 5 years - - 471,485 - 474,077 590,889 167,197 1,703,648
Non-current performance bonds - - 471,485 156,513 474,077 590,889 251,295 1,944,259
Total performance bonds 93,850 74,282 475,819 159,858 479,065 594,616 281,665 2,159,155
As of December 31, 2021
ThUS$
ThUS$

80
Bonds payable (continued)
Debtor's Tax ID No. 96.505.760-9 96.505.760-9 96.505.760-9 96.505.760-9 96.505.760-9 96.505.760-9 0-E
Debtor's name Colbún S.A. Colbún S.A. Colbún S.A. Colbún S.A. Colbún S.A. Colbún S.A.Fenix Power
Peru S.A.
Debtor's country Chile Chile Chile Chile Chile Chile Peru
Creditor's ID number 234 499 538 - - - -
Serie Serie C Serie F Serie I 144A/RegS 144A/RegS 144A/RegS 144A/RegS
Maturity date 10-15-2021 05-01-2028 06-10-2029 10-10-2027 07-10-2024 03-06-2030 09-20-2027
Currency or inflation-adjusted unit UF UF UF US$ US$ US$ US$
Amortization frequency Biannual Biannual Biannual Bullet Bullet Bullet Biannual
Interest type Fixed Fixed Fixed Fixed Fixed Fixed Fixed
Basis Fixed Fixed Fixed Fixed Fixed Fixed Fixed
Effective rate 8.10% 4.46% 5.02% 5.11% 4.80% 3.89% 4.57%
Nominal rate 7.00% 3.40% 4.50% 3.95% 4.50% 3.15% 4.32%
Nominal amounts Total ThUS$
Up to 90 days - - - - 3,345 4,988 15,657 23,990
90 days to 1 year 8,793 17,031 11,384 4,334 - - 12,000 53,542
1-3 years - 32,706 22,300 - - - 55,000 110,006
1-2 years - 16,353 11,150 - - - 27,000 54,503
2-3 years - 16,353 11,150 - - - 28,000 55,503
3-5 years - 32,706 22,300 - 157,410 - 40,000 252,416
3-4 years - 16,353 11,150 - 157,410 - 24,000 208,913
4-5 years - 16,353 11,150 - - - 16,000 43,503
Over 5 years - 40,883 39,025 500,000 - 500,000 186,000 1,265,908
Subtotal nominal amounts 8,793 123,326 95,009 504,334 160,755 504,988 308,657 1,705,862
Carrying amounts Total ThUS$
Up to 90 days - - - - 3,345 4,988 15,657 23,990
90 days to 1 year 8,712 16,674 11,227 4,334 - - 12,000 52,947
Current performance bonds 8,712 16,674 11,227 4,334 3,345 4,988 27,657 76,937
1-3 years - 31,992 21,986 - - - 53,892 107,870
1-2 years - 15,996 10,993 - - - 26,424 53,413
2-3 years - 15,996 10,993 - - - 27,468 54,457
3-5 years - 31,992 21,986 - 156,215 - 39,061 249,254
3-4 years - 15,996 10,993 - 156,215 - 23,513 206,717
4-5 years - 15,996 10,993 - - - 15,548 42,537
Over 5 years - 39,993 38,479 467,301 - 471,411 184,740 1,201,924
Non-current performance bonds - 103,977 82,451 467,301 156,215 471,411 277,693 1,559,048
Total performance bonds 8,712 120,651 93,678 471,635 159,560 476,399 305,350 1,635,985
As of December 31, 2020
ThUS$
ThUS$
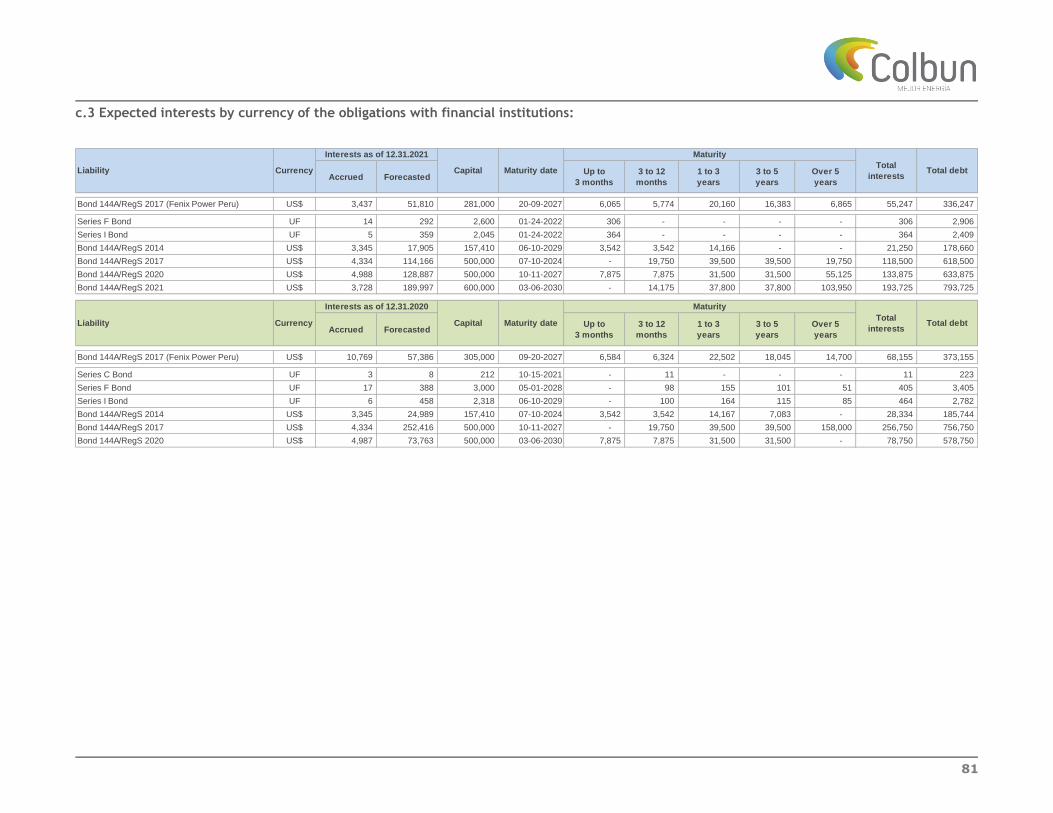
81
c.3 Expected interests by currency of the obligations with financial institutions:
Bond 144A/RegS 2017 (Fenix Power Peru) US$ 3,437 51,810 281,000 20-09-2027 6,065 5,774 20,160 16,383 6,865 55,247 336,247
Series F Bond UF 14 292 2,600 01-24-2022 306 - - - - 306 2,906
Series I Bond UF 5 359 2,045 01-24-2022 364 - - - - 364 2,409
Bond 144A/RegS 2014 US$ 3,345 17,905 157,410 06-10-2029 3,542 3,542 14,166 - - 21,250 178,660
Bond 144A/RegS 2017 US$ 4,334 114,166 500,000 07-10-2024 - 19,750 39,500 39,500 19,750 118,500 618,500
Bond 144A/RegS 2020 US$ 4,988 128,887 500,000 10-11-2027 7,875 7,875 31,500 31,500 55,125 133,875 633,875
Bond 144A/RegS 2021 US$ 3,728 189,997 600,000 03-06-2030 - 14,175 37,800 37,800 103,950 193,725 793,725
Bond 144A/RegS 2017 (Fenix Power Peru) US$ 10,769 57,386 305,000 09-20-2027 6,584 6,324 22,502 18,045 14,700 68,155 373,155
Series C Bond UF 3 8 212 10-15-2021 - 11 - - - 11 223
Series F Bond UF 17 388 3,000 05-01-2028 - 98 155 101 51 405 3,405
Series I Bond UF 6 458 2,318 06-10-2029 - 100 164 115 85 464 2,782
Bond 144A/RegS 2014 US$ 3,345 24,989 157,410 07-10-2024 3,542 3,542 14,167 7,083 - 28,334 185,744
Bond 144A/RegS 2017 US$ 4,334 252,416 500,000 10-11-2027 - 19,750 39,500 39,500 158,000 256,750 756,750
Bond 144A/RegS 2020 US$ 4,987 73,763 500,000 03-06-2030 7,875 7,875 31,500 31,500 - 78,750 578,750
Total
interestsTotal debt
Total
interestsTotal debt
3 to 5
years
Over 5
years
Maturity
Maturity
Up to
3 months
3 to 12
months
1 to 3
years
3 to 5
years
Over 5
years
Up to
3 months
3 to 12
months
1 to 3
years
Maturity dateCurrencyLiability
Interests as of 12.31.2021
Interests as of 12.31.2020
Liability Currency Maturity date
Accrued Forecasted
Accrued ForecastedCapital
Capital

82
d. Committed and uncommitted revolving credit facilities The Company has uncommitted bank lines for an approximate amount of US$ 150 million. Fenix Power has uncommitted lines for a total of US$ 25 million, contracted with two local banks. Other Lines: The Company has three bond lines registered in the CMF, one for an amount of UF 7 million with a term of thirty years (since its approval in August 2009), and two for a joint amount of UF 7 million with a term of ten and thirty years (since its approval in February 2020), and against which no placements have been performed as of to date. 25. Lease Liabilities As of December 31, 2021, and 2020, this caption comprises the following:

83
Lease obligation
(1) See note 20.a.2
Debtor's Tax ID No. 96505760-9 96505760-9 96505760-9 96505760-9 96505760-9 76362527-3 0-E 0-E 0-E 0-E 0-E 0-E 0-E
Debtor's name Colbún S.A. Colbún S.A. Colbún S.A. Colbún S.A. Colbún S.A.
Efizity
Ingenieria
SPA
Fenix Power
Peru S.A.
Fenix Power
Peru S.A.
Fenix Power
Peru S.A.
Fenix Power
Peru S.A.
Fenix Power
Peru S.A.
Fenix Power
Peru S.A.
Fenix Power
Peru S.A.
Debtor's country Chile Chile Chile Chile Chile Chile Peru Peru Peru Peru Peru Peru Peru
Creditor's Tax ID No. 96656410-5 96860250-0 96565580-8 96587380-5 76497459-k 79812610-5 0-E 0-E 0-E 0-E 0-E 0-E 0-E
Creditor's name
Bice Vida
Compania De
Seguros S.A.
B.Raices
Santa Lucia
SA
Cia. De
Leasing
Tattersall S.A.
Vigatec S.A.Nuevo Capital
Leasing SpA
Inmobiliaria
Arturo Prat
Ltda.
Laila Fatima
Gaber B.
Renta Equipos
SA
Renta Equipos
SA
Ricoh del
Perú SAC
Inversiones
Nuevo Capital
PerúCalidda
(1)
Consorcio
Transmantaro
S.A.
Creditor's country Chile Chile Chile Chile Chile Chile Peru Peru Peru Peru Peru Peru Peru
Currency or inflation-adjusted unit UF UF UF UF UF U.F. US$ US$ US$ US$ US$ US$ US$
Amortization frequency Monthly Monthly Monthly Monthly Monthly Monthly Monthly Monthly Monthly Monthly Monthly Monthly Quaterly
Interest type Fixed Fixed Fixed Fixed Fixed Fixed Fixed Fixed Fixed Fixed Fixed Fixed Fixed
Basis - - - - - Annual - - - - - - -
Effective rate 5.00% 5.00% 5.00% 5.00% 0.40% 1.31% 5.50% 3.40% 4.00% 3.40% 4.00% 7.00% 12.00%
Nominal rate 5.00% 5.00% 5.00% 5.00% 0.40% 1.31% 5.50% 3.40% 4.00% 3.40% 4.00% 7.00% 12.00%
Nominal amounts Total ThUS$
Up to 90 days 214 185 178 51 (102) 18 2 8 1 2 9 1,730 165 2,461
90 days to 1 year 659 568 - 136 43 49 10 30 4 6 35 5,192 525 7,257
1-3 years 530 456 - 326 - - 67 143 24 14 6 15,333 1,655 18,554
1-2 years 530 456 - 186 - - 23 57 10 12 6 7,407 778 9,465
2-3 years - - - 140 - - 44 86 14 2 - 7,926 877 9,089
3-5 years - - - 142 - - 193 9 13 - - 17,554 1,957 19,868
3-4 years - - 142 - - 83 9 13 - - 8,480 923 9,650
4-5 years - - - - - - 110 - - - - 9,074 1,034 10,218
Over 5 years - - - - - - - - - - - 69,451 8,702 78,153
Subtotal nominal amounts 1,403 1,209 178 655 (59) 67 272 190 42 22 50 109,260 13,004 126,293
Carrying amounts Total ThUS$
Up to 90 days 214 185 178 51 (102) 18 2 8 1 2 9 1,730 165 2,461
90 days to 1 year 659 568 - 136 43 49 36 30 5 6 36 5,192 525 7,285
Liabilities under lease
agreements, current873 753 178 187 (59) 67 38 38 6 8 45 6,922 690 9,746
1-3 years 530 456 - 326 - - 67 143 24 14 5 15,333 1,655 18,553
1-2 years 530 456 - 186 - - 23 57 10 12 5 7,407 778 9,464
2-3 years - - - 140 - - 44 86 14 2 - 7,926 877 9,089
3-5 years - - - 142 - - 193 9 12 - - 17,554 1,957 19,867
3-4 years - - 142 - - 83 9 12 - - 8,480 923 9,649
4-5 years - - - - - - 110 - - - - 9,074 1,034 10,218
Over 5 years - - - - - - - - - - - 69,450 8,702 78,152
Liabilities under lease
agreements, non-current530 456 - 468 - - 260 152 36 14 5 102,337 12,314 116,572
Total liabilities under lease
agreements1,403 1,209 178 655 (59) 67 298 190 42 22 50 109,259 13,004 126,318
As of December 31, 2021
ThUS$
ThUS$

84
Lease obligation (continued)
Debtor's Tax ID No. 96505760-9 96505760-9 96505760-9 96505760-9 96505760-9 76218856-2 76218856-2 76218856-2 76362527-3 76236821-8 76236821-8 76236821-8 0-E 0-E 0-E 0-E 0-E 0-E
Debtor's name Colbún S.A. Colbún S.A. Colbún S.A. Colbún S.A. Colbún S.A.
Colbún
Transmisión
S.A.
Colbún
Transmisión
S.A.
Colbún
Transmisión
S.A.
Efizity
Ingenieria
SPA
Efizity SPA Efizity SPA Efizity SPAFenix Power
Peru S.A.
Fenix Power
Peru S.A.
Fenix Power
Peru S.A.
Fenix Power
Peru S.A.
Fenix Power
Peru S.A.
Fenix Power
Peru S.A.
Debtor's country Chile Chile Chile Chile Chile Chile Chile Chile Chile Chile Chile Chile Peru Peru Peru Peru Peru Peru
Creditor's Tax ID No. 96656410-5 96860250-0 96565580-8 96587380-5 76497459-k 96565580-8 7065425-3 88723500-7 79812610-5 97006000-6 97006000-6 97006000-6 0-E 0-E 0-E 0-E 0-E 0-E
Creditor's name
Bice Vida
Compania
De Seguros
S.A.
B.Raices
Santa Lucia
SA
Cia. De
Leasing
Tattersall
S.A.
Vigatec S.A.
Nuevo
Capital
Leasing SpA
Cia. De
Leasing
Tattersall S.A.
Jorge Rocco
Pizarro
Constructora
Costa Brava
Ltda.
Inmobiliaria
Arturo Prat
Ltda.
BCI Leasing BCI Leasing BCI LeasingLaila Fatima
Gaber B.
Arrendamient
o Operativo
CIB S.A.
T-COPIA
Inversiones
Nuevo
Capital Perú
Calidda (1)
Consorcio
Transmantaro
S.A.
Creditor's country Chile Chile Chile Chile Chile Chile Chile Chile Chile Chile Chile Chile Peru Peru Peru Peru Peru Peru
Currency or inflation-adjusted unit UF UF UF UF UF UF UF UF UF UF UF UF US$ US$ US$ US$ US$ US$
Amortization frequency Monthly Monthly Monthly Monthly Monthly Monthly Monthly Monthly Monthly Monthly Monthly Monthly Monthly Monthly Monthly Monthly Monthly Quaterly
Interest type Fixed Fixed Fixed Fixed Fixed Fixed Fixed Fixed Fixed Fixed Fixed Fixed Fixed Fixed Fixed Fixed Fixed Fixed
Basis - - - - - - - - Anual Anual Anual Anual - - - - - -
Effective rate 5.00% 5.00% 5.00% 5.00% 0.40% 5.00% 1.70% 0.00% 1.31% 7.37% 11.75% 8.27% 5.50% 5.50% 4.10% 4.00% 7.00% 12.00%
Nominal rate 5.00% 5.00% 5.00% 5.00% 0.40% 5.00% 1.70% 0.00% 1.31% 7.37% 11.75% 8.27% 5.50% 5.50% 4.10% 4.00% 7.00% 12.00%
Nominal amounts Total ThUS$
Up to 90 days 205 176 140 12 82 36 10 6 19 1 1 1 1 8 6 6 1,617 146 2,473
90 days to 1 year 628 542 - 36 128 - 29 18 45 2 4 5 6 17 - 22 4,852 467 6,801
1-3 years 1,402 1,209 - 98 85 - 50 - - - 8 10 35 - - 50 14,329 1,468 18,744
1-2 years 873 753 - 48 85 - 40 - - - 7 8 12 - - 45 6,922 690 9,483
2-3 years 529 456 - 50 - - 10 - - - 1 2 23 - - 5 7,407 778 9,261
3-5 years - - - - - - - - - - - - 127 - - - 16,405 1,800 18,332
3-4 years - - - - - - - - - - - 44 - - - 7,925 877 8,846
4-5 years - - - - - - - - - - - - 83 - - - 8,480 923 9,486
Over 5 years - - - - - - - - - - - - 109 - - - 78,527 9,736 88,372
Subtotal nominal amounts 2,235 1,927 140 146 295 36 89 24 64 3 13 16 278 25 6 78 115,730 13,617 134,722
Carrying amounts Total ThUS$
Up to 90 days 205 176 140 12 82 36 10 6 19 2 2 1 1 8 6 6 1,617 146 2,475
90 days to 1 year 628 542 - 36 128 - 29 18 45 3 6 7 33 17 - 22 4,852 467 6,833
Liabilities under lease
agreements, current833 718 140 48 210 36 39 24 64 5 8 8 34 25 6 28 6,469 613 9,308
1-3 years 1,402 1,209 - 98 85 - 50 - - - 8 10 35 - - 50 14,329 1,468 18,744
1-2 years 873 753 - 48 85 - 40 - - - 7 7 12 - - 45 6,922 690 9,482
2-3 years 529 456 - 50 - - 10 - - - 1 3 23 - - 5 7,407 778 9,262
3-5 years - - - - - - - - - - - - 127 - - - 16,405 1,800 18,332
3-4 years - - - - - - - - - - - 44 - - - 7,925 877 8,846
4-5 years - - - - - - - - - - - - 83 - - - 8,480 923 9,486
Over 5 years - - - - - - - - - - - - 110 - - - 78,527 9,736 88,373
Liabilities under lease
agreements, non-current1,402 1,209 - 98 85 - 50 - - - 8 10 272 - - 50 109,261 13,004 125,449
Total liabilities under lease
agreements2,235 1,927 140 146 295 36 89 24 64 5 16 18 306 25 6 78 115,730 13,617 134,757
ThUS$
ThUS$
As of December 31, 2020

85
26. Trade and other payables As of December 31, 2021, and 2020, trade and other payables are composed of the following:
The main suppliers or creditors, with their respective representativeness percentages as of December 31, 2021, are:
Aging of the portfolio of trade and other payables:
As of December 31, 2021, the amounts payable for invoices receivable for goods and services amount to ThUS$ 159,487; as of December 31, 2020, it amounted to ThUS$ 74,446. For accounts payable to suppliers, the average payment period is 15 days from the date of receipt of the invoice; as a result of this, the fair value does not differ significantly from the related carrying amount.
12.31.2021 12.31.2020 12.31.2021 12.31.2020
ThUS$ ThUS$ ThUS$ ThUS$
Trade payables 190,576 108,776 - -
Dividends payable 1,907 942 - -
Other payables 13,223 8,010 9,475 12,952
Total 205,706 117,728 9,475 12,952
Current Non-current
Main Commercial Creditors %
GE Global Parts & Products Gmbh 5.01%
Ing. y Construcción Sigdo Koppers S.A. 4.32%
Trina Solar (Chile) SpA 4.22%
CMC - Coal Marketing Dac 2.73%
Comité de Operación Económica del Sist.Interconectado Nacional 2.02%
Transportadora de Gas del Perú S.A. 1.70%
Ingeniería Agrosonda Ltda. 1.70%
Gas Natural de Lima y Callao S.A. 1.39%
Pluspetrol Peru Corporation S.A. 1.27%
Zimmerman PV Tracker Gmbh 1.26%
Siemens Energy, Inc. 1.15%
Otros 73.22%
100.00%
Current
ThUS$
Total
ThUS$
Current
ThUS$
Total
ThUS$
Goods 80,817 80,817 29,545 29,545
Services 82,051 82,051 74,631 74,631
Others 27,708 27,708 4,600 4,600
Total 190,576 190,576 108,776 108,776
Balance as of 12.31.2020
Concept
Balance as of 12.31.2021

86
27. Other provisions a. Description of provisions As of December 31, 2021, and 2020, this caption comprises the following:
b. Movements in provisions during the period As of December 31, 2021, and 2020, this caption comprises the following:
(1) Provisions for differences and/or tax administrative contingencies (see note 39.c). (2) Corresponds to the provision for tax expense that is levied on the emissions on thermoelectric plants (Law 20,780).
c. Decommissioning The non-current balance corresponds to the disbursement related to the decommission of certain facilities, and future costs associated with the removal of certain assets and rehabilitation of specific land. d. Restructuring The Company has not established or recorded any provisions for this concept.
12.31.2021 12.31.2020 12.31.2021 12.31.2020
ThUS$ ThUS$ ThUS$ ThUS$
From legal proceedings 12,478 3,785 - -
Decommissioning, restoration and rehabilitation costs - - 56,858 46,785
Related to the environment 30,866 25,585 - -
Total 43,344 29,370 56,858 46,785
Provisions
Current Non-current
From legal
proceedings (1)
Decommissioning,
restoration and
rehabilitation costs
Related to the
environment (2) Total
ThUS$ ThUS$ ThUS$ ThUS$
Opening balance as of 01.01.2021 3,785 46,785 25,585 76,155
Increase (decrease) related to transfers and other changes, other provisions (1,220) - - (1,220)
Increase in existing provisions, other provisions 9,913 10,073 24,794 44,780
Provisions used, other provisions - - (19,513) (19,513)
Balance as of 12.31.2021 12,478 56,858 30,866 100,202
From legal
proceedings (1)
Decommissioning,
restoration and
rehabilitation costs
Related to the
environment (2) Total
ThUS$ ThUS$ ThUS$ ThUS$
Opening balance as of 01.01.2020 1,976 35,259 24,718 61,953
Increase in existing provisions, other provisions 1,809 11,526 25,584 38,919
Provision used, other provisions - - (24,717) (24,717)
Balance as of 12.31.2020 3,785 46,785 25,585 76,155
Movements in provisions
Movements in provisions

87
e. Litigations As of December 31, 2021, and 2020, the Company recognized provisions for litigation in accordance with IAS 37 (see note 39, letter c). 28. Provisions for employee benefits a. Employee benefits The Company recognizes provisions for benefits and bonuses for its employees, such as accrued vacations, benefits for termination of project contracts and performance incentives. As of December 31, 2021, and 2020, this caption comprises the following:
b. Movements in provision during the period As of December 31, 2021, and 2020, this caption comprises the following:
c. Provision for employee benefits, non-current
The Company and some subsidiaries have recorded a provision to cover the indemnity payments in accordance with the collective and individual bargaining agreements entered with its employees. This provision represents the total accrued provision (see note 3.1. m.).
12.31.2021 12.31.2020 12.31.2021 12.31.2020
ThUS$ ThUS$ ThUS$ ThUS$
Accrued vacations, current 5,935 5,655 - -
Performance bonus, current 9,439 11,439 - -
Other benefits - - 2,025 2,398
Provision for severance indemnity payments 8,052 7,060 23,916 40,600
Total 23,426 24,154 25,941 42,998
Employee benefits
Current Non-current
ThUS$ ThUS$ ThUS$ ThUS$ ThUS$
Opening balance as of 01.01.2021 5,655 11,439 - 7,060 24,154
Increase in existing provisions, other provisions 280 9,203 - 992 10,475
Provision used, other provisions - (11,203) - - (11,203)
Balance as of 12.31.2021 5,935 9,439 - 8,052 23,426
Total
ThUS$ ThUS$ ThUS$ ThUS$ ThUS$
Opening balance as of 01.01.2020 3,842 10,358 373 5,259 19,832
Increase in existing provisions, other provisions 2,044 10,603 482 1,801 14,930
Provision used, other provisions (231) (9,522) (855) - (10,608)
Balance as of 12.31.2020 5,655 11,439 - 7,060 24,154
TotalMovements in provisions
Movements in provisions
Accrued
vacations,
current
Accrued
vacations,
current
Provision for
severance
indemnity
payments
Provision for
severance
indemnity
payments
Performance
bonus, current
Performance
bonus, current
Other benefits,
current
Other benefits,
current

88
The basis for the actuarial calculation of the obligations with employees is permanently assessed by the Company. As of December 31, 2021, the Company has updated some indicators to better reflect the current market conditions. i) The detail of provision for employee benefits - As of December 31, 2021, and 2020, this caption comprises the following:
ii) Actuarial assumptions - The main assumptions used for actuarial calculation purposes are as follows:
Discount rate: Corresponds to the interest rate to be used to show in present value terms the disbursements expected to be realized in the future. The discount rate was determined based on the bonds denominated in inflation-adjusted units (UF) of the Chilean Central Bank with a 20-year term as of December 31, 2021. The source of the reference rate is Chilean Central Bank. Salary increase rate: Refers to the salary increase rate estimated by the Company for the employee salaries based on the internal compensation policy. Personnel turnover rate: Refers to the personnel turnover rate calculated by the Company based on its historical information. Age of retirement: Refers to the legal retirement age for men and women in accordance with the Decree Law 3,500 that includes the standards governing the current Chilean pension system. Mortality rate: Refers to the mortality rate published by the Chilean Financial Market Commission.
12.31.2021 12.31.2020
ThUS$ ThUS$
31,968 47,660
31,968 47,660
12.31.2021 12.31.2020
ThUS$ ThUS$
47,660 37,039
4,775 5,086
687 151
(7,546) 1,969
(12,196) 4,384
(1,412) (969)
31,968 47,660
Provision for employee benefits
Total
Payments
Interest cost
Foreign currency translation differences
Actuarial gain (loss)
Present value of the obligation for defined benefit
plans
Opening balance as of January 1
Severance indemnity payments
Closing balance
Cost of current service
2.49% 0.20%
1.62% 1.62%
Voluntary 4.20% 2.20%
Dismissal 3.40% 2.70%
Men 65 65
Women 60 60
RV-2014 RV-2014Mortality rate
12.31.2021 12.31.2020
Turnover rate
Retirement age
Actuarial basis used
Discount rate
Expected rate of salary increases
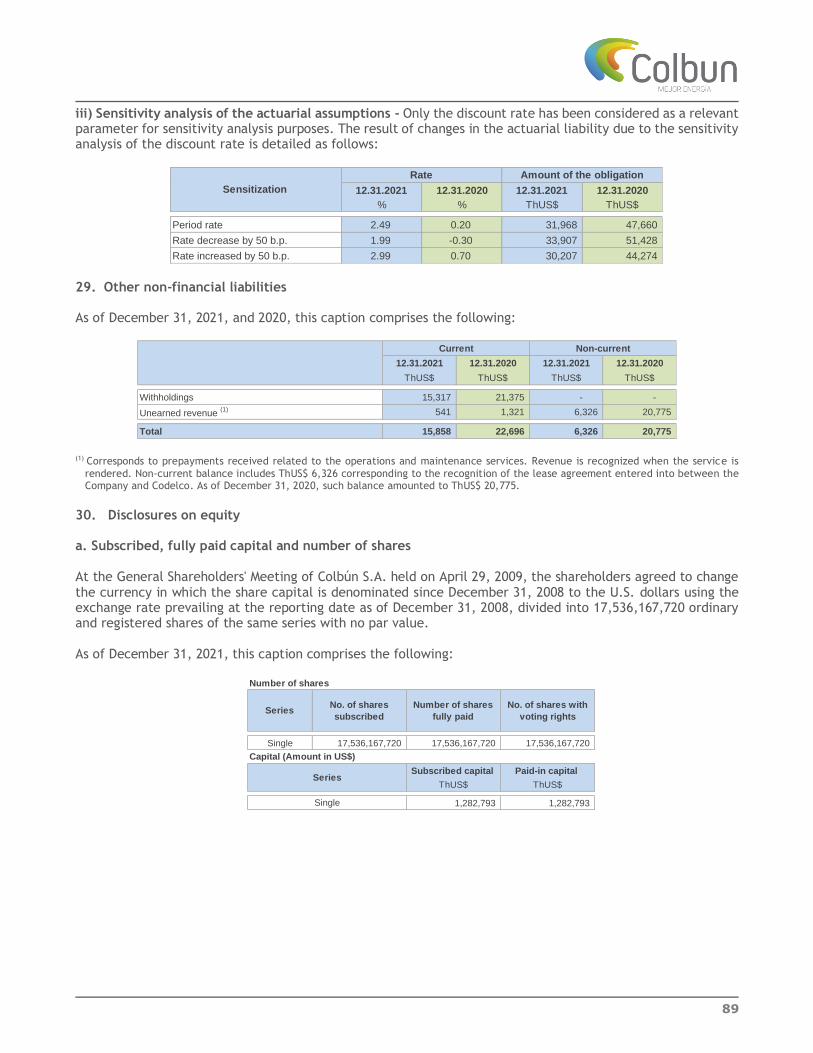
89
iii) Sensitivity analysis of the actuarial assumptions - Only the discount rate has been considered as a relevant parameter for sensitivity analysis purposes. The result of changes in the actuarial liability due to the sensitivity analysis of the discount rate is detailed as follows:
29. Other non-financial liabilities As of December 31, 2021, and 2020, this caption comprises the following:
(1) Corresponds to prepayments received related to the operations and maintenance services. Revenue is recognized when the service is
rendered. Non-current balance includes ThUS$ 6,326 corresponding to the recognition of the lease agreement entered into between the Company and Codelco. As of December 31, 2020, such balance amounted to ThUS$ 20,775.
30. Disclosures on equity a. Subscribed, fully paid capital and number of shares At the General Shareholders' Meeting of Colbún S.A. held on April 29, 2009, the shareholders agreed to change the currency in which the share capital is denominated since December 31, 2008 to the U.S. dollars using the exchange rate prevailing at the reporting date as of December 31, 2008, divided into 17,536,167,720 ordinary and registered shares of the same series with no par value. As of December 31, 2021, this caption comprises the following:
12.31.2021 12.31.2020 12.31.2021 12.31.2020
% % ThUS$ ThUS$
Period rate 2.49 0.20 31,968 47,660
Rate decrease by 50 b.p. 1.99 -0.30 33,907 51,428
Rate increased by 50 b.p. 2.99 0.70 30,207 44,274
Sensitization
Amount of the obligation Rate
12.31.2021 12.31.2020 12.31.2021 12.31.2020
ThUS$ ThUS$ ThUS$ ThUS$
Withholdings 15,317 21,375 - -
Unearned revenue (1) 541 1,321 6,326 20,775
Total 15,858 22,696 6,326 20,775
Current Non-current
Single 17,536,167,720 17,536,167,720 17,536,167,720
Subscribed capital Paid-in capital
ThUS$ ThUS$
1,282,793 1,282,793
Number of shares
Capital (Amount in US$)
Series
Single
SeriesNo. of shares
subscribed
Number of shares
fully paid
No. of shares with
voting rights

90
a.1 Reconciliation of shares At the reporting date, the reconciliation of the number of outstanding shares, is detailed as follows:
a.2 N° of shareholders As of December 31, 2021, the number of shareholders is 3,274. b. Share capital Share capital corresponds to the paid-in capital indicated in letter a. c. Share premium As of December 31, 2021, and 2020, the caption share premium amounts to ThUS$ 52,595 and is composed of ThUS$ 30,700 related to premium received in the share subscription term approved at the Extraordinary Shareholders' Meeting held on March 14, 2008, plus a share premium of ThUS$ 21,895 resulting from capital increases performed prior to 2008. d. Dividends The general policy and procedure on dividend distribution agreed at the Shareholders' Meeting held on April 29, 2021, established that the Company will distribute at least 50% of net profit. In accordance with IFRS, there is a legal and assumed obligation requiring the accounting for of a liability at each reporting date for the concept of the minimum legal dividend. At the Extraordinary Shareholders' Meeting held on September 15, 2021, it was approved to distribute an eventual dividend, charged to the accumulated profits of the Company for the amount of ThUS$ 750,000 corresponding to US $ 0.94277 per share, payable in dollars or pesos, at the election of the shareholders, from October 12, 2021. Additionally, the Board of Directors was empowered, so that, if it deems it necessary for any reason, to suspend the payment of the dividend referred to above, setting, in the same act or subsequently, a new payment date, which may not be later than December 31, 2021. This power may be exercised by the Board of Directors until before the publication of the notice of payment of the aforementioned dividend.
The Extraordinary Board of Directors dated August 10, 2021 approved the distribution of a provisional dividend, charged to the net profits corresponding to the year ending December 31, 2021 for the amount of ThUS $ 250,000 corresponding to US$0.01426 per share, payable in dollars or pesos, at the election of the shareholders, as of October 12, 2021. At the Shareholders' Meeting held on April 29, 2021, it was approved to distribute a final dividend in the amount of ThUS $ 81,675 corresponding to US $ 0.00465 per share, and an eventual dividend charged to accumulated earnings of previous years of ThUS $ 164,580, corresponding to US $ 0.00939 per share, which began to be paid on May 12, 2021.
Shares 12.31.2021 12.31.2020
No. of outstanding shares as of January 1 17,536,167,720 17,536,167,720
Changes in outstanding shares
Increase (decrease) in outstanding shares - -
No. of outstanding shares at the end of the period 17,536,167,720 17,536,167,720

91
At the Board of Directors' Meeting held on March 31, 2021, the directors agreed to propose to the Shareholders' Meeting the distribution of the net distributable profit as follows: (i) Distribute a final dividend of ThUS$ 81,675 corresponding to US$ 0.00465 per share, which in addition to a provisional dividend of ThUS$ 81,217 corresponding to US$ 0.00463 per share, would amount to Net Distributable Profit for 2020 of ThUS$ 162,892; and (ii) Distribute a provisional dividend with a debit to prior year retained earnings of ThUS$ 164,850, corresponding to US$ 0.00939 per share. At a meeting held on November 24, 2020, the Board of Directors of Colbún S.A. agreed to distribute an interim dividend charged to profits for the year ending December 31, 2020, for the total amount of ThUS$ 81,218; corresponding to US$ 0.00463 per share. Payment of this dividend began to be paid on December 16, 2020. At the Shareholders' Meeting on April 30, 2020, it was approved to distribute a final dividend of ThUS$ 110,630 corresponding to US$ 0.00631 per share, and an eventual dividend charged to accumulated earnings of previous years for ThUS$ 50,000, corresponding to US$ 0.00285 per share, which began to be paid on May 12, 2020. At the Board of Directors' Meeting held on March 31, 2020, the directors agreed to propose to the Shareholders' Meeting the distribution of the net distributable profit as follows: (i) Distribute a final dividend of ThUS$ 110,630 corresponding to US$ 0.00631 per share, which in addition to a provisional dividend of ThUS$ 92,404 corresponding to US$ 0.00527 per share, would amount to Net Distributable Profit for 2019 of ThUS$ 203,045; and (ii) Distribute a provisional dividend with a debit to prior year retained earnings of ThUS$ 50,000, corresponding to US$ 0.00285 per share. e. Detail of Other reserves This caption comprises the following:
Effect of first adoption of paid-in capital deflation: Circular No.456 issued by the Chilean Financial Market Commission and effect of first-time adoption of translation in accordance with IAS 21: Reserves generated by the first-time adoption of the International Financial Reporting Standards (IFRSs), which are subject to capitalization if permitted by accounting standards and law. Revaluation of property, plant and equipment: The methodology used to quantify the realization of this concept relates to the application of useful lives per class of asset used for the depreciation process to the revaluation amount determined as of the date of adoption. Deferred taxes: The adjustments in the measurement of assets and liabilities arising from the application of IFRS have resulted in the determination of new temporary differences recognized against the retained earnings in equity. The realization of this concept has been determined in the same proportion as the items from which it arises. Merger reserve: Refers to the revaluation reserve of assets at fair value recorded from mergers in previous years, which amounts have not been realized.
12.31.2021 12.31.2020
ThUS$ ThUS$
Effect of first adoption of paid-in capital deflation 517,617 517,617
Effect of first-time adoption of translation in accordance with IAS 21 (230,797) (230,797)
Revaluation of property, plant and equipment 278,017 400,112
Revaluation of deferred taxes (104,445) (108,361)
Merger reserve 155,959 174,967
Affiliate translation effects (37,714) (40,658)
Subsidiaries' reserve (12,051) (12,051)
Hedging reserve (14,838) 8,819
Associate hedging effects 311 131
Total 552,059 709,779
Other reserves

92
Effect of translation in associates: Refers to the exchange rate difference generated by fluctuations in exchange rates on investments in associates and joint ventures, which maintain as a functional currency the Chilean peso. Reserve of subsidiary: Reserve arising from the merger and variation in the interest of subsidiaries subject to capitalization if permitted by the accounting standards and law. Effect of hedging reserve: Refers to the effective portion of transactions designated as cash flow hedges waiting for the recognition of the hedged item in profit or loss. f. Retained earnings (accumulated losses) As of December 31, 2021, and 2020, changes in reserves for retained earnings are detailed as follows:
g. Capital management Capital management falls under the financing and investing policies of the Company, which establish, among other matters, that investments shall have appropriate financing according to the project in conformity with the Financing Policy. The Company will try to have sufficient liquidity in order to maintain an adequate financial position to meet its commitments and risks associated with its business. The cash surpluses of the Company will be invested in securities issued by financial institutions and marketable securities in accordance with the portfolio selection and diversification criteria determined by Management. The control on investments will be performed by the Board, in charge of approving specific investments both the amount and financing of specific investments in conformity with the Company's by-laws and the decision made at the Shareholders' Meeting, if applicable. The financing shall provide for the necessary funds to operate existing assets appropriately and to realize new investments in conformity with the Investing Policy mandate. For such purpose, the internal and external resources available will be used without compromising the Company's equity position or growth. Accordingly, the indebtedness level shall not compromise the "investment grade" credit rating of the debt securities issued by Colbún in the international and domestic markets. The Company will have different financing options, for which the following financing sources are preferred: bank borrowings both with international and local banks, long-term bond markets both in the international and local market, credits to supplier, retained earnings and capital increases.
12.31.2021 12.31.2020
ThUS$ ThUS$
Opening balance as of January 1 1,414,284 1,458,332
Profit or loss for the year 545,298 162,893
Effect of actuarial profit (loss) 10,080 (2,893)
Dividends (1,273,666) (232,970)
Realized retained earnings 137,184 28,922
Total distributable retained earnings 833,180 1,414,284
Distributable retained earnings
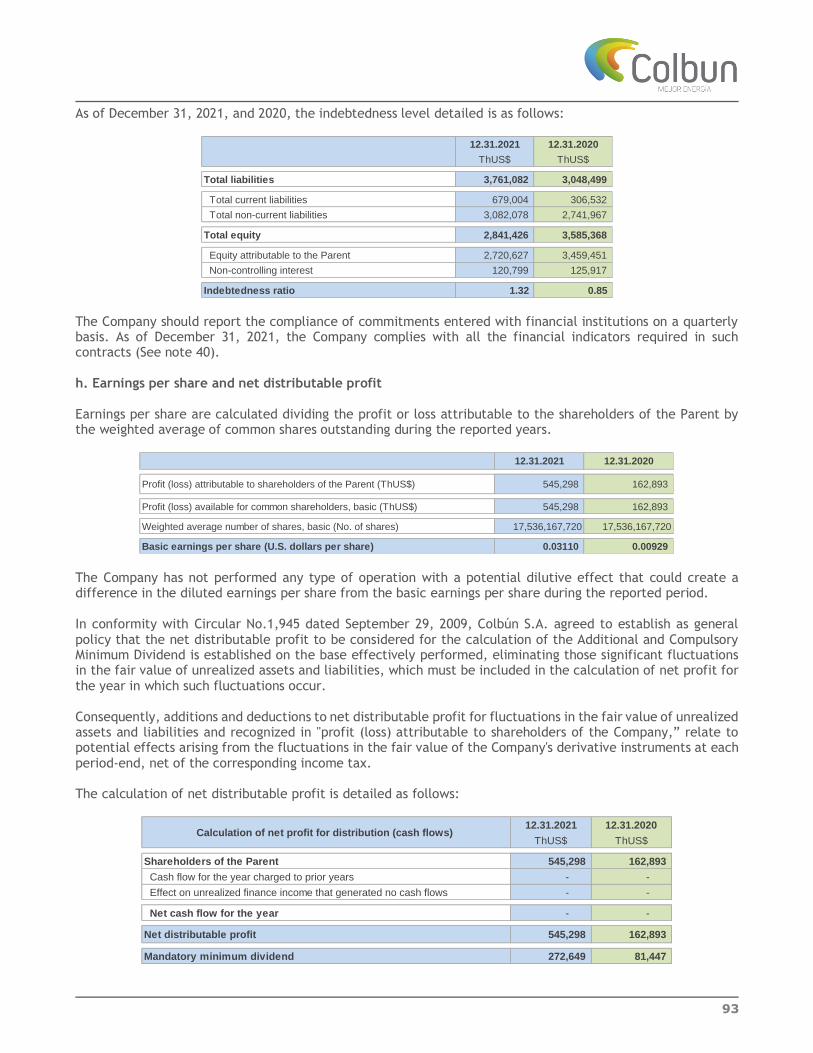
93
As of December 31, 2021, and 2020, the indebtedness level detailed is as follows:
The Company should report the compliance of commitments entered with financial institutions on a quarterly basis. As of December 31, 2021, the Company complies with all the financial indicators required in such contracts (See note 40). h. Earnings per share and net distributable profit Earnings per share are calculated dividing the profit or loss attributable to the shareholders of the Parent by the weighted average of common shares outstanding during the reported years.
The Company has not performed any type of operation with a potential dilutive effect that could create a difference in the diluted earnings per share from the basic earnings per share during the reported period. In conformity with Circular No.1,945 dated September 29, 2009, Colbún S.A. agreed to establish as general policy that the net distributable profit to be considered for the calculation of the Additional and Compulsory Minimum Dividend is established on the base effectively performed, eliminating those significant fluctuations in the fair value of unrealized assets and liabilities, which must be included in the calculation of net profit for the year in which such fluctuations occur. Consequently, additions and deductions to net distributable profit for fluctuations in the fair value of unrealized assets and liabilities and recognized in "profit (loss) attributable to shareholders of the Company,” relate to potential effects arising from the fluctuations in the fair value of the Company's derivative instruments at each period-end, net of the corresponding income tax. The calculation of net distributable profit is detailed as follows:
12.31.2021 12.31.2020
ThUS$ ThUS$
Total liabilities 3,761,082 3,048,499
Total current liabilities 679,004 306,532
Total non-current liabilities 3,082,078 2,741,967
Total equity 2,841,426 3,585,368
Equity attributable to the Parent 2,720,627 3,459,451
Non-controlling interest 120,799 125,917
Indebtedness ratio 1.32 0.85
12.31.2021 12.31.2020
Profit (loss) attributable to shareholders of the Parent (ThUS$) 545,298 162,893
Profit (loss) available for common shareholders, basic (ThUS$) 545,298 162,893
Weighted average number of shares, basic (No. of shares) 17,536,167,720 17,536,167,720
Basic earnings per share (U.S. dollars per share) 0.03110 0.00929
12.31.2021 12.31.2020
ThUS$ ThUS$
Shareholders of the Parent 545,298 162,893
Cash flow for the year charged to prior years - -
Effect on unrealized finance income that generated no cash flows - -
Net cash flow for the year - -
Mandatory minimum dividend 272,649 81,447
Calculation of net profit for distribution (cash flows)
Net distributable profit 545,298 162,893

94
31. Revenue For the periods ended December 31, 2021 and 2020, this caption comprises the following:
32. Raw materials and consumable For the periods ended December 31, 2021 and 2020, this caption comprises the following:
2021 2020
ThUS$ ThUS$
Regulated customer sales 454,501 438,374
Unregulated customer sales 689,425 698,794
Toll charges 35,390 54,842
Spot market sales 210,866 131,216
Other income 49,562 25,642
Total 1,439,744 1,348,868
January - December
2021 2020
ThUS$ ThUS$
Oil consumption (see Note 14) (49,346) (9,523)
Gas consumption (see Note 14) (394,380) (245,413)
Coal consumption (see Note 14) (89,660) (70,351)
Purchase of energy and capacity (70,648) (54,098)
Toll charges (114,954) (112,760)
Third-party work and supplies (62,985) (83,651)
Total (781,973) (575,796)
January - December
Inventories

95
33. Employee benefits expenses For the periods ended December 31, 2021 and 2020, this caption comprises the following (see note 3.1.m. and 3.1.o.):
34. Depreciation and amortization expenses For the periods ended December 31, 2021 and 2020, this caption comprises the following:
35. Total Financial income and financial cost For the periods ended December 31, 2021 and 2020, this caption comprises the following:
(1) Leases recognized under IFRS 16
2021 2020
ThUS$ ThUS$
Salaries and wages (63,436) (52,075)
Short-term employee benefits (6,129) (5,224)
Severance indemnity payments (7,375) (5,985)
Other personnel expenses (2,732) (2,073)
Total (79,672) (65,357)
January - December
2021 2020
ThUS$ ThUS$
Depreciation (see Note 19.b) (195,830) (229,236)
Depreciation right-of-use assets (see note 20.b) (13,185) (12,752)
Amortization of intangible assets (see Note 18.b) (4,148) (4,627)
Total (213,163) (246,615)
January - December
2021 2020
ThUS$ ThUS$
Income on cash and other cash equivalents 4,968 11,242
Total financial income 4,968 11,242
2021 2020
ThUS$ ThUS$
Expenses on bonds (67,555) (65,745)
Interest expense for lease liabilities (1) (8,615) (9,077)
Expense incurred for financial provisions (10,694) (9,865)
Borrowing costs (2,602) (2,666)
Income/expense on the valuation of net financial derivatives (1,592) (2,265)
Other expenses (bank expenses) (564) (396)
Other expenses (commissions) (812) (610)
Capital financial expenses (see note 19.c.iv) 6,087 165
Total financial cost (86,347) (90,459)
Total financial income and financial costs (81,379) (79,217)
January - December
Income (loss) from investments
Financial cost
January - December

96
36. Foreign currency translation and income (expense) from inflation-adjusted units The items that originate the effects on income for the concepts of foreign currency translation and inflation-adjusted units are detailed below: a. Foreign currency translation difference
37. Income (expense) from investments accounted for using the equity method Income from investments accounted by equity method for the period ended December 31, 2021, and 2020, respectively, are presented in the following breakdown:
(1) On December 30, 2021, the sale of the total share of the Joint Venture of Transmisora Eléctrica de Quillota Ltda. (equivalent to 50% of
the social rights) was made, to the companies APG Energy & Infra Investments Chile Expansion SpA, and CELEO Redes Chile Expansion SpA.
2021
ThUS$
2020
ThUS$
Cash and cash equivalents Ch$ (10,711) 8,882
Cash and cash equivalents PEN (716) (1,195)
Trade and other receivables Ch$ (14,328) 49
Trade and other receivables PEN (459) (1,060)
Current tax assets Ch$ 310 9,029
Current tax assets PEN (572) (1,093)
Other non-financial assets, non-current Ch$ (1,073) 1,308
Other non-financial assets, non-current PEN - (132)
(27,549) 15,788
Other financial liabilities, current UF 9,081 (6,326)
Other financial liabilities, current PEN 106 227
Trade and other payables Ch$ (1,115) (581)
Trade and other payables PEN (18) 53
Other non-financial liabilities Ch$ (3,218) (57)
Provisions for employee benefits Ch$ 8,887 (3,379)
13,723 (10,063)
(13,826) 5,725
Foreign currency translation difference Currency
January - December
Foreign currency translation difference - assets
Foreign currency translation difference - liabilities
Total foreign currency translation difference
2021
ThUS$
2020
ThUS$
Electrogas S.A. 7,035 8,149
Transmisora Eléctrica de Quillota Ltda (1) (338) 1,801
Total 6,697 9,950
January - December
Net interest in affiliates' income

97
38. Other gains (losses) For the periods ended December 31, 2021 and 2020, this caption comprises the following:
(1) On September 30, 2021, the shares of Colbún Transmisión S.A. were sold to Alfa Desarrollo SpA.
(2) On December 30, 2021, the sale of the total share of the Joint Venture of Transmisora Eléctrica de Quillota Ltda. (equivalent to 50% of the social rights) was made, to the companies APG Energy & Infra Investments Chile Expansion SpA, and CELEO Redes Chile Expansion SpA.
(3) In the Board of Director meeting held on November 30, the impairment of the San Pedro Hydroelectric Power Plant and Guaiquivilo Melado Hydroelectric Power Plant projects was approved.
(4) Corresponds to Financial cost related with the sale of accounts receivables balances generated by the energy price stabilizat ion
mechanism (“PEC” in its Spanish acronym). (5) Corresponds to the prepaid cost of Local Bonds Series F and I.
(6) Corresponds to the provision for tax expense that is levied on the emissions of thermoelectric plants (Law 20.780).
(7) Corresponds to the impairment of the assets of the subsidiary Fenix Power Perú S.A. (see Note 5.b)
(8) Corresponds to the prepaid tender premium of the 2024 Bond for ThUS$ 14,306 and adjustments for capitalized expenses of the 2024
Bond for US$ 3.084.
2021 2020
ThUS$ ThUS$
Insurance - 21,280
Sale of shares Colbún Transmisión S.A. (1) 841,948 -
Sale of shares Quillota Ltda (2) 11,734 -
Other income 6,403 8,350
Total other gains 860,085 29,630
2021 2020
ThUS$ ThUS$
Impairment projects (3) (139,951) -
Financial cost for sale of portfolio associated with PEC (4) (26,906) -
Bond prepayment costs (5) (14,901) -
Emissions of thermoelectric plants (6) (12,515) (13,362)
Donations and community contributions (5,556) (3,720)
Impairment of water rights (4,239) (4,517)
Decommissing cost (1,397) (1,350)
Loss from derivative contracts (825) (354)
Litigation-related legal fees (636) (1,153)
Write-offs and fines (292) (60)
Disposal of property, plant and equipment (69) (27,000)
Allowance for doubtful customers 398 (2,230)
Inventory obsolescence 1,022 (3)
Impairment CGU Peru (7) - (179,615)
Comission for prepayment of bond (8) - (17,391)
Others (47,571) (19,011)
Total other losses (253,438) (269,766)
Total other gains (losses) 606,647 (240,136)
Other gains
January - December
Other losses
January - December
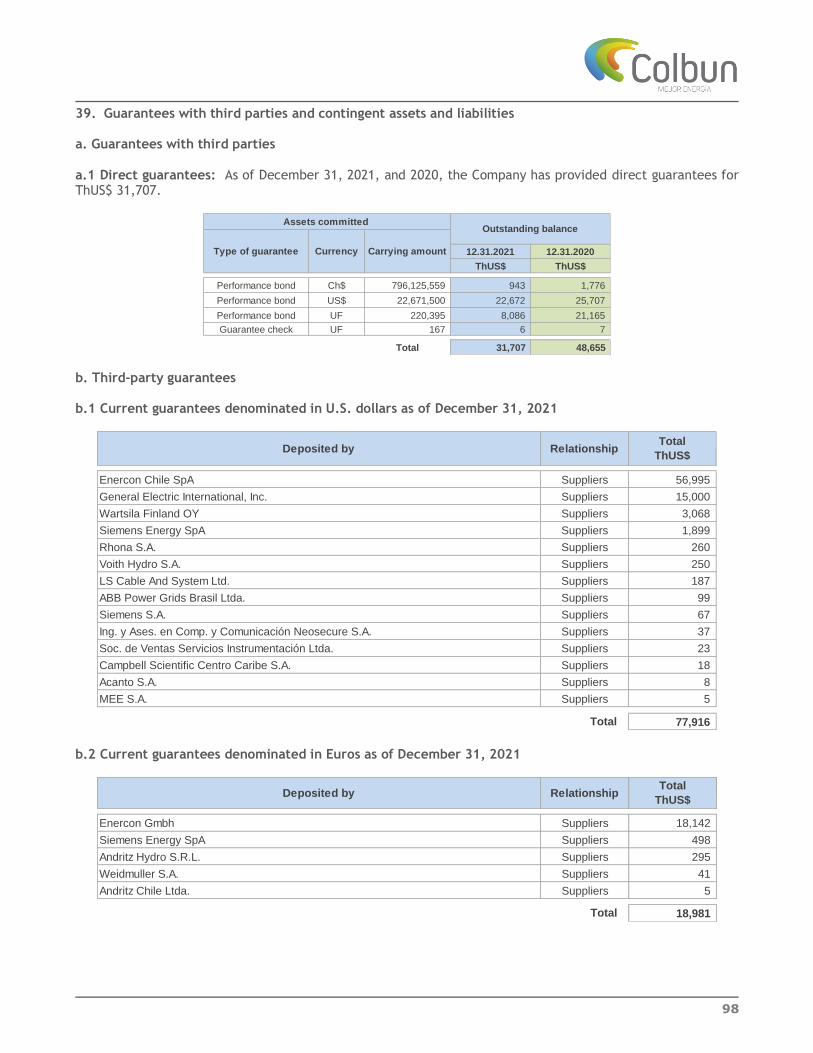
98
39. Guarantees with third parties and contingent assets and liabilities a. Guarantees with third parties a.1 Direct guarantees: As of December 31, 2021, and 2020, the Company has provided direct guarantees for ThUS$ 31,707.
b. Third-party guarantees b.1 Current guarantees denominated in U.S. dollars as of December 31, 2021
b.2 Current guarantees denominated in Euros as of December 31, 2021
12.31.2021 12.31.2020
ThUS$ ThUS$
Performance bond Ch$ 796,125,559 943 1,776
Performance bond US$ 22,671,500 22,672 25,707
Performance bond UF 220,395 8,086 21,165
Guarantee check UF 167 6 7
Total 31,707 48,655
Assets committed Outstanding balance
Type of guarantee Currency Carrying amount
Enercon Chile SpA Suppliers 56,995
General Electric International, Inc. Suppliers 15,000
Wartsila Finland OY Suppliers 3,068
Siemens Energy SpA Suppliers 1,899
Rhona S.A. Suppliers 260
Voith Hydro S.A. Suppliers 250
LS Cable And System Ltd. Suppliers 187
ABB Power Grids Brasil Ltda. Suppliers 99
Siemens S.A. Suppliers 67
Ing. y Ases. en Comp. y Comunicación Neosecure S.A. Suppliers 37
Soc. de Ventas Servicios Instrumentación Ltda. Suppliers 23
Campbell Scientific Centro Caribe S.A. Suppliers 18
Acanto S.A. Suppliers 8
MEE S.A. Suppliers 5
77,916 Total
Deposited by RelationshipTotal
ThUS$
Enercon Gmbh Suppliers 18,142
Siemens Energy SpA Suppliers 498
Andritz Hydro S.R.L. Suppliers 295
Weidmuller S.A. Suppliers 41
Andritz Chile Ltda. Suppliers 5
18,981 Total
Deposited by RelationshipTotal
ThUS$

99
b.3 Current guarantees denominated in Chilean pesos as of December 31, 2021
Vecchiola Ingeniería y Construcción S.A. Suppliers 288
Constructora y Maquinarias Pulmahue SpA Suppliers 44
SG Ingeniería Eléctrica Ltda. Suppliers 32
Eduardo Antonio Gómez Miranda Suppliers 29
DPLGrout Construcciones SpA Suppliers 19
ST Ingeniería y Construcción SpA Suppliers 19
Sodexo Chile SpA Suppliers 16
Ingeniería y Comercial San Andrés Ltda. Suppliers 13
Serv. de Ingeniería y Desarrollo de Proyectos S.A. Suppliers 13
Jaime Fuentes y Cía. Ltda. Suppliers 13
Target-Ts SpA Suppliers 12
Desarrollo Marítimo Servicios y Equipamiento SpA Suppliers 12
Sodexo Chile S.A. Suppliers 10
Soc. Asociación Canales Maule Sur Ltda. Suppliers 9
Dimetales SpA Suppliers 8
Ximena Mariela Soto Orellana Suppliers 7
Prosing Ingeniería y Servicios Ltda. Suppliers 6
Rhona S.A. Suppliers 5
Constructora Javag SpA Suppliers 3
558
Deposited by RelationshipTotal
ThUS$
Total

100
b.4 Current guarantees denominated in Inflation-adjusted units as of December 31, 2021
Promet Servicios SpA Suppliers 3,475
Ingeniería Agrosonda SpA Suppliers 1,398
Barlovento Recursos Naturales Sl Tax Id. Suppliers 499
DNV GL Chile Ltda. Suppliers 266
Serv. Industriales Ltda. Suppliers 225
Contract Chile S.A. Suppliers 177
Algoritmos y Mediciones Ambientales SpA Suppliers 170
Securitas S.A Suppliers 103
Ricoh Chile S.A. Suppliers 73
Vigatec S.A. Suppliers 65
Servicios Emca Spa Suppliers 65
Integración de Tecnologías ITQ Ltda. Suppliers 62
Ateme Consultores SpA Suppliers 58
Universidad de Concepción Suppliers 56
WSP Ambiental S.A. Suppliers 55
Siemens S.A. Suppliers 53
Novis S.A. Suppliers 49
Arkanosoft Chile SpA Suppliers 42
Marcelo Javier Urrea Caro EIRL Suppliers 41
Soc. Comercial San Cristóbal Ltda. Suppliers 37
Empresa Nacional de Telecomunicaciones S.A. Suppliers 36
Transportes José Carrasco Retamal EIRL Suppliers 34
OHL Servicios Ingesan S.A. Agencia en Chile Suppliers 33
Mario Francisco Segura Caballero Suppliers 32
Soc. Comercial Camin Ltda. Suppliers 31
Constructora Javag SpA Suppliers 31
Bessertec SpA Suppliers 29
Sodexo Chile SpA Suppliers 28
Sistema Integral de Telecomunicaciones Ltda. Suppliers 28
XPE Consult SpA Suppliers 27
Buses Ahumada Ltda. Suppliers 25
Latinomericana Serv. de Ingeniería y Construcción Ltda. Suppliers 21
Sodexo Chile S.A. Suppliers 19
J.E.J. Ingeniería S.A. Suppliers 18
SIGA Ingeniería y Consultoría S.A. Suppliers 18
Tecnored S.A. Suppliers 18
MYA Chile Soluciones contra Incendio e Industriales Ltda. Suppliers 17
ISS Facility Services S.A. Suppliers 17
Serv. Industriales Euroambiente Ltda. Suppliers 14
Conecta Ingeniería S.A. Suppliers 13
Soc. de Transportes Turismos e Invers. Suppliers 12
Serv. Eduardo Sebastián Velásquez Negrón E.I.R.L. Suppliers 12
GS3 Consultores SpA Suppliers 9
Soc. Comercial y de Inversiones Conyser Ltda. Suppliers 9
Enertis Chile SpA Suppliers 8
Aguasin SpA Suppliers 8
Barlovento Chile Ltda. Suppliers 8
SGS Chile Ltda. Soc. de Control Suppliers 7
Mantención de Jardines Arcoiris Ltda. Suppliers 5
Victoria S.A. Suppliers 5
Target-TS SpA Suppliers 4
GHD S.A. Suppliers 3
Servicios GEA Ltda. Suppliers 3
Arcadis Chile SpA Suppliers 3
Empresa de Servicios Himce Ltda. Suppliers 3
Andritz Chile Ltda. Suppliers 1
7,558
Deposited by RelationshipTotal
ThUS$
Total

101
Fenix Power Perú S.A.
b.1 Current guarantees denominated in Peruvian soles as of December 31, 2021
b.2 Current guarantees denominated in U.S. dollars as of December 31, 2021
c. Detail of litigation and others Management believes that, on the basis of the information in its possession at the reporting date, the provisions recognized in the consolidated statement of financial position appropriately cover the litigation risks and other operations detailed in this note; accordingly, Management expects no additional liabilities arising from such litigation risks other than the liabilities recognized. Considering the characteristics of the risks covering such provisions, it is impossible to determine a reasonable payment schedule, if applicable. As of December 31, 2021, the detail of litigation in accordance with IAS 37 is as follows: Chile 1.- The following charges were filed by the Superintendence of the Environment (SMA) against Santa María thermoelectric power plant as required by the Environment Court of Valdivia (TAV); (i) alleging existence of equipment other than the pieces of equipment authorized in the Environmental Qualification resolution (RCA) and (ii) for possibly not having registered with the Environmental Impact Evaluation System (SEI) oversizing of the thermal power plant chimney. Colbún duly substantiated and submitted its defense against the charges filed by the SMA and is currently waiting for the proceeding to continue. Note that in the administrative proceeding conducted prior to the investigation by SMA against Santa María thermoelectric power plant, the regulating authority concluded that there was no background information to file such charges; however, when the TAV reviewed the administrative resolution conducted by the SMA, it ordered to file those two charges.
Empresa Regional de Serv. Público del Oriente S.A. Suppliers 1,478
Unicontrol Suppliers 49
Procarvi S.A. Suppliers 37
Busser SAC Suppliers 27
J&V Resguardo SAC Suppliers 25
M&D Consultores Suppliers 4
People Intermediacion SAC Suppliers 4
Advanced Services In Decotations SAC Suppliers 1
1,625 Total
Deposited by RelationshipTotal
ThUS$
Barlovento Renovables Latinoamérica SAC Suppliers 201
Aptim Perú SAC Suppliers 15
JC Soluciones Técnicas Suppliers 6
VYT Contratistas SAC Suppliers 5
227
Deposited by RelationshipTotal
ThUS$
Total

102
Simultaneously, both Colbún S.A. and the Chilean Superintendence of the Environment (SMA) filed appeals in cassation with the Supreme Court against the judgment of the TAV, which ordered such filing of charges and established a limit of 350 MW gross to the power plant's capacity. On July 9, 2019, the Supreme Court (SC) received the appeals in cassation filed by the Superintendence of Environment (SMA) and Colbún against the sentence of the Environmental Court of Valdivia (TAV). The SC determined that the TAV incurred in an error of law when it required the SMA to file charges against Colbún for: (i) non-compliance with the SEIA; and (ii) non-compliance with RCA of the Santa María CT. The SC revoked the power limitation of the power plant to 350 MW gross established by the TAV and accepted the cassation for the purpose of retroacting the sanctioning procedure against Colbún to the stage prior to the issuance of the closure resolution. This sanctioning procedure concluded in favor of Colbún when the SMA, ordered filing both individualized complaints above in (i and ii) on September 4, 2019. However, the plaintiff filed an appeal with the Environment Court of Valdivia (TAV) against the resolution of the SMA ordering the filing of the complaints. The case has been alleged in the TAV and on March 31, 2020, the TAM rejected the case file, ordering the SMA to issue the corresponding resolution. The SMA filed a new appeal against this judgment on the Supreme Court, which was rejected as inadmissible. It would correspond, according to the procedural rules, to comply with the ruling of the TAV and the SMA should formulate, during the next months, charges again in this procedure. This process is expected to end in acquittal, compliance plan or fine, according to law. The SMA decided to apply a fine for minor infraction of UTA 345, regarding this resolution of the SMA, Colbún filed a claim to the Environmental Court of Valdivia and the Plaintiffs filed an Appeal for Reversal to the same SMA. 2.- Arbitration proceeding for taxes levied on emissions In December 2019, Colbún has filed an arbitration proceeding, as established in the “Electric Energy Purchase and Sale Agreement” entered into with Codelco in January 2010, so that Codelco reimburses the payment of the tax on emissions recorded during 2017 and 2018, and any applicable subsequent period. Likewise, Codelco has also filed an arbitration proceeding to resolve matters related to such contract. The processes are at the end of their discussion stage, with the parties having submitted their respective demands and responses. The Court summoned the parties to the conciliation stage provided for in the basis, but this was not achieved, and then the Court set the points of proof and suspended the probation period in accordance with the law in force. The process is awaiting the arguments that will be on January 6 and then the case remains for final judgment. Based on the information and opinions from experts available to such date, Management reasonably believes that this lawsuit will have a favorable outcome for the Company, and that finally, the customer should reimburse the payments required. 3.- Arbitration against CGE On December 18, 2020, by filing the corresponding lawsuit, Colbún has initiated the arbitration procedure provided for in the Electricity Purchase Agreement with CGE, to resolve the difference between the parties, in the sense that this distributor discounted at its discretion and without legal or contractual basis, the invoices for April, May and July approximately Ch$ 2,800 million, alleging that its final clients had not paid it as a consequence of the current pandemic. Based on the background and expert opinions available at this date, Management reasonably estimates a favorable result and that ultimately the client should pay all of the amounts involved. As of December 31, 2021, the process is in the probationary period.

103
4. Invalidation of RCA Diego de Almagro Sur photovoltaic project By Exempt Resolution of June 11, 2021, the Environmental Assessment Service (“SEA" for its Spanish acronym) notified the request for invalidation of the RCA that approved the project's EIS, presented by a Colla-Diaguita indigenous community, represented by Wilfredo Cerda; based on the project's impact on this community due to the alleged existence of ceremonial sites, destruction of the Inca Trail, impact of Los Gemelos hill due to the extraction of stone material, among other issues. Colbún presented the response and its defense before the SEA, in which the environmental evaluation carried out is defended, since the project does not generate significant impacts that could have justified an indigenous consultation. The SEA, by resolution dated November 11, 2021, rejected the Claim presented, without prejudice to which the Claimants filed an Appeal before the Environmental Court of Antofagasta insisting on their thesis. Colbún is studying the way to become part of the process. The Management, in compliance with IAS 37, estimates a contingency as remote, therefore, it has proceeded to disclose it, but has not constituted a provision to date, because it is not possible to reliably measure or estimate the liability arising from it, likewise, there are no claimable reimbursements in the event of an unfavorable judgment. 5. Patagüillas Tunnel Accident. As a result of the accident of the “Pataguilla Tunnel” of the “Canal Las Mercedes” that occurred at the end of November 2020, and which carries water for HPP Carena and also irrigates agricultural properties in the communes of Maria Pinto and Curacaví, on September 6, 2021, Colbún S.A. was notified a claim for compensation for damages filed by Mr. César Véliz ch$ 1,135 million. 6. Puerto Coronel Arbitration On September 23, 2021, an arbitration was established to Mr. Manuel José Vial Vial, between Colbún S.A. and Puerto de Coronel, to learn about the differences in interpretation of the tax clause of the service contract for coal unloading at the Santa María Thermal Power Plant, located in the Coronel commune. 40. Commitments
Commitments entered with financial institutions As of the date of publication of the Financial Statements, Colbún S.A does not maintain loans with financial entities or with bondholders that impose obligations to comply with financial indicators.
41. Environment The Group's companies on which disbursements associated with environment have been made are: Colbún S.A. and Fenix Power Perú S.A. Disbursements made for environmental expenses are mainly associated with facilities; accordingly, they will be recognized in profit or loss through depreciation in accordance with their useful life, except for the development of environmental impact statements and studies that correspond to environmental permits performed prior to the construction stage. The main ongoing projects and a brief description of them are detailed as follows: Horizonte Wind Project: Horizonte project is a wind farm located 130 km northeast of Taltal and 170 km southwest of Antofagasta, considering the displacement along Route 5. It considers an installed capacity of 778 MW, which is made up of 140 machines of 5,56 MW each one and an average annual generation of approximately 2,380 GWh. It considers the connection to the SEN in the future S/E Parinas located 22 km away.
104
On September 13, 2021, the SEA issued the Environmental Qualification Resolution (RCA) for the project and on September 21, at a meeting held in Taltal, the approval by the Board of Directors of the start of construction was announced. Photovoltaic Solar Projects Diego de Almagro Sur I and II: Photovoltaic solar power plant located in the Atacama Region, approximately 27 kilometers south of Diego de Almagro, considering an installed capacity of 220MW and an average annual generation of approximately 615 GWh. This project has it their Environmental Impact Study secured.
The construction phase of the project began during the month of September 2020 and roads and has an advance of 70%. San Pedro hydroelectric power plant: Run of the river hydroelectric power plant located in Los Ríos Region. The project has reached a 15% of progress and awaits the processing of the new environmental impact study of modifications to the project to resume the works and construction activities. Photovoltaic Solar Project Machicura: located in the Colbún area, at the foot of the Machicura reservoir, with an estimated power of 11.3 MW. The Project has completed its construction phase and is waiting to enter into operation. Additionally, there are disbursements associated with 25 power generation plants in operation, including the Fenix plant (Chilca, Peru) As of December 31, 2021, and 2020, the detail of the disbursements performed and to be performed in relation to environment regulations is the following:
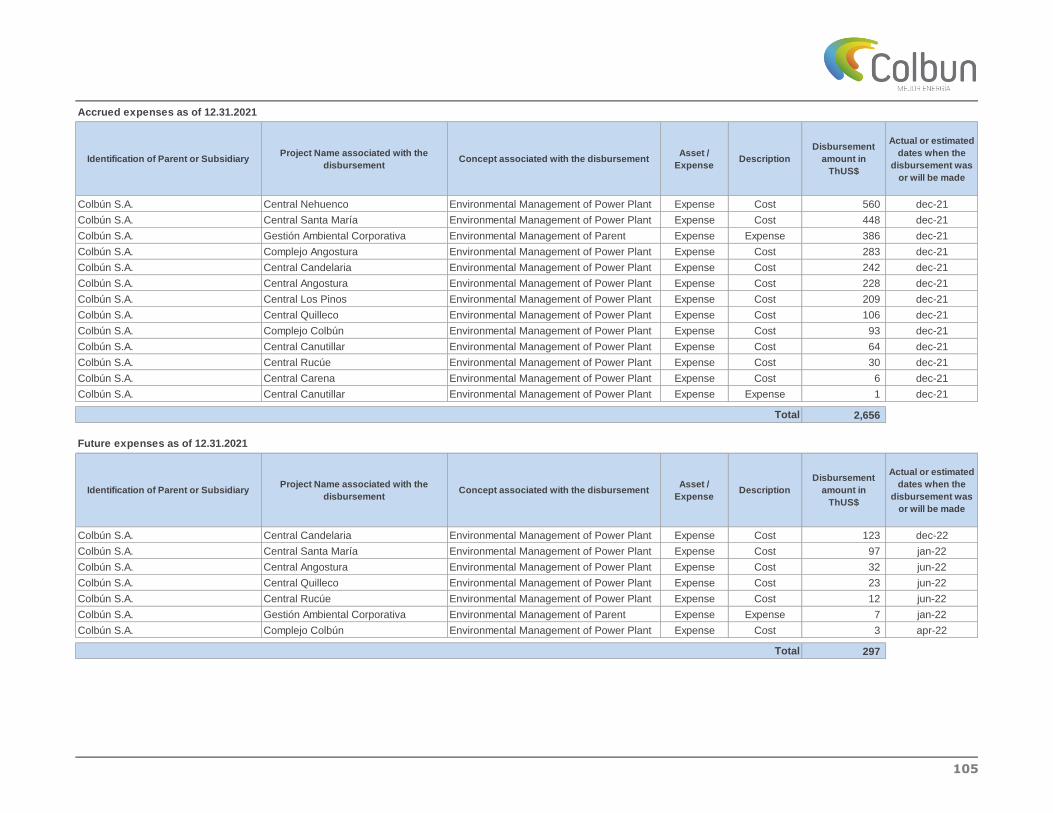
105
Accrued expenses as of 12.31.2021
Identification of Parent or Subsidiary Project Name associated with the
disbursementConcept associated with the disbursement
Asset /
ExpenseDescription
Disbursement
amount in
ThUS$
Actual or estimated
dates when the
disbursement was
or will be made
Colbún S.A. Central Nehuenco Environmental Management of Power Plant Expense Cost 560 dec-21
Colbún S.A. Central Santa María Environmental Management of Power Plant Expense Cost 448 dec-21
Colbún S.A. Gestión Ambiental Corporativa Environmental Management of Parent Expense Expense 386 dec-21
Colbún S.A. Complejo Angostura Environmental Management of Power Plant Expense Cost 283 dec-21
Colbún S.A. Central Candelaria Environmental Management of Power Plant Expense Cost 242 dec-21
Colbún S.A. Central Angostura Environmental Management of Power Plant Expense Cost 228 dec-21
Colbún S.A. Central Los Pinos Environmental Management of Power Plant Expense Cost 209 dec-21
Colbún S.A. Central Quilleco Environmental Management of Power Plant Expense Cost 106 dec-21
Colbún S.A. Complejo Colbún Environmental Management of Power Plant Expense Cost 93 dec-21
Colbún S.A. Central Canutillar Environmental Management of Power Plant Expense Cost 64 dec-21
Colbún S.A. Central Rucúe Environmental Management of Power Plant Expense Cost 30 dec-21
Colbún S.A. Central Carena Environmental Management of Power Plant Expense Cost 6 dec-21
Colbún S.A. Central Canutillar Environmental Management of Power Plant Expense Expense 1 dec-21
2,656
Future expenses as of 12.31.2021
Identification of Parent or Subsidiary Project Name associated with the
disbursementConcept associated with the disbursement
Asset /
ExpenseDescription
Disbursement
amount in
ThUS$
Actual or estimated
dates when the
disbursement was
or will be made
Colbún S.A. Central Candelaria Environmental Management of Power Plant Expense Cost 123 dec-22
Colbún S.A. Central Santa María Environmental Management of Power Plant Expense Cost 97 jan-22
Colbún S.A. Central Angostura Environmental Management of Power Plant Expense Cost 32 jun-22
Colbún S.A. Central Quilleco Environmental Management of Power Plant Expense Cost 23 jun-22
Colbún S.A. Central Rucúe Environmental Management of Power Plant Expense Cost 12 jun-22
Colbún S.A. Gestión Ambiental Corporativa Environmental Management of Parent Expense Expense 7 jan-22
Colbún S.A. Complejo Colbún Environmental Management of Power Plant Expense Cost 3 apr-22
297
Total
Total

106
Identification of Parent or Subsidiary Project Name associated with the
disbursementConcept associated with the disbursement
Asset /
ExpenseDescription
Disbursement
amount in
ThUS$
Actual or estimated
dates when the
disbursement was
or will be made
Colbún S.A. Nehuenco Environmental Management of Power Plant Expense Cost 508 dec-20
Colbún S.A. Sta María 1 Environmental Management of Power Plant Expense Cost 401 dec-20
Colbún S.A. Angostura Environmental Management of Power Plant Expense Cost 284 dec-20
Colbún S.A. Los Quilos Environmental Management of Power Plant Expense Cost 203 dec-20
Colbún S.A. Los Pinos Environmental Management of Power Plant Expense Cost 191 dec-20
Colbún S.A. Candelaria Environmental Management of Parent Expense Cost 166 dec-20
Colbún S.A. Quilleco Environmental Management of Power Plant Expense Cost 134 dec-20
Colbún S.A. Corporate environmental management Environmental Management of Power Plant Expense Expense 109 dec-20
Colbún S.A. Colbún Environmental Management of Power Plant Expense Cost 86 dec-20
Colbún S.A. Rucúe Environmental Management of Power Plant Expense Cost 77 dec-20
Colbún S.A. Hornitos Environmental Management of Power Plant Expense Cost 69 dec-20
Colbún S.A. Canutillar Environmental Management of Power Plant Expense Cost 35 dec-20
Colbún S.A. Zona Bio-Bio Environmental Management of Power Plant Expense Expense 9 dec-20
2,272
Future expenses as of 12.31.2020
Identification of Parent or Subsidiary Project Name associated with the
disbursementConcept associated with the disbursement
Asset /
ExpenseDescription
Disbursement
amount in
ThUS$
Actual or estimated
dates when the
disbursement was
or will be made
Colbún S.A. Sta María 1 Environmental Management of Power Plant Expense Cost 45 mar-21
Colbún S.A. Nehuenco Environmental Management of Power Plant Expense Cost 21 mar-21
Colbún S.A. Colbún Environmental Management of Power Plant Expense Cost 12 mar-21
Colbún S.A. Los Pinos Environmental Management of Power Plant Expense Cost 5 mar-21
Colbún S.A. Quilleco Environmental Management of Power Plant Expense Cost 4 mar-21
Colbún S.A. Rucúe Environmental Management of Power Plant Expense Cost 4 mar-21
Colbún S.A. Corporate environmental management Environmental Management of Power Plant Expense Expense 2 mar-21
Colbún S.A. Angostura Environmental Management of Power Plant Expense Cost 1 mar-21
Colbún S.A. Candelaria Environmental Management of Parent Expense Cost 1 mar-21
95Total
Total

107
Disbursements in Peru
Accrued expenses as of 12.31.2021
Identification of Parent or Subsidiary Project Name associated with the
disbursementConcept associated with the disbursement
Asset /
ExpenseDescription
Disbursement
amount in
ThUS$
Actual or estimated
dates when the
disbursement was
or will be made
Fenix Power Perú S.A. Chilca Power Plant Environmental Management of Power Plant Expense Cost 305 dic-21
305
Future expenses as of 12.31.2021
Identification of Parent or Subsidiary Project Name associated with the
disbursementConcept associated with the disbursement
Asset /
ExpenseDescription
Disbursement
amount in
ThUS$
Actual or estimated
dates when the
disbursement was
or will be made
Fenix Power Perú S.A. Chilca Power Plant Environmental Management of Power Plant Expense Cost 86 dic-22
86
Total
Total
Accrued expenses as of 12.31.2020
Identification of Parent or Subsidiary Project Name associated with the
disbursementConcept associated with the disbursement
Asset /
ExpenseDescription
Disbursement
amount in
ThUS$
Actual or estimated
dates when the
disbursement was
or will be made
Fenix Power Perú S.A. Environmental monitoring and managementEnvironmental Monitoring and Management Expense Cost 191 dic-20
191
Future expenses as of 12.31.2020
Identification of Parent or Subsidiary Project Name associated with the
disbursementConcept associated with the disbursement
Asset /
ExpenseDescription
Disbursement
amount in
ThUS$
Actual or estimated
dates when the
disbursement was
or will be made
Fenix Power Perú S.A. Environmental monitoring and managementEnvironmental Monitoring and Management Expense Cost 36 mar-21
36Total
Total
108
42. Events occurred after the date of the financial position At a meeting held on January 25, 2022, the Company's Board of Directors approved the consolidated financial statements as of December 31, 2021, prepared in accordance with International Financial Reporting Standards (IFRS), issued by the IASB.
On December 22, 2021, the company announced the total early redemption of the local bonds in force to date, corresponding to series F and I, for a notional amount of UF 4.6 million. The payment of said obligation, made in accordance with the clauses provided for such purposes in the respective bond issuance contracts, was made on January 24, 2022.
No other subsequent events have occurred between January 1, 2022 and the date of issuance of these Financial Statements.

109
43. Foreign currency The detail of Assets and Liabilities in foreign currency with effect on the result for exchange difference is as follows:
The detail of assets and liabilities in foreign currency does not include the investments accounted for using the equity method; accordingly, the differences arising from the exchange rate difference are recognized in equity as translation adjustment (see note 3’, letter e).
12.31.2021 12.31.2020
ThUS$ ThUS$
Total current assets
Cash and cash equivalents Ch$ US$ 80,972 79,005
Cash and cash equivalents EUR US$ 300 2,042
Cash and cash equivalents PEN US$ 7,088 7,124
Other non-financial assets, current Ch$ US$ 4,012 19,802
Other non-financial assets, current EUR US$ 19,576 -
Other non-financial assets, current UF US$ 98 -
Trade and other receivables, current Ch$ US$ 40,062 155,915
Trade and other receivables, current PEN US$ 18,905 24,992
Trade receivables due from related parties, current Ch$ US$ - 12
Current tax assets Ch$ US$ 32 11
Current tax assets PEN US$ 1,364 3,910
172,409 292,813
Other non-financial assets, non-current Ch$ US$ 18,967 5,737
18,967 5,737
191,376 298,550
12.31.2021 12.31.2020
MUS$ MUS$
Total current liabilities
Other financial liabilities, current Ch$ US$ - 221
Other financial liabilities, current UF US$ 37,141 14,326
Lease liabilities, current UF US$ 1,932 1,988
Trade and other payables Ch$ US$ 196,551 102,546
Trade and other payables PEN US$ 5,397 12,552
Trade and other payables EUR US$ 3,758 2,630
Payables due to related parties, current Ch$ US$ 1,399 31
Other current provisions Ch$ US$ 43,344 29,370
Provisions for employee benefits, current Ch$ US$ 22,184 22,688
Provisions for employee benefits, current PEN US$ 1,242 1,319
Other non-financial liabilities, current Ch$ US$ 14,231 21,229
Other non-financial liabilities, current PEN US$ 1,627 1,382
328,806 210,282
Non-current liabilities
Other financial liabilities, non-current Ch$ US$ - 218
Other financial liabilities, non-current UF US$ - 41,225
Lease liabilities, non-current UF US$ 1,454 2,844
Provisions for employee benefits, non-current Ch$ US$ 25,941 42,998
Other non-financial liabilities, non-current Ch$ US$ 6,326 9,952
33,721 97,237
362,527 307,519Total liabilites
Total non-current liabilities
Total current liabilites
Assets
Total current assets
Total non-current assets
Total assets
Pasivos
Foreign
currencyCurrency
Moneda
Extranjera
Moneda
Funcional

110
Maturity profile of other financial liabilities in foreign currency
44. Headcount (unaudited) As of December 31, 2021, and 2020, this caption comprises the following:
45. Exhibit 1 Additional information required for XBRL taxonomy This exhibit forms an integral part of the Company's interim consolidated financial statements. Fees for external auditors As of December 31, 2021, and 2020, this caption comprises the following:
* * * * * *
ThUS$ ThUS$ ThUS$ ThUS$ ThUS$ ThUS$
Other financial liabilities UF US$ 37,141 - - - - 37,141
37,141 - - - - 37,141
Total
ThUS$ ThUS$ ThUS$ ThUS$ ThUS$ ThUS$
Other financial liabilities Ch$ US$ 49 152 218 - - 419
Other financial liabilities UF US$ 20 14,326 10,993 10,993 19,239 55,571
69 14,478 11,211 10,993 19,239 55,990
Total
Up to 91
days
91 days to
1 year
1 to 3
years
3 to 5
years
Over 5
years
Up to 91
days
91 days to
1 year
1 to 3
years
3 to 5
years
Over 5
years
Total
Foreign
currency Currency
Foreign
currency Currency
As of 12.31.2021
Total
As of 12.31.2020
Chile Peru Total Chile Peru Total
Managers and main executives 87 9 96 82 9 91
Professionals and technical staff 754 86 840 717 73 790
Other 237 20 257 244 21 265
Total 1,078 115 1,193 1,043 103 1,146
Average of the year 1,074 107 1,181 1,029 95 1,124
No. of employees
12.31.202012.31.2021
2021 2020
ThUS$ ThUS$
Audit services 249 335
Tax services 108 6
Other services 417 307
Auditor´s fees 774 648
Concept
January - December