fast retailing co., ltd. consolidated financial statements for
TRANSCRIPT
Fast Retailing Co., Ltd.
Consolidated Financial Statements
for the year ended 31 August 2020

1
Millions of yenThousands of
U.S. dollars*
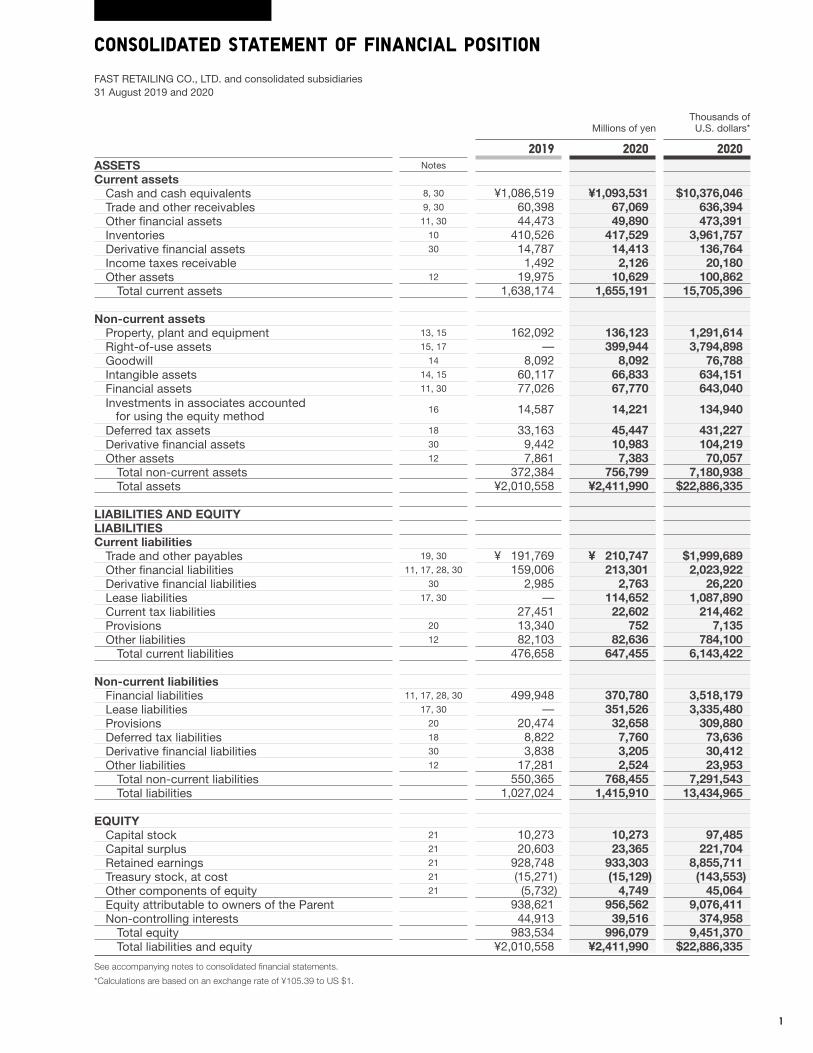
2019 2020 2020ASSETS Notes
Current assetsCash and cash equivalents 8, 30 ¥1,086,519 ¥1,093,531 $10,376,046 Trade and other receivables 9, 30 60,398 67,069 636,394 Other financial assets 11, 30 44,473 49,890 473,391 Inventories 10 410,526 417,529 3,961,757 Derivative financial assets 30 14,787 14,413 136,764 Income taxes receivable 1,492 2,126 20,180 Other assets 12 19,975 10,629 100,862
Total current assets 1,638,174 1,655,191 15,705,396
Non-current assetsProperty, plant and equipment 13, 15 162,092 136,123 1,291,614 Right-of-use assets 15, 17 — 399,944 3,794,898 Goodwill 14 8,092 8,092 76,788 Intangible assets 14, 15 60,117 66,833 634,151 Financial assets 11, 30 77,026 67,770 643,040 Investments in associates accounted for using the equity method
16 14,587 14,221 134,940
Deferred tax assets 18 33,163 45,447 431,227 Derivative financial assets 30 9,442 10,983 104,219 Other assets 12 7,861 7,383 70,057
Total non-current assets 372,384 756,799 7,180,938 Total assets ¥2,010,558 ¥2,411,990 $22,886,335
LIABILITIES AND EQUITYLIABILITIESCurrent liabilities
Trade and other payables 19, 30 ¥ 191,769 ¥ 210,747 $1,999,689 Other financial liabilities 11, 17, 28, 30 159,006 213,301 2,023,922 Derivative financial liabilities 30 2,985 2,763 26,220 Lease liabilities 17, 30 — 114,652 1,087,890 Current tax liabilities 27,451 22,602 214,462 Provisions 20 13,340 752 7,135 Other liabilities 12 82,103 82,636 784,100
Total current liabilities 476,658 647,455 6,143,422
Non-current liabilitiesFinancial liabilities 11, 17, 28, 30 499,948 370,780 3,518,179 Lease liabilities 17, 30 — 351,526 3,335,480 Provisions 20 20,474 32,658 309,880 Deferred tax liabilities 18 8,822 7,760 73,636 Derivative financial liabilities 30 3,838 3,205 30,412 Other liabilities 12 17,281 2,524 23,953
Total non-current liabilities 550,365 768,455 7,291,543 Total liabilities 1,027,024 1,415,910 13,434,965
EQUITYCapital stock 21 10,273 10,273 97,485 Capital surplus 21 20,603 23,365 221,704 Retained earnings 21 928,748 933,303 8,855,711 Treasury stock, at cost 21 (15,271) (15,129) (143,553)Other components of equity 21 (5,732) 4,749 45,064 Equity attributable to owners of the Parent 938,621 956,562 9,076,411 Non-controlling interests 44,913 39,516 374,958
Total equity 983,534 996,079 9,451,370 Total liabilities and equity ¥2,010,558 ¥2,411,990 $22,886,335
See accompanying notes to consolidated financial statements.
*Calculations are based on an exchange rate of ¥105.39 to US $1.
FAST RETAILING CO., LTD. and consolidated subsidiaries31 August 2019 and 2020
CONSOLIDATED STATEMENT OF FINANCIAL POSITION
2
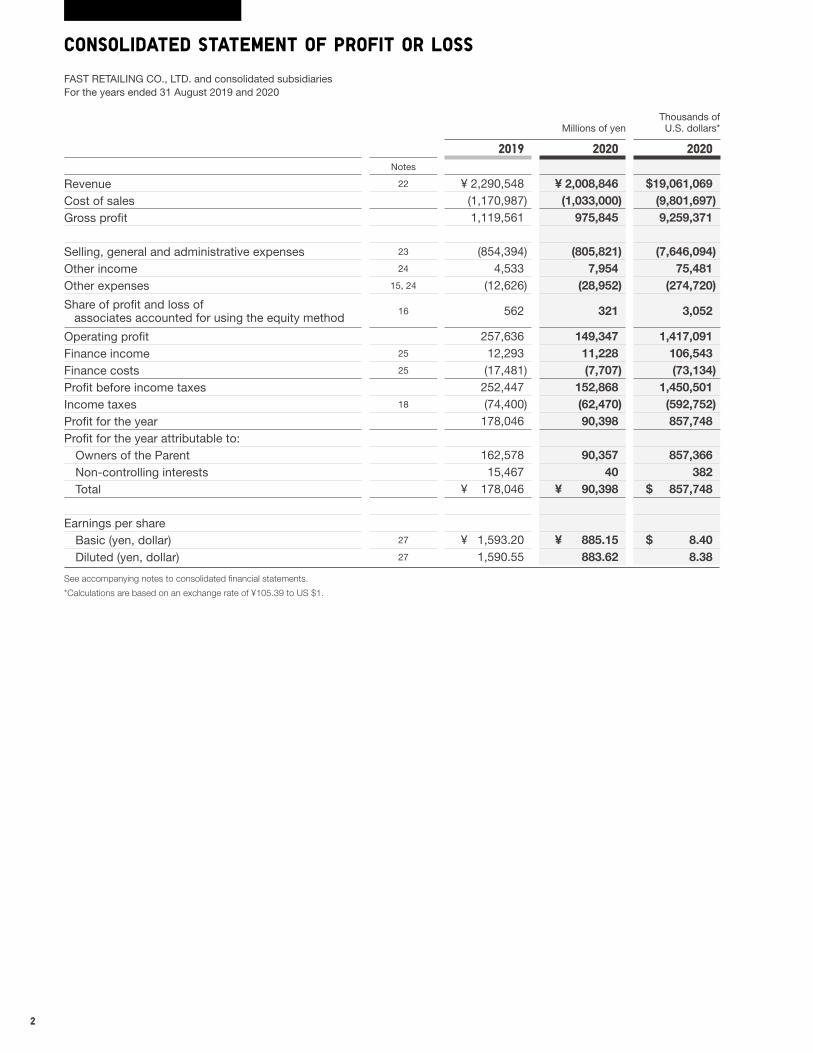
Millions of yenThousands of
U.S. dollars*
2019 2020 2020Notes
Revenue 22 ¥ 2,290,548 ¥ 2,008,846 $19,061,069Cost of sales (1,170,987) (1,033,000) (9,801,697)Gross profit 1,119,561 975,845 9,259,371
Selling, general and administrative expenses 23 (854,394) (805,821) (7,646,094)Other income 24 4,533 7,954 75,481 Other expenses 15, 24 (12,626) (28,952) (274,720)
Share of profit and loss of associates accounted for using the equity method
16 562 321 3,052
Operating profit 257,636 149,347 1,417,091 Finance income 25 12,293 11,228 106,543 Finance costs 25 (17,481) (7,707) (73,134)Profit before income taxes 252,447 152,868 1,450,501 Income taxes 18 (74,400) (62,470) (592,752)Profit for the year 178,046 90,398 857,748Profit for the year attributable to:
Owners of the Parent 162,578 90,357 857,366Non-controlling interests 15,467 40 382Total ¥ 178,046 ¥ 90,398 $ 857,748
Earnings per shareBasic (yen, dollar) 27 ¥ 1,593.20 ¥ 885.15 $ 8.40 Diluted (yen, dollar) 27 1,590.55 883.62 8.38
See accompanying notes to consolidated financial statements.
*Calculations are based on an exchange rate of ¥105.39 to US $1.
FAST RETAILING CO., LTD. and consolidated subsidiariesFor the years ended 31 August 2019 and 2020
CONSOLIDATED STATEMENT OF PROFIT OR LOSS
3
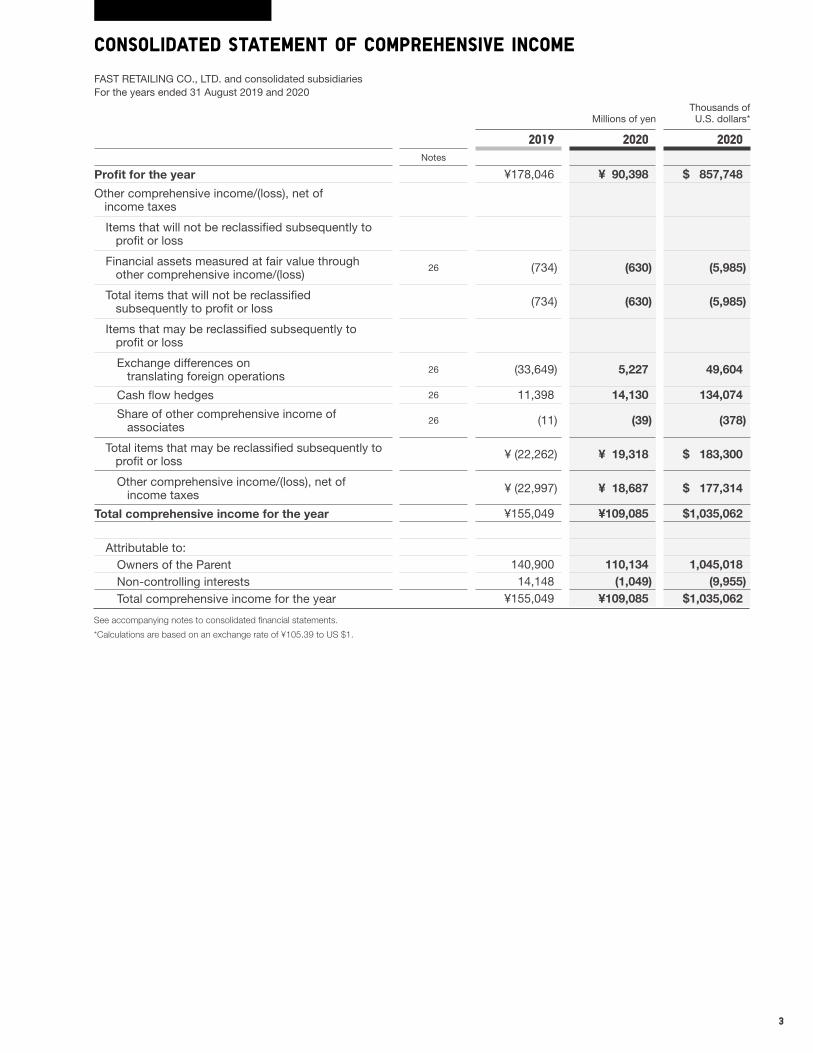
Millions of yenThousands of
U.S. dollars*
2019 2020 2020Notes
Profit for the year ¥178,046 ¥ 90,398 $ 857,748
Other comprehensive income/(loss), net of income taxes
Items that will not be reclassified subsequently to profit or loss
Financial assets measured at fair value through other comprehensive income/(loss)
26 (734) (630) (5,985)
Total items that will not be reclassified subsequently to profit or loss (734) (630) (5,985)
Items that may be reclassified subsequently to profit or loss
Exchange differences on translating foreign operations
26 (33,649) 5,227 49,604
Cash flow hedges 26 11,398 14,130 134,074
Share of other comprehensive income of associates
26 (11) (39) (378)
Total items that may be reclassified subsequently to profit or loss ¥ (22,262) ¥ 19,318 $ 183,300
Other comprehensive income/(loss), net of income taxes ¥ (22,997) ¥ 18,687 $ 177,314
Total comprehensive income for the year ¥155,049 ¥109,085 $1,035,062
Attributable to:Owners of the Parent 140,900 110,134 1,045,018 Non-controlling interests 14,148 (1,049) (9,955)Total comprehensive income for the year ¥155,049 ¥109,085 $1,035,062
See accompanying notes to consolidated financial statements.
*Calculations are based on an exchange rate of ¥105.39 to US $1.
FAST RETAILING CO., LTD. and consolidated subsidiariesFor the years ended 31 August 2019 and 2020
CONSOLIDATED STATEMENT OF COMPREHENSIVE INCOME
4
Millions of yen
Other components of equity
NotesCapital
stockCapital surplus
Retained earnings
Treasury stock, at cost
Financial assets
measured at fair value
through other comprehensive
income/(loss)
Foreign currency
translation reserve
Cash-flow hedge reserve
Share of other comprehensive
income of associates Total
Equity attributable
to owners of the Parent
Non-controlling interests
Total equity
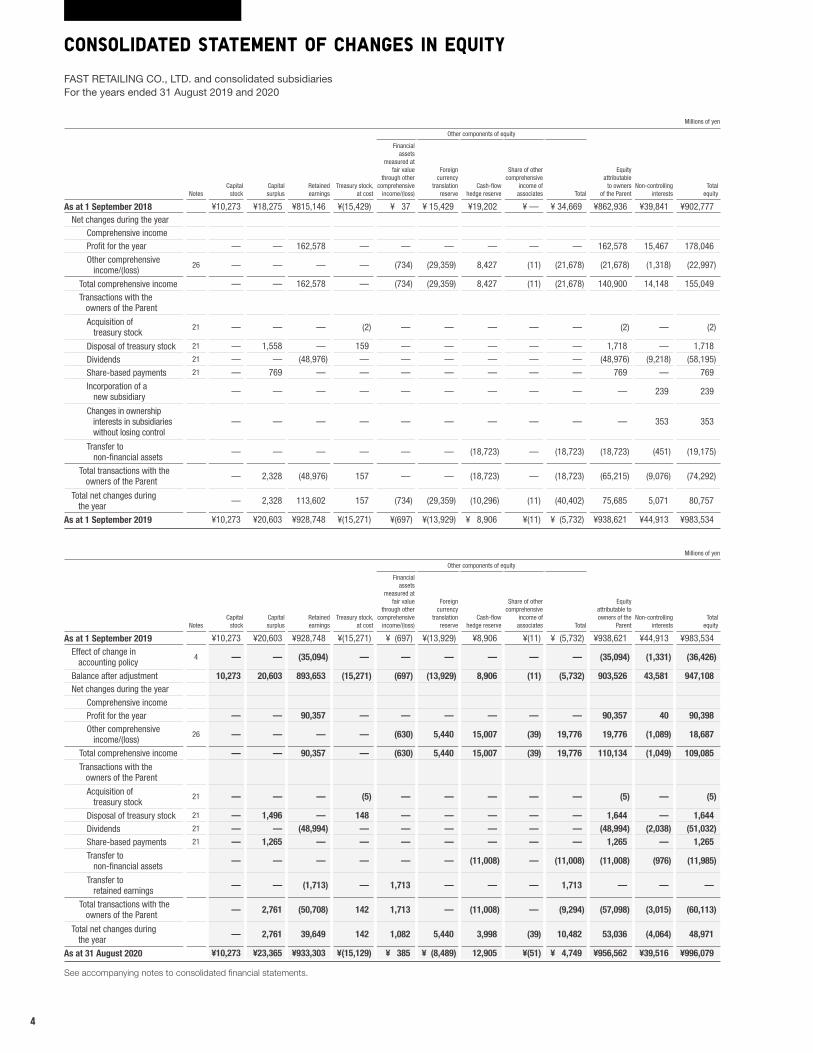
As at 1 September 2018 ¥10,273 ¥18,275 ¥815,146 ¥(15,429) ¥ 37 ¥ 15,429 ¥19,202 ¥ — ¥ 34,669 ¥862,936 ¥39,841 ¥902,777Net changes during the year
Comprehensive incomeProfit for the year — — 162,578 — — — — — — 162,578 15,467 178,046
Other comprehensive income/(loss)
26 — — — — (734) (29,359) 8,427 (11) (21,678) (21,678) (1,318) (22,997)
Total comprehensive income — — 162,578 — (734) (29,359) 8,427 (11) (21,678) 140,900 14,148 155,049
Transactions with the owners of the Parent
Acquisition of treasury stock
21 — — — (2) — — — — — (2) — (2)
Disposal of treasury stock 21 — 1,558 — 159 — — — — — 1,718 — 1,718
Dividends 21 — — (48,976) — — — — — — (48,976) (9,218) (58,195)
Share-based payments 21 — 769 — — — — — — — 769 — 769
Incorporation of a new subsidiary
— — — — — — — — — — 239 239
Changes in ownership interests in subsidiaries without losing control
— — — — — — — — — — 353 353
Transfer to non-financial assets
— — — — — — (18,723) — (18,723) (18,723) (451) (19,175)
Total transactions with the owners of the Parent — 2,328 (48,976) 157 — — (18,723) — (18,723) (65,215) (9,076) (74,292)
Total net changes during the year
— 2,328 113,602 157 (734) (29,359) (10,296) (11) (40,402) 75,685 5,071 80,757
As at 1 September 2019 ¥10,273 ¥20,603 ¥928,748 ¥(15,271) ¥(697) ¥(13,929) ¥ 8,906 ¥(11) ¥ (5,732) ¥938,621 ¥44,913 ¥983,534
Millions of yen
Other components of equity
NotesCapital
stockCapital surplus
Retained earnings
Treasury stock, at cost
Financial assets
measured at fair value
through other comprehensive
income/(loss)
Foreign currency
translation reserve
Cash-flow hedge reserve
Share of other comprehensive
income of associates Total
Equity attributable to owners of the
ParentNon-controlling
interestsTotal
equity
As at 1 September 2019 ¥10,273 ¥20,603 ¥928,748 ¥(15,271) ¥ (697) ¥(13,929) ¥8,906 ¥(11) ¥ (5,732) ¥938,621 ¥44,913 ¥983,534
Effect of change in accounting policy
4 — — (35,094) — — — — — — (35,094) (1,331) (36,426)
Balance after adjustment 10,273 20,603 893,653 (15,271) (697) (13,929) 8,906 (11) (5,732) 903,526 43,581 947,108Net changes during the year
Comprehensive incomeProfit for the year — — 90,357 — — — — — — 90,357 40 90,398Other comprehensive income/(loss)
26 — — — — (630) 5,440 15,007 (39) 19,776 19,776 (1,089) 18,687
Total comprehensive income — — 90,357 — (630) 5,440 15,007 (39) 19,776 110,134 (1,049) 109,085
Transactions with the owners of the Parent
Acquisition of treasury stock
21 — — — (5) — — — — — (5) — (5)
Disposal of treasury stock 21 — 1,496 — 148 — — — — — 1,644 — 1,644Dividends 21 — — (48,994) — — — — — — (48,994) (2,038) (51,032)Share-based payments 21 — 1,265 — — — — — — — 1,265 — 1,265
Transfer to non-financial assets
— — — — — — (11,008) — (11,008) (11,008) (976) (11,985)
Transfer to retained earnings
— — (1,713) — 1,713 — — — 1,713 — — —
Total transactions with the owners of the Parent — 2,761 (50,708) 142 1,713 — (11,008) — (9,294) (57,098) (3,015) (60,113)
Total net changes during the year
— 2,761 39,649 142 1,082 5,440 3,998 (39) 10,482 53,036 (4,064) 48,971
As at 31 August 2020 ¥10,273 ¥23,365 ¥933,303 ¥(15,129) ¥ 385 ¥ (8,489) 12,905 ¥(51) ¥ 4,749 ¥956,562 ¥39,516 ¥996,079
See accompanying notes to consolidated financial statements.
FAST RETAILING CO., LTD. and consolidated subsidiariesFor the years ended 31 August 2019 and 2020
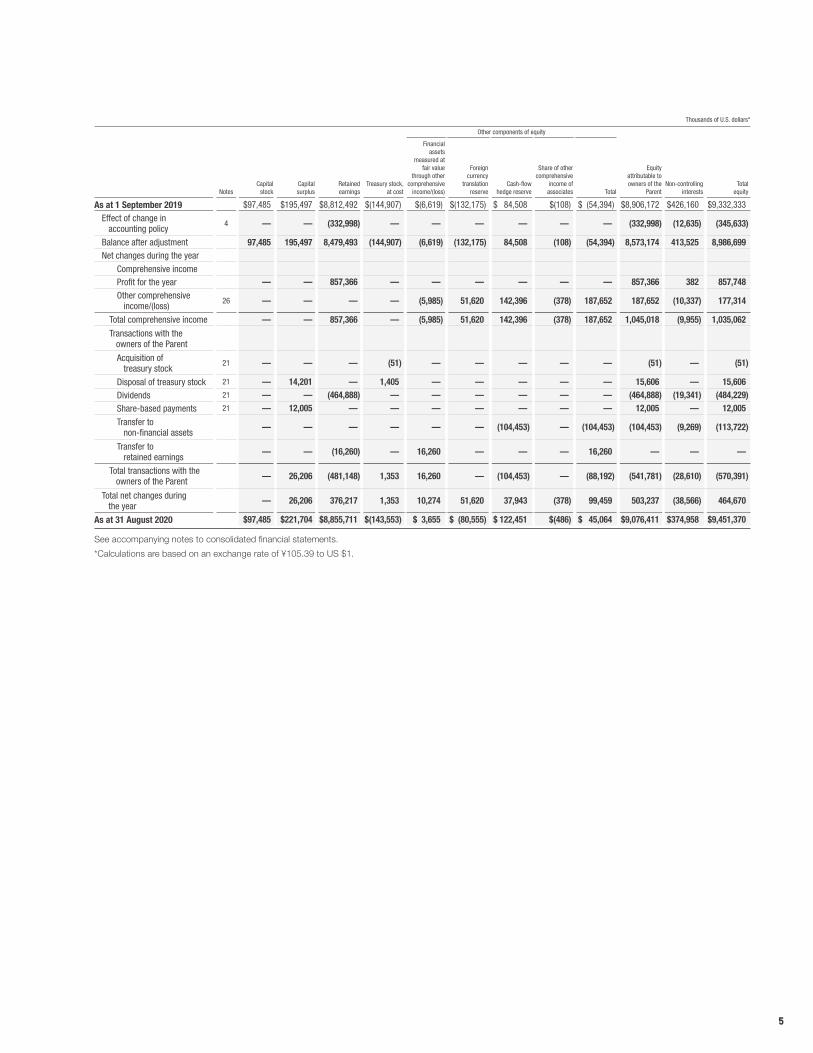
CONSOLIDATED STATEMENT OF CHANGES IN EQUITY
5
See accompanying notes to consolidated financial statements.
*Calculations are based on an exchange rate of ¥105.39 to US $1.
Thousands of U.S. dollars*
Other components of equity
NotesCapital
stockCapital surplus
Retained earnings
Treasury stock, at cost
Financial assets
measured at fair value
through other comprehensive
income/(loss)
Foreign currency
translation reserve
Cash-flow hedge reserve
Share of other comprehensive
income of associates Total
Equity attributable to owners of the
ParentNon-controlling
interestsTotal
equity
As at 1 September 2019 $97,485 $195,497 $8,812,492 $(144,907) $(6,619) $(132,175) $ 84,508 $(108) $ (54,394) $8,906,172 $426,160 $9,332,333
Effect of change in accounting policy
4 — — (332,998) — — — — — — (332,998) (12,635) (345,633)
Balance after adjustment 97,485 195,497 8,479,493 (144,907) (6,619) (132,175) 84,508 (108) (54,394) 8,573,174 413,525 8,986,699Net changes during the year
Comprehensive incomeProfit for the year — — 857,366 — — — — — — 857,366 382 857,748Other comprehensive income/(loss)
26 — — — — (5,985) 51,620 142,396 (378) 187,652 187,652 (10,337) 177,314
Total comprehensive income — — 857,366 — (5,985) 51,620 142,396 (378) 187,652 1,045,018 (9,955) 1,035,062
Transactions with the owners of the Parent
Acquisition of treasury stock
21 — — — (51) — — — — — (51) — (51)
Disposal of treasury stock 21 — 14,201 — 1,405 — — — — — 15,606 — 15,606 Dividends 21 — — (464,888) — — — — — — (464,888) (19,341) (484,229)Share-based payments 21 — 12,005 — — — — — — — 12,005 — 12,005
Transfer to non-financial assets
— — — — — — (104,453) — (104,453) (104,453) (9,269) (113,722)
Transfer to retained earnings
— — (16,260) — 16,260 — — — 16,260 — — —
Total transactions with the owners of the Parent — 26,206 (481,148) 1,353 16,260 — (104,453) — (88,192) (541,781) (28,610) (570,391)
Total net changes during the year
— 26,206 376,217 1,353 10,274 51,620 37,943 (378) 99,459 503,237 (38,566) 464,670
As at 31 August 2020 $97,485 $221,704 $8,855,711 $(143,553) $ 3,655 $ (80,555) $ 122,451 $(486) $ 45,064 $9,076,411 $374,958 $9,451,370
6
Millions of yenThousands of
U.S. dollars*
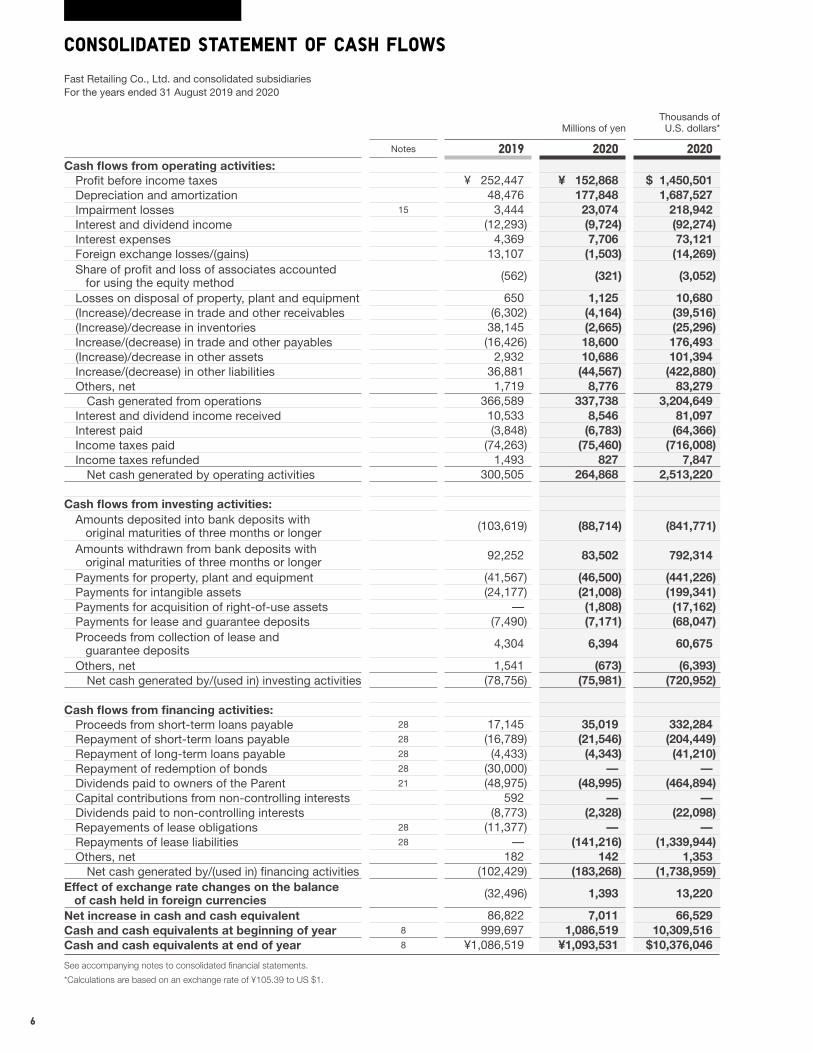
Notes 2019 2020 2020Cash flows from operating activities:
Profit before income taxes ¥ 252,447 ¥ 152,868 $ 1,450,501Depreciation and amortization 48,476 177,848 1,687,527Impairment losses 15 3,444 23,074 218,942Interest and dividend income (12,293) (9,724) (92,274)Interest expenses 4,369 7,706 73,121Foreign exchange losses/(gains) 13,107 (1,503) (14,269)Share of profit and loss of associates accounted for using the equity method (562) (321) (3,052)
Losses on disposal of property, plant and equipment 650 1,125 10,680(Increase)/decrease in trade and other receivables (6,302) (4,164) (39,516)(Increase)/decrease in inventories 38,145 (2,665) (25,296)Increase/(decrease) in trade and other payables (16,426) 18,600 176,493(Increase)/decrease in other assets 2,932 10,686 101,394Increase/(decrease) in other liabilities 36,881 (44,567) (422,880)Others, net 1,719 8,776 83,279
Cash generated from operations 366,589 337,738 3,204,649Interest and dividend income received 10,533 8,546 81,097Interest paid (3,848) (6,783) (64,366)Income taxes paid (74,263) (75,460) (716,008)Income taxes refunded 1,493 827 7,847
Net cash generated by operating activities 300,505 264,868 2,513,220
Cash flows from investing activities:Amounts deposited into bank deposits with original maturities of three months or longer (103,619) (88,714) (841,771)
Amounts withdrawn from bank deposits with original maturities of three months or longer 92,252 83,502 792,314
Payments for property, plant and equipment (41,567) (46,500) (441,226)Payments for intangible assets (24,177) (21,008) (199,341)Payments for acquisition of right-of-use assets — (1,808) (17,162)Payments for lease and guarantee deposits (7,490) (7,171) (68,047)Proceeds from collection of lease and guarantee deposits 4,304 6,394 60,675
Others, net 1,541 (673) (6,393)Net cash generated by/(used in) investing activities (78,756) (75,981) (720,952)
Cash flows from financing activities:Proceeds from short-term loans payable 28 17,145 35,019 332,284Repayment of short-term loans payable 28 (16,789) (21,546) (204,449)Repayment of long-term loans payable 28 (4,433) (4,343) (41,210)Repayment of redemption of bonds 28 (30,000) — —Dividends paid to owners of the Parent 21 (48,975) (48,995) (464,894)Capital contributions from non-controlling interests 592 — —Dividends paid to non-controlling interests (8,773) (2,328) (22,098)Repayements of lease obligations 28 (11,377) — —Repayments of lease liabilities 28 — (141,216) (1,339,944)Others, net 182 142 1,353
Net cash generated by/(used in) financing activities (102,429) (183,268) (1,738,959)Effect of exchange rate changes on the balance of cash held in foreign currencies (32,496) 1,393 13,220
Net increase in cash and cash equivalent 86,822 7,011 66,529Cash and cash equivalents at beginning of year 8 999,697 1,086,519 10,309,516Cash and cash equivalents at end of year 8 ¥1,086,519 ¥1,093,531 $10,376,046
See accompanying notes to consolidated financial statements.
*Calculations are based on an exchange rate of ¥105.39 to US $1.
Fast Retailing Co., Ltd. and consolidated subsidiariesFor the years ended 31 August 2019 and 2020
CONSOLIDATED STATEMENT OF CASH FLOWS
7
FAST RETAILING CO., LTD. and consolidated subsidiaries
1 Reporting Entity
FAST RETAILING CO., LTD. is a company incorporated in Japan. The locations of the registered headquarters and principal offices of the Company are disclosed at the Group’s website (http://www.fastretailing.com/eng/). The principal activities of the Company and its consoli-dated subsidiaries (the “Group”) are the UNIQLO business (casual wear retail business operating under the “UNIQLO” brand in Japan and overseas), GU business (casual wear retail business operating under the “GU” brand in Japan and overseas) and Theory business (apparel designing and retail business in Japan and overseas), etc.
2 Basis of Preparation
(1) Compliance with IFRSThe consolidated financial statements of the Group have been prepared in compliance with IFRS issued by the IASB. The Group meets all criteria of a “specified company” defined under Article 1-2 of the Rules Governing Term, Form, and Preparation of Consolidated Financial Statements accordingly, applies Article 93 of the Rules Governing Term, Form, and Preparation of Consolidated Financial Statements.
(2) Approval of the Consolidated Financial StatementsThe consolidated financial statements were approved on 26 November 2020 by Tadashi Yanai, Chairman, President, and CEO, and Takeshi Okazaki, Group Senior Vice President and CFO.
(3) Basis of MeasurementThe consolidated financial statements have been prepared on a historical cost basis, except for certain assets, liabilities, and financial instruments which are measured at fair value as indicated in “3. Significant Accounting Policies.”
(4) Functional Currency and Presentation CurrencyThe presentation currency for the Group’s consolidated financial statements is yen (in units of millions of yen), which is also the Company’s functional currency. All values are rounded down to the nearest million yen, except when other-wise indicated.
(5) Use of Estimates and JudgmentsThe preparation of the consolidated financial statements in accordance with IFRS requires management to make judg-ments, estimates, and assumptions that affect the applica-tion of accounting policies and the reported amounts of assets and liabilities, income and expenses. Actual results
may differ from these estimates. The estimates and underlying assumptions are reviewed on an ongoing basis. The effects of the review of accounting estimates are recognized in the accounting period in which the estimates were reviewed and in future accounting periods. Information about important estimates and judgments that have significant effects on the amounts recognized in the consolidated financial statements is as follows:• Valuation of inventories (3. Significant Accounting Policies
(6) and Note 10)• Recoverable amounts from cash-generating units (“CGU”)
for impairment tests (3. Significant Accounting Policies (10) and Note 15)
• Useful lives of property, plant and equipment, and intangi-ble assets (3. Significant Accounting Policies (7), (8) and Notes 13, 14)
• Recoverability of deferred tax assets (3. Significant Accounting Policies (14) and Note 18)
• Recoverability of trade and other receivables (3. Significant Accounting Policies (4) and Note 9, 30)
• Accounting treatment and valuation of provisions (3. Significant Accounting Policies (11) and Note 20)
• Fair value measurement of financial instruments (3. Significant Accounting Policies (4) and Note 30)
• Fair value measurement for unit price for share-based pay-ments (3. Significant Accounting Policies (12) and Note 29)
• Lease term (3. Significant Accounting Policies (9) and Note 17)
With the global spread of COVID-19, the Group’s perfor-mance has been adversely affected due to temporarily clos-ing stores, etc. Regarding impairment of non-financial assets, although we assume that business activities will gradually recover from September 2020 onward, we estimate that the impact of the COVID-19 pandemic will continue to be felt through to the end of August 2021, and we are working on the assumption that we will see recovery from that point onward. The estimates are made by taking into consideration the level of impact that differ from region to region and case-by-case basis.
(6) Basis of Financial Statement TranslationThe accompanying consolidated financial statements are expressed in yen, and solely for the convenience of the reader, have been translated into United States (U.S.) dollars at the rate of ¥105.39=$1, the approximate exchange rate prevailing on the Tokyo Foreign Exchange Market at 31 August 2020. This translation should not be construed as a representation that any amounts shown could be converted into U.S. dollars at that or any other rate.
NOTES TO THE CONSOLIDATED FINANCIAL STATEMENTS
8
3 Significant Accounting Policies
A. Basis of Consolidation(1) SubsidiariesA subsidiary is an entity (including a structured entity), directly or indirectly, controlled by the Company. The Group controls enterprises when it is exposed, or has rights, to variable returns arising from its involvement in those enterprises or when the Group has rights to variable returns in those enter-prises and is able to have an impact on said variable returns through its power over those enterprises. A subsidiary’s financial statements are incorporated into the Group’s con-solidated financial statements from the date on which the Group, obtains control until the date that control ceases. The subsidiaries adopted the consistent accounting poli-cies as the Company in the preparation of their financial statements. All intra-group balances, transactions within the Group as well as unrealized profit and loss resulting from transactions within the Group are eliminated at the time of preparation of the consolidated financial statements. The statutory fiscal year end dates for FAST RETAILING (CHINA) TRADING CO., LTD., UNIQLO TRADING CO., LTD., FAST RETAILING (SHANGHAI) TRADING CO., LTD., GU (Shanghai) Co., Ltd. and ten other companies vary between 31 December, 31 March and 30 June. The management accounts the financial statements of these subsidiaries as at the Group’s year-end that were pre-pared solely for the Group’s consolidation purpose. The financial statements of other subsidiaries are pre-pared using the same reporting period as the Parent company. A change in the ownership interest of a subsidiary, with-out a loss of control, is accounted for as an equity transaction. Any difference between the adjustment to the non-con-trolling interest and the fair value of the consideration received is recognized directly in equity as interests attribut-able to owners of the Parent. Profit or loss and each component of other comprehen-sive income are attributed to the owners of the Parent and to the non-controlling interests, even if this results in the non-controlling interests having a deficit balance. The number of consolidated subsidiaries as at 31 August 2020 is 134.
(2) Investments in associatesAn associate is an entity in which the Group has significant influence over the financial and operating policies. If the Group holds 20% or more of the voting rights of another enterprise, it is presumed that the Group has a sig-nificant influence over the other enterprise. Investments in
associates are accounted by applying the equity method, and measured at historical cost at the time of acquisition. Thereafter the carrying amount of the investment is adjusted to recognize changes in the Group’s share of net assets of the associate since acquisition date. The consoli-dated statement of profit or loss of profit or loss reflects the Group’s share of the results of operations of the associate. Any change in other comprehensive income of those invest-ees is presented as part of the Group’s other comprehensive income. Unrealized gains and losses resulting from transactions between the Group and the associate are eliminated to the extent of the interest in the associate. The number of associates as at 31 August 2020 is four.
B. Business combinationsBusiness combinations are accounted for using the acquisi-tion method. The cost of an acquisition is measured at the aggregation of the acquisition date fair values of assets transferred, liabilities assumed, and equity interests issued by the Company in exchange for control of the acquired company. If the cost of an acquisition exceeds the fair value of the identifiable assets and liabilities, it is recorded as goodwill on the consolidated statement of financial position. If it is below the fair value, this is immediately recorded as gains on the consolidated statement of profit or loss. Acquisition-related costs are expensed as incurred. Additional acquisitions of non-controlling interests are accounted for as equity transactions, and no goodwill is recognized. Contingent liabilities of acquired companies are recog-nized in a business combination only if they are present obli-gations, were incurred as a result of a past event, and their fair value can be reliably measured. For each business combination, the Group elects whether to measure the non-controlling interests in the acquiree at fair value or at the proportionate share of the acquiree’s identifiable net assets. If the initial accounting for a business combination is incomplete by the reporting date of the fiscal year in which the business combination occurs, the items for which the acquisition accounting is incomplete are reported using pro-visional amounts. Those amounts provisionally recognized on the acquisition date are retrospectively adjusted to reflect new information as if the acquisitions took place during the measurement period, had facts and circumstances that existed at the acquisition date been known at that time, they would have affected the amounts recognized on that date. Additional assets and liabilities are recognized if new infor-mation results in the recognition of additional assets or liabili-
9
ties. The measurement period should be within one year.
C. Foreign Currencies(1) Transactions and balancesTransactions in foreign currencies are initially recorded by the Group’s entities at their respective functional currency spot rates at the date the transaction first qualifies for recognition. Monetary assets and liabilities denominated in foreign currencies are translated at the functional currency spot rates of exchange at the reporting date. Differences arising from settlement or translation of monetary items are recog-nized in profit or loss. Non-monetary items that are measured in terms of his-torical cost in a foreign currency are translated using the exchange rates at the dates of the initial transactions. Non-monetary items measured at fair value in a foreign currency are translated using the exchange rates at the date when the fair value is determined. The gain or loss arising on transla-tion of non-monetary items measured at fair value is treated in line with the recognition of gain or loss on change in fair value of the item (i.e., translation differences on items whose fair value gain or loss is recognized in other comprehensive income or profit or loss are also recognized in other compre-hensive income or profit or loss, respectively).
(2) Foreign OperationsUpon consolidation, the assets and liabilities of foreign oper-ations are translated into yen at the rate of exchange prevail-ing at each reporting date and their statements of profit or loss are translated at average exchange rates during the period. The exchange differences arising on translation for consolidation are recognized in other comprehensive income. On disposal of a foreign operation, the component of other comprehensive income relating to that particular for-eign operation is recognized in profit or loss.
D. Financial Instruments(1) Financial assets(a) Initial recognition and measurementThe Group classifies financial assets as “financial assets measured at fair value through net profit or loss”; “financial assets measured at fair value through other comprehensive income” or “financial assets measured at amortized cost”; and that classification is determined at the time of initial recognition. The Group carries out initial recognition on the date of the transaction, when it becomes party to the contract related to the financial asset(s). All financial assets are measured by adding directly linked transaction costs to fair value, except those in the category classified as measured at fair value through net profit or loss.
Financial assets are classified as financial assets mea-sured at amortized cost, if the following requirements are satisfied:• Assets are held based on a business model that requires
them to be held to collect contractual cash flow• Cash flow, made up solely of payment of the principal and
interest on the balance of principal, is generated on a specified day under the contractual terms of the financial asset.
Financial assets other than financial assets measured at amortized cost are classified as financial assets measured at fair value. Apart from equity instruments held for trading pur-poses, which must be measured at fair value through Profit or Loss, other equity instruments measured at fair value are designated as either being measured at fair value through Profit or Loss or alternatively measured at fair value through Other Comprehensive Income; this is done for each individ-ual equity instrument and the designation is continuously applied to the instrument thereafter.
(b) Subsequent measurementMeasurement after the initial recognition of financial assets is carried out as follows in accordance with the classification.( i ) Financial assets measured at amortized cost Financial assets measured at amortized cost are mea-
sured at amortized cost using the effective interest method.
(ii) Financial assets measured at fair value The fluctuation in the fair value of financial assets mea-
sured at fair value is recognized as net profit or loss. However, any fluctuation in the fair value of equity finan-cial instruments designated as instruments to be mea-sured at fair value through other comprehensive income, is recognized as other comprehensive income; and if rec-ognition is suspended or if the fair value significantly drops, then it is transferred to Retained earnings. Note that dividends from the financial assets are recognized as net profit or loss as part of finance income.
(c) Impairment of financial assetsFor financial assets measured at amortized cost, expected credit losses pertaining to the financial assets are recognized as allowances for doubtful accounts. On each reporting date, the credit risk pertaining to each financial asset is evaluated to see if it has increased signifi-cantly since initial recognition and, if it has, then the expected credit losses for the entire period are recognized as an allow-ance for doubtful accounts; whereas if it has not, then the expected credit losses for a 12-month period are recognized as an allowance for doubtful accounts. At the time of an evaluation, if the contractual payment
10
due date has passed then, in principle, it will be assumed that the credit risk has significantly increased; however, when the evaluation takes place, other information that can be rea-sonably used and used as support is taken into account. However, trade receivables, etc., that do not include any major financial elements are always recognized as being an amount equivalent to expected credit loss for the entire period. If the issuer or debtor is in serious financial difficulties or is subject to a legal or formal business failure, then it is judged that there has been a default on obligations. And if it is judged that there has been a default on obligations, then the assets are treated as credit-impaired financial assets. Irrespective of the above, if it is reasonably judged that all or part of financial assets cannot be collected due to our legal rights of claim being terminated or similar, then the book value of the financial assets is directly amortized.
(d) Derecognition of financial assetsThe Group derecognizes a financial asset only if the contrac-tual rights to the cash flows from the financial asset expire or if the Group has transferred almost all risks and rewards of ownership. If the Group maintains control of the transferred financial asset, it recognizes the asset and associated liabili-ties to the extent of its continuing involvement.
(2) Non-derivative financial liabilities(a) Initial recognition and measurementCorporate bonds and loans, etc., are initially recognized by the Group on their effective date; and other financial liabilities are initially recognized on their transaction date. Financial lia-bilities are either classified as financial liabilities measured at fair value through profit or loss or financial liabilities measured at amortized cost, and this classification is determined at the time of initial recognition. All financial liabilities are initially measured at fair value, but financial liabilities measured at amortized cost are measured using the amount obtained after deducting directly attributable transaction costs.
(b) Subsequent measurementsFor measurements made after the initial recognition of a financial liability, any financial liabilities measured at fair value through profit or loss include financial liabilities held for trad-ing purposes and financial liabilities specified at the time of initial recognition as measured at fair value through profit or loss; and when these liabilities are measured at fair value after initial recognition, any changes are recognized as profit or loss for the current period. Any financial liabilities mea-sured at amortized cost are measured after initial recognition at amortized cost using the effective interest method. Any gains or losses made in the event of amortization using the effective interest method and the de-recognition of a liability
are recognized as profit or loss for the current period as part of finance costs.
(c) Derecognition of financial liabilitiesThe Group derecognizes a financial liability when it is extin-guished, that is, when the obligation specified in the contract is either discharged, cancelled, or expired.
(3) Presentation of financial assets and financial liabilitiesThe balance of financial assets and financial liabilities is offset on the consolidated statement of financial position and the net amount is presented only in cases in which the Group has the right to legally enforce offsetting the balances and also intends to settle the net amount, or realize assets and settle liabilities, at the same time.
(4) Derivative financial instruments and hedge accountingThe Group uses derivative financial instruments, such as for-ward currency contracts, to hedge its foreign currency risks. Such derivative financial instruments are initially recognized at fair value on the date on which a derivative contract is entered into and are subsequently re-measured at fair value. Derivatives are carried as financial assets when the fair value is positive and as financial liabilities when the fair value is negative. Any gains or losses arising from changes in the fair value of derivatives are taken directly to profit or loss, except for the effective portion of cash flow hedges, which is recog-nized in other comprehensive income and later reclassified to profit or loss when the hedge item affects profit or loss. At the inception of a hedge relationship, the Group for-mally designates and documents the hedge relationship to which the Group wishes to apply hedge accounting and the risk management objectives and strategy for undertaking the hedge. The documentation includes identification of the spe-cific hedging instrument, the hedged item or transaction, the nature of the risk being hedged, and how the entity will assess the hedging instrument’s effectiveness in offsetting the exposure to changes in the hedged item’s fair value or cash flows attributable to the hedged risk. Such hedges are expected to be highly effective in achieving offsetting changes in fair value or cash flows and are assessed on an ongoing basis to determine that they actually have been highly effective throughout the financial reporting periods for which they were designated. The Group has designated forward currency contracts as cash flow hedges and are accounted for as described below:
Cash flow hedgesFor gains and losses on hedges, effective portions are recog-nized as other comprehensive income, and non-effective
11
portions are immediately recognized as net profit or loss on the Consolidated Statement of Profit or Loss. Amounts pertaining to hedges that are included as other comprehensive income are transferred to profit or loss at the point in time when the hedged trades have an impact on profit or loss. If a transaction is planned that will generate rec-ognition of hedged assets or liabilities of a non-financial nature, then the amount that is recognized as other compre-hensive income is processed as a correction of the initial book value for the non-financial asset or liability. If the forecast transaction or firm commitment is no longer expected to occur, cumulative profit or loss amounts previ-ously recognized in equity through other comprehensive income are reclassified as profits or losses. If the hedging instrument expires or is sold, is terminated or exercised with-out replacement or rollover, or if its designation as a hedge is revoked, the amounts previously recognized in equity through other comprehensive income are recorded as equity until the forecast transaction occurs or firm commitment is met.
E. Cash and cash equivalentsCash and cash equivalents comprise cash on hand, bank deposits available for withdrawal on demand, and short-term, highly liquid investments due with a maturity of three months of the acquisition date or less that are readily con-vertible to cash and which are subject to an insignificant risk of changes in value.
F. InventoriesInventories are valued at the lower of cost and net realizable value; the weighted average method is principally used to determine cost. Net realizable value is based on the esti-mated selling price in the ordinary course of business less any estimated costs to sell.
G. Property, plant and equipment (1) Recognition and measurementProperty, plant and equipment are measured at cost less accumulated depreciation and any accumulated impairment losses. The cost of an item of property, plant and equipment comprises its purchase price and any directly attributable costs of bringing the asset to its working condition and loca-tion for its intended use, the initial estimate of the costs of dismantling and removing the item and restoring the site on which it is located.
(2) DepreciationAssets other than land and construction in progress are depreciated using the straight-line method over the esti-mated useful lives shown below:
Buildings and structures 3–30 years Furniture, equipment, and vehicles 5 years The useful lives, residual values, and depreciation meth-ods are reviewed at each reporting date, with the effect of any changes in estimates being accounted for on a prospec-tive basis.
H. Goodwill and intangible assets (1) GoodwillGoodwill is stated at the carrying amount, which is the acqui-sition cost after deducting accumulated impairment losses. Goodwill represents the excess amount of the historical cost of an interest acquired by the Group over the net amount of the fair value of the identifiable assets acquired and liabilities assumed. Goodwill is not amortized but is allocated to identifiable CGU based on the geographical region where business takes place and the type of business conducted, and then tested for impairment each year or when there is an indica-tion that it may be impaired. Impairment losses on goodwill are recognized in the consolidated statement of profit or loss and cannot be subsequently reversed in future periods.
(2) Intangible assetsIntangible assets are measured at cost, with any accumu-lated amortization and accumulated impairment losses deducted from the historical cost to arrive at the stated car-rying amount. Intangible assets acquired separately are measured at cost at initial recognition, and the cost of intangible assets acquired in a business combination is measured as fair value at the acquisition date. For internally generated intangible assets, the entire amount of the expenditure is recorded as an expense in the period in which it arises, except for development expenses that meet the requirements for capitalization. Intangible assets with finite useful lives are amortized over their respective estimated useful lives using the straight-line method, and they are tested for impairment when there is an indication that they may be impaired. The estimated useful life and amortization method for an intangible asset with a finite useful life is reviewed at the end of each reporting period, and any changes are applied prospectively as a change in accounting estimate. The estimated useful lives of the main intangible assets with finite useful lives are as follows:• Software for internal use Length of time it is usable
internally (3 to 5 years) Intangible assets with indefinite useful lives and intangible assets that are not yet available for use are not amortized. They are tested for impairment annually or when there is an
12
indication that they may be impaired, either individually or at the CGU level.
I. LeasesYear ended 31 August 2019The determination of whether an arrangement is, or contains, a lease is made based on the substance of the arrangement on the inception date of the lease, or in other words, whether the fulfillment of the arrangement depends on the use of a specific asset or group of assets and whether the arrange-ment conveys the right to such asset (whether explicitly stated in the contract or not). If the lease agreement substantially conveys the risks and rewards of the ownership of the asset to the lessee, the lease is classified as a finance lease. Leases other than finance leases are classified as operating leases. Finance leases are capitalized at the commencement of the lease at the fair value of the leased property or, if lower, at the present value of the minimum lease payments. Lease payments are apportioned between finance charges and reduction of the lease liability so as to achieve a constant rate of interest on the remaining balance of the liability. Finance charges are recognized in finance costs in the con-solidated statement of profit or loss. A leased asset is depreciated over the shorter of the esti-mated useful life of the asset and the lease term on a straight-line basis. Operating lease payments as lessee are recognized as an operating expense in the consolidated statement of profit or loss on a straight-line basis over the lease term. Operating lease income as lessor is recognized as an operating revenue in the consolidated statement of profit or loss on a straight-line basis over the lease term.
Year ended 31 August 2020(1) As LesseeRight-of-use assets are initially measured at cost at the com-mencement date of their lease. The cost includes the amount of the initial measurement of the lease liability, any lease payments made at or before the commencement date, less any lease incentives received, and any initial direct costs incurred. After the initial measurement, right-of-use assets are depreciated over the lease term using the straight-line method. The lease term is determined as the non-cancella-ble period together with periods covered by an option to ter-minate the lease if the lessee is reasonably certain not to exercise that option. The right-of-use assets are measured at cost less accumulated depreciation and any accumulated impairment losses. Lease liabilities are initially measured at the present value
of the lease payments that are not paid at the commence-ment date. The lease payments are discounted using the interest rate implicit in the lease, if that rate can be readily determined. If that rate cannot be readily determined, the incremental borrowing rate is used. The lease payments included in the measurement of the lease liability comprise the fixed payments and payments of penalties for terminating the lease, if the lease term reflects the exercising an option to terminate the lease. Subsequent to initial recognition, lease liabilities are mea-sured at amortized cost using the effective interest method. Lease liabilities are remeasured if there is a change in future lease payments resulting from a change in an index or a rate, or a change in the assessment of possibility of exercising a termination option. If a lease liability is remeasured, the amount of the remea-surement of the lease liability is recognized as an adjustment to the right-of-use asset.
(2) As LessorFor leases where the Group is the lender, each lease is clas-sified as either a finance lease or an operating lease at the time that the lease is agreed. In classifying each lease, the Group comprehensively evaluates whether or not the risks and economic value asso-ciated with ownership of the underlying assets all transfer substantively. If they do transfer, the lease is classified as a finance lease; otherwise, it is classified as an operating lease. Leases in which the Group acts as lender all correspond to subleases in which the Group acts as an intermediate lender. Head leases and subleases are accounted separately. In its consolidated financial statement, the Group includes lender finance leases pertaining to relevant subleases in “other current financial assets and “non-current financial assets.”
J. ImpairmentThe carrying amounts of the Group’s non-financial assets, excluding inventories and deferred tax assets, are reviewed to determine whether there is any indication of impairment at each reporting date. If there is any indication of impairment, the recoverable amount for the asset is estimated. For good-will, intangible assets with indefinite useful lives, and intangi-ble assets that are not yet available for use, the recoverable amount is estimated each year at the same time. The recoverable amount for an asset or CGU is the higher of value-in-use and fair value less costs of disposal. The fair value less costs of disposal calculation is based on available data from binding sales transactions, conducted at arm’s length, for similar assets or observable market prices less incremental costs for disposing of the asset. In
13
assessing value-in-use, the estimated future cash flows are discounted to their present value using a pre-tax discount rate that reflects the time value of money and the risks spe-cific to the asset. A CGU is the smallest group of assets which generates cash inflows from continuing use which are largely indepen-dent of the cash inflows from other assets or groups of assets. The CGU (or group of CGUs) for goodwill is determined based on the unit by which the goodwill is monitored for internal management purposes and must not be larger than an operating segment before aggregation. Because the corporate assets do not generate indepen-dent cash inflows, if there is an indication that corporate assets may be impaired, the recoverable amount is deter-mined for the CGU to which the corporate assets belong. If the carrying amount of an asset or a CGU exceeds the recoverable amount, an impairment loss is recognized in profit or loss for the period. Impairment losses recognized in relation to a CGU are first allocated to reduce the carrying amount of any goodwill allocated to the CGU and then allo-cated to the other assets of the CGU pro rata on the basis of their carrying amounts. An impairment loss related to goodwill cannot be reversed in future periods. Previously recognized impairment losses on assets other than goodwill are reviewed at each reporting date to determine whether there is any indication that a loss has decreased or no longer exists. A previously recognized impairment loss is reversed only if there has been a change in the assumptions used to determine the asset’s recoverable amount since the last impairment loss was rec-ognized. The reversal is limited so that the carrying amount of the asset does not exceed its recoverable amount, nor exceed the carrying amount that would have been deter-mined, net of depreciation, had no impairment loss been recognized for the asset in prior years.
K. ProvisionsProvisions are recognized when the Group has a present legal or constructive obligation as a result of a past event, it is probable that an outflow of resources embodying eco-nomic benefits will be required to settle the obligation, and a reliable estimate can be made of the amount of the obliga-tion. Provisions are recognized as the best estimate of the expenditure required to settle the present obligation (future cash flows), taking into account the risks and uncertainties surrounding the obligation at each reporting date. If the time value of money is material, provisions are mea-sured as the estimated future cash flows discounted to the present value using a pre-tax rate that reflects, when appro-priate, the time value of money and the risks specific to the
liability. When discounting is used, the increase due to the passage of time is recognized as a finance cost. Provision is described below:
Asset retirement obligationsThe obligations to restore property to its original state under real estate leasing agreements for offices, such as corporate headquarters and stores, are estimated and recorded as a provision. The expected length of use is estimated as the time from acquisition to the end of the useful life, and dis-count rates ranging between 0.00-1.00% are generally used in calculations.
L. Employee benefits(1) Defined contribution systemWe have adopted a defined contribution pension plan for employees of the Company and certain subsidiaries. The defined contribution pension plan is a post-retire-ment benefit plan in which the employer contributes a certain amount of contributions to other independent companies and is not subject to legal or presumptive obligation on pay-ment beyond those contributions. Contributions to the defined contribution pension plan are charged to expense during the period in which employ-ees provide services.
(2) Short-term employee benefitsFor short-term employee benefits, no discount calculation is made and expenses are recorded when employees provide related services. For bonuses and paid leave expenses, we have legal or presumptive obligations to pay them and recognize as liabili-ties the amount estimated to be paid based on those plans if reliable estimates are possible.
(3) Share-based paymentsThe Group grants share-based payments in the form of share subscription rights (stock options) to employees of the Company and its subsidiaries. In doing so, the Group aims to heighten morale and motivate employees to improve the Group’s business performance, thereby increasing share-holder value by reinforcing business development that is focused on the interests of the shareholders. These share-based payments do this by rewarding contributions to the Group’s profit and by connecting the benefits received by these individuals to the Company’s stock price. Stock options are measured at fair value based on the price of the Company’s shares on the grant date. Fair value of stock options is further disclosed in “29. Share-based Payments.” The fair value of the stock options determined at the
14
grant date is expensed, together with a corresponding increase in capital surplus in equity, over the vesting period on a straight-line basis, taking into consideration the Group’s best estimates of the number of stock options that will ulti-mately vest.
M. Revenue recognitionThe Group recognizes revenue in accordance with IFRS 15 Revenue from Contracts with Customers by applying the fol-lowing five-step approach:Step 1: Identify the contract(s) with a customerStep 2: Identify the performance obligations in the contractStep 3: Determine the transaction priceStep 4: Allocate the transaction price to the performance
obligations in the contractStep 5: Recognize revenue when (or as) the entity satisfies a
performance obligation
The Group, as a global clothing retailer, recognizes revenue when it satisfies its performance obligation by transferring the promised goods to the customer. An asset is transferred when the customer obtains control of that asset. In addition, the Group recognizes revenue at the amount of the promised consideration that the customer would pay in accordance with a contract, less the sum of discounts, rebates and refunds or credits.
N. Income taxesIncome taxes comprise current and deferred taxes and these are recognized in profit or loss, except taxes arising from items that are recognized as other comprehensive income. Current taxes are measured at the amount expected to be paid to (or recovered from) taxation authorities on taxable income or loss for the current year, using the rates that have been enacted or substantively enacted by each reporting date in the countries where the Group operates and gener-ates taxable income, with adjustments to tax payments in past periods. Through the use of an asset and liability approach, deferred tax assets and liabilities are recorded for the tempo-rary differences between the carrying amounts of assets and liabilities for accounting purposes and the amounts of assets and liabilities for tax purposes. Deferred tax assets and liabili-ties are not recognized for temporary differences under any of the following circumstances:• Temporary differences arising from goodwill;• Temporary differences arising from the initial recognition of
an asset / liability which, at the time of the transaction, does not affect either the accounting profit or the taxable income (other than in a business combination); or
• Temporary differences associated with investments in sub-sidiaries, but only to the extent that it is possible to control the timing of the reversal of the differences and it is proba-ble that the reversal will not occur in the foreseeable future.
The consolidated taxation system is applied for the Company and 100% owned subsidiaries in Japan. Deferred tax assets and liabilities are measured at the tax rates that are expected to apply in the year when the tempo-rary difference is realized or settled, based on tax laws that have been enacted or substantively enacted by each report-ing date. Deferred tax assets and liabilities are offset when there is a legally enforceable right to offset current tax assets and liabilities and when income taxes are levied by the same taxation authority on either the same taxable entity or on dif-ferent taxable entities which intend either to settle current tax assets and liabilities on a net basis, or to realize the assets and settle the liabilities simultaneously. Deferred tax assets are recognized for unused tax losses, tax credits, and deductible temporary differences to the extent that it is probable that future taxable profits will be available against which they can be utilized. Deferred tax assets are reviewed at each reporting date and reduced to the extent that it is no longer probable that the related tax benefits will be realized.
O. Earnings per shareBasic earnings per share is calculated by dividing profit or loss attributable to common shareholders of the Parent by the weighted-average number of common stocks outstand-ing during the period, adjusted for treasury stock. Diluted earnings per share is calculated by adjusting for all dilutive potential ordinary shares having a dilutive effect.
15
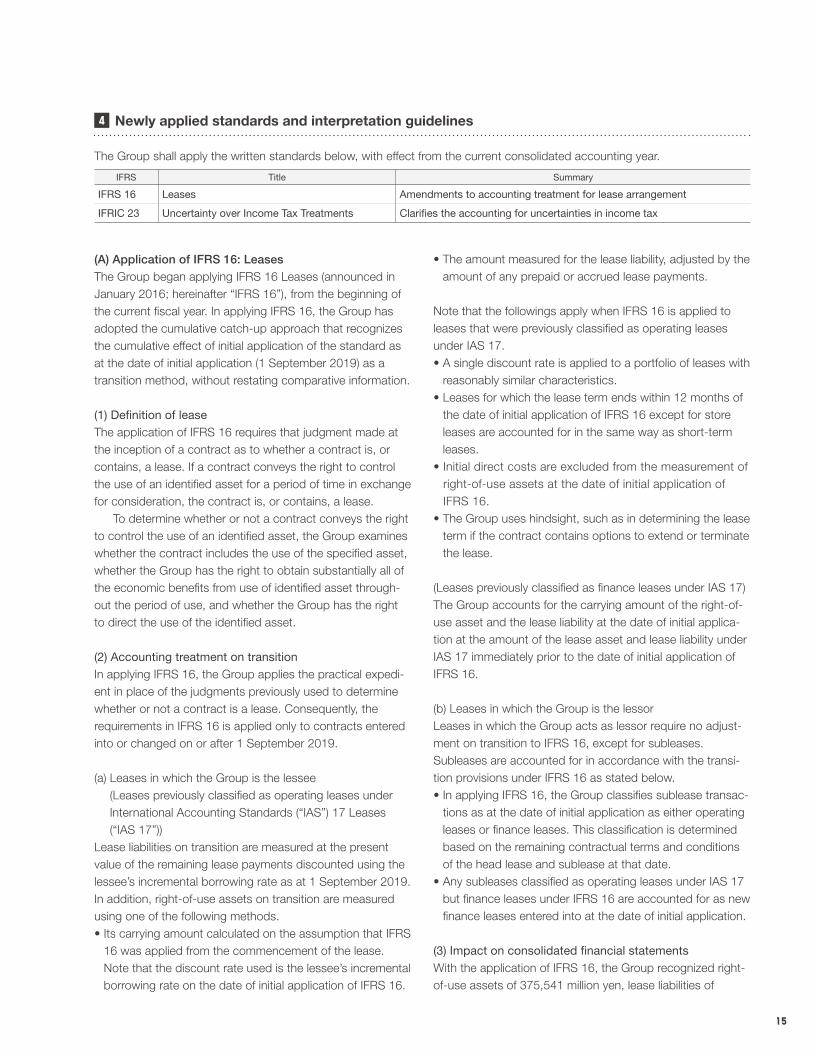
4 Newly applied standards and interpretation guidelines
The Group shall apply the written standards below, with effect from the current consolidated accounting year.
IFRS Title Summary
IFRS 16 Leases Amendments to accounting treatment for lease arrangement
IFRIC 23 Uncertainty over Income Tax Treatments Clarifies the accounting for uncertainties in income tax
(A) Application of IFRS 16: LeasesThe Group began applying IFRS 16 Leases (announced in January 2016; hereinafter “IFRS 16”), from the beginning of the current fiscal year. In applying IFRS 16, the Group has adopted the cumulative catch-up approach that recognizes the cumulative effect of initial application of the standard as at the date of initial application (1 September 2019) as a transition method, without restating comparative information.
(1) Definition of leaseThe application of IFRS 16 requires that judgment made at the inception of a contract as to whether a contract is, or contains, a lease. If a contract conveys the right to control the use of an identified asset for a period of time in exchange for consideration, the contract is, or contains, a lease. To determine whether or not a contract conveys the right to control the use of an identified asset, the Group examines whether the contract includes the use of the specified asset, whether the Group has the right to obtain substantially all of the economic benefits from use of identified asset through-out the period of use, and whether the Group has the right to direct the use of the identified asset.
(2) Accounting treatment on transitionIn applying IFRS 16, the Group applies the practical expedi-ent in place of the judgments previously used to determine whether or not a contract is a lease. Consequently, the requirements in IFRS 16 is applied only to contracts entered into or changed on or after 1 September 2019.
(a) Leases in which the Group is the lessee (Leases previously classified as operating leases under International Accounting Standards (“IAS”) 17 Leases (“IAS 17”))
Lease liabilities on transition are measured at the present value of the remaining lease payments discounted using the lessee’s incremental borrowing rate as at 1 September 2019. In addition, right-of-use assets on transition are measured using one of the following methods.• Its carrying amount calculated on the assumption that IFRS
16 was applied from the commencement of the lease. Note that the discount rate used is the lessee’s incremental borrowing rate on the date of initial application of IFRS 16.
• The amount measured for the lease liability, adjusted by the amount of any prepaid or accrued lease payments.
Note that the followings apply when IFRS 16 is applied to leases that were previously classified as operating leases under IAS 17.• A single discount rate is applied to a portfolio of leases with
reasonably similar characteristics.• Leases for which the lease term ends within 12 months of
the date of initial application of IFRS 16 except for store leases are accounted for in the same way as short-term leases.
• Initial direct costs are excluded from the measurement of right-of-use assets at the date of initial application of IFRS 16.
• The Group uses hindsight, such as in determining the lease term if the contract contains options to extend or terminate the lease.
(Leases previously classified as finance leases under IAS 17)The Group accounts for the carrying amount of the right-of-use asset and the lease liability at the date of initial applica-tion at the amount of the lease asset and lease liability under IAS 17 immediately prior to the date of initial application of IFRS 16.
(b) Leases in which the Group is the lessorLeases in which the Group acts as lessor require no adjust-ment on transition to IFRS 16, except for subleases. Subleases are accounted for in accordance with the transi-tion provisions under IFRS 16 as stated below.• In applying IFRS 16, the Group classifies sublease transac-
tions as at the date of initial application as either operating leases or finance leases. This classification is determined based on the remaining contractual terms and conditions of the head lease and sublease at that date.
• Any subleases classified as operating leases under IAS 17 but finance leases under IFRS 16 are accounted for as new finance leases entered into at the date of initial application.
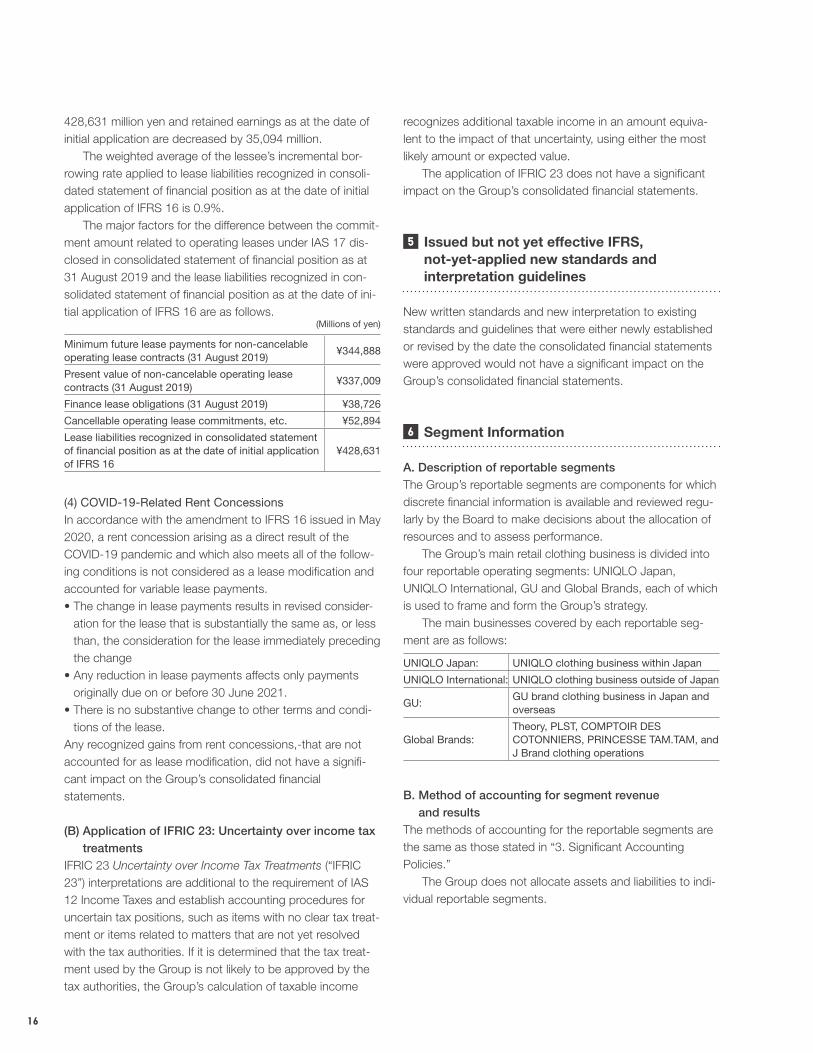
(3) Impact on consolidated financial statementsWith the application of IFRS 16, the Group recognized right-of-use assets of 375,541 million yen, lease liabilities of
16
428,631 million yen and retained earnings as at the date of initial application are decreased by 35,094 million. The weighted average of the lessee’s incremental bor-rowing rate applied to lease liabilities recognized in consoli-dated statement of financial position as at the date of initial application of IFRS 16 is 0.9%. The major factors for the difference between the commit-ment amount related to operating leases under IAS 17 dis-closed in consolidated statement of financial position as at 31 August 2019 and the lease liabilities recognized in con-solidated statement of financial position as at the date of ini-tial application of IFRS 16 are as follows.
(Millions of yen)
Minimum future lease payments for non-cancelable operating lease contracts (31 August 2019)
¥344,888
Present value of non-cancelable operating lease contracts (31 August 2019)
¥337,009
Finance lease obligations (31 August 2019) ¥38,726
Cancellable operating lease commitments, etc. ¥52,894
Lease liabilities recognized in consolidated statement of financial position as at the date of initial application of IFRS 16
¥428,631
(4) COVID-19-Related Rent ConcessionsIn accordance with the amendment to IFRS 16 issued in May 2020, a rent concession arising as a direct result of the COVID-19 pandemic and which also meets all of the follow-ing conditions is not considered as a lease modification and accounted for variable lease payments.• The change in lease payments results in revised consider-
ation for the lease that is substantially the same as, or less than, the consideration for the lease immediately preceding the change
• Any reduction in lease payments affects only payments originally due on or before 30 June 2021.
• There is no substantive change to other terms and condi-tions of the lease.
Any recognized gains from rent concessions,-that are not accounted for as lease modification, did not have a signifi-cant impact on the Group’s consolidated financial statements.
(B) Application of IFRIC 23: Uncertainty over income tax treatments
IFRIC 23 Uncertainty over Income Tax Treatments (“IFRIC 23”) interpretations are additional to the requirement of IAS 12 Income Taxes and establish accounting procedures for uncertain tax positions, such as items with no clear tax treat-ment or items related to matters that are not yet resolved with the tax authorities. If it is determined that the tax treat-ment used by the Group is not likely to be approved by the tax authorities, the Group’s calculation of taxable income
recognizes additional taxable income in an amount equiva-lent to the impact of that uncertainty, using either the most likely amount or expected value. The application of IFRIC 23 does not have a significant impact on the Group’s consolidated financial statements.
5 Issued but not yet effective IFRS, not-yet-applied new standards and interpretation guidelines
New written standards and new interpretation to existing standards and guidelines that were either newly established or revised by the date the consolidated financial statements were approved would not have a significant impact on the Group’s consolidated financial statements.
6 Segment Information
A. Description of reportable segmentsThe Group’s reportable segments are components for which discrete financial information is available and reviewed regu-larly by the Board to make decisions about the allocation of resources and to assess performance. The Group’s main retail clothing business is divided into four reportable operating segments: UNIQLO Japan, UNIQLO International, GU and Global Brands, each of which is used to frame and form the Group’s strategy. The main businesses covered by each reportable seg-ment are as follows:
UNIQLO Japan: UNIQLO clothing business within Japan
UNIQLO International: UNIQLO clothing business outside of Japan
GU:GU brand clothing business in Japan and overseas
Global Brands:Theory, PLST, COMPTOIR DES COTONNIERS, PRINCESSE TAM.TAM, and J Brand clothing operations
B. Method of accounting for segment revenue and results
The methods of accounting for the reportable segments are the same as those stated in “3. Significant Accounting Policies.” The Group does not allocate assets and liabilities to indi-vidual reportable segments.
17
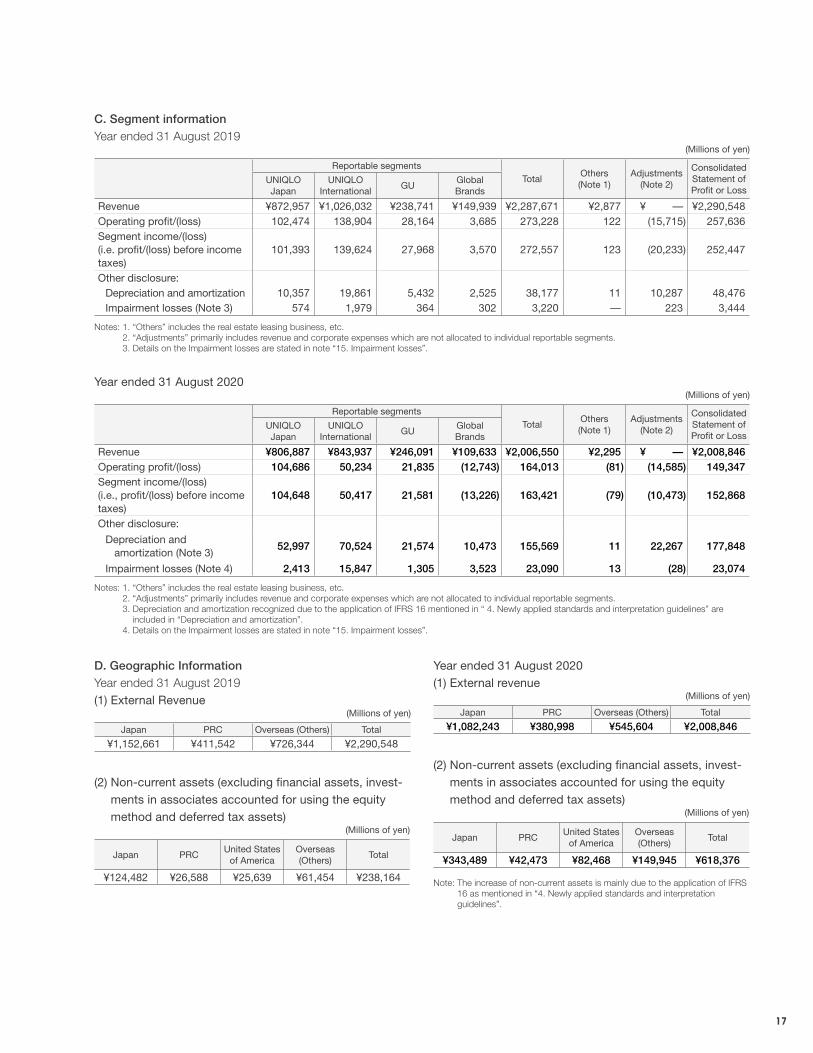
C. Segment informationYear ended 31 August 2019
(Millions of yen)
Reportable segmentsTotal
Others(Note 1)
Adjustments(Note 2)
Consolidated Statement of Profit or Loss
UNIQLOJapan
UNIQLOInternational
GUGlobalBrands
Revenue ¥872,957 ¥1,026,032 ¥238,741 ¥149,939 ¥2,287,671 ¥2,877 ¥ — ¥2,290,548Operating profit/(loss) 102,474 138,904 28,164 3,685 273,228 122 (15,715) 257,636Segment income/(loss) (i.e. profit/(loss) before income taxes)
101,393 139,624 27,968 3,570 272,557 123 (20,233) 252,447
Other disclosure:Depreciation and amortization 10,357 19,861 5,432 2,525 38,177 11 10,287 48,476Impairment losses (Note 3) 574 1,979 364 302 3,220 — 223 3,444
Notes: 1. “Others” includes the real estate leasing business, etc. 2. “Adjustments” primarily includes revenue and corporate expenses which are not allocated to individual reportable segments. 3. Details on the Impairment losses are stated in note “15. Impairment losses”.
Year ended 31 August 2020(Millions of yen)
Reportable segmentsTotal
Others(Note 1)
Adjustments(Note 2)
Consolidated Statement of Profit or Loss
UNIQLOJapan
UNIQLOInternational
GUGlobalBrands
Revenue ¥806,887 ¥843,937 ¥246,091 ¥109,633 ¥2,006,550 ¥2,295 ¥ — ¥2,008,846 Operating profit/(loss) 104,686 50,234 21,835 (12,743) 164,013 (81) (14,585) 149,347 Segment income/(loss) (i.e., profit/(loss) before income taxes)
104,648 50,417 21,581 (13,226) 163,421 (79) (10,473) 152,868
Other disclosure:
Depreciation and amortization (Note 3)
52,997 70,524 21,574 10,473 155,569 11 22,267 177,848
Impairment losses (Note 4) 2,413 15,847 1,305 3,523 23,090 13 (28) 23,074
Notes: 1. “Others” includes the real estate leasing business, etc. 2. “Adjustments” primarily includes revenue and corporate expenses which are not allocated to individual reportable segments. 3. Depreciation and amortization recognized due to the application of IFRS 16 mentioned in “ 4. Newly applied standards and interpretation guidelines” are
included in “Depreciation and amortization”. 4. Details on the Impairment losses are stated in note “15. Impairment losses”.
D. Geographic InformationYear ended 31 August 2019(1) External Revenue
(Millions of yen)
Japan PRC Overseas (Others) Total
¥1,152,661 ¥411,542 ¥726,344 ¥2,290,548
(2) Non-current assets (excluding financial assets, invest-ments in associates accounted for using the equity method and deferred tax assets)
(Millions of yen)
Japan PRCUnited States
of AmericaOverseas (Others)
Total
¥124,482 ¥26,588 ¥25,639 ¥61,454 ¥238,164
Year ended 31 August 2020(1) External revenue
(Millions of yen)
Japan PRC Overseas (Others) Total
¥1,082,243 ¥380,998 ¥545,604 ¥2,008,846
(2) Non-current assets (excluding financial assets, invest-ments in associates accounted for using the equity method and deferred tax assets)
(Millions of yen)
Japan PRCUnited States
of AmericaOverseas (Others)
Total
¥343,489 ¥42,473 ¥82,468 ¥149,945 ¥618,376
Note: The increase of non-current assets is mainly due to the application of IFRS 16 as mentioned in “4. Newly applied standards and interpretation guidelines”.
18
7 Business Combination
Not applicable.
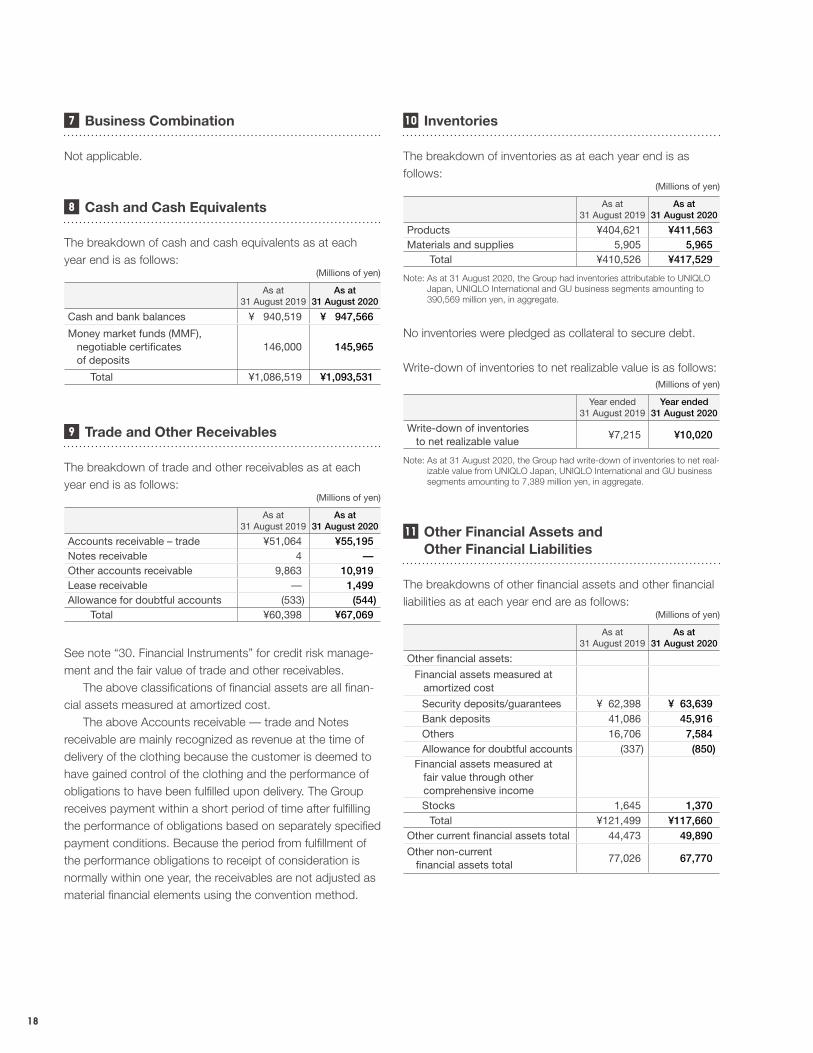
8 Cash and Cash Equivalents
The breakdown of cash and cash equivalents as at each year end is as follows:
(Millions of yen)
As at31 August 2019
As at31 August 2020
Cash and bank balances ¥ 940,519 ¥ 947,566
Money market funds (MMF), negotiable certificates of deposits
146,000 145,965
Total ¥1,086,519 ¥1,093,531
9 Trade and Other Receivables
The breakdown of trade and other receivables as at each year end is as follows:
(Millions of yen)
As at31 August 2019
As at31 August 2020
Accounts receivable – trade ¥51,064 ¥55,195 Notes receivable 4 —Other accounts receivable 9,863 10,919 Lease receivable — 1,499 Allowance for doubtful accounts (533) (544)
Total ¥60,398 ¥67,069
See note “30. Financial Instruments” for credit risk manage-ment and the fair value of trade and other receivables. The above classifications of financial assets are all finan-cial assets measured at amortized cost. The above Accounts receivable — trade and Notes receivable are mainly recognized as revenue at the time of delivery of the clothing because the customer is deemed to have gained control of the clothing and the performance of obligations to have been fulfilled upon delivery. The Group receives payment within a short period of time after fulfilling the performance of obligations based on separately specified payment conditions. Because the period from fulfillment of the performance obligations to receipt of consideration is normally within one year, the receivables are not adjusted as material financial elements using the convention method.
10 Inventories
The breakdown of inventories as at each year end is as follows:
(Millions of yen)
As at31 August 2019
As at31 August 2020
Products ¥404,621 ¥411,563Materials and supplies 5,905 5,965
Total ¥410,526 ¥417,529
Note: As at 31 August 2020, the Group had inventories attributable to UNIQLO Japan, UNIQLO International and GU business segments amounting to 390,569 million yen, in aggregate.
No inventories were pledged as collateral to secure debt.
Write-down of inventories to net realizable value is as follows:(Millions of yen)
Year ended31 August 2019
Year ended31 August 2020
Write-down of inventories to net realizable value
¥7,215 ¥10,020
Note: As at 31 August 2020, the Group had write-down of inventories to net real-izable value from UNIQLO Japan, UNIQLO International and GU business segments amounting to 7,389 million yen, in aggregate.
11 Other Financial Assets and Other Financial Liabilities
The breakdowns of other financial assets and other financial liabilities as at each year end are as follows:
(Millions of yen)
As at31 August 2019
As at31 August 2020
Other financial assets:
Financial assets measured at amortized cost
Security deposits/guarantees ¥ 62,398 ¥ 63,639 Bank deposits 41,086 45,916 Others 16,706 7,584 Allowance for doubtful accounts (337) (850)
Financial assets measured at fair value through other comprehensive income
Stocks 1,645 1,370 Total ¥121,499 ¥117,660
Other current financial assets total 44,473 49,890
Other non-current financial assets total
77,026 67,770
19
(Millions of yen)
As at31 August 2019
As at31 August 2020
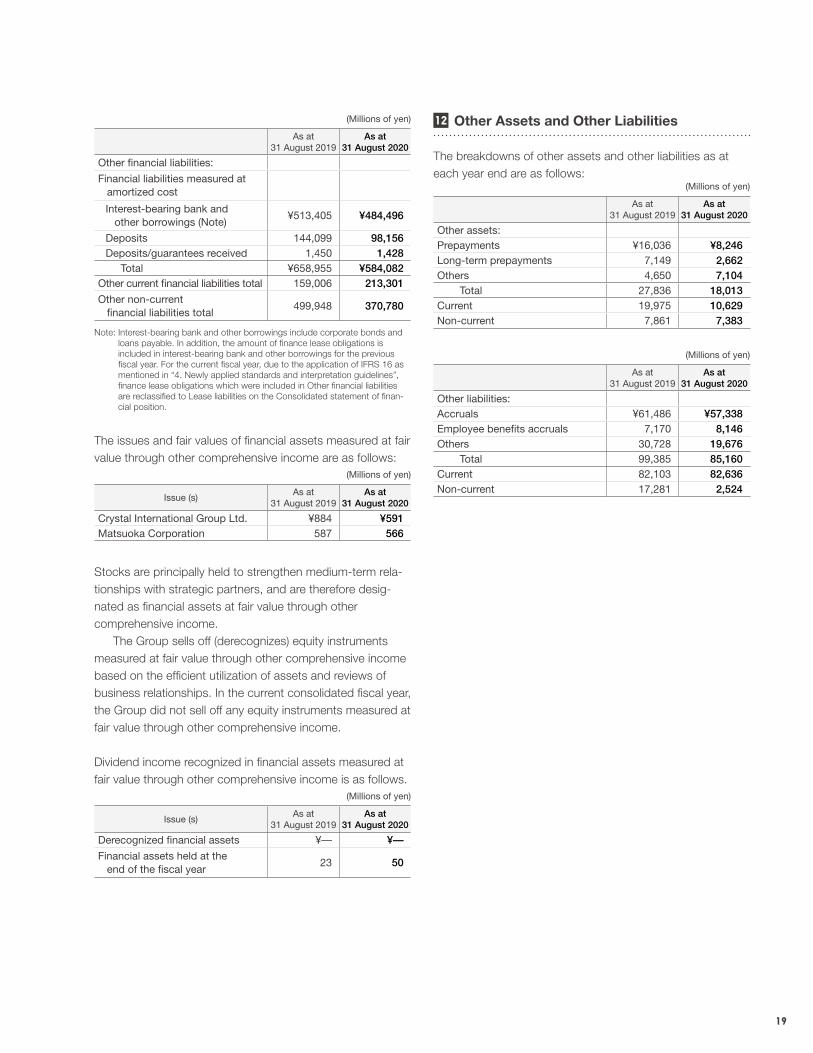
Other financial liabilities:
Financial liabilities measured at amortized cost
Interest-bearing bank and other borrowings (Note)
¥513,405 ¥484,496
Deposits 144,099 98,156Deposits/guarantees received 1,450 1,428
Total ¥658,955 ¥584,082Other current financial liabilities total 159,006 213,301
Other non-current financial liabilities total
499,948 370,780
Note: Interest-bearing bank and other borrowings include corporate bonds and loans payable. In addition, the amount of finance lease obligations is included in interest-bearing bank and other borrowings for the previous fiscal year. For the current fiscal year, due to the application of IFRS 16 as mentioned in “4. Newly applied standards and interpretation guidelines”, finance lease obligations which were included in Other financial liabilities are reclassified to Lease liabilities on the Consolidated statement of finan-cial position.
The issues and fair values of financial assets measured at fair value through other comprehensive income are as follows:
(Millions of yen)
Issue (s)As at
31 August 2019As at
31 August 2020
Crystal International Group Ltd. ¥884 ¥591Matsuoka Corporation 587 566
Stocks are principally held to strengthen medium-term rela-tionships with strategic partners, and are therefore desig-nated as financial assets at fair value through other comprehensive income. The Group sells off (derecognizes) equity instruments measured at fair value through other comprehensive income based on the efficient utilization of assets and reviews of business relationships. In the current consolidated fiscal year, the Group did not sell off any equity instruments measured at fair value through other comprehensive income.
Dividend income recognized in financial assets measured at fair value through other comprehensive income is as follows.
(Millions of yen)
Issue (s)As at
31 August 2019As at
31 August 2020
Derecognized financial assets ¥— ¥—
Financial assets held at the end of the fiscal year
23 50
12 Other Assets and Other Liabilities
The breakdowns of other assets and other liabilities as at each year end are as follows:
(Millions of yen)
As at31 August 2019
As at31 August 2020
Other assets:Prepayments ¥16,036 ¥8,246Long-term prepayments 7,149 2,662Others 4,650 7,104
Total 27,836 18,013Current 19,975 10,629Non-current 7,861 7,383
(Millions of yen)
As at31 August 2019
As at31 August 2020
Other liabilities:Accruals ¥61,486 ¥57,338Employee benefits accruals 7,170 8,146Others 30,728 19,676
Total 99,385 85,160Current 82,103 82,636Non-current 17,281 2,524
20
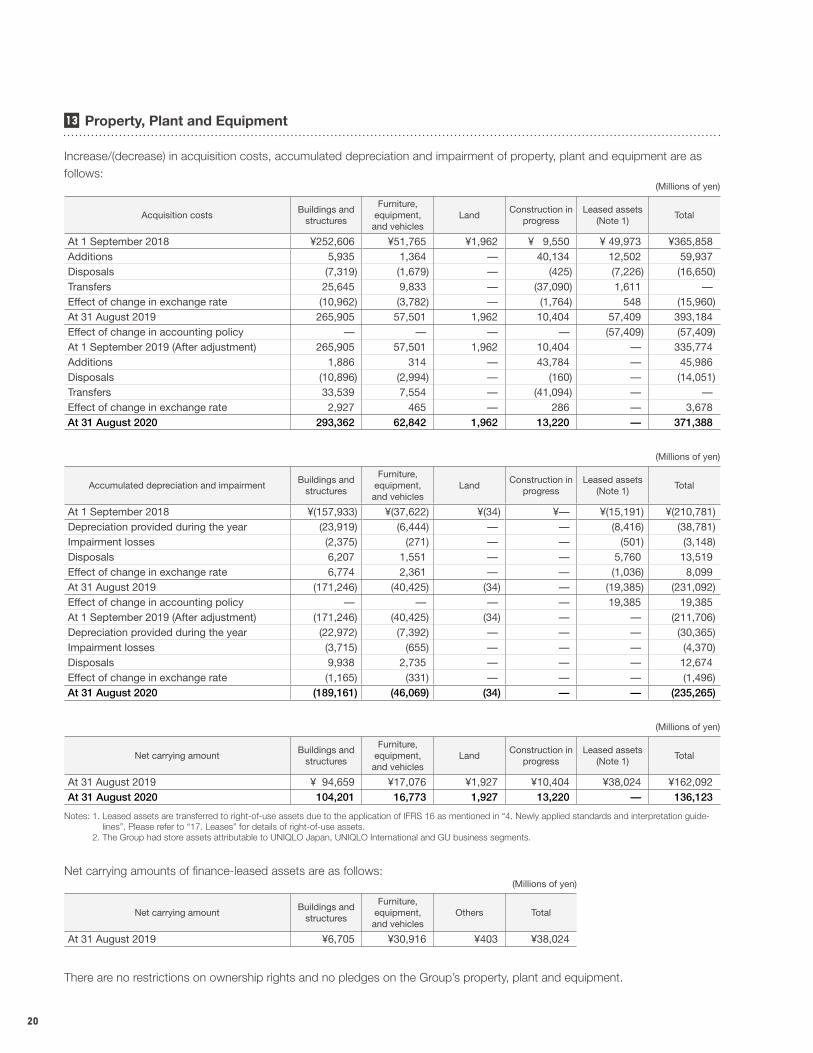
13 Property, Plant and Equipment
Increase/(decrease) in acquisition costs, accumulated depreciation and impairment of property, plant and equipment are as follows:
(Millions of yen)
Acquisition costsBuildings and
structures
Furniture, equipment, and vehicles
LandConstruction in
progressLeased assets
(Note 1)Total
At 1 September 2018 ¥252,606 ¥51,765 ¥1,962 ¥ 9,550 ¥ 49,973 ¥365,858 Additions 5,935 1,364 — 40,134 12,502 59,937 Disposals (7,319) (1,679) — (425) (7,226) (16,650)Transfers 25,645 9,833 — (37,090) 1,611 —Effect of change in exchange rate (10,962) (3,782) — (1,764) 548 (15,960)At 31 August 2019 265,905 57,501 1,962 10,404 57,409 393,184 Effect of change in accounting policy — — — — (57,409) (57,409)At 1 September 2019 (After adjustment) 265,905 57,501 1,962 10,404 — 335,774 Additions 1,886 314 — 43,784 — 45,986 Disposals (10,896) (2,994) — (160) — (14,051)Transfers 33,539 7,554 — (41,094) — —Effect of change in exchange rate 2,927 465 — 286 — 3,678 At 31 August 2020 293,362 62,842 1,962 13,220 — 371,388
(Millions of yen)
Accumulated depreciation and impairmentBuildings and
structures
Furniture, equipment, and vehicles
LandConstruction in
progressLeased assets
(Note 1)Total
At 1 September 2018 ¥(157,933) ¥(37,622) ¥(34) ¥— ¥(15,191) ¥(210,781)Depreciation provided during the year (23,919) (6,444) — — (8,416) (38,781)Impairment losses (2,375) (271) — — (501) (3,148)Disposals 6,207 1,551 — — 5,760 13,519 Effect of change in exchange rate 6,774 2,361 — — (1,036) 8,099 At 31 August 2019 (171,246) (40,425) (34) — (19,385) (231,092)Effect of change in accounting policy — — — — 19,385 19,385 At 1 September 2019 (After adjustment) (171,246) (40,425) (34) — — (211,706)Depreciation provided during the year (22,972) (7,392) — — — (30,365)Impairment losses (3,715) (655) — — — (4,370)Disposals 9,938 2,735 — — — 12,674 Effect of change in exchange rate (1,165) (331) — — — (1,496)At 31 August 2020 (189,161) (46,069) (34) — — (235,265)
(Millions of yen)
Net carrying amountBuildings and
structures
Furniture, equipment, and vehicles
LandConstruction in
progressLeased assets
(Note 1)Total
At 31 August 2019 ¥ 94,659 ¥17,076 ¥1,927 ¥10,404 ¥38,024 ¥162,092At 31 August 2020 104,201 16,773 1,927 13,220 — 136,123
Notes: 1. Leased assets are transferred to right-of-use assets due to the application of IFRS 16 as mentioned in “4. Newly applied standards and interpretation guide-lines”. Please refer to “17. Leases” for details of right-of-use assets.
2. The Group had store assets attributable to UNIQLO Japan, UNIQLO International and GU business segments.
Net carrying amounts of finance-leased assets are as follows:(Millions of yen)
Net carrying amountBuildings and
structures
Furniture, equipment, and vehicles
Others Total
At 31 August 2019 ¥6,705 ¥30,916 ¥403 ¥38,024
There are no restrictions on ownership rights and no pledges on the Group’s property, plant and equipment.
21
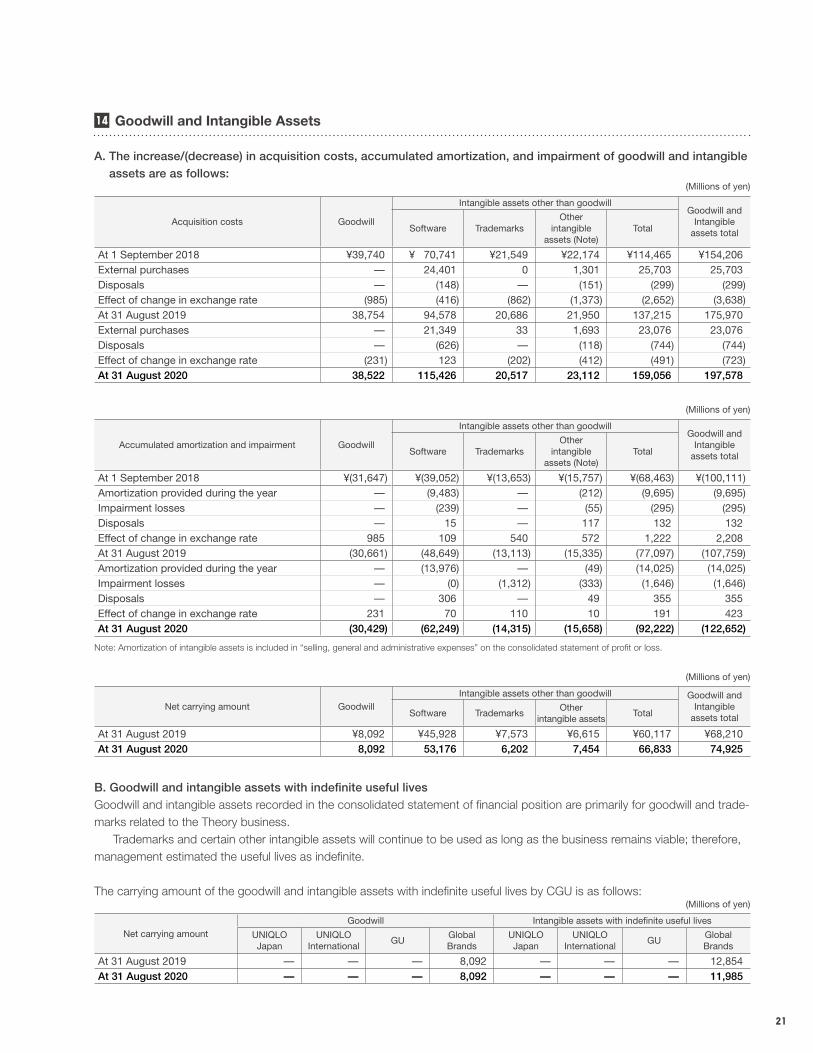
14 Goodwill and Intangible Assets
A. The increase/(decrease) in acquisition costs, accumulated amortization, and impairment of goodwill and intangible assets are as follows:
(Millions of yen)
Acquisition costs Goodwill
Intangible assets other than goodwillGoodwill and
Intangibleassets totalSoftware Trademarks
Otherintangible
assets (Note)Total
At 1 September 2018 ¥39,740 ¥ 70,741 ¥21,549 ¥22,174 ¥114,465 ¥154,206 External purchases — 24,401 0 1,301 25,703 25,703 Disposals — (148) — (151) (299) (299)Effect of change in exchange rate (985) (416) (862) (1,373) (2,652) (3,638)At 31 August 2019 38,754 94,578 20,686 21,950 137,215 175,970 External purchases — 21,349 33 1,693 23,076 23,076 Disposals — (626) — (118) (744) (744)Effect of change in exchange rate (231) 123 (202) (412) (491) (723)At 31 August 2020 38,522 115,426 20,517 23,112 159,056 197,578
(Millions of yen)
Accumulated amortization and impairment Goodwill
Intangible assets other than goodwillGoodwill and
Intangibleassets totalSoftware Trademarks
Otherintangible
assets (Note)Total
At 1 September 2018 ¥(31,647) ¥(39,052) ¥(13,653) ¥(15,757) ¥(68,463) ¥(100,111)Amortization provided during the year — (9,483) — (212) (9,695) (9,695)Impairment losses — (239) — (55) (295) (295)Disposals — 15 — 117 132 132 Effect of change in exchange rate 985 109 540 572 1,222 2,208 At 31 August 2019 (30,661) (48,649) (13,113) (15,335) (77,097) (107,759)Amortization provided during the year — (13,976) — (49) (14,025) (14,025)Impairment losses — (0) (1,312) (333) (1,646) (1,646)Disposals — 306 — 49 355 355 Effect of change in exchange rate 231 70 110 10 191 423 At 31 August 2020 (30,429) (62,249) (14,315) (15,658) (92,222) (122,652)
Note: Amortization of intangible assets is included in “selling, general and administrative expenses” on the consolidated statement of profit or loss.
(Millions of yen)
Net carrying amount GoodwillIntangible assets other than goodwill Goodwill and
Intangibleassets totalSoftware Trademarks
Otherintangible assets
Total
At 31 August 2019 ¥8,092 ¥45,928 ¥7,573 ¥6,615 ¥60,117 ¥68,210At 31 August 2020 8,092 53,176 6,202 7,454 66,833 74,925
B. Goodwill and intangible assets with indefinite useful livesGoodwill and intangible assets recorded in the consolidated statement of financial position are primarily for goodwill and trade-marks related to the Theory business. Trademarks and certain other intangible assets will continue to be used as long as the business remains viable; therefore, management estimated the useful lives as indefinite.
The carrying amount of the goodwill and intangible assets with indefinite useful lives by CGU is as follows:(Millions of yen)
Net carrying amountGoodwill Intangible assets with indefinite useful lives
UNIQLOJapan
UNIQLOInternational
GUGlobalBrands
UNIQLOJapan
UNIQLOInternational
GUGlobalBrands
At 31 August 2019 — — — 8,092 — — — 12,854At 31 August 2020 — — — 8,092 — — — 11,985
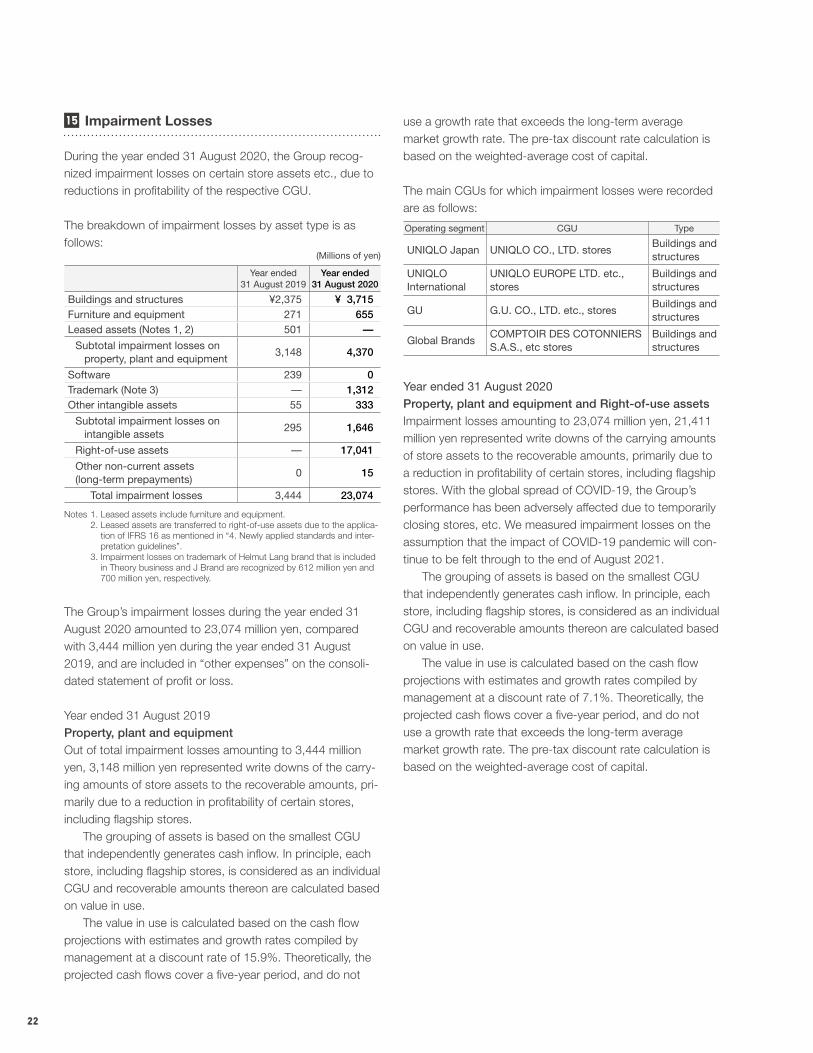
22
15 Impairment Losses
During the year ended 31 August 2020, the Group recog-nized impairment losses on certain store assets etc., due to reductions in profitability of the respective CGU.
The breakdown of impairment losses by asset type is as follows:
(Millions of yen)
Year ended31 August 2019
Year ended31 August 2020
Buildings and structures ¥2,375 ¥ 3,715Furniture and equipment 271 655Leased assets (Notes 1, 2) 501 —
Subtotal impairment losses on property, plant and equipment
3,148 4,370
Software 239 0Trademark (Note 3) — 1,312Other intangible assets 55 333
Subtotal impairment losses on intangible assets
295 1,646
Right-of-use assets — 17,041
Other non-current assets (long-term prepayments)
0 15
Total impairment losses 3,444 23,074
Notes 1. Leased assets include furniture and equipment. 2. Leased assets are transferred to right-of-use assets due to the applica-
tion of IFRS 16 as mentioned in “4. Newly applied standards and inter-pretation guidelines”.
3. Impairment losses on trademark of Helmut Lang brand that is included in Theory business and J Brand are recognized by 612 million yen and 700 million yen, respectively.
The Group’s impairment losses during the year ended 31 August 2020 amounted to 23,074 million yen, compared with 3,444 million yen during the year ended 31 August 2019, and are included in “other expenses” on the consoli-dated statement of profit or loss.
Year ended 31 August 2019Property, plant and equipmentOut of total impairment losses amounting to 3,444 million yen, 3,148 million yen represented write downs of the carry-ing amounts of store assets to the recoverable amounts, pri-marily due to a reduction in profitability of certain stores, including flagship stores. The grouping of assets is based on the smallest CGU that independently generates cash inflow. In principle, each store, including flagship stores, is considered as an individual CGU and recoverable amounts thereon are calculated based on value in use. The value in use is calculated based on the cash flow projections with estimates and growth rates compiled by management at a discount rate of 15.9%. Theoretically, the projected cash flows cover a five-year period, and do not
use a growth rate that exceeds the long-term average market growth rate. The pre-tax discount rate calculation is based on the weighted-average cost of capital.
The main CGUs for which impairment losses were recorded are as follows:
Operating segment CGU Type
UNIQLO Japan UNIQLO CO., LTD. storesBuildings and structures
UNIQLO International
UNIQLO EUROPE LTD. etc., stores
Buildings and structures
GU G.U. CO., LTD. etc., storesBuildings and structures
Global BrandsCOMPTOIR DES COTONNIERS S.A.S., etc stores
Buildings and structures
Year ended 31 August 2020Property, plant and equipment and Right-of-use assetsImpairment losses amounting to 23,074 million yen, 21,411 million yen represented write downs of the carrying amounts of store assets to the recoverable amounts, primarily due to a reduction in profitability of certain stores, including flagship stores. With the global spread of COVID-19, the Group’s performance has been adversely affected due to temporarily closing stores, etc. We measured impairment losses on the assumption that the impact of COVID-19 pandemic will con-tinue to be felt through to the end of August 2021. The grouping of assets is based on the smallest CGU that independently generates cash inflow. In principle, each store, including flagship stores, is considered as an individual CGU and recoverable amounts thereon are calculated based on value in use. The value in use is calculated based on the cash flow projections with estimates and growth rates compiled by management at a discount rate of 7.1%. Theoretically, the projected cash flows cover a five-year period, and do not use a growth rate that exceeds the long-term average market growth rate. The pre-tax discount rate calculation is based on the weighted-average cost of capital.
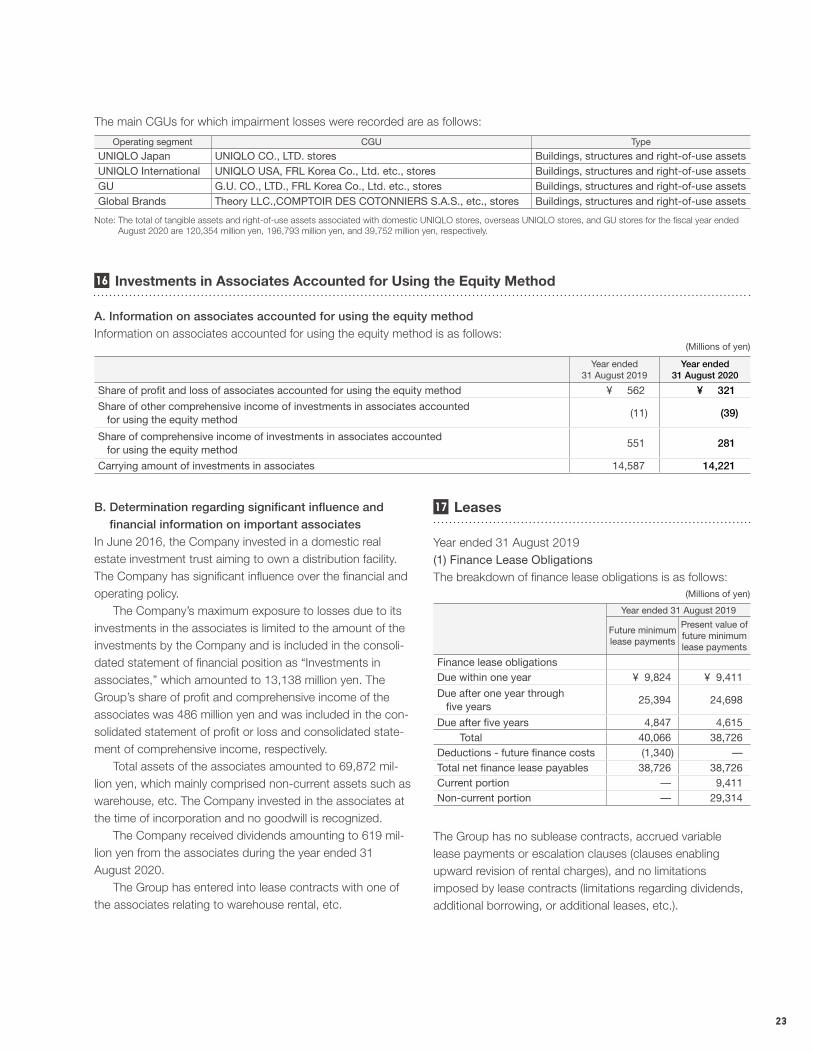
23
The main CGUs for which impairment losses were recorded are as follows:
Operating segment CGU Type
UNIQLO Japan UNIQLO CO., LTD. stores Buildings, structures and right-of-use assetsUNIQLO International UNIQLO USA, FRL Korea Co., Ltd. etc., stores Buildings, structures and right-of-use assetsGU G.U. CO., LTD., FRL Korea Co., Ltd. etc., stores Buildings, structures and right-of-use assetsGlobal Brands Theory LLC.,COMPTOIR DES COTONNIERS S.A.S., etc., stores Buildings, structures and right-of-use assets
Note: The total of tangible assets and right-of-use assets associated with domestic UNIQLO stores, overseas UNIQLO stores, and GU stores for the fiscal year ended August 2020 are 120,354 million yen, 196,793 million yen, and 39,752 million yen, respectively.
16 Investments in Associates Accounted for Using the Equity Method
A. Information on associates accounted for using the equity methodInformation on associates accounted for using the equity method is as follows:
(Millions of yen)
Year ended31 August 2019
Year ended31 August 2020
Share of profit and loss of associates accounted for using the equity method ¥ 562 ¥ 321
Share of other comprehensive income of investments in associates accounted for using the equity method
(11) (39)
Share of comprehensive income of investments in associates accounted for using the equity method
551 281
Carrying amount of investments in associates 14,587 14,221
B. Determination regarding significant influence and financial information on important associates
In June 2016, the Company invested in a domestic real estate investment trust aiming to own a distribution facility. The Company has significant influence over the financial and operating policy. The Company’s maximum exposure to losses due to its investments in the associates is limited to the amount of the investments by the Company and is included in the consoli-dated statement of financial position as “Investments in associates,” which amounted to 13,138 million yen. The Group’s share of profit and comprehensive income of the associates was 486 million yen and was included in the con-solidated statement of profit or loss and consolidated state-ment of comprehensive income, respectively. Total assets of the associates amounted to 69,872 mil-lion yen, which mainly comprised non-current assets such as warehouse, etc. The Company invested in the associates at the time of incorporation and no goodwill is recognized. The Company received dividends amounting to 619 mil-lion yen from the associates during the year ended 31 August 2020. The Group has entered into lease contracts with one of the associates relating to warehouse rental, etc.
17 Leases
Year ended 31 August 2019(1) Finance Lease ObligationsThe breakdown of finance lease obligations is as follows:
(Millions of yen)
Year ended 31 August 2019
Future minimumlease payments
Present value offuture minimum lease payments
Finance lease obligationsDue within one year ¥ 9,824 ¥ 9,411
Due after one year through five years
25,394 24,698
Due after five years 4,847 4,615 Total 40,066 38,726
Deductions - future finance costs (1,340) —Total net finance lease payables 38,726 38,726 Current portion — 9,411 Non-current portion — 29,314
The Group has no sublease contracts, accrued variable lease payments or escalation clauses (clauses enabling upward revision of rental charges), and no limitations imposed by lease contracts (limitations regarding dividends, additional borrowing, or additional leases, etc.).
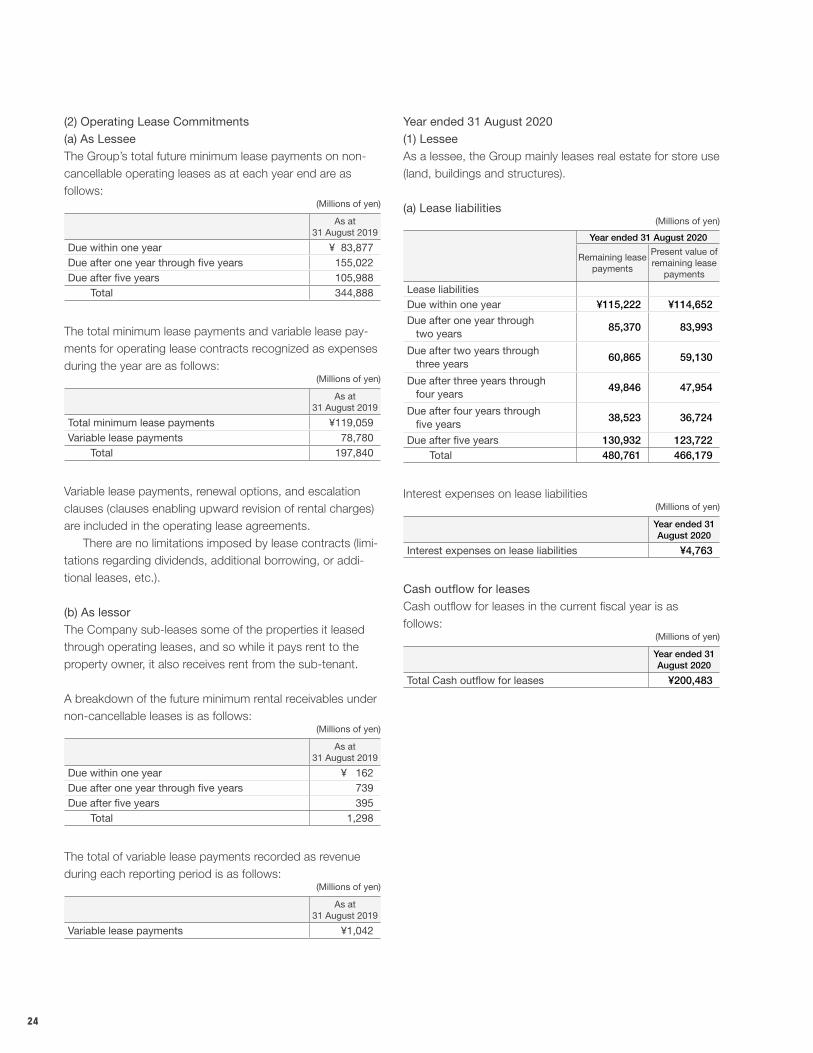
24
(2) Operating Lease Commitments(a) As LesseeThe Group’s total future minimum lease payments on non-cancellable operating leases as at each year end are as follows:
(Millions of yen)
As at31 August 2019
Due within one year ¥ 83,877Due after one year through five years 155,022Due after five years 105,988
Total 344,888
The total minimum lease payments and variable lease pay-ments for operating lease contracts recognized as expenses during the year are as follows:
(Millions of yen)
As at31 August 2019
Total minimum lease payments ¥119,059Variable lease payments 78,780
Total 197,840
Variable lease payments, renewal options, and escalation clauses (clauses enabling upward revision of rental charges) are included in the operating lease agreements. There are no limitations imposed by lease contracts (limi-tations regarding dividends, additional borrowing, or addi-tional leases, etc.).
(b) As lessorThe Company sub-leases some of the properties it leased through operating leases, and so while it pays rent to the property owner, it also receives rent from the sub-tenant.
A breakdown of the future minimum rental receivables under non-cancellable leases is as follows:
(Millions of yen)
As at31 August 2019
Due within one year ¥ 162Due after one year through five years 739Due after five years 395
Total 1,298
The total of variable lease payments recorded as revenue during each reporting period is as follows:
(Millions of yen)
As at31 August 2019
Variable lease payments ¥1,042
Year ended 31 August 2020(1) LesseeAs a lessee, the Group mainly leases real estate for store use (land, buildings and structures).
(a) Lease liabilities(Millions of yen)
Year ended 31 August 2020
Remaining lease payments
Present value of remaining lease
payments
Lease liabilitiesDue within one year ¥115,222 ¥114,652
Due after one year through two years
85,370 83,993
Due after two years through three years
60,865 59,130
Due after three years through four years
49,846 47,954
Due after four years through five years
38,523 36,724
Due after five years 130,932 123,722Total 480,761 466,179
Interest expenses on lease liabilities(Millions of yen)
Year ended 31 August 2020
Interest expenses on lease liabilities ¥4,763
Cash outflow for leasesCash outflow for leases in the current fiscal year is as follows:
(Millions of yen)
Year ended 31 August 2020
Total Cash outflow for leases ¥200,483
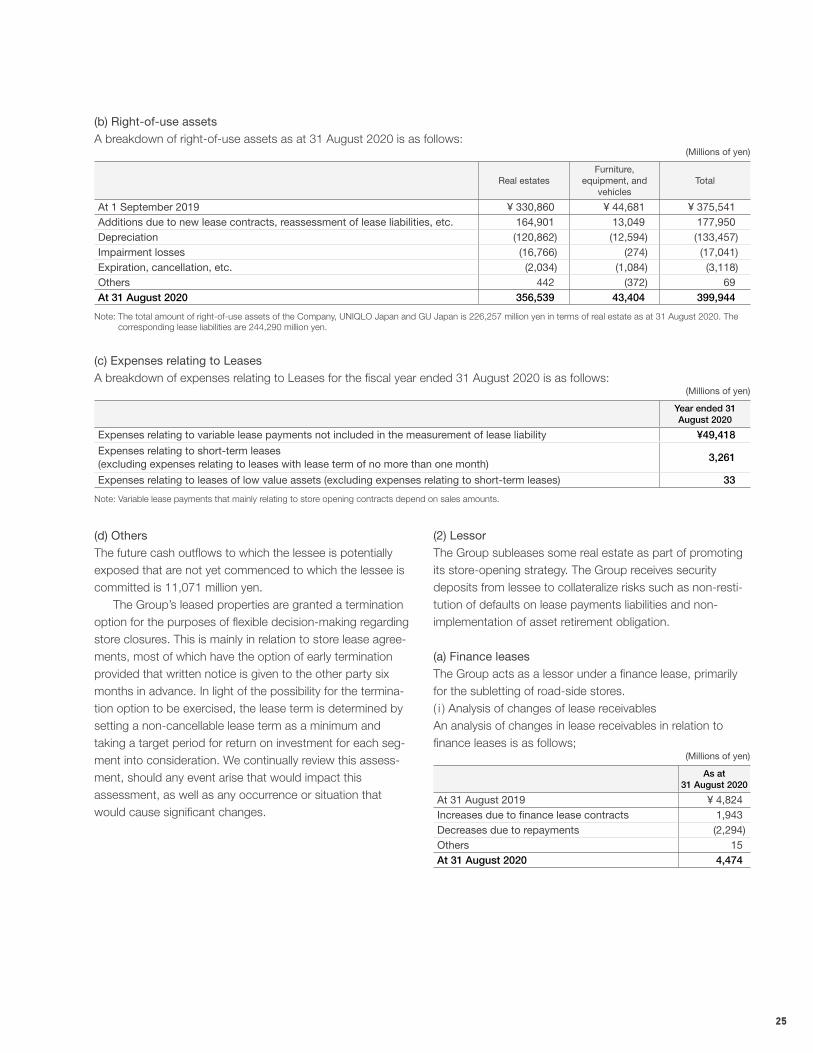
25
(b) Right-of-use assetsA breakdown of right-of-use assets as at 31 August 2020 is as follows:
(Millions of yen)
Real estatesFurniture,
equipment, and vehicles
Total
At 1 September 2019 ¥ 330,860 ¥ 44,681 ¥ 375,541 Additions due to new lease contracts, reassessment of lease liabilities, etc. 164,901 13,049 177,950 Depreciation (120,862) (12,594) (133,457)Impairment losses (16,766) (274) (17,041)Expiration, cancellation, etc. (2,034) (1,084) (3,118)Others 442 (372) 69 At 31 August 2020 356,539 43,404 399,944
Note: The total amount of right-of-use assets of the Company, UNIQLO Japan and GU Japan is 226,257 million yen in terms of real estate as at 31 August 2020. The corresponding lease liabilities are 244,290 million yen.
(c) Expenses relating to LeasesA breakdown of expenses relating to Leases for the fiscal year ended 31 August 2020 is as follows:
(Millions of yen)
Year ended 31 August 2020
Expenses relating to variable lease payments not included in the measurement of lease liability ¥49,418
Expenses relating to short-term leases (excluding expenses relating to leases with lease term of no more than one month)
3,261
Expenses relating to leases of low value assets (excluding expenses relating to short-term leases) 33
Note: Variable lease payments that mainly relating to store opening contracts depend on sales amounts.
(d) OthersThe future cash outflows to which the lessee is potentially exposed that are not yet commenced to which the lessee is committed is 11,071 million yen. The Group’s leased properties are granted a termination option for the purposes of flexible decision-making regarding store closures. This is mainly in relation to store lease agree-ments, most of which have the option of early termination provided that written notice is given to the other party six months in advance. In light of the possibility for the termina-tion option to be exercised, the lease term is determined by setting a non-cancellable lease term as a minimum and taking a target period for return on investment for each seg-ment into consideration. We continually review this assess-ment, should any event arise that would impact this assessment, as well as any occurrence or situation that would cause significant changes.
(2) LessorThe Group subleases some real estate as part of promoting its store-opening strategy. The Group receives security deposits from lessee to collateralize risks such as non-resti-tution of defaults on lease payments liabilities and non-implementation of asset retirement obligation.
(a) Finance leasesThe Group acts as a lessor under a finance lease, primarily for the subletting of road-side stores.( i ) Analysis of changes of lease receivablesAn analysis of changes in lease receivables in relation to finance leases is as follows;
(Millions of yen)
As at31 August 2020
At 31 August 2019 ¥ 4,824 Increases due to finance lease contracts 1,943 Decreases due to repayments (2,294)Others 15 At 31 August 2020 4,474
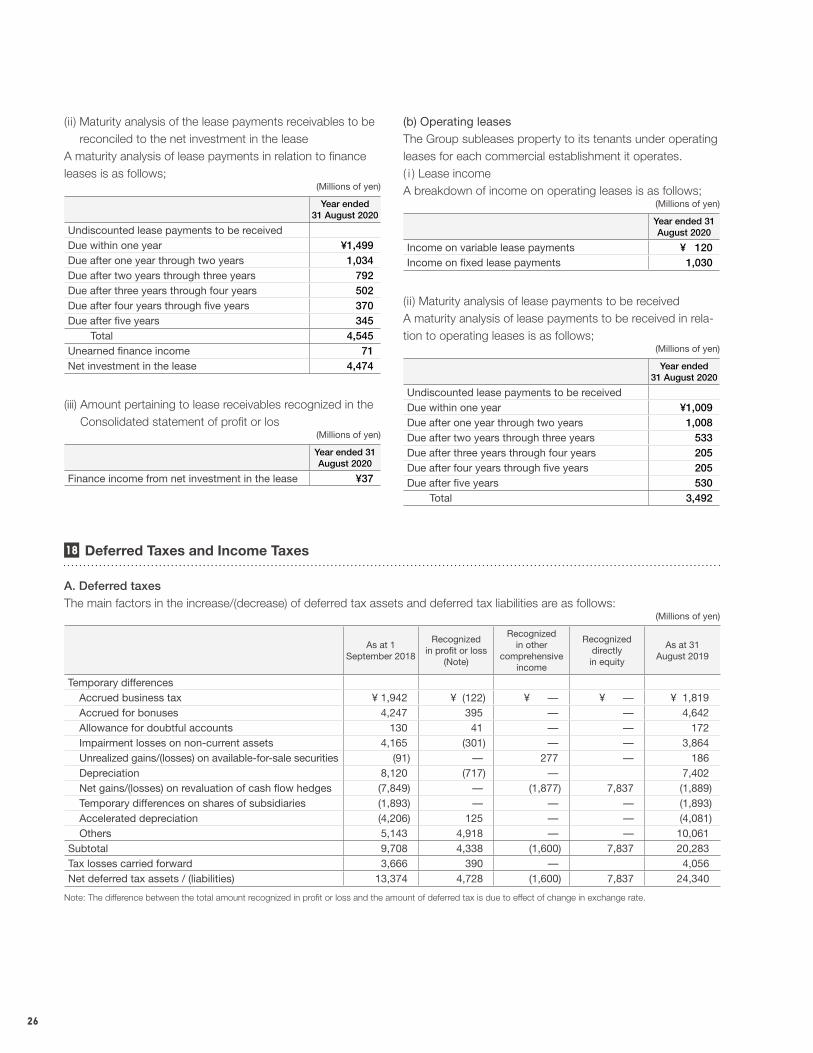
26
(ii) Maturity analysis of the lease payments receivables to be reconciled to the net investment in the lease
A maturity analysis of lease payments in relation to finance leases is as follows;
(Millions of yen)
Year ended 31 August 2020
Undiscounted lease payments to be receivedDue within one year ¥1,499Due after one year through two years 1,034Due after two years through three years 792Due after three years through four years 502Due after four years through five years 370Due after five years 345
Total 4,545Unearned finance income 71Net investment in the lease 4,474
(iii) Amount pertaining to lease receivables recognized in the Consolidated statement of profit or los
(Millions of yen)
Year ended 31 August 2020
Finance income from net investment in the lease ¥37
18 Deferred Taxes and Income Taxes
A. Deferred taxesThe main factors in the increase/(decrease) of deferred tax assets and deferred tax liabilities are as follows:
(Millions of yen)
As at 1 September 2018
Recognizedin profit or loss
(Note)
Recognized in other
comprehensive income
Recognized directly in equity
As at 31 August 2019
Temporary differencesAccrued business tax ¥ 1,942 ¥ (122) ¥ — ¥ — ¥ 1,819 Accrued for bonuses 4,247 395 — — 4,642 Allowance for doubtful accounts 130 41 — — 172 Impairment losses on non-current assets 4,165 (301) — — 3,864 Unrealized gains/(losses) on available-for-sale securities (91) — 277 — 186 Depreciation 8,120 (717) — 7,402 Net gains/(losses) on revaluation of cash flow hedges (7,849) — (1,877) 7,837 (1,889)Temporary differences on shares of subsidiaries (1,893) — — — (1,893)Accelerated depreciation (4,206) 125 — — (4,081)Others 5,143 4,918 — — 10,061
Subtotal 9,708 4,338 (1,600) 7,837 20,283 Tax losses carried forward 3,666 390 — 4,056 Net deferred tax assets / (liabilities) 13,374 4,728 (1,600) 7,837 24,340
Note: The difference between the total amount recognized in profit or loss and the amount of deferred tax is due to effect of change in exchange rate.
(b) Operating leasesThe Group subleases property to its tenants under operating leases for each commercial establishment it operates.( i ) Lease incomeA breakdown of income on operating leases is as follows;
(Millions of yen)
Year ended 31 August 2020
Income on variable lease payments ¥ 120Income on fixed lease payments 1,030
(ii) Maturity analysis of lease payments to be receivedA maturity analysis of lease payments to be received in rela-tion to operating leases is as follows;
(Millions of yen)
Year ended 31 August 2020
Undiscounted lease payments to be receivedDue within one year ¥1,009Due after one year through two years 1,008Due after two years through three years 533Due after three years through four years 205Due after four years through five years 205Due after five years 530
Total 3,492
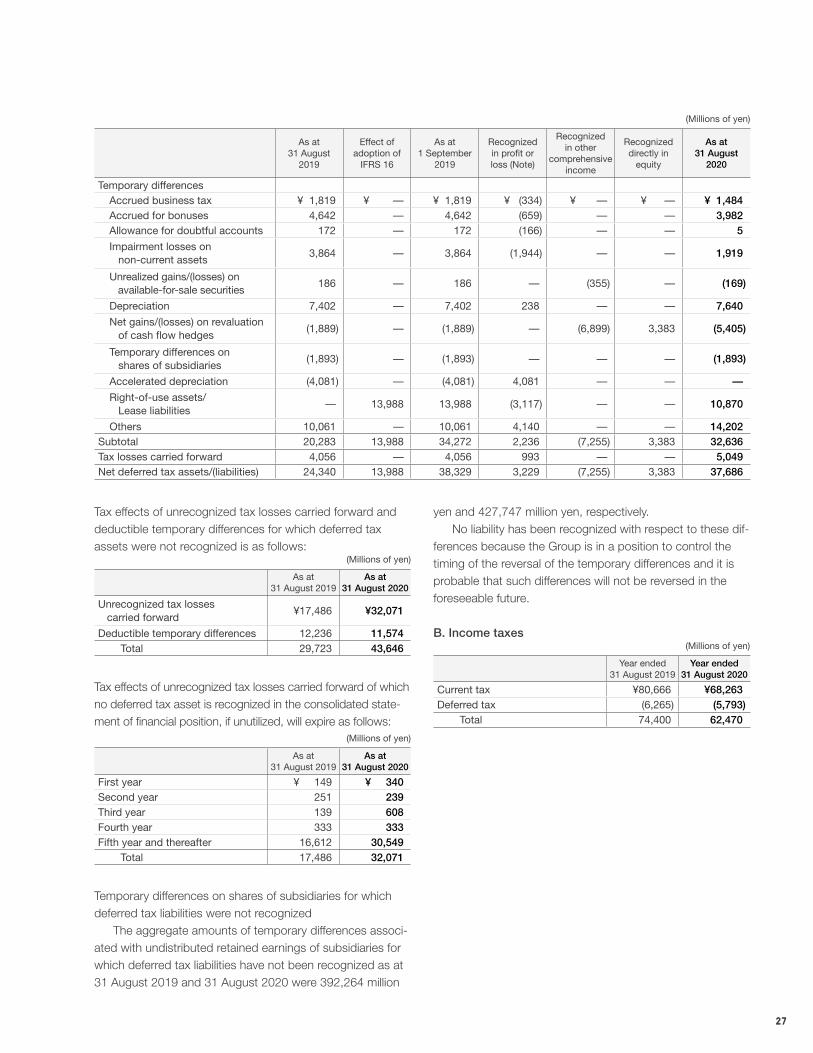
27
Tax effects of unrecognized tax losses carried forward and deductible temporary differences for which deferred tax assets were not recognized is as follows:
(Millions of yen)
As at31 August 2019
As at31 August 2020
Unrecognized tax losses carried forward
¥17,486 ¥32,071
Deductible temporary differences 12,236 11,574Total 29,723 43,646
Tax effects of unrecognized tax losses carried forward of which no deferred tax asset is recognized in the consolidated state-ment of financial position, if unutilized, will expire as follows:
(Millions of yen)
As at31 August 2019
As at31 August 2020
First year ¥ 149 ¥ 340Second year 251 239Third year 139 608Fourth year 333 333Fifth year and thereafter 16,612 30,549
Total 17,486 32,071
Temporary differences on shares of subsidiaries for which deferred tax liabilities were not recognized The aggregate amounts of temporary differences associ-ated with undistributed retained earnings of subsidiaries for which deferred tax liabilities have not been recognized as at 31 August 2019 and 31 August 2020 were 392,264 million
yen and 427,747 million yen, respectively. No liability has been recognized with respect to these dif-ferences because the Group is in a position to control the timing of the reversal of the temporary differences and it is probable that such differences will not be reversed in the foreseeable future.
B. Income taxes(Millions of yen)
Year ended31 August 2019
Year ended31 August 2020
Current tax ¥80,666 ¥68,263 Deferred tax (6,265) (5,793)
Total 74,400 62,470
(Millions of yen)
As at31 August
2019
Effect of adoption of
IFRS 16
As at1 September
2019
Recognizedin profit or loss (Note)
Recognizedin other
comprehensiveincome
Recognizeddirectly in
equity
As at31 August
2020
Temporary differencesAccrued business tax ¥ 1,819 ¥ — ¥ 1,819 ¥ (334) ¥ — ¥ — ¥ 1,484 Accrued for bonuses 4,642 — 4,642 (659) — — 3,982 Allowance for doubtful accounts 172 — 172 (166) — — 5
Impairment losses on non-current assets
3,864 — 3,864 (1,944) — — 1,919
Unrealized gains/(losses) on available-for-sale securities
186 — 186 — (355) — (169)
Depreciation 7,402 — 7,402 238 — — 7,640
Net gains/(losses) on revaluation of cash flow hedges
(1,889) — (1,889) — (6,899) 3,383 (5,405)
Temporary differences on shares of subsidiaries
(1,893) — (1,893) — — — (1,893)
Accelerated depreciation (4,081) — (4,081) 4,081 — — —
Right-of-use assets/ Lease liabilities
— 13,988 13,988 (3,117) — — 10,870
Others 10,061 — 10,061 4,140 — — 14,202 Subtotal 20,283 13,988 34,272 2,236 (7,255) 3,383 32,636 Tax losses carried forward 4,056 — 4,056 993 — — 5,049 Net deferred tax assets/(liabilities) 24,340 13,988 38,329 3,229 (7,255) 3,383 37,686
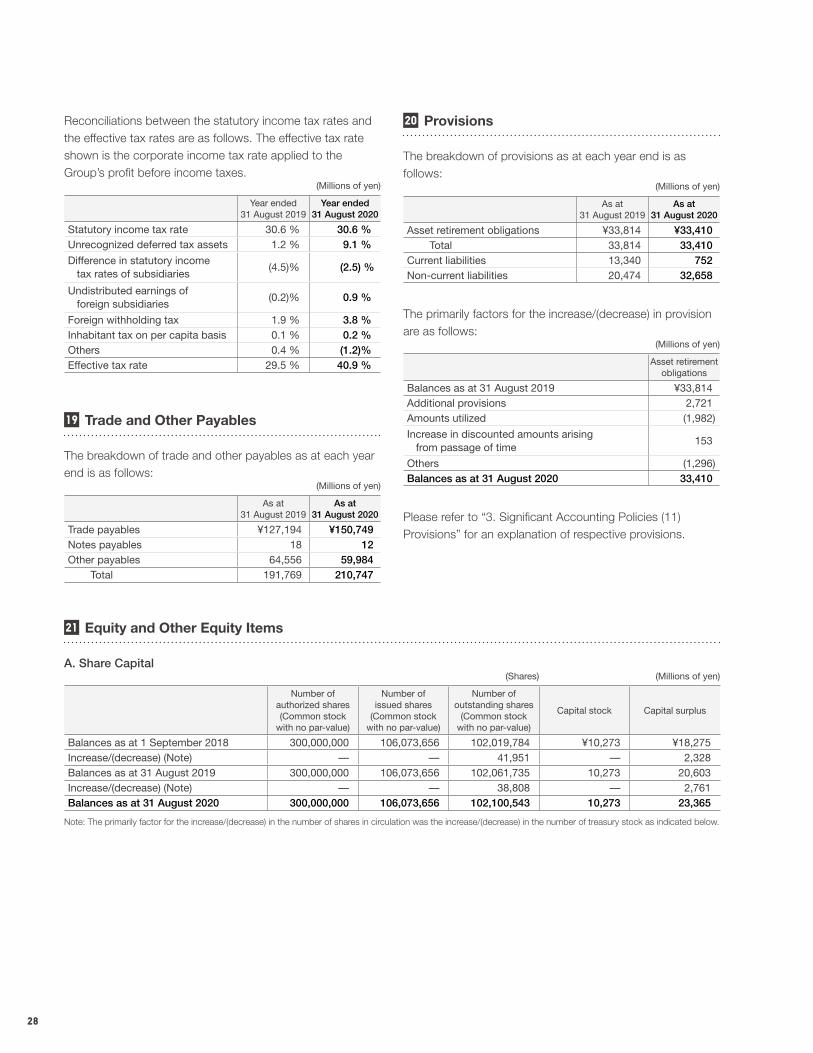
28
Reconciliations between the statutory income tax rates and the effective tax rates are as follows. The effective tax rate shown is the corporate income tax rate applied to the Group’s profit before income taxes.
(Millions of yen)
Year ended31 August 2019
Year ended31 August 2020
Statutory income tax rate 30.6 % 30.6 %Unrecognized deferred tax assets 1.2 % 9.1 %
Difference in statutory income tax rates of subsidiaries
(4.5)% (2.5) %
Undistributed earnings of foreign subsidiaries
(0.2)% 0.9 %
Foreign withholding tax 1.9 % 3.8 %Inhabitant tax on per capita basis 0.1 % 0.2 %Others 0.4 % (1.2)%Effective tax rate 29.5 % 40.9 %
19 Trade and Other Payables
The breakdown of trade and other payables as at each year end is as follows:
(Millions of yen)
As at31 August 2019
As at31 August 2020
Trade payables ¥127,194 ¥150,749Notes payables 18 12Other payables 64,556 59,984
Total 191,769 210,747
20 Provisions
The breakdown of provisions as at each year end is as follows:
(Millions of yen)
As at31 August 2019
As at31 August 2020
Asset retirement obligations ¥33,814 ¥33,410Total 33,814 33,410
Current liabilities 13,340 752Non-current liabilities 20,474 32,658
The primarily factors for the increase/(decrease) in provision are as follows:
(Millions of yen)
Asset retirement obligations
Balances as at 31 August 2019 ¥33,814 Additional provisions 2,721 Amounts utilized (1,982)
Increase in discounted amounts arising from passage of time
153
Others (1,296)Balances as at 31 August 2020 33,410
Please refer to “3. Significant Accounting Policies (11) Provisions” for an explanation of respective provisions.
21 Equity and Other Equity Items
A. Share Capital(Shares) (Millions of yen)
Number ofauthorized shares(Common stock
with no par-value)
Number of issued shares
(Common stock with no par-value)
Number of outstanding shares
(Common stock with no par-value)
Capital stock Capital surplus
Balances as at 1 September 2018 300,000,000 106,073,656 102,019,784 ¥10,273 ¥18,275Increase/(decrease) (Note) — — 41,951 — 2,328Balances as at 31 August 2019 300,000,000 106,073,656 102,061,735 10,273 20,603Increase/(decrease) (Note) — — 38,808 — 2,761Balances as at 31 August 2020 300,000,000 106,073,656 102,100,543 10,273 23,365
Note: The primarily factor for the increase/(decrease) in the number of shares in circulation was the increase/(decrease) in the number of treasury stock as indicated below.
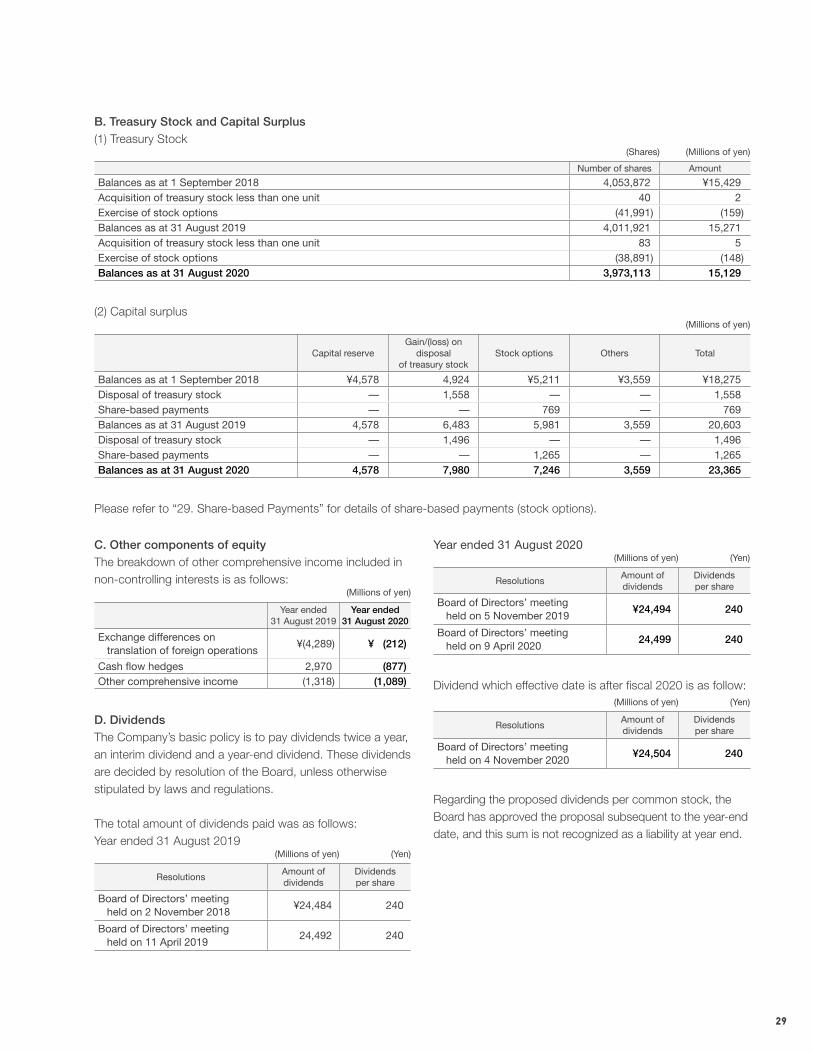
29
B. Treasury Stock and Capital Surplus(1) Treasury Stock
(Shares) (Millions of yen)
Number of shares Amount
Balances as at 1 September 2018 4,053,872 ¥15,429 Acquisition of treasury stock less than one unit 40 2 Exercise of stock options (41,991) (159)Balances as at 31 August 2019 4,011,921 15,271 Acquisition of treasury stock less than one unit 83 5 Exercise of stock options (38,891) (148)Balances as at 31 August 2020 3,973,113 15,129
(2) Capital surplus(Millions of yen)
Capital reserveGain/(loss) on
disposalof treasury stock
Stock options Others Total
Balances as at 1 September 2018 ¥4,578 4,924 ¥5,211 ¥3,559 ¥18,275Disposal of treasury stock — 1,558 — — 1,558Share-based payments — — 769 — 769Balances as at 31 August 2019 4,578 6,483 5,981 3,559 20,603Disposal of treasury stock — 1,496 — — 1,496Share-based payments — — 1,265 — 1,265Balances as at 31 August 2020 4,578 7,980 7,246 3,559 23,365
Please refer to “29. Share-based Payments” for details of share-based payments (stock options).
C. Other components of equityThe breakdown of other comprehensive income included in non-controlling interests is as follows:
(Millions of yen)
Year ended31 August 2019
Year ended31 August 2020
Exchange differences on translation of foreign operations
¥(4,289) ¥ (212)
Cash flow hedges 2,970 (877)Other comprehensive income (1,318) (1,089)
D. DividendsThe Company’s basic policy is to pay dividends twice a year, an interim dividend and a year-end dividend. These dividends are decided by resolution of the Board, unless otherwise stipulated by laws and regulations.
The total amount of dividends paid was as follows:Year ended 31 August 2019
(Millions of yen) (Yen)
ResolutionsAmount of dividends
Dividendsper share
Board of Directors’ meeting held on 2 November 2018
¥24,484 240
Board of Directors’ meeting held on 11 April 2019
24,492 240
Year ended 31 August 2020(Millions of yen) (Yen)
ResolutionsAmount of dividends
Dividendsper share
Board of Directors’ meeting held on 5 November 2019
¥24,494 240
Board of Directors’ meeting held on 9 April 2020
24,499 240
Dividend which effective date is after fiscal 2020 is as follow:(Millions of yen) (Yen)
ResolutionsAmount of dividends
Dividendsper share
Board of Directors’ meeting held on 4 November 2020
¥24,504 240
Regarding the proposed dividends per common stock, the Board has approved the proposal subsequent to the year-end date, and this sum is not recognized as a liability at year end.
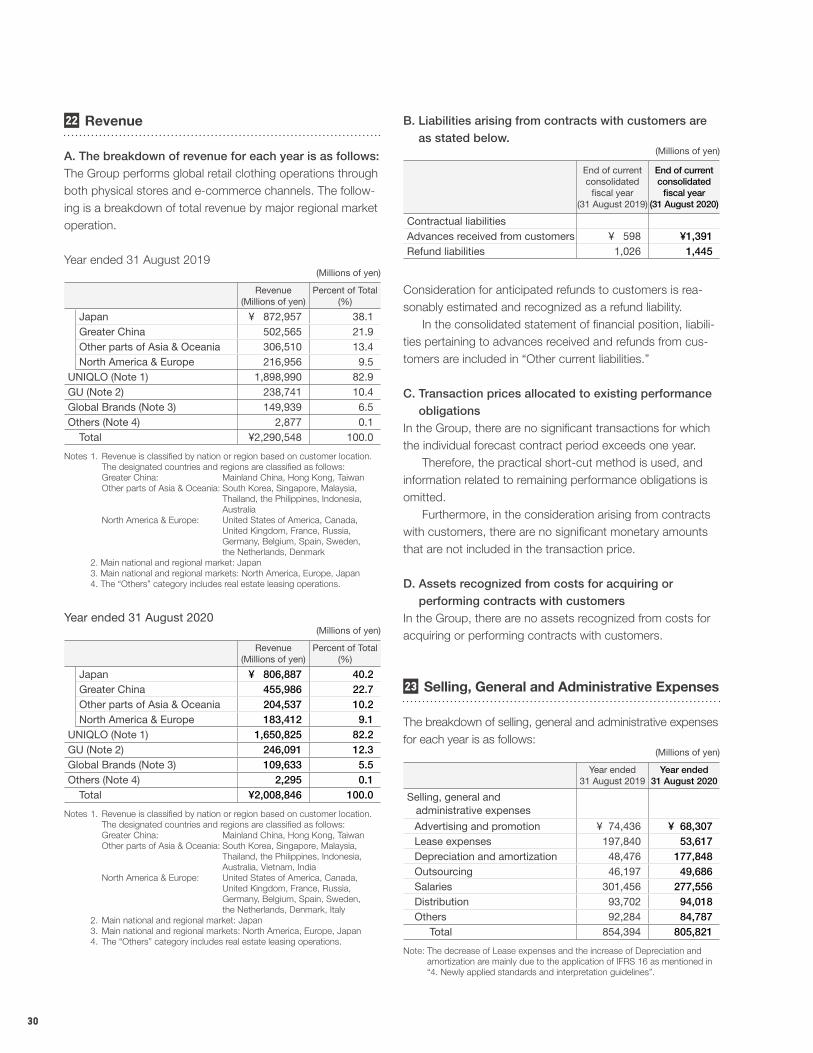
30
22 Revenue
A. The breakdown of revenue for each year is as follows:The Group performs global retail clothing operations through both physical stores and e-commerce channels. The follow-ing is a breakdown of total revenue by major regional market operation.
Year ended 31 August 2019(Millions of yen)
Revenue(Millions of yen)
Percent of Total(%)
Japan ¥ 872,957 38.1Greater China 502,565 21.9Other parts of Asia & Oceania 306,510 13.4North America & Europe 216,956 9.5
UNIQLO (Note 1) 1,898,990 82.9GU (Note 2) 238,741 10.4Global Brands (Note 3) 149,939 6.5Others (Note 4) 2,877 0.1
Total ¥2,290,548 100.0
Notes 1. Revenue is classified by nation or region based on customer location. The designated countries and regions are classified as follows: Greater China: Mainland China, Hong Kong, Taiwan Other parts of Asia & Oceania: South Korea, Singapore, Malaysia,
Thailand, the Philippines, Indonesia, Australia
North America & Europe: United States of America, Canada, United Kingdom, France, Russia, Germany, Belgium, Spain, Sweden, the Netherlands, Denmark
2. Main national and regional market: Japan 3. Main national and regional markets: North America, Europe, Japan 4. The “Others” category includes real estate leasing operations.
Year ended 31 August 2020(Millions of yen)
Revenue(Millions of yen)
Percent of Total(%)
Japan ¥ 806,887 40.2Greater China 455,986 22.7Other parts of Asia & Oceania 204,537 10.2North America & Europe 183,412 9.1
UNIQLO (Note 1) 1,650,825 82.2GU (Note 2) 246,091 12.3Global Brands (Note 3) 109,633 5.5Others (Note 4) 2,295 0.1
Total ¥2,008,846 100.0
Notes 1. Revenue is classified by nation or region based on customer location. The designated countries and regions are classified as follows: Greater China: Mainland China, Hong Kong, Taiwan Other parts of Asia & Oceania: South Korea, Singapore, Malaysia,
Thailand, the Philippines, Indonesia, Australia, Vietnam, India
North America & Europe: United States of America, Canada, United Kingdom, France, Russia, Germany, Belgium, Spain, Sweden, the Netherlands, Denmark, Italy
2. Main national and regional market: Japan 3. Main national and regional markets: North America, Europe, Japan 4. The “Others” category includes real estate leasing operations.
B. Liabilities arising from contracts with customers are as stated below.
(Millions of yen)
End of current consolidated
fiscal year(31 August 2019)
End of current consolidated
fiscal year(31 August 2020)
Contractual liabilitiesAdvances received from customers ¥ 598 ¥1,391Refund liabilities 1,026 1,445
Consideration for anticipated refunds to customers is rea-sonably estimated and recognized as a refund liability. In the consolidated statement of financial position, liabili-ties pertaining to advances received and refunds from cus-tomers are included in “Other current liabilities.”
C. Transaction prices allocated to existing performance obligations
In the Group, there are no significant transactions for which the individual forecast contract period exceeds one year. Therefore, the practical short-cut method is used, and information related to remaining performance obligations is omitted. Furthermore, in the consideration arising from contracts with customers, there are no significant monetary amounts that are not included in the transaction price.
D. Assets recognized from costs for acquiring or performing contracts with customers
In the Group, there are no assets recognized from costs for acquiring or performing contracts with customers.
23 Selling, General and Administrative Expenses
The breakdown of selling, general and administrative expenses for each year is as follows:
(Millions of yen)
Year ended31 August 2019
Year ended31 August 2020
Selling, general and administrative expenses
Advertising and promotion ¥ 74,436 ¥ 68,307Lease expenses 197,840 53,617Depreciation and amortization 48,476 177,848Outsourcing 46,197 49,686Salaries 301,456 277,556Distribution 93,702 94,018Others 92,284 84,787
Total 854,394 805,821
Note: The decrease of Lease expenses and the increase of Depreciation and amortization are mainly due to the application of IFRS 16 as mentioned in “4. Newly applied standards and interpretation guidelines”.
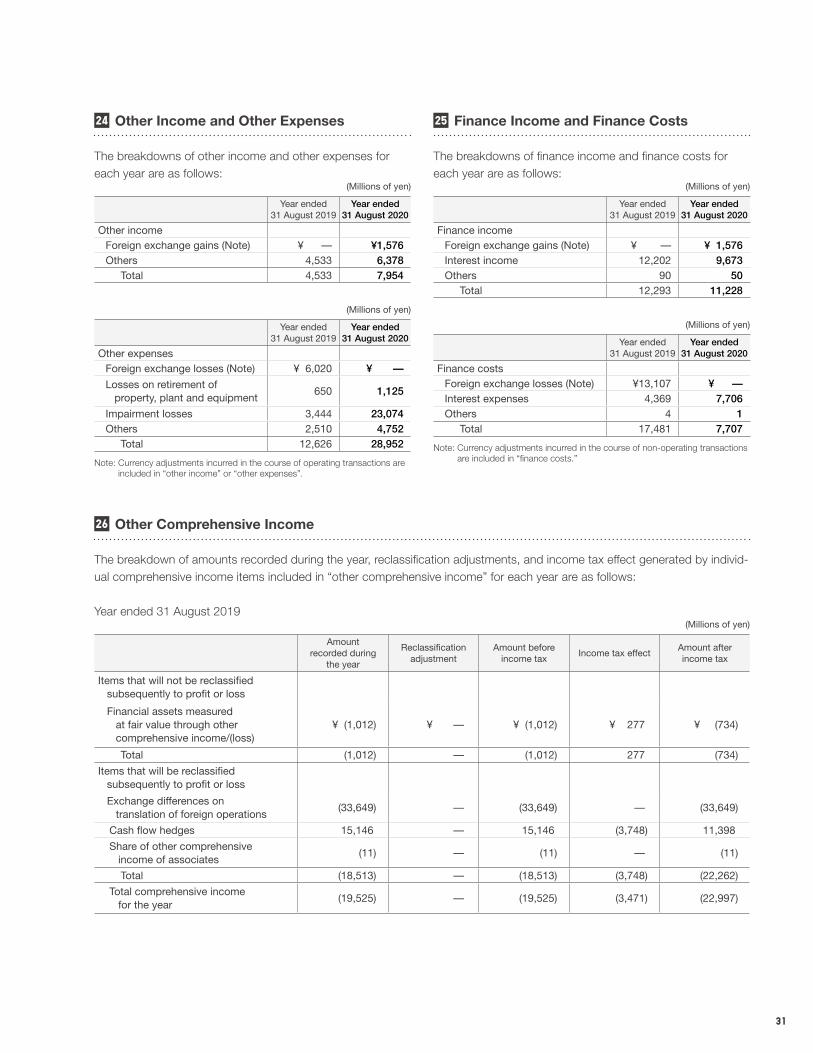
31
24 Other Income and Other Expenses
The breakdowns of other income and other expenses for each year are as follows:
(Millions of yen)
Year ended31 August 2019
Year ended31 August 2020
Other incomeForeign exchange gains (Note) ¥ — ¥1,576Others 4,533 6,378
Total 4,533 7,954
(Millions of yen)
Year ended31 August 2019
Year ended31 August 2020
Other expensesForeign exchange losses (Note) ¥ 6,020 ¥ —
Losses on retirement of property, plant and equipment
650 1,125
Impairment losses 3,444 23,074Others 2,510 4,752
Total 12,626 28,952
Note: Currency adjustments incurred in the course of operating transactions are included in “other income” or “other expenses”.
25 Finance Income and Finance Costs
The breakdowns of finance income and finance costs for each year are as follows:
(Millions of yen)
Year ended31 August 2019
Year ended31 August 2020
Finance incomeForeign exchange gains (Note) ¥ — ¥ 1,576Interest income 12,202 9,673Others 90 50
Total 12,293 11,228
(Millions of yen)
Year ended31 August 2019
Year ended31 August 2020
Finance costsForeign exchange losses (Note) ¥13,107 ¥ —Interest expenses 4,369 7,706Others 4 1
Total 17,481 7,707
Note: Currency adjustments incurred in the course of non-operating transactions are included in “finance costs.”
26 Other Comprehensive Income
The breakdown of amounts recorded during the year, reclassification adjustments, and income tax effect generated by individ-ual comprehensive income items included in “other comprehensive income” for each year are as follows:
Year ended 31 August 2019(Millions of yen)
Amountrecorded during
the year
Reclassificationadjustment
Amount beforeincome tax
Income tax effectAmount afterincome tax
Items that will not be reclassified subsequently to profit or loss
Financial assets measured at fair value through other comprehensive income/(loss)
¥ (1,012) ¥ — ¥ (1,012) ¥ 277 ¥ (734)
Total (1,012) — (1,012) 277 (734)
Items that will be reclassified subsequently to profit or loss
Exchange differences on translation of foreign operations
(33,649) — (33,649) — (33,649)
Cash flow hedges 15,146 — 15,146 (3,748) 11,398
Share of other comprehensive income of associates
(11) — (11) — (11)
Total (18,513) — (18,513) (3,748) (22,262)
Total comprehensive income for the year
(19,525) — (19,525) (3,471) (22,997)
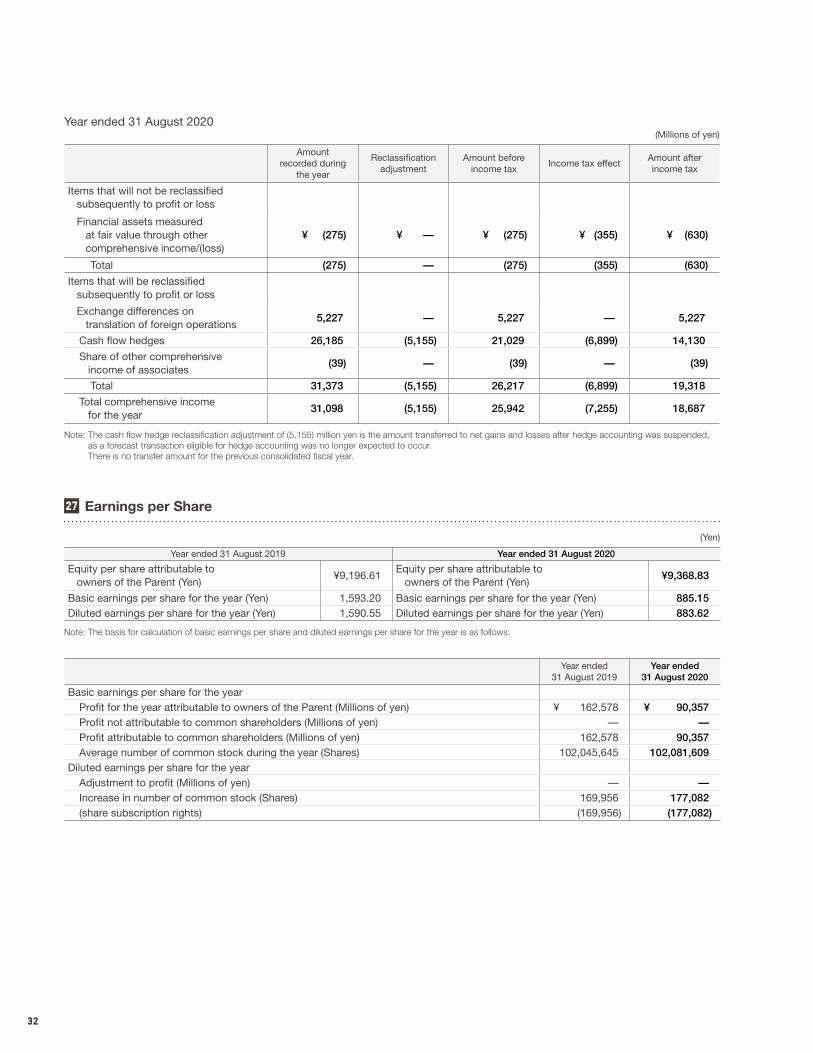
32
Year ended 31 August 2020(Millions of yen)
Amountrecorded during
the year
Reclassificationadjustment
Amount beforeincome tax
Income tax effectAmount afterincome tax
Items that will not be reclassified subsequently to profit or loss
Financial assets measured at fair value through other comprehensive income/(loss)
¥ (275) ¥ — ¥ (275) ¥ (355) ¥ (630)
Total (275) — (275) (355) (630)
Items that will be reclassified subsequently to profit or loss
Exchange differences on translation of foreign operations
5,227 — 5,227 — 5,227
Cash flow hedges 26,185 (5,155) 21,029 (6,899) 14,130
Share of other comprehensive income of associates
(39) — (39) — (39)
Total 31,373 (5,155) 26,217 (6,899) 19,318
Total comprehensive income for the year
31,098 (5,155) 25,942 (7,255) 18,687
Note: The cash flow hedge reclassification adjustment of (5,155) million yen is the amount transferred to net gains and losses after hedge accounting was suspended, as a forecast transaction eligible for hedge accounting was no longer expected to occur.
There is no transfer amount for the previous consolidated fiscal year.
27 Earnings per Share
(Yen)
Year ended 31 August 2019 Year ended 31 August 2020
Equity per share attributable to owners of the Parent (Yen)
¥9,196.61Equity per share attributable to owners of the Parent (Yen)
¥9,368.83
Basic earnings per share for the year (Yen) 1,593.20 Basic earnings per share for the year (Yen) 885.15Diluted earnings per share for the year (Yen) 1,590.55 Diluted earnings per share for the year (Yen) 883.62
Note: The basis for calculation of basic earnings per share and diluted earnings per share for the year is as follows:
Year ended31 August 2019
Year ended31 August 2020
Basic earnings per share for the yearProfit for the year attributable to owners of the Parent (Millions of yen) ¥ 162,578 ¥ 90,357 Profit not attributable to common shareholders (Millions of yen) — —Profit attributable to common shareholders (Millions of yen) 162,578 90,357 Average number of common stock during the year (Shares) 102,045,645 102,081,609
Diluted earnings per share for the yearAdjustment to profit (Millions of yen) — —Increase in number of common stock (Shares) 169,956 177,082 (share subscription rights) (169,956) (177,082)
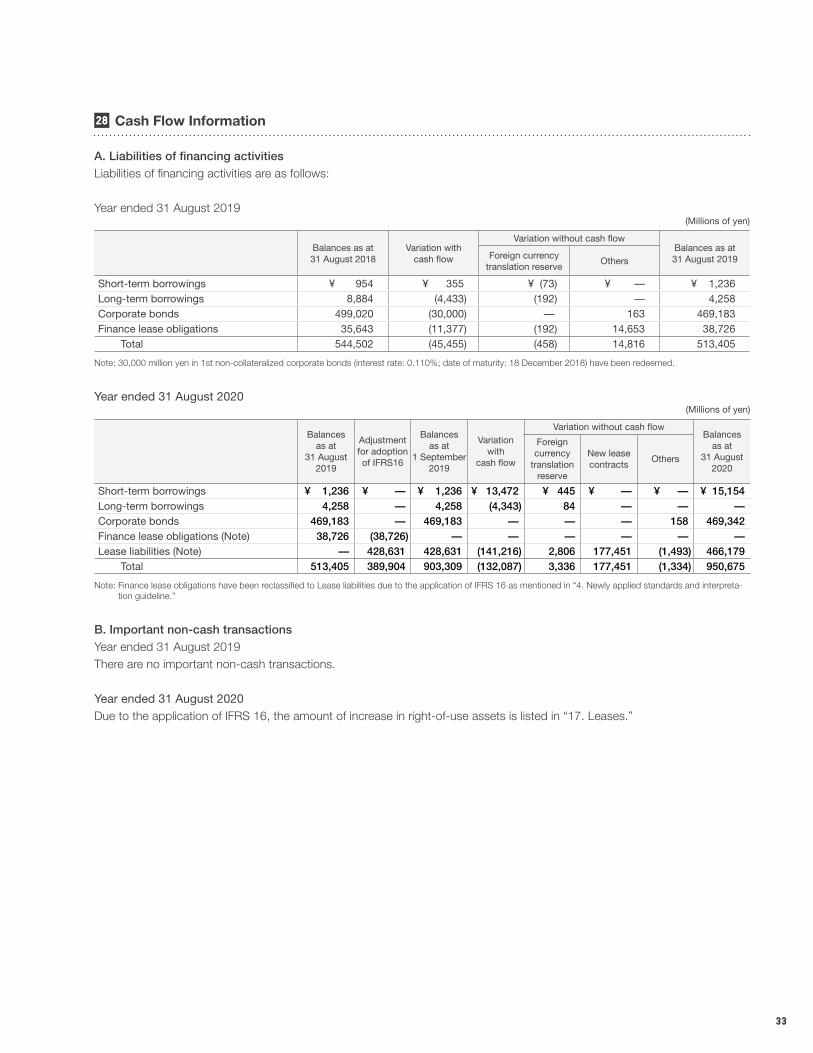
33
28 Cash Flow Information
A. Liabilities of financing activitiesLiabilities of financing activities are as follows:
Year ended 31 August 2019(Millions of yen)
Balances as at 31 August 2018
Variation with cash flow
Variation without cash flowBalances as at 31 August 2019Foreign currency
translation reserveOthers
Short-term borrowings ¥ 954 ¥ 355 ¥ (73) ¥ — ¥ 1,236 Long-term borrowings 8,884 (4,433) (192) — 4,258 Corporate bonds 499,020 (30,000) — 163 469,183 Finance lease obligations 35,643 (11,377) (192) 14,653 38,726
Total 544,502 (45,455) (458) 14,816 513,405
Note: 30,000 million yen in 1st non-collateralized corporate bonds (interest rate: 0.110%; date of maturity: 18 December 2018) have been redeemed.
Year ended 31 August 2020(Millions of yen)
Balances as at
31 August 2019
Adjustment for adoption of IFRS16
Balances as at
1 September 2019
Variation with
cash flow
Variation without cash flowBalances
as at 31 August
2020
Foreign currency
translationreserve
New lease contracts
Others
Short-term borrowings ¥ 1,236 ¥ — ¥ 1,236 ¥ 13,472 ¥ 445 ¥ — ¥ — ¥ 15,154 Long-term borrowings 4,258 — 4,258 (4,343) 84 — — —Corporate bonds 469,183 — 469,183 — — — 158 469,342 Finance lease obligations (Note) 38,726 (38,726) — — — — — —Lease liabilities (Note) — 428,631 428,631 (141,216) 2,806 177,451 (1,493) 466,179
Total 513,405 389,904 903,309 (132,087) 3,336 177,451 (1,334) 950,675
Note: Finance lease obligations have been reclassified to Lease liabilities due to the application of IFRS 16 as mentioned in “4. Newly applied standards and interpreta-tion guideline.”
B. Important non-cash transactionsYear ended 31 August 2019There are no important non-cash transactions.
Year ended 31 August 2020Due to the application of IFRS 16, the amount of increase in right-of-use assets is listed in “17. Leases.”
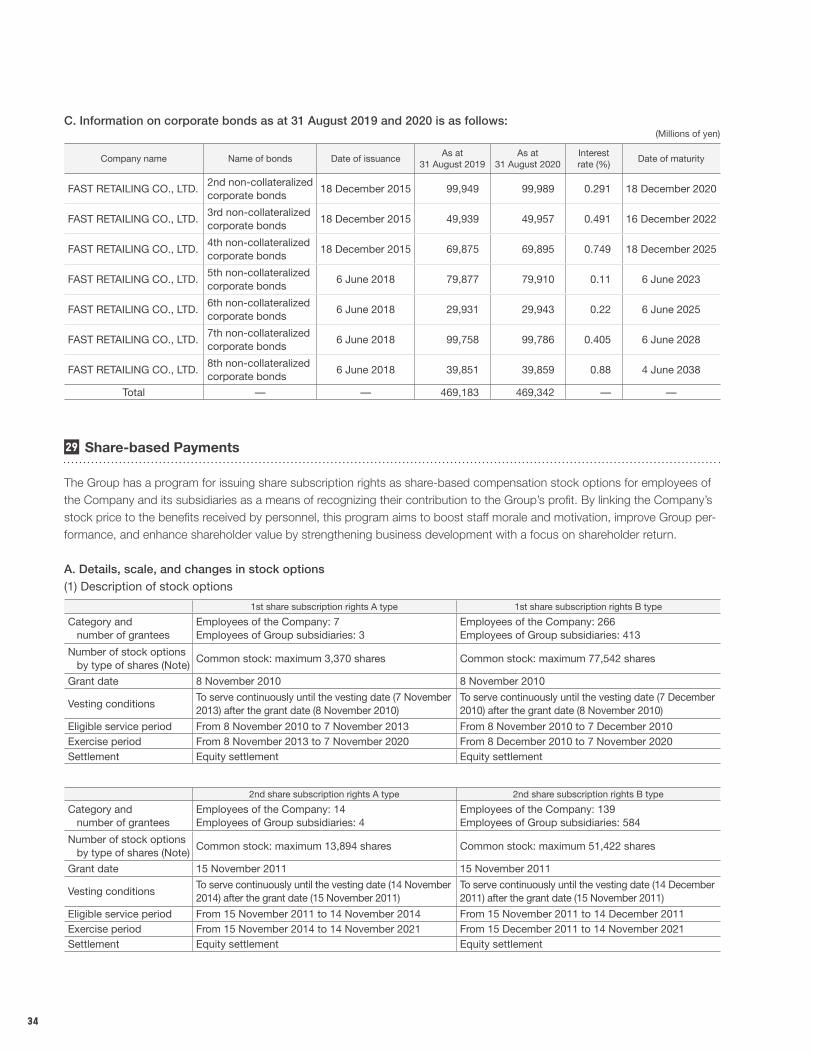
34
C. Information on corporate bonds as at 31 August 2019 and 2020 is as follows:(Millions of yen)
Company name Name of bonds Date of issuanceAs at
31 August 2019As at
31 August 2020Interest rate (%)
Date of maturity
FAST RETAILING CO., LTD.2nd non-collateralizedcorporate bonds
18 December 2015 99,949 99,989 0.291 18 December 2020
FAST RETAILING CO., LTD.3rd non-collateralizedcorporate bonds
18 December 2015 49,939 49,957 0.491 16 December 2022
FAST RETAILING CO., LTD.4th non-collateralizedcorporate bonds
18 December 2015 69,875 69,895 0.749 18 December 2025
FAST RETAILING CO., LTD.5th non-collateralizedcorporate bonds
6 June 2018 79,877 79,910 0.11 6 June 2023
FAST RETAILING CO., LTD.6th non-collateralizedcorporate bonds
6 June 2018 29,931 29,943 0.22 6 June 2025
FAST RETAILING CO., LTD.7th non-collateralizedcorporate bonds
6 June 2018 99,758 99,786 0.405 6 June 2028
FAST RETAILING CO., LTD.8th non-collateralizedcorporate bonds
6 June 2018 39,851 39,859 0.88 4 June 2038
Total — — 469,183 469,342 — —
29 Share-based Payments
The Group has a program for issuing share subscription rights as share-based compensation stock options for employees of the Company and its subsidiaries as a means of recognizing their contribution to the Group’s profit. By linking the Company’s stock price to the benefits received by personnel, this program aims to boost staff morale and motivation, improve Group per-formance, and enhance shareholder value by strengthening business development with a focus on shareholder return.
A. Details, scale, and changes in stock options(1) Description of stock options
1st share subscription rights A type 1st share subscription rights B type
Category and number of grantees
Employees of the Company: 7Employees of Group subsidiaries: 3
Employees of the Company: 266Employees of Group subsidiaries: 413
Number of stock options by type of shares (Note)
Common stock: maximum 3,370 shares Common stock: maximum 77,542 shares
Grant date 8 November 2010 8 November 2010
Vesting conditionsTo serve continuously until the vesting date (7 November 2013) after the grant date (8 November 2010)
To serve continuously until the vesting date (7 December 2010) after the grant date (8 November 2010)
Eligible service period From 8 November 2010 to 7 November 2013 From 8 November 2010 to 7 December 2010Exercise period From 8 November 2013 to 7 November 2020 From 8 December 2010 to 7 November 2020Settlement Equity settlement Equity settlement
2nd share subscription rights A type 2nd share subscription rights B type
Category and number of grantees
Employees of the Company: 14Employees of Group subsidiaries: 4
Employees of the Company: 139Employees of Group subsidiaries: 584
Number of stock options by type of shares (Note)
Common stock: maximum 13,894 shares Common stock: maximum 51,422 shares
Grant date 15 November 2011 15 November 2011
Vesting conditionsTo serve continuously until the vesting date (14 November 2014) after the grant date (15 November 2011)
To serve continuously until the vesting date (14 December 2011) after the grant date (15 November 2011)
Eligible service period From 15 November 2011 to 14 November 2014 From 15 November 2011 to 14 December 2011Exercise period From 15 November 2014 to 14 November 2021 From 15 December 2011 to 14 November 2021Settlement Equity settlement Equity settlement
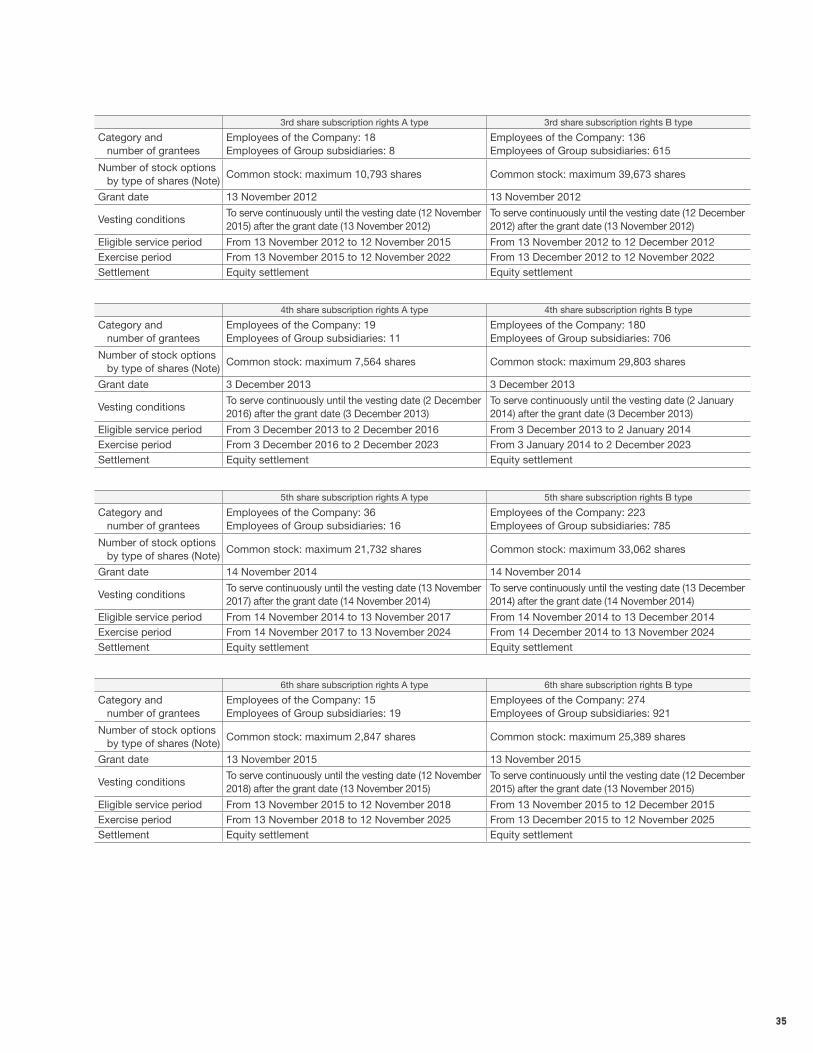
35
3rd share subscription rights A type 3rd share subscription rights B type
Category and number of grantees
Employees of the Company: 18Employees of Group subsidiaries: 8
Employees of the Company: 136Employees of Group subsidiaries: 615
Number of stock options by type of shares (Note)
Common stock: maximum 10,793 shares Common stock: maximum 39,673 shares
Grant date 13 November 2012 13 November 2012
Vesting conditionsTo serve continuously until the vesting date (12 November 2015) after the grant date (13 November 2012)
To serve continuously until the vesting date (12 December 2012) after the grant date (13 November 2012)
Eligible service period From 13 November 2012 to 12 November 2015 From 13 November 2012 to 12 December 2012Exercise period From 13 November 2015 to 12 November 2022 From 13 December 2012 to 12 November 2022Settlement Equity settlement Equity settlement
4th share subscription rights A type 4th share subscription rights B type
Category and number of grantees
Employees of the Company: 19Employees of Group subsidiaries: 11
Employees of the Company: 180Employees of Group subsidiaries: 706
Number of stock options by type of shares (Note)
Common stock: maximum 7,564 shares Common stock: maximum 29,803 shares
Grant date 3 December 2013 3 December 2013
Vesting conditionsTo serve continuously until the vesting date (2 December 2016) after the grant date (3 December 2013)
To serve continuously until the vesting date (2 January 2014) after the grant date (3 December 2013)
Eligible service period From 3 December 2013 to 2 December 2016 From 3 December 2013 to 2 January 2014Exercise period From 3 December 2016 to 2 December 2023 From 3 January 2014 to 2 December 2023Settlement Equity settlement Equity settlement
5th share subscription rights A type 5th share subscription rights B type
Category and number of grantees
Employees of the Company: 36Employees of Group subsidiaries: 16
Employees of the Company: 223Employees of Group subsidiaries: 785
Number of stock options by type of shares (Note)
Common stock: maximum 21,732 shares Common stock: maximum 33,062 shares
Grant date 14 November 2014 14 November 2014
Vesting conditionsTo serve continuously until the vesting date (13 November 2017) after the grant date (14 November 2014)
To serve continuously until the vesting date (13 December 2014) after the grant date (14 November 2014)
Eligible service period From 14 November 2014 to 13 November 2017 From 14 November 2014 to 13 December 2014Exercise period From 14 November 2017 to 13 November 2024 From 14 December 2014 to 13 November 2024Settlement Equity settlement Equity settlement
6th share subscription rights A type 6th share subscription rights B type
Category and number of grantees
Employees of the Company: 15Employees of Group subsidiaries: 19
Employees of the Company: 274Employees of Group subsidiaries: 921
Number of stock options by type of shares (Note)
Common stock: maximum 2,847 shares Common stock: maximum 25,389 shares
Grant date 13 November 2015 13 November 2015
Vesting conditionsTo serve continuously until the vesting date (12 November 2018) after the grant date (13 November 2015)
To serve continuously until the vesting date (12 December 2015) after the grant date (13 November 2015)
Eligible service period From 13 November 2015 to 12 November 2018 From 13 November 2015 to 12 December 2015Exercise period From 13 November 2018 to 12 November 2025 From 13 December 2015 to 12 November 2025Settlement Equity settlement Equity settlement
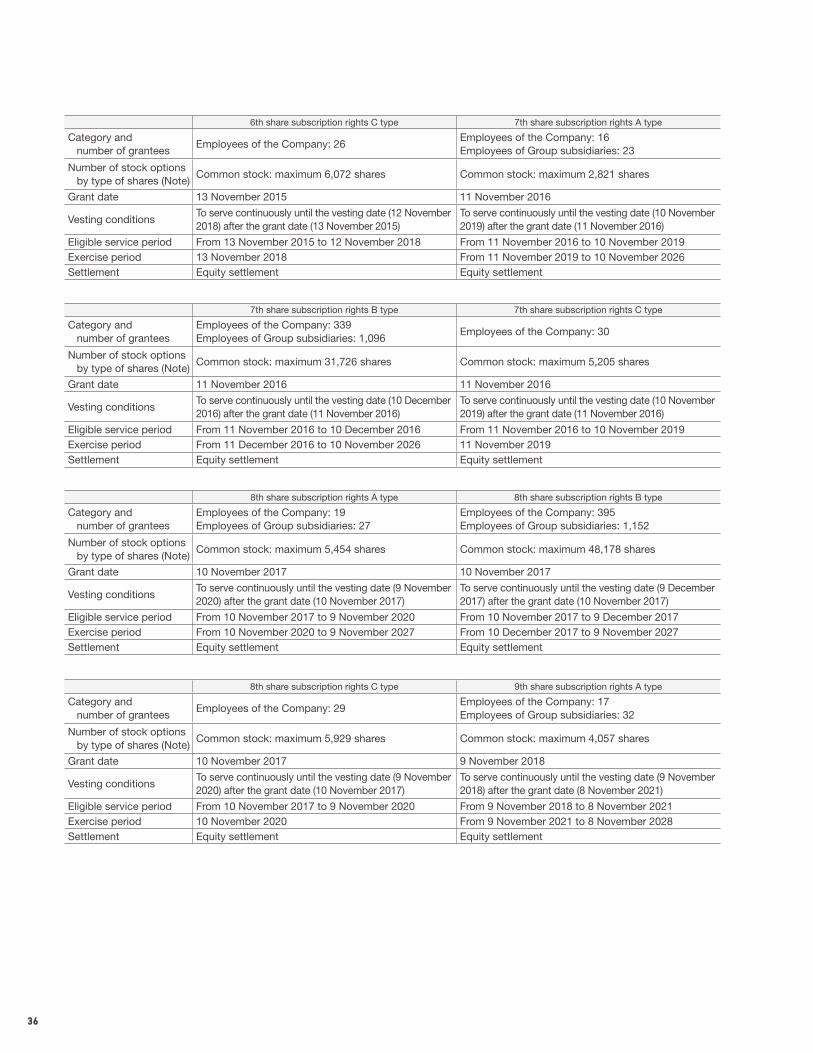
36
6th share subscription rights C type 7th share subscription rights A type
Category and number of grantees
Employees of the Company: 26Employees of the Company: 16Employees of Group subsidiaries: 23
Number of stock options by type of shares (Note)
Common stock: maximum 6,072 shares Common stock: maximum 2,821 shares
Grant date 13 November 2015 11 November 2016
Vesting conditionsTo serve continuously until the vesting date (12 November 2018) after the grant date (13 November 2015)
To serve continuously until the vesting date (10 November 2019) after the grant date (11 November 2016)
Eligible service period From 13 November 2015 to 12 November 2018 From 11 November 2016 to 10 November 2019Exercise period 13 November 2018 From 11 November 2019 to 10 November 2026Settlement Equity settlement Equity settlement
7th share subscription rights B type 7th share subscription rights C type
Category and number of grantees
Employees of the Company: 339Employees of Group subsidiaries: 1,096
Employees of the Company: 30
Number of stock options by type of shares (Note)
Common stock: maximum 31,726 shares Common stock: maximum 5,205 shares
Grant date 11 November 2016 11 November 2016
Vesting conditionsTo serve continuously until the vesting date (10 December 2016) after the grant date (11 November 2016)
To serve continuously until the vesting date (10 November 2019) after the grant date (11 November 2016)
Eligible service period From 11 November 2016 to 10 December 2016 From 11 November 2016 to 10 November 2019Exercise period From 11 December 2016 to 10 November 2026 11 November 2019Settlement Equity settlement Equity settlement
8th share subscription rights A type 8th share subscription rights B type
Category and number of grantees
Employees of the Company: 19Employees of Group subsidiaries: 27
Employees of the Company: 395Employees of Group subsidiaries: 1,152
Number of stock options by type of shares (Note)
Common stock: maximum 5,454 shares Common stock: maximum 48,178 shares
Grant date 10 November 2017 10 November 2017
Vesting conditionsTo serve continuously until the vesting date (9 November 2020) after the grant date (10 November 2017)
To serve continuously until the vesting date (9 December 2017) after the grant date (10 November 2017)
Eligible service period From 10 November 2017 to 9 November 2020 From 10 November 2017 to 9 December 2017Exercise period From 10 November 2020 to 9 November 2027 From 10 December 2017 to 9 November 2027Settlement Equity settlement Equity settlement
8th share subscription rights C type 9th share subscription rights A type
Category and number of grantees
Employees of the Company: 29Employees of the Company: 17Employees of Group subsidiaries: 32
Number of stock options by type of shares (Note)
Common stock: maximum 5,929 shares Common stock: maximum 4,057 shares
Grant date 10 November 2017 9 November 2018
Vesting conditionsTo serve continuously until the vesting date (9 November 2020) after the grant date (10 November 2017)
To serve continuously until the vesting date (9 November 2018) after the grant date (8 November 2021)
Eligible service period From 10 November 2017 to 9 November 2020 From 9 November 2018 to 8 November 2021Exercise period 10 November 2020 From 9 November 2021 to 8 November 2028Settlement Equity settlement Equity settlement
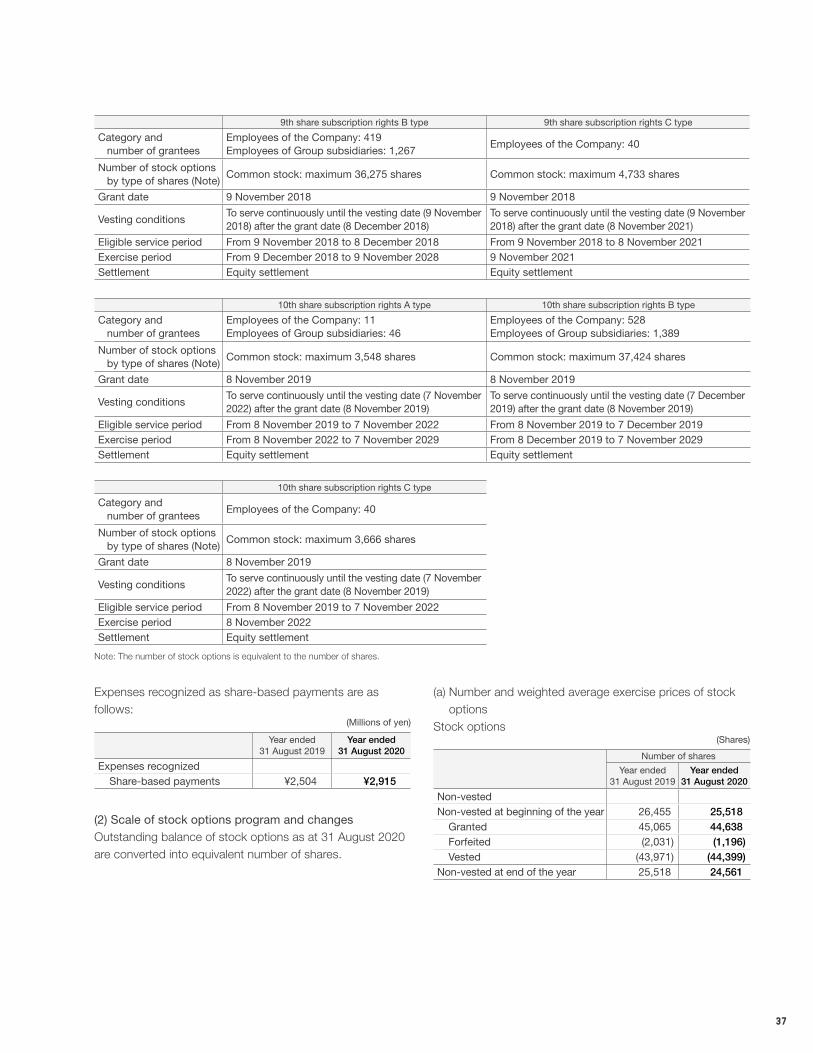
37
9th share subscription rights B type 9th share subscription rights C type
Category and number of grantees
Employees of the Company: 419Employees of Group subsidiaries: 1,267
Employees of the Company: 40
Number of stock options by type of shares (Note)
Common stock: maximum 36,275 shares Common stock: maximum 4,733 shares
Grant date 9 November 2018 9 November 2018
Vesting conditionsTo serve continuously until the vesting date (9 November 2018) after the grant date (8 December 2018)
To serve continuously until the vesting date (9 November 2018) after the grant date (8 November 2021)
Eligible service period From 9 November 2018 to 8 December 2018 From 9 November 2018 to 8 November 2021Exercise period From 9 December 2018 to 9 November 2028 9 November 2021Settlement Equity settlement Equity settlement
10th share subscription rights A type 10th share subscription rights B type
Category and number of grantees
Employees of the Company: 11Employees of Group subsidiaries: 46
Employees of the Company: 528Employees of Group subsidiaries: 1,389
Number of stock options by type of shares (Note)
Common stock: maximum 3,548 shares Common stock: maximum 37,424 shares
Grant date 8 November 2019 8 November 2019
Vesting conditionsTo serve continuously until the vesting date (7 November 2022) after the grant date (8 November 2019)
To serve continuously until the vesting date (7 December 2019) after the grant date (8 November 2019)
Eligible service period From 8 November 2019 to 7 November 2022 From 8 November 2019 to 7 December 2019Exercise period From 8 November 2022 to 7 November 2029 From 8 December 2019 to 7 November 2029Settlement Equity settlement Equity settlement
10th share subscription rights C type
Category and number of grantees
Employees of the Company: 40
Number of stock options by type of shares (Note)
Common stock: maximum 3,666 shares
Grant date 8 November 2019
Vesting conditionsTo serve continuously until the vesting date (7 November 2022) after the grant date (8 November 2019)
Eligible service period From 8 November 2019 to 7 November 2022Exercise period 8 November 2022Settlement Equity settlement
Note: The number of stock options is equivalent to the number of shares.
Expenses recognized as share-based payments are as follows:
(Millions of yen)
Year ended31 August 2019
Year ended31 August 2020
Expenses recognizedShare-based payments ¥2,504 ¥2,915
(2) Scale of stock options program and changesOutstanding balance of stock options as at 31 August 2020 are converted into equivalent number of shares.
(a) Number and weighted average exercise prices of stock options
Stock options(Shares)
Number of shares
Year ended31 August 2019
Year ended31 August 2020
Non-vestedNon-vested at beginning of the year 26,455 25,518
Granted 45,065 44,638 Forfeited (2,031) (1,196)Vested (43,971) (44,399)
Non-vested at end of the year 25,518 24,561
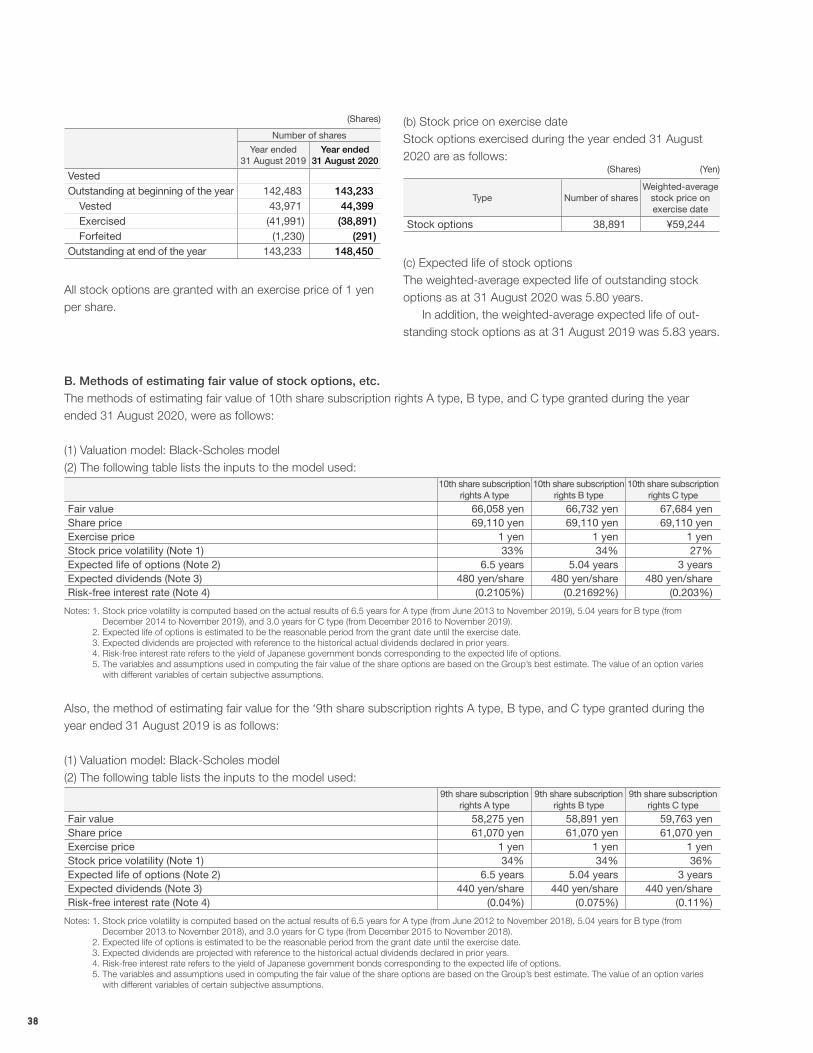
38
(Shares)
Number of shares
Year ended31 August 2019
Year ended31 August 2020
VestedOutstanding at beginning of the year 142,483 143,233
Vested 43,971 44,399 Exercised (41,991) (38,891)Forfeited (1,230) (291)
Outstanding at end of the year 143,233 148,450
All stock options are granted with an exercise price of 1 yen per share.
B. Methods of estimating fair value of stock options, etc.The methods of estimating fair value of 10th share subscription rights A type, B type, and C type granted during the year ended 31 August 2020, were as follows:
(1) Valuation model: Black-Scholes model(2) The following table lists the inputs to the model used:
10th share subscription rights A type
10th share subscription rights B type
10th share subscription rights C type
Fair value 66,058 yen 66,732 yen 67,684 yenShare price 69,110 yen 69,110 yen 69,110 yenExercise price 1 yen 1 yen 1 yenStock price volatility (Note 1) 33% 34% 27%Expected life of options (Note 2) 6.5 years 5.04 years 3 yearsExpected dividends (Note 3) 480 yen/share 480 yen/share 480 yen/shareRisk-free interest rate (Note 4) (0.2105%) (0.21692%) (0.203%)
Notes: 1. Stock price volatility is computed based on the actual results of 6.5 years for A type (from June 2013 to November 2019), 5.04 years for B type (from December 2014 to November 2019), and 3.0 years for C type (from December 2016 to November 2019).
2. Expected life of options is estimated to be the reasonable period from the grant date until the exercise date. 3. Expected dividends are projected with reference to the historical actual dividends declared in prior years. 4. Risk-free interest rate refers to the yield of Japanese government bonds corresponding to the expected life of options. 5. The variables and assumptions used in computing the fair value of the share options are based on the Group’s best estimate. The value of an option varies
with different variables of certain subjective assumptions.
Also, the method of estimating fair value for the ‘9th share subscription rights A type, B type, and C type granted during the year ended 31 August 2019 is as follows:
(1) Valuation model: Black-Scholes model(2) The following table lists the inputs to the model used:
9th share subscription rights A type
9th share subscription rights B type
9th share subscription rights C type
Fair value 58,275 yen 58,891 yen 59,763 yenShare price 61,070 yen 61,070 yen 61,070 yenExercise price 1 yen 1 yen 1 yenStock price volatility (Note 1) 34% 34% 36%Expected life of options (Note 2) 6.5 years 5.04 years 3 yearsExpected dividends (Note 3) 440 yen/share 440 yen/share 440 yen/shareRisk-free interest rate (Note 4) (0.04%) (0.075%) (0.11%)
Notes: 1. Stock price volatility is computed based on the actual results of 6.5 years for A type (from June 2012 to November 2018), 5.04 years for B type (from December 2013 to November 2018), and 3.0 years for C type (from December 2015 to November 2018).
2. Expected life of options is estimated to be the reasonable period from the grant date until the exercise date. 3. Expected dividends are projected with reference to the historical actual dividends declared in prior years. 4. Risk-free interest rate refers to the yield of Japanese government bonds corresponding to the expected life of options. 5. The variables and assumptions used in computing the fair value of the share options are based on the Group’s best estimate. The value of an option varies
with different variables of certain subjective assumptions.
(b) Stock price on exercise dateStock options exercised during the year ended 31 August 2020 are as follows:
(Shares) (Yen)
Type Number of sharesWeighted-average
stock price on exercise date
Stock options 38,891 ¥59,244
(c) Expected life of stock optionsThe weighted-average expected life of outstanding stock options as at 31 August 2020 was 5.80 years. In addition, the weighted-average expected life of out-standing stock options as at 31 August 2019 was 5.83 years.
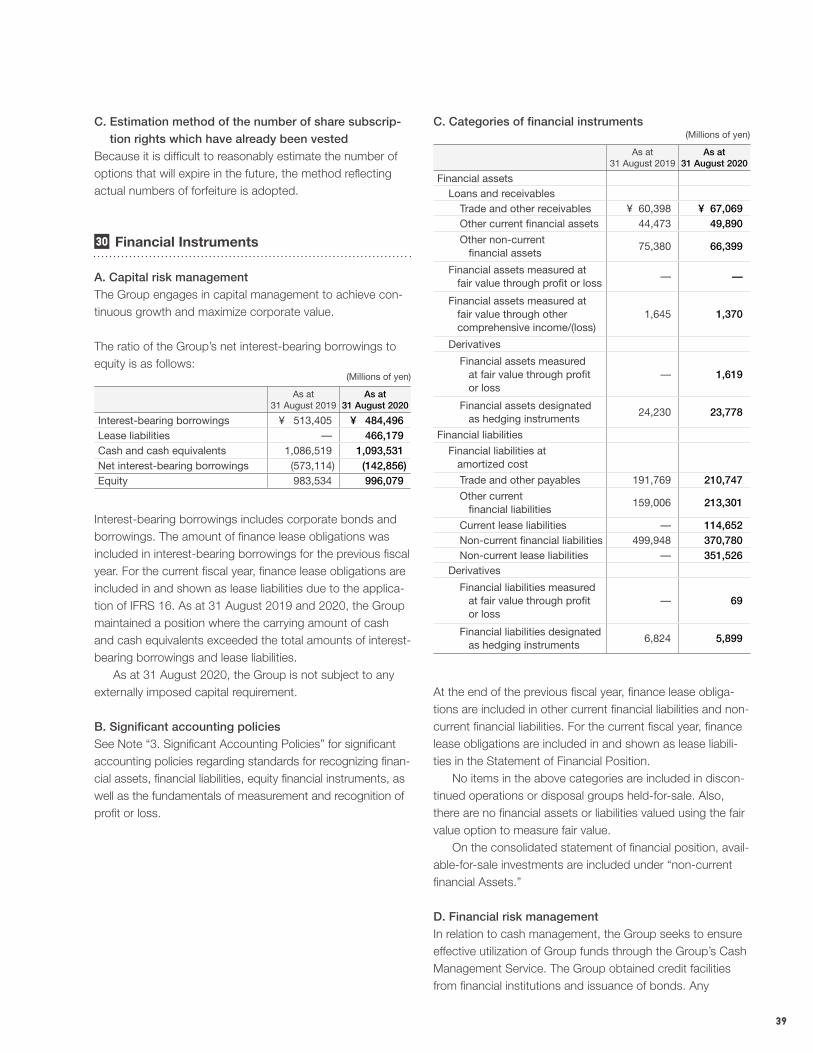
39
C. Estimation method of the number of share subscrip-tion rights which have already been vested
Because it is difficult to reasonably estimate the number of options that will expire in the future, the method reflecting actual numbers of forfeiture is adopted.
30 Financial Instruments
A. Capital risk managementThe Group engages in capital management to achieve con-tinuous growth and maximize corporate value.
The ratio of the Group’s net interest-bearing borrowings to equity is as follows:
(Millions of yen)
As at31 August 2019
As at31 August 2020
Interest-bearing borrowings ¥ 513,405 ¥ 484,496 Lease liabilities — 466,179 Cash and cash equivalents 1,086,519 1,093,531 Net interest-bearing borrowings (573,114) (142,856)Equity 983,534 996,079
Interest-bearing borrowings includes corporate bonds and borrowings. The amount of finance lease obligations was included in interest-bearing borrowings for the previous fiscal year. For the current fiscal year, finance lease obligations are included in and shown as lease liabilities due to the applica-tion of IFRS 16. As at 31 August 2019 and 2020, the Group maintained a position where the carrying amount of cash and cash equivalents exceeded the total amounts of interest-bearing borrowings and lease liabilities. As at 31 August 2020, the Group is not subject to any externally imposed capital requirement.
B. Significant accounting policiesSee Note “3. Significant Accounting Policies” for significant accounting policies regarding standards for recognizing finan-cial assets, financial liabilities, equity financial instruments, as well as the fundamentals of measurement and recognition of profit or loss.
C. Categories of financial instruments(Millions of yen)
As at31 August 2019
As at31 August 2020
Financial assetsLoans and receivables
Trade and other receivables ¥ 60,398 ¥ 67,069Other current financial assets 44,473 49,890
Other non-current financial assets
75,380 66,399
Financial assets measured at fair value through profit or loss
— —
Financial assets measured at fair value through other comprehensive income/(loss)
1,645 1,370
Derivatives
Financial assets measured at fair value through profit or loss
— 1,619
Financial assets designated as hedging instruments
24,230 23,778
Financial liabilities
Financial liabilities at amortized cost
Trade and other payables 191,769 210,747
Other current financial liabilities
159,006 213,301
Current lease liabilities — 114,652Non-current financial liabilities 499,948 370,780Non-current lease liabilities — 351,526
Derivatives
Financial liabilities measured at fair value through profit or loss
— 69
Financial liabilities designated as hedging instruments
6,824 5,899
At the end of the previous fiscal year, finance lease obliga-tions are included in other current financial liabilities and non-current financial liabilities. For the current fiscal year, finance lease obligations are included in and shown as lease liabili-ties in the Statement of Financial Position. No items in the above categories are included in discon-tinued operations or disposal groups held-for-sale. Also, there are no financial assets or liabilities valued using the fair value option to measure fair value. On the consolidated statement of financial position, avail-able-for-sale investments are included under “non-current financial Assets.”
D. Financial risk managementIn relation to cash management, the Group seeks to ensure effective utilization of Group funds through the Group’s Cash Management Service. The Group obtained credit facilities from financial institutions and issuance of bonds. Any
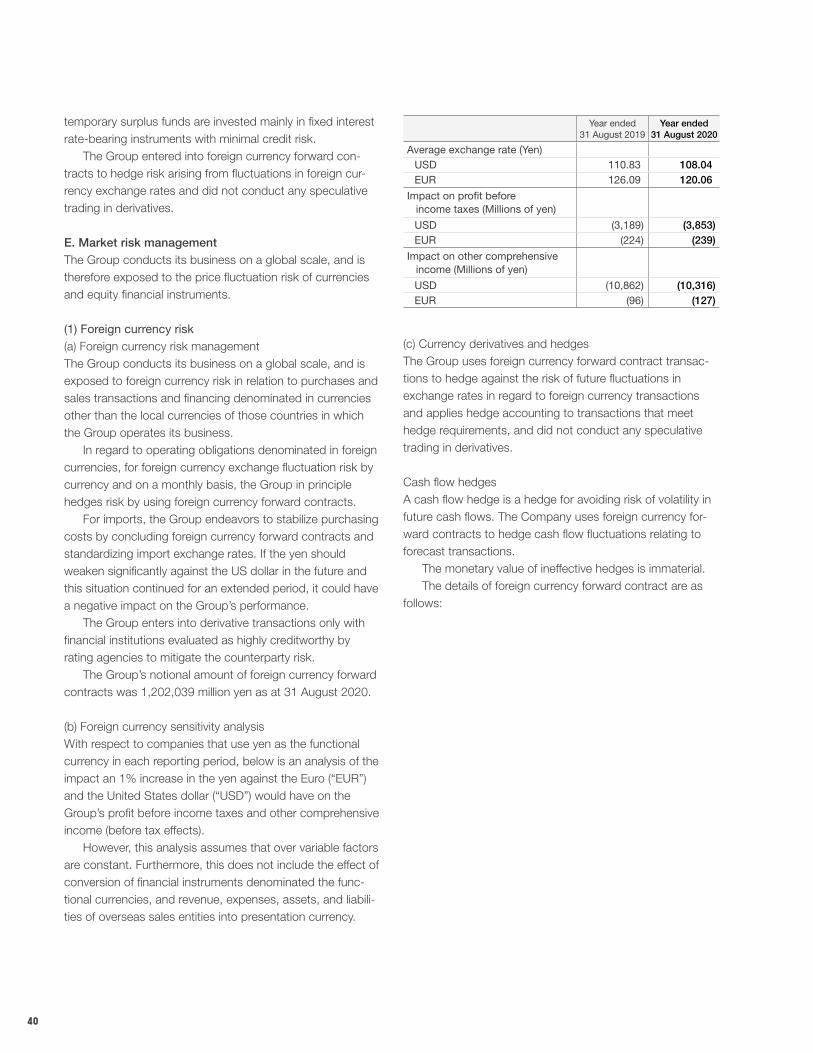
40
temporary surplus funds are invested mainly in fixed interest rate-bearing instruments with minimal credit risk. The Group entered into foreign currency forward con-tracts to hedge risk arising from fluctuations in foreign cur-rency exchange rates and did not conduct any speculative trading in derivatives.
E. Market risk managementThe Group conducts its business on a global scale, and is therefore exposed to the price fluctuation risk of currencies and equity financial instruments.
(1) Foreign currency risk(a) Foreign currency risk managementThe Group conducts its business on a global scale, and is exposed to foreign currency risk in relation to purchases and sales transactions and financing denominated in currencies other than the local currencies of those countries in which the Group operates its business. In regard to operating obligations denominated in foreign currencies, for foreign currency exchange fluctuation risk by currency and on a monthly basis, the Group in principle hedges risk by using foreign currency forward contracts. For imports, the Group endeavors to stabilize purchasing costs by concluding foreign currency forward contracts and standardizing import exchange rates. If the yen should weaken significantly against the US dollar in the future and this situation continued for an extended period, it could have a negative impact on the Group’s performance. The Group enters into derivative transactions only with financial institutions evaluated as highly creditworthy by rating agencies to mitigate the counterparty risk. The Group’s notional amount of foreign currency forward contracts was 1,202,039 million yen as at 31 August 2020.
(b) Foreign currency sensitivity analysisWith respect to companies that use yen as the functional currency in each reporting period, below is an analysis of the impact an 1% increase in the yen against the Euro (“EUR”) and the United States dollar (“USD”) would have on the Group’s profit before income taxes and other comprehensive income (before tax effects). However, this analysis assumes that over variable factors are constant. Furthermore, this does not include the effect of conversion of financial instruments denominated the func-tional currencies, and revenue, expenses, assets, and liabili-ties of overseas sales entities into presentation currency.
Year ended31 August 2019
Year ended31 August 2020
Average exchange rate (Yen)USD 110.83 108.04 EUR 126.09 120.06
Impact on profit before income taxes (Millions of yen)
USD (3,189) (3,853)EUR (224) (239)
Impact on other comprehensive income (Millions of yen)
USD (10,862) (10,316)EUR (96) (127)
(c) Currency derivatives and hedgesThe Group uses foreign currency forward contract transac-tions to hedge against the risk of future fluctuations in exchange rates in regard to foreign currency transactions and applies hedge accounting to transactions that meet hedge requirements, and did not conduct any speculative trading in derivatives.
Cash flow hedgesA cash flow hedge is a hedge for avoiding risk of volatility in future cash flows. The Company uses foreign currency for-ward contracts to hedge cash flow fluctuations relating to forecast transactions. The monetary value of ineffective hedges is immaterial. The details of foreign currency forward contract are as follows:
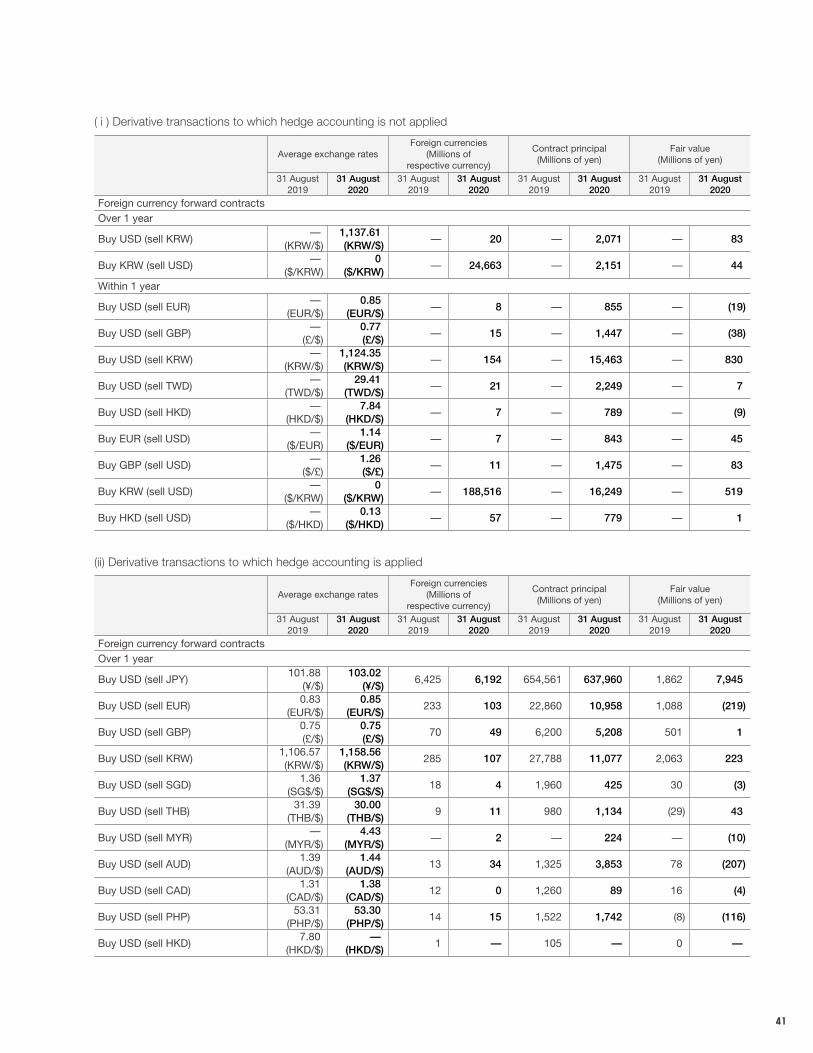
41
( i ) Derivative transactions to which hedge accounting is not applied
Average exchange ratesForeign currencies
(Millions ofrespective currency)
Contract principal(Millions of yen)
Fair value(Millions of yen)
31 August2019
31 August2020
31 August2019
31 August2020
31 August2019
31 August2020
31 August2019
31 August2020
Foreign currency forward contractsOver 1 year
Buy USD (sell KRW)—
(KRW/$)1,137.61(KRW/$)
— 20 — 2,071 — 83
Buy KRW (sell USD)—
($/KRW)0
($/KRW)— 24,663 — 2,151 — 44
Within 1 year
Buy USD (sell EUR)—
(EUR/$)0.85
(EUR/$)— 8 — 855 — (19)
Buy USD (sell GBP)—
(£/$)0.77(£/$)
— 15 — 1,447 — (38)
Buy USD (sell KRW)—
(KRW/$)1,124.35(KRW/$)
— 154 — 15,463 — 830
Buy USD (sell TWD)—
(TWD/$)29.41
(TWD/$)— 21 — 2,249 — 7
Buy USD (sell HKD)—
(HKD/$)7.84
(HKD/$)— 7 — 789 — (9)
Buy EUR (sell USD)—
($/EUR)1.14
($/EUR)— 7 — 843 — 45
Buy GBP (sell USD)—
($/£)1.26($/£)
— 11 — 1,475 — 83
Buy KRW (sell USD)—
($/KRW)0
($/KRW)— 188,516 — 16,249 — 519
Buy HKD (sell USD)—
($/HKD)0.13
($/HKD)— 57 — 779 — 1
(ii) Derivative transactions to which hedge accounting is applied
Average exchange ratesForeign currencies
(Millions ofrespective currency)
Contract principal(Millions of yen)
Fair value(Millions of yen)
31 August2019
31 August2020
31 August2019
31 August2020
31 August2019
31 August2020
31 August2019
31 August2020
Foreign currency forward contractsOver 1 year
Buy USD (sell JPY)101.88
(¥/$)103.02
(¥/$)6,425 6,192 654,561 637,960 1,862 7,945
Buy USD (sell EUR)0.83
(EUR/$)0.85
(EUR/$)233 103 22,860 10,958 1,088 (219)
Buy USD (sell GBP)0.75(£/$)
0.75(£/$)
70 49 6,200 5,208 501 1
Buy USD (sell KRW)1,106.57(KRW/$)
1,158.56(KRW/$)
285 107 27,788 11,077 2,063 223
Buy USD (sell SGD)1.36
(SG$/$)1.37
(SG$/$)18 4 1,960 425 30 (3)
Buy USD (sell THB)31.39
(THB/$)30.00
(THB/$)9 11 980 1,134 (29) 43
Buy USD (sell MYR)—
(MYR/$)4.43
(MYR/$)— 2 — 224 — (10)
Buy USD (sell AUD)1.39
(AUD/$)1.44
(AUD/$)13 34 1,325 3,853 78 (207)
Buy USD (sell CAD)1.31
(CAD/$)1.38
(CAD/$)12 0 1,260 89 16 (4)
Buy USD (sell PHP)53.31
(PHP/$)53.30
(PHP/$)14 15 1,522 1,742 (8) (116)
Buy USD (sell HKD)7.80
(HKD/$)—
(HKD/$)1 — 105 — 0 —
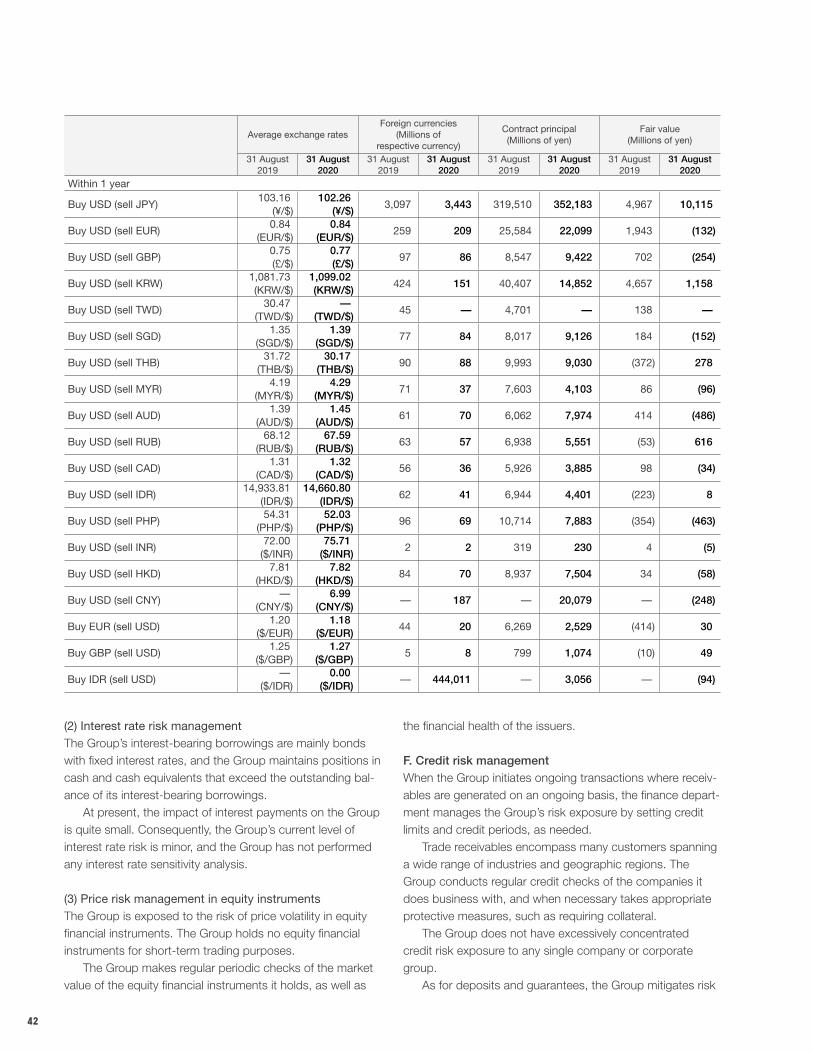
42
(2) Interest rate risk managementThe Group’s interest-bearing borrowings are mainly bonds with fixed interest rates, and the Group maintains positions in cash and cash equivalents that exceed the outstanding bal-ance of its interest-bearing borrowings. At present, the impact of interest payments on the Group is quite small. Consequently, the Group’s current level of interest rate risk is minor, and the Group has not performed any interest rate sensitivity analysis.
(3) Price risk management in equity instrumentsThe Group is exposed to the risk of price volatility in equity financial instruments. The Group holds no equity financial instruments for short-term trading purposes. The Group makes regular periodic checks of the market value of the equity financial instruments it holds, as well as
Average exchange ratesForeign currencies
(Millions ofrespective currency)
Contract principal(Millions of yen)
Fair value(Millions of yen)
31 August2019
31 August2020
31 August2019
31 August2020
31 August2019
31 August2020
31 August2019
31 August2020
Within 1 year
Buy USD (sell JPY)103.16
(¥/$)102.26
(¥/$)3,097 3,443 319,510 352,183 4,967 10,115
Buy USD (sell EUR)0.84
(EUR/$)0.84
(EUR/$)259 209 25,584 22,099 1,943 (132)
Buy USD (sell GBP)0.75(£/$)
0.77(£/$)
97 86 8,547 9,422 702 (254)
Buy USD (sell KRW)1,081.73(KRW/$)
1,099.02(KRW/$)
424 151 40,407 14,852 4,657 1,158
Buy USD (sell TWD)30.47
(TWD/$)—
(TWD/$)45 — 4,701 — 138 —
Buy USD (sell SGD)1.35
(SGD/$)1.39
(SGD/$)77 84 8,017 9,126 184 (152)
Buy USD (sell THB)31.72
(THB/$)30.17
(THB/$)90 88 9,993 9,030 (372) 278
Buy USD (sell MYR)4.19
(MYR/$)4.29
(MYR/$)71 37 7,603 4,103 86 (96)
Buy USD (sell AUD)1.39
(AUD/$)1.45
(AUD/$)61 70 6,062 7,974 414 (486)
Buy USD (sell RUB)68.12
(RUB/$)67.59
(RUB/$)63 57 6,938 5,551 (53) 616
Buy USD (sell CAD)1.31
(CAD/$)1.32
(CAD/$)56 36 5,926 3,885 98 (34)
Buy USD (sell IDR)14,933.81
(IDR/$)14,660.80
(IDR/$)62 41 6,944 4,401 (223) 8
Buy USD (sell PHP)54.31
(PHP/$)52.03
(PHP/$)96 69 10,714 7,883 (354) (463)
Buy USD (sell INR)72.00
($/INR)75.71
($/INR)2 2 319 230 4 (5)
Buy USD (sell HKD)7.81
(HKD/$)7.82
(HKD/$)84 70 8,937 7,504 34 (58)
Buy USD (sell CNY)—
(CNY/$)6.99
(CNY/$)— 187 — 20,079 — (248)
Buy EUR (sell USD)1.20
($/EUR)1.18
($/EUR)44 20 6,269 2,529 (414) 30
Buy GBP (sell USD)1.25
($/GBP)1.27
($/GBP)5 8 799 1,074 (10) 49
Buy IDR (sell USD)—
($/IDR)0.00
($/IDR)— 444,011 — 3,056 — (94)
the financial health of the issuers.
F. Credit risk managementWhen the Group initiates ongoing transactions where receiv-ables are generated on an ongoing basis, the finance depart-ment manages the Group’s risk exposure by setting credit limits and credit periods, as needed. Trade receivables encompass many customers spanning a wide range of industries and geographic regions. The Group conducts regular credit checks of the companies it does business with, and when necessary takes appropriate protective measures, such as requiring collateral. The Group does not have excessively concentrated credit risk exposure to any single company or corporate group. As for deposits and guarantees, the Group mitigates risk
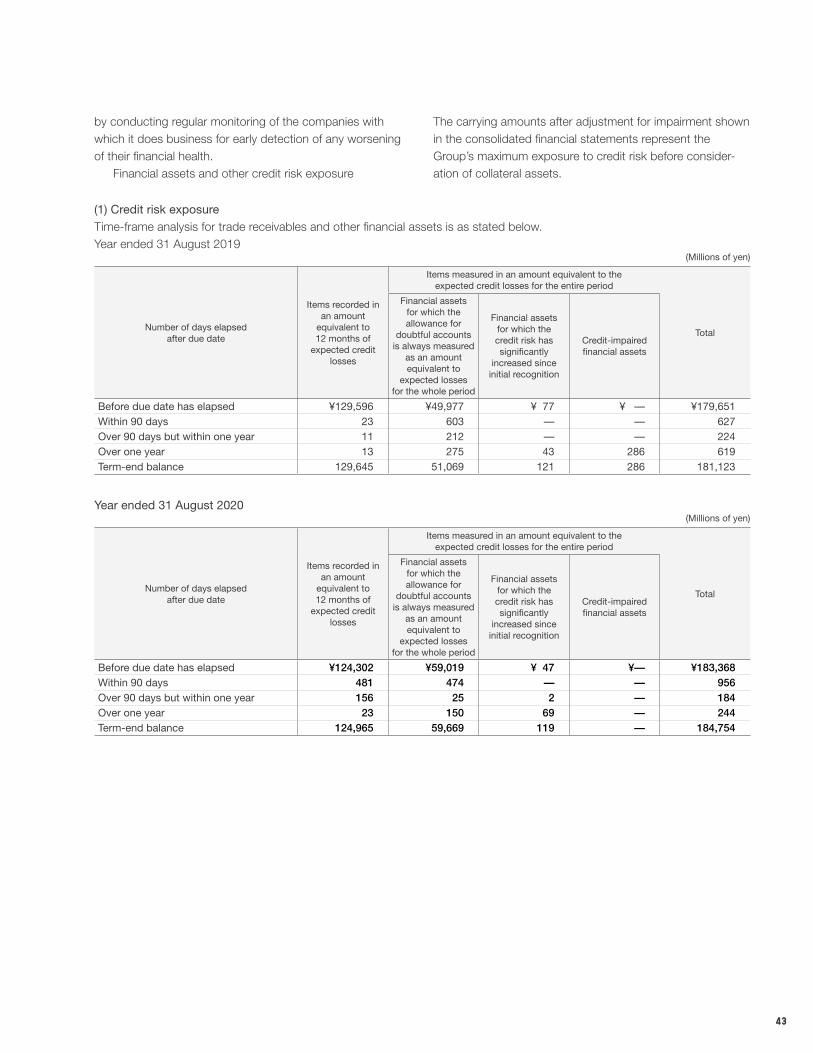
43
(1) Credit risk exposureTime-frame analysis for trade receivables and other financial assets is as stated below.Year ended 31 August 2019
(Millions of yen)
Number of days elapsedafter due date
Items recorded in an amount
equivalent to 12 months of
expected credit losses
Items measured in an amount equivalent to the expected credit losses for the entire period
Total
Financial assets for which the allowance for
doubtful accounts is always measured
as an amount equivalent to
expected losses for the whole period
Financial assetsfor which thecredit risk hassignificantly
increased sinceinitial recognition
Credit-impairedfinancial assets
Before due date has elapsed ¥129,596 ¥49,977 ¥ 77 ¥ — ¥179,651Within 90 days 23 603 — — 627Over 90 days but within one year 11 212 — — 224Over one year 13 275 43 286 619Term-end balance 129,645 51,069 121 286 181,123
Year ended 31 August 2020(Millions of yen)
Number of days elapsedafter due date
Items recorded in an amount
equivalent to 12 months of
expected credit losses
Items measured in an amount equivalent to the expected credit losses for the entire period
Total
Financial assets for which the allowance for
doubtful accounts is always measured
as an amount equivalent to
expected losses for the whole period
Financial assetsfor which thecredit risk hassignificantly
increased sinceinitial recognition
Credit-impairedfinancial assets
Before due date has elapsed ¥124,302 ¥59,019 ¥ 47 ¥— ¥183,368Within 90 days 481 474 — — 956Over 90 days but within one year 156 25 2 — 184Over one year 23 150 69 — 244Term-end balance 124,965 59,669 119 — 184,754
by conducting regular monitoring of the companies with which it does business for early detection of any worsening of their financial health. Financial assets and other credit risk exposure
The carrying amounts after adjustment for impairment shown in the consolidated financial statements represent the Group’s maximum exposure to credit risk before consider-ation of collateral assets.
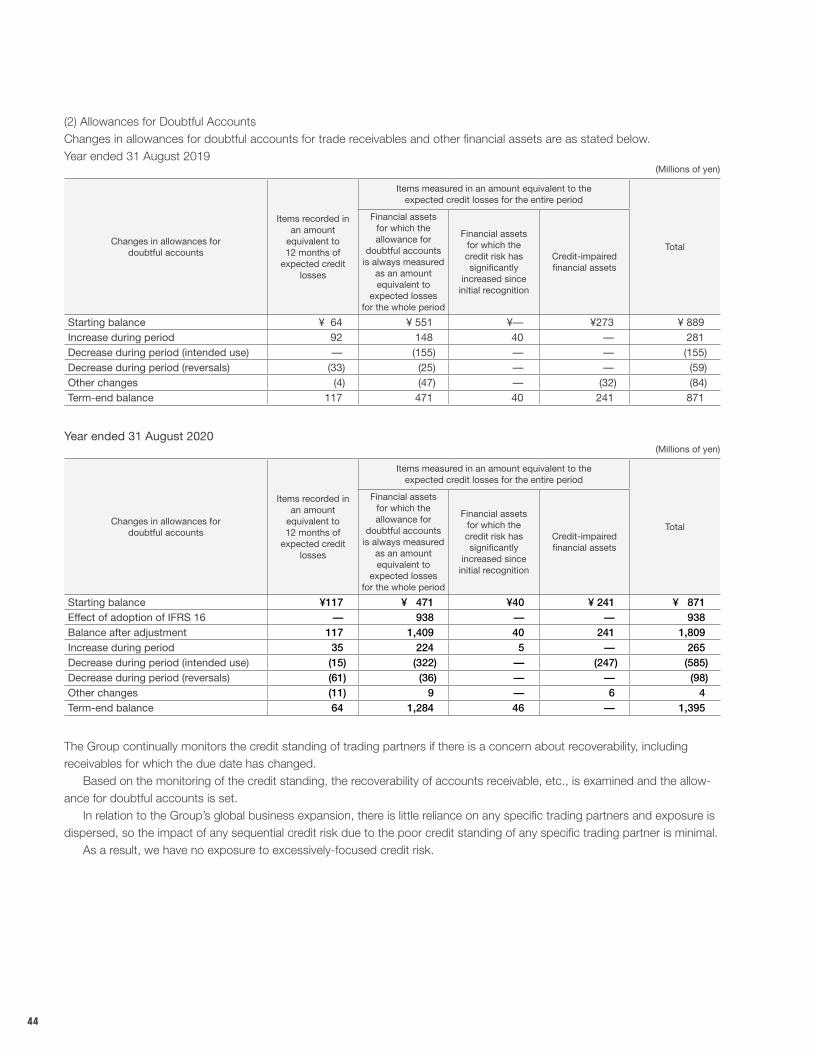
44
(2) Allowances for Doubtful AccountsChanges in allowances for doubtful accounts for trade receivables and other financial assets are as stated below.Year ended 31 August 2019
(Millions of yen)
Changes in allowances fordoubtful accounts
Items recorded in an amount
equivalent to12 months of
expected credit losses
Items measured in an amount equivalent to theexpected credit losses for the entire period
Total
Financial assets for which the allowance for
doubtful accounts is always measured
as an amount equivalent to
expected losses for the whole period
Financial assetsfor which thecredit risk hassignificantly
increased sinceinitial recognition
Credit-impairedfinancial assets
Starting balance ¥ 64 ¥ 551 ¥— ¥273 ¥ 889 Increase during period 92 148 40 — 281 Decrease during period (intended use) — (155) — — (155)Decrease during period (reversals) (33) (25) — — (59)Other changes (4) (47) — (32) (84)Term-end balance 117 471 40 241 871
Year ended 31 August 2020(Millions of yen)
Changes in allowances fordoubtful accounts
Items recorded in an amount
equivalent to12 months of
expected credit losses
Items measured in an amount equivalent to theexpected credit losses for the entire period
Total
Financial assets for which the allowance for
doubtful accounts is always measured
as an amount equivalent to
expected losses for the whole period
Financial assetsfor which thecredit risk hassignificantly
increased sinceinitial recognition
Credit-impairedfinancial assets
Starting balance ¥117 ¥ 471 ¥40 ¥ 241 ¥ 871 Effect of adoption of IFRS 16 — 938 — — 938 Balance after adjustment 117 1,409 40 241 1,809 Increase during period 35 224 5 — 265 Decrease during period (intended use) (15) (322) — (247) (585)Decrease during period (reversals) (61) (36) — — (98)Other changes (11) 9 — 6 4 Term-end balance 64 1,284 46 — 1,395
The Group continually monitors the credit standing of trading partners if there is a concern about recoverability, including receivables for which the due date has changed. Based on the monitoring of the credit standing, the recoverability of accounts receivable, etc., is examined and the allow-ance for doubtful accounts is set. In relation to the Group’s global business expansion, there is little reliance on any specific trading partners and exposure is dispersed, so the impact of any sequential credit risk due to the poor credit standing of any specific trading partner is minimal. As a result, we have no exposure to excessively-focused credit risk.
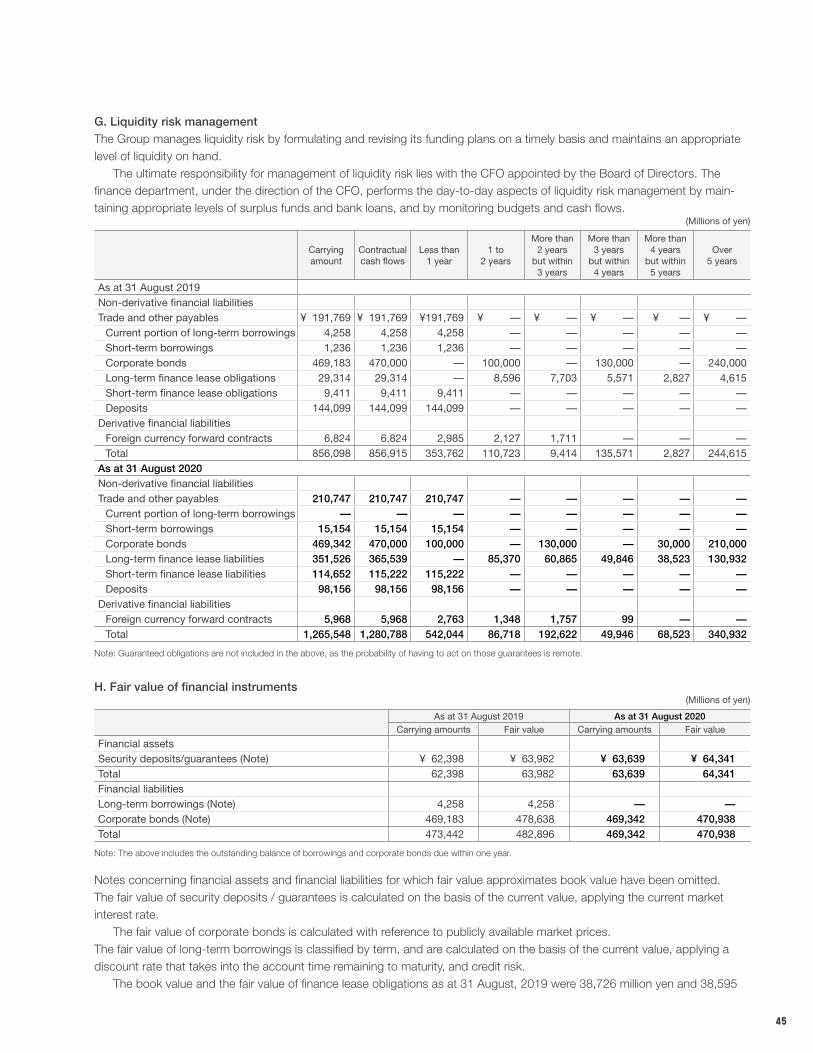
45
G. Liquidity risk managementThe Group manages liquidity risk by formulating and revising its funding plans on a timely basis and maintains an appropriate level of liquidity on hand. The ultimate responsibility for management of liquidity risk lies with the CFO appointed by the Board of Directors. The finance department, under the direction of the CFO, performs the day-to-day aspects of liquidity risk management by main-taining appropriate levels of surplus funds and bank loans, and by monitoring budgets and cash flows.
(Millions of yen)
Carrying amount
Contractual cash flows
Less than 1 year
1 to 2 years
More than2 years
but within3 years
More than3 years
but within4 years
More than4 years
but within5 years
Over5 years
As at 31 August 2019Non-derivative financial liabilitiesTrade and other payables ¥ 191,769 ¥ 191,769 ¥191,769 ¥ — ¥ — ¥ — ¥ — ¥ —
Current portion of long-term borrowings 4,258 4,258 4,258 — — — — —Short-term borrowings 1,236 1,236 1,236 — — — — —Corporate bonds 469,183 470,000 — 100,000 — 130,000 — 240,000Long-term finance lease obligations 29,314 29,314 — 8,596 7,703 5,571 2,827 4,615Short-term finance lease obligations 9,411 9,411 9,411 — — — — —Deposits 144,099 144,099 144,099 — — — — —
Derivative financial liabilitiesForeign currency forward contracts 6,824 6,824 2,985 2,127 1,711 — — —Total 856,098 856,915 353,762 110,723 9,414 135,571 2,827 244,615
As at 31 August 2020Non-derivative financial liabilitiesTrade and other payables 210,747 210,747 210,747 — — — — —
Current portion of long-term borrowings — — — — — — — —Short-term borrowings 15,154 15,154 15,154 — — — — —Corporate bonds 469,342 470,000 100,000 — 130,000 — 30,000 210,000Long-term finance lease liabilities 351,526 365,539 — 85,370 60,865 49,846 38,523 130,932Short-term finance lease liabilities 114,652 115,222 115,222 — — — — —Deposits 98,156 98,156 98,156 — — — — —
Derivative financial liabilitiesForeign currency forward contracts 5,968 5,968 2,763 1,348 1,757 99 — —Total 1,265,548 1,280,788 542,044 86,718 192,622 49,946 68,523 340,932
Note: Guaranteed obligations are not included in the above, as the probability of having to act on those guarantees is remote.
H. Fair value of financial instruments(Millions of yen)
As at 31 August 2019 As at 31 August 2020Carrying amounts Fair value Carrying amounts Fair value
Financial assetsSecurity deposits/guarantees (Note) ¥ 62,398 ¥ 63,982 ¥ 63,639 ¥ 64,341Total 62,398 63,982 63,639 64,341Financial liabilitiesLong-term borrowings (Note) 4,258 4,258 — —Corporate bonds (Note) 469,183 478,638 469,342 470,938Total 473,442 482,896 469,342 470,938
Note: The above includes the outstanding balance of borrowings and corporate bonds due within one year.
Notes concerning financial assets and financial liabilities for which fair value approximates book value have been omitted.The fair value of security deposits / guarantees is calculated on the basis of the current value, applying the current market interest rate. The fair value of corporate bonds is calculated with reference to publicly available market prices.The fair value of long-term borrowings is classified by term, and are calculated on the basis of the current value, applying a discount rate that takes into the account time remaining to maturity, and credit risk. The book value and the fair value of finance lease obligations as at 31 August, 2019 were 38,726 million yen and 38,595
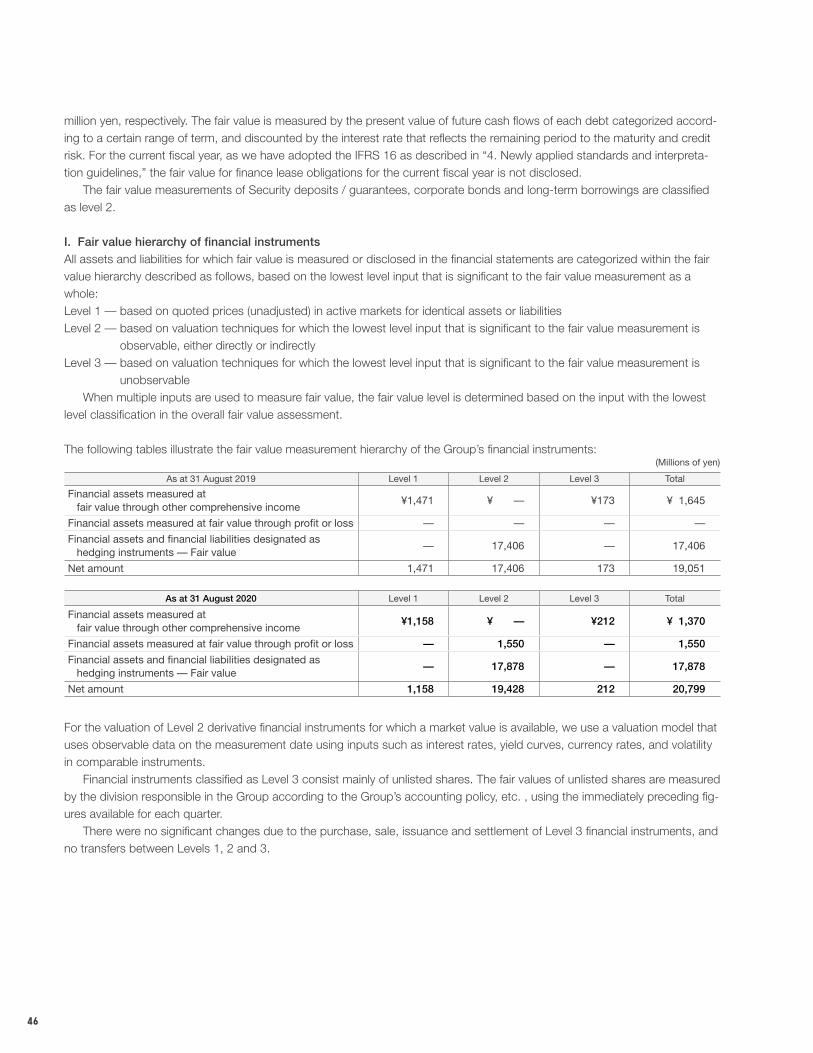
46
million yen, respectively. The fair value is measured by the present value of future cash flows of each debt categorized accord-ing to a certain range of term, and discounted by the interest rate that reflects the remaining period to the maturity and credit risk. For the current fiscal year, as we have adopted the IFRS 16 as described in “4. Newly applied standards and interpreta-tion guidelines,” the fair value for finance lease obligations for the current fiscal year is not disclosed. The fair value measurements of Security deposits / guarantees, corporate bonds and long-term borrowings are classified as level 2.
I. Fair value hierarchy of financial instrumentsAll assets and liabilities for which fair value is measured or disclosed in the financial statements are categorized within the fair value hierarchy described as follows, based on the lowest level input that is significant to the fair value measurement as a whole:Level 1 — based on quoted prices (unadjusted) in active markets for identical assets or liabilitiesLevel 2 — based on valuation techniques for which the lowest level input that is significant to the fair value measurement is
observable, either directly or indirectlyLevel 3 — based on valuation techniques for which the lowest level input that is significant to the fair value measurement is
unobservable When multiple inputs are used to measure fair value, the fair value level is determined based on the input with the lowest level classification in the overall fair value assessment.
The following tables illustrate the fair value measurement hierarchy of the Group’s financial instruments:(Millions of yen)
As at 31 August 2019 Level 1 Level 2 Level 3 Total
Financial assets measured at fair value through other comprehensive income
¥1,471 ¥ — ¥173 ¥ 1,645
Financial assets measured at fair value through profit or loss — — — —
Financial assets and financial liabilities designated as hedging instruments — Fair value
— 17,406 — 17,406
Net amount 1,471 17,406 173 19,051
As at 31 August 2020 Level 1 Level 2 Level 3 Total
Financial assets measured at fair value through other comprehensive income
¥1,158 ¥ — ¥212 ¥ 1,370
Financial assets measured at fair value through profit or loss — 1,550 — 1,550
Financial assets and financial liabilities designated as hedging instruments — Fair value
— 17,878 — 17,878
Net amount 1,158 19,428 212 20,799
For the valuation of Level 2 derivative financial instruments for which a market value is available, we use a valuation model that uses observable data on the measurement date using inputs such as interest rates, yield curves, currency rates, and volatility in comparable instruments. Financial instruments classified as Level 3 consist mainly of unlisted shares. The fair values of unlisted shares are measured by the division responsible in the Group according to the Group’s accounting policy, etc. , using the immediately preceding fig-ures available for each quarter. There were no significant changes due to the purchase, sale, issuance and settlement of Level 3 financial instruments, and no transfers between Levels 1, 2 and 3.
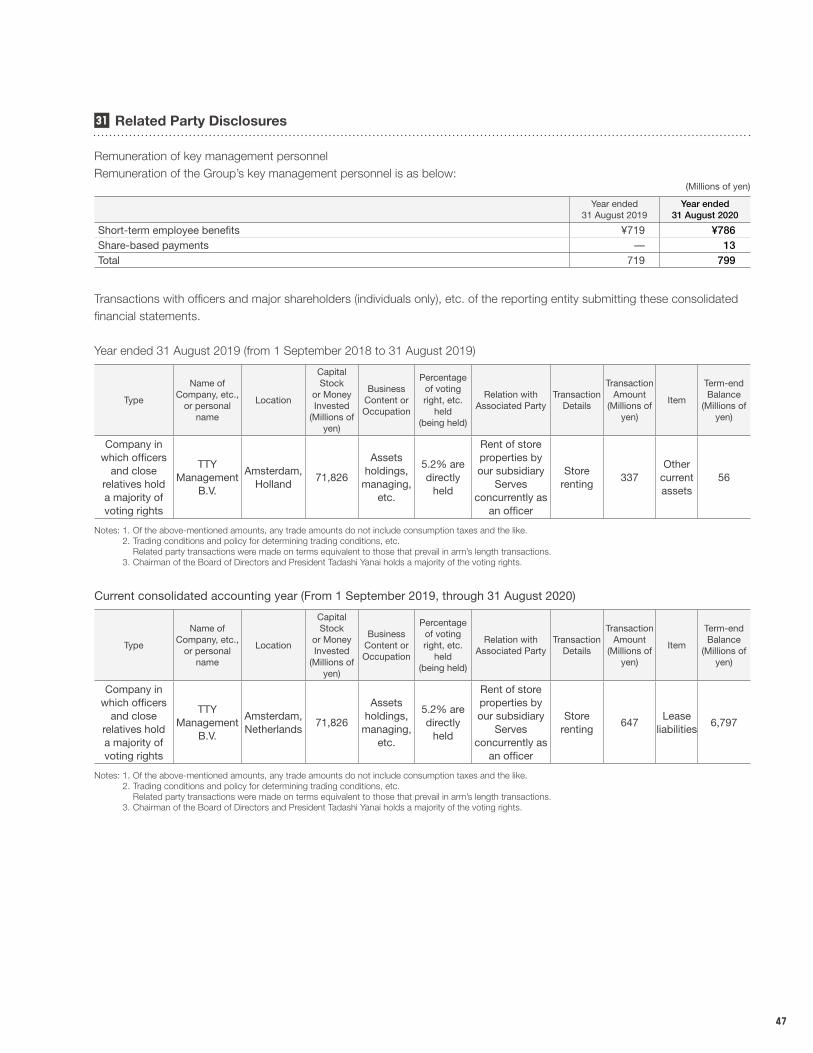
47
31 Related Party Disclosures
Remuneration of key management personnelRemuneration of the Group’s key management personnel is as below:
(Millions of yen)
Year ended31 August 2019
Year ended31 August 2020
Short-term employee benefits ¥719 ¥786Share-based payments — 13Total 719 799
Transactions with officers and major shareholders (individuals only), etc. of the reporting entity submitting these consolidated financial statements.
Year ended 31 August 2019 (from 1 September 2018 to 31 August 2019)
Type
Name of Company, etc.,
or personal name
Location
Capital Stock
or Money Invested
(Millions of yen)
Business Content or Occupation
Percentage of voting right, etc.
held (being held)
Relation with Associated Party
Transaction Details
Transaction Amount
(Millions of yen)
Item
Term-end Balance
(Millions of yen)
Company in which officers
and close relatives hold a majority of voting rights
TTY Management
B.V.
Amsterdam, Holland
71,826
Assets holdings,
managing, etc.
5.2% are directly
held
Rent of store properties by our subsidiary
Serves concurrently as
an officer
Store renting
337Other
current assets
56
Notes: 1. Of the above-mentioned amounts, any trade amounts do not include consumption taxes and the like. 2. Trading conditions and policy for determining trading conditions, etc. Related party transactions were made on terms equivalent to those that prevail in arm’s length transactions. 3. Chairman of the Board of Directors and President Tadashi Yanai holds a majority of the voting rights.
Current consolidated accounting year (From 1 September 2019, through 31 August 2020)
Type
Name of Company, etc.,
or personal name
Location
Capital Stock
or Money Invested
(Millions of yen)
Business Content or Occupation
Percentage of voting right, etc.
held (being held)
Relation with Associated Party
Transaction Details
Transaction Amount
(Millions of yen)
Item
Term-end Balance
(Millions of yen)
Company in which officers
and close relatives hold a majority of voting rights
TTY Management
B.V.
Amsterdam,Netherlands
71,826
Assetsholdings,
managing,etc.
5.2% aredirectly
held
Rent of store properties by our subsidiary
Serves concurrently as
an officer
Store renting
647Lease
liabilities6,797
Notes: 1. Of the above-mentioned amounts, any trade amounts do not include consumption taxes and the like. 2. Trading conditions and policy for determining trading conditions, etc. Related party transactions were made on terms equivalent to those that prevail in arm’s length transactions. 3. Chairman of the Board of Directors and President Tadashi Yanai holds a majority of the voting rights.
48
32 Major Subsidiaries
The Group’s major subsidiaries are as listed in “3. Corporate Profile 3. Subsidiaries and Associates.”
33 Commitments
The Group had the following commitments at each reporting date:
(Millions of yen)
As at31 August 2019
As at31 August 2020
Commitment for the acquisition of property, plant and equipment
¥ 7,382 ¥24,942
Commitment for acquisition of intangible assets
4,340 2,139
Total 11,723 27,081
34 Contingent Liabilities
Year ended 31 August 2019 Not applicable
Year ended 31 August 2020 Not applicable
35 Subsequent Events
Not applicable
OtherQuarterly information for the year ended 31 August 2020
(Cumulative period) First quarter Second quarter Third quarter Fiscal year
Revenue (Millions of yen) ¥623,484 ¥1,208,512 ¥1,544,924 ¥2,008,846
Quarterly income before income taxes and non-controlling interests (Millions of yen)
102,015 150,859 142,420 152,868
Quarterly net income (Millions of yen) 70,907 100,459 90,640 90,357Earnings per share (Yen) 694.73 984.21 887.96 885.15
(Accounting period) First quarter Second quarter Third quarter Fourth quarter
Quarterly earnings / (losses) per share (Yen) 694.73 289.51 (96.18) (2.77)
49
INDEPENDENT AUDITORS’ REPORT
50
51
52
53
54

Midtown Tower, 9-7-1 Akasaka, Minato-ku, Tokyo 107-6231, JapanTelephone: +81-3-6862-9983 Facsimile: +81-3-6865-0076
www. fa s t re t a i l i n g . c om FAST RETAILING CO., LTD.