consolidated financial statements - cepsa
TRANSCRIPT
2020CONSOLIDATED FINANCIAL STATEMENTS

2020COMPAÑÍA ESPAÑOLA DE PETRÓLEOS, S.A.
AND SUBSIDIARIES (CONSOLIDATED GROUP)
CONSOLIDATED FINANCIAL STATEMENTS

CONTENTSREPORT OF THE AUDITORS ON THE CONSOLIDATED FINANCIAL STATEMENTS
CONSOLIDATED BALANCE SHEET
CONSOLIDATED INCOME STATEMENT
CONSOLIDATED STATEMENT OF COMPREHENSIVE INCOME
STATEMENT OF SHAREHOLDER’S EQUITY
STATEMENT OF CASH FLOWS
NOTES TO THE CONSOLIDATED FINANCIAL STATEMENTS
04
12
14
16
17
18
20

Audit Report on Consolidated Financial Statementsissued by an Independent Auditor
COMPAÑÍA ESPAÑOLA DE PETRÓLEOS, S.A. AND SUBSIDIARIESConsolidated Financial Statements andConsolidated Management Reportfor the year endedDecember 31, 2020
Domicilio Social: C/ Raimundo Fernández Villaverde, 65. 28003 Madrid - Inscrita en el Registro Mercantil de Madrid, tomo 9.364 general, 8.130 de la sección 3ª del Libro de Sociedades, folio 68, hoja nº 87.690-1,inscripción 1ª. Madrid 9 de Marzo de 1.989. A member firm of Ernst & Young Global Limited.
Ernst & Young, S.L.Calle de Raimundo Fernández Villaverde, 6528003 Madrid
Tel: 902 365 456Fax: 915 727 238ey.com
AUDIT REPORT ON CONSOLIDATED FINANCIAL STATEMENTS ISSUED BY AN INDEPENDENTAUDITOR
Translation of a report and financial statements originally issued in Spanish. In the event of discrepancy, theSpanish-language version prevails
To the shareholders of Compañía Española de Petróleos, S.A.:
Opinion
We have audited the consolidated financial statements of Compañía Española de Petróleos, S.A. (theparent company) and its subsidiaries (the Group), which comprise the consolidated balance sheet atDecember 31, 2020, the consolidated income statement , the consolidated statement ofcomprehensive income, the consolidated statement of changes in equity, the consolidated statementof cash flows, and the notes thereto for the year then ended.
In our opinion, the accompanying consolidated financial statements give a true and fair view, in allmaterial respects, of the consolidated equity and the consolidated financial posit ion of the Group atDecember 31, 2020 and of its f inancial performance and its consolidated cash flows for the year thenended in accordance with Internat ional Financial Report ing Standards, as adopted by the EuropeanUnion (IFRS-EU), and other provisions in the regulatory framework applicable in Spain.
Basis for opinion
We conducted our audit in accordance with prevailing audit regulat ions in Spain. Our responsibilit iesunder those standards are further described in the Auditor’s responsibilities for the audit of theconsolidated financial statements sect ion of our report.
We are independent of the Group in accordance with the ethical requirements, including those relatedto independence, that are relevant to our audit of the consolidated financial statements in Spain asrequired by prevailing audit regulations. In this regard, we have not provided non-audit services norhave any situat ions or circumstances arisen that might have compromised our mandatoryindependence in a manner prohibited by the aforementioned requirements.
We believe that the audit evidence we have obtained is sufficient and appropriate to provide a basisfor our opinion.
A member firm of Ernst & Young Global Limited
2
More relevant audit issues
Most relevant audit issues are those matters that, in our professional judgment , were the mostsignificant assessed risks of material misstatements in our audit of the consolidated f inancialstatements of the current period. These risks were addressed in the context of our audit of theconsolidated financial statements as a whole, and in forming our audit opinion thereon, and we donot provide a separate opinion on these risks.
Impairment assessment of explorat ion and product ion assets
Descript ion The Group owns interests in certain explorat ion and product ion assets, mainly inAlgeria, South America and Abu Dhabi. At least once a year, management performsan impairment test on these assets (which are classified as intangible assets,property, plant and equipment , and investments in associates and joint ventures).This assessment of the recoverability of the aforementioned assets requiresmanagement to make assumptions in order to prepare the underlying cash flowprojections.
The assumptions include forecasts of oil prices, costs, discount rates, est imation ofoil and gas reserves and of overall market and economic condit ions. Refer to Note 14of the consolidated financial statements for details on impairment assessment ofexplorat ion and product ion assets.
We have determined these estimates and valuat ions to be a relevant audit mattersince changes in the hypotheses could have a material impact on the Group´ sconsolidated financial statements.
Our response Among others, we have performed the following procedures:
X We understood the process adopted by the Group for assessing therecoverability of such assets and reviewed the design and operat ingeffectiveness of its key controls.
X We reviewed, in collaborat ion with our valuation specialists, the reasonablenessof the methodology used by management to prepare the discounted cash flowscalculat ions.
X �For price assumptions, we corroborated future commodity prices to externalforecasts; we also verified prices were used consistent ly across CEPSA and thatpricing different ials were reasonable and appropriate.
X We engaged our internal valuation specialists to test the reasonableness of thediscount rates used for the impairment test ing.
X Regarding cash flow inputs, we:
X Confirmed that the key inputs (income, operat ing expenditures profiles,working capital and capital costs) could be supported by the approvedbudget and that their reasonability was based on current assets condit ionsand their projections of potent ial changes.
X �Verified that the assumptions development by the management toest imate the recoverable amount of these assets are consistent with theassumptions used for the est imation of the oil and gas reserves.
X We also verified the mathematical integrity of the impairment models andperformed a sensit ivity analysis and other addit ional procedures to assess thecompleteness of the impairment tests.
A member firm of Ernst & Young Global Limited
3
X We verified the disclosures included in the accompanying consolidated financialstatements in accordance with accounting standards.
The est imat ion of oil and gas reserves
Descript ion The est imation of oil and gas reserves and resources has a significant impact on theconsolidated financial statements, part icularly in impairment test ing and indepreciat ion and amort izat ion (‘DD&A’) charges (as described in Notes 4.4 and 14 tothe consolidated financial statements). This est imation is a significant area ofjudgment due to the technical uncertainty in assessing quantit ies and to the complexcontractual arrangements in place establishing the group’s share of reportablevolumes.
Our response Among others, we have performed the following procedures:
X We understood the process adopted by the Group to estimate the oil and gasreserves and reviewed the design and operat ing effect iveness of the keycontrols.
X �We assessed the competence of the group’s internal experts to sat isfy ourselvesthat they were appropriately qualified to carry out the volumes est imation.
X We reviewed the reasonability of the main changes in reserves with regard tothe last year and reconciliated actual production with expected product ion.
X �We analysed the key field development assumptions, such as product ionsprofiles, investments, operat ing costs and costs for decommissioning, as well asthese assumptions support ing the est imations of the oil and gas reserves.
X �We validated the consistency of the estimated reserves volume with thevolumes used for the impairment test analysis and for the depreciationcalculat ion.
X In relation to the verif icat ion of the audit reports on reserves prepared byindependent external expert specialized in the oil and gas industry, we assessedthe findings and conclusions reached by the independent expert and theircompetency, capability and objectivity for making the reserve estimates.Likewise, we reviewed the report issued by the external expert, reconciling thedata with the reserves used by CEPSA Group for the purposes of thedepreciat ion and recoverability of the assets.
Recoverabilit y of deferred tax assets
Descript ion At December 31, 2020 the deferred tax assets amounts to EUR 894 million, whichincludes the available tax loss carryforwards and deduct ions amounting to EUR 274million and the related to losses incurred by “Coastal” Group subsidiaries of EUR 276million (as described in Note 27 to the consolidated f inancial statements).
When assessing whether the amount recognised in the consolidated financialstatements for these assets is recoverable, Group management considers, asmentioned in Note 27, future tax profits forecast using methodology defined toanalyse the recovery of its assets, the evaluat ion of the est imates results of the taxgroup in accordance with the tax plan and the limit established by the applicable taxlegislation.
A member firm of Ernst & Young Global Limited
4
In addit ion, as disclosed in Note 27 to the consolidated financial statements, theGroup has deferred tax assets related to losses incurred by “Coastal” Groupsubsidiaries of EUR 276 million at December 31, 2020. The recoverabilityassessment is based on the liquidat ion of these companies and on management’sconclusion that it is probable that there will be sufficient future taxable profits againstwhich to offset these deferred tax assets.
We have determined this est imate and valuat ion to be a relevant audit matter sincechanges in the hypotheses could have a material impact on the Group’s consolidatedfinancial statements.
Our response Among others, we have performed the following procedures:
X We obtained an understanding and walked through the Group’s process toassess recoverability of deferred tax assets, including controls over the dataand assumptions used in the analysis, and evaluated the design and operat ingeffectiveness of the key controls.
X We considered whether or not the tax plan of Cepsa Tax Group in Spain wasreasonable and in line with the current tax law, including sat isfying ourselvesthat sufficient profit would be available in the appropriated periods.
X We reviewed the CEPSA management’s est imate of the future liquidat ionprocess of the investment in the “Coastal” Group subsidiaries.
X �We evaluated underlying data and assumptions used by management indetermining the expected future tax losses in “Coastal” group subsidiaries andour tax specialists assisted us in verifying tax regulat ion and the computationsof deferred tax assets.
X We reviewed the disclosures included in the accompanying consolidatedfinancial statements in accordance with current regulation.
Ot her informat ion: consolidat ed management report
Other information refers exclusively to the 2020 consolidated management report, the preparat ionof which is the responsibility of the parent Company’s directors and is not an integral part of theconsolidated financial statements
Our audit opinion on the consolidated financial statements does not cover the consolidatedmanagement report. Our responsibility for the consolidated management report, in conformity withprevailing audit regulat ions in Spain, entails:
a) Checking only that the consolidated non-financial statement has been provided as st ipulatedby applicable regulat ions and, if not, disclose this fact.
b) Assessing and reporting on the consistency of the remaining information included in theconsolidated management report with the consolidated financial statements, based on theknowledge of the Group obtained during the audit , in addition to evaluat ing and reporting onwhether the content and presentat ion of this part of the consolidated management report arein conformity with applicable regulat ions. If, based on the work we have performed, weconclude that there are material misstatements, we are required to disclose this fact.
A member firm of Ernst & Young Global Limited
5
Based on the work performed, as described above, we have verified that the information referred toin paragraph a) above is provided as st ipulated by applicable regulat ions and that the remaininginformation contained in the consolidated management report is consistent with that provided in the2020 consolidated financial statements and its content and presentat ion are in conformity withapplicable regulat ions.
Responsibilit ies of t he parent company´ s direct ors for t he consolidat ed f inancial st at ement s
The directors of the parent company are responsible for the preparat ion of the accompanyingconsolidated financial statements so that they give a true and fair view of the equity, f inancialposit ion and results of the Group, in accordance with IFRS-EU, and other provisions in the regulatoryframework applicable to the Group in Spain, and for such internal cont rol as they determine isnecessary to enable the preparat ion of consolidated financial statements that are free from materialmisstatement , whether due to fraud or error.
In preparing the consolidated financial statements, the directors of the parent company areresponsible for assessing the Group’s ability to cont inue as a going concern, disclosing, as applicable,matters related to going concern and using the going concern basis of accounting unless thedirectors either intend to liquidate the Group or to cease operat ions, or has no realist ic alternat ivebut to do so.
Audit or ’s responsibil it ies for t he audit of t he consolidat ed f inancial st at ement s
Our objectives are to obtain reasonable assurance about whether the consolidated financialstatements as a whole are free from material misstatement, whether due to fraud or error, and toissue an auditor’s report that includes our opinion.
Reasonable assurance is a high level of assurance, but is not a guarantee that an audit conducted inaccordance with prevailing audit regulations in Spain will always detect a material misstatementwhen it exists. Misstatements can arise from fraud or error and are considered material if,individually or in the aggregate, they could reasonably be expected to influence the economicdecisions of users taken on the basis of these consolidated financial statements.
As part of an audit in accordance with prevailing audit regulat ions in Spain, we exercise professionaljudgement and maintain professional skept icism throughout the audit . We also:
X Ident ify and assess the risks of material misstatement of the consolidated financialstatements, whether due to fraud or error, design and perform audit procedures responsiveto those risks, and obtain audit evidence that is sufficient and appropriate to provide a basisfor our opinion. The risk of not detect ing a material misstatement result ing from fraud ishigher than for one result ing from error, as fraud may involve collusion, forgery, intent ionalomissions, misrepresentat ions, or the override of internal control.
X Obtain an understanding of internal control relevant to the audit in order to design auditprocedures that are appropriate in the circumstances, but not for the purpose of expressingan opinion on the effectiveness of the Group’s internal control.
X Evaluate the appropriateness of accounting policies used and the reasonableness ofaccounting est imates and related disclosures made by management .
A member firm of Ernst & Young Global Limited
6
X Conclude on the appropriateness of the directors’ use of the going concern basis ofaccounting and, based on the audit evidence obtained, whether a material uncertainty existsrelated to events or condit ions that may cast significant doubt on the Group’s ability tocontinue as a going concern. If we conclude that a material uncertainty exists, we arerequired to draw attent ion in our auditor’s report to the related disclosures in theconsolidated financial statements or, if such disclosures are inadequate, to modify ouropinion. Our conclusions are based on the audit evidence obtained up to the date of ourauditor’s report. However, future events or condit ions may cause the Group to cease tocontinue as a going concern.
X Evaluate the overall presentat ion, st ructure and content of the consolidated financialstatements, including the disclosures, and whether the consolidated financial statementsrepresent the underlying transact ions and events in a manner that achieves fair presentat ion.
X Obtain sufficient appropriate audit evidence regarding the financial information of theentit ies or business act ivit ies within the Group to express an opinion on the consolidatedfinancial statements. We are responsible for the direct ion, supervision and performance ofthe group audit . We remain solely responsible for our audit opinion.
We communicate with the directors of the parent company regarding, among other matters, theplanned scope and t iming of the audit and significant audit findings, including any significantdeficiencies in internal control that we identify during our audit .
From the significant risks communicated with the directors of the parent company, we determinethose that were of most significance in the audit of the consolidated financial statements of thecurrent period and are therefore the most significant assessed risks.
We describe those risks in our auditor’s report unless law or regulation precludes public disclosureabout the matter.
ERNST & YOUNG, S.L.(Registered in the Official Register ofAuditors under No. S0530)
_______________________________Francisco Rahola Carral(Registered in the Official Register ofAuditors under No. 20597
March 4, 2021

12 CEPSA GROUP
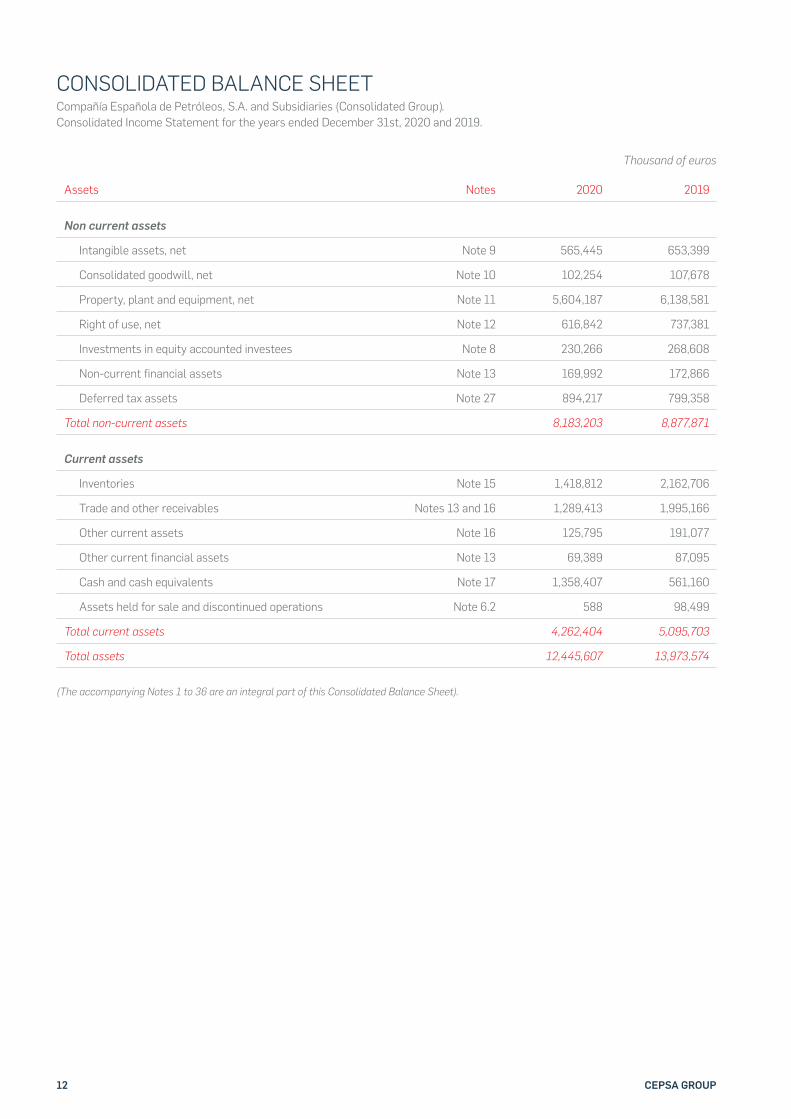
(The accompanying Notes 1 to 36 are an integral part of this Consolidated Balance Sheet).
CONSOLIDATED BALANCE SHEETCompañía Española de Petróleos, S.A. and Subsidiaries (Consolidated Group).Consolidated Income Statement for the years ended December 31st, 2020 and 2019.
Assets Notes 2020 2019
Non current assets
Intangible assets, net Note 9 565,445 653,399
Consolidated goodwill, net Note 10 102,254 107,678
Property, plant and equipment, net Note 11 5,604,187 6,138,581
Right of use, net Note 12 616,842 737,381
Investments in equity accounted investees Note 8 230,266 268,608
Non-current financial assets Note 13 169,992 172,866
Deferred tax assets Note 27 894,217 799,358
Total non-current assets 8,183,203 8,877,871
Current assets
Inventories Note 15 1,418,812 2,162,706
Trade and other receivables Notes 13 and 16 1,289,413 1,995,166
Other current assets Note 16 125,795 191,077
Other current financial assets Note 13 69,389 87,095
Cash and cash equivalents Note 17 1,358,407 561,160
Assets held for sale and discontinued operations Note 6.2 588 98,499
Total current assets 4,262,404 5,095,703
Total assets 12,445,607 13,973,574
Thousand of euros
13CONSOLIDATED FINANCIAL STATEMENTS 2020
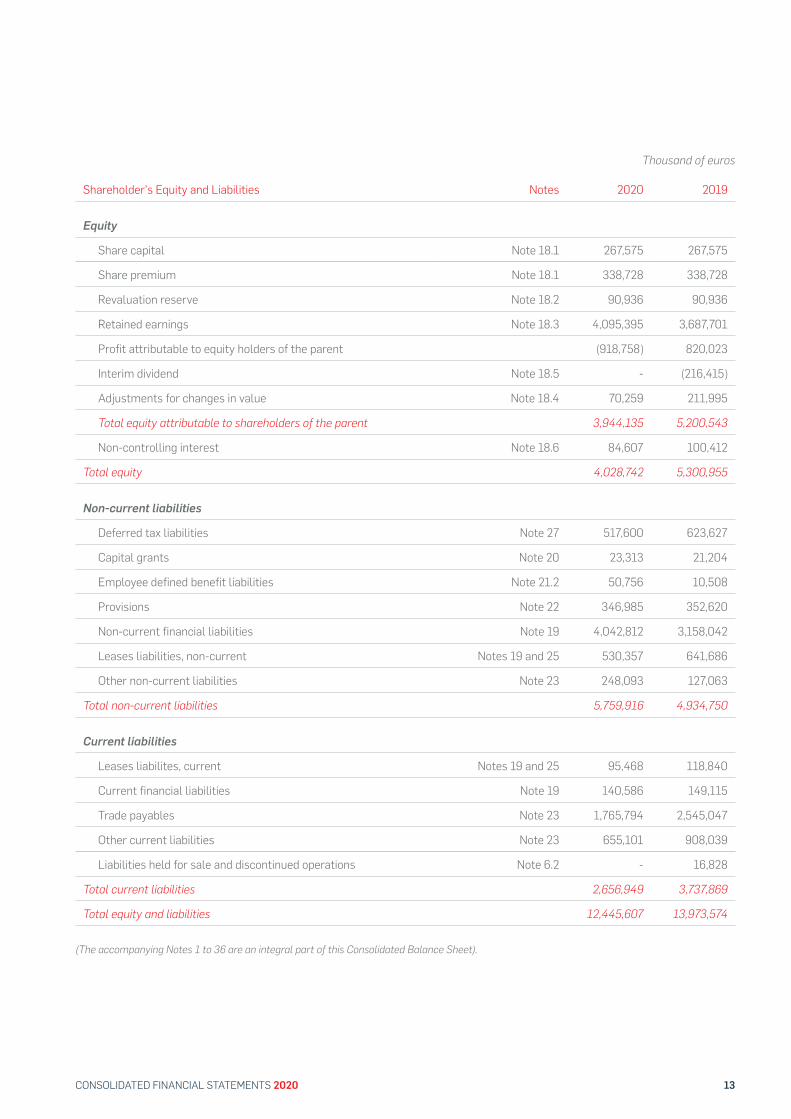
Shareholder's Equity and Liabilities Notes 2020 2019
Equity
Share capital Note 18.1 267,575 267,575
Share premium Note 18.1 338,728 338,728
Revaluation reserve Note 18.2 90,936 90,936
Retained earnings Note 18.3 4,095,395 3,687,701
Profit attributable to equity holders of the parent (918,758) 820,023
Interim dividend Note 18.5 - (216,415)
Adjustments for changes in value Note 18.4 70,259 211,995
Total equity attributable to shareholders of the parent 3,944,135 5,200,543
Non-controlling interest Note 18.6 84,607 100,412
Total equity 4,028,742 5,300,955
Non-current liabilities
Deferred tax liabilities Note 27 517,600 623,627
Capital grants Note 20 23,313 21,204
Employee defined benefit liabilities Note 21.2 50,756 10,508
Provisions Note 22 346,985 352,620
Non-current financial liabilities Note 19 4,042,812 3,158,042
Leases liabilities, non-current Notes 19 and 25 530,357 641,686
Other non-current liabilities Note 23 248,093 127,063
Total non-current liabilities 5,759,916 4,934,750
Current liabilities
Leases liabilites, current Notes 19 and 25 95,468 118,840
Current financial liabilities Note 19 140,586 149,115
Trade payables Note 23 1,765,794 2,545,047
Other current liabilities Note 23 655,101 908,039
Liabilities held for sale and discontinued operations Note 6.2 - 16,828
Total current liabilities 2,656,949 3,737,869
Total equity and liabilities 12,445,607 13,973,574
(The accompanying Notes 1 to 36 are an integral part of this Consolidated Balance Sheet).
Thousand of euros
14 CEPSA GROUP
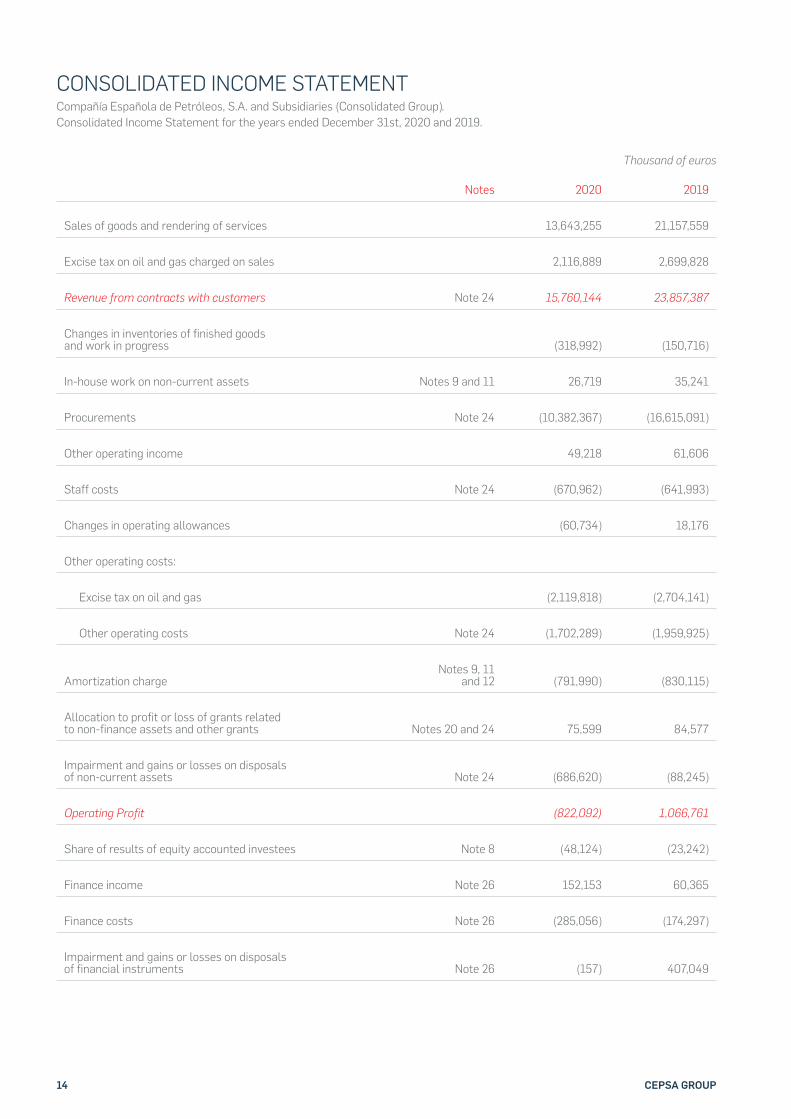
CONSOLIDATED INCOME STATEMENTCompañía Española de Petróleos, S.A. and Subsidiaries (Consolidated Group).Consolidated Income Statement for the years ended December 31st, 2020 and 2019.
Notes 2020 2019
Sales of goods and rendering of services 13,643,255 21,157,559
Excise tax on oil and gas charged on sales 2,116,889 2,699,828
Revenue from contracts with customers Note 24 15,760,144 23,857,387
Changes in inventories of finished goods and work in progress (318,992) (150,716)
In-house work on non-current assets Notes 9 and 11 26,719 35,241
Procurements Note 24 (10,382,367) (16,615,091)
Other operating income 49,218 61,606
Staff costs Note 24 (670,962) (641,993)
Changes in operating allowances (60,734) 18,176
Other operating costs:
Excise tax on oil and gas (2,119,818) (2,704,141)
Other operating costs Note 24 (1,702,289) (1,959,925)
Amortization chargeNotes 9, 11
and 12 (791,990) (830,115)
Allocation to profit or loss of grants related to non-finance assets and other grants Notes 20 and 24 75,599 84,577
Impairment and gains or losses on disposals of non-current assets Note 24 (686,620) (88,245)
Operating Profit (822,092) 1,066,761
Share of results of equity accounted investees Note 8 (48,124) (23,242)
Finance income Note 26 152,153 60,365
Finance costs Note 26 (285,056) (174,297)
Impairment and gains or losses on disposals of financial instruments Note 26 (157) 407,049
Thousand of euros
15CONSOLIDATED FINANCIAL STATEMENTS 2020
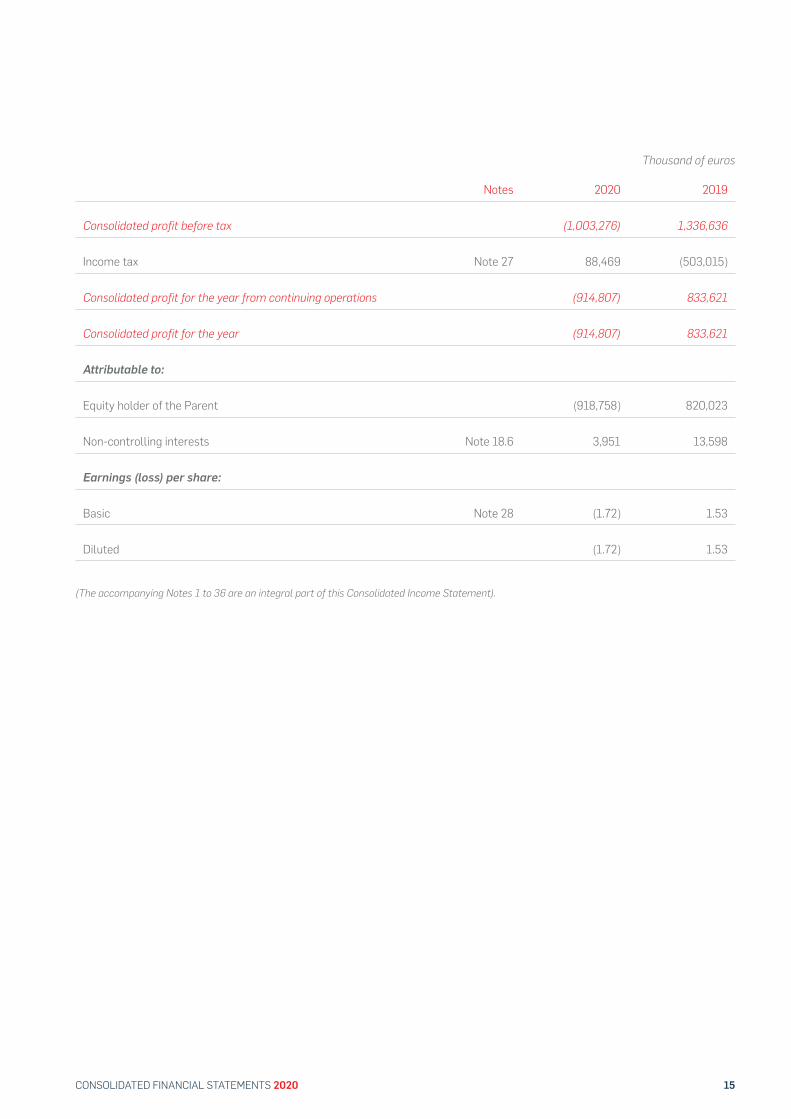
(The accompanying Notes 1 to 36 are an integral part of this Consolidated Income Statement).
Notes 2020 2019
Consolidated profit before tax (1,003,276) 1,336,636
Income tax Note 27 88,469 (503,015)
Consolidated profit for the year from continuing operations (914,807) 833,621
Consolidated profit for the year (914,807) 833,621
Attributable to:
Equity holder of the Parent (918,758) 820,023
Non-controlling interests Note 18.6 3,951 13,598
Earnings (loss) per share:
Basic Note 28 (1.72) 1.53
Diluted (1.72) 1.53
Thousand of euros
16 CEPSA GROUP
Notes 2020 2019
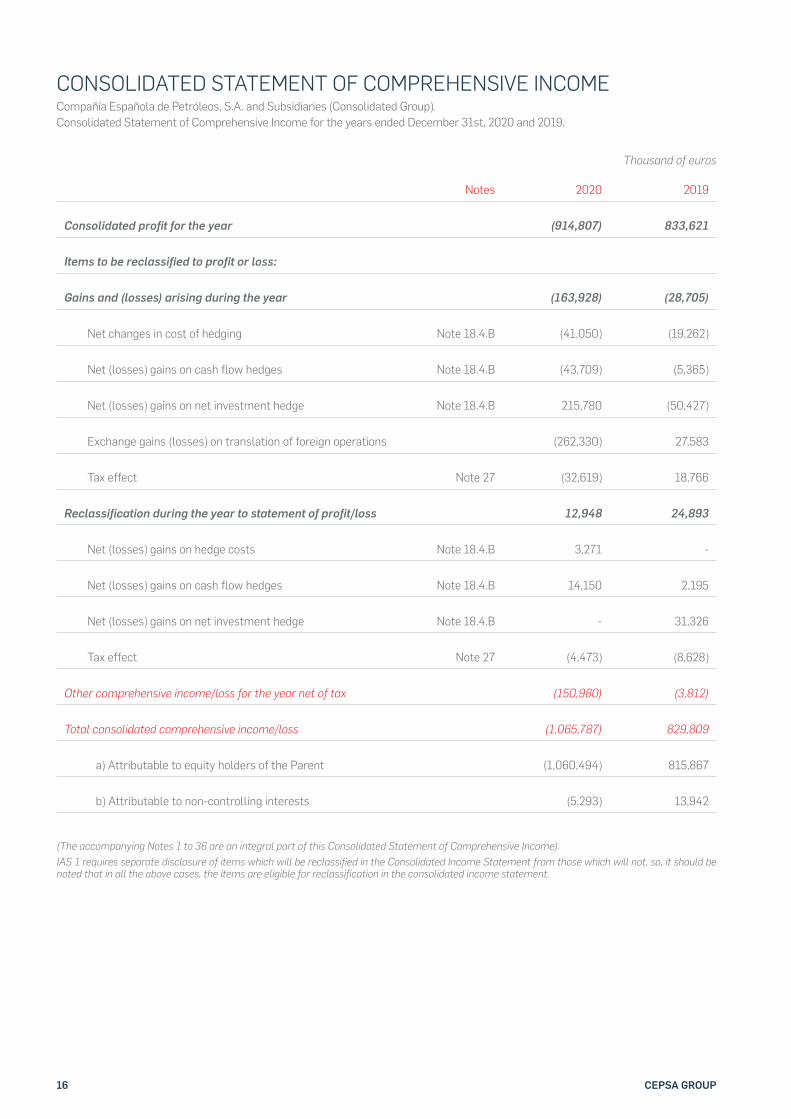
Consolidated profit for the year (914,807) 833,621
Items to be reclassified to profit or loss:
Gains and (losses) arising during the year (163,928) (28,705)
Net changes in cost of hedging Note 18.4.B (41,050) (19,262)
Net (losses) gains on cash flow hedges Note 18.4.B (43,709) (5,365)
Net (losses) gains on net investment hedge Note 18.4.B 215,780 (50,427)
Exchange gains (losses) on translation of foreign operations (262,330) 27,583
Tax effect Note 27 (32,619) 18,766
Reclassification during the year to statement of profit/loss 12,948 24,893
Net (losses) gains on hedge costs Note 18.4.B 3,271 -
Net (losses) gains on cash flow hedges Note 18.4.B 14,150 2,195
Net (losses) gains on net investment hedge Note 18.4.B - 31,326
Tax effect Note 27 (4,473) (8,628)
Other comprehensive income/loss for the year net of tax (150,980) (3,812)
Total consolidated comprehensive income/loss (1,065,787) 829,809
a) Attributable to equity holders of the Parent (1,060,494) 815,867
b) Attributable to non-controlling interests (5,293) 13,942
CONSOLIDATED STATEMENT OF COMPREHENSIVE INCOME Compañía Española de Petróleos, S.A. and Subsidiaries (Consolidated Group).Consolidated Statement of Comprehensive Income for the years ended December 31st, 2020 and 2019.
(The accompanying Notes 1 to 36 are an integral part of this Consolidated Statement of Comprehensive Income).IAS 1 requires separate disclosure of items which will be reclassified in the Consolidated Income Statement from those which will not, so, it should be noted that in all the above cases, the items are eligible for reclassification in the consolidated income statement.
Thousand of euros
17CONSOLIDATED FINANCIAL STATEMENTS 2020
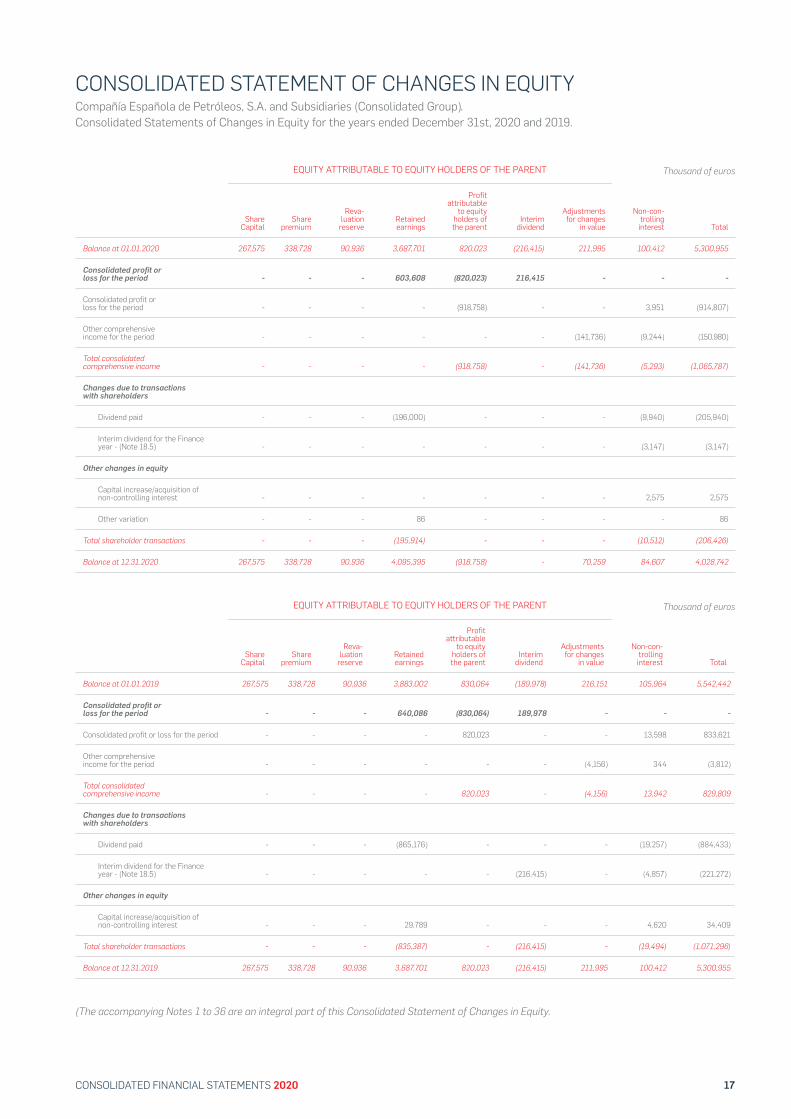
CONSOLIDATED STATEMENT OF CHANGES IN EQUITYCompañía Española de Petróleos, S.A. and Subsidiaries (Consolidated Group).Consolidated Statements of Changes in Equity for the years ended December 31st, 2020 and 2019.
Share Capital
Share premium
Reva-luation
reserve Retained earnings
Profit attributable
to equity holders of the parent
Interim dividend
Adjustments for changes
in value
Non-con-trolling interest Total
Balance at 01.01.2020 267,575 338,728 90,936 3,687,701 820,023 (216,415) 211,995 100,412 5,300,955
Consolidated profit or loss for the period - - - 603,608 (820,023) 216,415 - - -
Consolidated profit or loss for the period - - - - (918,758) - - 3,951 (914,807)
Other comprehensive income for the period - - - - - - (141,736) (9,244) (150,980)
Total consolidated comprehensive income - - - - (918,758) - (141,736) (5,293) (1,065,787)
Changes due to transactions with shareholders
Dividend paid - - - (196,000) - - - (9,940) (205,940)
Interim dividend for the Finance year - (Note 18.5) - - - - - - - (3,147) (3,147)
Other changes in equity
Capital increase/acquisition of non-controlling interest - - - - - - - 2,575 2,575
Other variation - - - 86 - - - - 86
Total shareholder transactions - - - (195,914) - - - (10,512) (206,426)
Balance at 12.31.2020 267,575 338,728 90,936 4,095,395 (918,758) - 70,259 84,607 4,028,742
Share Capital
Share premium
Reva-luation
reserve Retained earnings
Profit attributable
to equity holders of the parent
Interim dividend
Adjustments for changes
in value
Non-con-trolling interest Total
Balance at 01.01.2019 267,575 338,728 90,936 3,883,002 830,064 (189,978) 216,151 105,964 5,542,442
Consolidated profit or loss for the period - - - 640,086 (830,064) 189,978 - - -
Consolidated profit or loss for the period - - - - 820,023 - - 13,598 833,621
Other comprehensive income for the period - - - - - - (4,156) 344 (3,812)
Total consolidated comprehensive income - - - - 820,023 - (4,156) 13,942 829,809
Changes due to transactions with shareholders
Dividend paid - - - (865,176) - - - (19,257) (884,433)
Interim dividend for the Finance year - (Note 18.5) - - - - - (216,415) - (4,857) (221,272)
Other changes in equity
Capital increase/acquisition of non-controlling interest - - - 29,789 - - - 4,620 34,409
Total shareholder transactions - - - (835,387) - (216,415) - (19,494) (1,071,296)
Balance at 12.31.2019 267,575 338,728 90,936 3,687,701 820,023 (216,415) 211,995 100,412 5,300,955
EQUITY ATTRIBUTABLE TO EQUITY HOLDERS OF THE PARENT
EQUITY ATTRIBUTABLE TO EQUITY HOLDERS OF THE PARENT
(The accompanying Notes 1 to 36 are an integral part of this Consolidated Statement of Changes in Equity.
Thousand of euros
Thousand of euros
18 CEPSA GROUP
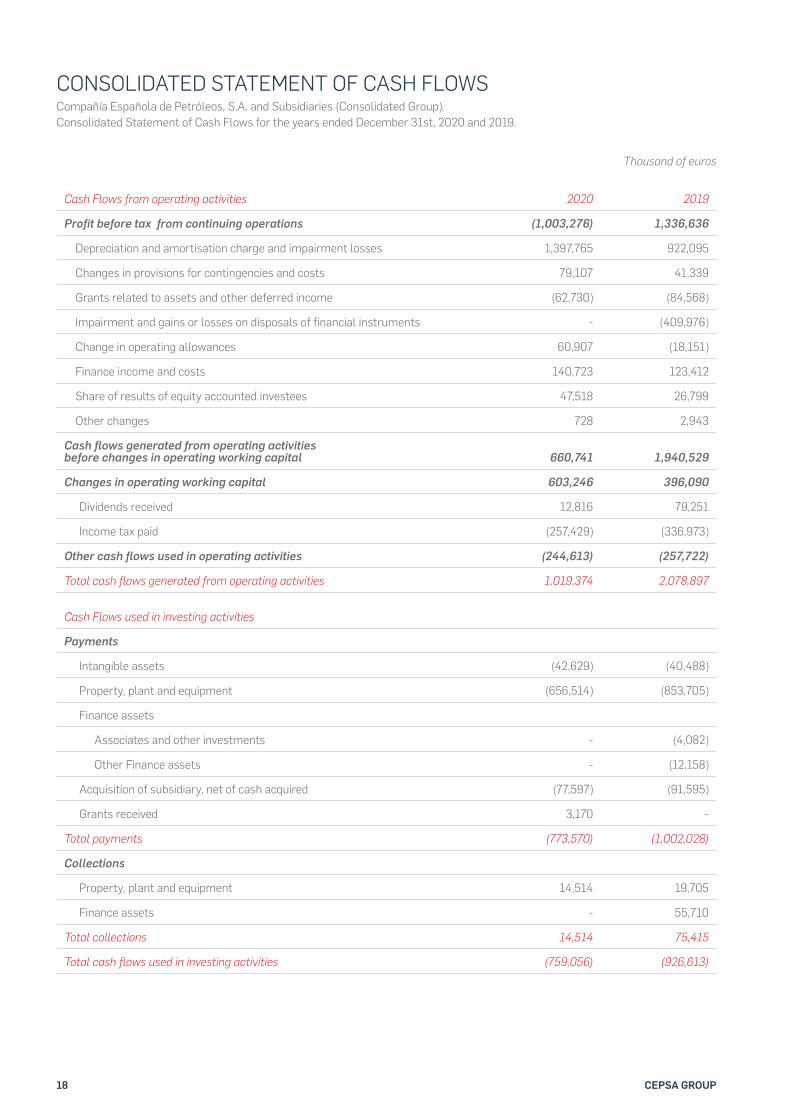
CONSOLIDATED STATEMENT OF CASH FLOWSCompañía Española de Petróleos, S.A. and Subsidiaries (Consolidated Group).Consolidated Statement of Cash Flows for the years ended December 31st, 2020 and 2019.
Cash Flows from operating activities 2020 2019
Profit before tax from continuing operations (1,003,276) 1,336,636
Depreciation and amortisation charge and impairment losses 1,397,765 922,095
Changes in provisions for contingencies and costs 79,107 41,339
Grants related to assets and other deferred income (62,730) (84,568)
Impairment and gains or losses on disposals of financial instruments - (409,976)
Change in operating allowances 60,907 (18,151)
Finance income and costs 140,723 123,412
Share of results of equity accounted investees 47,518 26,799
Other changes 728 2,943
Cash flows generated from operating activities before changes in operating working capital 660,741 1,940,529
Changes in operating working capital 603,246 396,090
Dividends received 12,816 79,251
Income tax paid (257,429) (336,973)
Other cash flows used in operating activities (244,613) (257,722)
Total cash flows generated from operating activities 1,019,374 2,078,897
Cash Flows used in investing activities
Payments
Intangible assets (42,629) (40,488)
Property, plant and equipment (656,514) (853,705)
Finance assets
Associates and other investments - (4,082)
Other Finance assets - (12,158)
Acquisition of subsidiary, net of cash acquired (77,597) (91,595)
Grants received 3,170 -
Total payments (773,570) (1,002,028)
Collections
Property, plant and equipment 14,514 19,705
Finance assets - 55,710
Total collections 14,514 75,415
Total cash flows used in investing activities (759,056) (926,613)
Thousand of euros

19CONSOLIDATED FINANCIAL STATEMENTS 2020
Cash Flows from financing activities 2020 2019
Dividends paid
To equity holders of the Parents (196,000) (531,591)
To non-controlling interests (13,087) (19,218)
Total dividends paid (209,087) (550,809)
Proceeds from borrowings 1,974,719 1,810,418
Repayment of borrowings (988,771) (1,858,399)
Interest paid (96,977) (102,009)
IFRS16 Debt payments (136,135) (142,719)
Total cash flows from bank borrowings 752,836 (292,709)
Total cash flows from financing activities 543,749 (843,518)
Net increase (decrease) in cash and cash equivalents 804,067 308,766
Effect of changes in foreign exchange rates (8,328) 2,133
Effect of exchange rate changes 1,508 3,383
Cash and cash equivalents at beginning of the period 561,160 246,878
Cash and cash equivalents at the end of the period 1,358,407 561,160
Detail of changes of operating working capital
Inventories 510,098 65,279
Trade and other receivables 784,416 207,552
Other current Finance assets (8,001) (4,478)
Trade and other payables (683,266) 117,761
Other changes (1) 9,976
Total changes in operating working capital 603,246 396,090
(The accompanying Notes 1 to 36 are an integral part of this Consolidated Statement of Cash Flow).
Thousand of euros
20 CEPSA GROUP
1. CORPORATE INFORMATION AND REGULATORY FRAMEWORK
2. BASIS OF PRESENTATION
2.1. Statement of compliance
2.2. Comparative information
2.3. Changes in accounting policies
3. ACCOUNTING ESTIMATES, ASSUMPTIONS AND SIGNIFICANT ADJUSTMENTS
4. SUMMARY OF GENERAL ACCOUNTING POLICIES
4.1. Consolidation principles
4.2. Business combinations and goodwill on consolidation
4.3. Foreign currency translation
4.4. Non-current assets in exploration, development, and production of hydrocarbon reserves
4.5. Fair value measurement
4.6. Other published standards to be applied in the future
5. EXTRAORDINARY COSTS INCURRED RELATED TO COVID-19
5.1. Inventory
5.2. Financial assets
5.3. Financial guarantees granted
5.4. Personnel costs
5.5. Hedges
5.6. Deferred tax
5.7. Fixed asset impairment
5.8. Depreciation and decommissioning provisions
5.9. Mitigation of risk and future impacts
22
22
22
23
23
24
26
26
26
27
27
29
29
30
30
31
31
31
31
31
31
32
32
6. BUSINESS COMBINATIONS
6.1. Main variations
6.2. Divestments
7. SEGMENT REPORTING
7.1. Business segment reporting
7.2. Geographical segment reporting
7.3. Information on non-recurring items
8. INVESTMENTS IN ASSOCIATES AND JOINT VENTURES
8.1. Record of interest
8.2. Goodwill
8.3. Impairment
8.4. Financial information of investee companies and businesses
9. INTANGIBLE ASSETS
10. GOODWILL ON CONSOLIDATION
11. PROPERTY, PLANT AND EQUIPMENT
12. RIGHTS OF USE
13. FINANCIAL ASSETS
14. IMPAIRMENT OF ASSETS
14.1. Signs of impairment this financial year and their treatment
14.2. Hypotheses and estimates used to calculate impairment in 2020
14.3. Recognition of the impairment calculated in the accounting period
14.4. Sensitivity analysis
15. INVENTORY
33
33
35
36
37
42
42
45
46
48
48
48
51
55
56
61
64
69
70
70
72
73
74
INDEX OF NOTES TO THE CONSOLIDATED FINANCIAL STATEMENTS
21CONSOLIDATED FINANCIAL STATEMENTS 2020
16. TRADE RECEIVABLES AND OTHER CURRENT ASSETS
17. CASH AND CASH EQUIVALENTS
18. EQUITY
18.1. Share capital and share premium
18.2. Revaluation reserve
18.3. Other reserves
18.4. Valuation adjustments
18.5. Dividends
18.6. Non-controlling interests
19. FINANCIAL LIABILITIES
20. CAPITAL GRANTS
21. PENSION AND SIMILAR OBLIGATIONS
21.1. Defined contribution plans
21.2. Defined benefit obligations
22. PROVISIONS
23. TRADE AND OTHER PAYABLES AND OTHER NON-CURRENT LIABILITIES
24. OPERATING INCOME AND EXPENSES
25. LEASES
26. FINANCIAL INCOME AND EXPENSE
27. TAX MATTERS
27.1. Tax expense recognized in results and equity
27.2. Reconciliation of the effective tax rate
27.3. Changes in balances due to deferred tax
74
76
76
76
76
77
77
78
79
80
84
85
85
86
88
89
91
95
97
99
100
100
101
27.4. Uncertainty related to treatment of corporate income tax and other taxes
27.5. Unrecognized deferred tax assets and liabilities
28. EARNINGS PER SHARE
29. ENVIRONMENTAL MATTERS
30. RISK MANAGEMENT POLICY
30.1. Main risks associated with the CEPSA group’s operations
30.2. Risk management model
31. FINANCIAL DERIVATIVES AND HEDGE OPERATIONS
31.1. Foreign currency risk
31.2. Commodities price risk
31.3. Interest rate price risk.
32. FAIR VALUE
33. RELATED PARTY TRANSACTIONS
33.1. Transactions with associates, joint ventures and other related parties
33.2. Transactions with shareholders
34. REMUNERATION AND OTHER BENEFITS FOR THE BOARD OF DIRECTORS AND SENIOR EXECUTIVES
35. GUARANTEE COMMITMENTS AND OTHER CONTINGENT LIABILITIES
36. EVENTS AFTER THE REPORTING PERIOD
1 04
104
105
105
107
107
107
114
118
118
118
120
122
122
123
124
126
127
22 CEPSA GROUP
1. CORPORATE INFORMATION AND REGULATORY FRAMEWORK
A) CORPORATE INFORMATION
Compañía Española de Petróleos, S.A. (hereinafter “CEPSA” or “the Company”) was incorporated on 26 September 1929, for an inde!nite period of time, with registered address at Paseo de la Castellana, 259 A, 28046 Madrid (Spain). It is entered in the Ma-drid Mercantile Register, Volume 588 of the Companies Book, Sheet 35, Page M-12689, and its Tax Identi!cation Number is A-28003119.
At the beginning of 2020, CEPSA shares were owned by two shareholders: “Cepsa Holding, LLC”, owner of shares represent-ing 63% of the share capital, a company incorporated in the Unit-ed Arab Emirates and ultimately controlled by “Mubadala Invest-ment Company, PJSC” (“MIC’’), and “Matador Bidco, S.À.R.L.”, owner of shares representing the remaining 37% of the share capital, a company incorporated in Luxembourg and ultimate-ly controlled by “The Carlyle Group, Inc.” On 29 January 2020, “Cepsa Holding, LLC” transferred to “Matador Bidco, S.À.R.L.” an additional 1.5% of the Company’s share capital. Consequently, “Cepsa Holding, LLC” holds shares representing 61.5% of the company’s share capital and “Matador Bidco, S.À.R.L.” holds shares representing the other 38.5%.
CEPSA and its investees (hereinafter “the CEPSA Group”) form an diversi!ed business Group which operates in the hydrocarbons industry in Spain and abroad, engaging in business activities relat-ed to the exploration and extraction of crude oil and natural gas, the production of petrochemical and energy products, asphalts and lubricants, and their distribution and marketing, gas distribu-tion and electricity generation, as well as trading activities.
B) REGULATORY FRAMEWORK
CEPSA Group activity carried out in Spain or abroad is subject to numerous legal, regulatory, safety, and environmental protection regulations. Any changes that may arise in applicable legislation can affect the framework in which these activities are carried out and therefore the results generated by the Group’s operations.
The hydrocarbons sector, in which the CEPSA Group operates, is basically regulated by Law 34/1998 of 7 October on the Oil and Gas Sector, amended by Law 11/2013 of 26 July and Law 8/2015 of May 21st which regulates certain measures to support entre-preneurship and stimulate growth and tax and non-tax measures related to exploration, research and development of hydrocarbons.
Regarding oil product retailing, Law 11/2013 introduced certain limits on the agreements on exclusive supply arrangements for petroleum products between wholesale operators and retailers, which have obliged the Group’s supply companies to adapt a sig-ni!cant part of the contracts in its network in order to incorpo-rate these limitations.
Law 8/2015 introduced signi!cant changes in the activities per-formed by operators in the hydrocarbons industry, including drilling, re!ning, commercialization of petrol products, liquid pe-troleum gas (“LPG”) and natural gas.
The changes made by Law 8/2015, in the fuels and combustibles industry, established certain limits on the growth of wholesale operators depending on their market share and established the possibility of retail operators supplying each other.
As far as re!ning activities are concerned, there are numerous industrial safety and environmental protection regulations, par-ticularly Royal Legislative Decree 1/2016, dated December 16, which published the revised text of the law on the integrated prevention and control of pollution.
Regarding natural gas, Law 8/2015 established an organized natural gas wholesale market, to be managed by the Market Op-erator (Mibgas).
CEPSA Group also operates in the electricity sector, regulated by Law 24/2013 of 26 December of Electricity sector. Royal De-cree 413/2014, of 6 June regulating electrical power generation from renewable energy, cogeneration, and waste sources also applies. Likewise, we must highlight the approval of Royal Decree 244/2019, of April 2019, which regulates the administrative, tech-nical, and economic conditions for self-consumption of electricity.
By means of Law 18/2014 of 15 October a National Energy Ef-!ciency Fund was created in Spain. Wholesale operators of oil products or lique!ed petroleum gases and natural gas and elec-tricity supply companies must contribute to this Fund on a yearly basis, affecting pro!ts in these business areas.
2. BASIS OF PRESENTATION
2.1. STATEMENT OF COMPLIANCE
The accompanying Consolidated Financial Statements have been prepared based on the accounting records of Compañía Española de Petróleos, S.A. and its subsidiaries, and in accord-ance with all International Financial Reporting Standards (IFRS) issued by the International Accounting Standards Board (IASB) and with all the interpretations issued by the International Fi-nancial Reporting Interpretations Committee (CINIIF/IFRIC) of the IASB applicable at 31 December 2020 provided that they had been adopted at that date by the European Union with the exception of those applied in advance, if any.
The Consolidated Financial Statements for 2020 were author-ized for issue by the Board of Directors of Compañía Española de Petróleos, S.A. on 4 March 2021, and will be submitted to the Shareholders’ Meeting for approval. The Board of Directors con-siders that they will be approved without any change.
The 2019 Financial Statements of CEPSA and the CEPSA Group were authorized for issue by the Board of Directors of Compañía Es-
NOTES TO THE FINANCIAL STATEMENTS FOR THE YEAR ENDED DECEMBER 31st, 2020.COMPAÑÍA ESPAÑOLA DE PETRÓLEOS, S.A. AND SUBSIDIARIES (CONSOLIDATED GROUP).
23CONSOLIDATED FINANCIAL STATEMENTS 2020
pañola de Petróleos, S.A. on 27 February 2020, and approved with-out amendment at the Shareholders’ Meeting on 4 March 2020.
• Reporting currency
The Consolidated Financial Statements are presented in euros, which is the functional currency of the parent company and the reporting currency of the Consolidated Financial Statements. Figures are rounded to the nearest thousands, except when oth-erwise indicated.
• Classi!cation of debts and credits
In the accompanying Consolidated Balance Sheet, debts or loans falling due within twelve months are classi!ed as current while those due to be settled within more than twelve months are classi!ed as non-current.
There are loans falling due within twelve months but whose long-term re!nancing is secured at the Company’s discretion through existing long-term credit facilities. Such loans are clas-si!ed as non-current liabilities.
• Statement of cash "ows
In accordance with the options for presentation contained in IAS 7 Statement of Cash Flows, the Group reports the information regarding cash "ows and cash equivalents from operations us-ing the indirect method, which implies starting with the “PROFIT BEFORE TAX FROM CONTINUING OPERATIONS” on the Consol-idated Income Statement and subsequently adjusting this !gure for the effects of non-monetary transactions and accruals for the period, as well as items on the Consolidated Income Statement relating to cash "ows from investing or !nancing operations.
In addition, the amount of interest payments related to the Group’s !nancing, including the !nance costs arising from booked leases pursuant to the provisions of IFRS 16, have been included in CASH FLOW FROM FINANCING ACTIVITIES.
2.2. COMPARATIVE INFORMATION
The effects of the COVID-19 pandemic have entailed a signi!cant change affecting how 2020 compares to the previous !nancial year. Said impacts are discussed extensively, where appropriate due to their signi!cance, in the corresponding Notes.
2.3. CHANGES IN ACCOUNTING POLICIES
The accounting policies used to prepare these Consolidated Fi-nancial Statements are the same as those applied in the prepa-ration of the Consolidated Financial Statements for the year ended 31 December 2019, except for the application of the fol-lowing standards, interpretations, and modi!cations, which were applied for the !rst time as of 1 January 2020. Their impacts are as follows:
• Revised version of the IFRS Conceptual Framework
The revised version of the Conceptual Framework sets out a number of fundamental concepts that guide the IASB in the de-velopment of standards and helps ensure that the standards are consistent and that similar transactions are handled in the same way. It also assists companies to develop their accounting poli-cies when no speci!c regulations apply to a transaction.
The revised Conceptual Framework includes a new chapter on val-uation, improves de!nitions and guidelines, and clari!es the most important areas such as prudence and measuring uncertainty.
• Amendments to IAS 1 and IAS 8 – De!nition of materiality
Amendments were made to the de!nition of materiality so that it would be easier to determine what is material. The de!nition of material helps companies to decide whether information should be included in the Consolidated Financial Statements. These amendments clarify said de!nition and include guidelines on how it should be applied. Additionally, the explanations in-cluded with the de!nition have been improved and are now con-sistent in all standards.
These amendments did not have a signi!cant impact on the Consolidated Financial Statements.
• Amendments to IFRS 7, IFRS 9, and IAS 39: Interest rate benchmark reform
These amendments provide for a number of exceptions that ap-ply to all hedge ratios directly affected by interest rate bench-mark reform. A hedge ratio is affected if said reform leads to uncertainty on the time and/or amount of cash "ow linked to the interest rate of the hedged item or hedging instrument.
These amendments did not have a signi!cant impact on the Consolidated Financial Statements.
• Amendments to the IFRS 3 - Business combinations
These amendments change the de!nition of business under IFRS 3 to help companies determine if a transaction should be recorded as a business combination or as an acquisition of a group of assets. This distinction is signi!cant as the acquiring company only recognizes goodwill when a business is acquired.
The new de!nition of business emphasizes that the purpose of a business is to provide goods or services to customers, gener-ating investment income (such as dividends or interest) or gen-erating other income from ordinary activities; while the previous de!nition focused on providing a return in the form of dividends, lower costs or other economic bene!ts directly to investors or other owners, members or participants.
• Amendments to IFRS 16 COVID-19-related rent concessions
These amendments provide a practical solution so that lessees may choose not to account for COVID-19-related rent conces-sions as an amendment to the lease. If they choose to do so, the lessee will account for the concessions by applying the criteria of IFRS 16 Leases as if the change were not a lease modi!cation.
This practical solution may only be applied to rent concessions directly related to COVID-19. The following conditions must be ful!lled: (i) the rent concession provides relief to payments that overall result in the consideration for the lease contract being substantially the same or less than the original consideration for the lease immediately before the concession was provided; (ii) any reduction in rent concession is for relief for payments that were originally due on or before 31 June 2021; and (iii) there are no other substantive changes to the other terms and conditions of the lease.
24 CEPSA GROUP
These amendments did not have a signi!cant impact on the Consolidated Financial Statements.
3. ACCOUNTING ESTIMATES, ASSUMPTIONS AND SIGNIFICANT ADJUSTMENTS
The information in these Consolidated Financial Statements is the responsibility of the Directors of the parent company, who expressly declare that all principles, policies, and criteria includ-ed in the International Financial Reporting Standards in force in the European Union (IFRS-EU) have been applied.
In the preparation of the Consolidated Financial Statements, ac-cording to the IFRS-EU standards, relevant estimates, assump-tions, and judgments by the Management are required which could signi!cantly affect the valuation of registered assets and liabilities, the presentation of contingent assets and liabilities, as well as the revenue and expenditure recognized in the !nancial year and presented in these Consolidated Financial Statements.
These relevant estimates, assumptions and judgments are based on historical experience and other factors that are consid-ered reasonable at the date of preparation of the !nancial state-ments. They are continuously reviewed by the Management and could therefore be reviewed in the future if circumstances change or as a result of new information. A new methodology for accounting estimates would be applied, pursuant to IAS 8, on a forward-looking basis, recognizing the effects of the change in estimate on the Consolidated Income Statement.
Except for cases where the exceptional nature of the COVID-19 pandemic may have had an impact, as set out below, and the change in the treatment of crude oil inventory and tank heel prod-uct inventory, in 2020 there were no signi!cant changes compared to 2019 in the methodology used to make accounting estimates.
The following summary provides additional information about the key relevant estimates, assumptions and judgments that have been used in the preparation of the Consolidated Financial State-ments and accompanying notes. These should be read in conjunc-tion with the sections of the notes mentioned in that summary.
A) GOING CONCERN
On 11 March 2020, the WHO declared COVID-19 an international pandemic. The pandemic rapidly developed into an unprecedent-ed health crisis affecting all domestic and international business activity. The economic and health uncertainties caused by the pandemic have made it extremely dif!cult to hypothesize and form meaningful judgments. CEPSA created working groups to review the impact of the new economic situation on the Group’s Financial Statement. Their assessment as at the date of issue of these Financial Statements is set out in these Consolidated Financial Statements.
The main judgments include an assessment of the going con-cern principle. In its implementation, the accounting loss arisen in this !nancial year was considered. This was fundamentally the result of: (i) the impairment recorded in relation to certain assets (see Note 14), (ii) the impairment necessary due to the adjustment in value of inventory (see Note 15), and (iii) the im-pact of governmental measures to contain the pandemic on de-mand for the company’s products and the Group’s sales in the markets where it operates. The Directors of the parent company drafted these Financial Statements Consolidated applying said principle based on:
• The soundness of the assets of the CEPSA Group, which has a healthy position and sufficient hardiness to absorb the impact of the current situation.
• The increased short and long-term solvency of the CEPSA Group achieved by signing new financing operations (see Note 19), thereby renewing and extending the due date for short-term lines of credit to afford the Group greater flexibility to take on its short and medium-term financial obligations.
• The revision of projections in the 2020-2024 Long-Term Plan approved in December 2019, revised in the short term with the 2021 Budget, for the impacts expected from COVID-19 as well as the economic recovery forecast for subsequent years in terms of operational volumes, product sale prices and supply costs, contingency plans, revisions of fixed costs and investments, hydrocarbon reserves, and other judgements.
The Group has the manoeuvrability to respond in the event the current situation of uncertainty as to the real date when busi-ness will return to normal is prolonged, as it has the ability to continue implementing mitigation measures to reduce costs, optimize the Group’s cash "ow, and preserve liquidity.
Therefore, the Directors believe that there are no uncertainties on the horizon entailing signi!cant impairment to the Group’s capacity to meet its legal and !nancial obligations in the fore-seable future and, consequently, these Consolidated Financial Statements have been prepared on a going concern basis. In fact, in the midst of the economic crisis caused by the COVID-19 pandemic, the Company reinforces its liquidity and solvency to cope with the uncertain times.
B) ESTIMATE OF HYDROCARBON RESERVES
Estimating Reserves is a key process for the decision-making of the Company and the application of the Successful Efforts Method used by the Group to account for its Exploration and Pro-duction activities.
The volume of oil and gas Reserves Proved and Probable (2P) is considered to calculate amortization charges applying the Unit of Production Method. Likewise, 2P Reserves, together with Contingent Resources, when apply, are considered in the evalu-ation of the recoverable amounts of the investments in Explora-tion and Production assets.
The CEPSA Reserves and Contingent Resources Evaluation Procedure follows the guidelines established by the Society of Petroleum Engineers (SPE), the American Society of Petroleum Geologists (AAPG), the World Petroleum Council (WPC), the So-ciety of Petroleum Evaluation Engineers (SPEE), and the Society of Exploration Geophysicists (SEG) in March 2007, revised in No-vember 2011 and June 2018, and is known by the abbreviated term “SPE-PRMS” (Petroleum Resources Management System). To determine the reserves, the procedure takes into account, among other factors: estimates of the volume of oil and natural gas in place, recovery factors, assumptions of price forecasts, and estimates of costs and investments.
Reserves are certi!ed annually by the Group’s internal experts, independent to Exploration and Production business. Addition-ally, every two years, the registered volumes are audited by in-dependent engineering !rms. The Reserves estimate as at 31 December 2019 was prepared by these !rms over the course of 2020 and certi!ed in July. Said audit did not generate signi!cant differences with those recorded in the Group.
25CONSOLIDATED FINANCIAL STATEMENTS 2020
The impairment tests on Exploration and Production assets set out in Note 14 utilized this new assessment.
The Successful Efforts Method and tangible and intangible assets in Exploration and Production projects are presented in Note 4.4.
C) IMPAIRMENT OF ASSETS
As part of the determination of the recoverable value of impair-ment assets (IAS 36), estimates, assumptions and judgments relate mainly to variations in crude oil prices, reduction in activi-ty, anticipated losses, or crisis situations in the geographical ar-eas where the Group operates. The estimates and assumptions used by the Management are determined internally by special-ized departments, based on available information on economic conditions and analysis by independent experts. The discount rate is reviewed annually.
The grouping of the assets in different cash-generating unit1
(CGUs) implies the making of professional judgments and the consideration, among other parameters, of the business seg-ments and the geographic areas in which the Group operates.
Judgments and estimates were also formed on determining the recoverable amount in order to calculate impairment losses on certain assets: intangible assets, property, plant and equipment, and investments in associates and joint ventures.
The impairment of assets and the method applied to calculate it are described in Note 14.
D) OBLIGATIONS RESULTING FROM THE DECOMMISSIONING OF ASSETS
Obligations for decommissioning of assets used for the produc-tion, development, transformation, and sale of hydrocarbons are recognized in the period in which such an obligation is expressed, based on a reasonable cost estimate. The estimates are based on the information available in terms of costs and work program.
The dismantling provisions are regularly updated to re"ect trends in estimated costs and the discount rates. This calcula-tion is complex due to both the initial recognition of the present value of the estimated future costs, and the subsequent adjust-ments made to represent, inter alia, the passing of time, changes in estimates due to variations in the assumptions initially used due to technological advances, regulatory changes, economic, political, and environmental safety-related factors, variations in schedules or in operation conditions, etc. The discount rate is reviewed each year.
The method applied in the calculation of obligations and their recognition in pro!t or loss are described in Notes 11 and 22.
E) INCOME TAX
Deferred tax assets are recognized to the extent that it is prob-able that there will be future pro!ts subject to tax suf!cient to offset them. Signi!cant management judgment is required to determine the amount of deferred tax assets that can be rec-ognized, based upon both the likely timing and level of future taxable pro!ts and future tax planning strategies, as well as the offset period.
1 In accordance with IAS 36, a cash-generating unit is the smallest iden-tifiable group of assets that generates cash inflows that are largely in-dependent of the cash inflows from other assets or groups of assets.
The impact of COVID-19 on determining the income tax for the current !nancial year and future years, as well as the in"uence of this assessment on the recovery of deferred tax assets and unused tax loss carryforwards (both from past !nancial years and those generated this year) was carefully reviewed to prevent recognizing deferred taxes for the Group companies that cannot offset them in the future due to lack of pro!t.
In the application of IFRS interpretation 23, the Management ap-plies its best judgment in assessing uncertainty about the tax position with regard to:
• Measuring the effect of uncertainty on the treatment of income tax individually case-by-case or jointly if they are correlated.
• Determining the degree of probability that the tax authority will accept the company’s tax position, in order to apply the relevant calculation method that best predicts the resolution of uncertainty.
Also, with respect to tax provisions, the assessment of possible outcomes of claims and contingencies is based on the assess-ments of the Group’s legal and tax counsel and take account of the present situation of the proceedings, as well as their overall professional experience. Since the outcome may ultimately be decided by courts, they may be different from the estimates.
The Group relies on the assessment of its legal counsel with re-gard to the probability that penalties and interest thereon will be applied. As a result of this counsel, it determines whether or not to carry the corresponding cost to the books and under which Consolidated Income Statement heading to record it.
The calculation processes and criteria used are described in Note 27.
F) PROVISIONS AND CONTINGENT LIABILITIES
The assessment of potential effects of legal claims and contin-gencies other than those mentioned above, for which the Group relies on the valuation of its legal counsel, that are based on their best professional judgment and take into account the present situation of the proceedings and their seasoned legal experience regarding the different issues. Since the outcome may ultimately be decided by courts, they may be different from the estimates.
Similarly, judgments and estimates are made to evaluate costs and establish provisions for write-offs and environmental repair using current information on expected repair costs and plans. Most write-off events do not occur in the near future, and the precise requirements that must be met when the event occurs are uncertain. Political, environmental, safety and public expec-tations are constantly changing.
This section also includes actions arising from environmental com-pliance in terms of reducing and eliminating greenhouse gases.
These criteria are outlined in Note 22.
26 CEPSA GROUP
G) OTHER MATTERS SUBJECT TO ESTIMATES, ASSUMPTIONS AND JUDGMENTS
Other matters that are subject to estimates, assumptions and judgments are summarized below:
• Determination of the existence of significant control or influence by the Group over an investee (see Note 4.1)
• The process of valuation of assets and liabilities in Business Combinations requires, on the part of Group management, the judgments and estimates indicated in Note 4.2.
• Useful lives of tangible and intangible assets (see Notes 9 and 11).
• The calculation of the valuation of stocks (see Note 15).
• When the fair values of financial assets and financial liabilities recorded in the balance sheet cannot be measured using quoted prices in active markets, this value is measured using alternative valuation techniques including the Discounted Cash Flows model. The data used in these models are taken from observable markets where possible. When it is not, certain value judgments are needed to establish fair values. Judgments include considerations of inputs such as liquidity risk, credit risk (own and counterparty), and volatility (see Note 30). Changes in assumptions about these factors could affect the reported fair value of financial instruments (see Note 32).
• The assessment of the expected losses, according to IFRS 9, adjusted to the Probability of Default (PD), an adjustment based on forward looking estimates of the Strategic Plan of the business area and/or macroeconomic variables has been incorporated.
• With regard to IFRS 16, a lease that provides control over the use of the leased asset must be analyzed to determine effective application of said standard and the duration of the contract, including any renewals that are deemed likely to be exercised.
H) CHANGES IN ESTIMATES
In 2020, EUR 186,388 thousand of crude oil and product were reclassi!ed from under Inventory to Technical installations. This crude oil and product correspond to the volumes in the storage tanks under the lowest operable level (tank heels), and it is per-manent, justifying its classi!cation as a !xed asset (see Notes 11 and 15).
This reclassi!cation was recorded at the beginning of 2020 as a change in estimates, because there is now suf!cient information to reasonably estimate the volume of crude oil and products to be reclassi!ed and the process with which to value them. The new information also allows us to properly estimate the portion of this volume that cannot be recovered when the tanks are fully drained, and subject the value of this non-recoverable volume for further transformation or sale to depreciation.
I) JUDGMENTS IN THE CASE OF TRANSACTIONS NOT ADDRESSED IN RULES OR INTERPRETATIONS ISSUED
Furthermore, when the accounting treatment of a particular transaction is not addressed in a published rule or interpretation,
the Management uses its judgment to de!ne and apply account-ing policies that provide information consistent with the general concepts of IFRS: faithful presentation, relevance, and materiality.
4. SUMMARY OF GENERAL ACCOUNTING POLICIES
4.1. CONSOLIDATION PRINCIPLES
Consolidated Financial Statements include the !nancial state-ments of the Company and the Company’s controlled entities (its subsidiaries) prepared as of 31 December of each year.
The entities directly controlled2 by the parent company (Com-pañía Española de Petróleos, S.A.), or indirectly through a direct-ly controlled entity, are consolidated by global integration.
Investments in joint ventures are consolidated through the Equity Method (see Note 8). The Group accounts for joint operations rec-ognizing their stake in assets, liabilities, income, and expenditures.
Investments in associated entities, in which the Group has signif-icant in"uence, are accounted for using the Equity Method. The situation of signi!cant in"uence is understood to be:
• on a general basis, in companies where the stake is between 20 and 50 per cent, and
• in companies where, although the interest is less than 20 per cent, this influence is understood to exist due to various factors, such as, among others, the CEPSA Group being represented on the Board of Directors, or a high volume of transactions.
For companies consolidated by global integration all intra-group balances and transactions are eliminated, as well as income and expenses not incurred (except for foreign exchange gains and losses arising from transactions and balances in foreign currencies) arising from intra-group transactions. In the case of joint operations, this elimination is limited to the Group’s owner-ship interest.
With regard to Group transactions with companies consolidated by the equity method, any unrealized pro!t is written off against the investment by the percent of the Group’s interest in the in-vestee; unrealized losses are written off in the same way, pro-vided there are no signs of impairment in the Group’s interest in said companies.
4.2. BUSINESS COMBINATIONS AND GOODWILL ON CONSOLIDATION
Business combinations are accounted for using the Acquisition Method. This method entails the recognition in the books at the acquisition date of the identi!able assets acquired and liabilities assumed at their fair value on that date, provided that this value can be reliably measured (see explanation in Note 6).
2 According to IFRS 10, there is control when the Company: • has power over the investee; • is exposed, or has rights, to variable returns from its involvement with
the investee; and • has the ability to use its power over the investee to affect the amount
of returns it receives.
27CONSOLIDATED FINANCIAL STATEMENTS 2020
The Group recognizes a goodwill on the date of purchase for the excess of:
• the consideration transferred (fair value of the assets delivered, of the equity instruments issued and the liabilities incurred or assumed at the date of exchange, and of any additional consideration that depends on future events, whenever it is likely and can be reliably measured), the amount of the non-controlling interest and, in business combinations achieved in stages, the fair value at the date of acquisition of the investment previously held in the acquired company;
• on the fair value at the date of acquisition of the net identifiable assets of the acquired entity.
If this difference is negative, it is accounted for as income in the Consolidated Income Statement (in both cases see Note 10).
The non-controlling interest is recognized for the proportional val-ue in the net assets of the acquired company or at its fair value.
Any deferred contingent consideration is recognized at the fair value at the date of acquisition. If there is an obligation to pay out contingent compensation that meets the de!nition of a !nancial instrument, it is classi!ed as equity. It is then not reassessed, and the settlement is accounted for under equity. Otherwise, the contingent compensation is measured again at fair value on each !ling date and any subsequent changes in fair value of the contingent compensation are recognized under results.
When business combination is deemed incomplete at the end of the reporting period, IFRS 3 requires issuers to disclose that fact and provide the provisional amounts of assets, liabilities, non-controlling interests as well as the items of the considera-tion paid. Additionally, issuers should disclose the reasons why the business combination accounting is incomplete, and the na-ture and amount of any measurement period adjustments rec-ognized during the reporting period.
In accordance with IFRS 3 and IAS 36, goodwill is not amortized. On the other hand, it is subjected to an impairment test at least once a year (more often if there are signs of loss of value).
4.3. FOREIGN CURRENCY TRANSLATION
A) FOREIGN CURRENCY TRANSACTIONS
For each Group company, transactions in a currency other than its functional currency are converted to the corresponding func-tional currency to the exchange rates in force at the time of the transaction. Pro!t or loss due to exchange differences arising between the time of accounting and the time of collection or payment are taken to pro!t or loss and included within the !-nancial results.
Additionally, monetary items in currencies present on the Con-solidated Balance Sheet at year end are restated in the function-al currency at the year-end rates. Differences with respect to the exchange rates prevailing at the transaction date thereof are recognized in pro!t or loss for the !nancial year.
However, any foreign exchange gains or losses arising from the conversion of the following items are recognized under OTHER COMPREHENSIVE INCOME:
• an investment in variable income designated as FVTOCI (except for impairment, in which case foreign currency differences recognized under OCI are reclassified under results);
• a financial liability designated as a net investment hedge in a foreign business to the extent the hedge is effective; and
• allowable cash flow hedges to the extent they are effective.
B) CONSOLIDATION OF FINANCIAL STATEMENTS OF COMPANIES WITH A FUNCTIONAL CURRENCY OTHER THAN THE EURO
The !nancial statements of the Group’s companies with a func-tional currency other than the euro have been converted to eu-ros using the Year-End Exchange Rate Method. Speci!cally:
• assets and liabilities, including goodwill and fair value adjustments, are converted at the year-end exchange rate,
• income and expenditure, including those corresponding to impairment, at the weighted average exchange rate for the financial year, and
• the historical exchange rate for equity is maintained.
Translation differences which arise, if any, are recognized under the heading OTHER COMPREHENSIVE INCOME in pro!t and loss and are accumulated under VALUE CHANGE ADJUST-MENTS in the EQUITY chapter of the accompanying Consolidat-ed Balance Sheet.
When an interest in this kind of company is disposed of in full or in part such that control, signi!cant in"uence, or joint control is lost, the amount accrued in the conversion reserve associated with that interest is reclassi!ed under results as pro!t or loss on disposal. If the Group disposes of part of its interest in a com-pany but retains control, the relevant proportion of the accrued amount is reclassi!ed under NON-CONTROLLING INTERESTS. When the Group disposes of only a part of an associate or joint venture while maintaining signi!cant in"uence or joint control, the relevant proportion of the accrued amount is reclassi!ed un-der pro!t or loss.
The effect of "uctuations in exchange rates in the evolution of account balances on the balance sheet between periods shown for each item in the respective tables in Notes 7 to 29 under the OTHER CHANGES column.
4.4. NON#CURRENT ASSETS IN EXPLORATION, DEVELOPMENT, AND PRODUCTION OF HYDROCARBON RESERVES.
Investments in exploration, development, and production of hydrocarbons are recognized based on the Successful Efforts Method. The accounting treatment for incurred expenditure is as follows:
A) RESERVES ACQUISITION COSTS THROUGH A BUSINESS COMBINATION.
Assets incorporated as a result of a business combination are classi!ed under the POSSIBLE OR CONTINGENT RESERVES or as PROVEN RESERVES under INTANGIBLE ASSETS, depending on the development phase of such an asset.
28 CEPSA GROUP
The acquisition cost of such acquired assets will remain under INTANGIBLE ASSETS throughout their useful life, even if they relate to or later become proven reserves.
This acquisition cost will be amortized according to criteria shared with other categories of assets in Exploration and Pro-duction, in line with their corresponding PPE asset in Exploration and Production:
• If the project results in the discovery of proven reserves, the Production Unit Method will be used to determine the annual allocation to profit or loss, in a process coordinated with the rest of the project’s assets. These will be included in OIL & GAS ASSETS under PROPERTY, PLANT AND EQUIPMENT.
• If the project does not lead to the discovery of reserves, the accumulated cost will be fully amortized against profit or loss in the year in which it occurs.
However, expenditure incurred in a business combination subse-quent to the acquisition thereof is not recorded here, but in the following notes.
B) ACQUISITION COSTS OF RESERVES DIRECTLY BY THE GROUP
Expenditure made on projects initiated by the Group, or on pro-jects acquired through a business combination following the ac-quisition of an interest, consists of:
1. The costs of acquiring exploration permits are capitalized under the EXPLORATION AND PRODUCTION ASSETS heading of INTANGIBLE ASSETS.
a. They are amortized from the date of purchase throughout the life of the exploration contract.
b. In the event of a discovery of proven reserves, amortization is stopped and, in due course3, the net value of these investments will be transferred to the OIL & GAS ASSETS heading of PROPERTY, PLANT AND EQUIPMENT.
2. Geology and geophysics costs, and other costs prior to well drilling, are charged to pro!t and loss as incurred, via capitalization and automatic amortization in the same month.
3. Exploration well drilling costs are temporarily capitalized in EXPLORATION AND PRODUCTION ASSETS under INTANGIBLE ASSETS until it is assessed if they have contributed to the discovery of reserves that justify commercial development.
a. If no reserves have been found, the drilling costs initially capitalized are amortized and recorded in the Consolidated Statement of Income.
b. If they have successfully ted to discovering proven reserves, the accumulated cost will be transferred3 to the OIL & GAS ASSETS heading of PROPERTY, PLANT AND EQUIPMENT.
3 The event which determines the transfer of an intangible asset to PP&E asset occurs when governmental authorization is obtained that allows first the development, and later the commercial exploitation, of a field during a specific period.
4. Exploration costs other than the above are recorded directly in the Consolidated Income Statement when they are incurred.
At the same time, feasibility analyses are carried out for each cash-generating unit (CGU) on the basis of the results of the ex-ploration and, where appropriate, the corresponding impairment tests (see Note 14) that could affect the net capitalized value of amortizations are also carried out.
C) DEVELOPMENT COSTS
Expenditures made in project development activities initiated by the Group, or in projects acquired through a business combina-tion after acquisition of an interest, consist of:
1. Development costs incurred to extract proven reserves (productive wells, dry development wells, oil and gas extraction and treatment facilities, recovery improvement systems, platforms, etc.) are capitalized at the acquisition cost under the OIL & GAS ASSETS heading of PROPERTY, PLANT AND EQUIPMENT.
2. Field abandonment and decommissioning costs are calculated individually for each !eld and recorded under OIL & GAS ASSETS at the current estimated value.
Development investments capitalized in accordance with criteria 1 and 2 above, together with the amounts referred to in paragraph B above received from Intangible assets at the date of trade, are amortized according to the following rules:
a. Investments in the acquisition of reserves transferred from intangible assets and investments in common facilities are amortized over the estimated commercial life of the !eld, based on the reserves extracted during the !nancial year with respect to the reserves estimated as proven and probable as recoverable at the beginning of each year (Production Unit Method).
b. Costs incurred in exploratory drilling for the development of the reserves are amortized over the estimated commercial life of the !eld, based on the reserves extracted during the year with respect to the reserves estimated as proven and probable developed as recoverable at the beginning of each year.
c. With respect to joint production contracts, this calculation is based on the proportion of production of the !nancial year and reserves assigned to the Group taking account of the estimates based on the contractual clauses.
D) IMPAIRMENT
An impairment test is periodically performed for each and every category of these assets. During the exploration phase (par-agraphs A and B), feasibility analyses are carried out on the basis of exploratory results and, where necessary, appropriate evidence of impairment, which could affect the net capitalized value of amortizations in intangible assets.
Likewise, during the development and operation phase, regular impairment tests are performed.
In all cases, the assets are grouped into CGUs and the criteria set out in Note 14 are followed. Impairment losses are recog-nized in the Consolidated Income Statement.
29CONSOLIDATED FINANCIAL STATEMENTS 2020
4.5. FAIR VALUE MEASUREMENT
A) FINANCIAL INSTRUMENTS
The Group measures !nancial instruments such as derivatives at fair value at each reporting date4.
B) NON#FINANCIAL ASSETS
A fair value measurement of a non-!nancial asset takes into ac-count a market participant’s ability to generate economic ben-e!ts and re"ects the asset’s highest and best use or its sale to another market participant that would use the asset in its high-est and best use.
For the calculation of fair value, the Group uses appropriate valuation techniques according to circumstances and based on available information, maximizing the use of relevant observable variables, and minimizing the use of non-observable variables.
To determine and disclose the fair value of !nancial instruments by valuation method, the Group uses the following hierarchy (see Note 32):
• Level 1: Quoted (unadjusted) market prices in active markets for identical assets or liabilities.
• Level 2: Other techniques in which all variables with a significant effect in accounted-for fair value are directly or indirectly observable.
• Level 3: Valuation techniques for which the lowest level input that is significant to the fair value measurement is unobservable.
4.6. OTHER PUBLISHED STANDARDS TO BE APPLIED IN THE FUTURE
The following standards and interpretations published by the IASB and the IFRS IC are not yet effective as of 31 December 2020:
• Amendments to IAS 1 Presentation of Financial Statements: Classi!cation of Liabilities as Current or Non-current
In January 2020, the IASB issued its amendments to paragraphs 69 to 76 of IAS 1 Presentation of Financial Statements to clarify the requirements to be applied to the classi!cation of liabilities as current or non-current. It speci!cally clari!ed:
• What it means to have the right to defer settlement
• That the right to defer settlement must exist at year end
• That the classification is not altered by the probability that the right to defer will be exercised
4 Fair value is the price that would be received for the sale of an asset or paid to transfer a liability in an orderly transaction between market participants at the transfer date. The fair value measurement is based on the assumption that the transaction to sell the asset or transfer the liability takes place either:
• On the principal market for the asset or liability, or • In the absence of a principal market, in the most advantageous market
for the asset or liability transactionThe principal or the most advantageous market must be accessible by the Group.
Only if a derivative implicit to a convertible liability is an equity instrument in and of itself, will the liability’s conditions have no impact on its classi!cation.
These amendments are effective for periods beginning on or af-ter 1 January 2023 and are to be applied retroactively.
• Amendments to the IFRS 3 Business Combinations: Reference to the conceptual framework
Issued by the IASB in May 2020, these amendments are to re-place the 1989 Conceptual Framework with a reference to the 2018 framework, with no signi!cant changes to requirements.
The IASB also added an exception to IFRS 3 requirements to pre-vent gains or losses on “day 2” that may stem from liabilities or contingent liabilities (within the scope of IAS 37 or IFRIC 21) if incurred separately. Meanwhile, the IASB decided to clarify the existing IFRS 3 guidance to recognize contingent assets that will not be affected by references to the Conceptual Framework.
These amendments are effective for periods beginning on or af-ter 1 January 2022 and can be applied prospectively. The Group does not expect any impact as a result of these amendments.
• Amendments to IAS 16 Property, Plant, and Equipment: Amounts received prior to planned use
These amendments issued by IASB in May 2020 prohibit de-ducting from asset acquisition costs amounts received from sales made from the asset while bringing it to the location and condition necessary for it to be capable of operating in the man-ner intended by Management. Instead, these amounts will be recorded in the income statement.
These amendments become effective for periods beginning on or after 1 January 2022, and are to be applied retrospectively only to items of property, plant, and equipment that are brought to the location and condition necessary for them to be capable of operating in the manner intended by Management on or af-ter the beginning of the earliest period presented in the !nancial statements in which the entity !rst applies the amendments. The Group does not expect any signi!cant impact as a result of these amendments.
• Amendments to IAS 37 – Cost of Ful!lling a Contract
These amendments issued by the IASB in May 2020 specify the costs that companies should include when assessing whether a contract is onerous or loss-making. The amendments propose a “direct cost approach.” Costs that relate directly to ful!lling a contract to deliver goods or provide services include both the in-cremental costs and an allocation of costs that relate directly to the contract. Administrative costs and overhead are not directly attributable to a contract; therefore, they are excluded from the calculation unless they are explicitly passed along to the coun-terparty pursuant to the contract.
These amendments are effective for periods beginning on or af-ter 1 January 2022.
• 2018-2020 Annual Improvements
As part of the 2018-2020 annual improvements to the IFRS, the IASB published an amendment to IFRS 9 and IAS 40
30 CEPSA GROUP
i. IFRS 9 Financial instruments: fees in the “10% test”
This amendment clari!es which fees to consider when ana-lyzing whether changes to the terms of a !nancial liability are substantially different from the original !nancial liability. These expenses only include those paid or received by the creditor or the borrower, including those paid or received by one on behalf of the other.
This amendment is effective for periods beginning on or after 1 January 2022 and early application is permitted.
ii. Amendments to IFRS 9, IAS 39, IFRS 7, IFRS 4, and IFRS 16: Interest rate benchmark reform – phase 2
In August 2020, the IASB published amendments to IFRS 9, IAS 39, IFRS 7, IFRS 4, and IFRS 16: Interest rate benchmark reform – phase 2. These amendments provide temporary relief in !nan-cial reporting while interbank offered rates (IBOR) are replaced by risk-free rates (RFR).
The CEPSA Group has not undertaken early application of any of these rules in preparing these consolidated Financial Statements.
5. EXTRAORDINARY COSTS INCURRED RELATED TO COVID#19
The impact of COVID-19 and other unfavourable economic events of 2020, such as plummeting crude oil prices and domestic and international demand affected the CEPSA Group’s results in quite different ways. As part of a critical industry providing essential energy and chemical products, CEPSA has maintained normal operations at its industrial centres, where CEPSA professionals have worked to ensure the energy supply and the distribution of other essential products during the COVID-19 crisis.
The situation caused by the pandemic is unprecedented in re-cent history and has affected all sectors. Like any other compa-nies in the energy sector, CEPSA has been adversely affected by the developments of the market. The Spanish market has been especially impacted with a signi!cant drop in energy consump-tion during the !rst State of Alarm, partially offset in the sum-mer and once again affected, albeit to a lesser extent, after the declaration of the new State of Alarm in October.
Thus, our businesses noted the following impacts in 2020:
• The sharp contraction of oil prices – which went from $68/barrel at the beginning of the year to $50/barrel at the end of 2020, going through a phase of exceptionally low prices in the first half of the year, reaching $20/barrel in April – entailed, on the one hand, decreased earnings from subsidiaries in Exploration and Production segment and, on the other, reduced sales for said companies, as OPEC-member countries, Russia, and other countries agreed to a curtailment of output in the month of April 2020, which has been maintained throughout 2020.
• The Refining area was affected both by the drop in demand, which in turn led to the reduction of refinery utilization rates, and by the resulting reduction in European refining margins. In fact, a decision was made in October 2020 to temporarily extend the maintenance shutdown of two units in the Huelva refinery to adapt production to current demand. The best time to reinitiate activity is being reviewed periodically, which is expected to take place in the first half of 2021, although it will depend on the evolution of the pandemic.
Electricity and gas sales were also adversely affected by falling prices due to reduced demand. Nevertheless, low gas and electricity prices fostered operational cost savings in Re!ning when they are part of production cost (combined cycle units with electricity and steam for distillation plants).
Additionally, the Group’s Trading unit has worked during the !rst half of 2020 with the aim of supporting the commer-cialization of the production of our re!neries and taking ad-vantage of the intermediation opportunities that have arisen in a market with as much volatility as the oil market has experienced.
• The Commercial segment was impacted by COVID-19 due to the drop in demand experienced by all and every different lines of the business that sell our products. Thus, the most affected correspond, on the one hand, to the network of service stations, which has seen its sales drop by around 29% on average, although there has been a recovery in the last semester, as a result of the completion of the first State of Alarm and the expectations about the success of the vaccination campaigns. Another of our activities strongly impacted by COVID-19 was aviation fuel sales, where business shrank significantly as a result of the limitation of travel worldwide, setting average annual demand 60% below that existing before the pandemic.
• Finally, some of our activities that performed well in 2020 partially offset the above-mentioned reductions. This is the case for our chemicals business, as products manufactured in CEPSA petrochemical plants have many applications in products necessary to fight the disease caused by the coronavirus, as well as to stop its spread. These products include LAB and phenol, of which CEPSA is the only producer in Spain. These compounds are raw material for a multitude of products in the pharmaceutical, technological and medical industries, among others.
As a result of the above, in 2020 there was a 35% drop in sales compared to 2019.
The following sections discuss the impact on results, referring to the assets and liabilities involved.
5.1. INVENTORY
Two signi!cant effects were found.
A) IMPAIRMENT OF INVENTORY VALUE
The above-mentioned variations in oil prices on the markets signi!cantly affected the value of crude and product inventories and indirectly affected the sales margin for petroleum products.
At year end, the adjustment in operational inventory value rose to EUR 38 million (excluding spare part inventories, see Note 15).
B) IDLE CAPACITY COSTS
As discussed in Note 15, production cost is one of the two key components in the valuation of inventory. The cost of production includes, where applicable, direct labour costs, general man-ufacturing costs, and the proportion of the depreciation of the non-current asset items used in the production process.
One of the consequences of COVID-19 is the reduction of the re!nery activity, which in the reporting period experienced a de-
31CONSOLIDATED FINANCIAL STATEMENTS 2020
crease between 20% and 30% in distillation activity from April to December. This decline in activity is considered idle capaci-ty. The portion of production costs incurred between April and December corresponding to idle capacity was not included in the valuation of !nished products for said months. In the fourth quarter of the !scal year, as part of the re!nery utilization rate optimization exercise, it was decided to keep two units of the La Rábida Re!nery idle, and to increase the utilization rate of the San Roque Re!nery. Consequently, subactivity has been applied only to the !rst one, for an approximate percentage of 40%.
The Petrochemicals business did not experience any idle capac-ity in 2020.
Supply contracts that became onerous as a result of the current circumstances have not been identi!ed.
5.2. FINANCIAL ASSETS
The health crisis arising from COVID-19 shut down economic ac-tivity in many business sectors, both in Spain and in the rest of the world. This shutdown hindered !nancial capacity of compa-nies and families, and therefore their ability to pay.
As a result, the CEPSA Group carefully reviewed its exposure to the risk of default and updated the model that determines the number of provisions to be established to cover them. The prob-ability of default on trade credits has been increased by 15% in Group’s assessment models, in line with the decreased collect-ability seen in the 2007 crisis; credits that are not trade credits were measured on a case-by-case basis according to interna-tional accounting standards. Next, the default allowances kept to hedging the current risk were assessed; where applicable, an update to discount rates adjusted to the speci!c risk of each as-set has been carried out.
However, the impact on the Consolidated Income Statement for !nancial year 2020 was negligible, because the need for addi-tional allowances arising from higher Probability of Default (PD) was offset by a reduction in balance of receivables resulting from the drop in prices and sales (see Note 13).
5.3. FINANCIAL GUARANTEES GRANTED
As most guarantees are granted by CEPSA or its main subsidi-aries to other companies in the Group, and, in the context of en-hancing the Group’s liquidity and solvency as discussed in Note 19, there are no signs of risk of enforcement.
5.4. PERSONNEL COSTS
Due to the precarious situation created by low fuel demand re-sulting from the State of Alarm and subsequent COVID-19 re-strictions, the Group had to implement a temporary labour force furloughing plan (ERTE in Spanish acronym) in its service station network, affecting 2,586 employees. However, since the plan was implemented in shifts, only a maximum of 1,200 employees were ever simultaneously furloughed.
The furlough began on 29 April and was effective until 31 Oc-tober, although employees were gradually reincorporated as activity bounced back after the !rst State of Alarm. The Group committed to pay the difference of up to 100% of the !xed sal-ary of the people affected throughout the furlough. Salary sav-ings resulting from said temporary labour force adjustment plan were EUR 2,556 thousand and they are included under Person-nel costs. CEPSA made Social Security contributions as per
employment situation and does not expect to receive any reim-bursement for this concept.
For the same reason, the Company is being compelled to imple-ment a temporary labour force furloughing plan in the Fuel 1 and Vacuum 2 units of the La Rábida Re!nery in the industrial area of Palos, in Huelva, starting in October and involving 62 employees. Because the plan is implemented in shifts, only a maximum of 39 employees are simultaneously furloughed. The Management periodically evaluates the most appropriate time to resume the activity of these units, which is expected to take place in the !rst half of 2021, although it will depend on the evolution of the pan-demic. CEPSA has contributed to Social Security according to ordinary employment situation and it is not expected to receive any reimbursement for this concept.
5.5. HEDGES
The CEPSA Group follows a consistent risk hedging policy, as set out in Notes 30 and 31.
In the context of this note, the hedge portfolio has been ana-lysed to clarify its exposure to various potential risks: non-per-formance risk and counterparty risk.
With regard to non-performance risk, no signi!cant risks were found that might affect the results in the future. Certain hedg-es associated with Re!ning activity that may be affected by this risk, are small and renewed monthly.
Concerning gas purchase and sale commitments, as they are quite short-term documented hedges, no signi!cant over-cov-erage risk has been found in relation to the total duration of the hedged period.
In terms of counterparty risk, the Group constantly monitors third parties (likewise to Note 5.2 above), but given their current investment grade rating, no signi!cant risks were detected.
5.6. DEFERRED TAX
Projections of future results were updated in December 2020, in order to assess the capacity of these results to absorb the de-ferred tax assets recognized on the consolidated Balance Sheet.
Even when the 2020 tax base is negative, and these loss car-ry-forwards have been added to the deferred tax balances re-corded at 2019 year-end, the projections of future results show suf!cient margin to offset said total deferred tax. In cases where a potential risk of non-recovery has been identi!ed, impairment has been recorded.
5.7. FIXED ASSET IMPAIRMENT
The drop in crude oil prices in 2020 is an event of impairment for Exploration and Production assets. No other event of impair-ment has been noticed regarding a signi!cant reduction in recov-erable reserves or an increase in expected future investments and production costs.
To conduct the appropriate impairment tests, only the forward price curve–with the ensuing impact on reserves— and discount rates were updated (see Note 14), as no signi!cant impacts were detected in the other impairment test variables (production pro-!les, investments, operating expenses, etc.).
32 CEPSA GROUP
Additionally, due to the volatility of hydrocarbon prices that has occurred during the 2020 !nancial year and the uncertainties observed in long-term prices, for the valuation of the Exploration and Production CGUs the “expected cash "ow approach” that establishes IAS 36 to re"ect expectations about possible cash "ows, instead of a single most probable cash "ow, has been used. For this, two scenarios have been considered for prices over three years (see Note 14).
Additionally, as a consequence of the evolution of the prices of certain petroleum products, strongly impacted by COVID 19, a drop in the pro!tability of some assets of the Re!ning-Commer-cial CGU is observed.
The net impact on !nancial year 2020 results amounted to EUR 648 million in PPE and intangible assets in Exploration and Production and rest of businesses and EUR 60 million in invest-ments in associates accounted for using the equity method (see Note 14.3).
Additionally, at the beginning of 2020, the market for CO2 emis-sion rights suffered from the impact of the reduction in produc-tive activity with a drop in the cost of these rights in the free market. The CEPSA Group recorded an impairment of EUR 17 million during the !rst semester of 2020 as a result of this cir-cumstance (see Note 9).
There were other lesser impairments set out in Note 14.
5.8. DEPRECIATION AND DECOMMISSIONING PROVISIONS
Indirectly, the impact of decreased international crude oil prices affected amortization and depreciation of hydrocarbon Explora-tion and Production projects, because either they shortened the useful life of the !eld or reduced the crude oil rights in produc-tion sharing contracts. Whilst the CEPSA Group carried out the impairment tests mentioned in Notes 5.7 and 14, the impact of said analysis was reviewed in terms of said factors.
Where relevant, the Group re-estimated depreciation and amor-tization corresponding to the affected assets, the outcome of this was recorded in the Income Statement as at 31 December 2020. At the same time, since assets depreciate according to the units produced, OPEC+ agreements on production curtailments reduced amortization and depreciation for the period in the Ex-ploration and Production business.
Similarly, a reduction in useful life of the oil !eld or other busi-ness operations anticipates decommissioning requirements. This event requires the Group to recognize the impact of the en-suing change of the recording period for said expenses in current Consolidated Income Statement. The CEPSA Group has duly analysed this risk and determined that expenditures of EUR 1 million should be paid in advance on its projects in Thailand.
5.9. MITIGATION OF RISK AND FUTURE IMPACTS
Due to the deterioration of the economic outlook, CEPSA imple-mented a contingency plan with different actions to protect cash "ow generation in 2020. Some of these actions are:
• Firm discipline in investments with objective reduction of EUR 380 million from the financial year’s investment budget.
• Extensive fixed cost reduction for all business units and operations in order to achieve savings of more than EUR 120 million in 2020 compared to the starting point of actual costs in 2019.
• Strict continuous management of working capital.
During the 2020 !nancial year, the Group’s Management has continuously monitored these actions. The proposed objec-tives have been exceeded and savings of EUR 527 million have been achieved.
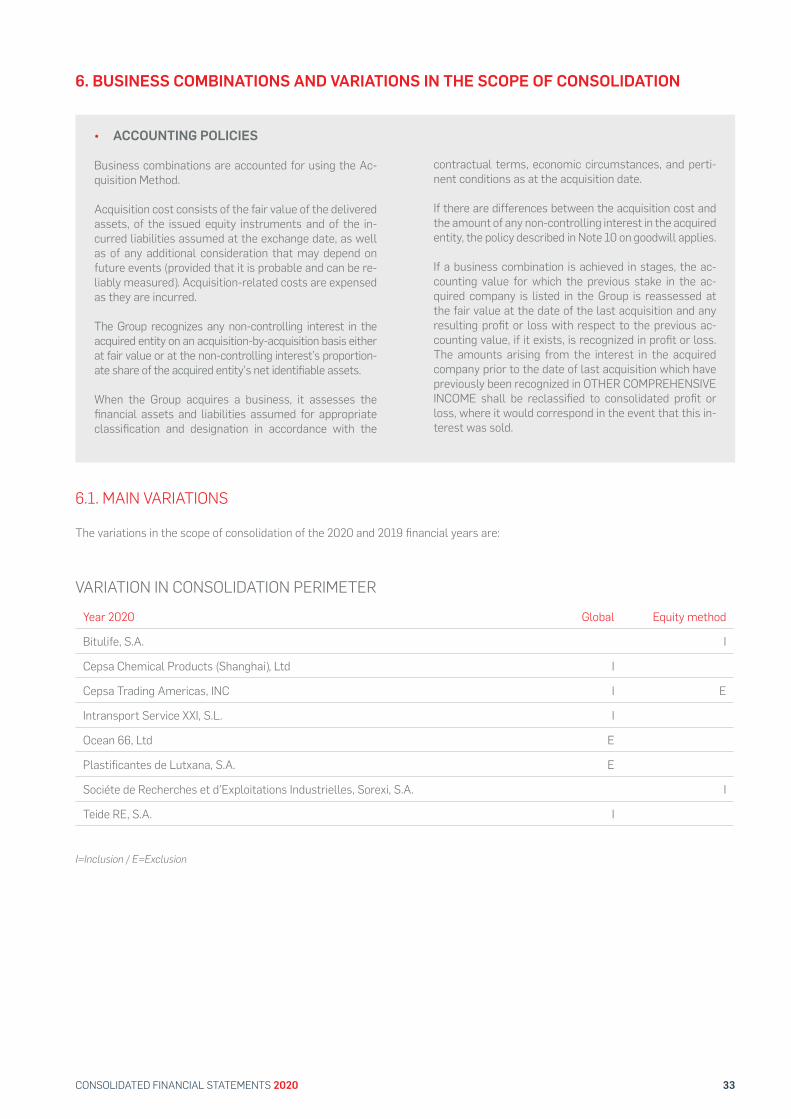
33CONSOLIDATED FINANCIAL STATEMENTS 2020
• ACCOUNTING POLICIES
Business combinations are accounted for using the Ac-quisition Method.
Acquisition cost consists of the fair value of the delivered assets, of the issued equity instruments and of the in-curred liabilities assumed at the exchange date, as well as of any additional consideration that may depend on future events (provided that it is probable and can be re-liably measured). Acquisition-related costs are expensed as they are incurred.
The Group recognizes any non-controlling interest in the acquired entity on an acquisition-by-acquisition basis either at fair value or at the non-controlling interest’s proportion-ate share of the acquired entity’s net identi!able assets.
When the Group acquires a business, it assesses the !nancial assets and liabilities assumed for appropriate classi!cation and designation in accordance with the
contractual terms, economic circumstances, and perti-nent conditions as at the acquisition date.
If there are differences between the acquisition cost and the amount of any non-controlling interest in the acquired entity, the policy described in Note 10 on goodwill applies.
If a business combination is achieved in stages, the ac-counting value for which the previous stake in the ac-quired company is listed in the Group is reassessed at the fair value at the date of the last acquisition and any resulting pro!t or loss with respect to the previous ac-counting value, if it exists, is recognized in pro!t or loss. The amounts arising from the interest in the acquired company prior to the date of last acquisition which have previously been recognized in OTHER COMPREHENSIVE INCOME shall be reclassi!ed to consolidated pro!t or loss, where it would correspond in the event that this in-terest was sold.
6. BUSINESS COMBINATIONS AND VARIATIONS IN THE SCOPE OF CONSOLIDATION
6.1. MAIN VARIATIONS
The variations in the scope of consolidation of the 2020 and 2019 !nancial years are:
VARIATION IN CONSOLIDATION PERIMETERYear 2020 Global Equity method
Bitulife, S.A. I
Cepsa Chemical Products (Shanghai), Ltd I
Cepsa Trading Americas, INC I E
Intransport Service XXI, S.L. I
Ocean 66, Ltd E
Plastificantes de Lutxana, S.A. E
Sociéte de Recherches et d’Exploitations Industrielles, Sorexi, S.A. I
Teide RE, S.A. I
I=Inclusion / E=Exclusion
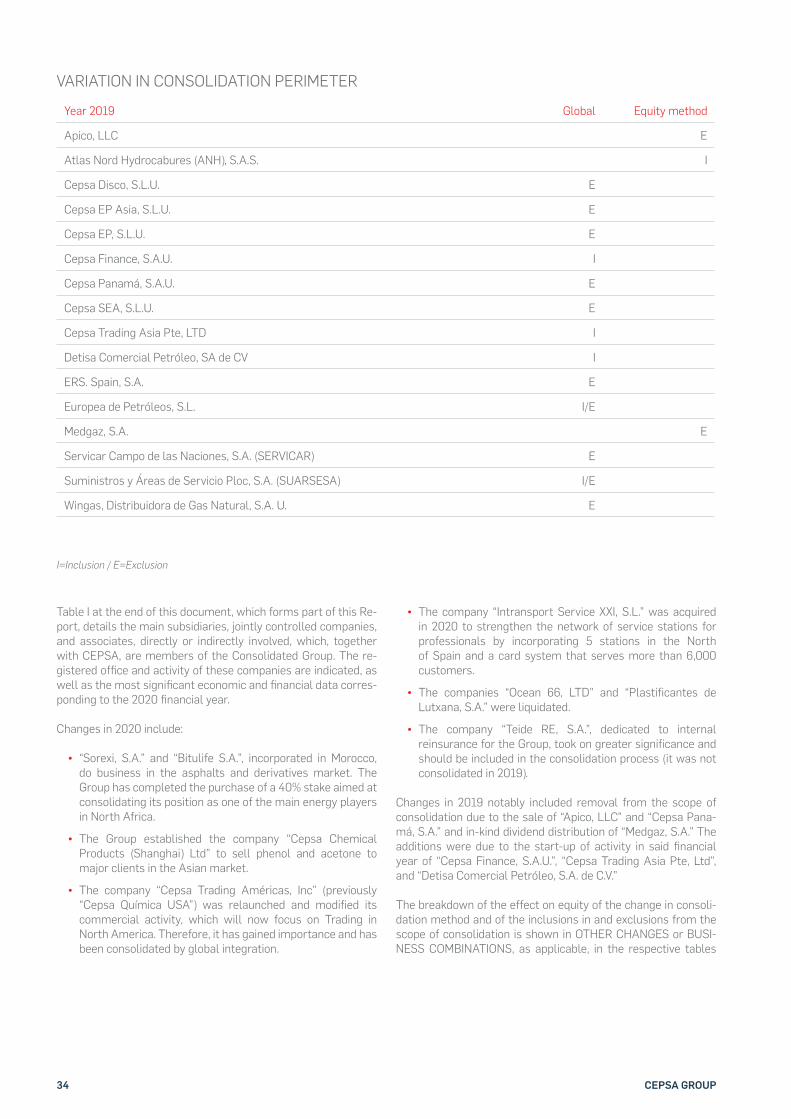
34 CEPSA GROUP
Year 2019 Global Equity method
Apico, LLC E
Atlas Nord Hydrocabures (ANH), S.A.S. I
Cepsa Disco, S.L.U. E
Cepsa EP Asia, S.L.U. E
Cepsa EP, S.L.U. E
Cepsa Finance, S.A.U. I
Cepsa Panamá, S.A.U. E
Cepsa SEA, S.L.U. E
Cepsa Trading Asia Pte, LTD I
Detisa Comercial Petróleo, SA de CV I
ERS. Spain, S.A. E
Europea de Petróleos, S.L. I/E
Medgaz, S.A. E
Servicar Campo de las Naciones, S.A. (SERVICAR) E
Suministros y Áreas de Servicio Ploc, S.A. (SUARSESA) I/E
Wingas, Distribuidora de Gas Natural, S.A. U. E
I=Inclusion / E=Exclusion
VARIATION IN CONSOLIDATION PERIMETER
Table I at the end of this document, which forms part of this Re-port, details the main subsidiaries, jointly controlled companies, and associates, directly or indirectly involved, which, together with CEPSA, are members of the Consolidated Group. The re-gistered of!ce and activity of these companies are indicated, as well as the most signi!cant economic and !nancial data corres-ponding to the 2020 !nancial year.
Changes in 2020 include:
• “Sorexi, S.A.” and “Bitulife S.A.”, incorporated in Morocco, do business in the asphalts and derivatives market. The Group has completed the purchase of a 40% stake aimed at consolidating its position as one of the main energy players in North Africa.
• The Group established the company “Cepsa Chemical Products (Shanghai) Ltd” to sell phenol and acetone to major clients in the Asian market.
• The company “Cepsa Trading Américas, Inc” (previously “Cepsa Química USA”) was relaunched and modified its commercial activity, which will now focus on Trading in North America. Therefore, it has gained importance and has been consolidated by global integration.
• The company “Intransport Service XXI, S.L.” was acquired in 2020 to strengthen the network of service stations for professionals by incorporating 5 stations in the North of Spain and a card system that serves more than 6,000 customers.
• The companies “Ocean 66, LTD” and “Plastificantes de Lutxana, S.A.” were liquidated.
• The company “Teide RE, S.A.”, dedicated to internal reinsurance for the Group, took on greater significance and should be included in the consolidation process (it was not consolidated in 2019).
Changes in 2019 notably included removal from the scope of consolidation due to the sale of “Apico, LLC” and “Cepsa Pana-má, S.A.” and in-kind dividend distribution of “Medgaz, S.A.” The additions were due to the start-up of activity in said !nancial year of “Cepsa Finance, S.A.U.”, “Cepsa Trading Asia Pte, Ltd”, and “Detisa Comercial Petróleo, S.A. de C.V.”
The breakdown of the effect on equity of the change in consoli-dation method and of the inclusions in and exclusions from the scope of consolidation is shown in OTHER CHANGES or BUSI-NESS COMBINATIONS, as applicable, in the respective tables
35CONSOLIDATED FINANCIAL STATEMENTS 2020
disclosing the changes of the !nancial year for each heading shown in Notes 7 to 29.
The information contained in this Report for !nancial year 2019 is presented only for purposes of comparison with information from !nancial year 2020.
6.2. DIVESTMENTS
• ACCOUNTING PRINCIPLES
Following IFRS 5, assets and liabilities belonging to the consolidated group and assets and liabilities of subsidi-aries held for sale are presented separately in the Con-solidated Balance Sheet. Depreciation of assets is inter-rupted from the date of reclassi!cation.
Assets held for sale. The entity measures non-current assets (or disposal groups) classi!ed as held for sale, at the lower of carrying amount and fair value less costs to sell. Non-current assets (or disposal groups) are clas-si!ed as held for sale if their carrying amount will be recovered through a sale transaction and not continued use, or of a distribution to the owners, instead of through their continued use.
This condition is considered to be ful!lled when the sale is highly probable, and the asset is available for immedi-ate sale in its present condition. The sale should presum-ably be completed within one year of the asset’s classi!-cation as held for sale.
Otherwise, a discontinued operation is a component that has been sold or otherwise disposed of or has been clas-si!ed as held for sale, and
• Represents a separate line of business or geographical area.
• Forms part of an individual and coordinated plan to sell or otherwise dispose of a separate line of business or geographical area of operations; or
• Is a subsidiary entity acquired exclusively with a view to its subsequent sale.
In the Consolidated Income Statement for the reporting period and prior-year comparison, the results of discon-tinued operations are reported separately from those of continuing operations.
A) DIVESTMENTS EXECUTED
In the 2020 !nancial year, no divestments from Group compa-nies occurred.
In 2019, the following companies were sold:
• “Apico, LLC”, by agreement signed on 31 July 2019 and completed on 11 September 2019 (see Note 8),
• “Cepsa Panamá, S.A.”, completed on 13 December 2019.
In addition, on 13 October 2019, the then sole shareholder of CEPSA, “Cepsa Holding, LLC” decided to proceed with the dis-tribution of a dividend in kind consisting of all shares of “Medgaz, S.A.” held by the Group to the then Sole Shareholder, charged to voluntary reserves (see Notes 8 and 18.5).
B) ONGOING DIVESTMENTS $ ASSETS HELD FOR SALE
The Company “Cepsa Peruana, S.A.C”, which was recorded as held for sale on 31 December 2019, was reinstated as a Group company for all intents and purposes as of 31 December 2020, as the Board decided to discontinue the sale process.
In 2019, after approval from the Board of Directors in Novem-ber 2019 of the sale of the Group’s interest in “Cepsa Peruana, S.A.C.”, the assets and liabilities this company would have con-tributed to the 2019 Consolidated Balance Sheet were removed from the headings according to their nature and grouped into re-spective headings under current assets and liabilities (ASSETS HELD FOR SALE and LIABILITIES ASSOCIATED WITH ASSETS HELD FOR SALE, respectively).
However, the events of 2020 signi!cantly affected the expected sales transaction. Therefore, the sales transaction was suspend-ed until further notice. Consequently, the company was once again included in the scope of consolidation with full effect, un-der the integration method as at December 2020 and its assets and liabilities included under the corresponding headings. The impact of this inclusion is brie"y described in the corresponding Notes. In 2020, a record was made of the results generated by the company from the date on which it was considered “availa-ble for sale” until its re-inclusion in the Consolidated Group.
Similarly, in !nancial year 2019, at the meeting of the Board of Directors on 26 September 2019, the sale of the Group’s stake in the company “Decal Panama, S.A.” was approved. Said trans-action is pending ful!lment and, as a result, the assets and li-abilities contributed to the Group by said company that were removed from their natural headings on the !nancial year 2019 Consolidated Balance Sheet and transferred to ASSETS HELD FOR SALE and OBLIGATIONS ASSOCIATED WITH ASSETS HELD FOR SALE, respectively, have continued as such in 2020.
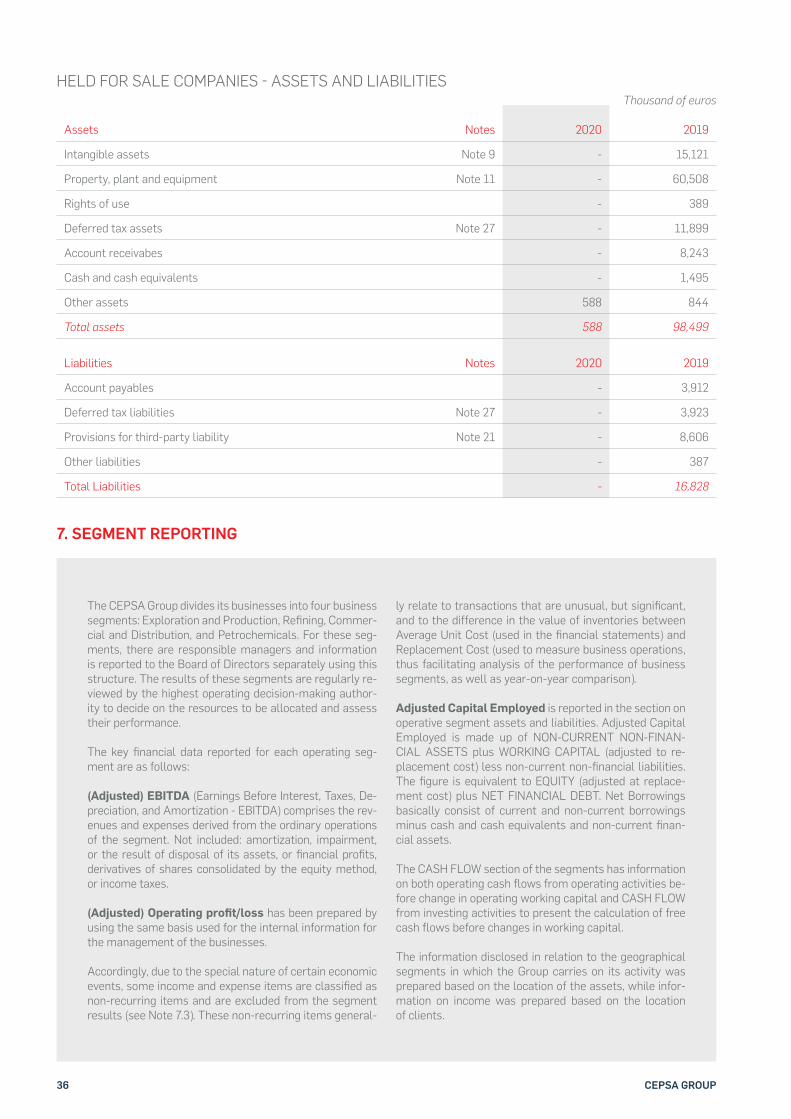
36 CEPSA GROUP
Liabilities Notes 2020 2019
Account payables - 3,912
Deferred tax liabilities Note 27 - 3,923
Provisions for third-party liability Note 21 - 8,606
Other liabilities - 387
Total Liabilities - 16,828
HELD FOR SALE COMPANIES # ASSETS AND LIABILITIES
Assets Notes 2020 2019
Intangible assets Note 9 - 15,121
Property, plant and equipment Note 11 - 60,508
Rights of use - 389
Deferred tax assets Note 27 - 11,899
Account receivabes - 8,243
Cash and cash equivalents - 1,495
Other assets 588 844
Total assets 588 98,499
The CEPSA Group divides its businesses into four business segments: Exploration and Production, Re!ning, Commer-cial and Distribution, and Petrochemicals. For these seg-ments, there are responsible managers and information is reported to the Board of Directors separately using this structure. The results of these segments are regularly re-viewed by the highest operating decision-making author-ity to decide on the resources to be allocated and assess their performance.
The key !nancial data reported for each operating seg-ment are as follows:
(Adjusted) EBITDA (Earnings Before Interest, Taxes, De-preciation, and Amortization - EBITDA) comprises the rev-enues and expenses derived from the ordinary operations of the segment. Not included: amortization, impairment, or the result of disposal of its assets, or !nancial pro!ts, derivatives of shares consolidated by the equity method, or income taxes.
(Adjusted) Operating pro!t/loss has been prepared by using the same basis used for the internal information for the management of the businesses.
Accordingly, due to the special nature of certain economic events, some income and expense items are classi!ed as non-recurring items and are excluded from the segment results (see Note 7.3). These non-recurring items general-
ly relate to transactions that are unusual, but signi!cant, and to the difference in the value of inventories between Average Unit Cost (used in the !nancial statements) and Replacement Cost (used to measure business operations, thus facilitating analysis of the performance of business segments, as well as year-on-year comparison).
Adjusted Capital Employed is reported in the section on operative segment assets and liabilities. Adjusted Capital Employed is made up of NON-CURRENT NON-FINAN-CIAL ASSETS plus WORKING CAPITAL (adjusted to re-placement cost) less non-current non-!nancial liabilities. The !gure is equivalent to EQUITY (adjusted at replace-ment cost) plus NET FINANCIAL DEBT. Net Borrowings basically consist of current and non-current borrowings minus cash and cash equivalents and non-current !nan-cial assets.
The CASH FLOW section of the segments has information on both operating cash "ows from operating activities be-fore change in operating working capital and CASH FLOW from investing activities to present the calculation of free cash "ows before changes in working capital.
The information disclosed in relation to the geographical segments in which the Group carries on its activity was prepared based on the location of the assets, while infor-mation on income was prepared based on the location of clients.
7. SEGMENT REPORTING
Thousand of euros
37CONSOLIDATED FINANCIAL STATEMENTS 2020
7.1. BUSINESS SEGMENT REPORTING
The activities of the CEPSA Group’s business segments are:
• Exploration and production includes exploration, development, and production of crude oil and natural gas reserves.
• Refining comprises the supply and refining activities of crude oil products and their export, sale of manufacturing surpluses, trading activities (more than 85% of the volume of operations is for refining activity), generation of electrical energy (70% of electricity refining consumption is equivalent to the energy produced by Gas and Electricity activities) and steam, activities that play a very important role in production processes and sales to industrial customers.
• Commercial and distribution contains the distribution and commercialization activity of oil and gas products.
• Petrochemicals consist of production, distribution, and sale of petrochemical and oleochemical products.
Lastly, the amounts for corporate functions carried out by the parent company are reported under Corporation, which is not a business segment.
The selling prices applied to transactions between these report-ing business segments are valued at market prices, and income, expenses, assets, and liabilities have been determined before the eliminations on consolidation, except for the internal eliminations of each business segment.
The segments have been de!ned on the basis of the delimita-tion of different activities that generate income and expenses, and also on the basis of the structure approved by the Board of Directors for the best management of each business. The man-agement team (Management Committees for each segment) analyses the main operational and !nancial magnitudes for deci-sion-making on resource allocation and performance assessment of the Group. The Group has not performed segment groupings for the presentation of the information.
The following breakdown shows information as of December 31, 2020 and 2019, by segment and, in terms of the net pro!t attributable to the parent company, the pro!t obtained in accordance with IFRS, and the pro!t adjusted to the management approach (next two pages):
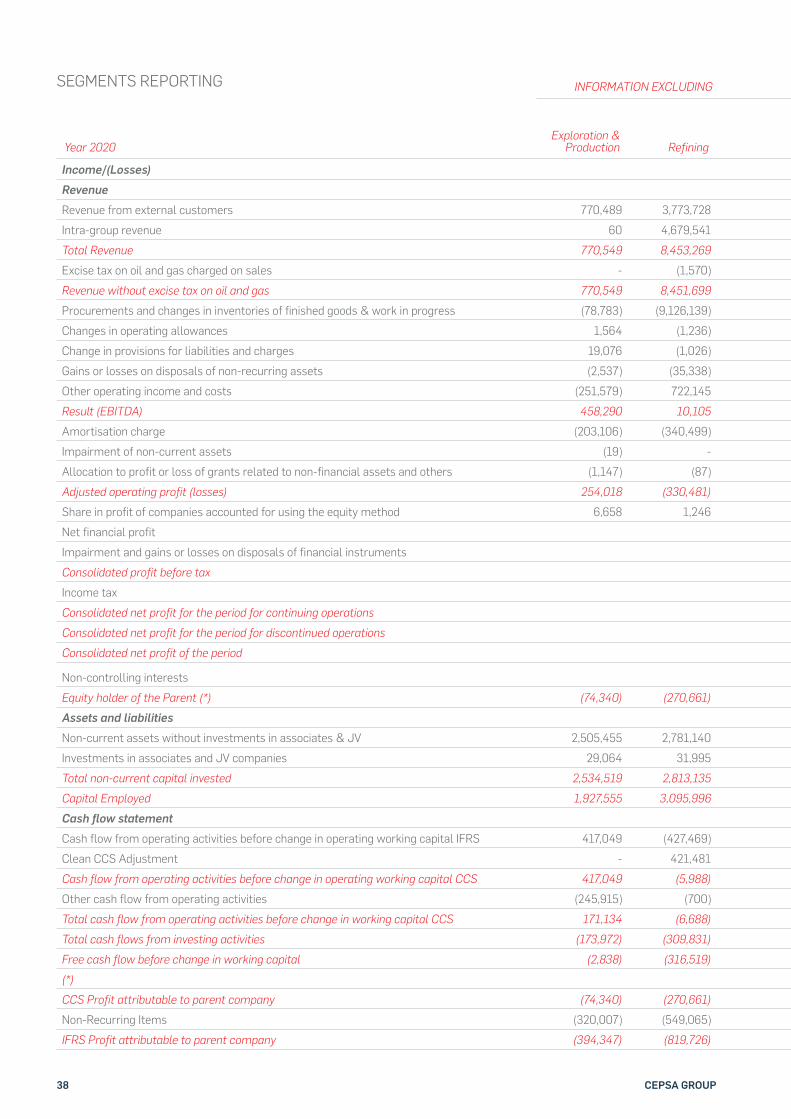
38 CEPSA GROUP
INFORMATION EXCLUDING CCS ADJUSTMENTS AND NON!RECURRING ITEMS
Year 2020 Exploration &
Production Refining Commercial Petrochemical Corporation Intra-Group Eliminations Total
CCSAdjustments
Non-Recurring Items
Total Consolidated
Income/(Losses) Revenue Revenue from external customers 770,489 3,773,728 9,259,001 1,953,833 3,093 - 15,760,144 - 15,760,144 Intra-group revenue 60 4,679,541 31,325 593,930 59,951 (5,364,807) - - - Total Revenue 770,549 8,453,269 9,290,326 2,547,763 63,044 (5,364,807) 15,760,144 - 15,760,144 Excise tax on oil and gas charged on sales - (1,570) (2,115,319) - - - (2,116,889) - (2,116,889)Revenue without excise tax on oil and gas 770,549 8,451,699 7,175,007 2,547,763 63,044 (5,364,807) 13,643,255 - 13,643,255 Procurements and changes in inventories of finished goods & work in progress (78,783) (9,126,139) (4,414,889) (1,812,003) (717) 5,181,414 (10,251,117) (450,242) (10,701,359)Changes in operating allowances 1,564 (1,236) (1,091) 313 653 - 203 (60,937) (60,734)Change in provisions for liabilities and charges 19,076 (1,026) (5,707) (223) 5,683 - 17,803 - 17,803 Gains or losses on disposals of non-recurring assets (2,537) (35,338) 6,442 (7,333) - - (38,766) - (38,766)Other operating income and costs (251,579) 722,145 (2,360,161) (371,101) (107,405) 183,393 (2,184,708) (53,206) (2,237,914)Result (EBITDA) 458,290 10,105 399,601 357,416 (38,742) - 1,186,670 (564,385) 622,285 Amortisation charge (203,106) (340,499) (164,268) (83,234) (883) - (791,990) - (791,990)Impairment of non-current assets (19) - 392 - - - 373 (648,227) (647,854)Allocation to profit or loss of grants related to non-financial assets and others (1,147) (87) (808) (191) (2,300) - (4,533) - (4,533)Adjusted operating profit (losses) 254,018 (330,481) 234,917 273,991 (41,925) - 390,520 (1,212,612) (822,092)Share in profit of companies accounted for using the equity method 6,658 1,246 3,073 (254) - - 10,723 (58,847) (48,124)Net financial profit (132,903) - (132,903)Impairment and gains or losses on disposals of financial instruments (157) - (157)Consolidated profit before tax 268,183 (1,271,459) (1,003,276)Income tax (258,293) 346,762 88,469 Consolidated net profit for the period for continuing operations 9,890 (924,697) (914,807)Consolidated net profit for the period for discontinued operations - - - Consolidated net profit of the period 9,890 (924,697) (914,807)
Non-controlling interests (8,453) 4,502 (3,951)Equity holder of the Parent (*) (74,340) (270,661) 168,802 204,702 (27,066) - 1,437 (920,195) (918,758)Assets and liabilities Non-current assets without investments in associates & JV 2,505,455 2,781,140 1,574,052 921,015 73,080 - 7,854,742 98,195 7,952,937 Investments in associates and JV companies 29,064 31,995 58,150 111,057 - - 230,266 - 230,266 Total non-current capital invested 2,534,519 2,813,135 1,632,202 1,032,072 73,080 - 8,085,008 98,195 8,183,203 Capital Employed 1,927,555 3,095,996 1,420,308 1,267,338 14,102 - 7,725,299 (245,741) 7,479,558 Cash flow statement Cash flow from operating activities before change in operating working capital IFRS 417,049 (427,469) 411,959 315,769 (56,567) - 660,741 Clean CCS Adjustment - 421,481 (13,196) 41,957 - - 450,242 Cash flow from operating activities before change in operating working capital CCS 417,049 (5,988) 398,763 357,726 (56,567) - 1,110,983 Other cash flow from operating activities (245,915) (700) (2,327) 4,076 253 - (244,613)Total cash flow from operating activities before change in working capital CCS 171,134 (6,688) 396,436 361,802 (56,314) - 866,370 Total cash flows from investing activities (173,972) (309,831) (138,145) (107,317) (29,791) - (759,056)Free cash flow before change in working capital (2,838) (316,519) 258,291 254,485 (86,105) - 107,314 (*)CCS Profit attributable to parent company (74,340) (270,661) 168,802 204,702 (27,066) 1,437 Non-Recurring Items (320,007) (549,065) (9,155) (29,594) (12,374) (920,195)IFRS Profit attributable to parent company (394,347) (819,726) 159,647 175,108 (39,440) (918,758)
SEGMENTS REPORTING
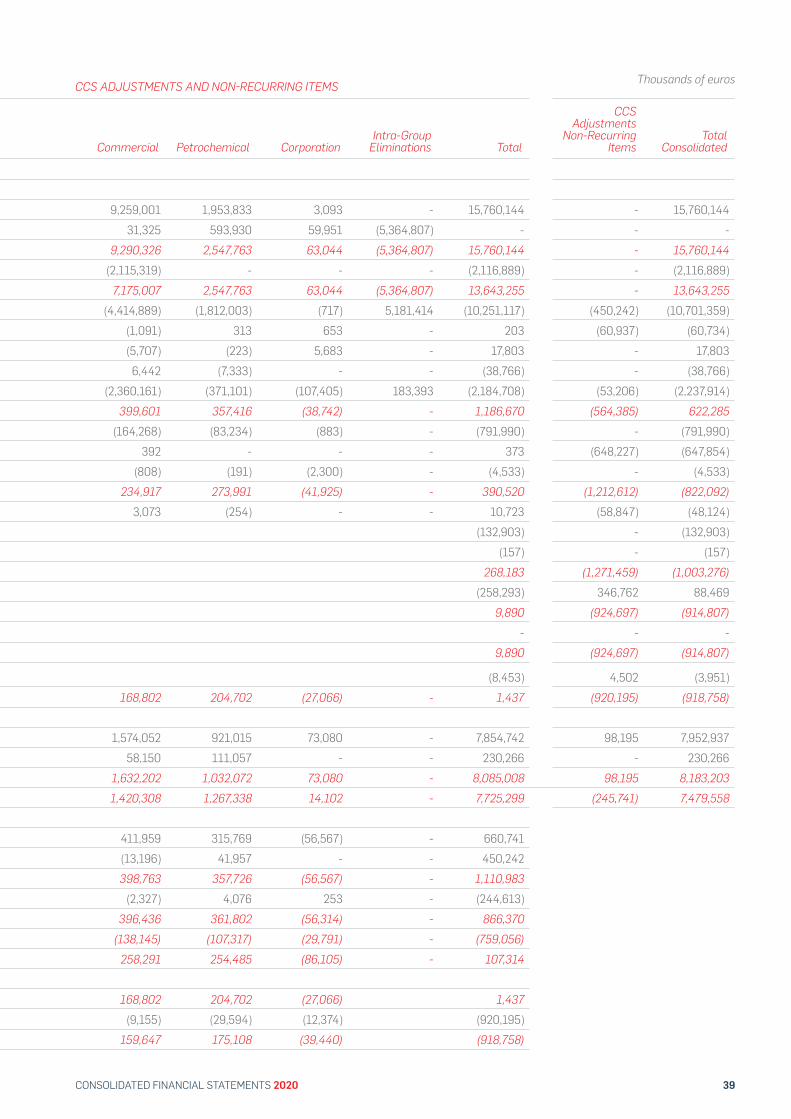
39CONSOLIDATED FINANCIAL STATEMENTS 2020
INFORMATION EXCLUDING CCS ADJUSTMENTS AND NON!RECURRING ITEMS
Year 2020 Exploration &
Production Refining Commercial Petrochemical Corporation Intra-Group Eliminations Total
CCSAdjustments
Non-Recurring Items
Total Consolidated
Income/(Losses) Revenue Revenue from external customers 770,489 3,773,728 9,259,001 1,953,833 3,093 - 15,760,144 - 15,760,144 Intra-group revenue 60 4,679,541 31,325 593,930 59,951 (5,364,807) - - - Total Revenue 770,549 8,453,269 9,290,326 2,547,763 63,044 (5,364,807) 15,760,144 - 15,760,144 Excise tax on oil and gas charged on sales - (1,570) (2,115,319) - - - (2,116,889) - (2,116,889)Revenue without excise tax on oil and gas 770,549 8,451,699 7,175,007 2,547,763 63,044 (5,364,807) 13,643,255 - 13,643,255 Procurements and changes in inventories of finished goods & work in progress (78,783) (9,126,139) (4,414,889) (1,812,003) (717) 5,181,414 (10,251,117) (450,242) (10,701,359)Changes in operating allowances 1,564 (1,236) (1,091) 313 653 - 203 (60,937) (60,734)Change in provisions for liabilities and charges 19,076 (1,026) (5,707) (223) 5,683 - 17,803 - 17,803 Gains or losses on disposals of non-recurring assets (2,537) (35,338) 6,442 (7,333) - - (38,766) - (38,766)Other operating income and costs (251,579) 722,145 (2,360,161) (371,101) (107,405) 183,393 (2,184,708) (53,206) (2,237,914)Result (EBITDA) 458,290 10,105 399,601 357,416 (38,742) - 1,186,670 (564,385) 622,285 Amortisation charge (203,106) (340,499) (164,268) (83,234) (883) - (791,990) - (791,990)Impairment of non-current assets (19) - 392 - - - 373 (648,227) (647,854)Allocation to profit or loss of grants related to non-financial assets and others (1,147) (87) (808) (191) (2,300) - (4,533) - (4,533)Adjusted operating profit (losses) 254,018 (330,481) 234,917 273,991 (41,925) - 390,520 (1,212,612) (822,092)Share in profit of companies accounted for using the equity method 6,658 1,246 3,073 (254) - - 10,723 (58,847) (48,124)Net financial profit (132,903) - (132,903)Impairment and gains or losses on disposals of financial instruments (157) - (157)Consolidated profit before tax 268,183 (1,271,459) (1,003,276)Income tax (258,293) 346,762 88,469 Consolidated net profit for the period for continuing operations 9,890 (924,697) (914,807)Consolidated net profit for the period for discontinued operations - - - Consolidated net profit of the period 9,890 (924,697) (914,807)
Non-controlling interests (8,453) 4,502 (3,951)Equity holder of the Parent (*) (74,340) (270,661) 168,802 204,702 (27,066) - 1,437 (920,195) (918,758)Assets and liabilities Non-current assets without investments in associates & JV 2,505,455 2,781,140 1,574,052 921,015 73,080 - 7,854,742 98,195 7,952,937 Investments in associates and JV companies 29,064 31,995 58,150 111,057 - - 230,266 - 230,266 Total non-current capital invested 2,534,519 2,813,135 1,632,202 1,032,072 73,080 - 8,085,008 98,195 8,183,203 Capital Employed 1,927,555 3,095,996 1,420,308 1,267,338 14,102 - 7,725,299 (245,741) 7,479,558 Cash flow statement Cash flow from operating activities before change in operating working capital IFRS 417,049 (427,469) 411,959 315,769 (56,567) - 660,741 Clean CCS Adjustment - 421,481 (13,196) 41,957 - - 450,242 Cash flow from operating activities before change in operating working capital CCS 417,049 (5,988) 398,763 357,726 (56,567) - 1,110,983 Other cash flow from operating activities (245,915) (700) (2,327) 4,076 253 - (244,613)Total cash flow from operating activities before change in working capital CCS 171,134 (6,688) 396,436 361,802 (56,314) - 866,370 Total cash flows from investing activities (173,972) (309,831) (138,145) (107,317) (29,791) - (759,056)Free cash flow before change in working capital (2,838) (316,519) 258,291 254,485 (86,105) - 107,314 (*)CCS Profit attributable to parent company (74,340) (270,661) 168,802 204,702 (27,066) 1,437 Non-Recurring Items (320,007) (549,065) (9,155) (29,594) (12,374) (920,195)IFRS Profit attributable to parent company (394,347) (819,726) 159,647 175,108 (39,440) (918,758)
Thousands of euros
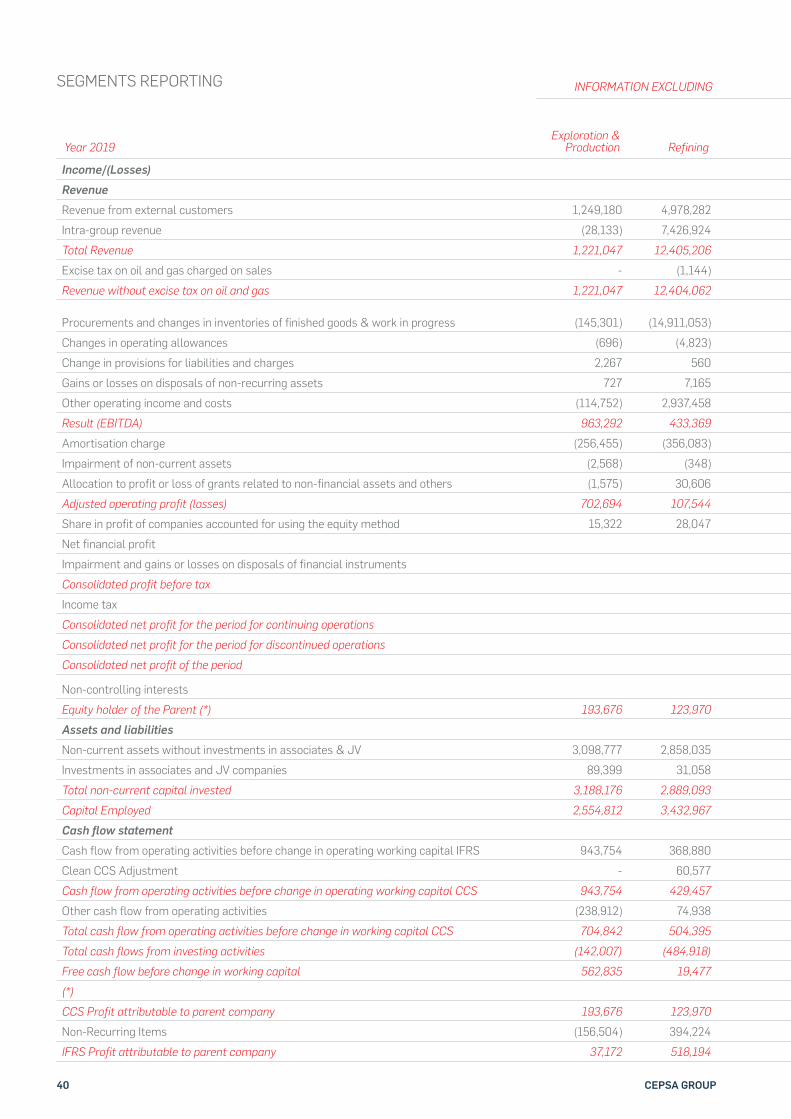
40 CEPSA GROUP
INFORMATION EXCLUDING CCS ADJUSTMENTS AND NON!RECURRING ITEMS
Year 2019 Exploration &
Production Refining Commercial Petrochemical Corporation Intra-Group Eliminations Total
CCSAdjustments
Non-Recurring Items
Total Consolidated
Income/(Losses) Revenue Revenue from external customers 1,249,180 4,978,282 15,219,133 2,406,805 3,987 - 23,857,387 - 23,857,387 Intra-group revenue (28,133) 7,426,924 212,685 1,070,376 63,893 (8,745,745) - - - Total Revenue 1,221,047 12,405,206 15,431,818 3,477,181 67,880 (8,745,745) 23,857,387 - 23,857,387 Excise tax on oil and gas charged on sales - (1,144) (2,698,684) - - - (2,699,828) - (2,699,828)Revenue without excise tax on oil and gas 1,221,047 12,404,062 12,733,134 3,477,181 67,880 (8,745,745) 21,157,559 - 21,157,559
Procurements and changes in inventories of finished goods & work in progress (145,301)
(14,911,053) (6,867,499) (2,835,816) (946) 8,084,801 (16,675,814) (89,994)
(16,765,808)Changes in operating allowances (696) (4,823) (3,798) 2,673 619 - (6,025) 24,201 18,176 Change in provisions for liabilities and charges 2,267 560 4,524 1,448 - - 8,799 - 8,799 Gains or losses on disposals of non-recurring assets 727 7,165 (125) (4,494) 7 - 3,280 - 3,280 Other operating income and costs (114,752) 2,937,458 (5,403,221) (394,545) (115,672) 660,944 (2,429,788) 11,790 (2,417,998)Result (EBITDA) 963,292 433,369 463,015 246,447 (48,112) - 2,058,011 (54,003) 2,004,008 Amortisation charge (256,455) (356,083) (133,851) (83,221) (505) - (830,115) - (830,115)Impairment of non-current assets (2,568) (348) 540 8,805 - - 6,429 (97,954) (91,525)Allocation to profit or loss of grants related to non-financial assets and others (1,575) 30,606 (25,533) (9,498) (9,607) - (15,607) - (15,607)Adjusted operating profit (losses) 702,694 107,544 304,171 162,533 (58,224) - 1,218,718 (151,957) 1,066,761 Share in profit of companies accounted for using the equity method 15,322 28,047 393 (6,078) - - 37,684 (60,926) (23,242)Net financial profit (113,932) - (113,932)Impairment and gains or losses on disposals of financial instruments 906 406,143 407,049 Consolidated profit before tax 1,143,376 193,260 1,336,636 Income tax (515,048) 12,033 (503,015)Consolidated net profit for the period for continuing operations 628,328 205,293 833,621 Consolidated net profit for the period for discontinued operations - - - Consolidated net profit of the period 628,328 205,293 833,621
Non-controlling interests (18,001) 4,403 (13,598)Equity holder of the Parent (*) 193,676 123,970 220,987 106,867 (35,173) - 610,327 209,696 820,023 Assets and liabilities Non-current assets without investments in associates & JV 3,098,777 2,858,035 1,677,603 940,093 58,564 - 8,633,072 (23,809) 8,609,263 Investments in associates and JV companies 89,399 31,058 20,440 127,711 - - 268,608 - 268,608 Total non-current capital invested 3,188,176 2,889,093 1,698,043 1,067,804 58,564 - 8,901,680 (23,809) 8,877,871 Capital Employed 2,554,812 3,432,967 1,253,605 1,381,901 52,371 - 8,675,656 131,822 8,807,478 Cash flow statement Cash flow from operating activities before change in operating working capital IFRS 943,754 368,880 438,545 234,996 (45,646) - 1,940,529 Clean CCS Adjustment - 60,577 21,578 7,839 - - 89,994 Cash flow from operating activities before change in operating working capital CCS 943,754 429,457 460,123 242,835 (45,646) - 2,030,523 Other cash flow from operating activities (238,912) 74,938 (73,729) (30,022) 10,003 - (257,722)Total cash flow from operating activities before change in working capital CCS 704,842 504,395 386,394 212,813 (35,643) - 1,772,801 Total cash flows from investing activities (142,007) (484,918) (170,280) (88,708) (40,771) - (926,684)Free cash flow before change in working capital 562,835 19,477 216,114 124,105 (76,414) - 846,117 (*)CCS Profit attributable to parent company 193,676 123,970 220,987 106,867 (35,173) 610,327 Non-Recurring Items (156,504) 394,224 (20,621) (16,246) 8,843 209,696 IFRS Profit attributable to parent company 37,172 518,194 200,366 90,621 (26,330) 820,023
SEGMENTS REPORTING
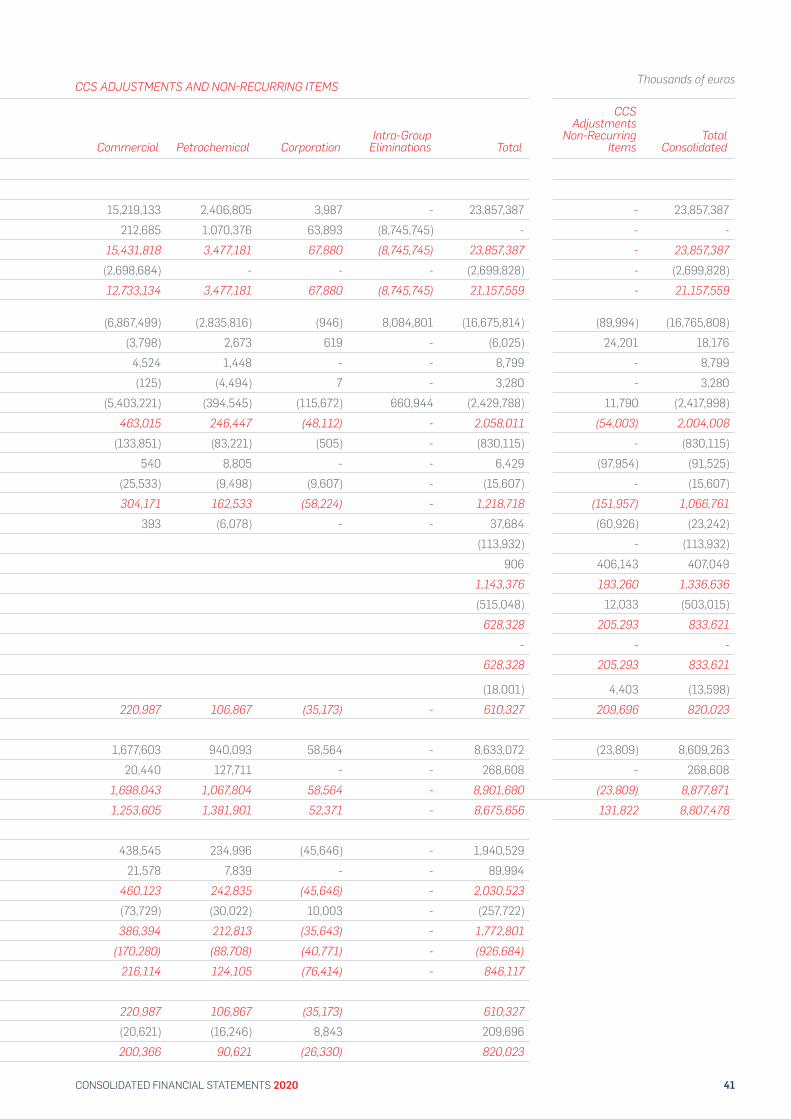
41CONSOLIDATED FINANCIAL STATEMENTS 2020
INFORMATION EXCLUDING CCS ADJUSTMENTS AND NON!RECURRING ITEMS
Year 2019 Exploration &
Production Refining Commercial Petrochemical Corporation Intra-Group Eliminations Total
CCSAdjustments
Non-Recurring Items
Total Consolidated
Income/(Losses) Revenue Revenue from external customers 1,249,180 4,978,282 15,219,133 2,406,805 3,987 - 23,857,387 - 23,857,387 Intra-group revenue (28,133) 7,426,924 212,685 1,070,376 63,893 (8,745,745) - - - Total Revenue 1,221,047 12,405,206 15,431,818 3,477,181 67,880 (8,745,745) 23,857,387 - 23,857,387 Excise tax on oil and gas charged on sales - (1,144) (2,698,684) - - - (2,699,828) - (2,699,828)Revenue without excise tax on oil and gas 1,221,047 12,404,062 12,733,134 3,477,181 67,880 (8,745,745) 21,157,559 - 21,157,559
Procurements and changes in inventories of finished goods & work in progress (145,301)
(14,911,053) (6,867,499) (2,835,816) (946) 8,084,801 (16,675,814) (89,994)
(16,765,808)Changes in operating allowances (696) (4,823) (3,798) 2,673 619 - (6,025) 24,201 18,176 Change in provisions for liabilities and charges 2,267 560 4,524 1,448 - - 8,799 - 8,799 Gains or losses on disposals of non-recurring assets 727 7,165 (125) (4,494) 7 - 3,280 - 3,280 Other operating income and costs (114,752) 2,937,458 (5,403,221) (394,545) (115,672) 660,944 (2,429,788) 11,790 (2,417,998)Result (EBITDA) 963,292 433,369 463,015 246,447 (48,112) - 2,058,011 (54,003) 2,004,008 Amortisation charge (256,455) (356,083) (133,851) (83,221) (505) - (830,115) - (830,115)Impairment of non-current assets (2,568) (348) 540 8,805 - - 6,429 (97,954) (91,525)Allocation to profit or loss of grants related to non-financial assets and others (1,575) 30,606 (25,533) (9,498) (9,607) - (15,607) - (15,607)Adjusted operating profit (losses) 702,694 107,544 304,171 162,533 (58,224) - 1,218,718 (151,957) 1,066,761 Share in profit of companies accounted for using the equity method 15,322 28,047 393 (6,078) - - 37,684 (60,926) (23,242)Net financial profit (113,932) - (113,932)Impairment and gains or losses on disposals of financial instruments 906 406,143 407,049 Consolidated profit before tax 1,143,376 193,260 1,336,636 Income tax (515,048) 12,033 (503,015)Consolidated net profit for the period for continuing operations 628,328 205,293 833,621 Consolidated net profit for the period for discontinued operations - - - Consolidated net profit of the period 628,328 205,293 833,621
Non-controlling interests (18,001) 4,403 (13,598)Equity holder of the Parent (*) 193,676 123,970 220,987 106,867 (35,173) - 610,327 209,696 820,023 Assets and liabilities Non-current assets without investments in associates & JV 3,098,777 2,858,035 1,677,603 940,093 58,564 - 8,633,072 (23,809) 8,609,263 Investments in associates and JV companies 89,399 31,058 20,440 127,711 - - 268,608 - 268,608 Total non-current capital invested 3,188,176 2,889,093 1,698,043 1,067,804 58,564 - 8,901,680 (23,809) 8,877,871 Capital Employed 2,554,812 3,432,967 1,253,605 1,381,901 52,371 - 8,675,656 131,822 8,807,478 Cash flow statement Cash flow from operating activities before change in operating working capital IFRS 943,754 368,880 438,545 234,996 (45,646) - 1,940,529 Clean CCS Adjustment - 60,577 21,578 7,839 - - 89,994 Cash flow from operating activities before change in operating working capital CCS 943,754 429,457 460,123 242,835 (45,646) - 2,030,523 Other cash flow from operating activities (238,912) 74,938 (73,729) (30,022) 10,003 - (257,722)Total cash flow from operating activities before change in working capital CCS 704,842 504,395 386,394 212,813 (35,643) - 1,772,801 Total cash flows from investing activities (142,007) (484,918) (170,280) (88,708) (40,771) - (926,684)Free cash flow before change in working capital 562,835 19,477 216,114 124,105 (76,414) - 846,117 (*)CCS Profit attributable to parent company 193,676 123,970 220,987 106,867 (35,173) 610,327 Non-Recurring Items (156,504) 394,224 (20,621) (16,246) 8,843 209,696 IFRS Profit attributable to parent company 37,172 518,194 200,366 90,621 (26,330) 820,023
Thousands of euros
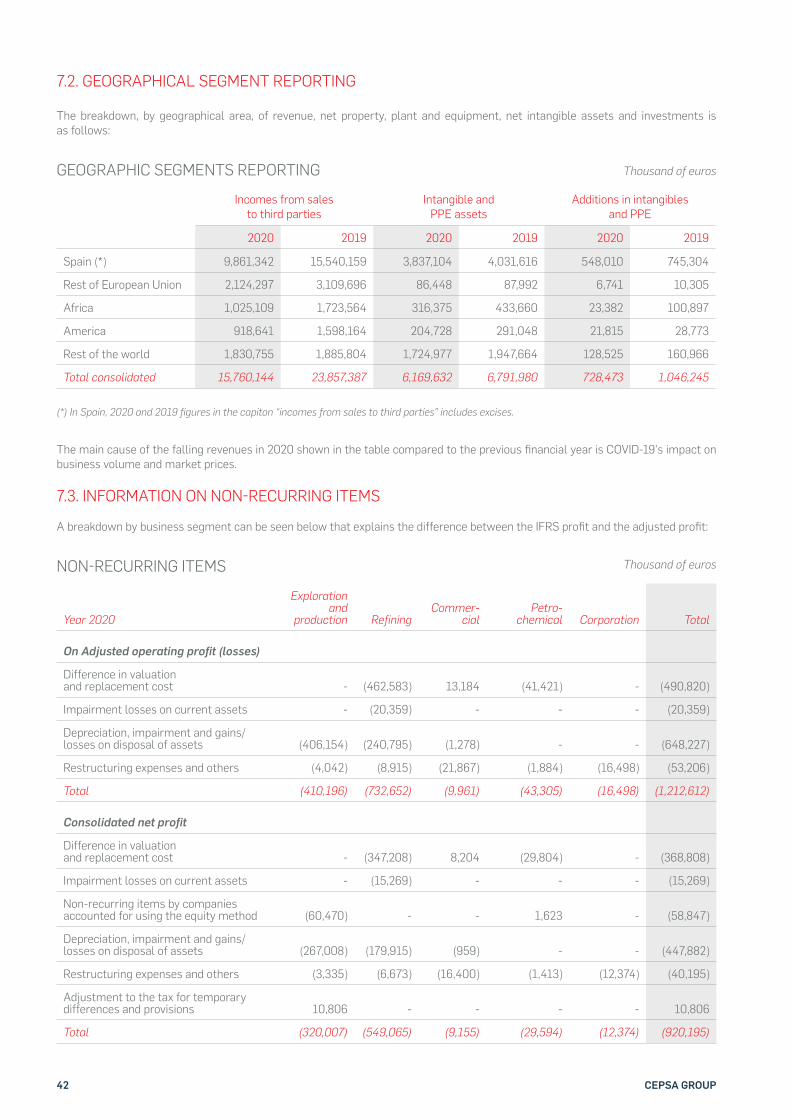
42 CEPSA GROUP
7.2. GEOGRAPHICAL SEGMENT REPORTING
The breakdown, by geographical area, of revenue, net property, plant and equipment, net intangible assets and investments is as follows:
GEOGRAPHIC SEGMENTS REPORTING
NON#RECURRING ITEMS
Incomes from sales to third parties
Intangible and PPE assets
Additions in intangibles and PPE
2020 2019 2020 2019 2020 2019
Spain (*) 9,861,342 15,540,159 3,837,104 4,031,616 548,010 745,304
Rest of European Union 2,124,297 3,109,696 86,448 87,992 6,741 10,305
Africa 1,025,109 1,723,564 316,375 433,660 23,382 100,897
America 918,641 1,598,164 204,728 291,048 21,815 28,773
Rest of the world 1,830,755 1,885,804 1,724,977 1,947,664 128,525 160,966
Total consolidated 15,760,144 23,857,387 6,169,632 6,791,980 728,473 1,046,245
Thousand of euros
Thousand of euros
(*) In Spain, 2020 and 2019 figures in the capiton “incomes from sales to third parties” includes excises.
The main cause of the falling revenues in 2020 shown in the table compared to the previous !nancial year is COVID-19’s impact on business volume and market prices.
7.3. INFORMATION ON NON#RECURRING ITEMS
A breakdown by business segment can be seen below that explains the difference between the IFRS pro!t and the adjusted pro!t:
Year 2020
Exploration and
production RefiningCommer-
cialPetro-
chemical Corporation Total
On Adjusted operating profit (losses)
Difference in valuation and replacement cost - (462,583) 13,184 (41,421) - (490,820)
Impairment losses on current assets - (20,359) - - - (20,359)
Depreciation, impairment and gains/losses on disposal of assets (406,154) (240,795) (1,278) - - (648,227)
Restructuring expenses and others (4,042) (8,915) (21,867) (1,884) (16,498) (53,206)
Total (410,196) (732,652) (9,961) (43,305) (16,498) (1,212,612)
Consolidated net profit
Difference in valuation and replacement cost - (347,208) 8,204 (29,804) - (368,808)
Impairment losses on current assets - (15,269) - - - (15,269)
Non-recurring items by companies accounted for using the equity method (60,470) - - 1,623 - (58,847)
Depreciation, impairment and gains/losses on disposal of assets (267,008) (179,915) (959) - - (447,882)
Restructuring expenses and others (3,335) (6,673) (16,400) (1,413) (12,374) (40,195)
Adjustment to the tax for temporary differences and provisions 10,806 - - - - 10,806
Total (320,007) (549,065) (9,155) (29,594) (12,374) (920,195)
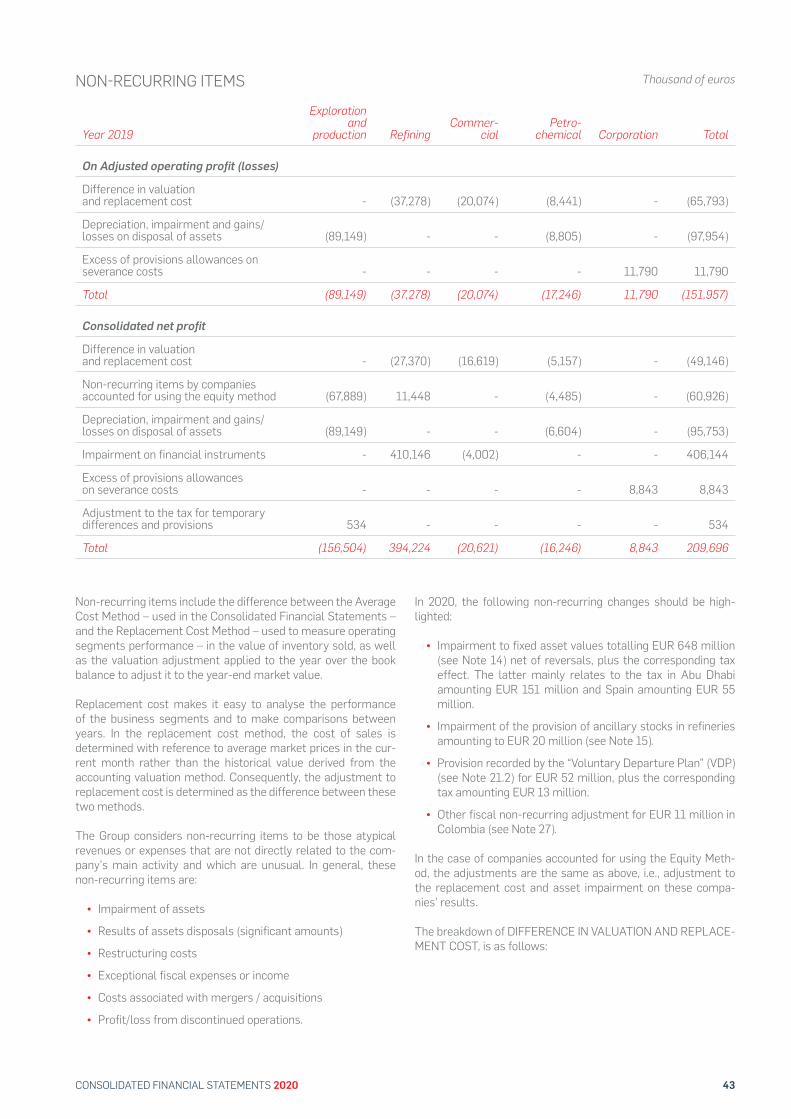
43CONSOLIDATED FINANCIAL STATEMENTS 2020
Non-recurring items include the difference between the Average Cost Method – used in the Consolidated Financial Statements – and the Replacement Cost Method – used to measure operating segments performance – in the value of inventory sold, as well as the valuation adjustment applied to the year over the book balance to adjust it to the year-end market value.
Replacement cost makes it easy to analyse the performance of the business segments and to make comparisons between years. In the replacement cost method, the cost of sales is determined with reference to average market prices in the cur-rent month rather than the historical value derived from the accounting valuation method. Consequently, the adjustment to replacement cost is determined as the difference between these two methods.
The Group considers non-recurring items to be those atypical revenues or expenses that are not directly related to the com-pany’s main activity and which are unusual. In general, these non-recurring items are:
• Impairment of assets
• Results of assets disposals (significant amounts)
• Restructuring costs
• Exceptional fiscal expenses or income
• Costs associated with mergers / acquisitions
• Profit/loss from discontinued operations.
In 2020, the following non-recurring changes should be high-lighted:
• Impairment to fixed asset values totalling EUR 648 million (see Note 14) net of reversals, plus the corresponding tax effect. The latter mainly relates to the tax in Abu Dhabi amounting EUR 151 million and Spain amounting EUR 55 million.
• Impairment of the provision of ancillary stocks in refineries amounting to EUR 20 million (see Note 15).
• Provision recorded by the “Voluntary Departure Plan” (VDP) (see Note 21.2) for EUR 52 million, plus the corresponding tax amounting EUR 13 million.
• Other fiscal non-recurring adjustment for EUR 11 million in Colombia (see Note 27).
In the case of companies accounted for using the Equity Meth-od, the adjustments are the same as above, i.e., adjustment to the replacement cost and asset impairment on these compa-nies’ results.
The breakdown of DIFFERENCE IN VALUATION AND REPLACE-MENT COST, is as follows:
NON#RECURRING ITEMS Thousand of euros
Year 2019
Exploration and
production RefiningCommer-
cialPetro-
chemical Corporation Total
On Adjusted operating profit (losses)
Difference in valuation and replacement cost - (37,278) (20,074) (8,441) - (65,793)
Depreciation, impairment and gains/losses on disposal of assets (89,149) - - (8,805) - (97,954)
Excess of provisions allowances on severance costs - - - - 11,790 11,790
Total (89,149) (37,278) (20,074) (17,246) 11,790 (151,957)
Consolidated net profit
Difference in valuation and replacement cost - (27,370) (16,619) (5,157) - (49,146)
Non-recurring items by companies accounted for using the equity method (67,889) 11,448 - (4,485) - (60,926)
Depreciation, impairment and gains/losses on disposal of assets (89,149) - - (6,604) - (95,753)
Impairment on financial instruments - 410,146 (4,002) - - 406,144
Excess of provisions allowances on severance costs - - - - 8,843 8,843
Adjustment to the tax for temporary differences and provisions 534 - - - - 534
Total (156,504) 394,224 (20,621) (16,246) 8,843 209,696

44 CEPSA GROUP
DIFFERENCE IN VALUATION AND REPLACEMENT COST Thousand of euros
Year 2020 Refining Commercial Petro-chemical Total
On Result (EBITDA)
Changes in inventory (421,481) 13,196 (41,957) (450,242)
Changes in inventory impairment (41,102) (12) 536 (40,578)
Total (462,583) 13,184 (41,421) (490,820)
Year 2019 Refining Commercial Petro-chemical Total
Profit from operations
Changes in inventory (60,577) (21,578) (7,839) (89,994)
Changes in inventory impairment 23,299 1,504 (602) 24,201
Total (37,278) (20,074) (8,441) (65,793)
45CONSOLIDATED FINANCIAL STATEMENTS 2020
8. INVESTMENTS IN ASSOCIATES AND JOINT VENTURES
• ACCOUNTING POLICIES
A) ASSOCIATES
An associate is a company in which the Group has a !nan-cial interest that does not grant it control but that, never-theless, does allow it to exercise signi!cant in"uence (see Note 4.1).
Investments in an associate are accounted for using the equity method, which is described below within the policies applicable to joint ventures.
B) JOINT ARRANGEMENTS
Under IFRS 11, joint arrangements are classi!ed as either joint operations or joint ventures. The classi!cation de-pends on the contractual rights and obligations of each in-vestor within the arrangement, rather than the legal struc-ture of the joint arrangement. CEPSA has equity interests in both modalities. A fundamental feature of joint arrange-ments is the existence of two or more parties exercising joint control.
Joint control is the contractually agreed sharing of con-trol of an economic unit, which exists only when decisions about the relevant activities of said unit require the unani-mous consent of the parties sharing control.
A joint operation is a type of joint arrangement whereby the parties that have joint control of the arrangement have rights to the assets and obligations for the liabilities relating to the arrangement. These parties are called joint opera-tors. The Group works in these types of joint arrangements, particularly in the area of Exploration and Production.
Recognition of Joint Operations. The Group recognizes its:
• Assets, including its share of any assets held jointly;
• Liabilities, including its share of any liabilities incurred jointly;
• Revenue from the sale of its share of the output arising from the joint operation;
• Its share of the revenue from the sale of the output by the joint operation; and
• Its expenses, including its share of any expenses incurred jointly.
In addition, in the consolidation process, balances, reve-nues, expenses and results for operations with companies consolidated by this procedure have been eliminated, de-pending on the stake held.
A joint venture is a type of joint arrangement whereby the parties that have joint control solely have rights to the net assets of the joint venture.
Recognition of Joint Ventures and investments in Associ-ates. The Group uses the Equity Method. Under this meth-od, an investment in a joint venture (and in an associate) is initially recognized at cost. The carrying amount of the investment is adjusted to recognize changes in the Group’s share of the net assets of the joint venture (of the associ-ate) since the acquisition date. The goodwill arising from the interest in the joint venture (or associate) is included in the carrying value of the investment and is not tested for impairment separately.
After applying the equity method, the Group determines whether it is necessary to recognize an impairment loss on its investment in its associate or joint venture. At each reporting date, the Group determines whether there is ob-jective evidence that the investment is impaired. If there is such evidence, the Group calculates the amount of impair-ment as the difference between the recoverable amount of the joint venture (or associate) and its carrying value, then recognizes the loss as SHARE IN PROFITS OF ASSO-CIATES AND JOINT VENTURES in the Income Statement, as a debit. Reversals of impairment amounts recorded in previous periods are calculated and recognized in the same way, as credits.
Upon loss of signi!cant in"uence over the associate or joint control over the joint venture, the Group measures and rec-ognizes any retained investment at its fair value. Any differ-ence between the carrying value of the associate or joint venture upon loss of signi!cant in"uence and the fair value of the retained investment and proceeds from disposal is recognized in the Consolidated Income Statement.
All subsidiaries, associates and jointly controlled entities within the CEPSA Group have a December 31th closing date.
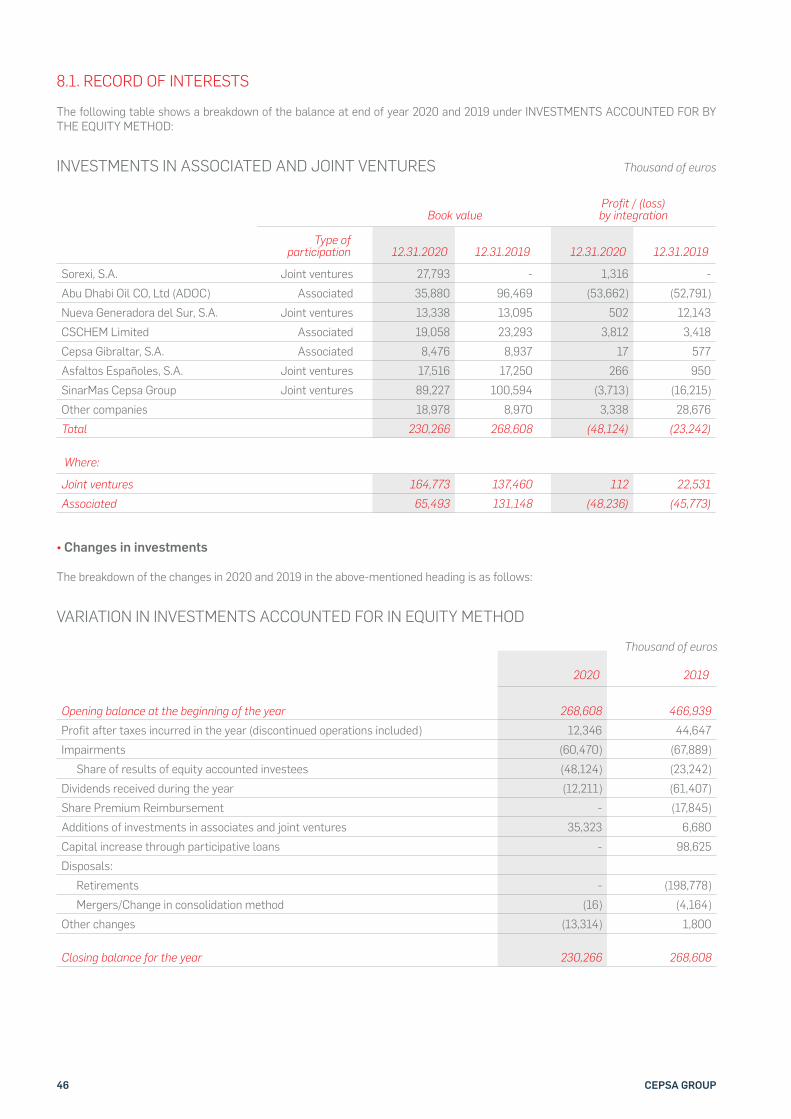
46 CEPSA GROUP
8.1. RECORD OF INTERESTS
The following table shows a breakdown of the balance at end of year 2020 and 2019 under INVESTMENTS ACCOUNTED FOR BY THE EQUITY METHOD:
• Changes in investments
The breakdown of the changes in 2020 and 2019 in the above-mentioned heading is as follows:
Book valueProfit / (loss) by integration
Type of participation 12.31.2020 12.31.2019 12.31.2020 12.31.2019
Sorexi, S.A. Joint ventures 27,793 - 1,316 - Abu Dhabi Oil CO, Ltd (ADOC) Associated 35,880 96,469 (53,662) (52,791)Nueva Generadora del Sur, S.A. Joint ventures 13,338 13,095 502 12,143CSCHEM Limited Associated 19,058 23,293 3,812 3,418 Cepsa Gibraltar, S.A. Associated 8,476 8,937 17 577 Asfaltos Españoles, S.A. Joint ventures 17,516 17,250 266 950 SinarMas Cepsa Group Joint ventures 89,227 100,594 (3,713) (16,215)Other companies 18,978 8,970 3,338 28,676 Total 230,266 268,608 (48,124) (23,242)
Where:
Joint ventures 164,773 137,460 112 22,531 Associated 65,493 131,148 (48,236) (45,773)
2020 2019
Opening balance at the beginning of the year 268,608 466,939 Profit after taxes incurred in the year (discontinued operations included) 12,346 44,647 Impairments (60,470) (67,889)
Share of results of equity accounted investees (48,124) (23,242)Dividends received during the year (12,211) (61,407)Share Premium Reimbursement - (17,845)Additions of investments in associates and joint ventures 35,323 6,680 Capital increase through participative loans - 98,625 Disposals:
Retirements - (198,778)Mergers/Change in consolidation method (16) (4,164)
Other changes (13,314) 1,800
Closing balance for the year 230,266 268,608
INVESTMENTS IN ASSOCIATED AND JOINT VENTURES
VARIATION IN INVESTMENTS ACCOUNTED FOR IN EQUITY METHOD
Thousand of euros
Thousand of euros

47CONSOLIDATED FINANCIAL STATEMENTS 2020
2020 2019
Investments accounted for in equity methodTotal assets 571,264 612,538 Total current and non current liabilities 332,380 311,285
Net assets 238,884 301,253 Total revenues 452,945 339,681
Profit for the year (417,324) (77,659)
Share of results of companies accounted for by using the equity method (discontinued operations included) (48,124) (23,242)
MAIN FIGURES Thousand of euros
In the 2020 !nancial year there were:
• Additional impairments in the Group’s interest in “Abu Dhabi Oil Co. Ltd” (ADOC) amounting EUR 60,470 thousand (see Note 8.3)
• In June 2020, the Group acquired the companies “Sorexi, S.A.” and “Bitulife, S.A.”, which manufacture and sell asphalt in Morocco, for 367,420 thousand Moroccan dirhams (EUR 33,955 thousand) including the capital increase fully subscribed by the CEPSA Group. The purchase agreement contains contingent payments: should the progress of said businesses exceed the expectations agreed upon on the date of sale, additional payments of up to EUR 4.5 million will be due in 2021-2022. Said payments are deemed contingent and catalogue as possible by the Group.
• “Atlas Nord Hydrocarbures, SAS” capital increase
• OTHER CHANGES lists translation differences, mainly from “SinarMas Cepsa”, “CSChem Ltd”, and “Abu Dhabi Oil Co. Ltd” (ADOC).
The most signi!cant changes in 2019 were:
• Divestment from “Medgaz, S.A.” via delivery of all the shares held by the Group as a dividend in kind to the shareholder “Cepsa Holding, LLC” (see Note 6.2 and 18.5), as well as the sale of the interest in “Apico, LLC” (see Note 6.2). These DERECOGNITIONS amount to a reduction under INVESTMENTS ACCOUNTED FOR BY THE EQUITY METHOD of EUR 139,901 thousand and EUR 58,877 thousand, respectively.
• In 2019, a capital increase took place in “SinarMas Cepsa, Pte Ltd” amounting to EUR 98,625 thousand via equity participation loan conversion.
• OTHER CHANGES mainly includes the translation differences for foreign companies, mostly relating to US dollars and Japanese Yen, which arise from the closing rates of two periods.
Other changes can be read in the document «Consolidated Fi-nancial Statements of 2019».
The principal !nancial aggregates, by percentage share, relating to Companies accounted for using the equity method are sum-marized below:
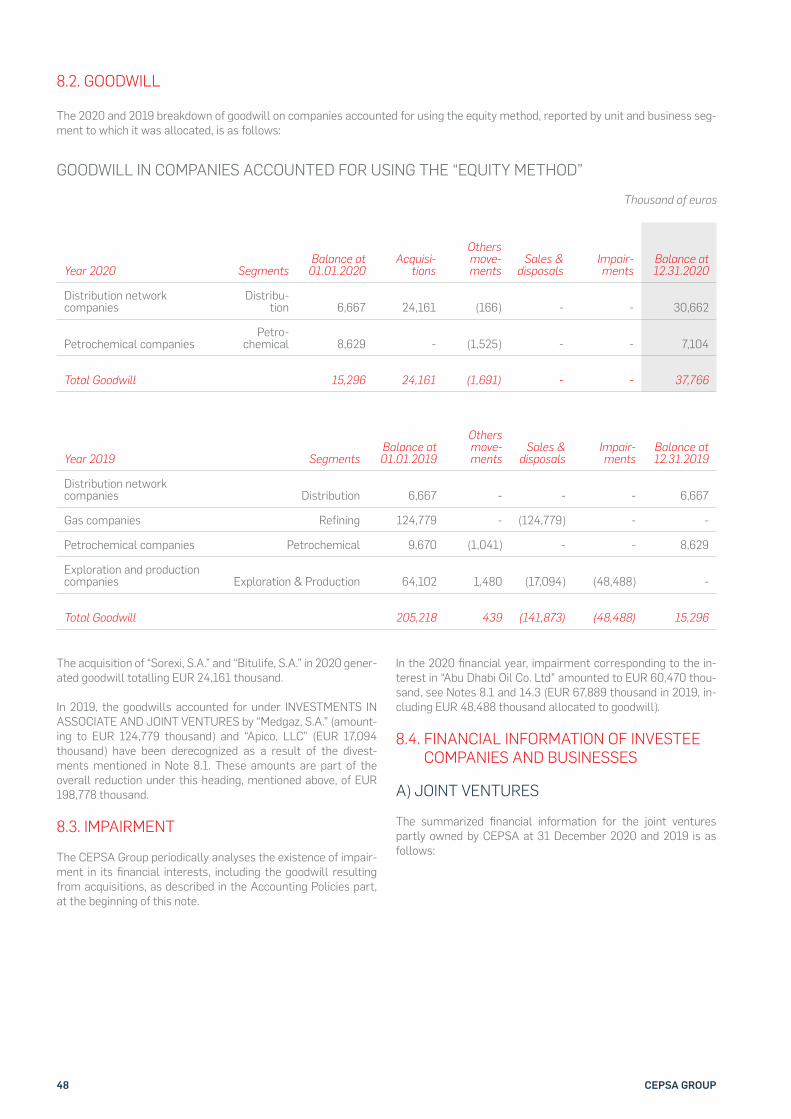
48 CEPSA GROUP
8.2. GOODWILL
The 2020 and 2019 breakdown of goodwill on companies accounted for using the equity method, reported by unit and business seg-ment to which it was allocated, is as follows:
GOODWILL IN COMPANIES ACCOUNTED FOR USING THE “EQUITY METHOD” Thousand of euros
Year 2020 SegmentsBalance at
01.01.2020Acquisi-
tions
Others move-ments
Sales & disposals
Impair- ments
Balance at12.31.2020
Distribution network companies
Distribu-tion 6,667 24,161 (166) - - 30,662
Petrochemical companiesPetro-
chemical 8,629 - (1,525) - - 7,104
Total Goodwill 15,296 24,161 (1,691) - - 37,766
Year 2019 SegmentsBalance at01.01.2019
Others move-ments
Sales & disposals
Impair- ments
Balance at 12.31.2019
Distribution network companies Distribution 6,667 - - - 6,667
Gas companies Refining 124,779 - (124,779) - -
Petrochemical companies Petrochemical 9,670 (1,041) - - 8,629
Exploration and production companies Exploration & Production 64,102 1,480 (17,094) (48,488) -
Total Goodwill 205,218 439 (141,873) (48,488) 15,296
The acquisition of “Sorexi, S.A.” and “Bitulife, S.A.” in 2020 gener-ated goodwill totalling EUR 24,161 thousand.
In 2019, the goodwills accounted for under INVESTMENTS IN ASSOCIATE AND JOINT VENTURES by “Medgaz, S.A.” (amount-ing to EUR 124,779 thousand) and “Apico, LLC” (EUR 17,094 thousand) have been derecognized as a result of the divest-ments mentioned in Note 8.1. These amounts are part of the overall reduction under this heading, mentioned above, of EUR 198,778 thousand.
8.3. IMPAIRMENT
The CEPSA Group periodically analyses the existence of impair-ment in its !nancial interests, including the goodwill resulting from acquisitions, as described in the Accounting Policies part, at the beginning of this note.
In the 2020 !nancial year, impairment corresponding to the in-terest in “Abu Dhabi Oil Co. Ltd” amounted to EUR 60,470 thou-sand, see Notes 8.1 and 14.3 (EUR 67,889 thousand in 2019, in-cluding EUR 48,488 thousand allocated to goodwill).
8.4. FINANCIAL INFORMATION OF INVESTEE COMPANIES AND BUSINESSES
A) JOINT VENTURES
The summarized !nancial information for the joint ventures partly owned by CEPSA at 31 December 2020 and 2019 is as follows:
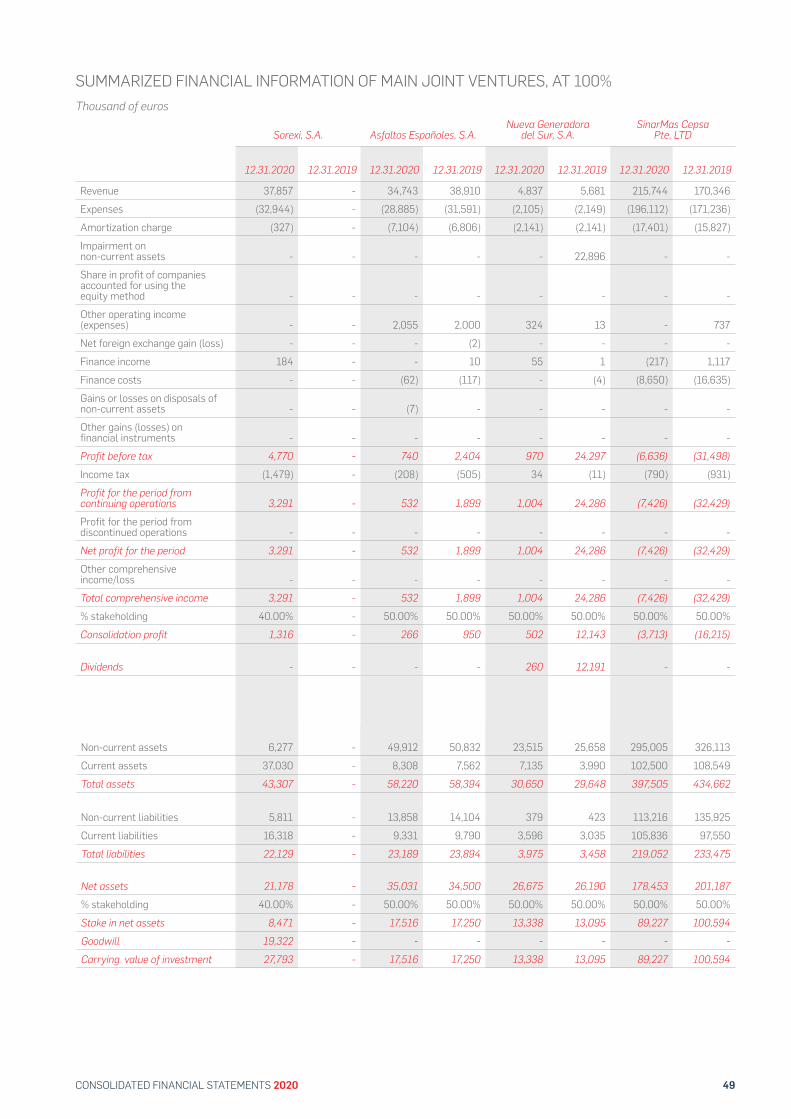
49CONSOLIDATED FINANCIAL STATEMENTS 2020
SUMMARIZED FINANCIAL INFORMATION OF MAIN JOINT VENTURES, AT 100%Thousand of euros
Sorexi, S.A. Asfaltos Españoles, S.A.Nueva Generadora
del Sur, S.A.SinarMas Cepsa
Pte, LTD
12.31.2020 12.31.2019 12.31.2020 12.31.2019 12.31.2020 12.31.2019 12.31.2020 12.31.2019
Revenue 37,857 - 34,743 38,910 4,837 5,681 215,744 170,346 Expenses (32,944) - (28,885) (31,591) (2,105) (2,149) (196,112) (171,236)Amortization charge (327) - (7,104) (6,806) (2,141) (2,141) (17,401) (15,827)Impairment on non-current assets - - - - - 22,896 - - Share in profit of companies accounted for using the equity method - - - - - - - - Other operating income (expenses) - - 2,055 2,000 324 13 - 737 Net foreign exchange gain (loss) - - - (2) - - - - Finance income 184 - - 10 55 1 (217) 1,117 Finance costs - - (62) (117) - (4) (8,650) (16,635)Gains or losses on disposals of non-current assets - - (7) - - - - - Other gains (losses) on financial instruments - - - - - - - - Profit before tax 4,770 - 740 2,404 970 24,297 (6,636) (31,498)Income tax (1,479) - (208) (505) 34 (11) (790) (931)Profit for the period from continuing operations 3,291 - 532 1,899 1,004 24,286 (7,426) (32,429)Profit for the period from discontinued operations - - - - - - - - Net profit for the period 3,291 - 532 1,899 1,004 24,286 (7,426) (32,429)Other comprehensive income/loss - - - - - - - - Total comprehensive income 3,291 - 532 1,899 1,004 24,286 (7,426) (32,429)% stakeholding 40.00% - 50.00% 50.00% 50.00% 50.00% 50.00% 50.00%Consolidation profit 1,316 - 266 950 502 12,143 (3,713) (16,215)
Dividends - - - - 260 12,191 - -
Non-current assets 6,277 - 49,912 50,832 23,515 25,658 295,005 326,113 Current assets 37,030 - 8,308 7,562 7,135 3,990 102,500 108,549 Total assets 43,307 - 58,220 58,394 30,650 29,648 397,505 434,662
Non-current liabilities 5,811 - 13,858 14,104 379 423 113,216 135,925 Current liabilities 16,318 - 9,331 9,790 3,596 3,035 105,836 97,550 Total liabilities 22,129 - 23,189 23,894 3,975 3,458 219,052 233,475
Net assets 21,178 - 35,031 34,500 26,675 26,190 178,453 201,187 % stakeholding 40.00% - 50.00% 50.00% 50.00% 50.00% 50.00% 50.00%Stake in net assets 8,471 - 17,516 17,250 13,338 13,095 89,227 100,594 Goodwill 19,322 - - - - - - - Carrying value of investment 27,793 - 17,516 17,250 13,338 13,095 89,227 100,594
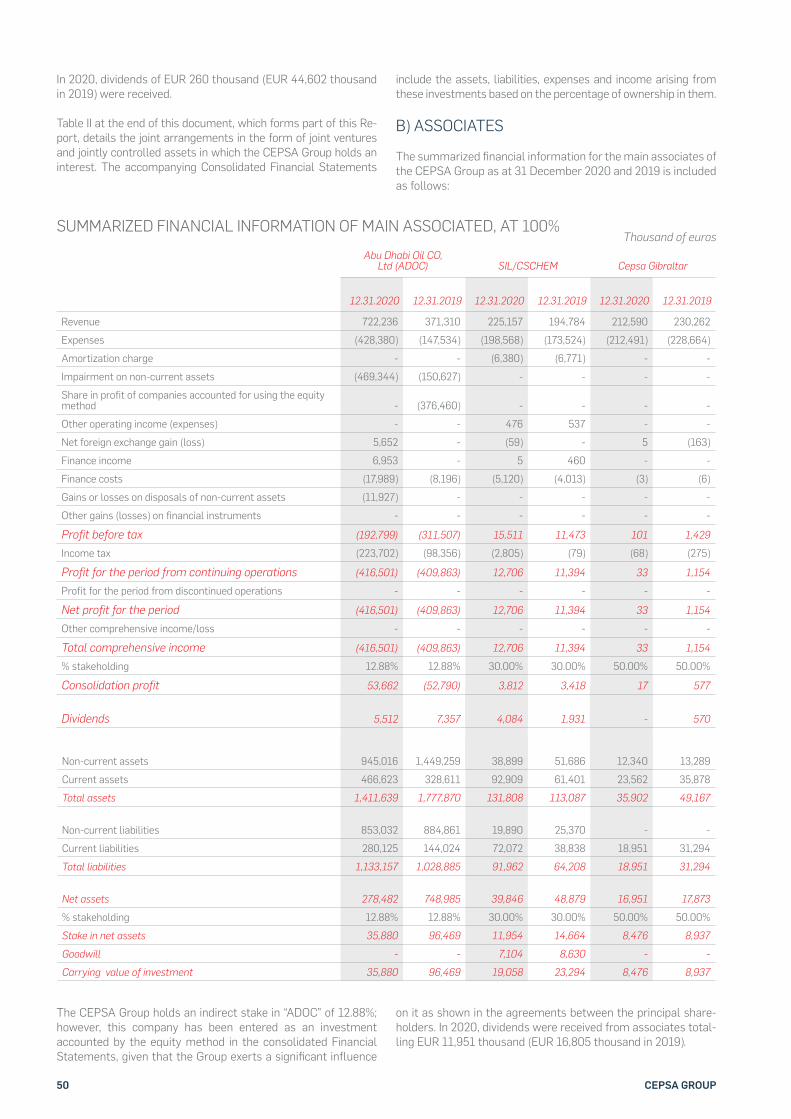
50 CEPSA GROUP
In 2020, dividends of EUR 260 thousand (EUR 44,602 thousand in 2019) were received.
Table II at the end of this document, which forms part of this Re-port, details the joint arrangements in the form of joint ventures and jointly controlled assets in which the CEPSA Group holds an interest. The accompanying Consolidated Financial Statements
include the assets, liabilities, expenses and income arising from these investments based on the percentage of ownership in them.
B) ASSOCIATES
The summarized !nancial information for the main associates of the CEPSA Group as at 31 December 2020 and 2019 is included as follows:
SUMMARIZED FINANCIAL INFORMATION OF MAIN ASSOCIATED, AT 100%Thousand of euros
Abu Dhabi Oil CO, Ltd (ADOC) SIL/CSCHEM Cepsa Gibraltar
12.31.2020 12.31.2019 12.31.2020 12.31.2019 12.31.2020 12.31.2019
Revenue 722,236 371,310 225,157 194,784 212,590 230,262 Expenses (428,380) (147,534) (198,568) (173,524) (212,491) (228,664)Amortization charge - - (6,380) (6,771) - - Impairment on non-current assets (469,344) (150,627) - - - - Share in profit of companies accounted for using the equity method - (376,460) - - - - Other operating income (expenses) - - 476 537 - - Net foreign exchange gain (loss) 5,652 - (59) - 5 (163)Finance income 6,953 - 5 460 - - Finance costs (17,989) (8,196) (5,120) (4,013) (3) (6)Gains or losses on disposals of non-current assets (11,927) - - - - - Other gains (losses) on financial instruments - - - - - - Profit before tax (192,799) (311,507) 15,511 11,473 101 1,429 Income tax (223,702) (98,356) (2,805) (79) (68) (275)Profit for the period from continuing operations (416,501) (409,863) 12,706 11,394 33 1,154 Profit for the period from discontinued operations - - - - - - Net profit for the period (416,501) (409,863) 12,706 11,394 33 1,154 Other comprehensive income/loss - - - - - - Total comprehensive income (416,501) (409,863) 12,706 11,394 33 1,154 % stakeholding 12.88% 12.88% 30.00% 30.00% 50.00% 50.00%Consolidation profit 53,662 (52,790) 3,812 3,418 17 577
Dividends 5,512 7,357 4,084 1,931 - 570
Non-current assets 945,016 1,449,259 38,899 51,686 12,340 13,289 Current assets 466,623 328,611 92,909 61,401 23,562 35,878 Total assets 1,411,639 1,777,870 131,808 113,087 35,902 49,167
Non-current liabilities 853,032 884,861 19,890 25,370 - - Current liabilities 280,125 144,024 72,072 38,838 18,951 31,294 Total liabilities 1,133,157 1,028,885 91,962 64,208 18,951 31,294
Net assets 278,482 748,985 39,846 48,879 16,951 17,873 % stakeholding 12.88% 12.88% 30.00% 30.00% 50.00% 50.00%Stake in net assets 35,880 96,469 11,954 14,664 8,476 8,937 Goodwill - - 7,104 8,630 - - Carrying value of investment 35,880 96,469 19,058 23,294 8,476 8,937
The CEPSA Group holds an indirect stake in “ADOC” of 12.88%; however, this company has been entered as an investment accounted by the equity method in the consolidated Financial Statements, given that the Group exerts a signi!cant in"uence
on it as shown in the agreements between the principal share-holders. In 2020, dividends were received from associates total-ling EUR 11,951 thousand (EUR 16,805 thousand in 2019).
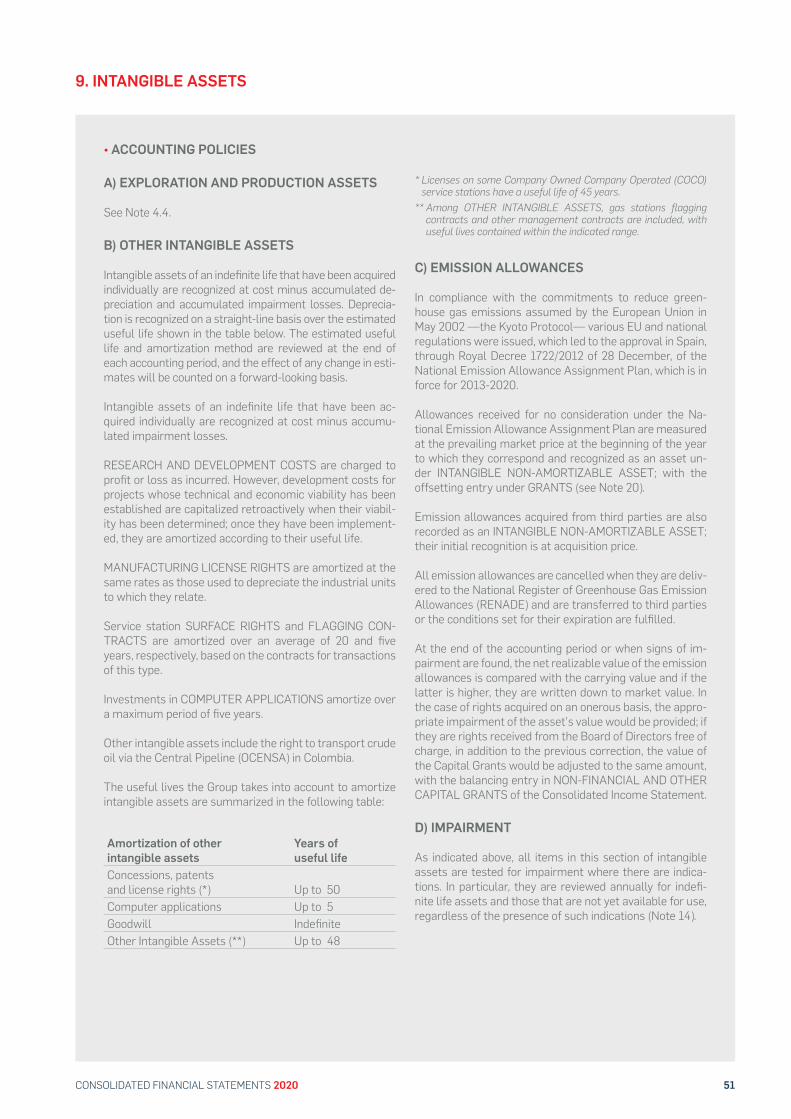
51CONSOLIDATED FINANCIAL STATEMENTS 2020
9. INTANGIBLE ASSETS
• ACCOUNTING POLICIES
A) EXPLORATION AND PRODUCTION ASSETS
See Note 4.4.
B) OTHER INTANGIBLE ASSETS
Intangible assets of an inde!nite life that have been acquired individually are recognized at cost minus accumulated de-preciation and accumulated impairment losses. Deprecia-tion is recognized on a straight-line basis over the estimated useful life shown in the table below. The estimated useful life and amortization method are reviewed at the end of each accounting period, and the effect of any change in esti-mates will be counted on a forward-looking basis.
Intangible assets of an inde!nite life that have been ac-quired individually are recognized at cost minus accumu-lated impairment losses.
RESEARCH AND DEVELOPMENT COSTS are charged to pro!t or loss as incurred. However, development costs for projects whose technical and economic viability has been established are capitalized retroactively when their viabil-ity has been determined; once they have been implement-ed, they are amortized according to their useful life.
MANUFACTURING LICENSE RIGHTS are amortized at the same rates as those used to depreciate the industrial units to which they relate.
Service station SURFACE RIGHTS and FLAGGING CON-TRACTS are amortized over an average of 20 and !ve years, respectively, based on the contracts for transactions of this type.
Investments in COMPUTER APPLICATIONS amortize over a maximum period of !ve years.
Other intangible assets include the right to transport crude oil via the Central Pipeline (OCENSA) in Colombia.
The useful lives the Group takes into account to amortize intangible assets are summarized in the following table:
* Licenses on some Company Owned Company Operated (COCO) service stations have a useful life of 45 years.
** Among OTHER INTANGIBLE ASSETS, gas stations flagging contracts and other management contracts are included, with useful lives contained within the indicated range.
C) EMISSION ALLOWANCES
In compliance with the commitments to reduce green-house gas emissions assumed by the European Union in May 2002 —the Kyoto Protocol— various EU and national regulations were issued, which led to the approval in Spain, through Royal Decree 1722/2012 of 28 December, of the National Emission Allowance Assignment Plan, which is in force for 2013-2020.
Allowances received for no consideration under the Na-tional Emission Allowance Assignment Plan are measured at the prevailing market price at the beginning of the year to which they correspond and recognized as an asset un-der INTANGIBLE NON-AMORTIZABLE ASSET; with the offsetting entry under GRANTS (see Note 20).
Emission allowances acquired from third parties are also recorded as an INTANGIBLE NON-AMORTIZABLE ASSET; their initial recognition is at acquisition price.
All emission allowances are cancelled when they are deliv-ered to the National Register of Greenhouse Gas Emission Allowances (RENADE) and are transferred to third parties or the conditions set for their expiration are ful!lled.
At the end of the accounting period or when signs of im-pairment are found, the net realizable value of the emission allowances is compared with the carrying value and if the latter is higher, they are written down to market value. In the case of rights acquired on an onerous basis, the appro-priate impairment of the asset’s value would be provided; if they are rights received from the Board of Directors free of charge, in addition to the previous correction, the value of the Capital Grants would be adjusted to the same amount, with the balancing entry in NON-FINANCIAL AND OTHER CAPITAL GRANTS of the Consolidated Income Statement.
D) IMPAIRMENT
As indicated above, all items in this section of intangible assets are tested for impairment where there are indica-tions. In particular, they are reviewed annually for inde!-nite life assets and those that are not yet available for use, regardless of the presence of such indications (Note 14).
Amortization of other intangible assets
Years of useful life
Concessions, patents and license rights (*) Up to 50Computer applications Up to 5Goodwill Inde!niteOther Intangible Assets (**) Up to 48
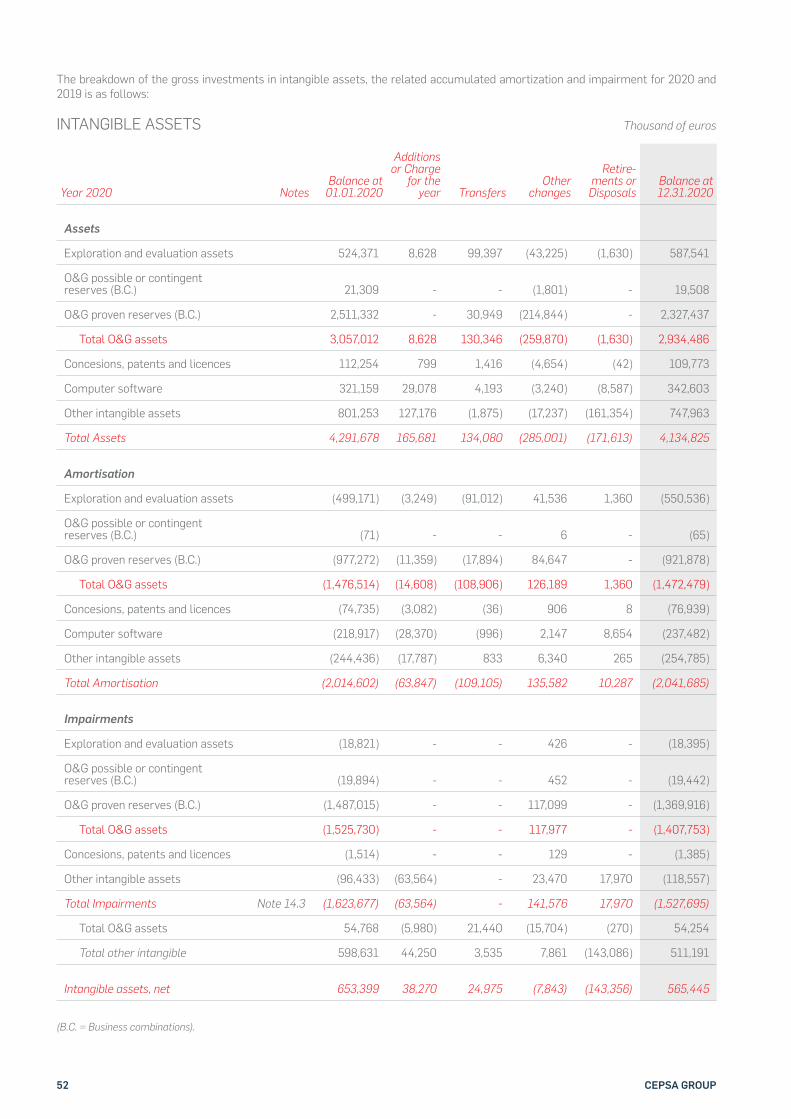
52 CEPSA GROUP
The breakdown of the gross investments in intangible assets, the related accumulated amortization and impairment for 2020 and 2019 is as follows:
INTANGIBLE ASSETS Thousand of euros
Year 2020 NotesBalance at
01.01.2020
Additions or Charge
for the year Transfers
Other changes
Retire-ments or Disposals
Balance at12.31.2020
Assets
Exploration and evaluation assets 524,371 8,628 99,397 (43,225) (1,630) 587,541
O&G possible or contingentreserves (B.C.) 21,309 - - (1,801) - 19,508
O&G proven reserves (B.C.) 2,511,332 - 30,949 (214,844) - 2,327,437
Total O&G assets 3,057,012 8,628 130,346 (259,870) (1,630) 2,934,486
Concesions, patents and licences 112,254 799 1,416 (4,654) (42) 109,773
Computer software 321,159 29,078 4,193 (3,240) (8,587) 342,603
Other intangible assets 801,253 127,176 (1,875) (17,237) (161,354) 747,963
Total Assets 4,291,678 165,681 134,080 (285,001) (171,613) 4,134,825
Amortisation
Exploration and evaluation assets (499,171) (3,249) (91,012) 41,536 1,360 (550,536)
O&G possible or contingent reserves (B.C.) (71) - - 6 - (65)
O&G proven reserves (B.C.) (977,272) (11,359) (17,894) 84,647 - (921,878)
Total O&G assets (1,476,514) (14,608) (108,906) 126,189 1,360 (1,472,479)
Concesions, patents and licences (74,735) (3,082) (36) 906 8 (76,939)
Computer software (218,917) (28,370) (996) 2,147 8,654 (237,482)
Other intangible assets (244,436) (17,787) 833 6,340 265 (254,785)
Total Amortisation (2,014,602) (63,847) (109,105) 135,582 10,287 (2,041,685)
Impairments
Exploration and evaluation assets (18,821) - - 426 - (18,395)
O&G possible or contingent reserves (B.C.) (19,894) - - 452 - (19,442)
O&G proven reserves (B.C.) (1,487,015) - - 117,099 - (1,369,916)
Total O&G assets (1,525,730) - - 117,977 - (1,407,753)
Concesions, patents and licences (1,514) - - 129 - (1,385)
Other intangible assets (96,433) (63,564) - 23,470 17,970 (118,557)
Total Impairments Note 14.3 (1,623,677) (63,564) - 141,576 17,970 (1,527,695)
Total O&G assets 54,768 (5,980) 21,440 (15,704) (270) 54,254
Total other intangible 598,631 44,250 3,535 7,861 (143,086) 511,191
Intangible assets, net 653,399 38,270 24,975 (7,843) (143,356) 565,445
(B.C. = Business combinations).
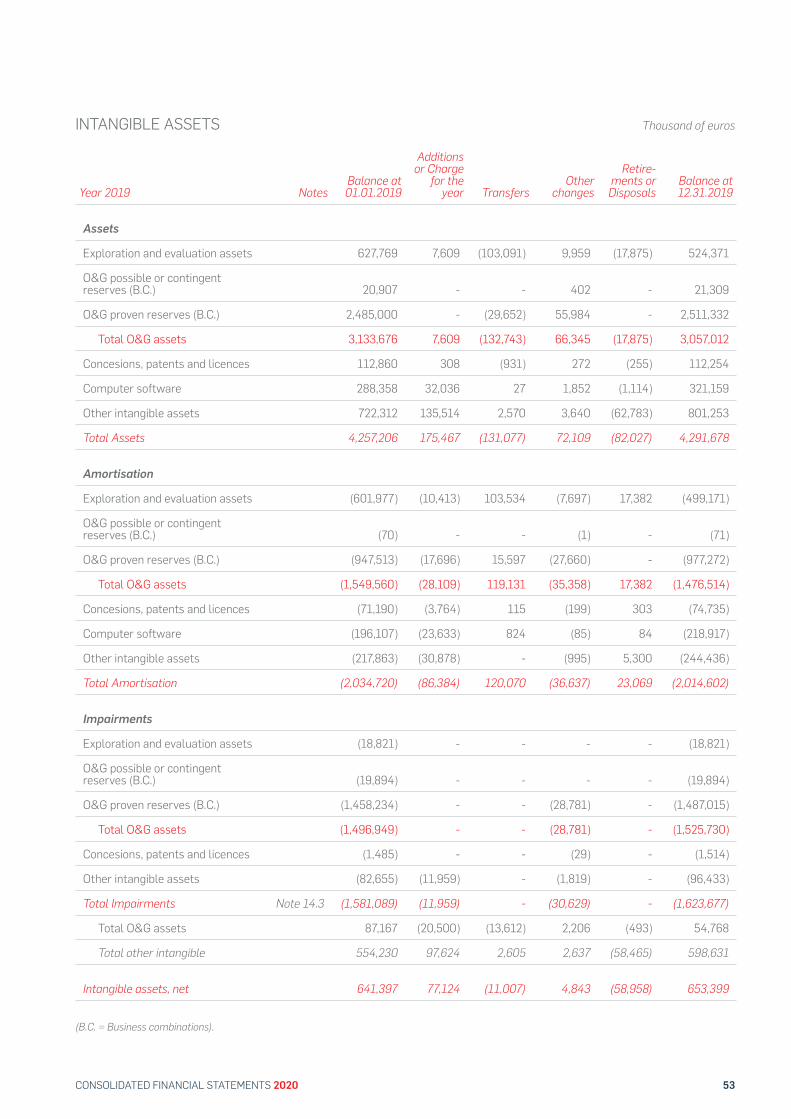
53CONSOLIDATED FINANCIAL STATEMENTS 2020
INTANGIBLE ASSETS Thousand of euros
Year 2019 NotesBalance at 01.01.2019
Additions or Charge
for the year Transfers
Other changes
Retire-ments or Disposals
Balance at 12.31.2019
Assets
Exploration and evaluation assets 627,769 7,609 (103,091) 9,959 (17,875) 524,371
O&G possible or contingentreserves (B.C.) 20,907 - - 402 - 21,309
O&G proven reserves (B.C.) 2,485,000 - (29,652) 55,984 - 2,511,332
Total O&G assets 3,133,676 7,609 (132,743) 66,345 (17,875) 3,057,012
Concesions, patents and licences 112,860 308 (931) 272 (255) 112,254
Computer software 288,358 32,036 27 1,852 (1,114) 321,159
Other intangible assets 722,312 135,514 2,570 3,640 (62,783) 801,253
Total Assets 4,257,206 175,467 (131,077) 72,109 (82,027) 4,291,678
Amortisation
Exploration and evaluation assets (601,977) (10,413) 103,534 (7,697) 17,382 (499,171)
O&G possible or contingent reserves (B.C.) (70) - - (1) - (71)
O&G proven reserves (B.C.) (947,513) (17,696) 15,597 (27,660) - (977,272)
Total O&G assets (1,549,560) (28,109) 119,131 (35,358) 17,382 (1,476,514)
Concesions, patents and licences (71,190) (3,764) 115 (199) 303 (74,735)
Computer software (196,107) (23,633) 824 (85) 84 (218,917)
Other intangible assets (217,863) (30,878) - (995) 5,300 (244,436)
Total Amortisation (2,034,720) (86,384) 120,070 (36,637) 23,069 (2,014,602)
Impairments
Exploration and evaluation assets (18,821) - - - - (18,821)
O&G possible or contingent reserves (B.C.) (19,894) - - - - (19,894)
O&G proven reserves (B.C.) (1,458,234) - - (28,781) - (1,487,015)
Total O&G assets (1,496,949) - - (28,781) - (1,525,730)
Concesions, patents and licences (1,485) - - (29) - (1,514)
Other intangible assets (82,655) (11,959) - (1,819) - (96,433)
Total Impairments Note 14.3 (1,581,089) (11,959) - (30,629) - (1,623,677)
Total O&G assets 87,167 (20,500) (13,612) 2,206 (493) 54,768
Total other intangible 554,230 97,624 2,605 2,637 (58,465) 598,631
Intangible assets, net 641,397 77,124 (11,007) 4,843 (58,958) 653,399
(B.C. = Business combinations).
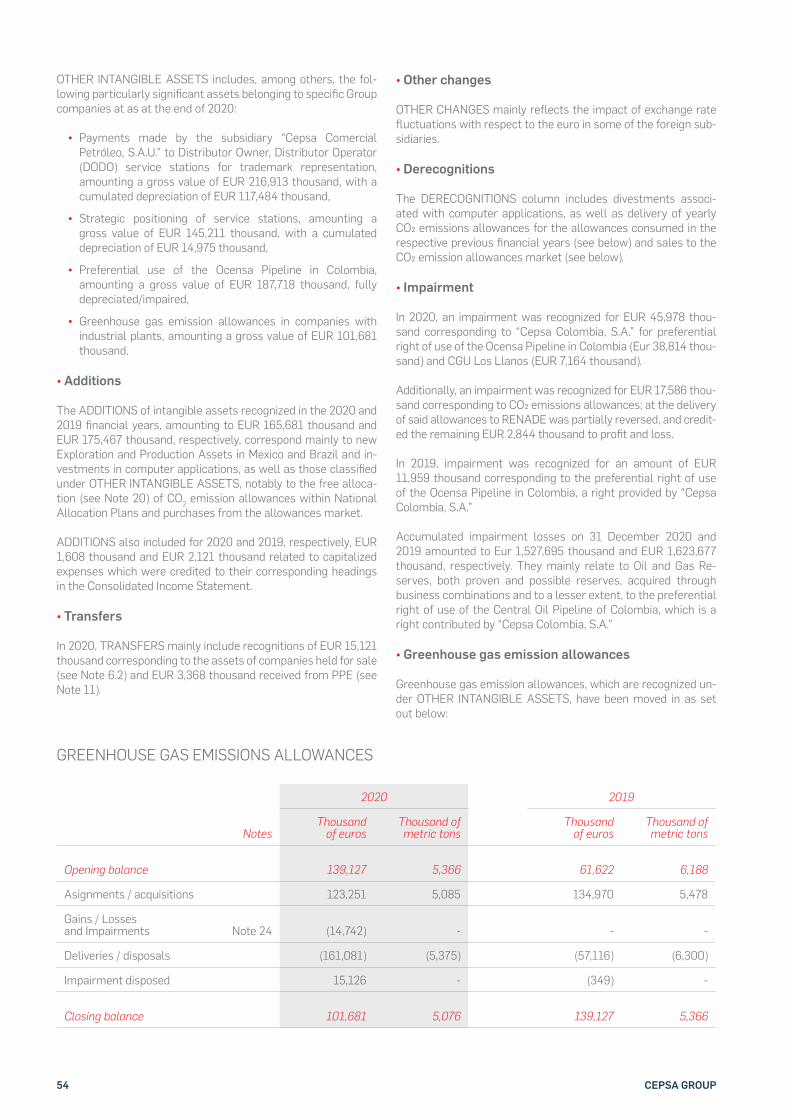
54 CEPSA GROUP
OTHER INTANGIBLE ASSETS includes, among others, the fol-lowing particularly signi!cant assets belonging to speci!c Group companies at as at the end of 2020:
• Payments made by the subsidiary “Cepsa Comercial Petróleo, S.A.U.” to Distributor Owner, Distributor Operator (DODO) service stations for trademark representation, amounting a gross value of EUR 216,913 thousand, with a cumulated depreciation of EUR 117,484 thousand,
• Strategic positioning of service stations, amounting a gross value of EUR 145,211 thousand, with a cumulated depreciation of EUR 14,975 thousand,
• Preferential use of the Ocensa Pipeline in Colombia, amounting a gross value of EUR 187,718 thousand, fully depreciated/impaired,
• Greenhouse gas emission allowances in companies with industrial plants, amounting a gross value of EUR 101,681 thousand.
• Additions
The ADDITIONS of intangible assets recognized in the 2020 and 2019 !nancial years, amounting to EUR 165,681 thousand and EUR 175,467 thousand, respectively, correspond mainly to new Exploration and Production Assets in Mexico and Brazil and in-vestments in computer applications, as well as those classi!ed under OTHER INTANGIBLE ASSETS, notably to the free alloca-tion (see Note 20) of CO2 emission allowances within National Allocation Plans and purchases from the allowances market.
ADDITIONS also included for 2020 and 2019, respectively, EUR 1,608 thousand and EUR 2,121 thousand related to capitalized expenses which were credited to their corresponding headings in the Consolidated Income Statement.
• Transfers
In 2020, TRANSFERS mainly include recognitions of EUR 15,121 thousand corresponding to the assets of companies held for sale (see Note 6.2) and EUR 3,368 thousand received from PPE (see Note 11).
• Other changes
OTHER CHANGES mainly re"ects the impact of exchange rate "uctuations with respect to the euro in some of the foreign sub-sidiaries.
• Derecognitions
The DERECOGNITIONS column includes divestments associ-ated with computer applications, as well as delivery of yearly CO% emissions allowances for the allowances consumed in the respective previous !nancial years (see below) and sales to the CO% emission allowances market (see below).
• Impairment
In 2020, an impairment was recognized for EUR 45,978 thou-sand corresponding to “Cepsa Colombia, S.A.” for preferential right of use of the Ocensa Pipeline in Colombia (Eur 38,814 thou-sand) and CGU Los Llanos (EUR 7,164 thousand).
Additionally, an impairment was recognized for EUR 17,586 thou-sand corresponding to CO% emissions allowances; at the delivery of said allowances to RENADE was partially reversed, and credit-ed the remaining EUR 2,844 thousand to pro!t and loss.
In 2019, impairment was recognized for an amount of EUR 11,959 thousand corresponding to the preferential right of use of the Ocensa Pipeline in Colombia, a right provided by “Cepsa Colombia, S.A.”
Accumulated impairment losses on 31 December 2020 and 2019 amounted to Eur 1,527,695 thousand and EUR 1,623,677 thousand, respectively. They mainly relate to Oil and Gas Re-serves, both proven and possible reserves, acquired through business combinations and to a lesser extent, to the preferential right of use of the Central Oil Pipeline of Colombia, which is a right contributed by “Cepsa Colombia, S.A.”
• Greenhouse gas emission allowances
Greenhouse gas emission allowances, which are recognized un-der OTHER INTANGIBLE ASSETS, have been moved in as set out below:
GREENHOUSE GAS EMISSIONS ALLOWANCES
2020 2019
NotesThousand
of eurosThousand of metric tons
Thousand of euros
Thousand of metric tons
Opening balance 139,127 5,366 61,622 6,188
Asignments / acquisitions 123,251 5,085 134,970 5,478
Gains / Losses and Impairments Note 24 (14,742) - - -
Deliveries / disposals (161,081) (5,375) (57,116) (6,300)
Impairment disposed 15,126 - (349) -
Closing balance 101,681 5,076 139,127 5,366
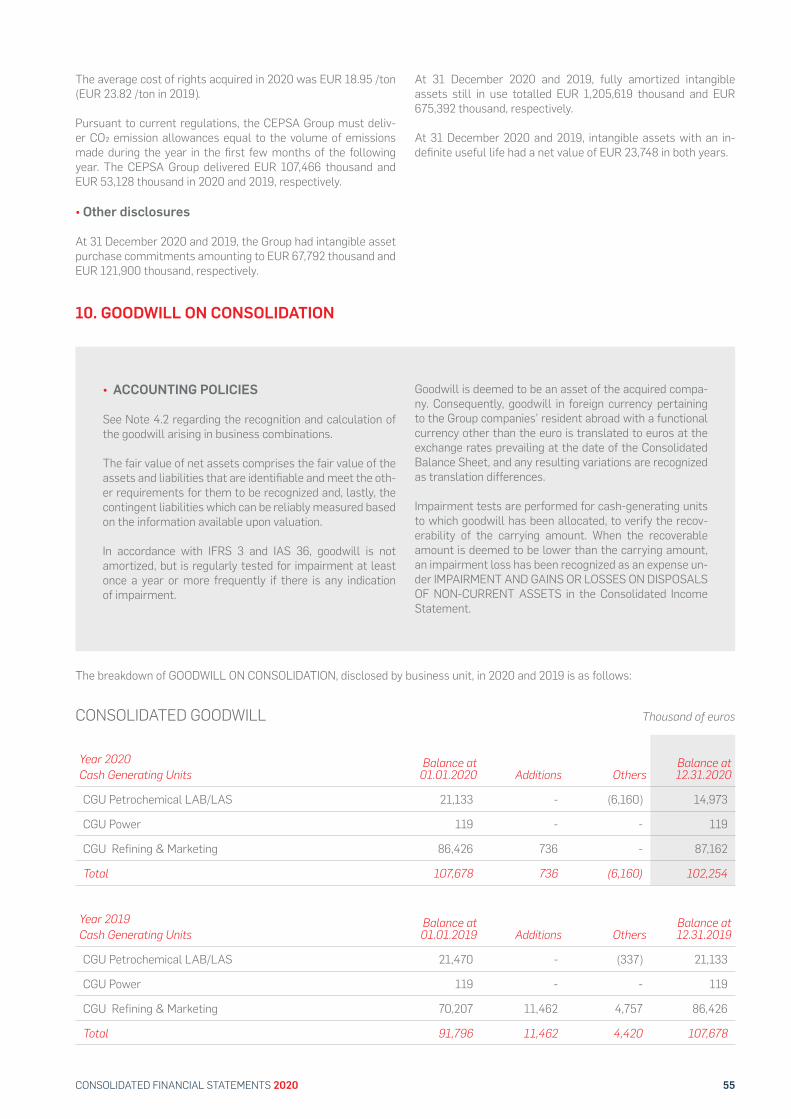
55CONSOLIDATED FINANCIAL STATEMENTS 2020
The average cost of rights acquired in 2020 was EUR 18.95 /ton (EUR 23.82 /ton in 2019).
Pursuant to current regulations, the CEPSA Group must deliv-er CO% emission allowances equal to the volume of emissions made during the year in the !rst few months of the following year. The CEPSA Group delivered EUR 107,466 thousand and EUR 53,128 thousand in 2020 and 2019, respectively.
• Other disclosures
At 31 December 2020 and 2019, the Group had intangible asset purchase commitments amounting to EUR 67,792 thousand and EUR 121,900 thousand, respectively.
At 31 December 2020 and 2019, fully amortized intangible assets still in use totalled EUR 1,205,619 thousand and EUR 675,392 thousand, respectively.
At 31 December 2020 and 2019, intangible assets with an in-de!nite useful life had a net value of EUR 23,748 in both years.
The breakdown of GOODWILL ON CONSOLIDATION, disclosed by business unit, in 2020 and 2019 is as follows:
• ACCOUNTING POLICIES
See Note 4.2 regarding the recognition and calculation of the goodwill arising in business combinations.
The fair value of net assets comprises the fair value of the assets and liabilities that are identi!able and meet the oth-er requirements for them to be recognized and, lastly, the contingent liabilities which can be reliably measured based on the information available upon valuation.
In accordance with IFRS 3 and IAS 36, goodwill is not amortized, but is regularly tested for impairment at least once a year or more frequently if there is any indication of impairment.
Goodwill is deemed to be an asset of the acquired compa-ny. Consequently, goodwill in foreign currency pertaining to the Group companies’ resident abroad with a functional currency other than the euro is translated to euros at the exchange rates prevailing at the date of the Consolidated Balance Sheet, and any resulting variations are recognized as translation differences.
Impairment tests are performed for cash-generating units to which goodwill has been allocated, to verify the recov-erability of the carrying amount. When the recoverable amount is deemed to be lower than the carrying amount, an impairment loss has been recognized as an expense un-der IMPAIRMENT AND GAINS OR LOSSES ON DISPOSALS OF NON-CURRENT ASSETS in the Consolidated Income Statement.
10. GOODWILL ON CONSOLIDATION
CONSOLIDATED GOODWILL Thousand of euros
Year 2020Cash Generating Units
Balance at 01.01.2020 Additions Others
Balance at 12.31.2020
CGU Petrochemical LAB/LAS 21,133 - (6,160) 14,973
CGU Power 119 - - 119
CGU Refining & Marketing 86,426 736 - 87,162
Total 107,678 736 (6,160) 102,254
Year 2019Cash Generating Units
Balance at01.01.2019 Additions Others
Balance at 12.31.2019
CGU Petrochemical LAB/LAS 21,470 - (337) 21,133
CGU Power 119 - - 119
CGU Refining & Marketing 70,207 11,462 4,757 86,426
Total 91,796 11,462 4,420 107,678
56 CEPSA GROUP
Goodwill arisen in 2020 corresponds to the acquisition of an in-terest in “Intrasport Service XXI, S.L.” (see Note 6.1)
The column OTHER CHANGES includes changes in exchange rates on “Detén Química, S.A.”’s goodwill, as the year-end ex-change rate was used (see Note 4.3).
No impairment was recorded in 2020 or 2019. The recoverable amount of the business units was determined on the basis of their value in use calculated consistent with the assumptions and cash "ows included in the Group’s strategic plan.
11. PROPERTY, PLANT AND EQUIPMENT
• ACCOUNTING POLICIES
A) EXPLORATION AND PRODUCTION ASSETS
See Note 4.4.
B) OTHER ITEMS OF PROPERTY, PLANT AND EQUIPMENT
These assets are initially recognized at acquisition cost. This cost includes the purchase price and transaction costs. When it comes to the acquisition, construction, or production of certain quali!ed assets (which are assets that require a substantial period of use), other directly at-tributable costs such as personnel costs, !nancial expens-es, and other items incurred until the time the assets are substantially ready for use or sale, are added to their cost.
The estimated present value of the decommission costs to be borne by the CEPSA Group is also recognized, where appropriate (see Note 22).
Assets acquired before December 31, 2003, were reval-ued, where appropriate, pursuant to applicable legislation.
The costs of expansion, modernization or improvements leading to increased productivity, capacity, or ef!ciency or to a lengthening of the useful lives of the assets, are cap-italized as a larger investment and are part of the acquisi-tion cost when incurred. On the other hand, repair, conser-vation, and maintenance costs are charged to the pro!t or loss as incurred.
Removed assets and items and the related acquisition cost and accumulated depreciation are derecognized.
As at the reporting date of the Consolidated Balance Sheet, assessment is underway as to whether there are !xed assets not included in a CGU showing signs of impair-ment. If such indication exists, the asset is tested for im-pairment, and where appropriate, the related impairment loss is recognized. (See Note 14).
The Group depreciates its property, plant and equipment, net of their residual value, using the straight-line method, i.e., by equitably distributing assets’ costs among the years of estimated useful life.
• Tank heel inventory
As indicated in Notes 3.H) and 15, the volume of crude oil and product at tank heels under the lowest operable lev-el is considered not part of operating stock, but rather is a !xed asset inherent to the company’s operations. Thus, it should be recognized under PROPERTY, PLANT, AND EQUIPMENT – TECHNICAL INSTALLATIONS.
Said volume of crude oil and product is recognized as a !xed asset as long as it is stored at the bottom of tanks. If a tank is drained for inspection or repair, the full contents is moved to other tanks, transferred to the production sys-tem, or released for sale. This draining also includes the volume considered to be the tank heel, which is allocat-ed to the proper use and purpose. In the case of crude oil, a portion of this volume is discarded as it is not !t for production. In these products, the entire tank heel is generally valid.
The crude oil and product transferred in 2020 from inven-tory was valued at inventory cost as at the date of transfer (1st of January). It is considered a non-depreciable asset, except for the estimated portion of crude oil to be discard-ed at the time the tank is drained. The estimated volume to be discarded is estimated at 10% of the tank heel volume. The value corresponding to this expendable crude oil de-preciates linearly over the course of the period between tank inspections, which is estimated to be 15 years for crude oil tanks.
When the tank is drained, the value of the tank heel volume that is not discarded is transferred back to inventory at his-torical cost. At this time, the difference between the net carrying value of the tank heel and the value transferred to inventory is recognized as pro!t or loss in the Income Statement.
Henceforth, when an out-of-service tank is started up, the volume of crude oil or product corresponding to the tank heel will be calculated at the inventory cost as of the day of the transfer and a new transfer from Inventory to Prop-erty, Plant, and Equipment will be recorded.
Depreciation of other property, plant and equipment Years of useful lifeBuildings and other structures 33 to 50Complex and specialized plants 12 to 33Machinery, other installations, !xtures and furnishings 10 to 15Other items 4 to 20

57CONSOLIDATED FINANCIAL STATEMENTS 2020
The breakdown of the gross investments in Property, Plant and Equipment, accumulated depreciation and impairment for 2020 and 2019 is as follows:
PROPERTY, PLANT AND EQUIPMENT Thousand of euros
Year 2020 NotesBalance at
01.01.2020
Additions or Charge
for the year TransfersOther
changes
Retire-ments or Disposals
Balance at 12.31.2020
Assets
Land and structures 465,478 52 1,531 927 (267) 467,721
Plant and machinery 8,795,004 11,816 644,847 (81,570) (114,596) 9,255,501
Oil & Gas Assets 4,112,622 132,114 158,649 (204,129) (575) 4,198,681
Other facilites, furniture 115,741 462 6,558 (5,176) (471) 117,114
Advances and property, plant and equipment under construction 1,146,699 418,176 (505,847) (4,789) (9,508) 1,044,731
Other property, plant and equipment 1,418,970 172 29,220 (79,132) (146,869) 1,222,361
Total Assets 16,054,514 562,792 334,958 (373,869) (272,286) 16,306,109
Depreciations
Land and structures (139,908) (7,227) (7,142) 2,761 83 (151,433)
Plant and machinery (6,175,170) (385,367) (12,261) 49,704 85,615 (6,437,479)
Oil & Gas Assets (1,887,154) (176,086) (76,056) 97,681 900 (2,040,715)
Other facilites, furniture (102,051) (4,809) 43 4,809 401 (101,607)
Other property, plant and equipment (436,232) (29,976) (236) 13,050 59,181 (394,213)
Total depreciations (8,740,515) (603,465) (95,652) 168,005 146,180 (9,125,447)
Impairments
Land and structures (1,352) - - - - (1,352)
Plant and machinery (336,561) (227,807) - 10,599 867 (552,902)
Oil & Gas Assets (52,513) (360,195) - 8,984 429 (403,295)
Other facilites, furniture (317) - - - - (317)
Other property, plant and equipment (784,675) - (21,809) 88,413 99,462 (618,609)
Total Impairments Note 14.3 (1,175,418) (588,002) (21,809) 107,996 100,758 (1,576,475)
Property, plant and equipment, net 6,138,581 (628,675) 217,497 (97,868) (25,348) 5,604,187
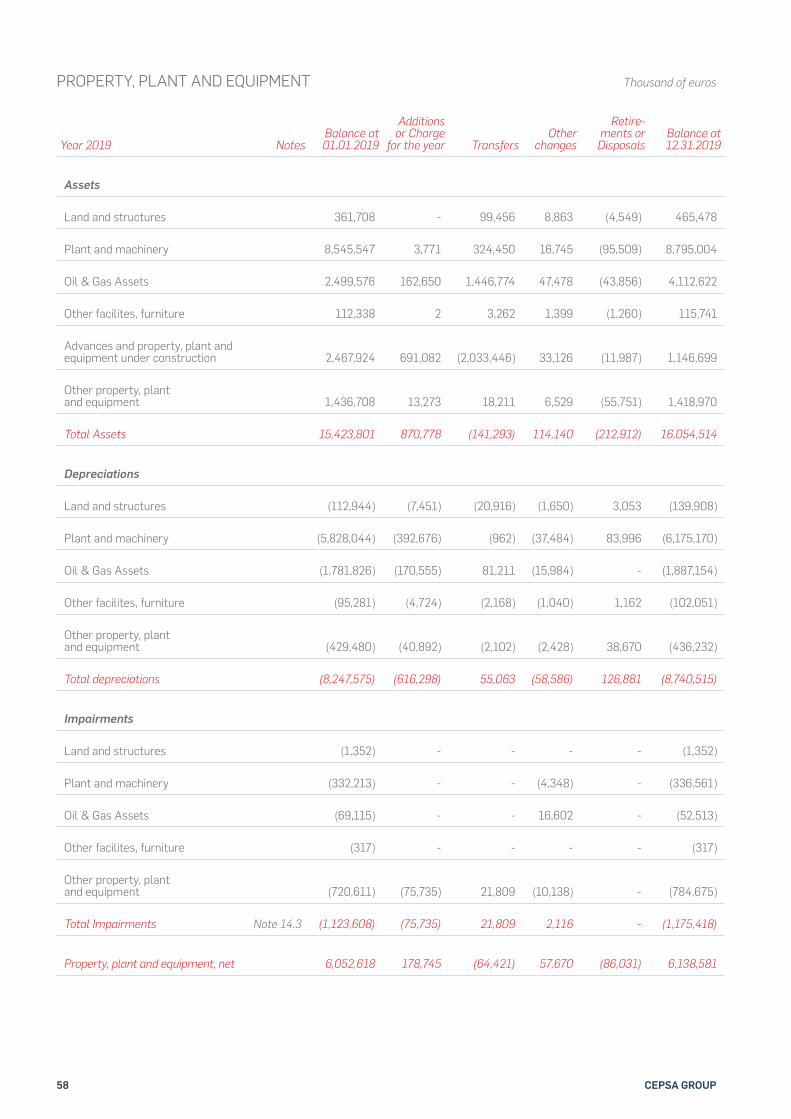
58 CEPSA GROUP
PROPERTY, PLANT AND EQUIPMENT Thousand of euros
Year 2019 NotesBalance at 01.01.2019
Additions or Charge
for the year TransfersOther
changes
Retire-ments or Disposals
Balance at 12.31.2019
Assets
Land and structures 361,708 - 99,456 8,863 (4,549) 465,478
Plant and machinery 8,545,547 3,771 324,450 16,745 (95,509) 8,795,004
Oil & Gas Assets 2,499,576 162,650 1,446,774 47,478 (43,856) 4,112,622
Other facilites, furniture 112,338 2 3,262 1,399 (1,260) 115,741
Advances and property, plant and equipment under construction 2,467,924 691,082 (2,033,446) 33,126 (11,987) 1,146,699
Other property, plant and equipment 1,436,708 13,273 18,211 6,529 (55,751) 1,418,970
Total Assets 15,423,801 870,778 (141,293) 114,140 (212,912) 16,054,514
Depreciations
Land and structures (112,944) (7,451) (20,916) (1,650) 3,053 (139,908)
Plant and machinery (5,828,044) (392,676) (962) (37,484) 83,996 (6,175,170)
Oil & Gas Assets (1,781,826) (170,555) 81,211 (15,984) - (1,887,154)
Other facilites, furniture (95,281) (4,724) (2,168) (1,040) 1,162 (102,051)
Other property, plant and equipment (429,480) (40,892) (2,102) (2,428) 38,670 (436,232)
Total depreciations (8,247,575) (616,298) 55,063 (58,586) 126,881 (8,740,515)
Impairments
Land and structures (1,352) - - - - (1,352)
Plant and machinery (332,213) - - (4,348) - (336,561)
Oil & Gas Assets (69,115) - - 16,602 - (52,513)
Other facilites, furniture (317) - - - - (317)
Other property, plant and equipment (720,611) (75,735) 21,809 (10,138) - (784,675)
Total Impairments Note 14.3 (1,123,608) (75,735) 21,809 2,116 - (1,175,418)
Property, plant and equipment, net 6,052,618 178,745 (64,421) 57,670 (86,031) 6,138,581
59CONSOLIDATED FINANCIAL STATEMENTS 2020
• Additions of assets
The additions of new assets in 2020 and 2019 amount to EUR 562,792 thousand and EUR 870,778 thousand, respectively, and are recorded in ADDITIONS OR ALLOWANCES. The following should be noted:
• In the Exploration and Production segment, investments to develop or increase activity, notably in the United Arab Emirates, where EUR 119 million have been invested in 2020 in the Sateh Al Razboot and Umm Lulu fields in the Abu Dhabi coastal area (EUR 140 million was invested in 2019). These are the provision of the agreement signed in March of that year with ADNOC, for a 20% stake in the aforementioned fields for 40 years of concession. To a lesser extent, additions in Algeria and Colombia are worth mentioning, with EUR 46 million and EUR 5 million respectively in 2020.
• Refining: investments made to improve industrial facilities, aimed at minimizing environmental impact and increasing efficiency and conversion rate, as well as focused on safety in activity. Notably, the additions to the San Roque Refinery, located in the Bay of Algeciras, exceeded EUR 152 million and EUR 250 million in 2020 and 2019, respectively, and those carried out in the La Rábida Refinery exceeded EUR 76 million and EUR 160 million in 2020 and 2019, respectively.
• In the Distribution segment, investments to maintain or improve the market share and presence in the markets, like the service stations market, for over EUR 36 million and EUR 85 million in 2020 and 2019, respectively.
• In the Petrochemical segment, investments to maintain the functionalities of our plants, most notably those located in Spain, for over EUR 70 million and EUR 101 million in 2020 and 2019, respectively.
• Capitalized overhead expenses relating to the start-up period of various items of property, plant, and equipment components which were credited to the accompanying Consolidated Statement of Income are also included. They amount to EUR 25,111 thousand and EUR 33,120 thousand in 2020 and 2019, respectively. There are no significant financial amounts.
• Transfers
TRANSFERS include EUR 3,368 thousand transferred to intangi-ble !xed assets (see Note 9).
In addition, “Cepsa Peruana S.A.C.”’s reinstatement in the scope of consolidation entails an increase in gross !xed asset value of EUR 165 million, with no expenditure entailed by this variation (EUR 61 million net of accumulated depreciation).
As set out in Note 3.H), in 2020, EUR 186,388 thousand corre-sponding to the value of permanent inventory in tanks was re-classi!ed from Inventory to the Technical Installations and ma-chinery heading under Fixed assets.
• Other changes
OTHER CHANGES mainly re"ects the impact of exchange rate "uctuations with respect to the euro of companies with a differ-ent functional currency.
• Derecognitions
The DERECOGNITIONS column includes 2020 divestments car-ried out with the sale of Mobile Offshore Platform Units (MOPUs), contributed to the Group by the subsidiary “MOPU Holdings (Sin-gapore) Pte, Ltd.” for a gross amount of EUR 167 million, practi-cally fully depreciated and deteriorated assets, derecognitions of catalytic converters removed at the end of their useful life; and derecognitions in the La Rábida re!nery due to the shutdown of installations that were fully amortized.
In 2019, divestments were carried out with the sale of Mobile Offshore Platform Units (MOPUs), contributed to the Group by the subsidiary “MOPU Holdings (Singapore) Pte, Ltd.” for a gross amount of EUR 95 million, practically fully depreciated and de-teriorated assets, disposals of technical installations (mainly catalytic converters at the end of their useful life) and that of a tanker for product transport.
• Impairment
The most signi!cant impairments recorded in 2020 were in the Peru CGU for EUR 34,080 thousand, in the Abu Dhabi CGU for EUR 188,695 thousand, in the Algeria CGU for EUR 128,699 thousand and in the Colombia CGU EUR 8,702 thousand.
Additionally, as a consequence of the evolution of the prices in certain re!ned products, strongly impacted by COVID 19, a drop in the pro!tability of some projects belonging to CGU Re!n-ing-Commercial is observed. Assets have been impaired for a value of EUR 221,861 thousand. According to accounting stand-ards, this decision can be reversed if the circumstances that mo-tivated it disappear.
Finally, an impairment of 4,192 thousand euros has been record-ed corresponding to the estimated loss of value in a combined cycle plant, in the Gas and Electricity business.
During 2019, the following impairments were recorded: that of the Mobile Offshore Platform Units (MOPUs), contributed to the Group by the subsidiary “MOPU Holdings (Singapore) Pte, Ltd.” amounting to EUR 53,853 thousand and EUR 21,802 thousand contributed by the CGU Peru.
• Other disclosures
At 31 December 2020 and 2019, the Group had property, plant, and equipment purchase commitments amounting to EUR 998,749 thousand and EUR 1,563,566 thousand, respectively, mostly associated with exploration and production investments.
At 31 December 2020 and 2019, no material items of property, plant and equipment had been pledged to secure compliance with obligations relating to the ownership thereof.
At 31 December 2020 and 2019 fully depreciated property, plant, and equipment still in use totalled EUR 4,468,409 thou-sand and EUR 4,015,298 thousand respectively. All these assets refer to facilities in operation and are not depreciated as part of the equipment involved.
In 1996 certain consolidated Group companies revalued their PPE pursuant to Royal Decree-Law 7/1996 of June 7, increasing the carrying amount of these assets by EUR 117,350 thousand. This increase in value is being depreciated (the depreciation charge is a tax-deductible expense) with a charge to pro!t in

60 CEPSA GROUP
1997 and subsequent years based on the years of residual useful lives of the revalued assets.
Certain CEPSA Group companies have been granted administra-tive concessions by the Spanish government to use mooring fa-cilities and access and adjacent areas at the ports of Santa Cruz de Tenerife which will revert to the state in 2027, Algeciras-La Línea—which will revert in 2065—and Palos de la Frontera—which will revert from 2022 to 2065. CEPSA Group Manage-ment expects that these concessions will be renewed when they expire. It also considers it unnecessary to make a provision for the decommissioning of these investments, as they are properly maintained, and their renewal is foreseeable.
The Group has taken out insurance policies to cover the possible risks to which its property, plant and equipment are subject to
and the claims that might be !led against it for carrying on its business activities. These policies are considered to suf!ciently cover the related risks.
Travel restrictions implemented as a result of COVID-19 led to a sustained drop in demand. To adapt to this situation and op-timize re!nery operations, after the routine maintenance shut-down in September of the Fuel 1 and Vacuum 2 units at the La Rábida Re!nery in Huelva, it was decided that said units should remain inactive until domestic demand signi!cantly recovers. At the date of issue of this Financial Statement, the situation has not changed, although Company Management is periodically re-viewing the best time to reinitiate activity, which is expected to take place in the !rst half of 2021, although it will depend on the evolution of the pandemic.
61CONSOLIDATED FINANCIAL STATEMENTS 2020
12. RIGHTS OF USE
• ACCOUNTING POLICIES AND PROCEDURES
In 2019, the CEPSA Group applied IFRS 16 (approved by the IASB in January 2016 and effective 1 January 2019) for the !rst time.
The Group understands that a lease provides control over the use of the leased asset and is therefore classi!ed as operating when the lessee obtains at least 80% of the eco-nomic bene!ts from the use of the asset. IFRS 16 distin-guishes between leases and service contracts on the basis of whether the use of an identi!ed asset is controlled by the customer.
The Group values whether a contract is or contains a lease at the beginning of the contract. The Group recognizes a RIGHT OF USE and the corresponding LEASE DEBT for all lease agreements in which it is a lessee, except for the excluded leases (with respect to debt recognition and the excluded leases, see Note 25, in Accounting Policies).
Where the Group incurs an obligation to bear the costs of decommissioning and withdrawing the leased asset, re-storing the location where the leased asset is located or restoring the underlying asset to the condition required by the provisions of the lease, a provision under IAS 37 must be recognized and quanti!ed. To the extent that these costs are related to an asset for rights of use, these costs are in-cluded in the cost of acquisition of the asset for rights of use, unless such costs are incurred to produce inventories.
Rights-of-use assets depreciate over the lease life or the useful life of the underlying asset, whichever is shortest. If a lease transfers ownership of the underlying asset or the cost of the rights-of-use asset re"ects that the Group expects to exercise the purchase option, the corresponding rights-of-use asset depreciates over the useful life of the underlying asset. Depreciation begins at the start date of the lease.
Rights-of-use assets are presented on a separate line in the Consolidated Balance Sheet.
• Impact on Group Accounting as a Lessee
Former operating leases
In the application of IFRS 16, for all leases (except those of low value or short-term contracts – see Note 25), the Group:
• recognizes RIGHT-OF-USE ASSETS and LEASE LIABILITIES in the consolidated balance sheet, initially measured at the present value of the future lease payments;
• recognizes depreciation of RIGHT-OF-USE ASSETS and interest on LEASE LIABILITIES in the Consolidated Income Statement; and
• separately reports the total amount of cash paid into a principal portion and interest (both presented within financing activities) in the Consolidated Cash Flow Statement.
Under IFRS 16, right-of-use assets will be tested for im-pairment in accordance with IAS 36 Impairment of Assets.
Finance leases
The main differences between IFRS 16 and IAS 17 with re-spect to assets formerly held under a !nance lease is the measurement of the residual value guarantees provided by the lessee to the lessor. IFRS 16 requires that the Group recognizes as part of its lease liability only the amount expected to be payable under a residual value guarantee, rather than the maximum amount guaranteed as required by IAS 17.
Since IFRS 16 entered into force, the Group has recognized equipment acquired via !nance lease previously included in property, plant, and equipment within the line item for RIGHT-OF-USE ASSETS; and the lease liability, previously presented within borrowing, has been presented in a sepa-rate line for lease liabilities.
Impairment
The Group applies IAS 36 to determine whether a rights-of-use asset is deteriorating in value and accounts for any impairment loss identi!ed as described in Note 14.
Impact on Consolidated Cash Flow Statement
Under IFRS 16, lessors must present:
• short-term lease payments, low-value lease payments, and variable lease payments not included in the debt valuation for leases as part of operational activities;
• payments for the fraction of interest on a lease debt as either operational activities or as financing activities, as permitted under IAS 7 (the Group has chosen to include interest payments as part of financing activities); and
• payments for the principal of the debt for leases, as part of the financing activities.
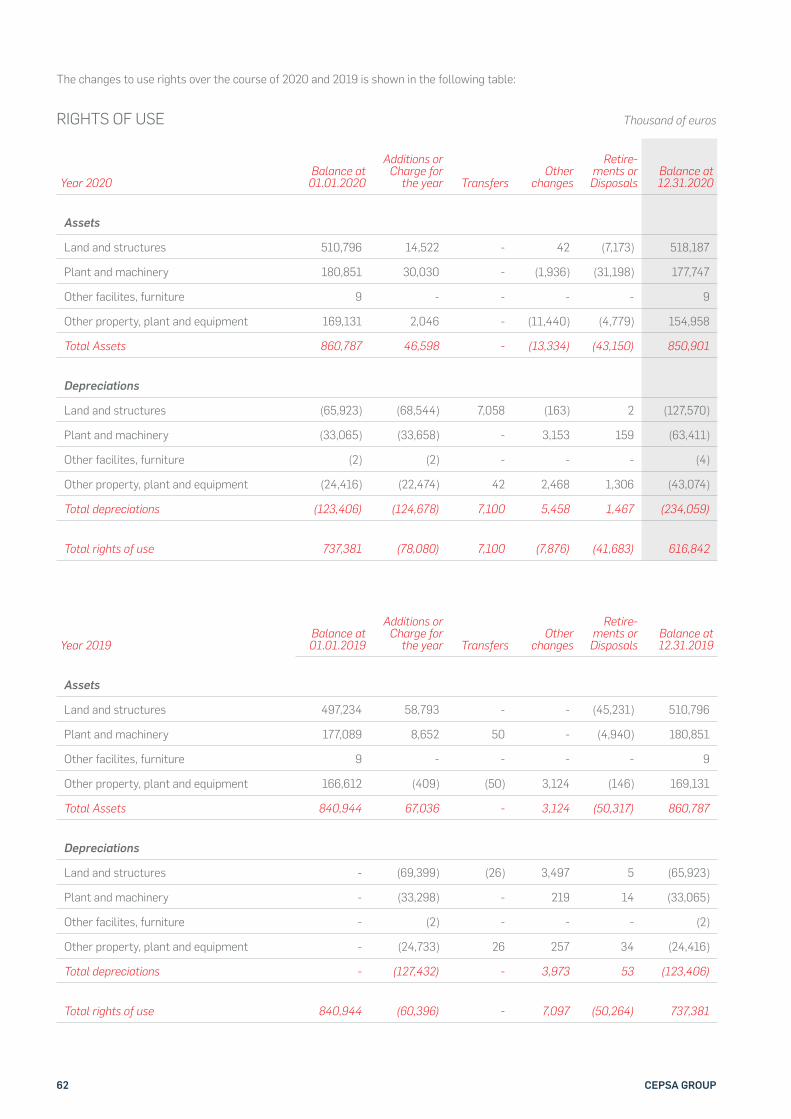
62 CEPSA GROUP
The changes to use rights over the course of 2020 and 2019 is shown in the following table:
RIGHTS OF USE Thousand of euros
Year 2020Balance at
01.01.2020
Additions or Charge for
the year TransfersOther
changes
Retire-ments or Disposals
Balance at 12.31.2020
Assets
Land and structures 510,796 14,522 - 42 (7,173) 518,187
Plant and machinery 180,851 30,030 - (1,936) (31,198) 177,747
Other facilites, furniture 9 - - - - 9
Other property, plant and equipment 169,131 2,046 - (11,440) (4,779) 154,958
Total Assets 860,787 46,598 - (13,334) (43,150) 850,901
Depreciations
Land and structures (65,923) (68,544) 7,058 (163) 2 (127,570)
Plant and machinery (33,065) (33,658) - 3,153 159 (63,411)
Other facilites, furniture (2) (2) - - - (4)
Other property, plant and equipment (24,416) (22,474) 42 2,468 1,306 (43,074)
Total depreciations (123,406) (124,678) 7,100 5,458 1,467 (234,059)
Total rights of use 737,381 (78,080) 7,100 (7,876) (41,683) 616,842
Year 2019Balance at 01.01.2019
Additions or Charge for
the year TransfersOther
changes
Retire-ments or Disposals
Balance at 12.31.2019
Assets
Land and structures 497,234 58,793 - - (45,231) 510,796
Plant and machinery 177,089 8,652 50 - (4,940) 180,851
Other facilites, furniture 9 - - - - 9
Other property, plant and equipment 166,612 (409) (50) 3,124 (146) 169,131
Total Assets 840,944 67,036 - 3,124 (50,317) 860,787
Depreciations
Land and structures - (69,399) (26) 3,497 5 (65,923)
Plant and machinery - (33,298) - 219 14 (33,065)
Other facilites, furniture - (2) - - - (2)
Other property, plant and equipment - (24,733) 26 257 34 (24,416)
Total depreciations - (127,432) - 3,973 53 (123,406)
Total rights of use 840,944 (60,396) - 7,097 (50,264) 737,381
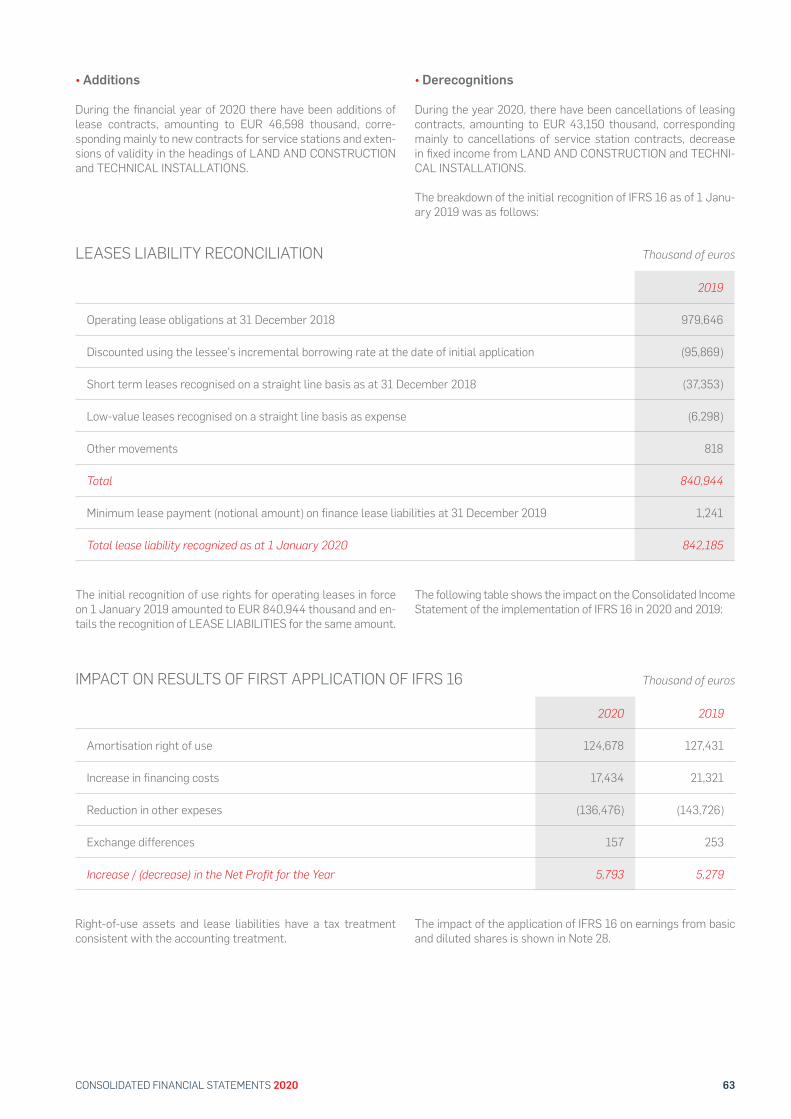
63CONSOLIDATED FINANCIAL STATEMENTS 2020
LEASES LIABILITY RECONCILIATION
IMPACT ON RESULTS OF FIRST APPLICATION OF IFRS 16
Thousand of euros
Thousand of euros
2019
Operating lease obligations at 31 December 2018 979,646
Discounted using the lessee’s incremental borrowing rate at the date of initial application (95,869)
Short term leases recognised on a straight line basis as at 31 December 2018 (37,353)
Low-value leases recognised on a straight line basis as expense (6,298)
Other movements 818
Total 840,944
Minimum lease payment (notional amount) on finance lease liabilities at 31 December 2019 1,241
Total lease liability recognized as at 1 January 2020 842,185
2020 2019
Amortisation right of use 124,678 127,431
Increase in financing costs 17,434 21,321
Reduction in other expeses (136,476) (143,726)
Exchange differences 157 253
Increase / (decrease) in the Net Profit for the Year 5,793 5,279
• Additions
During the !nancial year of 2020 there have been additions of lease contracts, amounting to EUR 46,598 thousand, corre-sponding mainly to new contracts for service stations and exten-sions of validity in the headings of LAND AND CONSTRUCTION and TECHNICAL INSTALLATIONS.
• Derecognitions
During the year 2020, there have been cancellations of leasing contracts, amounting to EUR 43,150 thousand, corresponding mainly to cancellations of service station contracts, decrease in !xed income from LAND AND CONSTRUCTION and TECHNI-CAL INSTALLATIONS.
The breakdown of the initial recognition of IFRS 16 as of 1 Janu-ary 2019 was as follows:
The initial recognition of use rights for operating leases in force on 1 January 2019 amounted to EUR 840,944 thousand and en-tails the recognition of LEASE LIABILITIES for the same amount.
The following table shows the impact on the Consolidated Income Statement of the implementation of IFRS 16 in 2020 and 2019:
Right-of-use assets and lease liabilities have a tax treatment consistent with the accounting treatment.
The impact of the application of IFRS 16 on earnings from basic and diluted shares is shown in Note 28.
64 CEPSA GROUP
13. FINANCIAL ASSETS
• ACCOUNTING POLICIES
The Group applies IFRS 9 in the recognition of these assets.
Trade receivables and debt securities issued by the Group are recognized for the !rst time when they are created. All other !nancial assets are recognized for the !rst time when the Group is made party to the instrument’s contrac-tual provisions.
At initial recognition, the Group measures !nancial assets at their fair value plus, in the case of a !nancial asset not at fair value through pro!t or loss (FV-CPG), transaction costs that are directly attributable to the acquisition of the !nancial as-set. On the other hand, the transaction costs of the !nancial assets accounted for at fair value through pro!t or loss are taken to pro!t or loss.
Subsequent measurement depends on the group’s business model for managing the !nancial asset and the contractual cash "ow characteristics of the !nancial asset. For purposes of subsequent measurement, !nancial assets are classi!ed in four categories:
I. Financial assets at amortized cost
This category is the most relevant to the Group. The Group measures !nancial assets at amortized cost if both of the following conditions are met:
• financial assets are maintained within a business model whose objective is to maintain financial assets to obtain contractual cash flows, and
• the contractual conditions of the financial asset give rise on specific dates to cash flows that are solely payments of principal and interest on the principal amount outstanding.
Interest income from these !nancial assets is included in !-nance income using the effective interest rate method. Any gain or loss arising on derecognition is recognized directly in pro!t or loss.
II. Financial assets at fair value through other com-prehensive income (FVTOCI) (debt instruments)
The Group measures debt instruments at fair value through other comprehensive income (OCI) if both of the following conditions are met:
• the financial asset is held within a business model with the objective of both obtaining contractual cash flows and for sale; and
• the contractual terms of the financial asset give rise on specific dates to cash flows that are solely payments of principal and interest on the principal amount outstanding.
The Group’s debt instruments recognized at FV-OCI include the sub-portfolio of trade receivables subject to pos-sible securitization.
III. Financial assets at fair value through other comprehensive income (FVTOCI) (equity instrument)
The Group can choose to classify irrevocably its equity in-vestments as equity investments designated at fair value through OCI. The classi!cation is determined on an instru-ment-by instrument basis. The Group has chosen not to clas-sify any equity investment under this category.
IV. Financial assets at fair value through pro!t or loss (FVTPL).
Assets that do not meet the criteria of the previous catego-ries are measured at FVTPL.
Upon initial recognition, an asset does not change categories unless the Group modi!es its business model to manage its !nancial assets.
IMPAIRMENT OF FINANCIAL ASSETS
The group assesses on a forward-looking-basis the expected credit losses associated with its debt instruments carried at amortized cost and FVTOCI. The impairment methodology applied depends on whether there has been a signi!cant in-crease in credit risk.
For trade receivables, the Group applies the simpli!ed ap-proach permitted by IFRS 9, which requires expected lifetime losses to be recognized from initial recognition of the assets.
DERECOGNITIONS
A !nancial asset (or, where applicable, a part of a !nancial asset or part of a group of similar !nancial assets) is primar-ily derecognized (i.e., removed from the Group’s consolidated Balance Sheet) when:
• the rights to receive cash flows from the asset have expired or
• the Group has transferred its rights to receive cash flows from the asset or has assumed an obligation to pay the received cash flows in full without material delay to a third party under a “pass-through” arrangement; and also:
• the Group has transferred substantially all the risks and rewards of the asset, or
• the Group has neither transferred nor retained substantially all the risks and rewards of the asset, but has transferred control of the asset.
65CONSOLIDATED FINANCIAL STATEMENTS 2020
If the group does not transfer or substantially retain all risks and bene!ts of the property and continues to have control of the transferred asset, the Group recognizes the interest retained in the asset and an associated liability for the amounts it may be obliged to pay.
If the Group substantially retains all the risks and bene!ts of ownership of a transferred !nancial asset, the Group continues to recognize the !nancial asset and also recog-nizes collateral indebtedness for the income received.
By derecognizing a !nancial asset valued at amortized cost, the difference between the carrying amount of the asset and the amount of the collection received and due to receive is recognized in pro!t or loss. Additionally, by derecognizing an investment in a debt instrument classi-!ed as !nancial assets at fair value with other comprehen-sive income, the pro!t or loss previously accumulated in the investment revaluation reserve is reclassi!ed to pro!t or loss. On the contrary, by derecognizing an investment in a capital instrument that the Group has chosen at the be-ginning to measure at fair value with other comprehensive income, the pro!t or loss previously accumulated in the in-vestment revaluation reserve is not reclassi!ed to pro!t or loss, but transferred to reserves.
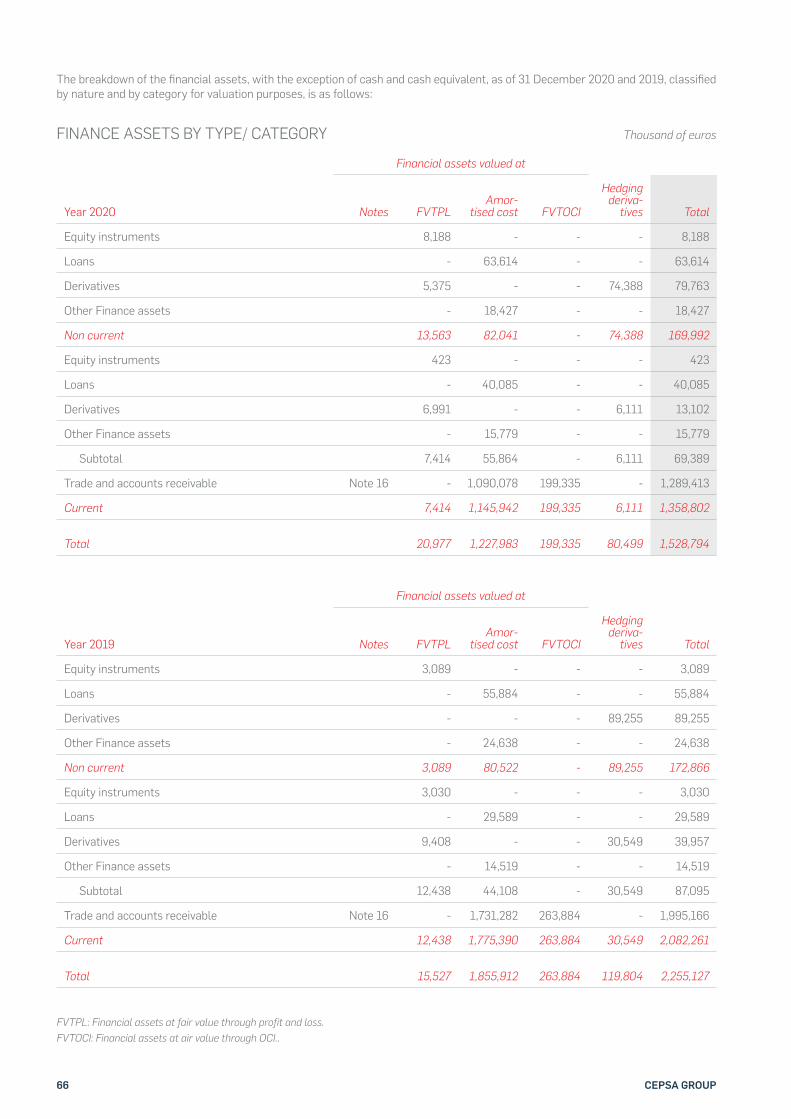
66 CEPSA GROUP
The breakdown of the !nancial assets, with the exception of cash and cash equivalent, as of 31 December 2020 and 2019, classi!ed by nature and by category for valuation purposes, is as follows:
FINANCE ASSETS BY TYPE/ CATEGORY Thousand of euros
Financial assets valued at
Year 2020 Notes FVTPLAmor-
tised cost FVTOCI
Hedging deriva-
tives Total
Equity instruments 8,188 - - - 8,188
Loans - 63,614 - - 63,614
Derivatives 5,375 - - 74,388 79,763
Other Finance assets - 18,427 - - 18,427
Non current 13,563 82,041 - 74,388 169,992
Equity instruments 423 - - - 423
Loans - 40,085 - - 40,085
Derivatives 6,991 - - 6,111 13,102
Other Finance assets - 15,779 - - 15,779
Subtotal 7,414 55,864 - 6,111 69,389
Trade and accounts receivable Note 16 - 1,090,078 199,335 - 1,289,413
Current 7,414 1,145,942 199,335 6,111 1,358,802
Total 20,977 1,227,983 199,335 80,499 1,528,794
Financial assets valued at
Year 2019 Notes FVTPLAmor-
tised cost FVTOCI
Hedging deriva-
tives Total
Equity instruments 3,089 - - - 3,089
Loans - 55,884 - - 55,884
Derivatives - - - 89,255 89,255
Other Finance assets - 24,638 - - 24,638
Non current 3,089 80,522 - 89,255 172,866
Equity instruments 3,030 - - - 3,030
Loans - 29,589 - - 29,589
Derivatives 9,408 - - 30,549 39,957
Other Finance assets - 14,519 - - 14,519
Subtotal 12,438 44,108 - 30,549 87,095
Trade and accounts receivable Note 16 - 1,731,282 263,884 - 1,995,166
Current 12,438 1,775,390 263,884 30,549 2,082,261
Total 15,527 1,855,912 263,884 119,804 2,255,127 FVTPL: Financial assets at fair value through profit and loss.FVTOCI: Financial assets at air value through OCI..
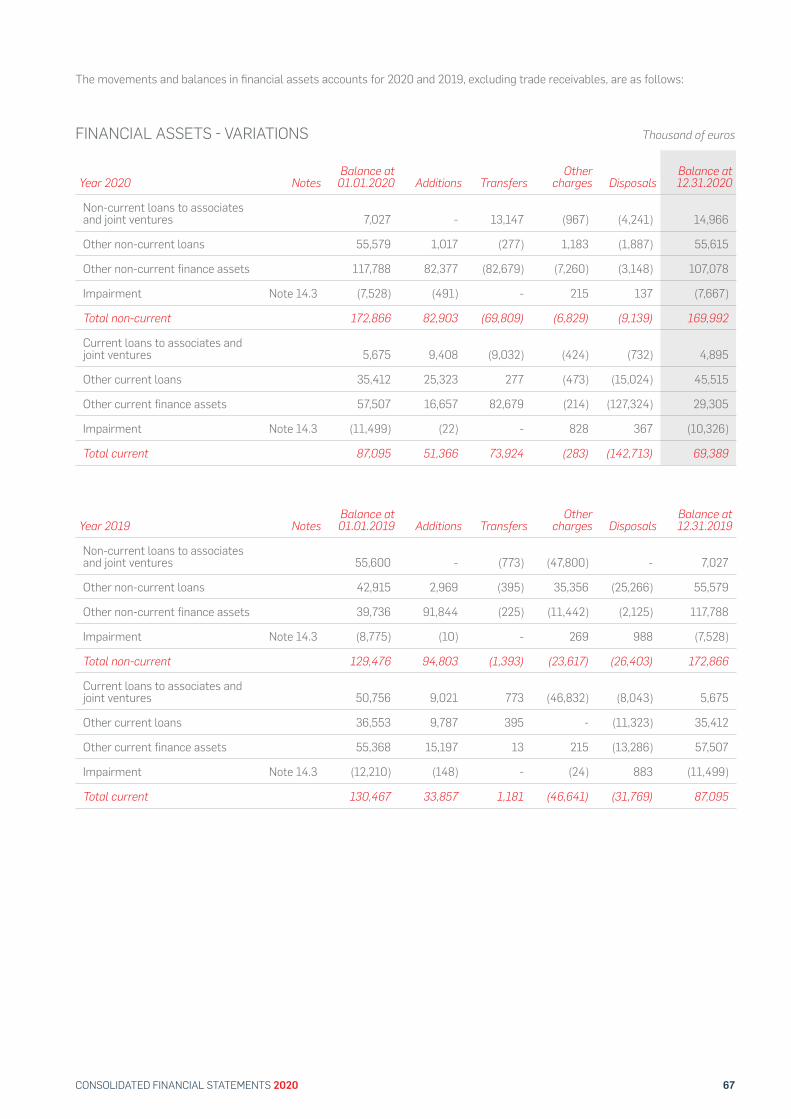
67CONSOLIDATED FINANCIAL STATEMENTS 2020
The movements and balances in !nancial assets accounts for 2020 and 2019, excluding trade receivables, are as follows:
FINANCIAL ASSETS # VARIATIONS Thousand of euros
Year 2020 NotesBalance at
01.01.2020 Additions TransfersOther
charges DisposalsBalance at 12.31.2020
Non-current loans to associates and joint ventures 7,027 - 13,147 (967) (4,241) 14,966
Other non-current loans 55,579 1,017 (277) 1,183 (1,887) 55,615
Other non-current finance assets 117,788 82,377 (82,679) (7,260) (3,148) 107,078
Impairment Note 14.3 (7,528) (491) - 215 137 (7,667)
Total non-current 172,866 82,903 (69,809) (6,829) (9,139) 169,992
Current loans to associates and joint ventures 5,675 9,408 (9,032) (424) (732) 4,895
Other current loans 35,412 25,323 277 (473) (15,024) 45,515
Other current finance assets 57,507 16,657 82,679 (214) (127,324) 29,305
Impairment Note 14.3 (11,499) (22) - 828 367 (10,326)
Total current 87,095 51,366 73,924 (283) (142,713) 69,389
Year 2019 NotesBalance at 01.01.2019 Additions Transfers
Other charges Disposals
Balance at 12.31.2019
Non-current loans to associates and joint ventures 55,600 - (773) (47,800) - 7,027
Other non-current loans 42,915 2,969 (395) 35,356 (25,266) 55,579
Other non-current finance assets 39,736 91,844 (225) (11,442) (2,125) 117,788
Impairment Note 14.3 (8,775) (10) - 269 988 (7,528)
Total non-current 129,476 94,803 (1,393) (23,617) (26,403) 172,866
Current loans to associates and joint ventures 50,756 9,021 773 (46,832) (8,043) 5,675
Other current loans 36,553 9,787 395 - (11,323) 35,412
Other current finance assets 55,368 15,197 13 215 (13,286) 57,507
Impairment Note 14.3 (12,210) (148) - (24) 883 (11,499)
Total current 130,467 33,857 1,181 (46,641) (31,769) 87,095
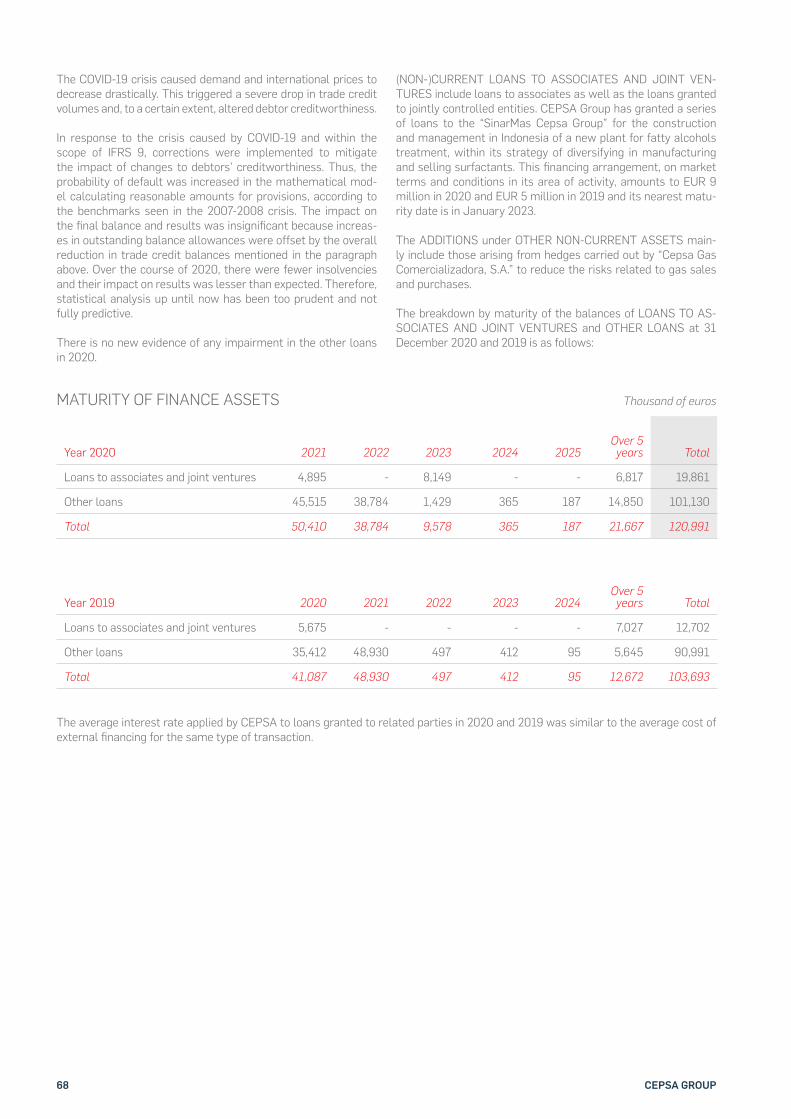
68 CEPSA GROUP
The COVID-19 crisis caused demand and international prices to decrease drastically. This triggered a severe drop in trade credit volumes and, to a certain extent, altered debtor creditworthiness.
In response to the crisis caused by COVID-19 and within the scope of IFRS 9, corrections were implemented to mitigate the impact of changes to debtors’ creditworthiness. Thus, the probability of default was increased in the mathematical mod-el calculating reasonable amounts for provisions, according to the benchmarks seen in the 2007-2008 crisis. The impact on the !nal balance and results was insigni!cant because increas-es in outstanding balance allowances were offset by the overall reduction in trade credit balances mentioned in the paragraph above. Over the course of 2020, there were fewer insolvencies and their impact on results was lesser than expected. Therefore, statistical analysis up until now has been too prudent and not fully predictive.
There is no new evidence of any impairment in the other loans in 2020.
(NON-)CURRENT LOANS TO ASSOCIATES AND JOINT VEN-TURES include loans to associates as well as the loans granted to jointly controlled entities. CEPSA Group has granted a series of loans to the “SinarMas Cepsa Group” for the construction and management in Indonesia of a new plant for fatty alcohols treatment, within its strategy of diversifying in manufacturing and selling surfactants. This !nancing arrangement, on market terms and conditions in its area of activity, amounts to EUR 9 million in 2020 and EUR 5 million in 2019 and its nearest matu-rity date is in January 2023.
The ADDITIONS under OTHER NON-CURRENT ASSETS main-ly include those arising from hedges carried out by “Cepsa Gas Comercializadora, S.A.” to reduce the risks related to gas sales and purchases.
The breakdown by maturity of the balances of LOANS TO AS-SOCIATES AND JOINT VENTURES and OTHER LOANS at 31 December 2020 and 2019 is as follows:
MATURITY OF FINANCE ASSETS Thousand of euros
Year 2020 2021 2022 2023 2024 2025Over 5 years Total
Loans to associates and joint ventures 4,895 - 8,149 - - 6,817 19,861
Other loans 45,515 38,784 1,429 365 187 14,850 101,130
Total 50,410 38,784 9,578 365 187 21,667 120,991
Year 2019 2020 2021 2022 2023 2024Over 5 years Total
Loans to associates and joint ventures 5,675 - - - - 7,027 12,702
Other loans 35,412 48,930 497 412 95 5,645 90,991
Total 41,087 48,930 497 412 95 12,672 103,693
The average interest rate applied by CEPSA to loans granted to related parties in 2020 and 2019 was similar to the average cost of external !nancing for the same type of transaction.
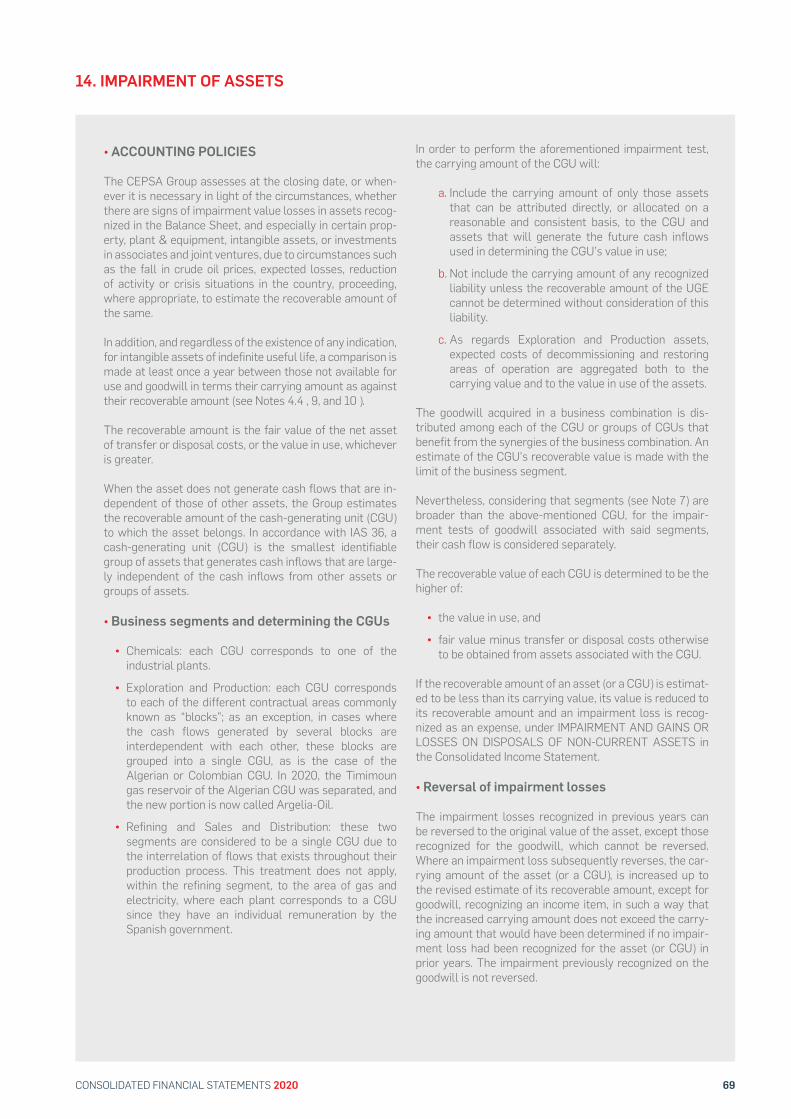
69CONSOLIDATED FINANCIAL STATEMENTS 2020
14. IMPAIRMENT OF ASSETS
• ACCOUNTING POLICIES
The CEPSA Group assesses at the closing date, or when-ever it is necessary in light of the circumstances, whether there are signs of impairment value losses in assets recog-nized in the Balance Sheet, and especially in certain prop-erty, plant & equipment, intangible assets, or investments in associates and joint ventures, due to circumstances such as the fall in crude oil prices, expected losses, reduction of activity or crisis situations in the country, proceeding, where appropriate, to estimate the recoverable amount of the same.
In addition, and regardless of the existence of any indication, for intangible assets of indefinite useful life, a comparison is made at least once a year between those not available for use and goodwill in terms their carrying amount as against their recoverable amount (see Notes 4.4 , 9, and 10 ).
The recoverable amount is the fair value of the net asset of transfer or disposal costs, or the value in use, whichever is greater.
When the asset does not generate cash flows that are in-dependent of those of other assets, the Group estimates the recoverable amount of the cash-generating unit (CGU) to which the asset belongs. In accordance with IAS 36, a cash-generating unit (CGU) is the smallest identifiable group of assets that generates cash inflows that are large-ly independent of the cash inflows from other assets or groups of assets.
• Business segments and determining the CGUs
• Chemicals: each CGU corresponds to one of the industrial plants.
• Exploration and Production: each CGU corresponds to each of the different contractual areas commonly known as “blocks”; as an exception, in cases where the cash flows generated by several blocks are interdependent with each other, these blocks are grouped into a single CGU, as is the case of the Algerian or Colombian CGU. In 2020, the Timimoun gas reservoir of the Algerian CGU was separated, and the new portion is now called Argelia-Oil.
• Refining and Sales and Distribution: these two segments are considered to be a single CGU due to the interrelation of flows that exists throughout their production process. This treatment does not apply, within the refining segment, to the area of gas and electricity, where each plant corresponds to a CGU since they have an individual remuneration by the Spanish government.
In order to perform the aforementioned impairment test, the carrying amount of the CGU will:
a. Include the carrying amount of only those assets that can be attributed directly, or allocated on a reasonable and consistent basis, to the CGU and assets that will generate the future cash in"ows used in determining the CGU’s value in use;
b. Not include the carrying amount of any recognized liability unless the recoverable amount of the UGE cannot be determined without consideration of this liability.
c. As regards Exploration and Production assets, expected costs of decommissioning and restoring areas of operation are aggregated both to the carrying value and to the value in use of the assets.
The goodwill acquired in a business combination is dis-tributed among each of the CGU or groups of CGUs that benefit from the synergies of the business combination. An estimate of the CGU’s recoverable value is made with the limit of the business segment.
Nevertheless, considering that segments (see Note 7) are broader than the above-mentioned CGU, for the impair-ment tests of goodwill associated with said segments, their cash flow is considered separately.
The recoverable value of each CGU is determined to be the higher of:
• the value in use, and
• fair value minus transfer or disposal costs otherwise to be obtained from assets associated with the CGU.
If the recoverable amount of an asset (or a CGU) is estimat-ed to be less than its carrying value, its value is reduced to its recoverable amount and an impairment loss is recog-nized as an expense, under IMPAIRMENT AND GAINS OR LOSSES ON DISPOSALS OF NON-CURRENT ASSETS in the Consolidated Income Statement.
• Reversal of impairment losses
The impairment losses recognized in previous years can be reversed to the original value of the asset, except those recognized for the goodwill, which cannot be reversed. Where an impairment loss subsequently reverses, the car-rying amount of the asset (or a CGU), is increased up to the revised estimate of its recoverable amount, except for goodwill, recognizing an income item, in such a way that the increased carrying amount does not exceed the carry-ing amount that would have been determined if no impair-ment loss had been recognized for the asset (or CGU) in prior years. The impairment previously recognized on the goodwill is not reversed.
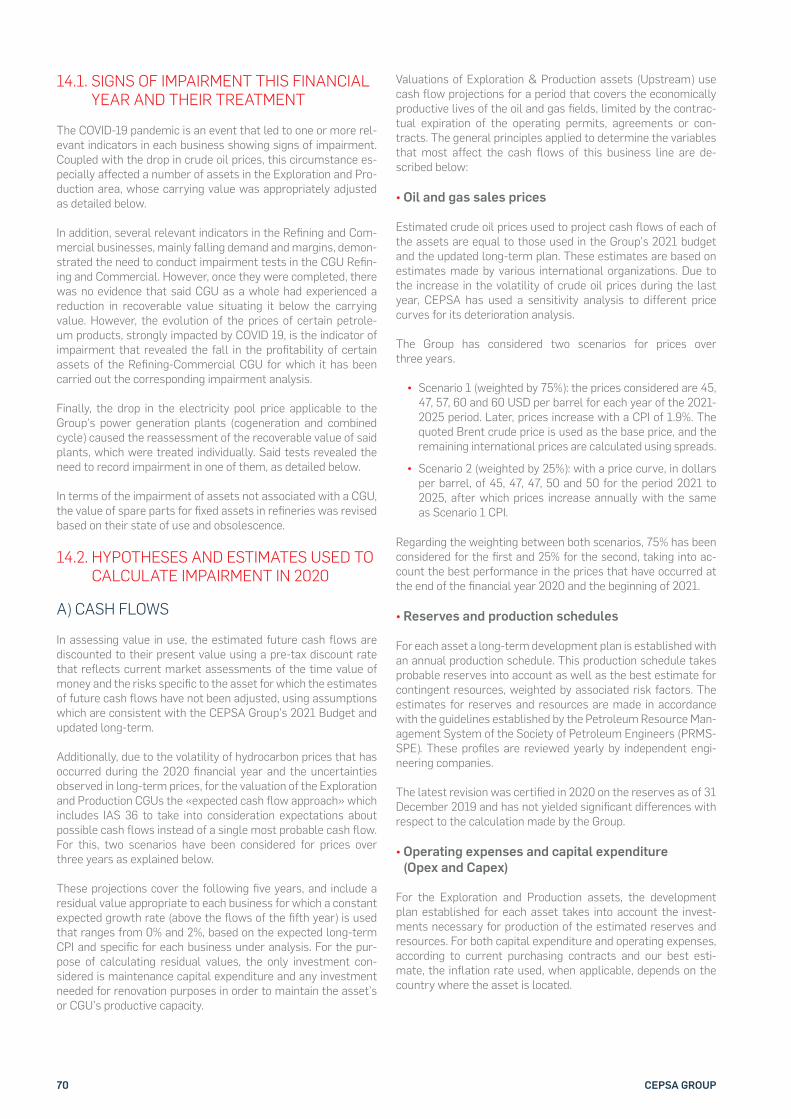
70 CEPSA GROUP
14.1. SIGNS OF IMPAIRMENT THIS FINANCIAL YEAR AND THEIR TREATMENT
The COVID-19 pandemic is an event that led to one or more rel-evant indicators in each business showing signs of impairment. Coupled with the drop in crude oil prices, this circumstance es-pecially affected a number of assets in the Exploration and Pro-duction area, whose carrying value was appropriately adjusted as detailed below.
In addition, several relevant indicators in the Re!ning and Com-mercial businesses, mainly falling demand and margins, demon-strated the need to conduct impairment tests in the CGU Re!n-ing and Commercial. However, once they were completed, there was no evidence that said CGU as a whole had experienced a reduction in recoverable value situating it below the carrying value. However, the evolution of the prices of certain petrole-um products, strongly impacted by COVID 19, is the indicator of impairment that revealed the fall in the pro!tability of certain assets of the Re!ning-Commercial CGU for which it has been carried out the corresponding impairment analysis.
Finally, the drop in the electricity pool price applicable to the Group’s power generation plants (cogeneration and combined cycle) caused the reassessment of the recoverable value of said plants, which were treated individually. Said tests revealed the need to record impairment in one of them, as detailed below.
In terms of the impairment of assets not associated with a CGU, the value of spare parts for !xed assets in re!neries was revised based on their state of use and obsolescence.
14.2. HYPOTHESES AND ESTIMATES USED TO CALCULATE IMPAIRMENT IN 2020
A) CASH FLOWS
In assessing value in use, the estimated future cash "ows are discounted to their present value using a pre-tax discount rate that re"ects current market assessments of the time value of money and the risks speci!c to the asset for which the estimates of future cash "ows have not been adjusted, using assumptions which are consistent with the CEPSA Group’s 2021 Budget and updated long-term.
Additionally, due to the volatility of hydrocarbon prices that has occurred during the 2020 !nancial year and the uncertainties observed in long-term prices, for the valuation of the Exploration and Production CGUs the «expected cash "ow approach» which includes IAS 36 to take into consideration expectations about possible cash "ows instead of a single most probable cash "ow. For this, two scenarios have been considered for prices over three years as explained below.
These projections cover the following !ve years, and include a residual value appropriate to each business for which a constant expected growth rate (above the "ows of the !fth year) is used that ranges from 0% and 2%, based on the expected long-term CPI and speci!c for each business under analysis. For the pur-pose of calculating residual values, the only investment con-sidered is maintenance capital expenditure and any investment needed for renovation purposes in order to maintain the asset’s or CGU’s productive capacity.
Valuations of Exploration & Production assets (Upstream) use cash "ow projections for a period that covers the economically productive lives of the oil and gas !elds, limited by the contrac-tual expiration of the operating permits, agreements or con-tracts. The general principles applied to determine the variables that most affect the cash "ows of this business line are de-scribed below:
• Oil and gas sales prices
Estimated crude oil prices used to project cash "ows of each of the assets are equal to those used in the Group’s 2021 budget and the updated long-term plan. These estimates are based on estimates made by various international organizations. Due to the increase in the volatility of crude oil prices during the last year, CEPSA has used a sensitivity analysis to different price curves for its deterioration analysis.
The Group has considered two scenarios for prices over three years.
• Scenario 1 (weighted by 75%): the prices considered are 45, 47, 57, 60 and 60 USD per barrel for each year of the 2021-2025 period. Later, prices increase with a CPI of 1.9%. The quoted Brent crude price is used as the base price, and the remaining international prices are calculated using spreads.
• Scenario 2 (weighted by 25%): with a price curve, in dollars per barrel, of 45, 47, 47, 50 and 50 for the period 2021 to 2025, after which prices increase annually with the same as Scenario 1 CPI.
Regarding the weighting between both scenarios, 75% has been considered for the !rst and 25% for the second, taking into ac-count the best performance in the prices that have occurred at the end of the !nancial year 2020 and the beginning of 2021.
• Reserves and production schedules
For each asset a long-term development plan is established with an annual production schedule. This production schedule takes probable reserves into account as well as the best estimate for contingent resources, weighted by associated risk factors. The estimates for reserves and resources are made in accordance with the guidelines established by the Petroleum Resource Man-agement System of the Society of Petroleum Engineers (PRMS-SPE). These pro!les are reviewed yearly by independent engi-neering companies.
The latest revision was certi!ed in 2020 on the reserves as of 31 December 2019 and has not yielded signi!cant differences with respect to the calculation made by the Group.
• Operating expenses and capital expenditure (Opex and Capex)
For the Exploration and Production assets, the development plan established for each asset takes into account the invest-ments necessary for production of the estimated reserves and resources. For both capital expenditure and operating expenses, according to current purchasing contracts and our best esti-mate, the in"ation rate used, when applicable, depends on the country where the asset is located.
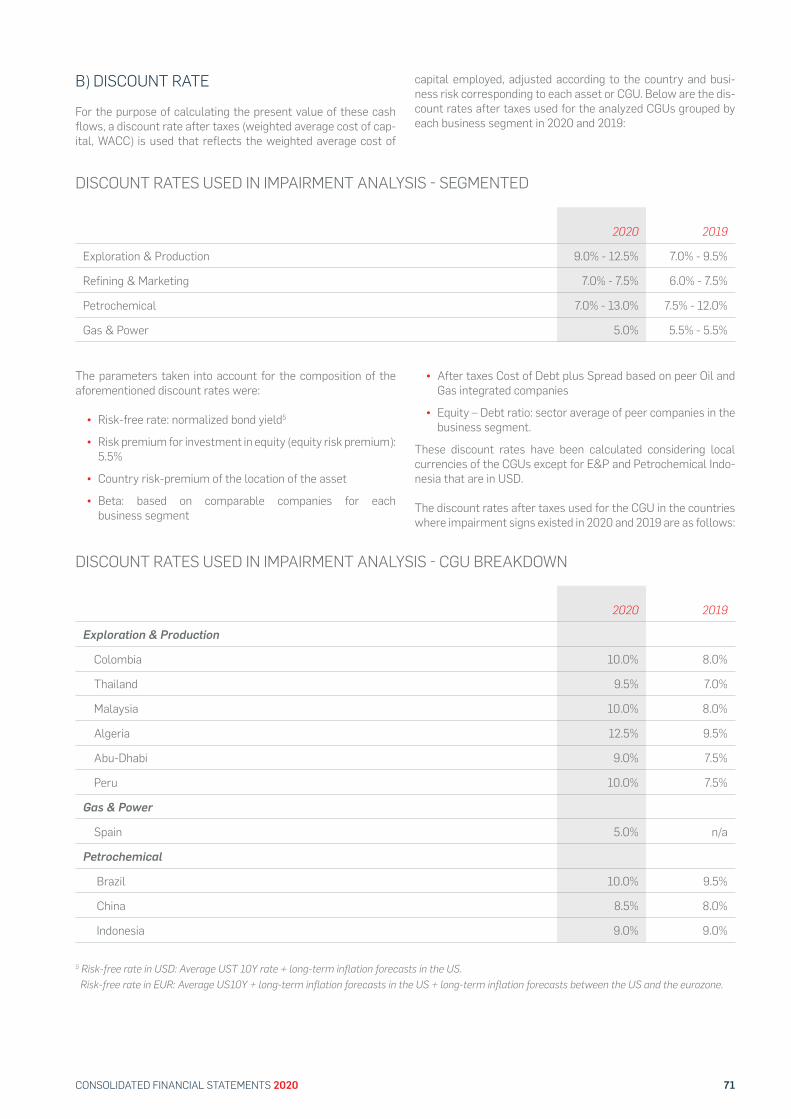
71CONSOLIDATED FINANCIAL STATEMENTS 2020
B) DISCOUNT RATE
For the purpose of calculating the present value of these cash "ows, a discount rate after taxes (weighted average cost of cap-ital, WACC) is used that re"ects the weighted average cost of
capital employed, adjusted according to the country and busi-ness risk corresponding to each asset or CGU. Below are the dis-count rates after taxes used for the analyzed CGUs grouped by each business segment in 2020 and 2019:
The parameters taken into account for the composition of the aforementioned discount rates were:
• Risk-free rate: normalized bond yield5
• Risk premium for investment in equity (equity risk premium): 5.5%
• Country risk-premium of the location of the asset
• Beta: based on comparable companies for each business segment
• After taxes Cost of Debt plus Spread based on peer Oil and Gas integrated companies
• Equity – Debt ratio: sector average of peer companies in the business segment.
These discount rates have been calculated considering local currencies of the CGUs except for E&P and Petrochemical Indo-nesia that are in USD.
The discount rates after taxes used for the CGU in the countries where impairment signs existed in 2020 and 2019 are as follows:
DISCOUNT RATES USED IN IMPAIRMENT ANALYSIS # SEGMENTED
DISCOUNT RATES USED IN IMPAIRMENT ANALYSIS # CGU BREAKDOWN
2020 2019
Exploration & Production 9.0% - 12.5% 7.0% - 9.5%
Refining & Marketing 7.0% - 7.5% 6.0% - 7.5%
Petrochemical 7.0% - 13.0% 7.5% - 12.0%
Gas & Power 5.0% 5.5% - 5.5%
2020 2019
Exploration & Production
Colombia 10.0% 8.0%
Thailand 9.5% 7.0%
Malaysia 10.0% 8.0%
Algeria 12.5% 9.5%
Abu-Dhabi 9.0% 7.5%
Peru 10.0% 7.5%
Gas & Power
Spain 5.0% n/a
Petrochemical
Brazil 10.0% 9.5%
China 8.5% 8.0%
Indonesia 9.0% 9.0%
5 Risk-free rate in USD: Average UST 10Y rate + long-term inflation forecasts in the US. Risk-free rate in EUR: Average US10Y + long-term inflation forecasts in the US + long-term inflation forecasts between the US and the eurozone.
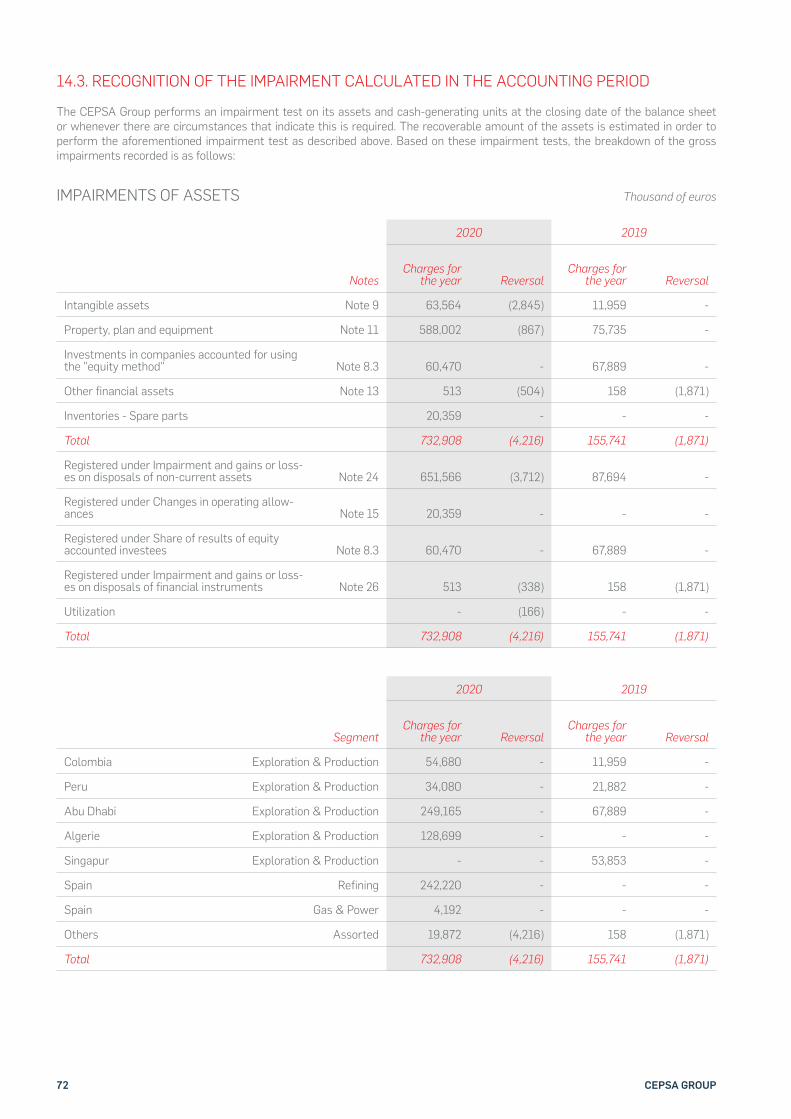
72 CEPSA GROUP
14.3. RECOGNITION OF THE IMPAIRMENT CALCULATED IN THE ACCOUNTING PERIOD
The CEPSA Group performs an impairment test on its assets and cash-generating units at the closing date of the balance sheet or whenever there are circumstances that indicate this is required. The recoverable amount of the assets is estimated in order to perform the aforementioned impairment test as described above. Based on these impairment tests, the breakdown of the gross impairments recorded is as follows:
2020 2019
NotesCharges for
the year ReversalCharges for
the year Reversal
Intangible assets Note 9 63,564 (2,845) 11,959 -
Property, plan and equipment Note 11 588,002 (867) 75,735 -
Investments in companies accounted for using the "equity method" Note 8.3 60,470 - 67,889 -
Other financial assets Note 13 513 (504) 158 (1,871)
Inventories - Spare parts 20,359 - - -
Total 732,908 (4,216) 155,741 (1,871)
Registered under Impairment and gains or loss-es on disposals of non-current assets Note 24 651,566 (3,712) 87,694 -
Registered under Changes in operating allow-ances Note 15 20,359 - - -
Registered under Share of results of equity accounted investees Note 8.3 60,470 - 67,889 -
Registered under Impairment and gains or loss-es on disposals of financial instruments Note 26 513 (338) 158 (1,871)
Utilization - (166) - -
Total 732,908 (4,216) 155,741 (1,871)
2020 2019
SegmentCharges for
the year ReversalCharges for
the year Reversal
Colombia Exploration & Production 54,680 - 11,959 -
Peru Exploration & Production 34,080 - 21,882 -
Abu Dhabi Exploration & Production 249,165 - 67,889 -
Algerie Exploration & Production 128,699 - - -
Singapur Exploration & Production - - 53,853 -
Spain Refining 242,220 - - -
Spain Gas & Power 4,192 - - -
Others Assorted 19,872 (4,216) 158 (1,871)
Total 732,908 (4,216) 155,741 (1,871)
IMPAIRMENTS OF ASSETS Thousand of euros
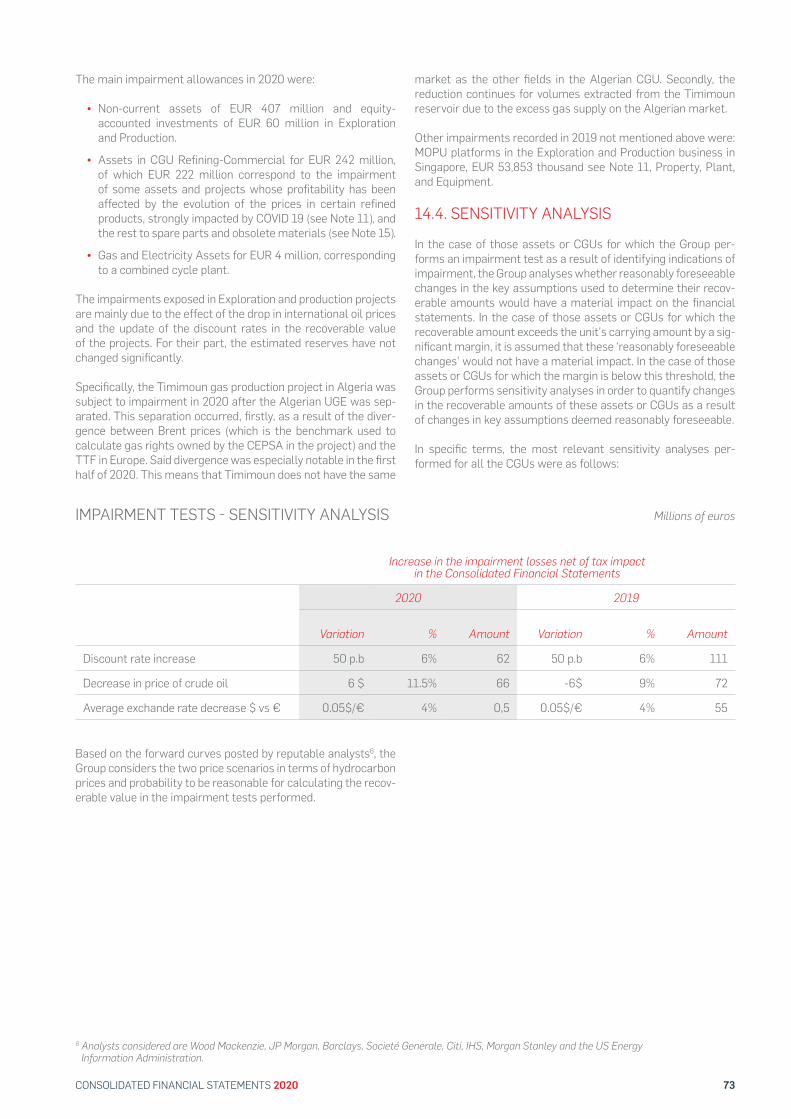
73CONSOLIDATED FINANCIAL STATEMENTS 2020
Increase in the impairment losses net of tax impactin the Consolidated Financial Statements
2020 2019
Variation % Amount Variation % Amount
Discount rate increase 50 p.b 6% 62 50 p.b 6% 111
Decrease in price of crude oil 6 $ 11.5% 66 -6$ 9% 72
Average exchande rate decrease $ vs & 0.05$/& 4% 0,5 0.05$/& 4% 55
The main impairment allowances in 2020 were:
• Non-current assets of EUR 407 million and equity-accounted investments of EUR 60 million in Exploration and Production.
• Assets in CGU Refining-Commercial for EUR 242 million, of which EUR 222 million correspond to the impairment of some assets and projects whose profitability has been affected by the evolution of the prices in certain refined products, strongly impacted by COVID 19 (see Note 11), and the rest to spare parts and obsolete materials (see Note 15).
• Gas and Electricity Assets for EUR 4 million, corresponding to a combined cycle plant.
The impairments exposed in Exploration and production projects are mainly due to the effect of the drop in international oil prices and the update of the discount rates in the recoverable value of the projects. For their part, the estimated reserves have not changed signi!cantly.
Speci!cally, the Timimoun gas production project in Algeria was subject to impairment in 2020 after the Algerian UGE was sep-arated. This separation occurred, !rstly, as a result of the diver-gence between Brent prices (which is the benchmark used to calculate gas rights owned by the CEPSA in the project) and the TTF in Europe. Said divergence was especially notable in the !rst half of 2020. This means that Timimoun does not have the same
market as the other !elds in the Algerian CGU. Secondly, the reduction continues for volumes extracted from the Timimoun reservoir due to the excess gas supply on the Algerian market.
Other impairments recorded in 2019 not mentioned above were: MOPU platforms in the Exploration and Production business in Singapore, EUR 53,853 thousand see Note 11, Property, Plant, and Equipment.
14.4. SENSITIVITY ANALYSIS
In the case of those assets or CGUs for which the Group per-forms an impairment test as a result of identifying indications of impairment, the Group analyses whether reasonably foreseeable changes in the key assumptions used to determine their recov-erable amounts would have a material impact on the !nancial statements. In the case of those assets or CGUs for which the recoverable amount exceeds the unit’s carrying amount by a sig-ni!cant margin, it is assumed that these ‘reasonably foreseeable changes’ would not have a material impact. In the case of those assets or CGUs for which the margin is below this threshold, the Group performs sensitivity analyses in order to quantify changes in the recoverable amounts of these assets or CGUs as a result of changes in key assumptions deemed reasonably foreseeable.
In speci!c terms, the most relevant sensitivity analyses per-formed for all the CGUs were as follows:
IMPAIRMENT TESTS # SENSITIVITY ANALYSIS Millions of euros
Based on the forward curves posted by reputable analysts6, the Group considers the two price scenarios in terms of hydrocarbon prices and probability to be reasonable for calculating the recov-erable value in the impairment tests performed.
6 Analysts considered are Wood Mackenzie, JP Morgan, Barclays, Societé Generale, Citi, IHS, Morgan Stanley and the US Energy Information Administration.
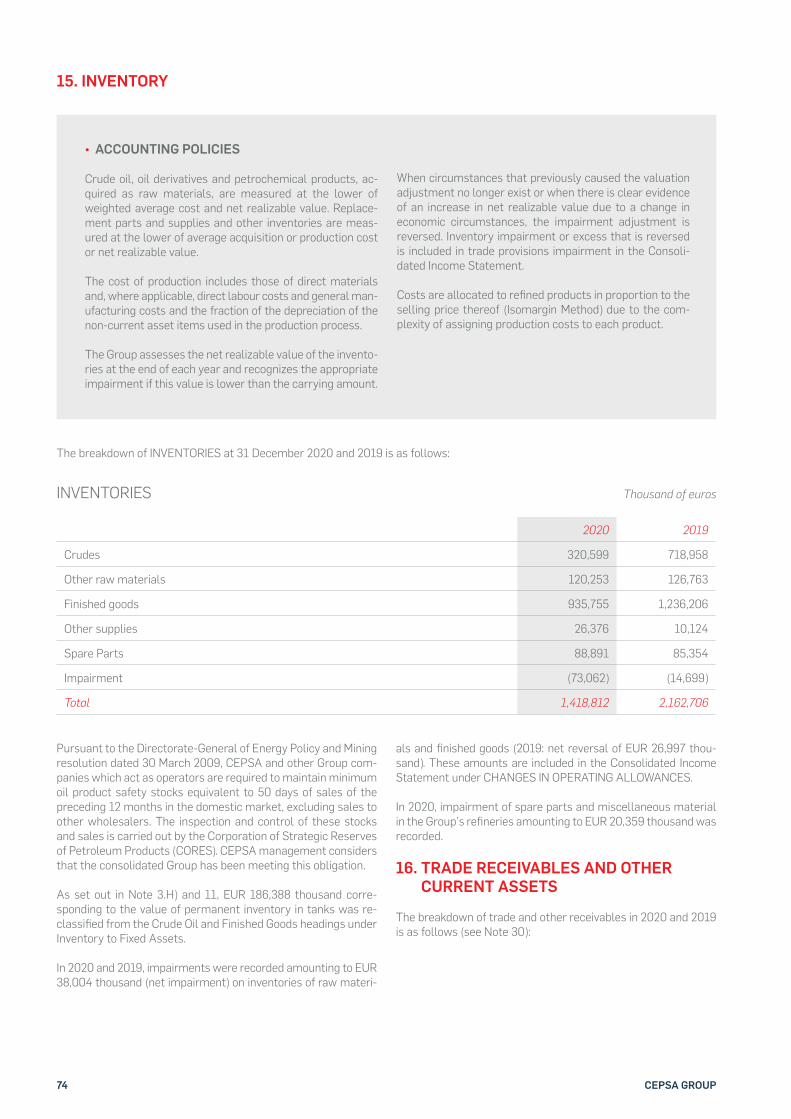
74 CEPSA GROUP
• ACCOUNTING POLICIES
Crude oil, oil derivatives and petrochemical products, ac-quired as raw materials, are measured at the lower of weighted average cost and net realizable value. Replace-ment parts and supplies and other inventories are meas-ured at the lower of average acquisition or production cost or net realizable value.
The cost of production includes those of direct materials and, where applicable, direct labour costs and general man-ufacturing costs and the fraction of the depreciation of the non-current asset items used in the production process.
The Group assesses the net realizable value of the invento-ries at the end of each year and recognizes the appropriate impairment if this value is lower than the carrying amount.
When circumstances that previously caused the valuation adjustment no longer exist or when there is clear evidence of an increase in net realizable value due to a change in economic circumstances, the impairment adjustment is reversed. Inventory impairment or excess that is reversed is included in trade provisions impairment in the Consoli-dated Income Statement.
Costs are allocated to re!ned products in proportion to the selling price thereof (Isomargin Method) due to the com-plexity of assigning production costs to each product.
15. INVENTORY
The breakdown of INVENTORIES at 31 December 2020 and 2019 is as follows:
2020 2019
Crudes 320,599 718,958
Other raw materials 120,253 126,763
Finished goods 935,755 1,236,206
Other supplies 26,376 10,124
Spare Parts 88,891 85,354
Impairment (73,062) (14,699)
Total 1,418,812 2,162,706
INVENTORIES Thousand of euros
Pursuant to the Directorate-General of Energy Policy and Mining resolution dated 30 March 2009, CEPSA and other Group com-panies which act as operators are required to maintain minimum oil product safety stocks equivalent to 50 days of sales of the preceding 12 months in the domestic market, excluding sales to other wholesalers. The inspection and control of these stocks and sales is carried out by the Corporation of Strategic Reserves of Petroleum Products (CORES). CEPSA management considers that the consolidated Group has been meeting this obligation.
As set out in Note 3.H) and 11, EUR 186,388 thousand corre-sponding to the value of permanent inventory in tanks was re-classi!ed from the Crude Oil and Finished Goods headings under Inventory to Fixed Assets.
In 2020 and 2019, impairments were recorded amounting to EUR 38,004 thousand (net impairment) on inventories of raw materi-
als and !nished goods (2019: net reversal of EUR 26,997 thou-sand). These amounts are included in the Consolidated Income Statement under CHANGES IN OPERATING ALLOWANCES.
In 2020, impairment of spare parts and miscellaneous material in the Group’s re!neries amounting to EUR 20,359 thousand was recorded.
16. TRADE RECEIVABLES AND OTHER CURRENT ASSETS
The breakdown of trade and other receivables in 2020 and 2019 is as follows (see Note 30):

75CONSOLIDATED FINANCIAL STATEMENTS 2020
2020 2019
Balance at the beginning of the year (135,837) (134,597)
Additions (12,283) (20,555)
Amounts 19,167 22,032
Other 700 (2,717)
Closing balance for the year (128,253) (135,837)
2020 2019
Public Administration 91,717 106,700
Current income tax assets 19,332 55,624
Other non-trade receivables 6,435 16,751
Prepayments 8,311 12,002
Total 125,795 191,077
Notes 2020 2019
Trade receivables for sales and services 1,369,427 2,030,723
Receivable from associates and joint ventures 19,028 51,502
Advances to suppliers 29,211 48,778
Allowances for bad credits (128,253) (135,837)
Total Note 13 1,289,413 1,995,166
ALLOWANCES FOR BAD CREDITS
OTHER CURRENT ASSETS
TRADE AND OTHER RECEIVABLES
Thousand of euros
Thousand of euros
Thousand of euros
CHANGES IN OPERATING ALLOWANCES on the income statement only refers to trade receivables as follows:
The Group has entered into various !nancial asset transfer agreements (factoring agreements and securitization transac-tions, both without recourse) with !nancial institutions. In the framework of these agreements, the Group transfers receiva-bles denominated in euros and foreign currency to the respec-tive !nancial institutions. Debtors that may be involved in secu-
ritization or factoring transactions are now valued at fair value in accordance with IFRS 9 (see Note 13).
The breakdown of trade and other receivables in 2020 and 2019 is as follows:
The PUBLIC ADMINISTRATION section mainly includes receivables from tax authorities for VAT and other taxes.

76 CEPSA GROUP
• ACCOUNTING POLICIES
This heading includes cash and cash equivalents and other liquid assets.
Cash equivalents include bank deposits and other investments maturing within three months at the time of the contract.
17. CASH AND CASH EQUIVALENTS
The breakdown of cash and cash equivalents at end of year for 2020 and 2019 is shown below:
Notes 2020 2019
Cash in hand 13,055 14,744
Time deposits 1,054,855 380,060
Current accounts 290,497 166,356
Total Note 19 1,358,407 561,160
CASH AND CASH EQUIVALENT Thousand of euros
Pursuant to the actions carried out by the Group in 2020 to maintain and improve its degree of liquidity, additional provisions for lines of credit were arranged with banking institutions and long-term bonds were issued (see Note 19). A signi!cant portion of these additional funds was kept in cash and cash equivalents at the end of 2020.
18. EQUITY
18.1. SHARE CAPITAL AND SHARE PREMIUM
SHARE CAPITAL amounts to EUR 267,574,941 and consists of 535,149,882 ordinary shares, fully subscribed and paid-up, with a par value of EUR 0.50 each (see Note 28).
At the end of 2020, CEPSA shares were owned by two share-holders: “Cepsa Holding, LLC”, owner of shares representing 61.5%, a company incorporated in the United Arab Emirates and ultimately controlled by “Mubadala Investment Company, PJSC” (“MIC’’), and “Matador Bidco, S.À.R.L.”, owner of shares representing the remaining 38.5%, a company incorporated in Luxembourg and ultimately controlled by “The Carlyle Group, Inc.” In January 2020, a transfer of shares took place between shareholders (see Note 1.A).
The Corporate Enterprises Act expressly permits the use of the SHARE PREMIUM account balance to increase share capital and does not establish any speci!c restrictions as to its use. The bal-ance of this account, which amounted to EUR 338,728 thousand, did not undergo any changes in 2020 or 2019.
18.2. REVALUATION RESERVE
In 1996, CEPSA revalued its property, plant and equipment pur-suant to Royal Decree-Law 7/1996 of 7 June and increased its equity by EUR 58,438 thousand. This amount is included under REVALUATION RESERVE, in EQUITY of the Consolidated Bal-ance Sheet.
Similarly, several companies of the Consolidated Group carried out this revaluation for EUR 70,495 thousand. This latter !gure was recognized under CONSOLIDATED RESERVES on consoli-dation, which is included in RETAINED EARNINGS.
The REVALUATION RESERVE also includes EUR 32,498 thou-sand relating to the revaluations made in 1979 and 1981 pur-suant to State Budget Laws 1/1979 and 74/1980, respectively, which can now be transferred to unrestricted voluntary reserves.
The balance of the Revaluation Reserve account corresponding to Royal Decree-Law 7/1996 can be used, free of tax, to elimi-nate recognized losses and to increase capital. From 1 January 2007 (i.e. ten years after the date of the balance sheet re"ecting the revaluation transactions), the balance of this account can be taken to unrestricted reserves, provided that the monetary sur-plus has been realized. The surplus will be deemed to have been realized with regard to the portion on which depreciation has been taken for accounting purposes or when the revalued assets have been transferred or derecognized. At 31 December 2020 the entire amount of this reserve is considered unrestricted.
If this balance were used in a manner other than that provided for in Royal Decree-Law 7/1996, it would be subject to tax.
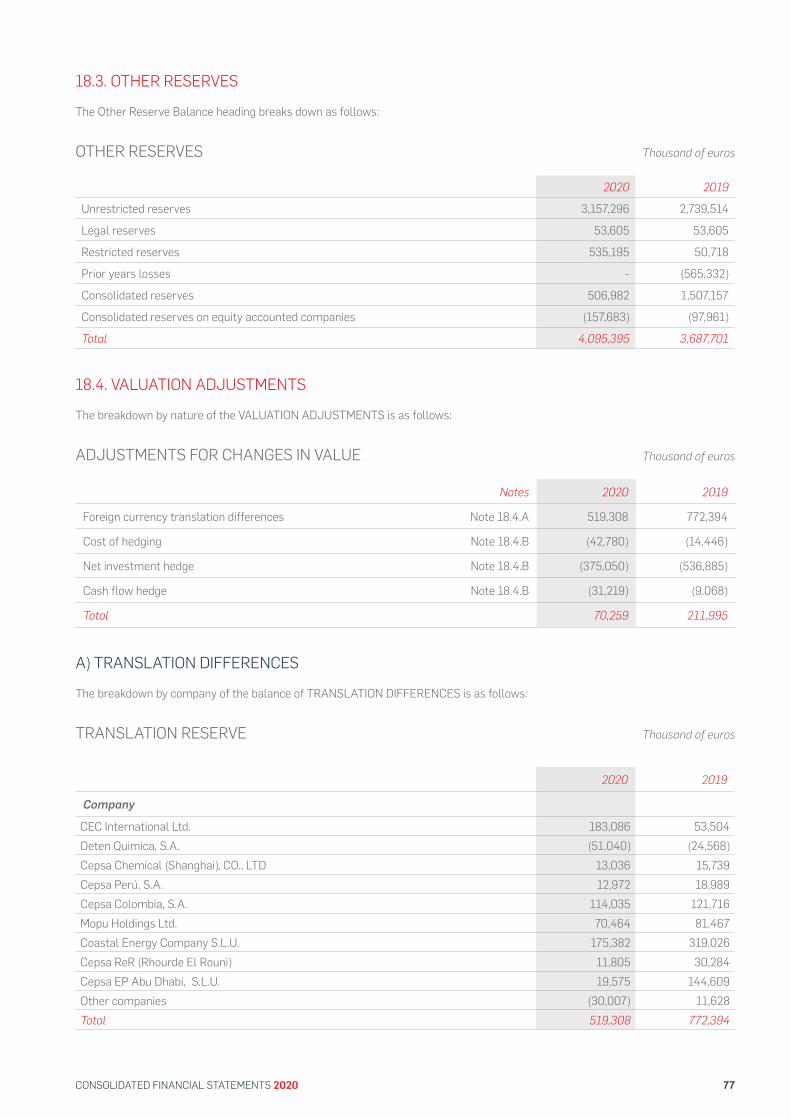
77CONSOLIDATED FINANCIAL STATEMENTS 2020
2020 2019Unrestricted reserves 3,157,296 2,739,514 Legal reserves 53,605 53,605 Restricted reserves 535,195 50,718 Prior years losses - (565,332)Consolidated reserves 506,982 1,507,157 Consolidated reserves on equity accounted companies (157,683) (97,961)Total 4,095,395 3,687,701
2020 2019
Company
CEC International Ltd. 183,086 53,504 Deten Quimica, S.A. (51,040) (24,568)Cepsa Chemical (Shanghai), CO., LTD 13,036 15,739 Cepsa Perú, S.A. 12,972 18,989 Cepsa Colombia, S.A. 114,035 121,716 Mopu Holdings Ltd. 70,464 81,467 Coastal Energy Company S.L.U. 175,382 319,026 Cepsa ReR (Rhourde El Rouni) 11,805 30,284 Cepsa EP Abu Dhabi, S.L.U. 19,575 144,609 Other companies (30,007) 11,628 Total 519,308 772,394
OTHER RESERVES
TRANSLATION RESERVE
Thousand of euros
Thousand of euros
18.4. VALUATION ADJUSTMENTS
The breakdown by nature of the VALUATION ADJUSTMENTS is as follows:
Notes 2020 2019
Foreign currency translation differences Note 18.4.A 519,308 772,394
Cost of hedging Note 18.4.B (42,780) (14,446)
Net investment hedge Note 18.4.B (375,050) (536,885)
Cash flow hedge Note 18.4.B (31,219) (9,068)
Total 70,259 211,995
ADJUSTMENTS FOR CHANGES IN VALUE Thousand of euros
A) TRANSLATION DIFFERENCES
The breakdown by company of the balance of TRANSLATION DIFFERENCES is as follows:
18.3. OTHER RESERVES
The Other Reserve Balance heading breaks down as follows:
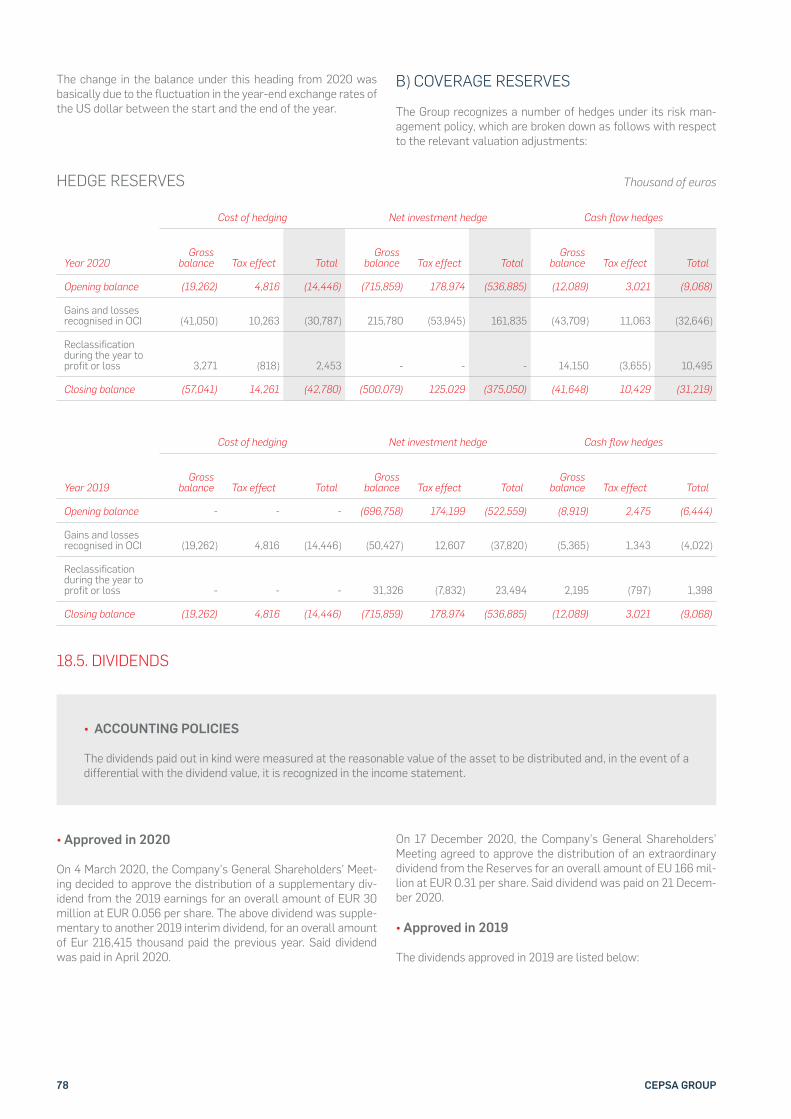
78 CEPSA GROUP
The change in the balance under this heading from 2020 was basically due to the "uctuation in the year-end exchange rates of the US dollar between the start and the end of the year.
B) COVERAGE RESERVES
The Group recognizes a number of hedges under its risk man-agement policy, which are broken down as follows with respect to the relevant valuation adjustments:
Cost of hedging Net investment hedge Cash flow hedges
Year 2020Gross
balance Tax effect TotalGross
balance Tax effect TotalGross
balance Tax effect Total
Opening balance (19,262) 4,816 (14,446) (715,859) 178,974 (536,885) (12,089) 3,021 (9,068)
Gains and losses recognised in OCI (41,050) 10,263 (30,787) 215,780 (53,945) 161,835 (43,709) 11,063 (32,646)
Reclassification during the year to profit or loss 3,271 (818) 2,453 - - - 14,150 (3,655) 10,495
Closing balance (57,041) 14,261 (42,780) (500,079) 125,029 (375,050) (41,648) 10,429 (31,219)
Cost of hedging Net investment hedge Cash flow hedges
Year 2019Gross
balance Tax effect TotalGross
balance Tax effect TotalGross
balance Tax effect Total
Opening balance - - - (696,758) 174,199 (522,559) (8,919) 2,475 (6,444)
Gains and losses recognised in OCI (19,262) 4,816 (14,446) (50,427) 12,607 (37,820) (5,365) 1,343 (4,022)
Reclassification during the year to profit or loss - - - 31,326 (7,832) 23,494 2,195 (797) 1,398
Closing balance (19,262) 4,816 (14,446) (715,859) 178,974 (536,885) (12,089) 3,021 (9,068)
HEDGE RESERVES Thousand of euros
• ACCOUNTING POLICIES
The dividends paid out in kind were measured at the reasonable value of the asset to be distributed and, in the event of a differential with the dividend value, it is recognized in the income statement.
18.5. DIVIDENDS
• Approved in 2020
On 4 March 2020, the Company’s General Shareholders’ Meet-ing decided to approve the distribution of a supplementary div-idend from the 2019 earnings for an overall amount of EUR 30 million at EUR 0.056 per share. The above dividend was supple-mentary to another 2019 interim dividend, for an overall amount of Eur 216,415 thousand paid the previous year. Said dividend was paid in April 2020.
On 17 December 2020, the Company’s General Shareholders’ Meeting agreed to approve the distribution of an extraordinary dividend from the Reserves for an overall amount of EU 166 mil-lion at EUR 0.31 per share. Said dividend was paid on 21 Decem-ber 2020.
• Approved in 2019
The dividends approved in 2019 are listed below:
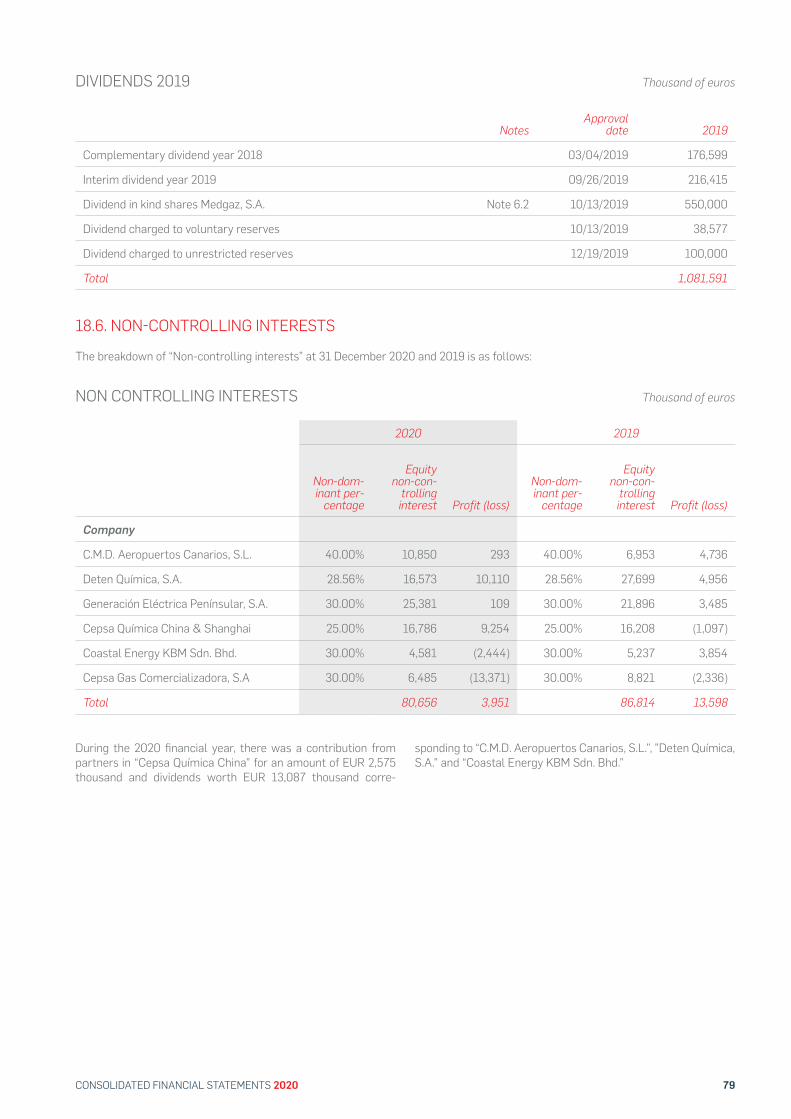
79CONSOLIDATED FINANCIAL STATEMENTS 2020
NotesApproval
date 2019
Complementary dividend year 2018 03/04/2019 176,599
Interim dividend year 2019 09/26/2019 216,415
Dividend in kind shares Medgaz, S.A. Note 6.2 10/13/2019 550,000
Dividend charged to voluntary reserves 10/13/2019 38,577
Dividend charged to unrestricted reserves 12/19/2019 100,000
Total 1,081,591
DIVIDENDS 2019 Thousand of euros
18.6. NON#CONTROLLING INTERESTS
The breakdown of “Non-controlling interests” at 31 December 2020 and 2019 is as follows:
2020 2019
Non-dom-inant per-
centage
Equity non-con-
trolling interest Profit (loss)
Non-dom-inant per-
centage
Equity non-con-
trolling interest Profit (loss)
Company
C.M.D. Aeropuertos Canarios, S.L. 40.00% 10,850 293 40.00% 6,953 4,736
Deten Química, S.A. 28.56% 16,573 10,110 28.56% 27,699 4,956
Generación Eléctrica Penínsular, S.A. 30.00% 25,381 109 30.00% 21,896 3,485
Cepsa Química China & Shanghai 25.00% 16,786 9,254 25.00% 16,208 (1,097)
Coastal Energy KBM Sdn. Bhd. 30.00% 4,581 (2,444) 30.00% 5,237 3,854
Cepsa Gas Comercializadora, S.A 30.00% 6,485 (13,371) 30.00% 8,821 (2,336)
Total 80,656 3,951 86,814 13,598
NON CONTROLLING INTERESTS Thousand of euros
During the 2020 !nancial year, there was a contribution from partners in “Cepsa Química China” for an amount of EUR 2,575 thousand and dividends worth EUR 13,087 thousand corre-
sponding to “C.M.D. Aeropuertos Canarios, S.L.”, ”Deten Química, S.A.” and “Coastal Energy KBM Sdn. Bhd.”
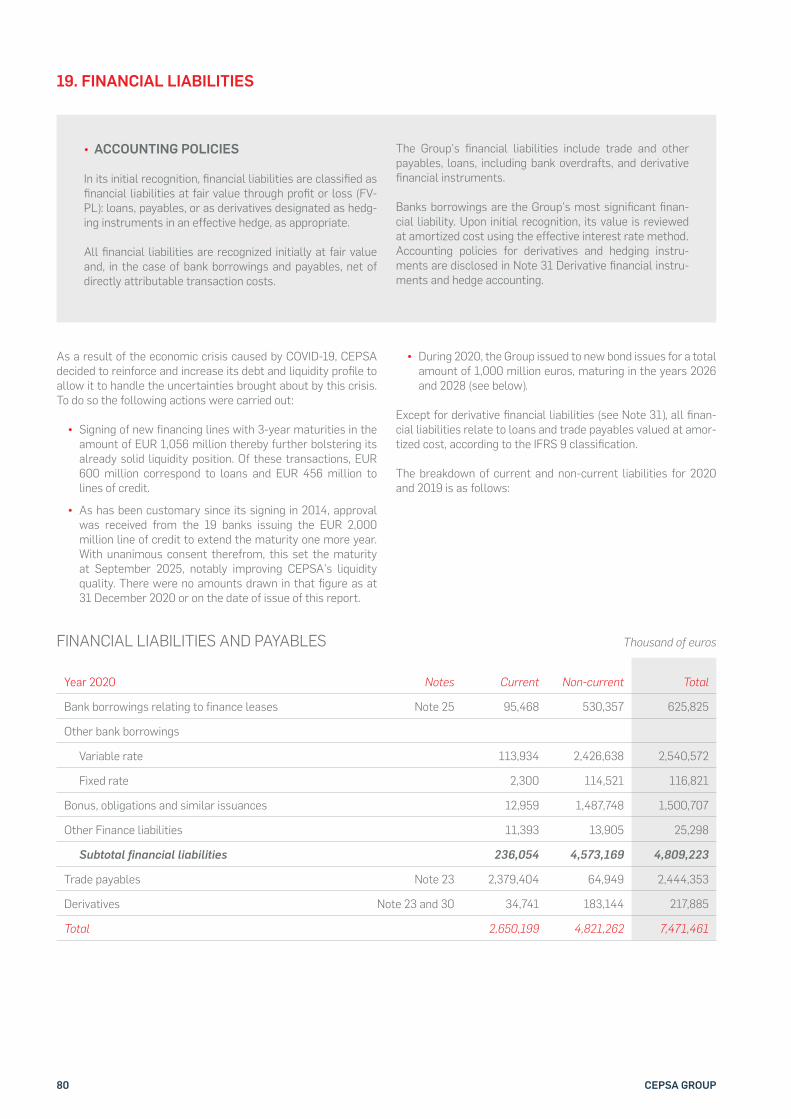
80 CEPSA GROUP
• ACCOUNTING POLICIES
In its initial recognition, !nancial liabilities are classi!ed as !nancial liabilities at fair value through pro!t or loss (FV-PL): loans, payables, or as derivatives designated as hedg-ing instruments in an effective hedge, as appropriate.
All !nancial liabilities are recognized initially at fair value and, in the case of bank borrowings and payables, net of directly attributable transaction costs.
The Group’s !nancial liabilities include trade and other payables, loans, including bank overdrafts, and derivative !nancial instruments.
Banks borrowings are the Group’s most signi!cant !nan-cial liability. Upon initial recognition, its value is reviewed at amortized cost using the effective interest rate method.Accounting policies for derivatives and hedging instru-ments are disclosed in Note 31 Derivative !nancial instru-ments and hedge accounting.
19. FINANCIAL LIABILITIES
As a result of the economic crisis caused by COVID-19, CEPSA decided to reinforce and increase its debt and liquidity pro!le to allow it to handle the uncertainties brought about by this crisis. To do so the following actions were carried out:
• Signing of new financing lines with 3-year maturities in the amount of EUR 1,056 million thereby further bolstering its already solid liquidity position. Of these transactions, EUR 600 million correspond to loans and EUR 456 million to lines of credit.
• As has been customary since its signing in 2014, approval was received from the 19 banks issuing the EUR 2,000 million line of credit to extend the maturity one more year. With unanimous consent therefrom, this set the maturity at September 2025, notably improving CEPSA’s liquidity quality. There were no amounts drawn in that figure as at 31 December 2020 or on the date of issue of this report.
• During 2020, the Group issued to new bond issues for a total amount of 1,000 million euros, maturing in the years 2026 and 2028 (see below).
Except for derivative !nancial liabilities (see Note 31), all !nan-cial liabilities relate to loans and trade payables valued at amor-tized cost, according to the IFRS 9 classi!cation.
The breakdown of current and non-current liabilities for 2020 and 2019 is as follows:
FINANCIAL LIABILITIES AND PAYABLES Thousand of euros
Year 2020 Notes Current Non-current Total
Bank borrowings relating to finance leases Note 25 95,468 530,357 625,825
Other bank borrowings
Variable rate 113,934 2,426,638 2,540,572
Fixed rate 2,300 114,521 116,821
Bonus, obligations and similar issuances 12,959 1,487,748 1,500,707
Other Finance liabilities 11,393 13,905 25,298
Subtotal financial liabilities 236,054 4,573,169 4,809,223
Trade payables Note 23 2,379,404 64,949 2,444,353
Derivatives Note 23 and 30 34,741 183,144 217,885
Total 2,650,199 4,821,262 7,471,461
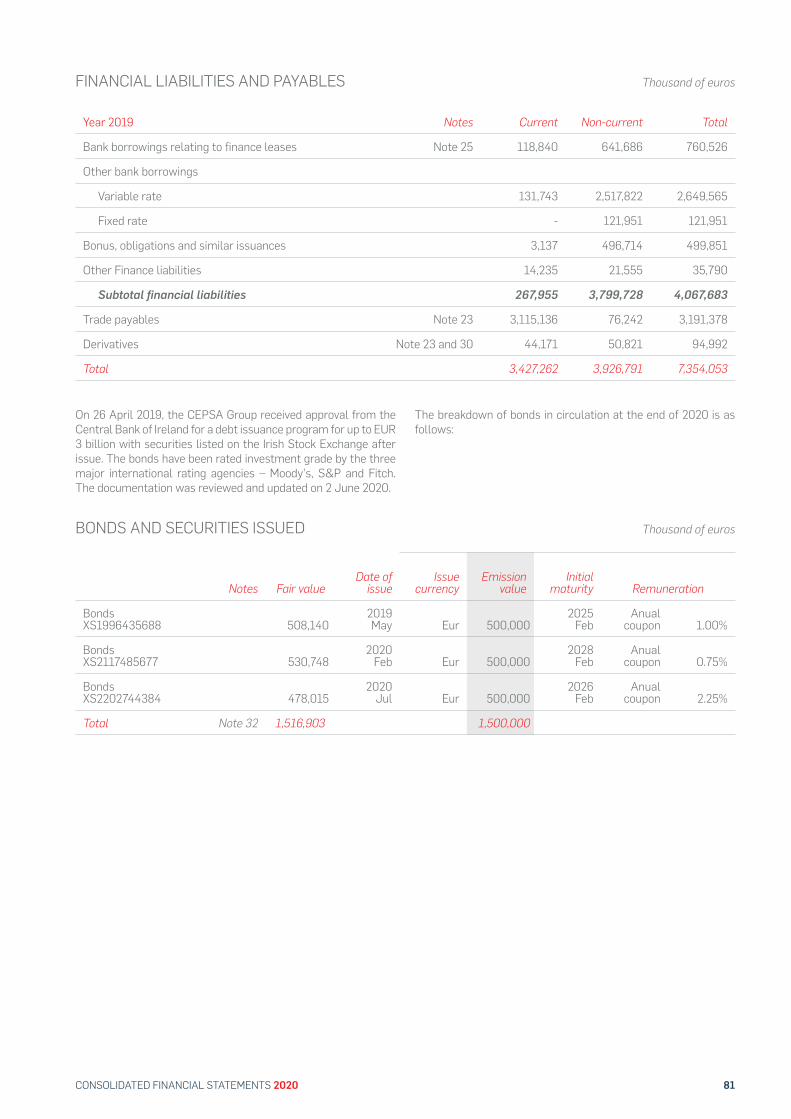
81CONSOLIDATED FINANCIAL STATEMENTS 2020
On 26 April 2019, the CEPSA Group received approval from the Central Bank of Ireland for a debt issuance program for up to EUR 3 billion with securities listed on the Irish Stock Exchange after issue. The bonds have been rated investment grade by the three major international rating agencies – Moody’s, S&P and Fitch. The documentation was reviewed and updated on 2 June 2020.
The breakdown of bonds in circulation at the end of 2020 is as follows:
Notes Fair valueDate of
issueIssue
currencyEmission
valueInitial
maturity Remuneration
Bonds XS1996435688 508,140
2019 May Eur 500,000
2025 Feb
Anual coupon 1.00%
Bonds XS2117485677 530,748
2020 Feb Eur 500,000
2028 Feb
Anual coupon 0.75%
Bonds XS2202744384 478,015
2020 Jul Eur 500,000
2026 Feb
Anual coupon 2.25%
Total Note 32 1,516,903 1,500,000
BONDS AND SECURITIES ISSUED Thousand of euros
FINANCIAL LIABILITIES AND PAYABLES Thousand of euros
Year 2019 Notes Current Non-current Total
Bank borrowings relating to finance leases Note 25 118,840 641,686 760,526
Other bank borrowings
Variable rate 131,743 2,517,822 2,649,565
Fixed rate - 121,951 121,951
Bonus, obligations and similar issuances 3,137 496,714 499,851
Other Finance liabilities 14,235 21,555 35,790
Subtotal financial liabilities 267,955 3,799,728 4,067,683
Trade payables Note 23 3,115,136 76,242 3,191,378
Derivatives Note 23 and 30 44,171 50,821 94,992
Total 3,427,262 3,926,791 7,354,053
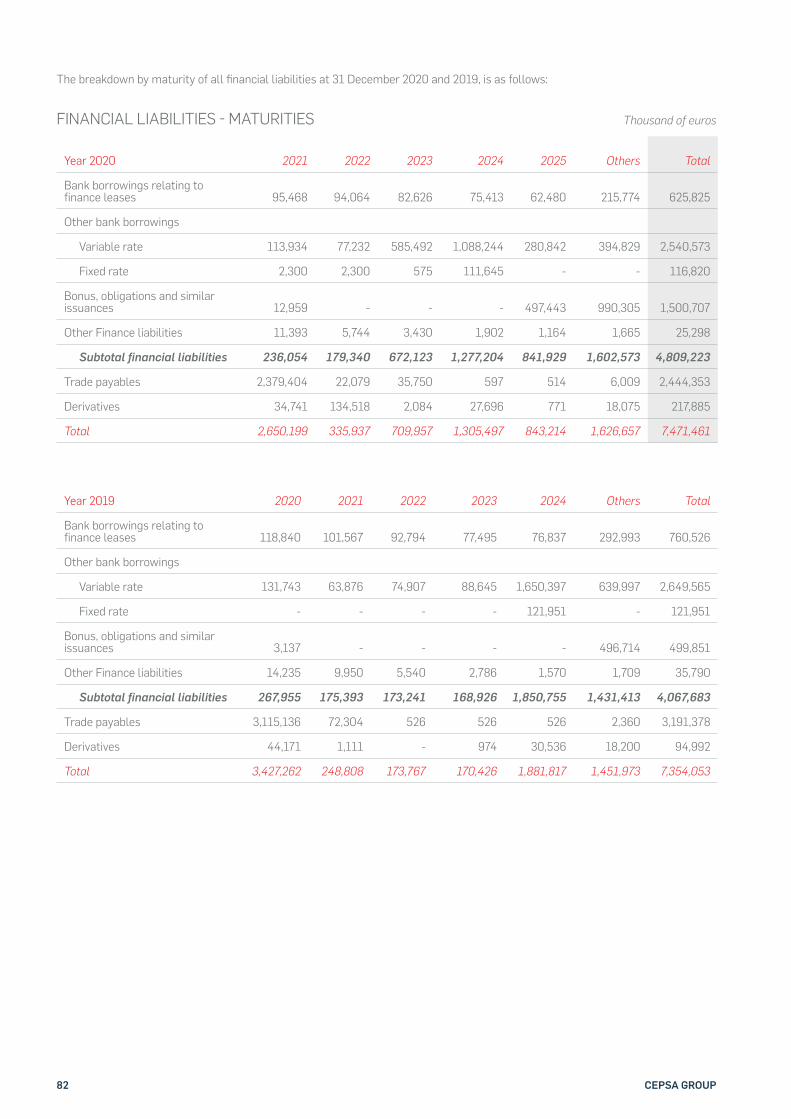
82 CEPSA GROUP
The breakdown by maturity of all !nancial liabilities at 31 December 2020 and 2019, is as follows:
FINANCIAL LIABILITIES # MATURITIES Thousand of euros
Year 2020 2021 2022 2023 2024 2025 Others Total
Bank borrowings relating to finance leases 95,468 94,064 82,626 75,413 62,480 215,774 625,825
Other bank borrowings
Variable rate 113,934 77,232 585,492 1,088,244 280,842 394,829 2,540,573
Fixed rate 2,300 2,300 575 111,645 - - 116,820
Bonus, obligations and similar issuances 12,959 - - - 497,443 990,305 1,500,707
Other Finance liabilities 11,393 5,744 3,430 1,902 1,164 1,665 25,298
Subtotal financial liabilities 236,054 179,340 672,123 1,277,204 841,929 1,602,573 4,809,223
Trade payables 2,379,404 22,079 35,750 597 514 6,009 2,444,353
Derivatives 34,741 134,518 2,084 27,696 771 18,075 217,885
Total 2,650,199 335,937 709,957 1,305,497 843,214 1,626,657 7,471,461
Year 2019 2020 2021 2022 2023 2024 Others Total
Bank borrowings relating to finance leases 118,840 101,567 92,794 77,495 76,837 292,993 760,526
Other bank borrowings
Variable rate 131,743 63,876 74,907 88,645 1,650,397 639,997 2,649,565
Fixed rate - - - - 121,951 - 121,951
Bonus, obligations and similar issuances 3,137 - - - - 496,714 499,851
Other Finance liabilities 14,235 9,950 5,540 2,786 1,570 1,709 35,790
Subtotal financial liabilities 267,955 175,393 173,241 168,926 1,850,755 1,431,413 4,067,683
Trade payables 3,115,136 72,304 526 526 526 2,360 3,191,378
Derivatives 44,171 1,111 - 974 30,536 18,200 94,992
Total 3,427,262 248,808 173,767 170,426 1,881,817 1,451,973 7,354,053
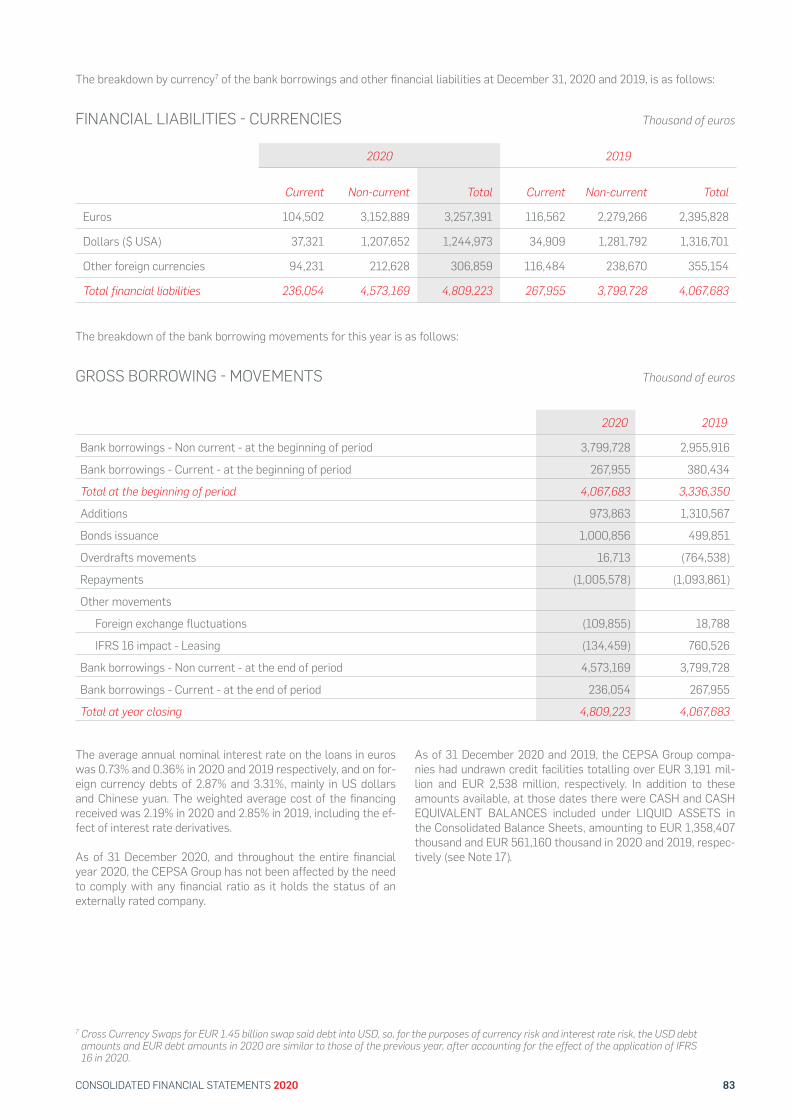
83CONSOLIDATED FINANCIAL STATEMENTS 2020
The breakdown of the bank borrowing movements for this year is as follows:
2020 2019
Bank borrowings - Non current - at the beginning of period 3,799,728 2,955,916
Bank borrowings - Current - at the beginning of period 267,955 380,434
Total at the beginning of period 4,067,683 3,336,350
Additions 973,863 1,310,567
Bonds issuance 1,000,856 499,851
Overdrafts movements 16,713 (764,538)
Repayments (1,005,578) (1,093,861)
Other movements
Foreign exchange fluctuations (109,855) 18,788
IFRS 16 impact - Leasing (134,459) 760,526
Bank borrowings - Non current - at the end of period 4,573,169 3,799,728
Bank borrowings - Current - at the end of period 236,054 267,955
Total at year closing 4,809,223 4,067,683
GROSS BORROWING # MOVEMENTS Thousand of euros
The average annual nominal interest rate on the loans in euros was 0.73% and 0.36% in 2020 and 2019 respectively, and on for-eign currency debts of 2.87% and 3.31%, mainly in US dollars and Chinese yuan. The weighted average cost of the !nancing received was 2.19% in 2020 and 2.85% in 2019, including the ef-fect of interest rate derivatives.
As of 31 December 2020, and throughout the entire !nancial year 2020, the CEPSA Group has not been affected by the need to comply with any !nancial ratio as it holds the status of an externally rated company.
As of 31 December 2020 and 2019, the CEPSA Group compa-nies had undrawn credit facilities totalling over EUR 3,191 mil-lion and EUR 2,538 million, respectively. In addition to these amounts available, at those dates there were CASH and CASH EQUIVALENT BALANCES included under LIQUID ASSETS in the Consolidated Balance Sheets, amounting to EUR 1,358,407 thousand and EUR 561,160 thousand in 2020 and 2019, respec-tively (see Note 17).
7 Cross Currency Swaps for EUR 1.45 billion swap said debt into USD, so, for the purposes of currency risk and interest rate risk, the USD debt amounts and EUR debt amounts in 2020 are similar to those of the previous year, after accounting for the effect of the application of IFRS 16 in 2020.
The breakdown by currency7 of the bank borrowings and other !nancial liabilities at December 31, 2020 and 2019, is as follows:
2020 2019
Current Non-current Total Current Non-current Total
Euros 104,502 3,152,889 3,257,391 116,562 2,279,266 2,395,828
Dollars ($ USA) 37,321 1,207,652 1,244,973 34,909 1,281,792 1,316,701
Other foreign currencies 94,231 212,628 306,859 116,484 238,670 355,154
Total financial liabilities 236,054 4,573,169 4,809,223 267,955 3,799,728 4,067,683
FINANCIAL LIABILITIES # CURRENCIES Thousand of euros
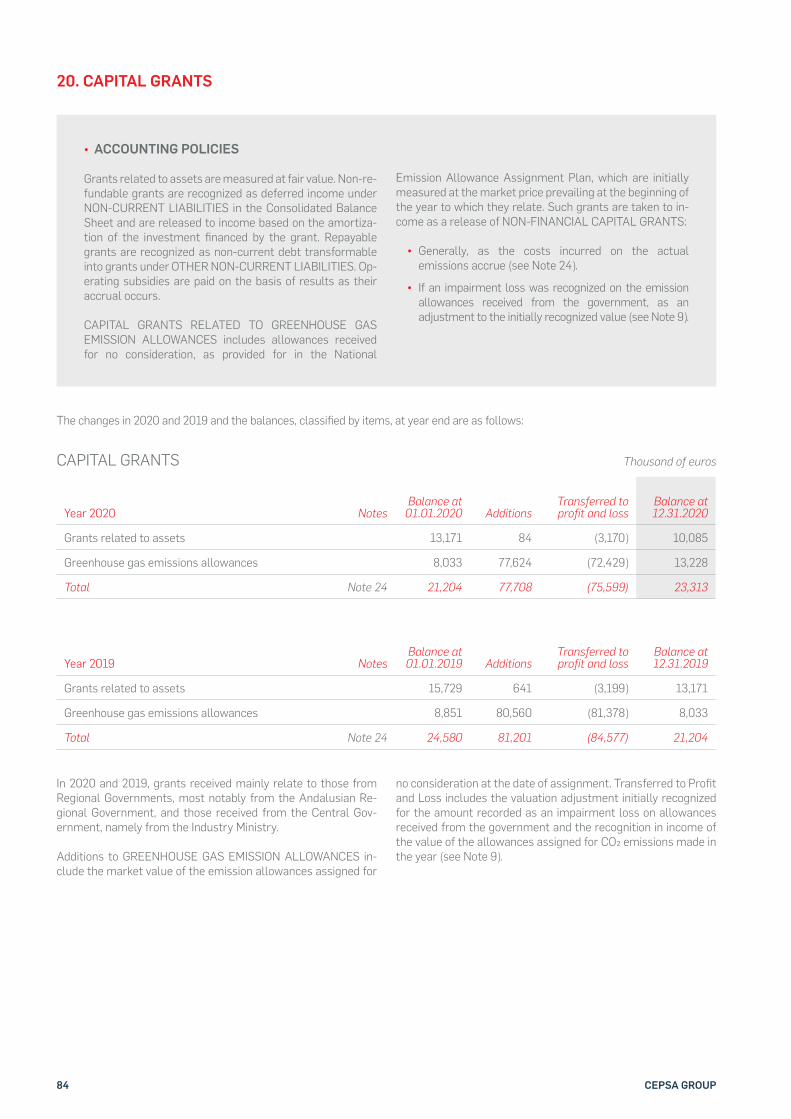
84 CEPSA GROUP
• ACCOUNTING POLICIES
Grants related to assets are measured at fair value. Non-re-fundable grants are recognized as deferred income under NON-CURRENT LIABILITIES in the Consolidated Balance Sheet and are released to income based on the amortiza-tion of the investment !nanced by the grant. Repayable grants are recognized as non-current debt transformable into grants under OTHER NON-CURRENT LIABILITIES. Op-erating subsidies are paid on the basis of results as their accrual occurs.
CAPITAL GRANTS RELATED TO GREENHOUSE GAS EMISSION ALLOWANCES includes allowances received for no consideration, as provided for in the National
Emission Allowance Assignment Plan, which are initially measured at the market price prevailing at the beginning of the year to which they relate. Such grants are taken to in-come as a release of NON-FINANCIAL CAPITAL GRANTS:
• Generally, as the costs incurred on the actual emissions accrue (see Note 24).
• If an impairment loss was recognized on the emission allowances received from the government, as an adjustment to the initially recognized value (see Note 9).
20. CAPITAL GRANTS
The changes in 2020 and 2019 and the balances, classi!ed by items, at year end are as follows:
CAPITAL GRANTS Thousand of euros
Year 2020 NotesBalance at
01.01.2020 AdditionsTransferred to profit and loss
Balance at 12.31.2020
Grants related to assets 13,171 84 (3,170) 10,085
Greenhouse gas emissions allowances 8,033 77,624 (72,429) 13,228
Total Note 24 21,204 77,708 (75,599) 23,313
Year 2019 NotesBalance at01.01.2019 Additions
Transferred to profit and loss
Balance at 12.31.2019
Grants related to assets 15,729 641 (3,199) 13,171
Greenhouse gas emissions allowances 8,851 80,560 (81,378) 8,033
Total Note 24 24,580 81,201 (84,577) 21,204
In 2020 and 2019, grants received mainly relate to those from Regional Governments, most notably from the Andalusian Re-gional Government, and those received from the Central Gov-ernment, namely from the Industry Ministry.
Additions to GREENHOUSE GAS EMISSION ALLOWANCES in-clude the market value of the emission allowances assigned for
no consideration at the date of assignment. Transferred to Pro!t and Loss includes the valuation adjustment initially recognized for the amount recorded as an impairment loss on allowances received from the government and the recognition in income of the value of the allowances assigned for CO% emissions made in the year (see Note 9).
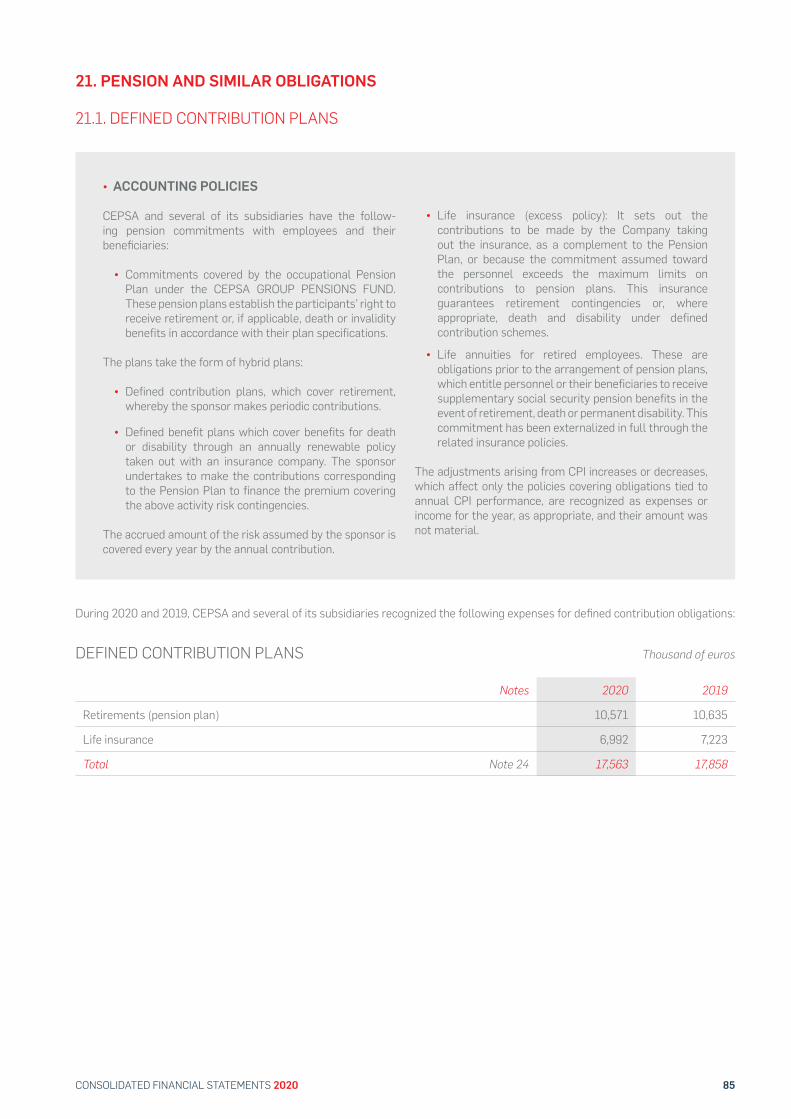
85CONSOLIDATED FINANCIAL STATEMENTS 2020
• ACCOUNTING POLICIES
CEPSA and several of its subsidiaries have the follow-ing pension commitments with employees and their bene!ciaries:
• Commitments covered by the occupational Pension Plan under the CEPSA GROUP PENSIONS FUND. These pension plans establish the participants’ right to receive retirement or, if applicable, death or invalidity benefits in accordance with their plan specifications.
The plans take the form of hybrid plans:
• Defined contribution plans, which cover retirement, whereby the sponsor makes periodic contributions.
• Defined benefit plans which cover benefits for death or disability through an annually renewable policy taken out with an insurance company. The sponsor undertakes to make the contributions corresponding to the Pension Plan to finance the premium covering the above activity risk contingencies.
The accrued amount of the risk assumed by the sponsor is covered every year by the annual contribution.
• Life insurance (excess policy): It sets out the contributions to be made by the Company taking out the insurance, as a complement to the Pension Plan, or because the commitment assumed toward the personnel exceeds the maximum limits on contributions to pension plans. This insurance guarantees retirement contingencies or, where appropriate, death and disability under defined contribution schemes.
• Life annuities for retired employees. These are obligations prior to the arrangement of pension plans, which entitle personnel or their beneficiaries to receive supplementary social security pension benefits in the event of retirement, death or permanent disability. This commitment has been externalized in full through the related insurance policies.
The adjustments arising from CPI increases or decreases, which affect only the policies covering obligations tied to annual CPI performance, are recognized as expenses or income for the year, as appropriate, and their amount was not material.
21. PENSION AND SIMILAR OBLIGATIONS
21.1. DEFINED CONTRIBUTION PLANS
During 2020 and 2019, CEPSA and several of its subsidiaries recognized the following expenses for de!ned contribution obligations:
Notes 2020 2019
Retirements (pension plan) 10,571 10,635
Life insurance 6,992 7,223
Total Note 24 17,563 17,858
DEFINED CONTRIBUTION PLANS Thousand of euros
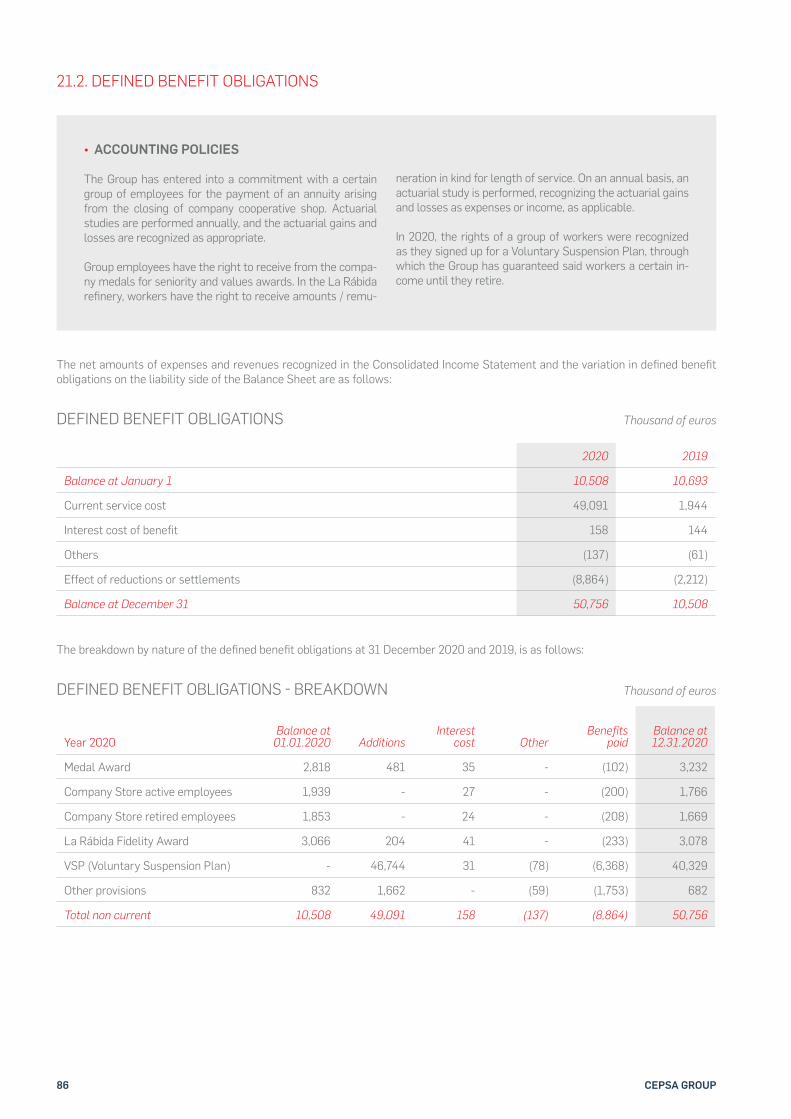
86 CEPSA GROUP
21.2. DEFINED BENEFIT OBLIGATIONS
• ACCOUNTING POLICIES
The Group has entered into a commitment with a certain group of employees for the payment of an annuity arising from the closing of company cooperative shop. Actuarial studies are performed annually, and the actuarial gains and losses are recognized as appropriate.
Group employees have the right to receive from the compa-ny medals for seniority and values awards. In the La Rábida re!nery, workers have the right to receive amounts / remu-
neration in kind for length of service. On an annual basis, an actuarial study is performed, recognizing the actuarial gains and losses as expenses or income, as applicable.
In 2020, the rights of a group of workers were recognized as they signed up for a Voluntary Suspension Plan, through which the Group has guaranteed said workers a certain in-come until they retire.
The net amounts of expenses and revenues recognized in the Consolidated Income Statement and the variation in de!ned bene!t obligations on the liability side of the Balance Sheet are as follows:
The breakdown by nature of the de!ned bene!t obligations at 31 December 2020 and 2019, is as follows:
2020 2019
Balance at January 1 10,508 10,693
Current service cost 49,091 1,944
Interest cost of benefit 158 144
Others (137) (61)
Effect of reductions or settlements (8,864) (2,212)
Balance at December 31 50,756 10,508
DEFINED BENEFIT OBLIGATIONS Thousand of euros
DEFINED BENEFIT OBLIGATIONS # BREAKDOWN Thousand of euros
Year 2020Balance at
01.01.2020 AdditionsInterest
cost OtherBenefits
paidBalance at 12.31.2020
Medal Award 2,818 481 35 - (102) 3,232
Company Store active employees 1,939 - 27 - (200) 1,766
Company Store retired employees 1,853 - 24 - (208) 1,669
La Rábida Fidelity Award 3,066 204 41 - (233) 3,078
VSP (Voluntary Suspension Plan) - 46,744 31 (78) (6,368) 40,329
Other provisions 832 1,662 - (59) (1,753) 682
Total non current 10,508 49,091 158 (137) (8,864) 50,756
87CONSOLIDATED FINANCIAL STATEMENTS 2020
In 2020, we started up a voluntary employment suspension pro-gram for the staff groups closest to retirement age. This consists of an agreement with the worker for a three-year individual em-ployment suspension, which is automatically renewed. Anyone over 57 years old on December 31, 2020 may volunteer. The con-ditions for these suspensions include maintaining a set level of ordinary income, contributions to pension plans, and insurance coverage for the risk contingencies set out therein. One hundred and !fty-!ve people signed up for this plan and departed the Company in 2020.
The total amount of the provision created by the Company for future payment obligations amounted to EUR 51,816 thousand. From this amount, EUR 40,400 thousand were recorded as long-
term de!ned bene!t obligations and the rest, EUR 8,878 thou-sand, corresponding to the payments to be made in the next 12 months as at the date of record, as a short-term obligation. Provisions were recorded in the Consolidated Income Statement under PERSONNEL COSTS. The effect on tax expense for the pe-riod can be seen in Note 27.
The provisions were calculated discounting the expected pay-ment "ow until the date of retirement at 1.71%. The average pay-ment period for this group amounted to 6.33 years.
The main assumptions used to determine the pension obligations and post-employment bene!ts under the plans of CEPSA and several of its subsidiaries are as follows:
2020 2019
Discount rate 1.500% 1.500%
Expected salary increase rate 0.250% 0.250%
Mortality tables PEMF2000 PEMF2000
MAIN ASSUMPTIONS # COOPERATIVE STORE
Year 2019Balance at 01.01.2019 Additions
Interest cost Other
Benefits paid
Balance at 12.31.2019
Medal Award 2,739 125 38 - (84) 2,818
Company Store active employees 1,919 - 32 - (12) 1,939
Company Store retired employees 2,041 - 29 - (217) 1,853
La Rábida Fidelity Award 3,142 147 45 - (268) 3,066
Other provisions 852 1,672 - (61) (1,631) 832
Total non current 10,693 1,944 144 (61) (2,212) 10,508
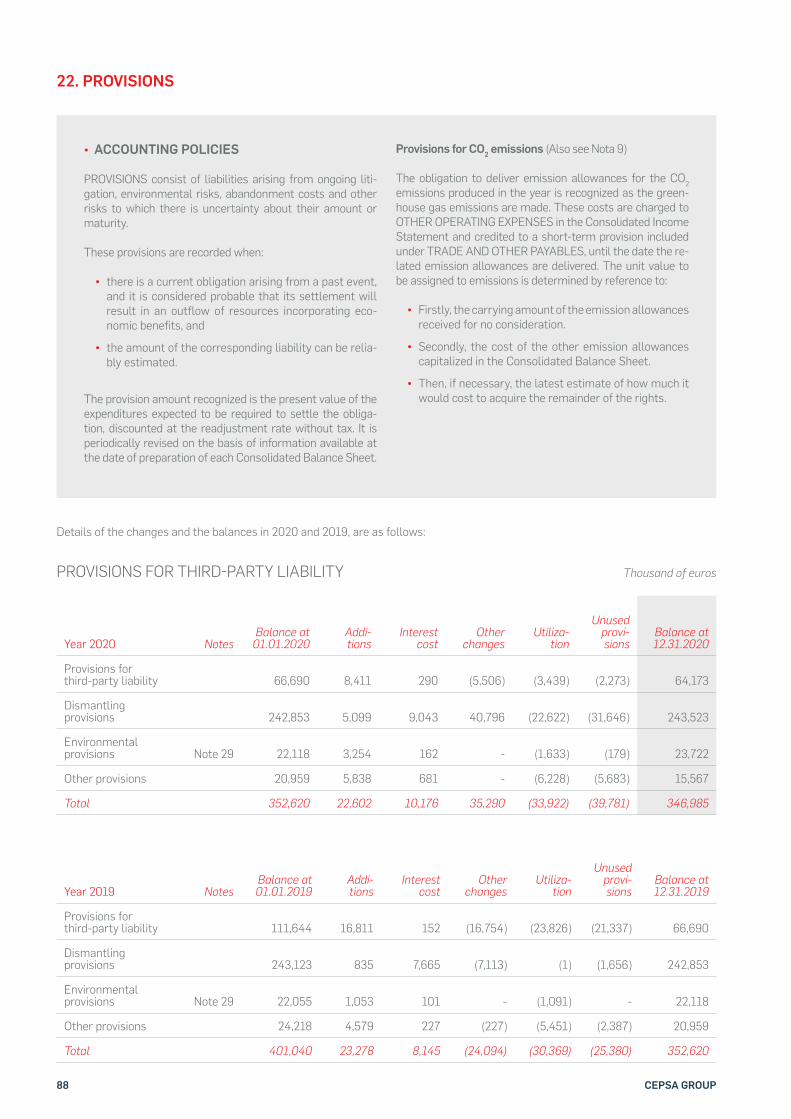
88 CEPSA GROUP
22. PROVISIONS
• ACCOUNTING POLICIES
PROVISIONS consist of liabilities arising from ongoing liti-gation, environmental risks, abandonment costs and other risks to which there is uncertainty about their amount or maturity.
These provisions are recorded when:
• there is a current obligation arising from a past event, and it is considered probable that its settlement will result in an outflow of resources incorporating eco-nomic benefits, and
• the amount of the corresponding liability can be relia-bly estimated.
The provision amount recognized is the present value of the expenditures expected to be required to settle the obliga-tion, discounted at the readjustment rate without tax. It is periodically revised on the basis of information available at the date of preparation of each Consolidated Balance Sheet.
Provisions for CO2 emissions (Also see Nota 9)
The obligation to deliver emission allowances for the CO2 emissions produced in the year is recognized as the green-house gas emissions are made. These costs are charged to OTHER OPERATING EXPENSES in the Consolidated Income Statement and credited to a short-term provision included under TRADE AND OTHER PAYABLES, until the date the re-lated emission allowances are delivered. The unit value to be assigned to emissions is determined by reference to:
• Firstly, the carrying amount of the emission allowances received for no consideration.
• Secondly, the cost of the other emission allowances capitalized in the Consolidated Balance Sheet.
• Then, if necessary, the latest estimate of how much it would cost to acquire the remainder of the rights.
Details of the changes and the balances in 2020 and 2019, are as follows:
PROVISIONS FOR THIRD#PARTY LIABILITY Thousand of euros
Year 2020 NotesBalance at
01.01.2020Addi-tions
Interest cost
Other changes
Utiliza-tion
Unused provi-sions
Balance at 12.31.2020
Provisions for third-party liability 66,690 8,411 290 (5,506) (3,439) (2,273) 64,173
Dismantling provisions 242,853 5,099 9,043 40,796 (22,622) (31,646) 243,523
Environmental provisions Note 29 22,118 3,254 162 - (1,633) (179) 23,722
Other provisions 20,959 5,838 681 - (6,228) (5,683) 15,567
Total 352,620 22,602 10,176 35,290 (33,922) (39,781) 346,985
Year 2019 NotesBalance at 01.01.2019
Addi-tions
Interest cost
Other changes
Utiliza-tion
Unused provi-sions
Balance at 12.31.2019
Provisions for third-party liability 111,644 16,811 152 (16,754) (23,826) (21,337) 66,690
Dismantling provisions 243,123 835 7,665 (7,113) (1) (1,656) 242,853
Environmental provisions Note 29 22,055 1,053 101 - (1,091) - 22,118
Other provisions 24,218 4,579 227 (227) (5,451) (2,387) 20,959
Total 401,040 23,278 8,145 (24,094) (30,369) (25,380) 352,620
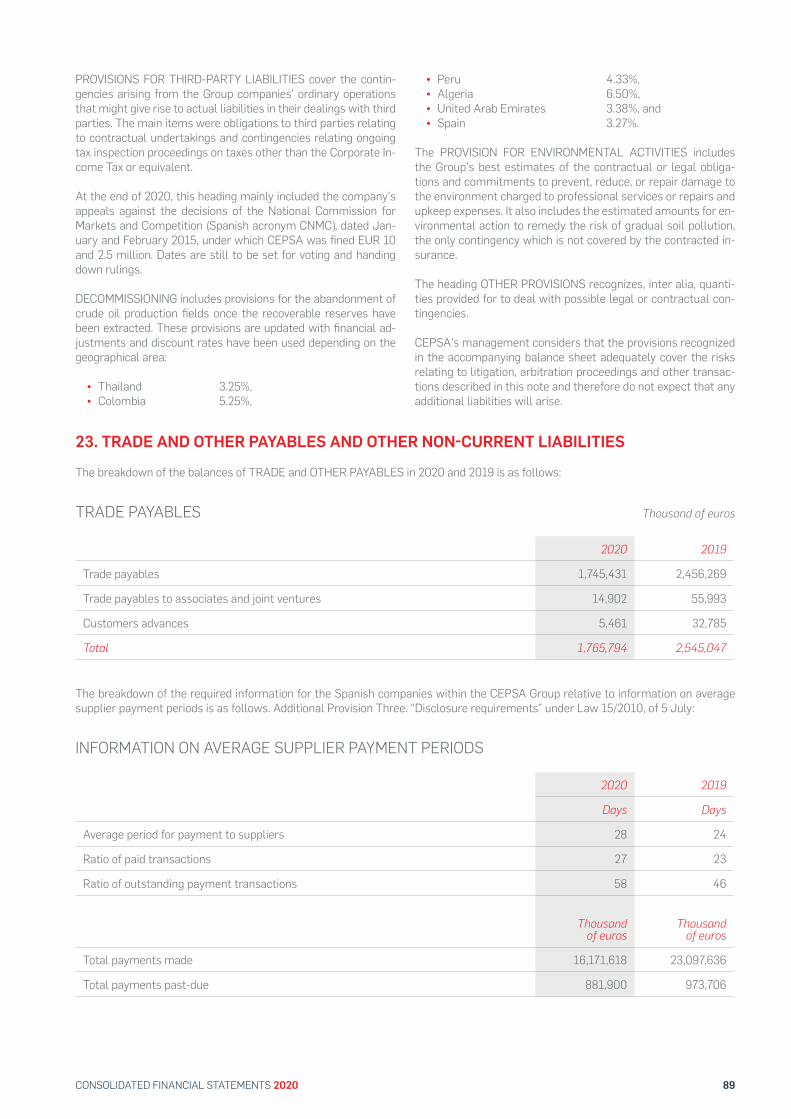
89CONSOLIDATED FINANCIAL STATEMENTS 2020
Thousand of euros
PROVISIONS FOR THIRD-PARTY LIABILITIES cover the contin-gencies arising from the Group companies’ ordinary operations that might give rise to actual liabilities in their dealings with third parties. The main items were obligations to third parties relating to contractual undertakings and contingencies relating ongoing tax inspection proceedings on taxes other than the Corporate In-come Tax or equivalent.
At the end of 2020, this heading mainly included the company’s appeals against the decisions of the National Commission for Markets and Competition (Spanish acronym CNMC), dated Jan-uary and February 2015, under which CEPSA was !ned EUR 10 and 2.5 million. Dates are still to be set for voting and handing down rulings.
DECOMMISSIONING includes provisions for the abandonment of crude oil production !elds once the recoverable reserves have been extracted. These provisions are updated with !nancial ad-justments and discount rates have been used depending on the geographical area:
• Thailand 3.25%,• Colombia 5.25%,
• Peru 4.33%,• Algeria 6.50%, • United Arab Emirates 3.38%, and • Spain 3.27%.
The PROVISION FOR ENVIRONMENTAL ACTIVITIES includes the Group’s best estimates of the contractual or legal obliga-tions and commitments to prevent, reduce, or repair damage to the environment charged to professional services or repairs and upkeep expenses. It also includes the estimated amounts for en-vironmental action to remedy the risk of gradual soil pollution, the only contingency which is not covered by the contracted in-surance.
The heading OTHER PROVISIONS recognizes, inter alia, quanti-ties provided for to deal with possible legal or contractual con-tingencies.
CEPSA’s management considers that the provisions recognized in the accompanying balance sheet adequately cover the risks relating to litigation, arbitration proceedings and other transac-tions described in this note and therefore do not expect that any additional liabilities will arise.
2020 2019
Trade payables 1,745,431 2,456,269
Trade payables to associates and joint ventures 14,902 55,993
Customers advances 5,461 32,785
Total 1,765,794 2,545,047
2020 2019
Days Days
Average period for payment to suppliers 28 24
Ratio of paid transactions 27 23
Ratio of outstanding payment transactions 58 46
Thousand of euros
Thousand of euros
Total payments made 16,171,618 23,097,636
Total payments past-due 881,900 973,706
TRADE PAYABLES
INFORMATION ON AVERAGE SUPPLIER PAYMENT PERIODS
The breakdown of the required information for the Spanish companies within the CEPSA Group relative to information on average supplier payment periods is as follows. Additional Provision Three. “Disclosure requirements” under Law 15/2010, of 5 July:
23. TRADE AND OTHER PAYABLES AND OTHER NON#CURRENT LIABILITIES
The breakdown of the balances of TRADE and OTHER PAYABLES in 2020 and 2019 is as follows:
90 CEPSA GROUP
OTHER CURRENT LIABILITIES
2020 2019
NotesNon-
current CurrentNon-
current Current
Liabilities from taxes other than income tax - 225,592 - 268,351
Tax income payables - 33,951 - 14,903
Fixed assets payables 57,491 69,835 55,519 155,694
Payroll - 86,322 - 96,983
Non-trade payables to associates and joint ventures - 4,371 3,178 102,547
Other liabilities 3,873 92,776 13,232 87,762
Liabilities from derivatives Note 19 183,144 34,741 50,821 44,171
Guarantees/deposits received 3,585 4,630 4,313 4,176
Provisions, short term - 102,883 - 133,452
Total 248,093 655,101 127,063 908,039
The breakdown of the balances of OTHER PAYABLES AND LIABILITIES ACCRUED FOR NON-FINANCIAL TRANSACTIONS in 2020 and 2019 is as follows:
Thousand of euros
THE VALUATION of cross-currency swaps taken out in the year is included under liabilities for !nancial derivatives as at 31 De-cember 2020.
PROVISIONS includes at 31 December 2020 and 2019 an amount of EUR 90,328 thousand and EUR 129,352 thousand, re-
spectively, relating to the obligation to deliver allowances for the CO2 emissions made, which are lower than the allowances as-signed under the National Emission Allowance Allocation Plan.
91CONSOLIDATED FINANCIAL STATEMENTS 2020
• ACCOUNTING POLICIES
Income and expenses are imputed on the basis of the ac-crual criterion.
The Group recognizes revenue from contracts with cus-tomers based on a !ve step model as set out in IFRS 15: Identify the contract(s) with a customer, identify the per-formance obligations in the contract, determine the trans-action price, allocate the transaction price to the perfor-mance obligations in the contract and recognize revenue when (or as) the entity satis!es a performance obligation at a point in time or over time.
The Group assesses its revenue arrangements against speci!c criteria to determine if it is acting as principal or agent.
The Group considers whether there are other promises in the contract that are separate performance obligations to which a portion of the transaction price needs to be allo-cated. In determining the transaction price for the sale of goods, the Group considers the effects of variable consid-eration, the existence of signi!cant !nancing components, non-cash consideration, and consideration payable to the customer.
VARIABLE CONSIDERATION
If the consideration in a contract includes a variable amount, the Group estimates the amount of considera-tion to which it will be entitled in exchange for transferring the goods to the customer. The variable consideration is estimated at contract inception and is restricted until it is highly probable that a signi!cant revenue reversal in the amount of cumulative revenue recognized will not occur when the associated uncertainty with the variable consid-eration is subsequently resolved. Some contracts for the sale of goods provide customers with a right of return and volume rebates. The rights of return and volume rebates give rise to variable consideration.
SIGNIFICANT FINANCING COMPONENT
Generally, the Group receives short-term advances from its customers. Using the practical expedient in IFRS 15, the Group does not adjust the promised amount of considera-tion for the effects of a signi!cant !nancing component if it expects, at the start of the contract, that the period be-tween the transfer of the promised good or service to the customer and the customer pays for that good or service will be one year or less. The Group also receives long-term advances from custom-ers for the sale of goods. In order to take into account the signi!cant !nancing component in this case, the transac-
tion price of such contracts is discounted using the rate that would be manifested in a separate !nancing transac-tion between the Group and its customers at the start of the contract.
NON-MONETARY CONSIDERATION
The Group applies the requirements of IFRS 13 Fair value measurement in measuring the fair value of the non-cash consideration. If the fair value cannot be reasonably esti-mated, the non-cash consideration is measured indirectly by reference to the stand-alone selling price. The fair value of such non-cash consideration received from the custom-er is included in the transaction price and measured when the Group obtains control of the goods or services.
CONSIDERATION PAYABLE TO THE CUSTOMER
The consideration payable to a customer is accounted for as a reduction of the transaction price. Consideration paya-ble to a customer includes cash amounts that CEPSA pays or is expected to pay to a customer. (for example: customer award credits or loyalty programs).
OIL PRODUCTION
Crude production revenues are recognized:
• on the basis of the Group’s working interest, when the Group holds a stake with other producers; and
• according to the contractual conditions in contracts for the distribution of production.
OTHER CIRCUMSTANCES
REVENUE does not include the value of exchanges of stra-tegic stocks arranged with other operators.
In accordance with the legislation applicable to companies operating in the oil and gas industry, the excise tax on oil and gas sales is recorded as part of the selling price and as an addition to cost under REVENUE and OTHER OPER-ATING EXPENSES, respectively, in the Consolidated Income Statement.
Revenues from services rendered are recognized consider-ing the degree of progress in completing the service at the balance sheet date, provided that the transaction results may be reliably estimated.
24. OPERATING INCOME AND EXPENSES
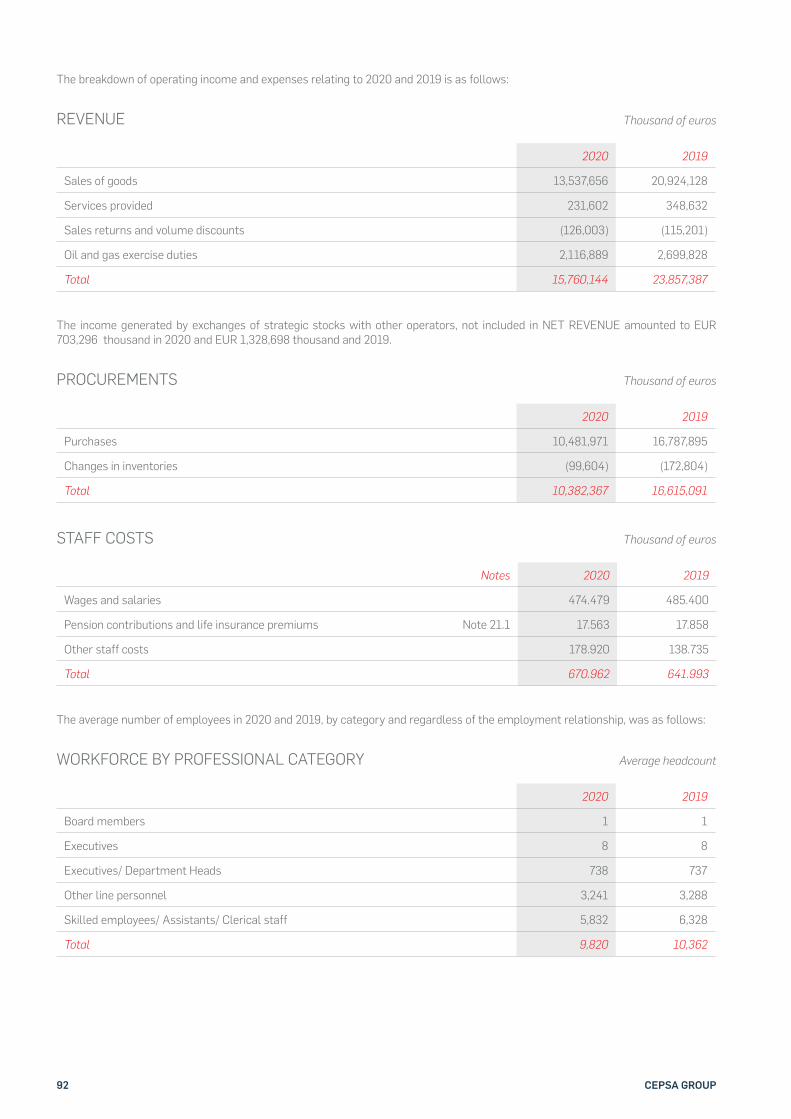
92 CEPSA GROUP
The breakdown of operating income and expenses relating to 2020 and 2019 is as follows:
Thousand of euros
Thousand of euros
Average headcount
2020 2019
Sales of goods 13,537,656 20,924,128
Services provided 231,602 348,632
Sales returns and volume discounts (126,003) (115,201)
Oil and gas exercise duties 2,116,889 2,699,828
Total 15,760,144 23,857,387
2020 2019
Purchases 10,481,971 16,787,895
Changes in inventories (99,604) (172,804)
Total 10,382,367 16,615,091
2020 2019
Board members 1 1
Executives 8 8
Executives/ Department Heads 738 737
Other line personnel 3,241 3,288
Skilled employees/ Assistants/ Clerical staff 5,832 6,328
Total 9,820 10,362
REVENUE
PROCUREMENTS
WORKFORCE BY PROFESSIONAL CATEGORY
The income generated by exchanges of strategic stocks with other operators, not included in NET REVENUE amounted to EUR 703,296 thousand in 2020 and EUR 1,328,698 thousand and 2019.
Notes 2020 2019
Wages and salaries 474.479 485.400
Pension contributions and life insurance premiums Note 21.1 17.563 17.858
Other staff costs 178.920 138.735
Total 670.962 641.993
STAFF COSTS Thousand of euros
The average number of employees in 2020 and 2019, by category and regardless of the employment relationship, was as follows:
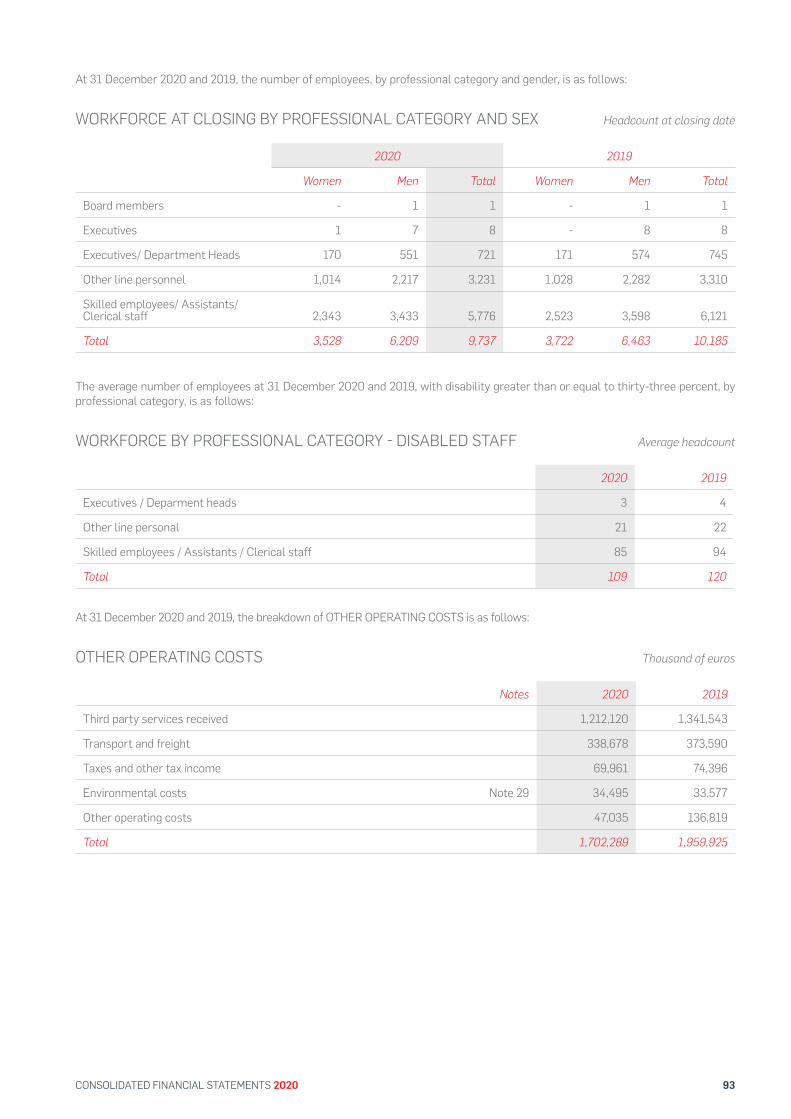
93CONSOLIDATED FINANCIAL STATEMENTS 2020
Average headcount
Headcount at closing date
2020 2019
Executives / Deparment heads 3 4
Other line personal 21 22
Skilled employees / Assistants / Clerical staff 85 94
Total 109 120
2020 2019
Women Men Total Women Men Total
Board members - 1 1 - 1 1
Executives 1 7 8 - 8 8
Executives/ Department Heads 170 551 721 171 574 745
Other line personnel 1,014 2,217 3,231 1,028 2,282 3,310
Skilled employees/ Assistants/ Clerical staff 2,343 3,433 5,776 2,523 3,598 6,121
Total 3,528 6,209 9,737 3,722 6,463 10,185
WORKFORCE BY PROFESSIONAL CATEGORY # DISABLED STAFF
WORKFORCE AT CLOSING BY PROFESSIONAL CATEGORY AND SEX
At 31 December 2020 and 2019, the number of employees, by professional category and gender, is as follows:
The average number of employees at 31 December 2020 and 2019, with disability greater than or equal to thirty-three percent, by professional category, is as follows:
At 31 December 2020 and 2019, the breakdown of OTHER OPERATING COSTS is as follows:
Notes 2020 2019
Third party services received 1,212,120 1,341,543
Transport and freight 338,678 373,590
Taxes and other tax income 69,961 74,396
Environmental costs Note 29 34,495 33,577
Other operating costs 47,035 136,819
Total 1,702,289 1,959,925
OTHER OPERATING COSTS Thousand of euros
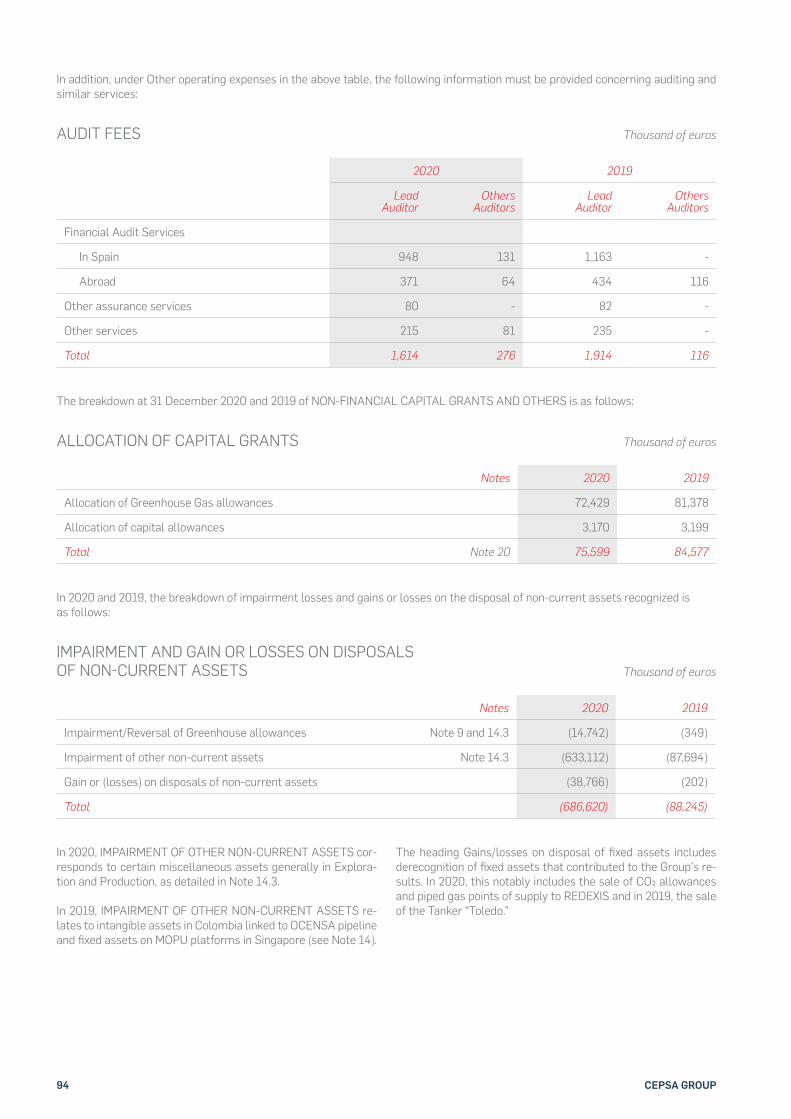
94 CEPSA GROUP
In addition, under Other operating expenses in the above table, the following information must be provided concerning auditing and similar services:
Thousand of euros
2020 2019
Lead Auditor
Others Auditors
Lead Auditor
Others Auditors
Financial Audit Services
In Spain 948 131 1,163 -
Abroad 371 64 434 116
Other assurance services 80 - 82 -
Other services 215 81 235 -
Total 1,614 276 1,914 116
AUDIT FEES
The breakdown at 31 December 2020 and 2019 of NON-FINANCIAL CAPITAL GRANTS AND OTHERS is as follows:
Notes 2020 2019
Allocation of Greenhouse Gas allowances 72,429 81,378
Allocation of capital allowances 3,170 3,199
Total Note 20 75,599 84,577
Notes 2020 2019
Impairment/Reversal of Greenhouse allowances Note 9 and 14.3 (14,742) (349)
Impairment of other non-current assets Note 14.3 (633,112) (87,694)
Gain or (losses) on disposals of non-current assets (38,766) (202)
Total (686,620) (88,245)
ALLOCATION OF CAPITAL GRANTS
IMPAIRMENT AND GAIN OR LOSSES ON DISPOSALS OF NON#CURRENT ASSETS
Thousand of euros
Thousand of euros
In 2020 and 2019, the breakdown of impairment losses and gains or losses on the disposal of non-current assets recognized is as follows:
In 2020, IMPAIRMENT OF OTHER NON-CURRENT ASSETS cor-responds to certain miscellaneous assets generally in Explora-tion and Production, as detailed in Note 14.3.
In 2019, IMPAIRMENT OF OTHER NON-CURRENT ASSETS re-lates to intangible assets in Colombia linked to OCENSA pipeline and !xed assets on MOPU platforms in Singapore (see Note 14).
The heading Gains/losses on disposal of !xed assets includes derecognition of !xed assets that contributed to the Group’s re-sults. In 2020, this notably includes the sale of CO% allowances and piped gas points of supply to REDEXIS and in 2019, the sale of the Tanker “Toledo.”
95CONSOLIDATED FINANCIAL STATEMENTS 2020
25. LEASES
• ACCOUNTING POLICIES
Effective as of 1 January 2019, IFRS 16 introduced a new procedure for the accounting of operating lease contracts, equivalent to the existing procedure for financial lease con-tracts. On that date, the Group first applied and recorded lease debt at the present value of pending lease payables as at 1 January 2019, discounted using the incremental borrowing rate at that date. See Note 12 for the financial impact of the first application of the standard.
In applying the Standard, the Group evaluates whether a contract is or contains a lease at the beginning of the con-tract. The Group recognizes a right of use and the corre-sponding lease debt for all lease agreements in which it is a lessee, except for the excluded contracts that are listed below.
Lease payments included in the lease debt calculation in-clude:
• fixed lease Payments, less any lease incentives to be received;
• variable lease payments that depend on an index or rate, initially calculated using the index or rate at the start date;
• the amount expected from the residual value guarantees to be paid by the lessee;
• the strike price of the purchase options, if the lessee has reasonable certainty of exercising the options; and
• payments of penalties for terminating the lease, if the conditions of the contract reflect the exercising of a termination option.
Lease debt is subsequently revised by increasing the bal-ance to reflect the financial cost on the debt (using the effective interest method), and reducing the balance to re-flect the lease payments made.
The Group separates the total amount of the payments for the principal of the lease and interest, and presents both within financing activities in the consolidated cash flow statement.
OPERATING LEASE CONTRACTS EXCLUDED FROM THIS TREATMENT
Due to materiality or practical effects, the following types of contracts are excluded from the treatment set out in this note:
• short-term leases (defined as leases for a duration equal to or less than 12 months), and
• leases of assets of reduced value.
For these leases, the Group recognizes lease payments as a linear operating expense throughout the life of the con-tract, unless an alternative form of sharing is more repre-sentative of the temporary pattern in which the economic benefits of leased assets are consumed. Therefore, there is no debt for future payments.
The Group acquired the use of certain assets through !nance and operating leases.
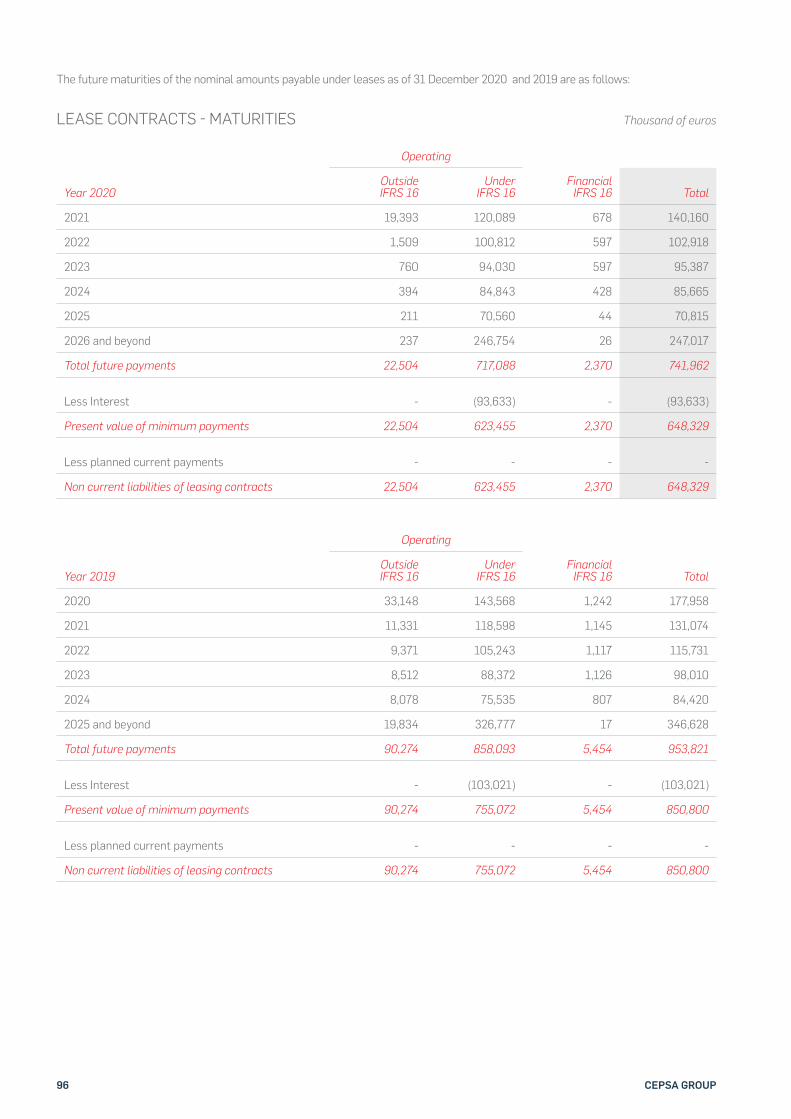
96 CEPSA GROUP
Thousand of euros
Operating
Year 2020Outside IFRS 16
Under IFRS 16
Financial IFRS 16 Total
2021 19,393 120,089 678 140,160
2022 1,509 100,812 597 102,918
2023 760 94,030 597 95,387
2024 394 84,843 428 85,665
2025 211 70,560 44 70,815
2026 and beyond 237 246,754 26 247,017
Total future payments 22,504 717,088 2,370 741,962
Less Interest - (93,633) - (93,633)
Present value of minimum payments 22,504 623,455 2,370 648,329
Less planned current payments - - - -
Non current liabilities of leasing contracts 22,504 623,455 2,370 648,329
Operating
Year 2019Outside IFRS 16
Under IFRS 16
Financial IFRS 16 Total
2020 33,148 143,568 1,242 177,958
2021 11,331 118,598 1,145 131,074
2022 9,371 105,243 1,117 115,731
2023 8,512 88,372 1,126 98,010
2024 8,078 75,535 807 84,420
2025 and beyond 19,834 326,777 17 346,628
Total future payments 90,274 858,093 5,454 953,821
Less Interest - (103,021) - (103,021)
Present value of minimum payments 90,274 755,072 5,454 850,800
Less planned current payments - - - -
Non current liabilities of leasing contracts 90,274 755,072 5,454 850,800
LEASE CONTRACTS # MATURITIES
The future maturities of the nominal amounts payable under leases as of 31 December 2020 and 2019 are as follows:
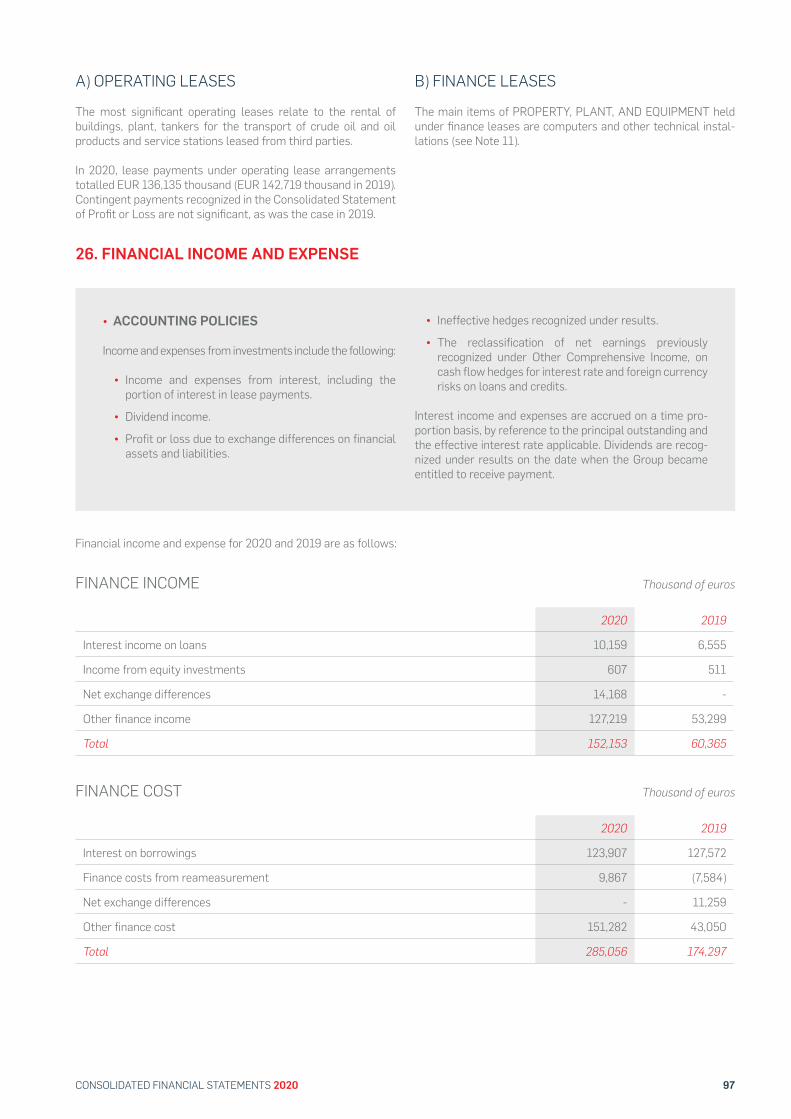
97CONSOLIDATED FINANCIAL STATEMENTS 2020
A) OPERATING LEASES
The most signi!cant operating leases relate to the rental of buildings, plant, tankers for the transport of crude oil and oil products and service stations leased from third parties.
In 2020, lease payments under operating lease arrangements totalled EUR 136,135 thousand (EUR 142,719 thousand in 2019). Contingent payments recognized in the Consolidated Statement of Pro!t or Loss are not signi!cant, as was the case in 2019.
B) FINANCE LEASES
The main items of PROPERTY, PLANT, AND EQUIPMENT held under !nance leases are computers and other technical instal-lations (see Note 11).
26. FINANCIAL INCOME AND EXPENSE
• ACCOUNTING POLICIES
Income and expenses from investments include the following:
• Income and expenses from interest, including the portion of interest in lease payments.
• Dividend income.
• Profit or loss due to exchange differences on financial assets and liabilities.
• Ineffective hedges recognized under results.
• The reclassification of net earnings previously recognized under Other Comprehensive Income, on cash flow hedges for interest rate and foreign currency risks on loans and credits.
Interest income and expenses are accrued on a time pro-portion basis, by reference to the principal outstanding and the effective interest rate applicable. Dividends are recog-nized under results on the date when the Group became entitled to receive payment.
Financial income and expense for 2020 and 2019 are as follows:
Thousand of euros
Thousand of euros
2020 2019
Interest income on loans 10,159 6,555
Income from equity investments 607 511
Net exchange differences 14,168 -
Other finance income 127,219 53,299
Total 152,153 60,365
2020 2019
Interest on borrowings 123,907 127,572
Finance costs from reameasurement 9,867 (7,584)
Net exchange differences - 11,259
Other finance cost 151,282 43,050
Total 285,056 174,297
FINANCE INCOME
FINANCE COST
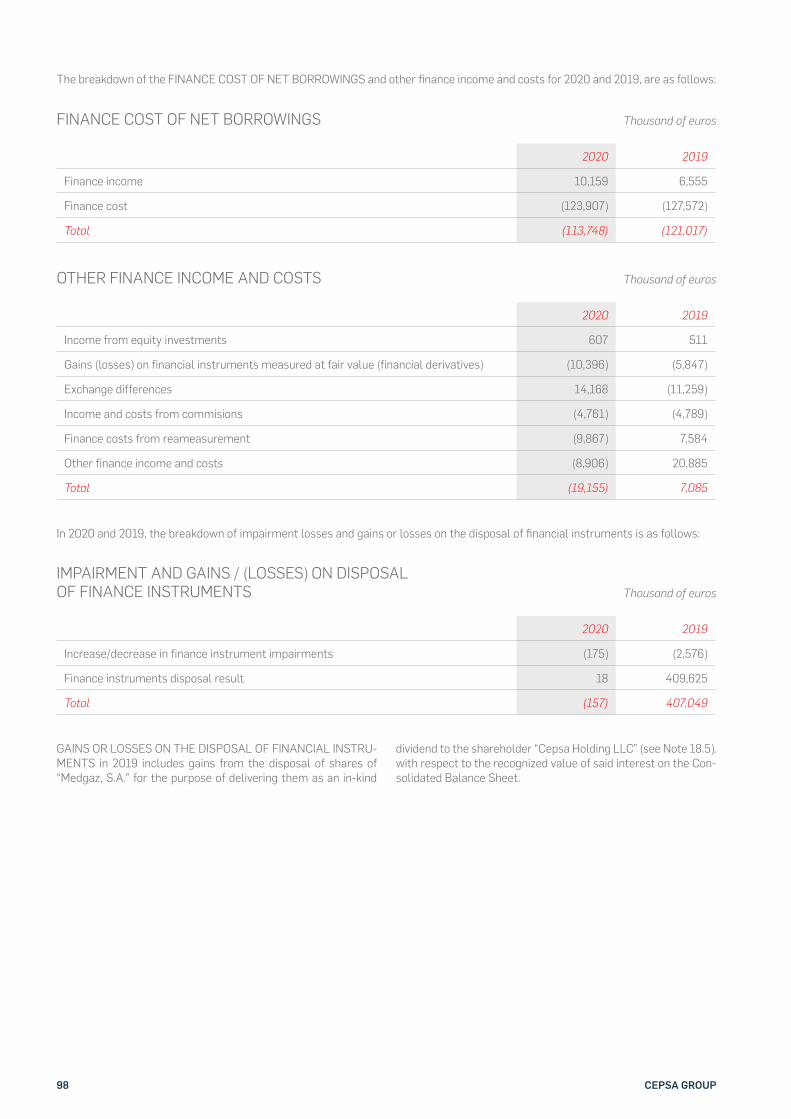
98 CEPSA GROUP
The breakdown of the FINANCE COST OF NET BORROWINGS and other !nance income and costs for 2020 and 2019, are as follows:
Thousand of euros
Thousand of euros
Thousand of euros
2020 2019
Finance income 10,159 6,555
Finance cost (123,907) (127,572)
Total (113,748) (121,017)
2020 2019
Increase/decrease in finance instrument impairments (175) (2,576)
Finance instruments disposal result 18 409,625
Total (157) 407,049
2020 2019
Income from equity investments 607 511
Gains (losses) on financial instruments measured at fair value (financial derivatives) (10,396) (5,847)
Exchange differences 14,168 (11,259)
Income and costs from commisions (4,761) (4,789)
Finance costs from reameasurement (9,867) 7,584
Other finance income and costs (8,906) 20,885
Total (19,155) 7,085
FINANCE COST OF NET BORROWINGS
IMPAIRMENT AND GAINS / (LOSSES) ON DISPOSAL OF FINANCE INSTRUMENTS
OTHER FINANCE INCOME AND COSTS
In 2020 and 2019, the breakdown of impairment losses and gains or losses on the disposal of !nancial instruments is as follows:
GAINS OR LOSSES ON THE DISPOSAL OF FINANCIAL INSTRU-MENTS in 2019 includes gains from the disposal of shares of “Medgaz, S.A.” for the purpose of delivering them as an in-kind
dividend to the shareholder “Cepsa Holding LLC” (see Note 18.5), with respect to the recognized value of said interest on the Con-solidated Balance Sheet.
99CONSOLIDATED FINANCIAL STATEMENTS 2020
27. TAX MATTERS
• ACCOUNTING POLICIES
Current and deferred income taxes are recognized under INCOME TAX in the accompanying Consolidated Income Statement, except when they arise from economic events that have been directly recognized in OTHER COMPRE-HENSIVE INCOME or EQUITY.
The current income tax expense is the result of applying the tax rate to the taxable profit for the year, after deducting the allowable tax credits. The current income tax charge is calculated on the basis of the Group’s interpretation of the tax laws enacted or substantively enacted at the end of the reporting period in the countries where the company’s subsidiaries and associates operate and generate taxable income, considering the Group’s tax position, and including the uncertain tax treatments (following IFRIC 23).
Deferred tax is accounted for using the liability method based on the balance sheet, under which temporary dif-ferences are determined as the difference between the tax bases of assets and liabilities and their carrying amounts. However, deferred taxes are not accounted for:
• if they arise from the initial recognition of the goodwill; or
• if they arise from initial recognition of an asset or liability in a transaction other than a business combination that at the time of the transaction affects neither accounting nor taxable profit nor loss.
Deferred tax assets for taxable income to be offset, out-standing tax credits, and deductible temporary differences are recognized when it is considered that, according to the best estimate on the Group’s future results, it is likely that said assets will be recovered.
Deferred tax assets and liabilities are measured based on the tax legislation and the tax rates in force when the re-lated deferred income tax asset is realized, or the deferred income tax liability is settled.
The Group reassesses recognized deferred tax assets and tax credits at each consolidated Balance Sheet date, and reduces the amount for any that are not likely to have fu-ture taxable profit will allow them to be recovered.
Following the same principles, recognized deferred tax assets and unrecognized tax credits are reassessed with the same frequency and their amount is recorded for those which, given the new information, it is likely that future tax-able profit will be available for their recovery.
Deferred tax liabilities for taxable temporary differences relating to investments in subsidiaries, associates and joint ventures are recognized with the exception of those de-ferred tax liabilities where the Group is not able to control the timing of the reversal of the temporary differences and it is probable that the differences will not reverse in the foreseeable future within the period allowed by law. Gener-ally, the Group is not able to control the reversal of tempo-rary differences for associates. The temporary difference is recognized only when there is an agreement through which the Group has the capacity to control reversal.
Deferred tax assets and liabilities are offset when there is a legally enforceable right to offset current tax assets and liabilities and when the deferred tax assets and liabilities derive from the tax on gains which relate to the same tax-ation authority, and apply to the same entity or taxpayer, or different entities or taxpayers, which intend to settle the current tax assets and liabilities on a net basis.
The treatment of Corporate Tax penalties ensures that any significant uncertainty as to the penalty and interest paya-ble may be clearly distinguished from the valuation of the tax. In that case, penalties are recognized as an operating expense. If, by contrast, there is considered to be signifi-cant doubt surrounding the amount of tax to be paid, an accounting policy of recognizing the penalties as tax ex-pense is considered acceptable. Given the high degree of uncertainty, CEPSA chose to reflect it as a tax expense.
CEPSA and certain Group companies pay the Corporate Income Tax under the consolidated taxation scheme in Group 4/89, with CEPSA being the parent company. Table I at the end of this doc-ument includes a list of the main companies making up the tax group in 2020.
Since 2010, in Spain CEPSA Group has adhered to the Code of Good Tax Practices drawn up by the Large Companies Forum jointly with the Spanish tax authorities.
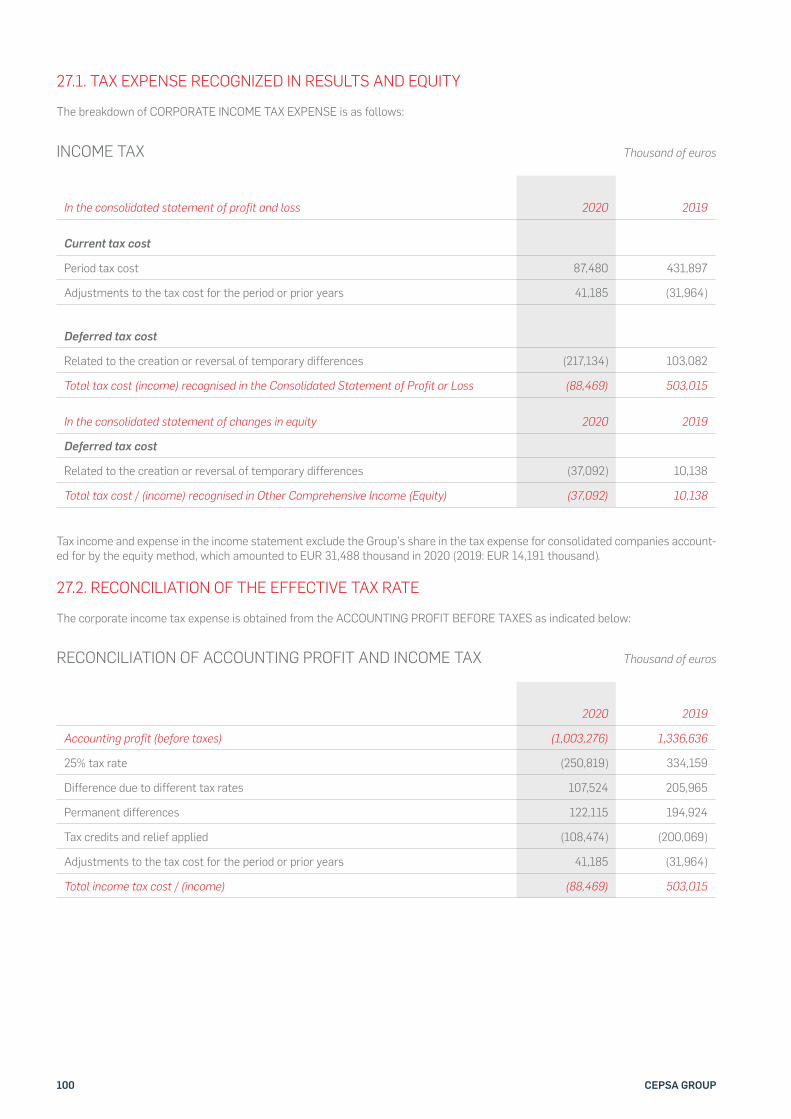
100 CEPSA GROUP
27.1. TAX EXPENSE RECOGNIZED IN RESULTS AND EQUITY
The breakdown of CORPORATE INCOME TAX EXPENSE is as follows:
Thousand of euros
Thousand of euros
In the consolidated statement of profit and loss 2020 2019
Current tax cost
Period tax cost 87,480 431,897
Adjustments to the tax cost for the period or prior years 41,185 (31,964)
Deferred tax cost
Related to the creation or reversal of temporary differences (217,134) 103,082
Total tax cost (income) recognised in the Consolidated Statement of Profit or Loss (88,469) 503,015
In the consolidated statement of changes in equity 2020 2019
Deferred tax cost
Related to the creation or reversal of temporary differences (37,092) 10,138
Total tax cost / (income) recognised in Other Comprehensive Income (Equity) (37,092) 10,138
2020 2019
Accounting profit (before taxes) (1,003,276) 1,336,636
25% tax rate (250,819) 334,159
Difference due to different tax rates 107,524 205,965
Permanent differences 122,115 194,924
Tax credits and relief applied (108,474) (200,069)
Adjustments to the tax cost for the period or prior years 41,185 (31,964)
Total income tax cost / (income) (88,469) 503,015
INCOME TAX
RECONCILIATION OF ACCOUNTING PROFIT AND INCOME TAX
Tax income and expense in the income statement exclude the Group’s share in the tax expense for consolidated companies account-ed for by the equity method, which amounted to EUR 31,488 thousand in 2020 (2019: EUR 14,191 thousand).
27.2. RECONCILIATION OF THE EFFECTIVE TAX RATE
The corporate income tax expense is obtained from the ACCOUNTING PROFIT BEFORE TAXES as indicated below:
101CONSOLIDATED FINANCIAL STATEMENTS 2020
The line DIFFERENCE DUE TO DIFFERENT TAX RATES mainly includes the effect of the different tax rates that apply to CEPSA for the various pro!t taxes on hydrocarbon production activity in Algeria, Thailand, and Abu Dhabi. Other foreign establishments or subsidiaries have no signi!cant in"uence on this rate differential.
With regard to Algeria, the following taxes apply:
• the TAX ON REMUNERATION FOR PRODUCTION ACTIV-ITIES is similar to the Spanish Corporate Income Tax as it taxes gross annual income in barrels of Saharan Blend crude oil, withheld and settled through the Algerian state-owned company Sonatrach, on behalf of CEPSA,
• in addition, under Algerian law, the SUPER PROFIT TAX (ef-fective August 2006) applies, whose tax rate is higher the higher the price of crude oil,
• the Tax on Hydrocarbon Revenues (French’s acronym TRP), and
• the Supplementary Income Tax (French’s acronym ICR) whose tax rate is based on the profits earned.
The combined accrued share of both taxes for 2020 and 2019 amounts to EUR 73,044 thousand and EUR 186,143 thousand respectively.
The activity of the Coastal Group is carried out mainly in Thai-land, where it is subject to two types of taxes:
• the EXPENSE FOR THE COUNTRY’S HYDROCARBON SEC-TOR TAX (Petroleum Income Tax, PIT), and
• the SPECIAL REMUNERATION BENEFIT (SRB), which is cal-culated separately for each concession the company holds. This tax is determined on the basis of production volumes and crude prices, and is subject to certain adjustments, such as changes in the consumer price index, the wholesale price index and the depth of exploration. The tax is calculat-ed based on each year’s production and includes deductions for the expenses incurred in the concessions.
The combined accrued share of both taxes for 2020 and 2019 amounts to EUR 8,965 thousand and EUR 40,778 thousand re-spectively.
In Abu Dhabi, the activity of exploration, development and ex-ploitation of hydrocarbons is subject to the INCOME TAX, and to a SUPER PROFIT TAX.
The combined accrued share of both taxes for 2020 and 2019 amounts to EUR 22,440 thousand and EUR 150,984 thousand.
In other tax jurisdictions, the differences in tax rates do not show signi!cant differences.
The PERMANENT DIFFERENCES line is mainly due to non-de-ductible expenses, non-deductible expenses, or income not eligible from a tax point of view. Those recognized in 2020 and
2019 mainly correspond to several impaired assets, to dividends, revenue obtained from Permanent Establishments abroad, and Corporate Income Tax settled abroad which was not included in the amount used to calculate deductions to the tax base as per article 31.2 of Law 27/2014, other provision allowances, penal-ties, and adjustments relating to consolidation.
For the calculation of the Corporate Tax expense, the applicable deductions for international double taxation of income obtained abroad through Permanent Establishments and dividends, per-formance of certain activities and other tax incentives have been considered, in accordance with the applicable regulations in each of the exercises.
Due to the radical change in scenario in 2020 (COVID-19 and cri-sis in the hydrocarbon markets), CEPSA has changed the mech-anism to avoid international double taxation on income from its establishments abroad corresponding to the 2019 !nancial year, applying the mechanism of exemption to the tax base (and not the imputation as tax deduction initially considered in its fore-cast for Corporation Tax in Spain in 2019), which has implied, on the one hand, an increase in tax expenditure for 2020 by EUR 35 million, and, on the other, a higher quota to be returned derived from the liquidation of Tax on Societies of the !scal group in ap-proximately EUR 31 million.
The amounts included the line ADJUSTMENTS TO INCOME TAX FOR THE CURRENT OR PRIOR TAX PERIODS, which amounted to EUR 41,185 thousand in expenses and EUR 31,964 thousand in revenue for 2020 and 2019, respectively, include the differ-ence between the expense accounted for in connection with Corporate Income Tax at 31 December 2019 and 2018 and the amount corresponding to the !nal settlement for said years. In the !nancial year 2020, the amount of the aforementioned tax is collected for an amount of 35 million euros and other adjust-ments of the Income Tax from previous years.
In 2019, income was recognized on INCOME TAX in connection with the adjustment related to inspections initiated by the tax authority in the years 2005-2008, as a result of a partially fa-vourable decision of Spain’s High Court, where such amounts had been provisioned.
27.3. CHANGES IN BALANCES DUE TO DEFERRED TAX
Below are the balances for deferred tax assets and liabilities, broken down by origin:
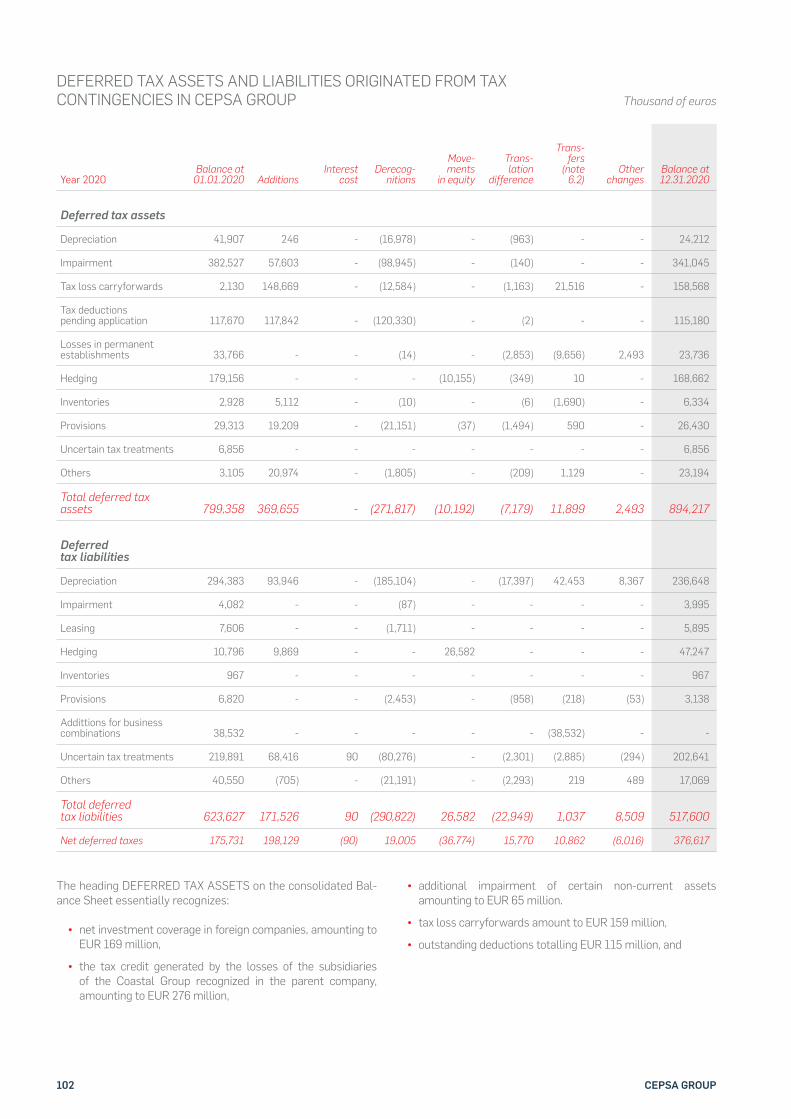
102 CEPSA GROUP
DEFERRED TAX ASSETS AND LIABILITIES ORIGINATED FROM TAX CONTINGENCIES IN CEPSA GROUP Thousand of euros
Year 2020Balance at
01.01.2020 AdditionsInterest
costDerecog-
nitions
Move-ments
in equity
Trans-lation
difference
Trans-fers
(note 6.2)
Other changes
Balance at 12.31.2020
Deferred tax assets
Depreciation 41,907 246 - (16,978) - (963) - - 24,212
Impairment 382,527 57,603 - (98,945) - (140) - - 341,045
Tax loss carryforwards 2,130 148,669 - (12,584) - (1,163) 21,516 - 158,568
Tax deductions pending application 117,670 117,842 - (120,330) - (2) - - 115,180
Losses in permanent establishments 33,766 - - (14) - (2,853) (9,656) 2,493 23,736
Hedging 179,156 - - - (10,155) (349) 10 - 168,662
Inventories 2,928 5,112 - (10) - (6) (1,690) - 6,334
Provisions 29,313 19,209 - (21,151) (37) (1,494) 590 - 26,430
Uncertain tax treatments 6,856 - - - - - - - 6,856
Others 3,105 20,974 - (1,805) - (209) 1,129 - 23,194
Total deferred tax assets 799,358 369,655 - (271,817) (10,192) (7,179) 11,899 2,493 894,217
Deferred tax liabilities
Depreciation 294,383 93,946 - (185,104) - (17,397) 42,453 8,367 236,648
Impairment 4,082 - - (87) - - - - 3,995
Leasing 7,606 - - (1,711) - - - - 5,895
Hedging 10,796 9,869 - - 26,582 - - - 47,247
Inventories 967 - - - - - - - 967
Provisions 6,820 - - (2,453) - (958) (218) (53) 3,138
Addittions for business combinations 38,532 - - - - - (38,532) - -
Uncertain tax treatments 219,891 68,416 90 (80,276) - (2,301) (2,885) (294) 202,641
Others 40,550 (705) - (21,191) - (2,293) 219 489 17,069
Total deferred tax liabilities 623,627 171,526 90 (290,822) 26,582 (22,949) 1,037 8,509 517,600
Net deferred taxes 175,731 198,129 (90) 19,005 (36,774) 15,770 10,862 (6,016) 376,617
The heading DEFERRED TAX ASSETS on the consolidated Bal-ance Sheet essentially recognizes:
• net investment coverage in foreign companies, amounting to EUR 169 million,
• the tax credit generated by the losses of the subsidiaries of the Coastal Group recognized in the parent company, amounting to EUR 276 million,
• additional impairment of certain non-current assets amounting to EUR 65 million.
• tax loss carryforwards amount to EUR 159 million,
• outstanding deductions totalling EUR 115 million, and
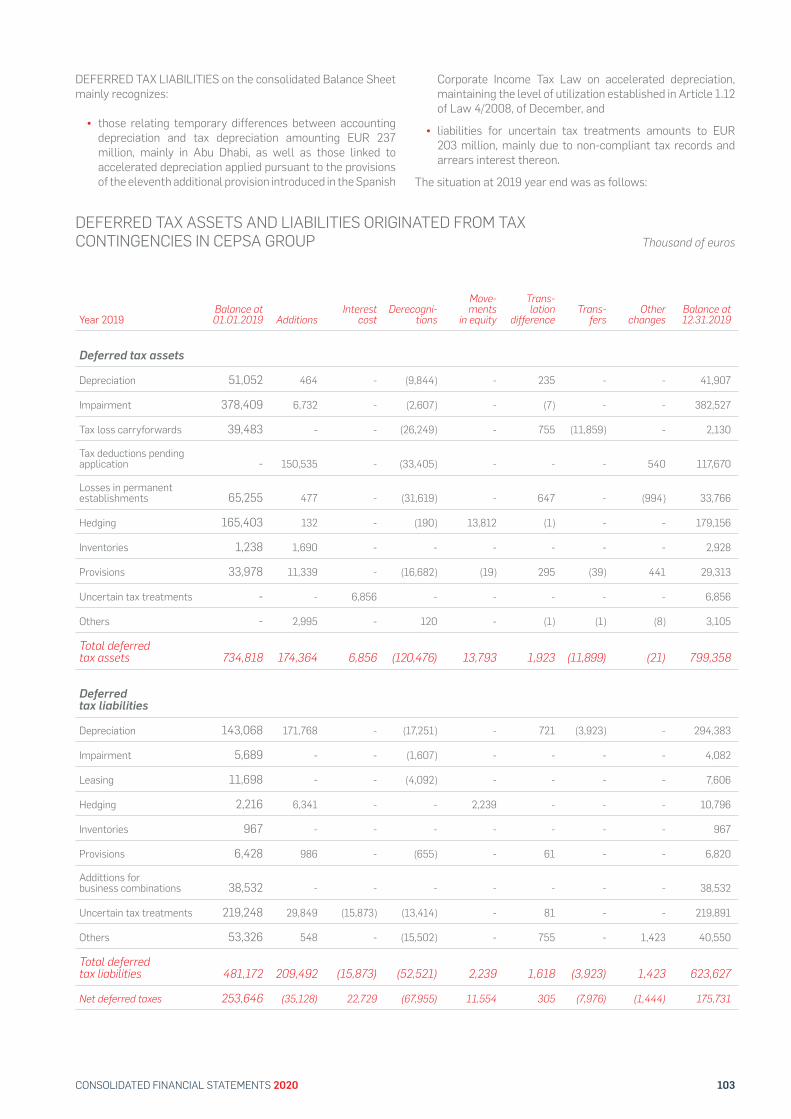
103CONSOLIDATED FINANCIAL STATEMENTS 2020
DEFERRED TAX ASSETS AND LIABILITIES ORIGINATED FROM TAX CONTINGENCIES IN CEPSA GROUP Thousand of euros
Year 2019Balance at 01.01.2019 Additions
Interest cost
Derecogni-tions
Move-ments
in equity
Trans-lation
differenceTrans-
fersOther
changesBalance at 12.31.2019
Deferred tax assets
Depreciation 51,052 464 - (9,844) - 235 - - 41,907
Impairment 378,409 6,732 - (2,607) - (7) - - 382,527
Tax loss carryforwards 39,483 - - (26,249) - 755 (11,859) - 2,130
Tax deductions pending application - 150,535 - (33,405) - - - 540 117,670
Losses in permanent establishments 65,255 477 - (31,619) - 647 - (994) 33,766
Hedging 165,403 132 - (190) 13,812 (1) - - 179,156
Inventories 1,238 1,690 - - - - - - 2,928
Provisions 33,978 11,339 - (16,682) (19) 295 (39) 441 29,313
Uncertain tax treatments - - 6,856 - - - - - 6,856
Others - 2,995 - 120 - (1) (1) (8) 3,105
Total deferred tax assets 734,818 174,364 6,856 (120,476) 13,793 1,923 (11,899) (21) 799,358
Deferred tax liabilities
Depreciation 143,068 171,768 - (17,251) - 721 (3,923) - 294,383
Impairment 5,689 - - (1,607) - - - - 4,082
Leasing 11,698 - - (4,092) - - - - 7,606
Hedging 2,216 6,341 - - 2,239 - - - 10,796
Inventories 967 - - - - - - - 967
Provisions 6,428 986 - (655) - 61 - - 6,820
Addittions for business combinations 38,532 - - - - - - - 38,532
Uncertain tax treatments 219,248 29,849 (15,873) (13,414) - 81 - - 219,891
Others 53,326 548 - (15,502) - 755 - 1,423 40,550
Total deferred tax liabilities 481,172 209,492 (15,873) (52,521) 2,239 1,618 (3,923) 1,423 623,627
Net deferred taxes 253,646 (35,128) 22,729 (67,955) 11,554 305 (7,976) (1,444) 175,731
DEFERRED TAX LIABILITIES on the consolidated Balance Sheet mainly recognizes:
• those relating temporary differences between accounting depreciation and tax depreciation amounting EUR 237 million, mainly in Abu Dhabi, as well as those linked to accelerated depreciation applied pursuant to the provisions of the eleventh additional provision introduced in the Spanish
Corporate Income Tax Law on accelerated depreciation, maintaining the level of utilization established in Article 1.12 of Law 4/2008, of December, and
• liabilities for uncertain tax treatments amounts to EUR 203 million, mainly due to non-compliant tax records and arrears interest thereon.
The situation at 2019 year end was as follows:
104 CEPSA GROUP
27.4. UNCERTAINTY RELATED TO TREATMENT OF CORPORATE INCOME TAX AND OTHER TAXES
In the normal course of business, the Group’s operations were subject to review by the tax authorities of the various countries where it operates. On occasion, this led to differences in inter-pretation of existing regulations. The Group’s interpretation is based on the opinion of internal experts as well as, where appli-cable, external experts on each of the relevant matters and juris-dictions to improve estimations of tax applicability and amounts.
In this regard, various tax assessments have been signed in disagreement, including one for corporate income tax for years 2005-2008 and 2009-2012. The CEPSA Group has !led the cor-responding appeals with the relevant judicial bodies. The Group has duly created provisions that ful!l the speci!ed probability requirements to cover the amounts relating to said tax assess-ments up to 2020 year-end.
The tax inspections for the years 2013-2016 relating to Corpo-rate Income Tax, VAT, Personal Income Tax Withholdings, and Non-Resident Income Tax for the CEPSA Tax Group were initiat-ed in July 2018 and concluded in July 2020 identifying no major liabilities beyond those set out in the accompanying !nancial statements. Furthermore, !nancial year 2017 and subsequent !nancial years remain open to inspection.
In December 2019, Colombian authorities closed the Income Tax audit corresponding to !nancial year 2015 and issued as-sessments amounting to EUR 90 million, which were signed in disagreement. The corresponding interest on arrears calculated based on a rate of 30% since 2016 would also need to be applied. Said assessments stem from an interpretative discrepancy with the DIAN (National Tax and Customs Department) regarding the regulations applicable to the branches, which could result in a double taxation for the branch of!ce in Colombia, and other additional issues such as the tax deductibility of the cost of pro-duction of royalties paid to the National Hydrocarbons Agency.
In December 2020, the DIAN provided separate settlement pro-posals in the amount of EUR 29 million for Income Tax and the CREE income tax for equity corresponding to the 2016 !nancial year, including the same items signed in disagreement relative to the 2015 !nancial year. The corresponding interest on arrears calculated in the same way since 2017 would also need to be added to this amount. The Company has until 30 March 2021 to !le the relevant arguments against said settlement proposals.
Supported by the judgment of the renowned external consult-ants hired to analyse this matter, the Company considers that the possibility of obtaining a resolution favourable to the Group in judicial proceedings is very high, although the tax procedure has some uncertainties arising from the likely prolonged litigation
time (6 to 7 years) throughout the different judicial instances. For this reason, the risk has been described as not likely and no pro-vision has been made for this in the 2020 !nancial statements.
There are also several additional closed tax records in previous !nancial years, for a lower amount, including one for income tax for the years 2009 and 2011, which were signed in non-com-pliance. “Cepsa Colombia, S.A.” has !led the corresponding ap-peals before the relevant appeal courts. These tax assessments amount to EUR 5 million, plus the corresponding interest and arrears calculated based on a rate of 30 per cent since 2009 and 2011, and penalty up to 365 per cent. Adequate provisions have been charged to losses. Furthermore, !nancial year 2017 and subsequent !nancial years remain open to inspection by Co-lombian authorities.
Both in Thailand and in Algeria, !nancial year 2015 and subse-quent !nancial years remain open to inspection, while in Abu Dhabi only !nancial year 2018 and subsequent !nancial years remain open to inspection.
CEPSA management does not expect any additional material liabilities for which provisions have not been recognized to arise for the parent company or for the other consolidated Group companies as a result of the appeals !led or of inspections of the years open to inspection.
In the opinion of the Company’s Directors and its tax advisors, re-lated party transactions are carried out at market value, transfer prices are adequately supported and it is estimated that there are no signi!cant risks of major liabilities arising in future in this respect.
27.5. UNRECOGNIZED DEFERRED TAX ASSETS AND LIABILITIES
The Group has not recognized deferred tax liabilities in relation to taxable temporary differences associated with investments in subsidiaries, associates, and joint ventures for an amount of EUR 130,171 thousand at year end 2020 compared to EUR 193,099 thousand at year end 2019.
The Group did not recognize any deferred tax assets arising from tax losses amounting to EUR 58,380 thousand in 2020 and EUR 65,676 thousand in 2019, given that according to its projected results, recoverability of these assets is not considered probable.
Finally, with regard to tax assessments in Colombia, it is worth noting that, in addition to the above-mentioned amount payable and interest on arrears, the tax authorities could impose a pen-alty of up to 194%, although the contingent tax liability has not been recognized, as a decision against the Group’s interests has been deemed unlikely.
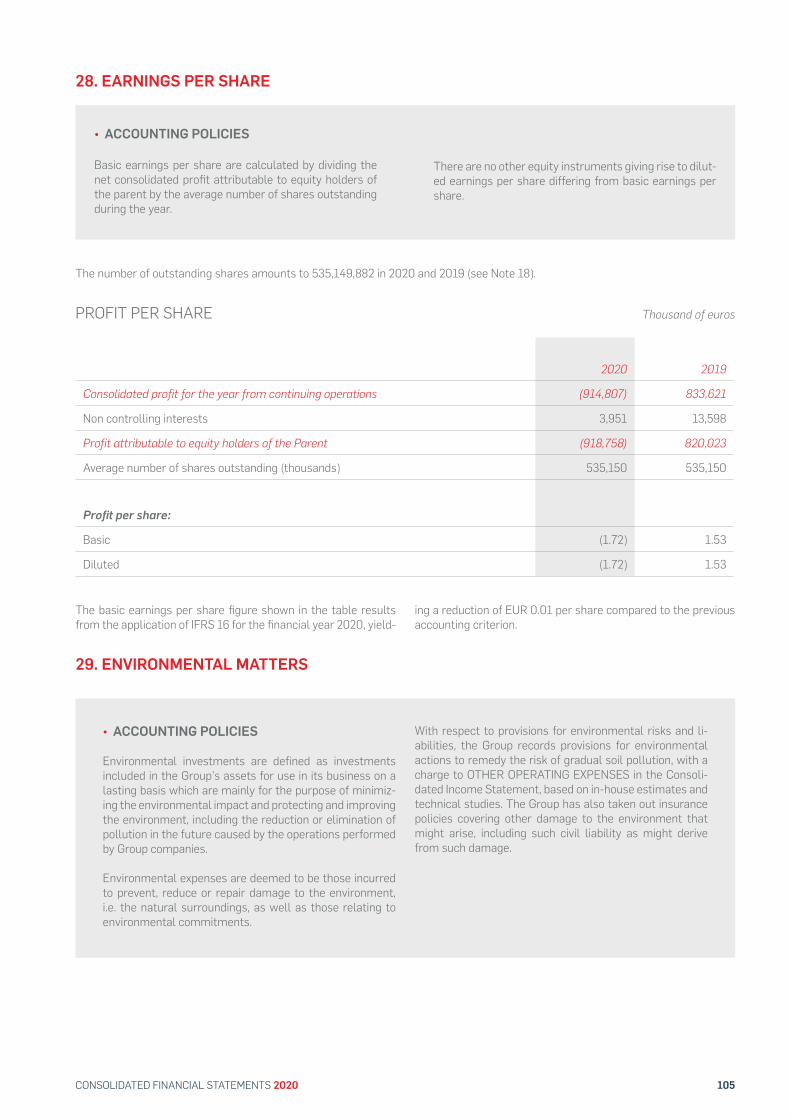
105CONSOLIDATED FINANCIAL STATEMENTS 2020
The number of outstanding shares amounts to 535,149,882 in 2020 and 2019 (see Note 18).
Thousand of euros
2020 2019
Consolidated profit for the year from continuing operations (914,807) 833,621
Non controlling interests 3,951 13,598
Profit attributable to equity holders of the Parent (918,758) 820,023
Average number of shares outstanding (thousands) 535,150 535,150
Profit per share:
Basic (1.72) 1.53
Diluted (1.72) 1.53
PROFIT PER SHARE
The basic earnings per share !gure shown in the table results from the application of IFRS 16 for the !nancial year 2020, yield-
ing a reduction of EUR 0.01 per share compared to the previous accounting criterion.
29. ENVIRONMENTAL MATTERS
• ACCOUNTING POLICIES
Environmental investments are defined as investments included in the Group’s assets for use in its business on a lasting basis which are mainly for the purpose of minimiz-ing the environmental impact and protecting and improving the environment, including the reduction or elimination of pollution in the future caused by the operations performed by Group companies.
Environmental expenses are deemed to be those incurred to prevent, reduce or repair damage to the environment, i.e. the natural surroundings, as well as those relating to environmental commitments.
With respect to provisions for environmental risks and li-abilities, the Group records provisions for environmental actions to remedy the risk of gradual soil pollution, with a charge to OTHER OPERATING EXPENSES in the Consoli-dated Income Statement, based on in-house estimates and technical studies. The Group has also taken out insurance policies covering other damage to the environment that might arise, including such civil liability as might derive from such damage.
28. EARNINGS PER SHARE
• ACCOUNTING POLICIES
Basic earnings per share are calculated by dividing the net consolidated pro!t attributable to equity holders of the parent by the average number of shares outstanding during the year.
There are no other equity instruments giving rise to dilut-ed earnings per share differing from basic earnings per share.
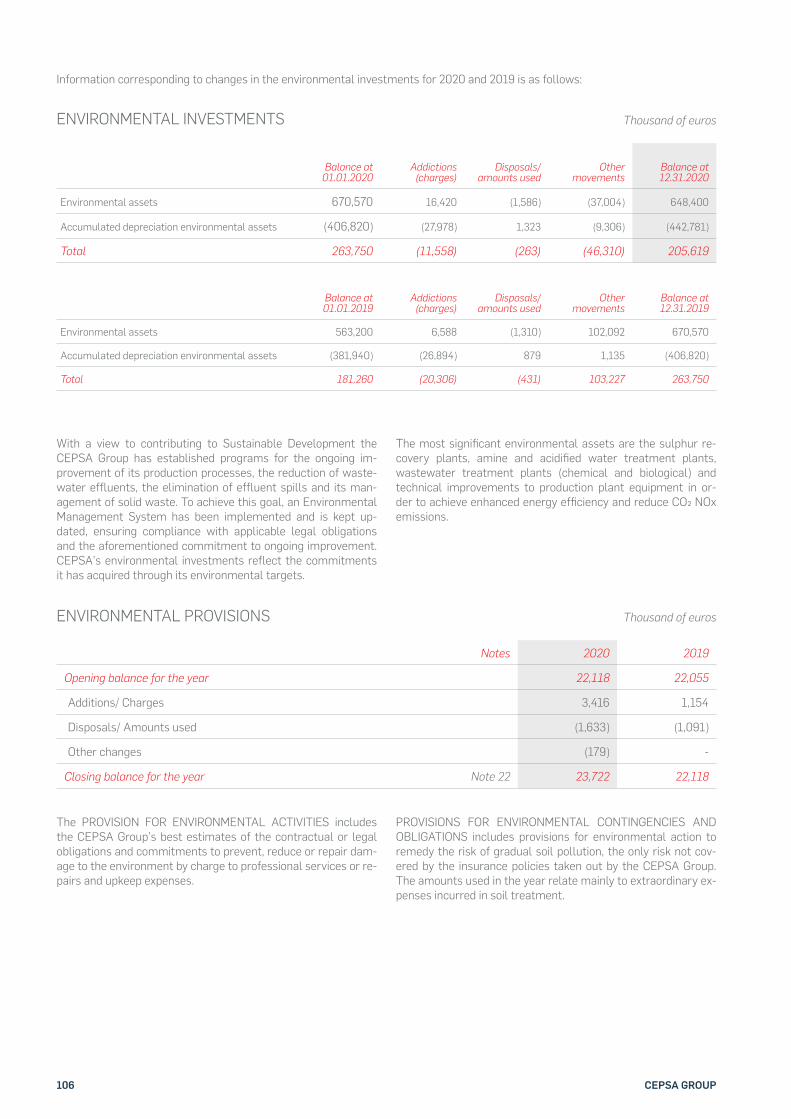
106 CEPSA GROUP
Information corresponding to changes in the environmental investments for 2020 and 2019 is as follows:
ENVIRONMENTAL INVESTMENTS Thousand of euros
Balance at 01.01.2020
Addictions (charges)
Disposals/ amounts used
Other movements
Balance at 12.31.2020
Environmental assets 670,570 16,420 (1,586) (37,004) 648,400
Accumulated depreciation environmental assets (406,820) (27,978) 1,323 (9,306) (442,781)
Total 263,750 (11,558) (263) (46,310) 205,619
Balance at 01.01.2019
Addictions (charges)
Disposals/ amounts used
Other movements
Balance at 12.31.2019
Environmental assets 563,200 6,588 (1,310) 102,092 670,570
Accumulated depreciation environmental assets (381,940) (26,894) 879 1,135 (406,820)
Total 181,260 (20,306) (431) 103,227 263,750
With a view to contributing to Sustainable Development the CEPSA Group has established programs for the ongoing im-provement of its production processes, the reduction of waste-water ef"uents, the elimination of ef"uent spills and its man-agement of solid waste. To achieve this goal, an Environmental Management System has been implemented and is kept up-dated, ensuring compliance with applicable legal obligations and the aforementioned commitment to ongoing improvement. CEPSA’s environmental investments re"ect the commitments it has acquired through its environmental targets.
The most signi!cant environmental assets are the sulphur re-covery plants, amine and acidi!ed water treatment plants, wastewater treatment plants (chemical and biological) and technical improvements to production plant equipment in or-der to achieve enhanced energy ef!ciency and reduce CO% NOx emissions.
Notes 2020 2019
Opening balance for the year 22,118 22,055
Additions/ Charges 3,416 1,154
Disposals/ Amounts used (1,633) (1,091)
Other changes (179) -
Closing balance for the year Note 22 23,722 22,118
ENVIRONMENTAL PROVISIONS Thousand of euros
The PROVISION FOR ENVIRONMENTAL ACTIVITIES includes the CEPSA Group’s best estimates of the contractual or legal obligations and commitments to prevent, reduce or repair dam-age to the environment by charge to professional services or re-pairs and upkeep expenses.
PROVISIONS FOR ENVIRONMENTAL CONTINGENCIES AND OBLIGATIONS includes provisions for environmental action to remedy the risk of gradual soil pollution, the only risk not cov-ered by the insurance policies taken out by the CEPSA Group. The amounts used in the year relate mainly to extraordinary ex-penses incurred in soil treatment.
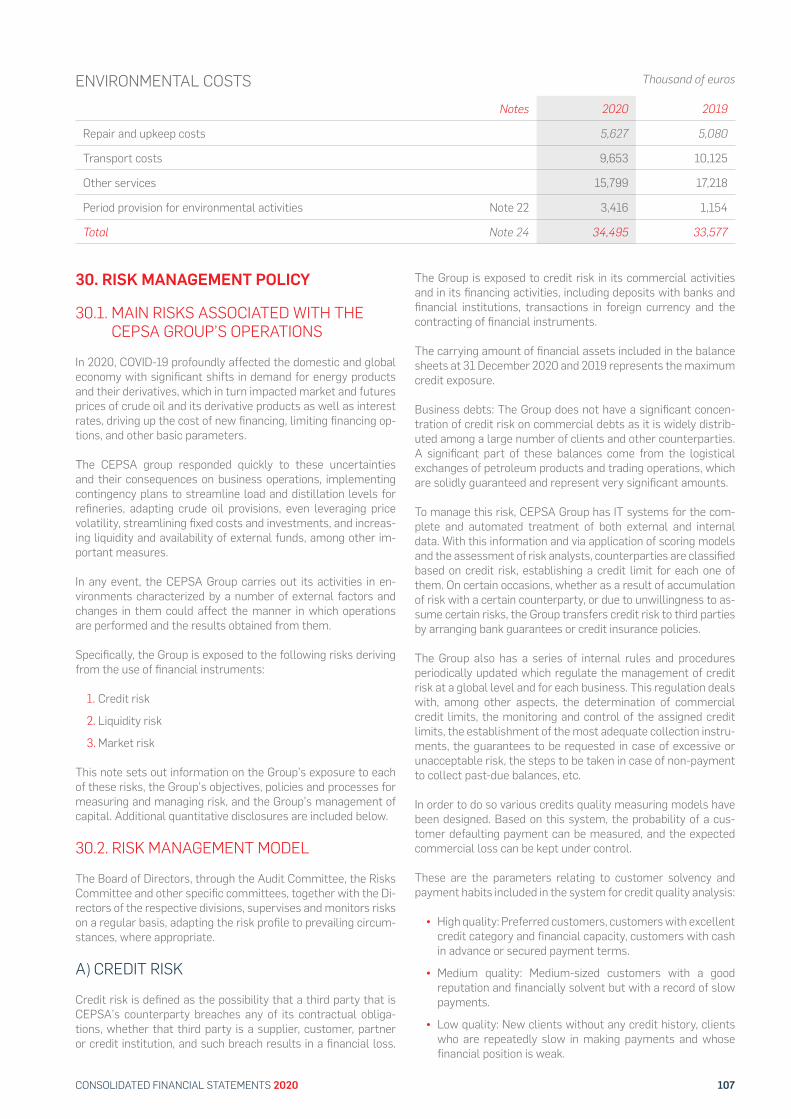
107CONSOLIDATED FINANCIAL STATEMENTS 2020
Notes 2020 2019
Repair and upkeep costs 5,627 5,080
Transport costs 9,653 10,125
Other services 15,799 17,218
Period provision for environmental activities Note 22 3,416 1,154
Total Note 24 34,495 33,577
ENVIRONMENTAL COSTS Thousand of euros
30. RISK MANAGEMENT POLICY
30.1. MAIN RISKS ASSOCIATED WITH THE CEPSA GROUP’S OPERATIONS
In 2020, COVID-19 profoundly affected the domestic and global economy with signi!cant shifts in demand for energy products and their derivatives, which in turn impacted market and futures prices of crude oil and its derivative products as well as interest rates, driving up the cost of new !nancing, limiting !nancing op-tions, and other basic parameters.
The CEPSA group responded quickly to these uncertainties and their consequences on business operations, implementing contingency plans to streamline load and distillation levels for re!neries, adapting crude oil provisions, even leveraging price volatility, streamlining !xed costs and investments, and increas-ing liquidity and availability of external funds, among other im-portant measures.
In any event, the CEPSA Group carries out its activities in en-vironments characterized by a number of external factors and changes in them could affect the manner in which operations are performed and the results obtained from them.
Speci!cally, the Group is exposed to the following risks deriving from the use of !nancial instruments:
1. Credit risk
2. Liquidity risk
3. Market risk
This note sets out information on the Group’s exposure to each of these risks, the Group’s objectives, policies and processes for measuring and managing risk, and the Group’s management of capital. Additional quantitative disclosures are included below.
30.2. RISK MANAGEMENT MODEL
The Board of Directors, through the Audit Committee, the Risks Committee and other speci!c committees, together with the Di-rectors of the respective divisions, supervises and monitors risks on a regular basis, adapting the risk pro!le to prevailing circum-stances, where appropriate.
A) CREDIT RISK
Credit risk is de!ned as the possibility that a third party that is CEPSA’s counterparty breaches any of its contractual obliga-tions, whether that third party is a supplier, customer, partner or credit institution, and such breach results in a !nancial loss.
The Group is exposed to credit risk in its commercial activities and in its !nancing activities, including deposits with banks and !nancial institutions, transactions in foreign currency and the contracting of !nancial instruments.
The carrying amount of !nancial assets included in the balance sheets at 31 December 2020 and 2019 represents the maximum credit exposure.
Business debts: The Group does not have a signi!cant concen-tration of credit risk on commercial debts as it is widely distrib-uted among a large number of clients and other counterparties. A signi!cant part of these balances come from the logistical exchanges of petroleum products and trading operations, which are solidly guaranteed and represent very signi!cant amounts.
To manage this risk, CEPSA Group has IT systems for the com-plete and automated treatment of both external and internal data. With this information and via application of scoring models and the assessment of risk analysts, counterparties are classi!ed based on credit risk, establishing a credit limit for each one of them. On certain occasions, whether as a result of accumulation of risk with a certain counterparty, or due to unwillingness to as-sume certain risks, the Group transfers credit risk to third parties by arranging bank guarantees or credit insurance policies.
The Group also has a series of internal rules and procedures periodically updated which regulate the management of credit risk at a global level and for each business. This regulation deals with, among other aspects, the determination of commercial credit limits, the monitoring and control of the assigned credit limits, the establishment of the most adequate collection instru-ments, the guarantees to be requested in case of excessive or unacceptable risk, the steps to be taken in case of non-payment to collect past-due balances, etc.
In order to do so various credits quality measuring models have been designed. Based on this system, the probability of a cus-tomer defaulting payment can be measured, and the expected commercial loss can be kept under control.
These are the parameters relating to customer solvency and payment habits included in the system for credit quality analysis:
• High quality: Preferred customers, customers with excellent credit category and financial capacity, customers with cash in advance or secured payment terms.
• Medium quality: Medium-sized customers with a good reputation and financially solvent but with a record of slow payments.
• Low quality: New clients without any credit history, clients who are repeatedly slow in making payments and whose financial position is weak.
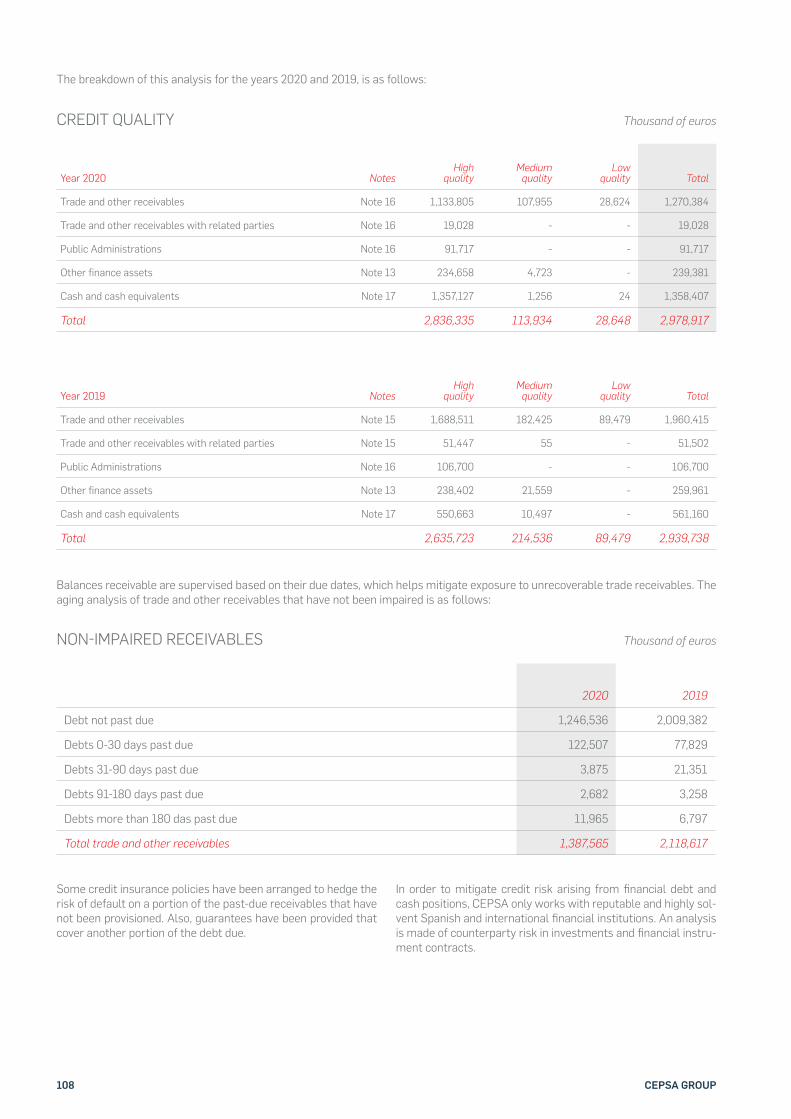
108 CEPSA GROUP
CREDIT QUALITY Thousand of euros
Year 2020 NotesHigh
qualityMedium
qualityLow
quality Total
Trade and other receivables Note 16 1,133,805 107,955 28,624 1,270,384
Trade and other receivables with related parties Note 16 19,028 - - 19,028
Public Administrations Note 16 91,717 - - 91,717
Other finance assets Note 13 234,658 4,723 - 239,381
Cash and cash equivalents Note 17 1,357,127 1,256 24 1,358,407
Total 2,836,335 113,934 28,648 2,978,917
Year 2019 NotesHigh
qualityMedium
qualityLow
quality Total
Trade and other receivables Note 15 1,688,511 182,425 89,479 1,960,415
Trade and other receivables with related parties Note 15 51,447 55 - 51,502
Public Administrations Note 16 106,700 - - 106,700
Other finance assets Note 13 238,402 21,559 - 259,961
Cash and cash equivalents Note 17 550,663 10,497 - 561,160
Total 2,635,723 214,536 89,479 2,939,738
Balances receivable are supervised based on their due dates, which helps mitigate exposure to unrecoverable trade receivables. The aging analysis of trade and other receivables that have not been impaired is as follows:
Thousand of euros
2020 2019
Debt not past due 1,246,536 2,009,382
Debts 0-30 days past due 122,507 77,829
Debts 31-90 days past due 3,875 21,351
Debts 91-180 days past due 2,682 3,258
Debts more than 180 das past due 11,965 6,797
Total trade and other receivables 1,387,565 2,118,617
NON#IMPAIRED RECEIVABLES
Some credit insurance policies have been arranged to hedge the risk of default on a portion of the past-due receivables that have not been provisioned. Also, guarantees have been provided that cover another portion of the debt due.
In order to mitigate credit risk arising from !nancial debt and cash positions, CEPSA only works with reputable and highly sol-vent Spanish and international !nancial institutions. An analysis is made of counterparty risk in investments and !nancial instru-ment contracts.
The breakdown of this analysis for the years 2020 and 2019, is as follows:
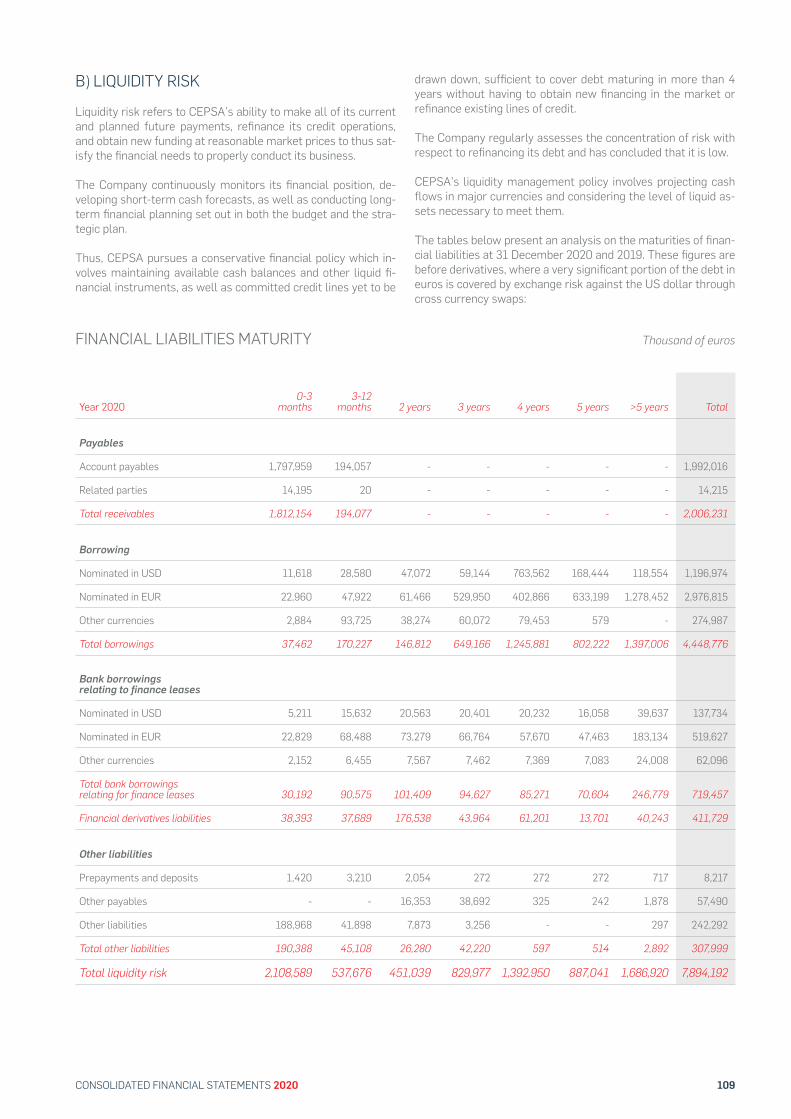
109CONSOLIDATED FINANCIAL STATEMENTS 2020
B) LIQUIDITY RISK
Liquidity risk refers to CEPSA’s ability to make all of its current and planned future payments, re!nance its credit operations, and obtain new funding at reasonable market prices to thus sat-isfy the !nancial needs to properly conduct its business.
The Company continuously monitors its !nancial position, de-veloping short-term cash forecasts, as well as conducting long-term !nancial planning set out in both the budget and the stra-tegic plan.
Thus, CEPSA pursues a conservative !nancial policy which in-volves maintaining available cash balances and other liquid !-nancial instruments, as well as committed credit lines yet to be
drawn down, suf!cient to cover debt maturing in more than 4 years without having to obtain new !nancing in the market or re!nance existing lines of credit.
The Company regularly assesses the concentration of risk with respect to re!nancing its debt and has concluded that it is low.
CEPSA’s liquidity management policy involves projecting cash "ows in major currencies and considering the level of liquid as-sets necessary to meet them.
The tables below present an analysis on the maturities of !nan-cial liabilities at 31 December 2020 and 2019. These !gures are before derivatives, where a very signi!cant portion of the debt in euros is covered by exchange risk against the US dollar through cross currency swaps:
FINANCIAL LIABILITIES MATURITY Thousand of euros
Year 20200-3
months3-12
months 2 years 3 years 4 years 5 years >5 years Total
Payables
Account payables 1,797,959 194,057 - - - - - 1,992,016
Related parties 14,195 20 - - - - - 14,215
Total receivables 1,812,154 194,077 - - - - - 2,006,231
Borrowing
Nominated in USD 11,618 28,580 47,072 59,144 763,562 168,444 118,554 1,196,974
Nominated in EUR 22,960 47,922 61,466 529,950 402,866 633,199 1,278,452 2,976,815
Other currencies 2,884 93,725 38,274 60,072 79,453 579 - 274,987
Total borrowings 37,462 170,227 146,812 649,166 1,245,881 802,222 1,397,006 4,448,776
Bank borrowings relating to finance leases
Nominated in USD 5,211 15,632 20,563 20,401 20,232 16,058 39,637 137,734
Nominated in EUR 22,829 68,488 73,279 66,764 57,670 47,463 183,134 519,627
Other currencies 2,152 6,455 7,567 7,462 7,369 7,083 24,008 62,096
Total bank borrowings relating for finance leases 30,192 90,575 101,409 94,627 85,271 70,604 246,779 719,457
Financial derivatives liabilities 38,393 37,689 176,538 43,964 61,201 13,701 40,243 411,729
Other liabilities
Prepayments and deposits 1,420 3,210 2,054 272 272 272 717 8,217
Other payables - - 16,353 38,692 325 242 1,878 57,490
Other liabilities 188,968 41,898 7,873 3,256 - - 297 242,292
Total other liabilities 190,388 45,108 26,280 42,220 597 514 2,892 307,999
Total liquidity risk 2,108,589 537,676 451,039 829,977 1,392,950 887,041 1,686,920 7,894,192

110 CEPSA GROUP
FINANCIAL LIABILITIES MATURITY Thousand of euros
Year 20190-3
months3-12
months 2 years 3 years 4 years 5 years >5 years Total
Payables
Account payables 2,628,145 250,093 - - - - - 2,878,238
Related parties 66,438 95 - - - - - 66,533
Total receivables 2,694,583 250,188 - - - - - 2,944,771
Borrowing
Nominated in USD 8,572 38,256 58,919 61,914 74,626 833,977 228,997 1,305,261
Nominated in EUR 5,088 35,001 26,569 29,028 27,040 873,273 913,322 1,909,321
Other currencies 22,687 95,653 39,906 38,388 36,888 81,738 818 316,078
Total borrowings 36,347 168,910 125,394 129,330 138,554 1,788,988 1,143,137 3,530,660
Bank borrowings relating to finance leases
Nominated in USD - 21,260 24,168 18,753 18,563 18,558 51,572 152,874
Nominated in EUR 41,453 62,401 81,656 78,574 61,455 60,651 243,640 629,830
Other currencies 134 9,176 9,529 7,798 8,099 8,184 37,924 80,844
Total bank borrowings relating for finance leases 41,587 92,837 115,353 105,125 88,117 87,393 333,136 863,548
Financial derivatives liabilities (23,195) (51,354) (32,364) (31,019) (28,246) (48,167) (13,923) (228,268)
Other liabilities
Prepayments and deposits 1,143 3,033 3,286 284 284 284 176 8,490
Other payables - - 53,020 242 242 242 1,773 55,519
Other liabilities 255,507 12,844 25,208 2,606 - - 412 296,577
Total other liabilities 256,650 15,877 81,514 3,132 526 526 2,361 360,586
Total liquidity risk 3,005,972 476,458 289,897 206,568 198,951 1,828,740 1,464,711 7,471,297
C) MARKET RISK
Market risk is the risk that the fair value of future cash "ows of a !nancial instrument will "uctuate because of changes in mar-ket prices. The Group is exposed to several types of market risk (price risk raw materials, exchange rate risk and interest rate risk) which may affect the Group’s !nancial results. The main market risks inherent to the oil sector result from "uctuations in crude oil prices, derivative prices, the re!ning margin and the exchange rate.
The Group monitors its exposure to market risk through ongoing sensitivity analyses. For each of the market risk factors detailed below, there is a table describing the sensitivity of Group pro!t and equity to the main risks to which its !nancial instruments are exposed.
The estimates made re"ect the impact of favourable and ad-verse changes. The impact on pro!t and/or equity is estimated on the basis of the !nancial instruments held by the Group at each year end.
Financial instruments affected by market risk include !nancial assets at fair value through pro!t or loss on the consolidated income statement (FVTPL), available-for-sale !nancial assets, derivative !nancial instruments, short-term deposits, borrow-ings, and certain other !nancial instruments.
I. Foreign currency risk
Foreign currency risk is the risk that the fair value or future cash "ows of a !nancial instrument will "uctuate because of changes in foreign exchange rates in which the company operates. The Company’s exposure to the risk of changes in foreign exchange rates relates primarily to the Company’s operating activities (when revenue or expense are denominated in a different cur-rency from the Company’s functional currency) and the transla-tion of foreign subsidiaries, both in the consolidated result and in their value of equity.
The Group’s pro!t and equity are exposed to "uctuations in the exchange rates of the currencies in which it does business. The Group’s most signi!cant foreign currency exposure is to the US
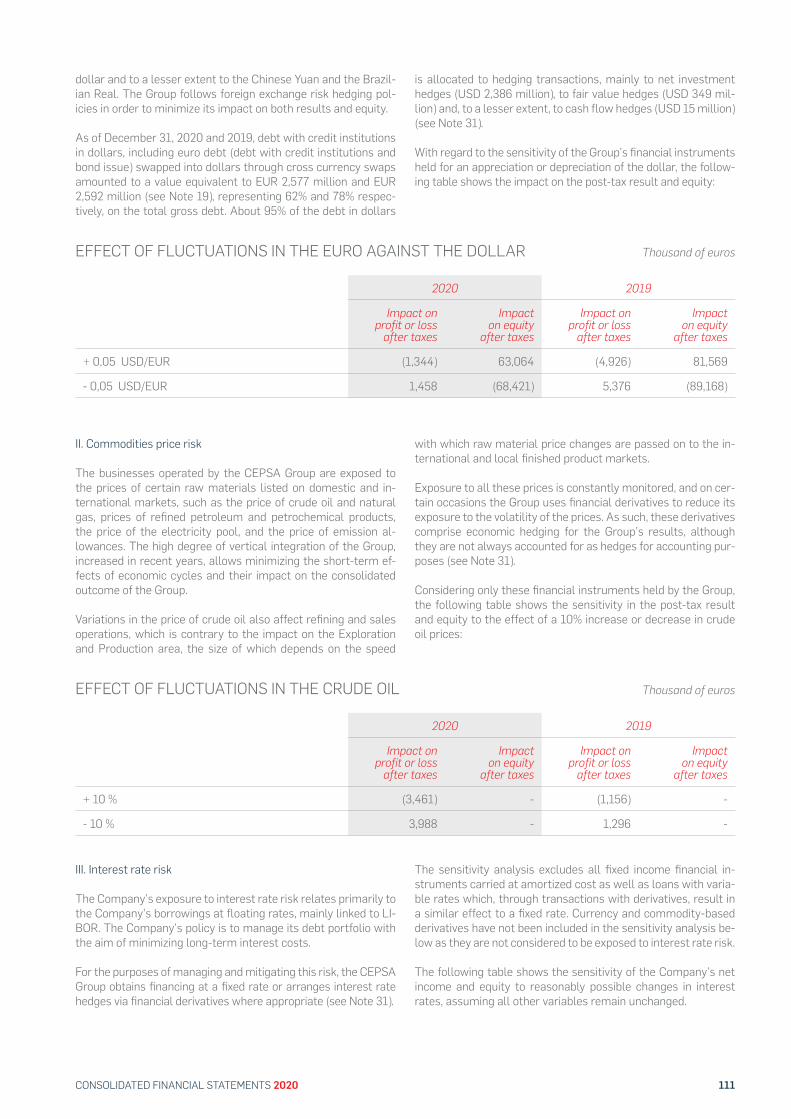
111CONSOLIDATED FINANCIAL STATEMENTS 2020
dollar and to a lesser extent to the Chinese Yuan and the Brazil-ian Real. The Group follows foreign exchange risk hedging pol-icies in order to minimize its impact on both results and equity.
As of December 31, 2020 and 2019, debt with credit institutions in dollars, including euro debt (debt with credit institutions and bond issue) swapped into dollars through cross currency swaps amounted to a value equivalent to EUR 2,577 million and EUR 2,592 million (see Note 19), representing 62% and 78% respec-tively, on the total gross debt. About 95% of the debt in dollars
is allocated to hedging transactions, mainly to net investment hedges (USD 2,386 million), to fair value hedges (USD 349 mil-lion) and, to a lesser extent, to cash "ow hedges (USD 15 million) (see Note 31).
With regard to the sensitivity of the Group’s !nancial instruments held for an appreciation or depreciation of the dollar, the follow-ing table shows the impact on the post-tax result and equity:
Thousand of euros
Thousand of euros
2020 2019
Impact on profit or loss
after taxes
Impact on equity
after taxes
Impact on profit or loss
after taxes
Impacton equity
after taxes
+ 0,05 USD/EUR (1,344) 63,064 (4,926) 81,569
- 0,05 USD/EUR 1,458 (68,421) 5,376 (89,168)
2020 2019
Impact on profit or loss
after taxes
Impact on equity
after taxes
Impact on profit or loss
after taxes
Impact on equity
after taxes
+ 10 % (3,461) - (1,156) -
- 10 % 3,988 - 1,296 -
EFFECT OF FLUCTUATIONS IN THE EURO AGAINST THE DOLLAR
EFFECT OF FLUCTUATIONS IN THE CRUDE OIL
II. Commodities price risk
The businesses operated by the CEPSA Group are exposed to the prices of certain raw materials listed on domestic and in-ternational markets, such as the price of crude oil and natural gas, prices of re!ned petroleum and petrochemical products, the price of the electricity pool, and the price of emission al-lowances. The high degree of vertical integration of the Group, increased in recent years, allows minimizing the short-term ef-fects of economic cycles and their impact on the consolidated outcome of the Group.
Variations in the price of crude oil also affect re!ning and sales operations, which is contrary to the impact on the Exploration and Production area, the size of which depends on the speed
with which raw material price changes are passed on to the in-ternational and local !nished product markets.
Exposure to all these prices is constantly monitored, and on cer-tain occasions the Group uses !nancial derivatives to reduce its exposure to the volatility of the prices. As such, these derivatives comprise economic hedging for the Group’s results, although they are not always accounted for as hedges for accounting pur-poses (see Note 31).
Considering only these !nancial instruments held by the Group, the following table shows the sensitivity in the post-tax result and equity to the effect of a 10% increase or decrease in crude oil prices:
III. Interest rate risk
The Company’s exposure to interest rate risk relates primarily to the Company’s borrowings at "oating rates, mainly linked to LI-BOR. The Company’s policy is to manage its debt portfolio with the aim of minimizing long-term interest costs.
For the purposes of managing and mitigating this risk, the CEPSA Group obtains !nancing at a !xed rate or arranges interest rate hedges via !nancial derivatives where appropriate (see Note 31).
The sensitivity analysis excludes all !xed income !nancial in-struments carried at amortized cost as well as loans with varia-ble rates which, through transactions with derivatives, result in a similar effect to a !xed rate. Currency and commodity-based derivatives have not been included in the sensitivity analysis be-low as they are not considered to be exposed to interest rate risk.
The following table shows the sensitivity of the Company’s net income and equity to reasonably possible changes in interest rates, assuming all other variables remain unchanged.
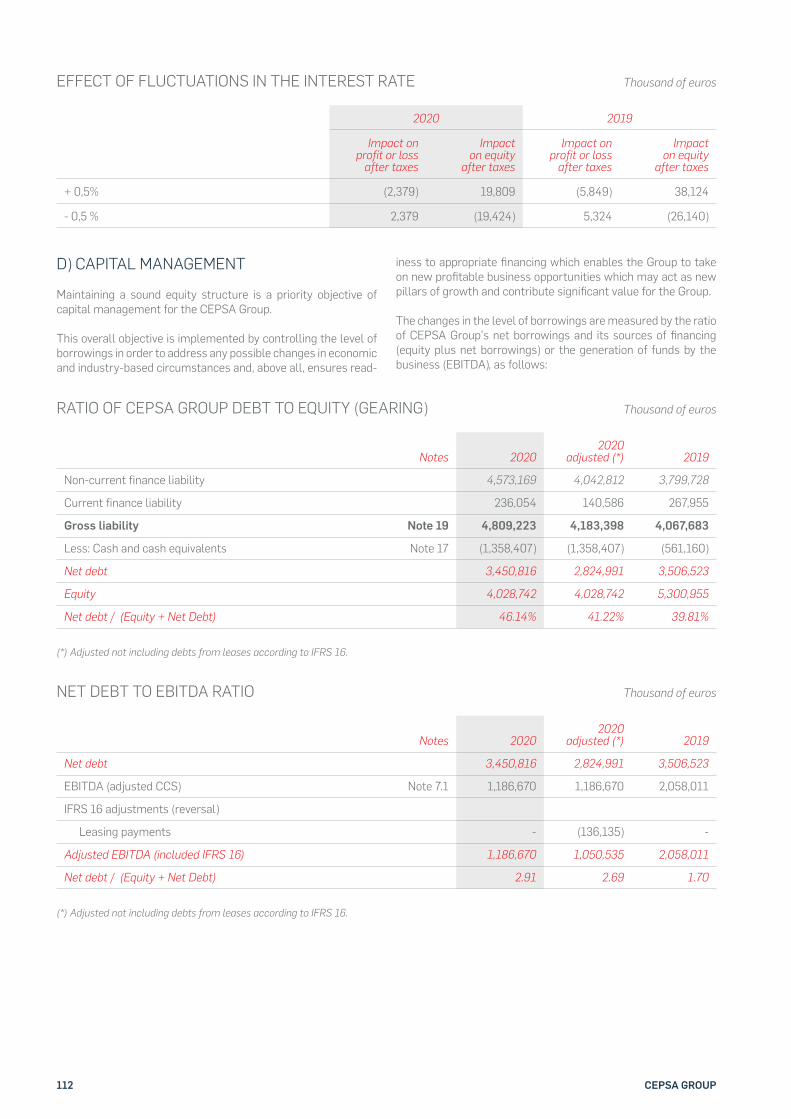
112 CEPSA GROUP
Thousand of euros
2020 2019
Impact on profit or loss
after taxes
Impact on equity
after taxes
Impact on profit or loss
after taxes
Impact on equity
after taxes
+ 0,5% (2,379) 19,809 (5,849) 38,124
- 0,5 % 2,379 (19,424) 5,324 (26,140)
EFFECT OF FLUCTUATIONS IN THE INTEREST RATE
D) CAPITAL MANAGEMENT
Maintaining a sound equity structure is a priority objective of capital management for the CEPSA Group.
This overall objective is implemented by controlling the level of borrowings in order to address any possible changes in economic and industry-based circumstances and, above all, ensures read-
iness to appropriate !nancing which enables the Group to take on new pro!table business opportunities which may act as new pillars of growth and contribute signi!cant value for the Group.
The changes in the level of borrowings are measured by the ratio of CEPSA Group’s net borrowings and its sources of !nancing (equity plus net borrowings) or the generation of funds by the business (EBITDA), as follows:
Notes 20202020
adjusted (*) 2019
Non-current finance liability 4,573,169 4,042,812 3,799,728
Current finance liability 236,054 140,586 267,955
Gross liability Note 19 4,809,223 4,183,398 4,067,683
Less: Cash and cash equivalents Note 17 (1,358,407) (1,358,407) (561,160)
Net debt 3,450,816 2,824,991 3,506,523
Equity 4,028,742 4,028,742 5,300,955
Net debt / (Equity + Net Debt) 46.14% 41.22% 39.81%
RATIO OF CEPSA GROUP DEBT TO EQUITY (GEARING) Thousand of euros
(*) Adjusted not including debts from leases according to IFRS 16.
(*) Adjusted not including debts from leases according to IFRS 16.
Notes 20202020
adjusted (*) 2019
Net debt 3,450,816 2,824,991 3,506,523
EBITDA (adjusted CCS) Note 7.1 1,186,670 1,186,670 2,058,011
IFRS 16 adjustments (reversal)
Leasing payments - (136,135) -
Adjusted EBITDA (included IFRS 16) 1,186,670 1,050,535 2,058,011
Net debt / (Equity + Net Debt) 2.91 2.69 1.70
NET DEBT TO EBITDA RATIO Thousand of euros
113CONSOLIDATED FINANCIAL STATEMENTS 2020
The Group performs an analysis of these ratios with leverage projections on a regular basis, an activity considered key to establishing an investment and dividend policy. Moderation in
investments, maintenance of income from ordinary activities, control of !xed costs, and limitation of the amount of dividends distributed represented a signi!cant reduction in debt.
114 CEPSA GROUP
31. FINANCIAL DERIVATIVES AND HEDGE OPERATIONS
• ACCOUNTING POLICIES
I. INITIAL RECOGNITION AND SUBSEQUENT MEASUREMENT
The CEPSA Group uses hedging and derivatives financial instruments, including most notably futures and swaps contracts with crude oil and product brokers, to hedge the price risks arising from the monthly purchases and sales of crude oil and oil-based products. The transaction limits and the hedging instruments are approved by Group man-agement and the monitoring process observes the separa-tion of the performance and control functions.
For foreign currency and interest rate risks, the transaction limits and hedging instruments (basically forward currency transactions and interest rate swaps) are also approved by Group management and the monitoring process observes the separation of the performance and control functions.
Such derivative financial instruments are initially recog-nized at fair value on the date on which a derivative con-tract is entered into and are subsequently remeasured at fair value at the reporting date. Derivatives are carried as financial assets when the fair value is positive and as finan-cial liabilities when the fair value is negative.
Profits or losses arising from changes in the fair value and settlement of those derivatives not designated as an accounting hedge as defined in IFRS 9 are directly attrib-uted to profit or loss and are shown in the Consolidated Statement of Income as financial income or expenses, as the case may be. Exceptionally, in the Trading segment and because of its activity, financial derivative trading is part of its operating income.
In the normal course of its operations the Group has for-ward sale and purchase contracts for oil and natural gas. These contracts are entered into and maintained to meet the procurement and delivery needs of these commodities in accordance with the periodic estimates for the purchase and sale of hydrocarbons. The contracts are monitored systematically and are adjusted as appropriate by physi-cal delivery. As a result, these contracts are considered for own use and therefore outside the scope of IFRS 9.
So far, the Group has used the extended use of fair value option for “own use” contracts since this option is not yet permitted according to Spanish GAAP.
As a part of the ordinary activity of the Trading segment, besides the supply of crude oil for the Group’s needs, pro-prietary trading activity is performed, in which some of the own-use supply contracts which allow trading with third parties are used. The value of purchase commitments that can be used for speculation purposes is not significant, as they are very short term contracts with market price ar-rangements.
II. HEDGE ACCOUNTING
At the inception of a hedge relationship, the Group formally designates and documents the hedge relationship to which it wishes to apply hedge accounting and the risk manage-ment objective and strategy for undertaking the hedge.
The documentation includes identification of the hedging instrument, the hedged item, the nature of the risk being hedged and how the Group will assess whether the hedg-ing relationship meets the hedge effectiveness require-ments (including the analysis of sources of hedge ineffec-tiveness and how the hedge ratio is determined). A hedging relationship qualifies for hedge accounting if it meets all of the following effectiveness requirements:
• There is an “economic relationship” between the hedged item and the hedging instrument.
• The effect of credit risk does not “dominate the value changes” that result from that economic relationship.
• The hedge ratio in relation to hedge is the same as that resulting from the amount of the item hedged that the entity actually hedges, and the amount of the hedge instrument that the entity actually uses to hedge that amount of the item hedged.
Hedges that meet the strict criteria for hedge accounting are accounted for, as described below:
Fair value hedges
Hedges for exposures to changes in the fair value of a recognized asset or liability, or unrecognized firm commit-ment attributable to a particular risk that could affect the Consolidated Income Statement. Changes in value of the hedging instrument and the hedged item attributable to the hedged risk are recognized in Profit or Loss.
Cash flow hedges
The Group uses forward currency contracts and other de-rivatives such as options to hedge its exposure to foreign currency risk in highly probable transactions. Likewise, to reduce the exposure to interest rate risk on its outstand-ing variable rate borrowings, the Group uses interest rate swaps.
The effective portion of the gain or loss on the hedging in-strument is recognized directly in OTHER COMPREHEN-SIVE INCOME, while the ineffective portion is recognized immediately in the Consolidated Income Statement, under FINANCIAL INCOME OR EXPENSE.
Amounts recognized as OTHER COMPREHENSIVE IN-COME are transferred to Consolidated Profit or Loss when the hedged transaction affects profit or loss. Both the hedge instrument and the hedged transaction are includ-ed under the same heading in the Consolidated Income Statement. If the hedging instrument expires or is sold,
115CONSOLIDATED FINANCIAL STATEMENTS 2020
terminated or exercised without replacement or rollover (as part of the hedging strategy), or if its designation as a hedge is revoked, or when the hedge no longer meets the criteria for hedge accounting, any cumulative gain or loss previously recognized in OTHER COMPREHENSIVE INCOME remains separately in EQUITY until the forecast transaction occurs or the firm commitment is met.
Net investment hedges
The Group uses both non-derivative liabilities (such as bank borrowing) and financial derivatives (mainly currency swaps) to hedge the exposure to changes in the EUR/USD rate of investments in the net assets of foreign operations whose functional currency is the USD.
Gains or losses on the hedging instrument relating to the ef-fective portion of the hedge are recognized in OTHER COM-PREHENSIVE INCOME while any gains or losses relating to the ineffective portion are recognized in the Consolidated Income Statement in FINANCIAL COSTS AND INCOME.
On disposal of the foreign operation, the cumulative value of any such gains or losses recorded in EQUITY is transferred to the Consolidated Income Statement.
Financial guarantee contracts
Financial guarantee contracts issued by the Group are those contracts that require a payment to be made to reimburse the holder for a loss it incurs because the specified debtor fails to make a payment when due in accordance with the terms of a debt instrument.
Financial guarantee contracts are recognized initially as a liability at fair value, adjusted for transaction costs that are directly attributable to the issuance of the guarantee. Subse-quently, the liability is measured at either the best estimate of the expenditure required to settle the present obligation at the reporting date or the amount initially recognized less accumulated amortization, whichever is higher.
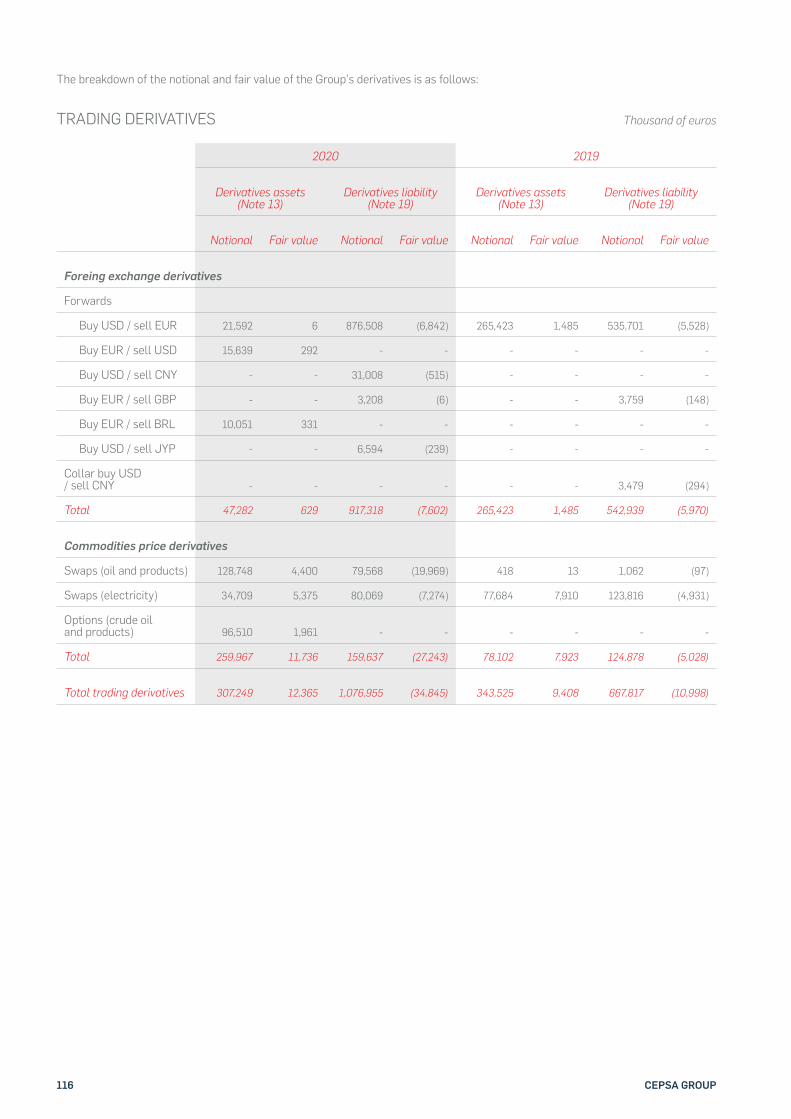
116 CEPSA GROUP
The breakdown of the notional and fair value of the Group’s derivatives is as follows:
2020 2019
Derivatives assets (Note 13)
Derivatives liability (Note 19)
Derivatives assets (Note 13)
Derivatives liability (Note 19)
Notional Fair value Notional Fair value Notional Fair value Notional Fair value
Foreing exchange derivatives
Forwards
Buy USD / sell EUR 21,592 6 876,508 (6,842) 265,423 1,485 535,701 (5,528)
Buy EUR / sell USD 15,639 292 - - - - - -
Buy USD / sell CNY - - 31,008 (515) - - - -
Buy EUR / sell GBP - - 3,208 (6) - - 3,759 (148)
Buy EUR / sell BRL 10,051 331 - - - - - -
Buy USD / sell JYP - - 6,594 (239) - - - -
Collar buy USD / sell CNY - - - - - - 3,479 (294)
Total 47,282 629 917,318 (7,602) 265,423 1,485 542,939 (5,970)
Commodities price derivatives
Swaps (oil and products) 128,748 4,400 79,568 (19,969) 418 13 1,062 (97)
Swaps (electricity) 34,709 5,375 80,069 (7,274) 77,684 7,910 123,816 (4,931)
Options (crude oil and products) 96,510 1,961 - - - - - -
Total 259,967 11,736 159,637 (27,243) 78,102 7,923 124,878 (5,028)
Total trading derivatives 307,249 12,365 1,076,955 (34,845) 343,525 9,408 667,817 (10,998)
TRADING DERIVATIVES Thousand of euros
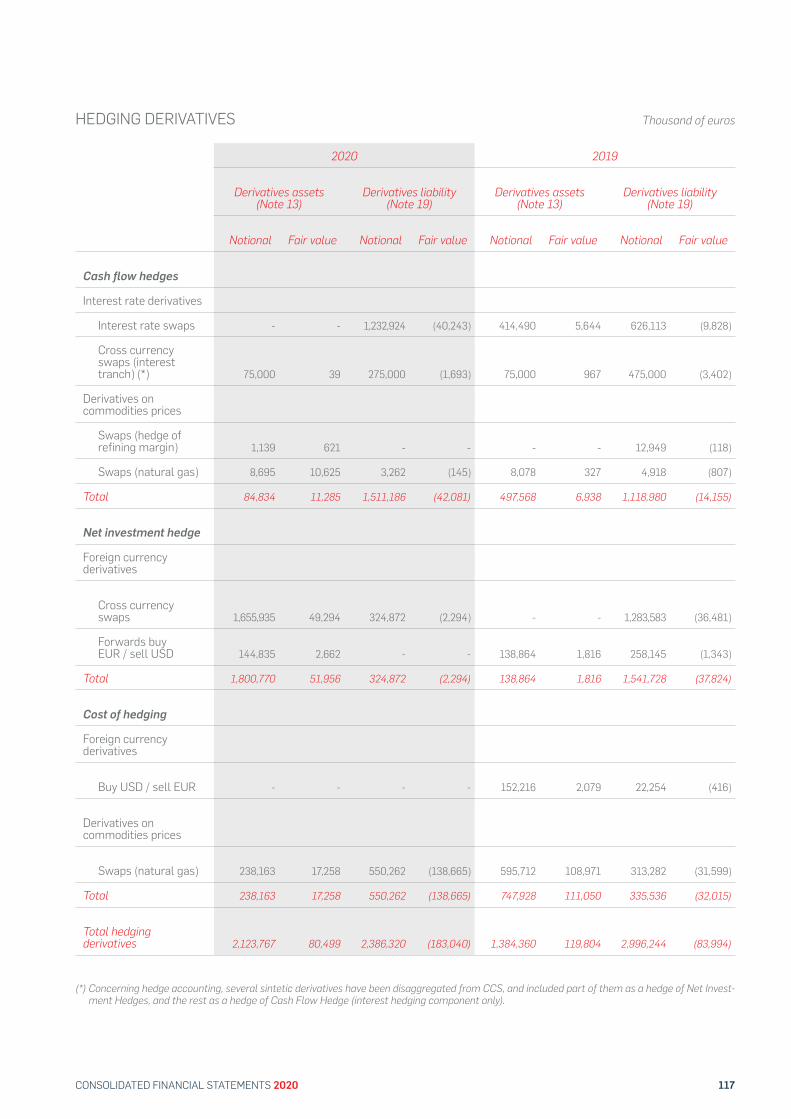
117CONSOLIDATED FINANCIAL STATEMENTS 2020
2020 2019
Derivatives assets (Note 13)
Derivatives liability (Note 19)
Derivatives assets (Note 13)
Derivatives liability (Note 19)
Notional Fair value Notional Fair value Notional Fair value Notional Fair value
Cash flow hedges
Interest rate derivatives
Interest rate swaps - - 1,232,924 (40,243) 414,490 5,644 626,113 (9,828)
Cross currency swaps (interest tranch) (*) 75,000 39 275,000 (1,693) 75,000 967 475,000 (3,402)
Derivatives on commodities prices
Swaps (hedge of refining margin) 1,139 621 - - - - 12,949 (118)
Swaps (natural gas) 8,695 10,625 3,262 (145) 8,078 327 4,918 (807)
Total 84,834 11,285 1,511,186 (42,081) 497,568 6,938 1,118,980 (14,155)
Net investment hedge
Foreign currency derivatives
Cross currency swaps 1,655,935 49,294 324,872 (2,294) - - 1,283,583 (36,481)
Forwards buy EUR / sell USD 144,835 2,662 - - 138,864 1,816 258,145 (1,343)
Total 1,800,770 51,956 324,872 (2,294) 138,864 1,816 1,541,728 (37,824)
Cost of hedging
Foreign currency derivatives
Buy USD / sell EUR - - - - 152,216 2,079 22,254 (416)
Derivatives on commodities prices
Swaps (natural gas) 238,163 17,258 550,262 (138,665) 595,712 108,971 313,282 (31,599)
Total 238,163 17,258 550,262 (138,665) 747,928 111,050 335,536 (32,015)
Total hedging derivatives 2,123,767 80,499 2,386,320 (183,040) 1,384,360 119,804 2,996,244 (83,994)
HEDGING DERIVATIVES Thousand of euros
(*) Concerning hedge accounting, several sintetic derivatives have been disaggregated from CCS, and included part of them as a hedge of Net Invest-ment Hedges, and the rest as a hedge of Cash Flow Hedge (interest hedging component only).
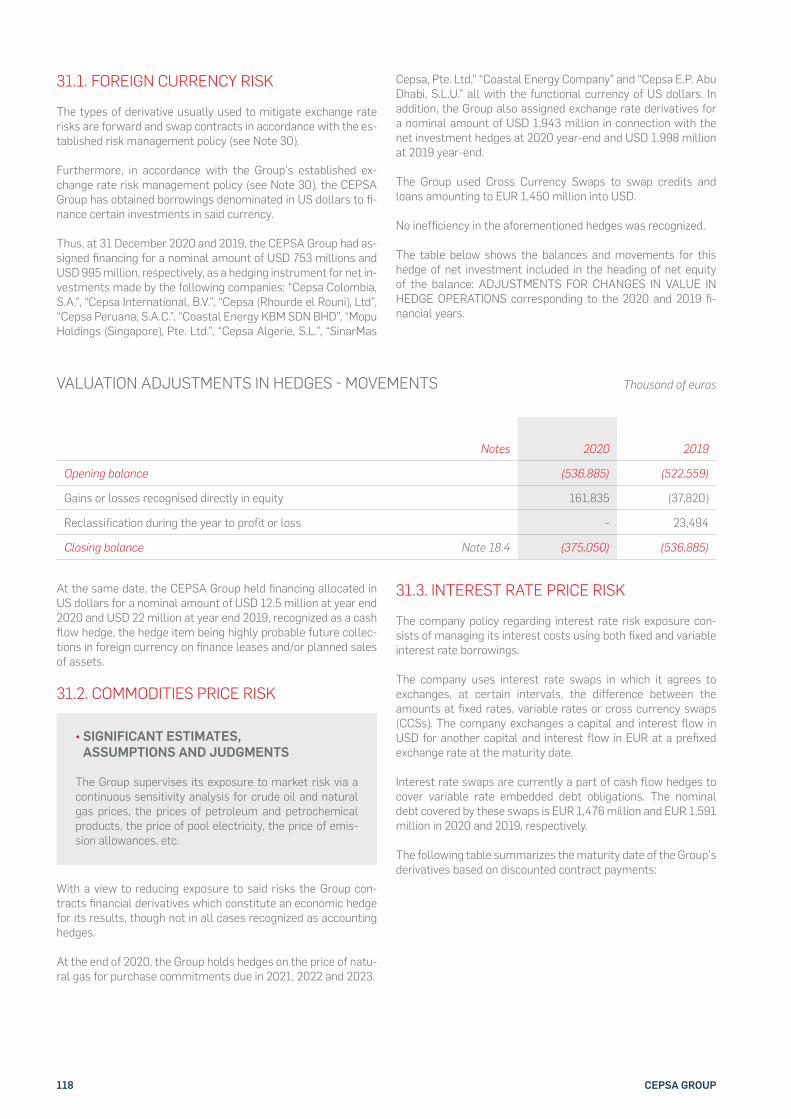
118 CEPSA GROUP
31.1. FOREIGN CURRENCY RISK
The types of derivative usually used to mitigate exchange rate risks are forward and swap contracts in accordance with the es-tablished risk management policy (see Note 30).
Furthermore, in accordance with the Group’s established ex-change rate risk management policy (see Note 30), the CEPSA Group has obtained borrowings denominated in US dollars to !-nance certain investments in said currency.
Thus, at 31 December 2020 and 2019, the CEPSA Group had as-signed !nancing for a nominal amount of USD 753 millions and USD 995 million, respectively, as a hedging instrument for net in-vestments made by the following companies: “Cepsa Colombia, S.A.”, “Cepsa International, B.V.”, “Cepsa (Rhourde el Rouni), Ltd”, “Cepsa Peruana, S.A.C.”, “Coastal Energy KBM SDN BHD”, “Mopu Holdings (Singapore), Pte. Ltd.”, “Cepsa Algerie, S.L.”, “SinarMas
Cepsa, Pte. Ltd,” “Coastal Energy Company” and “Cepsa E.P. Abu Dhabi, S.L.U.” all with the functional currency of US dollars. In addition, the Group also assigned exchange rate derivatives for a nominal amount of USD 1,943 million in connection with the net investment hedges at 2020 year-end and USD 1.998 million at 2019 year-end.
The Group used Cross Currency Swaps to swap credits and loans amounting to EUR 1,450 million into USD.
No inef!ciency in the aforementioned hedges was recognized.
The table below shows the balances and movements for this hedge of net investment included in the heading of net equity of the balance: ADJUSTMENTS FOR CHANGES IN VALUE IN HEDGE OPERATIONS corresponding to the 2020 and 2019 !-nancial years.
Thousand of euros
Notes 2020 2019
Opening balance (536,885) (522,559)
Gains or losses recognised directly in equity 161,835 (37,820)
Reclassification during the year to profit or loss - 23,494
Closing balance Note 18.4 (375,050) (536,885)
VALUATION ADJUSTMENTS IN HEDGES # MOVEMENTS
At the same date, the CEPSA Group held !nancing allocated in US dollars for a nominal amount of USD 12.5 million at year end 2020 and USD 22 million at year end 2019, recognized as a cash "ow hedge, the hedge item being highly probable future collec-tions in foreign currency on !nance leases and/or planned sales of assets.
31.2. COMMODITIES PRICE RISK
• SIGNIFICANT ESTIMATES, ASSUMPTIONS AND JUDGMENTS
The Group supervises its exposure to market risk via a continuous sensitivity analysis for crude oil and natural gas prices, the prices of petroleum and petrochemical products, the price of pool electricity, the price of emis-sion allowances, etc.
With a view to reducing exposure to said risks the Group con-tracts !nancial derivatives which constitute an economic hedge for its results, though not in all cases recognized as accounting hedges.
At the end of 2020, the Group holds hedges on the price of natu-ral gas for purchase commitments due in 2021, 2022 and 2023.
31.3. INTEREST RATE PRICE RISK
The company policy regarding interest rate risk exposure con-sists of managing its interest costs using both !xed and variable interest rate borrowings.
The company uses interest rate swaps in which it agrees to exchanges, at certain intervals, the difference between the amounts at !xed rates, variable rates or cross currency swaps (CCSs). The company exchanges a capital and interest "ow in USD for another capital and interest "ow in EUR at a pre!xed exchange rate at the maturity date.
Interest rate swaps are currently a part of cash "ow hedges to cover variable rate embedded debt obligations. The nominal debt covered by these swaps is EUR 1,476 million and EUR 1,591 million in 2020 and 2019, respectively.
The following table summarizes the maturity date of the Group’s derivatives based on discounted contract payments:
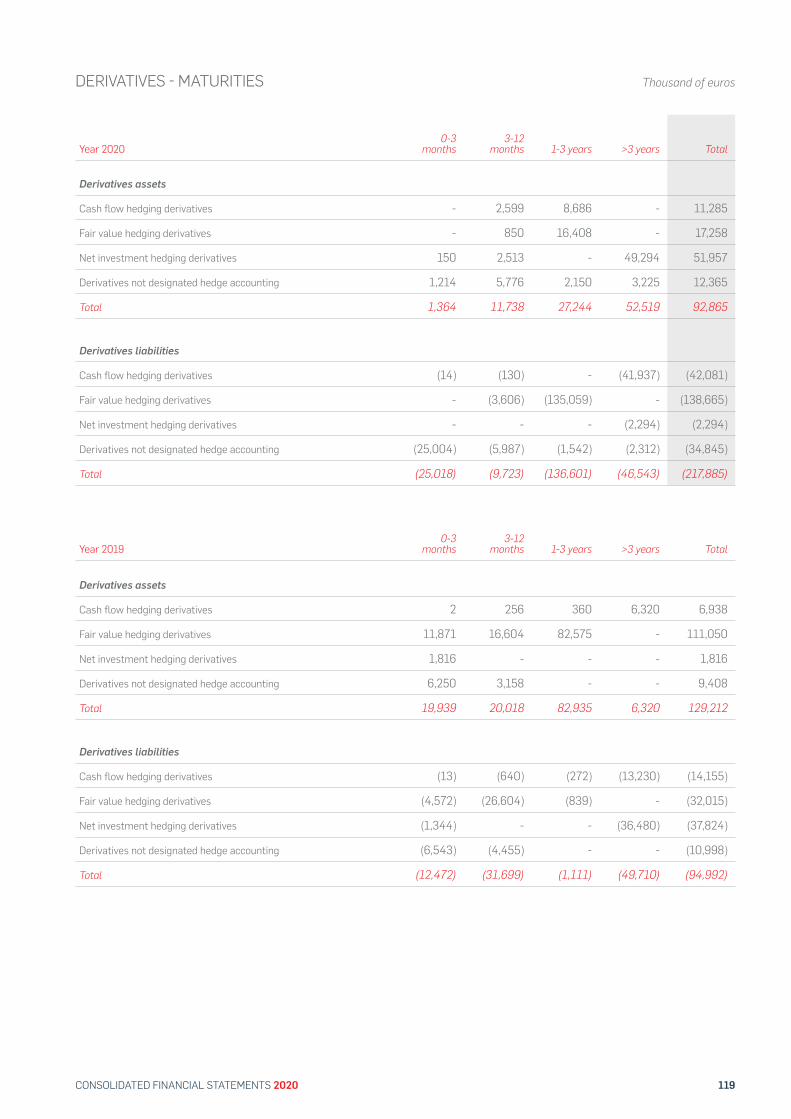
119CONSOLIDATED FINANCIAL STATEMENTS 2020
DERIVATIVES # MATURITIES Thousand of euros
Year 20200-3
months3-12
months 1-3 years >3 years Total
Derivatives assets
Cash flow hedging derivatives - 2,599 8,686 - 11,285
Fair value hedging derivatives - 850 16,408 - 17,258
Net investment hedging derivatives 150 2,513 - 49,294 51,957
Derivatives not designated hedge accounting 1,214 5,776 2,150 3,225 12,365
Total 1,364 11,738 27,244 52,519 92,865
Derivatives liabilities
Cash flow hedging derivatives (14) (130) - (41,937) (42,081)
Fair value hedging derivatives - (3,606) (135,059) - (138,665)
Net investment hedging derivatives - - - (2,294) (2,294)
Derivatives not designated hedge accounting (25,004) (5,987) (1,542) (2,312) (34,845)
Total (25,018) (9,723) (136,601) (46,543) (217,885)
Year 20190-3
months3-12
months 1-3 years >3 years Total
Derivatives assets
Cash flow hedging derivatives 2 256 360 6,320 6,938
Fair value hedging derivatives 11,871 16,604 82,575 - 111,050
Net investment hedging derivatives 1,816 - - - 1,816
Derivatives not designated hedge accounting 6,250 3,158 - - 9,408
Total 19,939 20,018 82,935 6,320 129,212
Derivatives liabilities
Cash flow hedging derivatives (13) (640) (272) (13,230) (14,155)
Fair value hedging derivatives (4,572) (26,604) (839) - (32,015)
Net investment hedging derivatives (1,344) - - (36,480) (37,824)
Derivatives not designated hedge accounting (6,543) (4,455) - - (10,998)
Total (12,472) (31,699) (1,111) (49,710) (94,992)
120 CEPSA GROUP
32. FAIR VALUE
• ACCOUNTING POLICIES
According to IFRS 13, the Group uses the following hier-archy for determining the fair value of derivative financial instruments and available for sale portfolio:
• 1: Quoted (unadjusted) market prices in active markets for identical assets or liabilities.
• 2: Valuation techniques for which the lowest level input that is significant to the fair value measurement is directly or indirectly observable.
• 3: Valuation techniques for which the lowest level input that is significant to the fair value measurement is unobservable.
Interest rate swaps, forward foreign exchange contracts, and term commodity contracts are valued using valuation techniques that use market observables such as exchange rates (cash and term), interest rate curves or term com-modity price curves.
With respect to a comparison of the carrying value and fair value of the Group’s !nancial assets and liabilities, Management con-siders that, except for !xed rate loans and the sub-portfolio of trade receivables subject to securitization, the fair value thereof is similar to the carrying value.
For the fair value of the !xed rate loans, the cash "ow discount rate is used. The fair value of the only !xed rate loan at 2020 year-end amounts to EUR 112.9 million, while the carrying value totals EUR 111.6 million (see Note 16).
Regarding the outstanding bonds issued at a !xed rate, the fair value at 31 December 2020 is EUR 1,516.9 million, while their book value amounts to EUR 1,500 million (see Note 19).
At 31 December 2020, the company’s own credit risk is consi- dered insigni!cant.
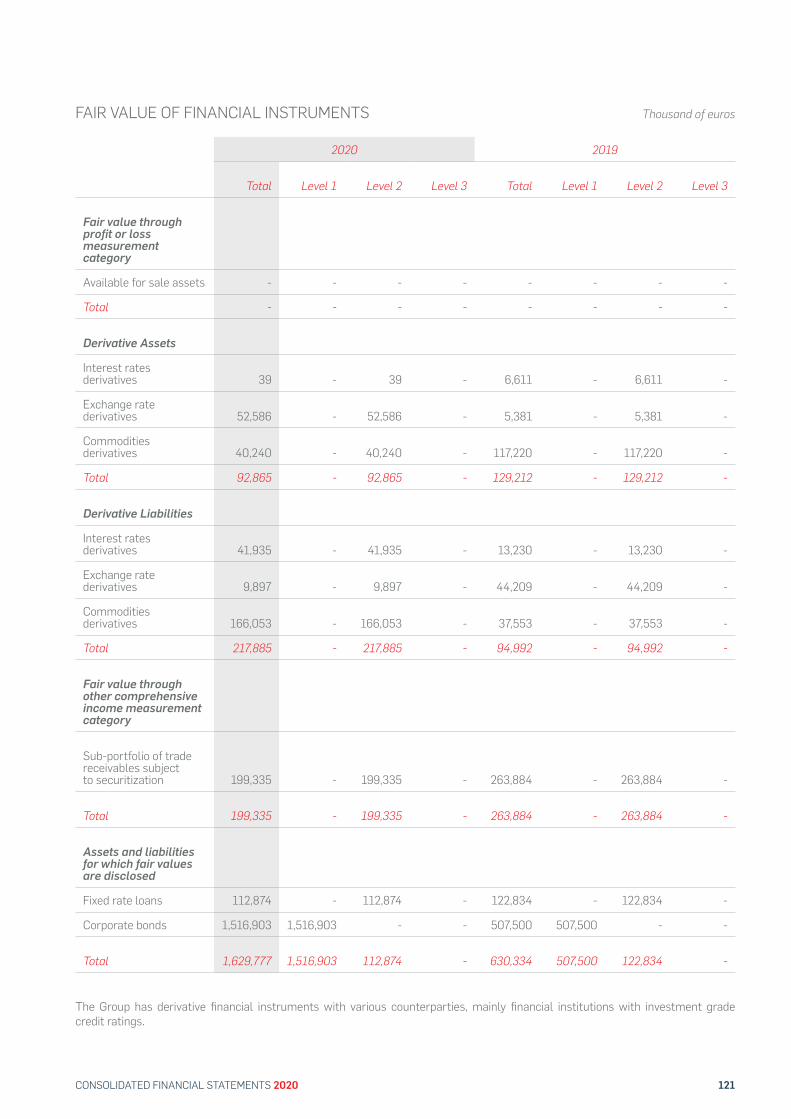
121CONSOLIDATED FINANCIAL STATEMENTS 2020
2020 2019
Total Level 1 Level 2 Level 3 Total Level 1 Level 2 Level 3
Fair value through profit or loss measurement category
Available for sale assets - - - - - - - -
Total - - - - - - - -
Derivative Assets
Interest rates derivatives 39 - 39 - 6,611 - 6,611 -
Exchange rate derivatives 52,586 - 52,586 - 5,381 - 5,381 -
Commodities derivatives 40,240 - 40,240 - 117,220 - 117,220 -
Total 92,865 - 92,865 - 129,212 - 129,212 -
Derivative Liabilities
Interest rates derivatives 41,935 - 41,935 - 13,230 - 13,230 -
Exchange rate derivatives 9,897 - 9,897 - 44,209 - 44,209 -
Commodities derivatives 166,053 - 166,053 - 37,553 - 37,553 -
Total 217,885 - 217,885 - 94,992 - 94,992 -
Fair value through other comprehensive income measurement category
Sub-portfolio of trade receivables subject to securitization 199,335 - 199,335 - 263,884 - 263,884 -
Total 199,335 - 199,335 - 263,884 - 263,884 -
Assets and liabilities for which fair values are disclosed
Fixed rate loans 112,874 - 112,874 - 122,834 - 122,834 -
Corporate bonds 1,516,903 1,516,903 - - 507,500 507,500 - -
Total 1,629,777 1,516,903 112,874 - 630,334 507,500 122,834 -
FAIR VALUE OF FINANCIAL INSTRUMENTS Thousand of euros
The Group has derivative !nancial instruments with various counterparties, mainly !nancial institutions with investment grade credit ratings.
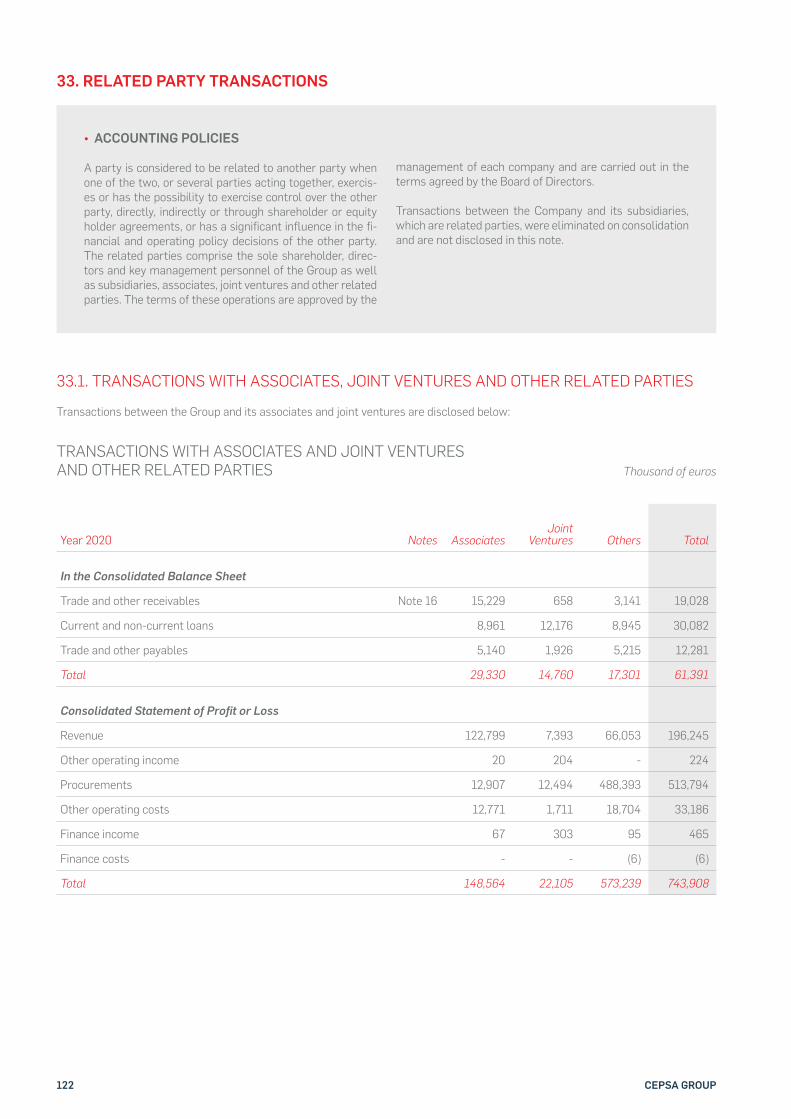
122 CEPSA GROUP
33. RELATED PARTY TRANSACTIONS
• ACCOUNTING POLICIES
A party is considered to be related to another party when one of the two, or several parties acting together, exercis-es or has the possibility to exercise control over the other party, directly, indirectly or through shareholder or equity holder agreements, or has a significant influence in the fi-nancial and operating policy decisions of the other party. The related parties comprise the sole shareholder, direc-tors and key management personnel of the Group as well as subsidiaries, associates, joint ventures and other related parties. The terms of these operations are approved by the
management of each company and are carried out in the terms agreed by the Board of Directors.
Transactions between the Company and its subsidiaries, which are related parties, were eliminated on consolidation and are not disclosed in this note.
TRANSACTIONS WITH ASSOCIATES AND JOINT VENTURES AND OTHER RELATED PARTIES Thousand of euros
Year 2020 Notes AssociatesJoint
Ventures Others Total
In the Consolidated Balance Sheet
Trade and other receivables Note 16 15,229 658 3,141 19,028
Current and non-current loans 8,961 12,176 8,945 30,082
Trade and other payables 5,140 1,926 5,215 12,281
Total 29,330 14,760 17,301 61,391
Consolidated Statement of Profit or Loss
Revenue 122,799 7,393 66,053 196,245
Other operating income 20 204 - 224
Procurements 12,907 12,494 488,393 513,794
Other operating costs 12,771 1,711 18,704 33,186
Finance income 67 303 95 465
Finance costs - - (6) (6)
Total 148,564 22,105 573,239 743,908
33.1. TRANSACTIONS WITH ASSOCIATES, JOINT VENTURES AND OTHER RELATED PARTIES
Transactions between the Group and its associates and joint ventures are disclosed below:
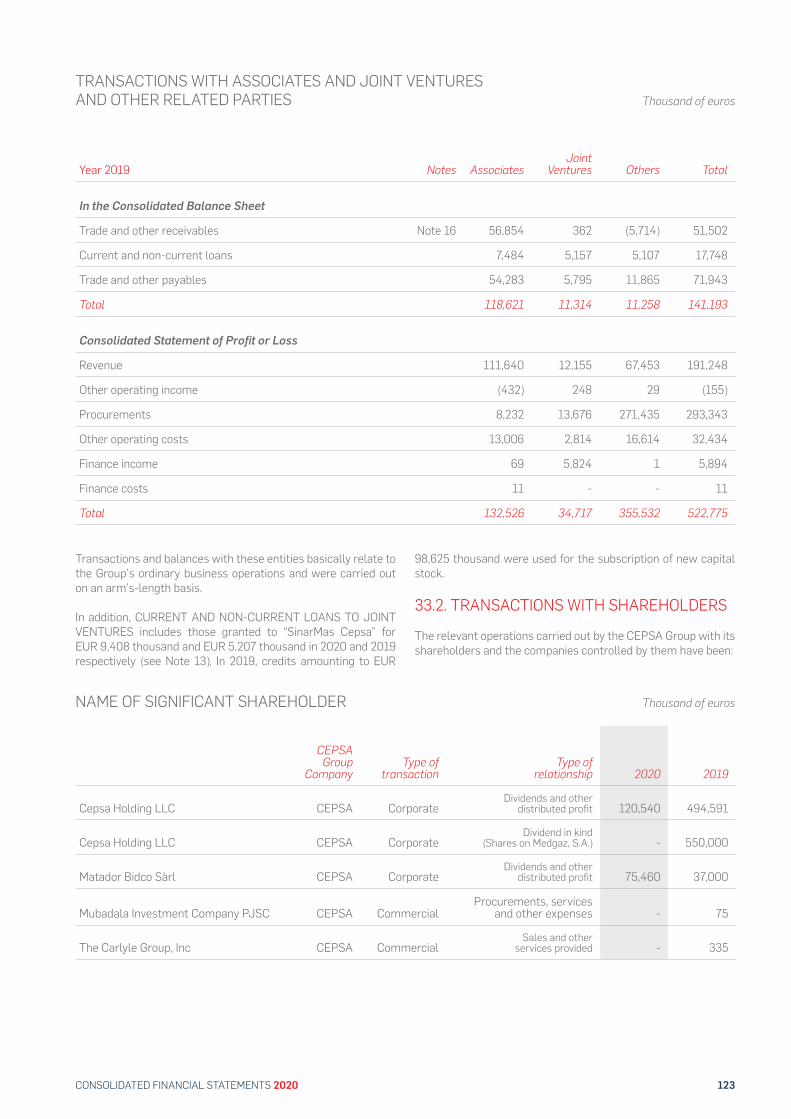
123CONSOLIDATED FINANCIAL STATEMENTS 2020
Year 2019 Notes AssociatesJoint
Ventures Others Total
In the Consolidated Balance Sheet
Trade and other receivables Note 16 56,854 362 (5,714) 51,502
Current and non-current loans 7,484 5,157 5,107 17,748
Trade and other payables 54,283 5,795 11,865 71,943
Total 118,621 11,314 11,258 141,193
Consolidated Statement of Profit or Loss
Revenue 111,640 12,155 67,453 191,248
Other operating income (432) 248 29 (155)
Procurements 8,232 13,676 271,435 293,343
Other operating costs 13,006 2,814 16,614 32,434
Finance income 69 5,824 1 5,894
Finance costs 11 - - 11
Total 132,526 34,717 355,532 522,775
Transactions and balances with these entities basically relate to the Group’s ordinary business operations and were carried out on an arm’s-length basis.
In addition, CURRENT AND NON-CURRENT LOANS TO JOINT VENTURES includes those granted to “SinarMas Cepsa” for EUR 9,408 thousand and EUR 5,207 thousand in 2020 and 2019 respectively (see Note 13). In 2019, credits amounting to EUR
98,625 thousand were used for the subscription of new capital stock.
33.2. TRANSACTIONS WITH SHAREHOLDERS
The relevant operations carried out by the CEPSA Group with its shareholders and the companies controlled by them have been:
NAME OF SIGNIFICANT SHAREHOLDER Thousand of euros
CEPSA Group
CompanyType of
transactionType of
relationship 2020 2019
Cepsa Holding LLC CEPSA CorporateDividends and other
distributed profit 120,540 494,591
Cepsa Holding LLC CEPSA CorporateDividend in kind
(Shares on Medgaz, S.A.) - 550,000
Matador Bidco Sàrl CEPSA CorporateDividends and other
distributed profit 75,460 37,000
Mubadala Investment Company PJSC CEPSA CommercialProcurements, services
and other expenses - 75
The Carlyle Group, Inc CEPSA CommercialSales and other
services provided - 335
TRANSACTIONS WITH ASSOCIATES AND JOINT VENTURES AND OTHER RELATED PARTIES Thousand of euros
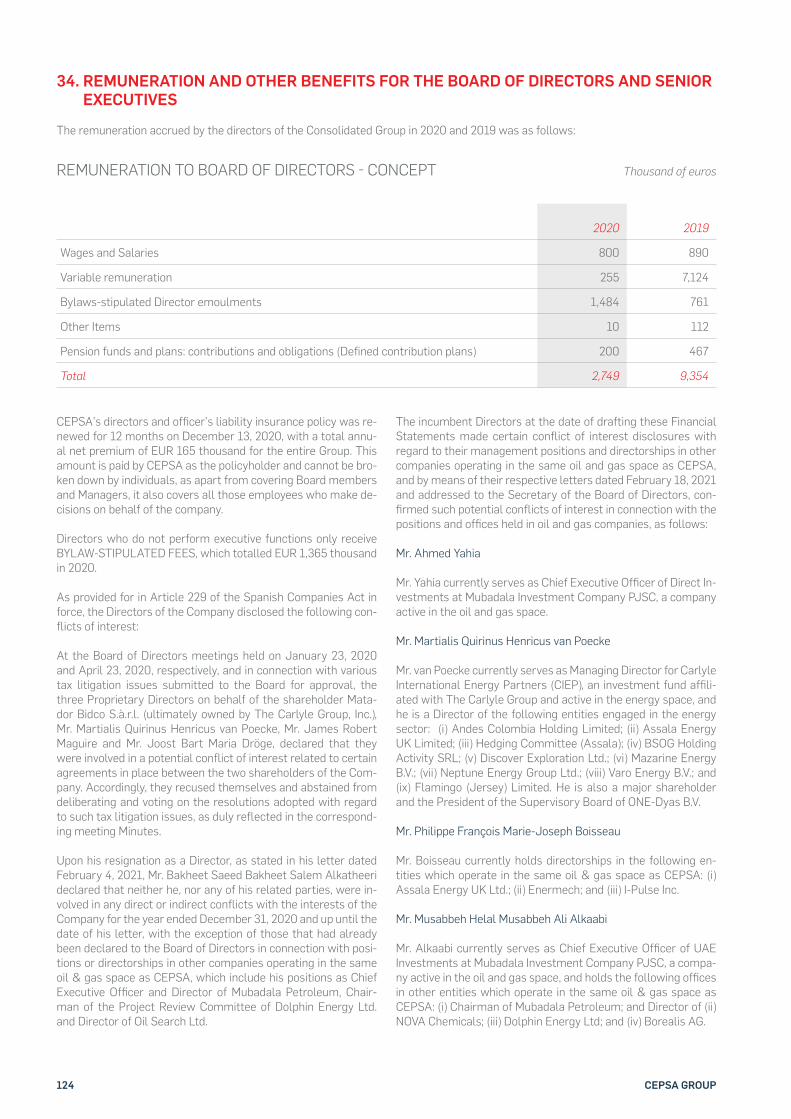
124 CEPSA GROUP
34. REMUNERATION AND OTHER BENEFITS FOR THE BOARD OF DIRECTORS AND SENIOR EXECUTIVES
The remuneration accrued by the directors of the Consolidated Group in 2020 and 2019 was as follows:
REMUNERATION TO BOARD OF DIRECTORS # CONCEPT Thousand of euros
2020 2019
Wages and Salaries 800 890
Variable remuneration 255 7,124
Bylaws-stipulated Director emoulments 1,484 761
Other Items 10 112
Pension funds and plans: contributions and obligations (Defined contribution plans) 200 467
Total 2,749 9,354
CEPSA’s directors and of!cer’s liability insurance policy was re-newed for 12 months on December 13, 2020, with a total annu-al net premium of EUR 165 thousand for the entire Group. This amount is paid by CEPSA as the policyholder and cannot be bro-ken down by individuals, as apart from covering Board members and Managers, it also covers all those employees who make de-cisions on behalf of the company.
Directors who do not perform executive functions only receive BYLAW-STIPULATED FEES, which totalled EUR 1,365 thousand in 2020.
As provided for in Article 229 of the Spanish Companies Act in force, the Directors of the Company disclosed the following con-"icts of interest:
At the Board of Directors meetings held on January 23, 2020 and April 23, 2020, respectively, and in connection with various tax litigation issues submitted to the Board for approval, the three Proprietary Directors on behalf of the shareholder Mata-dor Bidco S.à.r.l. (ultimately owned by The Carlyle Group, Inc.), Mr. Martialis Quirinus Henricus van Poecke, Mr. James Robert Maguire and Mr. Joost Bart Maria Dröge, declared that they were involved in a potential con"ict of interest related to certain agreements in place between the two shareholders of the Com-pany. Accordingly, they recused themselves and abstained from deliberating and voting on the resolutions adopted with regard to such tax litigation issues, as duly re"ected in the correspond-ing meeting Minutes.
Upon his resignation as a Director, as stated in his letter dated February 4, 2021, Mr. Bakheet Saeed Bakheet Salem Alkatheeri declared that neither he, nor any of his related parties, were in-volved in any direct or indirect con"icts with the interests of the Company for the year ended December 31, 2020 and up until the date of his letter, with the exception of those that had already been declared to the Board of Directors in connection with posi-tions or directorships in other companies operating in the same oil & gas space as CEPSA, which include his positions as Chief Executive Of!cer and Director of Mubadala Petroleum, Chair-man of the Project Review Committee of Dolphin Energy Ltd. and Director of Oil Search Ltd.
The incumbent Directors at the date of drafting these Financial Statements made certain con"ict of interest disclosures with regard to their management positions and directorships in other companies operating in the same oil and gas space as CEPSA, and by means of their respective letters dated February 18, 2021 and addressed to the Secretary of the Board of Directors, con-!rmed such potential con"icts of interest in connection with the positions and of!ces held in oil and gas companies, as follows:
Mr. Ahmed Yahia
Mr. Yahia currently serves as Chief Executive Of!cer of Direct In-vestments at Mubadala Investment Company PJSC, a company active in the oil and gas space.
Mr. Martialis Quirinus Henricus van Poecke
Mr. van Poecke currently serves as Managing Director for Carlyle International Energy Partners (CIEP), an investment fund af!li-ated with The Carlyle Group and active in the energy space, and he is a Director of the following entities engaged in the energy sector: (i) Andes Colombia Holding Limited; (ii) Assala Energy UK Limited; (iii) Hedging Committee (Assala); (iv) BSOG Holding Activity SRL; (v) Discover Exploration Ltd.; (vi) Mazarine Energy B.V.; (vii) Neptune Energy Group Ltd.; (viii) Varo Energy B.V.; and (ix) Flamingo (Jersey) Limited. He is also a major shareholder and the President of the Supervisory Board of ONE-Dyas B.V.
Mr. Philippe François Marie-Joseph Boisseau
Mr. Boisseau currently holds directorships in the following en-tities which operate in the same oil & gas space as CEPSA: (i) Assala Energy UK Ltd.; (ii) Enermech; and (iii) I-Pulse Inc.
Mr. Musabbeh Helal Musabbeh Ali Alkaabi
Mr. Alkaabi currently serves as Chief Executive Of!cer of UAE Investments at Mubadala Investment Company PJSC, a compa-ny active in the oil and gas space, and holds the following of!ces in other entities which operate in the same oil & gas space as CEPSA: (i) Chairman of Mubadala Petroleum; and Director of (ii) NOVA Chemicals; (iii) Dolphin Energy Ltd; and (iv) Borealis AG.
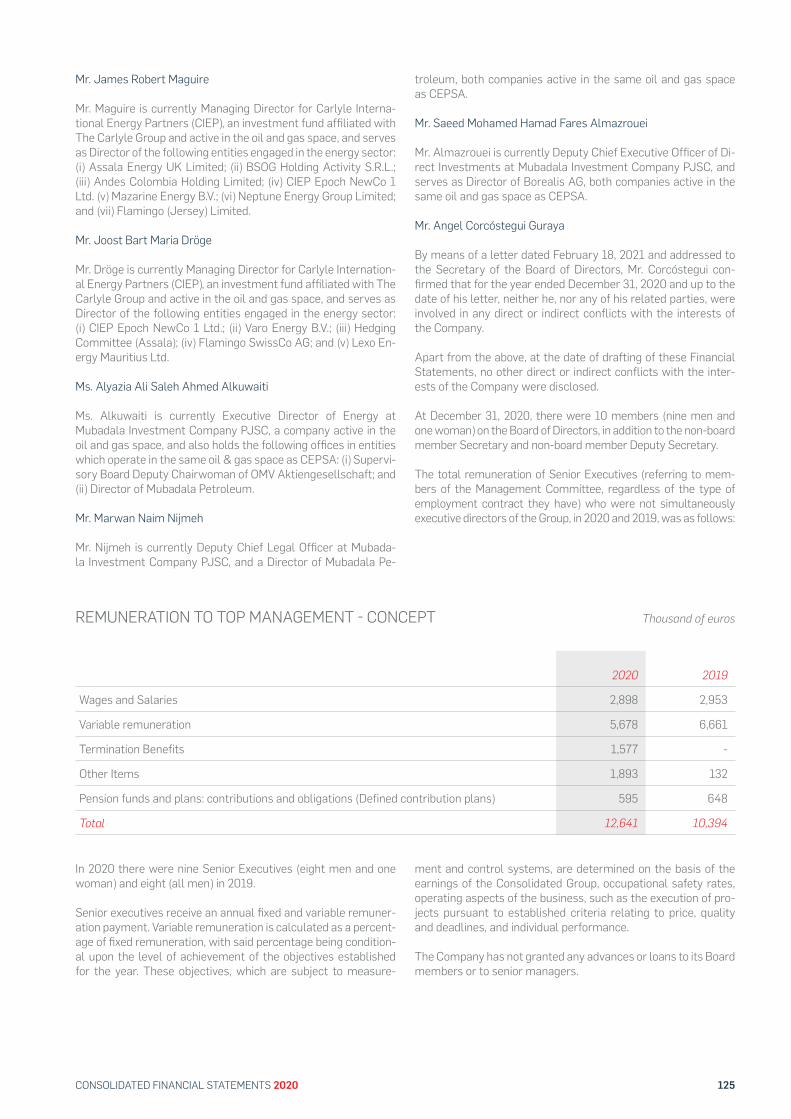
125CONSOLIDATED FINANCIAL STATEMENTS 2020
Mr. James Robert Maguire
Mr. Maguire is currently Managing Director for Carlyle Interna-tional Energy Partners (CIEP), an investment fund af!liated with The Carlyle Group and active in the oil and gas space, and serves as Director of the following entities engaged in the energy sector: (i) Assala Energy UK Limited; (ii) BSOG Holding Activity S.R.L.; (iii) Andes Colombia Holding Limited; (iv) CIEP Epoch NewCo 1 Ltd. (v) Mazarine Energy B.V.; (vi) Neptune Energy Group Limited; and (vii) Flamingo (Jersey) Limited.
Mr. Joost Bart Maria Dröge
Mr. Dröge is currently Managing Director for Carlyle Internation-al Energy Partners (CIEP), an investment fund af!liated with The Carlyle Group and active in the oil and gas space, and serves as Director of the following entities engaged in the energy sector: (i) CIEP Epoch NewCo 1 Ltd.; (ii) Varo Energy B.V.; (iii) Hedging Committee (Assala); (iv) Flamingo SwissCo AG; and (v) Lexo En-ergy Mauritius Ltd.
Ms. Alyazia Ali Saleh Ahmed Alkuwaiti
Ms. Alkuwaiti is currently Executive Director of Energy at Mubadala Investment Company PJSC, a company active in the oil and gas space, and also holds the following of!ces in entities which operate in the same oil & gas space as CEPSA: (i) Supervi-sory Board Deputy Chairwoman of OMV Aktiengesellschaft; and (ii) Director of Mubadala Petroleum.
Mr. Marwan Naim Nijmeh
Mr. Nijmeh is currently Deputy Chief Legal Of!cer at Mubada-la Investment Company PJSC, and a Director of Mubadala Pe-
troleum, both companies active in the same oil and gas space as CEPSA.
Mr. Saeed Mohamed Hamad Fares Almazrouei
Mr. Almazrouei is currently Deputy Chief Executive Of!cer of Di-rect Investments at Mubadala Investment Company PJSC, and serves as Director of Borealis AG, both companies active in the same oil and gas space as CEPSA.
Mr. Angel Corcóstegui Guraya
By means of a letter dated February 18, 2021 and addressed to the Secretary of the Board of Directors, Mr. Corcóstegui con-!rmed that for the year ended December 31, 2020 and up to the date of his letter, neither he, nor any of his related parties, were involved in any direct or indirect con"icts with the interests of the Company.
Apart from the above, at the date of drafting of these Financial Statements, no other direct or indirect con"icts with the inter-ests of the Company were disclosed. At December 31, 2020, there were 10 members (nine men and one woman) on the Board of Directors, in addition to the non-board member Secretary and non-board member Deputy Secretary.
The total remuneration of Senior Executives (referring to mem-bers of the Management Committee, regardless of the type of employment contract they have) who were not simultaneously executive directors of the Group, in 2020 and 2019, was as follows:
REMUNERATION TO TOP MANAGEMENT # CONCEPT Thousand of euros
2020 2019
Wages and Salaries 2,898 2,953
Variable remuneration 5,678 6,661
Termination Benefits 1,577 -
Other Items 1,893 132
Pension funds and plans: contributions and obligations (Defined contribution plans) 595 648
Total 12,641 10,394
In 2020 there were nine Senior Executives (eight men and one woman) and eight (all men) in 2019.
Senior executives receive an annual !xed and variable remuner-ation payment. Variable remuneration is calculated as a percent-age of !xed remuneration, with said percentage being condition-al upon the level of achievement of the objectives established for the year. These objectives, which are subject to measure-
ment and control systems, are determined on the basis of the earnings of the Consolidated Group, occupational safety rates, operating aspects of the business, such as the execution of pro-jects pursuant to established criteria relating to price, quality and deadlines, and individual performance.
The Company has not granted any advances or loans to its Board members or to senior managers.
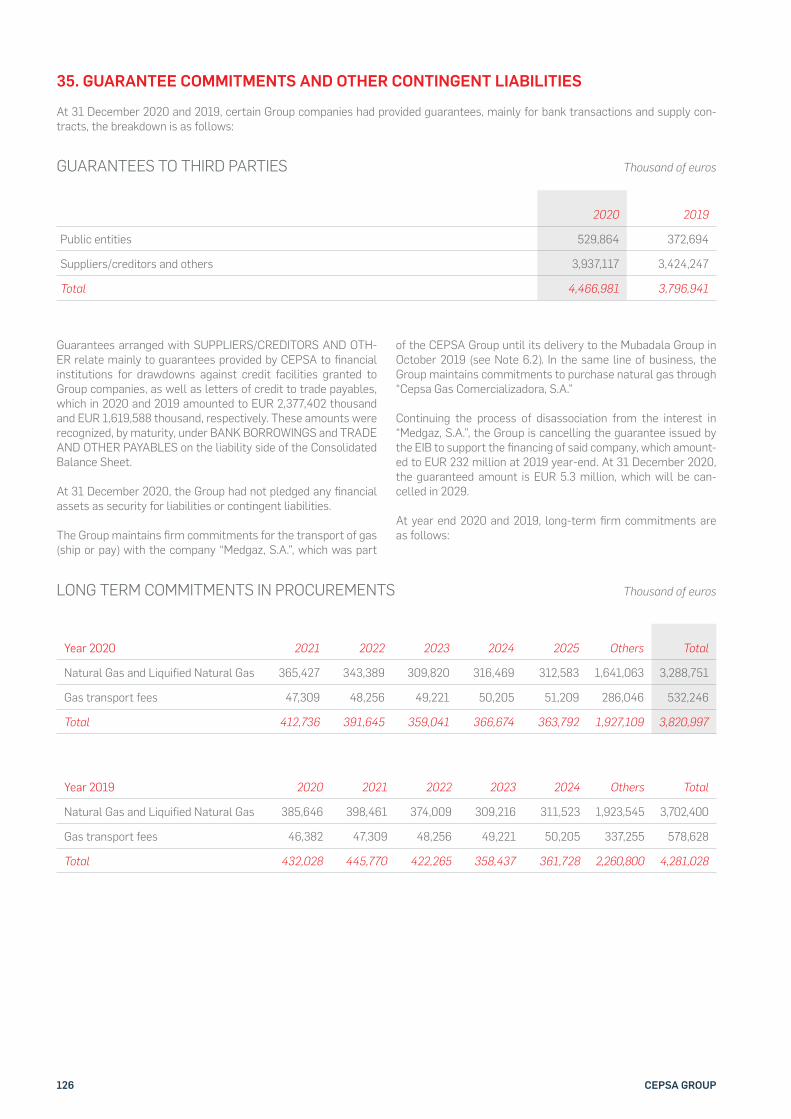
126 CEPSA GROUP
35. GUARANTEE COMMITMENTS AND OTHER CONTINGENT LIABILITIES
At 31 December 2020 and 2019, certain Group companies had provided guarantees, mainly for bank transactions and supply con-tracts, the breakdown is as follows:
GUARANTEES TO THIRD PARTIES Thousand of euros
2020 2019
Public entities 529,864 372,694
Suppliers/creditors and others 3,937,117 3,424,247
Total 4,466,981 3,796,941
Guarantees arranged with SUPPLIERS/CREDITORS AND OTH-ER relate mainly to guarantees provided by CEPSA to !nancial institutions for drawdowns against credit facilities granted to Group companies, as well as letters of credit to trade payables, which in 2020 and 2019 amounted to EUR 2,377,402 thousand and EUR 1,619,588 thousand, respectively. These amounts were recognized, by maturity, under BANK BORROWINGS and TRADE AND OTHER PAYABLES on the liability side of the Consolidated Balance Sheet.
At 31 December 2020, the Group had not pledged any !nancial assets as security for liabilities or contingent liabilities.
The Group maintains !rm commitments for the transport of gas (ship or pay) with the company “Medgaz, S.A.”, which was part
of the CEPSA Group until its delivery to the Mubadala Group in October 2019 (see Note 6.2). In the same line of business, the Group maintains commitments to purchase natural gas through “Cepsa Gas Comercializadora, S.A.”
Continuing the process of disassociation from the interest in “Medgaz, S.A.”, the Group is cancelling the guarantee issued by the EIB to support the !nancing of said company, which amount-ed to EUR 232 million at 2019 year-end. At 31 December 2020, the guaranteed amount is EUR 5.3 million, which will be can-celled in 2029.
At year end 2020 and 2019, long-term !rm commitments are as follows:
LONG TERM COMMITMENTS IN PROCUREMENTS Thousand of euros
Year 2020 2021 2022 2023 2024 2025 Others Total
Natural Gas and Liquified Natural Gas 365,427 343,389 309,820 316,469 312,583 1,641,063 3,288,751
Gas transport fees 47,309 48,256 49,221 50,205 51,209 286,046 532,246
Total 412,736 391,645 359,041 366,674 363,792 1,927,109 3,820,997
Year 2019 2020 2021 2022 2023 2024 Others Total
Natural Gas and Liquified Natural Gas 385,646 398,461 374,009 309,216 311,523 1,923,545 3,702,400
Gas transport fees 46,382 47,309 48,256 49,221 50,205 337,255 578,628
Total 432,028 445,770 422,265 358,437 361,728 2,260,800 4,281,028

127CONSOLIDATED FINANCIAL STATEMENTS 2020
These commitments were quanti!ed using estimates based on Brent Crude forward curves valid at year end 2020 and 2019, re-spectively, which is the main benchmark price of these contracts
36. EVENTS AFTER THE REPORTING PERIOD
In the !rst few months of 2021, the group reached an agree-ment with the trading company GEO Alternativa, S.L. to transfer customers (approximately 75,000 contracts) with electricity, natural gas, and associated maintenance services contracts. An advance was collected in December 2020 to strengthen the transaction.
In January 2021, the worsening of the COVID-19 pandemic caused more stringent measures limiting mobility, which caused the Company to apply a second temporary labour force adjust-ment plan limited to service station employees.
On February 4, 2021, the Extraordinary General Shareholders’ Meeting accepted the resignation tendered by Mr. Bakheet Saeed Bakheet Salem Alkatheeri as a member of the Board of Directors, thanking him for his distinguished service and wise counsel. To !ll the vacant seat on the Board, Mr. Ahmed Yahia was appointed as a Director of the Company, for a six-year term of of!ce.
At its meeting held on February 4, 2021, the Board of Directors accepted the resignation tendered by Mr. Musabbeh Helal Mus-abbeh Ali Alkaabi as Chairman of the Board, acknowledging its deepest gratitude to Mr. Alkaabi for his tireless commitment and contributions to the Company throughout his term. To succeed him, the Director, Mr. Ahmed Yahia, was appointed as the new Chairman. Notwithstanding, Mr. Alkaabi will continue to serve as a member of the Board of Directors.
At the date of issuing of these Consolidated Financial State-ments, there have been no more signi!cant subsequent events to be mentioned in this section.
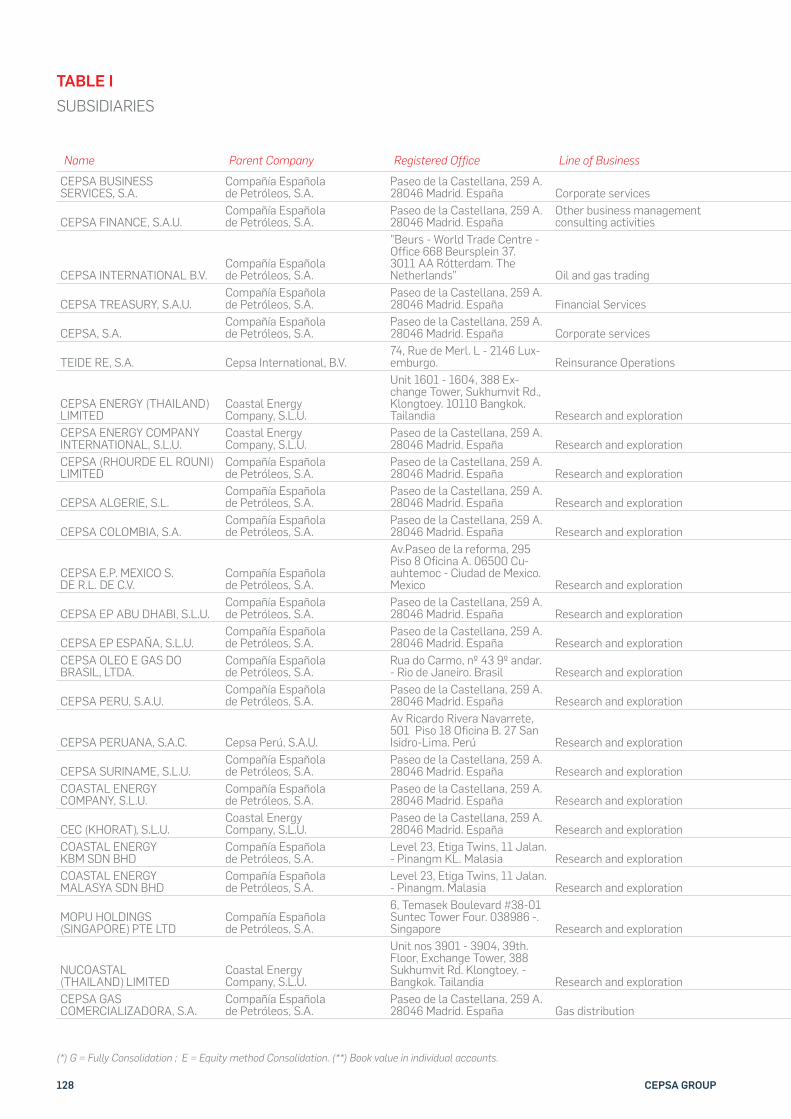
128 CEPSA GROUP
TABLE I
Ownership Equity
Name Parent Company Registered Office Line of Business 2020 2019
Share Capital
Subscribed
Share Capital
PaidReserves +
Net Profit
Net Cost of Investment
(**)
Conso-lidation
Method (*)Fiscal Group
CEPSA BUSINESS SERVICES, S.A.
Compañía Española de Petróleos, S.A.
Paseo de la Castellana, 259 A. 28046 Madrid. España Corporate services 100% 100% 60 60 589 2,810 G Yes
CEPSA FINANCE, S.A.U.Compañía Española de Petróleos, S.A.
Paseo de la Castellana, 259 A. 28046 Madrid. España
Other business management consulting activities 100% 100% 100 100 161 100 G Yes
CEPSA INTERNATIONAL B.V.Compañía Española de Petróleos, S.A.
"Beurs - World Trade Centre - Office 668 Beursplein 37. 3011 AA Rótterdam. The Netherlands” Oil and gas trading 100% 100% 3,515 3,515 80,205 106,824 G No
CEPSA TREASURY, S.A.U.Compañía Española de Petróleos, S.A.
Paseo de la Castellana, 259 A. 28046 Madrid. España Financial Services 100% 100% 60 60 1,540 60 G Yes
CEPSA, S.A.Compañía Española de Petróleos, S.A.
Paseo de la Castellana, 259 A. 28046 Madrid. España Corporate services 100% 100% 61 61 1,370 61 G Yes
TEIDE RE, S.A. Cepsa International, B.V.74, Rue de Merl. L - 2146 Lux-emburgo. Reinsurance Operations 100% 100% 2,725 2,725 37,722 2,725 G No
CEPSA ENERGY (THAILAND) LIMITED
Coastal Energy Company, S.L.U.
Unit 1601 - 1604, 388 Ex-change Tower, Sukhumvit Rd., Klongtoey. 10110 Bangkok. Tailandia Research and exploration 100% 100% 2,149 2,149 2,184 2,805 G No
CEPSA ENERGY COMPANY INTERNATIONAL, S.L.U.
Coastal Energy Company, S.L.U.
Paseo de la Castellana, 259 A. 28046 Madrid. España Research and exploration 100% 100% 45 45 (235,158) (202,395) G Yes
CEPSA (RHOURDE EL ROUNI) LIMITED
Compañía Española de Petróleos, S.A.
Paseo de la Castellana, 259 A. 28046 Madrid. España Research and exploration 100% 100% 100,791 100,791 84,907 145,673 G Yes
CEPSA ALGERIE, S.L.Compañía Española de Petróleos, S.A.
Paseo de la Castellana, 259 A. 28046 Madrid. España Research and exploration 100% 100% 37 37 214,498 265,462 G Yes
CEPSA COLOMBIA, S.A.Compañía Española de Petróleos, S.A.
Paseo de la Castellana, 259 A. 28046 Madrid. España Research and exploration 100% 100% 24,109 24,109 (48,962) 87,544 G Yes
CEPSA E.P. MEXICO S. DE R.L. DE C.V.
Compañía Española de Petróleos, S.A.
Av.Paseo de la reforma, 295 Piso 8 Oficina A. 06500 Cu-auhtemoc - Ciudad de Mexico. Mexico Research and exploration 100% 100% 6,147 6,147 (4,679) 1,445 G No
CEPSA EP ABU DHABI, S.L.U.Compañía Española de Petróleos, S.A.
Paseo de la Castellana, 259 A. 28046 Madrid. España Research and exploration 100% 100% 3 3 1,329,939 1,349,444 G Yes
CEPSA EP ESPAÑA, S.L.U.Compañía Española de Petróleos, S.A.
Paseo de la Castellana, 259 A. 28046 Madrid. España Research and exploration 100% 100% 100 100 (1,071) - G No
CEPSA OLEO E GAS DO BRASIL, LTDA.
Compañía Española de Petróleos, S.A.
Rua do Carmo, nº 43 9º andar. - Rio de Janeiro. Brasil Research and exploration 100% 100% 57,103 57,103 (33,578) 10,680 G No
CEPSA PERU, S.A.U.Compañía Española de Petróleos, S.A.
Paseo de la Castellana, 259 A. 28046 Madrid. España Research and exploration 100% 100% 60 60 77,024 86,831 G Yes
CEPSA PERUANA, S.A.C. Cepsa Perú, S.A.U.
Av Ricardo Rivera Navarrete, 501 Piso 18 Oficina B. 27 San Isidro-Lima. Perú Research and exploration 100% 100% 78,428 78,428 (43,987) 64,730 G No
CEPSA SURINAME, S.L.U.Compañía Española de Petróleos, S.A.
Paseo de la Castellana, 259 A. 28046 Madrid. España Research and exploration 100% 100% 23,706 23,706 10,377 34,661 G Yes
COASTAL ENERGY COMPANY, S.L.U.
Compañía Española de Petróleos, S.A.
Paseo de la Castellana, 259 A. 28046 Madrid. España Research and exploration 100% 100% 37 37 (277,585) 45,493 G Yes
CEC (KHORAT), S.L.U.Coastal Energy Company, S.L.U.
Paseo de la Castellana, 259 A. 28046 Madrid. España Research and exploration 100% 100% 46 46 (14,069) (24,598) G No
COASTAL ENERGY KBM SDN BHD
Compañía Española de Petróleos, S.A.
Level 23, Etiga Twins, 11 Jalan. - Pinangm KL. Malasia Research and exploration 70% 70% 4,926 4,926 2,420 4,986 G No
COASTAL ENERGY MALASYA SDN BHD
Compañía Española de Petróleos, S.A.
Level 23, Etiga Twins, 11 Jalan. - Pinangm. Malasia Research and exploration 100% 100% 22,596 22,596 (20,937) - G No
MOPU HOLDINGS (SINGAPORE) PTE LTD
Compañía Española de Petróleos, S.A.
6, Temasek Boulevard #38-01 Suntec Tower Four. 038986 -. Singapore Research and exploration 100% 100% 56,345 56,345 (7,261) 119,548 G No
NUCOASTAL (THAILAND) LIMITED
Coastal Energy Company, S.L.U.
Unit nos 3901 - 3904, 39th. Floor, Exchange Tower, 388 Sukhumvit Rd. Klongtoey. - Bangkok. Tailandia Research and exploration 100% 100% 1,730 1,730 (33,902) (5,304) G No
CEPSA GAS COMERCIALIZADORA, S.A.
Compañía Española de Petróleos, S.A.
Paseo de la Castellana, 259 A. 28046 Madrid. España Gas distribution 70% 70% 3,060 3,060 (24,541) - G No
SUBSIDIARIES
(*) G = Fully Consolidation ; E = Equity method Consolidation. (**) Book value in individual accounts.
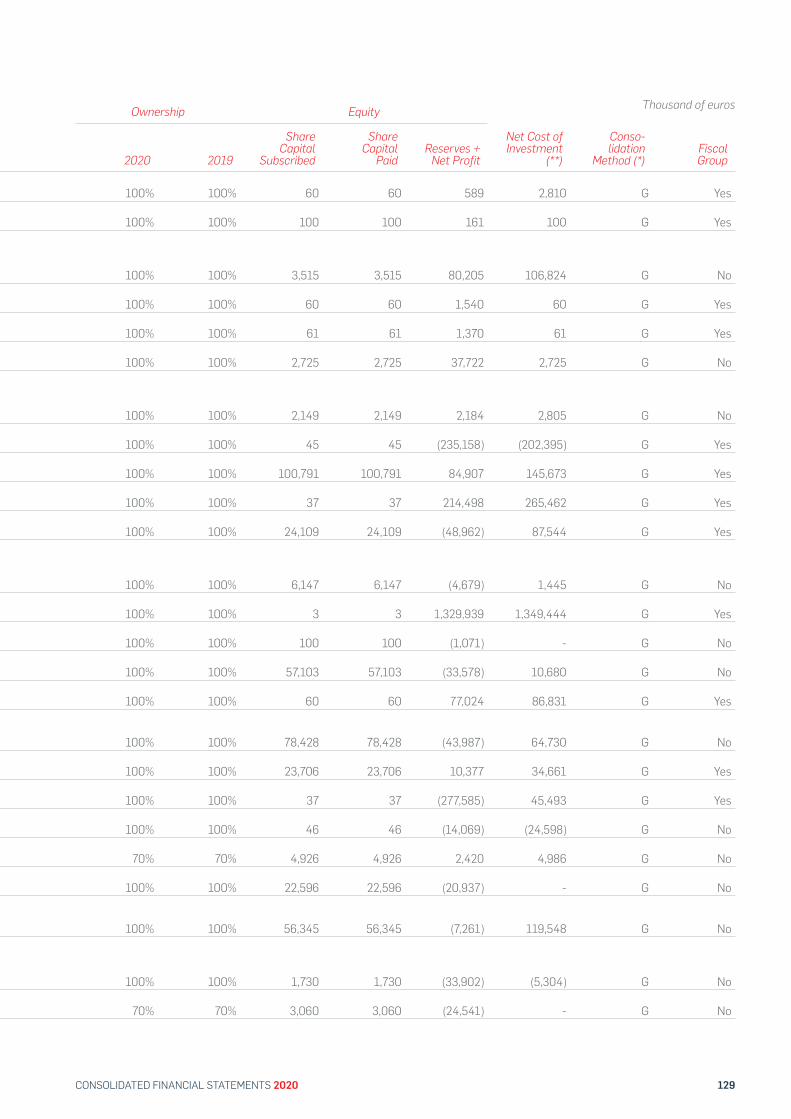
129CONSOLIDATED FINANCIAL STATEMENTS 2020
Ownership Equity
Name Parent Company Registered Office Line of Business 2020 2019
Share Capital
Subscribed
Share Capital
PaidReserves +
Net Profit
Net Cost of Investment
(**)
Conso-lidation
Method (*)Fiscal Group
CEPSA BUSINESS SERVICES, S.A.
Compañía Española de Petróleos, S.A.
Paseo de la Castellana, 259 A. 28046 Madrid. España Corporate services 100% 100% 60 60 589 2,810 G Yes
CEPSA FINANCE, S.A.U.Compañía Española de Petróleos, S.A.
Paseo de la Castellana, 259 A. 28046 Madrid. España
Other business management consulting activities 100% 100% 100 100 161 100 G Yes
CEPSA INTERNATIONAL B.V.Compañía Española de Petróleos, S.A.
"Beurs - World Trade Centre - Office 668 Beursplein 37. 3011 AA Rótterdam. The Netherlands” Oil and gas trading 100% 100% 3,515 3,515 80,205 106,824 G No
CEPSA TREASURY, S.A.U.Compañía Española de Petróleos, S.A.
Paseo de la Castellana, 259 A. 28046 Madrid. España Financial Services 100% 100% 60 60 1,540 60 G Yes
CEPSA, S.A.Compañía Española de Petróleos, S.A.
Paseo de la Castellana, 259 A. 28046 Madrid. España Corporate services 100% 100% 61 61 1,370 61 G Yes
TEIDE RE, S.A. Cepsa International, B.V.74, Rue de Merl. L - 2146 Lux-emburgo. Reinsurance Operations 100% 100% 2,725 2,725 37,722 2,725 G No
CEPSA ENERGY (THAILAND) LIMITED
Coastal Energy Company, S.L.U.
Unit 1601 - 1604, 388 Ex-change Tower, Sukhumvit Rd., Klongtoey. 10110 Bangkok. Tailandia Research and exploration 100% 100% 2,149 2,149 2,184 2,805 G No
CEPSA ENERGY COMPANY INTERNATIONAL, S.L.U.
Coastal Energy Company, S.L.U.
Paseo de la Castellana, 259 A. 28046 Madrid. España Research and exploration 100% 100% 45 45 (235,158) (202,395) G Yes
CEPSA (RHOURDE EL ROUNI) LIMITED
Compañía Española de Petróleos, S.A.
Paseo de la Castellana, 259 A. 28046 Madrid. España Research and exploration 100% 100% 100,791 100,791 84,907 145,673 G Yes
CEPSA ALGERIE, S.L.Compañía Española de Petróleos, S.A.
Paseo de la Castellana, 259 A. 28046 Madrid. España Research and exploration 100% 100% 37 37 214,498 265,462 G Yes
CEPSA COLOMBIA, S.A.Compañía Española de Petróleos, S.A.
Paseo de la Castellana, 259 A. 28046 Madrid. España Research and exploration 100% 100% 24,109 24,109 (48,962) 87,544 G Yes
CEPSA E.P. MEXICO S. DE R.L. DE C.V.
Compañía Española de Petróleos, S.A.
Av.Paseo de la reforma, 295 Piso 8 Oficina A. 06500 Cu-auhtemoc - Ciudad de Mexico. Mexico Research and exploration 100% 100% 6,147 6,147 (4,679) 1,445 G No
CEPSA EP ABU DHABI, S.L.U.Compañía Española de Petróleos, S.A.
Paseo de la Castellana, 259 A. 28046 Madrid. España Research and exploration 100% 100% 3 3 1,329,939 1,349,444 G Yes
CEPSA EP ESPAÑA, S.L.U.Compañía Española de Petróleos, S.A.
Paseo de la Castellana, 259 A. 28046 Madrid. España Research and exploration 100% 100% 100 100 (1,071) - G No
CEPSA OLEO E GAS DO BRASIL, LTDA.
Compañía Española de Petróleos, S.A.
Rua do Carmo, nº 43 9º andar. - Rio de Janeiro. Brasil Research and exploration 100% 100% 57,103 57,103 (33,578) 10,680 G No
CEPSA PERU, S.A.U.Compañía Española de Petróleos, S.A.
Paseo de la Castellana, 259 A. 28046 Madrid. España Research and exploration 100% 100% 60 60 77,024 86,831 G Yes
CEPSA PERUANA, S.A.C. Cepsa Perú, S.A.U.
Av Ricardo Rivera Navarrete, 501 Piso 18 Oficina B. 27 San Isidro-Lima. Perú Research and exploration 100% 100% 78,428 78,428 (43,987) 64,730 G No
CEPSA SURINAME, S.L.U.Compañía Española de Petróleos, S.A.
Paseo de la Castellana, 259 A. 28046 Madrid. España Research and exploration 100% 100% 23,706 23,706 10,377 34,661 G Yes
COASTAL ENERGY COMPANY, S.L.U.
Compañía Española de Petróleos, S.A.
Paseo de la Castellana, 259 A. 28046 Madrid. España Research and exploration 100% 100% 37 37 (277,585) 45,493 G Yes
CEC (KHORAT), S.L.U.Coastal Energy Company, S.L.U.
Paseo de la Castellana, 259 A. 28046 Madrid. España Research and exploration 100% 100% 46 46 (14,069) (24,598) G No
COASTAL ENERGY KBM SDN BHD
Compañía Española de Petróleos, S.A.
Level 23, Etiga Twins, 11 Jalan. - Pinangm KL. Malasia Research and exploration 70% 70% 4,926 4,926 2,420 4,986 G No
COASTAL ENERGY MALASYA SDN BHD
Compañía Española de Petróleos, S.A.
Level 23, Etiga Twins, 11 Jalan. - Pinangm. Malasia Research and exploration 100% 100% 22,596 22,596 (20,937) - G No
MOPU HOLDINGS (SINGAPORE) PTE LTD
Compañía Española de Petróleos, S.A.
6, Temasek Boulevard #38-01 Suntec Tower Four. 038986 -. Singapore Research and exploration 100% 100% 56,345 56,345 (7,261) 119,548 G No
NUCOASTAL (THAILAND) LIMITED
Coastal Energy Company, S.L.U.
Unit nos 3901 - 3904, 39th. Floor, Exchange Tower, 388 Sukhumvit Rd. Klongtoey. - Bangkok. Tailandia Research and exploration 100% 100% 1,730 1,730 (33,902) (5,304) G No
CEPSA GAS COMERCIALIZADORA, S.A.
Compañía Española de Petróleos, S.A.
Paseo de la Castellana, 259 A. 28046 Madrid. España Gas distribution 70% 70% 3,060 3,060 (24,541) - G No
Thousand of euros
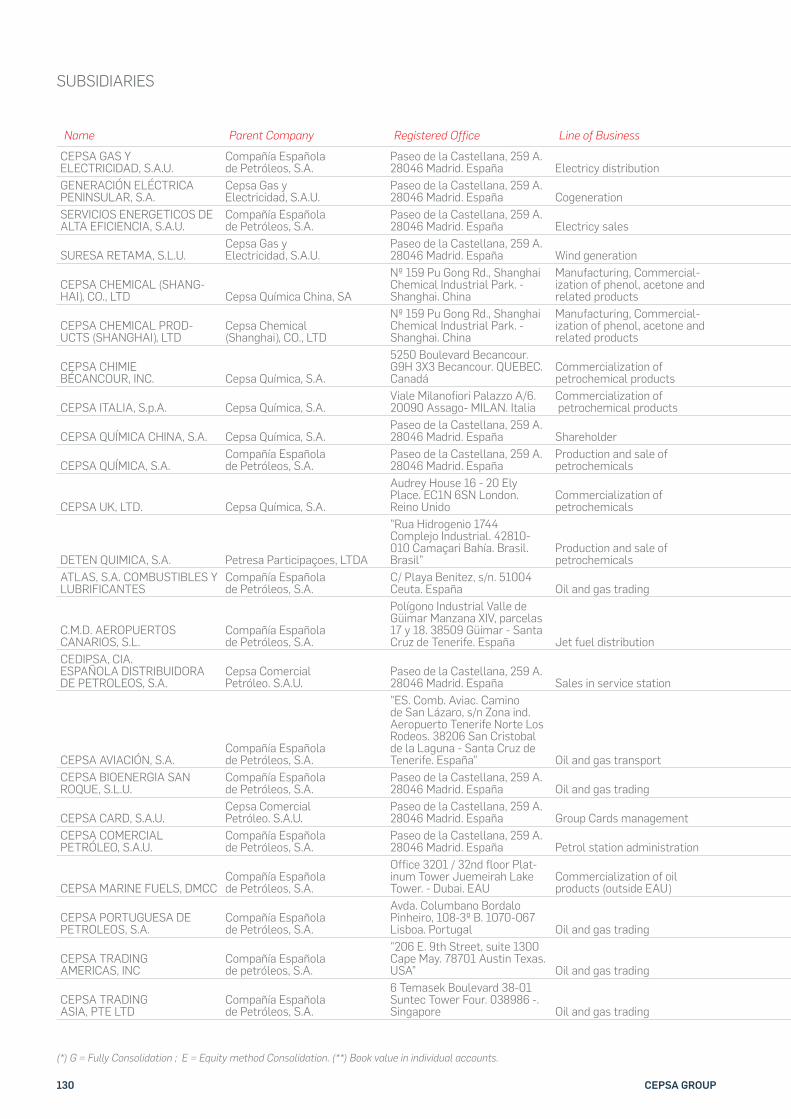
130 CEPSA GROUP
Ownership Equity
Name Parent Company Registered Office Line of Business 2020 2019
Share Capital
Subscribed
Share Capital
PaidReserves +
Net Profit
Net Cost of Investment
(**)
Conso-lidation
Method (*)Fiscal Group
CEPSA GAS Y ELECTRICIDAD, S.A.U.
Compañía Española de Petróleos, S.A.
Paseo de la Castellana, 259 A. 28046 Madrid. España Electricy distribution 100% 100% 12,330 12,330 74,761 130,621 G Yes
GENERACIÓN ELÉCTRICA PENINSULAR, S.A.
Cepsa Gas y Electricidad, S.A.U.
Paseo de la Castellana, 259 A. 28046 Madrid. España Cogeneration 70% 70% 32,000 32,000 53,476 22,400 G No
SERVICIOS ENERGETICOS DE ALTA EFICIENCIA, S.A.U.
Compañía Española de Petróleos, S.A.
Paseo de la Castellana, 259 A. 28046 Madrid. España Electricy sales 100% 100% 100 100 3,058 5,408 G Yes
SURESA RETAMA, S.L.U.Cepsa Gas y Electricidad, S.A.U.
Paseo de la Castellana, 259 A. 28046 Madrid. España Wind generation 100% 100% 605 605 11,669 17,082 G Yes
CEPSA CHEMICAL (SHANG-HAI), CO., LTD Cepsa Química China, SA
Nº 159 Pu Gong Rd., Shanghai Chemical Industrial Park. - Shanghai. China
Manufacturing, Commercial-ization of phenol, acetone and related products 75% 75% 241,637 241,637 (100,446) 56,294 G No
CEPSA CHEMICAL PROD-UCTS (SHANGHAI), LTD
Cepsa Chemical (Shanghai), CO., LTD
Nº 159 Pu Gong Rd., Shanghai Chemical Industrial Park. - Shanghai. China
Manufacturing, Commercial-ization of phenol, acetone and related products 75% - 26,176 26,176 - 26,176 G No
CEPSA CHIMIE BÉCANCOUR, INC. Cepsa Química, S.A.
5250 Boulevard Becancour. G9H 3X3 Becancour. QUEBEC. Canadá
Commercialization ofpetrochemical products 100% 100% 1,152 1,152 36,285 7,718 G No
CEPSA ITALIA, S.p.A. Cepsa Química, S.A.Viale Milanofiori Palazzo A/6. 20090 Assago- MILAN. Italia
Commercialization of petrochemical products 100% 100% 6,000 6,000 6,544 9,737 G No
CEPSA QUÍMICA CHINA, S.A. Cepsa Química, S.A.Paseo de la Castellana, 259 A. 28046 Madrid. España Shareholder 75% 75% 12,830 12,830 44,058 42,220 G Yes
CEPSA QUÍMICA, S.A.Compañía Española de Petróleos, S.A.
Paseo de la Castellana, 259 A. 28046 Madrid. España
Production and sale of petrochemicals 100% 100% 60 60 698,741 553,617 G Yes
CEPSA UK, LTD. Cepsa Química, S.A.
Audrey House 16 - 20 Ely Place. EC1N 6SN London. Reino Unido
Commercialization of petrochemicals 100% 100% 3,337 3,337 9,346 10,532 G No
DETEN QUIMICA, S.A. Petresa Participaçoes, LTDA
"Rua Hidrogenio 1744 Complejo Industrial. 42810-010 Camaçari Bahía. Brasil. Brasil”
Production and sale of petrochemicals 71% 71% 61,333 61,333 83,806 152,959 G No
ATLAS, S.A. COMBUSTIBLES Y LUBRIFICANTES
Compañía Española de Petróleos, S.A.
C/ Playa Benitez, s/n. 51004 Ceuta. España Oil and gas trading 100% 100% 3,930 3,930 1,095 4,077 G Yes
C.M.D. AEROPUERTOS CANARIOS, S.L.
Compañía Española de Petróleos, S.A.
Polígono Industrial Valle de Güimar Manzana XIV, parcelas 17 y 18. 38509 Güimar - Santa Cruz de Tenerife. España Jet fuel distribution 60% 60% 21,576 21,576 5,002 12,946 G No
CEDIPSA, CIA. ESPAÑOLA DISTRIBUIDORA DE PETROLEOS, S.A.
Cepsa Comercial Petróleo. S.A.U.
Paseo de la Castellana, 259 A. 28046 Madrid. España Sales in service station 100% 100% 8,114 8,114 22,395 48,059 G Yes
CEPSA AVIACIÓN, S.A.Compañía Española de Petróleos, S.A.
"ES. Comb. Aviac. Camino de San Lázaro, s/n Zona ind. Aeropuerto Tenerife Norte Los Rodeos. 38206 San Cristobal de la Laguna - Santa Cruz de Tenerife. España” Oil and gas transport 100% 100% 954 954 19,535 18,956 G Yes
CEPSA BIOENERGIA SAN ROQUE, S.L.U.
Compañía Española de Petróleos, S.A.
Paseo de la Castellana, 259 A. 28046 Madrid. España Oil and gas trading 100% 100% 3,003 3,003 4,045 8,003 G Yes
CEPSA CARD, S.A.U.Cepsa Comercial Petróleo. S.A.U.
Paseo de la Castellana, 259 A. 28046 Madrid. España Group Cards management 100% 100% 60 60 (800) 460 G Yes
CEPSA COMERCIAL PETRÓLEO, S.A.U.
Compañía Española de Petróleos, S.A.
Paseo de la Castellana, 259 A. 28046 Madrid. España Petrol station administration 100% 100% 82,043 82,043 733,879 687,546 G Yes
CEPSA MARINE FUELS, DMCCCompañía Española de Petróleos, S.A.
Office 3201 / 32nd floor Plat-inum Tower Juemeirah Lake Tower. - Dubai. EAU
Commercialization of oil products (outside EAU) 100% 100% 406 406 992 - G No
CEPSA PORTUGUESA DE PETROLEOS, S.A.
Compañía Española de Petróleos, S.A.
Avda. Columbano Bordalo Pinheiro, 108-3º B. 1070-067 Lisboa. Portugal Oil and gas trading 100% 100% 30,000 30,000 37,828 65,957 G No
CEPSA TRADING AMERICAS, INC
Compañía Española de petróleos, S.A.
"206 E. 9th Street, suite 1300 Cape May. 78701 Austin Texas. USA” Oil and gas trading 100% - 8 8 (117) 13 G No
CEPSA TRADING ASIA, PTE LTD
Compañía Española de Petróleos, S.A.
6 Temasek Boulevard 38-01 Suntec Tower Four. 038986 -. Singapore Oil and gas trading 100% 100% 461 461 503 461 G No
SUBSIDIARIES
(*) G = Fully Consolidation ; E = Equity method Consolidation. (**) Book value in individual accounts.
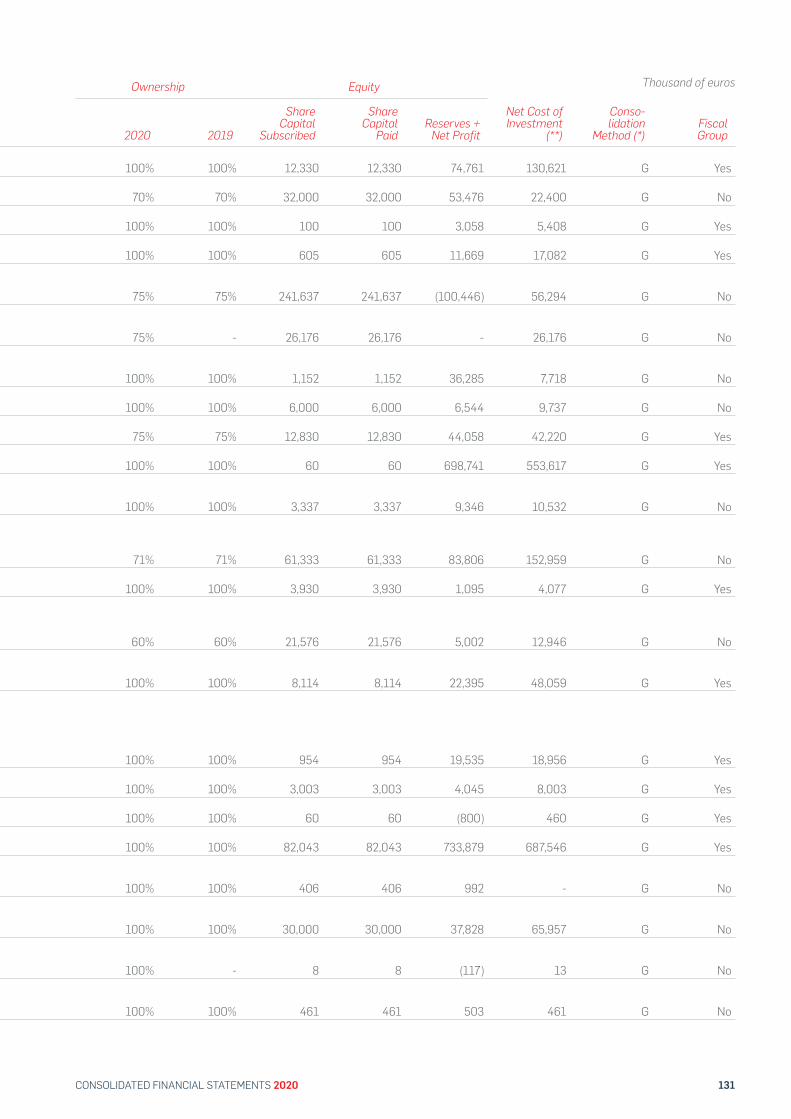
131CONSOLIDATED FINANCIAL STATEMENTS 2020
Ownership Equity
Name Parent Company Registered Office Line of Business 2020 2019
Share Capital
Subscribed
Share Capital
PaidReserves +
Net Profit
Net Cost of Investment
(**)
Conso-lidation
Method (*)Fiscal Group
CEPSA GAS Y ELECTRICIDAD, S.A.U.
Compañía Española de Petróleos, S.A.
Paseo de la Castellana, 259 A. 28046 Madrid. España Electricy distribution 100% 100% 12,330 12,330 74,761 130,621 G Yes
GENERACIÓN ELÉCTRICA PENINSULAR, S.A.
Cepsa Gas y Electricidad, S.A.U.
Paseo de la Castellana, 259 A. 28046 Madrid. España Cogeneration 70% 70% 32,000 32,000 53,476 22,400 G No
SERVICIOS ENERGETICOS DE ALTA EFICIENCIA, S.A.U.
Compañía Española de Petróleos, S.A.
Paseo de la Castellana, 259 A. 28046 Madrid. España Electricy sales 100% 100% 100 100 3,058 5,408 G Yes
SURESA RETAMA, S.L.U.Cepsa Gas y Electricidad, S.A.U.
Paseo de la Castellana, 259 A. 28046 Madrid. España Wind generation 100% 100% 605 605 11,669 17,082 G Yes
CEPSA CHEMICAL (SHANG-HAI), CO., LTD Cepsa Química China, SA
Nº 159 Pu Gong Rd., Shanghai Chemical Industrial Park. - Shanghai. China
Manufacturing, Commercial-ization of phenol, acetone and related products 75% 75% 241,637 241,637 (100,446) 56,294 G No
CEPSA CHEMICAL PROD-UCTS (SHANGHAI), LTD
Cepsa Chemical (Shanghai), CO., LTD
Nº 159 Pu Gong Rd., Shanghai Chemical Industrial Park. - Shanghai. China
Manufacturing, Commercial-ization of phenol, acetone and related products 75% - 26,176 26,176 - 26,176 G No
CEPSA CHIMIE BÉCANCOUR, INC. Cepsa Química, S.A.
5250 Boulevard Becancour. G9H 3X3 Becancour. QUEBEC. Canadá
Commercialization ofpetrochemical products 100% 100% 1,152 1,152 36,285 7,718 G No
CEPSA ITALIA, S.p.A. Cepsa Química, S.A.Viale Milanofiori Palazzo A/6. 20090 Assago- MILAN. Italia
Commercialization of petrochemical products 100% 100% 6,000 6,000 6,544 9,737 G No
CEPSA QUÍMICA CHINA, S.A. Cepsa Química, S.A.Paseo de la Castellana, 259 A. 28046 Madrid. España Shareholder 75% 75% 12,830 12,830 44,058 42,220 G Yes
CEPSA QUÍMICA, S.A.Compañía Española de Petróleos, S.A.
Paseo de la Castellana, 259 A. 28046 Madrid. España
Production and sale of petrochemicals 100% 100% 60 60 698,741 553,617 G Yes
CEPSA UK, LTD. Cepsa Química, S.A.
Audrey House 16 - 20 Ely Place. EC1N 6SN London. Reino Unido
Commercialization of petrochemicals 100% 100% 3,337 3,337 9,346 10,532 G No
DETEN QUIMICA, S.A. Petresa Participaçoes, LTDA
"Rua Hidrogenio 1744 Complejo Industrial. 42810-010 Camaçari Bahía. Brasil. Brasil”
Production and sale of petrochemicals 71% 71% 61,333 61,333 83,806 152,959 G No
ATLAS, S.A. COMBUSTIBLES Y LUBRIFICANTES
Compañía Española de Petróleos, S.A.
C/ Playa Benitez, s/n. 51004 Ceuta. España Oil and gas trading 100% 100% 3,930 3,930 1,095 4,077 G Yes
C.M.D. AEROPUERTOS CANARIOS, S.L.
Compañía Española de Petróleos, S.A.
Polígono Industrial Valle de Güimar Manzana XIV, parcelas 17 y 18. 38509 Güimar - Santa Cruz de Tenerife. España Jet fuel distribution 60% 60% 21,576 21,576 5,002 12,946 G No
CEDIPSA, CIA. ESPAÑOLA DISTRIBUIDORA DE PETROLEOS, S.A.
Cepsa Comercial Petróleo. S.A.U.
Paseo de la Castellana, 259 A. 28046 Madrid. España Sales in service station 100% 100% 8,114 8,114 22,395 48,059 G Yes
CEPSA AVIACIÓN, S.A.Compañía Española de Petróleos, S.A.
"ES. Comb. Aviac. Camino de San Lázaro, s/n Zona ind. Aeropuerto Tenerife Norte Los Rodeos. 38206 San Cristobal de la Laguna - Santa Cruz de Tenerife. España” Oil and gas transport 100% 100% 954 954 19,535 18,956 G Yes
CEPSA BIOENERGIA SAN ROQUE, S.L.U.
Compañía Española de Petróleos, S.A.
Paseo de la Castellana, 259 A. 28046 Madrid. España Oil and gas trading 100% 100% 3,003 3,003 4,045 8,003 G Yes
CEPSA CARD, S.A.U.Cepsa Comercial Petróleo. S.A.U.
Paseo de la Castellana, 259 A. 28046 Madrid. España Group Cards management 100% 100% 60 60 (800) 460 G Yes
CEPSA COMERCIAL PETRÓLEO, S.A.U.
Compañía Española de Petróleos, S.A.
Paseo de la Castellana, 259 A. 28046 Madrid. España Petrol station administration 100% 100% 82,043 82,043 733,879 687,546 G Yes
CEPSA MARINE FUELS, DMCCCompañía Española de Petróleos, S.A.
Office 3201 / 32nd floor Plat-inum Tower Juemeirah Lake Tower. - Dubai. EAU
Commercialization of oil products (outside EAU) 100% 100% 406 406 992 - G No
CEPSA PORTUGUESA DE PETROLEOS, S.A.
Compañía Española de Petróleos, S.A.
Avda. Columbano Bordalo Pinheiro, 108-3º B. 1070-067 Lisboa. Portugal Oil and gas trading 100% 100% 30,000 30,000 37,828 65,957 G No
CEPSA TRADING AMERICAS, INC
Compañía Española de petróleos, S.A.
"206 E. 9th Street, suite 1300 Cape May. 78701 Austin Texas. USA” Oil and gas trading 100% - 8 8 (117) 13 G No
CEPSA TRADING ASIA, PTE LTD
Compañía Española de Petróleos, S.A.
6 Temasek Boulevard 38-01 Suntec Tower Four. 038986 -. Singapore Oil and gas trading 100% 100% 461 461 503 461 G No
Thousand of euros
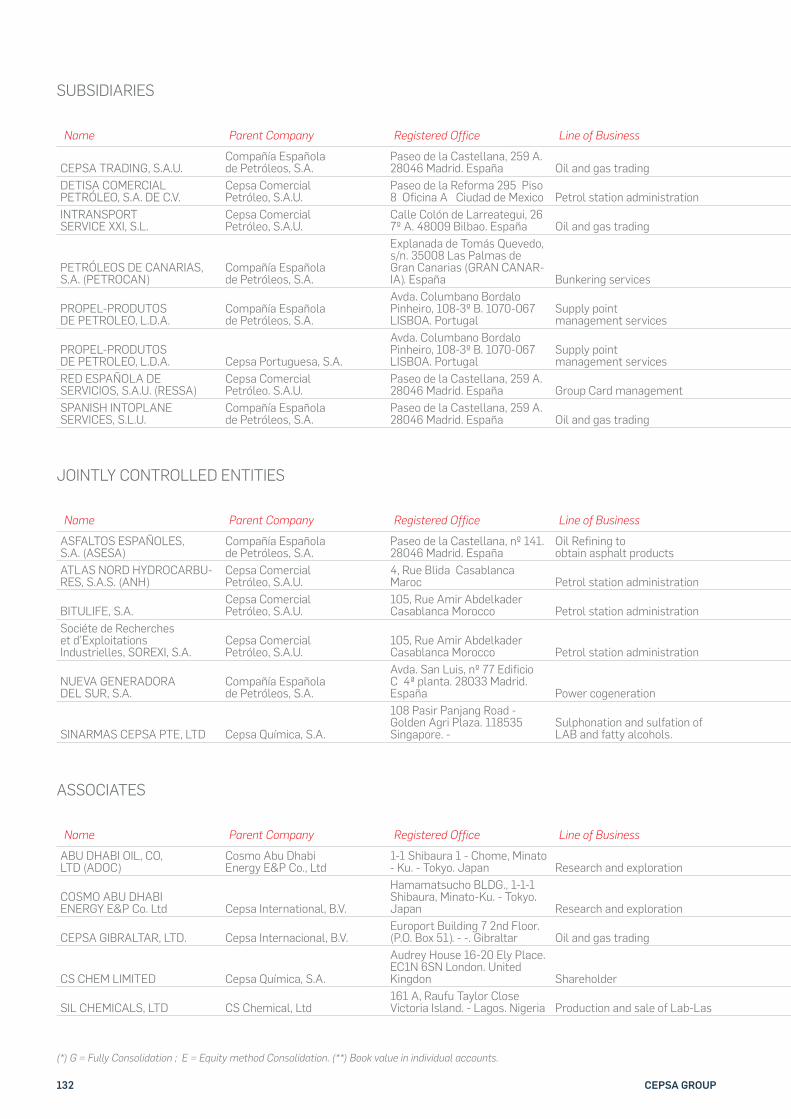
132 CEPSA GROUP
Ownership Equity
Name Parent Company Registered Office Line of Business 2020 2019
Share Capital
Subscribed
Share Capital
PaidReserves +
Net Profit
Net Cost of Investment
(**)
Conso-lidation
Method (*)Fiscal Group
CEPSA TRADING, S.A.U.Compañía Española de Petróleos, S.A.
Paseo de la Castellana, 259 A. 28046 Madrid. España Oil and gas trading 100% 100% 60 60 (2,834) 60 G Yes
DETISA COMERCIAL PETRÓLEO, S.A. DE C.V.
Cepsa Comercial Petróleo, S.A.U.
Paseo de la Reforma 295 Piso 8 Oficina A Ciudad de Mexico Petrol station administration 100% 100% 7,734 4,048 (891) 7,734 G No
INTRANSPORT SERVICE XXI, S.L.
Cepsa Comercial Petróleo, S.A.U.
Calle Colón de Larreategui, 26 7º A. 48009 Bilbao. España Oil and gas trading 100% - 2,201 2,201 3,140 5,951 G No
PETRÓLEOS DE CANARIAS, S.A. (PETROCAN)
Compañía Española de Petróleos, S.A.
Explanada de Tomás Quevedo, s/n. 35008 Las Palmas de Gran Canarias (GRAN CANAR-IA). España Bunkering services 100% 100% 120 120 34,091 34,363 G Yes
PROPEL-PRODUTOS DE PETROLEO, L.D.A.
Compañía Española de Petróleos, S.A.
Avda. Columbano Bordalo Pinheiro, 108-3º B. 1070-067 LISBOA. Portugal
Supply point management services 93% 93% 224 224 187 1,380 G No
PROPEL-PRODUTOS DE PETROLEO, L.D.A. Cepsa Portuguesa, S.A.
Avda. Columbano Bordalo Pinheiro, 108-3º B. 1070-067 LISBOA. Portugal
Supply point management services 7% 7% 224 224 187 1,380 G No
RED ESPAÑOLA DE SERVICIOS, S.A.U. (RESSA)
Cepsa Comercial Petróleo. S.A.U.
Paseo de la Castellana, 259 A. 28046 Madrid. España Group Card management 100% 100% 300 300 33,848 39,705 G Yes
SPANISH INTOPLANE SERVICES, S.L.U.
Compañía Española de Petróleos, S.A.
Paseo de la Castellana, 259 A. 28046 Madrid. España Oil and gas trading 100% 100% 1,000 1,000 (328) 2,547 G Yes
Ownership Equity
Name Parent Company Registered Office Line of Business 2020 2019
Share Capital
Subscribed
Share Capital
PaidReserves +
Net Profit
Net Cost of Investment
(**)
Conso-lidation
Method (*)Fiscal Group
ASFALTOS ESPAÑOLES, S.A. (ASESA)
Compañía Española de Petróleos, S.A.
Paseo de la Castellana, nº 141. 28046 Madrid. España
Oil Refining to obtain asphalt products 50% 50% 8,529 8,529 26,502 17,869 E No
ATLAS NORD HYDROCARBU-RES, S.A.S. (ANH)
Cepsa Comercial Petróleo, S.A.U.
4, Rue Blida Casablanca Maroc Petrol station administration 50% 50% 15,810 15,810 1,532 7,905 E No
BITULIFE, S.A.Cepsa Comercial Petróleo, S.A.U.
105, Rue Amir Abdelkader Casablanca Morocco Petrol station administration 40% - 1,603 1,603 6,995 7,359 E No
Sociéte de Recherches et d’Exploitations Industrielles, SOREXI, S.A.
Cepsa Comercial Petróleo, S.A.U.
105, Rue Amir Abdelkader Casablanca Morocco Petrol station administration 40% - 1,171 1,171 19,982 26,596 E No
NUEVA GENERADORA DEL SUR, S.A.
Compañía Española de Petróleos, S.A.
Avda. San Luis, nº 77 Edificio C 4ª planta. 28033 Madrid. España Power cogeneration 50% 50% 2,290 2,290 24,385 3,691 E No
SINARMAS CEPSA PTE, LTD Cepsa Química, S.A.
108 Pasir Panjang Road - Golden Agri Plaza. 118535 Singapore. -
Sulphonation and sulfation of LAB and fatty alcohols. 50% 50% 330,201 330,201 (135,663) 123,400 E No
Ownership Equity
Name Parent Company Registered Office Line of Business 2020 2019
Share Capital
Subscribed
Share Capital
PaidReserves +
Net Profit
Net Cost of Investment
(**)
Conso-lidation
Method (*)Fiscal Group
ABU DHABI OIL, CO, LTD (ADOC)
Cosmo Abu Dhabi Energy E&P Co., Ltd
1-1 Shibaura 1 - Chome, Minato - Ku. - Tokyo. Japan Research and exploration 13% 13% 92.987 92.987 90.477 71.446 E No
COSMO ABU DHABI ENERGY E&P Co. Ltd Cepsa International, B.V.
Hamamatsucho BLDG., 1-1-1 Shibaura, Minato-Ku. - Tokyo. Japan Research and exploration 20% 20% 28 28 35.502 17.396 E No
CEPSA GIBRALTAR, LTD. Cepsa Internacional, B.V.Europort Building 7 2nd Floor. (P.O. Box 51). - -. Gibraltar Oil and gas trading 50% 50% 71 71 18.203 25 E No
CS CHEM LIMITED Cepsa Química, S.A.
Audrey House 16-20 Ely Place. EC1N 6SN London. United Kingdon Shareholder 30% 30% 1 1 88.105 25.465 E No
SIL CHEMICALS, LTD CS Chemical, Ltd161 A, Raufu Taylor Close Victoria Island. - Lagos. Nigeria Production and sale of Lab-Las 30% 30% 116 116 89.610 84.882 E No
SUBSIDIARIES
JOINTLY CONTROLLED ENTITIES
ASSOCIATES
(*) G = Fully Consolidation ; E = Equity method Consolidation. (**) Book value in individual accounts.
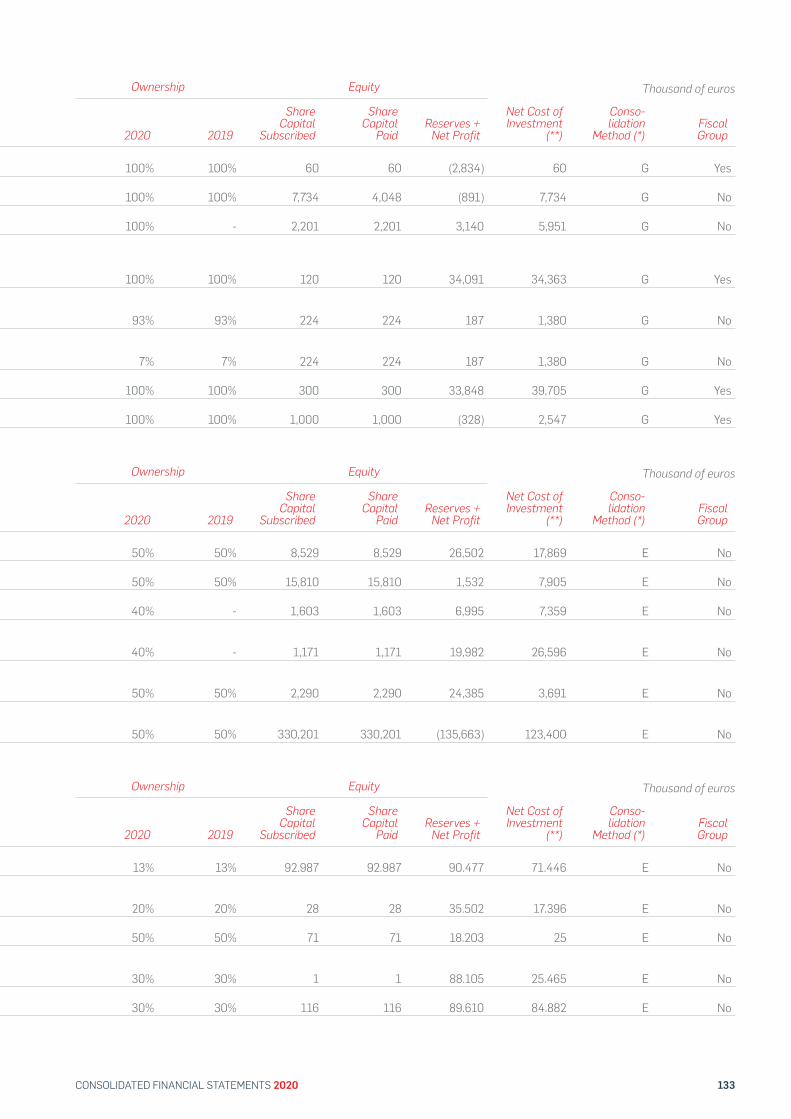
133CONSOLIDATED FINANCIAL STATEMENTS 2020
Ownership Equity
Name Parent Company Registered Office Line of Business 2020 2019
Share Capital
Subscribed
Share Capital
PaidReserves +
Net Profit
Net Cost of Investment
(**)
Conso-lidation
Method (*)Fiscal Group
CEPSA TRADING, S.A.U.Compañía Española de Petróleos, S.A.
Paseo de la Castellana, 259 A. 28046 Madrid. España Oil and gas trading 100% 100% 60 60 (2,834) 60 G Yes
DETISA COMERCIAL PETRÓLEO, S.A. DE C.V.
Cepsa Comercial Petróleo, S.A.U.
Paseo de la Reforma 295 Piso 8 Oficina A Ciudad de Mexico Petrol station administration 100% 100% 7,734 4,048 (891) 7,734 G No
INTRANSPORT SERVICE XXI, S.L.
Cepsa Comercial Petróleo, S.A.U.
Calle Colón de Larreategui, 26 7º A. 48009 Bilbao. España Oil and gas trading 100% - 2,201 2,201 3,140 5,951 G No
PETRÓLEOS DE CANARIAS, S.A. (PETROCAN)
Compañía Española de Petróleos, S.A.
Explanada de Tomás Quevedo, s/n. 35008 Las Palmas de Gran Canarias (GRAN CANAR-IA). España Bunkering services 100% 100% 120 120 34,091 34,363 G Yes
PROPEL-PRODUTOS DE PETROLEO, L.D.A.
Compañía Española de Petróleos, S.A.
Avda. Columbano Bordalo Pinheiro, 108-3º B. 1070-067 LISBOA. Portugal
Supply point management services 93% 93% 224 224 187 1,380 G No
PROPEL-PRODUTOS DE PETROLEO, L.D.A. Cepsa Portuguesa, S.A.
Avda. Columbano Bordalo Pinheiro, 108-3º B. 1070-067 LISBOA. Portugal
Supply point management services 7% 7% 224 224 187 1,380 G No
RED ESPAÑOLA DE SERVICIOS, S.A.U. (RESSA)
Cepsa Comercial Petróleo. S.A.U.
Paseo de la Castellana, 259 A. 28046 Madrid. España Group Card management 100% 100% 300 300 33,848 39,705 G Yes
SPANISH INTOPLANE SERVICES, S.L.U.
Compañía Española de Petróleos, S.A.
Paseo de la Castellana, 259 A. 28046 Madrid. España Oil and gas trading 100% 100% 1,000 1,000 (328) 2,547 G Yes
Ownership Equity
Name Parent Company Registered Office Line of Business 2020 2019
Share Capital
Subscribed
Share Capital
PaidReserves +
Net Profit
Net Cost of Investment
(**)
Conso-lidation
Method (*)Fiscal Group
ASFALTOS ESPAÑOLES, S.A. (ASESA)
Compañía Española de Petróleos, S.A.
Paseo de la Castellana, nº 141. 28046 Madrid. España
Oil Refining to obtain asphalt products 50% 50% 8,529 8,529 26,502 17,869 E No
ATLAS NORD HYDROCARBU-RES, S.A.S. (ANH)
Cepsa Comercial Petróleo, S.A.U.
4, Rue Blida Casablanca Maroc Petrol station administration 50% 50% 15,810 15,810 1,532 7,905 E No
BITULIFE, S.A.Cepsa Comercial Petróleo, S.A.U.
105, Rue Amir Abdelkader Casablanca Morocco Petrol station administration 40% - 1,603 1,603 6,995 7,359 E No
Sociéte de Recherches et d’Exploitations Industrielles, SOREXI, S.A.
Cepsa Comercial Petróleo, S.A.U.
105, Rue Amir Abdelkader Casablanca Morocco Petrol station administration 40% - 1,171 1,171 19,982 26,596 E No
NUEVA GENERADORA DEL SUR, S.A.
Compañía Española de Petróleos, S.A.
Avda. San Luis, nº 77 Edificio C 4ª planta. 28033 Madrid. España Power cogeneration 50% 50% 2,290 2,290 24,385 3,691 E No
SINARMAS CEPSA PTE, LTD Cepsa Química, S.A.
108 Pasir Panjang Road - Golden Agri Plaza. 118535 Singapore. -
Sulphonation and sulfation of LAB and fatty alcohols. 50% 50% 330,201 330,201 (135,663) 123,400 E No
Ownership Equity
Name Parent Company Registered Office Line of Business 2020 2019
Share Capital
Subscribed
Share Capital
PaidReserves +
Net Profit
Net Cost of Investment
(**)
Conso-lidation
Method (*)Fiscal Group
ABU DHABI OIL, CO, LTD (ADOC)
Cosmo Abu Dhabi Energy E&P Co., Ltd
1-1 Shibaura 1 - Chome, Minato - Ku. - Tokyo. Japan Research and exploration 13% 13% 92.987 92.987 90.477 71.446 E No
COSMO ABU DHABI ENERGY E&P Co. Ltd Cepsa International, B.V.
Hamamatsucho BLDG., 1-1-1 Shibaura, Minato-Ku. - Tokyo. Japan Research and exploration 20% 20% 28 28 35.502 17.396 E No
CEPSA GIBRALTAR, LTD. Cepsa Internacional, B.V.Europort Building 7 2nd Floor. (P.O. Box 51). - -. Gibraltar Oil and gas trading 50% 50% 71 71 18.203 25 E No
CS CHEM LIMITED Cepsa Química, S.A.
Audrey House 16-20 Ely Place. EC1N 6SN London. United Kingdon Shareholder 30% 30% 1 1 88.105 25.465 E No
SIL CHEMICALS, LTD CS Chemical, Ltd161 A, Raufu Taylor Close Victoria Island. - Lagos. Nigeria Production and sale of Lab-Las 30% 30% 116 116 89.610 84.882 E No
Thousand of euros
Thousand of euros
Thousand of euros
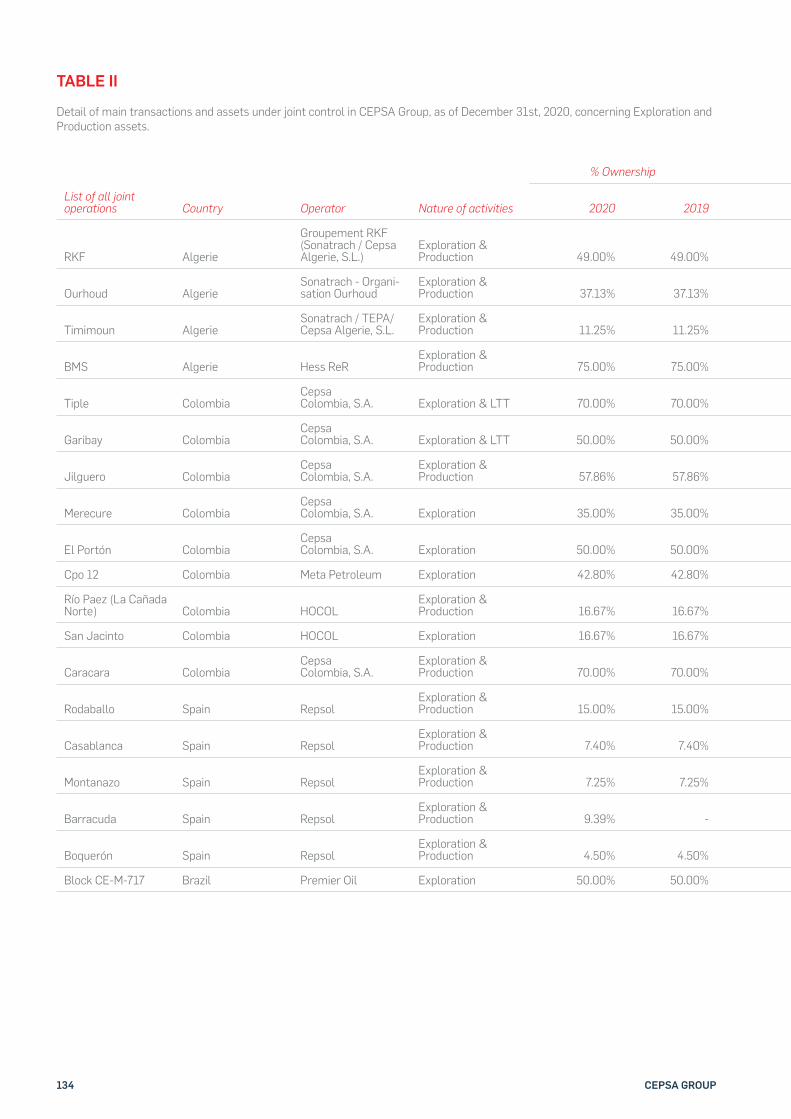
134 CEPSA GROUP
TABLE II
Detail of main transactions and assets under joint control in CEPSA Group, as of December 31st, 2020, concerning Exploration and Production assets.
% Ownership Revenue Profit before tax Net profit Total Assets Total Liabilities
List of all joint operations Country Operator Nature of activities 2020 2019 2020 2019 2020 2019 2020 2019 2020 2019 2020 2019
RKF Algerie
Groupement RKF (Sonatrach / Cepsa Algerie, S.L.)
Exploration & Production 49.00% 49.00% 64,089 119,689 34,198 67,295 1,756 6,346 161,952 146,027 85,305 156,198
Ourhoud AlgerieSonatrach - Organi-sation Ourhoud
Exploration &Production 37.13% 37.13% 175,692 285,981 106,564 233,693 63,937 140,673 78,510 75,433 16,169 7,109
Timimoun AlgerieSonatrach / TEPA/ Cepsa Algerie, S.L.
Exploration & Production 11.25% 11.25% 19,382 24,224 -129,704 -5,688 -131,655 -8,169 32,209 174,460 6,784 8,701
BMS Algerie Hess ReRExploration & Production 75.00% 75.00% 45,369 94,605 -15,094 30,302 -15,094 30,140 205,485 250,617 205,485 250,617
Tiple ColombiaCepsa Colombia, S.A. Exploration & LTT 70.00% 70.00% 138 0 663 6,423 138 0 -49 129 1,117 1,321
Garibay ColombiaCepsa Colombia, S.A. Exploration & LTT 50.00% 50.00% 303 2,279 -808 589 303 2,279 819 1,172 720 348
Jilguero ColombiaCepsa Colombia, S.A.
Exploration & Production 57.86% 57.86% 219 4,252 -811 -5,889 219 4,252 -652 133 1,891 2,615
Merecure ColombiaCepsa Colombia, S.A. Exploration 35.00% 35.00% 0 0 131 -268 0 0 293 -119 567 393
El Portón ColombiaCepsa Colombia, S.A. Exploration 50.00% 50.00% 0 0 0 0 0 0 0 0 44 0
Cpo 12 Colombia Meta Petroleum Exploration 42.80% 42.80% 0 0 -24 9 0 0 0 0 0 0
Río Paez (La Cañada Norte) Colombia HOCOL
Exploration & Production 16.67% 16.67% 1,708 3,490 330 1,945 1,708 3,490 453 3,091 696 597
San Jacinto Colombia HOCOL Exploration 16.67% 16.67% 0 0 0 0 0 0 0 0 0 0
Caracara ColombiaCepsa Colombia, S.A.
Exploration & Production 70.00% 70.00% 65,553 154,431 11,773 55,088 65,553 154,431 55,414 121,907 18,729 29,882
Rodaballo Spain Repsol Exploration &Production 15.00% 15.00% 0 0 0 0 0 0 0 0 2,000 1,601
Casablanca Spain Repsol Exploration & Production 7.40% 7.40% 337 525 0 0 0 0 0 1,978 13,567 11,709
Montanazo Spain Repsol Exploration & Production 7.25% 7.25% 0 159 0 0 0 0 0 -536 778 768
Barracuda Spain Repsol Exploration & Production 9.39% - 60 - 0 - 0 - 0 - 0 -
Boquerón Spain Repsol Exploration & Production 4.50% 4.50% 60 171 0 0 0 0 0 444 143 116
Block CE-M-717 Brazil Premier Oil Exploration 50.00% 50.00% 0 0 -20 -1,567 -15 -1,175 20,501 15,992 20,501 15,992
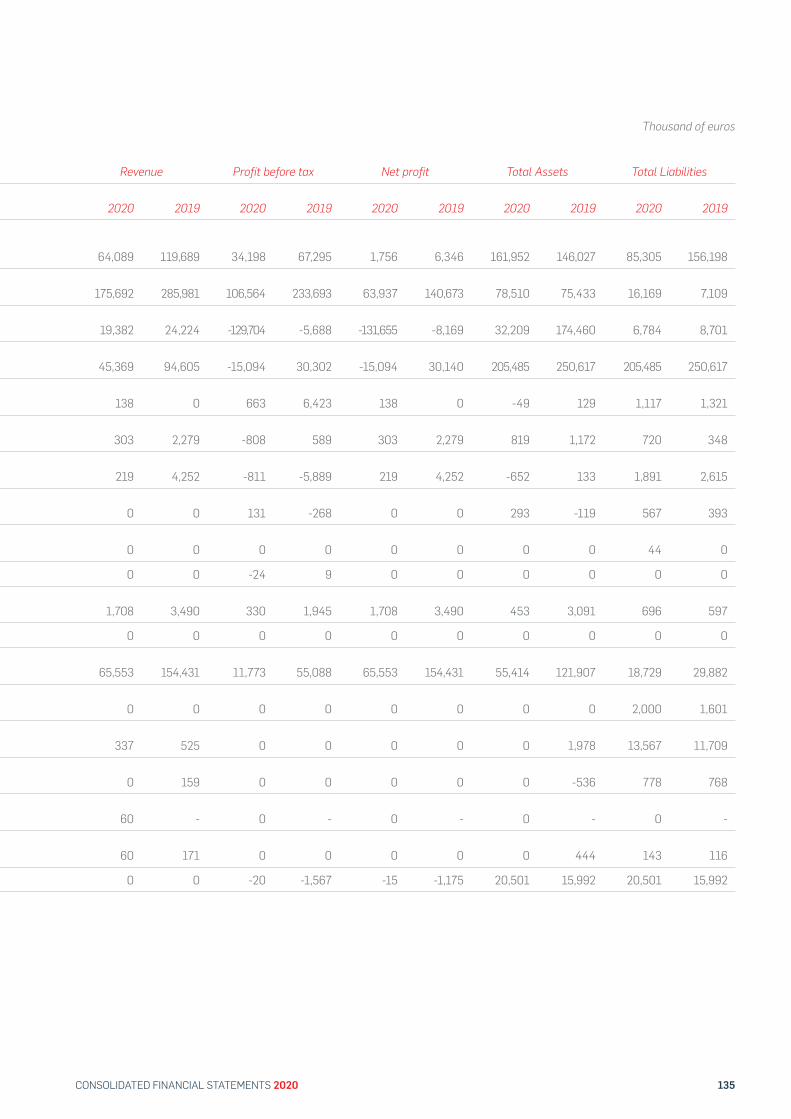
135CONSOLIDATED FINANCIAL STATEMENTS 2020
% Ownership Revenue Profit before tax Net profit Total Assets Total Liabilities
List of all joint operations Country Operator Nature of activities 2020 2019 2020 2019 2020 2019 2020 2019 2020 2019 2020 2019
RKF Algerie
Groupement RKF (Sonatrach / Cepsa Algerie, S.L.)
Exploration & Production 49.00% 49.00% 64,089 119,689 34,198 67,295 1,756 6,346 161,952 146,027 85,305 156,198
Ourhoud AlgerieSonatrach - Organi-sation Ourhoud
Exploration &Production 37.13% 37.13% 175,692 285,981 106,564 233,693 63,937 140,673 78,510 75,433 16,169 7,109
Timimoun AlgerieSonatrach / TEPA/ Cepsa Algerie, S.L.
Exploration & Production 11.25% 11.25% 19,382 24,224 -129,704 -5,688 -131,655 -8,169 32,209 174,460 6,784 8,701
BMS Algerie Hess ReRExploration & Production 75.00% 75.00% 45,369 94,605 -15,094 30,302 -15,094 30,140 205,485 250,617 205,485 250,617
Tiple ColombiaCepsa Colombia, S.A. Exploration & LTT 70.00% 70.00% 138 0 663 6,423 138 0 -49 129 1,117 1,321
Garibay ColombiaCepsa Colombia, S.A. Exploration & LTT 50.00% 50.00% 303 2,279 -808 589 303 2,279 819 1,172 720 348
Jilguero ColombiaCepsa Colombia, S.A.
Exploration & Production 57.86% 57.86% 219 4,252 -811 -5,889 219 4,252 -652 133 1,891 2,615
Merecure ColombiaCepsa Colombia, S.A. Exploration 35.00% 35.00% 0 0 131 -268 0 0 293 -119 567 393
El Portón ColombiaCepsa Colombia, S.A. Exploration 50.00% 50.00% 0 0 0 0 0 0 0 0 44 0
Cpo 12 Colombia Meta Petroleum Exploration 42.80% 42.80% 0 0 -24 9 0 0 0 0 0 0
Río Paez (La Cañada Norte) Colombia HOCOL
Exploration & Production 16.67% 16.67% 1,708 3,490 330 1,945 1,708 3,490 453 3,091 696 597
San Jacinto Colombia HOCOL Exploration 16.67% 16.67% 0 0 0 0 0 0 0 0 0 0
Caracara ColombiaCepsa Colombia, S.A.
Exploration & Production 70.00% 70.00% 65,553 154,431 11,773 55,088 65,553 154,431 55,414 121,907 18,729 29,882
Rodaballo Spain Repsol Exploration &Production 15.00% 15.00% 0 0 0 0 0 0 0 0 2,000 1,601
Casablanca Spain Repsol Exploration & Production 7.40% 7.40% 337 525 0 0 0 0 0 1,978 13,567 11,709
Montanazo Spain Repsol Exploration & Production 7.25% 7.25% 0 159 0 0 0 0 0 -536 778 768
Barracuda Spain Repsol Exploration & Production 9.39% - 60 - 0 - 0 - 0 - 0 -
Boquerón Spain Repsol Exploration & Production 4.50% 4.50% 60 171 0 0 0 0 0 444 143 116
Block CE-M-717 Brazil Premier Oil Exploration 50.00% 50.00% 0 0 -20 -1,567 -15 -1,175 20,501 15,992 20,501 15,992
Thousand of euros