interim report and financial statements
TRANSCRIPT

Interim Report andFinancial Statements
(unaudited) for the period ended 30 June 2020
Dimensional Funds ICVC
Authorised by the Financial Conduct Authority

No marketing notification has been submitted in Germany for the following Funds of Dimensional Funds ICVC:
Global Short-Dated Bond Fund
International Core Equity Fund
International Value Fund
United Kingdom Core Equity Fund
United Kingdom Small Companies Fund
United Kingdom Value Fund
Accordingly, these Funds must not be publicly marketed in Germany.

Table of Contents
Dimensional Funds ICVC
General Information* 2
Investment Objectives and Policies* 3Authorised Corporate Director’s Investment Report* 5
Incorporation and Share Capital* 9
The Funds* 9
Fund Cross-Holdings* 9
Fund and Shareholder Liability* 9
Regulatory Disclosure* 9
Potential Implications of Brexit* 9
Directors' Statement* 10
The Interim Report and Financial Statements for each of the below sub-funds (the “Funds”);
Emerging Markets Core Equity Fund
Global Short-Dated Bond Fund
International Core Equity Fund
International Value FundUnited Kingdom Core Equity Fund
United Kingdom Small Companies Fund
United Kingdom Value Fund
are set out in the following order:
Price and Distribution Record 11
Portfolio Statement* 25
Statement of Total Return 139
Statement of Change in Net Assets Attributable to Shareholders 139
Balance Sheet 140
Note to the Financial Statements 140
Distribution Tables 141
Supplemental Information* 148
* These collectively comprise the Authorised Corporate Director’s (“ACD”) Report.
Dimensional Fund Advisors Ltd. Interim Report and Financial Statements, 30 June 2020 1

Dimensional Funds ICVC
General Information
Authorised Corporate Director (the “ACD”): Investment Manager:Dimensional Fund Advisors Ltd. Dimensional Fund Advisors Ltd.20 Triton Street 20 Triton StreetRegent’s Place Regent’s PlaceLondon NW1 3BF London NW1 3BFTelephone: 020 3033 3300 Authorised and Regulated by the Financial Conduct AuthorityFacsimile: 020 3033 3324Authorised and Regulated by the Financial Conduct Authority Dimensional Fund Advisors LP
6300 Bee Cave RoadAdministrator: Building OneState Street Bank and Trust Company, London Branch Austin, TX 7874620 Churchill Place USACanary WharfLondon E14 5HJ DFA Australia LimitedAuthorised and Regulated by the Financial Conduct Authority and the Level 43Prudential Regulatory Authority 1 Macquarie Place
SydneyRegistrar: NSW 2000, AustraliaSS&C Financial Services International Limited and SS&C Financial Data Services Europe Limited Dimensional Japan LtdSt. Nicholas Lane Kokusai BuildingBasildon Suite 808Essex SS15 5FS 3-1-1 MarunouchiSS&C Financial Data Services Europe Limited is Authorised and Chiyoda-Ku, Tokyo 100-0005Regulated by the Financial Conduct Authority and the Prudential Regulatory Authority. Dimensional Fund Advisors Pte Ltd
8 Marina View, Asia Square Tower 1Depositary (the “Depositary”): Suite 33-01, Singapore 018960State Street Trustees Limited20 Churchill PlaceCanary WharfLondon E14 5HJAuthorised and Regulated by the Financial Conduct Authority andPrudential Regulatory Authority
Independent Auditors:PricewaterhouseCoopers LLP7 More LondonRiversideLondon SE1 2RT
Board of Directors of Dimensional Fund Advisors Ltd.David ButlerStephen ClarkNathan LacazeCatherine NewellGerard O’ReillyVictoria Parry (Independent)John RomizaPeter Wood (Independent)
Dimensional Fund Advisors Ltd. Interim Report and Financial Statements, 30 June 2020 2

Global Short-Dated Bond Fund
The investment objective of the Global Short-Dated Bond Fund (the “Fund”) is to seek tomaximise current income while preserving capital.
Dimensional Funds ICVC
Investment Objectives and Policies
Set out below is the investment objective and a summary of the investment policy for each sub-fund of Dimensional Funds ICVC. The full investment policies are set out in the Prospectus, which is available to download from http://www.dimensional.com.
Emerging Markets Core Equity Fund
The investment objective of the Emerging Markets Core Equity Fund (the “Fund”) is to maximise long-term total return.
The investment policy of this Fund is to purchase transferable securities of publicly-traded companies in emerging markets which the ACD deems eligible or of companies which derive a significant proportion of their business from such emerging markets.
The Fund will generally have a higher allocation to small-cap companies and in companies which the ACD deems to be eligible value stocks, and a corresponding lower allocation to large growth companies, in each case, relative to the securities eligible for investment by the Fund across all the various markets on which it may invest. Companies are considered small primarily based on a company’s market capitalisation. Securities are considered value stocks primarily because a company’s shares have a high book value in relation to their market value. In assessing value, the ACD may consider additional factors such as price to cash flow or price to earnings ratios, as well as economic conditions and developments in the issuer’s industry. The criteria the ACD uses for assessing value are subject to change from time to time. The ACD may also modify Fund allocations after considering other factors which the ACD determines to be appropriate, such as free float, momentum, trading strategies, liquidity management, and profitability, as well as other factors that the ACD determines to be appropriate given market conditions. In assessing profitability, the ACD may consider different ratios, such as that of earnings or profits from operations relative to book value or assets.
Emerging market countries are countries that are generally considered to be developing or emerging countries by the World Bank or International Finance Corporation or otherwise are regarded by their own authorities as developing. Currently, the Fund intends to purchase a broad and diverse group of securities of companies which are organised under the laws of, or maintain their principal place of business in, emerging markets countries which are traded on the principal exchanges of Brazil, Chile, China, Colombia, Czech Republic, Greece, Hong Kong, Hungary, India, Indonesia, South Korea, Malaysia, Mexico, Philippines, Poland, Qatar, Saudi Arabia, South Africa, Taiwan, Thailand, Turkey and Unites Arab Emirates and securities or depositary receipts subject to certain requirements set out in the prospectus. The ACD reserves the right to amend the list of countries at any time. Any amendment to this list will be notified in the periodic reports of the Fund.
The investment policy of this Fund is to purchase high quality, investment grade short termfixed income and floating-rate securities and money market instruments issued bygovernmental, quasi-governmental and corporate issuers in developed countries whichmature in five years or less from the date of settlement of the purchase of the instrument.At the present time, developed countries comprise Australia, Austria, Belgium, Canada,Denmark, Finland, France, Germany, Hong Kong, Ireland, Italy, Japan, Luxembourg,Netherlands, New Zealand, Norway, Portugal, Singapore, Spain, Sweden, Switzerland, theUnited Kingdom and the United States of America. The ACD reserves the right to amendthe list of countries at any time with the agreement of the Depositary. Any amendment tothis list will be notified in the periodic reports of the Fund. It is not the current intention ofthe Fund to invest in emerging markets.
Under normal circumstances the Fund will invest most of its assets in investment gradeshort term fixed income and floating-rate securities and money market instruments; it isexpected that most of the assets of the Fund held in foreign currency-denominatedinstruments will be hedged back into the base currency of the portfolio.
Dimensional Fund Advisors Ltd. Interim Report and Financial Statements, 30 June 2020 3

International Value Fund
The investment objective of the International Value Fund (the “Fund”) is to maximise long-term total return.
The investment policy of this Fund is to purchase transferable securities of certain non-United Kingdom companies which the ACD deems eligible value stocks. Generally theFund intends to purchase a broad and diverse group of readily marketable stocks ofcompanies organised under the laws of certain developed countries, excluding the UnitedKingdom, and in securities of companies organised under the laws of other eligiblemarkets, including the United Kingdom, the majority of whose revenues derive from, or themajority of whose business is conducted in these countries. At the present time the Fundmay invest in Australia, Austria, Belgium, Canada, Denmark, Finland, France, Germany,Hong Kong, Ireland, Israel, Italy, Japan, Netherlands, New Zealand, Norway, Portugal,Singapore, Spain, Sweden, Switzerland and the United States of America. The ACDreserves the right to amend the list of countries at any time with the agreement of theDepositary. Securities are considered value stocks primarily because a company’s shareshave a high book value in relation to their market value. In assessing value, the ACD mayconsider additional factors such as price to cash flow or price to earnings ratios, as well aseconomic conditions and developments in the issuer’s industry. The criteria the ACD usesfor assessing value are subject to change from time to time. The Fund’s investmentobjective may also be achieved through the use of depositary receipts representingsecurities of companies meeting the above criteria. The ACD may also modify Fundallocations after considering other factors which the ACD determines to be appropriate,such as free float, momentum, trading strategies, liquidity management, and profitability, aswell as other factors that the ACD determines to be appropriate given market conditions. Inassessing profitability, the ACD may consider different ratios, such as that of earnings orprofits from operations relative to book value or assets.
United Kingdom Small Companies Fund
The investment objective of the United Kingdom Small Companies Fund (the “Fund”) is tomaximise long-term total return.
The investment policy of this Fund is to purchase transferable securities of United Kingdomcompanies which the ACD deems eligible small companies. Generally the Fund intends topurchase a broad and diverse group of readily marketable stocks of United Kingdom smallcompanies which are traded principally on the London Stock Exchange or on an over-the-counter market (primarily United Kingdom over-the-counter market). Companies areconsidered small primarily based on a company’s market capitalisation.
United Kingdom Value Fund
The investment objective of the United Kingdom Value Fund (the “Fund”) is to maximiselong-term total return.
Dimensional Funds ICVC
Investment Objectives and Policies (continued)
International Core Equity Fund
The investment objective of the International Core Equity Fund (the “Fund”) is to maximise long-term total return.
The investment policy of this Fund is to purchase transferable securities of certain non-United Kingdom companies. Generally, the Fund intends to purchase a broad and diverse group of readily marketable stocks of companies organised under the laws of certain developed countries, excluding the United Kingdom and in securities of companies organised under the laws of other eligible markets, including the United Kingdom, the majority of whose revenues derive from, or the majority of whose business is conducted in, these countries. The Fund will generally be overweighted in small companies and in shares which the ACD deems to be eligible value stocks, and underweighted in large growth companies. At the present time, the Fund may invest in Australia, Austria, Belgium, Canada, Denmark, Finland, France, Germany, Hong Kong, Ireland, Israel, Italy, Japan, Netherlands, New Zealand, Norway, Portugal, Singapore, Spain, Sweden, Switzerland and the United States of America. The ACD reserves the right to amend the list of countries at any time with the agreement of the Depositary. Companies are considered small primarily based on a company’s market capitalisation. Securities are considered value stocks primarily because a company’s shares have a high book value in relation to their market value. In assessing value, the ACD may consider additional factors such as price to cash flow or price to earnings ratios, as well as economic conditions and developments in the issuer’s industry. The criteria the ACD uses for assessing value are subject to change from time to time. The Fund’s investment objective may also be achieved through the use of depositary receipts representing securities of companies meeting the above criteria. The ACD may also modify Fund allocations after considering other factors which the ACD determines to be appropriate, such as free float, momentum, trading strategies, liquidity management, and profitability, as well as other factors that the ACD determines to be appropriate given market conditions. In assessing profitability, the ACD may consider different ratios, such as that of earnings or profits from operations relative to book value or assets.
United Kingdom Core Equity Fund
The investment objective of the United Kingdom Core Equity Fund (the “Fund”) is to maximise long-term total return.
The investment policy of this Fund is to purchase transferable securities of United Kingdom companies. Generally the Fund intends to purchase a broad and diverse group of readily marketable stocks of United Kingdom companies traded principally on the London Stock Exchange or an over-the-counter market (primarily the United Kingdom over-the-counter market). The Fund will generally be overweighted in small companies and in shares which the ACD deems to be eligible value stocks, and underweighted in large growth companies. Companies are considered small primarily based on a company’s market capitalisation. Securities are considered to be value stocks primarily because a company’s shares have a high book value in relation to their market value. In assessing value, the ACD may consider additional factors such as price to cash flow or price to earnings ratios, as well as economic conditions and developments in the issuer’s industry. The criteria the ACD uses for assessing value are subject to change from time to time. The ACD may also modify Fund allocations after considering other factors which the ACD determines to be appropriate, such as free float, momentum, trading strategies, liquidity management, and profitability, as well as other factors that the ACD determines to be appropriate given market conditions. In assessing profitability, the ACD may consider different ratios, such as that of earnings or profits from operations relative to book value or assets.
The investment policy of this Fund is to purchase transferable securities of United Kingdomcompanies which the ACD deems eligible value stocks. Generally the Fund intends topurchase a broad and diverse group of readily marketable stocks of United Kingdomcompanies traded principally on the London Stock Exchange or on over-the-countermarket (primarily United Kingdom over-the-counter market) that the ACD determines to bevalue stocks. Securities are considered value stocks primarily because a company’s shareshave a high book value in relation to their market value. In assessing value, the ACD mayconsider additional factors such as price to cash flow or price to earnings ratios, as well aseconomic conditions and developments in the issuer’s industry. The criteria the ACD usesfor assessing value are subject to change from time to time. The ACD may also modifyFund allocations after considering other factors which the ACD determines to beappropriate, such as free float, momentum, trading strategies, liquidity management, andprofitability, as well as other factors that the ACD determines to be appropriate givenmarket conditions. In assessing profitability, the ACD may consider different ratios, such asthat of earnings or profits from operations relative to book value or assets.
Dimensional Fund Advisors Ltd. Interim Report and Financial Statements, 30 June 2020 4

Dimensional Funds ICVC
Authorised Corporate Director’s Investment ReportEmerging Markets Core Equity Fund Global Short-Dated Bond Fund
Costs Costs
Purchases £'000 Purchases £'000
Alibaba ADR 6,951 European Investment Bank FRN 15/01/2025 103,743China Mobile 3,074 UK Treasury 0% 18/05/2020 99,829CNOOC 2,940 Oesterreichische Kontrollbank FRN 22/11/2021 96,027Kweichow Moutai 2,059 French Discount Treasury Bill 0% 29/01/2020 84,779Ping An Insurance Group Co of China 2,022 Monetary Authority of Singapore Bill 0% 14/08/2020 69,160Bank of China 1,425 Canadian Imperial Bank of Commerce FRN 08/07/2020 60,813China Gas 1,364 Nederlandse Waterschapsbank FRN 15/12/2021 (Frankfurt Listing) 60,716Baidu ADR 1,328 Agence Francaise de Developpement EPIC FRN 07/06/2021 56,025New Oriental Education & Technology ADR 1,308 Monetary Authority of Singapore Bill 0% 08/05/2020 50,000ZTO Express Cayman ADR 1,278 Monetary Authority of Singapore Bill 0% 21/08/2020 48,643
Proceeds Proceeds
Sales £'000 Sales £'000
Reliance Industries GDR 1,295 UK Treasury 0% 16/03/2020 150,000Naspers 1,215 UK Treasury 0% 18/05/2020 106,430NCSoft 942 Denmark Government Bond 1.5% 15/11/2023 102,367Grupo Financiero Banorte 871 UK Treasury 0% 23/03/2020 90,000Kingsoft 852 French Discount Treasury Bill 0% 29/01/2020 84,606SK 800 UK Treasury 0% 17/02/2020 80,000Huaneng Renewables 785 Monetary Authority of Singapore Bill 0% 08/05/2020 51,449Top Glove 693 Monetary Authority of Singapore Bill 0% 13/03/2020 50,839GOME Retail 654 Monetary Authority of Singapore Bill 0% 31/01/2020 50,324NetEase ADR 626 UK Treasury 0% 10/02/2020 50,000
The Emerging Markets Core Equity Fund (the “Fund”) invests in companies with increasedexposure to companies with smaller market capitalisations, lower relative prices, andhigher profitability across emerging markets. As of 30 June 2020, the Fund had exposureto approximately 5,200 companies. This reflects our approach of seeking to deliver highlydiversified exposure to emerging markets companies.
The Global Short-Dated Bond Fund (the “Fund”) invests in high-quality fixed incomeinstruments with maturities at or below five years. As of 30 June 2020, the Fund wasdiversified across 8 currencies, and issuers from 17 countries as well as supranationalorganisations.
For the six-month period ending 30 June 2020, the total return of the Fund was -7.59% inBritish pounds. This compares to a total return of -3.28% for the MSCI Emerging MarketIndex (the “Index”). With low relative price (value) stocks underperforming high relativeprice (growth) stocks, the Fund’s greater emphasis on value stocks had a negative impacton relative performance. At the country level, the Fund’s lesser allocation to China alsodetracted from relative performance, as China outperformed the overall Index.
For the six-month period ending 30 June 2020, the total return of the Fund was +0.56% inBritish pounds. This compares to a total return of +2.48% for the FTSE World GovernmentBond Index 1-5 Years (hedged to GBP)(the “Index”). Yield curves were generally flat in theshort-term maturity segment in many developed markets for the period, indicating smallerexpected term premiums. As a result, the Fund’s duration was reduced from 1.75 years atthe beginning of the period to 1.29 years at the end of the period. Realised term premiumswere, however, generally positive across developed markets, and longer-term U.S. dollar-denominated government bonds were generally the best performers. As a result, theFund’s shorter duration and underweight to U.S. dollar-denominated government bonds inthe three- to five-year maturity range detracted from performance relative to the Index.
The top ten purchases and sales during the period were as follows:The top ten purchases and sales during the period were as follows:
Dimensional Fund Advisors Ltd. Interim Report and Financial Statements, 30 June 2020 5

Dimensional Funds ICVC
Authorised Corporate Director’s Investment Report (continued)International Core Equity Fund International Value Fund
Costs Costs
Purchases £'000 Purchases £'000
Facebook 2,214 Pfizer 6,592Comcast 1,982 Verizon Communications 4,863Cisco Systems 1,497 Toyota Motor 3,015Broadcom 1,065 Deere 1,746salesforce.com 1,063 EOG Resources 1,687TOTAL 981 Bristol-Myers Squibb 1,640Walt Disney 960 US Bancorp 1,107Berkshire Hathaway 920 BASF 1,069Schlumberger 801 Westpac Banking 940PepsiCo 733 Dollar Tree 858
Proceeds Proceeds
Sales £'000 Sales £'000
Facebook 3,812 Novartis 3,387TOTAL 1,521 TOTAL 1,928Bank of Montreal (CAD) 1,096 Bank of America 1,925UnitedHealth 990 Walt Disney 1,669Bristol-Myers Squibb 953 Truist Financial 1,299SoftBank Group 832 Banco Santander 1,167Micron Technology 806 UPM-Kymmene 914Nestle 674 Capital One Financial 873E.ON 657 Wells Fargo 866Givaudan 642 Lonza 824
The International Core Equity Fund (the “Fund”) invests in companies with increasedexposure to companies with smaller market capitalisations, lower relative prices, andhigher profitability across non-U.K. developed markets. As of 30 June 2020, the Fund hadexposure to approximately 6,000 companies. This reflects our approach of seeking todeliver highly diversified exposure to non-U.K. developed markets companies.
The International Value Fund (the “Fund”) invests in large-cap low relative price (value)companies across non-U.K. developed markets. As of 30 June 2020, the Fund hadexposure to approximately 700 companies. This reflects our approach of seeking to deliver highly diversified exposure to large-cap value companies in non-U.K. developed markets.
For the six-month period ending 30 June 2020, the total return of the Fund was -3.48% inBritish pounds. This compares to a total return of 2.11% for the MSCI World ex UK Index(the “Index”). With low relative price (value) stocks underperforming high relative price(growth) stocks, the Fund’s greater emphasis on value stocks had a negative impact onrelative performance. With small-cap stocks underperforming large, the Fund’s inclusion ofand emphasis on small-caps also detracted from performance relative to the Index (whichis composed primarily of large- and mid-cap stocks).
For the six-month period ending 30 June 2020, the total return of the Fund was -15.83% inBritish pounds. This compares to a total return of -10.85% for the MSCI World ex UKValue Index (the “Index”). With low relative price (value) stocks underperforming highrelative price (growth) stocks, the Fund’s focus on value stocks detracted fromperformance. The Fund’s greater emphasis on mid caps detracted from relativeperformance, as mid caps underperformed large caps. The Fund’s emphasis on stockswith higher profitability also detracted from relative performance, as higher-profitabilitystocks generally underperformed. At the sector level, the Fund’s general exclusion ofhighly regulated utilities also detracted from relative performance, as utilities outperformedthe overall Index.
The top ten purchases and sales during the period were as follows: The top ten purchases and sales during the period were as follows:
Dimensional Fund Advisors Ltd. Interim Report and Financial Statements, 30 June 2020 6

Dimensional Funds ICVC
Authorised Corporate Director’s Investment Report (continued)United Kingdom Core Equity Fund United Kingdom Small Companies Fund
Costs Costs
Purchases £'000 Purchases £'000
BP 5,204 Marks & Spencer 2,660Rio Tinto 5,141 Hiscox 2,600Reckitt Benckiser 4,483 Weir 1,861BHP 2,455 Centrica 1,612GlaxoSmithKline 1,729 Meggitt 1,586Prudential 1,726 Quilter 1,100Compass 1,545 C&C 1,056M&G 1,458 easyJet 936SSE 1,420 Ascential 791Centrica 1,120 Micro Focus International 713
Proceeds Proceeds
Sales £'000 Sales £'000
BP 7,456 Cobham 5,640Tesco 3,481 Pennon 5,345London Stock Exchange 3,216 Intermediate Capital 5,027British American Tobacco 2,974 Bellway 4,659Experian 2,334 HomeServe 4,036Anglo American 1,583 ConvaTec 3,594Cobham 1,390 boohoo 2,931BAE Systems 1,306 Howden Joinery 2,650AstraZeneca 1,147 El 2,280EI 1,031 GVC 1,618
The United Kingdom Core Equity Fund (the “Fund”) invests in U.K. companies withincreased exposure to companies with smaller market capitalisations, lower relative prices,and higher profitability. As of 30 June 2020, the Fund had exposure to approximately 470companies. This reflects our approach of seeking to deliver highly diversified exposure toU.K. companies.
The United Kingdom Small Companies Fund (the “Fund”) invests in U.K. small companies. As of 30 June 2020, the Fund had holdings in approximately 370 companies. This reflectsour approach of seeking to deliver highly diversified exposure to U.K. small companies.
For the six-month period ending 30 June 2020, the total return of the Fund was -19.41% inBritish pounds. This compares to a total return of -18.40% for the MSCI United KingdomIMI Index (the “Index”). The Fund’s greater emphasis on stocks with smaller capitalisationsdetracted from relative performance, as small-caps underperformed large-caps.
The Fund seeks to capture the returns of the U.K. market. The Index has been includedfor market context purposes only.
For the six-month period ending 30 June 2020, the total return of the Fund in Britishpounds was -23.99%. This compares to a total return of -21.91% for the MSCI UnitedKingdom Small Cap Index (the “Index”). The Fund’s exclusion of stocks with the lowestprofitability and highest relative price detracted from relative performance, as thosesecurities outperformed. The Fund’s greater allocation to micro-caps and consequentlesser allocation to small-caps with larger market capitalizations also detracted fromrelative performance, as micro-caps underperformed the larger small-caps held by theIndex.
The top ten purchases and sales during the period were as follows: The top ten purchases and sales during the period were as follows:
Dimensional Fund Advisors Ltd. Interim Report and Financial Statements, 30 June 2020 7

Dimensional Funds ICVC
Authorised Corporate Director’s Investment Report (continued)United Kingdom Value Fund
Costs
Purchases £'000
BHP 12,181Rio Tinto 9,293Lloyds Banking 7,578Prudential 5,068Royal Dutch Shell 'B' 4,028Mondi 3,955BT 2,478Johnson Matthey 2,461Legal & General 2,179DCC 2,036
Proceeds
Sales £'000
3i 3,730BHP 3,279Tesco 2,841Cobham 2,066Anglo American 2,004Ei Group 1,688Standard Life Aberdeen 1,335Vodafone 1,253Persimmon 1,150Barclays 615
The United Kingdom Value Fund (the “Fund”) invests in U.K. low relative price (value)companies. As of 30 June 2020, the Fund had holdings in approximately 220 companies.This reflects our approach of seeking to deliver highly diversified exposure to U.K. valuecompanies.
For the six-month period ending 30 June 2020, the total return of the Fund was -27.57% inBritish pounds. This compares to a total return of -18.40% for the MSCI United KingdomIMI Index (the “Index”). With low relative price (value) stocks underperforming high relativeprice (growth) stocks, the Fund’s focus on value stocks detracted from performancerelative to the style-neutral Index. At the sector level, the Fund’s general exclusion ofhighly regulated utilities also detracted from relative performance, as utilities outperformedthe overall Index.
The top ten purchases and sales during the period were as follows:
Dimensional Fund Advisors Ltd. Interim Report and Financial Statements, 30 June 2020 8

Dimensional Funds ICVC
o
o
Saudi Stock Exchange (Tadawul) Shanghai- Hong Kong Stock Connect Shenzhen- Hong Kong Stock Connect; and
o
o
o
o
o
o
o
o
bail-in risk; call-in risk; investment in other collective investment schemes; market suspension risk; regional concentration risk; and pandemic risk;
o
o
o
o
o
o
o Update the description of how investors can obtain information regarding the portfolio holdings of each Fund.
Political instability and economic uncertainty associated with the United Kingdom's ("UK")exit from the European Union ("Brexit") may lead to speculation and market volatility,particularly for assets denominated in GBP.
The implications of Brexit extend well beyond the UK economy and financial markets,impacting multinational organisations globally. The ACD continues to monitor Brexit and thepotential impact to the Funds and their activities.
Beginning in January 2020, global financial markets have experienced and may continue toexperience significant volatility resulting from the spread of a novel coronavirus known asCOVID-19. The outbreak of COVID-19 has resulted in travel and border restrictions,quarantines, supply chain disruptions, lower consumer demand and general marketuncertainty. The effects of COVID-19 have and may continue to adversely affect the globaleconomy, the economies of certain nations and individual issuers, all of which maynegatively impact the performance of the Funds.
26 February 2020, the main changes were as follows:For the Emerging Markets Core Equity Fund, add China, Qatar, Saudi Arabia, andUnited Emirates to the list of emerging markets eligible for investment;Add the following markets as eligible markets for the Funds:
23 April 2020, the main changes were as follows:Update the Brexit risk factor to reflect the UK’s departure from the EU and thecommencement of the transitional period;Update the annual capital gains exemption for 2020/2021;Revise management fees for Emerging Markets Core Equity Fund, Global Short-Dated Bond Fund and International Core Equity Fund to reflect a reduction in themanagement fee payable to the ACD;
Update historical performance for the Funds; andUpdate the list of the Depositary’s sub-custodians.
Update a number of the existing risk factors (e.g. for Brexit and liquidity risk) and addcertain new risk factors including for:
Past performance is not necessarily a guide to future performance. The value of shares cango down as well as up and is not guaranteed. Changes in rates of exchange may alsocause the value of shares to fluctuate.
Potential Implications of Brexit
The Company represents segregated portfolios of assets and, accordingly, assets of a Fundbelong exclusively to that Fund and shall not be used or made available to discharge(directly or indirectly) the liabilities of, or claims against, any other person or body, includingthe Company and any other Fund and shall not be available for any such purpose.Shareholders are not liable for debts of the Company.
Regulatory Disclosure
2 June 2020, the main changes were as follows:Amend introductory disclosures, including emphasising the importance of reviewingthe prospectus and key investor information document prior to investing;
Update description of the anti-money laundering arrangements following thetransposition of the fourth Anti-Money Laundering Directive into the UK;
Expand description of securities lending arrangements to provide additionalinformation to investors;
Events during the Financial Period
The prospectus of the Company was updated on the following dates:
Fund Cross-HoldingsNo Fund held shares in any other Fund of the Company during the period ending 30 June2020.
Fund and Shareholder Liability
International Core Equity FundInternational Value FundUnited Kingdom Core Equity FundUnited Kingdom Small Companies FundUnited Kingdom Value Fund
The base currency for the Company is United Kingdom Pounds Sterling. The Company is ofunlimited duration.
The FundsThe Company is structured as an “umbrella” company and comprises seven authorisedinvestment Funds. The Company and each Fund are classified as an Undertaking forCollective Investment in Transferable Securities (UCITS). Different Funds may beestablished from time to time by the ACD with the agreement of the Depositary andapproval of the FCA. The Funds are operated separately and the assets of each Fund aremanaged in accordance with the investment objective and policy applicable to that Fund.The following Funds are currently available:
Emerging Markets Core Equity FundGlobal Short-Dated Bond Fund
Change of name of entities that act as registrar and perform the transfer agencyfunction;
The ACD presents the unaudited interim report and financial statements of DimensionalFunds ICVC (the “Company”) for the period ended 30 June 2020.
Incorporation and Share CapitalThe Company is an Open-Ended Investment Company ("OEIC") with variable capitalincorporated with limited liability and registered in England and Wales under numberIC000258 and authorised by the Financial Conduct Authority ("FCA") on 24 September2003 under the Open-Ended Investment Companies Regulations 2001 (the “Regulations”).
The maximum share capital of the Company is £500,000,000,000 and the minimum sharecapital is £100. Shares have no par value. The share capital of the Company at all timesequals the aggregate net asset values of the sub-funds of the Company (each a “Fund” andtogether the “Funds”).
This document has been issued by Dimensional Fund Advisors Ltd. (Authorised andRegulated by the FCA Firm Reference Number 150100) as ACD.
Update certain information regarding the ACD’s policies, including updating detailsregarding how conflicts of interest are identified and managed, the ACD’s use ofdealing commissions and the ACD’s approach to research, and expresslyreferencing the ACD’s UK stewardship code statement on its website; and
Update disclosure of relevant taxation matters, and the description of the OECD Common Reporting Standard and the U.S. Foreign Account Tax Compliance Act;
Clarify the accompanying description of the minimum investment and holdingamount, including to expressly state that a request by an investor to deal in sharesmay be refused if it would cause the investor to fall below such an amount (subject toany waiver by the ACD);
Add disclosure regarding the ability of an investor to transfer shares to another person;
Dimensional Fund Advisors Ltd. Interim Report and Financial Statements, 30 June 2020 9

Dimensional Funds ICVC
Value AssessmentAn Annual statement on the Assessment of Value is available for all applicable funds managed by Dimensional Fund Advisors Ltd. at www.dimensional.com.
Authorised Corporate Director's Statement.This report has been prepared in accordance with the requirements ofFCA Rules and COLL, as issued and amended from time to time.
The financial statements on pages 139 to 140 were approved on 21 August 2020 by the ACD and signed on their behalf by:
Nathan Lacaze
Dimensional Fund Advisors Ltd. Interim Report and Financial Statements, 30 June 2020 10

Emerging Markets Core Equity Fund
Price and Distribution Record
Capital (share prices)
The table below shows the highest and lowest share prices for the last 5 years and the current interim period.
Calendar Year Highest (p) Lowest (p) Highest (p) Lowest (p)
3,141.00 2,222.00 3,719.00 2,642.00
3,447.00 2,220.00 4,183.00 2,681.00
3,913.00 3,189.00 4,835.00 3,924.00
4,008.00 3,263.00 5,019.00 4,105.00
3,815.00 3,363.00 4,906.00 4,307.00
3,829.00 2,702.00 5,013.00 3,527.00
Calendar Year Highest (¢) Lowest (¢) Highest (¢) Lowest (¢)
1,236.00 862.00 1,239.00 868.00
1,100.00 811.00 1,130.00 829.00
1,252.00 1,070.00 1,310.00 1,115.00
1,291.00 1,054.00 1,369.00 1,122.00
1,270.00 1,057.00 1,383.00 1,147.00
1,278.00 825.40 1,413.00 912.20
* 1 January 2020 to 30 June 2020
Net Revenue Distributions/Accumulations
Income Shares
Accumulation Shares
Euro Income Shares
Euro Accumulation Shares
Calendar Year Pence Per Share Pence Per Share Cents Per Share Cents Per Share
2015 49.5237 58.7824 19.2631 19.3674
2016 58.1469 70.4082 19.2766 19.7516
2017 66.7568 82.3443 21.6108 22.5606
2018 77.4313 97.2276 24.5793 26.1271
2019 71.8326 92.2510 23.5716 25.6399
2020* 17.7390 23.1510 5.5110 6.0925
* 1 January 2020 to 30 June 2020
2015
2016
2017
2018
2019
2018
2019
2020*
Euro Income Shares Euro Accumulation Shares
Income Shares Accumulation Shares
2015
2016
2017
2020*
The table below shows the net revenue distribution earned on income shares and the net revenue automatically reinvested in respect of accumulation shares for the last 5 years and the current interim period.
Dimensional Fund Advisors Ltd. Interim Report and Financial Statements, 30 June 2020 11

Emerging Markets Core Equity Fund
Price and Distribution Record (continued)
Fund Size
The table below shows the net asset values for the last three final accounting dates and the current interim period.
Net Assets Number of Net Assets Number of
Total Net Per Share (p) Shares in Issue Per Share (p) Shares in Issue
Accounting Date Asset Value (£) Income Income Accumulation Accumulation
31/12/2017 1,432,464,203 3,850.00 17,064,486 4,822.00 12,862,643
31/12/2018 1,304,707,232 3,389.00 17,366,518 4,341.00 12,592,860
31/12/2019 1,280,546,813 3,700.00 15,172,825 4,831.00 11,685,191
30/06/2020 1,271,765,962 3,400.00 16,633,420 4,462.00 11,924,595
Net Assets Number of Net Assets Number of
Total Net Per Share (¢) Shares in Issue Per Share (¢) Shares in Issue
Accounting Date Asset Value (£) Euro Income Euro Income Euro Accumulation Euro Accumulation
31/12/2017 1,432,464,203 1,232.00 7,542,926 1,306.00 6,160,330
31/12/2018 1,304,707,232 1,073.00 9,739,280 1,163.00 7,256,878
31/12/2019 1,280,546,813 1,236.00 6,598,580 1,366.00 7,338,728
30/06/2020 1,271,765,962 1,057.00 9,974,037 1,174.00 7,259,976
Ongoing Charges Figure (OCF)
The OCF of the Emerging Markets Core Equity Fund for all four share classes was 0.56%* as at 30 June 2020 (31 December 2019: 0.67%).
* The ongoing charges figure shown here is an annualised estimate of the charges as there has been a reasonably significant difference to the last reported ongoing charges figure.
Synthetic Risk and Reward Indicator
Lower risk Higher risk
Typically lower rewards Typically higher rewards
1 2 3 4 5 6 7
Synthetic Risk and Reward Indicator as at 31 December 2019: 6
● The risk and reward category is calculated using historical data which may not be a reliable indicator of the Fund's future risk profile.
● The risk and reward category may shift over time and is not a target or guarantee.
● The lowest category (i.e. category 1) does not mean a risk-free investment.
● The Fund is Category 6 because of the high range and frequency of price movements (volatility) of the underlying investments within the Fund.
Past performance is not necessarily a guide to future performance. Investors are reminded that the price of shares and the income from your investment may fluctuate and may be affected by exchange rate variations.
The OCF is the ratio of the Fund’s total disclosure costs (excluding overdraft interest) to the average net assets of the Fund. It may vary from period to period. It excludes portfolio transaction costs and performance fees, if any.
Dimensional Fund Advisors Ltd. Interim Report and Financial Statements, 30 June 2020 12

Global Short-Dated Bond Fund
Price and Distribution Record
Capital (share prices)
The table below shows the highest and lowest share prices for the last 5 years and the current interim period.
Calendar Year Highest (p) Lowest (p) Highest (p) Lowest (p)
1,229.00 1,208.00 1,542.00 1,509.00
1,250.00 1,211.00 1,586.00 1,529.00
1,234.00 1,216.00 1,584.00 1,555.00
1,210.00 1,194.00 1,572.00 1,551.00
1,233.00 1,201.00 1,617.00 1,570.00
1,231.00 1,219.00 1,619.00 1,603.00
Calendar Year Highest (p) Lowest (p) Highest (p) Lowest (p)
1,061.00 1,042.00 1,110.00 1,083.00
1,080.00 1,044.00 1,144.00 1,101.00
1,064.00 1,049.00 1,144.00 1,123.00
1,044.00 1,030.00 1,135.00 1,121.00
1,063.00 1,036.00 1,168.00 1,134.00
1,062.00 1,052.00 1,169.00 1,158.00
* 1 January 2020 to 30 June 2020
Net Revenue Distributions/Accumulations
Income Shares
Accumulation Shares
Gross Income Shares
Gross Accumulation Shares
Calendar Year Pence Per Share Pence Per Share Pence Per Share Pence Per Share
2015 15.0342 18.8255 16.2097 16.8991
2016 15.2271 19.2936 16.4046 17.3646
2017 16.6500 21.3700 14.3700 15.4300
2018 10.5935 13.7659 9.1352 9.9456
2019 6.3899 8.3687 5.5125 6.0444
2020* 2.2904 3.0103 1.9756 2.1747
* 1 January 2020 to 30 June 2020
2016
Income Shares Accumulation Shares
2015
2016
2017
2018
2019
2020*
Gross Income Shares Gross Accumulation Shares
2015
2017
2018
2019
2020*
The table below shows the net revenue distribution earned on income shares and the net revenue automatically reinvested in respect of accumulation shares for the last 5 years and the current interim period.
Dimensional Fund Advisors Ltd. Interim Report and Financial Statements, 30 June 2020 13

Global Short-Dated Bond Fund
Price and Distribution Record (continued)
Fund Size
The table below shows the net asset values for the last three final accounting dates and the current interim period.
Net Assets Number of Net Assets Number of
Total Net Per Share (p) Shares in Issue Per Share (p) Shares in Issue
Accounting Date Asset Value (£) Income Income Accumulation Accumulation
31/12/2017 4,279,934,749 1,209.00 102,893,119 1,567.00 87,485,753
31/12/2018 4,649,458,700 1,201.00 108,128,467 1,571.00 99,772,583
31/12/2019 5,051,100,175 1,224.00 111,804,274 1,609.00 108,143,661
30/06/2020 4,900,482,273 1,228.00 111,324,759 1,617.00 101,763,182
Net Assets Number of Net Assets Number of
Total Net Per Share (p) Shares in Issue Per Share (p) Shares in Issue
Accounting Date Asset Value (£) Gross Income Gross Income Gross Accumulation Gross Accumulation
31/12/2017 4,279,934,749 1,043.00 79,768,718 1,132.00 73,656,878
31/12/2018 4,649,458,700 1,036.00 81,780,789 1,135.00 82,508,707
31/12/2019 5,051,100,175 1,056.00 88,560,643 1,162.00 86,790,192
30/06/2020 4,900,482,273 1,059.00 85,729,823 1,168.00 83,885,053
Ongoing Charges Figure (OCF)
The OCF of the Global Short-Dated Bond Fund for all four share classes was 0.28%* as at 30 June 2020 (31 December 2019: 0.30%).
* The ongoing charges figure shown here is an annualised estimate of the charges as there has been a reasonably significant difference to the last reported ongoing charges figure.
Synthetic Risk and Reward Indicator
Lower risk Higher risk
Typically lower rewards Typically higher rewards
1 2 3 4 5 6 7
Synthetic Risk and Reward Indicator as at 31 December 2019: 2
● The risk and reward category is calculated using historical data which may not be a reliable indicator of the Fund's future risk profile.
● The risk and reward category may shift over time and is not a target or guarantee.
● The lowest category (i.e. category 1) does not mean a risk-free investment.
● The Fund is Category 2 because of the low range and frequency of price movements (volatility) of the underlying investments within the Fund.
The OCF is the ratio of the Fund’s total disclosure costs (excluding overdraft interest) to the average net assets of the Fund. It may vary from period to period. It excludes portfolio transaction costs and performance fees, if any.
Past performance is not necessarily a guide to future performance. Investors are reminded that the price of shares and the income from your investment may fluctuate and may be affected by exchange rate variations.
Dimensional Fund Advisors Ltd. Interim Report and Financial Statements, 30 June 2020 14

International Core Equity Fund
Price and Distribution Record
Capital (share prices)
The table below shows the highest and lowest share prices for the last 5 years and the current interim period.
Calendar Year Highest (p) Lowest (p) Highest (p) Lowest (p)
1,598.00 1,344.00 1,801.00 1,523.00
1,948.00 1,319.00 2,246.00 1,512.00
2,131.00 1,898.00 2,496.00 2,212.00
2,278.00 1,923.00 2,708.00 2,286.00
2,393.00 1,930.00 2,897.00 2,324.00
2,418.00 1,747.00 2,961.00 2,140.00
* 1 January 2020 to 30 June 2020
Net Revenue Distributions/Accumulations
Income Shares
Accumulation Shares
Calendar Year Pence Per Share Pence Per Share
2015 24.6116 27.8065
2016 29.8209 34.2696
2017 31.5489 36.8455
2018 35.0711 41.5848
2019 39.1852 47.2910
2020* 9.9713 12.2119
* 1 January 2020 to 30 June 2020
Fund Size
The table below shows the net asset values for the last three final accounting dates and the current interim period.
Net Assets Number of Net Assets Number of
Total Net Per Share (p) Shares in Issue Per Share (p) Shares in Issue
Accounting Date Asset Value (£) Income Income Accumulation Accumulation
31/12/2017 763,601,401 2,101.00 22,699,554 2,486.00 11,531,920
31/12/2018 782,950,640 1,941.00 25,466,460 2,337.00 12,354,580
31/12/2019 1,057,461,936 2,318.00 29,061,185 2,840.00 13,514,031
30/06/2020 1,020,324,221 2,228.00 29,312,827 2,741.00 13,402,481
Income Shares Accumulation Shares
2015
2016
2017
2018
2019
2020*
The table below shows the net revenue distribution earned on income shares and the net revenue automatically reinvested in respect of accumulation shares for the last 5 years and the current interim period.
Past performance is not necessarily a guide to future performance. Investors are reminded that the price of shares and the income from your investment may fluctuate and may be affected by exchange rate variations.
Dimensional Fund Advisors Ltd. Interim Report and Financial Statements, 30 June 2020 15

International Core Equity Fund
Price and Distribution Record (continued)Ongoing Charges Figure (OCF)
The OCF of the International Core Equity Fund for both share classes was 0.30%* as at 30 June 2020 (31 December 2019: 0.34%).
* The ongoing charges figure shown here is an annualised estimate of the charges as there has been a reasonably significant difference to the last reported ongoing charges figure.
Synthetic Risk and Reward Indicator
Lower risk Higher risk
Typically lower rewards Typically higher rewards
1 2 3 4 5 6 7
Synthetic Risk and Reward Indicator as at 31 December 2019: 5
● The risk and reward category is calculated using historical data which may not be a reliable indicator of the Fund's future risk profile.
● The risk and reward category may shift over time and is not a target or guarantee.
● The lowest category (i.e. category 1) does not mean a risk-free investment.
● The Fund is Category 5 because of the high range and frequency of price movements (volatility) of the underlying investments within the Fund.
The OCF is the ratio of the Fund’s total disclosure costs (excluding overdraft interest) to the average net assets of the Fund. It may vary from period to period. It excludes portfolio transaction costs and performance fees, if any.
Dimensional Fund Advisors Ltd. Interim Report and Financial Statements, 30 June 2020 16

International Value Fund
Price and Distribution Record
Capital (share prices)
The table below shows the highest and lowest share prices for the last 5 years and the current interim period.
Calendar Year Highest (p) Lowest (p) Highest (p) Lowest (p)
1,969.00 1,617.00 2,327.00 1,923.00
2,400.00 1,526.00 2,910.00 1,838.00
2,570.00 2,291.00 3,168.00 2,809.00
2,646.00 2,224.00 3,321.00 2,791.00
2,667.00 2,215.00 3,425.00 2,824.00
2,625.00 1,725.00 3,422.00 2,248.00
* 1 January 2020 to 30 June 2020
Net Revenue Distributions/Accumulations
Income Shares
Accumulation Shares
Calendar Year Pence Per Share Pence Per Share
2015 33.5702 39.7674
2016 38.3643 46.3283
2017 42.8579 52.6450
2018 50.6955 63.3833
2019 56.8752 72.7022
2020* 13.6685 17.8141
* 1 January 2020 to 30 June 2020
Fund Size
The table below shows the net asset values for the last three final accounting dates and the current interim period.
Net Assets Number of Net Assets Number of
Total Net Per Share (p) Shares in Issue Per Share (p) Shares in Issue
Accounting Date Asset Value (£) Income Income Accumulation Accumulation
31/12/2017 500,949,440 2,529.00 9,507,420 3,154.00 8,261,482
31/12/2018 439,773,445 2,232.00 9,190,639 2,845.00 8,246,914
31/12/2019 478,165,103 2,572.00 7,886,440 3,353.00 8,212,239
30/06/2020 398,581,390 2,151.00 7,947,514 2,821.00 8,068,841
Income Shares Accumulation Shares
2015
2016
2017
2018
2019
2020*
The table below shows the net revenue distribution earned on income shares and the net revenue automatically reinvested in respect of accumulation shares for the last 5 years and the current interim period.
Past performance is not necessarily a guide to future performance. Investors are reminded that the price of shares and the income from your investment may fluctuate and may be affected by exchange rate variations.
Dimensional Fund Advisors Ltd. Interim Report and Financial Statements, 30 June 2020 17

International Value Fund
Price and Distribution Record (continued)Ongoing Charges Figure (OCF)
The OCF of the International Value Fund for both share classes was 0.39%* as at 30 June 2020 (31 December 2019: 0.42%).
* The OCF is based on the annualised estimate of the expenses for the period ending 30 June 2020.
Synthetic Risk and Reward Indicator
Lower risk Higher risk
Typically lower rewards Typically higher rewards
1 2 3 4 5 6 7
Synthetic Risk and Reward Indicator as at 31 December 2019: 5
● The risk and reward category is calculated using historical data which may not be a reliable indicator of the Fund's future risk profile.
● The risk and reward category may shift over time and is not a target or guarantee.
● The lowest category (i.e. category 1) does not mean a risk-free investment.
● The Fund is Category 6 because of the high range and frequency of price movements (volatility) of the underlying investments within the Fund.
The OCF is the ratio of the Fund’s total disclosure costs (excluding overdraft interest) to the average net assets of the Fund. It may vary from period to period. It excludes portfolio transaction costs and performance fees, if any.
Dimensional Fund Advisors Ltd. Interim Report and Financial Statements, 30 June 2020 18

United Kingdom Core Equity Fund
Price and Distribution Record
Capital (share prices)
The table below shows the highest and lowest share prices for the last 5 years and the current interim period.
Calendar Year Highest (p) Lowest (p) Highest (p) Lowest (p)
1,400.00 1,193.00 1,808.00 1,568.00
1,409.00 1,101.00 1,910.00 1,467.00
1,557.00 1,401.00 2,166.00 1,919.00
1,633.00 1,349.00 2,298.00 1,936.00
1,607.00 1,342.00 2,396.00 1,960.00
1,581.00 982.00 2,398.00 1,490.00
* 1 January 2020 to 30 June 2020
Net Revenue Distributions/Accumulations
Income Shares
Accumulation Shares
Calendar Year Pence Per Share Pence Per Share
2015 39.4109 51.3065
2016 35.9304 48.1769
2017 40.8234 56.3009
2018 54.3328 77.1581
2019 58.7241 86.6205
2020* 18.2642 27.6894
* 1 January 2020 to 30 June 2020
Fund Size
The table below shows the net asset values for the last three final accounting dates and the current interim period.
Net Assets Number of Net Assets Number of
Total Net Per Share (p) Shares in Issue Per Share (p) Shares in Issue
Accounting Date Asset Value (£) Income Income Accumulation Accumulation
31/12/2017 687,968,764 1,538.00 27,066,628 2,164.00 12,556,660
31/12/2018 630,612,232 1,347.00 27,035,280 1,967.00 13,546,931
31/12/2019 798,405,326 1,558.00 27,297,627 2,364.00 15,780,396
30/06/2020 655,784,002 1,237.00 28,039,468 1,904.00 16,228,222
Income Shares Accumulation Shares
2015
2016
2017
2018
2019
2020*
The table below shows the net revenue distribution earned on income shares and the net revenue automatically reinvested in respect of accumulation shares for the last 5 years and the current interim period.
Past performance is not necessarily a guide to future performance. Investors are reminded that the price of shares and the income from your investment may fluctuate and may be affected by exchange rate variations.
Dimensional Fund Advisors Ltd. Interim Report and Financial Statements, 30 June 2020 19

United Kingdom Core Equity Fund
Price and Distribution Record (continued)Ongoing Charges Figure (OCF)
The OCF of the United Kingdom Core Equity Fund for both share classes was 0.22%* as at 30 June 2020 (31 December 2019: 0.24%).
* The OCF is based on the annualised estimate of the expenses for the period ending 30 June 2020.
Synthetic Risk and Reward Indicator
Lower risk Higher risk
Typically lower rewards Typically higher rewards
1 2 3 4 5 6 7
Synthetic Risk and Reward Indicator as at 31 December 2019: 5
● The risk and reward category is calculated using historical data which may not be a reliable indicator of the Fund's future risk profile.
● The risk and reward category may shift over time and is not a target or guarantee.
● The lowest category (i.e. category 1) does not mean a risk-free investment.
● The Fund is Category 5 because of the high range and frequency of price movements (volatility) of the underlying investments within the Fund.
The OCF is the ratio of the Fund’s total disclosure costs (excluding overdraft interest) to the average net assets of the Fund. It may vary from period to period. It excludes portfolio transaction costs and performance fees, if any.
Dimensional Fund Advisors Ltd. Interim Report and Financial Statements, 30 June 2020 20

United Kingdom Small Companies Fund
Price and Distribution Record
Capital (share prices)
The table below shows the highest and lowest share prices for the last 5 years and the current interim period.
Calendar Year Highest (p) Lowest (p) Highest (p) Lowest (p)
2,984.00 2,523.00 3,766.00 3,185.00
3,008.00 2,477.00 3,948.00 3,202.00
3,371.00 2,903.00 4,530.00 3,850.00
3,482.00 2,757.00 4,723.00 3,788.00
3,573.00 2,777.00 5,053.00 3,868.00
3,535.00 1,944.00 5,058.00 2,781.00
* 1 January 2020 to 30 June 2020
Net Revenue Distributions/Accumulations
Income Shares
Accumulation Shares
Calendar Year Pence Per Share Pence Per Share
2015 67.7759 86.0522
2016 70.4026 91.6107
2017 72.0872 96.1606
2018 82.3905 112.4345
2019 88.3073 123.9066
2020* 6.2460 8.9300
* 1 January 2020 to 30 June 2020
Fund Size
The table below shows the net asset values for the last three final accounting dates and the current interim period.
Net Assets Number of Net Assets Number of
Total Net Per Share (p) Shares in Issue Per Share (p) Shares in Issue
Accounting Date Asset Value (£) Income Income Accumulation Accumulation
31/12/2017 476,524,466 3,336.00 6,941,078 4,526.00 5,412,200
31/12/2018 385,463,937 2,765.00 6,825,421 3,853.00 5,105,960
31/12/2019 474,515,268 3,514.00 6,703,094 5,028.00 4,752,899
30/06/2020 354,002,496 2,662.00 6,924,659 3,818.00 4,444,860
Income Shares Accumulation Shares
2015
2016
2017
2018
2019
2020*
The table below shows the net revenue distribution earned on income shares and the net revenue automatically reinvested in respect of accumulation shares for the last 5 years and the current interim period.
Past performance is not necessarily a guide to future performance. Investors are reminded that the price of shares and the income from your investment may fluctuate and may be affected by exchange rate variations.
Dimensional Fund Advisors Ltd. Interim Report and Financial Statements, 30 June 2020 21

United Kingdom Small Companies Fund
Price and Distribution Record (continued)Ongoing Charges Figure (OCF)
The OCF of the United Kingdom Small Companies Fund for both share classes was 0.56%* as at 30 June 2020 (31 December 2019: 0.59%).
* The OCF is based on the annualised estimate of the expenses for the period ending 30 June 2020.
Synthetic Risk and Reward Indicator
Lower risk Higher risk
Typically lower rewards Typically higher rewards
1 2 3 4 5 6 7
Synthetic Risk and Reward Indicator as at 31 December 2019: 5
● The risk and reward category is calculated using historical data which may not be a reliable indicator of the Fund's future risk profile.
● The risk and reward category may shift over time and is not a target or guarantee.
● The lowest category (i.e. category 1) does not mean a risk-free investment.
● The Fund is Category 5 because of the high range and frequency of price movements (volatility) of the underlying investments within the Fund.
The OCF is the ratio of the Fund’s total disclosure costs (excluding overdraft interest) to the average net assets of the Fund. It may vary from period to period. It excludes portfolio transaction costs and performance fees, if any.
Dimensional Fund Advisors Ltd. Interim Report and Financial Statements, 30 June 2020 22

United Kingdom Value Fund
Price and Distribution Record
Capital (share prices)
The table below shows the highest and lowest share prices for the last 5 years and the current interim period.
Calendar Year Highest (p) Lowest (p) Highest Lowest
1,650.00 1,275.00 2,226.00 1,753.00
1,567.00 1,142.00 2,229.00 1,594.00
1,770.00 1,574.00 2,575.00 2,257.00
1,853.00 1,463.00 2,729.00 2,200.00
1,692.00 1,445.00 2,657.00 2,216.00
1,656.00 952.20 2,654.00 1,526.00
* 1 January 2020 to 30 June 2020
Net Revenue Distributions/Accumulations
Income Shares
Accumulation Shares
Calendar Year Pence Per Share Cents Per Share
2015 49.6091 67.4369
2016 37.1697 52.1932
2017 44.7176 64.5839
2018 64.9519 96.5663
2019 71.9783 111.6457
2020* 16.1195 25.8344
* 1 January 2020 to 30 June 2020
Fund Size
The table below shows the net asset values for the last three final accounting dates and the current interim period.
Net Assets Number of Net Assets Number of
Total Net Per Share (p) Shares in Issue Per Share Shares in Issue
Accounting Date Asset Value (£) Income Income Accumulation Accumulation
31/12/2017 614,698,988 1,748.00 16,034,119 2,573.00 13,004,339
31/12/2018 522,369,133 1,458.00 15,885,307 2,236.00 13,000,961
31/12/2019 602,278,841 1,637.00 15,796,571 2,625.00 13,093,494
30/06/2020 480,652,182 1,170.00 17,084,009 1,900.00 14,777,676
Income Shares Accumulation Shares
2015
2016
2017
2018
2019
2020*
The table below shows the net revenue distribution earned on income shares and the net revenue automatically reinvested in respect of accumulation shares for the last 5 years and the current interim period.
Past performance is not necessarily a guide to future performance. Investors are reminded that the price of shares and the income from your investment may fluctuate and may be affected by exchange rate variations.
Dimensional Fund Advisors Ltd. Interim Report and Financial Statements, 30 June 2020 23

United Kingdom Value Fund
Price and Distribution Record (continued)Ongoing Charges Figure (OCF)
The OCF of the United Kingdom Value Fund for both share classes was 0.39%* as at 30 June 2020 (31 December 2019: 0.42%).
* The OCF is based on the annualised estimate of the expenses for the period ending 30 June 2020.
Synthetic Risk and Reward Indicator
Lower risk Higher risk
Typically lower rewards Typically higher rewards
1 2 3 4 5 6 7
Synthetic Risk and Reward Indicator as at 31 December 2019: 5
● The risk and reward category is calculated using historical data which may not be a reliable indicator of the Fund's future risk profile.
● The risk and reward category may shift over time and is not a target or guarantee.
● The lowest category (i.e. category 1) does not mean a risk-free investment.
● The Fund is Category 6 because of the high range and frequency of price movements (volatility) of the underlying investments within the Fund.
The OCF is the ratio of the Fund’s total disclosure costs (excluding overdraft interest) to the average net assets of the Fund. It may vary from period to period. It excludes portfolio transaction costs and performance fees, if any.
Dimensional Fund Advisors Ltd. Interim Report and Financial Statements, 30 June 2020 24

Emerging Markets Core Equity Fund
Portfolio Statementas at 30 June 2020
Holding Investment
Fair
Value
£'000
Percentage
of total
net assets
% Holding Investment
Fair
Value
£'000
Percentage
of total
net assets
%
Brazil 6.11% (9.55%) Brazil (continued)
87,683 AES Tiete Energia 208 0.02 101,648 Cia Siderurgica Nacional 161 0.01
31,658 Aliansce Sonae Shopping Centers 135 0.01 389,911 Cia Siderurgica Nacional ADR 605 0.05
27,460 Alliar Medicos A Frente 42 - 410,106 Cielo 284 0.02
32,325 Alpargatas Preference Shares 143 0.01 699,800 Cogna Educacao 687 0.05
49,084 Alupar Investimento 178 0.01 31,903 Construtora Tenda 146 0.01
676,048 AMBEV ADR 1,473 0.12 33,653 Cosan 355 0.03
11,700 Anima 42 - 73,688 Cosan Logistica 214 0.02
21,211 Arezzo Industria e Comercio 151 0.01 33,800 CSU Cardsystem 68 0.01
36,078 Atacadao 108 0.01 48,541 CVC Brasil Operadora e Agencia de
30,974 Azul ADR 286 0.02 Viagens 133 0.01
20,808 B2W Cia Digital 331 0.03 1,200 Cyrela Commercial Properties
93,558 B3 - Brasil Bolsa Balcao 767 0.06 Empreendimentos e Participacoes 3 -
48,817 Banco ABC Brasil Preference Shares 104 0.01 9,000 Dimed Distribuidora da Medicamentos 40 -
220,085 Banco Bradesco 648 0.05 34,518 Direcional Engenharia 79 0.01
498,605 Banco Bradesco ADR 1,581 0.12 157,315 Duratex 303 0.02
308,413 Banco Bradesco Preference Shares 993 0.08 87,841 EcoRodovias Infraestrutura e
20,412 Banco BTG Pactual 232 0.02 Logistica 171 0.01
134,378 Banco do Brasil 675 0.05 98,247 EDP - Energias do Brasil 258 0.02
158,379 Banco do Estado do Rio Grande do Sul 93,508 Embraer ADR 473 0.04
Preference Shares 332 0.03 33,732 Enauta Participacoes 52 -
75,537 Banco Santander Brasil 330 0.03 71,878 Energisa 525 0.04
184,729 BB Seguridade Participacoes 785 0.06 61,990 Eneva 405 0.03
52,698 BK Brasil Operacao e Assessoria a 48,342 Engie Brasil Energia 311 0.02
Restaurantes 82 0.01 347,470 Equatorial Energia 1,192 0.09
270,264 BR Malls Participacoes 411 0.03 42,300 Eucatex Industria e Comercio
76,839 BR Properties 103 0.01 Preference Shares 40 -
20,400 BrasilAgro - Co Brasileira de 68,897 Even Construtora e Incorporadora 114 0.01
Propriedades Agricolas 63 - 48,780 Ez Tec Empreendimentos e
33,210 Braskem ADR 230 0.02 Participacoes 290 0.02
150,064 BRF 470 0.04 99,097 Fleury 367 0.03
43,000 Camil Alimentos 72 0.01 23,700 Fras-Le 19 -
542,175 CCR 1,198 0.09 16,917 Gafisa 16 -
41,400 Centrais Eletricas Brasileiras 192 0.02 3,784 Gafisa ADR 7 -
24,031 Centrais Eletricas Brasileiras ADR 110 0.01 10,809 Gafisa Rights 10 -
26,200 Centrais Eletricas Brasileiras 445,235 Gerdau ADR 1,050 0.08
Preference Shares 125 0.01 16,200 Gerdau Preference Shares 38 -
5,400 Centrais Eletricas Santa Catarina 21,701 Gol Linhas Aereas Inteligentes ADR 122 0.01
Preference Shares 43 - 6,400 Grazziotin Preference Shares 25 -
85,155 Cia Brasileira de Distribuicao 929 0.07 51,652 Guararapes Confeccoes 138 0.01
129,233 Cia de Locacao das Americas 328 0.03 14,114 Hapvida Participacoes e Investimentos 133 0.01
17,159 Cia de Saneamento Basico do Estado 236,481 Helbor Empreendimentos 103 0.01
de Sao Paulo 147 0.01 63,596 Hypera 321 0.03
58,462 Cia de Saneamento Basico do Estado 20,400 Industrias Romi 39 -
de Sao Paulo ADR 495 0.04 32,932 Instituto Hermes Pardini 113 0.01
24,590 Cia de Saneamento de Minas 75,557 International Meal Co Alimentacao 45 -
Gerais-COPASA 212 0.02 87,647 Iochpe Maxion 182 0.01
46,500 Cia de Saneamento do Parana 46 - 264,073 IRB Brasil Resseguros 497 0.04
476,502 Cia de Saneamento do Parana 63,406 Itau Unibanco 236 0.02
Preference 447 0.04 577,574 Itau Unibanco Preference Shares 2,301 0.18
109,650 CIA de Saneamento do Parana Unit 516 0.04 456,158 JBS 1,443 0.11
65,511 Cia de Transmissao de Energia 117,854 JHSF Participacoes 128 0.01
Eletrica Paulista Preference Shares 203 0.02 20,226 JSL 68 0.01
31,839 Cia Energetica de Minas Gerais 56 - 9,034 Kepler Weber 50 -
41,290 Cia Energetica de Minas Gerais ADR 68 0.01 412,371 Klabin 1,256 0.10
212,349 Cia Energetica de Minas Gerais 75,988 Light 185 0.02
Preference Shares 347 0.03 3,400 Linx ADR 12 -
66,799 Cia Energetica de Sao Paulo 105,322 Localiza Rent a Car 651 0.05
Preference Shares 286 0.02 19,063 LOG Commercial Properties e
5,842 Cia Energetica do Ceara Preference Participacoes 89 0.01
Shares 50 - 13,867 Log-in Logistica Intermodal 31 -
29,400 Cia Ferro Ligas da Bahia - FERBASA 20,472 Lojas Americanas 83 0.01
Preference Shares 83 0.01 80,872 Lojas Americanas Preference Shares 388 0.03
39,918 Cia Hering 86 0.01 262,539 Lojas Renner 1,626 0.13
6,100 Cia Paranaense de Energia 55 - 26,481 M Dias Branco 161 0.01
33,104 Cia Paranaense de Energia ADR 305 0.02 276,677 Magazine Luiza 2,915 0.23
3,500 Cia Paranaense de Energia Preference 23,300 Mahle-Metal Leve 64 0.01
Shares 32 -
Dimensional Fund Advisors Ltd. Interim Report and Financial Statements, 30 June 2020 25

Emerging Markets Core Equity Fund
Portfolio Statement (continued)as at 30 June 2020
Holding Investment
Fair
Value
£'000
Percentage
of total
net assets
% Holding Investment
Fair
Value
£'000
Percentage
of total
net assets
%
Brazil (continued) Brazil (continued)
45,000 Marcopolo 18 - 40,000 Vulcabras Azaleia 31 -
214,818 Marcopolo Preference Shares 93 0.01 54,335 WEG 407 0.03
139,626 Marfrig Global Foods 263 0.02 44,081 Wiz Solucoes e Corretagem de Seguros 72 0.01
57,693 Marisa Lojas 71 0.01 109,625 YDUQS Participacoes 562 0.04
92,849 Mills Estruturas e Servicos de 77,683 6.11
Engenharia 74 0.01
71,863 Minerva 140 0.01 Chile 0.75% (1.01%)
126,595 MRV Engenharia e Participacoes 338 0.03
193,358 Natura 1,160 0.09 1,165,764 AES Gener 136 0.01
10,393 Natura Rights 60 0.01 914,009 Aguas Andinas 250 0.02
184,611 Notre Dame Intermedica Participacoes 1,883 0.15 17,891 Banco de Chile ADR 260 0.02
127,730 Odontoprev 279 0.02 5,058 Banco de Credito e Inversiones 142 0.01
35,388 Omega Geracao 186 0.02 13,766 Banco Santander Chile ADR 187 0.02
9,905 Paranapanema 20 - 256,286 Besalco 107 0.01
56,139 Petro Rio 295 0.02 42,257 CAP 223 0.02
115,062 Petrobras Distribuidora 371 0.03 403,623 Cencosud 475 0.04
724,453 Petroleo Brasileiro 2,450 0.19 19,442 Cia Cervecerias Unidas ADR 236 0.02
335,041 Petroleo Brasileiro ADR 2,257 0.18 7,419,515 Cia Sud Americana de Vapores 137 0.01
1,356,398 Petroleo Brasileiro Preference Shares 4,419 0.35 297 Clinica Las Condes 8 -
364,958 Petroleo Brasileiro Preference 57,789 Coca-Cola Embonor Preference Shares 65 0.01
Shares ADR 2,369 0.19 2,098,148 Colbun 273 0.02
54,683 Porto Seguro 429 0.03 11,262 Embotelladora Andina ADR 133 0.01
56,100 Portobello 36 - 84,743 Embotelladora Andina Preference
28,913 Profarma Distribuidora de Produtos Shares 171 0.01
Farmaceuticos 24 - 100,593 Empresa Nacional de
141,171 Qualicorp Consultoria e Corretora de Telecomunicaciones 527 0.04
Seguros 598 0.05 247,838 Empresas CMPC 415 0.03
105,006 Raia Drogasil 1,739 0.14 55,265 Empresas COPEC 312 0.03
64,087 Randon Implementos e Participacoes 97,570 Empresas Hites 13 -
Preference Shares 92 0.01 1,247,221 Empresas La Polar 10 -
7,440 Restoque Comercio e Confeccoes de 4,577 Empresas Lipigas 21 -
Roupas 8 - 13,881 Empresas Tricot 7 -
244,792 Rumo 833 0.07 8,306,175 Enel Americas 1,023 0.08
13,500 Sao Carlos Empreendimentos e 128,829 Enel Americas ADR 792 0.06
Participacoes 75 0.01 130,101 Enel Chile ADR 398 0.03
128,715 Sao Martinho 387 0.03 218,616 Engie Energia Chile 243 0.02
22,440 Schulz Preference Shares 36 - 352,651 Enjoy 2 -
10,596 Ser Educacional 24 - 82,086 Falabella 212 0.02
41,018 SLC Agricola 145 0.01 48,894 Forus 47 -
30,752 Smiles Fidelidade 69 0.01 749,793 Grupo Security 108 0.01
5,300 Springs Global Participacoes 5 - 14,546 Hortifrut 13 -
135,264 Sul America 931 0.07 283,023 Inversiones Aguas Metropolitanas 199 0.02
200,924 Suzano 1,134 0.09 17,084 Inversiones La Construccion 91 0.01
3,242 Suzano ADR 18 - 37,721,524 Itau CorpBanca Chile 81 0.01
2,079 Tecnisa 4 - 14,864 Itau CorpBanca Chile ADR 47 -
20,075 Tegma Gestao Logistica 70 0.01 94,871 Latam Airlines ADR 95 0.01
73,644 Telefonica Brasil ADR 533 0.04 1,909,297 Masisa 29 -
25,300 Telefonica Brasil Preference Shares 184 0.01 8,527 Molibdenos y Metales 44 -
8,500 Terra Santa Agro 21 - 405,648 Multiexport Foods 96 0.01
140,539 TIM Participacoes 291 0.02 203,446 Parque Arauco 293 0.02
21,725 TIM Participacoes ADR 224 0.02 59,356 PAZ 37 -
33,600 TOTVS 113 0.01 487,343 Ripley 131 0.01
113,566 Transmissora Alianca de Energia 199,589 Salfacorp 86 0.01
Eletrica 489 0.04 180,805 Sigdo Koppers 144 0.01
43,270 Trisul 77 0.01 620,817 SMU 93 0.01
37,585 Tupy 110 0.01 3,315,122 Sociedad Matriz SAAM 176 0.01
110,918 Ultrapar Participacoes 300 0.02 26,382 Sociedad Quimica y Minera de Chile
5,239 Ultrapar Participacoes ADR 14 - ADR 563 0.05
6,533 Unipar Carbocloro 29 - 1,060 Sociedad Quimica y Minera de Chile
30,764 Unipar Carbocloro Preference Shares 111 0.01 Preference Shares 22 -
63,800 Usinas Siderurgicas de Minas Gerais 220,091 Socovesa 50 -
Usiminas 74 0.01 254,182 SONDA 135 0.01
231,977 Usinas Siderurgicas de Minas Gerais 138,757 Vina Concha y Toro 176 0.01
Usiminas Preference Shares 249 0.02 9,534 0.75
1,343,054 Vale 11,179 0.88
33,715 Valid Solucoes e Servicos de
Seguranca em Meios de Pagamento e Identificacao 55 -
Dimensional Fund Advisors Ltd. Interim Report and Financial Statements, 30 June 2020 26

Emerging Markets Core Equity Fund
Portfolio Statement (continued)as at 30 June 2020
Holding Investment
Fair
Value
£'000
Percentage
of total
net assets
% Holding Investment
Fair
Value
£'000
Percentage
of total
net assets
%
China 25.48% (17.84%) China (continued)
371,000 361 Degrees International 39 - 1,230,000 BBMG 195 0.02
542,500 3SBio 560 0.05 34,800 Befar 17 -
5,258 51job ADR 299 0.02 11,019 Beibuwan Port 14 -
22,160 58.com ADR 969 0.08 6,900 BeiGene 82 0.01
33,800 5I5J 12 - 3,150 BeiGene ADR 484 0.04
344,000 AAC Technologies 1,721 0.14 8,100 Beijing Aosaikang Pharmaceutical 18 -
10,800 Addsino 17 - 96,200 Beijing Capital 33 -
9,300 AECC Aero-Engine Control 15 - 27,000 Beijing Capital Development 18 -
17,500 AECC Aviation Power 47 - 1,168,000 Beijing Capital International Airport 596 0.05
11,400 Aerospace Hi-Tech 13 - 847,000 Beijing Capital Land 129 0.01
1,136,284 Agile 1,090 0.09 33,750 Beijing Chunlizhengda Medical
4,994,540 Agricultural Bank of China 1,639 0.13 Instruments 187 0.02
29,670 Aier Eye Hospital 148 0.01 24,900 Beijing Dabeinong Technology 26 -
1,460,000 Air China 710 0.06 3,600 Beijing E-Hualu Information
15,500 Aisino 29 - Technology 23 -
105,208 Alibaba ADR 18,406 1.45 13,200 Beijing Enlight Media 17 -
1,858,000 Aluminum Corp of China 283 0.02 1,068,000 Beijing Enterprises Medical & Health 12 -
2,856 Aluminum Corp of China ADR 11 - 27,600 Beijing Jetsen Technology 13 -
833,200 Angang Steel 164 0.01 362,000 Beijing Jingneng Clean Energy 58 0.01
14,900 Angel Yeast 85 0.01 13,300 Beijing New Building Materials 33 -
558,000 Anhui Conch Cement 3,064 0.24 426,000 Beijing North Star 76 0.01
23,700 Anhui Construction Engineering 11 - 23,500 Beijing Orient Landscape &
162,000 Anhui Expressway 61 0.01 Environment 13 -
9,100 Anhui Guangxin Agrochemical 18 - 10,700 Beijing Orient National
4,400 Anhui Gujing Distillery 76 0.01 Communication Science & Technology 15 -
20,500 Anhui Hengyuan Coal Industry and 26,667 Beijing Oriental Yuhong Waterproof
Electricity Power 11 - Technology 125 0.01
26,000 Anhui Jiangnan Chemical Industry 17 - 57,800 Beijing Originwater Technology 54 0.01
11,900 Anhui Jinhe Industrial 31 - 35,200 Beijing Sanju Environmental
9,300 Anhui Kouzi Distillery 55 0.01 Protection and New Material 17 -
6,400 Anhui Yingjia Distillery 16 - 53,000 Beijing Shougang 26 -
14,300 Anhui Zhongding Sealing Parts 13 - 3,600 Beijing Shunxin Agriculture 24 -
314,000 ANTA Sports Products 2,258 0.18 6,500 Beijing Sinnet Technology 20 -
1,064,000 Anton Oilfield Services 51 - 5,700 Beijing Thunisoft 19 -
123,000 Aowei 18 - 9,009 Beijing Tiantan Biological Products 47 -
12,587 Apeloa Pharmaceutical 34 - 15,300 Beijing Tongrentang 48 -
394,500 Asia Cement China 315 0.03 88,000 Beijing Urban Construction Design &
103,507 Asia Plastic Recycling 14 - Development 16 -
1,700 Asymchem Laboratories Tianjin 48 - 43,500 Beijing Yanjing Brewery 34 -
52,856 Atlas 322 0.03 4,400 Berry Genomics 30 -
3,600 Autobio Diagnostics 67 0.01 102,000 Best Pacific International 11 -
21,000 AVIC Aircraft 43 - 2,900 Betta Pharmaceuticals 47 -
77,800 Avic Capital 35 - 9,432 Better Life Commercial Chain Share 15 -
30,546 AVIC Electromechanical Systems 28 - 900 BGI Genomics 16 -
15,300 Avic Heavy Machinery 18 - 9,553 Biem.L.Fdlkk Garment 19 -
5,100 AVIC Jonhon Optronic Technology 24 - 13,579 Bitauto ADR 175 0.01
14,500 AVIC Shenyang Aircraft 55 0.01 5,200 Blue Sail Medical 18 -
1,261,000 AviChina Industry & Technology 465 0.04 19,900 Bluefocus Intelligent Communications 18 -
5,200 AVICOPTER 25 - 354,314 BOE Technology 190 0.02
65,500 Babytree 10 - 174,500 Bohai Leasing 60 0.01
40,500 BAIC BluePark New Energy Technology 30 - 6,200 Boya Bio-pharmaceutical 27 -
1,369,500 BAIC Motor 483 0.04 213,000 Boyaa Interactive International 19 -
39,668 Baidu ADR 3,917 0.31 27,430 Bright Dairy & Food 47 -
342,000 BAIOO Family Interactive 35 - 9,100 B-Soft 19 -
73,712 Bank of Changsha 67 0.01 217,500 BYD 1,368 0.11
13,587,119 Bank of China 4,100 0.32 425,000 BYD Electronic International 792 0.06
188,500 Bank of Chongqing 77 0.01 21,650 C&S Paper 56 0.01
1,452,935 Bank of Communications 730 0.06 31,000 Cabbeen Fashion 6 -
97,000 Bank of Hangzhou 100 0.01 39,700 Caitong Securities 47 -
150,300 Bank of Jiangsu 98 0.01 8,700 Camel 9 -
226,861 Bank of Nanjing 192 0.02 563,000 CAR 138 0.01
51,500 Bank of Tianjin 16 - 18,000 Carpenter Tan 8 -
37,400 Bank of Zhengzhou 7 - 24,654 Cayman Engley Industrial 57 0.01
132,500 Baoshan Iron & Steel 70 0.01 33,700 CCOOP 17 -
114,000 Baoye 74 0.01 35,390 CECEP Solar Energy 14 -
28,523 Baozun ADR 892 0.07 23,100 CECEP Wind-Power 6 -
Dimensional Fund Advisors Ltd. Interim Report and Financial Statements, 30 June 2020 27

Emerging Markets Core Equity Fund
Portfolio Statement (continued)as at 30 June 2020
Holding Investment
Fair
Value
£'000
Percentage
of total
net assets
% Holding Investment
Fair
Value
£'000
Percentage
of total
net assets
%
China (continued) China (continued)
505,000 Central China Real Estate 192 0.02 707,000 China Lesso 749 0.06
373,000 Central China Securities 49 - 765,000 China Life Insurance 1,255 0.10
8,100 Centre Testing International 18 - 6,583 China Life Insurance ADR 53 0.01
1,985,000 CGN Power 332 0.03 269,000 China Lilang 117 0.01
4,900 Chacha Food 31 - 232,000 China Logistics Property 80 0.01
4,200 Changchun High & New Technology 1,020,000 China Longyuan Power 467 0.04
Industry 211 0.02 421,000 China Machinery Engineering 90 0.01
48,300 Changjiang Securities 37 - 592,000 China Maple Leaf Educational Systems 147 0.01
48,000 Changshouhua Food 10 - 867,500 China Medical System 832 0.07
2,500 Changzhou Xingyu Automotive Lighting 18,300 China Meheco 30 -
Systems 37 - 184,000 China Meidong Auto 368 0.03
18,000 Chanjet Information Technology 17 - 1,038,203 China Merchants Bank 3,887 0.31
321,000 Chaowei Power 115 0.01 64,600 China Merchants Securities 59 0.01
7,100 Chaozhou Three-Circle 23 - 2,279,220 China Minsheng Banking 1,276 0.10
7,961 Cheetah Mobile ADR 11 - 1,183,000 China Modern Dairy 107 0.01
9,500 Chengdu Hongqi Chain 12 - 909,000 China Molybdenum 241 0.02
2,700 Chengdu Kanghong Pharmaceutical 15 - 7,800 China National Accord Medicines 40 -
40,800 China Aerospace Times Electronics 30 - 2,526,050 China National Building Material 2,187 0.17
177,500 China Aircraft Leasing 117 0.01 57,200 China National Chemical Engineering 36 -
785,000 China Aoyuan 773 0.06 9,500 China National Medicines 45 -
11,400 China Avionics Systems 18 - 217,200 China National Nuclear Power 102 0.01
42,100 China Baoan 41 - 29,069 China Nonferrous Metal Industry's
938,000 China BlueChemical 113 0.01 Foreign Engineering and Construction 14 -
20,231 China CAMC Engineering 17 - 804,000 China Oilfield Services 588 0.05
3,680,000 China Cinda Asset Management 584 0.05 844,000 China Oriental 187 0.02
2,755,744 China CITIC Bank 977 0.08 890,000 China Pacific Insurance 1,933 0.15
922,832 China Coal Energy 171 0.01 8,023,000 China Petroleum & Chemical 2,725 0.22
962,845 China Communications Construction 441 0.04 11,143 China Petroleum & Chemical ADR 386 0.03
1,004,400 China Communications Services 509 0.04 125,000 China Pioneer Pharma 15 -
401,500 China Conch Venture 1,379 0.11 1,153,000 China Railway 481 0.04
16,706,591 China Construction Bank 10,999 0.87 724,568 China Railway Construction 463 0.04
16,700 China CSSC 34 - 24,100 China Railway Hi-tech Industry 24 -
15,000 China CYTS Tours 17 - 482,000 China Railway Signal & Communication 168 0.01
908,000 China Datang Corp Renewable Power 83 0.01 28,100 China Railway Tielong Container
104,000 China Development Bank Financial Logistics 18 -
Leasing 11 - 870,800 China Rare Earth 32 -
899,438 China Dili 149 0.01 2,284,000 China Reinsurance 190 0.02
2,600 China Distance Education ADR 18 - 18,100 China Resources Double Crane
1,669,000 China Dongxiang 121 0.01 Pharmaceutical 28 -
1,040,000 China Eastern Airlines 302 0.02 435,000 China Resources Medical 202 0.02
2,099 China Eastern Airlines ADR 31 - 798,500 China Resources Pharmaceutical 374 0.03
452,000 China Electronics Huada Technology 42 - 11,163 China Resources Sanjiu Medical &
1,276,000 China Electronics Optics Valley Union 62 0.01 Pharmaceutical 38 -
922,000 China Energy Engineering 70 0.01 459,000 China Sanjiang Fine Chemicals 100 0.01
1,029,000 China Everbright Bank 314 0.03 1,370,800 China SCE 484 0.04
781,000 China Evergrande 1,638 0.13 670,000 China Shanshui Cement 142 0.01
9,800 China Express Airlines 17 - 1,446,000 China Shengmu Organic Milk 37 -
11,400 China Film 17 - 1,211,000 China Shenhua Energy 1,544 0.12
54,000 China Financial Services 1 - 149,000 China Shineway Pharmaceutical 80 0.01
38,000 China Fortune Land Development 100 0.01 576,000 China Silver 35 -
1,448,500 China Galaxy Securities 638 0.05 23,100 China South Publishing & Media 28 -
62,900 China Gezhouba 43 - 1,368,000 China Southern Airlines 494 0.04
44,600 China Grand Automotive Services 16 - 429,400 China State Construction Engineering 236 0.02
12,500 China Greatwall Technology 19 - 328,500 China Sunshine Paper 34 -
108,000 China Greenland Broad Greenstate 6 - 513,000 China Suntien Green Energy 95 0.01
250,000 China Hanking 42 - 102,000 China Taifeng Beddings* - -
396,500 China Harmony New Energy Auto 159 0.01 1,682,000 China Telecom 380 0.03
1,190,500 China Hongqiao 429 0.03 9,431 China Telecom ADR 214 0.02
5,071,000 China Huarong Asset Management 411 0.03 89,500 China Tian Lun Gas 55 0.01
38,000 China Huirong Financial 4 - 273,000 China Tianrui Group Cement 224 0.02
260,000 China Huiyuan Juice* 10 - 1,600 China Tourism Group Duty Free 28 -
1,500 China Index ADR 2 - 12,100 China TransInfo Technology 33 -
484,800 China International Capital 776 0.06 633,601 China United Network Communications 353 0.03
279,680 China International Marine Containers 183 0.02 594,900 China Vanke 1,532 0.12
58,784 China Jushi 62 0.01 14,100 China West Construction 16 -
36,000 China Kepei Education 23 - 112,000 China Wood Optimization 23 -
Dimensional Fund Advisors Ltd. Interim Report and Financial Statements, 30 June 2020 28

Emerging Markets Core Equity Fund
Portfolio Statement (continued)as at 30 June 2020
Holding Investment
FairValue£'000
Percentageof total
net assets% Holding Investment
FairValue£'000
Percentageof total
net assets%
China (continued) China (continued)
280,000 China XLX Fertiliser 53 0.01 7,900 Dawning Information Industry 35 - 148,900 China Yangtze Power 325 0.03 10,200 Deppon Logistics 16 - 490,500 China Yongda Automobiles Services 479 0.04 28,000 Dexin China 9 - 356,000 China Yuhua Education 238 0.02 14,000 DHC Software 20 - 762,500 China ZhengTong Auto Services 89 0.01 4,800 Dian Diagnostics 20 -
7,300 China Zhenhua Group Science & 1,322,000 Differ 72 0.01 Technology 19 - 6,600 Digital China Group 19 -
1,071,600 China Zhongwang 164 0.01 10,300 Digital China Information Service 18 - 900,000 Chinasoft International 400 0.03 6,900 Dong-E-E-Jiao 28 -
17,500 Chinese Universe Publishing and Media 24 - 173,200 Dongfang Electric 74 0.01 18,000 Chlitina 107 0.01 1,072,000 Dongfeng Motor 521 0.04
5,300 Chongqing Brewery 45 - 89,600 Dongjiang Environmental 50 - 46,700 Chongqing Changan Automobile 59 0.01 20,100 Dongxing Securities 25 - 53,200 Chongqing Dima Industry 17 - 969,000 Dongyue 319 0.03
7,840 Chongqing Fuling Electric Power 141,000 Dynagreen Environmental Protection 40 - Industrial 13 - 8,500 East Money Information 20 -
12,300 Chongqing Fuling Zhacai 51 0.01 888,000 E-Commodities 18 - 432,000 Chongqing Machinery & Electric 18 - 30,000 EEKA Fashion 27 -
1,514,000 Chongqing Rural Commercial Bank 486 0.04 44,100 Elion Clean Energy 17 - 15,900 Chongqing Zhifei Biological Products 183 0.02 10,800 ENN Ecological 13 - 20,600 Chongqing Zongshen Power Machinery 15 - 200,100 ENN Energy 1,835 0.15 6,300 Chow Tai Seng Jewellery 16 - 2,200 Eoptolink Technology 16 -
941,991 CIFI 597 0.05 31,500 Eternal Asia Supply Chain Management 19 - 605,000 CIMC-TianDa 11 - 8,800 Eve Energy 49 -
36,600 Cinda Real Estate 17 - 110,800 Everbright Securities 65 0.01 9,400 Cisen Pharmaceutical 17 - 150 Fang ADR 1 -
45,250 CITIC Guoan Information Industry 12 - 23,000 Fangda Carbon New Material 17 - 350,500 CITIC Securities 540 0.04 28,400 Fangda Special Steel Technology 17 -
16,700 CMST Development 8 - 12,562 Fanhua ADR 205 0.02 14,800 CNHTC Jinan Truck 53 0.01 997,500 Fantasia 152 0.01 33,600 CNNC Hua Yuan Titanium Dioxide 17 - 30,600 FAW Jiefang 38 -
3,930,000 CNOOC 3,562 0.28 5,400 Fiberhome Telecommunication40,859 CNOOC ADR 3,732 0.29 Technologies 18 - 13,810 COFCO Biotechnology 11 - 27,200 Financial Street 21 -
107,000 COFCO Meat 29 - 66,000 First Tractor 13 - 141,000 Cogobuy 19 - 234,000 Flat Glass 206 0.02
15,000 Coland 11 - 109,800 Focus Media Information Technology 70 0.01 213,000 Colour Life Services 83 0.01 28,400 Foshan Haitian Flavouring & Food 407 0.03 263,000 Consun Pharmaceutical 85 0.01 13,700 Foshan Nationstar Optoelectronics 18 -
20,900 Contemporary Amperex Technology 420 0.03 1,209,453 Fosun International 1,254 0.10 576,000 Coolpad 10 - 86,500 Founder Securities 71 0.01
1,139,000 COSCO SHIPPING 266 0.02 562,000 Fu Shou Yuan International 419 0.03 1,862,000 COSCO SHIPPING Development 143 0.01 1,198,000 Fufeng 311 0.03
664,457 COSCO SHIPPING Energy Transportation 242 0.02 12,900 Fujian Longking 13 - 383,000 Cosmo Lady China 19 - 6,600 Fujian Longma Environmental
3,541,386 Country Garden 3,548 0.28 Sanitation Equipment 19 - 516,273 Country Garden Services 1,952 0.15 4,500 Fujian Star-net Communication 18 - 302,000 CPMC 92 0.01 31,200 Fujian Sunner Development 104 0.01 151,500 CRCC High-Tech Equipment 17 - 244,000 Fuyao Glass Industry 473 0.04 757,000 CRRC 260 0.02 12,600 Gansu Qilianshan Cement 24 - 128,000 CSC Financial 118 0.01 1,600 G-bits Network Technology Xiamen 101 0.01
18,000 CSG 10 - 5,618 GDS ADR 365 0.03 1,725,600 CSPC Pharmaceutical 2,656 0.21 80,000 GEM 46 -
42,000 CSSC Offshore and Marine Engineering 23 - 72,000 Gemdale 114 0.01 858,000 CT Environmental* 6 - 528,500 Genertec Universal Medical 260 0.02
9,000 D&O Home Collection 34 - 13,300 Genimous Technology 13 - 4,510 Da An Gene of Sun Yat-Sen University 14 - 315,800 GF Securities 275 0.02
1,251,000 Dali Foods 619 0.05 8,600 Giant Network 17 - 35,700 Dalian Huarui Heavy Industry 18 - 700 Gigadevice Semiconductor Beijing 19 -
572,000 Dalian Port PDA 43 - 1,600 Glodon 13 - 145,926 Daqin Railway 118 0.01 42,600 GoerTek 144 0.01
7,400 Dare Power Dekor Home 13 - 272,000 Golden Eagle Retail 209 0.02 3,000 Dashang 8 - 63,500 Golden Throat 10 - 5,760 DaShenLin Pharmaceutical 54 0.01 58,578 GOME Retail 8 -
896,000 Datang International Power Generation 94 0.01 6,400 Gotion High-tech 20 - 40,600 Datong Coal Industry 18 - 427,616 Grand Baoxin Auto 52 0.01
Dimensional Fund Advisors Ltd. Interim Report and Financial Statements, 30 June 2020 29

Emerging Markets Core Equity Fund
Portfolio Statement (continued)as at 30 June 2020
Holding Investment
Fair
Value
£'000
Percentage
of total
net assets
% Holding Investment
Fair
Value
£'000
Percentage
of total
net assets
%
China (continued) China (continued)
31,900 Grandjoy 19 - 21,500 Hebei Chengde Lolo 17 -
826,750 Great Wall Motor 420 0.03 11,400 Hebei Hengshui Laobaigan Liquor 17 -
24,800 Greattown 17 - 4,000 Hefei Meiya Optoelectronic Technology 24 -
462,000 Greatview Aseptic Packaging 133 0.01 41,500 Heilongjiang Agriculture 77 0.01
60,800 Gree Electric Appliances of Zhuhai 396 0.03 19,200 Henan Pinggao Electric 16 -
21,700 Gree Real Estate* 29 - 37,400 Henan Shenhuo Coal & Power 18 -
117,600 Greenland 84 0.01 34,900 Henan Shuanghui Investment &
723,000 Greenland Hong Kong 208 0.02 Development 185 0.02
389,500 Greentown China 317 0.03 40,700 Henan Zhongyuan Expressway 17 -
392,000 Greentown Service 375 0.03 335,378 Hengan International 2,139 0.17
10,800 GRG Banking Equipment 16 - 26,163 Hengdian Group DMEGC Magnetics 34 -
11,600 Guangdong Ellington Electronics 41,633 Hengli Petrochemical 67 0.01
Technology 14 - 9,400 Hengtong Optic-electric 18 -
16,900 Guangdong Haid 93 0.01 80,620 Hengyi Petrochemical 85 0.01
108,500 Guangdong HEC Technology 86 0.01 452,000 Hilong 11 -
3,300 Guangdong Hongda Blasting 13 - 33,192 Hiroca 51 0.01
21,400 Guangdong Huatie Tongda High-speed 144,000 Hisense Home Appliances 136 0.01
Railway Equipment 14 - 6,400 Hithink RoyalFlush Information
14,800 Guangdong Shirongzhaoye 11 - Network 98 0.01
32,500 Guangdong Tapai 45 - 40,900 Holitech Technology 25 -
6,859 Guangdong Xinbao Electrical 30,600 Hongda Xingye 13 -
Appliances 29 - 12,425 Hongfa Technology 57 0.01
100,000 Guangdong Yueyun Transportation 20 - 1,136,969 Honghua 28 -
193,578 Guanghui Energy 60 0.01 100,000 Honworld 25 -
710,000 Guangshen Railway 108 0.01 161,000 Hua Hong Semiconductor 455 0.04
23,100 Guangxi Liugong Machinery 17 - 766,000 Huadian Fuxin Energy 200 0.02
6,580 Guangxi Liuzhou Pharmaceutical 17 - 572,000 Huadian Power International 134 0.01
45,700 Guangxi Wuzhou Zhongheng 17 - 43,700 Huadong Medicine 127 0.01
994,654 Guangzhou Automobile 584 0.05 29,600 Huafa Industrial Zhuhai 24 -
16,000 Guangzhou Baiyun International 23,000 Huafu Fashion 17 -
Airport 28 - 6,300 Huagong Tech 18 -
68,000 Guangzhou Baiyunshan Pharmaceutical 140 0.01 14,000 Hualan Biological Engineering 81 0.01
11,000 Guangzhou Haige Communications 16 - 926,000 Huaneng Power International 283 0.02
5,100 Guangzhou Kingmed Diagnostics 53 0.01 3,053 Huaneng Power International ADR 37 -
869,600 Guangzhou R&F Properties 825 0.07 28,500 Huapont Life Sciences 18 -
12,000 Guangzhou Shiyuan Electronic 274,800 Huatai Securities 357 0.03
Technology 138 0.01 118,000 Huaxi 22 -
2,200 Guangzhou Wondfo Biotech 26 - 23,600 Huaxi Securities 29 -
21,900 Guangzhou Yuexiu Financial 29 - 32,600 Huaxin Cement 89 0.01
28,200 Guizhou Panjiang Refined Coal 17 - 44,300 Huayu Automotive Systems 106 0.01
5,200 Guizhou Space Appliance 22 - 270,000 Huazhong In-Vehicle 17 -
188,500 Guolian Securities 51 0.01 50,622 Huazhu ADR 1,459 0.12
544,000 Guorui Properties 66 0.01 65,100 Hubei Biocause Pharmaceutical 39 -
99,600 Guotai Junan Securities 112 0.01 25,100 Hubei Jumpcan Pharmaceutical 74 0.01
42,400 Guoyuan Securities 41 - 11,300 Hubei Kaile Science & Technology 18 -
588,000 Haichang Ocean Park 28 - 10,300 Hubei Xingfa Chemicals 11 -
44,500 Haier Smart Home 91 0.01 171,500 Huishang Bank 48 -
598 Hailiang Education ADR 20 - 5,600 Hunan Aihua 19 -
54,000 Hainan Meilan International Airport 62 0.01 9,800 Hunan Gold 9 -
6,600 Hainan Poly Pharm 56 0.01 226,700 Hunan Valin Steel 98 0.01
16,200 Haisco Pharmaceutical 50 - 1,630 Hundsun Technologies 20 -
286,000 Haitian International 473 0.04 15,127 Iflytek 65 0.01
608,000 Haitong Securities 399 0.03 11,127,503 Industrial & Commercial Bank of China 5,501 0.43
15,700 Hang Zhou Great Star Industrial 21 - 7,200 Industrial Bank 13 -
12,200 Hangcha 15 - 70,026 Industrial Securities 55 0.01
40,524 Hangxiao Steel Structure 17 - 388,681 Inner Mongolia BaoTou Steel Union 48 -
81,300 Hangzhou Binjiang Real Estate 40 - 23,700 Inner Mongolia First Machinery 28 -
16,700 Hangzhou Hikvision Digital Technology 58 0.01 159,700 Inner Mongolia Junzheng Energy &
14,800 Hangzhou Oxygen Plant 24 - Chemical Industry 47 -
12,100 Hangzhou Robam Appliances 43 - 78,400 Inner Mongolia Yili Industrial 281 0.02
3,307 Hangzhou Tigermed Consulting 39 - 43,700 Inner Mongolia Yitai Coal 23 -
12,200 Han's Laser Technology Industry 51 0.01 3,900 Inspur Electronic Information
161,000 Harbin Bank 19 - Industry 18 -
386,000 Harbin Electric 122 0.01 9,200 Jafron Biomedical 74 0.01
41,000 Harmonicare Medical* 2 - 5,000 Jason Furniture Hangzhou 26 -
286,000 HC 38 - 19,090 JD.com ADR 925 0.07
Dimensional Fund Advisors Ltd. Interim Report and Financial Statements, 30 June 2020 30

Emerging Markets Core Equity Fund
Portfolio Statement (continued)as at 30 June 2020
Holding Investment
Fair
Value
£'000
Percentage
of total
net assets
% Holding Investment
Fair
Value
£'000
Percentage
of total
net assets
%
China (continued) China (continued)
9,100 Jiajiayue 52 0.01 16,500 Liaoning Cheng Da 36 -
2,004,000 Jiangnan 64 0.01 14,523 Liaoning Wellhope Agri-Tech 25 -
64,900 Jiangsu Changshu Rural Commercial 4,400 Lier Chemical 9 -
Bank 56 0.01 762,000 Lifetech Scientific 195 0.02
51,800 Jiangsu Eastern Shenghong 33 - 88,500 Lingyi iTech Guangdong 108 0.01
338,000 Jiangsu Expressway 323 0.03 35,467 Link Motion ADR* - -
21,900 Jiangsu Guotai International 15 - 33,500 Liuzhou Iron & Steel 17 -
6,200 Jiangsu Hengli Hydraulic 57 0.01 57,948 Livzon Pharmaceutical 237 0.02
41,780 Jiangsu Hengrui Medicine 444 0.04 876,000 Logan 1,264 0.10
10,976 Jiangsu Hengshun Vinegar Industry 23 - 41,100 Loncin Motor 18 -
10,700 Jiangsu Kanion Pharmaceutical 17 - 16,200 Long Yuan Construction 16 -
13,100 Jiangsu King's Luck Brewery 60 0.01 610,000 Longfor 2,363 0.19
20,200 Jiangsu Nhwa Pharmaceutical 39 - 49,383 LONGi Green Energy Technology 232 0.02
11,700 Jiangsu Shagang 17 - 6,800 Longshine Technology 13 -
24,524 Jiangsu Yanghe Brewery Joint-Stock 297 0.02 1,288,000 Lonking 316 0.03
7,400 Jiangsu Yangnong Chemical 70 0.01 27,000 Luxi Chemical 23 -
3,200 Jiangsu Yoke Technology 19 - 62,788 Luxshare Precision Industry 371 0.03
4,200 Jiangsu Yuyue Medical Equipment & 733,000 Luye Pharma 365 0.03
Supply 18 - 19,500 Luzhou Laojiao 205 0.02
28,400 Jiangsu Zhangjiagang Rural 4,200 Maccura Biotechnology 28 -
Commercial Bank 19 - 16,000 Mango Excellent Media 120 0.01
39,800 Jiangsu Zhongnan Construction 41 - 484,000 Maoye International 19 -
51,602 Jiangsu Zhongtian Technology 68 0.01 8,100 Mayinglong Pharmaceutical 23 -
469,000 Jiangxi Copper 385 0.03 13,200 Meinian Onehealth Healthcare 22 -
16,000 Jiangxi Wannianqing Cement 24 - 295,000 Meitu 47 -
58,200 Jiangxi Zhengbang Technology 117 0.01 1,110,000 Metallurgical Corp of China 144 0.01
17,100 Jilin Aodong Pharmaceutical 31 - 800 Milkyway Chemical Supply Chain
3,000 Jinan Acetate Chemical 10 - Service 10 -
213,000 Jingrui 48 - 10,800 Ming Yang Smart Energy 16 -
44,600 Jinke Properties 42 - 262,000 Minsheng Education 29 -
18,771 JinkoSolar ADR 273 0.02 488,000 Minth 1,129 0.09
14,100 Jinneng Science&Technology 19 - 31,200 MLS 55 0.01
38,059 Jizhong Energy Resources 13 - 1,678,000 MMG 281 0.02
100,500 JNBY Design 82 0.01 168,000 MOBI Development 14 -
16,900 Joincare Pharmaceutical Group 566,600 Modern Land China 58 0.01
Industry 32 - 72,396 Momo ADR 1,030 0.08
5,200 Joinn Laboratories China 63 0.01 8,400 Montnets Rongxin Technology 19 -
17,200 Jointown Pharmaceutical 37 - 47,540 Muyuan Foodstuff 449 0.04
7,700 Jonjee Hi-Tech Industrial And 53,400 Myhome Real Estate Development 17 -
Commercial 52 0.01 33,300 MYS 17 -
10,015 Joyoung 43 - 30,900 NanJi E-Commerce 75 0.01
15,977 JOYY ADR 1,156 0.09 118,400 Nanjing Iron & Steel 44 -
10,116 JSTI 9 - 3,300 Nanjing King-Friend Biochemical
7,800 Juewei Food 63 0.01 Pharmaceutical 25 -
16,400 Juneyao Airlines 17 - 33,500 Nanjing Sample Technology* 7 -
1,796,000 Kaisa 552 0.04 10,500 Nanjing Securities 17 -
291,000 Kangda International Environmental 24 - 19,980 Nanjing Xinjiekou Department Store 23 -
384,000 Kasen International 39 - 3,600 Nanyang Topsec Technologies 11 -
418,600 Kingdee International Software 793 0.06 27,300 NARI Technology 64 0.01
18,200 Konka 14 - 135,000 Nature Home 14 -
15,600 KPC Pharmaceuticals 18 - 2,000 NAURA Technology 39 -
13,200 Kweichow Moutai 2,225 0.18 9,300 NavInfo 18 -
876,959 KWG 1,201 0.10 11,493 NetEase ADR 4,045 0.32
6,163 Lao Feng Xiang 34 - 28,500 New Century Healthcare 4 -
4,000 Laobaixing Pharmacy Chain 46 - 194,200 New China Life Insurance 529 0.04
286,600 Legend 273 0.02 37,000 New Hope Liuhe 127 0.01
9,599 Lemtech 23 - 25,070 New Oriental Education & Technology
4,662,000 Lenovo 2,103 0.17 ADR 2,676 0.21
44,600 Lens Technology 144 0.01 8,100 Newland Digital Technology 15 -
36,200 Leo 16 - 722,000 Nexteer Automotive 404 0.03
102,000 Leoch International Technology 5 - 27,400 Ninestar 104 0.01
19,577 Lepu Medical Technology Beijing 82 0.01 7,705 Ningbo Huaxiang Electronic 14 -
25,759 LexinFintech ADR 223 0.02 18,000 Ningbo Joyson Electronic 49 -
25,900 Leyard Optoelectronic 18 - 21,400 Ningbo Sanxing Medical Electric 17 -
658,000 Li Ning 1,696 0.13 4,300 Ningbo Tuopu 14 -
217,000 Lianhua Supermarket 32 - 91,600 Ningbo Zhoushan Port 38 -
Dimensional Fund Advisors Ltd. Interim Report and Financial Statements, 30 June 2020 31

Emerging Markets Core Equity Fund
Portfolio Statement (continued)as at 30 June 2020
Holding Investment
Fair
Value
£'000
Percentage
of total
net assets
% Holding Investment
Fair
Value
£'000
Percentage
of total
net assets
%
China (continued) China (continued)
206,133 NIO ADR 1,214 0.10 503,500 Sany Heavy Equipment International 187 0.02
4,288 Niu Technologies ADR 54 0.01 74,700 Sany Heavy Industry 161 0.01
5,455 Noah ADR 112 0.01 15,500 Saurer Intelligent Technology 8 -
32,800 North Huajin Chemical Industries 17 - 89,400 Sealand Securities 45 -
27,800 Northeast Pharmaceutical* 17 - 1,384,000 Seazen 979 0.08
34,000 Northeast Securities 33 - 4,803 Secoo ADR 12 -
841,000 NVC International 12 - 798,900 Semiconductor Manufacturing
41,600 Oceanwide 18 - International 2,265 0.18
5,300 Offcn Education Technology 17 - 27,700 SF 175 0.01
54,600 Offshore Oil Engineering 29 - 700 SG Micro 25 -
70,800 OFILM 150 0.01 51,610 SGIS Songshan 23 -
5,317 OneSmart International Education ADR 17 - 247,000 Shaanxi Coal Industry 205 0.02
135,000 O-Net Technologies 72 0.01 16,700 Shandong Buchang Pharmaceuticals 56 0.01
2,400 Oppein Home 32 - 199,749 Shandong Chenming Paper 58 0.01
5,600 Opple Lighting 18 - 28,346 Shandong Hualu Hengsheng Chemical 58 0.01
18,639 ORG Technology 9 - 22,400 Shandong Linglong Tyre 52 0.01
40,800 Orient 21 - 16,900 Shandong Longda Meat Foodstuff 16 -
320,800 Orient Securities 144 0.01 8,800 Shandong Luyitong Intelligent
26,385 Oriental Pearl 29 - Electric 13 -
21,600 Ourpalm 18 - 178,982 Shandong Nanshan Aluminum 42 -
4,400 Ovctek China 35 - 4,400 Shandong Sinocera Functional Material 17 -
203,000 Pacific Online 25 - 76,700 Shandong Sun Paper Industry 84 0.01
347,000 Parkson Retail 17 - 704,000 Shandong Weigao Group Medical Polymer 1,277 0.10
15,500 PCI-Suntek Technology 16 - 89,400 Shandong Xinhua Pharmaceutical 39 -
1,458,000 People's Insurance Co Group of China 345 0.03 20,600 Shandong Yisheng Livestock & Poultry
3,000 Perfect World 20 - Breeding 36 -
7,016,000 PetroChina 1,897 0.15 56,900 Shanghai 2345 Network 18 -
5,637 PetroChina ADR 153 0.01 18,600 Shanghai AJ 17 -
1,433 PharmaBlock Sciences Nanjing 21 - 2,300 Shanghai AtHub 29 -
10,192 Phoenix New Media ADR 12 - 5,200 Shanghai Bairun Investment 27 -
1,485,492 PICC Property & Casualty 999 0.08 10,800 Shanghai Baosight Software 73 0.01
5,018 Pinduoduo ADR 357 0.03 6,500 Shanghai East China Computer 18 -
205,100 Ping An Bank 302 0.02 1,056,000 Shanghai Electric 244 0.02
31,700 Ping An Healthcare and Technology 393 0.03 12,500 Shanghai Environment 17 -
1,485,500 Ping An Insurance Group Co of China 12,089 0.95 136,000 Shanghai Fosun Pharmaceutical 371 0.03
40,100 Pingdingshan Tianan Coal Mining 17 - 180,000 Shanghai Fudan-Zhangjiang
35,800 Polaris Bay 49 - Bio-Pharmaceutical 100 0.01
79,100 Poly Developments 135 0.01 29,500 Shanghai Industrial Development 17 -
1,371,000 Postal Savings Bank of China 640 0.05 4,200 Shanghai International Airport 35 -
143,800 Power Construction Corp of China 57 0.01 30,800 Shanghai International Port 15 -
886,000 Powerlong Real Estate 404 0.03 896,569 Shanghai Jin Jiang Capital 125 0.01
328,000 PW Medtech 57 0.01 5,400 Shanghai Jinjiang International
270,000 Q Technology 287 0.02 Hotels 17 -
5,400 Qianhe Condiment and Food 20 - 4,200 Shanghai Kinetic Medical 14 -
5,000 Qingdao Gon Technology 19 - 11,900 Shanghai M&G Stationery 75 0.01
22,600 Qingdao Hanhe Cable 12 - 15,500 Shanghai Maling Aquarius 17 -
179,000 Qingdao Port International 77 0.01 9,900 Shanghai Mechanical and Electrical
412,000 Qingling Motors 61 0.01 Industry 19 -
296,000 Qinhuangdao Port 37 - 403,500 Shanghai Pharmaceuticals 552 0.04
33,975 Qinqin Foodstuffs Group Cayman 8 - 260,000 Shanghai Prime Machinery 14 -
13,638 Qudian ADR 19 - 3,400 Shanghai Putailai New Energy
34,000 Qunxing Paper* - - Technology 40 -
10,300 Rainbow Digital Commercial 11 - 47,360 Shanghai RAAS Blood Products 46 -
34,500 Real Gold Mining* 1 - 17,100 Shanghai Shimao 9 -
218,278 Red Star Macalline 98 0.01 24,400 Shanghai Shyndec Pharmaceutical 27 -
590,000 Redco Properties 221 0.02 15,600 Shanghai Tongji Science & Technology
24,700 Renhe Pharmacy 17 - Industrial 15 -
7,125 RISE Education Cayman ADR 21 - 5,300 Shanghai Waigaoqiao Free Trade Zone 9 -
132,900 RiseSun Real Estate Development 124 0.01 6,900 Shanghai Wanye Enterprises 19 -
55,200 Rongsheng Petro Chemical 78 0.01 50,700 Shanghai Yuyuan Tourist Mart 52 0.01
393,500 Ronshine China 282 0.02 25,900 Shanghai Zijiang Enterprise 13 -
2,180 RYB Education ADR 5 - 12,800 Shanxi Blue Flame 11 -
72,615 SAIC Motor 142 0.01 53,500 Shanxi Lu'an Environmental Energy
53,400 Sailun 22 - Development 34 -
24,900 Sanan Optoelectronics 72 0.01 107,000 Shanxi Meijin Energy 77 0.01
700 Sangfor Technologies 17 - 122,900 Shanxi Taigang Stainless Steel 47 -
Dimensional Fund Advisors Ltd. Interim Report and Financial Statements, 30 June 2020 32

Emerging Markets Core Equity Fund
Portfolio Statement (continued)as at 30 June 2020
Holding Investment
Fair
Value
£'000
Percentage
of total
net assets
% Holding Investment
Fair
Value
£'000
Percentage
of total
net assets
%
China (continued) China (continued)
8,598 Shanxi Xinghuacun Fen Wine Factory 144 0.01 5,180 Skshu Paint 55 0.01
101,660 Shanxi Xishan Coal & Electricity 1,672,000 Skyfame Realty 176 0.01
Power 44 - 11,905 Sogou ADR 40 -
85,200 Shanying International 29 - 1,065,000 SOHO China 305 0.03
3,900 Shede Spirits 17 - 7,846 Sohu.com ADR 57 0.01
82,000 Sheng Ye Capital 55 0.01 11,500 Songcheng Performance Development 23 -
8,300 Shengda Resources 11 - 48,500 Sou Yu Te 16 -
163,000 Shengjing Bank 122 0.01 8,800 Spring Airlines 36 -
256,000 Shenguan 7 - 338,000 SPT Energy 11 -
36,107 Shengyi Technology 122 0.01 226,000 Starrise Media 17 -
8,598 Shennan Circuits 166 0.01 332,000 Sun King Power Electronics 40 -
160,800 Shenwan Hongyuan 36 - 1,194,000 Sunac China 4,076 0.32
27,700 Shenzhen Airport 24 - 8,100 Sunflower Pharmaceutical 14 -
3,400 Shenzhen Capchem Technology 22 - 15,300 Sungrow Power Supply 25 -
3,100 Shenzhen Desay Battery Technology 18 - 29,900 Suning Universal 11 -
246,000 Shenzhen Expressway 203 0.02 32,700 Suning.com 33 -
12,800 Shenzhen Fastprint Circuit Tech 19 - 209,600 Sunny Optical Technology 2,735 0.23
2,800 Shenzhen FRD Science & Technology 11 - 225,000 Sunshine 100 China 32 -
14,900 Shenzhen Gas 11 - 12,500 Sunward Intelligent Equipment 9 -
3,873 Shenzhen Goodix Technology 99 0.01 24,400 Sunwoda Electronic 53 0.01
6,200 Shenzhen Hepalink Pharmaceutical 18 - 19,100 Suofeiya Home Collection 53 0.01
13,393 Shenzhen Inovance Technology 59 0.01 7,000 Suzhou Anjie Technology 20 -
11,200 Shenzhen Jinjia 11 - 22,600 Suzhou Dongshan Precision
4,585 Shenzhen Kangtai Biological Products 86 0.01 Manufacturing 78 0.01
4,700 Shenzhen Kinwong Electronic 19 - 55,600 Suzhou Gold Mantis Construction
6,000 Shenzhen Megmeet Electrical 18 - Decoration 50 -
10,637 Shenzhen Mindray Bio-Medical 34,700 Tahoe 20 -
Electronics 375 0.03 3,500 Taiji Computer 18 -
44,700 Shenzhen MTC 25 - 27,332 TAL Education ADR 1,498 0.12
34,400 Shenzhen Neptunus Bioengineering 17 - 88,000 Tang Palace China 7 -
116,200 Shenzhen Overseas Chinese Town 81 0.01 43,200 Tangshan Jidong Cement 80 0.01
16,400 Shenzhen Salubris Pharmaceuticals 56 0.01 68,300 TangShan Port 17 -
900 Shenzhen SC New Energy Technology 9 - 33,500 Tangshan Sanyou Chemical Industries 18 -
1,100 Shenzhen Sinovatio Technology 21 - 74,347 TBEA 58 0.01
9,100 Shenzhen Sunlord Electronics 26 - 103,600 TCL Technology 74 0.01
7,700 Shenzhen Suntak Circuit Technology 18 - 33,700 Tech-Bank Food 50 -
13,400 Shenzhen Sunway Communication 82 0.01 23,900 Tecon Biology 44 -
74,610 Shenzhen Tagen 59 0.01 1,000,500 Tencent 52,459 4.12
14,880 Shenzhen YUTO Packaging Technology 47 - 89,000 Tenfu Cayman 50 -
20,300 Shenzhen Zhenye 16 - 231,000 Tenwow International* 2 -
24,000 Shenzhen Zhongjin Lingnan Nonfemet 10 - 3,700 Thunder Software Technology 33 -
216,600 Shenzhou International 2,127 0.17 38,500 Tian Di Science & Technology 13 -
3,400 Shijiazhuang Yiling Pharmaceutical 12 - 249,000 Tian Ge Interactive 27 -
2,002,144 Shui On Land 270 0.02 160,000 Tian Shan Development 51 0.01
274,000 Sichuan Expressway 50 - 426,000 Tiangong International 112 0.01
13,500 Sichuan Kelun Pharmaceutical 33 - 4,400 Tianjin 712 Communication &
50,800 Sichuan Languang Development 31 - Broadcasting 19 -
17,200 Sichuan Shuangma Cement 25 - 116,000 Tianjin Capital Environmental
7,641 Sichuan Swellfun 55 0.01 Protection 29 -
8,100 Sieyuan Electric 19 - 53,924 Tianjin Guangyu Development 45 -
2,106,000 Sihuan Pharmaceutical 164 0.01 19,800 Tianjin Zhonghuan Semiconductor 51 0.01
9,000 Silergy 476 0.04 27,800 Tianma Microelectronics 49 -
30,767 SINA 899 0.07 552,000 Tianneng Power International 766 0.06
30,200 Sinochem International 18 - 10,200 Tianshui Huatian Technology 16 -
25,300 Sinolink Securities 33 - 126,000 Tianyun International 12 -
27,600 Sinoma International Engineering 17 - 15,101 Tibet Summit Resources 17 -
42,700 Sinoma Science & Technology 76 0.01 21,400 Tibet Tianlu 18 -
1,554,413 Sino-Ocean 302 0.02 1,232,000 Tingyi Cayman Islands 1,557 0.12
677,500 Sinopec Engineering 234 0.02 33,800 Titan Wind Energy Suzhou 23 -
1,624,000 Sinopec Oilfield Service 85 0.01 4,400 Toly Bread 26 -
1,157,000 Sinopec Shanghai Petrochemical 226 0.02 249,000 Tong Ren Tang Technologies 154 0.01
758,800 Sinopharm 1,583 0.13 23,500 TongFu Microelectronics 68 0.01
6,200 Sino-Platinum Metals 21 - 19,400 Tonghua Dongbao Pharmaceutical 39 -
292,400 Sinosoft Technology 34 - 57,000 Tongkun 84 0.01
1,095,000 Sinotrans 178 0.02 177,900 Tongling Nonferrous Metals 40 -
399,000 Sinotruk Hong Kong 841 0.07 73,300 Tongwei 147 0.01
Dimensional Fund Advisors Ltd. Interim Report and Financial Statements, 30 June 2020 33

Emerging Markets Core Equity Fund
Portfolio Statement (continued)as at 30 June 2020
Holding Investment
Fair
Value
£'000
Percentage
of total
net assets
% Holding Investment
Fair
Value
£'000
Percentage
of total
net assets
%
China (continued) China (continued)
3,200 Topchoice Medical 61 0.01 417,528 Xingda International 65 0.01
53,900 Transfar Zhilian 34 - 135,400 Xinhu Zhongbao 46 -
427,000 TravelSky Technology 611 0.05 169,000 Xinhua Winshare Publishing and Media 93 0.01
482,000 Trigiant 59 0.01 189,547 Xinjiang Goldwind Science &
89,560 Trip.com ADR 1,900 0.15 Technology 132 0.01
38,000 Trony Solar* - - 38,900 Xinjiang Tianshan Cement 68 0.01
46,000 Tsaker Chemical 5 - 24,700 Xinjiang Zhongtai Chemical 13 -
180,000 Tsingtao Brewery 1,088 0.09 180,000 Xinming China 19 -
54,000 Tunghsu Optoelectronic Technology 17 - 74,000 Xinxing Ductile Iron Pipes 29 -
7,205 Tuniu ADR 7 - 16,600 Xinyangfeng Agricultural Technology 17 -
20,000 Tus Environmental Science And 1,424,015 Xinyi Solar 1,099 0.09
Technology Development 17 - 92,000 Xinyu Iron & Steel 43 -
7,400 Unigroup Guoxin Microelectronics 62 0.01 16,729 Xinyuan Real Estate ADR 29 -
810,947 Uni-President China 658 0.05 756,205 Xtep International 205 0.02
11,500 Unisplendour 57 0.01 11,400 Xuji Electric 17 -
12,300 Universal Scientific Industrial 12,290 Xunlei ADR 38 -
Shanghai 31 - 632,000 Yadea 355 0.03
1,529,800 V1 35 - 23,800 Yang Quan Coal Industry 12 -
9,000 Valiant 18 - 100,200 Yango 73 0.01
14,000 Vatti 16 - 5,100 Yantai Changyu Pioneer Wine 20 -
4,100 Venustech 20 - 5,100 Yantai Eddie Precision Machinery 31 -
8,600 Victory Giant Technology Huizhou 24 - 18,500 Yantai Jereh Oilfield Services 66 0.01
182,954 Vipshop ADR 2,951 0.23 1,170,000 Yanzhou Coal Mining 707 0.06
9,400 Wanda Film 17 - 249,000 Yashili International 13 -
3,600 Wangfujing 19 - 12,269 Yealink Network Technology 96 0.01
8,200 Wangneng Environment 16 - 94,000 YiChang HEC ChangJiang Pharmaceutical 156 0.01
18,500 Wangsu Science & Technology 18 - 172,000 Yida China 33 -
27,800 Wanhua Chemical 160 0.01 11,700 Yifan Pharmaceutical 31 -
2,759,000 Want Want China 1,699 0.13 5,900 Yifeng Pharmacy Chain 62 0.01
17,600 Wanxiang Qianchao 10 - 198,000 Yihai International 1,655 0.13
17,100 Wasu Media 21 - 23,600 Yintai Gold 43 -
24,777 Weibo ADR 671 0.05 7,315 Yiren Digital ADR 25 -
879,840 Weichai Power 1,334 0.11 6,000 Yixintang Pharmaceutical 26 -
12,800 Weifu High-Technology 30 - 84,900 Yonghui Superstores 92 0.01
6,300 Weihai Guangwei Composites 46 - 4,100 Yonyou Network Technology 21 -
262,000 Weiqiao Textile 38 - 55,600 Youngor 38 -
152,700 Wens Foodstuffs 383 0.03 196,770 Youyuan International* 1 -
1,848,000 West China Cement 274 0.02 6,500 Youzu Interactive 20 -
23,400 Western Securities 22 - 4,900 Yuan Longping High-tech Agriculture 9 -
6,300 Westone Information Industry 15 - 1,621,000 YuanShengTai Dairy Farm 78 0.01
3,887 Will Semiconductor 90 0.01 135,667 Yum China 5,400 0.43
378,000 Wisdom Education International 126 0.01 45,094 Yunda 127 0.01
24,400 Wolong Electric 32 - 61,700 Yunnan Aluminium 31 -
7,100 Wonders Information 18 - 6,200 Yunnan Baiyao 67 0.01
109,100 Wuchan Zhongda 53 0.01 30,700 Yunnan Copper 37 -
10,400 Wuhan Department Store 19 - 6,700 Yunnan Energy New Material 51 0.01
5,800 Wuhan Guide Infrared 20 - 26,800 Yunnan Tin 26 -
2,200 Wuhan Jingce Electronic 17 - 121,000 Yunnan Water Investment 17 -
42,100 Wuhu Sanqi Interactive Entertainment 15,601 Yusin 28 -
Network Technology 227 0.02 1,474,829 Yuzhou Properties 520 0.04
27,800 Wuhu Token Science 36 - 4,700 ZBOM Home Collection 14 -
52,300 Wuliangye Yibin 1,031 0.08 4,300 Zhangzhou Pientzehuang Pharmaceutical 84 0.01
45,700 WUS Printed Circuit Kunshan 132 0.01 27,500 Zhejiang Century Huatong 48 0.01
37,520 WuXi AppTec 396 0.03 31,200 Zhejiang Chint Electrics 95 0.01
13,300 Wuxi Lead Intelligent Equipment 71 0.01 8,900 Zhejiang Crystal-Optech 18 -
34,600 Wuxi Taiji Industry 47 - 28,400 Zhejiang Dahua Technology 63 0.01
125,492 XCMG Construction Machinery 85 0.01 4,640 Zhejiang Dingli Machinery 41 -
269,500 Xiabuxiabu Catering Management China 216 0.02 452,000 Zhejiang Expressway 260 0.02
88,579 Xiamen C & D 83 0.01 8,500 Zhejiang Garden Bio-Chemical
2,500 Xiamen Faratronic 18 - High-tech 14 -
398,000 Xiamen International Port 26 - 8,100 Zhejiang Hailiang 8 -
6,200 Xiamen Intretech 41 - 27,800 Zhejiang Hangmin 17 -
23,800 Xiamen ITG 18 - 78,000 Zhejiang Huafeng Spandex 46 -
6,100 Xiamen Kingdomway 18 - 17,100 Zhejiang Huahai Pharmaceutical 67 0.01
15,400 Xiamen Tungsten 21 - 42,400 Zhejiang Jiahua Energy Chemical
12,300 Xinfengming 14 - Industry 43 -
Dimensional Fund Advisors Ltd. Interim Report and Financial Statements, 30 June 2020 34

Emerging Markets Core Equity Fund
Portfolio Statement (continued)as at 30 June 2020
Holding Investment
Fair
Value
£'000
Percentage
of total
net assets
% Holding Investment
Fair
Value
£'000
Percentage
of total
net assets
%
China (continued) Colombia (continued)
10,400 Zhejiang Jianfeng 17 - 28,740 Mineros 20 -
6,900 Zhejiang Jingsheng Mechanical & 10,104 Promigas ESP 14 -
Electrical 20 - 3,089 0.24
48,700 Zhejiang Jinke Culture Industry 19 -
39,202 Zhejiang Juhua 31 - Cyprus 0.00% (0.00%)
69,404 Zhejiang Longsheng 102 0.01
3,700 Zhejiang Medicine 8 - 3,890 Global Ports Investments GDR 9 -
10,700 Zhejiang Narada Power Source 13 - 9 -
38,800 Zhejiang NHU 130 0.01
27,700 Zhejiang Runtu 29 - Czech Republic 0.12% (0.18%)
54,817 Zhejiang Sanhua Intelligent Controls 138 0.01
28,900 Zhejiang Satellite Petrochemical 54 0.01 23,383 CEZ 401 0.03
44,000 Zhejiang Semir Garment 36 - 10,310 Komercni banka 198 0.02
10,000 Zhejiang Supor 82 0.01 331,912 Moneta Money Bank 615 0.05
29,400 Zhejiang Wanfeng Auto Wheel 22 - 24,325 O2 Czech Republic 180 0.01
8,320 Zhejiang Weiming Environment 316 Philip Morris CR 144 0.01
Protection 22 - 1,538 0.12
37,100 Zhejiang Weixing New Building
Materials 50 - Egypt 0.05% (0.07%)
3,600 Zhejiang Wolwo Bio-Pharmaceutical 26 -
8,800 Zhejiang Xianju Pharmaceutical 17 - 207,765 Commercial International Bank Egypt
16,400 Zhejiang Yasha Decoration 19 - GDR 655 0.05
12,900 Zhejiang Yongtai Technology 18 - 25,674 Egyptian Financial Group-Hermes GDR 31 -
159,200 Zhengzhou Coal Mining Machinery 55 0.01 686 0.05
38,900 Zhengzhou Yutong Bus 55 0.01
2,186,000 Zhong An 50 - Greece 0.29% (0.40%)
31,100 Zhongjin Gold 33 -
31,100 Zhongshan Broad Ocean Motor 13 - 21,213 Aegean Airlines 78 0.01
364,500 Zhongsheng 1,644 0.13 154,043 Alpha Bank 92 0.01
106,800 Zhongtian Financial 39 - 15,437 Athens Water Supply & Sewage 99 0.01
299,500 Zhou Hei Ya International 208 0.02 12,949 Autohellas 42 -
230,000 Zhuzhou CRRC Times Electric 475 0.04 9,614 Bank of Greece 111 0.01
87,700 Zhuzhou Kibing 60 0.01 52,359 Ellaktor 51 -
23,300 Zibo Qixiang Tengda Chemical 17 - 272,818 Eurobank Ergasias Services 102 0.01
1,912,000 Zijin Mining 725 0.06 10,904 FF* 9 -
332,800 Zoomlion Heavy Industry Science and 23,968 Fourlis 93 0.01
Technology 209 0.02 50,756 GEK Terna Real Estate Construction 282 0.02
257,756 ZTE 641 0.05 9,379 Hellenic Exchanges - Athens Stock
91,079 ZTO Express Cayman ADR 2,751 0.22 Exchange 27 -
324,056 25.48 12,400 Hellenic Petroleum 67 0.01
37,617 Hellenic Telecommunications
Colombia 0.24% (0.40%) Organization 415 0.03
48,025 Holding Co ADMIE IPTO 101 0.01
14,184 Banco Davivienda Preference Shares 89 0.01 30,785 Intracom 14 -
15,304 Banco de Bogota 202 0.02 18,001 JUMBO 263 0.02
22,933 Bancolombia 119 0.01 18,509 LAMDA Development 100 0.01
8,648 Bancolombia ADR 185 0.01 327,281 Marfin Investment 18 -
8,850 Bolsa de Valores de Colombia 19 - 20,263 Motor Oil Hellas Corinth Refineries 237 0.02
237,212 Celsia ESP 209 0.02 35,339 Mytilineos 238 0.02
188,334 Cementos Argos 140 0.01 80,542 National Bank of Greece 95 0.01
82,600 CEMEX Latam 28 - 43,693 OPAP 337 0.03
63,625 Constructora Conconcreto 5 - 128,359 Piraeus Bank 180 0.01
46,829 Corp Financiera Colombiana 281 0.02 3,022 Piraeus Port Authority 47 -
836,006 Ecopetrol 377 0.03 732 Plastika Kritis 9 -
86,242 Grupo Argos Colombia 187 0.01 48,025 Public Power 150 0.01
31,750 Grupo Argos Colombia Preference 9,740 Sarantis 73 0.01
Shares 54 - 18,487 Terna Energy 160 0.01
26,685 Grupo Aval Acciones y Valores ADR 93 0.01 921 Thessaloniki Port Authority 17 -
147,047 Grupo Aval Acciones y Valores 14,724 Titan Cement International 145 0.01
Preference Shares 27 - 3,652 0.29
47,492 Grupo de Inversiones Suramericana 194 0.01
29,830 Grupo de Inversiones Suramericana Hong Kong 5.97% (4.85%)
Preference Shares 104 0.01
171,396 Grupo Energia Bogota 87 0.01 201,000 AAG Energy 23 -
45,675 Grupo Nutresa 206 0.02 345,000 Ajisen China 38 -
110,821 Interconexion Electrica ESP 449 0.04 80,000 AKM Industrial 8 -
Dimensional Fund Advisors Ltd. Interim Report and Financial Statements, 30 June 2020 35

Emerging Markets Core Equity Fund
Portfolio Statement (continued)as at 30 June 2020
Holding Investment
Fair
Value
£'000
Percentage
of total
net assets
% Holding Investment
Fair
Value
£'000
Percentage
of total
net assets
%
Hong Kong (continued) Hong Kong (continued)
192,000 Alibaba Health Information Technology 455 0.04 1,094,668 China Resources Land 3,379 0.27
158,000 AMVIG 23 - 515,207 China Resources Power 494 0.04
1,032,000 Anxin-China* - - 120,000 China Shuifa Singyes Energy 8 -
236,000 APT Satellite 49 - 2,451,289 China South City 201 0.02
1,382,000 Asia Television 10 - 595,000 China Starch 8 -
315,000 Asian Citrus* 4 - 1,048,850 China State Construction
272,000 Ausnutria Dairy 496 0.04 International 498 0.04
1,425,816 AVIC International HK 18 - 794,885 China Taiping Insurance 1,035 0.08
268,500 Beijing Enterprises 731 0.06 1,274,000 China Traditional Chinese Medicine 500 0.04
4,460,000 Beijing Enterprises Clean Energy 19 - 1,168,000 China Travel International
2,674,000 Beijing Enterprises Water 849 0.07 Investment Hong Kong 135 0.01
1,048,000 Beijing Gas Blue Sky 12 - 1,452,486 China Unicom Hong Kong 640 0.05
940,000 Beijing Properties 10 - 116,255 China Unicom Hong Kong ADR 516 0.04
1,582,000 Bosideng International 398 0.03 222,000 China Vast Industrial Urban
1,540,000 Brilliance China Automotive 1,124 0.09 Development 78 0.01
82,000 C Animal Health* 1 - 280,000 China Water Affairs 163 0.01
726,022 C C Land 134 0.01 152,000 China Water Industry 4 -
70,000 C&D International Investment 88 0.01 168,000 Chu Kong Shipping Enterprises 16 -
193,000 CA Cultural Technology 40 - 398,000 CIMC Enric 128 0.01
206,000 Canvest Environmental Protection 74 0.01 2,596,000 CITIC 1,986 0.16
1,960,000 Capital Environment 23 - 1,510,810 CITIC Resources 40 -
90,000 Carrianna 5 - 440,000 Citychamp Watch & Jewellery 71 0.01
1,319,000 Century Sunshine 11 - 3,165,352 Concord New Energy 107 0.01
1,018,000 CGN New Energy 158 0.01 296,000 COSCO SHIPPING International Hong
1,120,000 China Aerospace International 57 - Kong 71 0.01
1,915,000 China Agri-Products Exchange 12 - 828,346 COSCO SHIPPING Ports 361 0.03
2,000 China Boton - - 3,100,000 CP Pokphand 218 0.02
1,886,000 China Common Rich Renewable Energy 730,000 CWT International* 2 -
Investments* 186 0.01 1,560,000 Cybernaut International 17 -
1,122,000 China Daye Non-Ferrous Metals Mining 5 - 422,000 Dawnrays Pharmaceutical 40 -
1,320,000 China Dynamics 6 - 28,000 DBA Telecommunication Asia* 1 -
508,000 China Everbright 598 0.05 368,500 Digital China Holdings 194 0.02
354,000 China Everbright Greentech 113 0.01 173,000 Essex Bio-technology 99 0.01
1,177,740 China Everbright International 507 0.04 282,000 EVA Precision Industrial 11 -
861,200 China Fiber Optic Network System* 5 - 1,604,000 Far East Horizon 1,106 0.09
518,000 China Foods 159 0.01 94,200 Fuguiniao* 7 -
911,400 China Gas 2,293 0.18 3,950,000 Fullshare 59 -
126,000 China Glass 5 - 1,570,000 GCL New Energy 18 -
360,000 China Grand Pharmaceutical and 7,025,000 GCL-Poly Energy 161 0.01
Healthcare 205 0.02 2,415,000 Geely Automobile 3,095 0.24
81,000 China High Precision Automation* 2 - 3,126,000 Gemdale Properties & Investment 470 0.04
128,000 China High Speed Transmission 1,489,000 Glorious Property 30 -
Equipment 61 0.01 212,000 Golden Meditech 18 -
44,000 China Infrastructure & Logistics 4 - 98,000 Goldlion 16 -
1,343,133 China Jinmao 767 0.06 125,000 Goldpac 18 -
24,000 China Lumena New Materials* - - 7,349 Greentown China Rights - -
24,000 China Lumena New Materials Rights - - 590,000 Guangdong Investment 825 0.07
2,550,000 China Medical & HealthCare 46 - 178,000 Guangdong Land 16 -
918,000 China Mengniu Dairy 2,859 0.22 576,000 Haier Electronics 1,420 0.11
610,000 China Merchants Land 76 0.01 143,000 Health & Happiness H&H International 526 0.04
693,943 China Merchants Port 666 0.05 235,000 Henderson Investment 10 -
107,400 China Metal Recycling* - - 978,800 Hengdeli 33 -
1,010,000 China Minsheng Financial 10 - 1,032,000 Hi Sun Technology China 94 0.01
848,500 China Mobile 4,659 0.37 75,906 HKC 36 -
234,775 China Mobile ADR 6,399 0.50 428,000 Hopson Development 359 0.03
341,692 China New Town Development 5 - 1,360,485 Hua Han Health Industry* 28 -
262,000 China Oceanwide 6 - 510,000 Huanxi Media 82 0.01
2,330,000 China Oil & Gas 59 - 75,400 IMAX China 89 0.01
1,345,749 China Overseas Grand Oceans 619 0.05 134,000 Inspur International 37 -
1,777,447 China Overseas Land & Investment 4,383 0.34 348,672 Jiayuan International 117 0.01
598,815 China Overseas Property 516 0.04 124,000 Jinchuan Group International
1,425,000 China Power International Development 211 0.02 Resources 9 -
119,000 China Properties 6 - 1,642,000 Joy City Property 86 0.01
448,716 China Resources Beer 2,040 0.16 422,000 Ju Teng International 124 0.01
1,488,057 China Resources Cement 1,483 0.12 238,385 K Wah International 83 0.01
428,000 China Resources Gas 1,699 0.13 1,200,000 Kai Yuan 6 -
Dimensional Fund Advisors Ltd. Interim Report and Financial Statements, 30 June 2020 36

Emerging Markets Core Equity Fund
Portfolio Statement (continued)as at 30 June 2020
Holding Investment
Fair
Value
£'000
Percentage
of total
net assets
% Holding Investment
Fair
Value
£'000
Percentage
of total
net assets
%
Hong Kong (continued) Hong Kong (continued)
348,653 Kingboard 735 0.06 307,125 Yuexiu Transport Infrastructure 174 0.01
692,043 Kingboard Laminates 566 0.04 62,000 Zhongyu Gas 47 -
2,310,000 Kunlun Energy 1,219 0.10 462,000 Zhuguang 53 -
50,000 Lee & Man Chemical 16 - 75,950 5.97
903,800 Lee & Man Paper Manufacturing 395 0.03
148,500 Lee's Pharmaceutical 63 0.01 Hungary 0.24% (0.35%)
4,215 Legend Rights* - -
232,500 Lifestyle China 44 - 18,697 CIG Pannonia Life Insurance 8 -
530,000 LVGEM China Real Estate Investment 130 0.01 229,554 Magyar Telekom Telecommunications 226 0.02
62,000 Min Xin 16 - 272,888 MOL Hungarian Oil & Gas 1,316 0.10
359,000 Mingfa Group International* 2 - 17,532 Opus Global 12 -
806,000 Minmetals Land 81 0.01 35,221 OTP Bank 1,011 0.08
3,200,000 Nan Hai 20 - 26,250 Richter Gedeon 442 0.04
148,500 NetDragon Websoft 340 0.03 3,015 0.24
199,000 New World Department Store China 29 -
1,147,000 Nine Dragons Paper 844 0.07 India 10.65% (11.89%)
112,000 Overseas Chinese Town Asia 19 -
1,866,000 Panda Green Energy 27 - 1,088 3M India 220 0.02
427,000 PAX Global Technology 151 0.01 3,808 Aarti Drugs 52 -
424,000 Phoenix Media Investment 19 - 21,180 Aarti Industries 214 0.02
1,427,000 Poly Property 350 0.03 1,059 Aarti Surfactants* 1 -
1,478,000 Pou Sheng International 277 0.02 8,027 ABB India 82 0.01
78,000 Road King Infrastructure 86 0.01 1,605 ABB Power Products & Systems India 15 -
45,464 Rotam Global Agrosciences 19 - 703 Abbott India 119 0.01
261,000 Shanghai Industrial 326 0.03 17,501 ACC 252 0.02
1,355,000 Shanghai Industrial Urban Development 127 0.01 2,070 Accelya Solutions India 21 -
1,070,000 Shanghai Zendai Property 3 - 78,997 Adani Enterprises 133 0.01
656,526 Shenzhen International 852 0.07 67,610 Adani Gas 112 0.01
1,582,981 Shenzhen Investment 406 0.03 151,572 Adani Green Energy 587 0.05
557,500 Shimao 1,920 0.15 173,225 Adani Ports & Special Economic Zone 647 0.05
834,000 Shoucheng 134 0.01 517,452 Adani Power 200 0.02
1,323,126 Shougang Fushan Resources 223 0.02 102,228 Adani Transmission 286 0.02
646,000 Silver Grant International 63 0.01 226,421 Aditya Birla Capital 155 0.01
3,214,500 Sino Biopharmaceutical 4,938 0.39 102,605 Aditya Birla Fashion and Retail 138 0.01
1,152,000 Sinofert 84 0.01 11,992 Aditya Birla Fashion And Retail
1,034,000 Sinolink Worldwide 54 - Rights 22/07/2020 2 -
534,000 Sinopec Kantons 166 0.01 25,103 Advanced Enzyme Technologies 46 -
1,047,949 Skyworth 239 0.02 23,361 Aegis Logistics 44 -
272,000 Sparkle Roll 7 - 2,922 Agro Tech Foods 16 -
247,000 Spring Real Estate Investment Trust 64 0.01 10,870 Ahluwalia Contracts India 24 -
1,648,000 SRE 5 - 14,370 AIA Engineering 248 0.02
1,068,503 SSY 594 0.05 9,443 Ajanta Pharma 144 0.01
1,094,500 Sun Art Retail 1,524 0.12 4,922 Akzo Nobel India 97 0.01
680,000 Symphony Holdings 62 0.01 50,442 Alembic 44 -
4,870,000 Taung Gold International 12 - 29,229 Alembic Pharmaceuticals 287 0.02
405,000 TCL Electronics 161 0.01 4,102 Alkyl Amines Chemicals 93 0.01
1,050,000 Tech Pro Technology Development* 1 - 517,550 Allahabad Bank* 42 -
198,500 Texhong Textile 129 0.01 38,723 Allcargo Logistics 33 -
166,000 Tian An China Investment 60 0.01 19,537 Amara Raja Batteries 137 0.01
152,000 Tianjin Development 28 - 219,075 Ambuja Cements 458 0.04
1,042,000 Tianjin Port Development 58 - 42,645 Amtek Auto* - -
516,000 Tibet Water Resources 27 - 8,757 Apar Industries 30 -
136,000 Time Watch Investments 11 - 3,766 APL Apollo Tubes 63 0.01
245,596 Tomson 44 - 8,323 Apollo Hospitals Enterprise 122 0.01
2,250,000 Tongda 108 0.01 158,704 Apollo Tyres 185 0.02
112,000 Top Spring International 13 - 77,856 Arvind 27 -
316,793 Towngas China 116 0.01 15,571 Arvind Fashions 28 -
578,000 Truly International 49 - 5,300 Arvind Fashions Rights 17/07/2020 4 -
3,694,000 United Energy 536 0.04 40,651 Asahi India Glass 77 0.01
198,000 Vinda International 577 0.05 775,691 Ashok Leyland 394 0.03
250,000 Wasion 65 0.01 44,338 Ashoka Buildcon 30 -
82,000 Wison Engineering Services 7 - 67,730 Asian Paints 1,233 0.10
1,430,000 Yanchang Petroleum International 8 - 12,545 Aster DM Healthcare 17 -
104,000 Yip's Chemical 23 - 21,638 Astral Poly Technik 224 0.02
4,735,612 Yuexiu Property 682 0.05 683 AstraZeneca Pharma India 26 -
524,000 Yuexiu Real Estate Investment Trust 195 0.02 8,142 Atul 403 0.03
Dimensional Fund Advisors Ltd. Interim Report and Financial Statements, 30 June 2020 37

Emerging Markets Core Equity Fund
Portfolio Statement (continued)as at 30 June 2020
Holding Investment
Fair
Value
£'000
Percentage
of total
net assets
% Holding Investment
Fair
Value
£'000
Percentage
of total
net assets
%
India (continued) India (continued)
179,611 Aurobindo Pharma 1,493 0.12 38,021 Cholamandalam Financial 124 0.01
3,261 Automotive Axles 20 - 143,128 Cholamandalam Investment and Finance 293 0.02
24,306 Avanti Feeds 132 0.01 91,418 Cipla 632 0.05
23,130 Avenue Supermarts 578 0.05 137,435 City Union Bank 180 0.01
149,277 Axis Bank 656 0.05 246,783 Coal India 354 0.03
26,657 Axis Bank GDR 578 0.05 19,822 Cochin Shipyard 64 0.01
18,030 Bajaj & Investment 496 0.04 2,043 Coforge 31 -
15,113 Bajaj Auto 461 0.04 32,321 Colgate-Palmolive India 489 0.04
24,293 Bajaj Consumer Care 38 - 63,989 Container Corp Of India 288 0.02
13,196 Bajaj Electricals 56 0.01 54,150 Coromandel International 442 0.04
46,215 Bajaj Finance 1,411 0.11 1,894 CreditAccess Grameen 11 -
7,539 Bajaj Finserv 475 0.04 8,608 CRISIL 151 0.01
240,225 Bajaj Hindusthan Sugar 19 - 196,888 Crompton Greaves Consumer Electricals 503 0.04
5,453 Balaji Amines 29 - 21,784 Cummins India 92 0.01
46,178 Balkrishna Industries 632 0.05 27,481 Cyient 82 0.01
35,364 Balmer Lawrie 42 - 137,788 Dabur India 695 0.06
97,009 Balrampur Chini Mills 141 0.01 29,826 Dalmia Bharat 217 0.02
15,683 Banco Products India 12 - 46,126 DB Limited 37 -
18,817 Bandhan Bank 65 0.01 85,835 DCB Bank 70 0.01
314,801 Bank of Baroda 165 0.01 39,027 DCM Shriram 133 0.01
994,343 Bank of Maharashtra 119 0.01 18,910 Deepak Fertilisers & Petrochemicals 24 -
863 Bannari Amman Sugars 9 - 24,089 Deepak Nitrite 124 0.01
5,965 BASF India 73 0.01 17,957 Delta 17 -
12,986 Bata India 183 0.02 39,754 DEN Networks 32 -
2,254 Bayer CropScience 145 0.01 17,894 Dhampur Sugar Mills 26 -
110,231 Berger Paints India 587 0.05 9,343 Dhanuka Agritech 71 0.01
30,111 Bhansali Engineering Polymers 15 - 34,332 Dilip Buildcon 101 0.01
347,637 Bharat Electronics 332 0.03 182,258 Dish TV India 15 -
99,204 Bharat Forge 339 0.03 41,548 Dishman Carbogen Amcis 55 -
168,620 Bharat Petroleum 680 0.05 20,792 Divi's Laboratories 511 0.04
632 Bharat Rasayan 51 - 951 Dixon Technologies India 59 0.01
421,201 Bharti Airtel 2,546 0.20 158,102 DLF 254 0.02
113,104 Bharti Infratel 270 0.02 12,181 Dr Lal PathLabs 205 0.02
64,973 Biocon 274 0.02 609 Dr Reddy's Laboratories 26 -
12,082 Birla 76 0.01 30,705 Dr Reddy's Laboratories ADR 1,327 0.10
112,028 Birlasoft 108 0.01 12,143 eClerx Services 59 0.01
18,884 Bliss Gvs Pharma 20 - 256,633 Edelweiss Financial Services 174 0.01
2,452 Blue Dart Express 54 - 3,282 Eicher Motors 649 0.05
10,885 Blue Star 59 0.01 47,308 EID Parry India 141 0.01
31,136 Bodal Chemicals 20 - 69,841 EIH 48 -
43,984 Bombay Dyeing & Manufacturing 34 - 14,181 Elgi Equipments 22 -
13,947 Borosil Renewables 20 - 43,655 Emami 102 0.01
2,055 Bosch 253 0.02 12,521 Endurance Technologies 117 0.01
44,662 Brigade Enterprises 66 0.01 68,489 Engineers India 56 0.01
18,660 Britannia Industries 726 0.06 10,335 Eris Lifesciences 51 -
6,261 BSE 30 - 47,624 Escorts 536 0.04
115,249 Cadila Healthcare 440 0.04 9,283 Essel Propack 18 -
22,605 Can Fin Homes 82 0.01 969 Excel Industries 7 -
136,186 Canara Bank 148 0.01 139,319 Exide Industries 223 0.02
16,400 Capacit'e Infraprojects 20 - 28,410 FDC 86 0.01
11,711 Caplin Point Laboratories 40 - 761,310 Federal Bank 419 0.03
28,558 Carborundum Universal 86 0.01 43,970 Finolex Cables 135 0.01
6,741 Care Ratings 30 - 24,215 Finolex Industries 130 0.01
171,362 Castrol India 233 0.02 126,039 Firstsource Solutions 48 -
40,860 CCL Products India 103 0.01 178,925 Fortis Healthcare 235 0.02
9,169 Ceat 90 0.01 93,884 Future Enterprises 17 -
10,331 Central Depository Services India 30 - 18,546 Future Lifestyle Fashions 30 -
36,110 Century Plyboards India 46 - 36,272 Gabriel India 34 -
12,471 Century Textiles & Industries 40 - 511,237 GAIL India 560 0.04
1,926 Cera Sanitaryware 46 - 1,765 Galaxy Surfactants 28 -
28,106 CESC 188 0.02 5,360 Garware Technical Fibres 79 0.01
4,536 Cesc Ventures 9 - 17,194 Gateway Distriparks 16 -
237,525 CG Power and Industrial Solutions 22 - 17,486 GE T&D India 14 -
90,110 Chambal Fertilizers and Chemicals 138 0.01 41,190 General Insurance Corp of India 66 0.01
16,750 Chennai Petroleum 14 - 17,541 GFL 19 -
125,864 Chennai Super Kings Cricket* 1 - 29,780 GHCL 44 -
Dimensional Fund Advisors Ltd. Interim Report and Financial Statements, 30 June 2020 38

Emerging Markets Core Equity Fund
Portfolio Statement (continued)as at 30 June 2020
Holding Investment
Fair
Value
£'000
Percentage
of total
net assets
% Holding Investment
Fair
Value
£'000
Percentage
of total
net assets
%
India (continued) India (continued)
2,980 Gillette India 160 0.01 89,174 IIFL Finance 71 0.01
9,507 GlaxoSmithKline Pharmaceuticals 152 0.01 89,174 IIFL Securities 41 -
85,718 Glenmark Pharmaceuticals 415 0.03 12,739 IIFL Wealth Management 141 0.01
935 GMM Pfaudler 41 - 102,124 India Cements 141 0.01
7,282 Godfrey Phillips India 80 0.01 4,829 India Glycols 14 -
94,550 Godrej Consumer Products 704 0.06 219,066 Indiabulls Housing Finance 491 0.04
32,250 Godrej Industries 147 0.01 147,146 Indiabulls Real Estate 79 0.01
11,159 Godrej Properties 104 0.01 77,260 Indiabulls Ventures 98 0.01
103,686 Granules India 227 0.02 4,410 Indiabulls Ventures (Partly-Paid) 2 -
56,795 Graphite India 113 0.01 51,356 Indian Bank 34 -
70,599 Grasim Industries 470 0.04 5,806 Indian Energy Exchange 11 -
33,809 Great Eastern Shipping 78 0.01 167,545 Indian Hotels 145 0.01
43,694 Greaves Cotton 39 - 8,617 Indian Hume Pipe 15 -
26,431 Greenpanel Industries 11 - 380,422 Indian Oil 351 0.03
32,173 Greenply Industries 29 - 855,026 Indian Overseas Bank 113 0.01
17,275 Grindwell Norton 90 0.01 21,498 Indo Count Industries 9 -
14,380 Gujarat Alkalies & Chemicals 52 - 10,008 Indoco Remedies 22 -
21,221 Gujarat Ambuja Exports 33 - 105,205 Indraprastha Gas 503 0.04
17,541 Gujarat Fluorochemicals 68 0.01 68,038 IndusInd Bank 349 0.03
80,805 Gujarat Gas 278 0.02 1,541 INEOS Styrolution India 12 -
22,010 Gujarat Industries Power 17 - 143,053 Infibeam Avenues 92 0.01
53,275 Gujarat Mineral Development 23 - 8,029 Info Edge India 239 0.02
24,298 Gujarat Narmada Valley Fertilizers & 477,296 Infosys 3,780 0.30
Chemicals 40 - 306,584 Infosys ADR 2,390 0.19
143,075 Gujarat Pipavav Port 117 0.01 5,082 Ingersoll Rand India 35 -
43,154 Gujarat State Fertilizers & Chemicals 25 - 37,457 Inox Leisure 92 0.01
101,756 Gujarat State Petronet 242 0.02 20,428 Intellect Design Arena 25 -
5,206 Gulf Oil Lubricants India 32 - 5,655 InterGlobe Aviation 60 0.01
49,976 Hathway Cable & Datacom 17 - 19,956 Ipca Laboratories 360 0.03
12,405 Hatsun Agro Product Limited 88 0.01 82,668 IRB Infrastructure Developers 79 0.01
70,918 Havells India 443 0.04 633,291 ITC 1,334 0.11
333,492 HCL Technologies 2,000 0.16 33,990 ITD Cementation India 18 -
2,236 HDFC Asset Management 60 0.01 26,342 ITI 30 -
398,788 HDFC Bank 4,588 0.36 14,827 J Kumar Infraprojects 15 -
62,742 HDFC Life Insurance 373 0.03 51,550 Jagran Prakashan 22 -
9,969 HealthCare Global Enterprises 13 - 30,045 Jai 27 -
3,495 HEG 31 - 35,862 Jaiprakash Power Ventures 1 -
44,388 HeidelbergCement India 85 0.01 123,240 Jammu & Kashmir Bank 24 -
34,507 Hemisphere Properties India* 12 - 70,333 Jamna Auto Industries 25 -
7,575 Heritage Foods 21 - 12,586 JB Chemicals & Pharmaceuticals 96 0.01
46,310 Hero MotoCorp 1,275 0.10 9,859 Jindal Poly Films 40 -
1,354 Hester Biosciences 18 - 80,400 Jindal Saw 50 -
52,373 Hexaware Technologies 187 0.02 128,074 Jindal Stainless 56 0.01
399,064 HFCL 68 0.01 41,309 Jindal Stainless Hisar 31 -
27,312 Hikal 37 - 226,775 Jindal Steel & Power 395 0.03
1,544 HIL 19 - 10,869 JK Cement 160 0.01
66,705 Himadri Speciality Chemical 34 - 17,092 JK Lakshmi Cement 47 -
529,810 Hindalco Industries 842 0.07 51,783 JK Paper 56 0.01
4,658 Hinduja Global Solutions 33 - 36,740 JK Tyre & Industries 25 -
205,535 Hindustan Petroleum 482 0.04 142,170 JM Financial 107 0.01
153,437 Hindustan Unilever 3,604 0.28 35,195 JMC Projects India 18 -
967 Honda SIEL Power Products 10 - 2,796 Johnson Controls-Hitachi Air
795 Honeywell Automation India 256 0.02 Conditioning India 68 0.01
13,947 Hopewell Tableware* 21 - 299,711 JSW Energy 152 0.01
180,588 Housing Development Finance 3,433 0.27 438,599 JSW Steel 895 0.07
18,121 Huhtamaki PPL 40 - 41,050 JTEKT India 30 -
189,123 ICICI Bank 719 0.06 37,949 Jubilant Foodworks 708 0.06
133,032 ICICI Bank ADR 989 0.08 53,742 Jubilant Life Sciences 381 0.03
22,557 ICICI Lombard General Insurance 309 0.02 16,776 Just Dial 72 0.01
42,690 ICICI Prudential Life Insurance 195 0.02 32,792 Jyothy Labs 41 -
12,605 ICICI Securities 64 0.01 28,742 Kajaria Ceramics 122 0.01
485 ICRA 13 - 36,467 Kalpataru Power Transmission 85 0.01
439,187 IDFC 87 0.01 9,203 Kalyani Steels 20 -
917,189 IDFC First Bank 254 0.02 33,615 Kansai Nerolac Paints 163 0.01
4,920 IFB Industries 22 - 108,098 Karnataka Bank 49 -
468,483 IFCI 38 - 209,643 Karur Vysya Bank 76 0.01
Dimensional Fund Advisors Ltd. Interim Report and Financial Statements, 30 June 2020 39

Emerging Markets Core Equity Fund
Portfolio Statement (continued)as at 30 June 2020
Holding Investment
Fair
Value
£'000
Percentage
of total
net assets
% Holding Investment
Fair
Value
£'000
Percentage
of total
net assets
%
India (continued) India (continued)
17,694 Kaveri Seed 110 0.01 10,860 NESCO 50 -
49,716 KEC International 144 0.01 6,723 Nestle India 1,245 0.10
22,060 KEI Industries 83 0.01 4,096 Newgen Software Technologies 7 -
5,986 Kiri Industries 27 - 626,068 NHPC 135 0.01
9,713 Kirloskar Brothers 12 - 40,297 NIIT 41 -
27,024 Kirloskar Oil Engines 31 - 2,360 Nilkamal 29 -
28,195 KNR Constructions 64 0.01 90,995 NLC India 45 -
13,886 Kolte-Patil Developers 24 - 35,246 NMDC 31 -
76,661 Kotak Mahindra Bank 1,120 0.09 23,937 NOCIL 21 -
104,045 Kpit Technologies 71 0.01 16,804 NRB Bearings 14 -
14,446 KPR Mill 76 0.01 311,180 NTPC 320 0.03
39,039 KRBL 103 0.01 2,172 Nucleus Software Exports 6 -
4,389 KSB 22 - 30,160 Oberoi Realty 119 0.01
17,926 LA Opala RG 36 - 267,397 Oil & Natural Gas 235 0.02
1,236 Lakshmi Machine Works 38 - 90,315 Oil India 91 0.01
21,780 Laurus Labs 122 0.01 24,927 Omaxe 38 -
4,796 LG Balakrishnan & Bros 13 - 11,345 Oracle Financial Services Software 350 0.03
163,403 LIC Housing Finance 467 0.04 44,628 Orient Cement 34 -
56,840 LT Foods 25 - 38,871 Orient Electric 86 0.01
703 Lumax Industries 8 - 17,543 Orient Refractories 34 -
105,212 Lupin 1,035 0.08 1,872 Oriental Carbon & Chemicals 15 -
2,339 LUX Industries 29 - 2,269 Page Industries 486 0.04
50,670 Magma Fincorp 15 - 10,628 Paisalo Digital 24 -
18,233 Mahanagar Gas 207 0.02 28,367 Parag Milk Foods 29 -
1,949 Maharashtra Scooters 52 - 75,185 PC Jeweller 13 -
11,568 Maharashtra Seamless 27 - 32,485 Persistent Systems 223 0.02
250,149 Mahindra & Mahindra 1,377 0.11 344,250 Petronet LNG 966 0.08
187,639 Mahindra & Mahindra Financial 4,199 Pfizer 180 0.01
Services 339 0.03 48,409 Phillips Carbon Black 46 -
68,879 Mahindra CIE Automotive 87 0.01 22,837 Phoenix Mills 143 0.01
24,440 Mahindra Holidays & Resorts India 44 - 28,311 PI Industries 460 0.04
12,703 Mahindra Lifespace Developers 29 - 33,796 Pidilite Industries 500 0.04
6,425 Mahindra Logistics 19 - 47,772 Piramal Enterprises 703 0.06
6,620 Majesco 25 - 33,333 PNB Housing Finance 75 0.01
230,601 Manappuram Finance 377 0.03 34,339 PNC Infratech 53 -
82,946 Mangalore Refinery & Petrochemicals 33 - 3,084 Poly Medicure 10 -
155,091 Marico 590 0.05 7,378 Polyplex 38 -
105,971 Marksans Pharma 37 - 510,801 Power Finance 466 0.04
21,186 Maruti Suzuki India 1,333 0.11 350,857 Power Grid Corp of India 661 0.05
7,185 MAS Financial Services 51 - 1,799 Power Mech Projects 9 -
6,244 Mastek 27 - 21,114 Praj Industries 14 -
60,244 Max Financial Services 349 0.03 27,150 Prakash Industries 10 -
49,238 Max India* 36 - 81,584 Prestige Estates Projects 184 0.02
7,253 Mayur Uniquoters 16 - 79,019 Prism Johnson 40 -
81,089 Meghmani Organics 46 - 2,909 Procter & Gamble Health 127 0.01
31,312 Minda 25 - 3,951 Procter & Gamble Hygiene & Health
31,338 Minda Industries 93 0.01 Care 431 0.03
16,591 Mindtree 166 0.01 3,072 PSP Projects 13 -
5,423 Mishra Dhatu Nigam 13 - 112,511 PTC India 59 0.01
36,617 MOIL 55 - 98,729 PTC India Financial Services 13 -
29,564 Morepen Laboratories 7 - 661,368 Punjab National Bank 248 0.02
692,715 Motherson Sumi Systems 707 0.06 13,730 PVR 148 0.01
15,576 Motilal Oswal Financial Services 100 0.01 25,326 Quess 100 0.01
62,074 Mphasis 582 0.05 15,333 Radico Khaitan 62 0.01
504 MRF 364 0.03 79,272 Rain Industries 65 0.01
3,479 Multi Commodity Exchange of India 48 - 34,297 Rajesh Exports 173 0.01
4,253 Muthoot Capital Services 17 - 29,415 Rallis India 87 0.01
68,073 Muthoot Finance 800 0.06 25,045 Ramco Cements 172 0.01
25,112 Narayana Hrudayalaya 73 0.01 18,910 Ramco Industries 32 -
49,805 Natco Pharma 337 0.03 7,409 Ramkrishna Forgings 13 -
367,216 National Aluminium 126 0.01 97,921 Rashtriya Chemicals & Fertilizers 49 -
50,599 Nava Bharat Ventures 28 - 8,727 Ratnamani Metals & Tubes 98 0.01
7,125 Navin Fluorine International 125 0.01 11,515 Raymond 35 -
56,701 Navneet Education 47 - 155,368 RBL Bank 291 0.02
167,516 NBCC India 42 - 471,531 REC 550 0.04
275,012 NCC 86 0.01 172,472 Redington India 164 0.01
Dimensional Fund Advisors Ltd. Interim Report and Financial Statements, 30 June 2020 40

Emerging Markets Core Equity Fund
Portfolio Statement (continued)as at 30 June 2020
Holding Investment
Fair
Value
£'000
Percentage
of total
net assets
% Holding Investment
Fair
Value
£'000
Percentage
of total
net assets
%
India (continued) India (continued)
27,806 Relaxo Footwears 190 0.02 773,705 Tata Motors 824 0.07
338,430 Reliance Industries 6,237 0.49 116,437 Tata Motors ADR 637 0.05
144,523 Reliance Industries GDR 5,365 0.42 382,657 Tata Power 185 0.02
379,224 Reliance Power 17 - 161,711 Tata Steel 571 0.05
26,868 Repco Home Finance 36 - 2,660 Tata Steel GDR 9 -
68,568 Sadbhav Engineering 33 - 7,285 TCI Express 53 -
2,652 Sanofi India 225 0.02 171,114 Tech Mahindra 1,002 0.08
540 Sasken Technologies 3 - 15,242 Techno Electric & Engineering 31 -
18,375 SBI Life Insurance 160 0.01 12,223 Thermax 99 0.01
3,320 Schaeffler India 128 0.01 55,033 Thomas Cook India 16 -
20,123 Schneider Electric Infrastructure 18 - 6,215 Thyrocare Technologies 34 -
8,576 Security & Intelligence Services 666 Tide Water Oil Co India 29 -
India 35 - 90,801 Time Technoplast 36 -
47,005 Sequent Scientific 46 - 12,094 Timken India 122 0.01
11,958 Sharda Cropchem 34 - 17,651 Tinplate Co of India 22 -
5,403 Sheela Foam 84 0.01 92,754 Titan 953 0.08
12,596 Shilpa Medicare 65 0.01 21,755 Torrent Pharmaceuticals 556 0.04
65,398 Shipping Corp of India 40 - 56,789 Torrent Power 195 0.02
15,563 Shoppers Stop 28 - 17,002 Transport Corp of India 31 -
1,738 Shree Cement 432 0.03 16,227 Trent 109 0.01
50,442 Shreno Preference Shares* 9 - 730,950 Trident 55 -
13,171 Shriram City Union Finance 95 0.01 39,928 Triveni Engineering & Industries 24 -
98,356 Shriram Transport Finance 733 0.06 43,646 Triveni Turbine 32 -
7,170 Siemens 85 0.01 1,207 TTK Prestige 70 0.01
7,651 SKF India 137 0.01 39,391 Tube Investments of India 188 0.02
34,159 Sobha 84 0.01 16,036 TV Today Network 32 -
11,374 Solar Industries India 120 0.01 284,642 TV18 Broadcast 104 0.01
5,179 Solara Active Pharma Sciences 37 - 2,242 TVS Srichakra 33 -
12,257 Somany Ceramics 16 - 590,682 UCO Bank 94 0.01
18,664 Somany Home Innovation 16 - 21,326 Uflex 48 -
19,721 Sonata Software 51 - 20,331 UltraTech Cement 854 0.07
686,892 South Indian Bank 60 0.01 17,048 Unichem Laboratories 32 -
7,397 SRF 288 0.02 355,187 Union Bank of India 122 0.01
9,830 Srikalahasthi Pipes 19 - 25,154 United Breweries 282 0.02
57,793 Star Cement 53 - 105,302 United Spirits 672 0.05
39,556 State Bank of India 76 0.01 181,358 UPL 835 0.07
20,259 State Bank of India GDR 386 0.03 57,030 Usha Martin 12 -
393,563 Steel Authority of India 129 0.01 13,243 VA Tech Wabag 15 -
64,577 Sterlite Technologies 76 0.01 8,663 Vaibhav Global 119 0.01
18,958 Strides Pharma Science 84 0.01 182,864 Vakrangee 69 0.01
12,746 Subros 23 - 10,137 Vardhman Textiles 71 0.01
12,612 Sudarshan Chemical Industries 53 - 22,710 Varun Beverages 167 0.01
4,998 Sumitomo Chemical India 15 - 567,049 Vedanta 651 0.05
111,214 Sun Pharmaceutical Industries 568 0.05 53,638 Vedanta ADR 251 0.02
42,082 Sun TV Network 183 0.01 2,329 Venky's India 28 -
10,626 Sundaram Finance 168 0.01 2,734 Vesuvius India 27 -
10,486 Sundaram Finance Holdings 5 - 44,814 V-Guard Industries 82 0.01
653 Sundaram-Clayton 12 - 11,644 Vinati Organics 121 0.01
26,032 Sundram Fasteners 106 0.01 2,143 Vindhya Telelinks 17 -
31,840 Sunteck Realty 65 0.01 19,391 VIP Industries 54 -
24,839 Suprajit Engineering 39 - 297 V-Mart Retail 6 -
20,564 Supreme Industries 249 0.02 3,855,255 Vodafone Idea 439 0.04
8,172 Supreme Petrochem 15 - 17,155 Voltas 101 0.01
16,281 Suven Life Sciences 7 - 16,623 VRL Logistics 29 -
16,281 Suven Pharmaceuticals 83 0.01 2,493 VST Industries 84 0.01
2,397 Swaraj Engines 38 - 1,353 VST Tillers Tractors 19 -
6,488 Symphony 61 0.01 866 WABCO India 64 0.01
42,426 Syngene International 184 0.02 44,715 Welspun 39 -
37,847 TAKE Solutions 20 - 27,212 Welspun Enterprises 19 -
183 Tasty Bite Eatables 24 - 276,076 Welspun India 111 0.01
31,892 Tata Chemicals 107 0.01 20,516 West Coast Paper Mills 42 -
34,507 Tata Communications 231 0.02 3,326 Wheels India 16 -
159,672 Tata Consultancy Services 3,593 0.28 13,423 Whirlpool of India 299 0.02
101,302 Tata Consumer Products 424 0.03 269,846 Wipro 639 0.05
13,870 Tata Elxsi 134 0.01 18,775 Wockhardt 57 0.01
8,671 Tata Metaliks 45 - 977,710 Yes Bank 270 0.02
Dimensional Fund Advisors Ltd. Interim Report and Financial Statements, 30 June 2020 41

Emerging Markets Core Equity Fund
Portfolio Statement (continued)as at 30 June 2020
Holding Investment
Fair
Value
£'000
Percentage
of total
net assets
% Holding Investment
Fair
Value
£'000
Percentage
of total
net assets
%
India (continued) Indonesia (continued)
313,002 Zee Entertainment Enterprises 578 0.05 1,673,300 Indika Energy 64 0.01
43,367 Zensar Technologies 58 0.01 383,700 Indo Tambangraya Megah 156 0.01
2,784 Zydus Wellness 38 - 149,100 Indocement Tunggal Prakarsa 100 0.01
135,495 10.65 645,100 Indofood CBP Sukses Makmur 343 0.03
1,768,100 Indofood Sukses Makmur 659 0.05
Indonesia 1.86% (2.45%) 47,400 Indo-Rama Synthetics 6 -
227,400 Indosat 31 -
3,083,400 Ace Hardware Indonesia 265 0.02 2,976,200 Industri dan Perdagangan Bintraco
12,924,184 Adaro Energy 735 0.06 Dharma 9 -
1,204,557 Adhi Karya 42 - 1,927,300 Industri Jamu Dan Farmasi Sido Muncul 134 0.01
763,100 Adi Sarana Armada 17 - 558,145 Inovisi Infracom* - -
583,100 AKR Corporindo 84 0.01 400,500 Integra Indocabinet 9 -
7,918,100 Alam Sutera Realty 58 0.01 4,356,300 Inti Agri Resources* 9 -
3,506,246 Aneka Tambang 120 0.01 3,946,100 Intikeramik Alamasri Industri 11 -
911,400 Armidian Karyatama* 1 - 5,188,100 Intiland Development 55 0.01
1,646,000 Arwana Citramulia 36 - 2,553,900 Japfa Comfeed Indonesia 173 0.01
216,133 Astra Agro Lestari 102 0.01 634,601 Jasa Marga 160 0.01
3,231,500 Astra International 886 0.07 1,905,800 Jaya Real Property 44 -
692,600 Astra Otoparts 35 - 7,963,000 Kalbe Farma 661 0.05
5,817,400 Astrindo Nusantara Infrastructure 17 - 2,633,100 Kapuas Prima Coal 21 -
1,343,500 Asuransi Kresna Mitra 94 0.01 9,660,197 Kawasan Industri Jababeka 79 0.01
7,018,000 Bakrie Telecom* 8 - 2,161,300 KMI Wire & Cable 49 -
5,090,600 Bank Bukopin 54 0.01 2,643,987 Krakatau Steel 41 -
1,359,700 Bank Central Asia 2,210 0.17 5,771,800 Kresna Graha Investama 51 0.01
1,106,525 Bank Danamon Indonesia 170 0.01 865,900 Link Net 111 0.01
2,925,366 Bank Mandiri 827 0.07 1,037,225 Lippo Cikarang 50 0.01
3,324,200 Bank Maybank Indonesia 30 - 21,128,920 Lippo Karawaci 204 0.02
1,439,214 Bank Negara Indonesia 376 0.03 769,700 Malindo Feedmill 26 -
1,864,500 Bank Pan Indonesia 85 0.01 1,089,500 Matahari Department Store 100 0.01
1,213,600 Bank Pembangunan Daerah Jawa Barat 2,437,175 Mayora Indah 313 0.03
Dan Banten 53 0.01 4,775,733 Medco Energi Internasional 123 0.01
2,532,700 Bank Pembangunan Daerah Jawa Timur 72 0.01 3,573,500 Media Nusantara Citra 185 0.02
1,320,420 Bank Permata 95 0.01 503,212 Metrodata Electronics 37 -
8,867,600 Bank Rakyat Indonesia 1,535 0.12 5,297,900 Mitra Adiperkasa 236 0.02
1,616,015 Bank Tabungan Negara 115 0.01 908,400 Mitra Keluarga Karyasehat 118 0.01
5,599,800 Barito Pacific 371 0.03 615,200 Mitra Pinasthika Mustika 17 -
42,500 Bayan Resources 30 - 15,920,800 MNC Investama 45 -
2,818,200 Bekasi Fajar Industrial Estate 18 - 10,481,900 MNC Land 66 0.01
311,700 BFI Finance Indonesia 5 - 142,500 MNC Sky Vision 8 -
530,300 Bintang Oto Global 42 - 7,921,600 Modernland Realty 28 -
879,600 BISI International 41 - 587,900 Nippon Indosari Corpindo 40 -
315,100 Blue Bird 20 - 455,500 Pabrik Kertas Tjiwi Kimia 134 0.01
4,449,700 Buana Lintas Lautan 78 0.01 758,900 Pacific Strategic Financial 36 -
2,369,600 Bukit Asam 274 0.02 4,205,000 Pakuwon Jati 100 0.01
3,201,200 Bumi Serpong Damai 135 0.01 2,102,400 Pan Brothers 34 -
10,223,200 Bumi Teknokultura Unggul 29 - 8,769,200 Panin Financial 92 0.01
2,909,300 Capital Financial Indonesia 60 0.01 746,000 Paninvest 32 -
1,395,700 Catur Sentosa Adiprana 28 - 1,666,100 Pelayaran Tamarin Samudra 6 -
2,950,200 Charoen Pokphand Indonesia 935 0.07 2,885,500 Perusahaan Gas Negara 187 0.02
3,900,297 Ciputra Development 136 0.01 1,507,100 Perusahaan Perkebunan London Sumatra
692,206 Citra Marga Nusaphala Persada 59 0.01 Indonesia 71 0.01
4,765,700 City Retail Developments 37 - 385,900 Pool Advista Indonesia* 1 -
4,297,300 Delta Dunia Makmur 33 - 1,653,718 PP 82 0.01
464,600 Dharma Satya Nusantara 9 - 7,707,100 PP Properti 22 -
4,273,500 Eagle High Plantations 22 - 3,732,400 Puradelta Lestari 37 -
2,892,800 Elnusa 36 - 1,156,400 Ramayana Lestari Sentosa 39 -
991,400 Erajaya Swasembada 71 0.01 23,469,200 Rimo International Lestari* 50 -
1,783,700 Eureka Prima Jakarta* 11 - 1,935,800 Salim Ivomas Pratama 28 -
1,152,400 Gajah Tunggal 25 - 405,600 Sampoerna Agro 48 -
2,696,006 Garuda Indonesia 38 - 9,140,400 Sarana Menara Nusantara 530 0.04
6,430,800 Global Mediacom 68 0.01 1,429,700 Sariguna Primatirta 38 -
239,400 Gudang Garam 645 0.05 1,305,300 Sawit Sumbermas Sarana 58 0.01
47,750,800 Hanson International* 102 0.01 8,775,900 Sekawan Intipratama* - -
413,900 Harum Energy 28 - 1,126,400 Selamat Sempurna 67 0.01
228,800 Impack Pratama Industri 16 - 913,900 Semen Baturaja 16 -
1,705,200 Indah Kiat Pulp & Paper 582 0.05 548,400 Semen Indonesia 301 0.02
Dimensional Fund Advisors Ltd. Interim Report and Financial Statements, 30 June 2020 42

Emerging Markets Core Equity Fund
Portfolio Statement (continued)as at 30 June 2020
Holding Investment
Fair
Value
£'000
Percentage
of total
net assets
% Holding Investment
Fair
Value
£'000
Percentage
of total
net assets
%
Indonesia (continued) Malaysia (continued)
7,529,300 Sentul City 21 - 316,650 Bursa Malaysia 439 0.04
104,000 Siloam International Hospitals 31 - 335,400 Cahya Mata Sarawak 100 0.01
38,000 Sinar Mas Multiartha 36 - 375,000 Capitaland Malaysia Mall Trust 57 0.01
1,008,400 Sitara Propertindo* 11 - 74,800 Carlsberg Brewery Malaysia 351 0.03
8,678,800 Smartfren Telecom 48 - 135,600 CB Industrial Product 23 -
8,275,000 Sri Rejeki Isman 89 0.01 6,100 Chin Teck Plantations 6 -
1,921,000 Steel Pipe Industry of Indonesia 14 - 1,052,920 CIMB 711 0.06
7,086,900 Sugih Energy* 4 - 45,800 CSC Steel 7 -
1,164,800 Sumber Alfaria Trijaya 53 - 217,150 Cypark Resources 41 -
4,028,600 Summarecon Agung 135 0.01 300,900 D&O Green Technologies 42 -
2,465,600 Surya Citra Media 164 0.01 372,600 Dagang NeXchange 13 -
1,952,300 Surya Esa Perkasa 17 - 56,400 Daiman Development* - -
1,366,700 Surya Semesta Internusa 30 - 301,400 Datasonic 80 0.01
55,924 Telekomunikasi Indonesia ADR 1,006 0.08 190,100 Dayang Enterprise 46 -
424,800 Tempo Scan Pacific 33 - 326,840 Dialog 225 0.02
1,436,600 Tiga Pilar Sejahtera Food* 3 - 628,000 DiGi.Com 516 0.04
1,618,999 Timah 55 0.01 547,000 DRB-Hicom 177 0.01
869,500 Tiphone Mobile Indonesia* 6 - 48,300 Dufu Technology 45 -
708,800 Totalindo Eka Persada 2 - 10,100 Dutch Lady Milk Industries 83 0.01
4,979,800 Tower Bersama Infrastructure 310 0.03 410,098 Eastern & Oriental 31 -
16,144,900 Trada Alam Minera* 35 - 636,000 Eco World Development 50 -
2,979,200 Tunas Baru Lampung 95 0.01 232,600 Eco World International 19 -
550,500 Tunas Ridean 42 - 645,300 Ekovest 62 0.01
808,100 Ultrajaya Milk Industry & Trading 76 0.01 818,600 FGV 155 0.01
1,444,000 Unilever Indonesia 649 0.05 47,000 Fraser & Neave 286 0.02
1,092,613 United Tractors 1,033 0.08 266,900 Frontken 127 0.01
902,100 Vale Indonesia 144 0.01 134,840 Gabungan AQRS 22 -
8,821,600 Visi Media Asia 25 - 197,500 Gadang 17 -
6,349,800 Waskita Beton Precast 71 0.01 523,620 Gamuda 363 0.03
2,093,221 Waskita Karya 85 0.01 63,000 Gas Malaysia 34 -
1,498,699 Wijaya Karya 103 0.01 420,500 Genting 328 0.03
2,003,600 Wijaya Karya Bangunan Gedung 22 - 1,076,600 Genting Malaysia 516 0.04
2,194,800 Wijaya Karya Beton 35 - 44,800 Genting Plantations 84 0.01
2,785,875 XL Axiata 439 0.04 259,400 George Kent Malaysia 30 -
23,609 1.86 268,866 Globetronics Technology 109 0.01
147,800 Guan Chong 74 0.01
Malaysia 2.38% (2.65%) 77,200 GuocoLand Malaysia 7 -
100,450 Hai-O Enterprise 36 -
279,982 7-Eleven Malaysia 71 0.01 207,720 HAP Seng Consolidated 336 0.03
538,400 Aeon 103 0.01 69,700 Hap Seng Plantations 19 -
52,090 AEON Credit Service M 94 0.01 473,800 Hartalega 1,172 0.09
179,385 AFFIN Bank 54 0.01 68,000 Heineken Malaysia 290 0.02
1,033,200 AirAsia 171 0.01 86,900 Hengyuan Refining 57 0.01
935,400 AirAsia X 18 - 166,100 HeveaBoard 12 -
6,100 Ajinomoto Malaysia 20 - 374,400 Hiap Teck Venture 11 -
486,700 Alliance Bank Malaysia 199 0.02 77,811 Hong Leong Bank 208 0.02
32,900 Allianz Malaysia 88 0.01 60,965 Hong Leong Financial 152 0.01
149,060 AmFIRST Real Estate Investment Trust 12 - 41,100 Hong Leong Industries 63 0.01
814,612 AMMB 482 0.04 135,300 Hup Seng Industries 24 -
662,000 Astro Malaysia 103 0.01 36,198 IGB 18 -
186,400 ATA IMS 44 - 595,244 IGB Real Estate Investment Trust 203 0.02
785,332 Axiata 529 0.04 60,000 IHH Healthcare 63 0.01
285,432 Axis Real Estate Investment Trust 112 0.01 1,110,480 IJM 380 0.03
56,900 Batu Kawan 158 0.01 52,400 IJM Plantations 17 -
1,877,933 Berjaya 66 0.01 1,123,286 Inari Amertron 360 0.03
376,700 Berjaya Assets 21 - 210,000 Insas 25 -
81,900 Berjaya Food 17 - 219,509 IOI 181 0.02
369,600 Berjaya Land 12 - 550,629 IOI Properties 102 0.01
386,094 Berjaya Sports Toto 161 0.01 1,052,800 Iris 37 -
303,000 Bermaz Auto 85 0.01 338,700 Iskandar Waterfront City 37 -
213,922 BIMB 139 0.01 308,100 JAKS Resources 51 0.01
305,038 Boustead 35 - 239,490 Jaya Tiasa 22 -
385,800 Boustead Plantations 26 - 173,700 JHM Consolidation 44 -
528,070 Brait 82 0.01 50,200 Keck Seng Malaysia 35 -
69,794 British American Tobacco Malaysia 143 0.01 249,200 Kenanga Investment Bank 26 -
1,535,500 Bumi Armada 66 0.01 241,440 Kerjaya Prospek 47 -
Dimensional Fund Advisors Ltd. Interim Report and Financial Statements, 30 June 2020 43

Emerging Markets Core Equity Fund
Portfolio Statement (continued)as at 30 June 2020
Holding Investment
Fair
Value
£'000
Percentage
of total
net assets
% Holding Investment
Fair
Value
£'000
Percentage
of total
net assets
%
Malaysia (continued) Malaysia (continued)
35,400 Kim Loong Resources 8 - 3,870,688 Sapura Energy 66 0.01
57,000 KLCCP Stapled 86 0.01 100,642 Sarawak Oil Palms 57 0.01
1,002,851 KNM 40 - 110,000 Scientex 184 0.02
400,000 Kossan Rubber Industries 648 0.05 543,270 Serba Dinamik 171 0.01
546,900 KPJ Healthcare 86 0.01 155,220 Serba Dinamik Warrants 31/12/2099 8 -
128,300 Kretam 10 - 1,251,254 Sime Darby 501 0.04
253,573 KSL 28 - 197,154 Sime Darby Plantation 185 0.02
33,002 Kuala Lumpur Kepong 139 0.01 750,854 Sime Darby Property 96 0.01
64,100 Kumpulan Fima 19 - 148,600 SKP Resources 38 -
1,177,000 Land & General 18 - 540,752 SP Setia 87 0.01
190,100 Landmarks 9 - 973,100 Sumatec Resources* - -
553,520 LBS Bina 37 - 676,150 Sunway 177 0.01
77,200 Lii Hen Industries 36 - 232,251 Sunway Construction 83 0.01
71,200 Lingkaran Trans Kota 57 0.01 549,900 Sunway Real Estate Investment Trust 169 0.01
147,100 Lotte Chemical Titan 50 - 74,280 Suria Capital 13 -
82,480 LPI Capital 210 0.02 135,700 Syarikat Takaful Malaysia Keluarga 115 0.01
109,800 Magni-Tech Industries 43 - 152,947 Ta Ann 68 0.01
360,800 Magnum 151 0.01 554,600 TA Enterprise 53 0.01
662,142 Mah Sing 67 0.01 617,800 TA Global 28 -
436,600 Malakoff 76 0.01 104,866 Taliworks 17 -
642,771 Malayan Banking 919 0.07 66,300 Tan Chong Motor 14 -
255,800 Malayan Flour Mills 25 - 320,199 Telekom Malaysia 253 0.02
499,273 Malaysia Airports 518 0.04 344,493 Tenaga Nasional 761 0.06
759,791 Malaysia Building Society 90 0.01 19,000 Thong Guan Industries 14 -
64,900 Malaysian Pacific Industries 135 0.01 109,260 TIME dotCom 225 0.02
1,168,000 Malaysian Resources 105 0.01 93,900 TMC Life Sciences 9 -
356,025 Matrix Concepts 123 0.01 339,400 Top Glove 1,040 0.08
421,500 Maxis 431 0.03 280,418 Tropicana 47 -
59,150 MBM Resources 36 - 181,900 TSH Resources 29 -
553,200 Media Chinese International 18 - 352,400 Tune Protect 22 -
68,000 Mega First 81 0.01 134,350 Uchi Technologies 66 0.01
165,500 MISC 242 0.02 106,100 UEM Edgenta 39 -
202,678 MKH 43 - 940,212 UEM Sunrise 75 0.01
148,100 MMC 20 - 146,300 UMW 71 0.01
213,703 MNRB 29 - 17,100 Unisem M 7 -
186,000 MPHB Capital 27 - 21,700 United Malacca 19 -
124,200 MRCB-QUILL REIT 17 - 50,200 United Plantations 126 0.01
78,800 Muda 22 - 385,600 UOA Development 135 0.01
209,000 Muhibbah Engineering M 37 - 1,072,827 Velesto Energy 30 -
72,870 Mulpha International 21 - 71,900 ViTrox 123 0.01
668,200 My EG Services 179 0.02 1,336,333 Vivocom International 8 -
16,300 Nestle Malaysia 430 0.03 685,400 VS Industry 127 0.01
205,400 OCK 22 - 159,266 Wah Seong 15 -
141,880 Oriental 153 0.01 565,808 WCT 51 0.01
631,717 OSK 97 0.01 112,800 Wellcall 17 -
198,200 Padini 93 0.01 393,200 Westports 281 0.02
8,600 Panasonic Manufacturing Malaysia 49 - 213,500 Widad 19 -
162,457 Pantech 11 - 241,200 Yinson 271 0.02
181,370 Paramount 31 - 165,417 YNH Property 86 0.01
305,900 Pavilion Real Estate Investment Trust 93 0.01 1,739,986 YTL 275 0.02
105,000 Pentamaster 103 0.01 194,700 YTL Hospitality REIT 39 -
51,100 Petron Malaysia Refining & Marketing 39 - 352,455 YTL Power International 45 -
407,700 Petronas Chemicals 481 0.04 30,226 2.38
73,500 Petronas Dagangan 288 0.02
114,400 Petronas Gas 366 0.03 Mexico 2.32% (3.30%)
93,200 PIE Industrial 23 -
214,500 Pos Malaysia 38 - 12,500 ALEATICA 8 -
111,160 PPB 372 0.03 2,162,650 Alfa 982 0.08
561,020 Press Metal Aluminium 482 0.04 498,158 Alpek 299 0.02
741,408 Public Bank 2,321 0.18 312,076 Alsea 250 0.02
250,075 QL Resources 455 0.04 6,170,371 America Movil 3,232 0.25
45,960 Ranhill Utilities 8 - 94,400 America Movil ADR 987 0.08
324,114 RGB International 9 - 76,493 Arca Continental 270 0.02
471,230 RHB Bank 430 0.03 299,877 Asesor de Activos Prisma 54 -
284,025 RHB Capital* - - 810,162 Axtel 111 0.01
18,300 Sam Engineering & Equipment M 26 - 196,289 Banco del Bajio 136 0.01
Dimensional Fund Advisors Ltd. Interim Report and Financial Statements, 30 June 2020 44

Emerging Markets Core Equity Fund
Portfolio Statement (continued)as at 30 June 2020
Holding Investment
Fair
Value
£'000
Percentage
of total
net assets
% Holding Investment
Fair
Value
£'000
Percentage
of total
net assets
%
Mexico (continued) Mexico (continued)
59,399 Becle 93 0.01 346,124 La Comer 395 0.03
24,042 Bio Pappel 14 - 412,802 Macquarie Mexico Real Estate
198,464 Bolsa Mexicana de Valores 297 0.02 Management 331 0.03
3,168,298 Cemex 715 0.06 1,700 Medica Sur 1 -
162,397 Cemex ADR 374 0.03 245,774 Megacable 578 0.05
12,205 Coca-Cola Femsa ADR 435 0.03 433,527 Minera Frisco 28 -
118,047 Concentradora Fibra Danhos 91 0.01 403,150 Nemak 67 0.01
372,544 Concentradora Fibra Hotelera Mexicana 61 0.01 655,179 Orbia Advance 776 0.06
479,470 Consorcio ARA 42 - 129,959 Organizacion Cultiba 53 -
202,612 Controladora Vuela Cia de Aviacion 88 0.01 305,111 Organizacion Soriana 194 0.02
8,221 Controladora Vuela Cia de Aviacion 345,986 PLA Administradora Industrial S 329 0.03
ADR 36 - 209,014 Prologis Property Mexico 301 0.02
20,929 Corp Actinver 6 - 49,945 Promotora y Operadora de
232,692 Corp Inmobiliaria Vesta 280 0.02 Infraestructura 293 0.02
49,400 Corp Moctezuma 84 0.01 15,797 Promotora y Operadora de
45 Corporativo Fragua - - Infraestructura 'L' 60 0.01
133,134 Credito Real 56 - 94,367 Qualitas Controladora 291 0.02
8,100 Cydsa 6 - 149,652 Regional 326 0.03
60,618 El Puerto de Liverpool 118 0.01 559,179 Telesites 293 0.02
50,158 Elementia 11 - 804,076 TV Azteca 9 -
428,719 Empresas ICA* 1 - 113,620 Unifin Financiera 68 0.01
177,781 Fibra Shop Portafolios Inmobiliarios 39 - 82,993 Vitro 67 0.01
1,261,247 Fibra Uno Administracion 811 0.06 649,425 Wal-Mart de Mexico 1,266 0.10
19,276 Financiera Independencia 6 - 29,557 2.32
24,100 Fomento Economico Mexicano 123 0.01
11,641 Fomento Economico Mexicano ADR 594 0.05 Peru 0.08% (0.12%)
379,257 Genomma Lab Internacional 294 0.02
748,279 Gentera 286 0.02 8,293 Cementos Pacasmayo ADR 54 0.01
81,436 Gruma 701 0.06 23,851 Cia de Minas Buenaventura ADR 174 0.01
274,850 Grupo Aeromexico 56 - 6,845 Credicorp 754 0.06
166,915 Grupo Aeroportuario del Centro Norte 626 0.05 976 Fossal ADR* - -
4,835 Grupo Aeroportuario del Centro Norte 17,167 Grana y Montero ADR 31 -
ADR 146 0.01 1,013 0.08
69,139 Grupo Aeroportuario del Pacifico 398 0.03
3,487 Grupo Aeroportuario del Pacifico ADR 202 0.02 Philippines 1.11% (1.39%)
13,835 Grupo Aeroportuario del Sureste 126 0.01
4,090 Grupo Aeroportuario del Sureste ADR 375 0.03 422,200 8990 66 0.01
574,770 Grupo Bimbo 787 0.06 356,570 Aboitiz Equity Ventures 265 0.02
154,785 Grupo Carso 245 0.02 334,900 Aboitiz Power 148 0.01
92,276 Grupo Cementos de Chihuahua 314 0.02 854,000 AC Energy Philippines 31 -
228,216 Grupo Comercial Chedraui 209 0.02 1,160 ACR Mining* - -
21,700 Grupo Elektra 963 0.08 81,200 AgriNurture 10 -
145,247 Grupo Famsa 7 - 1,821,400 Alliance Global 202 0.02
672,309 Grupo Financiero Banorte 1,852 0.15 27,578 Altus Property Ventures 18 -
458,564 Grupo Financiero Inbursa 266 0.02 1,880,000 Apex Mining 39 -
192,655 Grupo GICSA 25 - 38,040 Asia United Bank 29 -
99,725 Grupo Herdez 122 0.01 269,600 Atlas Consolidated Mining &
223,876 Grupo Hotelero Santa Fe 32 - Development 9 -
144,100 Grupo Industrial Saltillo 79 0.01 26,402 Ayala 335 0.03
32,724 Grupo KUO 54 - 1,254,300 Ayala Land 693 0.06
298,250 Grupo Lala 129 0.01 698,000 AyalaLand Logistics 19 -
746,223 Grupo Mexico 1,387 0.11 171,283 Bank of the Philippine Islands 198 0.02
41,751 Grupo Pochteca 9 - 396,687 BDO Unibank 635 0.05
122,764 Grupo Rotoplas 64 0.01 2,801,950 Belle 65 0.01
195,641 Grupo Sanborns 134 0.01 2,091,700 Bloomberry Resorts 248 0.02
48,025 Grupo Simec 79 0.01 251,000 Cebu 24 -
12,273 Grupo Sports World 6 - 196,520 Cebu Air 127 0.01
958,906 Grupo Televisa 820 0.06 2,367,338 CEMEX Philippines 39 -
53,900 Grupo Traxion 26 - 534,200 Century Pacific Food 127 0.01
195,080 Hoteles City Express 52 - 1,038,899 Century Properties 6 -
73,848 Industrias Bachoco 176 0.01 330,300 Chelsea Logistics and Infrastructure 20 -
1,434 Industrias Bachoco ADR 41 - 470,873 China Banking 161 0.01
106,283 Industrias CH 314 0.02 1,359,100 Cosco Capital 113 0.01
76,029 Industrias Penoles 615 0.05 1,436,600 D&L Industries 118 0.01
98,107 Infraestructura Energetica Nova 223 0.02 2,693,800 DMCI 180 0.01
720,070 Kimberly-Clark de Mexico 881 0.07 371,000 DoubleDragon Properties 104 0.01
Dimensional Fund Advisors Ltd. Interim Report and Financial Statements, 30 June 2020 45

Emerging Markets Core Equity Fund
Portfolio Statement (continued)as at 30 June 2020
Holding Investment
Fair
Value
£'000
Percentage
of total
net assets
% Holding Investment
Fair
Value
£'000
Percentage
of total
net assets
%
Philippines (continued) Poland (continued)
399,400 Eagle Cement 64 0.01 1,582 AB 9 -
448,416 East West Banking 54 - 15,277 Agora 25 -
292,600 EEI 24 - 48,885 Alior Bank 164 0.01
1,031,100 Emperador 139 0.01 3,857 Alumetal 30 -
1,446,000 Empire East Land 6 - 4,382 Amica 112 0.01
425,300 Filinvest Development 55 0.01 36,607 AmRest 172 0.01
6,028,000 Filinvest Land 98 0.01 5,493 Apator 23 -
First Gen - - 4,099 Asseco Poland 57 0.01
153,840 First Philippine 154 0.01 10,095 Bank Handlowy w Warszawie 81 0.01
1,419,598 Global Ferronickel 20 - 226,073 Bank Millennium 145 0.01
375,000 Global-Estate Resorts 5 - 9,110 Bank Ochrony Srodowiska 12 -
14,785 Globe Telecom 500 0.04 35,606 Bank Polska Kasa Opieki 390 0.03
33,754 GT Capital 249 0.02 27,747 Bioton 26 -
384,400 Holcim Philippines 40 - 54,014 Boryszew 39 -
418,312 Integrated Micro-Electronics 41 - 6,601 Budimex 299 0.02
Services 742 0.06 10,228 CCC 125 0.01
572,480 JG Summit 606 0.05 4,838 CD Projekt 398 0.03
185,760 Jollibee Foods 423 0.03 20,815 Ciech 134 0.01
378,000 Leisure & Resorts World 9 - 1,960 ComArch 82 0.01
1,354,400 Lopez 61 0.01 87,446 Cyfrowy Polsat 477 0.04
903,800 LT 118 0.01 232,248 Develia 93 0.01
126,684 MacroAsia 14 - 18,003 Dino Polska 732 0.06
58,220 Manila Electric 255 0.02 2,178 Dom Development 40 -
566,600 Manila Water 117 0.01 20,760 Echo Investment 16 -
225,500 Max's 20 - 142,605 Enea 216 0.02
300,935 Megawide Construction 36 - 48,274 Eurocash 174 0.02
4,682,600 Megaworld 233 0.02 8,201 Fabryki Mebli Forte 35 -
3,916,900 Metro Pacific Investments 237 0.02 124,967 Famur 59 0.01
357,082 Metropolitan Bank & Trust 215 0.02 283,176 Getin Noble Bank 17 -
3,570,220 Nickel Asia 105 0.01 72,387 Globe Trade Centre 100 0.01
1,544,800 Petron 78 0.01 22,777 Grupa Azoty 146 0.01
1,000,500 Philex Mining 43 - 6,206 Grupa Azoty Zaklady Chemiczne Police 16 -
231,683 Philippine National Bank 76 0.01 4,579 Grupa Kety 409 0.03
3,037 Philippine Seven 6 - 45,299 Grupa Lotos 559 0.04
5,652 Philippine Stock Exchange 15 - 3,992 ING Bank Slaski 119 0.01
160,200 Phoenix Petroleum Philippines 30 - 4,023 Inter Cars 168 0.01
295,520 Pilipinas Shell Petroleum 87 0.01 30,092 Jastrzebska Spolka Weglowa 116 0.01
18,510 PLDT 378 0.03 40,873 Kernel 343 0.03
30,956 PLDT ADR 616 0.05 58,441 KGHM Polska Miedz 1,084 0.09
3,793,000 Premium Leisure 19 - 5,640 KRUK 120 0.01
651,000 Puregold Price Club 490 0.04 509 LPP 634 0.05
132,600 PXP Energy 14 - 7,715 Lubelski Wegiel Bogdanka 35 -
320,000 RFM 23 - 5,228 mBank 252 0.02
280,876 Rizal Commercial Banking 77 0.01 77,445 Netia 60 0.01
1,343,283 Robinsons Land 378 0.03 1,007 Neuca 104 0.01
198,950 Robinsons Retail 210 0.02 227,960 Orange Polska 292 0.02
257,610 San Miguel 419 0.03 282,321 PGE Polska Grupa Energetyczna 416 0.03
104,770 San Miguel Food and Beverage 118 0.01 26,663 PKP Cargo 78 0.01
90,710 Security Bank 152 0.01 42 PlayWay 4 -
680,620 Semirara Mining & Power 140 0.01 123,996 Polski Koncern Naftowy ORLEN 1,609 0.13
201,000 Shakey's Pizza Asia Ventures 19 - 161,205 Polskie Gornictwo Naftowe i
8,877 SM Investments 134 0.01 Gazownictwo 151 0.01
1,316,917 SM Prime 685 0.05 120,609 Powszechna Kasa Oszczednosci Bank
634,000 SSI 12 - Polski 556 0.04
1,370,000 STI Education Systems 7 - 88,019 Powszechny Zaklad Ubezpieczen 523 0.04
15,382 Top Frontier Investment 33 - 2,739 Santander Bank Polska 99 0.01
240,721 Union Bank of the Philippines 215 0.02 102,856 Stalexport Autostrady 58 0.01
274,600 Universal Robina 583 0.05 718 Stalprodukt 23 -
2,758,800 Vista Land & Lifescapes 166 0.01 688,107 Tauron Polska Energia 338 0.03
399,800 Vistamalls 24 - 105,749 VRG 50 -
594,000 Wilcon Depot 149 0.01 7,614 Warsaw Stock Exchange 66 0.01
14,065 1.11 346 Wawel 41 -
8,140 Zespol Elektrowni Patnow Adamow Konin 14 -
Poland 1.01% (1.15%) 12,780 1.01
141 11 bit studios 15 -
Dimensional Fund Advisors Ltd. Interim Report and Financial Statements, 30 June 2020 46

Emerging Markets Core Equity Fund
Portfolio Statement (continued)as at 30 June 2020
Holding Investment
Fair
Value
£'000
Percentage
of total
net assets
% Holding Investment
Fair
Value
£'000
Percentage
of total
net assets
%
Qatar 0.19% (0.00%) Saudi Arabia (continued)
212,643 Aamal 35 - 62,235 Al Rajhi Bank 769 0.06
13,994 Al Khaleej Takaful 6 - 9,102 Al Yamamah Steel Industries 34 -
15,075 Al Meera Consumer Goods 61 0.01 10,041 AlAbdullatif Industrial Investment 22 -
185,094 Barwa Real Estate 125 0.01 8,829 Alandalus Property 29 -
16,775 Commercial Bank PSQC 14 - 6,471 Aldrees Petroleum and Transport
158,987 Doha Bank 72 0.01 Services 89 0.01
166,924 Gulf International Services 56 - 251,862 Alinma Bank 798 0.06
10,487 Gulf Warehousing 12 - 6,655 AlJazira Takaful Ta'awuni 25 -
55,358 Industries Qatar 95 0.01 6,008 Almarai 68 0.01
215,182 Masraf Al Rayan 184 0.02 12,847 Arab National Bank 54 -
247,663 Mazaya Qatar Real Estate Development 50 - 13,441 Arabian Cement 78 0.01
37,532 Medicare 57 0.01 8,962 Arabian Pipes 24 -
82,652 Mesaieed Petrochemical 37 - 6,978 Arabian Shield Cooperative Insurance 23 -
39,143 Ooredoo 57 0.01 37,454 Arriyadh Development 119 0.01
36,175 Qatar Electricity & Water 128 0.01 29,395 Aseer Trading Tourism & Manufacturing 66 0.01
15,320 Qatar Fuel 55 - 14,341 Astra Industrial 59 0.01
674,557 Qatar Gas Transport 394 0.03 19,751 Bank AlBilad 96 0.01
61,794 Qatar International Islamic Bank 112 0.01 132,767 Bank Al-Jazira 329 0.03
15,744 Qatar Islamic Bank 56 - 17,115 Banque Saudi Fransi 109 0.01
179,463 Qatar National Bank 698 0.06 4,490 Basic Chemical Industries 23 -
9,880 Qatar National Cement 8 - 11,775 Bawan 34 -
13,327 Qatar Navigation 17 - 1,108 Bupa Arabia for Cooperative Insurance 27 -
52,834 United Development 14 - 42,391 City Cement 151 0.01
211,597 Vodafone Qatar 53 - 7,451 Co for Cooperative Insurance 115 0.01
18,317 Widam Food 29 - 251,186 Dar Al Arkan Real Estate Development 391 0.03
2,425 0.19 8,797 Dur Hospitality 48 -
19,268 Eastern Province Cement 123 0.01
Russia 1.32% (1.65%) 6,800 Electrical Industries 22 -
82,196 Emaar Economic City 122 0.01
63,177 Etalon GDR 71 - 84,970 Etihad Etisalat 500 0.04
379,375 Gazprom ADR 1,687 0.13 48,843 Fawaz Abdulaziz Al Hokair 202 0.02
27,045 Globaltrans Investment GDR 120 0.01 11,489 Fitaihi 26 -
12,662 LSR GDR 20 - 21,934 Hail Cement 59 0.01
52,573 LUKOIL ADR 3,214 0.25 5,738 Herfy Food Services 56 -
42,642 Magnitogorsk Iron & Steel Works GDR 237 0.02 6,098 Jarir Marketing 194 0.02
11,935 Mail.Ru GDR 222 0.02 6,691 Leejam Sports 86 0.01
14,679 Mechel ADR 22 - 11,630 Malath Cooperative Insurance 26 -
68,947 MMC Norilsk Nickel ADR 1,492 0.12 24,941 Methanol Chemicals 37 -
116,794 Mobile TeleSystems ADR 878 0.07 11,203 Middle East Paper 34 -
1,542 Novatek GDR 184 0.01 129,952 Mobile Telecommunications Co Saudi
28,711 Novolipetsk Steel GDR 464 0.04 Arabia 326 0.03
9,160 O'Key GDR 5 - 1,206 Mouwasat Medical Services 24 -
38,085 PhosAgro GDR 385 0.03 35,159 Najran Cement 83 0.01
8,857 Polyus GDR 605 0.05 6,486 Nama Chemicals 26 -
8,531 Ros Agro GDR 63 - 3,082 National Co for Glass Manufacturing 11 -
207,749 Rosneft Oil GDR 860 0.07 102,566 National Commercial Bank 832 0.07
36,696 Rostelecom ADR 222 0.02 3,756 National Gas & Industrialization 23 -
284,157 RusHydro ADR 239 0.02 138,341 National Industrialization 315 0.03
202,457 Sberbank of Russia ADR 1,879 0.15 7,703 National Medical Care 71 0.01
54,299 Severstal GDR 533 0.04 4,274 National Metal Manufacturing &
44,953 Tatneft ADR 1,745 0.14 Casting 13 -
224,983 VEON ADR 324 0.03 37,226 Northern Region Cement 81 0.01
452,368 VTB Bank GDR 349 0.03 5,910 Qassim Cement 80 0.01
30,926 X5 Retail GDR 904 0.07 44,805 Rabigh Refining & Petrochemical 132 0.01
16,724 1.32 7,605 Red Sea International 21 -
45,525 Riyad Bank 167 0.01
Saudi Arabia 1.00% (0.00%) 113,969 Sahara International Petrochemical 358 0.03
81,583 Samba Financial 487 0.04
9,802 Abdul Mohsen Al-Hokair Tourism and 12,831 Saudi Airlines Catering 218 0.02
Development 30 - 47,219 Saudi Basic Industries 911 0.07
4,054 Abdullah Al Othaim Markets 99 0.01 16,278 Saudi British Bank 80 0.01
17,273 Advanced Petrochemical 200 0.02 7,324 Saudi Cement 86 0.01
11,756 Al Babtain Power & Telecommunication 58 0.01 13,443 Saudi Ceramic 99 0.01
13,029 Al Hassan Ghazi Ibrahim Shaker 30 - 3,703 Saudi Chemical 19 -
29,576 Al Jouf Cement 57 - 4,106 Saudi Co For Hardware CJSC 39 -
10,183 Al Khaleej Training and Education 30 - 69,378 Saudi Electricity 236 0.02
Dimensional Fund Advisors Ltd. Interim Report and Financial Statements, 30 June 2020 47

Emerging Markets Core Equity Fund
Portfolio Statement (continued)as at 30 June 2020
Holding Investment
Fair
Value
£'000
Percentage
of total
net assets
% Holding Investment
Fair
Value
£'000
Percentage
of total
net assets
%
Saudi Arabia (continued) South Africa (continued)
30,649 Saudi Ground Services 189 0.01 997,153 FirstRand 1,781 0.14
23,177 Saudi Industrial Investment 102 0.01 143,012 Foschini 440 0.03
3,114 Saudi Investment Bank 9 - 359,408 Gold Fields 2,686 0.21
160,565 Saudi Kayan Petrochemical 287 0.02 408,239 Gold Fields ADR 3,050 0.24
9,289 Saudi Marketing 45 - 145,863 Grand Parade Investments 14 -
9,187 Saudi Printing & Packaging 26 - 353,513 Grindrod 50 -
28,006 Saudi Public Transport 87 0.01 8,837 Grindrod Shipping 21 -
18,839 Saudi Re for Cooperative Reinsurance 33 - 931,338 Growthpoint Properties 604 0.05
13,352 Saudi Real Estate 37 - 195,113 Harmony Gold Mining 620 0.05
9,226 Saudi Research & Marketing 126 0.01 140,229 Harmony Gold Mining ADR 452 0.04
10,020 Saudi Telecom 214 0.02 24,902 Hudaco Industries 85 0.01
20,127 Savola 185 0.01 96,936 Hyprop Investments 104 0.01
62,663 Seera 219 0.02 270,665 Impala Platinum 1,469 0.12
8,033 Southern Province Cement 98 0.01 165,553 Imperial Logistics 314 0.02
18,614 Tabuk Cement 50 - 96,743 Investec 158 0.01
13,726 Takween Advanced Industries 21 - 225,354 Investec Property Fund 99 0.01
9,565 Umm Al-Qura Cement 48 - 189,328 Italtile 94 0.01
9,389 United Electronics 114 0.01 35,538 JSE 205 0.02
45,370 Yamama Cement 215 0.02 1,236,095 KAP Industrial 143 0.01
30,664 Yanbu Cement 190 0.01 31,348 Kumba Iron Ore 688 0.05
1,600 Yanbu National Petrochemical 18 - 64,566 Lewis 40 -
12,409 Zamil Industrial Investment 42 - 118,755 Liberty 367 0.03
12,664 1.00 1,001,087 Life Healthcare 798 0.06
471,505 Long4Life 70 0.01
South Africa 4.74% (6.57%) 80,050 Massmart 86 0.01
995,405 Merafe Resources 21 -
258,630 Absa 1,057 0.08 167,611 Metair Investments 142 0.01
43,803 Adcock Ingram 97 0.01 48,793 MiX Telematics 13 -
81,429 Adcorp 14 - 6,509 MiX Telematics ADR 45 -
416,409 Advtech 140 0.01 863,657 Momentum Metropolitan 721 0.06
91,213 AECI 334 0.03 124,076 Motus 186 0.01
91,945 African Oxygen 75 0.01 132,504 Mpact 59 -
72,896 African Rainbow Minerals 574 0.05 127,473 Mr Price 864 0.07
67,627 Afrimat 100 0.01 759,977 MTN 1,932 0.15
661,118 Alexander Forbes 142 0.01 230,581 MultiChoice 1,151 0.09
193,862 Allied Electronics 184 0.01 307,628 Murray & Roberts 71 0.01
97,906 Alviva 31 - 379,209 Nampak 23 -
17,403 Anglo American Platinum 1,015 0.08 21,125 Naspers 3,144 0.25
154,736 AngloGold Ashanti ADR 3,654 0.29 197,745 Nedbank 961 0.08
457,320 Arrowhead Properties 38 - 126,713 NEPI Rockcastle 533 0.04
189,997 Aspen Pharmacare 1,280 0.10 201 Net 1 UEPS Technologies - -
34,625 Astral Foods 237 0.02 599,067 Netcare 388 0.03
231,691 Attacq 58 - 48,371 Ninety One 99 0.01
167,311 AVI 550 0.04 208,062 Northam Platinum 1,132 0.09
24,457 Balwin Properties 3 - 51,549 Oceana 169 0.01
183,448 Barloworld 635 0.05 81,346 Octodec Investments 25 -
92,259 Bid 1,239 0.10 1,126,135 Old Mutual 637 0.05
146,863 Bidvest 989 0.08 118,528 Omnia 156 0.01
424,657 Blue Label Telecoms 53 - 277,287 Pepkor 147 0.01
14,225 Capitec Bank 577 0.05 133,659 Peregrine 123 0.01
15,211 Cashbuild 101 0.01 179,950 Pick n Pay Stores 435 0.03
29,265 Caxton and CTP Publishers and 956,402 PPC 50 -
Printers 6 - 48,404 PSG 363 0.03
20,309 City Lodge Hotels 21 - 241,941 PSG Konsult 81 0.01
144,277 Clicks 1,416 0.11 114,552 Raubex 124 0.01
95,638 Coronation Fund Managers 180 0.01 57,059 RCL Foods 24 -
71,209 Curro 29 - 1,539,435 Redefine Properties 239 0.02
181,045 DataTec 224 0.02 126,034 Resilient REIT 262 0.02
118,759 Dis-Chem Pharmacies 97 0.01 133,223 Reunert 217 0.02
134,268 Discovery 667 0.05 58,568 RFG 40 -
36,641 Distell 130 0.01 85,141 Royal Bafokeng Platinum 142 0.01
190,536 Emira Property Fund 60 0.01 1,039,755 SA Corporate Real Estate 63 0.01
106,297 Equites Property Fund 83 0.01 457,350 Sanlam 1,269 0.10
4,094 Evraz Highveld Steel And Vanadium* - - 19,084 Santam 242 0.02
131,776 Exxaro Resources 809 0.06 374,534 Sappi 480 0.04
31,781 Famous Brands 60 0.01 103,468 Sasol 652 0.05
Dimensional Fund Advisors Ltd. Interim Report and Financial Statements, 30 June 2020 48

Emerging Markets Core Equity Fund
Portfolio Statement (continued)as at 30 June 2020
Holding Investment
Fair
Value
£'000
Percentage
of total
net assets
% Holding Investment
Fair
Value
£'000
Percentage
of total
net assets
%
South Africa (continued) South Korea (continued)
56,118 Sasol ADR 357 0.03 16,573 AUK 19 -
265,545 Shoprite 1,327 0.10 1,762 Aurora World 11 -
899,662 Sibanye Stillwater 1,544 0.12 16,068 Austem 17 -
79,140 Sibanye Stillwater ADR 556 0.04 5,423 Autech 40 -
90,354 SPAR 734 0.06 5,497 Avaco 26 -
45,967 Spur 36 - 2,248 Avatec 10 -
431,115 Standard Bank 2,115 0.17 4,799 Baiksan 17 -
818,649 Steinhoff International 39 - 24,075 Barun Electronics 1 -
94,008 Sun International 74 0.01 801 Bcworld Pharm 10 -
302,016 Super 235 0.02 16,527 BGF 47 -
261,552 Telkom 372 0.03 3,663 BGF retail 344 0.03
19,113 Textainer 125 0.01 9,163 BH 123 0.01
84,567 Tiger Brands 715 0.06 4,154 Binex 36 -
84,651 Tongaat Hulett 22 - 2,591 Binggrae 105 0.01
46,087 Tower Property Fund 6 - 3,594 BioSmart 13 -
262,109 Transaction Capital 227 0.02 2,034 Biotoxtech 13 -
121,592 Trencor 30 - 20,232 Biovill* 4 -
268,422 Truworths International 435 0.03 2,745 BIT Computer 22 -
343,619 Tsogo Sun Gaming 71 0.01 5,322 Bixolon 17 -
343,619 Tsogo Sun Hotels 36 - 4,613 Bluecom 21 -
225,817 Vodacom 1,309 0.10 107,138 BNK Financial 361 0.03
275,953 Vukile Property Fund 102 0.01 3,959 Boditech Med 47 -
38,403 Wilson Bayly Holmes-Ovcon 181 0.01 21,590 Bohae Brewery 11 -
559,457 Woolworths 869 0.07 886 BoKwang Industry 3 -
60,339 4.74 9,896 Bolak 12 -
2,476 Bookook Securities 31 -
South Korea 13.26% (14.04%) 9,015 Boryung Pharmaceutical 103 0.01
9,287 Bosung Power Technology 11 -
12,756 3S Korea 21 - 21,457 Brain Contents 9 -
4,459 ABco Electronics 12 - 11,795 Bubang 17 -
2,840 Able C&C 18 - 4,158 Bukwang Pharmaceutical 95 0.01
5,776 ABOV Semiconductor 33 - 1,071 Busan City Gas 26 -
30,083 Abpro Bio 14 - 158 BYC 22 -
7,520 Ace Technologies 73 0.01 22,237 Byucksan 25 -
1,071 Actoz Soft 6 - 27,114 CammSys 49 0.01
3,472 ADTechnology 63 0.01 23,358 Capro 40 -
1,217 ADTechnology Rights 07/07/2020 3 - 1,103 Caregen 52 0.01
1,164 Advanced Nano Products 15 - 1,946 Cell Biotech 22 -
6,483 Advanced Process Systems 102 0.01 4,590 Celltrion 951 0.08
8,923 Aekyung Petrochemical 39 - 878 Celltrion Pharm 75 0.01
3,572 AfreecaTV 153 0.01 2,331 Changhae Ethanol 21 -
15,166 Agabang&Company 31 - 18,174 Charm Engineering 16 -
2,686 Ahn-Gook Pharmaceutical 23 - 28,190 Cheil Worldwide 313 0.03
2,053 Ahnlab 69 0.01 3,028 Chemtronics 28 -
10,024 AJ Networks 19 - 2,669 Cheryong Electric 9 -
28,299 Ajin Industrial 49 0.01 12,773 ChinHung International 17 -
1,616 Aju Capital 12 - 10,452 Chinyang 17 -
4,579 AK 58 0.01 3,314 Choa Pharmaceutical 10 -
322 Alteogen 58 0.01 2,822 Chong Kun Dang Pharmaceutical 207 0.02
15,118 ALUKO 18 - 1,080 Chongkundang 87 0.01
11,642 Aminologics 15 - 1,250 Choong Ang Vaccine Laboratory 14 -
3,882 Amorepacific 441 0.04 14,244 Chorokbaem Media 16 -
3,260 AMOREPACIFIC 114 0.01 5,806 Chorokbaem Media Rights 2 -
192 AMOREPACIFIC Preference Shares 4 - 1,103 Chosun Refractories 54 0.01
1,049 Amotech 20 - 2,539 Chungdahm Learning 32 -
13,185 Anam Electronics 15 - 11,307 CJ 659 0.05
8,418 Ananti 55 0.01 8,077 CJ CGV 112 0.01
5,302 Apact 23 - 4,256 CJ CGV Rights 21/07/2020 9 -
14,420 Aprogen Healthcare & Games 9 - 2,964 CJ CheilJedang 654 0.05
95,590 Aprogen pharmaceuticals 120 0.01 7,019 CJ ENM 524 0.04
5,928 APS 35 - 3,485 CJ Freshway 36 -
694 ASIA 33 - 2,592 CJ Logistics 276 0.02
1,021 Asia Cement 37 - 2,041 CKD Bio 54 0.01
3,920 Asia Paper Manufacturing 79 0.01 2,864 Clean & Science 63 0.01
10,703 Asiana Airlines 28 - 560 CLIO Cosmetics 7 -
21,885 Atinum Investment 23 - 8,267 CMG Pharmaceutical 22 -
Dimensional Fund Advisors Ltd. Interim Report and Financial Statements, 30 June 2020 49

Emerging Markets Core Equity Fund
Portfolio Statement (continued)as at 30 June 2020
Holding Investment
Fair
Value
£'000
Percentage
of total
net assets
% Holding Investment
Fair
Value
£'000
Percentage
of total
net assets
%
South Korea (continued) South Korea (continued)
23,139 CODI-M 5 - 18,434 Dayou Automotive Seat Technology 8 -
2,487 Com2uSCorp 198 0.02 41,541 Dayou Plus 18 -
4,933 Coreana Cosmetics 17 - 56,791 DB 27 -
2,767 Cosmax 183 0.02 18,974 DB Financial Investment 41 -
2,259 Cosmax BTI 26 - 18,183 DB HiTek 355 0.03
3,685 COSMAX NBT 16 - 40,358 DB Insurance 1,170 0.09
1,582 Cosmecca Korea 13 - 2,130 DCM 15 -
3,335 CosmoAM&T 28 - 2,991 Dentium 76 0.01
3,339 Cosmochemical 18 - 17,563 Deutsch Motors 75 0.01
5,125 COSON 18 - 2,561 Development Advance Solution 8 -
16,749 Coway 818 0.07 93,629 DGB Financial 324 0.03
15,383 COWELL FASHION 57 0.01 3,488 DHP Korea 19 -
9,188 Creative & Innovative System 31 - 844 DI Dong Il 38 -
4,864 CROWNHAITAI 27 - 9,076 Digital Chosun 12 -
1,939 CS Wind 55 0.01 4,610 Digital Daesung 21 -
5,521 CTC BIO 38 - 6,460 Digital Power Communications 46 -
486 Cuckoo 26 - 3,258 DIO 55 0.01
3,612 Cuckoo Homesys 82 0.01 5,156 Display Tech 11 -
3,242 Cymechs 28 - 8,154 DMS 29 -
12,776 D.I 35 - 1,314 DNF 13 -
9,588 DA Technology 8 - 1,882 Dohwa Engineering 10 -
10,147 Dae Dong Industrial 42 - 6,087 Dong A Eltek 28 -
760 Dae Han Flour Mills 85 0.01 2,986 Dong Ah Tire & Rubber 23 -
3,920 Dae Hwa Pharmaceutical 34 - 1,497 Dong-A Socio 96 0.01
14,745 Dae Hyun 16 - 1,209 Dong-A ST 71 0.01
8,346 Dae Won Chemical 9 - 4,932 Dong-Ah Geological Engineering 47 -
23,737 Dae Won Kang Up 49 0.01 7,933 Dongbang Transport Logistics 10 -
27,747 Dae Young Packaging 19 - 5,036 Dongbu 31 -
7,216 Daea TI 30 - 597 Dongil Industries 23 -
1,784 Daebongls 12 - 14,401 Dongjin Semichem 274 0.02
31,970 Daechang 26 - 1,952 DongKook Pharmaceutical 160 0.01
916 Daechang Forging 16 - 23,359 Dongkuk Industries 40 -
5,188 Daeduck 20 - 32,911 Dongkuk Steel Mill 118 0.01
8,968 Daeduck Electronics 47 - 15,123 Dongkuk Structures & Construction 55 0.01
6,140 Daehan New Pharm 48 - 6,517 Dongsuh 70 0.01
7,120 Daehan Steel 34 - 11,647 DONGSUNG 30 -
11,245 Dae-Il 12 - 6,521 Dongsung Finetec 38 -
1,316 Daejoo Electronic Materials 31 - 2,499 Dongwha Enterprise 57 0.01
12,161 Daekyo 35 - 6,029 Dongwha Pharm 66 0.01
3,677 Daelim B&Co 11 - 39,511 Dongwon Development 88 0.01
14,913 Daelim Industrial 830 0.07 548 Dongwon F&B 66 0.01
15,443 DAEMYUNG SONOSEASON 11 - 1,232 Dongwon Industries 167 0.01
10,854 Daesang 190 0.02 2,288 Dongwon Systems 33 -
8,189 Daesang 'C' 45 - 5,195 Dongwoo Farm To Table 12 -
2,460 Daesung 22 - 2,010 Dongyang E&P 16 -
6,113 Daesung Energy 20 - 25,477 Dongyang Steel Pipe 17 -
9,491 Daesung Industrial 18 - 3,005 Doosan 77 0.01
7,527 Daewon Cable 5 - 21,520 Doosan Bobcat 383 0.03
4,286 Daewon Media 17 - 10,049 Doosan Fuel Cell 220 0.02
5,505 Daewon Pharmaceutical 64 0.01 82,807 Doosan Heavy Industries &
7,001 Daewon San Up 25 - Construction 271 0.02
6,400 Daewoo Electronic Components 11 - 105,323 Doosan Infracore 517 0.04
79,160 Daewoo Engineering & Construction 183 0.02 5,539 Doosan Solus 126 0.01
17,828 Daewoo Shipbuilding & Marine 5,138 DoubleUGames 278 0.02
Engineering 326 0.03 8,927 Douzone Bizon 617 0.05
5,512 Daewoong 102 0.01 5,827 Dreamus 20 -
686 Daewoong Pharmaceutical 61 0.01 2,415 DSK 11 -
2,698 Daihan Pharmaceutical 53 0.01 3,151 DTR Automotive 53 0.01
21,423 Daishin Securities 140 0.01 3,547 Duk San Neolux 81 0.01
4,523 Daiyang Metal 13 - 10,954 DY 28 -
21,312 Danal 52 0.01 6,844 DY POWER 47 -
2,415 Danawa 46 - 1,448 e Tec E&C 69 0.01
10,564 Daou Data 89 0.01 1,736 E1 41 -
13,026 Daou Technology 175 0.01 3,176 Eagon Industrial 17 -
6,901 Dasan Networks 39 - 22,113 Easy 75 0.01
4,705 Dawonsys 52 0.01 908 Easy Bio 32 -
Dimensional Fund Advisors Ltd. Interim Report and Financial Statements, 30 June 2020 50

Emerging Markets Core Equity Fund
Portfolio Statement (continued)as at 30 June 2020
Holding Investment
Fair
Value
£'000
Percentage
of total
net assets
% Holding Investment
Fair
Value
£'000
Percentage
of total
net assets
%
South Korea (continued) South Korea (continued)
2,132 Echo Marketing 52 0.01 3,713 Hana Tour Service 96 0.01
5,887 Ecopro 117 0.01 2,377 Hanall Biopharma 45 -
1,754 e-Credible 24 - 5,501 Hancom 58 0.01
1,451 Eehwa Construction 4 - 1,641 Hancom MDS 14 -
134,585 Ehwa Technologies Information 14 - 2,221 Handok 45 -
7,941 Elentec 22 - 6,909 Handsome 163 0.01
8,750 E-MART 625 0.05 992 Hanil 31 -
4,884 EMKOREA 18 - 1,210 Hanil Cement 67 0.01
4,331 EM-Tech 39 - 972 Hanil Hyundai Cement 18 -
11,614 EMW 4 - 12,782 Hanjin Heavy Industries &
5,487 Enex 4 - Construction 50 -
5,951 ENF Technology 141 0.01 691 Hanjin Kal 38 -
948 Eo Technics 61 0.01 3,321 Hanjin Transportation 99 0.01
2,120 eSang Networks 9 - 7,017 Hankook* 1 -
3,115 Estechpharma 24 - 213 Hankook AtlasBX 7 -
18,133 Eugene 45 - 483 Hankook Cosmetics Manufacturing 14 -
31,229 Eugene Investment & Securities 60 0.01 414 Hankook Shell Oil 65 0.01
2,932 Eugene Technology 54 0.01 37,742 Hankook Tire & Technology 629 0.05
7,416 Eusu 30 - 2,032 Hankuk Paper Manufacturing* 26 -
7,907 Exax 9 - 1,869 Hanmi Pharm 308 0.03
5,936 Exem 14 - 1,303 Hanmi Science 29 -
2,028 Ezwel 18 - 2,939 Hanmi Semiconductor 15 -
3,580 F&F 223 0.02 4,161 HanmiGlobal 19 -
7,470 Farmsco 30 - 66,139 Hanon Systems 405 0.03
20,591 FarmStory 16 - 2,345 Hans Biomed 31 -
10,940 Feelux 33 - 5,701 Hansae 41 -
20,291 Fila 482 0.04 7,507 Hansae Yes24 22 -
5,465 Fine Semitech 92 0.01 7,069 Hanshin Construction 55 0.01
5,509 Firstec 8 - 6,861 Hanshin Machinery 6 -
21,715 Foosung 118 0.01 28,870 Hansol 58 0.01
1,515 Fursys 29 - 4,320 Hansol Chemical 372 0.03
2,547 Gabia 25 - 43,265 Hansol HomeDeco 29 -
2,116 Gamevil 41 - 12,076 Hansol Paper 114 0.01
1,350 Gaon Cable 15 - 17,263 Hansol Technics 82 0.01
18,466 Gemvaxlink 18 - 2,419 Hanssem 141 0.01
446 Genexine 28 - 56,777 Hanwha General Insurance 99 0.01
12,107 Genie Music 26 - 65,011 Hanwha Investment & Securities 72 0.01
3,375 Geumhwa PSC 58 0.01 149,003 Hanwha Life Insurance 137 0.01
13,143 Gigalane 10 - 41,347 Hanwha Solutions 539 0.04
4,503 Globon 7 - 7,927 Hanyang Eng 51 0.01
4,629 GMB Korea 17 - 3,417 Hanyang Securities 16 -
42,655 GNCO 34 - 17,535 Harim Holdings 80 0.01
1,350 GOLFZON 64 0.01 18,536 Harim Limited 37 -
15,001 Golfzon Newdin 52 0.01 16,924 HB Technology 24 -
3,707 Good People 5 - 11,395 HDC 65 0.01
12,840 Grand Korea Leisure 111 0.01 3,745 HDC Hyundai Development
1,231 Green Cross 123 0.01 Co-Engineering & Construction 54 0.01
1,115 Green Cross Cell 31 - 7,742 HDC Hyundai Engineering Plastics 20 -
7,232 Green Cross Holdings 117 0.01 2,666 HDC I-Controls 14 -
42,800 GS 1,051 0.08 1,483 Helixmith 61 0.01
34,482 GS Engineering & Construction 572 0.05 37,079 Heung-A Shipping* 6 -
32,299 GS Global 36 - 57,665 Heungkuk Fire & Marine Insurance 87 0.01
1,354 GS Home Shopping 100 0.01 936 High Tech Pharm 7 -
16,020 GS Retail 396 0.03 4,931 Hite Jinro 146 0.01
1,629 Gunjang Energy 32 - 5,324 Hitejinro 78 0.01
450 Gwangju Shinsegae 41 - 10,755 HJ Magnolia Yongpyong Hotel & Resort 29 -
4,687 GY Commerce 1 - 2,642 HLB 166 0.01
3,696 HAESUNG DS 37 - 4,631 HLB Life Science 58 0.01
2,931 Haesung Industrial 26 - 33,847 HMM 107 0.01
24,564 Haimarrow Food Service 42 - 10,484 Home Center 8 -
3,643 Haitai Confectionery & Foods 21 - 7,656 Homecast 18 -
12,746 Halla 24 - 14,660 Hotel Shilla 704 0.06
4,510 Halla Holdings 82 0.01 13,854 HS Industries 65 0.01
13,184 Han Kuk Carbon 67 0.01 29,721 HS R&A 30 -
93,098 Hana Financial 1,699 0.13 10,916 HSD Engine 36 -
19,502 Hana Micron 61 0.01 6,634 Huchems Fine Chemical 71 0.01
Dimensional Fund Advisors Ltd. Interim Report and Financial Statements, 30 June 2020 51

Emerging Markets Core Equity Fund
Portfolio Statement (continued)as at 30 June 2020
Holding Investment
Fair
Value
£'000
Percentage
of total
net assets
% Holding Investment
Fair
Value
£'000
Percentage
of total
net assets
%
South Korea (continued) South Korea (continued)
191 Hugel 61 0.01 5,242 Infinitt Healthcare 24 -
9,709 Humax 20 - 4,505 INITECH 14 -
1,307 Humedix 24 - 1,768 Innocean Worldwide 54 0.01
7,003 Huneed Technologies 31 - 1,206 InnoWireless 41 -
3,010 Huons 111 0.01 2,261 Innox Advanced Materials 68 0.01
2,977 Huons Global 63 0.01 42,327 Inscobee 59 0.01
9,127 Huvis 41 - 4,453 Insun ENT 26 -
4,889 Huvitz 23 - 1,007 Intelligent Digital Integrated
10,217 Hwa Shin 13 - Security 19 -
652 Hwacheon Machine Tool 13 - 2,468 Interflex 21 -
5,434 Hwail Pharm 31 - 2,421 Interojo 39 -
5,133 Hwangkum Steel & Technology 19 - 36,397 Interpark Holdings 57 0.01
2,897 Hwaseung Enterprise 22 - 7,807 INTOPS 58 0.01
5,850 HwaSung Industrial 38 - 12,329 INZI Display 14 -
6,118 Hy-Lok 54 0.01 3,665 Iones 18 -
3,246 Hyosung 138 0.01 7,628 IS Dongseo 146 0.01
1,844 Hyosung Advanced Materials 142 0.01 4,692 ISC 53 0.01
1,313 Hyosung Chemical 93 0.01 3,638 i-SENS 62 0.01
1,782 Hyosung TNC 135 0.01 6,385 ISU Chemical 38 -
9,598 Hyulim ROBOT 5 - 3,428 ISU Chemical Rights 28/07/2020 4 -
5,082 Hyundai 45 - 14,095 IsuPetasys 33 -
6,455 Hyundai Bioscience 58 0.01 2,219 It's Hanbul 23 -
4,259 Hyundai BNG Steel 21 - 8,294 Jahwa Electronics 36 -
5,095 Hyundai Construction Equipment 75 0.01 1,891 JASTECH 11 -
6,031 Hyundai Department Store 230 0.02 5,168 Jayjun Cosmetic 9 -
10,213 Hyundai Electric & Energy System 55 0.01 89,967 JB Financial 289 0.02
3,660 Hyundai Elevator 171 0.01 5,042 JC Hyun System 21 -
29,997 Hyundai Engineering & Construction 671 0.05 2,703 Jcontentree 56 0.01
9,675 Hyundai Glovis 662 0.05 1,276 Jeju Air Rights 3 -
26,818 Hyundai Greenfood 140 0.01 3,504 Jeju Semiconductor 6 -
2,148 Hyundai Heavy Industries 357 0.03 3,455 Jejuair 38 -
4,576 Hyundai Holdings 30 - 7,818 Jeongsan Aikang 9 -
3,378 Hyundai Home Shopping Network 146 0.01 315 Jinro Distillers 6 -
23,489 Hyundai Hy Communications & Network 68 0.01 8,187 Jinsung T.E.C. 43 -
8,416 Hyundai Livart Furniture 96 0.01 5,320 JLS 21 -
56,571 Hyundai Marine & Fire Insurance 877 0.07 4,506 JNK Heaters 26 -
7,995 Hyundai Mipo Dockyard 170 0.01 1,566 JS 7 -
10,743 Hyundai Mobis 1,397 0.11 17,394 Jusung Engineering 66 0.01
24,296 Hyundai Motor 1,608 0.13 826 JVM 18 -
9,428 Hyundai Motor Securities 53 0.01 6,855 JW 25 -
4,489 Hyundai Pharmaceutical 17 - 3,998 JW Life Science 52 0.01
6,738 Hyundai Rotem 70 0.01 1,362 JW Pharmaceutical 33 -
33,505 Hyundai Steel 464 0.04 10,354 JYP Entertainment 149 0.01
1,453 Hyundai Telecommunication 6 - 1,153 Kakao 209 0.02
8,257 Hyundai Wia 193 0.02 6,944 Kanglim 8 -
2,758 HyVision System 18 - 2,292 Kangnam Jevisco 22 -
51,763 iA 16 - 10,255 Kangwon Land 149 0.01
3,403 ICD 30 - 7,825 KAON Media 30 -
4,070 IDIS 35 - 21,057 KB Financial 483 0.04
18,410 IHQ 20 - 51,354 KB Financial ADR 1,172 0.09
2,976 Il Dong Pharmaceutical 30 - 3,332 KC 42 -
9,363 Iljin 29 - 7,616 KC Green 19 -
1,143 Iljin Diamond 33 - 3,970 KC Tech 60 0.01
3,221 Iljin Display 6 - 1,819 KCC 164 0.01
9,448 Iljin Electric 17 - 4,782 KCC Engineering & Construction 20 -
3,536 Iljin Materials 119 0.01 1,709 KCC Glass 38 -
849 Ilshin Spinning 35 - 1,941 KCI 13 -
14,604 Ilshin Stone 22 - 58,519 KEC 32 -
6,775 ilShinbiobase 11 - 1,728 KEPCO Engineering & Construction 18 -
273 Ilsung Pharmaceuticals 14 - 8,867 KEPCO Plant Service & Engineering 174 0.01
2,269 Ilyang Pharmaceutical 98 0.01 12,571 Keyang Electric Machinery 23 -
10,651 iMarketKorea 63 0.01 6,650 KEYEAST 55 0.01
4,221 InBody 46 - 5,991 Kginicis 89 0.01
15,706 INCON 9 - 7,815 KGMobilians 61 0.01
1,002 Incross 23 - 2,856 KH Vatec 44 -
86,642 Industrial Bank of Korea 474 0.04 74,642 Kia Motors 1,620 0.13
Dimensional Fund Advisors Ltd. Interim Report and Financial Statements, 30 June 2020 52

Emerging Markets Core Equity Fund
Portfolio Statement (continued)as at 30 June 2020
Holding Investment
Fair
Value
£'000
Percentage
of total
net assets
% Holding Investment
Fair
Value
£'000
Percentage
of total
net assets
%
South Korea (continued) South Korea (continued)
1,263 KINX 50 0.01 12,137 Kuk-il Paper Manufacturing 47 -
8,449 KISCO 25 - 2,189 Kukje Pharma 11 -
5,015 KISCO Holdings 38 - 5,425 Kumho Industrial 24 -
4,352 KISWIRE 45 - 10,799 Kumho Petrochemical 542 0.04
97,408 Kiwi Media* 46 - 32,065 Kumho Tire 65 0.01
8,069 KIWOOM Securities 476 0.04 6,000 Kumkang Kind 13 -
6,459 KL-Net 9 - 17,780 Kwang Dong Pharmaceutical 84 0.01
2,000 KM 25 - 12,280 Kwang Myung Electric 16 -
8,760 KMH 45 - 7,151 Kyeryong Construction Industrial 74 0.01
11,415 KMW 495 0.04 12,590 Kyobo Securities 53 0.01
1,434 Kocom 5 - 3,284 Kyongbo Pharmaceutical 20 -
18,169 Kodaco 17 - 2,655 Kyung Dong Navien 75 0.01
10,615 Koentec 62 0.01 1,991 Kyung Nam Pharm 11 -
2,345 Koh Young Technology 159 0.01 8,769 Kyungbang 72 0.01
4,176 Kolmar BNH 114 0.01 1,025 KyungDong City Gas 12 -
4,205 Kolmar Korea 121 0.01 8,323 Kyungdong Pharm 55 0.01
3,916 Kolmar Korea Holdings 58 0.01 4,388 Kyung-In Synthetic 29 -
4,689 Kolon 57 0.01 2,597 L&F 54 0.01
3,925 Kolon Global 23 - 2,010 L&K Biomed 10 -
9,785 Kolon Industries 212 0.02 1,646 LabGenomics 24 -
2,502 KoMiCo 61 0.01 18,897 LB Semicon 104 0.01
1,835 KONA I* 16 - 9,909 LEADCORP 43 -
3,874 Kopla 8 - 2,332 Leaders Cosmetics 7 -
31 Korea Airport Service 1 - 4,174 LEENO Industrial 320 0.03
5,185 Korea Alcohol Industrial 53 0.01 5,530 Leenos 4 -
45,210 Korea Asset In Trust 86 0.01 9,600 LF 80 0.01
7,601 Korea Autoglass 69 0.01 20,519 LG 990 0.08
3,711 Korea Cast Iron Pipe Industries 22 - 3,984 LG Chem 1,322 0.10
3,018 Korea Circuit 26 - 4,423 LG Display 34 -
1,282 Korea District Heating 28 - 170,874 LG Display ADR 665 0.05
10,629 Korea Electric Power 140 0.01 62,846 LG Electronics 2,691 0.21
45,461 Korea Electric Power ADR 294 0.02 4,574 LG Hausys 199 0.02
3,923 Korea Electric Terminal 85 0.01 27,605 LG HelloVision 75 0.01
719 Korea Export Packaging Industrial 9 - 1,764 LG Household & Health Care 1,608 0.13
6,905 Korea Flange 10 - 7,246 LG Innotek 854 0.07
7,355 Korea Gas 130 0.01 15,895 LG International 167 0.01
5,153 Korea Information & Communications 31 - 95,159 LG Uplus 783 0.06
5,568 Korea Information Certificate 1,590 Lion Chemtech 9 -
Authority 22 - 11,189 Livefinancial 11 -
16,165 Korea Investment 487 0.04 2,229 LMS 15 -
7,470 Korea Line 87 0.01 8,425 Lock&Lock 64 0.01
4,130 Korea Materials & Analysis 4 - 5,283 LOT Vacuum 39 -
1,510 Korea Petrochemical Ind 116 0.01 10,370 Lotte 222 0.02
119,573 Korea Real Estate Investment & Trust 138 0.01 3,571 Lotte Chemical 404 0.03
9,081 Korea Shipbuilding & Offshore 1,401 Lotte Chilsung Beverage 96 0.01
Engineering 538 0.04 802 Lotte Confectionery 57 0.01
3,998 Korea United Pharm 65 0.01 8,158 LOTTE Fine Chemical 190 0.02
2,111 Korea Zinc 479 0.04 217 Lotte Food 51 0.01
38,247 Korean Air Lines 449 0.04 4,198 LOTTE Himart 109 0.01
25,307 Korean Air Lines Rights 10/07/2020 30 - 46,891 Lotte Non-Life Insurance 52 0.01
2,002 Korean Drug 15 - 4,552 Lotte Shopping 245 0.02
45,587 Korean Reinsurance 227 0.02 2,718 Lotte Tour Development 25 -
6,685 Kortek 40 - 6,845 LS 161 0.01
1,420 KPX Chemical 46 - 3,230 LS Cable & System Asia 14 -
12,892 KSIGN 11 - 6,113 LS Electric 198 0.02
11,941 KSS LINE 63 0.01 10,811 Lumens 12 -
22,137 KT ADR 175 0.01 4,882 Lutronic 20 -
8,451 KT Hitel 28 - 15,205 LVMC 41 -
20,238 KT Skylife 109 0.01 93,433 Macquarie Korea Infrastructure Fund 721 0.06
4,943 KT Submarine 14 - 3,943 Maeil 23 -
17,055 KT&G 904 0.07 1,895 Maeil Dairies 102 0.01
25,792 KTB Investment & Securities 39 - 24,309 Mando 368 0.03
17,671 KTCS 20 - 28,470 Maniker 18 -
13,384 Ktis 18 - 6,612 Mcnex 139 0.01
1,773 Kukbo Design 17 - 12,531 ME2ON 58 0.01
1,416 Kukdo Chemical 33 - 2,395 Medience* 7 -
Dimensional Fund Advisors Ltd. Interim Report and Financial Statements, 30 June 2020 53

Emerging Markets Core Equity Fund
Portfolio Statement (continued)as at 30 June 2020
Holding Investment
Fair
Value
£'000
Percentage
of total
net assets
% Holding Investment
Fair
Value
£'000
Percentage
of total
net assets
%
South Korea (continued) South Korea (continued)
2,366 Medipost 44 - 1,552 Oceanbridge 19 -
2,104 Medy-Tox 207 0.02 8,969 OCI 225 0.02
1,383 Meerecompany 22 - 9,302 Omnisystem 13 -
4,239 MegaStudy 29 - 3,624 Openbase 8 -
4,314 MegaStudyEdu 104 0.01 5,417 Opto Device Technology 15 -
23,478 Meritz Financial 149 0.01 3,187 OptoElectronics Solutions 102 0.01
38,885 Meritz Fire & Marine Insurance 333 0.03 9,196 OPTRON-TEC 29 -
149,797 Meritz Securities 306 0.03 2,309 Orbitech 4 -
3,589 META BIOMED 6 - 13,414 Orientbio 6 -
419 Mezzion Pharma 65 0.01 7,239 Orion 655 0.05
9,501 Mgame 28 - 15,077 Orion Holdings 135 0.01
342 Mi Chang Oil Industrial 13 - 1,798 OSANGJAIEL 11 -
17,618 MiCo 110 0.01 6,389 Osstem Implant 130 0.01
3,248 Minwise 29 - 13,415 Osung Advanced Materials 19 -
193,582 Mirae* 10 - 255 Ottogi 96 0.01
78,659 Mirae Asset Daewoo 355 0.03 21,285 Paik Kwang Industrial 37 -
46,743 Mirae Asset Life Insurance 84 0.01 77,004 Pan Ocean 199 0.02
942 Miwon Commercial 46 - 10,450 Pang Rim 12 -
723 Miwon Specialty Chemical 39 - 19,796 Pan-Pacific 27 -
11,793 MK Electron 61 0.01 6,762 Paradise 61 0.01
9,072 MNTech 19 - 18,253 Partron 109 0.01
1,869 Modetour Network 13 - 7,802 Paru 13 -
21,750 Moorim P&P 43 - 2,840 Pearl Abyss 419 0.03
14,880 Moorim Paper 20 - 589 PHARMA RESEARCH PRODUCTS 22 -
4,450 Motonic 22 - 10,376 Pharmicell 129 0.01
9,851 MS Autotech 34 - 5,717 PI Advanced Materials 111 0.01
10,539 Muhak 38 - 3,310 PNE Solution 42 -
1,159 Multicampus 23 - 6,774 POLUS BioPharm* 1 -
5,173 MyungMoon Pharm 20 - 5,274 POSCO 621 0.05
11,014 Namhae Chemical 54 0.01 48,086 POSCO ADR 1,454 0.12
7,629 Namsun Aluminum 32 - 3,756 POSCO Chemical 191 0.03
2,544 Namuga 25 - 19,916 Posco ICT 57 0.01
238 Namyang Dairy Products 46 - 31,131 Posco International 294 0.02
5,947 NanoenTek 44 - 9,443 Posco M-Tech 30 -
1,167 Nasmedia 22 - 15,612 Power Logics 74 0.01
9,968 Nature & Environment 10 - 4,435 Protec 61 0.01
6,330 NAVER 1,143 0.09 4,327 PSK 78 0.01
2,532 NCSoft 1,528 0.12 9,787 Pulmuone 114 0.01
1,597 NeoPharm 36 - 1,010 Pungkuk Alcohol Industry 17 -
4,535 Neowiz 85 0.01 4,771 Pyeong Hwa Automotive 18 -
3,955 Neowiz Holdings 39 - 5,600 RaonSecure 14 -
9,164 NEPES 178 0.02 1,989 Rayence 15 -
1,134 Netmarble 77 0.01 17,762 Redrover* 1 -
5,637 Neuros 10 - 1,719 Reyon Pharmaceutical 19 -
8,375 New Power Plasma 27 - 1,934 RFHIC 48 -
14,190 Nexen 37 - 4,315 RFTech 24 -
27,198 Nexen Tire 98 0.01 2,052 Robostar 20 -
5,280 Next Entertainment World 19 - 4,343 Rsupport 22 -
6,048 NextEye 5 - 4,446 S Net Systems 18 -
1,501 Nexturn 8 - 2,884 S&S Tech 73 0.01
54,155 NH Investment & Securities 303 0.02 649 S&T 7 -
2,432 NHN 136 0.01 4,040 S&T Motiv 104 0.01
7,540 NHN KCP 252 0.02 7,795 S-1 453 0.04
13,907 NICE 199 0.02 1,153 Sajo Industries 20 -
2,937 Nice Information & Telecommunication 51 0.01 4,114 Sajodaerim 39 -
13,890 NICE Information Service 172 0.01 1,697 Sam Chun Dang Pharm 42 -
9,824 NICE Total Cash Management 42 - 7,102 Sam Young Electronics 34 -
25,838 NK 20 - 5,859 Sam Yung Trading 52 0.01
1,175 Nong Shim 66 0.01 3,105 Sambo Corrugated Board 15 -
2,300 Nong Woo Bio 16 - 7,766 Sambo Motors 22 -
665 NongShim 165 0.01 6,686 Sambon Electronics 6 -
1,475 Noroo 9 - 768 Samchully 35 -
5,658 NOROO Paint & Coatings 27 - 13,591 Samho Development 40 -
16,223 NPC 39 - 3,419 Samho International 60 0.01
8,809 NS Shopping 77 0.01 6,295 SAMHWA Paints Industrial 20 -
4,333 Nuri Telecom 18 - 31,119 Samick Musical Instruments 30 -
Dimensional Fund Advisors Ltd. Interim Report and Financial Statements, 30 June 2020 54

Emerging Markets Core Equity Fund
Portfolio Statement (continued)as at 30 June 2020
Holding Investment
Fair
Value
£'000
Percentage
of total
net assets
% Holding Investment
Fair
Value
£'000
Percentage
of total
net assets
%
South Korea (continued) South Korea (continued)
2,396 Samick THK 17 - 1,917 Seoulin Bioscience 13 -
631 Samil Pharmaceutical 8 - 5,699 SEOWONINTECH 24 -
4,737 Samji Electronics 34 - 7,613 Seoyon 35 -
10,869 Samjin LND 20 - 7,295 Seoyon E-Hwa 16 -
4,431 Samjin Pharmaceutical 81 0.01 17,245 Sewon Cellontech 33 -
11,753 Samkee Automotive 21 - 3,171 Sewon Precision Industry* 3 -
6,893 Sammok S-Form 36 - 5,318 SEWOONMEDICAL 11 -
25,329 SAMPYO Cement 55 0.01 7,756 SFA Engineering 172 0.01
378 Samsung Biologics 198 0.02 25,109 SFA Semicon 85 0.01
9,547 Samsung C&T 747 0.06 57,144 SG 23 -
9,467 Samsung Card 175 0.01 17,587 SH Energy & Chemical 9 -
23,075 Samsung Electro-Mechanics 2,009 0.16 3,559 Shin Poong Pharmaceutical 73 0.01
910,484 Samsung Electronics 32,563 2.56 1,670 Shindaeyang Paper 61 0.01
19,353 Samsung Electronics GDR 17,349 1.36 88,582 Shinhan Financial 1,725 0.14
78,291 Samsung Engineering 647 0.05 8,844 Shinhan Financial ADR 174 0.01
11,934 Samsung Fire & Marine Insurance 1,423 0.11 8,424 Shinil Electronics 11 -
178,031 Samsung Heavy Industries 717 0.06 3,807 Shinsegae 567 0.05
15,605 Samsung Life Insurance 472 0.04 1,705 Shinsegae Engineering & Construction 23 -
12,732 Samsung Pharmaceutical 32 - 1,304 Shinsegae Food 46 -
1,189 Samsung Publishing 17 - 462 Shinsegae Information & Communication 38 -
1,509 Samsung SDI 372 0.03 879 Shinsegae International 93 0.01
7,484 Samsung SDS 854 0.07 40,105 Shinsung E&G 36 -
25,135 Samsung Securities 448 0.04 22,057 Shinsung Tongsang 26 -
32,167 SAMT 45 - 15,483 Shinwha Intertek 28 -
3,656 Samwha Capacitor 132 0.01 29,190 Shinwon 31 -
2,113 Samyang 57 0.01 2,909 Shinyoung Securities 84 0.01
2,193 Samyang Foods 187 0.02 13,566 SHOWBOX 23 -
2,406 Samyang Holdings 92 0.01 27,992 Signetics 13 -
885 Samyang Tongsang 32 - 4,485 SIGONG TECH 15 -
2,792 Sang-A Frontec 53 0.01 3,827 Silicon Works 100 0.01
23,806 Sangsangin 99 0.01 5,049 Silla 33 -
2,603 Sangsangin Industry 2 - 9,845 SIMMTECH 70 0.01
5,593 Sangsin Energy Display Precision 31 - 12,849 SIMPAC 20 -
2,704 SaraminHR 42 - 3,298 Sindoh 54 0.01
1,758 Satrec Initiative 27 - 2,016 Sinil Pharm 19 -
9,118 SAVEZONE I&C 13 - 4,038 SK 795 0.06
48,014 SBI Investment Korea 19 - 4,501 SK Bioland 101 0.01
29,956 SBS Media 38 - 4,309 SK Chemicals 374 0.03
81,393 SBW 49 0.01 2,125 SK D&D 39 -
19,079 S-Connect 21 - 7,908 SK Discovery 209 0.02
1,230 SD Biotechnologies 4 - 532 SK Gas 27 -
5,609 SDN 11 - 127,246 SK Hynix 7,335 0.58
453 SeAH 22 - 10,951 SK Innovation 971 0.08
8,676 Seah Besteel 60 0.01 2,167 SK Materials 294 0.02
936 SeAH Steel 31 - 99,824 SK Networks 321 0.03
1,044 SeAH Steel Holdings 24 - 8,076 SK Rent A Car 50 -
8,704 Sebang 60 0.01 214,096 SK Securities 127 0.01
4,994 Sebang Global Battery 103 0.01 2,230 SK Telecom 318 0.04
7,556 Secuve 9 - 6,370 SKC 263 0.02
6,521 Seegene 498 0.04 15,430 SKC Solmics 44 -
2,444 Sejin Heavy Industries 10 - 6,645 SL* 62 0.01
6,885 Sejong Industrial 25 - 14,602 SM Culture & Contents 15 -
226,459 Sejong Telecom 41 - 6,200 SM Entertainment 102 0.01
8,401 Sekonix 28 - 46,280 S-MAC 43 -
5,234 Selvas AI 10 - 2,264 SMCore 13 -
873 Sempio Foods 27 - 12,429 SMEC 16 -
2,771 Semyung Electric Machinery 7 - 6,827 SNU Precision 15 -
6,909 S-Energy 29 - 4,138 S-Oil 178 0.02
9,508 Seobu T&D 42 - 9,177 Solborn 21 -
64,867 Seohan 41 - 65,395 Solco Biomedical* 6 -
86,075 Seohee Construction 61 0.01 5,944 Solid 23 -
5,048 Seojin System 110 0.01 7,308 Songwon Industrial 63 0.01
7,589 Seondo Electric 12 - 5,042 Soulbrain* 327 0.03
2,464 Seoul Auction 7 - 1,156 SPC Samlip 49 -
1,616 Seoul Pharma 10 - 6,156 SPG 24 -
12,979 Seoul Semiconductor 118 0.01 1,368 Spigen Korea 58 0.01
Dimensional Fund Advisors Ltd. Interim Report and Financial Statements, 30 June 2020 55

Emerging Markets Core Equity Fund
Portfolio Statement (continued)as at 30 June 2020
Holding Investment
Fair
Value
£'000
Percentage
of total
net assets
% Holding Investment
Fair
Value
£'000
Percentage
of total
net assets
%
South Korea (continued) South Korea (continued)
46,351 Ssangyong Cement Industrial 160 0.01 2,667 Vitzrocell 30 -
23,621 Ssangyong Motor 52 0.01 8,346 VT GMP 50 -
1,397 ST Pharm 38 - 85,988 W 14 -
2,588 Suheung 93 0.01 6,201 Webzen 92 0.01
2,949 Sun Kwang 31 - 4,486 Welcron 18 -
1,905 SundayToz 36 - 1,624 Wemade 45 -
5,620 Sung Bo Chemicals 18 - 5,618 Whanin Pharmaceutical 55 0.01
12,272 Sung Kwang Bend 57 0.01 28,638 WillBes 24 -
29,869 Sungchang Enterprise 29 - 5,312 Winix 71 0.01
6,599 Sungdo Engineering & Construction 16 - 1,852 Wins 19 -
12,099 Sungshin Cement 50 - 9,313 WiSoL 82 0.01
46,257 Sungwoo Hitech 86 0.01 11,692 WIZIT 5 -
5,627 Sunjin 37 - 16,876 Wonik 52 -
7,776 Sunny Electronics 16 - 14,126 WONIK CUBE 15 -
1,816 Suprema 39 - 3,983 WONIK IPS 96 0.01
2,376 SY 6 - 5,394 Wonik Materials 100 0.01
9,996 Synergy Innovation 12 - 3,355 Wonik QnC 31 -
30,441 Synopex 61 0.01 4,277 Woojin 10 -
1,843 Systems Technology 19 - 132,500 Woori Financial 790 0.06
9,664 Tae Kyung Industrial 32 - 2,608 Woori Financial ADR 46 -
214 Taekwang Industrial 101 0.01 109,006 Woori Investment Bank 42 -
6,961 Taewoong 31 - 29,908 Woori Technology 14 -
27,637 Taeyoung Engineering & Construction 291 0.02 15,691 Woori Technology Investment 29 -
77,344 Taihan Electric Wire 35 - 3,140 Wooridul Pharmaceutical 14 -
11,785 Taihan Fiberoptics 30 - 15,173 Woorison F&G 20 -
1,793 Taihan Textile 28 - 1,764 Woory Industrial 21 -
5,779 Tailim Packaging 13 - 7,495 Woosu AMS 20 -
5,475 TechWing 65 0.01 9,557 WooSung Feed 21 -
745 Tego Science 14 - 3,421 Worldex Industry & Trading 22 -
13,812 Telcon RF Pharmaceutical 49 - 11,595 Y G-1 37 -
1,599 Telechips 8 - 2,173 YeaRimDang Publishing 3 -
2,387 TES 35 - 1,515 Yest 6 -
5,768 Theragen Etex 41 - 3,366 YG Entertainment 85 0.01
3,514 Thinkware Systems 20 - 7,729 YJM Games 7 -
9,957 TK 49 - 1,126 Yonwoo 13 -
19,900 TK Chemical 29 - 6,134 Yoosung Enterprise 10 -
9,796 TOBESOFT 10 - 7,265 YooSung T&S 10 -
2,591 Tokai Carbon Korea 152 0.01 4,809 Youlchon Chemical 47 -
34,940 Tong Yang Moolsan 23 - 318 Young Poong 99 0.01
95,041 Tongyang 76 0.01 6,473 Young Poong Precision 28 -
25,986 Tongyang Life Insurance 51 0.01 9,859 Youngone 170 0.01
928 Tonymoly 7 - 4,238 Youngone Holdings 111 0.01
10,139 Top Engineering 54 0.01 12,185 YTN 14 -
5,073 Toptec 65 0.01 60,958 Yuanta Securities Korea 108 0.01
9,810 Tovis 44 - 11,275 Yuhan 386 0.03
2,289 TS 30 - 10,805 YuHwa Securities 16 -
3,996 T'way 3 - 5,270 Yujin Robot 8 -
3,628 UBCare 24 - 21,230 Yungjin Pharmaceutical 79 0.01
626 Ubiquoss 16 - 1,278 Yuyu Pharma 12 -
1,356 Ubiquoss Holdings 31 - 4,257 Zeus 37 -
5,624 UIL 15 - 168,708 13.26
2,770 Uju Electronics 50 -
14,213 Uni-Chem 13 - Taiwan 16.86% (16.14%)
2,445 Unick 13 -
3,715 Unid 105 0.01 23,000 Aaeon Technology 46 -
8,063 Union Semiconductor Equipment & 41,389 ABC Taiwan Electronics 20 -
Materials 32 - 164,164 Ability Enterprise 55 0.01
5,199 Uniquest 36 - 24,093 Ability Opto-Electronics Technology 25 -
22,188 Unison 25 - 119,000 AcBel Polytech 64 0.01
1,074 Unitekno 7 - 211,465 Accton Technology 1,329 0.11
3,103 UniTest 26 - 20,000 Ace Pillar 12 -
3,310 Value Added Technology 46 - 1,182,315 Acer 582 0.05
5,036 Viatron Technologies 29 - 68,000 ACES Electronic 53 0.01
5,913 Vidente 25 - 77,000 Acon 16 -
2,948 Vieworks 66 0.01 22,400 Acter 129 0.01
5,720 Visang Education 27 - 63,000 Action Electronics 16 -
Dimensional Fund Advisors Ltd. Interim Report and Financial Statements, 30 June 2020 56

Emerging Markets Core Equity Fund
Portfolio Statement (continued)as at 30 June 2020
Holding Investment
Fair
Value
£'000
Percentage
of total
net assets
% Holding Investment
Fair
Value
£'000
Percentage
of total
net assets
%
Taiwan (continued) Taiwan (continued)
21,958 Actron Technology 53 - 48,000 Azurewave Technologies 24 -
101,548 A-DATA Technology 161 0.01 295,127 Bank of Kaohsiung 80 0.01
5,366 Addcn Technology 34 - 14,000 Baolong International 5 -
19,000 Advanced Ceramic X 216 0.02 72,000 Basso Industry 80 0.01
90,000 Advanced International Multitech 77 0.01 116,000 BenQ Materials 59 0.01
43,000 Advanced Optoelectronic Technology 21 - 697,000 BES Engineering 136 0.01
34,000 Advanced Power Electronics 26 - 71,190 Bin Chuan Enterprise 51 -
47,383 Advanced Wireless Semiconductor 119 0.01 15,000 Bionime 29 -
139,726 Advancetek Enterprise 67 0.01 123,000 Biostar Microtech International 33 -
73,652 Advantech 600 0.05 24,821 Bioteque 107 0.01
12,000 AEON Motor 10 - 45,670 Bizlink 264 0.02
285,000 Aerospace Industrial Development 234 0.02 63,000 Boardtek Electronics 42 -
231,441 AGV Products 49 - 8,000 Bon Fame 9 -
40,739 Airmate Cayman International 31 - 52,000 Bright Led Electronics 21 -
28,164 Airtac International 400 0.03 220,089 Brighton-Best International Taiwan 163 0.01
17,000 Alchip Technologies 234 0.02 76,000 C Sun Manufacturing 60 0.01
64,440 ALI 39 - 29,000 Calchen Pharmaceuticals* 58 0.01
36,000 All Ring Tech 42 - 12,000 Calin Technology 7 -
11,000 Allied Circuit 44 - 157,000 Cameo Communications 45 -
31,460 Allis Electric 19 - 33,805 Capital Futures 36 -
75,552 Alltek Technology 43 - 1,013,278 Capital Securities 289 0.02
24,000 Alltop Technology 61 0.01 204,000 Career Technology MFG 172 0.01
100,200 Alpha Networks 76 0.01 84,999 Carnival Industrial 23 -
162,528 Altek 112 0.01 106,068 Casetek 192 0.02
26,575 Amazing Microelectronic 65 0.01 15,000 Caswell 63 0.01
156,000 Ambassador Hotel 126 0.01 199,878 Catcher Technology 1,223 0.10
59,000 Ampire 36 - 1,366,017 Cathay Financial 1,577 0.12
50,000 AMPOC Far-East 49 - 45,417 Cathay Financial Rights 9 -
391,132 AmTRAN Technology 87 0.01 686,000 Cathay No. 1 REIT 322 0.03
90,405 Anderson Industrial 19 - 162,000 Cathay No. 2 REIT 79 0.01
32,177 Anpec Electronics 74 0.01 327,300 Cathay Real Estate Development 179 0.01
22,000 Apac Opto Electronics 26 - 53,000 Celxpert Energy 44 -
41,964 Apacer Technology 50 - 104,149 Center Laboratories 215 0.02
14,739 APAQ Technology 12 - 96,348 Central Reinsurance 49 -
93,000 APCB 58 0.01 373,862 Chailease 1,281 0.10
60,502 Apex Biotechnology 46 - 66,000 Chain Chon Industrial 15 -
80,371 Apex International 153 0.01 55,696 ChainQui Construction Development 32 -
25,000 Apex Medical 25 - 152,000 Champion Building Materials 23 -
57,200 Apex Science & Engineering 19 - 1,092,466 Chang Hwa Commercial Bank 583 0.05
79,005 Arcadyan Technology 182 0.02 17,923 Chang Wah Electromaterials 80 0.01
312,913 Ardentec 275 0.02 77,000 Chang Wah Technology 64 0.01
20,000 Argosy Research 64 0.01 104,000 Channel Well Technology 79 0.01
1,008,305 ASE Technology 1,877 0.15 23,000 Chant Sincere 22 -
161,378 ASE Technology ADR 593 0.05 106,175 Charoen Pokphand Enterprise 200 0.02
734,296 Asia Cement 883 0.07 11,000 Chaun-Choung Technology 80 0.01
52,000 Asia Electronic Material 19 - 49,000 CHC Healthcare 59 0.01
93,000 Asia Optical 180 0.01 41,100 CHC Resources 51 -
589,232 Asia Pacific Telecom 128 0.01 49,000 Chen Full International 52 -
190,872 Asia Polymer 101 0.01 30,000 Chenbro Micom 77 0.01
20,000 Asia Tech Image 31 - 60,000 Cheng Fwa Industrial 18 -
122,736 Asia Vital Components 141 0.01 525,000 Cheng Loong 338 0.03
11,468 ASMedia Technology 453 0.04 366,864 Cheng Mei Materials Technology 78 0.01
8,919 ASPEED Technology 304 0.02 503,384 Cheng Shin Rubber Industry 468 0.04
18,000 ASROCK 69 0.01 227,230 Cheng Uei Precision Industry 249 0.02
171,269 Asustek Computer 1,020 0.08 65,000 Chenming Electronic Technology 23 -
36,000 Aten International 88 0.01 80,000 Chia Chang 79 0.01
3,316,801 AU Optronics 845 0.07 216,809 Chia Hsin Cement 105 0.01
41,013 AU Optronics ADR 103 0.01 20,000 Chian Hsing Forging Industrial 23 -
53,800 Audix 61 0.01 222,955 Chicony Electronics 523 0.04
23,000 AURAS Technology 109 0.01 77,802 Chicony Power Technology 144 0.01
13,000 Aurona Industries 6 - 26,800 Chieftek Precision 68 0.01
23,100 Aurora 58 0.01 135,320 Chien Kuo Construction 38 -
10,000 Avalue Technology 19 - 102,543 Chilisin Electronics 254 0.02
99,000 Avermedia Technologies 79 0.01 6,000 Chime Ball Technology 6 -
68,768 AVY Precision Technology 47 - 2,453,798 China Airlines 555 0.04
33,000 Axiomtek 50 - 414,600 China Bills Finance 176 0.01
Dimensional Fund Advisors Ltd. Interim Report and Financial Statements, 30 June 2020 57

Emerging Markets Core Equity Fund
Portfolio Statement (continued)as at 30 June 2020
Holding Investment
Fair
Value
£'000
Percentage
of total
net assets
% Holding Investment
Fair
Value
£'000
Percentage
of total
net assets
%
Taiwan (continued) Taiwan (continued)
162,000 China Chemical & Pharmaceutical 113 0.01 12,368 Dadi Early-Childhood Education 63 0.01
2,846,037 China Development Financial 742 0.06 34,747 Dafeng TV 42 -
4,000 China Ecotek 4 - 85,139 Da-Li Development 74 0.01
157,500 China Electric Manufacturing 49 - 58,440 Danen Technology 6 -
21,210 China Fineblanking Technology 22 - 120,950 Darfon Electronics 126 0.01
265,663 China General Plastics 138 0.01 251,000 Darwin Precisions 73 0.01
53,680 China Glaze 13 - 19,000 Davicom Semiconductor 11 -
996,081 China Life Insurance Limited 598 0.05 19,800 Daxin Materials 49 -
685,777 China Man-Made Fiber 126 0.01 145,683 De Licacy Industrial 86 0.01
186,374 China Metal Products 143 0.01 37,000 Delpha Construction 17 -
128,244 China Motor 130 0.01 235,184 Delta Electronics 1,086 0.09
2,033,959 China Petrochemical Development 464 0.04 81,000 Depo Auto Parts Ind 114 0.01
4,039,305 China Steel 2,307 0.18 27,000 Dimerco Data System 43 -
68,000 China Steel Chemical 197 0.02 72,000 Dimerco Express 78 0.01
58,000 China Steel Structure 41 - 225,493 D-Link 119 0.01
46,300 China Wire & Cable 35 - 49,350 DONPON PRECISION 19 -
54,130 Chinese Maritime Transport 39 - 21,336 Dyaco International 33 -
61,000 Ching Feng Home Fashions 52 - 202,467 Dynamic Electronics 97 0.01
153,000 Chin-Poon Industrial 111 0.01 75,000 Dynapack International Technology 158 0.01
435,000 Chipbond Technology 773 0.06 337,000 E Ink 378 0.03
362,821 ChipMOS Technologies 338 0.03 24,484 E&R Engineering 34 -
3,074 ChipMOS Technologies ADR 56 0.01 3,946,257 E.Sun Financial 3,018 0.24
90,395 Chong Hong Construction 216 0.02 222,800 Eastern Media International 99 0.01
85,752 Chroma ATE 358 0.03 68,052 Eclat Textile 640 0.05
107,000 Chun YU Works 53 - 13,000 ECOVE Environment 79 0.01
278,361 Chun Yuan Steel Industry 76 0.01 102,449 Edimax Technology 27 -
597,023 Chung Hung Steel 135 0.01 57,652 Edison Opto 18 -
5,000 Chung Hwa Food Industrial 12 - 92,872 Edom Technology 46 -
210,609 Chung Hwa Pulp 52 - 19,316 eGalax_eMPIA Technology 33 -
25,000 Chung Lien Transportation 48 - 27,000 Egis Technology 144 0.01
246,125 Chung-Hsin Electric & Machinery 116,661 Elan Microelectronics 386 0.03
Manufacturing 187 0.02 18,000 E-Lead Electronic 9 -
14,000 Chunghwa Chemical Synthesis & Biotech 25 - 29,000 E-LIFE MALL 58 0.01
6,000 Chunghwa Precision Test Tech 135 0.01 111,240 Elite Advanced Laser 229 0.02
43,499 Chunghwa Telecom 140 0.01 114,691 Elite Material 503 0.04
45,887 Chunghwa Telecom ADR 1,445 0.11 134,000 Elite Semiconductor Microelectronics
78,000 Chyang Sheng Dyeing & Finishing 27 - Technology 143 0.01
41,000 Cleanaway 189 0.02 238,735 Elitegroup Computer Systems 78 0.01
252,714 Clevo 207 0.02 36,000 eMemory Technology 484 0.04
504,514 CMC Magnetics 102 0.01 80,000 Emerging Display Technologies 47 -
46,764 CoAsia Electronics 16 - 21,891 Ennoconn 169 0.01
74,000 Collins 27 - 401,000 EnTie Commercial Bank 157 0.01
2,215,814 Compal Electronics 1,176 0.09 72,000 Episil 51 -
483,000 Compeq Manufacturing 634 0.05 580,960 Epistar 590 0.05
46,000 Compucase Enterprise 39 - 4,000 Eslite Spectrum 10 -
340,121 Concord Securities 69 0.01 53,000 Eson Precision Ind 47 -
19,920 Concraft 61 0.01 453,891 Eternal Materials 389 0.03
263,550 Continental 93 0.01 171,000 Etron Technology 37 -
89,000 Contrel Technology 38 - 15,000 Eurocharm 39 -
23,257 Coremax 38 - 2,041,525 Eva Airways 630 0.05
242,200 Coretronic 213 0.02 212,856 Everest Textile 62 0.01
100,860 Co-Tech Development 117 0.01 379,000 Evergreen International Storage &
28,008 Cowealth Medical 26 - Transport 143 0.01
57,000 Coxon Precise Industrial 22 - 1,642,144 Evergreen Marine Corp Taiwan 487 0.04
58,000 Creative Sensor 30 - 308,449 Everlight Chemical Industrial 125 0.01
40,897 CSBC Corp Taiwan 26 - 231,376 Everlight Electronics 197 0.02
3,312,364 CTBC Financial 1,859 0.15 61,000 Everspring Industry 29 -
250,660 CTCI 270 0.02 49,000 Excel Cell Electronic 26 -
23,900 C-Tech United 10 - 55,000 Excellence Opto 34 -
18,127 Cub Elecparts 76 0.01 5,000 Excelliance Mos 16 -
32,240 CviLux 25 - 57,873 Excelsior Medical 95 0.01
13,259 Cyberlink 39 - 22,050 EZconn 22 -
21,000 CyberPower Systems 47 - 459,610 Far Eastern Department Stores 316 0.03
185,000 CyberTAN Technology 83 0.01 1,319,901 Far Eastern International Bank 404 0.03
19,800 Cypress Technology 43 - 1,079,835 Far Eastern New Century 829 0.07
129,000 DA CIN Construction 80 0.01 497,000 Far EasTone Telecommunications 932 0.07
Dimensional Fund Advisors Ltd. Interim Report and Financial Statements, 30 June 2020 58
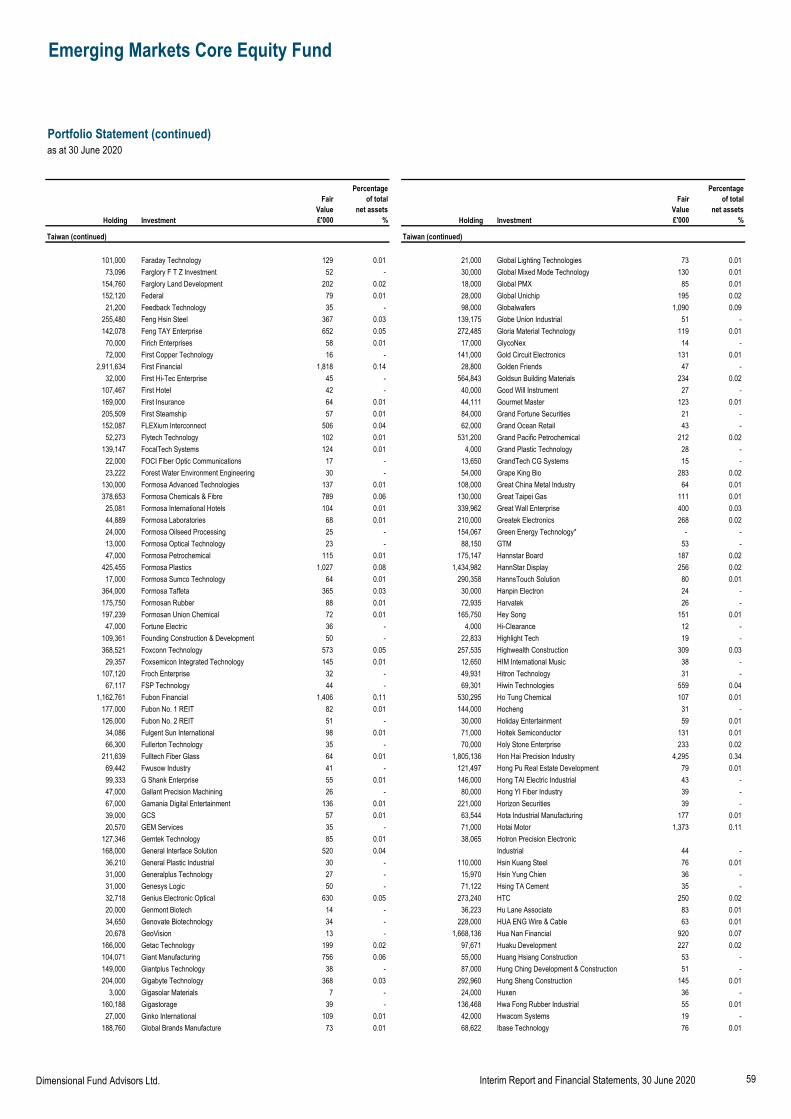
Emerging Markets Core Equity Fund
Portfolio Statement (continued)as at 30 June 2020
Holding Investment
Fair
Value
£'000
Percentage
of total
net assets
% Holding Investment
Fair
Value
£'000
Percentage
of total
net assets
%
Taiwan (continued) Taiwan (continued)
101,000 Faraday Technology 129 0.01 21,000 Global Lighting Technologies 73 0.01
73,096 Farglory F T Z Investment 52 - 30,000 Global Mixed Mode Technology 130 0.01
154,760 Farglory Land Development 202 0.02 18,000 Global PMX 85 0.01
152,120 Federal 79 0.01 28,000 Global Unichip 195 0.02
21,200 Feedback Technology 35 - 98,000 Globalwafers 1,090 0.09
255,480 Feng Hsin Steel 367 0.03 139,175 Globe Union Industrial 51 -
142,078 Feng TAY Enterprise 652 0.05 272,485 Gloria Material Technology 119 0.01
70,000 Firich Enterprises 58 0.01 17,000 GlycoNex 14 -
72,000 First Copper Technology 16 - 141,000 Gold Circuit Electronics 131 0.01
2,911,634 First Financial 1,818 0.14 28,800 Golden Friends 47 -
32,000 First Hi-Tec Enterprise 45 - 564,843 Goldsun Building Materials 234 0.02
107,467 First Hotel 42 - 40,000 Good Will Instrument 27 -
169,000 First Insurance 64 0.01 44,111 Gourmet Master 123 0.01
205,509 First Steamship 57 0.01 84,000 Grand Fortune Securities 21 -
152,087 FLEXium Interconnect 506 0.04 62,000 Grand Ocean Retail 43 -
52,273 Flytech Technology 102 0.01 531,200 Grand Pacific Petrochemical 212 0.02
139,147 FocalTech Systems 124 0.01 4,000 Grand Plastic Technology 28 -
22,000 FOCI Fiber Optic Communications 17 - 13,650 GrandTech CG Systems 15 -
23,222 Forest Water Environment Engineering 30 - 54,000 Grape King Bio 283 0.02
130,000 Formosa Advanced Technologies 137 0.01 108,000 Great China Metal Industry 64 0.01
378,653 Formosa Chemicals & Fibre 789 0.06 130,000 Great Taipei Gas 111 0.01
25,081 Formosa International Hotels 104 0.01 339,962 Great Wall Enterprise 400 0.03
44,889 Formosa Laboratories 68 0.01 210,000 Greatek Electronics 268 0.02
24,000 Formosa Oilseed Processing 25 - 154,067 Green Energy Technology* - -
13,000 Formosa Optical Technology 23 - 88,150 GTM 53 -
47,000 Formosa Petrochemical 115 0.01 175,147 Hannstar Board 187 0.02
425,455 Formosa Plastics 1,027 0.08 1,434,982 HannStar Display 256 0.02
17,000 Formosa Sumco Technology 64 0.01 290,358 HannsTouch Solution 80 0.01
364,000 Formosa Taffeta 365 0.03 30,000 Hanpin Electron 24 -
175,750 Formosan Rubber 88 0.01 72,935 Harvatek 26 -
197,239 Formosan Union Chemical 72 0.01 165,750 Hey Song 151 0.01
47,000 Fortune Electric 36 - 4,000 Hi-Clearance 12 -
109,361 Founding Construction & Development 50 - 22,833 Highlight Tech 19 -
368,521 Foxconn Technology 573 0.05 257,535 Highwealth Construction 309 0.03
29,357 Foxsemicon Integrated Technology 145 0.01 12,650 HIM International Music 38 -
107,120 Froch Enterprise 32 - 49,931 Hitron Technology 31 -
67,117 FSP Technology 44 - 69,301 Hiwin Technologies 559 0.04
1,162,761 Fubon Financial 1,406 0.11 530,295 Ho Tung Chemical 107 0.01
177,000 Fubon No. 1 REIT 82 0.01 144,000 Hocheng 31 -
126,000 Fubon No. 2 REIT 51 - 30,000 Holiday Entertainment 59 0.01
34,086 Fulgent Sun International 98 0.01 71,000 Holtek Semiconductor 131 0.01
66,300 Fullerton Technology 35 - 70,000 Holy Stone Enterprise 233 0.02
211,639 Fulltech Fiber Glass 64 0.01 1,805,136 Hon Hai Precision Industry 4,295 0.34
69,442 Fwusow Industry 41 - 121,497 Hong Pu Real Estate Development 79 0.01
99,333 G Shank Enterprise 55 0.01 146,000 Hong TAI Electric Industrial 43 -
47,000 Gallant Precision Machining 26 - 80,000 Hong YI Fiber Industry 39 -
67,000 Gamania Digital Entertainment 136 0.01 221,000 Horizon Securities 39 -
39,000 GCS 57 0.01 63,544 Hota Industrial Manufacturing 177 0.01
20,570 GEM Services 35 - 71,000 Hotai Motor 1,373 0.11
127,346 Gemtek Technology 85 0.01 38,065 Hotron Precision Electronic
168,000 General Interface Solution 520 0.04 Industrial 44 -
36,210 General Plastic Industrial 30 - 110,000 Hsin Kuang Steel 76 0.01
31,000 Generalplus Technology 27 - 15,970 Hsin Yung Chien 36 -
31,000 Genesys Logic 50 - 71,122 Hsing TA Cement 35 -
32,718 Genius Electronic Optical 630 0.05 273,240 HTC 250 0.02
20,000 Genmont Biotech 14 - 36,223 Hu Lane Associate 83 0.01
34,650 Genovate Biotechnology 34 - 228,000 HUA ENG Wire & Cable 63 0.01
20,678 GeoVision 13 - 1,668,136 Hua Nan Financial 920 0.07
166,000 Getac Technology 199 0.02 97,671 Huaku Development 227 0.02
104,071 Giant Manufacturing 756 0.06 55,000 Huang Hsiang Construction 53 -
149,000 Giantplus Technology 38 - 87,000 Hung Ching Development & Construction 51 -
204,000 Gigabyte Technology 368 0.03 292,960 Hung Sheng Construction 145 0.01
3,000 Gigasolar Materials 7 - 24,000 Huxen 36 -
160,188 Gigastorage 39 - 136,468 Hwa Fong Rubber Industrial 55 0.01
27,000 Ginko International 109 0.01 42,000 Hwacom Systems 19 -
188,760 Global Brands Manufacture 73 0.01 68,622 Ibase Technology 76 0.01
Dimensional Fund Advisors Ltd. Interim Report and Financial Statements, 30 June 2020 59

Emerging Markets Core Equity Fund
Portfolio Statement (continued)as at 30 June 2020
Holding Investment
Fair
Value
£'000
Percentage
of total
net assets
% Holding Investment
Fair
Value
£'000
Percentage
of total
net assets
%
Taiwan (continued) Taiwan (continued)
1,049,013 IBF Financial 340 0.03 36,000 Laser Tek Taiwan 24 -
180,000 Ichia Technologies 67 0.01 25,142 Laster Tech 18 -
101,000 I-Chiun Precision Industry 20 - 64,000 Leader Electronics 12 -
74,460 IEI Integration 90 0.01 414,599 Lealea Enterprise 85 0.01
123,000 Infortrend Technology 44 - 18,216 Ledlink Optics 11 -
59,000 Info-Tek 28 - 72,000 LEE CHI Enterprises 19 -
32,206 Innodisk 157 0.01 32,650 Lelon Electronics 38 -
3,351,471 Innolux 729 0.06 52,375 Leofoo Development 23 -
49,400 Inpaq Technology 42 - 67,203 LES Enphants 12 -
8,000 Insyde Software 21 - 214,000 Lextar Electronics 118 0.01
15,000 Intai Technology 55 0.01 44,204 Li Cheng Enterprise 43 -
59,421 Integrated Service Technology 89 0.01 412,362 Li Peng Enterprise 75 0.01
10,000 IntelliEPI 15 - 43,664 Lian HWA Food 53 -
343,800 International CSRC Investment 191 0.02 34,800 Lida 36 -
25,000 International Games System 506 0.04 221,105 Lien Hwa Industrial 259 0.02
965,556 Inventec 669 0.05 251,000 Lingsen Precision Industries 71 0.01
27,120 Iron Force Industrial 69 0.01 15,000 Lion Travel Service 32 -
62,000 I-Sheng Electric Wire & Cable 77 0.01 119,134 Lite-On Semiconductor 135 0.01
81,945 ITE Technology 139 0.01 1,007,060 Lite-On Technology 1,286 0.10
77,343 ITEQ 314 0.03 116,460 Long Bon International 45 -
11,945 Jarllytec 21 - 84,373 Long Da Construction & Development 36 -
129,000 Jean 30 - 388,076 Longchen Paper & Packaging 152 0.01
21,000 Jentech Precision Industrial 164 0.01 48,000 Longwell 77 0.01
43,593 Jess-Link Products 43 - 28,909 Lotes 302 0.02
11,000 Jih Lin Technology 14 - 9,000 Lotus Pharmaceutical 21 -
801,037 Jih Sun Financial 213 0.02 21,943 Lu Hai 26 -
84,427 Jinli 17 - 136,000 Lucky Cement 37 -
19,000 JMC Electronics 32 - 46,310 Lumax International 84 0.01
14,000 Johnson Health Tech 27 - 76,000 Lung Yen Life Service 122 0.01
13,000 Jourdeness 30 - 46,119 LuxNet 31 -
42,000 K Laser Technology 17 - 26,000 Macauto Industrial 54 -
18,926 Kaimei Electronic 18 - 19,756 Machvision 169 0.01
32,720 Kaori Heat Treatment 57 0.01 8,000 Macroblock 21 -
68,000 Kaulin Manufacturing 23 - 669,906 Macronix International 572 0.05
239,700 KEE TAI Properties 67 0.01 99,380 Makalot Industrial 423 0.03
214,804 Kenda Rubber Industrial 174 0.01 32,000 Marketech International 75 0.01
123,000 Kenmec Mechanical Engineering 61 0.01 31,967 Materials Analysis Technology 71 0.01
102,000 Kerry TJ Logistics 115 0.01 74,560 Mayer Steel Pipe 32 -
34,550 Key Ware Electronics 11 - 10,000 Mechema Chemicals International 16 -
138,000 Kindom Development 118 0.01 158,471 MediaTek 2,518 0.20
44,340 King Chou Marine Technology 39 - 1,061,968 Mega Financial 905 0.07
18,000 King Slide Works 166 0.01 45,710 Meiloon Industrial 28 -
772,098 King Yuan Electronics 731 0.06 241,448 Mercuries & Associates 176 0.01
462,000 King's Town Bank 457 0.04 583,977 Mercuries Life Insurance 161 0.01
60,099 King's Town Construction 58 0.01 51,000 Merida Industry 282 0.02
58,000 Kinik 99 0.01 85,627 Merry Electronics 328 0.03
54,000 Kinko Optical 47 - 218,729 Microbio 452 0.04
744,460 Kinpo Electronics 223 0.02 182,526 Micro-Star International 538 0.04
118,949 Kinsus Interconnect Technology 230 0.02 22,000 Mildef Crete 31 -
32,008 KMC Kuei Meng International 131 0.01 76,000 MIN AIK Technology 29 -
52,000 KNH Enterprise 62 0.01 125,136 Mirle Automation 134 0.01
56,000 KS Terminals 64 0.01 386,875 Mitac 345 0.03
33,000 Kung Long Batteries Industrial 134 0.01 10,000 MJ International 19 -
249,730 Kung Sing Engineering 61 0.01 37,440 Mobiletron Electronics 30 -
46,730 Kung Sing Engineering Rights 3 - 17,000 momo.com 336 0.03
155,088 Kuo Toong International 73 0.01 47,000 Mosel Vitelic 37 -
131,523 Kuoyang Construction 86 0.01 179,934 Motech Industries 36 -
58,630 Kwong Fong Industries 22 - 17,000 MPI 43 -
41,881 Kwong Lung Enterprise 50 - 32,000 Nak Sealing Technologies 59 0.01
160,959 KYE Systems 39 - 92,000 Namchow 117 0.01
99,000 L&K Engineering 74 0.01 128,653 Nan Kang Rubber Tire 157 0.01
6,295 La Kaffa International 27 - 18,000 Nan Liu Enterprise 131 0.01
135,000 LAN FA Textile 31 - 79,000 Nan Ren Lake Leisure Amusement 26 -
31,000 LandMark Optoelectronics 248 0.02 512,262 Nan Ya Plastics 912 0.07
39,784 Lanner Electronics 68 0.01 111,480 Nan Ya Printed Circuit Board 244 0.02
18,465 Largan Precision 2,076 0.16 29,000 Nang Kuang Pharmaceutical 43 -
Dimensional Fund Advisors Ltd. Interim Report and Financial Statements, 30 June 2020 60

Emerging Markets Core Equity Fund
Portfolio Statement (continued)as at 30 June 2020
Holding Investment
Fair
Value
£'000
Percentage
of total
net assets
% Holding Investment
Fair
Value
£'000
Percentage
of total
net assets
%
Taiwan (continued) Taiwan (continued)
139,587 Nantex Industry 150 0.01 306,314 Radiant Opto-Electronics 999 0.08
368,759 Nanya Technology 618 0.05 597,272 Radium Life Tech 170 0.01
15,000 National Aerospace Fasteners 24 - 7,000 Rafael Microelectronics 26 -
1,000 National Petroleum 1 - 175,877 Realtek Semiconductor 1,449 0.11
36,000 Netronix 40 - 171,016 Rechi Precision 81 0.01
57,000 New Best Wire Industrial 39 - 47,000 Rexon Industrial 102 0.01
42,000 New Era Electronics 20 - 386,115 Rich Development 107 0.01
31,000 Newmax Technology 44 - 12,100 RichWave Technology 63 0.01
34,955 Nexcom International 22 - 459,000 Ritek 66 0.01
116,097 Nichidenbo 171 0.01 20,000 Rodex Fasteners 20 -
81,217 Nien Hsing Textile 37 - 308,000 Roo Hsing 113 0.01
76,000 Nien Made Enterprise 602 0.05 224,418 Ruentex Development 316 0.03
13,000 Niko Semiconductor 14 - 17,000 Ruentex Engineering & Construction 30 -
18,400 Nishoku Technology 33 - 179,237 Ruentex Industries 350 0.03
3,000 Nova Technology 12 - 12,810 Samebest 21 -
160,000 Novatek Microelectronics 1,005 0.08 115,000 Sampo 68 0.01
44,483 Nuvoton Technology 47 - 123,156 San Fang Chemical Industry 73 0.01
533,000 O-Bank 106 0.01 124,233 San Far Property 52 -
84,000 Ocean Plastics 73 0.01 62,872 San Shing Fastech 78 0.01
20,000 OK Biotech 16 - 22,000 Sanitar 20 -
188,758 OptoTech 106 0.01 187,260 Sanyang Motor 110 0.01
18,000 Orient Europharma 25 - 21,266 SCI Pharmtech 83 0.01
336,908 Orient Semiconductor Electronics 110 0.01 31,000 Scientech 40 -
229,872 Oriental Union Chemical 106 0.01 86,000 SDI 114 0.01
32,292 O-TA Precision Industry 33 - 38,000 Senao International 31 -
120,450 Pacific Construction 33 - 11,000 Senao Networks 33 -
27,000 Pacific Hospital Supply 66 0.01 77,000 Sercomm 166 0.01
37,637 Paiho Shih 31 - 105,922 Sesoda 78 0.01
145,800 Pan Jit International 113 0.01 65,000 Shan-Loong Transportation 53 -
201,301 Pan-International Industrial 101 0.01 34,773 Sharehope Medicine 38 -
16,000 Panion & BF Biotech 58 0.01 62,000 Sheng Yu Steel 30 -
28,600 Parade Technologies 776 0.06 37,152 ShenMao Technology 21 -
21,210 Paragon Technologies 20 - 49,000 Shieh Yih Machinery Industry 16 -
17,000 Parpro 13 - 24,000 Shih Her Technologies 31 -
10,942 PCL Technologies 36 - 206,074 Shih Wei Navigation 36 -
20,460 P-Duke Technology 38 - 165,000 Shihlin Electric & Engineering 207 0.02
651,968 Pegatron 1,150 0.09 2,549,176 Shin Kong Financial 604 0.05
23,249 Pharmally International 105 0.01 604,000 Shin Kong No.1 REIT 317 0.03
211,101 Phihong Technology 50 - 72,449 Shin Zu Shing 296 0.02
59,000 Phison Electronics 479 0.04 31,000 Shinih Enterprise 19 -
7,717 Phoenix Tours International 7 - 225,472 Shining Building Business 62 0.01
43,070 Pixart Imaging 202 0.02 131,000 Shinkong Insurance 129 0.01
19,000 Planet Technology 35 - 670,032 Shinkong Synthetic Fibers 207 0.02
69,144 Plastron Precision 31 - 50,000 Shinkong Textile 60 0.01
73,000 Plotech 37 - 31,000 Shiny Chemical Industrial 94 0.01
23,000 Polytronics Technology 42 - 162,000 Shuttle 44 -
11,732 Posiflex Technology 27 - 337,456 Sigurd Microelectronics 377 0.03
1,111,306 Pou Chen 882 0.07 254,156 Silicon Integrated Systems 86 0.01
12,881 Power Wind Health Industry 65 0.01 43,860 Simplo Technology 387 0.03
382,700 Powertech Technology 1,123 0.09 101,219 Sinbon Electronics 414 0.03
28,852 Poya International 464 0.04 200,283 Sincere Navigation 84 0.01
188,944 President Chain Store 1,547 0.12 14,019 Single Well Industrial 8 -
467,546 President Securities 176 0.01 37,000 Sinher Technology 43 -
234,000 Primax Electronics 308 0.02 18,104 Sinmag Equipment 44 -
626,737 Prince Housing & Development 174 0.01 25,211 Sino American Electronic* - -
100,000 Princeton Technology 17 - 256,000 Sino-American Silicon Products 671 0.05
10,000 Pro Hawk 46 - 293,000 Sinon 146 0.01
68,000 Promate Electronic 64 0.01 2,352,492 SinoPac Financial 704 0.06
62,173 Prosperity Dielectrics 92 0.01 72,524 Sinphar Pharmaceutical 67 0.01
785,834 Qisda 382 0.03 151,611 Sinyi Realty 113 0.01
36,000 QST International 48 - 70,400 Sirtec International 57 0.01
51,364 Qualipoly Chemical 39 - 50,000 Sitronix Technology 212 0.02
25,000 Quang Viet Enterprise 94 0.01 109,000 Siward Crystal Technology 61 0.01
697,679 Quanta Computer 1,363 0.11 43,000 Soft-World International 138 0.01
89,000 Quanta Storage 83 0.01 202,035 Solar Applied Materials Technology 209 0.02
143,334 Quintain Steel 32 - 61,000 Solomon Technology 33 -
Dimensional Fund Advisors Ltd. Interim Report and Financial Statements, 30 June 2020 61

Emerging Markets Core Equity Fund
Portfolio Statement (continued)as at 30 June 2020
Holding Investment
Fair
Value
£'000
Percentage
of total
net assets
% Holding Investment
Fair
Value
£'000
Percentage
of total
net assets
%
Taiwan (continued) Taiwan (continued)
34,340 Solteam 24 - 139,110 Taiwan Paiho 247 0.02
80,000 Sonix Technology 125 0.01 160,092 Taiwan PCB Techvest 154 0.01
63,000 Southeast Cement 28 - 77,000 Taiwan Prosperity Chemical 14 -
31,000 Speed Tech 70 0.01 86,904 Taiwan Sakura 113 0.01
42,410 Spirox 35 - 61,100 Taiwan Sanyo Electric 58 0.01
28,754 Sporton International 187 0.02 119,855 Taiwan Secom 288 0.02
22,000 St Shine Optical 214 0.02 140,000 Taiwan Semiconductor 155 0.01
48,000 Standard Chemical & Pharmaceutical 59 0.01 4,865,391 Taiwan Semiconductor Manufacturing 41,941 3.30
157,430 Standard Foods 274 0.02 142,670 Taiwan Shin Kong Security 146 0.01
48,800 Stark Technology 89 0.01 11,000 Taiwan Steel Union 19 -
68,000 Sun Yad Construction 23 - 171,408 Taiwan Styrene Monomer 78 0.01
68,000 Sunko INK 18 - 116,011 Taiwan Surface Mounting Technology 415 0.03
29,000 Sunny Friend Environmental Technology 206 0.02 390,061 Taiwan TEA 171 0.01
92,000 Sunonwealth Electric Machine Industry 130 0.01 93,000 Taiwan Union Technology 367 0.03
268,895 Sunplus Technology 90 0.01 48,904 Taiyen Biotech 42 -
77,356 Sunrex Technology 85 0.01 479,513 Tatung 278 0.02
61,000 Sunspring Metal 35 - 51,912 TCI 392 0.03
198,785 Supreme Electronics 163 0.01 44,620 Te Chang Construction 37 -
19,000 Swancor 45 - 743,000 Teco Electric and Machinery 554 0.04
94,064 Sweeten Real Estate Development 56 0.01 7,700 Tehmag Foods 46 -
10,324 Symtek Automation Asia 17 - 33,000 Tera Autotech 25 -
75,250 Syncmold Enterprise 168 0.01 95,537 Test Research 143 0.01
37,594 Synmosa Biopharma 28 - 145,921 Test Rite International 84 0.01
370,740 Synnex Technology International 425 0.03 60,000 Tex-Ray Industrial 46 -
43,140 Sysage Technology 48 - 29,000 Thinking Electronic Industrial 70 0.01
45,000 Systex 101 0.01 65,200 Thye Ming Industrial 54 0.01
53,558 T3EX Global 40 - 517,800 Ton Yi Industrial 131 0.01
415,486 TA Chen Stainless Pipe 310 0.03 89,143 Tong Hsing Electronic Industries 342 0.03
27,000 Ta Liang Technology 31 - 189,199 Tong Yang Industry 190 0.02
373,820 Ta Ya Electric Wire & Cable 112 0.01 130,152 Tong-Tai Machine & Tool 47 -
18,000 Ta Yih Industrial 30 - 50,880 TOPBI International 73 0.01
60,300 Tah Hsin Industrial 86 0.01 70,544 Topco Scientific 212 0.02
75,013 TA-I Technology 157 0.01 19,122 Topco Technologies 33 -
59,374 Tai Tung Communication 32 - 47,000 Topkey 185 0.02
1,380,699 Taichung Commercial Bank 444 0.04 86,272 Topoint Technology 54 0.01
16,826 TaiDoc Technology 127 0.01 43,000 Toung Loong Textile Manufacturing 33 -
94,660 Taiflex Scientific 128 0.01 208,000 TPK 266 0.02
38,482 Taimide Tech 42 - 15,000 Trade-Van Information Services 21 -
72,000 Tainan Enterprises 40 - 75,623 Transcend Information 150 0.01
631,484 Tainan Spinning 198 0.02 233,730 Tripod Technology 840 0.07
75,726 Tainergy Tech 34 - 35,000 Tsang Yow Industrial 15 -
7,000 Tainet Communication System 9 - 64,000 Tsann Kuen Enterprise 34 -
49,000 Tai-Saw Technology 28 - 13,750 TSC Auto ID Technology 72 0.01
3,074,549 Taishin Financial 1,132 0.09 164,901 TSEC 33 -
19,000 TaiSol Electronics 47 - 258,148 TSRC 122 0.01
98,000 Taisun Enterprise 63 0.01 20,000 Ttet Union 67 0.01
93,840 Taita Chemical 38 - 4,000 TTFB 28 -
2,065,916 Taiwan Business Bank 615 0.05 75,368 TTY Biopharm 158 0.01
2,114,026 Taiwan Cement 2,491 0.20 483,216 Tung Ho Steel Enterprise 298 0.02
61,203 Taiwan Chinsan Electronic Industrial 60 0.01 30,000 Tung Thih Electronic 45 -
140,020 Taiwan Cogeneration 152 0.01 25,847 TURVO International 45 -
1,967,016 Taiwan Cooperative Financial 1,125 0.09 122,968 TXC 215 0.02
17,000 Taiwan FamilyMart 112 0.01 110,321 TYC Brother Industrial 74 0.01
287,000 Taiwan Fertilizer 394 0.03 288,257 Tycoons Group Enterprise 32 -
137,000 Taiwan Fire & Marine Insurance 74 0.01 144,837 Tyntek 54 0.01
100,000 Taiwan FU Hsing Industrial 108 0.01 39,000 UDE 29 -
655,213 Taiwan Glass Industry 180 0.01 30,000 Ultra Chip 20 -
389,000 Taiwan High Speed Rail 392 0.03 259,000 U-Ming Marine Transport 224 0.02
193,890 Taiwan Hon Chuan Enterprise 293 0.02 492,590 Unimicron Technology 680 0.05
67,000 Taiwan Hopax Chemicals Manufacturing 40 - 965,821 Union Bank Of Taiwan 297 0.02
428,061 Taiwan Land Development 84 0 850,717 Uni-President Enterprises 1,674 0.13
12,345 Taiwan Line Tek Electronic 9 0 59,000 Unitech Computer 42 -
30,000 Taiwan Mask 23 0 361,715 Unitech Printed Circuit Board 256 0.02
332,300 Taiwan Mobile 1,009 0.08 74,200 United Integrated Services 411 0.03
128,000 Taiwan Navigation 59 0.01 4,122,893 United Microelectronics 1,801 0.14
7,030 Taiwan Optical Platform 24 - 33,924 United Orthopedic 35 -
Dimensional Fund Advisors Ltd. Interim Report and Financial Statements, 30 June 2020 62

Emerging Markets Core Equity Fund
Portfolio Statement (continued)as at 30 June 2020
Holding Investment
Fair
Value
£'000
Percentage
of total
net assets
% Holding Investment
Fair
Value
£'000
Percentage
of total
net assets
%
Taiwan (continued) Taiwan (continued)
28,000 United Radiant Technology 11 - 27,000 Yuanta Futures 40 -
1,223,628 United Renewable Energy 220 0.02 13,000 Yuen Chang Stainless Steel 5 -
287,622 Unity Opto Technology* 33 - 88,700 Yulon Finance 266 0.02
44,000 Univacco Technology 28 - 510,875 Yulon Motor 303 0.02
207,225 Universal Cement 103 0.01 28,000 Yung Chi Paint & Varnish
14,680 Universal Microwave Technology 35 - Manufacturing 53 -
135,705 Unizyx 70 0.01 47,600 Yungshin Construction & Development 43 -
467,593 UPC Technology 129 0.01 97,900 YungShin Global 133 0.01
4,399 Userjoy Technology 11 - 14,000 Yungtay Engineering 22 -
484,211 USI 164 0.01 34,577 Zeng Hsing Industrial 133 0.01
27,300 Usun Technology 29 - 95,000 Zenitron 51 -
22,000 Utechzone 29 - 57,000 Zero One Technology 62 0.01
391,000 Vanguard International Semiconductor 841 0.07 271,100 Zhen Ding Technology 959 0.08
59,000 Ve Wong 48 - 239,479 Zig Sheng Industrial 47 -
11,000 VHQ Media 21 - 180,084 Zinwell 100 0.01
82,159 Victory New Materials 23 - 58,000 Zippy Technology 53 -
64,525 Visual Photonics Epitaxy 162 0.01 42,095 ZongTai Real Estate Development 42 -
4,202 Vivotek 9 - 214,484 16.86
29,497 Voltronic Power Technology 688 0.05
277,238 Wafer Works 256 0.02 Thailand 2.69% (3.11%)
42,000 Waffer Technology 15 -
39,270 Wah Hong Industrial 28 - 166,700 AAPICO Hitech NVDR 37 -
116,000 Wah Lee Industrial 181 0.01 207,400 Advanced Info Service 1,012 0.08
1,043,849 Walsin Lihwa 417 0.03 101,600 Advanced Information Technology 46 -
161,181 Walsin Technology 795 0.06 31,400 AEON Thana Sinsap Thailand 89 0.01
155,000 Walton Advanced Engineering 42 - 13,000 AEON Thana Sinsap Thailand NVDR 37 -
407,612 Wan Hai Lines 184 0.02 153,600 After You 39 -
90,000 We & Win Development 24 - 450,200 Airports of Thailand 718 0.06
177,000 Wei Chuan Foods 112 0.01 59,700 AJ Plast 21 -
201,535 Weikeng Industrial 85 0.01 23,400 Allianz Ayudhya Capital 22 -
53,000 Well Shin Technology 68 0.01 402,100 Amata 162 0.01
42,000 Weltrend Semiconductor 32 - 490,000 Ananda Development 21 -
31,000 Wha Yu Industrial 13 - 1,128,742 AP Thailand 174 0.01
24,000 Wholetech System Hitech 19 - 1,649,900 Asia Aviation NVDR 86 0.01
71,697 Win Semiconductors 592 0.05 1,118,000 Asia Plus 49 -
1,478,513 Winbond Electronics 543 0.04 109,100 Asia Sermkij Leasing NVDR 48 -
18,000 Winmate 30 - 139,440 Asian Insulators 5 -
37,000 Winstek Semiconductor 25 - 196,000 B Grimm Power 276 0.02
345,330 Wintek* 3 - 473,900 Bangchak 262 0.02
132,753 Wisdom Marine Lines 91 0.01 479,200 Bangkok Airways 79 0.01
1,529,371 Wistron 1,510 0.12 88,750 Bangkok Aviation Fuel Services 54 0.01
130,963 Wistron NeWeb 232 0.02 43,800 Bangkok Bank 124 0.01
66,000 Wonderful Hi-Tech 28 - 33,400 Bangkok Bank NVDR 94 0.01
58,000 Wowprime 129 0.01 391,650 Bangkok Chain Hospital 154 0.01
740,586 WPG 802 0.06 1,516,300 Bangkok Dusit Medical Services 896 0.07
192,724 WT Microelectronics 210 0.02 2,591,820 Bangkok Expressway & Metro 649 0.05
64,745 WUS Printed Circuit 57 0.01 9,040 Bangkok Insurance 66 0.01
40,000 XAC Automation 29 - 6,931,200 Bangkok Land 186 0.02
60,000 XinTec 186 0.02 207,320 Bangkok Life Assurance NVDR 85 0.01
62,266 Xxentria Technology Materials 94 0.01 593,300 Bangkok Ranch 31 -
110,135 Yageo 1,153 0.09 1,762,440 Banpu 281 0.02
1,125,750 Yang Ming Marine Transport 201 0.02 209,600 Banpu Power 92 0.01
171,100 YC INOX 117 0.01 1,239,300 Beauty Community 50 -
28,000 YCC Parts Manufacturing 34 - 691,100 BEC World 90 0.01
97,350 Yea Shin International Development 40 - 241,400 Berli Jucker 251 0.02
270,779 Yem Chio 84 0.01 1,928,900 Better World Green 25 -
41,621 Yeong Guan Energy Technology 69 0.01 287,900 Brooker 3 -
58,000 YFC-Boneagle Electric 32 - 522,700 BTS 156 0.01
825,738 YFY 313 0.03 145,700 Bumrungrad Hospital 448 0.04
103,086 Yi Jinn Industrial 36 - 132,120 Buriram Sugar 10 -
610,975 Yieh Phui Enterprise 145 0.01 2,307,814 Cal-Comp Electronics Thailand 89 0.01
44,550 Yonyu Plastics 41 - 90,200 Carabao 246 0.02
68,899 Young Fast Optoelectronics 38 - 397,300 Central Pattana 511 0.04
9,000 Young Optics 16 - 186,000 Central Plaza Hotel 113 0.01
84,336 Youngtek Electronics 152 0.01 59,533 Central Retail 51 0.01
2,942,739 Yuanta Financial 1,414 0.11 446,400 CH Karnchang 234 0.02
Dimensional Fund Advisors Ltd. Interim Report and Financial Statements, 30 June 2020 63

Emerging Markets Core Equity Fund
Portfolio Statement (continued)as at 30 June 2020
Holding Investment
Fair
Value
£'000
Percentage
of total
net assets
% Holding Investment
Fair
Value
£'000
Percentage
of total
net assets
%
Thailand (continued) Thailand (continued)
1,107,160 Charoen Pokphand Foods 920 0.07 132,600 Mega Lifesciences 128 0.01
30,400 Charoong Thai Wire & Cable 4 - 450,453 Millcon Steel 8 -
1,470,200 Chularat Hospital 95 0.01 597,191 Minor International 318 0.03
858,000 CIMB Thai Bank 14 - 72,828 Minor International Rights - -
324,500 CK Power 35 - 110,200 MK Restaurants 170 0.01
154,500 COL 57 0.01 132,000 Modernform 9 -
246,500 Com7 184 0.02 694,700 Mono Technology 50 -
828,500 Communication & System Solution 29 - 230,400 Muangthai Capital 316 0.03
728,600 Country 14 - 415,600 Namyong Terminal 32 -
2,279,300 Country Group Development 35 - 487,500 Nava Nakorn 24 -
966,000 CP ALL 1,719 0.14 1,189,500 Nawarat Patanakarn 19 -
26,800 Delta Electronics Thailand 38 - 56,800 Netbay 52 0.01
406,000 Demco 35 - 94,600 Noble Development 27 -
261,100 Dhipaya Insurance 154 0.01 1,683,800 Nusasiri 15 -
49,200 Do Day Dream 21 - 413,100 Origin Property 59 0.01
86,200 Dusit Thani 17 - 28,800 Osotspa 29 -
1,361,000 Dynasty Ceramic 72 0.01 103,700 PCS Machine 12 -
365,700 Eastern Polymer 46 - 718,500 Plan B Media 113 0.01
378,100 Eastern Power 36 - 363,500 Platinum 29 -
259,900 Eastern Water Resources Development 357,100 Polyplex Thailand 155 0.01
and Management 69 0.01 539,550 Precious Shipping 78 0.01
50,000 Electricity Generating 326 0.03 164,200 Premier Marketing 30 -
343,200 Energy Absolute 355 0.03 312,800 Prima Marine 64 0.01
443,700 Erawan 44 - 383,000 Principal Capital 36 -
345,200 Esso Thailand 64 0.01 2,937,880 Property Perfect 32 -
366,900 Forth 58 0.01 394,500 Pruksa 120 0.01
202,200 Forth Smart Service 33 - 378,600 PTG Energy 162 0.01
498,200 Fortune Parts Industry 24 - 2,487,510 PTT 2,460 0.19
374,900 GFPT 128 0.01 566,213 PTT Exploration & Production 1,370 0.11
83,900 Global Green Chemicals 20 - 450,575 PTT Global Chemical 549 0.04
143,186 Global Power Synergy 277 0.02 265,600 Pylon 29 -
541,400 Group Lease NVDR 54 0.01 4,458,842 Quality Houses 261 0.02
1,784,560 Gunkul Engineering 122 0.01 1,111,700 Raimon Land 19 -
46,700 Haad Thip 22 - 104,500 Rajthanee Hospital 58 0.01
233,000 Hana Microelectronics 169 0.01 144,900 Ratch 238 0.02
1,771,779 Home Product Center 715 0.06 17,200 Ratch NVDR 28 -
261,800 Ichitan 56 0.01 676,796 Ratchthani Leasing 64 0.01
522,900 Indorama Ventures 379 0.03 294,200 Regional Container Lines 25 -
370,050 Interlink Communication 35 - 336,168 Rojana Industrial Park 39 -
108,800 Intouch NVDR 161 0.01 171,300 RS 73 0.01
4,406,910 IRPC 304 0.02 139,600 S 11 19 -
2,968,426 Italian-Thai Development 89 0.01 80,900 Sabina 39 -
1,446,900 Jasmine International 137 0.01 99,100 Saha Pathana Inter-Holding 161 0.01
44,200 Jubilee Enterprise 18 - 912,100 Sahakol Equipment 49 -
200 Kang Yong Electric 2 - 166,900 Sahamitr Pressure Container 37 -
469,833 Karmarts 37 - 71,800 Saha-Union 67 0.01
283,500 Kasikornbank NVDR 697 0.06 278,200 Samart 42 -
255,200 KCE Electronics 153 0.01 191,000 Samart Telcoms 31 -
1,170,600 KGI Securities Thailand 107 0.01 1,300 Samitivej 14 -
986,440 Khon Kaen Sugar Industry 52 0.01 5,152,600 Sansiri 103 0.01
39,000 Khonburi Sugar 3 - 70,100 Sappe 35 -
90,100 Kiatnakin Bank 95 0.01 1,398,521 SC Asset 80 0.01
691,000 Krung Thai Bank 188 0.02 318,260 SEAFCO 47 -
287,100 Krungthai Card 227 0.02 666,916 Sena Development 44 -
238,900 Lalin Property 27 - 207,000 Sermsang Power 40 -
92,100 Lam Soon Thailand 11 - 1,621,900 Seven Utilities and Power 17 -
985,600 Land & Houses 198 0.02 83,000 Siam Cement 805 0.06
287,280 Land & Houses NVDR 58 0.01 37,000 Siam Cement NVDR 359 0.03
91,800 Lanna Resources 17 - 30,517 Siam City Cement 104 0.01
2,700,708 LH Financial 73 0.01 132,500 Siam Commercial Bank 253 0.02
888,935 Loxley 34 - 562,087 Siam Future Development 68 0.01
889,300 LPN Development 105 0.01 531,256 Siam Global House 233 0.02
341,100 Major Cineplex 135 0.01 274,800 Siam Wellness 49 -
560,300 MBK 204 0.02 475,100 Siamgas & Petrochemicals 106 0.01
93,100 MCOT 13 - 1,458,700 Singha Estate 61 0.01
170,100 MCS Steel 53 0.01 431,200 Sino-Thai Engineering & Construction 173 0.01
Dimensional Fund Advisors Ltd. Interim Report and Financial Statements, 30 June 2020 64

Emerging Markets Core Equity Fund
Portfolio Statement (continued)as at 30 June 2020
Holding Investment
Fair
Value
£'000
Percentage
of total
net assets
% Holding Investment
Fair
Value
£'000
Percentage
of total
net assets
%
Thailand (continued) Thailand (continued)
147,000 SNC Former 34 - 96,480 Workpoint Entertainment 28 -
235,475 Somboon Advance Technology 66 0.01 34,170 2.69
150,800 Southern Concrete Pile 21 -
316,100 SPCG 135 0.01 Turkey 0.82% (0.85%)
232,060 Sri Trang Agro-Industry 167 0.01
273,705 Srisawad 372 0.03 89,783 Adese Alisveris Merkezleri Ticaret 21 -
801,000 Srithai Superware 15 - 407,474 Akbank T.A.S. 297 0.02
206,400 Srivichai Vejvivat 35 - 53,244 AKIS Gayrimenkul Yatirimi 20 -
900,200 Star Petroleum Refining 158 0.01 4,269 Akmerkez Gayrimenkul Yatirim
448,000 STP & I 51 - Ortakligi 18 -
1,065,075 Supalai 469 0.04 65,002 Aksa Akrilik Kimya Sanayii 56 0.01
8,291,700 Super Energy 206 0.02 128,387 Aksa Enerji Uretim 83 0.01
423,200 Susco 27 - 60,308 Aksigorta 49 0.01
746,300 Syntec Construction 30 - 61,388 Alarko 41 -
155,200 TAC Consumer 19 - 13,955 Alarko Gayrimenkul Yatirim Ortakligi 25 -
219,800 Taokaenoi Food & Marketing 60 0.01 325,954 Albaraka Turk Katilim Bankasi 64 0.01
116,200 Tapaco 12 - 26,475 Alkim Alkali Kimya 42 -
58,100 Tapaco - Warrants 18/03/2022 1 - 81,210 Anadolu Anonim Turk Sigorta Sirketi 60 0.01
2,341,600 Tata Steel Thailand 22 - 149,528 Anadolu Cam Sanayii 83 0.01
321,700 Thai Agro Energy 23 - 70,348 Anadolu Efes Biracilik Ve Malt
351,000 Thai Airways International 35 - Sanayii 179 0.02
76,400 Thai Central Chemical 40 - 44,436 Anadolu Hayat Emeklilik 39 -
40,500 Thai Nakarin Hospital 35 - 59,268 Arcelik 140 0.01
409,700 Thai Oil 478 0.04 11,946 Aselsan Elektronik Sanayi Ve Ticaret 46 -
1,900 Thai President Foods 10 - 15,433 AvivaSA Emeklilik ve Hayat 27 -
600 Thai Rayon - - 28,796 Aygaz 41 -
20,200 Thai Rayon NVDR 14 - 14,791 Bagfas Bandirma Gubre Fabrikalari 30 -
538,300 Thai Reinsurance 12 - 195,514 Bera 101 0.01
379,506 Thai Solar Energy 29 - 66,177 Besiktas Futbol Yatirimlari Sanayi
16,900 Thai Stanley Electric 76 0.01 ve Ticaret 24 -
705,556 Thai Union 240 0.02 99,383 BIM Birlesik Magazalar 803 0.06
221,400 Thai Vegetable Oil 153 0.01 8,518 Bizim Toptan Satis Magazalari 20 -
164,100 Thai Wah 17 - 15,604 Borusan Mannesmann Boru Sanayi ve
463,500 Thaicom 57 0.01 Ticaret 22 -
279,900 Thaifoods 36 - 4,250 Borusan Yatirim ve Pazarlama 35 -
274,700 Thaire Life Assurance 19 - 14,220 Brisa Bridgestone Sabanci Sanayi ve
72,400 Thanachart Capital 67 0.01 Ticaret 21 -
103,000 Thitikorn 20 - 25,039 Bursa Cimento Fabrikasi 13 -
644,100 Thoresen Thai Agencies 54 0.01 18,683 Cimsa Cimento Sanayi VE Ticaret 22 -
208,000 Tipco Asphalt NVDR 137 0.01 34,873 Coca-Cola Icecek 182 0.01
181,600 TIPCO Foods 34 - 16,421 Deva 38 -
66,500 Tisco Financial 122 0.01 382,673 Dogan Sirketler Grubu 93 0.01
208,600 TKS Technologies 27 - 12,581 Dogus Otomotiv Servis ve Ticaret 24 -
5,287,791 TMB Bank 146 0.01 513 EGE Endustri VE Ticaret 38 -
102,000 TMT Steel 11 - 122,255 EIS Eczacibasi Ilac ve Sinai ve
151,200 TOA Paint Thailand 146 0.01 Finansal Yatirimlar Sanayi ve Ticaret 89 0.01
339,400 Total Access Communication NVDR 351 0.03 653,579 Emlak Konut Gayrimenkul Yatirim
98,200 TPC Power 30 - Ortakligi 152 0.01
3,259,190 TPI Polene 102 0.01 43,432 Enerjisa Enerji 44 -
863,600 TPI Polene Power 92 0.01 139,108 Enka Insaat ve Sanayi 103 0.01
7,306,487 True 655 0.05 8,613 Erbosan Erciyas Boru Sanayii ve
216,300 TTCL 17 - Ticaret 22 -
28,260 TTCL NVDR 2 - 434,961 Eregli Demir ve Celik Fabrikalari 445 0.03
481,800 TTW 168 0.01 14,190 Fenerbahce Futbol 21 -
1,074,634 U City 41 - 20,607 Ford Otomotiv Sanayi 175 0.01
100,200 Union Auction 21 - 46,172 Global Yatirim 22 -
503,890 Unique Engineering & Construction 69 0.01 46,440 Goodyear Lastikleri 30 -
168,800 United Paper 50 0.01 77,459 Gozde Girisim Sermayesi Yatirim
55,300 Univanich Palm Oil 6 - Ortakligi 44 -
500,400 Univentures 40 - 181,210 GSD 44 -
275,160 Vanachai 23 - 52,095 Gubre Fabrikalari 175 0.01
39,308 Vanachai Rights - - 72,147 Hektas Ticaret 122 0.01
389,836 VGI 77 0.01 242,154 Ihlas 25 -
147,200 Vinythai 86 0.01 50,280 Ipek Dogal Enerji Kaynaklari
1,698,100 WHA 149 0.01 Arastirma Ve Uretim 82 0.01
369,400 WHA Utilities and Power 44 - 42,484 Is Finansal Kiralama 22 -
Dimensional Fund Advisors Ltd. Interim Report and Financial Statements, 30 June 2020 65

Emerging Markets Core Equity Fund
Portfolio Statement (continued)as at 30 June 2020
Holding Investment
Fair
Value
£'000
Percentage
of total
net assets
% Holding Investment
Fair
Value
£'000
Percentage
of total
net assets
%
Turkey (continued) United Arab Emirates (continued)
240,463 Is Gayrimenkul Yatirim Ortakligi 55 0.01 125,866 Amlak Finance 8 -
72,673 Is Yatirim Menkul Degerler 54 0.01 213,764 Arabtec 28 -
64,877 Kardemir Karabuk Demir Celik Sanayi 26,152 Aramex 20 -
ve Ticaret 'A' 32 - 608,476 Deyaar Development 37 0.01
293,150 Kardemir Karabuk Demir Celik Sanayi 90,000 Dubai Financial Market 17 -
ve Ticaret 'D' 113 0.01 40,000 Dubai Investments 10 -
223 Kartonsan Karton Sanayi ve Ticaret 12 - 297,184 Dubai Islamic Bank 252 0.02
17,035 Kerevitas Gida Sanayi ve Ticaret 9 - 889,176 DXB Entertainments 25 -
40,489 KOC 85 0.01 67,303 Emaar Development 31 -
56,810 Kordsa Teknik Tekstil 84 0.01 100,000 Emaar Malls 30 -
17,603 Koza Altin Isletmeleri 172 0.01 158,785 Emirates Telecommunications 581 0.05
97,714 Koza Anadolu Metal Madencilik 96,230 First Abu Dhabi Bank 240 0.02
Isletmeleri 156 0.01 1,545 0.12
6,368 Logo Yazilim Sanayi Ve Ticaret 59 0.01
15,328 Mavi Giyim Sanayi Ve Ticaret 87 0.01 Portfolio of investments 99.66% (99.96%) 1,267,407 99.66
31,110 Migros Ticaret 144 0.01 Net other assets 4,359 0.34
33,191 MLP Saglik Hizmetleri 79 0.01 Net assets 1,271,766 100.00
65,976 NET 19 -
13,526 Netas Telekomunikasyon 23 - Comparative figures shown in brackets next to each country heading relate to 31 December 2019.
20,469 Nuh Cimento Sanayi 37 -
196,434 ODAS Elektrik Uretim ve Sanayi
Ticaret 59 0.01 * Delisted and unquoted securities are held at the ACD's valuation.
4,409 Otokar Otomotiv Ve Savunma Sanayi 79 0.01
26,600 Panora Gayrimenkul Yatirim Ortakligi 17 -
27,268 Pegasus Hava Tasimaciligi 175 0.02
282,505 Petkim Petrokimya 143 0.01
11,384 Polisan 4 -
54,765 Sarkuysan Elektrolitik Bakir Sanayi
ve Ticaret 45 -
19,478 Sasa Polyester Sanayi 25 -
162,785 Sekerbank Turk 28 -
68,494 Selcuk Ecza Deposu Ticaret ve Sanayi 72 0.01
223,265 Soda Sanayii 162 0.01
21,492 Tat Gida Sanayi 26 -
78,270 TAV Havalimanlari 178 0.02
99,055 Tekfen 201 0.02
63,018 Tofas Turk Otomobil Fabrikasi 189 0.02
56,053 Torunlar Gayrimenkul Yatirim
Ortakligi 21 -
298,453 Trakya Cam Sanayii 127 0.01
11,398 Tupras Turkiye Petrol Rafinerileri 122 0.01
58,890 Turcas Petrol 23 -
252,518 Turk Hava Yollari 375 0.03
193,347 Turk Telekomunikasyon 186 0.02
2,608 Turk Traktor ve Ziraat Makineleri 25 -
322,525 Turkcell Iletisim Hizmetleri 632 0.05
414,035 Turkiye Garanti Bankasi 422 0.03
349,372 Turkiye Halk Bankasi 271 0.02
202,630 Turkiye Is Bankasi 135 0.01
875,537 Turkiye Sinai Kalkinma Bankasi 136 0.01
183,057 Turkiye Sise ve Cam Fabrikalari 120 0.01
289,683 Turkiye Vakiflar Bankasi 185 0.02
68,656 Ulker Biskuvi Sanayi 197 0.02
1 Vakif Gayrimenkul Yatirim Ortakligi - -
30,705 Vestel Elektronik Sanayi ve Ticaret 60 0.01
559,262 Yapi ve Kredi Bankasi 162 0.01
70,113 Yatas Yatak ve Yorgan Sanayi ve
Ticaret 71 0.01
40,504 Yeni Gimat Gayrimenkul Ortakligi 57 0.01
107,512 Zorlu Enerji Elektrik Uretim 27 -
10,391 0.82
United Arab Emirates 0.12% (0.00%)
173,182 Abu Dhabi Islamic Bank 141 0.01
462,661 Air Arabia 125 0.01
Securities are admitted to an official stock exchange listing or traded on another regulated market unless otherwise
stated, if any.
Dimensional Fund Advisors Ltd. Interim Report and Financial Statements, 30 June 2020 66

Global Short-Dated Bond Fund
Portfolio Statementas at 30 June 2020
Holding Investment
FairValue£'000
Percentageof total
net assets% Holding Investment
FairValue£'000
Percentageof total
net assets%
Australia 3.48% (1.32%) Belgium (continued)
AUD 4,000,000 Australia & New Zealand Banking EUR 38,000,000 Kingdom of Belgium Treasury Bill 0%3.25% 07/04/2021 2,281 0.05 10/09/2020 34,748 0.71
AUD 7,000,000 Australia & New Zealand Banking FRN 71,238 1.45
07/04/2021 3,936 0.08 AUD 4,000,000 Australia & New Zealand Banking FRN Canada 18.99% (18.39%)
16/08/2021 2,254 0.05 AUD 3,500,000 Australia & New Zealand Banking FRN EUR 8,400,000 Bank of Montreal 0.25% 17/11/2021 7,688 0.16
07/03/2022 1,975 0.04 GBP 500,000 Bank of Montreal 1.375% 29/12/2021 505 0.01 AUD 6,000,000 Australia & New Zealand Banking FRN CAD 25,000,000 Bank of Montreal 1.61% 28/10/2021 15,057 0.31
18/01/2023 3,376 0.07 CAD 141,815,000 Bank of Montreal 1.88% 31/03/2021 85,393 1.74 AUD 9,000,000 Australia & New Zealand Banking FRN EUR 47,830,000 Bank of Montreal FRN 28/09/2021 43,827 0.89
29/08/2024 5,054 0.10 EUR 11,000,000 Bank of Nova Scotia 0.375% 06/04/2022 10,074 0.21 AUD 13,000,000 Australia & New Zealand Banking FRN GBP 3,000,000 Bank of Nova Scotia 1.25% 08/06/2022 3,029 0.06
16/01/2025 7,292 0.15 USD 25,420,000 Bank of Nova Scotia 2.7% 07/03/2022 21,457 0.44 AUD 10,000,000 Australia Government Bond 5.75% CAD 80,000,000 Bank of Nova Scotia 3.27% 11/01/2021 48,345 0.99
15/05/2021 5,849 0.12 GBP 12,992,000 Bank of Nova Scotia FRN 11/06/2021 12,979 0.27 AUD 40,000,000 Australia Treasury Bill 0% 21/08/2020 22,321 0.46 CAD 125,000,000 Canadian Imperial Bank of CommerceEUR 19,400,000 Commonwealth Bank of Australia 0.5% 1.85% 14/07/2020 74,502 1.52
11/07/2022 17,911 0.36 CAD 25,000,000 Canadian Imperial Bank of CommerceAUD 2,500,000 Commonwealth Bank of Australia FRN 1.9% 26/04/2021 15,049 0.31
25/04/2023 1,408 0.03 GBP 10,000,000 Export Development Canada FRNEUR 11,660,000 National Australia Bank 0.35% 15/11/2021 9,995 0.20
07/09/2022 10,741 0.22 GBP 26,073,000 Export Development Canada FRNEUR 7,998,000 National Australia Bank 0.875% 31/01/2022 26,077 0.53
20/01/2022 7,409 0.15 GBP 82,568,000 Export Development Canada FRNAUD 2,000,000 National Australia Bank 3% 12/05/2021 1,141 0.02 29/05/2024 82,408 1.68
AUD 500,000 National Australia Bank FRN GBP 12,033,000 Export Development Canada FRN21/10/2021 282 0.01 17/01/2025 11,998 0.24
AUD 1,000,000 National Australia Bank FRN CAD 49,000,000 Province of Alberta Canada 1.35%16/05/2023 564 0.01 01/09/2021 29,519 0.60
AUD 13,500,000 National Australia Bank FRN GBP 5,000,000 Province of Manitoba Canada 1.5%26/09/2023 7,629 0.16 15/12/2022 5,132 0.10
AUD 10,000,000 National Australia Bank FRN EUR 727,000 Province of Ontario Canada 3%19/06/2024 5,645 0.12 28/09/2020 669 0.01
AUD 10,000,000 National Australia Bank FRN CAD 43,250,000 Province of Ontario Canada 3.15%21/01/2025 5,614 0.11 02/06/2022 27,103 0.55
AUD 3,000,000 Queensland Treasury 5.5% 21/06/2021 1,759 0.03 GBP 8,248,000 Province of Ontario Canada FRNEUR 14,774,000 Toyota Finance Australia 0% 10/11/2020 8,250 0.17
09/04/2021 13,469 0.27 CAD 66,000,000 Province of Ontario Canada FRNEUR 14,600,000 Toyota Finance Australia 0.25% 27/10/2021 39,531 0.81
09/04/2024 13,298 0.27 GBP 8,391,000 Province of Quebec Canada 0.875%EUR 1,000,000 Toyota Finance Australia 0.5% 24/05/2022 8,466 0.17
06/04/2023 918 0.02 GBP 1,010,000 Province of Quebec Canada 1.5%EUR 10,500,000 Westpac Banking 0.25% 17/01/2022 9,626 0.20 15/12/2023 1,046 0.02
AUD 2,500,000 Westpac Banking FRN 07/02/2022 1,412 0.03 CAD 11,400,000 Province of Quebec Canada 4.25%AUD 8,000,000 Westpac Banking FRN 16/11/2023 4,525 0.09 01/12/2021 7,162 0.15 AUD 9,500,000 Westpac Banking FRN 24/04/2024 5,408 0.11 CAD 32,000,000 Province of Quebec Canada 4.5%
AUD 13,000,000 Westpac Banking FRN 16/08/2024 7,333 0.15 01/12/2020 19,397 0.40 170,430 3.48 CAD 33,000,000 Royal Bank of Canada 1.92% 17/07/2020 19,670 0.40
CAD 91,274,000 Royal Bank of Canada 1.968%Austria 2.48% (0.06%) 02/03/2022 55,306 1.13
CAD 21,500,000 Royal Bank of Canada 2% 21/03/2022 13,045 0.27 EUR 3,315,000 Autobahnen- und Schnell- CAD 40,600,000 Royal Bank of Canada 2.03% 15/03/2021 24,426 0.50
strassen-Finanzierungs 1.375% 09/04/2021 3,069 0.06 CAD 10,000,000 Royal Bank of Canada 2.86% 04/03/2021 6,047 0.12 EUR 1,300,000 KA Finanz 0.375% 11/08/2020 1,188 0.02 EUR 26,467,000 Royal Bank of Canada FRN 24/07/2020 24,187 0.49
EUR 800,000 OeBB-Infrastruktur 3.5% 19/10/2020 739 0.02 EUR 7,000,000 Royal Bank of Canada FRN 19/01/2021 6,408 0.13 GBP 1,000,000 Oesterreichische Kontrollbank 1.125% EUR 200,000 Toronto-Dominion Bank 0.625%
15/12/2022 1,022 0.02 08/03/2021 183 - USD 141,800,000 Oesterreichische Kontrollbank FRN EUR 3,023,000 Toronto-Dominion Bank 0.625%
22/11/2021 115,534 2.36 20/07/2023 2,814 0.06 121,552 2.48 CAD 128,300,000 Toronto-Dominion Bank 1.994%
23/03/2022 77,843 1.59 Belgium 1.45% (0.61%) CAD 29,533,000 Toronto-Dominion Bank 2.621%
22/12/2021 18,051 0.37 EUR 17,297,000 Euroclear Bank FRN 10/07/2020 15,801 0.32 CAD 13,000,000 Toronto-Dominion Bank 3.005%EUR 22,629,000 Euroclear Bank FRN 08/03/2021 20,689 0.42 30/05/2023 8,183 0.17
Dimensional Fund Advisors Ltd. Interim Report and Financial Statements, 30 June 2020 67

Global Short-Dated Bond Fund
Portfolio Statement (continued)as at 30 June 2020
Holding Investment
FairValue£'000
Percentageof total
net assets% Holding Investment
FairValue£'000
Percentageof total
net assets%
Canada (continued) France (continued)
EUR 12,011,000 Toronto-Dominion Bank FRN 08/09/2020 10,980 0.22 EUR 2,800,000 Total Capital International 0.25%EUR 14,100,000 Total Capital Canada 1.125% 12/07/2023 2,568 0.05
18/03/2022 13,101 0.27 EUR 6,900,000 Total Capital International 2.125%EUR 26,200,000 Total Capital Canada 0% 09/07/2020 23,937 0.49 15/03/2023 6,641 0.14 CAD 12,000,000 Toyota Credit Canada 2.02% 28/02/2022 7,263 0.15 GBP 5,721,000 Total Capital International 2.25%
CAD 7,000,000 Toyota Credit Canada 2.35% 18/07/2022 4,264 0.09 17/12/2020 5,764 0.12 930,366 18.99 USD 4,347,000 Total Capital International 2.875%
17/02/2022 3,678 0.07 Denmark 2.43% (4.15%) EUR 8,000,000 UNEDIC ASSEO 0% 25/11/2020 7,317 0.15
EUR 5,000,000 UNEDIC ASSEO 0.25% 24/11/2023 4,656 0.10 EUR 14,678,000 Kommunekredit 0% 08/09/2022 13,514 0.27 EUR 29,000,000 UNEDIC ASSEO 0.875% 25/10/2022 27,217 0.56 EUR 68,521,000 Kommunekredit 0.125% 28/08/2023 63,573 1.30 EUR 500,000 UNEDIC ASSEO 2.25% 05/04/2023 489 0.01 EUR 29,748,000 Kommunekredit 0.25% 29/03/2023 27,661 0.56 627,607 12.81
EUR 12,000,000 Kommunekredit 0.25% 15/05/2023 11,161 0.23 NOK 40,000,000 Kommunekredit 1.435% 11/09/2020 3,357 0.07 Germany 11.00% (10.26%)
119,266 2.43
EUR 5,055,000 Deutsche Bahn Finance 0% 19/07/2021 4,619 0.09 Finland 0.67% (0.35%) EUR 4,754,000 Deutsche Bahn Finance 1.75%
06/11/2020 4,368 0.09 GBP 12,267,000 Kuntarahoitus 0.75% 15/12/2020 12,294 0.25 GBP 2,000,000 Deutsche Bahn Finance 2.75%USD 2,000,000 Kuntarahoitus FRN 26/10/2020 1,631 0.03 20/06/2022 2,085 0.04 EUR 2,900,000 OP Corporate Bank 0.375% 11/10/2022 2,668 0.06 EUR 1,500,000 Deutsche Bahn Finance 4.375%
EUR 17,618,000 OP Corporate Bank 0.75% 03/03/2022 16,282 0.33 23/09/2021 1,444 0.03 32,875 0.67 EUR 1,445,000 Deutsche Bahn Finance FRN 23/07/2020 1,320 0.03
GBP 20,000,000 FMS Wertmanagement 1.125% 07/09/2023 20,554 0.42 France 12.81% (9.99%) GBP 10,700,000 FMS Wertmanagement FRN 14/01/2022 10,704 0.22
EUR 16,410,000 Kreditanstalt fuer Wiederaufbau 0%EUR 25,600,000 Agence Francaise de Developpement 15/09/2023 15,260 0.31
EPIC 0.125% 31/03/2021 23,462 0.48 EUR 18,300,000 Kreditanstalt fuer WiederaufbauEUR 39,000,000 Agence Francaise de Developpement 0.125% 07/11/2023 17,096 0.35
EPIC 0.125% 30/04/2022 35,941 0.73 EUR 21,500,000 Kreditanstalt fuer WiederaufbauEUR 1,100,000 Agence Francaise de Developpement 0.125% 15/01/2024 20,102 0.41
EPIC 2.125% 15/02/2021 1,020 0.02 GBP 10,000,000 Kreditanstalt fuer Wiederaufbau 1%USD 75,000,000 Agence Francaise de Developpement 15/12/2022 10,206 0.21
EPIC FRN 07/06/2021 61,117 1.25 AUD 4,500,000 Kreditanstalt fuer Wiederaufbau 2.8%USD 26,400,000 Agence Francaise de Developpement 17/02/2021 2,550 0.05
EPIC FRN 17/12/2021 21,522 0.44 AUD 8,000,000 Kreditanstalt fuer WiederaufbauEUR 32,000,000 Bpifrance Financement 0.125% 6.25% 19/05/2021 4,695 0.10
25/11/2020 29,280 0.60 EUR 4,400,000 Land Baden-Wuerttemberg FRNEUR 3,700,000 Caisse Centrale du Credit Immobilier 21/10/2020 4,024 0.08
de France 0.125% 01/03/2021 3,388 0.07 EUR 20,500,000 Land Baden-Wuerttemberg FRNEUR 87,400,000 Caisse d'Amortissement de la Dette 19/07/2021 18,865 0.38
Sociale 0.125% 25/11/2022 80,844 1.65 EUR 1,300,000 Land Baden-Wuerttemberg FRNEUR 23,800,000 Caisse d'Amortissement de la Dette 19/10/2021 1,199 0.02
Sociale 0.125% 25/10/2023 22,120 0.45 EUR 3,460,000 Land Berlin 0.25% 15/07/2020 3,161 0.07 EUR 26,000,000 Caisse d'Amortissement de la Dette GBP 15,022,000 Landeskreditbank Baden-Wuerttemberg
Sociale 0.5% 25/05/2023 24,356 0.50 Foerderbank 1.125% 17/05/2021 15,135 0.31 EUR 6,000,000 Caisse d'Amortissement de la Dette USD 4,443,000 Landeskreditbank Baden-Wuerttemberg
Sociale 3.75% 25/10/2020 5,552 0.11 Foerderbank FRN 27/09/2021 3,621 0.07 GBP 400,000 Caisse des Depots et Consignations USD 45,000,000 Landeskreditbank Baden-Wuerttemberg
1% 25/01/2021 402 0.01 Foerderbank FRN 15/03/2022 (Frankfurt Listing) 36,638 0.75 EUR 3,750,000 Dexia Credit Local 0.2% 16/03/2021 3,439 0.07 USD 2,000,000 Landeskreditbank Baden-Wuerttemberg
EUR 31,150,000 Dexia Credit Local 0.25% 02/06/2022 28,735 0.59 Foerderbank FRN 15/03/2022 (Luxembourg Listing) 1,628 0.03 EUR 11,700,000 Dexia Credit Local 0.25% 01/06/2023 10,851 0.22 EUR 31,600,000 Landwirtschaftliche Rentenbank 0.05%
EUR 3,000,000 Dexia Credit Local 0.625% 21/01/2022 2,779 0.06 12/06/2023 29,293 0.60 EUR 20,250,000 Dexia Credit Local 0.625% 03/02/2024 19,077 0.39 AUD 5,000,000 Landwirtschaftliche Rentenbank 4.25%EUR 24,150,000 Dexia Credit Local 0.75% 25/01/2023 22,634 0.46 09/01/2025 3,222 0.07 GBP 17,300,000 Dexia Credit Local 0.875% 07/09/2021 17,416 0.35 EUR 10,200,000 Landwirtschaftliche Rentenbank FRNGBP 34,500,000 Dexia Credit Local 1.125% 15/06/2022 35,022 0.71 15/01/2021 9,339 0.19 EUR 2,000,000 Dexia Credit Local 2% 22/01/2021 1,850 0.04 EUR 9,000,000 LFA Foerderbank Bayern 1.75%EUR 1,000,000 Sanofi 0% 21/03/2022 915 0.02 10/09/2020 8,255 0.17 EUR 4,100,000 Sanofi 0% 13/09/2022 3,749 0.08 EUR 31,000,000 NRW Bank 0% 10/08/2022 28,540 0.58
EUR 68,400,000 Sanofi 0.5% 21/03/2023 63,387 1.29 EUR 53,849,000 NRW Bank 0% 11/11/2022 49,639 1.01 EUR 3,400,000 SNCF Reseau 0.1% 27/05/2021 3,116 0.06 EUR 10,000,000 NRW Bank 0.125% 10/03/2023 9,256 0.19
GBP 21,610,000 SNCF Reseau 5.5% 01/12/2021 23,161 0.47 EUR 11,200,000 NRW Bank 0.125% 07/07/2023 10,389 0.21 EUR 25,977,000 SNCF Reseau 6% 12/10/2020 24,142 0.49 EUR 6,000,000 NRW Bank 0.25% 02/02/2024 5,602 0.11
Dimensional Fund Advisors Ltd. Interim Report and Financial Statements, 30 June 2020 68

Global Short-Dated Bond Fund
Portfolio Statement (continued)as at 30 June 2020
Holding Investment
FairValue£'000
Percentageof total
net assets% Holding Investment
FairValue£'000
Percentageof total
net assets%
Germany (continued) Netherlands (continued)
EUR 17,000,000 NRW Bank FRN 17/05/2021 15,628 0.32 EUR 32,000,000 Toyota Motor Finance Netherlands FRNGBP 18,000,000 NRW Bank FRN 09/10/2024 17,964 0.37 30/09/2021 29,233 0.60
EUR 312,000 State of Hesse 2.75% 22/09/2020 287 0.01 443,918 9.06
EUR 48,800,000 State of North Rhine-WestphaliaGermany 0% 05/12/2022 45,019 0.92 New Zealand 0.54% (0.49%)
EUR 14,000,000 State of North Rhine-WestphaliaGermany 0.2% 17/04/2023 13,005 0.27 EUR 8,741,000 ANZ New Zealand Int'l 0.4% 01/03/2022 8,024 0.16
EUR 21,233,000 State of North Rhine-Westphalia EUR 20,200,000 ASB Finance 0.5% 10/06/2022 18,575 0.38 Germany 0.375% 16/02/2023 19,799 0.40 26,599 0.54
EUR 13,000,000 State of North Rhine-WestphaliaGermany FRN 28/10/2020 11,892 0.24 Norway 2.28% (1.20%)
GBP 39,600,000 State of North Rhine-WestphaliaGermany FRN 29/10/2021 39,553 0.81 EUR 6,155,000 Equinor 0.875% 17/02/2023 5,733 0.12
GBP 23,000,000 State of North Rhine-Westphalia EUR 7,433,000 Equinor 2% 10/09/2020 6,817 0.14 Germany FRN 15/10/2024 22,961 0.47 EUR 2,680,000 Equinor 5.625% 11/03/2021 2,546 0.05
538,917 11.00 SEK 446,000,000 Kommunalbanken 0.125% 21/03/2022 38,860 0.79 GBP 42,180,000 Kommunalbanken 0.875% 08/12/2020 42,298 0.86
Luxembourg 2.56% (3.15%) GBP 3,013,000 Kommunalbanken 1.125% 30/11/2022 3,076 0.06 NOK 60,000,000 Kommunalbanken 1.5% 19/04/2022 5,116 0.11
EUR 2,087,000 European Financial Stability USD 3,700,000 Kommunalbanken FRN 15/04/2021 3,015 0.06 Facility 0.1% 19/01/2021 1,913 0.04 USD 4,000,000 Kommunalbanken FRN 08/09/2021
EUR 26,000,000 European Financial Stability (Frankfurt Listing) 3,261 0.07 Facility 0.125% 17/10/2023 24,270 0.50 USD 1,400,000 Kommunalbanken FRN 08/09/2021
EUR 50,950,000 European Financial Stability (Luxembourg Listing) 1,142 0.02 Facility 0.2% 17/01/2024 47,743 0.97 111,864 2.28
EUR 1,500,000 Nestle Finance International 0.75%16/05/2023 1,400 0.03 Singapore 4.66% (3.44%)
EUR 26,783,000 Novartis Finance 0.125% 20/09/2023 24,653 0.50 EUR 27,300,000 Novartis Finance 0.5% 14/08/2023 25,347 0.52 AUD 5,700,000 DBS Bank FRN 23/08/2021 3,192 0.06
125,326 2.56 AUD 9,000,000 DBS Bank FRN 13/09/2022 5,029 0.10 SGD 120,000,000 Monetary Authority of Singapore Bill
Netherlands 9.06% (6.72%) 0% 14/08/2020 69,970 1.43 SGD 85,000,000 Monetary Authority of Singapore Bill
EUR 2,000,000 Allianz Finance II 3.5% 14/02/2022 1,933 0.04 0% 21/08/2020 49,559 1.01 EUR 5,500,000 Allianz Finance II FRN 07/12/2020 5,028 0.10 SGD 45,000,000 Monetary Authority of Singapore Bill
EUR 121,976,000 BNG Bank 0.05% 11/07/2023 112,806 2.30 0% 04/09/2020 26,235 0.54 EUR 8,000,000 BNG Bank 0.25% 22/02/2023 7,428 0.15 AUD 3,000,000 Oversea-Chinese Banking FRNEUR 9,500,000 BNG Bank 0.25% 10/01/2024 8,860 0.18 06/10/2020 1,676 0.03 GBP 3,728,000 BNG Bank 1% 17/06/2022 3,782 0.08 AUD 55,000,000 Oversea-Chinese Banking FRNGBP 5,043,000 BNG Bank 1.125% 24/05/2021 5,083 0.10 23/04/2021 30,779 0.63
GBP 10,000,000 BNG Bank 1.25% 15/12/2021 10,143 0.21 AUD 3,200,000 Oversea-Chinese Banking FRNEUR 2,500,000 BNG Bank 2.25% 17/07/2023 2,466 0.05 06/09/2021 1,792 0.04
EUR 10,759,000 Cooperatieve Rabobank UA 0.5% AUD 4,000,000 Oversea-Chinese Banking FRN06/12/2022 9,965 0.20 05/12/2022 2,233 0.05
USD 29,210,000 Cooperatieve Rabobank UA 2.75% EUR 26,166,000 Temasek Financial I 0.5% 01/03/2022 24,014 0.49 10/01/2022 24,622 0.50 GBP 2,290,000 Temasek Financial I 4.625% 26/07/2022 2,483 0.05
EUR 9,147,000 Cooperatieve Rabobank UA 4.75% AUD 3,000,000 United Overseas Bank FRN 06/04/2021 1,680 0.03 06/06/2022 9,135 0.19 AUD 2,500,000 United Overseas Bank FRN 24/01/2022 1,401 0.03
EUR 64,200,000 Nederlandse Waterschapsbank 0.125% AUD 15,000,000 United Overseas Bank FRN 25/07/2022 8,360 0.17 25/09/2023 59,668 1.22 228,403 4.66
GBP 6,580,000 Nederlandse Waterschapsbank 0.875%20/12/2021 6,634 0.13 Supranational 16.75% (14.53%)
USD 4,800,000 Nederlandse Waterschapsbank FRN10/11/2020 3,912 0.08 EUR 8,000,000 African Development Bank 0.25%
USD 75,000,000 Nederlandse Waterschapsbank FRN 24/01/2024 7,468 0.15 15/12/2021 (Frankfurt Listing) 61,103 1.25 USD 26,000,000 African Development Bank FRN
USD 24,000,000 Nederlandse Waterschapsbank FRN 15/12/2021 21,160 0.43 15/12/2021 (Luxembourg Listing) 19,553 0.40 EUR 94,285,000 Asian Development Bank 0.2%
EUR 11,512,000 Shell International Finance 1% 25/05/2023 87,583 1.79 06/04/2022 10,700 0.22 SEK 44,000,000 Asian Development Bank 0.37%
EUR 14,136,000 Shell International Finance 1.25% 26/06/2023 3,848 0.08 15/03/2022 13,206 0.27 GBP 19,500,000 Asian Development Bank FRN 01/02/2022 19,509 0.40
EUR 14,245,000 Shell International Finance 1.625% GBP 5,500,000 Asian Development Bank FRN 12/10/2023 5,492 0.11 24/03/2021 13,178 0.27 GBP 30,719,000 Asian Development Bank FRN
EUR 27,632,000 Toyota Motor Finance Netherlands 19/03/2024 30,687 0.63 0.625% 26/09/2023 25,480 0.52 EUR 31,000,000 Council Of Europe Development Bank
0.125% 25/05/2023 28,796 0.59
Dimensional Fund Advisors Ltd. Interim Report and Financial Statements, 30 June 2020 69

Global Short-Dated Bond Fund
Portfolio Statement (continued)as at 30 June 2020
Holding Investment
FairValue£'000
Percentageof total
net assets% Holding Investment
FairValue£'000
Percentageof total
net assets%
Supranational (continued) Sweden (continued)
EUR 12,983,000 Council Of Europe Development Bank SEK 559,550,000 Kommuninvest I Sverige 0.75%0% 13/07/2020 11,873 0.24 22/02/2023 49,458 1.01
USD 10,000,000 EUROFIMA FRN 15/11/2021 8,179 0.17 SEK 265,000,000 Kommuninvest I Sverige 1% 13/11/2023 23,713 0.48 USD 9,555,000 EUROFIMA FRN 11/03/2022 7,786 0.16 EUR 10,478,000 Skandinaviska Enskilda Banken 0.3%
GBP 20,025,000 European Bank for Reconstruction & 17/02/2022 9,616 0.20 Development FRN 27/02/2023 20,003 0.41 GBP 31,738,000 Svensk Exportkredit 0.625% 07/12/2020 31,791 0.65
GBP 26,382,000 European Bank for Reconstruction & GBP 33,602,000 Svensk Exportkredit 1.375% 15/12/2022 34,478 0.70 Development FRN 28/02/2024 26,376 0.54 GBP 3,500,000 Svensk Exportkredit 1.375% 15/12/2023 3,621 0.07
GBP 5,000,000 European Bank for Reconstruction & USD 2,000,000 Svensk Exportkredit FRN 14/12/2020 1,630 0.03 Development FRN 13/11/2024 4,994 0.10 USD 15,000,000 Svensk Exportkredit FRN 15/07/2021 12,232 0.25
NOK 10,130,000 European Investment Bank 1.5% EUR 14,882,000 Svenska Handelsbanken 0.25%12/05/2022 866 0.02 28/02/2022 13,655 0.28
SEK 9,400,000 European Investment Bank 2.75% EUR 3,000,000 Svenska Handelsbanken 0.5% 21/03/2023 2,779 0.06 13/11/2023 889 0.02 EUR 14,508,000 Svenska Handelsbanken 1.125%
AUD 6,487,000 European Investment Bank 6.25% 14/12/2022 13,621 0.28 08/06/2021 3,819 0.08 GBP 16,781,000 Svenska Handelsbanken 2.375%
GBP 9,000,000 European Investment Bank FRN 18/01/2022 17,237 0.35 10/01/2022 9,012 0.18 EUR 3,159,000 Svenska Handelsbanken 2.625%
GBP 10,954,000 European Investment Bank FRN 23/08/2022 3,046 0.06 18/02/2022 10,960 0.22 249,913 5.10
GBP 15,347,000 European Investment Bank FRN29/06/2023 15,394 0.31 United Kingdom 0.36% (10.19%)
GBP 103,500,000 European Investment Bank FRN15/01/2025 103,700 2.12 GBP 10,633,000 Network Rail Infrastructure Finance
EUR 96,133,000 European Stability Mechanism 0.1% 4.625% 21/07/2020 10,657 0.22 31/07/2023 89,478 1.83 GBP 5,400,000 Transport for London 2.25% 09/08/2022 5,571 0.11
EUR 6,750,000 European Stability Mechanism GBP 1,400,000 UK Treasury 0% 01/09/2020 1,400 0.03 Treasury Bill 0% 06/08/2020 6,169 0.13 17,628 0.36
EUR 15,000,000 European Stability MechanismTreasury Bill 0% 10/09/2020 13,714 0.28 United States 3.86% (4.18%)
EUR 15,500,000 European Stability MechanismTreasury Bill 0% 22/10/2020 14,179 0.29 EUR 17,240,000 3M 0.375% 15/02/2022 15,841 0.32
EUR 6,900,000 FMS Wertmanagement FRN 06/04/2021 6,323 0.13 EUR 5,500,000 3M 0.95% 15/05/2023 5,169 0.10 AUD 15,300,000 Inter-American Development Bank 6% EUR 3,500,000 3M 1.875% 15/11/2021 3,280 0.07
26/02/2021 8,851 0.18 EUR 5,900,000 Apple 1% 10/11/2022 5,532 0.11 USD 2,120,000 Inter-American Development Bank FRN EUR 4,643,000 Apple 1.375% 17/01/2024 4,468 0.09
15/07/2021 1,730 0.03 EUR 3,394,000 Berkshire Hathaway 0.625% 17/01/2023 3,141 0.06 USD 7,910,000 Inter-American Development Bank FRN EUR 5,169,000 Berkshire Hathaway 0.75% 16/03/2023 4,802 0.10
25/10/2021 6,443 0.13 EUR 1,659,000 Berkshire Hathaway 1.3% 15/03/2024 1,578 0.03 USD 2,039,000 Inter-American Development Bank FRN USD 11,862,000 Cisco Systems 1.85% 20/09/2021 9,840 0.20
15/01/2022 1,660 0.03 EUR 6,420,000 Johnson & Johnson 0.25% 20/01/2022 5,911 0.12 USD 27,000,000 Inter-American Development Bank FRN EUR 820,000 Merck 1.125% 15/10/2021 758 0.02
16/09/2022 21,935 0.45 GBP 9,594,000 Nestle 1.75% 09/12/2020 9,646 0.20 USD 29,000,000 Inter-American Investment FRN USD 2,396,000 Nestle 1.875% 09/03/2021 1,969 0.04
12/10/2021 23,637 0.48 USD 16,425,000 Oracle 1.9% 15/09/2021 13,612 0.28 GBP 66,771,000 International Bank for USD 26,049,000 Oracle 2.5% 15/05/2022 21,940 0.45
Reconstruction & Development 66,710 1.36 EUR 20,671,000 Pfizer 0.25% 06/03/2022 18,959 0.39 SEK 100,000,000 International Bank for USD 742,000 Pfizer 2.2% 15/12/2021 619 0.01
Reconstruction & Development 0.375% 17/07/2023 8,730 0.18 EUR 3,609,000 Procter & Gamble 1.125% 02/11/2023 3,433 0.07 AUD 12,000,000 International Bank for EUR 1,500,000 Procter & Gamble 2% 05/11/2021 1,409 0.03
Reconstruction & Development 2.8% 13/01/2021 6,783 0.14 EUR 7,274,000 Procter & Gamble 2% 16/08/2022 6,938 0.14 GBP 3,667,000 International Bank for EUR 13,047,000 Toyota Motor Credit 0% 21/07/2021 11,892 0.24
Reconstruction & Development FRN 13/12/2022 3,667 0.07 EUR 4,864,000 Toyota Motor Credit 0.75% 21/07/2022 4,487 0.09 GBP 58,830,000 International Bank for EUR 8,898,000 Toyota Motor Credit 1% 09/03/2021 8,172 0.17
Reconstruction & Development FRN 15/05/2024 58,706 1.20 EUR 9,924,000 Toyota Motor Credit 1% 10/09/2021 9,149 0.19 USD 15,000,000 International Finance FRN 15/12/2021 12,236 0.25 EUR 7,887,000 Toyota Motor Credit 1.8% 23/07/2020 7,211 0.15 GBP 18,950,000 International Finance FRN 18/01/2022 18,962 0.39 USD 11,194,000 Toyota Motor Credit 1.9% 08/04/2021 9,228 0.19
SEK 165,000,000 Nordic Investment Bank 0.125% 188,984 3.86
22/03/2022 14,371 0.29 NOK 93,000,000 Nordic Investment Bank 1.5% Short Term Deposits 1.98% (0.00%)
31/08/2022 7,950 0.16 820,628 16.75 USD 80,000,000 Canadian Imperial Bank of Commerce
FRN 08/07/2020 65,197 1.33 Sweden 5.10% (4.85%) USD 24,000,000 Oversea Chinese Banking FRN
22/10/2020 19,559 0.40 SEK 378,470,000 Kommuninvest I Sverige 0.25% USD 15,000,000 Shell International Finance 0.5%
01/06/2022 33,036 0.68 25/05/2021 12,168 0.25
Dimensional Fund Advisors Ltd. Interim Report and Financial Statements, 30 June 2020 70

Global Short-Dated Bond Fund
Portfolio Statement (continued)as at 30 June 2020
Holding Investment
FairValue£'000
Percentageof total
net assets% Holding Investment
FairValue£'000
Percentageof total
net assets%
Short Term Deposits 1.98% (0.00%) Forward Fx Currency Contracts (continued)
96,924 1.98 CAD (167,374,516) Sold for GBP98,937,101 Settlement06/08/2020 (761) (0.01)
Forward Fx Currency Contracts -1.74% (0.80%) CAD (169,496,047) Sold for GBP99,384,358 Settlement07/08/2020 (1,577) (0.03)
CAD 80,925,493 Bought for GBP47,337,753 Settlement CAD (140,817,596) Sold for GBP82,257,814 Settlement08/07/2020 872 0.02 11/08/2020 (1,620) (0.03)
CAD 13,523,541 Bought for GBP7,994,445 Settlement DKK (252,386,000) Sold for GBP29,533,598 Settlement23/07/2020 61 - 15/07/2020 (1,408) (0.03)
DKK 165,328,306 Bought for GBP19,594,303 Settlement DKK (342,596,661) Sold for GBP40,709,331 Settlement15/07/2020 674 0.01 13/08/2020 (1,311) (0.03)
DKK 63,535,359 Bought for GBP7,757,846 Settlement EUR (119,327,248) Sold for GBP105,514,343 Settlement15/07/2020 31 - 01/07/2020 (3,490) (0.07)
DKK 23,522,335 Bought for GBP2,765,907 Settlement EUR (118,267,621) Sold for GBP103,724,015 Settlement15/07/2020 118 - 08/07/2020 (4,322) (0.09)
DKK 217,273,536 Bought for GBP26,435,748 Settlement EUR (125,803,758) Sold for GBP109,897,697 Settlement13/08/2020 214 - 13/07/2020 (5,042) (0.10)
DKK 71,189,159 Bought for GBP8,694,430 Settlement EUR (44,356,965) Sold for GBP38,639,317 Settlement13/08/2020 37 - 16/07/2020 (1,889) (0.04)
DKK 54,133,966 Bought for GBP6,646,208 Settlement EUR (97,584,160) Sold for GBP86,146,565 Settlement13/08/2020 (6) - 20/07/2020 (3,020) (0.06)
EUR 110,912,295 Bought for GBP101,539,097 Settlement EUR (25,000,000) Sold for GBP21,944,280 Settlement01/07/2020 (222) - 20/07/2020 (899) (0.02)
EUR 8,414,953 Bought for GBP7,352,978 Settlement EUR (14,099,157) Sold for GBP12,564,564 Settlement01/07/2020 334 0.01 20/07/2020 (318) (0.01)
EUR 7,418,304 Bought for GBP6,479,848 Settlement EUR (6,255,064) Sold for GBP5,692,178 Settlement13/07/2020 298 0.01 20/07/2020 (23) -
EUR 44,356,965 Bought for GBP38,916,095 Settlement EUR (104,786,399) Sold for GBP92,256,911 Settlement16/07/2020 1,612 0.03 21/07/2020 (3,492) (0.07)
EUR 46,227,973 Bought for GBP41,621,915 Settlement EUR (99,614,378) Sold for GBP87,083,686 Settlement20/07/2020 618 0.01 22/07/2020 (3,941) (0.08)
EUR 10,077,586 Bought for GBP8,924,202 Settlement EUR (23,338,038) Sold for GBP20,484,827 Settlement22/07/2020 284 0.01 22/07/2020 (841) (0.02)
EUR 18,330,458 Bought for GBP16,569,797 Settlement EUR (101,874,474) Sold for GBP91,868,669 Settlement11/08/2020 185 - 28/07/2020 (1,229) (0.03)
NOK 148,695,607 Bought for GBP12,446,715 Settlement EUR (105,218,196) Sold for GBP93,736,576 Settlement10/07/2020 4 - 31/07/2020 (2,421) (0.05)
SGD 90,023,036 Bought for GBP51,312,545 Settlement EUR (110,394,933) Sold for GBP98,329,495 Settlement22/07/2020 1,190 0.03 04/08/2020 (2,566) (0.05)
SGD 45,154,600 Bought for GBP25,633,797 Settlement EUR (115,514,417) Sold for GBP101,528,047 Settlement22/07/2020 701 0.01 11/08/2020 (4,059) (0.08)
USD 130,309,898 Bought for GBP105,781,324 Settlement EUR (2,235,859) Sold for GBP1,995,636 Settlement01/07/2020 416 0.01 11/08/2020 (48) -
AUD (139,197,801) Sold for GBP75,675,779 Settlement EUR (2,218,481) Sold for GBP1,975,286 Settlement02/07/2020 (2,020) (0.04) 11/08/2020 (53) -
AUD (13,767,136) Sold for GBP7,633,402 Settlement EUR (98,703,679) Sold for GBP87,288,372 Settlement22/07/2020 (51) - 12/08/2020 (2,934) (0.06)
AUD (12,115,824) Sold for GBP6,703,479 Settlement EUR (15,078,919) Sold for GBP13,517,311 Settlement22/07/2020 (59) - 12/08/2020 (266) (0.01)
AUD (7,058,845) Sold for GBP3,909,868 Settlement EUR (116,821,944) Sold for GBP104,470,594 Settlement22/07/2020 (30) - 13/08/2020 (2,315) (0.05)
AUD (2,466,152) Sold for GBP1,370,889 Settlement EUR (119,322,371) Sold for GBP107,118,329 Settlement22/07/2020 (6) - 14/08/2020 (1,954) (0.04)
AUD (2,017,411) Sold for GBP1,118,444 Settlement EUR (112,402,090) Sold for GBP100,937,111 Settlement22/07/2020 (8) - 17/08/2020 (1,815) (0.04)
AUD (130,286,630) Sold for GBP72,204,920 Settlement EUR (83,092,246) Sold for GBP74,438,438 Settlement04/08/2020 (513) (0.01) 18/08/2020 (1,521) (0.03)
AUD (13,151,284) Sold for GBP7,290,826 Settlement EUR (112,559,672) Sold for GBP100,711,956 Settlement04/08/2020 (49) - 19/08/2020 (2,188) (0.04)
CAD (117,144,155) Sold for GBP68,580,351 Settlement EUR (115,304,104) Sold for GBP103,895,466 Settlement08/07/2020 (1,205) (0.02) 20/08/2020 (1,515) (0.03)
CAD (171,651,723) Sold for GBP100,253,791 Settlement EUR (108,578,269) Sold for GBP98,402,477 Settlement23/07/2020 (1,997) (0.04) 21/08/2020 (861) (0.02)
CAD (170,376,549) Sold for GBP98,574,528 Settlement EUR (117,002,514) Sold for GBP105,980,877 Settlement28/07/2020 (2,915) (0.06) 24/08/2020 (989) (0.02)
CAD (162,907,721) Sold for GBP96,424,679 Settlement EUR (101,423,731) Sold for GBP92,038,669 Settlement30/07/2020 (615) (0.01) 25/08/2020 (690) (0.01)
Dimensional Fund Advisors Ltd. Interim Report and Financial Statements, 30 June 2020 71

Global Short-Dated Bond Fund
Portfolio Statement (continued)as at 30 June 2020
Holding Investment
FairValue£'000
Percentageof total
net assets%
Forward Fx Currency Contracts (continued) #N/A
EUR (109,003,383) Sold for GBP98,344,640 Settlement26/08/2020 (1,316) (0.03)
EUR (112,686,821) Sold for GBP102,126,173 Settlement27/08/2020 (904) (0.02)
EUR (111,356,057) Sold for GBP102,040,009 Settlement28/08/2020 225 -
NOK (357,422,498) Sold for GBP29,829,403 Settlement10/07/2020 (98) -
SEK (511,748,115) Sold for GBP43,970,192 Settlement28/07/2020 (550) (0.01)
SEK (321,721,906) Sold for GBP27,304,750 Settlement29/07/2020 (684) (0.01)
SEK (596,566,048) Sold for GBP51,022,082 Settlement12/08/2020 (882) (0.02)
SEK (560,750,880) Sold for GBP47,753,163 Settlement14/08/2020 (1,036) (0.02)
SGD (135,177,636) Sold for GBP76,856,523 Settlement22/07/2020 (1,981) (0.04)
SGD (45,002,900) Sold for GBP25,437,928 Settlement22/07/2020 (808) (0.02)
SGD (84,919,793) Sold for GBP48,790,851 Settlement27/08/2020 (729) (0.01)
SGD (119,968,107) Sold for GBP69,079,181 Settlement17/09/2020 (876) (0.02)
USD (130,309,898) Sold for GBP106,891,385 Settlement01/07/2020 694 0.01
USD (67,143,836) Sold for GBP54,430,164 Settlement08/07/2020 (288) (0.01)
USD (109,935,710) Sold for GBP88,259,496 Settlement30/07/2020 (1,319) (0.03)
USD (92,561,514) Sold for GBP73,751,585 Settlement31/07/2020 (1,669) (0.03)
USD (26,484,880) Sold for GBP21,312,427 Settlement31/07/2020 (268) (0.01)
USD (14,901,480) Sold for GBP12,053,537 Settlement31/07/2020 (88) -
USD (116,729,562) Sold for GBP92,266,268 Settlement04/08/2020 (2,845) (0.06)
USD (125,496,694) Sold for GBP98,984,795 Settlement07/08/2020 (3,268) (0.07)
USD (130,304,821) Sold for GBP105,752,703 Settlement11/08/2020 (416) (0.01)
USD (122,800,713) Sold for GBP97,815,083 Settlement14/08/2020 (2,238) (0.05)
(84,769) (1.74)
Portfolio of investments 98.72% (94.68%) 4,837,669 98.72
Net other assets 62,813 1.28 Net assets 4,900,482 100.00
Comparative figures shown in brackets next to each country heading relate to 31 December 2019.
Dimensional Fund Advisors Ltd. Interim Report and Financial Statements, 30 June 2020 72

International Core Equity Fund
Portfolio Statementas at 30 June 2020
Holding Investment
Fair
Value
£'000
Percentage
of total
net assets
% Holding Investment
Fair
Value
£'000
Percentage
of total
net assets
%
Australia 2.59% (2.87%) Australia (continued)
5,477 A2B Australia 2 - 19,771 Charter Hall Long Wale REIT 47 -
17,928 Abacus Property 27 - 25,870 Charter Hall Retail REIT 49 0.01
16,866 Accent 13 - 19,126 Charter Hall Social Infrastructure
5,265 Adairs 7 - REIT 25 -
29,536 Adbri 52 0.01 3,067 CIMIC 41 -
1,584 Afterpay 54 0.01 51,481 Cleanaway Waste Management 63 0.01
19,050 AGL Energy 181 0.02 1,816 Clinuvel Pharmaceuticals 26 -
6,609 ALE Property 18 - 22,845 Coca-Cola Amatil 110 0.01
3,428 Alliance Aviation Services 6 - 1,390 Cochlear 147 0.01
20,109 ALS 74 0.01 7,011 Codan 28 -
4,307 Altium 78 0.01 34,588 Coles 331 0.03
51,323 Alumina 47 0.01 8,776 Collins Foods 46 0.01
18,220 AMA 6 - 37,867 Commonwealth Bank of Australia 1,468 0.14
23,117 Amaysim Australia 7 - 19,374 Computershare 143 0.01
34,623 Amcor (AUD) 280 0.03 103,806 Cooper Energy 22 -
47,843 Amcor (USD) 387 0.04 3,292 Corporate Travel Management 18 -
323,532 AMP 335 0.03 21,190 Costa 34 -
17,446 Ampol 285 0.03 3,700 Credit 32 -
4,894 Ansell 100 0.01 98,682 Cromwell Property 49 0.01
11,979 AP Eagers 45 0.01 9,353 Crown Resorts 50 0.01
37,141 APA 231 0.02 10,770 CSL 1,727 0.17
2,944 APN Industria REIT 4 - 46,088 CSR 95 0.01
2,888 Appen 55 0.01 6,370 Data#3 16 -
4,368 ARB 44 0.01 102,762 Decmil 3 -
32,554 Ardent Leisure 7 - 31,477 Dexus 162 0.02
11,881 Arena REIT 15 - 12,381 Domain Australia 23 -
14,752 Aristocrat Leisure 210 0.02 3,785 Domino's Pizza Enterprises 145 0.02
23,551 Asaleo Care 13 - 42,610 Downer EDI 104 0.01
2,661 ASX 127 0.01 30,653 Eclipx 21 -
28,872 Atlas Arteria 107 0.01 5,094 Elders 27 -
1,015 Atlassian 145 0.02 8,997 Emeco 5 -
3,388 AUB 28 - 39,953 Energy World 1 -
31,143 Aurelia Metals 9 - 1,380 EQT 19 -
102,081 Aurizon 281 0.03 15,218 Estia Health 13 -
54,059 AusNet Services 50 0.01 5,724 EVENT Hospitality and Entertainment 27 -
20,329 Austal 37 - 77,193 Evolution Mining 244 0.02
50,166 Australia & New Zealand Banking 522 0.05 6,350 Ferroglobe Representation & Warranty
20,492 Australian Agricultural 12 - Investment Trust* - -
9,751 Australian Finance 9 - 17,843 FlexiGroup 11 -
24,996 Australian Pharmaceutical Industries 16 - 5,473 Flight Centre Travel 34 -
5,656 Aventus 7 - 65,626 Fortescue Metals 508 0.05
36,800 BGP* - - 10,312 Freedom Foods* 17 -
4,879 Baby Bunting 9 - 38,191 G8 Education 19 -
29,067 Bank of Queensland 100 0.01 11,520 Galaxy Resources 5 -
19,032 Bapcor 63 0.01 20,009 GDI Property 13 -
171,566 Beach Energy 146 0.01 22,576 Genworth Mortgage Insurance Australia 26 -
14,209 Bega Cheese 36 - 11,179 Gold Road Resources 10 -
19,170 Bendigo & Adelaide Bank 75 0.01 29,674 Goodman 246 0.02
87,540 BHP 1,753 0.17 63,057 GPT 147 0.01
651 Blackmores 28 - 18,031 GrainCorp 41 -
28,934 BlueScope Steel 189 0.02 1,416 Grange Resources - -
58,177 Boral 123 0.01 17,484 Growthpoint Properties Australia 31 -
40,839 Brambles 248 0.02 4,738 GUD 31 -
7,208 Bravura Solutions 18 - 10,940 GWA 17 -
4,739 Breville 60 0.01 6,338 Hansen Technologies 10 -
4,802 Brickworks 43 - 36,717 Harvey Norman 72 0.01
23,748 BWP Trust 51 0.01 39,128 Healius 67 0.01
3,715 BWX 7 - 7,159 Hotel Property Investments 12 -
9,673 Cardno 1 - 12,204 HT&E 8 -
16,234 carsales.com 161 0.02 2,343 HUB24 12 -
4,464 Cedar Woods Properties 13 - 8,078 IDP Education 70 0.01
9,220 Centuria Industrial REIT 16 - 34,403 IGO 93 0.01
21,777 Centuria Office REIT 24 - 17,505 Iluka Resources 83 0.01
21,171 Challenger 52 0.01 23,785 Imdex 15 -
13,701 Champion Iron 22 - 91,981 Incitec Pivot 96 0.01
22,166 Charter Hall 120 0.01 54,624 Infigen Energy 28 -
Dimensional Fund Advisors Ltd. Interim Report and Financial Statements, 30 June 2020 73

International Core Equity Fund
Portfolio Statement (continued)as at 30 June 2020
Holding Investment
Fair
Value
£'000
Percentage
of total
net assets
% Holding Investment
Fair
Value
£'000
Percentage
of total
net assets
%
Australia (continued) Australia (continued)
17,824 Infomedia 17 - 13,585 Pact 17 -
17,283 Ingenia Communities 43 0.01 29,839 Peet 16 -
16,069 Inghams 29 - 15,221 Pendal 51 -
81,332 Insurance Australia 262 0.03 52,994 Perenti Global 34 -
9,673 Intega 1 - 3,136 Perpetual 52 0.01
5,767 Integral Diagnostics 12 - 97,934 Perseus Mining 71 0.01
3,678 Integrated Research 8 - 11,942 Platinum Asset Management 25 -
8,167 InvoCare 48 0.01 4,918 Premier Investments 47 0.01
22,044 IOOF 61 0.01 2,835 Pro Medicus 42 -
9,557 IPH 40 - 4,833 PSC Insurance 6 -
10,966 IRESS 67 0.01 37,604 Qantas Airways 79 0.01
8,674 IVE 4 - 9,409 Qantas Airways Placement 30/06/2020 20 -
15,314 Japara Healthcare 4 - 30,001 QBE Insurance 149 0.02
7,559 JB Hi-Fi 181 0.02 58,831 Qube 95 0.01
86,080 Jupiter Mines 13 - 52,747 Ramelius Resources 58 0.01
26,960 Karoon Energy 9 - 6,388 Ramsay Health Care 237 0.02
7,087 Kingsgate Consolidated 2 - 2,694 REA 162 0.02
13,972 Lendlease 96 0.01 10,328 Reece 53 0.01
5,343 Lifestyle Communities 28 - 7,942 Regis Healthcare 6 -
31,208 Link Administration 71 0.01 31,733 Regis Resources 92 0.01
2,002 Lovisa 7 - 64,158 Resolute Mining 40 -
29,490 Lynas 32 - 11,348 Rio Tinto 621 0.06
22,997 MACA 11 - 14,295 Sandfire Resources 40 -
73,701 Macmahon 10 - 77,452 Santos 228 0.02
7,650 Macquarie 507 0.05 48,521 Saracen Mineral 147 0.02
7,036 Magellan Financial 228 0.02 100,647 Scentre 122 0.01
93,430 Mayne Pharma 20 - 7,722 SeaLink Travel 19 -
5,166 McMillan Shakespeare 26 - 4,849 SEEK 59 0.01
95,783 Medibank Pvt 159 0.02 8,456 Select Harvests 30 -
3,162 Medusa Mining 1 - 98,740 Senex Energy 12 -
26,414 Mesoblast 48 0.01 18,846 Service Stream 20 -
66,493 Metcash 101 0.01 8,315 Seven 80 0.01
13,907 Mineral Resources 164 0.02 50,121 Seven West Media 3 -
130,531 Mirvac 158 0.02 8,343 SG Fleet 7 -
1,200 Mission West Properties Escrow 52,784 Shopping Centres Australasia Property 64 0.01
Shares* - - 93,423 Sigma Healthcare 32 -
37,482 MMA Offshore 1 - 37,469 Silver Lake Resources 44 -
5,297 Monadelphous 32 - 5,712 SmartGroup 19 -
12,995 Monash IVF 4 - 10,488 Sonic Healthcare 178 0.02
9,476 Money3 8 - 127,794 South32 145 0.02
24,551 Mount Gibson Iron 8 - 132,693 Southern Cross Media 13 -
67,426 Myer 7 - 63,610 Spark Infrastructure 77 0.01
9,003 MyState 20 - 24,509 SpeedCast International* 8 -
55,386 National Australia Bank 563 0.06 1,395 Spirit MTA Escrow Shares* 1 -
33,460 National Storage REIT 35 - 46,844 St Barbara 82 0.01
7,881 Navigator Global Investments 5 - 50,925 Star Entertainment 80 0.01
6,017 Netwealth 30 - 39,165 Steadfast 74 0.01
40,992 New Hope 31 - 82,850 Stockland 153 0.01
14,654 Newcrest Mining 258 0.03 33,376 Suncorp 172 0.02
4,935 NEXTDC 27 - 13,798 Super Retail 62 0.01
27,629 nib 71 0.01 24,573 Superloop 14 -
4,029 Nick Scali 15 - 24,422 Sydney Airport 77 0.01
55,103 Nine Entertainment 42 - 19,919 Syrah Resources 3 -
35,778 Northern Star Resources 267 0.03 70,436 Tabcorp 132 0.01
34,787 NRW 36 - 13,220 Tassal 25 -
20,479 Nufarm 47 0.01 17,543 Technology One 86 0.01
54,168 OceanaGold 95 0.01 131,717 Telstra 230 0.02
15,563 OFX 12 - 11,395 Thorn 1 -
58,145 Oil Search 103 0.01 21,368 TPG* 101 0.01
13,312 Omni Bridgeway 35 - 28,934 Transurban 228 0.02
15,077 oOh!media 8 - 16,184 Treasury Wine Estates 95 0.01
10,908 Orica 101 0.01 14,205 Tronox 81 0.01
44,928 Origin Energy 146 0.02 20,642 United Malt Grp 47 0.01
54,153 Orora 76 0.01 137,151 Vicinity Centres 110 0.01
21,185 OZ Minerals 130 0.01 5,388 Village Roadshow 7 -
4,654 Pacific Current 14 - 119,336 Virgin Australia* 6 -
Dimensional Fund Advisors Ltd. Interim Report and Financial Statements, 30 June 2020 74

International Core Equity Fund
Portfolio Statement (continued)as at 30 June 2020
Holding Investment
Fair
Value
£'000
Percentage
of total
net assets
% Holding Investment
Fair
Value
£'000
Percentage
of total
net assets
%
Australia (continued) Belgium (continued)
53,804 Virgin Australia NPV 30/03/2012* - - 2 Atenor Rights 25/06/2020 - -
3,592 Virtus Health 6 - 6 Banque Nationale de Belgique 11 -
34,686 Vocus 57 0.01 388 Barco 55 0.01
7,757 Webjet 14 - 1,042 Befimmo 38 -
25,052 Wesfarmers 627 0.06 2,393 Bekaert 38 -
16,419 Western Areas 24 - 8,155 bpost 45 0.01
18,676 Westgold Resources 22 - 881 Care Property Invest 21 -
57,645 Westpac Banking 578 0.06 571 Cie d'Entreprises CFE 32 -
61,886 Whitehaven Coal 49 0.01 1,013 Cofinimmo 115 0.01
13,269 Woodside Petroleum 161 0.02 2,946 Colruyt 133 0.01
26,778 Woolworths 557 0.06 4,347 Deceuninck 5 -
13,968 Worley 68 0.01 1,634 D'ieteren 73 0.01
8,758 WPP AUNZ 1 - 5,128 Econocom 8 -
26,420 2.59 1,480 Elia 130 0.01
12,056 Euronav 79 0.01
Austria 0.16% (0.20%) 684 EVS Broadcast Equipment 10 -
2,320 Exmar 5 -
700 Agrana Beteiligungs 12 - 1,998 Fagron 34 -
5,111 ams 61 0.01 1,047 Galapagos 167 0.02
3,683 ANDRITZ 110 0.01 609 Gimv 28 -
2,074 AT&S Austria Technologie & 123 Home Invest Belgium 13 -
Systemtechnik 30 - 310 Immobel 17 -
6,787 Atrium European Real Estate 17 - 874 Intervest Offices & Warehouses 19 -
1,617 BAWAG 45 0.01 270 Jensen-Group 5 -
3,187 CA Immobilien Anlagen 87 0.01 8,034 KBC 376 0.04
270 DO 11 - 754 Kinepolis 28 -
7,886 Erste Group Bank 151 0.02 110 Leasinvest Real Estate 9 -
1,990 EVN 27 - 16 Lotus Bakeries 41 -
670 Flughafen Wien 16 - 1,188 Melexis 72 0.01
3,804 IMMOFINANZ 53 0.01 551 Mithra Pharmaceuticals 9 -
235 Kapsch TrafficCom 4 - 784 Montea C.V.A 64 0.01
770 Lenzing 29 - 4,800 Ontex 57 0.01
358 Mayr Melnhof Karton 44 0.01 2,979 Orange Belgium 40 -
1,390 Oesterreichische Post 38 - 10,822 Proximus 182 0.02
6,930 OMV 186 0.02 4,814 Recticel 34 -
862 Palfinger 15 - 72 Resilux 8 -
1,103 POLYTEC 5 - 521 Retail Estates 29 -
519 Porr 7 - 413 Shurgard Self Storage 13 -
10,162 Raiffeisen Bank International 146 0.02 472 Sipef 19 -
191 Rosenbauer International 6 - 6,018 Solvay 398 0.04
1,605 S IMMO 24 - 2,931 Telenet 101 0.01
2,466 S&T 51 - 2,353 Tessenderlo 57 0.01
549 Schoeller-Bleckmann Oilfield 3,275 UCB 307 0.03
Equipment 12 - 9,721 Umicore 371 0.04
443 Semperit 4 - 467 Van de Velde 9 -
962 Strabag 20 - 7,162 Warehouses De Pauw CVA 161 0.02
8,209 Telekom Austria 46 0.01 218 Wereldhave Belgium Comm VA 10 -
5,462 UNIQA Insurance 30 - 4,940 0.48
890 Verbund 32 -
2,452 Vienna Insurance Group Wiener Brazil 0.01% (0.00%)
Versicherung Gruppe 44 0.01
8,221 voestalpine 144 0.01 5,194 Natura ADR 62 0.01
5,394 Wienerberger 95 0.01 62 0.01
603 Zumtobel 3 -
1,605 0.16 Canada 3.37% (4.31%)
Belgium 0.48% (0.57%) 8,700 5N Plus 9 -
3,700 Absolute Software 30 -
914 Ackermans & van Haaren 97 0.01 800 Acadian Timber 7 -
1,004 Aedifica 91 0.01 11,478 Advantage Oil & Gas 11 -
5,927 Ageas 170 0.02 6,108 Aecon 54 0.01
13,927 AGFA-Gevaert 47 0.01 16,062 Africa Oil 10 -
569 Akka Technologies 15 - 1,200 Ag Growth International 19 -
25,296 Anheuser-Busch InBev 1,022 0.10 3,900 AGF Management 11 -
169 Ascencio 7 - 2,304 Agnico Eagle Mines 116 0.01
287 Atenor 15 - 5,236 Air Canada 54 0.01
Dimensional Fund Advisors Ltd. Interim Report and Financial Statements, 30 June 2020 75

International Core Equity Fund
Portfolio Statement (continued)as at 30 June 2020
Holding Investment
Fair
Value
£'000
Percentage
of total
net assets
% Holding Investment
Fair
Value
£'000
Percentage
of total
net assets
%
Canada (continued) Canada (continued)
1,600 AirBoss of America 17 - 5,443 Choice Properties Real Estate
17,821 Alamos Gold 131 0.01 Investment Trust 41 -
2,959 Alaris Royalty 21 - 16,119 CI Financial 163 0.02
1,400 Algoma Central 9 - 5,009 Cineplex 29 -
8,640 Algonquin Power & Utilities 90 0.01 1,576 City Office REIT 13 -
2,814 Allied Properties Real Estate 459 Cogeco 22 -
Investment Trust 67 0.01 1,350 Cogeco Communications 79 0.01
10,856 AltaGas 99 0.01 2,138 Colliers International 98 0.01
2,800 Altius Minerals 16 - 5,181 Cominar Real Estate Investment Trust 24 -
1,400 Andrew Peller 7 - 6,800 Computer Modelling 19 -
26,196 ARC Resources 71 0.01 554 Constellation Software 507 0.05
5,600 Aritzia 60 0.01 15,300 Copper Mountain Mining 5 -
3,279 Artis Real Estate Investment Trust 14 - 1,200 Corby Spirit and Wine 12 -
4,014 Atco 94 0.01 22,003 Corus Entertainment 37 -
25,475 Athabasca Oil 3 - 58,010 Crescent Point Energy 77 0.01
3,300 ATS Automation Tooling Systems 36 - 9,489 Crew Energy 2 -
2,000 AutoCanada 13 - 10,800 CRH Medical 18 -
82,242 B2Gold 364 0.04 2,500 Crombie Real Estate Investment Trust 19 -
2,184 Badger Daylighting 37 - 2,703 CT Real Estate Investment Trust 22 -
13,381 Bank of Montreal (CAD) 568 0.06 23,350 Denison Mines 6 -
1,181 Bank of Montreal (USD) 50 0.01 1,100 Descartes Systems 45 0.01
27,444 Bank of Nova Scotia 907 0.09 2,200 DIRTT Environmental Solutions 2 -
14,694 Barrick Gold 313 0.03 9,386 Dollarama 252 0.02
40,141 Baytex Energy 16 - 1,500 Dorel Industries 5 -
4,697 BCE 158 0.02 2,600 Dream Industrial Real Estate
16,822 Birchcliff Energy 12 - Investment Trust 16 -
2,700 Bird Construction 9 - 1,673 Dream Office Real Estate Investment
2,436 Black Diamond 2 - Trust 20 -
31,293 BlackBerry 121 0.01 7,800 DREAM Unlimited 40 -
1,200 Boardwalk Real Estate Investment 13,450 Dundee Precious Metals 69 0.01
Trust 20 - 18,846 ECN Capital 43 -
2,210 Bonterra Energy 2 - 124 E-L Financial 49 0.01
4,771 Boralex 85 0.01 12,753 Eldorado Gold 99 0.01
7,389 Brookfield Asset Management 196 0.02 28,210 Element Fleet Management 163 0.02
1,645 BRP 54 0.01 4,328 Emera 136 0.01
1,100 BSR Real Estate Investment Trust 9 - 7,726 Empire 154 0.02
11,734 CAE 155 0.02 25,549 Enbridge 629 0.06
12,758 Cameco 105 0.01 4,376 Endeavour Silver 8 -
8,882 Canaccord Genuity 36 - 8,100 Enerflex 25 -
7,400 Canacol Energy 17 - 29,500 Enerplus 65 0.01
2,192 Canada Goose 41 0.01 2,800 Enghouse Systems 118 0.01
3,029 Canadiaartment Properties REIT 87 0.01 7,704 Ensign Energy Services 5 -
11,781 Canadian Imperial Bank of Commerce 600 Equitable 25 -
(CAD) 631 0.06 3,300 ERO Copper 38 -
1,294 Canadian Imperial Bank of Commerce 1,800 Evertz Technologies 12 -
(USD) 69 0.01 700 Exchange Income 11 -
17,821 Canadian National Railway 1,260 0.12 1,671 Exco Technologies 6 -
69,971 Canadian Natural Resources 991 0.10 5,003 Extendicare 16 -
3,457 Canadian Pacific Railway 702 0.07 801 Fairfax Financial 197 0.02
3,146 Canadian Tire 220 0.02 2,700 Fiera Capital 15 -
5,120 Canadian Utilities 100 0.01 12,801 Finning International 139 0.01
7,314 Canadian Western Bank 101 0.01 1,508 Firm Capital Mortgage Investment 10 -
5,100 Canfor 35 - 7,595 First Capital Real Estate Investment
3,200 CanWel Building Materials 8 - Trust 62 0.01
5,205 Capital Power 82 0.01 1,100 First National Financial 18 -
23,800 Capstone Mining 12 - 30,784 First Quantum Minerals 185 0.02
6,045 Cardinal Energy 2 - 2,228 FirstService 179 0.02
8,100 Cascades 70 0.01 4,500 Fission Uranium 1 -
6,270 CCL Industries 162 0.02 12,242 Fortis 373 0.04
10,024 Celestica 54 0.01 9,209 Fortuna Silver Mines 35 -
17,901 Cenovus Energy 68 0.01 518 Franco-Nevada 58 0.01
13,467 Centerra Gold 120 0.01 6,871 Freehold Royalties 14 -
15,609 CES Energy Solutions 10 - 5,299 Frontera Energy 11 -
7,606 CGI 390 0.04 13,300 Galiano Gold 13 -
8,520 Chartwell Retirement Residences 46 0.01 1,800 Gamehost 7 -
14,600 China Gold International Resources 6 - 500 GDI Integrated Facility Services 10 -
Dimensional Fund Advisors Ltd. Interim Report and Financial Statements, 30 June 2020 76

International Core Equity Fund
Portfolio Statement (continued)as at 30 June 2020
Holding Investment
Fair
Value
£'000
Percentage
of total
net assets
% Holding Investment
Fair
Value
£'000
Percentage
of total
net assets
%
Canada (continued) Canada (continued)
3,387 Genworth MI Canada 65 0.01 1,800 Medical Facilities 5 -
4,034 George Weston 241 0.02 20,487 MEG Energy 44 0.01
9,920 Gibson Energy 123 0.01 1,500 Melcor Developments 7 -
7,222 Gildan Activewear 88 0.01 4,706 Mercer International 31 -
294 goeasy 10 - 4,550 Methanex 67 0.01
6,620 Golden Star Resources 15 - 6,224 Metro CN 208 0.02
23,321 Gran Tierra Energy 6 - 300 Morguard 22 -
1,100 Granite Real Estate Investment Trust 45 0.01 900 Morguard North American Residential
3,783 Great Canadian Gaming 61 0.01 Real Estate Investment Trust 8 -
3,893 Great-West Lifeco 54 0.01 1,284 Morguard Real Estate Investment Trust 4 -
1,500 Guardian Capital 19 - 2,700 Morneau Shepell 50 -
5,600 Guyana Goldfields 6 - 1,200 MTY Food 17 -
6,118 H&R Real Estate Investment Trust 35 - 9,069 Mullen 37 -
2,200 Heroux-Devtek 13 - 17,370 National Bank of Canada 629 0.06
1,300 High Liner Foods 5 - 37,648 New Gold 41 -
4,594 Home Capital 53 0.01 3,000 NFI 29 -
7,408 Horizon North Logistics 3 - 2,370 North American Construction 12 -
17,000 Hudbay Minerals 38 - 3,603 North West 64 0.01
20,671 Husky Energy 56 0.01 9,413 Northland Power 186 0.02
7,900 Hydro One 119 0.01 2,586 NorthWest Healthcare Properties Real
7,708 iA Financial 202 0.02 Estate Investment Trust 16 -
14,600 IAMGOLD 43 0.01 12,075 Nutrien 320 0.03
3,332 IGM Financial 63 0.01 11,979 NuVista Energy 5 -
3,067 IMAX 28 - 2,859 Onex 102 0.01
3,400 Imperial Metals 4 - 10,246 Open Text 354 0.04
12,153 Imperial Oil 156 0.02 3,000 Osisko Gold Royalties 23 -
1,400 Information Services (CAD) 12 - 7,448 Painted Pony Energy 2 -
5,645 Innergex Renewable Energy 63 0.01 6,089 Pan American Silver 139 0.01
2,100 Inovalis Real Estate Investment Trust 10 - 14,661 Pan American Silver CVR 22/02/2029* 7 -
1,212 Intact Financial 92 0.01 3,333 Paramount Resources 3 -
11,172 Inter Pipeline 83 0.01 15,328 Parex Resources 146 0.02
6,397 Interfor 41 0.01 9,164 Parkland 179 0.02
2,700 InterRent Real Estate Investment 5,745 Pason Systems 25 -
Trust 23 - 4,615 Pembina Pipeline 91 0.01
4,100 Intertape Polymer 28 - 11,947 Peyto Exploration & Development 13 -
2,456 IPL Plastics 8 - 3,900 PHX Energy Services 3 -
30,952 Ivanhoe Mines 69 0.01 1,500 Pinnacle Renewable Energy 4 -
2,900 Jamieson Wellness 58 0.01 988 Pizza Pizza Royalty 5 -
500 K-Bro Linen 8 - 900 Points International 6 -
6,650 Kelt Exploration 5 - 1,100 Pollard Banknote 11 -
10,781 Keyera 131 0.01 8,166 PrairieSky Royalty 41 -
2,904 Killam Apartment Real Estate 19,698 Precision Drilling 12 -
Investment Trust 29 - 15,300 Premier Gold Mines 20 -
897 Kinaxis 102 0.01 1,600 Premium Brands 82 0.01
88,005 Kinross Gold 504 0.05 8,900 Pretium Resources 59 0.01
14,940 Kirkland Lake Gold 478 0.05 11,542 Quarterhill 14 -
9,200 Knight Therapeutics 38 - 10,288 Quebecor 179 0.02
5,100 Labrador Iron Ore Royalty 72 0.01 4,300 Real Matters 62 0.01
9,027 Largo Resources 4 - 600 Recipe Unlimited 3 -
2,720 Laurentian Bank of Canada 47 0.01 1,588 Reitmans Canada* - -
2,352 Leon's Furniture 18 - 4,100 Resolute Forest Products 7 -
5,487 Linamar 124 0.01 5,548 Restaurant Brands International (CAD) 247 0.03
6,592 Loblaw 264 0.03 2,056 Restaurant Brands International (USD) 92 0.01
18,400 Lucara Diamond 7 - 3,300 Richelieu Hardware 55 0.01
3,747 Lululemon Athletica 898 0.09 3,581 RioCan Real Estate Investment Trust 32 -
3,400 Lundin Gold 25 - 4,787 Ritchie Bros Auctioneers 154 0.02
38,262 Lundin Mining 164 0.02 9,069 Rogers Communications 297 0.03
1,200 Magellan Aerospace 5 - 16,500 Roxgold 15 -
23,539 Magna International 837 0.08 41,179 Royal Bank of Canada (CAD) 2,255 0.22
4,996 Major Drilling Group International 12 - 3,733 Royal Bank of Canada (USD) 205 0.02
1,350 Mandalay Resources 2 - 7,068 Russel Metals 67 0.01
30,922 Manulife Financial 334 0.03 14,100 Sabina Gold & Silver 16 -
3,304 Maple Leaf Foods 56 0.01 6,117 Sandstorm Gold 46 0.01
10,400 Martinrea International 65 0.01 7,782 Saputo 149 0.01
1,600 Mav Beauty Brands 2 - 700 Savaria 5 -
4,638 McEwen Mining 4 - 11,709 Secure Energy Services 11 -
Dimensional Fund Advisors Ltd. Interim Report and Financial Statements, 30 June 2020 77

International Core Equity Fund
Portfolio Statement (continued)as at 30 June 2020
Holding Investment
Fair
Value
£'000
Percentage
of total
net assets
% Holding Investment
Fair
Value
£'000
Percentage
of total
net assets
%
Canada (continued) Canada (continued)
36,823 SEMAFO 100 0.01 3,201 WSP Global 156 0.02
37,236 Seven Generations Energy 69 0.01 58,601 Yamana Gold 252 0.02
26,582 Shaw Communications 352 0.04 6,200 Yangarra Resources 2 -
4,400 ShawCor 7 - 34,346 3.37
300 Shopify 225 0.02
4,011 Sienna Senior Living 22 - Denmark 0.75% (0.71%)
2,800 Sierra Wireless 20 -
1,120 Slate Retail REIT 6 - 264 ALK-Abello 58 0.01
2,490 Sleep Country Canada 24 - 5,764 Alm Brand 43 -
2,978 SmartCentres Real Estate Investment 1,135 Ambu 29 -
Trust 36 - 61 AP Moller - Maersk 'A' 54 0.01
2,000 Spin Master 28 - 68 AP Moller - Maersk 'B' 64 0.01
711 Sprott 19 - 1,873 Bang & Olufsen 3 -
8,600 SSR Mining 142 0.01 3,746 Bang & Olufsen Rights 6 -
7,825 Stantec 191 0.02 2,552 Bavarian Nordic 57 0.01
1,615 Stelco 7 - 448 Brodrene Hartmann 19 -
4,529 Stella-Jones 91 0.01 1,760 Carlsberg 190 0.02
7,400 Storm Resources 6 - 2,957 Chr Hansen 247 0.02
23,000 Stornoway Diamond* - - 2,321 Coloplast 289 0.03
1,600 Summit Industrial Income REIT 10 - 2,291 Columbus 2 -
10,089 Sun Life Financial 292 0.03 2,200 D/S Norden 24 -
71,903 Suncor Energy 990 0.10 17,696 Danske Bank 192 0.02
18,294 Superior Plus 121 0.01 3,795 Demant 82 0.01
11,017 Tamarack Valley Energy 5 - 1,889 Dfds 48 -
6,800 Taseko Mines 3 - 1,748 Drilling Company of 1972 30 -
13,172 TC Energy 450 0.04 2,968 DSV PANALPINA 295 0.03
24,950 Teck Resources 202 0.02 2,776 FLSmidth 65 0.01
7,250 Telus 98 0.01 870 Genmab 233 0.02
6,540 Teranga Gold 47 - 6,139 GN Store Nord 267 0.03
468 Tervita 1 - 3,521 H Lundbeck 108 0.01
98 Tervita Warrants 19/07/2020 - - 1,638 H+H International 21 -
7,826 TFI International 216 0.02 8,865 ISS 117 0.01
710 Thomson Reuters 39 - 4,008 Jyske Bank 96 0.01
14,677 Tidewater Midstream and 3,252 Matas 23 -
Infrastructure 7 - 1,269 Netcompany 67 0.01
6,686 Timbercreek Financial 33 - 1,601 Nilfisk 18 -
1,226 TMX 95 0.01 1,601 NKT 29 -
19,007 TORC Oil & Gas 19 - 365 NNIT 5 -
6,670 Torex Gold Resources 82 0.01 44,079 Novo Nordisk 2,319 0.23
3,480 Toromont Industries 136 0.01 6,522 Novozymes 304 0.03
37,937 Toronto-Dominion Bank 1,361 0.13 1,842 Orsted 173 0.02
2,900 Total Energy Services 4 - 9,168 Pandora 405 0.04
23,321 Tourmaline Oil 171 0.02 501 Parken Sport & Entertainment 5 -
23,482 TransAlta 111 0.01 1,732 Per Aarsleff 49 -
7,500 TransAlta Renewables 63 0.01 1,895 Ringkjoebing Landbobank 108 0.01
8,200 Transcontinental 73 0.01 254 Rockwool International 'A' 50 0.01
3,000 TransGlobe Energy 1 - 569 Rockwool International 'B' 125 0.01
38,300 Trevali Mining 2 - 3,187 Royal Unibrew 218 0.02
19,023 Trican Well Service 9 - 364 RTX 9 -
8,651 Tricon Capital 46 0.01 3,562 Scandinavian Tobacco 43 -
119 Trisura 4 - 998 Schouw 64 0.01
44,534 Turquoise Hill Resources 25 - 2,109 SimCorp 183 0.02
2,455 Uni-Select 12 - 372 Solar 12 -
14,179 Vermilion Energy 50 - 5,414 Spar Nord Bank 35 -
3,300 Wajax 16 - 4,316 Sydbank 66 0.01
6,700 Wesdome Gold Mines 45 - 146 Tivoli 13 -
2,604 West Fraser Timber 71 0.01 2,583 Topdanmark 87 0.01
20,776 Western Forest Products 11 - 2,634 TORM 15 -
2,970 Westport Fuel Systems 3 - 3,330 Tryg 78 0.01
3,698 Westshore Terminals Investment 36 - 131 United International Enterprises 21 -
2,410 Wheaton Precious Metals 83 0.01 4,839 Vestas Wind Systems 402 0.04
36,483 Whitecap Resources 49 0.01 27,928 Vestjysk Bank 10 -
4,937 WildBrain 3 - 2,099 Zealand Pharma 59 0.01
1,300 Winpak 31 - 7,634 0.75
840 WPT Industrial Real Estate
Investment Trust 9 -
Dimensional Fund Advisors Ltd. Interim Report and Financial Statements, 30 June 2020 78

International Core Equity Fund
Portfolio Statement (continued)as at 30 June 2020
Holding Investment
Fair
Value
£'000
Percentage
of total
net assets
% Holding Investment
Fair
Value
£'000
Percentage
of total
net assets
%
Finland 0.54% (0.58%) France (continued)
3,215 Adapteo 22 - 2,273 Albioma 75 0.01
3,741 Aktia Bank 30 - 4,238 Alstom 162 0.02
653 Alma Media 4 - 164 Altarea 20 -
1,150 Aspo 6 - 1,731 Alten 122 0.01
750 Atria 6 - 1,401 Amundi 90 0.01
242 BasWare 7 - 364 ARGAN 27 -
2,559 Cargotec 48 0.01 5,290 Arkema 412 0.04
2,883 Caverion 15 - 470 Assystem 9 -
4,189 Citycon 24 - 5,697 Atos 393 0.04
7,946 Elisa 393 0.04 295 Aubay 8 -
358 Enento 12 - 29,442 AXA 498 0.05
5,131 Finnair 4 - 524 Axway Software 8 -
5,131 Finnair Rights 01/07/2020 18 - 191 Bastide le Confort Medical 6 -
2,864 Fiskars 27 - 3,188 Beneteau 19 -
13,093 Fortum 203 0.02 1,500 Bigben Interactive 15 -
6,467 F-Secure 17 - 855 BioMerieux 94 0.01
2,753 HKScan 5 - 16,353 BNP Paribas 525 0.05
5,679 Huhtamaki 183 0.02 386 Boiron 13 -
7,747 Kemira 81 0.01 33,524 Bollore 85 0.01
7,408 Kesko 'A' 98 0.01 1,327 Bonduelle 26 -
15,668 Kesko 'B' 221 0.02 12,003 Bouygues 331 0.03
2,172 Kojamo 37 - 12,023 Bureau Veritas 207 0.02
8,775 Kone 493 0.05 12 Burelle 6 -
2,723 Konecranes 50 0.01 4,782 Capgemini 441 0.04
2,372 Lassila & Tikanoja 29 - 2,944 Carmila 33 -
712 Lehto 1 - 29,927 Carrefour 379 0.04
7,857 Metsa Board 43 0.01 2,825 Casino Guichard Perrachon 86 0.01
3,720 Metso 100 0.01 709 Cegedim 19 -
13,487 Neste 430 0.04 65,477 CGG 59 0.01
133,556 Nokia 469 0.05 1,317 Chargeurs 16 -
5,805 Nokian Renkaat 105 0.01 20,119 Cie de Saint-Gobain 595 0.06
57,085 Nordea Bank 321 0.03 824 Cie des Alpes 13 -
702 Olvi 27 - 9,826 Cie Generale des Etablissements
6,277 Oriola 11 - Michelin 832 0.08
1,310 Orion 'A' 51 0.01 5,398 Cie Plastic Omnium 89 0.01
6,581 Orion 'B' 258 0.03 5,027 CNP Assurances 47 -
17,096 Outokumpu 39 - 6,688 Coface 35 -
6,096 Outotec 28 - 2,624 Covivio 158 0.02
658 Ponsse 15 - 20,924 Credit Agricole 160 0.02
2,352 Raisio 7 - 15,296 Danone 873 0.09
1,394 Revenio 36 - 59 Dassault Aviation 44 0.01
6,498 Sampo 181 0.02 954 Dassault Systemes 132 0.01
6,586 Sanoma 54 0.01 11,582 Derichebourg 27 -
1,495 Stockmann 1 - 427 Devoteam 28 -
26,534 Stora Enso 257 0.03 7,207 Edenred 257 0.03
452 Terveystalo 4 - 7,015 Eiffage 525 0.05
3,724 TietoEVRY 82 0.01 26,908 Electricite de France 203 0.02
2,196 Tikkurila 25 - 6,478 Elior 30 -
2,989 Tokmanni 36 - 13,503 Elis 129 0.01
20,538 UPM-Kymmene 483 0.05 42,180 Engie 433 0.04
3,300 Uponor 36 - 529 Eramet 15 -
938 Vaisala 28 - 2,647 EssilorLuxottica 278 0.03
5,429 Valmet 115 0.01 243 Esso Francaise 3 -
21,884 Wartsila 148 0.02 3,873 Etablissements Maurel et Prom 6 -
13,124 YIT 59 0.01 8,968 Europcar Mobility 17 -
5,483 0.54 16,522 Eutelsat Communications 123 0.01
6,704 Faurecia 213 0.02
France 3.11% (3.71%) 1,242 Fnac Darty 42 0.01
1,314 Gaztransport Et Technigaz 81 0.01
1,080 ABC arbitrage 7 - 1,514 Gecina 156 0.02
3,556 Accor 79 0.01 14,609 Getlink 175 0.02
1,089 Aeroports de Paris 92 0.01 799 GL Events 9 -
17,036 Air France-KLM 63 0.01 222 Groupe Crit 11 -
6,380 Air Liquide 743 0.07 400 Groupe Open 3 -
14,223 Airbus 833 0.08 539 Guerbet 17 -
1,050 AKWEL 14 - 718 Haulotte 3 -
Dimensional Fund Advisors Ltd. Interim Report and Financial Statements, 30 June 2020 79

International Core Equity Fund
Portfolio Statement (continued)as at 30 June 2020
Holding Investment
Fair
Value
£'000
Percentage
of total
net assets
% Holding Investment
Fair
Value
£'000
Percentage
of total
net assets
%
France (continued) France (continued)
717 Hermes International 487 0.05 37,654 Solocal* 6 -
171 HEXAOM 5 - 245 Somfy 20 -
1,649 ICADE 95 0.01 1,191 Sopra Steria 119 0.01
158 ID Logistics 25 - 6,831 SPIE 83 0.01
3,118 Iliad 493 0.05 169 Stef 11 -
1,994 Imerys 55 0.01 17,300 Suez 166 0.02
3,225 Ingenico 420 0.04 756 Sword 20 -
1,717 Ipsen 119 0.01 644 Synergie 13 -
2,977 IPSOS 61 0.01 2,338 Tarkett 21 -
1,388 Jacquet Metal Service 15 - 940 Technicolor 2 -
6,390 JCDecaux 96 0.01 2,526 Teleperformance 517 0.05
1,383 Kaufman & Broad 38 - 2,237 Television Francaise 1 10 -
1,774 Kering 787 0.08 4,429 Thales 294 0.03
7,219 Klepierre 118 0.01 290 Thermador 14 -
3,704 Korian 110 0.01 63,704 TOTAL 1,981 0.19
7,332 Lagardere 85 0.01 70 Total Gabon 7 -
44 Laurent-Perrier 3 - 657 Trigano 54 0.01
1,252 Lectra 19 - 4,692 Ubisoft Entertainment 309 0.03
9,908 Legrand 617 0.06 4,145 Unibail-Rodamco-Westfield 191 0.02
178 Linedata Services 4 - 19,844 Unibail-Rodamco-Westfield CDI 45 0.01
1,242 LISI 21 - 23,699 Valeo 509 0.05
224 LNA Sante 10 - 537 Vallourec 19 -
1,910 L'Oreal 499 0.05 3,039 Valneva 12 -
7,137 LVMH Moet Hennessy Louis Vuitton 2,554 0.25 16,105 Veolia Environnement 300 0.03
3,351 Maisons du Monde 36 - 193 Vetoquinol 11 -
313 Manitou BF 5 - 1,198 Vicat 30 -
2,319 Mercialys 16 - 599 Vilmorin 26 -
1,472 Mersen 28 - 14,035 Vinci 1,063 0.11
1,769 Metropole Television 16 - 225 Virbac 40 -
29,065 Natixis 62 0.01 8,114 Vivendi 170 0.02
1,789 Nexans 68 0.01 1,153 Worldline 81 0.01
3,061 Nexity 81 0.01 31,709 3.11
850 NRJ 4 -
1,576 Oeneo 16 - Germany 2.88% (3.26%)
111,831 Orange 1,090 0.11
2,055 Orpea 194 0.02 2,896 1&1 Drillisch 61 0.01
1,017 Pernod Ricard 131 0.01 3,041 7C Solarparken 10 -
41,812 Peugeot 555 0.06 3,669 Aareal Bank 58 0.01
517 Pierre & Vacances 7 - 4,239 adidas 901 0.09
728 Plastivaloire 2 - 2,379 ADO Properties 53 0.01
15,630 Publicis 408 0.04 5,273 ADVA Optical Networking 28 -
2,586 Quadient 30 - 3,938 AIXTRON 38 -
1,330 Recylex* 2 - 433 Allgeier 13 -
8,048 Renault 163 0.02 5,041 Allianz 831 0.08
19,797 Rexel 187 0.02 7,248 alstria office REIT 89 0.01
21 Robertet 18 - 289 Amadeus Fire 29 -
1,961 Rothschild 39 - 380,000 Apollo Future Mobility 19 -
4,244 Rubis 166 0.02 36,055 Aroundtown 173 0.02
4,844 Safran 403 0.04 376 Atoss Software 35 -
14,599 Sanofi 1,206 0.12 2,058 Aurubis 103 0.01
999 Sartorius Stedim Biotech 200 0.02 13,173 BASF 601 0.06
381 Savencia 19 - 159 Basler 8 -
9,473 Schneider Electric 858 0.08 1,235 Bauer 11 -
6,681 SCOR 148 0.02 21,322 Bayer 1,289 0.13
1,375 SEB 182 0.02 16,335 Bayerische Motoren Werke 841 0.08
355 Seche Environnement 11 - 2,970 Bayerische Motoren Werke Preference
13,565 SES 75 0.01 Shares 116 0.01
1,045 Societe BIC 43 - 1,132 BayWa 30 -
254 Societe de la Tour Eiffel 7 - 1,884 Bechtle 268 0.03
285 Societe des Bains de Mer et du 632 Befesa 20 -
Cercle des Etrangers a Monaco 13 - 1,046 Beiersdorf 97 0.01
19,375 Societe Generale 260 0.03 504 Bertrandt 16 -
471 Societe pour l'Informatique 306 bet-at-home.com 11 -
Industrielle 9 - 264 Bijou Brigitte 7 -
3,679 Sodexo 205 0.02 872 Bilfinger 13 -
988 SOITEC 89 0.01 591 Biotest Preference Shares 11 -
Dimensional Fund Advisors Ltd. Interim Report and Financial Statements, 30 June 2020 80

International Core Equity Fund
Portfolio Statement (continued)as at 30 June 2020
Holding Investment
Fair
Value
£'000
Percentage
of total
net assets
% Holding Investment
Fair
Value
£'000
Percentage
of total
net assets
%
Germany (continued) Germany (continued)
2,962 Borussia Dortmund 16 - 2,008 Henkel Preference Shares 154 0.02
7,581 Brenntag 325 0.03 1,204 HOCHTIEF 88 0.01
1,406 CANCOM 61 0.01 392 Hornbach 26 -
822 Carl Zeiss Meditec 65 0.01 647 Hornbach Baumarkt 17 -
12,386 CECONOMY 35 - 4,809 HUGO BOSS 118 0.01
738 CENIT 6 - 52 Hypoport 19 -
322 Centrotec 4 - 1,866 Indus 51 -
498 Cewe Stiftung 44 0.01 53,979 Infineon Technologies 1,025 0.10
152 comdirect bank 2 - 1,031 Instone Real Estate 18 -
49,878 Commerzbank 179 0.02 1,761 Jenoptik 33 -
1,120 CompuGroup Medical 72 0.01 3,557 Jungheinrich Preference Shares 67 0.01
6,439 Continental 515 0.05 13,109 K+S 67 0.01
810 Corestate Capital 14 - 5,872 KION 294 0.03
14,330 Covestro 448 0.04 5,434 Kloeckner 24 -
1,768 CropEnergies 14 - 125 Knorr-Bremse 10 -
3,684 CTS Eventim 124 0.01 1,170 Koenig & Bauer 21 -
48,331 Daimler 1,584 0.16 717 Krones 38 -
1,046 Delivery Hero 86 0.01 610 KWS Saat 38 -
195 Dermapharm 8 - 7,349 LANXESS 318 0.03
50,565 Deutsche Bank 384 0.04 2,896 LEG Immobilien 303 0.03
741 Deutsche Beteiligungs 20 - 1,725 Leoni 11 -
4,012 Deutsche Boerse 585 0.06 31,500 L'Occitane International 43 0.01
2,565 Deutsche EuroShop 30 - 873 LPKF Laser & Electronics 15 -
17,423 Deutsche Lufthansa 143 0.01 240 Manz 4 -
9,583 Deutsche Pfandbriefbank 56 0.01 1,166 Merck (EUR) 109 0.01
28,319 Deutsche Post 844 0.08 15,318 METRO 119 0.01
112,905 Deutsche Telekom 1,540 0.15 4,064 MLP 20 -
8,328 Deutsche Wohnen 304 0.03 2,300 MTU Aero Engines 327 0.03
11,610 Deutz 45 0.01 1,796 Muenchener
5,527 Dialog Semiconductor 200 0.02 Rueckversicherungs-Gesellschaft in Muenchen 375 0.04
139 Dr Hoenle 6 - 3,424 Nemetschek 189 0.02
216 Draegerwerk 12 - 154 New Work 38 -
479 Draegerwerk Preference Shares 31 - 778 Nexus 28 -
2,735 Duerr 58 0.01 3,965 Nordex 32 -
7,976 E.ON 74 0.01 1,530 Norma 33 -
180 Eckert & Ziegler Strahlen- und 148 OHB 6 -
Medizintechnik 25 - 4,735 OSRAM Licht 177 0.02
177 Elmos Semiconductor 3 - 2,631 PATRIZIA 53 0.01
1,524 ElringKlinger 7 - 131 Pfeiffer Vacuum Technology 20 -
557 Energiekontor 11 - 8,165 PNE 37 -
6,823 Evonik Industries 142 0.01 3,752 Porsche Automobil Preference Shares 175 0.02
705 Evotec 16 - 11,705 ProSiebenSat.1 Media 114 0.01
1,473 Fielmann 81 0.01 2,670 Puma 166 0.02
2,767 Fraport Frankfurt Airport Services 6,500 QSC 8 -
Worldwide 98 0.01 129 Rational 59 0.01
10,355 Freenet 135 0.01 2,799 Rheinmetall 197 0.02
11,069 Fresenius 443 0.04 1,529 RHOEN-KLINIKUM 25 -
7,356 Fresenius Medical Care 509 0.05 2,054 RIB Software 54 0.01
1,917 FUCHS PETROLUB 52 0.01 4,338 Rocket Internet 76 0.01
3,210 FUCHS PETROLUB Preference Shares 104 0.01 2,324 RTL 61 0.01
3,556 GEA 92 0.01 15,666 RWE 446 0.04
1,955 Gerresheimer 145 0.02 4,213 SAF-Holland 21 -
569 Gesco 8 - 2,446 Salzgitter 28 -
864 GFT Technologies 8 - 11,881 SAP 1,336 0.13
274 Grammer 5 - 1,368 Sartorius Preference Shares 361 0.04
4,577 Grand City Properties 87 0.01 8,196 Schaeffler Preference Shares 50 0.01
1,012 H&R 5 - 436 Schaltbau 10 -
4,704 Hamborner REIT 38 - 2,431 Scout24 153 0.02
1,777 Hamburger Hafen und Logistik 25 - 2,479 SGL Carbon 7 -
797 Hannover Rueck 111 0.01 10,929 Siemens 1,038 0.10
1,951 Hapag-Lloyd 94 0.01 1,057 Siltronic 87 0.01
5,005 HeidelbergCement 218 0.02 1,254 Sixt 79 0.01
20,096 Heidelberger Druckmaschinen 11 - 968 Sixt Leasing 16 -
3,467 Hella 117 0.01 1,412 Sixt Preference Shares 59 0.01
3,667 HelloFresh 160 0.02 440 SMA Solar Technology 11 -
775 Henkel 53 0.01 1,863 Software 61 0.01
Dimensional Fund Advisors Ltd. Interim Report and Financial Statements, 30 June 2020 81

International Core Equity Fund
Portfolio Statement (continued)as at 30 June 2020
Holding Investment
Fair
Value
£'000
Percentage
of total
net assets
% Holding Investment
Fair
Value
£'000
Percentage
of total
net assets
%
Germany (continued) Hong Kong (continued)
1,079 Stabilus 47 0.01 564,000 Convoy Global* 2 -
157 STO Preference Shares 14 - 22,000 Cross-Harbour 25 -
343 STRATEC 27 - 330,000 CSI Properties 8 -
1,636 Stroeer 90 0.01 2,368,000 CST 5 -
5,718 Suedzucker 74 0.01 34,082 Dah Sing Banking 25 -
703 SUESS MicroTec 9 - 11,567 Dah Sing Financial 26 -
216 Surteco 4 - 12,300 Dairy Farm International 47 0.01
4,160 Symrise 394 0.04 24,000 Dickson Concepts International 11 -
6,624 TAG Immobilien 130 0.01 240,000 Emperor Capital 3 -
2,975 Takkt 25 - 56,000 Emperor International 8 -
2,621 Talanx 78 0.01 260,000 Emperor Watch & Jewellery 3 -
426 Technotrans 6 - 4,050 Endeavour Mining 77 0.01
988 Tele Columbus 3 - 98,307 Esprit 9 -
70,702 Telefonica Deutschland 171 0.02 3,000 Fairwood 5 -
8,830 thyssenkrupp 50 0.01 90,517 Far East Consortium International 24 -
4,211 Uniper 111 0.01 195,000 FIH Mobile 17 -
5,417 United Internet 186 0.02 194,000 First Pacific 30 -
135 Varta 13 - 67,000 Fortune Real Estate Investment Trust 49 0.01
1,962 VERBIO Vereinigte BioEnergie 17 - 59,000 Galaxy Entertainment 327 0.03
2,031 Volkswagen 266 0.03 44,000 Genting Hong Kong 3 -
10,987 Volkswagen Preference Shares 1,349 0.13 390,000 Get Nice 5 -
8,795 Vonovia 443 0.04 86,000 Giordano International 10 -
748 Vossloh 27 - 933 Golar LNG 6 -
1,069 Wacker Chemie 60 0.01 22,000 Gold-Finance* - -
1,691 Wacker Neuson 21 - 70,000 Goodbaby International 6 -
693 Washtec 23 - 14,128 Great Eagle 29 -
1,771 Wuestenrot & Wuerttembergische 25 - 1,209,600 G-Resources 5 -
1,549 Zalando 89 0.01 5,000 Guoco 58 0.01
1,076 Zeal Network 31 - 220,000 Guotai Junan International 23 -
29,363 2.88 169,754 Haitong International Securities 33 -
50,000 Hang Lung 95 0.01
Greece 0.00% (0.00%) 71,000 Hang Lung Properties 137 0.01
26,700 Hang Seng Bank 365 0.04
6,409 TT Hellenic Postbank* - - 14,011 Hanison Construction 2 -
- - 4,000 Harbour Centre Development 3 -
35,792 Henderson Land Development 110 0.01
Hong Kong 1.18% (1.20%) 84,500 HK Electric Investments & HK
Electric Investments 71 0.01
8,000 Aeon Credit Service Asia 5 - 29,500 HKBN 42 0.01
257,700 AIA 1,955 0.19 42,239 HKR International 14 -
82,000 Allied Properties HK 16 - 248,000 HKT Trust & HKT 295 0.03
27,000 APT Satellite 6 - 24,000 Hon Kwok Land Investment 6 -
11,300 ASM Pacific Technology 97 0.01 93,345 Hong Kong & China Gas 117 0.01
59,593 Bank of East Asia 111 0.01 28,712 Hong Kong Exchanges & Clearing 995 0.10
88,000 BOC Hong Kong 228 0.02 10,000 Hong Kong Ferry 6 -
23,000 BOE Varitronix 6 - 35,827 Hongkong & Shanghai Hotels 26 -
52,000 Bright Smart Securities & Commodities 8 - 30,130 Hongkong Land 101 0.01
85,000 Brightoil Petroleum* 3 - 352,200 Hutchison Port Trust 28 -
24,000 Cafe de Coral 40 - 109,000 Hutchison Telecommunications Hong
14,000 Camsing International* - - Kong 14 -
61,000 Cathay Pacific Airways 48 0.01 24,900 Hysan Development 65 0.01
113,795 Champion REIT 48 0.01 22,000 IT 3 -
466,000 China Energy Development 8 - 586 ITC Properties - -
34,000 China New Higher Education 18 - 27,098 Johnson Electric 39 -
80,000 China Star Entertainment 14 - 63,000 K Wah International 22 -
685,000 China Strategic 2 - 54,500 Kerry Logistics Network 59 0.01
26,000 Chinese Estates 14 - 31,500 Kerry Properties 66 0.01
14,000 Chong Hing Bank 14 - 218,000 Kingston Financial 16 -
16,000 Chow Sang Sang International 14 - 27,000 Kowloon Development 24 -
74,000 Chow Tai Fook Jewellery 58 0.01 18,413 Lai Sun Development 15 -
171,000 CITIC Telecom International 44 0.01 74,400 Landing International Development 2 -
88,448 CK Asset 428 0.04 39,500 Langham Hospitality Investments 5 -
57,948 CK Hutchison 303 0.03 50,000 Leyou Technologies 13 -
16,000 CK Infrastructure 67 0.01 32,000 Lifestyle International 21 -
24,500 CLP 195 0.02 58,866 Link REIT 392 0.04
37,500 CNQC International 3 - 12,000 Liu Chong Hing Investment 9 -
Dimensional Fund Advisors Ltd. Interim Report and Financial Statements, 30 June 2020 82

International Core Equity Fund
Portfolio Statement (continued)as at 30 June 2020
Holding Investment
Fair
Value
£'000
Percentage
of total
net assets
% Holding Investment
Fair
Value
£'000
Percentage
of total
net assets
%
Hong Kong (continued) Hong Kong (continued)
26,000 Luk Fook International 46 0.01 172,000 Xinyi Glass 171 0.02
128,000 Macau Legend Development 14 - 66,000 Yue Yuen Industrial 82 0.01
124,800 Man Wah 97 0.01 210,000 Zensun Enterprises 8 -
6,500 Mandarin Oriental International 8 - 12,095 1.18
1,355,200 Mason 3 -
9,700 Meituan Dianping 176 0.02 Ireland 0.82% (0.83%)
53,000 Melco International Development 84 0.01
40,000 MGM China 42 - 13,256 Accenture 2,295 0.23
10,000 Miramar Hotel & Investment 15 - 31,170 AIB 32 -
26,158 MTR 110 0.01 10,615 Alkermes 167 0.02
106,000 NagaCorp 100 0.01 4,744 Allegion 385 0.04
41,023 New World Development 159 0.02 8,435 Aptiv 519 0.05
48,000 NewOcean Energy 4 - 2,040 Ardmore Shipping 7 -
92,070 NWS 64 0.01 53,227 Bank of Ireland 89 0.01
32,000 OP Financial 3 - 31,082 Cairn Homes 26 -
340,800 Oshidori International 34 - 1,626 Cimpress 109 0.01
377,000 Pacific Basin Shipping 44 0.01 34,977 CRH 974 0.10
80,000 Pacific Textiles 31 - 4,287 Datalex* 1 -
290,674 PCCW 135 0.01 8,826 Endo International 25 -
32,000 Pico Far East 4 - 2,133 FBD 13 -
97,700 Polytec Asset 8 - 3,139 Flutter Entertainment (GBP) 336 0.03
29,500 Power Assets 131 0.01 1,998 Flutter Entertainment (EUR) 213 0.02
82,000 Prosperity REIT 20 - 6,738 Glanbia 62 0.01
18,000 Regal Hotels International 6 - 36,713 Hibernia REIT 38 -
40,000 Regal Real Estate Investment Trust 5 - 11,517 Irish Continental 38 -
22,000 Regina Miracle International 5 - 22,103 Irish Residential Properties REIT 29 -
62,052 Sa International 8 - 15,183 James Hardie Industries CDI 232 0.02
54,200 Sands China 173 0.02 3,536 Jazz Pharmaceuticals 315 0.03
13,169 SEA 8 - 1,795 Kerry 179 0.02
72,666 Shangri-La Asia 51 0.01 8,882 Kingspan 465 0.05
138,500 Shun Tak 42 0.01 14,418 Medtronic 1,059 0.10
70,000 Singamas Container 4 - 7,493 Permanent TSB 4 -
91,165 Sino Land 93 0.01 8,928 Perrigo 396 0.04
112,000 SITC International 97 0.01 2,848 Prothena 24 -
117,000 SJM 106 0.01 13,670 Smurfit Kappa 364 0.04
21,349 SmarTone Telecommunications 9 - 8,396 0.82
5,000 Soundwill 4 -
22,500 Stella International 19 - Israel 0.26% (0.29%)
31,908 Sun Hung Kai 10 -
24,514 Sun Hung Kai Properties 255 0.03 995 AFI Properties 19 -
33,000 SUNeVision 21 - 3,556 Airport City 31 0.01
65,000 Sunlight Real Estate Investment Trust 26 - 1,483 Allot 12 -
22,500 Swire Pacific 'A' 97 0.01 4,961 Alony Hetz Properties & Investments 40 0.01
45,000 Swire Pacific 'B' 35 - 390 Alrov Properties and Lodgings 8 -
26,200 Swire Properties 53 0.01 6,601 Amot Investments 25 -
23,000 TAI Cheung 12 - 700 Arad 9 -
61,500 Techtronic Industries 489 0.05 28,036 Arko 4 -
17,000 Television Broadcasts 16 - 1,276 Ashtrom 11 -
48,000 Texwinca 6 - 406 AudioCodes 10 -
18,000 TK 4 - 378 Azrieli 14 -
58,000 TOM 7 - 18,806 Bank Hapoalim 91 0.01
17,214 Transport International 27 - 60,593 Bank Leumi Le-Israel 246 0.03
88,000 United Laboratories International 62 0.01 30 Bayside Land 13 -
31,000 Value Partners 13 - 323 Bet Shemesh Engines 1997 5 -
26,500 Valuetronics 9 - 64,726 Bezeq The Israeli Telecommunication 49 0.01
44,000 Vitasoy International 137 0.01 140 Big Shopping Centers 8 -
40,000 VSTECS 17 - 306 Blue Square Real Estate 9 -
10,400 VTech 51 0.01 1,220 Camtek 12 -
20,000 Wai Kee 8 - 2,654 Cellcom Israel 8 -
550,500 WH 384 0.04 3,608 Clal Insurance Enterprises 25 -
48,652 Wharf 80 0.01 299 Danel Adir Yeoshua 23 -
12,652 Wharf Real Estate Investment 49 - 302 Delek 6 -
15,082 Wheelock* 97 0.01 2,490 Delek Automotive Systems 8 -
6,000 Wing On Co International 11 - 362 Delta Galil Industries 3 -
20,000 Wing Tai Properties 8 - 650 Dor Alon Energy in Israel 1988 9 -
55,600 Wynn Macau 78 0.01 24,826 El Al Israel Airlines 3 -
Dimensional Fund Advisors Ltd. Interim Report and Financial Statements, 30 June 2020 83

International Core Equity Fund
Portfolio Statement (continued)as at 30 June 2020
Holding Investment
Fair
Value
£'000
Percentage
of total
net assets
% Holding Investment
Fair
Value
£'000
Percentage
of total
net assets
%
Israel (continued) Italy (continued)
69 Electra 24 - 683 Avio 9 -
420 Electra Consumer Products 1970 8 - 6,316 Azimut 88 0.01
4,469 Energix-Renewable Energies 14 - 718,824 Banca Carige* - -
1,050 Equital 15 - 9,021 Banca Farmafactoring 42 0.01
3,162 First International Bank Of Israel 55 0.01 2,878 Banca Generali 69 0.01
402 Formula Systems 1985 25 - 1,058 Banca IFIS 8 -
984 Fox Wizel 30 0.01 6,681 Banca Mediolanum 39 -
1,381 Gilat Satellite Networks 7 - 938 Banca Monte dei Paschi di Siena 1 -
180 Hadera Paper 4 - 27,599 Banca Popolare di Sondrio SCPA 43 0.01
9,938 Harel Insurance Investments & 94,868 Banco BPM 116 0.01
Financial Services 44 0.01 916 Biesse 9 -
937 Hilan 31 0.01 27,596 BPER Banca 56 0.01
33,328 ICL 81 0.01 1,657 Brunello Cucinelli 40 -
582 IDI Insurance 11 - 3,245 Buzzi Unicem 56 0.01
4,086 Inrom Construction Industries 11 - 2,290 Buzzi Unicem Preference Shares 23 -
930 Isracard 2 - 5,601 Cairo Communication 8 -
41,775 Israel Discount Bank 105 0.01 3,372 Cementir 20 -
85 Isras Investment 9 - 10,551 Cerved 61 0.01
2,210 Kamada 14 - 55,531 CIR SpA-Compagnie Industriali 20 -
1,422 Magic Software Enterprises 13 - 1,059 COIMA RES 6 -
1,944 Matrix IT 33 - 5,895 Credito Emiliano 24 -
2,340 Maytronics 21 - 5,023 Credito Valtellinese 24 -
3,932 Mediterranean Towers 7 - 1,059 Danieli & C Officine Meccaniche 11 -
40 Mehadrin 1 - 797 Datalogic 8 -
3,380 Meitav Dash Investments 7 - 14,390 Davide Campari-Milano 99 0.01
1,084 Melisron 33 - 3,392 De' Longhi 72 0.01
2,595 Menora Mivtachim 21 - 1,288 DiaSorin 197 0.02
22,087 Migdal Insurance & Financial 9 - 516 El.En. 10 -
9,401 Mivne Real Estate KD 14 - 10,201 Enav 38 -
4,347 Mizrahi Tefahot Bank 66 0.01 135,636 Enel 963 0.10
1,927 Naphtha Israel Petroleum 5 - 54,885 Eni 428 0.04
1,894 Nawi Brothers 6 - 3,272 ERG 59 0.01
1,413 Nice 213 0.02 2,782 Esprinet 9 -
1,948 Nova Measuring Instruments 74 0.01 4,992 Falck Renewables 24 -
170,227 Oil Refineries 26 - 3,298 Ferrari 456 0.05
160 One Software Technologies 10 - 74,305 Fiat Chrysler Automobiles 606 0.06
1,869 OPC Energy 12 - 643 Fila 5 -
7,143 Partner Communications 24 - 31,958 Fincantieri 18 -
601 Paz Oil 39 0.01 17,336 FinecoBank Banca Fineco 190 0.02
7,447 Phoenix 22 - 8,529 Freni Brembo 64 0.01
441 Rami Levy Chain Stores Hashikma 2,809 Geox 2 -
Marketing 2006 20 - 1,693 Gruppo MutuiOnline 29 -
779 Sapiens International (ILS) 17 - 50,753 Hera 157 0.02
1,827 Sapiens International (USD) 39 - 2,342 Illimity Bank 15 -
362 Scope Metals 4 - 930 IMA Industria Macchine Automatiche 45 -
7,247 Shapir Engineering and Industry 35 - 3,723 Immobiliare Grande Distribuzione SIIQ 12 -
12,857 Shikun & Binui 36 0.01 26,300 IMMSI 9 -
7,599 Shufersal 40 0.01 4,477 Interpump 108 0.01
1,794 SolarEdge Technologies 200 0.02 193,018 Intesa Sanpaolo 297 0.03
2,562 Strauss 58 0.01 35,997 Iren 73 0.01
3,582 Summit Real Estate 26 - 25,370 Italgas 122 0.01
2,047 Taro Pharmaceutical Industries 111 0.01 1,110 Italmobiliare 30 -
13,495 Teva Pharmaceutical Industries 133 0.01 27,724 Juventus Football Club 23 -
6,490 Tower Semiconductor 99 0.01 22,165 Leonardo 119 0.01
2,665 0.26 3,914 Maire Tecnimont 6 -
1,542 MARR 19 -
Italy 0.88% (1.13%) 27,049 Mediaset 39 -
21,572 Mediobanca Banca di Credito
75,659 A2A 88 0.01 Finanziario 125 0.01
2,965 ACEA 47 0.01 10,417 Moncler 329 0.03
7,878 Amplifon 169 0.02 21,332 OVS 19 -
19,233 Anima 67 0.01 11,885 Piaggio & C 23 -
13,188 Arnoldo Mondadori Editore 12 - 18,078 Pirelli & C 63 0.01
18,167 Assicurazioni Generali 221 0.02 16,889 Poste Italiane 122 0.01
14,841 Atlantia 197 0.02 23,800 PRADA 67 0.01
6,591 Autogrill 28 - 7,638 Prysmian 144 0.01
Dimensional Fund Advisors Ltd. Interim Report and Financial Statements, 30 June 2020 84

International Core Equity Fund
Portfolio Statement (continued)as at 30 June 2020
Holding Investment
Fair
Value
£'000
Percentage
of total
net assets
% Holding Investment
Fair
Value
£'000
Percentage
of total
net assets
%
Italy (continued) Japan (continued)
4,804 RAI Way 25 - 9,600 Akebono Brake Industry 12 -
5,915 Recordati 241 0.02 1,100 Akita Bank 12 -
16,476 Reno de Medici 10 - 200 Albis 3 -
1,013 Reply 66 0.01 1,600 Alconix 14 -
4,328 Retelit 7 - 3,800 Alfresa 65 0.01
8,998 Safilo 6 - 700 Alpen 9 -
35,892 Saipem 73 0.01 15,700 Alps Alpine 164 0.02
3,727 Salvatore Ferragamo 41 - 1,100 Altech 16 -
34,767 Saras 22 - 12,800 Amada 85 0.01
281 Sesa 14 - 2,300 Amano 39 -
69,685 Snam 277 0.03 1,500 Amuse 25 -
10,907 Societa Cattolica di Assicurazioni 51 0.01 2,900 ANA 54 0.01
4,271 Sogefi 3 - 1,800 Anest Iwata 11 -
1,345 SOL 13 - 4,700 Anritsu 91 0.01
4,098 Tamburi Investment Partners 22 - 1,700 AOI TYO 6 -
3,268 Technogym 22 - 3,000 AOKI 14 -
487,754 Telecom Italia 159 0.02 1,000 Aomori Bank 17 -
322,340 Telecom Italia Preference Shares 103 0.01 3,600 Aoyama Trading 20 -
11,583 Tenaris 61 0.01 5,400 Aozora Bank 76 0.01
47,892 Terna Rete Elettrica Nazionale 270 0.03 1,600 Arakawa Chemical Industries 15 -
1,629 Tinexta 18 - 800 Arata 29 -
511 Tod's 12 - 2,400 Arcland Sakamoto 34 0.01
43,578 UniCredit 325 0.03 3,500 Arcs 57 0.01
1,159 Unieuro 8 - 1,100 Argo Graphics 28 -
65,799 Unione di Banche Italiane 173 0.02 700 Ariake Japan 36 -
29,977 Unipol Gruppo 95 0.01 2,600 Arisawa Manufacturing 16 -
26,491 UnipolSai Assicurazioni 51 - 300 As One 27 -
12,247 Webuild 16 - 1,200 Asahi 13 -
1,377 Zignago Vetro 17 - 3,600 Asahi Diamond Industrial 13 -
9,046 0.88 10,509 Asahi Group 300 0.03
3,100 Asahi Holdings 67 0.01
Japan 9.59% (10.21%) 8,800 Asahi Intecc 204 0.02
52,483 Asahi Kasei 346 0.03
3,800 77 Bank 46 0.01 700 ASAHI YUKIZAI 8 -
1,100 A&D 6 - 400 Asanuma 12 -
800 ABC-Mart 38 0.01 2,800 Asia Pile 10 -
1,800 Achilles 26 - 5,800 Asics 54 0.01
10,600 Acom 33 - 1,600 ASKA Pharmaceutical 15 -
19 Activia Properties 53 0.01 1,100 ASKUL 29 -
2,180 Adastria 28 - 47,306 Astellas Pharma 643 0.06
6,600 ADEKA 71 0.01 800 Ateam 5 -
1,200 Advan 12 - 6,000 Atom 37 -
44 Advance Residence Investment 106 0.01 3,900 Autobacs Seven 40 -
5,500 Advantest 253 0.03 2,100 Avex 14 -
17,179 Aeon 325 0.03 2,200 Awa Bank 40 0.01
1,000 Aeon Delight 23 - 1,000 Axial Retailing 33 -
800 Aeon Fantasy 9 - 3,100 Azbil 77 0.01
9,400 AEON Financial Service 83 0.01 4,591 Bandai Namco 196 0.02
3,260 Aeon Mall 35 - 2,500 Bando Chemical Industries 12 -
77 AEON REIT Investment 67 0.01 900 Bank of Iwate 18 -
7,061 AGC 163 0.02 2,500 Bank of Kyoto 72 0.01
1,900 Ai 22 - 800 Bank of Nagoya 14 -
1,100 Aica Kogyo 29 - 1,360 Bank of Okinawa 32 -
400 Aichi 2 - 1,200 Bank of Saga 11 -
400 Aichi Bank 8 - 2,500 Bank of the Ryukyus 18 -
600 Aichi Steel 14 - 900 BayCurrent Consulting 61 0.01
3,400 Aida Engineering 19 - 500 Belc 28 -
19,800 Aiful 35 - 2,600 Bell System24 27 -
1,600 Ain 85 0.01 2,800 Belluna 13 -
700 Aiphone 8 - 3,200 Benefit One 52 0.01
9,000 Air Water 103 0.01 2,900 Benesse 63 0.01
3,600 Aisan Industry 14 - 1,400 BeNEXT 10 -
5,566 Aisin Seiki 132 0.01 300 Bengo4.com 23 -
2,200 Aizawa Securities 11 - 3,100 Bic Camera 27 -
7,628 Ajinomoto 103 0.01 1,400 BML 30 -
400 Akatsuki 11 - 400 BrainPad 14 -
Dimensional Fund Advisors Ltd. Interim Report and Financial Statements, 30 June 2020 85

International Core Equity Fund
Portfolio Statement (continued)as at 30 June 2020
Holding Investment
Fair
Value
£'000
Percentage
of total
net assets
% Holding Investment
Fair
Value
£'000
Percentage
of total
net assets
%
Japan (continued) Japan (continued)
17,932 Bridgestone 470 0.05 1,000 Daiho 18 -
3,800 Broadleaf 15 - 600 Daiichi Jitsugyo 16 -
500 BRONCO BILLY 9 - 900 Daiichi Kigenso Kagaku-Kogyo 5 -
13,182 Brother Industries 193 0.02 14,271 Dai-ichi Life 138 0.02
4,700 Bunka Shutter 26 - 1,751 Daiichi Sankyo 116 0.01
400 C Uyemura 19 - 700 Dai-ichi Seiko 11 -
2,800 Calbee 63 0.01 2,900 Daiichikosho 70 0.01
18,919 Canon 305 0.03 500 Daiken 7 -
1,800 Canon Electronics 22 - 1,800 Daiki Aluminium Industry 8 -
2,600 Canon Marketing Japan 43 0.01 5,408 Daikin Industries 708 0.07
2,100 Capcom 62 0.01 400 Daikokutenbussan 15 -
1,300 Carlit 5 - 2,000 Daikyonishikawa 7 -
8,200 Casio Computer 116 0.01 600 Dainichiseika Color & Chemicals
1,000 Cawachi 21 - Manufacturing 10 -
900 Central Automotive Products 14 - 6,000 Daio Paper 65 0.01
2,600 Central Glass 36 0.01 1,300 Daiseki 28 -
2,653 Central Japan Railway 335 0.03 2,650 Daishi Hokuetsu Financial 44 0.01
300 Central Security Patrols 10 - 1,000 Daito Pharmaceutical 30 -
400 Central Sports 7 - 2,935 Daito Trust Construction 220 0.02
400 Change 23 - 1,300 Daitron 16 -
23,530 Chiba Bank 90 0.01 26,952 Daiwa House Industry 516 0.05
2,100 Chilled & Frozen Logistics 25 - 66 Daiwa House REIT Investment 127 0.01
800 Chiyoda 7 - 2,700 Daiwa Industries 18 -
1,000 Chiyoda Integre 12 - 8 Daiwa Office Investment 36 -
1,200 Chofu Seisakusho 20 - 42,582 Daiwa Securities 145 0.02
700 Chori 10 - 86 Daiwa Securities Living Investments 65 0.01
9,028 Chubu Electric Power 92 0.01 2,000 Daiwabo 106 0.01
1,200 Chubu Shiryo 15 - 7,900 DCM 74 0.01
1,900 Chudenko 33 - 3,800 DeNA 39 -
700 Chuetsu Pulp & Paper 8 - 5,500 Denka 110 0.01
7,500 Chugai Pharmaceutical 326 0.03 400 Denki Kogyo 8 -
7,800 Chugoku Bank 59 0.01 7,449 Denso 236 0.02
6,600 Chugoku Electric Power 72 0.01 3,678 Dentsu 71 0.01
4,500 Chugoku Marine Paints 27 - 1,300 Denyo 19 -
900 Chukyo Bank 15 - 700 Descente 8 -
3,000 CI Takiron 16 - 5,800 Dexerials 37 0.01
21,100 Citizen Watch 56 0.01 6,800 DIC 139 0.02
900 CMIC 10 - 800 Digital Arts 52 0.01
2,300 CMK 7 - 1,300 Digital Garage 33 -
3,425 Coca-Cola Bottlers Japan 51 0.01 2,300 Dip 38 0.01
900 cocokara fine 39 - 300 Disco 59 0.01
3,800 Colowide 42 0.01 600 DKS 23 -
30 Comforia Residential REIT 73 0.01 7,400 DMG Mori 73 0.01
1,500 Computer Engineering & Consulting 19 - 1,100 Doshisha 14 -
2,600 COMSYS 63 0.01 1,700 Doutor Nichires 22 -
1,400 Comture 30 - 3,700 Dowa 91 0.01
29,310 Concordia Financial 76 0.01 2,000 DTS 34 -
800 CONEXIO 9 - 2,600 Duskin 54 0.01
1,100 Corona 8 - 600 DyDo 22 -
5,100 Cosmo Energy 60 0.01 1,800 Eagle Industry 10 -
800 Cosmos Pharmaceutical 100 0.01 500 Earth 31 -
5,000 Create Restaurants 27 - 5,476 East Japan Railway 309 0.03
1,800 Create SD 45 0.01 5,600 Ebara 107 0.01
11,000 Credit Saison 102 0.01 6,600 EDION 55 0.01
1,000 CTI Engineering 13 - 900 eGuarantee 17 -
2,400 Curves 11 - 1,800 Ehime Bank 16 -
4,100 CyberAgent 164 0.02 1,600 Eiken Chemical 21 -
1,200 Cybozu 30 - 1,831 Eisai 118 0.01
5,377 Dai Nippon Printing 100 0.01 1,500 Eizo 46 0.01
2,500 Daibiru 18 - 1,000 Elan 14 -
18,000 Daicel 113 0.01 1,100 Elecom 44 0.01
500 Dai-Dan 11 - 2,400 Electric Power Development 37 -
3,500 Daido Metal 14 - 1,400 Elematec 9 -
2,000 Daido Steel 50 0.01 2,000 EM Systems 15 -
1,700 Daifuku 121 0.01 60,234 ENEOS 174 0.02
1,000 Daihen 29 - 1,600 Enigmo 16 -
Dimensional Fund Advisors Ltd. Interim Report and Financial Statements, 30 June 2020 86

International Core Equity Fund
Portfolio Statement (continued)as at 30 June 2020
Holding Investment
Fair
Value
£'000
Percentage
of total
net assets
% Holding Investment
Fair
Value
£'000
Percentage
of total
net assets
%
Japan (continued) Japan (continued)
2,300 en-japan 46 0.01 2,200 Fuyo General Lease 100 0.01
600 Enplas 11 - 1,000 G-7 18 -
1,300 EPS 10 - 1,200 Gakken 13 -
2,000 eRex 21 - 1,600 Gecoss 11 -
3,400 ES-Con Japan 21 - 400 Genki Sushi 7 -
700 ESPEC 9 - 1,000 Genky DrugStores 27 -
1,900 Exedy 23 - 2,200 Gep 22 -
1,600 Ezaki Glico 62 0.01 700 Giken 27 -
13,016 FamilyMart 182 0.02 43 Global One Real Estate Investment 32 -
2,400 FAN Communications 8 - 1,100 GLOBERIDE 17 -
3,300 Fancl 79 0.01 2,700 Glory 50 0.01
513 FANUC 75 0.01 129 GLP J-Reit 152 0.02
1,433 Fast Retailing 667 0.07 3,800 GMO Financial 18 -
3,800 FCC 53 0.01 3,800 GMO internet 85 0.01
10,200 Feed One 16 - 1,600 GMO Payment Gateway 136 0.02
3,600 Ferrotec 18 - 900 Godo Steel 12 -
14,900 FIDEA 11 - 1,200 Goldcrest 13 -
4,600 Financial Products 21 - 1,000 Goldwin 53 0.01
4,800 First Bank of Toyama 10 - 400 Grace Technology 19 -
1,100 FJ Next 7 - 8,900 Gree 31 -
2,000 Foster Electric 16 - 6,800 GS Yuasa 98 0.01
1,600 FP 104 0.01 2,000 G-Tekt 15 -
1,900 France Bed 12 - 2,709 GungHo Online Entertainment 39 -
22 Frontier Real Estate Investment 56 0.01 13,500 Gunma Bank 35 -
1,170 Fudo Tetra 13 - 1,200 Gunze 36 0.01
1,500 Fuji 6 - 1,700 Gurunavi 10 -
1,700 Fuji Co Ehime 24 - 6,200 H2O Retailing 34 -
6,600 Fuji Electric 147 0.02 22,900 Hachijuni Bank 71 0.01
1,400 Fuji Kyuko 35 - 1,100 Hagihara Industries 12 -
2,200 Fuji Media 17 - 400 Hagiwara Electric 6 -
3,200 Fuji Oil 67 0.01 9,800 Hakuhodo DY 95 0.01
700 Fuji Pharma 6 - 900 Hakuto 7 -
2,900 Fuji Seal International 46 0.01 500 Halows 13 -
900 Fuji Soft 29 - 1,400 Hamakyorex 33 -
5,600 Fuji/Aichi 80 0.01 2,100 Hamamatsu Photonics 74 0.01
500 Fujibo 12 - 7,916 Hankyu Hanshin 218 0.02
1,000 Fujicco 15 - 30 Hankyu Hanshin REIT 28 -
7,715 FUJIFILM 269 0.03 2,400 Hanwa 36 0.01
21,000 Fujikura 49 0.01 600 Happinet 5 -
2,400 Fujikura Kasei 9 - 1,700 Harima Chemicals 13 -
900 Fujimori Kogyo 26 - 14,700 Haseko 151 0.02
3,000 Fujitec 45 0.01 14,800 Hazama Ando 70 0.01
2,670 Fujitsu 254 0.03 11 Health Care & Medical Investment 10 -
1,000 Fujitsu Frontech 8 - 2,900 Heiwa 40 -
2,500 Fujitsu General 42 0.01 1,800 Heiwa Real Estate 42 0.01
400 Fukuda 15 - 47 Heiwa Real Estate REIT 36 -
600 Fukuda Denshi 32 - 1,800 Heiwado 26 -
1,500 Fukui Bank 19 - 1,900 Hibiya Engineering 27 -
900 Fukui Computer 19 - 1,710 Hiday Hidaka 22 -
7,891 Fukuoka Financial 101 0.01 600 Hikari Tsushin 111 0.01
34 Fukuoka REIT 34 - 1,100 HI-LEX 10 -
600 Fukushima Bank 1 - 22,100 Hino Motors 121 0.01
600 Fukushima Galilei 15 - 300 Hioki EE 7 -
800 Fukuyama Transporting 23 - 435 Hirose Electric 39 -
1,200 FULLCAST 13 - 15,400 Hiroshima Bank 59 0.01
500 Funai Electric 2 - 3,000 HIS 36 -
1,649 Funai Soken 30 - 1,400 Hisaka Works 8 -
1,400 Furukawa 12 - 500 Hisamitsu Pharmaceutical 22 -
6,100 Furukawa Electric 120 0.01 21,244 Hitachi 546 0.05
2,300 Furuno Electric 17 - 5,600 Hitachi Capital 101 0.01
800 Furusato Industries 8 - 6,600 Hitachi Construction Machinery 149 0.01
2,500 Furyu 20 - 4,200 Hitachi Metals 41 0.01
800 Fuso Chemical 24 - 2,500 Hitachi Transport System 54 0.01
2,000 Futaba 15 - 10,500 Hitachi Zosen 31 -
5,000 Futaba Industrial 17 - 1,600 Hochiki 15 -
800 Future 10 - 400 Hodogaya Chemical 13 -
Dimensional Fund Advisors Ltd. Interim Report and Financial Statements, 30 June 2020 87

International Core Equity Fund
Portfolio Statement (continued)as at 30 June 2020
Holding Investment
Fair
Value
£'000
Percentage
of total
net assets
% Holding Investment
Fair
Value
£'000
Percentage
of total
net assets
%
Japan (continued) Japan (continued)
1,600 Hogy Medical 40 - 3,000 Itoki 8 -
10,800 Hokkaido Electric Power 34 - 1,200 IwaiCosmo 10 -
800 Hokkan 11 - 300 Iwaki 1 -
1,600 Hokkoku Bank 35 - 2,600 Iwatani 74 0.01
7,300 Hokuetsu 21 - 5,155 Iyo Bank 26 -
1,900 Hokuetsu Industries 15 - 1,900 Izumi 49 0.01
9,394 Hokuhoku Financial 63 0.01 10,900 J Front Retailing 59 0.01
8,400 Hokuriku Electric Power 44 0.01 4,700 J Trust 11 -
1,700 Hokuto 26 - 800 JAC Recruitment 7 -
39,112 Honda Motor 814 0.08 2,000 Jaccs 27 -
700 H-One 3 - 2,000 Jafco 55 0.01
1,300 Honeys 11 - 1,200 Jamco 7 -
4,600 Hoosiers 18 - 4,700 Japan Airlines 69 0.01
1,400 Horiba 60 0.01 2,000 Japan Airport Terminal 69 0.01
14 Hoshino Resorts REIT 49 0.01 3,800 Japan Aviation Electronics Industry 42 0.01
1,000 Hoshizaki 70 0.01 900 Japan Cash Machine 4 -
3,100 Hosiden 22 - 34,100 Japan Display 12 -
500 Hosokawa Micron 22 - 700 Japan Elevator Service 18 -
1,700 House Foods 45 0.01 68 Japan Excellent 64 0.01
8,833 Hoya 684 0.07 15,302 Japan Exchange 288 0.03
11,000 Hulic 84 0.01 185 Japan Hotel REIT Investment 62 0.01
63 Hulic Reit 64 0.01 800 Japan Investment Adviser 6 -
16,000 Hyakugo Bank 40 - 2,200 Japan Lifeline 24 -
1,800 Hyakujushi Bank 26 - 42 Japan Logistics Fund 93 0.01
3,700 Ibiden 88 0.01 4,500 Japan Material 57 0.01
752 Ichibanya 27 - 1,400 Japan Medical Dynamic Marketing 17 -
23,300 Ichigo 48 0.01 1,400 Japan Petroleum Exploration 19 -
75 Ichigo Office REIT Investment 42 - 27,300 Japan Post 158 0.02
3,000 Ichikoh Industries 11 - 1,900 Japan Post Insurance 20 -
1,400 Ichinen 13 - 18 Japan Prime Realty Investment 43 0.01
2,600 Ichiyoshi Securities 9 - 700 Japan Pulp & Paper 21 -
600 Icom 14 - 23 Japan Real Estate Investment 96 0.01
2,400 Idec 31 - 95 Japan Retail Fund Investment 97 0.01
7,602 Idemitsu Kosan 131 0.01 5,200 Japan Securities Finance 20 -
3,100 IDOM 12 - 4,500 Japan Steel Works 52 0.01
12,923 IHI 152 0.02 33,871 Japan Tobacco 512 0.05
5,184 Iida 65 0.01 3,000 Japan Transcity 11 -
6,700 Iino Kaiun Kaisha 17 - 2,900 Japan Wool Textile 23 -
1,900 IJTT 6 - 1,700 JBCC 19 -
1,300 Imasen Electric Industrial 7 - 400 JCR Pharmaceuticals 34 -
2,000 Inaba Denki Sangyo 36 - 1,600 JCU 41 0.01
3,600 Inabata 35 - 1,500 Jeol 34 -
72 Industrial & Infrastructure Fund 13,319 JFE 78 0.01
Investment 94 0.01 10,000 JGC 86 0.01
1,000 I-Net Corp/Kanagawa 11 - 7,900 Jimoto 6 -
2,200 Infocom 49 0.01 900 JINS 44 0.01
13,000 Infomart 73 0.01 600 J-Oil Mills 18 -
500 Information Services 1,500 Joshin Denki 25 -
International-Dentsu 19 - 1,000 JSP 11 -
51,012 Inpex 257 0.03 3,900 JSR 61 0.01
2,400 Intage 16 - 18,200 JTEKT 115 0.01
1,200 Internet Initiative Japan 33 - 2,000 Juki 8 -
514 Invesco Office J-Reit 54 0.01 1,700 Juroku Bank 25 -
283 Invincible Investment 60 0.01 1,200 Justsystems 69 0.01
600 IR Japan 51 0.01 14,900 JVCKenwood 18 -
1,100 Iriso Electronics 29 - 800 K&O Energy 9 -
1,200 Iseki 10 - 2,702 Kadokawa 45 0.01
18,000 Isetan Mitsukoshi 84 0.01 700 Kaga Electronics 10 -
2,800 Ishihara Sangyo Kaisha 15 - 2,600 Kagome 63 0.01
25,903 Isuzu Motors 190 0.02 20,900 Kajima 202 0.02
2,900 Ito En 133 0.01 5,272 Kakaku.com 108 0.01
26,327 ITOCHU 462 0.05 2,000 Kaken Pharmaceutical 83 0.01
4,300 Itochu Enex 28 - 700 Kakiyasu Honten 14 -
3,200 Itochu Techno-Solutions 98 0.01 1,000 Kamakura Shinsho 8 -
300 Itochu-Shokuhin 12 - 300 Kameda Seika 12 -
9,100 Itoham Yonekyu 45 0.01 2,000 Kamei 15 -
Dimensional Fund Advisors Ltd. Interim Report and Financial Statements, 30 June 2020 88

International Core Equity Fund
Portfolio Statement (continued)as at 30 June 2020
Holding Investment
Fair
Value
£'000
Percentage
of total
net assets
% Holding Investment
Fair
Value
£'000
Percentage
of total
net assets
%
Japan (continued) Japan (continued)
3,701 Kamigumi 59 0.01 2,300 Komeri 48 0.01
1,500 Kanaden 15 - 4,400 Komori 23 -
400 Kanagawa Chuo Kotsu 12 - 3,600 Konami 98 0.01
3,500 Kanamoto 62 0.01 1,200 Kondotec 10 -
8,700 Kandenko 60 0.01 30,217 Konica Minolta 85 0.01
3,600 Kaneka 76 0.01 800 Konishi 9 -
6,700 Kanematsu 65 0.01 2,000 Konoike Transport 18 -
400 Kanematsu Electronics 12 - 1,200 Kose 117 0.01
11,392 Kansai Electric Power 90 0.01 2,400 Koshidaka 8 -
4,496 Kansai Mirai Financial 14 - 1,100 Kotobuki Spirits 37 -
3,900 Kansai Paint 67 0.01 1,000 Kourakuen 12 -
6,000 Kanto Denka Kogyo 39 - 600 Krosaki Harima 16 -
11,372 Kao 732 0.07 10,700 K's 118 0.01
800 Kappa Create 9 - 19,654 Kubota 239 0.02
1,700 Kasai Kogyo 6 - 3,300 Kumagai Gumi 64 0.01
1,500 Katakura Industries 13 - 3,900 Kumiai Chemical Industry 30 -
2,000 Katitas 38 - 600 Kura Sushi 24 -
1,500 Kato Sangyo 40 - 1,100 Kurabo Industries 19 -
400 Kato Works 4 - 17,530 Kuraray 149 0.02
400 KAWADA TECHNOLOGIES 15 - 1,500 Kureha 53 0.01
12,408 Kawasaki Heavy Industries 145 0.02 4,106 Kurita Water Industries 93 0.01
2,800 Kawasaki Kisen Kaisha 21 - 900 Kusuri no Aoki 57 0.01
69,376 KDDI 1,691 0.17 1,700 KYB 26 -
3,399 Keihan 123 0.01 5,241 Kyocera 232 0.02
1,800 Keihanshin Building 19 - 600 Kyodo Printing 13 -
3,900 Keihin 74 0.01 1,300 Kyoei Steel 13 -
8,326 Keikyu 104 0.01 2,200 Kyokuto Kaihatsu Kogyo 22 -
2,185 Keio 101 0.01 1,400 Kyokuto Securities 5 -
2,900 Keisei Electric Railway 74 0.01 2,700 KYORIN 45 0.01
1,700 Keiyo 9 - 1,700 Kyoritsu Maintenance 47 0.01
7,000 Keiyo Bank 27 - 2,000 Kyosan Electric Manufacturing 8 -
11,100 Kenedix 45 0.01 1,800 Kyowa Exeo 35 -
20 Kenedix Office Investment 91 0.01 2,800 Kyudenko 67 0.01
40 Kenedix Residential Next Investment 56 0.01 14,340 Kyushu Electric Power 98 0.01
27 Kenedix Retail REIT 41 0.01 19,820 Kyushu Financial 68 0.01
600 Kenko Mayonnaise 9 - 4,400 Kyushu Railway 93 0.01
4,400 Kewpie 68 0.01 1,100 LAC 10 -
964 Keyence 328 0.03 1,400 Laox 2 -
2,700 KH Neochem 42 - 68 LaSalle Logiport REIT 85 0.01
1,700 Kikkoman 66 0.01 3,200 Lasertec 245 0.03
3,600 Kinden 48 0.01 3,000 Lawson 122 0.01
2,673 Kintetsu 98 0.01 1,800 LEC 22 -
400 Kintetsu Department Store 9 - 600 Life 16 -
3,900 Kintetsu World Express 55 0.01 3,600 LIFULL 11 -
12,500 Kirin 215 0.02 200 LINE 8 -
1,900 Kissei Pharmaceutical 39 - 3,600 Link And Motivation 11 -
700 Kitagawa 8 - 3,300 Lintec 64 0.01
500 Kita-Nippon Bank 7 - 3,900 Lion 76 0.01
300 Kitano Construction 6 - 10,759 LIXIL 122 0.01
3,000 Kitanotatsujin 12 - 1,700 LIXIL VIVA 33 -
1,200 Kito 12 - 1,000 M&A Capital Partners 30 -
6,300 Kitz 33 - 7,100 M3 246 0.03
4,100 Kiyo Bank 51 0.01 2,000 Mabuchi Motor 52 0.01
1,400 KLab 8 - 4,100 Macnica Fuji Electronics 48 0.01
1,200 Koa 9 - 2,600 Macromill 14 -
1,500 Koatsu Gas Kogyo 8 - 12,200 Maeda 76 0.01
900 Kobayashi Pharmaceutical 64 0.01 1,700 Maeda Kosen 32 -
3,200 Kobe Bussan 147 0.02 1,200 Maeda Road Construction 18 -
300 Kobe Electric Railway 9 - 1,600 Makino Milling Machine 40 -
22,375 Kobe Steel 62 0.01 1,410 Makita 42 0.01
300 Koei Tecmo 8 - 1,400 Mani 30 -
2,500 Kohnan Shoji 64 0.01 1,000 MarkLines 17 -
5,151 Koito Manufacturing 169 0.02 900 Mars 11 -
3,500 Kokuyo 34 - 37,057 Marubeni 136 0.01
39,594 Komatsu 658 0.07 1,100 Marubun 5 -
2,600 KOMEDA 36 - 1,200 Marudai Food 17 -
Dimensional Fund Advisors Ltd. Interim Report and Financial Statements, 30 June 2020 89

International Core Equity Fund
Portfolio Statement (continued)as at 30 June 2020
Holding Investment
Fair
Value
£'000
Percentage
of total
net assets
% Holding Investment
Fair
Value
£'000
Percentage
of total
net assets
%
Japan (continued) Japan (continued)
3,900 Maruha Nichiro 65 0.01 8,900 Mitsui Chemicals 151 0.02
6,800 Marui 100 0.01 6,300 Mitsui E&S 20 -
2,500 Maruichi Steel Tube 51 - 16,227 Mitsui Fudosan 233 0.02
2,800 Marusan Securities 9 - 17 Mitsui Fudosan Logistics Park 62 0.01
500 Maruwa 31 - 1,000 Mitsui Matsushima 6 -
1,000 Maruwa Unyu Kikan 23 - 5,900 Mitsui Mining & Smelting 97 0.01
800 Maruzen Co Taito ward 11 - 7,418 Mitsui OSK Lines 107 0.01
600 Maruzen Showa Unyu 15 - 1,000 Mitsui Sugar 15 -
2,100 Marvelous 11 - 1,900 Mitsui-Soko 21 -
1,300 Matsuda Sangyo 13 - 1,400 Miura 47 0.01
1,400 Matsui Construction 7 - 3,000 Mixi 43 -
1,500 Matsumotokiyoshi 44 0.01 1,000 Miyazaki Bank 18 -
800 Matsuyafoods 22 - 320,983 Mizuho Financial 321 0.03
1,500 Max 17 - 2,600 Mizuho Leasing 47 0.01
2,900 Maxell 22 - 1,400 Mizuno 22 -
16,492 Mazda Motor 81 0.01 1,100 Mochida Pharmaceutical 33 -
1,700 McDonald's Co Japan 75 0.01 1,100 Modec 13 -
6,600 MCJ 43 - 9,400 Monex 15 -
80 MCUBS MidCity Investment 47 0.01 300 Monogatari 19 -
46,876 Mebuki Financial 88 0.01 6,800 MonotaRO 222 0.02
1,300 MEC 21 - 81 Mori Hills REIT Investment 83 0.01
3,000 Medipal 47 0.01 18 Mori Trust Hotel Reit 13 -
900 Megachips 14 - 50 Mori Trust Sogo Reit 50 0.01
3,800 Megmilk Snow Brand 72 0.01 2,200 Morinaga 70 0.01
2,800 Meidensha 37 - 3,000 Morinaga Milk Industry 109 0.01
2,786 MEIJI 181 0.02 1,300 Morita 18 -
1,200 Meiko Electronics 12 - 5,454 MS&AD Insurance 122 0.01
3,500 Meisei Industrial 21 - 1,100 MTI 5 -
1,500 Meitec 59 0.01 600 Murakami 11 -
1,400 Menicon 56 0.01 13,338 Murata Manufacturing 636 0.06
400 METAWATER 15 - 5,700 Musashi Seimitsu Industry 41 0.01
900 Michinoku Bank 8 - 1,900 Musashino Bank 22 -
4,400 Mie Kotsu 16 - 3,800 Nabtesco 95 0.01
1,200 Milbon 47 0.01 1,400 Nachi-Fujikoshi 36 -
1,000 Mimasu Semiconductor Industry 18 - 700 Nagano Bank 6 -
15,179 MINEBEA MITSUMI 224 0.02 7,600 Nagase 77 0.01
800 Ministop 9 - 1,000 Nagatanien 16 -
2,500 Miraca 48 0.01 300 Nagawa 18 -
80 Mirai 23 - 6,411 Nagoya Railroad 147 0.02
4,800 Mirait 58 0.01 1,800 Nakanishi 19 -
800 Miroku Jyoho Service 14 - 2,900 Namura Shipbuilding 3 -
4,500 MISUMI 92 0.01 5,900 Nankai Electric Railway 110 0.01
1,100 Mitani 55 0.01 1,900 Nanto Bank 30 -
400 Mitani Sekisan 17 - 7,559 NEC 295 0.03
3,300 Mitsuba 12 - 800 NEC Capital Solutions 12 -
17,391 Mitsubishi 298 0.03 1,800 NEC Networks & System Integration 30 -
75,822 Mitsubishi Chemical 359 0.04 4,200 NET One Systems 114 0.01
40,832 Mitsubishi Electric 431 0.04 2,700 Neturen 11 -
21,379 Mitsubishi Estate 259 0.03 6,300 Nexon 116 0.01
4 Mitsubishi Estate Logistics REIT 2,400 Nextage 16 -
Investment 12 - 8,802 NGK Insulators 99 0.01
6,100 Mitsubishi Gas Chemical 75 0.01 7,926 NGK Spark Plug 92 0.01
16,183 Mitsubishi Heavy Industries 311 0.03 2,163 NH Foods 71 0.01
1,800 Mitsubishi Logisnext 13 - 12,900 NHK Spring 68 0.01
2,600 Mitsubishi Logistics 55 0.01 5,500 Nichias 93 0.01
5,140 Mitsubishi Materials 88 0.01 1,000 Nichiban 11 -
17,556 Mitsubishi Motors 35 - 2,900 Nichicon 16 -
2,000 Mitsubishi Paper Mills 5 - 400 Nichiden 7 -
1,200 Mitsubishi Pencil 12 - 1,800 Nichiha 31 -
400 Mitsubishi Research Institute 13 - 2,300 NichiiGakkan 29 -
800 Mitsubishi Shokuhin 17 - 3,300 Nichi-iko Pharmaceutical 33 -
1,100 Mitsubishi Steel Manufacturing 6 - 4,400 Nichirei 104 0.01
150,373 Mitsubishi UFJ Financial 479 0.05 1,400 Nichireki 17 -
33,300 Mitsubishi UFJ Lease & Finance 128 0.01 700 Nichirin 7 -
1,500 Mitsuboshi Belting 19 - 2,982 Nidec 162 0.02
20,327 Mitsui 245 0.03 6,400 Nifco 111 0.01
Dimensional Fund Advisors Ltd. Interim Report and Financial Statements, 30 June 2020 90

International Core Equity Fund
Portfolio Statement (continued)as at 30 June 2020
Holding Investment
Fair
Value
£'000
Percentage
of total
net assets
% Holding Investment
Fair
Value
£'000
Percentage
of total
net assets
%
Japan (continued) Japan (continued)
1,000 Nihon Chouzai 12 - 1,600 Nisshin 4 -
5,600 Nihon House 12 - 2,000 Nisshin Oillio 51 0.01
600 Nihon Kagaku Sangyo 4 - 4,015 Nisshin Seifun 49 0.01
2,400 Nihon Kohden 66 0.01 9,604 Nisshinbo 57 0.01
5,600 Nihon M&A Center 206 0.02 1,000 Nissin 11 -
2,600 Nihon Nohyaku 9 - 2,500 Nissin Electric 20 -
4,000 Nihon Parkerizing 33 - 3,100 Nissin Kogyo 51 0.01
1,600 Nihon Plast 6 - 1,000 Nissin Sugar 14 -
4,100 Nihon Unisys 104 0.01 1,900 Nitori 303 0.03
4,000 Nikkiso 31 - 1,400 Nitta 25 -
4,500 Nikkon 73 0.01 500 Nittetsu Mining 17 -
10,360 Nikon 70 0.01 5,474 Nitto Denko 251 0.02
1,273 Nintendo 461 0.05 1,700 Nitto Kogyo 25 -
3,000 Nippo 62 0.01 200 Nitto Seiko 1 -
24 Nippon Accommodations Fund 113 0.01 900 Noevir 31 -
800 Nippon Beet Sugar Manufacturing 11 - 2,500 NOF 70 0.01
22 Nippon Building Fund 102 0.01 1,000 Nohmi Bosai 16 -
400 Nippon Carbon 10 - 2,100 Nojima 43 -
1,300 Nippon Chemi-Con 18 - 4,900 NOK 49 0.01
15,200 Nippon Coke & Engineering 8 - 43,346 Nomura 158 0.02
400 Nippon Commercial Development 5 - 4,800 Nomura Co 33 -
2,800 Nippon Concrete Industries 6 - 4,100 Nomura Real Estate 62 0.01
7,700 Nippon Denko 10 - 155 Nomura Real Estate Master Fund 151 0.02
2,000 Nippon Densetsu Kogyo 36 - 8,034 Nomura Research Institute 177 0.02
4,826 Nippon Electric Glass 61 0.01 1,800 Noritsu Koki 20 -
3,353 Nippon Express 141 0.01 1,800 Noritz 18 -
3,100 Nippon Flour Mills 38 - 15,500 North Pacific Bank 24 -
2,900 Nippon Gas 102 0.01 1,200 NS Solutions 27 -
5,500 Nippon Kayaku 47 0.01 500 NS Tool 10 -
600 Nippon Koei 14 - 1,000 NS United Kaiun Kaisha 11 -
55,100 Nippon Light Metal 78 0.01 2,600 NSD 36 -
1,200 Nippon Paint 71 0.01 13,777 NSK 83 0.01
8,700 Nippon Paper Industries 99 0.01 44,700 NTN 73 0.01
8,800 Nippon Parking Development 9 - 22,700 NTT Data 205 0.02
2,000 Nippon Pillar Packing 21 - 43,242 NTT DOCOMO 940 0.09
600 Nippon Piston Ring 5 - 900 Obara 22 -
68 Nippon Prologis REIT 168 0.02 40,630 Obayashi 309 0.03
26 NIPPON REIT Investment 68 0.01 500 Obic 71 0.01
400 Nippon Road 22 - 8,752 Odakyu Electric Railway 175 0.02
3,500 Nippon Seiki 33 - 2,300 Ogaki Kyoritsu Bank 39 -
300 Nippon Sharyo 6 - 500 Ohsho Food Service 23 -
9,400 Nippon Sheet Glass 26 - 1,200 Oiles 13 -
800 Nippon Shinyaku 53 0.01 1,100 Oisix ra daichi 18 -
1,600 Nippon Shokubai 68 0.01 900 Oita Bank 16 -
2,400 Nippon Signal 21 - 53,100 Oji 201 0.02
1,700 Nippon Soda 36 - 2,400 Okabe 15 -
17,151 Nippon Steel 131 0.01 600 Okamoto Industries 18 -
1,500 Nippon Steel Trading 38 - 4,700 Okamura 27 -
22,700 Nippon Suisan Kaisha 80 0.01 8,000 Okasan Securities 20 -
1,100 Nippon Systemware 18 - 8,900 Oki Electric Industry 70 0.01
19,868 Nippon Telegraph & Telephone 377 0.04 1,100 Okinawa Cellular Telephone 34 -
1,100 Nippon Television 10 - 2,546 Okinawa Electric Power 35 -
4,000 Nippon Thompson 10 - 1,700 OKUMA 59 0.01
760 Nippon Yakin Kogyo 9 - 2,100 Okumura 39 -
11,358 Nippon Yusen 130 0.01 600 Okura Industrial 7 -
14,100 Nipro 127 0.01 2,000 Okuwa 25 -
3,000 Nishimatsu Construction 49 0.01 30,652 Olympus 480 0.05
2,200 Nishimatsuya Chain 18 - 1,651 Omron 90 0.01
9,200 Nishi-Nippon Financial 50 0.01 10 One REIT 19 -
3,200 Nishi-Nippon Railroad 71 0.01 2,500 Ono Pharmaceutical 59 0.01
2,200 Nishio Rent All 37 - 900 Onoken 8 -
4,400 Nissan Chemical 183 0.02 7,000 Onward 17 -
50,000 Nissan Motor 151 0.02 600 Open Door 6 -
3,700 Nissan Shatai 26 - 4,000 Open House 111 0.01
300 Nissei ASB Machine 7 - 1,600 Optim 42 0.01
2,300 Nissha 18 - 1,000 Optorun 19 -
Dimensional Fund Advisors Ltd. Interim Report and Financial Statements, 30 June 2020 91

International Core Equity Fund
Portfolio Statement (continued)as at 30 June 2020
Holding Investment
Fair
Value
£'000
Percentage
of total
net assets
% Holding Investment
Fair
Value
£'000
Percentage
of total
net assets
%
Japan (continued) Japan (continued)
700 Oracle Corp Japan 67 0.01 3,400 Riso Kyoiku 8 -
500 Organo 22 - 1,446 Rohm 78 0.01
25,500 Orient 23 - 3,100 Rohto Pharmaceutical 80 0.01
900 Oriental Land 97 0.01 500 Rokko Butter 6 -
41,928 ORIX 421 0.04 1,000 Roland DG 9 -
69 Orix JREIT 73 0.01 1,000 Rorze 40 -
11,347 Osaka Gas 182 0.02 4,900 Round One 29 -
700 Osaka Organic Chemical Industry 14 - 1,100 Royal 16 -
1,400 Osaka Soda 25 - 2,400 Ryobi 22 -
400 Osaka Steel 4 - 1,300 Ryoden 14 -
2,000 Osaki Electric 8 - 17,700 Ryohin Keikaku 203 0.02
4,900 OSG 61 0.01 1,300 Ryosan 22 -
5,900 OSJB 10 - 1,100 S Foods 22 -
3,204 Otsuka 114 0.01 400 S&B Foods 12 -
3,800 Otsuka Corp 163 0.02 1,500 Sac's Bar 7 -
10,800 Outsourcing 56 0.01 1,500 Saibu Gas 31 -
1,600 Oyo 17 - 1,500 Saizeriya 24 -
4,100 Pacific Industrial 29 - 600 Sakai Chemical Industry 9 -
1,400 Pacific Metals 16 - 700 Sakai Moving Service 29 -
700 Pack 17 - 2,500 Sakata INX 19 -
1,200 PAL 12 - 3,000 Sala 13 -
8,000 Pan Pacific International 143 0.01 2,400 SAMTY 25 -
78,009 Panasonic 553 0.06 19 Samty Residential Investment 15 -
1,300 Paramount Bed 43 0.01 1,720 San ju San Financial 17 -
6,700 Park24 93 0.01 800 San-A 25 -
1,300 Pasona 12 - 4,000 San-Ai Oil 29 -
26,000 Penta-Ocean Construction 114 0.01 1,999 Sanden 5 -
500 Pepper Food Service 2 - 900 Sanei Architecture Planning 9 -
1,200 PeptiDream 45 0.01 2,600 Sangetsu 30 -
8,800 Persol 98 0.01 10,100 San-In Godo Bank 41 0.01
400 PIA 10 - 1,700 Sanken Electric 27 -
3,900 Pigeon 123 0.01 3,500 Sanki Engineering 33 -
1,900 Pilot 47 0.01 2,000 Sankyo 39 -
1,500 Piolax 18 - 500 Sankyo Frontier 13 -
1,600 Poletowin Pitcrew 11 - 3,700 Sankyo Seiko 12 -
70 Premier Investment 63 0.01 2,000 Sankyo Tateyama 15 -
1,200 Premium 17 - 4,200 Sankyu 128 0.01
6,800 Press Kogyo 15 - 2,200 Sanoh Industrial 11 -
3,900 Pressance 35 - 8,800 Santen Pharmaceutical 132 0.01
6,000 Prestige International 37 - 14,100 Sanwa 102 0.01
2,200 Prima Meat Packers 48 0.01 1,000 Sanyo Chemical Industries 35 -
2,600 Proto 20 - 500 Sanyo Denki 18 -
3,600 PS Mitsubishi Construction 14 - 600 Sanyo Electric Railway 10 -
2,400 Qol 20 - 800 Sanyo Shokai 4 -
2,500 Raito Kogyo 27 - 1,600 Sanyo Special Steel 11 -
1,900 Raiznext 17 - 1,400 Sanyo Trading 11 -
2,600 Rakus 37 - 6,100 Sapporo 93 0.01
3,232 Rakuten 23 - 2,400 Sato 42 0.01
27,800 Recruit 773 0.08 1,800 Sawada 12 -
1,600 Relia 12 - 1,400 Sawai Pharmaceutical 59 0.01
5,500 Relo 84 0.01 8,910 SBI 157 0.02
24,400 Renesas Electronics 101 0.01 1,800 SBS 30 -
15,800 Rengo 105 0.01 1,800 SCREEN 68 0.01
36,997 Resona 103 0.01 1,500 SCSK 59 0.01
6,900 Resorttrust 73 0.01 300 SEC Carbon 15 -
1,500 Restar 24 - 2,071 Secom 147 0.02
29,268 Ricoh 170 0.02 4,900 Sega Sammy 48 0.01
800 Ricoh Leasing 18 - 12,200 Seibu 108 0.01
1,300 Right On 6 - 2,300 Seikagaku 20 -
400 Riken 9 - 3,600 Seikitokyu Kogyo 21 -
800 Riken Keiki 14 - 1,600 Seiko 21 -
2,200 Riken Technos 7 - 14,188 Seiko Epson 132 0.01
600 Riken Vitamin 10 - 6,500 Seino 69 0.01
1,100 Ringer Hut 20 - 3,000 Seiren 31 -
600 Rinnai 41 0.01 19,528 Sekisui Chemical 228 0.02
1,000 Riso Kagaku 11 - 14,686 Sekisui House 227 0.02
Dimensional Fund Advisors Ltd. Interim Report and Financial Statements, 30 June 2020 92

International Core Equity Fund
Portfolio Statement (continued)as at 30 June 2020
Holding Investment
Fair
Value
£'000
Percentage
of total
net assets
% Holding Investment
Fair
Value
£'000
Percentage
of total
net assets
%
Japan (continued) Japan (continued)
181 Sekisui House Reit 95 0.01 38,745 Sony 2,159 0.21
1,600 Sekisui Kasei 7 - 3,800 Sony Financial 75 0.01
8,300 Senko 50 - 3,600 Sotetsu 78 0.01
400 Senshu Electric 9 - 2,500 Space Value 7 -
14,020 Senshu Ikeda 17 - 6,200 Sparx 10 -
1,400 Senshukai 4 - 2,000 S-Pool 11 -
2,900 Seria 84 0.01 1,500 Square Enix 62 0.01
23,312 Seven & i 619 0.06 400 SRA 7 -
37,700 Seven Bank 84 0.01 900 St Marc 11 -
1,600 SG 42 0.01 4,700 Stanley Electric 92 0.01
10,180 Sharp 88 0.01 24 Star Asia Investment 17 -
300 Shibaura Electronics 5 - 600 Star Mica 6 -
1,000 Shibaura Machine 16 - 1,700 Star Micronics 15 -
800 Shibaura Mechatronics 17 - 2,900 Starts 48 0.01
600 Shibusawa Warehouse 9 - 11 Starts Proceed Investment 17 -
1,000 Shibuya 21 - 600 Starzen 19 -
2,900 Shiga Bank 52 0.01 500 Strike 18 -
1,400 Shikoku Bank 8 - 1,100 Studio Alice 13 -
2,000 Shikoku Chemicals 16 - 12,427 Subaru 211 0.02
9,300 Shikoku Electric Power 56 0.01 1,600 Sugi 88 0.01
1,900 Shima Seiki Manufacturing 22 - 800 Sugimoto 11 -
2,500 Shimachu 57 0.01 16,600 SUMCO 207 0.02
3,000 Shimadzu 65 0.01 1,400 Sumida 8 -
1,000 Shimamura 55 0.01 14,130 Sumitomo 132 0.01
403 Shimano 63 0.01 2,200 Sumitomo Bakelite 50 0.01
26,454 Shimizu 177 0.02 73,559 Sumitomo Chemical 179 0.02
500 Shimizu Bank 7 - 7,100 Sumitomo Dainippon Pharma 80 0.01
500 Shinagawa Refractories 8 - 1,400 Sumitomo Densetsu 25 -
300 Shindengen Electric Manufacturing 5 - 26,562 Sumitomo Electric Industries 249 0.03
8,821 Shin-Etsu Chemical 839 0.08 9,800 Sumitomo Forestry 100 0.01
1,800 Shin-Etsu Polymer 12 - 7,336 Sumitomo Heavy Industries 130 0.01
1,400 Shinko Electric Industries 15 - 5,526 Sumitomo Metal Mining 125 0.01
2,400 Shinko Shoji 15 - 18,800 Sumitomo Mitsui Construction 67 0.01
4,200 Shinmaywa Industries 32 - 16,574 Sumitomo Mitsui Financial 379 0.04
2,400 Shinnihon 15 - 3,869 Sumitomo Mitsui Trust 88 0.01
1,200 Shinoken 8 - 2,700 Sumitomo Osaka Cement 77 0.01
8,900 Shinsei Bank 87 0.01 9,451 Sumitomo Realty & Development 212 0.02
5,455 Shionogi 278 0.03 3,400 Sumitomo Riko 16 -
2,500 Ship Healthcare 85 0.01 15,200 Sumitomo Rubber Industries 122 0.01
9,194 Shiseido 474 0.05 800 Sumitomo Seika Chemicals 21 -
21,228 Shizuoka Bank 111 0.01 3,800 Sumitomo Warehouse 37 -
3,900 Shizuoka Gas 29 - 3,800 Sun Frontier Fudousan 25 -
600 SHO-BOND 22 - 2,100 Sundrug 57 0.01
1,400 Shoei 28 - 3,600 Suntory Beverage & Food 114 0.01
800 Shoei Foods 25 - 5,900 Suruga Bank 17 -
5,500 Showa 93 0.01 4,600 Sushiro Global 82 0.01
13,100 Showa Denko 239 0.02 2,260 Suzuken Co Aichi Japan 69 0.01
1,400 Showa Sangyo 35 - 13,957 Suzuki Motor 385 0.04
2,200 Siix 16 - 3,100 SWCC Showa 27 -
700 Sinanen 14 - 3,886 Sysmex 241 0.02
1,600 Sinfonia Technology 12 - 4,800 Systena 52 0.01
1,400 Sinko Industries 15 - 900 Syuppin 5 -
2,800 Sintokogio 17 - 1,700 T Hasegawa 31 -
1,300 SK-Electronics 11 - 800 T RAD 8 -
10,800 SKY Perfect JSAT 33 - 15,242 T&D 106 0.01
11,200 Skylark 144 0.02 1,000 T&K Toka 6 -
140 SMC 58 0.01 1,100 Tachibana Eletech 14 -
400 SMK 8 - 1,900 Tachi-S 12 -
4,400 SMS 80 0.01 7,100 Tadano 48 0.01
2,800 Sodick 17 - 1,000 Taihei Dengyo Kaisha 17 -
58,258 SoftBank Group 2,397 0.24 11,300 Taiheiyo Cement 213 0.02
24,500 Softbank 254 0.03 1,500 Taiho Kogyo 6 -
1,900 Sohgo Security Services 72 0.01 1,000 Taikisha 22 -
56,900 Sojitz 100 0.01 10,500 Taisei 311 0.03
3,800 Solasto 31 - 1,200 Taisho Pharmaceutical 60 0.01
6,533 Sompo 183 0.02 600 Taiyo 23 -
Dimensional Fund Advisors Ltd. Interim Report and Financial Statements, 30 June 2020 93

International Core Equity Fund
Portfolio Statement (continued)as at 30 June 2020
Holding Investment
Fair
Value
£'000
Percentage
of total
net assets
% Holding Investment
Fair
Value
£'000
Percentage
of total
net assets
%
Japan (continued) Japan (continued)
6,200 Taiyo Nippon Sanso 85 0.01 1,300 Tokyo Energy & Systems 8 -
8,600 Taiyo Yuden 217 0.02 6,851 Tokyo Gas 133 0.01
1,300 Takamatsu Construction 24 - 2,000 Tokyo Kiraboshi Financial 17 -
3,200 Takamiya 13 - 1,300 Tokyo Ohka Kogyo 53 0.01
700 Takaoka Toko 5 - 1,400 Tokyo Rope Manufacturing 6 -
1,500 Takara 11 - 1,500 Tokyo Seimitsu 39 -
6,900 Takara Leben 19 - 8,800 Tokyo Steel Manufacturing 41 0.01
2,000 Takara Standard 23 - 10,800 Tokyo Tatemono 101 0.01
1,100 Takasago International 18 - 1,000 Tokyotokeiba 27 -
2,500 Takasago Thermal Engineering 30 - 10,278 Tokyu 118 0.01
9,026 Takashimaya 61 0.01 8,700 Tokyu Construction 37 -
14,020 Takeda Pharmaceutical 407 0.04 32,031 Tokyu Fudosan 122 0.01
1,300 Takeei 11 - 40 Tokyu REIT 44 0.01
2,600 Takeuchi Manufacturing 35 - 600 Tomoe Engineering 8 -
4,000 Takuma 45 0.01 800 Tomoku 11 -
2,300 Tama Home 21 - 9,400 TOMONY 25 -
1,200 Tamron 17 - 6,379 Tomy 41 0.01
4,200 Tamura 14 - 500 Tonami 21 -
2,000 Tanseisha 11 - 9,700 Topcon 63 0.01
1,100 Tayca 11 - 3,400 Toppan Forms 27 -
5,926 TDK 478 0.05 4,989 Toppan Printing 68 0.01
1,600 TechMatrix 23 - 2,800 Topre 25 -
2,100 TechnoPro 97 0.01 1,400 Topy Industries 13 -
16,100 Teijin 208 0.02 53,456 Toray Industries 205 0.02
700 Teikoku Sen-I 12 - 4,200 Toridoll 38 0.01
700 Tekken 11 - 1,100 Torii Pharmaceutical 26 -
1,100 Tenma 14 - 1,600 Torishima Pump Manufacturing 10 -
11,574 Terumo 357 0.04 2,300 Tosei 20 -
1,000 T-Gaia 15 - 15 Tosei Reit Investment 12 -
3,100 THK 62 0.01 2,768 Toshiba 72 0.01
8,400 TIS 144 0.02 1,400 Toshiba TEC 44 0.01
600 TKC 26 - 600 Tosho 6 -
500 Toa Oil 8 - 18,400 Tosoh 204 0.02
100 TOA ROAD 2 - 1,100 Totetsu Kogyo 23 -
1,100 Toa/Hyogo 6 - 3,500 TOTO 109 0.01
1,400 Toa/Tokio 16 - 2,700 Towa Bank 14 -
7,000 Toagosei 56 0.01 2,800 Towa Pharmaceutical 42 0.01
1,310 Tobishima 10 - 6,700 Toyo Construction 20 -
5,900 Tobu Railway 159 0.02 1,600 Toyo Engineering 4 -
2,600 TOC 13 - 2,600 Toyo Ink 40 -
4,000 Tocalo 35 0.01 600 Toyo Kanetsu 10 -
8,000 Tochigi Bank 10 - 7,100 Toyo Seikan 65 0.01
13,500 Toda 71 0.01 700 Toyo Tanso 9 -
600 Toei Animation 23 - 12,300 Toyo Tire 134 0.02
400 Toenec 11 - 1,100 Toyo/Chuo-ku 8 -
3,200 Toho 49 0.01 7,100 Toyobo 80 0.01
12,000 Toho Bank 20 - 5,300 Toyoda Gosei 90 0.01
2,900 Toho Gas 118 0.01 7,200 Toyota Boshoku 79 0.01
3,200 Toho Titanium 16 - 2,538 Toyota Industries 109 0.01
600 Toho Zinc 7 - 82,062 Toyota Motor 4,189 0.41
3,000 Toho/Tokyo 88 0.01 7,064 Toyota Tsusho 145 0.02
16,275 Tohoku Electric Power 126 0.01 2,400 TPR 24 -
6,000 TOKAI 45 0.01 300 Trancom 16 -
17,700 Tokai Carbon 135 0.01 1,000 Transcosmos 19 -
2,900 Tokai Rika 34 0.01 5,200 Trend Micro 237 0.02
13,500 Tokai Tokyo Financial 24 - 2,600 Trusco Nakayama 55 0.01
1,200 Tokai/Gifu 22 - 3,500 TS Tech 78 0.01
400 Token 21 - 4,900 TSI 17 -
9,225 Tokio Marine 327 0.03 4,600 Tsubaki Nakashima 29 -
500 Tokushu Tokai Paper 17 - 2,300 Tsubakimoto Chain 45 0.01
6,200 Tokuyama 118 0.01 400 Tsubakimoto Kogyo 12 -
1,500 Tokyo Broadcasting System 19 - 3,000 Tsugami 20 -
2,600 Tokyo Century 108 0.01 1,700 Tsukishima Kikai 15 -
5,500 Tokyo Dome 32 - 6,900 Tsukuba Bank 9 -
54,529 Tokyo Electric Power 136 0.01 2,200 Tsukui 8 -
3,703 Tokyo Electron 739 0.07 1,700 Tsumura 36 0.01
Dimensional Fund Advisors Ltd. Interim Report and Financial Statements, 30 June 2020 94

International Core Equity Fund
Portfolio Statement (continued)as at 30 June 2020
Holding Investment
Fair
Value
£'000
Percentage
of total
net assets
% Holding Investment
Fair
Value
£'000
Percentage
of total
net assets
%
Japan (continued) Japan (continued)
1,400 Tsuruha 157 0.02 6,300 Yokogawa Electric 80 0.01
800 Tsurumi Manufacturing 11 - 2,800 Yokohama Reito 19 -
1,200 TV Asahi 14 - 10,700 Yokohama Rubber 122 0.01
700 Tv Tokyo 13 - 1,100 Yokowo 21 -
2,100 UACJ 31 - 300 Yomiuri Land 8 -
8,600 Ube Industries 120 0.01 1,400 Yondoshi 19 -
400 Uchida Yoko 19 - 1,300 Yorozu 10 -
1,700 Ulvac 40 0.01 2,200 Yoshinoya 37 -
1,800 Unicharm 60 0.01 1,000 Yuasa Trading 22 -
3,900 Unipres 28 - 3,300 Yumeshin 15 -
500 UNITED 4 - 300 Yurtec 1 -
1,400 United Arrows 19 - 50,400 Z 200 0.02
4,200 United Super Markets 36 0.01 3,600 Zenkoku Hosho 110 0.01
87 United Urban Investment 76 0.01 2,050 Zenrin 19 -
4,700 Unitika 13 - 5,000 Zensho 82 0.01
1,500 Universal Entertainment 24 - 9,000 Zeon 67 0.01
7,300 Ushio 79 0.01 2,800 ZIGExN 7 -
6,000 USS 78 0.01 2,800 ZOZO 51 0.01
1,400 UT 26 - 97,808 9.59
1,200 UUUM 22 -
900 V Technology 25 - Netherlands 1.42% (1.45%)
3,900 Valor 62 0.01
1,400 Valqua 20 - 8,426 Aalberts 227 0.02
800 ValueCommerce 17 - 9,718 ABN AMRO Bank 68 0.01
1,200 Vector 8 - 1,556 Accell 31 -
900 Vision Tokyo Japan 5 - 94 Adyen 110 0.01
2,600 Vital KSK 20 - 75,468 Aegon 182 0.02
6,400 VT 17 - 5,907 Akzo Nobel 432 0.04
3,400 Wacoal 51 0.01 21,184 Altice Europe 68 0.01
7,200 Wacom 30 - 1,205 AMG Advanced Metallurgical 18 -
1,700 Wakachiku Construction 15 - 832 Amsterdam Commodities 14 -
2,400 Wakita 17 - 3,003 APERAM 68 0.01
1,000 Warabeya Nichiyo 13 - 5,475 Arcadis 80 0.01
700 Watahan 10 - 16,077 ArcelorMittal 136 0.01
800 WATAMI 6 - 644 Argenx 116 0.01
400 WDB 8 - 2,217 ASM International 272 0.03
1,554 Welcia 102 0.01 5,237 ASML 1,547 0.15
2,210 West 36 - 13,881 ASR Nederland 344 0.03
2,933 West Japan Railway 134 0.01 1,629 Basic-Fit 35 -
600 Workman 43 0.01 4,288 BE Semiconductor Industries 154 0.02
1,500 World 19 - 525 Beter Bed 1 -
800 World Holdings 10 - 5,325 Boskalis Westminster 87 0.01
400 Wowow 7 - 83 Brack Capital Properties 4 -
1,200 Xebio 8 - 1,414 Brunel International 8 -
1,900 Yahagi Construction 11 - 48,225 CNH Industrial (EUR) 272 0.03
1,300 Yakult Honsha 62 0.01 6,584 CNH Industrial (USD) 38 -
700 YAKUODO 14 - 7,168 Coca-Cola European Partners (EUR) 219 0.02
1,900 YAMABIKO 13 - 6,403 Coca-Cola European Partners (USD) 196 0.02
500 YAMADA Consulting 5 - 3,035 Corbion 88 0.01
18,355 Yamada Denki 74 0.01 2,119 Core Laboratories 33 -
1,800 Yamagata Bank 18 - 11,513 DHT 49 0.01
11,453 Yamaguchi Financial 57 0.01 2,376 Eurocommercial Properties 25 -
2,312 Yamaha 88 0.01 538 Eurofins Scientific 272 0.03
18,019 Yamaha Motor 229 0.02 3,496 Euronext 284 0.03
1,400 Yamaichi Electronics 15 - 2,494 Flow Traders 72 0.01
1,300 YA-MAN 10 - 1,814 ForFarmers 9 -
2,200 Yamanashi Chuo Bank 14 - 11,021 Frank's International 19 -
10,089 Yamato 177 0.02 3,163 Fugro 10 -
2,800 Yamato Kogyo 46 0.01 3,270 GrandVision 76 0.01
4,600 Yamazaki Baking 64 0.01 1,984 Heijmans 12 -
3,500 Yamazen 24 - 7,495 Heineken 566 0.06
1,200 Yaoko 70 0.01 329 Hunter Douglas 14 -
3,300 Yaskawa Electric 93 0.01 2,386 IMCD 183 0.02
2,500 Yellow Hat 28 - 56,238 ING 319 0.03
1,400 Yodogawa Steel Works 20 - 4,516 Intertrust 62 0.01
2,300 Yokogawa Bridge 39 0.01 913 Kendrion 10 -
Dimensional Fund Advisors Ltd. Interim Report and Financial Statements, 30 June 2020 95

International Core Equity Fund
Portfolio Statement (continued)as at 30 June 2020
Holding Investment
Fair
Value
£'000
Percentage
of total
net assets
% Holding Investment
Fair
Value
£'000
Percentage
of total
net assets
%
Netherlands (continued) New Zealand (continued)
66,893 Koninklijke Ahold Delhaize 1,492 0.15 173,172 SKY Network Television 13 -
17,707 Koninklijke BAM 26 - 44,891 SKYCITY Entertainment 56 0.01
4,173 Koninklijke DSM 469 0.05 87,019 Spark New Zealand 206 0.02
201,105 Koninklijke KPN 432 0.04 11,575 Steel & Tube 4 -
18,711 Koninklijke Philips 704 0.07 10,252 Stride Property 9 -
3,921 Koninklijke Vopak 169 0.02 15,956 Summerset 54 0.01
330 Nederland Apparatenfabriek 12 - 2,223 Synlait Milk 8 -
10,371 NN 283 0.03 9,610 Tourism 10 -
955 NSI 30 - 37,932 TOWER 12 -
1,903 NXP Semiconductors 173 0.02 4,004 Trustpower 15 -
4,694 OCI 40 - 15,078 Vector 28 -
6,714 Ordina 11 - 16,612 Vital Healthcare Property Trust 21 -
25,274 PostNL 44 - 952 Xero 48 -
4,824 Prosus 363 0.04 35,495 Z Energy 49 0.01
4,037 QIAGEN 141 0.01 2,190 0.21
9,170 Randstad 335 0.03
10,668 SBM Offshore 127 0.01 Norway 0.29% (0.37%)
10,536 Signify 218 0.02
1,204 Sligro Food 15 - 40,377 ABG Sundal Collier 14 -
2,944 TKH 95 0.01 1,358 Adevinta 11 -
4,444 TomTom 29 - 878 AF 13 -
36,394 Unilever 1,582 0.16 7,828 Akastor 3 -
439 Van Lanschot Kempen 5 - 259 Aker 8 -
1,067 Vastned Retail 19 - 5,285 Aker BP 79 0.01
1,522 Wereldhave 12 - 7,828 Aker Solutions 6 -
13,050 Wolters Kluwer 823 0.08 4,027 American Shipping 9 -
14,479 1.42 3,737 Atea 29 -
4,748 Austevoll Seafood 31 -
New Zealand 0.21% (0.22%) 2,885 Avance Gas 4 -
4,377 Axactor 2 -
20,180 a2 Milk 210 0.02 9,434 B2Holding 3 -
52,534 Air New Zealand 36 - 805 Bakkafrost 40 -
49,679 Argosy Property 30 - 1,415 Bonheur 27 -
10,757 Arvida 8 - 5,298 Borregaard 45 0.01
12,374 Auckland International Airport 42 0.01 2,011 BW Energy 3 -
5,154 CBL* 2 - 9,861 BW Offshore 26 -
45,034 Chorus 175 0.02 12,582 DNB 136 0.01
20,844 Contact Energy 68 0.01 49,118 DNO 24 -
5,451 EBOS 61 0.01 5,183 Entra 55 0.01
12,645 Fisher & Paykel Healthcare 234 0.02 49,780 Equinor 575 0.06
3,815 Fletcher Building (AUD) 7 - 12,149 Europris 48 0.01
44,266 Fletcher Building (NZD) 85 0.01 2,818 Fjordkraft 18 -
3,612 Fonterra Co-operative 7 - 2,051 FLEX LNG 8 -
8,601 Freightways 32 - 7,626 Frontline 43 0.01
25,999 Genesis Energy 41 - 875 Gjensidige Forsikring 13 -
40,407 Goodman Property Trust 43 0.01 670 Golden Ocean 2 -
33,535 Heartland 21 - 3,578 Grieg Seafood 30 -
33,751 Infratil 83 0.01 3,807 Hexagon Composites 13 -
3,013 Investore Property 3 - 1,945 Hoegh LNG 2 -
10,572 Kathmandu 6 - 2,998 Kongsberg 34 -
68,845 Kiwi Property 37 - 5,036 Kvaerner 3 -
3,008 Mainfreight 62 0.01 6,002 Leroy Seafood 28 -
22,311 Mercury NZ 54 0.01 8,759 Mowi 133 0.01
20,460 Meridian Energy 51 0.01 29,814 NEL 47 0.01
9,110 Metlifecare 24 - 5,250 Nordic American Tankers 18 -
12,042 New Zealand Refining 5 - 5,947 Nordic Semiconductor 37 -
18,574 NZME 2 - 33,576 Norsk Hydro 75 0.01
20,866 Oceania Healthcare 10 - 1,037 Norway Royal Salmon 21 -
7,336 Port of Tauranga 29 - 2,700 Norwegian Air Shuttle 1 -
46,182 Precinct Properties New Zealand 38 - 10,604 Norwegian Finans 60 0.01
32,296 Property for Industry 40 - 5,061 Ocean Yield 9 -
660 Restaurant Brands New Zealand 4 - 5,917 Odfjell Drilling 5 -
9,698 Ryman Healthcare 66 0.01 1,168 Olav Thon Eiendomsselskap 14 -
2,481 Sanford NZ 8 - 7,476 Orkla 53 0.01
5,089 Scales 13 - 10,702 Otello 10 -
17,657 Skellerup 20 - 27,764 PGS 9 -
Dimensional Fund Advisors Ltd. Interim Report and Financial Statements, 30 June 2020 96

International Core Equity Fund
Portfolio Statement (continued)as at 30 June 2020
Holding Investment
Fair
Value
£'000
Percentage
of total
net assets
% Holding Investment
Fair
Value
£'000
Percentage
of total
net assets
%
Norway (continued) Singapore (continued)
2,580 Protector Forsikring 8 - 111,493 ComfortDelGro 94 0.01
2,352 Salmar 89 0.01 28,368 DBS 345 0.03
5,881 Sbanken 31 - 12,500 Delfi 5 -
3,859 Scatec Solar 50 0.01 70,435 ESR-REIT 16 -
1,675 Schibsted 'A' 35 - 111,384 Ezion* 1 -
1,126 Schibsted 'B' 21 - 66,830 Ezion Warrants 16/04/2023* - -
2,537 Selvaag Bolig 12 - 152,609 Ezra* - -
8,341 SFL 63 0.01 48,014 Far East Hospitality Trust 14 -
6,425 SpareBank 1 SR-Bank 38 0.01 10,300 Far East Orchard 6 -
1,174 Stolt-Nielsen 8 - 35,299 First Real Estate Investment Trust 14 -
22,115 Storebrand 92 0.01 21,700 First Resources 18 -
14,177 Subsea 7 73 0.01 8,400 Fraser and Neave 7 -
16,687 Telenor 197 0.02 23,000 Frasers Centrepoint Trust 31 -
6,006 TGS NOPEC Geophysical 72 0.01 32,300 Frasers Hospitality Trust 9 -
3,903 TOMRA Systems 115 0.01 92,890 Frasers Logistics & Commercial Trust 65 0.01
2,490 Treasure 2 - 14,700 Frasers Property 11 -
6,369 Veidekke 62 0.01 13,700 Frencken 7 -
7,214 Wallenius Wilhelmsen 8 - 159,600 Genting Singapore 71 0.01
1,192 Wilh Wilhelmsen 11 - 33,300 GL 11 -
10,426 XXL 16 - 362,100 Golden Agri-Resources 31 -
3,484 Yara International 97 0.01 1,600 Great Eastern 18 -
2,977 0.29 14,000 GuocoLand 12 -
8,700 Haw Par 50 -
Portugal 0.08% (0.09%) 8,200 Ho Bee Land 10 -
16,000 Hong Leong Finance 23 -
3,470 Altri 13 - 54,000 Hyflux* 1 -
601,084 Banco Comercial Portugues 59 0.01 66,000 IGG 44 0.01
162,808 Banco Espirito Santo* - - 13,000 Indofood Agri Resources 2 -
4,238 CTT-Correios de Portugal 8 - 50,600 Japfa 20 -
62,137 EDP - Energias de Portugal 242 0.02 6,611 Jardine Cycle & Carriage 78 0.01
18,648 Galp Energia 176 0.02 617 Kenon 10 -
10,827 Jeronimo Martins 154 0.02 43,685 Keppel 152 0.02
5,260 Mota-Engil 5 - 44,203 Keppel DC REIT 65 0.01
16,150 Navigator 32 - 149,639 Keppel Infrastructure Trust 47 0.01
15,838 NOS 56 0.01 77,486 Keppel REIT 50 0.01
15,555 REN - Redes Energeticas Nacionais 35 - 4,200 Kulicke & Soffa Industries 69 0.01
1,549 Semapa-Sociedade de Investimento e 20,100 Lian Beng 5 -
Gestao 11 - 142,800 Lippo Malls Indonesia Retail Trust 11 -
38,138 Sonae 23 - 44,886 Manulife US Real Estate Investment
814 0.08 Trust 28 -
79,496 Mapletree Commercial Trust 90 0.01
Singapore 0.51% (0.63%) 37,377 Mapletree Industrial Trust 63 0.01
88,692 Mapletree Logistics Trust 101 0.01
68,600 Accordia Golf Trust 27 - 118,442 Mapletree North Asia Commercial Trust 64 0.01
11,000 AEM 20 - 36,800 Metro 16 -
28,897 AIMS APAC REIT 20 - 111,000 Midas* 2 -
53,926 ARA LOGOS Logistics Trust 18 - 61,900 NetLink NBN Trust 35 -
37,300 Ascendas India Trust 29 - 21,800 Olam International 18 -
89,976 Ascendas Real Estate Investment Trust 167 0.02 19,700 OUE 14 -
114,967 Ascott Residence Trust 67 0.01 100,549 OUE Commercial Real Estate
23,100 Best World International* 3 - Investment Trust 22 -
17,900 BOC Aviation 93 0.01 66,604 Oversea-Chinese Banking 351 0.04
19,100 Boustead Singapore 7 - 24,299 Oxley 3 -
7,000 Bukit Sembawang Estates 16 - 18,300 Parkway Life Real Estate Investment
8,750 Bund Center Investment 2 - Trust 36 -
6,043 BW LPG 15 - 30,637 Raffles Medical 16 -
40,884 CapitaLand 70 0.01 13,400 Riverstone 20 -
97,610 CapitaLand Commercial Trust 97 0.01 84,100 Sabana Shari'ah Compliant Industrial
91,800 CapitaLand Mall Trust 105 0.01 Real Estate Investment Trust 17 -
36,240 CapitaLand Retail China Trust 27 - 32,570 SATS 54 0.01
38,400 CDL Hospitality Trusts 23 - 4,100 SBS Transit 7 -
14,200 China Aviation Oil Singapore 8 - 64,500 Sembcorp Industries 66 0.01
51,200 China Sunsine Chemical 10 - 29,000 Sembcorp Marine 7 -
18,000 Chip Eng Seng 6 - 44,800 Sheng Siong 43 0.01
30,900 Chuan Hup 3 - 57,700 SIIC Environment 7 -
10,900 City Developments 54 0.01 96,700 Sinarmas Land 10 -
Dimensional Fund Advisors Ltd. Interim Report and Financial Statements, 30 June 2020 97

International Core Equity Fund
Portfolio Statement (continued)as at 30 June 2020
Holding Investment
Fair
Value
£'000
Percentage
of total
net assets
% Holding Investment
Fair
Value
£'000
Percentage
of total
net assets
%
Singapore (continued) Spain (continued)
97,762 Singapore Airlines 212 0.02 3,597 Global Dominion Access 9 -
31,300 Singapore Exchange 152 0.02 6,728 Grifols 167 0.02
71,000 Singapore Post 32 - 1,859 Grupo Catalana Occidente 34 -
109,400 Singapore Press 81 0.01 176,690 Iberdrola 1,683 0.17
54,600 Singapore Technologies Engineering 105 0.01 421 Iberpapel Gestion 7 -
179,207 Singapore Telecommunications 258 0.03 7,512 Indra Sistemas 48 0.01
74,635 Soilbuild Business Space REIT 17 - 24,121 Industria de Diseno Textil 520 0.05
43,100 SPH REIT 22 - 13,954 Inmobiliaria Colonial Socimi 103 0.01
50,000 Starhill Global REIT 15 - 3,490 Lar Espana Real Estate Socimi 15 -
29,500 StarHub 22 - 125,034 Liberbank 17 -
13,800 Sunningdale Tech 8 - 31,459 Mapfre 45 0.01
99,200 Suntec Real Estate Investment Trust 82 0.01 2,911 Masmovil Ibercom 60 0.01
29,500 UMS 15 - 9,793 Mediaset Espana Comunicacion 29 -
8,406 United Industrial 11 - 6,884 Melia Hotels International 24 -
30,413 United Overseas Bank 359 0.04 19,080 Merlin Properties Socimi 133 0.01
13,972 UOB-Kay Hian 9 - 1,328 Miquel y Costas & Miquel 15 -
14,007 UOL 55 0.01 13,924 Naturgy Energy 211 0.02
16,700 Venture 158 0.02 8,823 Obrascon Huarte Lain 5 -
8,700 Wilmar International 21 - 4,611 Pharma Mar 31 -
23,750 Wing Tai 25 - 15,603 Promotora de Informaciones 7 -
203,700 Yangzijiang Shipbuilding 111 0.01 14,019 Prosegur Cia de Seguridad 27 -
5,170 0.51 5,444 Quabit Inmobiliaria 2 -
6,042 Realia Business 4 -
Spain 0.83% (1.03%) 13,358 Red Electrica 205 0.02
33,909 Repsol 241 0.02
1,703 Acciona 136 0.01 33,909 Repsol Rights 07/07/2020 13 -
9,465 Acerinox 62 0.01 26,617 Sacyr 46 -
10,408 ACS Actividades de Construccion y 3,402 Siemens Gamesa Renewable Energy 49 0.01
Servicios 215 0.02 2,795 Solaria Energia y Medio Ambiente 29 -
10,408 ACS Actividades de Construccion y 3,196 Talgo 12 -
Servicios Rights 08/07/2020 13 - 1,436 Tecnicas Reunidas 18 -
2,308 Aena 254 0.03 149,032 Telefonica 580 0.06
748 Alantra Partners 8 - 133,325 Telefonica Rights 02/07/2020 22 -
2,126 Almirall 23 - 10,303 Tubacex 12 -
11,885 Amadeus IT 507 0.05 34,923 Unicaja Banco 15 -
52,903 Amper 8 - 877 Vidrala 68 0.01
7,604 Applus Services 47 0.01 1,775 Viscofan 94 0.01
2,251 Atresmedia Corp de Medios de 9,700 Zardoya Otis 54 0.01
Comunicacion 5 - 8,452 0.83
219,069 Banco Bilbao Vizcaya Argentaria 607 0.06
260,801 Banco de Sabadell 74 0.01 Sweden 1.18% (1.21%)
249,617 Banco Santander 494 0.05
230 Banco Santander ADR - - 4,320 AAK 60 0.01
61,115 Bankia 53 0.01 4,192 AcadeMedia 22 -
26,227 Bankinter 101 0.01 2,196 AddLife 18 -
86,215 CaixaBank 149 0.02 2,027 AddNode 31 -
2,864 Cellnex Telecom 141 0.01 3,283 AddTech 105 0.01
2,412 Cia de Distribucion Integral Logista 37 - 4,660 AF Poyry 80 0.01
3,473 CIE Automotive 50 0.01 2,740 Ahlstrom-Munksjo 33 -
919 Construcciones y Auxiliar de 9,471 Alfa Laval 169 0.02
Ferrocarriles 27 - 2,386 Alimak 21 -
3,884 Ebro Foods 65 0.01 12,743 Arjo 57 0.01
3,823 EDP Renovaveis 42 0.01 7,029 Assa Abloy 117 0.01
2,300 eDreams ODIGEO 5 - 16,139 Atlas Copco 'A' 555 0.06
2,063 Elecnor 17 - 8,922 Atlas Copco 'B' 268 0.03
11,577 Enagas 232 0.02 1,580 Atrium Ljungberg 18 -
9,384 Ence Energia y Celulosa 25 - 6,168 Attendo 20 -
10,623 Endesa 213 0.02 7,015 Autoliv 366 0.04
2,600 Ercros 4 - 6,110 Avanza Bank 70 0.01
4,096 Euskaltel 30 - 5,324 Axfood 95 0.01
12,169 Faes Farma 40 - 3,334 Beijer Alma 28 -
2,640 Ferrovial 58 0.01 2,432 Beijer Ref 59 0.01
2,420 Fluidra 26 - 1,907 Bergman & Beving 12 -
3,754 Fomento de Construcciones y Contratas 29 - 566 Besqab 5 -
163 Fomento de Construcciones y 8,729 Betsson 49 0.01
Contratas Convertible Shares 1 - 8,729 Betsson Redemption Shares 2 -
Dimensional Fund Advisors Ltd. Interim Report and Financial Statements, 30 June 2020 98

International Core Equity Fund
Portfolio Statement (continued)as at 30 June 2020
Holding Investment
Fair
Value
£'000
Percentage
of total
net assets
% Holding Investment
Fair
Value
£'000
Percentage
of total
net assets
%
Sweden (continued) Sweden (continued)
1,217 BHG 9 - 1,576 Medivir 2 -
7,055 Bilia 47 0.01 2,957 Mekonomen 17 -
8,617 BillerudKorsnas 100 0.01 3,902 Millicom International Cellular 81 0.01
966 BioGaia 43 - 312 MIPS 9 -
1,799 Biotage 21 - 3,831 Modern Times Group MTG 33 -
14,347 Boliden 262 0.03 1,907 Momentum 20 -
6,073 Bonava 26 - 3,014 Mycronic 46 0.01
10,830 Bravida 83 0.01 3,466 NCC 46 0.01
1,820 Bufab 16 - 1,102 Nederman 11 -
744 Bulten 4 - 2,535 New Wave 7 -
4,300 Bure Equity 75 0.01 1,931 Nibe Industrier 34 -
7,698 Byggmax 29 - 9,692 Nobia 37 -
5,176 Castellum 80 0.01 5,775 Nobina 28 -
1,162 Catena 37 - 1,129 Nolato 61 0.01
2,211 Clas Ohlson 20 - 2,880 Nordic Entertainment 71 0.01
9,452 Cloetta 20 - 1,206 Nordic Waterproofing 10 -
1,336 Collector 2 - 2,102 NP3 Fastigheter 16 -
2,401 Concentric 27 - 10,026 Nyfosa 56 0.01
4,637 Coor Service Management 25 - 625 OEM International 13 -
4,164 Dios Fastigheter 23 - 4,286 Pandox 40 -
13,796 Dometic 102 0.01 16,185 Peab 109 0.01
2,143 Duni 17 - 1,663 Platzer Fastigheter 11 -
2,888 Dustin 13 - 636 Proact IT 10 -
1,189 Eastnine 12 - 21,340 Ratos 47 0.01
1,658 Elanders 7 - 1,558 RaySearch Laboratories 12 -
10,998 Electrolux 149 0.01 3,084 Recipharm 31 -
10,998 Electrolux Professional 33 - 1,232 Recipharm (Non-Voting) 12 -
11,166 Elekta 84 0.01 5,529 Resurs 19 -
13,928 Epiroc 'A' 141 0.01 3,087 Saab 63 0.01
8,340 Epiroc 'B' 83 0.01 3,464 Sagax 38 -
352 Essity 'A' 9 - 32,302 Samhallsbyggnadsbolaget i Norden 67 0.01
13,777 Essity 'B' 363 0.04 23,367 Sandvik 354 0.04
2,197 Evolution Gaming 106 0.01 22,028 SAS 15 -
6,132 Fabege 59 0.01 4,486 Scandi Standard 25 -
1,290 Fagerhult 4 - 1,173 Sectra 53 0.01
2,246 Fastighets Balder 70 0.01 15,525 Securitas 170 0.02
1,137 FastPartner 7 - 21,417 Skandinaviska Enskilda Banken 151 0.01
11,740 Fingerprint Cards 17 - 11,444 Skanska 188 0.02
6,009 Getinge 89 0.01 1,148 SKF 'A' 17 -
7,801 Granges 50 0.01 19,665 SKF 'B' 297 0.03
3,129 Gunnebo 5 - 1,788 SkiStar 15 -
2,685 Haldex 8 - 1,255 Spotify Technology 271 0.03
1,398 Heba Fastighets 10 - 9,272 SSAB 'A' 21 -
20,815 Hennes & Mauritz 244 0.02 34,523 SSAB 'B' 74 0.01
3,286 Hexagon 155 0.02 724 Svenska Cellulosa 'A' 7 -
15,367 Hexpol 91 0.01 14,613 Svenska Cellulosa 'B' 140 0.01
3,156 HIQ International 12 - 21,116 Svenska Handelsbanken 'A' 165 0.02
6,969 Hoist Finance 15 - 2,420 Sweco 89 0.01
2,892 Holmen 74 0.01 11,012 Swedbank 115 0.01
3,681 Hufvudstaden 37 - 4,304 Swedish Match 244 0.02
1,900 Humana 8 - 4,649 Swedish Orphan Biovitrum 86 0.01
1,287 Husqvarna 'A' 8 - 647 Systemair 9 -
18,748 Husqvarna 'B' 124 0.01 12,882 Tele2 139 0.01
2,452 ICA 95 0.01 32,169 Telefonaktiebolaget LM Ericsson 238 0.02
3,582 Indutrade 115 0.01 65,440 Telia 199 0.02
2,406 Intrum 36 - 4,884 Thule 100 0.01
4,835 JM 88 0.01 11,951 Trelleborg 140 0.01
11,991 Kindred 59 0.01 1,939 Troax 25 -
30,461 Klovern 40 - 1,231 VBG 15 -
1,991 KNOW IT 27 - 3,171 Veoneer 28 -
9,073 Kungsleden 55 0.01 447 Vitrolife 8 -
3,123 Lagercrantz 38 - 12,438 Volvo 'A' 158 0.02
1,558 Lifco 79 0.01 78,892 Volvo 'B' 1,007 0.10
5,467 Lindab International 52 0.01 6,896 Wallenstam 65 0.01
6,497 Loomis 126 0.01 5,523 Wihlborgs Fastigheter 74 0.01
5,128 Lundin Energy 100 0.01 12,084 1.18
Dimensional Fund Advisors Ltd. Interim Report and Financial Statements, 30 June 2020 99

International Core Equity Fund
Portfolio Statement (continued)as at 30 June 2020
Holding Investment
Fair
Value
£'000
Percentage
of total
net assets
% Holding Investment
Fair
Value
£'000
Percentage
of total
net assets
%
Switzerland 3.35% (3.52%) Switzerland (continued)
33,816 ABB 618 0.06 42 Interroll 70 0.01
8,130 Adecco 311 0.03 59 Intershop 28 -
7,976 Alcon 372 0.04 169 Investis 13 -
831 Allreal 134 0.01 9,791 Julius Baer 333 0.03
349 ALSO 68 0.01 146 Jungfraubahn 15 -
77 APG SGA 12 - 393 Kardex 58 0.01
3,223 Arbonia 27 - 147 Komax 19 -
47,230 Aryzta (CHF) 17 - 30,624 Kongsberg Automotive 1 -
5,270 Aryzta (EUR) 2 - 2,113 Kudelski 6 -
2,337 Ascom 18 - 2,042 Kuehne + Nagel International 275 0.03
237 Autoneum 19 - 8,830 LafargeHolcim 313 0.03
102 Bachem 22 - 334 Lastminute.com 6 -
2,119 Baloise 255 0.02 18 LEM 21 -
68 Banque Cantonale de Geneve 11 - 724 Liechtensteinische Landesbank 35 -
1,370 Banque Cantonale Vaudoise 106 0.01 5,747 Logitech International 299 0.03
110 Barry Callebaut 171 0.02 1,689 Lonza 719 0.07
21 Belimo 125 0.01 196 Luzerner Kantonalbank 66 0.01
202 Bell Food 41 0.01 11 Metall Zug 13 -
886 Bellevue 17 - 2,428 Mobilezone 17 -
317 Berner Kantonalbank 62 0.01 450 Mobimo 106 0.01
1,104 BKW 80 0.01 71,643 Nestle 6,458 0.63
472 Bobst 22 - 46,187 Novartis 3,269 0.32
371 Bossard 46 0.01 2,119 ObsEva 9 -
475 Bucher Industries 112 0.01 11,753 OC Oerlikon 77 0.01
55 Burckhardt Compression 11 - 1,065 Orascom Development 8 -
440 Burkhalter 24 - 669 Orior 45 0.01
360 Calida 9 - 611 Partners 449 0.05
31 Carlo Gavazzi 5 - 49 Phoenix Mecano 16 -
1,891 Cembra Money Bank 150 0.02 102 Plazza 24 -
2 Chocoladefabriken Lindt & Spruengli 138 0.01 1,548 PSP Swiss Property 143 0.01
7,617 Chubb 781 0.08 273 Rieter 21 -
8,311 Cie Financiere Richemont 431 0.04 676 Roche 189 0.02
11,290 Clariant 181 0.02 17,739 Roche Genusscheine NVP 5,003 0.49
381 Coltene 24 - 9 Romande Energie 8 -
74 Conzzeta 54 0.01 36 Schaffner 6 -
46,354 Credit Suisse 388 0.04 744 Schindler 143 0.01
818 CRISPR Therapeutics 50 0.01 33,223 Schmolz & Bickenbach 5 -
450 Daetwyler 71 0.01 63 Schweiter Technologies 64 0.01
2,124 DKSH 110 0.01 1,018 SFS 77 0.01
167 dormakaba 74 0.01 224 SGS 444 0.04
3,410 Dufry 81 0.01 200 Siegfried 73 0.01
619 EDAG Engineering 4 - 14,912 SIG Combibloc 194 0.02
6,825 EFG International 40 - 5,396 Sika 844 0.08
133 Emmi 94 0.01 1,204 Sonova 196 0.02
317 EMS-Chemie 198 0.02 167 St Galler Kantonalbank 60 0.01
18 Energiedienst - - 23,452 STMicroelectronics 513 0.05
82 Feintool International 3 - 161 Straumann 112 0.01
198 Fenix Outdoor International 14 - 1,283 Sulzer 83 0.01
1,369 Flughafen Zurich 146 0.02 3,513 Sunrise Communications 253 0.02
44 Forbo 52 0.01 1,706 Swatch 54 0.01
2,200 Galenica 127 0.01 1,015 Swatch Bearer Shares 165 0.02
12,379 GAM 23 - 780 Swiss Life 232 0.02
6,395 Garmin 501 0.05 2,761 Swiss Prime Site 209 0.02
3,849 Garrett Motion 17 - 5,741 Swiss Re 358 0.04
1,595 Geberit 648 0.06 1,757 Swisscom 748 0.07
249 Georg Fischer 174 0.02 661 Swissquote 46 -
126 Givaudan 381 0.04 13,035 TE Connectivity 854 0.08
41 Gurit 48 0.01 3,138 Temenos 390 0.04
1,955 Helvetia 145 0.02 179 TX 11 -
253 Hiag Immobilien 20 - 451 u-blox 25 -
110 HOCHDORF 6 - 52,989 UBS 494 0.05
1,000 Huber + Suhner 57 0.01 1,007 Valiant 75 0.01
3 Hypothekarbank Lenzburg 11 - 262 Valora 41 -
961 Implenia 29 - 1,310 VAT 192 0.02
192 Ina Invest 3 - 59 Vaudoise Assurances 23 -
90 Inficon 56 0.01 700 Vetropack 32 -
Dimensional Fund Advisors Ltd. Interim Report and Financial Statements, 30 June 2020 100

International Core Equity Fund
Portfolio Statement (continued)as at 30 June 2020
Holding Investment
Fair
Value
£'000
Percentage
of total
net assets
% Holding Investment
Fair
Value
£'000
Percentage
of total
net assets
%
Switzerland (continued) United States (continued)
1,497 Vifor Pharma 185 0.02 18,911 Aflac 545 0.05
1,967 Vontobel 112 0.01 5,515 AGCO 245 0.03
252 VP Bank 27 - 6,778 Agilent Technologies 481 0.05
440 VZ 27 - 1,500 Agilysys 22 -
110 V-ZUG 7 - 1,609 Agios Pharmaceuticals 69 0.01
7 Warteck Invest 12 - 2,207 Agree Realty 117 0.01
167 Ypsomed 19 - 8,449 Air Lease 202 0.02
752 Zehnder 24 - 5,205 Air Products and Chemicals 1,012 0.10
11 Zug Estates 19 - 6,278 Air Transport Services 109 0.01
7 Zuger Kantonalbank 37 - 6,467 Akamai Technologies 553 0.06
1,815 Zurich Insurance 517 0.05 4,210 Akebia Therapeutics 44 0.01
34,181 3.35 22,400 Alacer Gold 120 0.01
842 Alamo 69 0.01
United States 65.30% (61.52%) 1,850 Alarm.com 96 0.01
11,276 Alaska Air 338 0.03
1,938 1-800-Flowers.com 32 - 2,398 Albany International 114 0.01
670 1st Constitution Bancorp 7 - 7,309 Albemarle 454 0.05
1,735 1st Source 49 0.01 837 Albireo Pharma 19 -
4,323 2U 130 0.01 12,444 Alcoa 111 0.01
6,660 3D Systems 37 - 1,051 Alector 20 -
15,356 3M 1,942 0.19 1,200 Alerus Financial 19 -
6,757 A O Smith 256 0.03 3,262 Alexander & Baldwin 33 -
3,198 A10 Networks 17 - 200 Alexander's 39 -
2,246 AAON 98 0.01 3,664 Alexandria Real Estate Equities 482 0.05
833 AAR 14 - 8,830 Alexion Pharmaceuticals 800 0.08
4,439 Aaron's 168 0.02 672 Alico 16 -
32,706 Abbott Laboratories 2,371 0.23 1,830 Align Technology 396 0.04
30,363 AbbVie 2,386 0.23 613 Alleghany 243 0.02
2,746 Abercrombie & Fitch 23 - 7,504 Allegheny Technologies 63 0.01
760 ABIOMED 149 0.02 1,844 Allegiance Bancshares 37 -
4,455 ABM Industries 132 0.01 1,252 Allegiant Travel 114 0.01
1,701 Acacia Communications 94 0.01 2,226 ALLETE 99 0.01
4,700 Acacia Research 16 - 3,719 Alliance Data Systems 138 0.01
7,913 Acadia Healthcare 160 0.02 8,246 Alliant Energy 318 0.03
4,628 ACADIA Pharmaceuticals 182 0.02 600 Allied Motion Technologies 17 -
3,413 Acadia Realty Trust 37 - 9,580 Allison Transmission 287 0.03
2,054 Acceleron Pharma 161 0.02 10,270 Allscripts Healthcare Solutions 54 0.01
5,503 ACCO Brands 31 - 12,146 Allstate 944 0.09
1,800 Accuray 3 - 22,914 Ally Financial 365 0.04
7,262 Achillion Pharmaceuticals CVR* - - 1,309 Alnylam Pharmaceuticals 158 0.02
5,420 ACI Worldwide 117 0.01 1,200 Alpha & Omega Semiconductor 10 -
504 ACNB 11 - 5,920 Alphabet 'A' 6,736 0.66
16,460 Activision Blizzard 1,011 0.10 6,077 Alphabet 'C' 6,904 0.68
2,923 Acuity Brands 213 0.02 1,043 Altair Engineering 33 -
4,855 Acushnet 137 0.01 738 Alteryx 96 0.01
101 Adams Resources & Energy 2 - 14,327 Altice USA 264 0.03
834 Addus HomeCare 62 0.01 518 Altisource Portfolio Solutions 6 -
2,673 Adesto Technologies 27 - 4,206 Altra Industrial Motion 105 0.01
6,042 Adient 78 0.01 47,793 Altria 1,530 0.15
6,874 Adobe 2,373 0.23 1,623 AMAG Pharmaceuticals 10 -
33,273 ADT 211 0.02 377 A-Mark Precious Metals 6 -
2,700 Adtalem Global Education 69 0.01 8,877 Amazon.com 19,369 1.90
3,073 ADTRAN 27 - 1,860 Ambac Financial 21 -
7,238 Aduro Biotech 13 - 1,560 Ambarella 56 0.01
3,799 Advance Auto Parts 442 0.04 2,984 AMC Entertainment 11 -
4,081 Advanced Disposal Services 100 0.01 3,020 AMC Networks 58 0.01
1,765 Advanced Energy Industries 94 0.01 4,577 Amdocs 224 0.02
11,629 Advanced Micro Devices 475 0.05 1,182 Amedisys 190 0.02
1,895 AdvanSix 18 - 1,462 AMERCO 359 0.04
3,044 Adverum Biotechnologies 51 0.01 6,471 Ameren 367 0.04
10,427 AECOM 319 0.03 2,541 Ameresco 57 0.01
1,381 Aegion 17 - 17,685 American Airlines 191 0.02
877 Aeglea BioTherapeutics 7 - 2,332 American Assets Trust 54 0.01
1,365 AeroVironment 87 0.01 5,277 American Axle & Manufacturing 33 -
25,378 AES 296 0.03 5,734 American Campus Communities 161 0.02
3,737 Affiliated Managers 220 0.02 14,194 American Eagle Outfitters 128 0.01
Dimensional Fund Advisors Ltd. Interim Report and Financial Statements, 30 June 2020 101

International Core Equity Fund
Portfolio Statement (continued)as at 30 June 2020
Holding Investment
Fair
Value
£'000
Percentage
of total
net assets
% Holding Investment
Fair
Value
£'000
Percentage
of total
net assets
%
United States (continued) United States (continued)
12,664 American Electric Power 821 0.08 4,207 Arena Pharmaceuticals 215 0.02
2,837 American Equity Investment Life 54 0.01 3,593 Ares Management 111 0.01
22,409 American Express 1,724 0.17 1,228 Argan 47 0.01
3,097 American Finance Trust 20 - 2,330 Argo Group International 66 0.01
4,472 American Financial 223 0.02 12,853 Argonaut Gold 19 -
11,622 American Homes 4 Rent 252 0.03 1,153 Arista Networks 194 0.02
20,958 American International 523 0.05 6,558 Arlo Technologies 14 -
500 American National Bankshares 10 - 950 Armstrong Flooring 2 -
1,464 American National Insurance 85 0.01 2,900 Armstrong World Industries 176 0.02
763 American Public Education 18 - 4,768 Arrow Electronics 262 0.03
1,367 American Renal Associates 7 - 860 Arrow Financial 20 -
1,200 American Software 15 - 3,129 Arrowhead Pharmaceuticals 108 0.01
1,531 American States Water 96 0.01 500 Artesian Resources 14 -
7,731 American Tower 1,597 0.16 6,369 Arthur J Gallagher 496 0.05
1,438 American Vanguard 16 - 3,334 Artisan Partners Asset Management 85 0.01
5,019 American Water Works 513 0.05 910 Arvinas 24 -
1,309 American Woodmark 77 0.01 1,840 Asbury Automotive 117 0.01
435 America's Car-Mart 30 - 377 Ascena Retail - -
4,906 Ameriprise Financial 592 0.06 3,780 ASGN 202 0.02
4,945 Ameris Bancorp 94 0.01 3,537 Ashford Hospitality Trust 2 -
1,055 AMERISAFE 52 0.01 3,442 Ashland Global 192 0.02
6,118 AmerisourceBergen 493 0.05 1,400 Aspen Aerogels 7 -
496 Ames National 8 - 3,460 Aspen Technology 291 0.03
6,593 AMETEK 473 0.05 2,474 Assembly Biosciences 47 0.01
14,476 Amgen 2,731 0.27 5,100 Assertio 4 -
11,695 Amicus Therapeutics 148 0.02 10,606 Associated Banc-Corp 116 0.01
20,959 Amkor Technology 202 0.02 310 Associated Capital 9 -
3,213 AMN Healthcare Services 120 0.01 3,530 Assurant 289 0.03
2,154 Amneal Pharmaceuticals 8 - 5,473 Assured Guaranty 109 0.01
700 Ampco-Pittsburgh 2 - 12 Asta Funding - -
3,400 Amphastar Pharmaceuticals 61 0.01 1,771 Astec Industries 65 0.01
8,581 Amphenol 665 0.07 1,553 Astronics 14 -
1,065 Amplify Energy 1 - 2,127 At Home 12 -
8,139 Analog Devices 788 0.08 156,720 AT&T 3,823 0.38
2,200 Anaplan 80 0.01 3,807 Atara Biotherapeutics 43 0.01
1,183 AnaptysBio 22 - 9,986 Athene 249 0.03
1,540 Andersons 17 - 3,351 Atkore International 73 0.01
4,127 ANGI Homeservices 40 - 1,854 Atlantic Capital Bancshares 18 -
1,900 AngioDynamics 16 - 3,321 Atlantic Power 5 -
617 ANI Pharmaceuticals 16 - 5,447 Atlantic Union Bankshares 100 0.01
791 Anika Therapeutics 22 - 4,501 Atlantica Sustainable Infrastructure 106 0.01
852 ANSYS 196 0.02 577 Atlas Air Worldwide 19 -
1,020 Anterix 37 - 2,955 Atmos Energy 237 0.02
14,957 Antero Resources 30 - 748 ATN International 35 -
5,493 Anthem 1,160 0.11 1,515 AtriCure 55 0.01
8,009 Aon 1,228 0.12 86 Atrion 43 0.01
24,385 Apache 264 0.03 5,560 Autodesk 1,051 0.10
5,813 Apartment Investment and Management 176 0.02 10,230 Automatic Data Processing 1,220 0.12
1,927 Apogee Enterprises 37 - 6,647 AutoNation 204 0.02
541 Appfolio 71 0.01 702 AutoZone 645 0.06
111,008 Apple 32,703 3.22 1,214 Avalara 132 0.01
8,706 Apple Hospitality REIT 70 0.01 4,129 AvalonBay Communities 514 0.05
2,600 Applied Industrial Technologies 130 0.01 2,300 Avangrid 79 0.01
26,126 Applied Materials 1,255 0.12 3,693 Avanos Medical 87 0.01
3,538 AptarGroup 315 0.03 6,110 Avaya 62 0.01
2,045 Aptinyx 7 - 4,018 Avery Dennison 366 0.04
14,270 Aramark 260 0.03 2,200 Avid Technology 13 -
1,100 ArcBest 23 - 5,865 Avis Budget 108 0.01
8,956 Arch Capital 207 0.02 2,838 Avista 82 0.01
1,674 Arch Resources 41 0.01 6,591 Avnet 145 0.02
13,719 Archer-Daniels-Midland 443 0.04 1,659 Avrobio 24 -
9,645 Archrock 51 0.01 19,892 Axalta Coating Systems 359 0.04
6,328 Arconic 71 0.01 2,592 Axcelis Technologies 57 0.01
3,637 Arcosa 123 0.01 5,383 Axis Capital 179 0.02
7 Arcus Biosciences - - 1,800 Axon Enterprise 140 0.01
4,354 Ardelyx 23 - 5,127 Axos Financial 90 0.01
Dimensional Fund Advisors Ltd. Interim Report and Financial Statements, 30 June 2020 102

International Core Equity Fund
Portfolio Statement (continued)as at 30 June 2020
Holding Investment
Fair
Value
£'000
Percentage
of total
net assets
% Holding Investment
Fair
Value
£'000
Percentage
of total
net assets
%
United States (continued) United States (continued)
2,510 AXT 9 - 1,731 BlackRock 751 0.07
1,778 AZZ 49 0.01 4,301 Blackstone 196 0.02
2,405 B&G Foods 48 0.01 4,693 Bloomin' Brands 40 -
1,600 Badger Meter 80 0.01 2,000 Blucora 18 -
14,167 Baker Hughes 171 0.02 543 Blue Bird 6 -
1,147 Balchem 88 0.01 2,289 Bluebird Bio 112 0.01
14,845 Ball 827 0.08 800 Bluerock Residential Growth REIT 5 -
3,400 Banc of California 29 - 5,065 BMC Stock 102 0.01
2,300 BancFirst 73 0.01 4,971 Boingo Wireless 51 -
4,434 Bancorp 33 - 2,098 Boise Cascade 63 0.01
7,313 BancorpSouth Bank 131 0.01 3,662 BOK Financial 163 0.02
147,206 Bank of America 2,800 0.28 1,404 Bonanza Creek Energy 17 -
1,232 Bank of Commerce 7 - 1,079 Booking 1,398 0.14
2,968 Bank of Hawaii 146 0.02 2,278 Boot Barn 41 0.01
756 Bank of Marin Bancorp 20 - 7,427 Booz Allen Hamilton 458 0.05
21,116 Bank of New York Mellon 635 0.06 18,532 BorgWarner 529 0.05
4,283 Bank of NT Butterfield & Son 85 0.01 381 Boston Beer 170 0.02
361 Bank of Princeton 6 - 1,179 Boston Omaha 15 -
8,461 Bank OZK 155 0.02 6,209 Boston Private Financial 34 -
1,100 BankFinancial 7 - 4,556 Boston Properties 333 0.03
6,059 BankUnited 97 0.01 13,603 Boston Scientific 384 0.04
438 Bankwell Financial 6 - 2,138 Bottomline Technologies DE 86 0.01
2,411 Banner 73 0.01 925 Boyd Gaming 15 -
1,118 Bar Harbor Bankshares 21 - 2,792 Brady 106 0.01
3,736 Barnes 120 0.01 1,231 Braemar Hotels & Resorts 3 -
2,076 Barnes & Noble Education 3 - 8,308 Brandywine Realty Trust 76 0.01
380 Barrett Business Services 16 - 1,382 Bridge Bancorp 25 -
625 Bassett Furniture Industries 4 - 2,151 Bridgewater Bancshares 17 -
13,434 Bausch Health (CAD) 199 0.02 2,368 Briggs & Stratton 3 -
1,068 Bausch Health (USD) 16 - 1,925 Bright Horizons Family Solutions 181 0.02
9,338 Baxter International 641 0.06 1,289 Brightcove 8 -
396 Baycom 4 - 5,645 Brighthouse Financial 124 0.01
6,248 BBX Capital 13 - 5,089 Brightsphere Investment 52 0.01
1,120 BCB Bancorp 8 - 3,749 BrightView 34 -
5,078 Beacon Roofing Supply 107 0.01 1,813 Brinker International 37 -
2,194 Beazer Homes USA 18 - 2,837 Brink's 106 0.01
3,793 Becton Dickinson 720 0.07 24,577 Bristol-Myers Squibb 1,157 0.12
6,923 Bed Bath & Beyond 61 0.01 281 Bristow 3 -
500 Bel Fuse 4 - 12,337 Brixmor Property 130 0.01
3,132 Belden 81 0.01 12,563 Broadcom 3,167 0.31
1,692 Benchmark Electronics 29 - 5,164 Broadridge Financial Solutions 529 0.05
36,878 Berkshire Hathaway 5,317 0.52 9,781 Brookdale Senior Living 22 -
2,472 Berkshire Hills Bancorp 22 - 3,573 Brookfield Property REIT 30 -
3,274 Berry 13 - 5,780 Brookline Bancorp 46 0.01
6,579 Berry Global 234 0.02 4,817 Brooks Automation 168 0.02
12,186 Best Buy 857 0.09 11,827 Brown & Brown 385 0.04
418 BG Staffing 4 - 1,989 Brown-Forman 'A' 92 0.01
21,979 BGC Partners 49 0.01 11,004 Brown-Forman 'B' 567 0.06
700 Big 5 Sporting Goods 1 - 1,128 BRT Apartments 10 -
4,089 Big Lots 144 0.02 6,873 Bruker 220 0.02
10 Biglari 'A' 3 - 6,445 Brunswick 332 0.03
101 Biglari 'B' 5 - 1,346 Bryn Mawr Bank 29 -
1,732 BioDelivery Sciences International 6 - 3,481 Buckle 44 0.01
9,097 Biogen 1,929 0.19 1,234 Build-A-Bear Workshop 2 -
1,000 BioLife Solutions 12 - 9,788 Builders FirstSource 163 0.02
1,639 BioMarin Pharmaceutical 163 0.02 6,436 Bunge 214 0.02
620 Bio-Rad Laboratories 218 0.02 3,376 Burlington Stores 544 0.05
400 BioSpecifics Technologies 19 - 5,858 BWX Technologies 268 0.03
680 Bio-Techne 141 0.01 1,918 Byline Bancorp 20 -
1,841 BioTelemetry 66 0.01 312 C&F Financial 8 -
1,821 BJ's Restaurants 31 - 306 Cable One 438 0.04
6,120 BJ's Wholesale Club 189 0.02 5,200 Cabot 155 0.02
2,702 Black Hills 123 0.01 1,559 Cabot Microelectronics 170 0.02
5,326 Black Knight 312 0.03 29,330 Cabot Oil & Gas 407 0.04
2,044 Blackbaud 95 0.01 1,548 CACI International 276 0.03
1,381 Blackline 93 0.01 3,375 Cactus 54 0.01
Dimensional Fund Advisors Ltd. Interim Report and Financial Statements, 30 June 2020 103

International Core Equity Fund
Portfolio Statement (continued)as at 30 June 2020
Holding Investment
Fair
Value
£'000
Percentage
of total
net assets
% Holding Investment
Fair
Value
£'000
Percentage
of total
net assets
%
United States (continued) United States (continued)
8,576 Cadence BanCorp 60 0.01 13,333 Central European Media Enterprises 38 -
7,048 Cadence Design Systems 540 0.05 606 Central Garden & Pet 18 -
849 CAI International 12 - 3,104 Central Garden & Pet 'A' 86 0.01
2,700 CalAmp 17 - 1,600 Central Pacific Financial 20 -
885 Calavo Growers 44 0.01 506 Central Valley Community Bancorp 6 -
2,500 Caleres 16 - 6,598 Century Aluminum 37 -
1,276 California Resources 1 - 353 Century Bancorp 22 -
2,115 California Water Service 80 0.01 2,428 Century Communities 60 0.01
2,731 Calithera Biosciences 12 - 76,692 CenturyLink 610 0.06
2,749 Calix 33 - 1,230 Cerence 39 -
7,197 Callaway Golf 103 0.01 4,033 Ceridian HCM 257 0.03
19,449 Callon Petroleum 18 - 8,562 Cerner 474 0.05
1,976 Cal-Maine Foods 71 0.01 1,369 CEVA 40 -
262 Cambridge Bancorp 13 - 10,035 CF Industries 225 0.02
1,262 Camden National 34 - 7,095 CH Robinson Worldwide 449 0.05
3,644 Camden Property Trust 267 0.03 7,491 ChampionX 59 0.01
11,273 Campbell Soup 452 0.05 12,469 Change Healthcare 112 0.01
700 Camping World 15 - 1,886 ChannelAdvisor 23 -
5,778 Cannae 193 0.02 2,691 Charles River Laboratories
1,760 Cantel Medical 63 0.01 International 371 0.04
1,350 Capital City Bank 22 - 27,572 Charles Schwab 735 0.07
12,600 Capital One Financial 639 0.06 2,387 Chart Industries 91 0.01
500 Capital Senior Living - - 3,653 Charter Communications 1,514 0.15
10,098 Capitol Federal Financial 90 0.01 618 Chase 50 0.01
11,763 Capri 150 0.02 2,384 Chatham Lodging Trust 12 -
1,434 Capstar Financial 13 - 3,364 Cheesecake Factory 62 0.01
1,111 Cara Therapeutics 15 - 1,568 Chefs' Warehouse 18 -
14,539 Cardinal Health 615 0.06 2,042 Chegg 111 0.01
440 Cardiovascular Systems 11 - 709 Chemed 256 0.03
3,392 Cardtronics 67 0.01 1,826 ChemoCentryx 81 0.01
498 CareDx 14 - 12,911 Chemours 161 0.02
3,788 CareTrust REIT 53 0.01 300 Chemung Financial 7 -
1,925 Cargurus 38 - 8,961 Cheniere Energy 336 0.03
2,360 Carlisle 229 0.02 741 Chesapeake Utilities 50 0.01
9,295 CarMax 673 0.07 38,318 Chevron 2,736 0.27
15,266 Carnival 208 0.02 2,300 Chiasma 11 -
2,136 Carpenter Technology 42 0.01 6,214 Chico's FAS 7 -
1,200 Carriage Services 18 - 800 Children's Place 25 -
19,409 Carrier Global 349 0.04 2,360 Chimerix 6 -
3,042 Carrols Restaurant 12 - 819 Chipotle Mexican Grill 698 0.07
3,231 Cars.com 16 - 2,232 Choice Hotels International 142 0.01
3,401 Carter's 220 0.02 8,815 Church & Dwight 551 0.06
359 Carvana 35 - 1,931 Churchill Downs 208 0.02
1,867 Casa Systems 6 - 1,616 Chuy's 20 -
2,425 Casella Waste Systems 100 0.01 7,865 Ciena 340 0.03
2,458 Casey's General Stores 297 0.03 8,407 Cigna 1,284 0.13
858 Cass Information Systems 27 - 6,530 Cimarex Energy 144 0.02
5,195 Castlight Health 3 - 1,581 Cincinnati Bell 19 -
6,977 Catalent 409 0.04 6,111 Cincinnati Financial 317 0.03
6,665 Catalyst Pharmaceuticals 25 - 8,885 Cinemark 84 0.01
25,670 Caterpillar 2,616 0.26 3,053 Cintas 655 0.07
5,460 Cathay General Bancorp 115 0.01 1,474 CIRCOR International 29 -
900 Cato 6 - 2,972 Cirrus Logic 146 0.02
301 Cavco Industries 48 0.01 135,612 Cisco Systems 5,098 0.50
3,583 CBIZ 69 0.01 6,179 CIT 104 0.01
3,264 Cboe Global Markets 243 0.02 853 Citi Trends 11 -
11,157 CBRE 401 0.04 37,277 Citigroup 1,525 0.15
1,046 CBTX 17 - 2,000 Citizens 10 -
5,113 CDK Global 171 0.02 800 Citizens & Northern 13 -
5,032 CDW 467 0.05 14,409 Citizens Financial 276 0.03
2,764 CECO Environmental 15 - 4,770 Citrix Systems 562 0.06
5,867 Cedar Realty Trust 5 - 1,039 City 54 0.01
6,758 Celanese 470 0.05 4,512 Civeo 2 -
15,606 Centene 795 0.08 679 Civista Bancshares 8 -
13,493 Centennial Resource Development 11 - 3,351 Clarus 30 -
15,194 CenterPoint Energy 230 0.02 17,294 Clean Energy Fuels 31 -
Dimensional Fund Advisors Ltd. Interim Report and Financial Statements, 30 June 2020 104

International Core Equity Fund
Portfolio Statement (continued)as at 30 June 2020
Holding Investment
Fair
Value
£'000
Percentage
of total
net assets
% Holding Investment
Fair
Value
£'000
Percentage
of total
net assets
%
United States (continued) United States (continued)
4,447 Clean Harbors 216 0.02 7,118 Consolidated Edison 421 0.04
1,915 Clearfield 22 - 3,274 Constellation Brands 464 0.05
900 Clearwater Paper 26 - 1,411 Construction Partners 20 -
1,500 Clearway Energy 'A' 26 - 2,200 Container Store 6 -
3,572 Clearway Energy 'C' 67 0.01 7,541 Contango Oil & Gas 16 -
19,145 Cleveland-Cliffs 84 0.01 5,243 Continental Resources 69 0.01
800 Clipper Realty 5 - 1,383 Cooper 305 0.03
4,218 Clorox 748 0.07 2,601 Cooper Tire & Rubber 58 0.01
18,816 Cloudera 198 0.02 816 Cooper-Standard 9 -
6,334 CME 836 0.08 1,904 Copa 80 0.01
7,848 CMS Energy 368 0.04 8,343 Copart 556 0.06
2,727 CNA Financial 71 0.01 6,580 Corcept Therapeutics 90 0.01
1,153 CNB Financial 16 - 4,057 CoreCivic 31 -
7,390 CNO Financial 91 0.01 5,370 CoreLogic 299 0.03
10,652 CNX Resources 74 0.01 3,740 Core-Mark 75 0.01
77,443 Coca-Cola 2,796 0.28 2,624 CorePoint Lodging 9 -
400 Coca-Cola Consolidated 75 0.01 1,577 CoreSite Realty 153 0.02
878 Codexis 8 - 7,700 Cornerstone Building Brands 37 -
457 Codorus Valley Bancorp 5 - 1,840 Cornerstone OnDemand 57 0.01
15,436 Coeur Mining 60 0.01 26,490 Corning 553 0.06
1,935 Cogent Communications 123 0.01 4,738 Corporate Office Properties Trust 97 0.01
4,398 Cognex 210 0.02 16,298 Corteva 347 0.04
14,424 Cognizant Technology Solutions 663 0.07 1,178 CorVel 70 0.01
2,809 Cohen & Steers 153 0.02 1,811 Corvus Pharmaceuticals 4 -
1,524 Coherent 164 0.02 7,161 Costamare 33 -
3,400 Cohu 46 0.01 373 CoStar 210 0.02
7,507 Colfax 164 0.02 8,805 Costco Wholesale 2,162 0.21
15,497 Colgate-Palmolive 914 0.09 38,163 Coty 147 0.02
409 Collectors Universe 12 - 200 County Bancorp 4 -
1,200 Collegium Pharmaceutical 17 - 775 Coupa Software 172 0.02
500 Colony Bankcorp 5 - 6,018 Cousins Properties 147 0.02
3,256 Columbia Banking System 73 0.01 8,374 Covanta 64 0.01
7,929 Columbia Financial 88 0.01 700 Covenant Transportation 8 -
5,139 Columbia Property Trust 55 0.01 4,247 Covetrus 60 0.01
3,712 Columbia Sportswear 241 0.02 1,357 Cowen 17 -
1,838 Columbus McKinnon 48 0.01 1,656 Cracker Barrel Old Country Store 147 0.02
203,526 Comcast 6,454 0.63 912 Craft Brew Alliance 11 -
8,301 Comerica 250 0.03 4,188 Crane 200 0.02
3,104 Comfort Systems USA 101 0.01 3,400 Crawford 'A' 21 -
7,640 Commerce Bancshares 364 0.04 1,700 Crawford 'B' 10 -
4,651 Commercial Metals 76 0.01 1,592 Credit Acceptance 544 0.05
2,800 Commercial Vehicle 7 - 7,102 Cree 336 0.03
10,669 CommScope 72 0.01 3,653 Crocs 104 0.01
500 Communications Systems 2 - 3,082 Cross Country Healthcare 16 -
2,892 Community Bank System 131 0.01 7,904 Crown 418 0.04
1,500 Community Bankers Trust 7 - 7,859 Crown Castle International 1,039 0.10
500 Community Financial 9 - 2,263 CryoLife 35 -
7,299 Community Health Systems 18 - 2,943 CSG Systems International 100 0.01
951 Community Healthcare Trust 32 - 778 CSW Industrials 43 0.01
1,206 Community Trust Bancorp 32 - 22,778 CSX 1,270 0.13
2,053 CommVault Systems 64 0.01 369 CTO Realty Growth 12 -
2,856 Compass Minerals International 112 0.01 2,500 CTS 40 -
1,200 Computer Programs and Systems 21 - 8,540 CubeSmart 188 0.02
716 Computer Task 2 - 1,685 Cubic 66 0.01
1,359 comScore 3 - 3,452 Cullen/Frost Bankers 204 0.02
600 Comtech Telecommunications 8 - 663 Culp 5 -
11,939 Conagra Brands 328 0.03 6,313 Cummins 889 0.09
1,400 Concert Pharmaceuticals 11 - 700 Curo 5 -
8,963 Concho Resources 365 0.04 2,730 Curtiss-Wright 200 0.02
9,637 Conduent 19 - 11,652 Cushman & Wakefield 117 0.01
1,313 CONMED 74 0.01 1,671 Customers Bancorp 16 -
2,902 ConnectOne Bancorp 37 - 251 Cutera 2 -
1,600 Conn's 13 - 8,801 CVB Financial 132 0.01
52,147 ConocoPhillips 1,752 0.17 6,309 CVR Energy 99 0.01
2,055 CONSOL Energy 9 - 28,126 CVS Health 1,476 0.15
7,756 Consolidated Communications 40 - 3,339 Cymabay Therapeutics 10 -
Dimensional Fund Advisors Ltd. Interim Report and Financial Statements, 30 June 2020 105

International Core Equity Fund
Portfolio Statement (continued)as at 30 June 2020
Holding Investment
Fair
Value
£'000
Percentage
of total
net assets
% Holding Investment
Fair
Value
£'000
Percentage
of total
net assets
%
United States (continued) United States (continued)
4,763 CyrusOne 289 0.03 4,889 Dropbox 85 0.01
1,591 CytomX Therapeutics 11 - 1,300 DSP 17 -
102 Daily Journal 21 - 4,825 DTE Energy 419 0.04
3,800 Daktronics 13 - 300 Ducommun 9 -
9,757 Dana 97 0.01 9,306 Duke Energy 608 0.06
7,296 Danaher 1,024 0.10 13,302 Duke Realty 374 0.04
5,322 Darden Restaurants 331 0.03 3,388 Dunkin' Brands 178 0.02
12,097 Darling Ingredients 232 0.02 17,498 DuPont de Nemours 747 0.07
1,353 DASAN Zhone Solutions 9 - 16,776 DXC Technology 219 0.02
8,897 Daseke 28 - 1,354 DXP Enterprises 22 -
2,008 Dave & Buster's Entertainment 21 - 2,710 Dycom Industries 89 0.01
8,378 DaVita 527 0.05 13,524 E*TRADE Financial 536 0.05
711 Dawson Geophysical 1 - 2,324 Eagle Bancorp 60 0.01
4,233 Dean Foods - - 2,472 Eagle Bulk Shipping 5 -
2,241 Deckers Outdoor 355 0.04 2,033 Eagle Materials 117 0.01
13,705 Deere 1,715 0.17 711 Eagle Pharmaceuticals 28 -
2,106 Del Taco Restaurants 10 - 1,670 Earthstone Energy 4 -
6,290 Delek US Energy 86 0.01 9,807 East West Bancorp 281 0.03
3,602 Dell Technologies 158 0.02 3,466 Easterly Government Properties 65 0.01
4,841 Delphi Technologies 56 0.01 308 Eastern 5 -
41,008 Delta Air Lines 951 0.09 1,711 EastGroup Properties 162 0.02
2,889 Deluxe 56 0.01 8,355 Eastman Chemical 471 0.05
3,950 Denali Therapeutics 76 0.01 16,088 Eaton 1,138 0.11
21,935 Denbury Resources 6 - 7,608 Eaton Vance 232 0.02
3,300 Denny's 27 - 38,153 eBay 1,594 0.16
9,155 DENTSPLY SIRONA 327 0.03 1,207 Ebix 21 -
5,074 Designer Brands 27 - 1,334 Echo Global Logistics 23 -
2,500 Destination XL 1 - 3,547 EchoStar 81 0.01
29,186 Devon Energy 264 0.03 3,005 Ecolab 478 0.05
1,015 DexCom 329 0.03 4,131 Edgewell Personal Care 103 0.01
2,438 DHI 4 - 8,803 Edison International 397 0.04
414 Diamond Hill Investment 37 - 7,272 Edwards Lifesciences 402 0.04
6,427 Diamondback Energy 216 0.02 1,400 eGain 12 -
8,250 DiamondRock Hospitality 36 - 1,125 eHealth 87 0.01
5,972 Dick's Sporting Goods 202 0.02 1,600 El Paso Electric 87 0.01
1,694 Digi International 15 - 2,072 El Pollo Loco 25 -
6,111 Digital Realty Trust 697 0.07 16,499 Elanco Animal Health 282 0.03
2,003 Digital Turbine 19 - 1,034 Elastic 77 0.01
1,176 Dillard's 25 - 5,952 Eldorado Resorts 191 0.02
1,821 Dime Community Bancshares 20 - 6,205 Electronic Arts 660 0.07
679 Dine Brands Global 23 - 15,901 Element Solutions 136 0.01
3,848 Diodes 155 0.02 2,154 Elevate Credit 3 -
16,433 Discover Financial Services 659 0.07 3,259 elf Beauty 50 0.01
7,398 Discovery 'A' 128 0.01 17,274 Eli Lilly 2,291 0.22
14,174 Discovery 'C' 223 0.02 4,183 EMCOR 222 0.02
10,341 DISH Network 278 0.03 875 EMCORE 2 -
8,321 Diversified Healthcare Trust 30 - 3,784 Emerald 9 -
1,100 DMC Global 24 - 2,703 Emergent BioSolutions 166 0.02
2,047 DocuSign 286 0.03 26,230 Emerson Electric 1,310 0.13
2,049 Dolby Laboratories 110 0.01 7,231 Empire State Realty Trust 40 -
9,272 Dollar General 1,435 0.14 2,102 Employers 52 0.01
10,129 Dollar Tree 772 0.08 1,520 Enanta Pharmaceuticals 61 0.01
10,639 Dominion Energy 699 0.07 6,756 Encompass Health 334 0.03
1,454 Domino's Pizza 437 0.04 2,190 Encore Capital 61 0.01
2,986 Domtar 51 - 532 Encore Wire 21 -
5,960 Donaldson 223 0.02 12,580 Endurance International 41 0.01
2,571 Donegal 29 - 3,943 Energizer 148 0.02
2,797 Donnelley Financial Solutions 19 - 339 Energy Fuels - -
3,186 Dorian LPG 20 - 2,100 Energy Recovery 15 -
1,102 Dorman Products 60 0.01 3,097 Enerpac Tool 45 0.01
2,000 Douglas Dynamics 57 0.01 2,965 EnerSys 155 0.02
7,235 Douglas Emmett 180 0.02 21,688 EnLink Midstream 41 -
6,453 Dover 497 0.05 1,700 Ennis 25 -
28,635 Dow 955 0.09 2,955 Enova International 36 -
14,458 DR Horton 643 0.06 5,716 Enphase Energy 220 0.02
2,299 Dril-Quip 55 0.01 1,380 EnPro Industries 54 0.01
Dimensional Fund Advisors Ltd. Interim Report and Financial Statements, 30 June 2020 106

International Core Equity Fund
Portfolio Statement (continued)as at 30 June 2020
Holding Investment
Fair
Value
£'000
Percentage
of total
net assets
% Holding Investment
Fair
Value
£'000
Percentage
of total
net assets
%
United States (continued) United States (continued)
2,850 Ensign 94 0.01 41,249 Facebook 7,416 0.73
1,058 Enstar 132 0.01 1,926 FactSet Research Systems 512 0.05
5,900 Entegris 278 0.03 1,453 Fair Isaac 480 0.05
9,895 Entercom Communications 11 - 1,124 Farmer Bros 7 -
4,259 Entergy 325 0.03 369 Farmers & Merchants Bancorp Archbold 6 -
743 Enterprise Bancorp 14 - 2,000 Farmers National Banc 19 -
2,113 Enterprise Financial Services 51 0.01 900 FARO Technologies 39 -
3,400 Entravision Communications 4 - 15,434 Fastenal 526 0.05
2,326 Envestnet 133 0.01 1,976 FB Financial 38 -
4,567 Envista 76 0.01 900 FBL Financial 26 -
26,598 EOG Resources 1,074 0.11 800 Federal Agricultural Mortgage 40 -
1,392 EPAM Systems 279 0.03 2,793 Federal Realty Investment Trust 193 0.02
1,870 Epizyme 25 - 3,200 Federal Signal 77 0.01
1,000 ePlus 58 0.01 7,330 Federated Hermes 139 0.01
3,229 EPR Properties 87 0.01 11,700 FedEx 1,281 0.13
17,326 EQT 156 0.02 552 FedNat 5 -
1,093 Equifax 149 0.02 5,350 Ferro 51 -
2,018 Equinix 1,132 0.11 6,350 Ferroglobe 3 -
17,634 Equitable 273 0.03 2,719 FibroGen 90 0.01
7,846 Equitrans Midstream 53 0.01 149 Fidelity D&D Bancorp 6 -
611 Equity Bancshares 8 - 16,404 Fidelity National Financial 408 0.04
5,510 Equity Commonwealth 143 0.02 10,083 Fidelity National Information
6,990 Equity LifeStyle Properties 351 0.04 Services 1,077 0.11
10,739 Equity Residential 504 0.05 1,195 Fiesta Restaurant 6 -
1,686 Erie Indemnity 259 0.03 17,844 Fifth Third Bancorp 272 0.03
784 Escalade 9 - 1,266 Financial Institutions 18 -
1,677 ESCO Technologies 114 0.01 10,262 FireEye 101 0.01
516 Esquire Financial 7 - 8,331 First American Financial 322 0.03
853 ESSA Bancorp 10 - 949 First Bancorp 16 -
6,913 Essent 201 0.02 11,569 First BanCorp/Puerto Rico 52 0.01
3,635 Essential Properties Realty Trust 45 0.01 1,988 First Bancorp/Southern Pines NC 39 -
6,389 Essential Utilities 217 0.02 898 First Bancshares 16 -
1,903 Essex Property Trust 351 0.04 1,539 First Bank/Hamilton NJ 8 -
4,057 Estee Lauder 614 0.06 3,339 First Busey 50 0.01
1,400 Ethan Allen Interiors 13 - 488 First Business Financial Services 6 -
2,787 Etsy 233 0.02 500 First Choice Bancorp 6 -
2,680 Euronet Worldwide 204 0.02 647 First Citizens BancShares 208 0.02
252 Evans Bancorp 5 - 7,039 First Commonwealth Financial 46 0.01
552 Everbridge 61 0.01 498 First Community 6 -
3,419 Evercore 159 0.02 1,200 First Community Bankshares 21 -
1,734 Everest Re 286 0.03 1,033 First Financial 30 -
6,765 Evergy 326 0.03 6,372 First Financial Bancorp 71 0.01
1,054 Everi 4 - 8,078 First Financial Bankshares 184 0.02
7,462 Eversource Energy 505 0.05 3,125 First Foundation 40 -
4,468 EVERTEC 101 0.01 484 First Guaranty Bancshares 5 -
2,250 Evo Payments 42 0.01 5,956 First Hawaiian 81 0.01
7,423 Evolent Health 41 - 60,366 First Horizon National* - -
1,800 Evolution Petroleum 4 - 20,652 First Horizon National Corp 161 0.02
5,550 Evoqua Water Technologies 80 0.01 5,143 First Industrial Realty Trust 158 0.02
2,577 EW Scripps 18 - 1,000 First Internet Bancorp 13 -
2,896 Exact Sciences 203 0.02 3,145 First Interstate BancSystem 78 0.01
16,608 Exelixis 307 0.03 3,635 First Merchants 80 0.01
20,558 Exelon 603 0.06 1,140 First Mid Bancshares 23 -
1,658 ExlService 84 0.01 7,802 First Midwest Bancorp 84 0.01
3,919 Expedia 264 0.03 815 First Northwest Bancorp 8 -
5,963 Expeditors International of 1,653 First of Long Island 22 -
Washington 361 0.04 4,387 First Republic Bank 375 0.04
2,020 Exponent 130 0.01 5,832 First Solar 235 0.02
3,349 Express 4 - 3,142 FirstCash 169 0.02
16,345 Extended Stay America 149 0.02 14,838 FirstEnergy 459 0.04
1,758 Exterran 8 - 10,653 Fiserv 841 0.08
4,589 Extra Space Storage 343 0.03 14,102 Fitbit 74 0.01
68,561 Exxon Mobil 2,473 0.24 2,581 Five Below 225 0.02
1,900 EZCORP 10 - 3,904 Five Point 15 -
3,323 F5 Networks 372 0.04 3,150 Five Prime Therapeutics 17 -
1,930 Fabrinet 94 0.01 563 Five Star Senior Living 2 -
Dimensional Fund Advisors Ltd. Interim Report and Financial Statements, 30 June 2020 107

International Core Equity Fund
Portfolio Statement (continued)as at 30 June 2020
Holding Investment
Fair
Value
£'000
Percentage
of total
net assets
% Holding Investment
Fair
Value
£'000
Percentage
of total
net assets
%
United States (continued) United States (continued)
2,903 Flagstar Bancorp 67 0.01 25,200 General Mills 1,247 0.12
3,180 FleetCor Technologies 637 0.06 72,960 General Motors 1,501 0.15
43,920 Flex 365 0.04 853 Genesco 15 -
329 Flexsteel Industries 3 - 700 Genie Energy 4 -
5,340 FLIR Systems 174 0.02 7,520 Genpact 221 0.02
4,010 Floor & Decor 186 0.02 13,933 Gentex 292 0.03
2,775 Flotek Industries 3 - 1,787 Gentherm 56 0.01
11,042 Flowers Foods 200 0.02 7,384 Genuine Parts 523 0.05
7,078 Flowserve 163 0.02 18,368 Genworth Financial 38 -
489 Fluent 1 - 543 GEO 5 -
4,295 Fluidigm 14 - 1,191 Geospace Technologies 8 -
9,024 Fluor 88 0.01 2,179 German American Bancorp 54 0.01
1,768 Flushing Financial 17 - 1,814 Getty Realty 44 0.01
6,638 FMC 526 0.05 2,397 Gibraltar Industries 92 0.01
21,439 FNB 128 0.01 1,802 G-III Apparel 19 -
502 FONAR 9 - 39,200 Gilead Sciences 2,382 0.23
8,986 Foot Locker 215 0.02 5,444 Glacier Bancorp 153 0.02
155,271 Ford Motor 759 0.08 1,175 Gladstone Commercial 18 -
3,296 Forestar 39 - 2,232 Global Blood Therapeutics 121 0.01
4,900 FormFactor 112 0.01 491 Global Indemnity 10 -
990 Forrester Research 25 - 2,100 Global Medical REIT 19 -
3,962 Forterra 30 - 3,416 Global Net Lease 46 0.01
3,094 Fortinet 336 0.03 6,621 Global Payments 898 0.09
5,945 Fortive 329 0.03 1,625 Global Water Resources 13 -
6,493 Fortune Brands Home & Security 332 0.03 1,148 Globant 137 0.01
4,800 Forum Energy Technologies 2 - 6,205 Globe Life 365 0.04
1,909 Forward Air 76 0.01 3,799 Globus Medical 147 0.02
2,482 Fossil 9 - 5,229 Glu Mobile 39 -
2,773 Four Corners Property Trust 54 0.01 2,193 GlycoMimetics 7 -
13,519 Fox 'A' 296 0.03 2,568 GMS 49 0.01
8,906 Fox 'B' 194 0.02 4,765 GoDaddy 282 0.03
1,821 Fox Factory 121 0.01 5,599 Gold Resource 18 -
654 Franklin Covey 11 - 5,441 Goldman Sachs 857 0.09
2,456 Franklin Electric 104 0.01 16,506 Goodyear Tire & Rubber 121 0.01
649 Franklin Financial Network 13 - 660 Goosehead Insurance 39 -
18,909 Franklin Resources 315 0.03 2,138 GoPro 8 -
4,400 Franklin Street Properties 18 - 1,523 Gorman-Rupp 38 -
47,056 Freeport-McMoRan 422 0.04 757 GP Strategies 5 -
800 FreightCar America 1 - 7,129 Graco 275 0.03
2,115 Fresh Del Monte Produce 42 - 8,209 GrafTech International 54 0.01
675 Freshpet 45 0.01 585 Graham 6 -
2,501 Front Yard Residential 18 - 261 Graham 'B' 73 0.01
3,314 frontdoor 121 0.01 1,645 Grand Canyon Education 121 0.01
965 FRP 32 - 2,566 Granite Construction 40 -
179 FS Bancorp 6 - 24,697 Graphic Packaging 276 0.03
2,104 FTI Consulting 191 0.02 5,439 Gray Television 61 0.01
11,378 Fulton Financial 97 0.01 5,297 Great Lakes Dredge & Dock 39 -
4,228 FutureFuel 41 0.01 1,039 Great Southern Bancorp 33 -
1,100 FVCBankcorp 9 - 3,831 Great Western Bancorp 43 0.01
2,718 G1 Therapeutics 53 0.01 4,957 Green Brick Partners 45 0.01
498 Gaia 3 - 3,961 Green Dot 155 0.02
365 GAMCO Investors 4 - 1,137 Green Plains 9 -
4,349 GameStop 15 - 1,672 Greenbrier 31 -
9,046 Gaming and Leisure Properties 254 0.03 507 Greene County Bancorp 9 -
6,721 Gannett 8 - 1,093 Greenhill 9 -
32,615 Gap 331 0.03 2,605 Greenlight Capital Re 14 -
2,402 Gartner 233 0.02 2,306 Greif 'A' 63 0.01
4,395 GasLog 11 - 1,179 Greif 'B' 39 -
9,627 Gates Industrial 79 0.01 109 Griffin Industrial Realty 5 -
2,000 GATX 99 0.01 2,300 Griffon 34 -
5,752 GCI Liberty 314 0.03 2,200 Gritstone Oncology 12 -
4,635 GCP Applied Technologies 68 0.01 920 Group 1 Automotive 49 0.01
4,055 Genco Shipping & Trading 21 - 1,323 Groupon 21 -
900 Gencor Industries 9 - 4,007 Grubhub 228 0.02
3,065 Generac 297 0.03 2,299 GSI Technology 13 -
110,394 General Electric 609 0.06 1,283 GTT Communications 9 -
Dimensional Fund Advisors Ltd. Interim Report and Financial Statements, 30 June 2020 108

International Core Equity Fund
Portfolio Statement (continued)as at 30 June 2020
Holding Investment
Fair
Value
£'000
Percentage
of total
net assets
% Holding Investment
Fair
Value
£'000
Percentage
of total
net assets
%
United States (continued) United States (continued)
707 Guaranty Bancshares 14 - 4,896 Hershey 509 0.05
1,784 Guardant Health 116 0.01 3,830 Hertz Global 5 -
4,607 Guess? 36 - 405 Heska 30 -
2,437 Guidewire Software 217 0.02 12,161 Hess 494 0.05
717 Gulf Island Fabrication 2 - 50,040 Hewlett Packard Enterprise 390 0.04
7,504 Gulfport Energy 6 - 6,763 Hexcel 258 0.03
2,914 H&E Equipment Services 44 0.01 600 Hibbett Sports 10 -
11,052 H&R Block 128 0.01 6,652 HighPoint Resources 2 -
1,918 Hackett 21 - 4,368 Highwoods Properties 132 0.01
2,350 Haemonetics 168 0.02 4,674 Hill International 6 -
6,578 Hain Celestial 166 0.02 3,690 Hill-Rom 325 0.03
1,013 Hallador Energy 1 - 3,999 Hilltop 59 0.01
56,699 Halliburton 572 0.06 5,612 Hilton Grand Vacations 88 0.01
890 Hallmark Financial Services 2 - 8,748 Hilton Worldwide 526 0.05
2,673 Halozyme Therapeutics 56 0.01 200 Hingham Institution For Savings 27 -
600 Hamilton Beach Brands 6 - 3,858 HMS 99 0.01
1,787 Hamilton Lane 94 0.01 4,190 HNI 105 0.01
5,859 Hancock Whitney 98 0.01 9,763 HollyFrontier 226 0.02
31,905 Hanesbrands 290 0.03 13,202 Hologic 574 0.06
2,000 Hanger 27 - 854 Home Bancorp 18 -
1,292 Hanmi Financial 10 - 11,355 Home BancShares AR 137 0.01
2,120 Hanover Insurance 173 0.02 18,197 Home Depot 3,646 0.36
4,282 HarborOne Bancorp 29 - 1,119 HomeStreet 22 -
13,261 Harley-Davidson 257 0.03 1,029 HomeTrust Bancshares 13 -
5,200 Harmonic 20 - 14,448 Honeywell International 1,686 0.17
1,300 Harpoon Therapeutics 17 - 200 Hooker Furniture 3 -
4,906 Harsco 52 0.01 6,592 Hope Bancorp 48 0.01
14,240 Hartford Financial Services 444 0.04 3,200 Horace Mann Educators 94 0.01
2,957 Harvard Bioscience 8 - 2,825 Horizon Bancorp 24 -
4,090 Hasbro 245 0.03 9,977 Horizon Therapeutics 449 0.05
854 Haverty Furniture 11 - 12,472 Hormel Foods 491 0.05
4,303 Hawaiian 50 0.01 21,957 Host Hotels & Resorts 196 0.02
4,590 Hawaiian Electric Industries 134 0.01 6,762 Hostess Brands 67 0.01
720 Hawkins 25 - 9,206 Houghton Mifflin Harcourt 13 -
570 Hawthorn Bancshares 9 - 2,351 Houlihan Lokey 103 0.01
400 Haynes International 8 - 700 Houston Wire & Cable 1 -
3,459 HB Fuller 125 0.01 3,039 Howard Hughes 130 0.01
6,302 HCA Healthcare 493 0.05 25,313 Howmet Aerospace 334 0.03
800 HCI 29 - 45,426 HP 634 0.06
13,684 HD Supply 375 0.04 1,500 Hub 57 0.01
5,557 Healthcare Realty Trust 132 0.01 4,154 Hubbell 413 0.04
3,685 Healthcare Services 73 0.01 756 HubSpot 134 0.01
8,890 Healthcare Trust of America 189 0.02 841 Hudson 3 -
16,316 Healthpeak Properties 361 0.04 135 Hudson Global 1 -
2,705 HealthStream 47 0.01 6,326 Hudson Pacific Properties 129 0.01
6,601 Heartland Express 110 0.01 3,795 Humana 1,172 0.12
2,284 Heartland Financial USA 60 0.01 44,976 Huntington Bancshares 325 0.03
34,548 Hecla Mining 86 0.01 3,050 Huntington Ingalls Industries 440 0.04
1,490 HEICO 122 0.01 17,770 Huntsman 257 0.03
2,157 HEICO 'A' 144 0.02 200 Hurco 5 -
1,217 Heidrick & Struggles International 21 - 1,601 Huron Consulting 57 0.01
1,390 Helen of Troy 213 0.02 2,167 Hyatt Hotels 89 0.01
2,467 Helios Technologies 75 0.01 900 Hyster-Yale Materials Handling 28 -
5,089 Helix Energy Solutions 15 - 529 I3 Verticals 13 -
7,280 Helmerich & Payne 113 0.01 6,279 IAA 196 0.02
1,586 Hemisphere Media 12 - 716 IAC/InterActiveCorp 185 0.02
6,088 Henry Schein 288 0.03 3,169 IBERIABANK 113 0.01
6,084 Herbalife Nutrition 219 0.02 1,300 ICF International 65 0.01
3,045 Herc 75 0.01 1,722 Ichor 35 -
2,684 Heritage Commerce 16 - 951 ICU Medical 139 0.01
2,901 Heritage Financial 47 0.01 2,101 IDACORP 147 0.02
2,200 Heritage Insurance 22 - 3,137 IDEX 394 0.04
1,276 Heritage-Crystal Clean 18 - 2,816 IDEXX Laboratories 752 0.07
4,884 Herman Miller 104 0.01 2,281 IDT 12 -
3,347 Heron Therapeutics 39 - 1,006 IES 19 -
2,181 Hersha Hospitality Trust 10 - 6,133 Illinois Tool Works 851 0.08
Dimensional Fund Advisors Ltd. Interim Report and Financial Statements, 30 June 2020 109

International Core Equity Fund
Portfolio Statement (continued)as at 30 June 2020
Holding Investment
Fair
Value
£'000
Percentage
of total
net assets
% Holding Investment
Fair
Value
£'000
Percentage
of total
net assets
%
United States (continued) United States (continued)
1,996 Illumina 589 0.06 5,423 IQVIA 607 0.06
1,423 Immersion 7 - 500 iRadimed 9 -
1,253 Impinj 27 - 9,773 Iridium Communications 197 0.02
1,901 Incyte 159 0.02 1,066 iRobot 73 0.01
1,005 Independence 24 - 11,268 Iron Mountain 236 0.02
340 Independence Contract Drilling 1 - 6,784 Ironwood Pharmaceuticals 56 0.01
3,298 Independence Realty Trust 31 - 2,300 Iteris 9 -
2,879 Independent Bank 91 0.01 2,176 Itron 114 0.01
1,626 Independent Bank/Massachusetts 85 0.01 6,489 ITT 308 0.03
1,620 Independent Bank/Michigan 19 - 5,900 IVERIC bio 26 -
3,735 Industrial Logistics Properties Trust 62 0.01 1,073 J & J Snack Foods 109 0.01
11,535 Infinera 55 0.01 840 J Alexander's 3 -
4,000 Information Services (USD) 7 0 2,919 J M Smucker 250 0.03
16,714 Ingersoll Rand 382 0 3,836 J2 Global 217 0.02
2,280 Ingevity 96 0.01 12,748 Jabil 335 0.03
902 Ingles Markets 31 - 3,210 Jack Henry & Associates 473 0.05
4,961 Ingredion 328 0.03 1,175 Jack in the Box 70 0.01
6,600 InnerWorkings 7 - 5,087 Jacobs Engineering 352 0.04
1,757 Innospec 108 0.01 2,192 James River 80 0.01
8,137 Innoviva 94 0.01 10,513 Janus Henderson 180 0.02
1,200 Inogen 34 - 6,224 JB Hunt Transport Services 608 0.06
3,812 Inovalon 57 0.01 5,503 JBG SMITH Properties 133 0.01
4,176 Inovio Pharmaceuticals 108 0.01 19,218 Jefferies Financial 236 0.02
1,195 Inphi 108 0.01 7,228 JELD-WEN 93 0.01
2,850 Insight Enterprises 113 0.01 21,633 JetBlue Airways 194 0.02
2,198 Insperity 113 0.01 700 John B Sanfilippo & Son 48 0.01
1,627 Installed Building Products 89 0.01 2,286 John Bean Technologies 154 0.02
1,000 Insteel Industries 15 - 3,883 John Wiley & Sons 125 0.01
2,224 Insulet 339 0.03 52,559 Johnson & Johnson 5,961 0.58
2,326 Integer 134 0.01 17,327 Johnson Controls International 477 0.05
3,254 Integra LifeSciences 123 0.01 643 Johnson Outdoors 46 0.01
139,121 Intel 6,602 0.65 178 Joint 2 -
2,326 Intellia Therapeutics 39 - 2,804 Jones Lang LaSalle 231 0.02
1,501 Inter Parfums 58 0.01 1,949 Jounce Therapeutics 12 -
5,202 Interactive Brokers 175 0.02 67,900 JPMorgan Chase 5,138 0.50
7,005 Intercontinental Exchange 516 0.05 13,585 Juniper Networks 249 0.03
2,314 InterDigital 108 0.01 2,713 K12 59 0.01
4,214 Interface 28 - 860 Kadant 68 0.01
4,137 International Bancshares 105 0.01 737 Kaiser Aluminum 44 0.01
21,761 International Business Machines 2,122 0.21 2,092 Kala Pharmaceuticals 17 -
421 International Flavors & Fragrances 1,257 KalVista Pharmaceuticals 13 -
(ILS) 42 0.01 3,612 Kansas City Southern 434 0.04
2,479 International Flavors & Fragrances 8,312 KAR Auction Services 96 0.01
(USD) 246 0.03 1,917 Karyopharm Therapeutics 28 -
15,327 International Game Technology 110 0.01 6,111 KB Home 149 0.02
21,535 International Paper 613 0.06 10,575 KBR 197 0.02
2,176 International Seaways 31 - 4,488 Kearny Financial 29 -
22,070 Interpublic 305 0.03 13,244 Kellogg 702 0.07
851 Intevac 4 - 1,400 Kelly Services 18 -
1,443 INTL. FCStone 63 0.01 4,671 Kemper 270 0.03
2,059 Intra-Cellular Therapies 42 0.01 6,158 Kennametal 142 0.01
8,725 Intrepid Potash 7 - 8,254 Kennedy-Wilson 100 0.01
597 IntriCon 6 - 7,508 Keurig Dr Pepper 173 0.02
4,929 Intuit 1,156 0.11 37,514 KeyCorp 362 0.04
482 Intuitive Surgical 217 0.02 4,115 Keysight Technologies 329 0.03
2,633 Invacare 14 - 1,800 Kforce 42 0.01
28,182 Invesco 238 0.02 4,172 Kilroy Realty 199 0.02
1,400 Invesque 3 - 984 Kimball Electronics 10 -
900 Investar 11 - 2,613 Kimball International 25 -
17,131 Investors Bancorp 115 0.01 7,602 Kimberly-Clark 864 0.09
591 Investors Real Estate Trust 33 - 17,173 Kimco Realty 177 0.02
119 Investors Title 11 - 50,415 Kinder Morgan 602 0.06
18,721 Invitation Homes 413 0.04 1,585 Kindred Biosciences 5 -
465 ION Geophysical 1 - 781 Kingstone 3 -
3,622 Ionis Pharmaceuticals 175 0.02 1,000 Kiniksa Pharmaceuticals 21 -
2,539 IPG Photonics 325 0.03 748 Kinsale Capital 92 0.01
Dimensional Fund Advisors Ltd. Interim Report and Financial Statements, 30 June 2020 110

International Core Equity Fund
Portfolio Statement (continued)as at 30 June 2020
Holding Investment
Fair
Value
£'000
Percentage
of total
net assets
% Holding Investment
Fair
Value
£'000
Percentage
of total
net assets
%
United States (continued) United States (continued)
3,965 Kirby 172 0.02 8,725 Liberty Media Corp-Liberty Formula
3,366 Kite Realty Group Trust 32 - One 'C' 228 0.02
10,591 KKR 260 0.03 3,517 Liberty Media Corp-Liberty SiriusXM
7,539 KLA 1,176 0.12 'A' 96 0.01
8,172 Knight-Swift Transportation 277 0.03 5,638 Liberty Media Corp-Liberty SiriusXM
4,439 Knoll 46 0.01 'C' 153 0.01
7,012 Knowles 86 0.01 4,327 Liberty Oilfield Services 19 -
14,227 Kohl's 239 0.02 2,476 Liberty TripAdvisor 4 -
1,936 Kontoor Brands 28 - 1,920 Life Storage 145 0.01
951 Koppers 14 - 1,850 Lifetime Brands 10 -
4,271 Korn Ferry 107 0.01 1,425 Lifevantage 15 -
29,074 Kosmos Energy 39 - 900 Ligand Pharmaceuticals 83 0.01
17,945 Kraft Heinz 462 0.05 6,102 Limelight Networks 37 -
1,260 Kraton 18 - 1,194 Limoneira 13 -
5,571 Kratos Defense & Security Solutions 70 0.01 3,451 Lincoln Electric 233 0.02
36,292 Kroger 1,009 0.10 8,667 Lincoln National 252 0.03
4,500 Kronos Worldwide 37 - 1,916 Lindblad Expeditions 12 -
1,007 Krystal Biotech 34 - 8,108 Linde 1,395 0.14
2,128 Kura Oncology 29 - 559 Lindsay 41 0.01
1,329 KVH Industries 10 - 7,203 Lions Gate Entertainment 'A' 43 0.01
600 L B Foster 6 - 9,278 Lions Gate Entertainment 'B' 51 0.01
11,892 L Brands 146 0.02 1,741 Liquidity Services 9 -
4,984 L3Harris Technologies 709 0.07 1,617 Lithia Motors 201 0.02
3,116 Laboratory Corp of America 411 0.04 1,096 Littelfuse 150 0.02
3,722 Lakeland Bancorp 34 - 3,272 LivaNova 125 0.01
1,650 Lakeland Financial 61 0.01 5,095 Live Nation Entertainment 183 0.02
6,983 Lam Research 1,752 0.17 2,733 Live Oak Bancshares 31 -
3,372 Lamar Advertising 183 0.02 9,521 Livent 46 -
6,610 Lamb Weston 341 0.03 4,449 LiveRamp 153 0.01
1,460 Lancaster Colony 180 0.02 19,328 LKQ 406 0.04
1,200 Landec 10 - 12,571 Loews 345 0.03
2,089 Lands' End 14 - 2,928 LogMeIn 203 0.02
2,254 Landstar System 203 0.02 605 Loral Space & Communications 10 -
2,622 Lannett 15 - 8,180 Louisiana-Pacific 167 0.02
2,731 Lantheus 31 - 16,084 Lowe's 1,748 0.17
897 Laredo Petroleum 10 - 6,868 LPL Financial 427 0.04
17,223 Las Vegas Sands 625 0.06 784 LSB Industries 1 -
5,646 Lattice Semiconductor 125 0.01 2,119 LSI Industries 11 -
8,008 Laureate Education 65 0.01 1,824 LTC Properties 55 0.01
400 Lawson Products 10 - 706 Luby's 1 -
8,744 Lazard 198 0.02 712 Lumber Liquidators 8 -
3,300 La-Z-Boy 72 0.01 3,531 Lumentum 225 0.02
1,998 LCI Industries 185 0.02 3,061 Luminex 75 0.01
1,265 LCNB 17 - 6 Lumos Pharma - -
4,487 Lear 394 0.04 3,892 Luther Burbank 31 -
6,026 Legg Mason 244 0.02 700 Lydall 7 -
10,204 Leggett & Platt 287 0.03 19,145 LyondellBasell Industries 1,011 0.10
5,539 Leidos 416 0.04 2,994 M&T Bank 249 0.02
1,522 LeMaitre Vascular 32 - 1,193 M/I Homes 33 -
5,268 LendingClub 20 - 2,311 Macatawa Bank 14 -
455 LendingTree 101 0.01 5,415 Macerich 39 -
5,770 Lennar 'A' 287 0.03 3,849 Mack-Cali Realty 48 -
661 Lennar 'B' 24 - 1,000 Mackinac Financial 8 -
1,482 Lennox International 278 0.03 3,560 MACOM Technology Solutions 95 0.01
563 Level One Bancorp 7 - 5,771 Macquarie Infrastructure 143 0.01
10,646 Lexington Realty Trust 90 0.01 1,689 MacroGenics 39 -
1,642 LGI Homes 115 0.01 26,406 Macy's 142 0.01
1,535 LHC 215 0.02 1,068 Madison Square Garden Entertainment 65 0.01
748 Liberty Broadband 'A' 75 0.01 752 Madrigal Pharmaceuticals 63 0.01
3,741 Liberty Broadband 'C' 381 0.04 1,400 Magellan Health 80 0.01
3,223 Liberty Latin America 'A' 25 - 1,850 Magenta Therapeutics 11 -
8,354 Liberty Latin America 'C' 63 0.01 1,000 MagnaChip Semiconductor 8 -
822 Liberty Media Corp-Liberty Braves 'A' 13 - 2,871 Maiden 3 -
2,181 Liberty Media Corp-Liberty Braves 'C' 33 - 1,518 Malibu Boats 62 0.01
1,574 Liberty Media Corp-Liberty Formula 3,633 Mallinckrodt 8 -
One 'A' 38 - 616 Malvern Bancorp 6 -
Dimensional Fund Advisors Ltd. Interim Report and Financial Statements, 30 June 2020 111

International Core Equity Fund
Portfolio Statement (continued)as at 30 June 2020
Holding Investment
Fair
Value
£'000
Percentage
of total
net assets
% Holding Investment
Fair
Value
£'000
Percentage
of total
net assets
%
United States (continued) United States (continued)
3,667 Manhattan Associates 281 0.03 4,027 Merit Medical Systems 144 0.01
1,139 Manitex International 5 - 1,997 Meritage Homes 120 0.01
1,521 Manitowoc 14 - 7,400 Meritor 120 0.01
4,445 ManpowerGroup 250 0.02 621 Mesa Air 2 -
1,750 ManTech International 97 0.01 2,544 Meta Financial 37 -
44,668 Marathon Oil 217 0.02 2,612 Methode Electronics 67 0.01
14,666 Marathon Petroleum 422 0.04 21,573 MetLife 624 0.06
800 Marchex 1 - 300 Metropolitan Bank 7 -
1,400 Marcus 15 - 800 Mettler-Toledo International 511 0.05
2,619 Marcus & Millichap 59 0.01 1,432 MGE Energy 74 0.01
1,555 Marine Products 17 - 26,021 MGIC Investment 169 0.02
1,100 MarineMax 20 - 3,308 MGM Growth Properties 72 0.01
4,700 Marinus Pharmaceuticals 10 - 11,294 MGM Resorts International 154 0.02
532 Markel 392 0.04 1,064 MGP Ingredients 32 -
1,206 MarketAxess 489 0.05 6,327 Michaels 36 -
148 Marlin Business Services 1 - 6,895 Microchip Technology 575 0.06
66,220 Marriott International* - - 29,385 Micron Technology 1,174 0.12
9,310 Marriott International 'A' 655 0.06 152,190 Microsoft 24,577 2.41
2,246 Marriott Vacations Worldwide 148 0.01 498 MicroStrategy 48 -
11,153 Marsh & McLennan 957 0.09 776 Mid Penn Bancorp 11 -
4,286 Marten Transport 87 0.01 4,153 Mid-America Apartment Communities 377 0.04
3,461 Martin Marietta Materials 582 0.06 4,536 Middleby 296 0.03
17,481 Marvell Technology 477 0.05 604 Middlefield Banc 10 -
11,155 Masco 444 0.04 845 Middlesex Water 45 -
1,720 Masimo 308 0.03 1,043 Midland States Bancorp 12 -
1,989 Masonite International 128 0.01 849 MidWestOne Financial 14 -
6,268 MasTec 227 0.02 1,774 Mimecast 59 0.01
813 Mastech Digital 15 - 2,398 Minerals Technologies 90 0.01
17,716 Mastercard 4,229 0.41 1,200 Minerva Neurosciences 3 -
2,827 MasterCraft Boat 44 - 1,746 Mistras 5 -
7,110 Matador Resources 48 - 1,771 Mitek Systems 13 -
1,880 Match 162 0.02 3,533 MKS Instruments 317 0.03
1,395 Materion 69 0.01 500 MMA Capital 9 -
2,040 Matrix Service 17 - 3,320 Mobile Mini 85 0.01
3,512 Matson 84 0.01 2,682 Modine Manufacturing 12 -
11,441 Mattel 89 0.01 3,570 Moelis 90 0.01
2,497 Matthews International 39 - 2,906 Mohawk Industries 236 0.02
1,064 Maxar Technologies (USD) 16 - 2,159 Molecular Templates 25 -
1,686 Maxar Technologies (CAD) 25 - 5,113 Molina Healthcare 715 0.07
8,292 Maxim Integrated Products 402 0.04 8,804 Molson Coors Beverage 254 0.02
3,215 MAXIMUS 186 0.02 2,745 Momenta Pharmaceuticals 80 0.01
3,202 MaxLinear 55 0.01 700 Monarch Casino & Resort 19 -
8,914 MBIA 52 0.01 15,410 Mondelez International 635 0.06
266 McCormick 38 - 780 MongoDB 140 0.01
2,660 McCormick (Non-Voting) 389 0.04 4,731 Monmouth Real Estate Investment 55 0.01
12,252 McDonald's 1,824 0.18 1,160 Monolithic Power Systems 217 0.02
2,279 McGrath RentCorp 99 0.01 2,057 Monro 92 0.01
6,279 McKesson 776 0.08 9,871 Monster Beverage 555 0.05
2,816 MDC 80 0.01 702 Montage Resources 2 -
14,177 MDU Resources 255 0.02 6,086 Moody's 1,332 0.13
748 MedCath Corporation* - - 2,347 Moog 101 0.01
2,417 Media General CVR* - - 19,268 Morgan Stanley 740 0.07
14,675 Medical Properties Trust 220 0.02 1,532 Morningstar 175 0.02
700 Medifast 78 0.01 22,126 Mosaic 228 0.02
5,215 MEDNAX 70 0.01 1,113 Motorcar Parts of America 15 -
1,926 Medpace 141 0.01 4,602 Motorola Solutions 518 0.05
2,684 Meet 14 - 700 Movado 6 -
7,143 MEI Pharma 24 - 6,931 Mr Cooper 69 0.01
1,114 Mercantile Bank 20 - 5,425 MRC Global 27 -
921 Merchants Bancorp 13 - 1,753 MSA Safety 160 0.02
67,153 Merck (USD) 4,165 0.41 2,849 MSC Industrial Direct 165 0.02
4,198 Mercury General 136 0.01 2,568 MSCI 681 0.07
2,613 Mercury Systems 166 0.02 2,373 MSG Networks 20 -
3,246 Meredith 39 - 762 MTS Systems 11 -
3,713 Meridian Bancorp 34 - 4,311 Mueller Industries 91 0.01
2,340 Meridian Bioscience 41 - 10,815 Mueller Water Products 81 0.01
Dimensional Fund Advisors Ltd. Interim Report and Financial Statements, 30 June 2020 112

International Core Equity Fund
Portfolio Statement (continued)as at 30 June 2020
Holding Investment
Fair
Value
£'000
Percentage
of total
net assets
% Holding Investment
Fair
Value
£'000
Percentage
of total
net assets
%
United States (continued) United States (continued)
11,150 Murphy Oil 119 0.01 4,418 NextGen Healthcare 39 -
2,594 Murphy USA 232 0.02 11,105 NexTier Oilfield Solutions 21 -
726 MVB Financial 8 - 1,019 NI 12 -
2,813 Myers Industries 33 - 3,275 NIC 61 0.01
23,476 Mylan 305 0.03 702 Nicolet Bankshares 31 -
1,575 MyoKardia 124 0.01 29,833 Nielsen 356 0.03
700 MYR 18 - 25,044 NIKE 1,956 0.19
6,007 Myriad Genetics 54 0.01 11,338 NiSource 209 0.02
473 Nabors Industries 14 - 1,174 NL Industries 3 -
300 NACCO Industries 6 - 5,245 NMI 67 0.01
700 Napco Security Technologies 13 - 3,516 NN 12 -
4,118 Nasdaq 394 0.04 13,100 Noble 4 -
219 Nathan's Famous 10 - 28,062 Noble Energy 197 0.02
2,200 National Bank 47 - 2,100 Noodles 10 -
508 National Bankshares 12 - 2,717 Nordson 409 0.04
1,263 National Beverage 63 0.01 12,022 Nordstrom 154 0.02
2,712 National CineMedia 7 - 7,391 Norfolk Southern 1,039 0.10
3,865 National Fuel Gas 128 0.01 445 Northeast Bank 6 -
8,470 National General 145 0.01 15,328 Northern Oil and Gas 10 -
2,035 National Health Investors 100 0.01 7,552 Northern Trust 468 0.05
964 National HealthCare 49 - 3,516 Northfield Bancorp 32 -
6,904 National Instruments 213 0.02 8,456 Northwest Bancshares 69 0.01
18,943 National Oilwell Varco 187 0.02 1,193 Northwest Natural 53 0.01
900 National Research 41 - 375 Northwest Pipe 7 -
6,278 National Retail Properties 183 0.02 2,055 NorthWestern 91 0.01
3,007 National Storage Affiliates Trust 70 0.01 26,264 NortonLifeLock 416 0.04
3,501 National Vision 86 0.01 9,919 Norwegian Cruise Line 133 0.01
199 National Western Life 31 - 468 Norwood Financial 9 -
625 Natural Gas Services 3 - 1,502 Novanta 127 0.01
1,300 Natural Grocers by Vitamin Cottage 16 - 1,097 Novocure 52 0.01
900 Nature's Sunshine Products 7 - 8,270 NOW 58 0.01
2,496 Natus Medical 44 - 20,491 NRG Energy 550 0.05
2,298 Nautilus 17 - 4,456 Nu Skin Enterprises 141 0.01
16,305 Navient 96 0.01 13,342 Nuance Communications 275 0.03
3,826 Navistar International 87 0.01 15,189 Nucor 505 0.05
2,826 NBT Bancorp 70 0.01 2,711 NuVasive 120 0.01
9,026 NCR 132 0.01 484 NV5 Global 20 -
1,464 NCS Multistage 1 - 170 NVE 8 -
1,652 Neenah 66 0.01 11,397 nVent Electric 171 0.02
11,357 Nektar Therapeutics 207 0.02 4,127 NVIDIA 1,236 0.12
1,800 Nelnet 68 0.01 185 NVR 479 0.05
2,352 Neogen 144 0.01 32,430 Occidental Petroleum 471 0.05
3,425 NeoGenomics 81 0.01 4,334 Oceaneering International 21 -
2,000 NeoPhotonics 14 - 4,243 OceanFirst Financial 59 0.01
9,576 NetApp 343 0.03 3,653 Ocwen Financial 2 -
2,791 Netflix 1,015 0.10 35,184 Office Depot 64 0.01
2,393 NETGEAR 48 - 1,880 Office Properties Income Trust 40 -
5,209 NetScout Systems 108 0.01 2,787 OFG Bancorp 29 -
1,220 Neurocrine Biosciences 125 0.01 7,993 OGE Energy 198 0.02
6,179 New Jersey Resources 162 0.02 566 Ohio Valley Banc 10 -
1,028 New Relic 56 0.01 13,308 O-I Glass 94 0.01
3,500 New Senior Investment 10 - 2,087 Oil States International 8 -
28,192 New York Community Bancorp 230 0.02 419 Oil-Dri Corp of America 12 -
6,488 New York Times 223 0.02 728 Okta 118 0.01
22,161 Newell Brands 281 0.03 6,118 Old Dominion Freight Line 820 0.08
11,355 Newmark 43 - 10,818 Old National Bancorp 119 0.01
641 NewMarket 207 0.02 20,531 Old Republic International 268 0.03
22,612 Newmont 1,096 0.11 1,842 Old Second Bancorp 11 -
3,806 Newpark Resources 7 - 12,938 Olin 119 0.01
16,228 News 'A' 154 0.02 2,960 Ollie's Bargain Outlet 239 0.02
10,595 News 'B' 101 0.01 743 Olympic Steel 7 -
1,402 NewStar Financial* - - 317 Omega Flex 27 -
2,900 Nexa Resources 15 - 8,661 Omega Healthcare Investors 211 0.02
950 NexPoint Residential Trust 27 - 2,032 Omnicell 114 0.01
3,779 Nexstar Media 257 0.03 11,651 Omnicom 515 0.05
6,208 NextEra Energy 1,206 0.12 5,031 On Deck Capital 3 -
Dimensional Fund Advisors Ltd. Interim Report and Financial Statements, 30 June 2020 113

International Core Equity Fund
Portfolio Statement (continued)as at 30 June 2020
Holding Investment
Fair
Value
£'000
Percentage
of total
net assets
% Holding Investment
Fair
Value
£'000
Percentage
of total
net assets
%
United States (continued) United States (continued)
25,596 ON Semiconductor 406 0.04 1,372 PDF Solutions 21 -
2,108 ONE Gas 129 0.01 11,000 PDL BioPharma 26 -
800 One Liberty Properties 12 - 5,841 Peabody Energy 14 -
10,192 OneMain 200 0.02 1,155 Peapack-Gladstone Financial 17 -
12,145 ONEOK 314 0.03 5,826 Pebblebrook Hotel Trust 66 0.01
1,716 OneSpan 38 - 1,524 Pegasystems 121 0.01
2,111 Onto Innovation 58 0.01 6,104 Penn National Gaming 147 0.01
37,080 OPKO Health 89 0.01 574 Penn Virginia 4 -
429 Oppenheimer 7 - 1,425 Pennant 26 -
64,800 Oracle 2,892 0.28 300 Penns Woods Bancorp 5 -
3,386 OraSure Technologies 30 - 2,453 Pennsylvania Real Estate Investment
3,395 ORBCOMM 10 - Trust 3 -
2,460 O'Reilly Automotive 846 0.08 6,415 PennyMac Financial Services 213 0.02
1,070 Origin Bancorp 18 - 5,876 Penske Automotive 184 0.02
820 Orion 2 - 8,968 Pentair 273 0.03
2,400 Orion Energy Systems 6 - 825 Penumbra 116 0.01
344 Ormat Technologies (ILS) 18 - 740 Peoples Bancorp 13 -
3,386 Ormat Technologies (USD) 174 0.02 400 Peoples Bancorp of North Carolina 6 -
700 Orrstown Financial Services 8 - 506 Peoples Financial Services 15 -
1,417 Orthofix Medical 36 - 25,792 People's United Financial 237 0.02
491 OrthoPediatrics 17 - 1,593 People's Utah Bancorp 28 -
6,122 Oshkosh 356 0.03 33,909 PepsiCo 3,620 0.35
1,225 OSI Systems 74 0.01 5,704 Perdoceo Education 73 0.01
8,299 Otis Worldwide 383 0.04 1,600 Perficient 46 -
1,706 Otter Tail 54 0.01 6,452 Performance Food 153 0.01
5,307 Outfront Media 63 0.01 3,561 PerkinElmer 277 0.03
2,400 Overseas Shipholding 4 - 12,298 Perspecta 229 0.02
17,707 Ovintiv (CAD) 134 0.01 700 PetIQ 19 -
4,890 Ovintiv (USD) 37 - 700 PetMed Express 19 -
6,164 Owens & Minor 38 - 2,300 Pfenex 16 -
8,197 Owens Corning 368 0.04 128,209 Pfizer 3,409 0.33
1,400 Oxford Immunotec Global 15 - 13,052 PG&E 96 0.01
1,290 Oxford Industries 45 - 4,188 PGT Innovations 53 0.01
1,716 P H Glatfelter 22 - 1,704 Phibro Animal Health 36 -
16,629 PACCAR 996 0.10 25,391 Philip Morris International 1,460 0.14
1,165 Pacific Mercantile Bancorp 3 - 12,941 Phillips 66 723 0.07
6,274 Pacific Premier Bancorp 107 0.01 2,100 Photronics 18 -
2,092 Pacira BioSciences 89 0.01 8,340 Physicians Realty Trust 119 0.01
5,659 Packaging Corp of America 452 0.04 900 PICO 6 -
8,131 PacWest Bancorp 125 0.01 5,436 Piedmont Office Realty Trust 73 0.01
469 Palo Alto Networks 87 0.01 9,867 Pilgrim's Pride 131 0.01
300 PAM Transportation Services 8 - 4,985 Pinnacle Financial Partners 166 0.02
800 Panhandle Oil and Gas 2 - 4,395 Pinnacle West Capital 261 0.03
1,152 Papa John's International 73 0.01 7,657 Pioneer Natural Resources 589 0.06
3,095 Par Pacific 22 - 1,300 Piper Sandler 61 0.01
9,322 Paramount 59 0.01 12,182 Pitney Bowes 25 -
1,300 Park Aerospace 12 - 809 PJT Partners 33 -
9,688 Park Hotels & Resorts 80 0.01 3,346 Planet Fitness 162 0.02
1,184 Park National 67 0.01 1,500 Plantronics 18 -
806 Parke Bancorp 9 - 5,201 Playa Hotels & Resorts 15 -
4,515 Parker-Hannifin 660 0.06 700 PlayAGS 2 -
526 Park-Ohio 7 - 2,113 Plexus 119 0.01
21,312 Parsley Energy 184 0.02 9,984 PNC Financial Services 836 0.08
1,788 Patrick Industries 85 0.01 3,454 PNM Resources 108 0.01
33 Patriot Transportation - - 5,144 Polaris 386 0.04
7,080 Patterson 130 0.01 4,538 PolyOne 96 0.01
12,023 Patterson-UTI Energy 34 - 804 Ponce de Leon Federal Bank 7 -
15,725 Paychex 944 0.09 2,136 Pool 462 0.05
2,557 Paycom Software 625 0.06 5,715 Popular 172 0.02
1,720 Paylocity 195 0.02 3,837 Portland General Electric 130 0.01
11,617 PayPal 1,592 0.16 5,011 Post 358 0.04
7,651 PBF Energy 60 0.01 476 Potbelly 1 -
1,900 PC Connection 73 0.01 1,300 Powell Industries 29 -
607 PCSB Financial 6 - 2,193 Power Integrations 207 0.02
2,800 PCTEL 16 - 10,056 PPG Industries 851 0.08
4,900 PDC Energy 48 - 18,873 PPL 396 0.04
Dimensional Fund Advisors Ltd. Interim Report and Financial Statements, 30 June 2020 114

International Core Equity Fund
Portfolio Statement (continued)as at 30 June 2020
Holding Investment
Fair
Value
£'000
Percentage
of total
net assets
% Holding Investment
Fair
Value
£'000
Percentage
of total
net assets
%
United States (continued) United States (continued)
3,768 PQ 40 - 8,228 Raymond James Financial 458 0.04
3,033 PRA 93 0.01 2,332 Rayonier Advanced Materials 5 -
4,561 PRA Health Sciences 349 0.03 22,657 Raytheon Technologies 1,141 0.11
776 Preferred Apartment Communities 5 - 308 RBB Bancorp 3 -
1,163 Preferred Bank 39 - 1,192 RBC Bearings 127 0.01
319 Preformed Line Products 13 - 712 Reading International 3 -
4,425 Premier 121 0.01 1,777 Real Estate Maximums 44 -
2,107 Premier Financial 30 - 1,242 RealNetworks 1 -
554 Premier Financial Bancorp 6 - 6,037 Realogy 35 -
3,593 Prestige Consumer Healthcare 107 0.01 3,302 RealPage 173 0.02
1,773 PRGX Global 7 - 9,194 Realty Income 447 0.04
2,306 PriceSmart 113 0.01 805 Reata Pharmaceuticals 101 0.01
3,411 Primerica 317 0.03 442 Red Lion Hotels 1 -
8,332 Primo Water 90 0.01 500 Red Robin Gourmet Burgers 4 -
3,816 Primoris Services 54 0.01 4,173 Red Rock Resorts 36 -
13,253 Principal Financial 435 0.04 2,879 Redfin 92 0.01
4,014 ProAssurance 46 - 2,817 Regal Beloit 197 0.02
49,231 Procter & Gamble 4,721 0.46 6,583 Regency Centers 245 0.02
2,227 Progress Software 71 0.01 1,374 Regeneron Pharmaceuticals 683 0.07
21,574 Progressive 1,379 0.14 1,746 REGENXBIO 52 0.01
13,565 Prologis 1,006 0.10 372 Regional Management 5 -
1,453 Proofpoint 128 0.01 39,079 Regions Financial 345 0.03
5,978 ProPetro 24 - 3,200 Regis 22 -
6,601 Prosperity Bancshares 310 0.03 2,812 Reinsurance Group of America 174 0.02
934 Protagonist Therapeutics 13 - 4,742 Reliance Steel & Aluminum 359 0.04
500 Protective Insurance 6 - 43,588 Reliance Worldwide 72 0.01
1,127 Proto Labs 105 0.01 2,090 RenaissanceRe 285 0.03
980 Providence Service 63 0.01 3,792 Renasant 74 0.01
1,161 Provident Bancorp 7 - 3,344 Renewable Energy 66 0.01
600 Provident Financial 6 - 4,053 Rent-A-Center 90 0.01
3,200 Provident Financial Services 37 - 1,556 Repligen 151 0.01
804 Prudential Bancorp 8 - 1,029 Republic Bancorp 27 -
9,429 Prudential Financial 454 0.04 2,529 Republic First Bancorp 5 -
1,094 PS Business Parks 116 0.01 8,234 Republic Services 544 0.05
2,103 PTC 131 0.01 5,942 Resideo Technologies 55 0.01
2,017 PTC Therapeutics 83 0.01 3,473 ResMed 533 0.05
10,746 Public Service Enterprise 431 0.04 1,526 Resources Connection 14 -
4,436 Public Storage 690 0.07 4,789 Retail Opportunity Investments 45 -
16,821 PulteGroup 459 0.04 9,733 Retail Properties of America 58 0.01
1,134 Pure Cycle 8 - 676 Retail Value 7 -
9,714 Pure Storage 136 0.01 2,814 Retrophin 45 -
4,452 PVH 176 0.02 2,642 REV 13 -
509 QAD 17 - 1,534 Revance Therapeutics 32 -
814 QCR 20 - 5,228 Rexford Industrial Realty 175 0.02
11,896 QEP Resources 12 - 7,401 Rexnord 174 0.02
3,432 Qorvo 300 0.03 409 RGC Resources 8 -
2,695 QTS Realty Trust 138 0.01 918 RH 189 0.02
3,224 Quad Graphics 9 - 1,357 Rhythm Pharmaceuticals 24 -
25,860 QUALCOMM 1,875 0.18 8,253 Ribbon Communications 26 -
1,493 Qualys 123 0.01 500 Richardson Electronics 2 -
1,291 Quanex Building Products 14 - 3,800 Rigel Pharmaceuticals 6 -
8,520 Quanta Services 271 0.03 2,107 Ring Energy 2 -
5,085 Quest Diagnostics 457 0.04 489 RingCentral 108 0.01
1,673 Quidel 286 0.03 1,292 Rite Aid 18 -
3,046 QuinStreet 25 - 1,248 Riverview Bancorp 5 -
3,000 Quotient Technology 18 - 2,477 RLI 164 0.02
27,913 Qurate Retail 211 0.02 7,060 RLJ Lodging Trust 54 0.01
4,343 R1 RCM 38 - 682 RMR 17 -
14,945 Radian 186 0.02 9,762 Robert Half International 412 0.04
4,456 Radiant Logistics 14 - 2,454 Rocket Pharmaceuticals 42 -
3,901 RadNet 48 - 4,191 Rockwell Automation 712 0.07
700 Rafael 8 - 1,200 Rogers 118 0.01
2,372 Ralph Lauren 140 0.01 901 Roku 84 0.01
8,424 Rambus 100 0.01 8,460 Rollins 287 0.03
16,452 Range Resources 74 0.01 2,029 Roper Technologies 637 0.06
1,700 Raven Industries 29 - 16,038 Ross Stores 1,113 0.11
Dimensional Fund Advisors Ltd. Interim Report and Financial Statements, 30 June 2020 115

International Core Equity Fund
Portfolio Statement (continued)as at 30 June 2020
Holding Investment
Fair
Value
£'000
Percentage
of total
net assets
% Holding Investment
Fair
Value
£'000
Percentage
of total
net assets
%
United States (continued) United States (continued)
7,197 Royal Caribbean Cruises 293 0.03 1,599 Seritage Growth Properties 15 -
2,038 Royal Gold 200 0.02 10,742 Service Corp International 336 0.03
9,770 RPC 24 - 6,171 Service Properties Trust 37 -
4,821 RPM International 290 0.03 8,721 ServiceMaster Global 255 0.02
3,000 RPT Realty 17 - 818 ServiceNow 263 0.03
4,226 RR Donnelley & Sons 4 - 3,984 ServisFirst Bancshares 112 0.01
4,099 RTI Surgical 9 - 1,430 Shake Shack 60 0.01
1,150 Rush Enterprises 38 - 3,640 Shenandoah Telecommunications 145 0.01
1,392 Ruth's Hospitality 9 - 2,428 Sherwin-Williams 1,118 0.11
5,096 Ryder System 152 0.01 450 Shockwave Medical 17 -
4,000 Ryerson 18 - 772 Shoe Carnival 18 -
2,602 Ryman Hospitality Properties 72 0.01 651 Shore Bancshares 6 -
5,064 S&P Global 1,324 0.13 358 ShotSpotter 7 -
2,716 S&T Bancorp 51 - 1,746 Shutterstock 49 -
8,973 Sabra Health Care REIT 105 0.01 1,500 Shyft 20 -
15,417 Sabre 99 0.01 800 Sierra Bancorp 12 -
731 Safeguard Scientifics 4 - 4,940 SIGA Technologies 24 -
1,000 Safety Insurance 62 0.01 3,023 Signature Bank 257 0.03
1,442 Sage Therapeutics 49 - 3,949 Signet Jewelers 34 -
2,129 Saia 189 0.02 8,921 Silgan 231 0.02
4,166 Sailpoint Technologies 89 0.01 1,917 Silicon Laboratories 151 0.01
10,720 salesforce.com 1,600 0.16 693 SilverBow Resources 2 -
6,135 Sally Beauty 62 0.01 7,714 Simmons First National 102 0.01
138,200 Samsonite International 113 0.01 5,335 Simon Property 295 0.03
1,548 Sanderson Farms 145 0.01 5,618 Simply Good Foods 86 0.01
3,383 Sandy Spring Bancorp 68 0.01 2,494 Simpson Manufacturing 168 0.02
5,753 Sangamo Therapeutics 41 - 12,522 Sims 56 0.01
2,407 Sanmina 49 - 824 Simulations Plus 39 -
18,688 Santander Consumer USA 287 0.03 59,476 Sirius XM 276 0.03
1,558 Sarepta Therapeutics 206 0.02 7,149 SITE Centers 47 -
782 Saul Centers 20 - 1,802 SiteOne Landscape Supply 160 0.02
171 SB Financial 2 - 3,133 Six Flags Entertainment 49 -
634 SB One Bancorp 10 - 1,269 SJW 62 0.01
3,285 SBA Communications 773 0.08 9,793 Skechers USA 246 0.02
1,200 ScanSource 23 - 4,111 Skyline Champion 81 0.01
52,348 Schlumberger 767 0.08 2,100 SkyWest 56 0.01
7,232 Schneider National 142 0.01 6,758 Skyworks Solutions 692 0.07
800 Schnitzer Steel Industries 11 - 3,424 SL Green Realty 139 0.01
1,412 Scholastic 34 - 1,400 Sleep Number 49 -
2,492 Schweitzer-Mauduit International 66 0.01 40,291 SLM 228 0.02
3,072 Science Applications International 193 0.02 5,176 SM Energy 15 -
3,591 Scientific Games 44 - 1,946 SMART Global 40 -
439 Scorpio Bulkers 6 - 1,169 SmartFinancial 15 -
4,245 Scorpio Tankers 46 - 2,600 Smith & Wesson Brands 43 -
3,237 Scotts Miracle-Gro 343 0.03 9,303 Snap 175 0.02
42 Seaboard 101 0.01 3,082 Snap-on 341 0.03
1,100 SeaChange International 1 - 1,572 Solaris Oilfield Infrastructure 9 -
4,056 Seacoast Banking Corp of Florida 65 0.01 9,182 SolarWinds 136 0.01
842 SEACOR 19 - 1,900 Sonic Automotive 49 -
2,646 SEACOR Marine 6 - 7,931 Sonoco Products 335 0.03
12,310 Seagate Technology 478 0.05 3,740 Sonos 44 -
6,340 Sealed Air 168 0.02 3,807 South Jersey Industries 76 0.01
1,241 SeaSpine 10 - 4,776 South State 182 0.02
1,665 Seattle Genetics 223 0.02 16,875 Southern 709 0.07
4,237 SeaWorld Entertainment 51 - 4,985 Southern Copper 156 0.02
800 SecureWorks 7 - 504 Southern First Bancshares 11 -
6,301 SEI Investments 272 0.03 400 Southern Missouri Bancorp 8 -
1,028 Select Bancorp 7 - 1,982 Southern National Bancorp of Virginia 15 -
6,256 Select Energy Services 25 - 2,233 Southside Bancshares 50 -
7,563 Select Medical 88 0.01 21,538 Southwest Airlines 613 0.06
3,971 Selective Insurance 169 0.02 2,018 Southwest Gas 111 0.01
5,887 Sempra Energy 566 0.06 37,892 Southwestern Energy 78 0.01
2,915 Semtech 120 0.01 1,817 SP Plus 28 -
526 Seneca Foods 14 - 1,655 SpartanNash 28 -
10,071 Sensata Technologies 300 0.03 2,892 Spectrum Brands 108 0.01
2,763 Sensient Technologies 116 0.01 3,620 Spectrum Pharmaceuticals 9 -
Dimensional Fund Advisors Ltd. Interim Report and Financial Statements, 30 June 2020 116

International Core Equity Fund
Portfolio Statement (continued)as at 30 June 2020
Holding Investment
Fair
Value
£'000
Percentage
of total
net assets
% Holding Investment
Fair
Value
£'000
Percentage
of total
net assets
%
United States (continued) United States (continued)
916 Spero Therapeutics 10 - 1,559 Syndax Pharmaceuticals 18 -
2,160 Spire 113 0.01 6,092 Syneos Health 285 0.03
5,443 Spirit AeroSystems 116 0.01 952 Synlogic 2 -
4,972 Spirit Airlines 73 0.01 3,898 SYNNEX 374 0.04
406 Spirit of Texas Bancshares 4 - 2,126 Synopsys 329 0.03
4,478 Spirit Realty Capital 126 0.01 9,728 Synovus Financial 159 0.02
1,530 Splunk 242 0.02 849 Syros Pharmaceuticals 7 -
861 Spok 7 - 16,296 Sysco 722 0.07
6,616 Sportsman's Warehouse 73 0.01 3,031 Systemax 50 -
9,749 Sprouts Farmers Market 206 0.02 8,556 T Rowe Price 841 0.08
1,299 SPS Commerce 79 0.01 373 Tabula Rasa HealthCare 16 -
2,408 SPX 80 0.01 180 Tactile Systems Technology 6 -
3,091 SPX FLOW 91 0.01 2,435 Take-Two Interactive Software 273 0.03
2,365 Square 199 0.02 4,554 Talos Energy 33 -
7,071 SS&C Technologies 319 0.03 661 Tandem Diabetes Care 47 -
3,791 St Joe 60 0.01 3,635 Tanger Factory Outlet Centers 22 -
1,044 STAAR Surgical 52 0.01 19,600 Tapestry 213 0.02
6,508 STAG Industrial 154 0.02 11,506 Targa Resources 176 0.02
1,216 Stamps.com 175 0.02 24,778 Target 2,393 0.23
1,800 Standard Motor Products 60 0.01 2,283 Taubman Centers 72 0.01
1,100 Standex International 52 0.01 8,665 Taylor Morrison Home 135 0.01
5,184 Stanley Black & Decker 574 0.06 11,605 TCF Financial 269 0.03
21,340 Starbucks 1,277 0.13 14,607 TD Ameritrade 421 0.04
2,700 StarTek 11 - 1,401 Team 6 -
3,007 State Auto Financial 43 - 1,720 Tech Data 203 0.02
7,396 State Street 370 0.04 20,607 TechnipFMC 114 0.01
18,845 Steel Dynamics 395 0.04 1,190 TechTarget 29 -
6,373 Steelcase 63 0.01 1,300 Tecnoglass 6 -
1,766 Stepan 137 0.01 3,179 Teekay 6 -
6,382 Stericycle 287 0.03 2,465 Teekay Tankers 27 -
3,548 STERIS 433 0.04 17,500 TEGNA 159 0.02
12,839 Sterling Bancorp 119 0.01 1,738 Tejon Ranch 20 -
1,087 Sterling Bancorp/Michigan 3 - 2,233 Teladoc Health 340 0.03
1,653 Sterling Construction 14 - 1,530 Teledyne Technologies 380 0.04
4,921 Steven Madden 99 0.01 445 Teleflex 129 0.01
1,500 Stewart Information Services 40 - 3,200 Telenav 14 -
4,759 Stifel Financial 179 0.02 6,645 Telephone and Data Systems 107 0.01
1,685 Stock Yards Bancorp 55 0.01 3,355 Tempur Sealy International 197 0.02
2,115 Stoneridge 35 - 4,267 Tenet Healthcare 63 0.01
8,684 STORE Capital 169 0.02 1,010 Tennant 53 0.01
3,592 Stratasys 46 - 4,953 Teradata 84 0.01
1,366 Strategic Education 170 0.02 8,704 Teradyne 587 0.06
300 Strattec Security 4 - 6,371 Terex 97 0.01
400 Stratus Properties 6 - 13,263 TerraForm Power 196 0.02
2,400 Strongbridge Biopharma 8 - 3,002 Terreno Realty 128 0.01
4,145 Stryker 599 0.06 600 Territorial Bancorp 12 -
583 Summit Financial 8 - 781 Tesla 642 0.06
3,869 Summit Hotel Properties 19 - 160 TESSCO Technologies 1 -
8,515 Summit Materials 114 0.01 2,948 Tetra Tech 188 0.02
3,352 Sun Communities 367 0.04 5,106 TETRA Technologies 2 -
5,074 SunCoke Energy 12 - 70 Tetraphase Pharmaceuticals - -
434 Sundance Energy 1 - 3,218 Texas Capital Bancshares 76 0.01
7,785 Sunrun 123 0.01 22,148 Texas Instruments 2,249 0.22
9,586 Sunstone Hotel Investors 64 0.01 5,219 Texas Roadhouse 225 0.02
3,483 Super Micro Computer 80 0.01 3,298 Textainer 22 -
700 Superior Group of 8 - 8,513 TFS Financial 98 0.01
3,571 Supernus Pharmaceuticals 68 0.01 7,503 Thermo Fisher Scientific 2,144 0.21
3,199 Surgery Partners 29 - 1,997 Thermon 23 -
500 Surmodics 18 - 7,064 Third Point Reinsurance 43 -
3,219 SVB Financial 542 0.05 3,200 Thor Industries 278 0.03
2,761 Switch 40 - 500 Tidewater 2 -
1,812 Sykes Enterprises 40 - 5,099 Tiffany 500 0.05
818 Synalloy 5 - 1,334 Tilly's 6 -
1,836 Synaptics 88 0.01 700 Timberland Bancorp 10 -
2,900 Synchronoss Technologies 8 - 6,110 Timken 226 0.02
33,325 Synchrony Financial 595 0.06 1,745 TimkenSteel 6 -
Dimensional Fund Advisors Ltd. Interim Report and Financial Statements, 30 June 2020 117

International Core Equity Fund
Portfolio Statement (continued)as at 30 June 2020
Holding Investment
Fair
Value
£'000
Percentage
of total
net assets
% Holding Investment
Fair
Value
£'000
Percentage
of total
net assets
%
United States (continued) United States (continued)
1,900 Tiptree 9 - 3,284 UMB Financial 134 0.01
3,966 Titan International 5 - 1,094 UMH Properties 11 -
670 Titan Machinery 6 - 14,289 Umpqua 122 0.01
29,166 TJX 1,205 0.12 9,484 Under Armour 'A' 76 0.01
11,344 T-Mobile US 979 0.10 10,713 Under Armour 'C' 77 0.01
11,344 T-Mobile US Rights 27/07/2020 2 - 600 Unifi 6 -
9,010 Toll Brothers 230 0.02 1,032 UniFirst 148 0.01
966 Tompkins Financial 50 - 18,260 Union Pacific 2,462 0.24
1,744 Tootsie Roll Industries 48 - 3,400 Unisys 29 -
2,349 TopBuild 214 0.02 14,082 United Airlines 402 0.04
5,090 Toro 275 0.03 8,302 United Bankshares WV 183 0.02
5,095 Towne Bank 77 0.01 5,161 United Community Banks 82 0.01
1,200 Townsquare Media 4 - 1,900 United Fire 42 -
2,674 TPI Composites 51 - 2,999 United Insurance 19 -
6,805 Tractor Supply 729 0.07 3,438 United Natural Foods 52 0.01
772 Trade Desk 255 0.02 14,122 United Parcel Service 1,259 0.12
6,901 Trane Technologies 501 0.05 6,563 United Rentals 789 0.08
300 Transcat 6 - 1,000 United Security Bancshares 5 -
1,389 TransDigm 500 0.05 3,010 United States Cellular 75 0.01
39,772 Transocean 57 0.01 391 United States Lime & Minerals 27 -
4,338 TransUnion 298 0.03 9,674 United States Steel 57 0.01
500 TravelCenters of America 7 - 3,003 United Therapeutics 293 0.03
11,860 Travelers 1,090 0.11 26,196 UnitedHealth 6,182 0.61
500 Travelzoo 2 - 6,282 Uniti 46 -
960 Trecora Resources 5 - 855 Unitil 31 -
1,805 Tredegar 22 - 956 Unity Bancorp 11 -
4,206 TreeHouse Foods 145 0.01 12,545 Univar Solutions 169 0.02
2,590 Trex 270 0.03 865 Universal 30 -
6,826 TRI Pointe 79 0.01 811 Universal Display 97 0.01
1,913 Tribune Publishing 16 - 987 Universal Electronics 37 -
2,439 TriCo Bancshares 58 0.01 596 Universal Health Realty Income Trust 39 -
3,259 TriMas 63 0.01 4,671 Universal Health Services 351 0.03
7,167 Trimble 249 0.02 2,300 Universal Insurance 32 -
3,816 TriNet 186 0.02 2,146 Universal Logistics 30 -
9,572 Trinity Industries 164 0.02 300 Universal Stainless & Alloy Products 2 -
2,919 Trinseo 52 0.01 2,500 Universal Technical Institute 13 -
4,880 TripAdvisor 76 0.01 2,250 Univest Financial 28 -
525 Triple-S Management 8 - 13,492 Unum 177 0.02
1,874 TriState Capital 23 - 989 Upland Software 27 -
6,755 Triton International 165 0.02 4,546 Upwork 53 0.01
1,841 Triumph Bancorp 36 - 4,439 Urban Edge Properties 42 -
2,060 TrueBlue 25 - 8,343 Urban Outfitters 102 0.01
3,030 TrueCar 6 - 1,075 Urstadt Biddle Properties 10 -
25,932 Truist Financial 775 0.08 27,439 US Bancorp 811 0.08
6,666 TrustCo Bank Corp NY 34 - 1,117 US Concrete 22 -
4,309 Trustmark 84 0.01 1,000 US Ecology 27 -
3,700 TTEC 134 0.01 12,469 US Foods 202 0.02
2,723 TTM Technologies 25 - 559 US Physical Therapy 36 -
1,945 Tupperware Brands 7 - 4,368 US Silica 13 -
696 Turning Point Brands 14 - 1,302 US Xpress Enterprises 6 -
3,900 Tutor Perini 39 - 1,874 USANA Health Sciences 109 0.01
1,446 Twilio 248 0.02 312 Utah Medical Products 23 -
452 Twin Disc 2 - 1,761 Vail Resorts 254 0.02
2,623 Twin River Worldwide 46 - 9,815 Valaris 6 -
14,256 Twitter 342 0.03 16,309 Valero Energy 757 0.07
345 Tyler Technologies 95 0.01 26,776 Valley National Bancorp 168 0.02
11,719 Tyson Foods 566 0.06 1,666 Valmont Industries 151 0.01
1,089 Ubiquiti 152 0.01 8,098 Valvoline 129 0.01
9,493 UDR 284 0.03 3,718 Vanda Pharmaceuticals 34 -
4,483 UFP Industries 178 0.02 2,518 Varex Imaging 31 -
601 UFP Technologies 22 - 2,760 Varian Medical Systems 270 0.03
6,912 UGI 178 0.02 6,501 Vector 53 0.01
2,621 Ulta Beauty 423 0.04 1,126 Vectrus 45 -
2,900 Ultra Clean 52 0.01 3,636 Veeco Instruments 38 -
2,029 Ultragenyx Pharmaceutical 122 0.01 1,810 Veeva Systems 339 0.03
1,040 Ultralife 6 - 10,417 Ventas 311 0.03
Dimensional Fund Advisors Ltd. Interim Report and Financial Statements, 30 June 2020 118

International Core Equity Fund
Portfolio Statement (continued)as at 30 June 2020
Holding Investment
Fair
Value
£'000
Percentage
of total
net assets
% Holding Investment
Fair
Value
£'000
Percentage
of total
net assets
%
United States (continued) United States (continued)
2,400 Vera Bradley 9 - 1,870 Weis Markets 76 0.01
39,414 VEREIT 208 0.02 7,879 Welbilt 39 -
1,500 Vericel 17 - 82,840 Wells Fargo 1,732 0.17
4,513 Verint Systems 161 0.02 11,852 Welltower 494 0.05
3,411 VeriSign 566 0.06 11,458 Wendy's 202 0.02
4,561 Verisk Analytics 610 0.06 6,329 Werner Enterprises 220 0.02
853 Veritiv 11 - 4,423 WesBanco 71 0.01
204,403 Verizon Communications 9,114 0.89 1,511 WESCO International Preference Shares 32 -
9,942 Verra Mobility 84 0.01 3,090 WESCO International 88 0.01
1,530 Verso 15 - 1,546 West BanCorp 22 -
2,389 Vertex Pharmaceuticals 555 0.05 1,978 West Pharmaceutical Services 355 0.03
12,649 VF 622 0.06 1,784 Westamerica BanCorp 81 0.01
1,023 ViacomCBS 'A' 21 - 7,714 Western Alliance Bancorp 230 0.02
28,981 ViacomCBS 'B' 543 0.05 7,430 Western Digital 254 0.02
958 Viad 15 - 864 Western New England Bancorp 4 -
3,118 ViaSat 100 0.01 18,641 Western Union 323 0.03
11,500 Viavi Solutions 118 0.01 7,626 Westinghouse Air Brake Technologies 356 0.03
696 Vicor 41 - 4,857 Westlake Chemical 213 0.02
194 Victory Capital 3 - 15,965 Westrock 360 0.04
3,900 ViewRay 6 - 600 Westwood 8 -
542 Village Super Market 12 - 2,065 WEX 273 0.03
2,665 Virgin Galactic 33 - 932 Weyco 16 -
5,186 Virtu Financial 99 0.01 4,365 Weyerhaeuser 79 0.01
600 Virtus Investment Partners 55 0.01 4,632 Whirlpool 479 0.05
2,200 Virtusa 57 0.01 219 White Mountains Insurance 157 0.02
34,613 Visa 5,396 0.53 2,000 Whitestone REIT 12 -
11,281 Vishay Intertechnology 137 0.01 450 Willdan 9 -
1,088 Vishay Precision 21 - 24,923 Williams 373 0.04
3,179 Vista Outdoor 37 - 6,807 Williams-Sonoma 454 0.04
1,437 Visteon 76 0.01 2,468 Willis Towers Watson 388 0.04
30,283 Vistra Energy 462 0.05 6,511 WillScot 69 0.01
3,399 Vivint Solar 26 - 1,195 Wingstop 133 0.01
800 VMware 98 0.01 133 Winmark 18 -
1,632 Vocera Communications 27 - 2,545 Winnebago Industries 138 0.01
10,991 Vonage 87 0.01 3,756 Wintrust Financial 131 0.01
7,302 Vornado Realty Trust 229 0.02 12,184 WisdomTree Investments 33 -
1,200 VOXX International 6 - 5,991 Wolverine World Wide 114 0.01
5,199 Voya Financial 193 0.02 3,174 Woodward 202 0.02
656 VSE 16 - 1,017 Workday 154 0.02
3,775 Vulcan Materials 356 0.03 630 World Acceptance 33 -
8,354 W R Berkley 384 0.04 2,977 World Fuel Services 61 0.01
3,613 W R Grace 148 0.01 2,289 World Wrestling Entertainment 81 0.01
8,260 W&T Offshore 16 - 3,700 Worthington Industries 112 0.01
3,846 Wabash National 33 - 6,113 WP Carey 333 0.03
4,221 Waddell & Reed Financial 52 0.01 33,136 WPX Energy 169 0.02
28,618 Walgreens Boots Alliance 986 0.10 3,450 WSFS Financial 78 0.01
2,872 Walker & Dunlop 117 0.01 1,893 WW Grainger 468 0.05
45,427 Walmart 4,407 0.43 2,522 WW International 50 -
33,969 Walt Disney 3,084 0.30 3,722 Wyndham Destinations 84 0.01
4,597 Warrior Met Coal 57 0.01 5,176 Wyndham Hotels & Resorts 178 0.02
4,100 Washington Federal 88 0.01 6,355 Wynn Resorts 383 0.04
7,565 Washington Prime 5 - 13,159 Xcel Energy 670 0.07
3,215 Washington Real Estate Investment 2,569 Xencor 67 0.01
Trust 58 0.01 4,463 Xenia Hotels & Resorts 34 -
1,200 Washington Trust Bancorp 32 - 11,317 Xerox 141 0.01
2,100 Waste Connections (CAD) 157 0.02 7,206 Xilinx 539 0.05
3,246 Waste Connections (USD) 243 0.02 5,535 Xperi 66 0.01
18,523 Waste Management 1,563 0.15 7,850 XPO Logistics 481 0.05
2,613 Waters 376 0.04 5,974 Xylem 312 0.03
1,888 Waterstone Financial 22 - 3,753 Yelp 66 0.01
1,744 Watsco 248 0.02 4,533 YETI 158 0.02
1,590 Watts Water Technologies 104 0.01 579 York Water 22 -
733 WD-40 119 0.01 1,325 YRC Worldwide 2 -
5,922 Webster Financial 134 0.01 8,105 Yum! Brands 574 0.06
6,727 WEC Energy 477 0.05 1,691 ZAGG 4 -
5,071 Weingarten Realty Investors 78 0.01 2,114 Zebra Technologies 433 0.04
Dimensional Fund Advisors Ltd. Interim Report and Financial Statements, 30 June 2020 119

International Core Equity Fund
Portfolio Statement (continued)as at 30 June 2020
Holding Investment
Fair
Value
£'000
Percentage
of total
net assets
%
United States (continued) #N/A
133 Zedge - -
1,691 Zendesk 119 0.01
2,515 Zillow 'A' 116 0.01
7,077 Zillow 'C' 329 0.03
4,928 Zimmer Biomet 469 0.05
9,308 Zions Bancorp 250 0.02
3,100 Zix 17 -
9,541 Zoetis 1,026 0.10
1,863 Zogenix 39 -
1,281 Zscaler 110 0.01
800 Zumiez 18 -
44,820 Zynga 349 0.03
666,285 65.30
Portfolio of investments 99.79% (99.91%) 1,018,204 99.79
Net other assets 2,120 0.21
Net assets 1,020,324 100.00
Comparative figures shown in brackets next to each country heading relate to 31 December 2019.
Securities are admitted to an official stock exchange listing or traded on another regulated market unless otherwise stated, if any. * Delisted and unquoted securities are held at the ACD's valuation.
Dimensional Fund Advisors Ltd. Interim Report and Financial Statements, 30 June 2020 120

International Value Fund
Portfolio Statementas at 30 June 2020
Holding Investment
Fair
Value
£'000
Percentage
of total
net assets
% Holding Investment
Fair
Value
£'000
Percentage
of total
net assets
%
Australia 2.31% (2.47%) Denmark 0.84% (0.74%)
142,621 AMP 148 0.04 81 AP Moller - Maersk 'A' 71 0.02
122,248 Australia & New Zealand Banking 1,272 0.32 144 AP Moller - Maersk 'B' 136 0.03
1,869 Bank of Queensland 6 - 4,115 Carlsberg 444 0.11
30,619 Bendigo & Adelaide Bank 120 0.03 26,164 Danske Bank 284 0.07
77,417 BlueScope Steel 505 0.13 6,499 Demant 140 0.04
64,956 Boral 138 0.04 2,914 DSV Panalpina 289 0.07
24,027 Crown Resorts 130 0.03 1,236 Genmab 331 0.08
24,293 Downer EDI 59 0.01 6,341 H Lundbeck 195 0.05
70,707 Fortescue Metals 547 0.14 6,868 Novozymes 320 0.08
77,291 Harvey Norman 152 0.04 768 Rockwool International 'B' 168 0.04
100,260 Incitec Pivot 105 0.03 4,601 Tryg 108 0.03
31,648 Lendlease 218 0.05 10,503 Vestas Wind Systems 873 0.22
107,895 National Australia Bank 1,098 0.28 3,359 0.84
117,204 Oil Search 207 0.05
82,288 Origin Energy 268 0.07 Finland 0.28% (0.44%)
63,799 QBE Insurance 316 0.08
190,355 Santos 561 0.14 15,254 Fortum 236 0.06
273,949 South32 311 0.08 23,820 Nokia 84 0.02
111,894 Suncorp 576 0.14 95,047 Nordea Bank 535 0.13
93,186 Tabcorp 175 0.04 27,058 Stora Enso 262 0.07
152,744 Westpac Banking 1,531 0.38 560 UPM-Kymmene 13 -
44,284 Woodside Petroleum 536 0.13 1,130 0.28
13,180 Worley 64 0.02
3,005 Erste Group Bank 57 0.01 France 4.10% (4.90%)
7,064 Raiffeisen Bank International 102 0.03
9,202 2.31 6,625 Arkema 516 0.13
5,260 Atos 363 0.09
Austria 0.00% (0.05%) 34,901 AXA 590 0.15
38,671 BNP Paribas 1,242 0.31
Belgium 0.25% (0.45%) 44,075 Bollore 112 0.03
22,888 Bouygues 632 0.16
6,205 Ageas 178 0.04 2,165 Capgemini 200 0.05
9,217 KBC 431 0.11 38,531 Carrefour 488 0.12
5,787 Solvay 383 0.10 42,712 Cie de Saint-Gobain 1,263 0.32
992 0.25 14,545 Cie Generale des Etablissements
Michelin 1,232 0.31
Canada 3.25% (4.10%) 8,492 CNP Assurances 80 0.02
22,306 Credit Agricole 171 0.04
13,472 AltaGas 123 0.03 2,114 Eiffage 158 0.04
35,113 Bank of Montreal 1,490 0.37 42,494 Electricite de France 320 0.08
35,627 Bank of Nova Scotia 1,177 0.30 68,905 Engie 707 0.18
26,958 BlackBerry 105 0.03 565 EssilorLuxottica 59 0.01
20,816 Cameco 171 0.04 471 Iliad 74 0.02
20,221 Canadian Imperial Bank of Commerce 1,084 0.27 44,805 Natixis 95 0.02
85,442 Canadian Natural Resources 1,210 0.30 110,309 Orange 1,075 0.27
44,969 Cenovus Energy 170 0.04 67,672 Peugeot 898 0.23
1,526 Fairfax Financial 375 0.10 10,094 Publicis 263 0.07
41,859 First Quantum Minerals 252 0.06 15,603 Renault 316 0.08
2,693 Genworth MI Canada 51 0.01 1,765 Sanofi 146 0.04
7,222 Great-West Lifeco 100 0.03 6,760 SCOR 150 0.04
34,292 Husky Energy 92 0.02 51,896 Societe Generale 697 0.17
9,458 iA Financial 248 0.06 132,656 TOTAL 4,124 1.03
21,900 Imperial Oil 281 0.07 16,828 Valeo 361 0.09
6,000 Inter Pipeline 44 0.01 16,332 4.10
171,658 Kinross Gold 983 0.25
30,982 Lundin Mining 132 0.03 Germany 3.46% (3.82%)
40,162 Magna International 1,428 0.36
56,333 Manulife Financial 608 0.15 10,094 Allianz 1,665 0.42
17,807 Nutrien 472 0.12 25,589 BASF 1,167 0.29
2,298 Onex 82 0.02 35,767 Bayer 2,162 0.54
111,701 Suncor Energy 1,538 0.39 19,985 Bayerische Motoren Werke 1,029 0.26
75,403 Teck Resources 611 0.15 4,348 Bayerische Motoren Werke Preference
32,200 Yamana Gold 139 0.04 Shares 170 0.04
12,966 3.25 38,245 Commerzbank 138 0.04
12,553 Continental 1,003 0.25
7,148 Covestro 224 0.06
Dimensional Fund Advisors Ltd. Interim Report and Financial Statements, 30 June 2020 121

International Value Fund
Portfolio Statement (continued)as at 30 June 2020
Holding Investment
Fair
Value
£'000
Percentage
of total
net assets
% Holding Investment
Fair
Value
£'000
Percentage
of total
net assets
%
Germany (continued) Italy (continued)
53,930 Daimler 1,768 0.45 1,095,232 Telecom Italia 358 0.09
83,554 Deutsche Bank 634 0.16 58,299 UniCredit 435 0.11
34,642 Deutsche Lufthansa 284 0.07 3,079 0.77
2,645 Hapag-Lloyd 127 0.03
5,452 HeidelbergCement 237 0.06 Japan 8.97% (8.86%)
2,040 METRO 16 -
2,505 Muenchener 23,700 AGC 548 0.14
Rueckversicherungs-Gesellschaft in Muenchen 522 0.13 16,700 Aisin Seiki 396 0.10
6,404 Porsche Automobil Preference Shares 299 0.08 5,400 Alfresa 92 0.02
8,370 RWE 239 0.06 13,900 Alps Alpine 145 0.04
2,844 Talanx 84 0.02 22,300 Amada 148 0.04
86,787 Telefonica Deutschland 210 0.05 9,700 Aozora Bank 137 0.03
7,976 Uniper 210 0.05 18,600 Asahi Kasei 123 0.03
2,162 Volkswagen 283 0.07 3,000 Bank of Kyoto 87 0.02
10,815 Volkswagen Preference Shares 1,328 0.33 5,000 Brother Industries 73 0.02
13,799 3.46 3,200 Canon Marketing Japan 53 0.01
32,000 Chiba Bank 123 0.03
Hong Kong 1.07% (1.33%) 6,400 Coca-Cola Bottlers Japan 94 0.02
36,300 Concordia Financial 95 0.02
40,906 Bank of East Asia 76 0.02 3,600 Credit Saison 33 0.01
99,000 Cathay Pacific Airways 78 0.02 12,100 Dai Nippon Printing 226 0.06
172,000 CK Asset 833 0.21 19,000 Daicel 119 0.03
147,454 CK Hutchison 770 0.19 3,000 Daido Steel 75 0.02
1,000 Guoco 12 - 18,000 Dai-ichi Life 174 0.04
92,000 Hang Lung Properties 177 0.04 8,100 Daio Paper 88 0.02
55,483 Henderson Land Development 171 0.04 4,300 Daiwa House Industry 82 0.02
27,500 Hongkong Land 92 0.02 63,400 Daiwa Securities 215 0.05
70,284 Kerry Properties 147 0.04 15,300 Denso 485 0.12
96,669 New World Development 374 0.09 10,500 Dentsu 203 0.05
104,971 NWS 73 0.02 6,600 DIC 135 0.03
127,732 Sino Land 130 0.03 4,800 Dowa 118 0.03
55,559 Sun Hung Kai Properties 578 0.15 9,500 Ebara 181 0.05
35,111 Swire Pacific 'A' 152 0.04 130,500 ENEOS 376 0.09
36,137 Swire Pacific 'B' 28 0.01 3,100 Fuji Media 24 0.01
94,000 WH 65 0.02 3,200 FUJIFILM 112 0.03
84,462 Wharf 140 0.04 8,100 Fukuoka Financial 104 0.03
43,090 Wheelock* 278 0.07 1,200 Fukuyama Transporting 34 0.01
76,000 Yue Yuen Industrial 94 0.02 26,000 Hachijuni Bank 80 0.02
4,268 1.07 16,200 Hankyu Hanshin 446 0.11
11,000 Haseko 113 0.03
Ireland 1.14% (0.54%) 3,500 Heiwa 48 0.01
22,700 Hino Motors 125 0.03
4,459 Aptiv 274 0.07 18,200 Hitachi 468 0.12
21,276 CRH 592 0.15 4,300 Hitachi Capital 77 0.02
2,162 Flutter Entertainment (GBP) 231 0.06 85,200 Honda Motor 1,773 0.44
3,338 Flutter Entertainment (EUR) 357 0.09 5,400 Ibiden 128 0.03
2,400 Horizon Therapeutics 108 0.03 13,500 Idemitsu Kosan 233 0.06
10,037 Linde 1,727 0.43 6,700 IHI 79 0.02
17,255 Trane Technologies 1,253 0.31 15,100 Iida 188 0.05
4,542 1.14 70,700 Inpex 356 0.09
20,100 Isetan Mitsukoshi 94 0.02
Israel 0.16% (0.12%) 32,300 Isuzu Motors 237 0.06
5,200 Itoham Yonekyu 25 0.01
35,539 Bank Hapoalim 172 0.05 10,500 Iyo Bank 52 0.01
37,925 Bank Leumi Le-Israel 154 0.04 22,100 J Front Retailing 120 0.03
2,988 First International Bank Of Israel 52 0.01 4,200 Japan Airlines 62 0.02
1,757 Isracard 3 - 22,000 Japan Post 128 0.03
29,757 Israel Discount Bank 75 0.02 33,600 JFE 196 0.05
16,701 Teva Pharmaceutical Industries 164 0.04 6,200 JGC 53 0.01
620 0.16 10,300 JSR 162 0.04
19,500 JTEKT 123 0.03
Italy 0.77% (0.99%) 29,100 Kajima 282 0.07
8,000 Kamigumi 128 0.03
68,695 Eni 535 0.13 4,000 Kandenko 28 0.01
120,667 Fiat Chrysler Automobiles 985 0.25 5,000 Kaneka 106 0.03
497,582 Intesa Sanpaolo 766 0.19 13,400 Kawasaki Heavy Industries 157 0.04
Dimensional Fund Advisors Ltd. Interim Report and Financial Statements, 30 June 2020 122

International Value Fund
Portfolio Statement (continued)as at 30 June 2020
Holding Investment
Fair
Value
£'000
Percentage
of total
net assets
% Holding Investment
Fair
Value
£'000
Percentage
of total
net assets
%
Japan (continued) Japan (continued)
7,000 Kinden 94 0.02 77,600 Sojitz 137 0.03
2,600 Kokuyo 26 0.01 12,600 Sompo 353 0.09
16,400 Komatsu 273 0.07 21,000 Subaru 356 0.09
54,900 Konica Minolta 154 0.04 34,700 Sumitomo 323 0.08
6,300 K's 70 0.02 122,700 Sumitomo Chemical 298 0.08
36,000 Kuraray 306 0.08 49,200 Sumitomo Electric Industries 460 0.12
3,400 Kyocera 151 0.04 13,700 Sumitomo Forestry 140 0.04
7,347 Kyushu Financial 25 0.01 11,000 Sumitomo Heavy Industries 194 0.05
2,200 Lintec 43 0.01 10,600 Sumitomo Metal Mining 241 0.06
16,500 LIXIL 187 0.05 45,100 Sumitomo Mitsui Financial 1,033 0.26
7,700 Maeda 48 0.01 10,900 Sumitomo Mitsui Trust 249 0.06
2,000 Maeda Road Construction 31 0.01 4,000 Sumitomo Realty & Development 90 0.02
52,400 Marubeni 193 0.05 22,300 Sumitomo Rubber Industries 179 0.04
600 Maruichi Steel Tube 12 - 600 Suzuken Co Aichi Japan 18 -
52,200 Mazda Motor 255 0.06 4,600 Suzuki Motor 127 0.03
53,110 Mebuki Financial 100 0.03 23,000 T&D 159 0.04
9,200 Medipal 144 0.04 8,300 Taiheiyo Cement 156 0.04
34,800 Mitsubishi 597 0.15 10,000 Takashimaya 68 0.02
81,100 Mitsubishi Chemical 384 0.10 22,800 Teijin 295 0.07
12,900 Mitsubishi Gas Chemical 159 0.04 22,300 Toda 117 0.03
18,550 Mitsubishi Heavy Industries 356 0.09 2,300 Tokio Marine 81 0.02
8,300 Mitsubishi Materials 142 0.04 2,500 Tokyo Broadcasting System 32 0.01
23,900 Mitsubishi Motors 48 0.01 21,000 Tokyo Tatemono 196 0.05
219,447 Mitsubishi UFJ Financial 698 0.18 59,400 Tokyu Fudosan 226 0.06
54,000 Mitsubishi UFJ Lease & Finance 208 0.05 9,000 Toppan Printing 122 0.03
26,900 Mitsui 324 0.08 73,900 Toray Industries 283 0.07
13,100 Mitsui Chemicals 222 0.06 21,200 Tosoh 235 0.06
19,200 Mitsui Fudosan 276 0.07 10,600 Toyo Seikan 97 0.02
9,900 Mitsui OSK Lines 143 0.04 5,400 Toyoda Gosei 91 0.02
404,400 Mizuho Financial 404 0.10 7,600 Toyota Boshoku 83 0.02
16,350 MS&AD Insurance 365 0.09 5,000 Toyota Industries 215 0.05
3,100 Nagase 31 0.01 72,961 Toyota Motor 3,725 0.94
8,900 NEC 347 0.09 13,400 Toyota Tsusho 276 0.07
16,900 NGK Insulators 190 0.05 3,000 TS Tech 67 0.02
3,000 NH Foods 98 0.02 1,000 TV Asahi 12 -
18,000 NHK Spring 95 0.02 12,200 Ube Industries 170 0.04
24,400 Nikon 166 0.04 3,300 Ushio 36 0.01
8,000 Nippo 165 0.04 39,000 Yamada Denki 157 0.04
4,800 Nippon Electric Glass 61 0.02 20,100 Yamaha Motor 256 0.06
6,400 Nippon Express 270 0.07 14,700 Yokohama Rubber 168 0.04
12,200 Nippon Paper Industries 139 0.04 10,000 Zeon 75 0.02
2,200 Nippon Shokubai 94 0.02 35,770 8.97
33,838 Nippon Steel 259 0.06
15,500 Nippon Yusen 177 0.04 Netherlands 1.54% (1.34%)
124,300 Nissan Motor 375 0.09
4,200 Nitto Denko 193 0.05 32,203 ABN AMRO Bank 226 0.06
2,200 NOK 22 0.01 73,991 Aegon 179 0.04
57,500 Nomura 209 0.05 23,163 ArcelorMittal 195 0.05
11,800 Nomura Real Estate 178 0.04 1,400 ASM International 172 0.04
23,600 NSK 142 0.04 1,985 Coca-Cola European Partners 61 0.02
56,200 Obayashi 427 0.11 7,559 Heineken 571 0.14
94,000 Oji 356 0.09 112,671 ING 639 0.16
69,000 ORIX 693 0.17 62,203 Koninklijke Ahold Delhaize 1,387 0.35
13,400 Rengo 89 0.02 12,907 Koninklijke DSM 1,451 0.36
43,700 Resona 121 0.03 12,946 Koninklijke Philips 487 0.12
50,400 Ricoh 293 0.07 4,323 Koninklijke Vopak 186 0.05
3,200 Rohm 173 0.04 11,037 NN 301 0.08
8,100 Seiko Epson 75 0.02 7,768 Randstad 284 0.07
12,800 Seino 136 0.03 6,139 1.54
2,500 Sekisui Chemical 29 0.01
24,700 Sekisui House 383 0.10 New Zeland 0.12% (0.11%)
800 Shimamura 44 0.01
43,100 Shimizu 288 0.07 4,550 Air New Zealand 3 -
9,000 Shinsei Bank 88 0.02 39,871 Auckland International Airport 136 0.04
21,400 Shizuoka Bank 112 0.03 22,903 Chorus 89 0.02
13,900 Showa Denko 253 0.06 6,783 Ebos 76 0.02
Dimensional Fund Advisors Ltd. Interim Report and Financial Statements, 30 June 2020 123

International Value Fund
Portfolio Statement (continued)as at 30 June 2020
Holding Investment
Fair
Value
£'000
Percentage
of total
net assets
% Holding Investment
Fair
Value
£'000
Percentage
of total
net assets
%
New Zeland (continued) Switzerland 4.02% (4.73%)
60,268 Fletcher Building 116 0.03 74,058 ABB 1,353 0.34
5,665 Ryman Healthcare 39 0.01 15,939 Adecco 610 0.15
459 0.12 8,962 Alcon 418 0.11
1,724 Baloise 207 0.05
Norway 0.30% (0.34%) 680 Banque Cantonale Vaudoise 53 0.01
21,612 Cie Financiere Richemont 1,121 0.28
45,177 DNB 489 0.12 53,154 Credit Suisse 445 0.11
14,860 Equinor 172 0.04 7,316 Garmin 573 0.14
80,865 Norsk Hydro 180 0.05 1,025 Helvetia 76 0.02
3,568 SpareBank 1 SR-Bank 21 0.01 17,146 Julius Baer 583 0.15
26,162 Storebrand 109 0.03 23,660 LafargeHolcim 838 0.21
9,189 Subsea 7 48 0.01 2,325 Lonza 990 0.25
5,224 Yara International 146 0.04 50,372 Novartis 3,565 0.90
1,165 0.30 4,045 Swatch 128 0.03
1,331 Swatch Bearer Shares 216 0.05
Portugal 0.00% (0.00%) 1,256 Swiss Life 374 0.09
737 Swiss Prime Site 56 0.01
212,158 Banco Espirito Santo* - - 5,698 Swiss Re 356 0.09
- - 1,839 Swisscom 783 0.20
126,021 UBS 1,175 0.30
Singapore 0.48% (0.50%) 1,706 Vifor Pharma 211 0.05
6,684 Zurich Insurance 1,905 0.48
11,900 BOC Aviation 62 0.02 16,036 4.02
97,200 CapitaLand 166 0.04
36,200 City Developments 178 0.04 United States 65.07% (62.27%)
6,300 Jardine Cycle & Carriage 74 0.02
138,500 Keppel 482 0.12 15,909 Activision Blizzard 977 0.25
59,307 Oversea-Chinese Banking 312 0.08 4,129 Advance Auto Parts 480 0.12
165,832 Singapore Airlines 360 0.09 6,414 AECOM 196 0.05
33,240 UOL 132 0.03 27,467 Aflac 792 0.20
44,600 Wilmar International 107 0.03 8,877 Air Products and Chemicals 1,725 0.43
85,600 Yangzijiang Shipbuilding 46 0.01 7,129 Akamai Technologies 609 0.15
1,919 0.48 6,404 Alaska Air 192 0.05
7,194 Albemarle 447 0.11
Spain 0.59% (1.04%) 10,830 Alexion Pharmaceuticals 981 0.25
554 Alleghany 219 0.05
294,422 Banco Bilbao Vizcaya Argentaria 816 0.21 14,301 Allstate 1,112 0.28
440,361 Banco Santander 871 0.22 42,058 Ally Financial 669 0.17
54,482 CaixaBank 94 0.02 105,191 Amcor 851 0.21
11,792 EDP Renovaveis 130 0.03 9,000 Amdocs 441 0.11
58,797 Repsol 417 0.10 1,173 AMERCO 288 0.07
70,078 Repsol Rights 07/07/2020 28 0.01 3,217 American Financial 161 0.04
2,356 0.59 32,530 American International 812 0.20
6,284 AMETEK 451 0.11
Sweden 1.08% (1.12%) 15,628 Analog Devices 1,512 0.38
11,118 Anthem 2,349 0.59
14,592 BillerudKorsnas 169 0.04 19,456 Apache 211 0.05
28,261 Boliden 516 0.13 16,675 Aramark 304 0.08
12,706 Getinge 188 0.05 10,736 Arch Capital 248 0.06
3,425 Holmen 88 0.02 21,360 Archer-Daniels-Midland 690 0.17
4,657 ICA 181 0.05 5,933 Arconic 67 0.02
3,622 Intrum 54 0.01 3,550 Arrow Electronics 195 0.05
3,096 Millicom International Cellular 64 0.02 2,236 Assurant 183 0.05
6,189 Pandox 58 0.01 344,377 AT&T 8,401 2.11
3,369 Saab 69 0.02 7,240 Athene 181 0.05
53,770 Skandinaviska Enskilda Banken 378 0.10 3,418 Autoliv 178 0.04
29,877 SKF 'B' 451 0.11 14,657 Baker Hughes 177 0.04
22,281 Svenska Cellulosa 'B' 214 0.05 144,455 Bank of America 2,748 0.69
40,634 Svenska Handelsbanken 'A' 317 0.08 61,847 Bank of New York Mellon 1,860 0.47
17,308 Swedbank 181 0.05 2,505 Becton Dickinson 475 0.12
135,729 Telia 413 0.10 29,136 Berkshire Hathaway 4,201 1.05
15,971 Trelleborg 187 0.05 9,333 Biogen 1,979 0.50
7,545 Volvo 'A' 96 0.02 989 Bio-Rad Laboratories 348 0.09
54,342 Volvo 'B' 693 0.17 13,037 BorgWarner 372 0.09
4,317 1.08 3,872 Boston Scientific 109 0.03
35,768 Bristol-Myers Squibb 1,685 0.42
Dimensional Fund Advisors Ltd. Interim Report and Financial Statements, 30 June 2020 124

International Value Fund
Portfolio Statement (continued)as at 30 June 2020
Holding Investment
Fair
Value
£'000
Percentage
of total
net assets
% Holding Investment
Fair
Value
£'000
Percentage
of total
net assets
%
United States (continued) United States (continued)
7,279 Bunge 242 0.06 55,735 Fifth Third Bancorp 849 0.21
500 CACI International 89 0.02 41,531 First Horizon National* - -
7,010 Caesars Entertainment 69 0.02 4,900 Fiserv 387 0.10
36,353 Capital One Financial 1,845 0.46 425,079 Ford Motor 2,077 0.52
10,274 Cardinal Health 434 0.11 7,937 Fortive 439 0.11
4,938 Carlisle 480 0.12 500 Fortune Brands Home & Security 26 0.01
9,846 CarMax 713 0.18 27,159 Fox 'A' 594 0.15
54,266 Carnival 738 0.19 20,639 Fox 'B' 450 0.11
28,882 Carrier Global 519 0.13 12,691 Franklin Resources 211 0.05
12,752 CBRE 459 0.12 60,306 Freeport-McMoRan 541 0.14
500 Celanese 35 0.01 1,500 GCI Liberty 82 0.02
22,489 Centene 1,146 0.29 155,809 General Electric 860 0.22
125,134 CenturyLink 996 0.25 84,290 General Motors 1,734 0.44
524 Cerence 16 - 7,400 Gentex 155 0.04
17,299 CF Industries 387 0.10 3,433 Genuine Parts 243 0.06
30,689 Change Healthcare 277 0.07 2,500 Global Payments 339 0.09
8,630 Charter Communications 3,577 0.90 2,000 Globe Life 118 0.03
88,881 Chevron 6,346 1.59 11,479 Goldman Sachs 1,809 0.45
7,711 Chubb 790 0.20 62,398 Halliburton 630 0.16
3,066 Ciena 133 0.03 276 Harley-Davidson 5 -
19,488 Cigna 2,976 0.75 28,089 Hartford Financial Services 876 0.22
70,044 Citigroup 2,865 0.72 774 Hasbro 47 0.01
16,455 Citizens Financial 315 0.08 5,157 Henry Schein 244 0.06
36,643 Cognizant Technology Solutions 1,685 0.42 21,521 Hess 874 0.22
242,294 Comcast 7,684 1.93 145,311 Hewlett Packard Enterprise 1,132 0.28
4,518 Comerica 136 0.03 9,105 HollyFrontier 211 0.05
14,221 Conagra Brands 390 0.10 23,733 Howmet Aerospace 313 0.08
5,452 Concho Resources 222 0.06 7,194 Humana 2,222 0.56
54,461 ConocoPhillips 1,830 0.46 60,020 Huntington Bancshares 433 0.11
7,355 Constellation Brands 1,042 0.26 362 Hyatt Hotels 15 -
75,671 Corning 1,581 0.40 15,225 Ingersoll Rand 348 0.09
14,141 Corteva 301 0.08 2,317 Ingredion 153 0.04
6,297 Coty 24 0.01 230,441 Intel 10,936 2.74
10,998 Cummins 1,549 0.39 1,978 International Flavors & Fragrances 196 0.05
50,262 CVS Health 2,638 0.66 28,131 International Paper 801 0.20
6,641 Danaher 932 0.23 3,081 Interpublic 43 0.01
300 Darden Restaurants 19 - 600 IPG Photonics 77 0.02
14,375 DaVita 904 0.23 5,331 IQVIA 597 0.15
15,800 Deere 1,977 0.50 6,079 J M Smucker 520 0.13
62,404 Delta Air Lines 1,448 0.36 5,378 Jacobs Engineering 372 0.09
5,900 Dentsply Sirona 211 0.05 3,778 Jazz Pharmaceuticals 337 0.08
31,450 Devon Energy 285 0.07 14,900 Johnson Controls International 410 0.10
6,070 Diamondback Energy 204 0.05 2,978 Jones Lang LaSalle 245 0.06
12,400 Discovery 'A' 214 0.05 115,222 JPMorgan Chase 8,720 2.19
24,760 Discovery 'C' 390 0.10 12,801 Juniper Networks 235 0.06
12,617 DISH Network 339 0.09 8,183 Kansas City Southern 984 0.25
800 Dolby Laboratories 43 0.01 8,600 Keurig Dr Pepper 198 0.05
13,016 Dollar Tree 992 0.25 72,538 KeyCorp 700 0.18
46,264 Dow 1,542 0.39 94,408 Kinder Morgan 1,127 0.28
34,881 DR Horton 1,551 0.39 9,393 Knight-Swift Transportation 318 0.08
24,308 DuPont de Nemours 1,038 0.26 12,187 Kohl's 205 0.05
225 DXC Technology 3 - 24,243 Kraft Heinz 625 0.16
10,936 Eastman Chemical 616 0.15 57,744 Kroger 1,605 0.40
39,710 Eaton 2,809 0.70 3,438 L3Harris Technologies 489 0.12
7,600 Elanco Animal Health 130 0.03 7,002 Laboratory Corp of America 923 0.23
19,462 Emerson Electric 972 0.24 4,969 Lear 437 0.11
299 Envista 5 - 9,625 Leidos 723 0.18
37,903 EOG Resources 1,531 0.38 20,198 Lennar 'A' 1,003 0.25
6,758 Equitable 104 0.03 1,704 Lennar 'B' 63 0.02
1,669 Everest Re 275 0.07 1,000 Liberty Broadband 'A' 100 0.03
2,099 Expedia 141 0.04 4,176 Liberty Broadband 'C' 425 0.11
153,795 Exxon Mobil 5,547 1.39 700 Liberty Media Corp-Liberty Formula
657 F5 Networks 73 0.02 One 'C' 18 -
15,537 FedEx 1,701 0.43 3,963 Liberty Media Corp-Liberty SiriusXM
11,146 Fidelity National Information 'A' 108 0.03
Services 1,191 0.30 7,926 Liberty Media Corp-Liberty SiriusXM
'C' 216 0.05
Dimensional Fund Advisors Ltd. Interim Report and Financial Statements, 30 June 2020 125

International Value Fund
Portfolio Statement (continued)as at 30 June 2020
Holding Investment
Fair
Value
£'000
Percentage
of total
net assets
% Holding Investment
Fair
Value
£'000
Percentage
of total
net assets
%
United States (continued) United States (continued)
8,145 Lincoln National 237 0.06 1,405 Roper Technologies 441 0.11
23,237 LKQ 489 0.12 17,185 Royal Caribbean Cruises 700 0.18
10,608 Loews 291 0.07 1,758 Royal Gold 172 0.04
23,326 LyondellBasell Industries 1,232 0.31 22,968 Santander Consumer USA 352 0.09
5,392 M&T Bank 448 0.11 66,970 Schlumberger 981 0.25
58 ManpowerGroup 3 - 2 Seaboard 5 -
25,346 Marathon Oil 123 0.03 10,907 Sensata Technologies 325 0.08
46,829 Marathon Petroleum 1,349 0.34 4,664 Skyworks Solutions 477 0.12
405 Markel 298 0.07 4,227 Snap-on 468 0.12
4,185 Martin Marietta Materials 703 0.18 3,149 Sonoco Products 133 0.03
22,220 Marvell Technology 606 0.15 4,489 Southern Copper 140 0.04
15,457 McKesson 1,909 0.48 39,071 Southwest Airlines 1,112 0.28
32,356 Medtronic 2,378 0.60 261 Spectrum Brands 10 -
30,009 MetLife 868 0.22 13,075 SS&C Technologies 590 0.15
45,539 MGM Resorts International 621 0.16 12,263 Stanley Black & Decker 1,358 0.34
11,772 Microchip Technology 981 0.25 14,139 State Street 708 0.18
64,209 Micron Technology 2,565 0.64 18,379 Steel Dynamics 385 0.10
5,879 Mohawk Industries 477 0.12 3,470 STERIS 423 0.11
7,711 Molson Coors Beverage 222 0.06 42,076 Synchrony Financial 751 0.19
31,228 Mondelez International 1,287 0.32 25,858 Target 2,498 0.63
45,673 Morgan Stanley 1,755 0.44 25,259 TE Connectivity 1,655 0.42
5,634 Mosaic 58 0.01 8,661 TechnipFMC 48 0.01
43,968 Mylan 571 0.14 245 Teledyne Technologies 61 0.02
8,176 National Oilwell Varco 81 0.02 1,311 Thermo Fisher Scientific 375 0.09
16,352 Newell Brands 207 0.05 1,166 Tiffany 114 0.03
48,382 Newmont 2,346 0.59 15,490 T-Mobile US 1,336 0.34
16,242 News 'A' 154 0.04 15,490 T-Mobile US Rights 27/07/2020 3 -
7,100 News 'B' 68 0.02 23,734 Travelers 2,181 0.55
24,188 Nielsen 289 0.07 6,173 Trimble 214 0.05
10,218 Noble Energy 72 0.02 36,205 Truist Financial 1,082 0.27
18,150 Norfolk Southern 2,551 0.64 5,100 Twitter 122 0.03
2,447 Northern Trust 152 0.04 23,524 Tyson Foods 1,136 0.29
10,563 Norwegian Cruise Line 142 0.04 25,066 United Airlines 716 0.18
4,198 Nuance Communications 87 0.02 3,330 United Rentals 400 0.10
25,470 Nucor 847 0.21 6,485 Universal Health Services 487 0.12
66,825 Occidental Petroleum 971 0.24 29,632 US Bancorp 876 0.22
28,807 ON Semiconductor 457 0.11 4,236 US Foods 69 0.02
12,407 Otis Worldwide 573 0.14 34,424 Valero Energy 1,598 0.40
26,956 Ovintiv 204 0.05 108,636 Verizon Communications 4,844 1.22
2,527 Owens Corning 113 0.03 298 ViacomCBS 'A' 6 -
24,532 PACCAR 1,470 0.37 26,911 ViacomCBS 'B' 505 0.13
4,990 Packaging Corp of America 398 0.10 25,323 Vistra Energy 386 0.10
4,996 Parker-Hannifin 730 0.18 4,500 Voya Financial 167 0.04
10,425 People's United Financial 96 0.02 6,093 Vulcan Materials 575 0.14
3,536 PerkinElmer 276 0.07 7,785 W R Berkley 358 0.09
6,224 Perrigo 276 0.07 56,203 Walgreens Boots Alliance 1,936 0.49
228,296 Pfizer 6,071 1.52 32,856 Walt Disney 2,983 0.75
21,595 Phillips 66 1,207 0.30 143,840 Wells Fargo 3,008 0.75
10,149 Pioneer Natural Resources 780 0.20 11,615 Western Digital 396 0.10
12,862 PNC Financial Services 1,077 0.27 5,647 Westinghouse Air Brake Technologies 264 0.07
4,695 Post 335 0.08 5,998 Westlake Chemical 264 0.07
19,627 Principal Financial 644 0.16 28,381 Westrock 640 0.16
14,359 Prudential Financial 692 0.17 4,535 Whirlpool 469 0.12
26,940 PulteGroup 735 0.18 50,226 Williams 751 0.19
842 PVH 33 0.01 20,836 Xerox 259 0.06
7,000 Qorvo 611 0.15 10,365 XPO Logistics 635 0.16
4,653 Quanta Services 148 0.04 1,700 Xylem 89 0.02
10,575 Quest Diagnostics 951 0.24 800 Zillow 'A' 37 0.01
4,265 Ralph Lauren 252 0.06 4,700 Zillow 'C' 219 0.05
36,682 Raytheon Technologies 1,847 0.46 8,075 Zimmer Biomet 769 0.19
1,630 Regeneron Pharmaceuticals 810 0.20 12,379 Zions Bancorp 333 0.08
73,293 Regions Financial 647 0.16 259,350 65.07
2,743 Reinsurance Group of America 170 0.04
6,112 Reliance Steel & Aluminum 462 0.12 Portfolio of investments 99.80% (100.26%) 397,800 99.80
410 RenaissanceRe 56 0.01 Net other assets 781 0.20
24,693 Republic Services 1,631 0.41 Net assets 398,581 100.00
Dimensional Fund Advisors Ltd. Interim Report and Financial Statements, 30 June 2020
Comparative figures shown in brackets next to each country heading relate to 31 December 2019.
Securities are admitted to an official stock exchange listing or traded on another regulated market unless otherwise stated, if any.
* Delisted and unquoted securities are held at the ACD's valuation.
126

United Kingdom Core Equity Fund
Portfolio Statementas at 30 June 2020
Holding Investment
Fair
Value
£'000
Percentage
of total
net assets
% Holding Investment
Fair
Value
£'000
Percentage
of total
net assets
%
Aerospace & Defence 1.73% (2.37%) Construction & Materials (continued)
22,086 Avon Rubber 700 0.11 82,215 Tyman 157 0.02
1,061,023 BAE Systems 5,181 0.79 92,854 Volution 166 0.03
175,499 Chemring 421 0.06 5,052 0.77
411,098 Meggitt 1,221 0.18
342,351 QinetiQ 1,037 0.16 Electricity 1.47% (1.06%)
617,101 Rolls-Royce 1,784 0.27
255,744 Senior 177 0.03 22,670 ContourGlobal 43 0.01
41,442 Ultra Electronics 837 0.13 369,133 Drax 975 0.15
11,358 1.73 620,834 SSE 8,608 1.31
9,626 1.47
Automobiles & Parts 0.49% (0.43%)
Electronic & Electrical Equipment 1.22% (1.00%)
604,864 Auto Trader 3,189 0.49
11,387 TI Fluid Systems 21 - 13,438 Dialight 43 0.01
3,210 0.49 43,538 DiscoverIE 219 0.03
656 Gooch & Housego 7 -
Banks 5.50% (7.16%) 162,531 Halma 3,714 0.57
48,821 ITM Power 135 0.02
38,569 Bank of Georgia 413 0.06 60,064 Luceco 56 0.01
3,999,684 Barclays 4,594 0.70 250,940 Morgan Advanced Materials 605 0.09
4,833,606 HSBC 18,317 2.79 37,308 Oxford Instruments 526 0.08
19,544,832 Lloyds Banking 6,104 0.93 19,256 Renishaw 754 0.12
1,357,910 Royal Bank of Scotland 1,653 0.25 47,572 Spectris 1,210 0.18
950,567 Standard Chartered 4,113 0.63 41,635 Strix 78 0.01
16,544 TBC Bank 147 0.02 34,642 TClarke 34 0.01
822,283 Virgin Money 761 0.12 104,629 TT Electronics 178 0.03
36,102 5.50 44,607 Volex 66 0.01
54,768 Xaar 30 -
Beverages 2.81% (2.70%) 10,142 XP Power 351 0.05
8,006 1.22
62,831 AG Barr 288 0.04
198,784 Britvic 1,546 0.24 Financial Services 5.31% (5.15%)
28,583 C&C 66 0.01
74,265 Coca-Cola 1,516 0.23 343,038 3i 2,912 0.44
498,599 Diageo 13,457 2.05 125,334 AJ Bell 491 0.08
59,972 Fevertree Drinks 1,250 0.19 74,011 Allied Minds 22 -
3,703 Nichols 48 0.01 13,739 Appreciate 4 -
97,569 Stock Spirits 231 0.04 185,433 Arrow Global 159 0.02
18,402 2.81 203,377 Ashmore 844 0.13
221,851 Brewin Dolphin 570 0.09
Chemicals 1.14% (1.08%) 2,048 Brooks Macdonald 34 0.01
106,162 Burford Capital 491 0.07
69,317 Croda International 3,661 0.56 472 Charles Stanley 1 -
293,258 Elementis 186 0.03 11,007 City of London Investment 42 0.01
103,285 Johnson Matthey 2,189 0.33 101,695 Close Brothers 1,133 0.17
31,673 Scapa 31 - 74,944 CMC Markets 199 0.03
201,677 Synthomer 558 0.09 17,387 Georgia Capital 79 0.01
3,985 Treatt 19 - 13,842 H&T 45 0.01
43,886 Victrex 861 0.13 125,749 Hargreaves Lansdown 2,098 0.32
7,505 1.14 186,635 IG 1,512 0.23
77,699 IntegraFin 363 0.06
Construction & Materials 0.77% (0.74%) 100,553 Intermediate Capital 1,314 0.20
162,367 International Personal Finance 89 0.01
362,764 Balfour Beatty 955 0.15 396,790 Investec 645 0.10
181,461 Costain 130 0.02 607,828 IP 398 0.06
74 Epwin - - 195,732 John Laing 688 0.10
156,788 Forterra 318 0.05 352,585 Jupiter Fund Management 906 0.14
39,850 Henry Boot 98 0.01 28,547 Liontrust Asset Management 378 0.06
287,519 Ibstock 525 0.08 55,570 London Stock Exchange 4,608 0.70
27,886 James Halstead 143 0.02 1,127,774 M&G 1,917 0.29
80,437 Keller 514 0.08 841,611 Man 1,108 0.17
80,979 Kier 80 0.01 1,500,417 Melrose Industries 1,741 0.27
109,091 Marshalls 680 0.10 3,735 Mortgage Advice Bureau 22 -
39,908 Morgan Sindall 500 0.08 198,395 Ninety One 413 0.06
42,151 Norcros 66 0.01 14,156 Non-Standard Finance 1 -
162,420 Polypipe 720 0.11 33,247 Numis 103 0.02
Dimensional Fund Advisors Ltd. Interim Report and Financial Statements, 30 June 2020 127

United Kingdom Core Equity Fund
Portfolio Statement (continued)as at 30 June 2020
Holding Investment
Fair
Value
£'000
Percentage
of total
net assets
% Holding Investment
Fair
Value
£'000
Percentage
of total
net assets
%
Financial Services (continued) General Industrials (continued)
209,377 OneSavings Bank 559 0.09 727,034 DS Smith 2,422 0.37
244,761 Paragon Banking 872 0.13 28,498 Macfarlane 20 -
67,374 Plus500 886 0.14 132,728 Smiths 1,855 0.28
47,665 Polar Capital 234 0.04 196,769 Vesuvius 773 0.12
11,702 Premier Miton 12 - 5,574 0.85
89,607 Provident Financial 159 0.02
812,952 Quilter 1,127 0.17 General Retailers 3.63% (3.40%)
20,191 Rathbone Brothers 291 0.04
8,044 River & Mercantile 15 - 45,802 ASOS 1,533 0.23
1,628 S&U 27 - 504,284 B&M European Value Retail 1,988 0.30
43,707 Schroders 1,300 0.20 498,912 boohoo 2,014 0.31
18,025 Schroders (Non-Voting) 376 0.06 222,223 Card Factory 111 0.02
772,183 Standard Life Aberdeen 2,127 0.32 35,872 CVS 362 0.06
13,644 Tatton Asset Management 39 0.01 624,133 Debenhams* - -
420,465 TP ICAP 1,482 0.23 138,806 DFS Furniture 228 0.03
34,836 5.31 35,303 Dignity 87 0.01
719,051 Dixons Carphone 641 0.10
Fixed Line Telecommunications 1.24% (1.57%) 72,084 Dunelm 853 0.13
175,034 Frasers 532 0.08
6,320,156 BT 7,287 1.11 214,760 Halfords 332 0.05
430,337 TalkTalk Telecom 366 0.05 387,040 Inchcape 1,882 0.29
36,000 Telecom Plus 508 0.08 272,113 JD Sports Fashion 1,703 0.26
8,161 1.24 44,298 Joules 49 0.01
19,943 Just Eat Takeaway.com 1,690 0.26
Food & Drug Retailers 2.32% (2.52%) 1,382,035 Kingfisher 3,074 0.47
179,529 Lookers 34 0.01
74,907 Greggs 1,216 0.19 1,289,800 Marks & Spencer 1,301 0.20
1,054,341 J Sainsbury 2,239 0.34 37,803 Motorpoint 93 0.01
17,099 McColl's Retail 7 - 103,566 N Brown 36 0.01
83,331 Ocado 1,698 0.26 31,465 Naked Wines 135 0.02
3,073,879 Tesco 7,125 1.09 59,562 Next 2,926 0.45
1,517,552 Wm Morrison Supermarkets 2,906 0.44 1,262,296 Pendragon 114 0.02
15,191 2.32 362,162 Pets at Home 867 0.13
814,448 Saga 138 0.02
Food Producers 3.07% (2.46%) 13,542 ScS 19 -
40,819 Studio Retail 89 0.01
1,189 Anglo-Eastern Plantations 6 - 93,959 Topps Tiles 41 0.01
111,651 Associated British Foods 2,137 0.33 329,558 Vertu Motors 82 0.01
12,705 Bakkavor 9 - 111,666 Vivo Energy 91 0.01
16,725 Carr's 18 - 67,786 WH Smith 742 0.11
25,597 Cranswick 918 0.14 23,787 3.63
155,687 Devro 236 0.04
343,217 Greencore 439 0.07 Health Care Equipment & Services 1.14% (1.19%)
27,205 Hilton Food 340 0.05
735,830 Premier Foods 520 0.08 15,635 Advanced Medical Solutions 36 -
295,591 Tate & Lyle 1,994 0.30 41,310 CareTech 178 0.03
306,197 Unilever 13,497 2.06 534,847 ConvaTec 1,047 0.16
20,114 3.07 73,776 EKF Diagnostics 31 -
362,644 Mediclinic International 968 0.15
Forestry & Paper 0.56% (0.53%) 30,108 NMC Health* 9 -
258,920 Smith & Nephew 3,911 0.60
242,786 Mondi 3,675 0.56 331,181 Spire Healthcare 284 0.04
3,675 0.56 142,588 UDG Healthcare 1,025 0.16
7,489 1.14
Gas, Water & Multiutilities 2.53% (2.19%)
Household Goods & Home Construction 4.66% (4.04%)
5,693,998 Centrica 2,208 0.34
614,725 National Grid 6,069 0.92 479,092 Barratt Developments 2,379 0.36
221,462 Pennon 2,489 0.38 92,093 Bellway 2,363 0.36
123,800 Severn Trent 3,085 0.47 69,379 Berkeley 2,894 0.44
299,613 United Utilities 2,764 0.42 270,353 Countryside Properties 891 0.14
16,615 2.53 220,103 Crest Nicholson 447 0.07
129,752 Galliford Try 155 0.02
General Industrials 0.85% (0.70%) 52,866 Headlam 144 0.02
318,045 McBride 196 0.03
899,244 Coats 504 0.08 308,117 McCarthy & Stone 222 0.03
Dimensional Fund Advisors Ltd. Interim Report and Financial Statements, 30 June 2020 128

United Kingdom Core Equity Fund
Portfolio Statement (continued)as at 30 June 2020
Holding Investment
Fair
Value
£'000
Percentage
of total
net assets
% Holding Investment
Fair
Value
£'000
Percentage
of total
net assets
%
Household Goods & Home Construction (continued) Media (continued)
25,793 MJ Gleeson 171 0.03 188,138 Ascential 546 0.08
152,814 Persimmon 3,524 0.54 54,354 Bloomsbury Publishing 110 0.02
162,776 Reckitt Benckiser 12,078 1.84 1,986 Centaur Media - -
208,521 Redrow 921 0.14 88,249 Daily Mail & General Trust 604 0.09
1,976,956 Taylor Wimpey 2,803 0.43 61,053 Euromoney Institutional Investor 502 0.08
175,131 Vistry 1,253 0.19 172,697 GoCo 165 0.03
99,347 Watkin Jones 151 0.02 142,553 Hyve 143 0.02
30,592 4.66 368,080 Informa 1,734 0.27
2,313,840 ITV 1,721 0.26
Industrial Engineering 1.72% (1.46%) 13,881 M&C Saatchi 7 -
379,708 Moneysupermarket.com 1,223 0.19
154,842 Bodycote 973 0.15 8,022 NAHL 3 -
23,492 Flowtech Fluidpower 17 - 30,511 Next Fifteen Communications 109 0.02
406 Goodwin 12 - 435,651 Pearson 2,523 0.39
56,766 Hill & Smith 702 0.11 294,283 Reach 229 0.03
202,006 IMI 1,880 0.29 503,635 RELX 9,446 1.44
11,998 Porvair 68 0.01 538,136 Rightmove 2,974 0.45
35,883 Renold 4 - 2,118 STV 5 -
13,755 Rhi Magnesita 339 0.05 4,359 Wilmington 5 -
447,319 Rotork 1,255 0.19 541,225 WPP 3,424 0.52
161,163 Severfield 98 0.01 25,893 3.95
40,166 Spirax-Sarco Engineering 4,000 0.61
32,943 Trifast 37 0.01 Mining 7.94% (5.97%)
22,816 Vitec 160 0.02
164,853 Weir 1,762 0.27 343,309 Anglo American 6,386 0.98
11,307 1.72 113,790 Anglo Pacific 153 0.02
197,746 Antofagasta 1,838 0.28
Industrial Metals & Mining 0.21% (0.20%) 770,088 BHP 12,668 1.93
962,806 Centamin 1,701 0.26
306,566 Evraz 876 0.13 154,733 Central Asia Metals 222 0.03
320,309 Ferrexpo 533 0.08 84,183 Fresnillo 698 0.11
1,409 0.21 80,295 Gem Diamonds 22 -
3,257,869 Glencore 5,511 0.84
Industrial Transportation 0.51% (0.50%) 258,898 Highland Gold Mining 589 0.09
268,428 Hochschild Mining 516 0.08
7,891 Braemar Shipping Services 9 - 264,416 KAZ Minerals 1,293 0.20
17,393 Clarkson 391 0.06 150,014 Pan African Resources 26 0.01
34,045 James Fisher & Sons 452 0.07 504,147 Petra Diamonds 9 -
690,248 Royal Mail 1,259 0.19 1,834,986 Petropavlovsk 471 0.07
435,536 Signature Aviation 1,026 0.16 433,942 Rio Tinto 19,603 2.99
193,822 Stobart 74 0.01 184,334 Sibanye Stillwater 316 0.05
65,127 Wincanton 120 0.02 101,671 SolGold 21 -
3,331 0.51 52,043 7.94
Leisure Goods 0.30% (0.18%) Mobile Telecommunications 1.41% (1.16%)
2,779 Frontier Developments 51 0.01 24,300 Gamma Communications 304 0.05
22,128 Games Workshop 1,768 0.27 6,951,576 Vodafone 8,924 1.36
226,620 Photo-Me International 125 0.02 9,228 1.41
1,944 0.30
Non-Life Insurance 1.55% (1.37%)
Life Insurance 3.11% (2.94%)
100,059 Admiral 2,325 0.35
1,368,443 Aviva 3,770 0.57 246,898 Beazley 1,016 0.16
106,842 Chesnara 300 0.05 910,514 Direct Line Insurance 2,511 0.38
2,185 Hansard Global 1 - 260,039 Hastings 500 0.08
929,555 Just 496 0.08 100,340 Hiscox 783 0.12
2,309,773 Legal & General 5,121 0.78 149,337 Lancashire 1,212 0.18
370,275 Phoenix 2,406 0.37 380,149 RSA Insurance 1,590 0.24
382,247 Prudential 4,682 0.71 95,393 Sabre Insurance 254 0.04
380,406 St James's Place 3,640 0.55 10,191 1.55
20,416 3.11
Oil & Gas Producers 8.15% (11.52%)
Media 3.95% (3.80%)
7,661,100 BP 23,726 3.62
17,073 4imprint 420 0.06 556,421 Cairn Energy 648 0.10
Dimensional Fund Advisors Ltd. Interim Report and Financial Statements, 30 June 2020 129

United Kingdom Core Equity Fund
Portfolio Statement (continued)as at 30 June 2020
Holding Investment
Fair
Value
£'000
Percentage
of total
net assets
% Holding Investment
Fair
Value
£'000
Percentage
of total
net assets
%
Oil & Gas Producers (continued) Real Estate Investment & Services (continued)
8,270 Diversified Gas & Oil 8 - 136,238 Great Portland Estates 876 0.13
29,215 Energean 181 0.03 387,097 Hammerson 318 0.05
2,006,298 EnQuest 279 0.04 101,830 Helical 322 0.05
114,127 Genel Energy 146 0.02 450,423 Intu Properties* 8 -
201,463 Gulf Keystone Petroleum 180 0.03 278,154 Land Securities 1,543 0.24
243,333 Hurricane Energy 14 - 485,309 LondonMetric Property 1,024 0.16
5,012 IGas Energy 1 - 40,874 LSL Property Services 84 0.01
36,236 Parkmead 12 - 26,686 McKay Securities 48 0.01
189,748 Pharos Energy 32 0.01 201,942 NewRiver REIT 129 0.02
1,811,330 Premier Oil 883 0.13 515,931 Primary Health Properties 821 0.13
212,504 Rockhopper Exploration 17 - 147,224 Raven Property 49 0.01
976,463 Royal Dutch Shell 'A' 12,762 1.95 175,269 RDI REIT 142 0.02
1,130,893 Royal Dutch Shell 'B' 14,066 2.15 222,046 Regional REIT 161 0.02
281,528 Savannah Energy 20 - 121,443 Safestore 886 0.14
1,458,715 Tullow Oil 452 0.07 90,985 Savills 756 0.12
53,427 8.15 330,768 Schroder Real Estate Investment Trust 100 0.01
53,451 Secure Income REIT 145 0.02
Oil Equipment, Services & Distribution 0.25% (0.39%) 455,733 Segro 4,097 0.62
117,369 Shaftesbury 633 0.10
113,666 Hunting 240 0.04 186,169 St Modwen Properties 635 0.10
476,108 John Wood 938 0.14 251,372 Standard Life Investment Property
168,940 Lamprell 34 0.01 Income Trust 153 0.02
227,224 Petrofac 400 0.06 64,663 Target Healthcare REIT 71 0.01
1,612 0.25 821,561 Tritax Big Box REIT 1,198 0.18
164,179 U & I 124 0.02
Personal Goods 0.62% (0.57%) 139,811 UNITE 1,325 0.20
91,007 Urban & Civic 209 0.03
227,649 Burberry 3,647 0.56 64,280 Workspace 430 0.07
158,092 PZ Cussons 294 0.04 24,245 3.70
49,818 Superdry 72 0.01
57,594 Ted Baker 49 0.01 Software & Computer Services 1.36% (1.17%)
4,062 0.62
232,707 Avast 1,218 0.19
Pharmaceuticals & Biotechnology 8.44% (6.63%) 18,945 AVEVA 773 0.12
39,772 Computacenter 648 0.10
9,934 4d pharma 4 - 38,278 EMIS 406 0.06
20,230 Abcam 273 0.04 51,819 FDM 483 0.07
196,551 Alliance Pharma 147 0.02 2,528 First Derivatives 64 0.01
336,344 AstraZeneca 28,408 4.33 44,203 IDOX 21 -
109,957 Circassia 26 0.01 50,560 iomart 180 0.03
35,546 Clinigen 280 0.04 46,999 Kainos 349 0.05
9,205 Dechra Pharmaceuticals 261 0.04 7,480 Learning Technologies 9 -
11,800 Genus 413 0.06 141,888 Micro Focus International 625 0.10
1,377,758 GlaxoSmithKline 22,645 3.45 169,535 NCC 309 0.05
75,447 Hikma Pharmaceuticals 1,661 0.26 9,295 Redcentric 11 -
62,142 Horizon Discovery 61 0.01 32,637 RM 77 0.01
698,762 Indivior 577 0.09 381,785 Sage 2,576 0.39
26,867 PureTech Health 76 0.01 51,716 SDL 254 0.04
535,514 Vectura 505 0.08 83,636 Softcat 908 0.14
55,337 8.44 8,911 1.36
Real Estate Investment & Services 3.70% (4.10%) Support Services 9.40% (8.88%)
1,464,076 Assura 1,167 0.18 409,298 AA 93 0.01
78,632 Big Yellow 803 0.12 252,255 Aggreko 1,113 0.17
454,160 British Land 1,763 0.27 274,788 Ashtead 7,433 1.13
375,603 Capital & Counties Properties 559 0.09 462,751 Babcock International 1,461 0.22
19,569 Capital & Regional 18 - 41,570 Begbies Traynor 41 0.01
83,143 CLS 160 0.02 196,302 Biffa 399 0.06
182,353 Custodian Reit 162 0.02 112,497 Bunzl 2,434 0.37
54,530 Derwent London 1,559 0.24 1,026,899 Capita 464 0.07
64,320 Ediston Property Investment 35 0.01 51,267 Carillion* - -
343,497 Empiric Student Property 197 0.03 49,038 Clipper Logistics 145 0.02
171,894 Foxtons 66 0.01 35,089 DCC 2,354 0.36
206,549 GCP Student Living 258 0.04 57,645 De La Rue 77 0.01
422,039 Grainger 1,211 0.18 25,219 De La Rue New Shares - -
Dimensional Fund Advisors Ltd. Interim Report and Financial Statements, 30 June 2020 130

United Kingdom Core Equity Fund
Portfolio Statement (continued)as at 30 June 2020
Holding Investment
Fair
Value
£'000
Percentage
of total
net assets
% Holding Investment
Fair
Value
£'000
Percentage
of total
net assets
%
Support Services (continued) Travel & Leisure (continued)
58,666 Diploma 1,051 0.16 129,186 Gym 197 0.03
329,913 Electrocomponents 2,194 0.33 120,513 Hollywood Bowl 179 0.03
298,023 Equiniti 436 0.07 20,631 Hostelworld 13 -
169,745 Essentra 498 0.08 66,497 InterContinental Hotels 2,414 0.37
324,026 Experian 9,173 1.40 430,997 International Consolidated Airlines 981 0.15
106,342 Ferguson 7,036 1.07 53,570 J D Wetherspoon 543 0.08
1,099,886 G4S 1,260 0.19 577,063 Marston's 312 0.05
142,612 Grafton 953 0.15 153,589 Mitchells & Butlers 287 0.04
1,080,117 Hays 1,317 0.20 380,072 National Express 738 0.11
153,800 HomeServe 1,982 0.30 73,202 On the Beach 215 0.03
450,768 Howden Joinery 2,521 0.38 248,930 Playtech 713 0.11
85,765 Interserve* - - 4,900 PPHE Hotel 51 0.01
75,496 Intertek 4,087 0.62 163,996 Rank 248 0.04
607,901 IWG 1,630 0.25 232,730 Restaurant 135 0.02
80,989 John Menzies 98 0.02 312,583 SSP 806 0.12
295,337 Johnson Service 341 0.05 240,936 Stagecoach 148 0.02
116,591 Kin & Carta 73 0.01 2,797 TEN Entertainment 4 -
100,777 Mears 155 0.02 177,204 TUI 675 0.10
24,840 Midwich 98 0.02 84,664 Whitbread 1,879 0.29
281,777 Mitie 246 0.04 751,485 William Hill 887 0.14
250,734 Pagegroup 957 0.15 512 Wizz Air 17 -
49,385 PayPoint 306 0.05 2,526 Young & Co's Brewery 'A' 26 0.01
275,230 Redde Northgate 473 0.07 25,166 3.84
44,196 Renew 197 0.03
813,712 Renewi 208 0.03 Portfolio of investments 100.34% (99.75%) 658,045 100.34
818,147 Rentokil Initial 4,184 0.64 Net other assets (2,261) (0.34)
29,987 Ricardo 116 0.02 Net assets 655,784 100.00
52,152 Robert Walters 209 0.03
173,277 RPS 79 0.01 Comparative figures shown in brackets next to each country heading relate to 31 December 2019.
3,718 RWS 22 -
389,092 Serco 595 0.09
385,055 SIG 117 0.02 * Delisted and unquoted securities are held at the ACD's valuation.
96,263 SIG New Shares - -
27,336 Smart Metering Systems 157 0.02
550,843 Speedy Hire 310 0.05
100,394 SThree 265 0.04
199,546 Travis Perkins 2,260 0.35
5,110 Vp 36 0.01
61,654 9.40
Technology Hardware & Equipment 0.10% (0.09%)
277,336 Spirent Communications 667 0.10
6,334 Telit Communications 7 -
674 0.10
Tobacco 3.34% (3.33%)
411,829 British American Tobacco 12,896 1.97
578,468 Imperial Brands 9,004 1.37
21,900 3.34
Travel & Leisure 3.84% (5.20%)
228,444 888 399 0.06
39,500 Carnival 386 0.06
756,101 Cineworld 452 0.07
535,454 Compass 6,016 0.92
48,925 Dart 414 0.06
306,698 Domino's Pizza 954 0.15
172,227 easyJet 1,201 0.18
1,256,711 Firstgroup 636 0.10
23,715 Fuller Smith & Turner 174 0.03
48,250 Gamesys 418 0.06
46,683 Go-Ahead 394 0.06
299,841 GVC 2,254 0.34
Securities are admitted to an official stock exchange listing or traded on another regulated market unless otherwise
stated, if any.
Dimensional Fund Advisors Ltd. Interim Report and Financial Statements, 30 June 2020 131

United Kingdom Small Companies Fund
Portfolio Statementas at 30 June 2020
Holding Investment
Fair
Value
£'000
Percentage
of total
net assets
% Holding Investment
Fair
Value
£'000
Percentage
of total
net assets
%
Aerospace & Defence 3.25% (3.74%) Electronic & Electrical Equipment 2.91% (2.64%)
50,898 Avon Rubber 1,614 0.46 31,328 Dialight 101 0.03
456,238 Chemring 1,095 0.31 130,475 DiscoverIE 655 0.19
1,060,709 Meggitt 3,149 0.89 916 Gooch & Housego 10 -
861,908 QinetiQ 2,612 0.74 88,619 Luceco 83 0.02
659,562 Senior 457 0.13 466,871 Morgan Advanced Materials 1,125 0.32
126,603 Ultra Electronics 2,557 0.72 86,088 Oxford Instruments 1,214 0.34
11,484 3.25 17,329 Renishaw 679 0.19
185,425 Spectris 4,715 1.33
Automobiles & Parts 0.05% (0.00%) 54,654 Strix 103 0.03
262,386 TT Electronics 447 0.13
99,812 TI Fluid Systems 186 0.05 135,657 Volex 201 0.06
186 0.05 111,356 Xaar 61 0.02
26,006 XP Power 900 0.25
Banks 0.88% (0.76%) 10,294 2.91
71,621 Bank of Georgia 766 0.22 Financial Services 11.34% (9.84%)
394,249 Investec 641 0.18
5,877 Metro Bank 6 - 6,692 AJ Bell 26 0.01
45,221 TBC Bank 403 0.11 137,542 Allied Minds 42 0.01
1,416,110 Virgin Money 1,310 0.37 283,814 Arrow Global 243 0.07
3,126 0.88 697,660 Ashmore 2,897 0.82
619,614 Brewin Dolphin 1,592 0.45
Beverages 2.41% (1.71%) 284,925 Burford Capital 1,318 0.37
20,923 Charles Stanley 54 0.02
201,067 AG Barr 922 0.26 267,383 Close Brothers 2,979 0.84
418,190 Britvic 3,253 0.92 210,204 CMC Markets 559 0.16
433,651 C&C 995 0.28 10,362 Georgia Capital 47 0.01
115,754 Fevertree Drinks 2,413 0.68 12,055 H&T 39 0.01
16,272 Nichols 212 0.06 560,345 IG 4,539 1.28
306,863 Stock Spirits 726 0.21 2,474 Impax Asset Management 8 -
8,521 2.41 9,855 IntegraFin 46 0.01
70,243 Intermediate Capital 918 0.26
Chemicals 1.57% (1.46%) 374,185 International Personal Finance 205 0.06
1,449,995 IP 948 0.27
986,634 Elementis 625 0.18 758,425 John Laing 2,667 0.75
231,447 Scapa 227 0.06 774,127 Jupiter Fund Management 1,989 0.56
546,145 Synthomer 1,511 0.43 44,150 Liontrust Asset Management 585 0.17
1,169 Treatt 6 - 2,582,072 Man 3,398 0.96
159,283 Victrex 3,125 0.88 7,162 Mortgage Advice Bureau 42 0.01
21,420 Zotefoams 73 0.02 39,738 Non-Standard Finance 3 -
5,567 1.57 88,815 Numis 276 0.08
288,647 OneSavings Bank 770 0.22
Construction & Materials 3.47% (3.02%) 479,831 Paragon Banking 1,709 0.48
183,569 Plus500 2,415 0.68
1,138,299 Balfour Beatty 2,998 0.85 70,276 Polar Capital 345 0.10
289,006 Costain 207 0.06 30,557 Premier Miton 31 0.01
19,908 Epwin 13 - 362,935 Provident Financial 645 0.18
332,092 Forterra 674 0.19 47,029 PureTech Health 133 0.04
141,400 Henry Boot 348 0.10 2,795,303 Quilter 3,874 1.10
739,107 Ibstock 1,349 0.38 84,211 Rathbone Brothers 1,213 0.34
29,191 James Halstead 149 0.04 5,133 S&U 85 0.02
125,190 Keller 800 0.23 993,133 TP ICAP 3,500 0.99
253,411 Kier 250 0.07 40,140 11.34
334,687 Marshalls 2,085 0.59
68,102 Morgan Sindall 853 0.24 Fixed Line Telecommunications 0.66% (0.58%)
77,694 Norcros 121 0.03
369,681 Polypipe 1,639 0.46 1,122,270 TalkTalk Telecom 954 0.27
24,050 TClarke 23 0.01 98,713 Telecom Plus 1,392 0.39
256,060 Tyman 491 0.14 2,346 0.66
165,941 Volution 297 0.08
12,297 3.47 Food & Drug Retailers 0.74% (0.76%)
Electricity 0.51% (0.42%) 161,564 Greggs 2,622 0.74
19,625 McColl's Retail 8 -
21,846 ContourGlobal 42 0.01 2,630 0.74
668,579 Drax 1,766 0.50
1,808 0.51
Dimensional Fund Advisors Ltd. Interim Report and Financial Statements, 30 June 2019 132

United Kingdom Small Companies Fund
Portfolio Statement (continued)as at 30 June 2020
Holding Investment
Fair
Value
£'000
Percentage
of total
net assets
% Holding Investment
Fair
Value
£'000
Percentage
of total
net assets
%
Food Producers 3.16% (2.66%) Household Goods & Home Construction 3.05% (4.41%)
29,802 Anglo-Eastern Plantations 143 0.04 36,115 Bellway 927 0.26
64,959 Bakkavor 46 0.01 720,176 Countryside Properties 2,374 0.67
48,371 Carr's 52 0.02 487,598 Crest Nicholson 990 0.28
80,296 Cranswick 2,879 0.81 209,158 Galliford Try 249 0.07
269,751 Devro 409 0.12 136,764 Headlam 373 0.11
883,327 Greencore 1,131 0.32 451,409 McBride 278 0.08
64,791 Hilton Food 810 0.23 662,696 McCarthy & Stone 477 0.13
2,518 MP Evans 13 - 61,354 MJ Gleeson 407 0.12
1,407,658 Premier Foods 994 0.28 420,517 Redrow 1,858 0.52
697,592 Tate & Lyle 4,706 1.33 359,892 Vistry 2,575 0.73
11,183 3.16 187,941 Watkin Jones 285 0.08
10,793 3.05
Gas, Water & Multiutilities 0.89% (1.30%)
Industrial Engineering 4.97% (4.14%)
4,655,610 Centrica 1,805 0.51
120,871 Pennon 1,359 0.38 313,014 Bodycote 1,967 0.56
3,164 0.89 43,631 Castings 161 0.05
13,365 Flowtech Fluidpower 10 -
General Industrials 0.54% (0.46%) 932 Goodwin 28 0.01
137,516 Hill & Smith 1,700 0.48
701,749 Coats 394 0.11 426,277 IMI 3,966 1.12
41,596 Macfarlane 29 0.01 11,897 Porvair 67 0.02
381,427 Vesuvius 1,498 0.42 36,237 Rhi Magnesita 892 0.25
1,921 0.54 1,411,207 Rotork 3,960 1.12
367,150 Severfield 222 0.06
General Retailers 7.13% (7.52%) 156,019 Trifast 178 0.05
52,705 Vitec 369 0.10
42,113 ASOS 1,410 0.40 382,138 Weir 4,085 1.15
915,315 B&M European Value Retail 3,609 1.02 17,605 4.97
374,782 boohoo 1,513 0.43
505,624 Card Factory 253 0.07 Industrial Metals & Mining 0.24% (0.15%)
98,668 CVS 995 0.28
1,851,799 Debenhams* - - 121,785 BlueJay Mining 7 -
318,729 DFS Furniture 524 0.15 515,868 Ferrexpo 859 0.24
87,141 Dignity 214 0.06 866 0.24
1,883,391 Dixons Carphone 1,680 0.47
142,279 Dunelm 1,683 0.48 Industrial Transportation 2.39% (2.26%)
385,163 Frasers 1,170 0.33
377,890 Halfords 583 0.17 31,567 Braemar Shipping Services 37 0.01
675,410 Inchcape 3,284 0.93 48,967 Clarkson 1,099 0.31
42,559 Joules 47 0.01 76,540 James Fisher & Sons 1,016 0.29
533,394 Lookers 101 0.03 1,497,327 Royal Mail 2,732 0.77
2,652,819 Marks & Spencer 2,677 0.76 1,267,600 Signature Aviation 2,985 0.84
49,690 Motorpoint 122 0.03 500,324 Stobart 191 0.06
240,785 N Brown 84 0.02 209,061 Wincanton 386 0.11
50,586 Naked Wines 217 0.06 8,446 2.39
2,012,136 Pendragon 181 0.05
851,576 Pets at Home 2,039 0.58 Leisure Goods 1.21% (0.70%)
1,707,088 Saga 290 0.08
3,799 ScS 5 - 10,547 Frontier Developments 194 0.05
69,789 Studio Retail 153 0.04 47,920 Games Workshop 3,829 1.08
314,503 Topps Tiles 139 0.04 488,884 Photo-Me International 269 0.08
584,499 Vertu Motors 146 0.04 4,292 1.21
144,704 Vivo Energy 116 0.03
185,016 WH Smith 2,026 0.57 Life Insurance 0.44% (0.71%)
25,261 7.13
228,759 Chesnara 643 0.18
Health Care Equipment & Services 1.51% (2.12%) 20,383 Hansard Global 6 -
1,673,017 Just 894 0.26
89,485 Advanced Medical Solutions 206 0.06 1,543 0.44
85,328 CareTech 369 0.10
78,831 Integrated Diagnostics 238 0.07 Media 2.80% (2.61%)
655,963 Mediclinic International 1,751 0.49
478,254 Spire Healthcare 411 0.12 37,227 4imprint 916 0.26
329,305 UDG Healthcare 2,366 0.67 540,098 Ascential 1,567 0.44
5,341 1.51 119,561 Bloomsbury Publishing 243 0.07
Dimensional Fund Advisors Ltd. Interim Report and Financial Statements, 30 June 2019 133

United Kingdom Small Companies Fund
Portfolio Statement (continued)as at 30 June 2020
Holding Investment
Fair
Value
£'000
Percentage
of total
net assets
% Holding Investment
Fair
Value
£'000
Percentage
of total
net assets
%
Media (continued) Personal Goods 0.29% (0.32%)
93,220 Centaur Media 21 0.01 453,031 PZ Cussons 843 0.24
248,213 Daily Mail & General Trust 1,698 0.48 79,317 Superdry 115 0.03
161,632 Euromoney Institutional Investor 1,329 0.38 70,155 Ted Baker 59 0.02
4,501 Future 58 0.02 1,017 0.29
495,860 GoCo 473 0.13
356,649 Hyve 358 0.10 Pharmaceuticals & Biotechnology 1.21% (0.61%)
19,918 M&C Saatchi 10 -
818,861 Moneysupermarket.com 2,637 0.75 131,418 Alizyme* - -
43,068 Next Fifteen Communications 153 0.04 614,456 Alliance Pharma 460 0.13
495,755 Reach 387 0.11 225,080 Circassia 54 0.01
2,452 STV 5 - 99,442 Clinigen 782 0.22
39,597 Wilmington 49 0.01 25,991 Genus 910 0.26
9,904 2.80 197,295 Horizon Discovery 193 0.05
1,022,919 Indivior 845 0.24
Mining 2.65% (1.63%) 1,119,566 Vectura 1,056 0.30
4,300 1.21
271,044 Anglo Pacific 364 0.10
1,924,819 Centamin 3,401 0.96 Real Estate Investment & Services 12.01% (12.20%)
231,784 Central Asia Metals 332 0.09
170,044 Gem Diamonds 46 0.01 4,042,021 Assura 3,221 0.91
552,429 Highland Gold Mining 1,257 0.36 239,384 Big Yellow 2,444 0.69
469,224 Hochschild Mining 902 0.26 1,117,931 Capital & Counties Properties 1,662 0.47
430,248 KAZ Minerals 2,104 0.59 64,201 Capital & Regional 58 0.02
889,691 Petra Diamonds 16 0.01 268,482 CLS 518 0.15
3,513,078 Petropavlovsk 901 0.25 475,275 Custodian Reit 422 0.12
323,502 SolGold 68 0.02 29,346 Derwent London 839 0.24
30,508 International Ferro Metals* - - 1,008,677 Empiric Student Property 579 0.16
9,391 2.65 489,985 Foxtons 189 0.05
411,432 GCP Student Living 514 0.15
Mobile Telecommunications 0.09% (0.06%) 1,119,232 Grainger 3,212 0.91
405,000 Great Portland Estates 2,606 0.74
24,256 Gamma Communications 303 0.09 961,627 Hammerson 791 0.22
303 0.09 191,032 Helical 604 0.17
952,085 Intu Properties* 17 -
Non-Life Insurance 3.14% (2.13%) 1,407,528 LondonMetric Property 2,970 0.84
158,896 LSL Property Services 326 0.09
943,512 Beazley 3,883 1.10 79,844 McKay Securities 143 0.04
552,812 Hastings 1,062 0.30 485,436 NewRiver REIT 311 0.09
405,126 Hiscox 3,161 0.89 1,552,017 Primary Health Properties 2,471 0.70
341,093 Lancashire 2,768 0.78 80,189 Purplebricks 34 0.01
89,906 Sabre Insurance 239 0.07 226,946 Raven Property 76 0.02
11,113 3.14 483,899 RDI REIT 391 0.11
601,894 Regional REIT 436 0.12
Oil & Gas Producers 1.23% (1.52%) 376,421 Safestore 2,746 0.78
221,738 Savills 1,842 0.52
1,127,316 Cairn Energy 1,313 0.37 902,147 Schroder Real Estate Investment Trust 272 0.08
479,366 Diversified Gas & Oil 458 0.13 115,610 Secure Income REIT 314 0.09
2,816,862 EnQuest 391 0.11 366,271 Shaftesbury 1,974 0.56
195,145 Genel Energy 249 0.07 338,202 St Modwen Properties 1,153 0.33
349,592 Gulf Keystone Petroleum 312 0.09 653,410 Standard Life Investment Property
436,941 Hurricane Energy 26 0.01 Income Trust 398 0.11
3,937 IGas Energy 1 - 142,577 Target Healthcare REIT 157 0.04
50,026 Parkmead 16 - 2,520,158 Tritax Big Box REIT 3,674 1.04
328,007 Pharos Energy 56 0.02 240,337 U & I 181 0.05
1,512,749 Premier Oil 737 0.21 341,388 UNITE 3,235 0.91
108,937 Rockhopper Exploration 9 - 220,035 Urban & Civic 506 0.14
1,149,971 Savannah Energy 81 0.02 181,554 Workspace 1,216 0.34
2,237,510 Tullow Oil 694 0.20 42,502 12.01
4,343 1.23
Software & Computer Services 2.58% (2.10%)
Oil Equipment, Services & Distribution 0.91% (1.34%)
110,038 Computacenter 1,794 0.51
224,857 Hunting 475 0.14 70,079 EMIS 743 0.21
990,534 John Wood 1,951 0.55 91,177 FDM 849 0.24
359,596 Lamprell 71 0.02 4,034 First Derivatives 101 0.03
403,486 Petrofac 711 0.20 73,212 iomart 261 0.07
3,208 0.91
Dimensional Fund Advisors Ltd. Interim Report and Financial Statements, 30 June 2019 134

United Kingdom Small Companies Fund
Portfolio Statement (continued)as at 30 June 2020
Holding Investment
Fair
Value
£'000
Percentage
of total
net assets
% Holding Investment
Fair
Value
£'000
Percentage
of total
net assets
%
Software & Computer Services (continued) Travel & Leisure 6.24% (8.05%)
108,402 Kainos 805 0.23 465,201 888 813 0.23
229,769 Micro Focus International 1,013 0.28 36,442 Air Partner 30 0.01
402,679 NCC 733 0.21 1,439,451 Cineworld 861 0.24
88,520 RM 207 0.06 137,408 Dart 1,164 0.33
137,017 SDL 673 0.19 801,099 Domino's Pizza 2,493 0.70
181,070 Softcat 1,966 0.55 149,503 easyJet 1,043 0.29
9,145 2.58 2,115,712 Firstgroup 1,071 0.30
42,805 Fuller Smith & Turner 313 0.09
Support Services 12.71% (14.72%) 101,736 Gamesys 881 0.25
81,626 Go-Ahead 688 0.19
907,185 AA 206 0.06 239,987 Gym 366 0.10
424,090 Aggreko 1,871 0.53 99,878 Hollywood Bowl 148 0.04
841,901 Babcock International 2,658 0.75 88,476 Hostelworld 57 0.02
100,571 Begbies Traynor 99 0.03 133,332 J D Wetherspoon 1,351 0.38
364,711 Biffa 740 0.21 1,079,821 Marston's 584 0.17
1,934,931 Capita 875 0.25 348,518 Mitchells & Butlers 650 0.18
525,814 Carillion* - - 854,719 National Express 1,661 0.47
58,545 Clipper Logistics 174 0.05 198,967 On the Beach 585 0.17
160,060 De La Rue 215 0.06 510,249 Playtech 1,462 0.41
70,026 De La Rue New Shares - - 17,533 PPHE Hotel 184 0.05
174,977 Diploma 3,136 0.88 305,081 Rank 461 0.13
724,796 Electrocomponents 4,820 1.36 141,056 Restaurant 82 0.02
676,631 Equiniti 989 0.28 103,101 Sportech 19 0.01
440,354 Essentra 1,292 0.36 693,865 SSP 1,789 0.51
2,521,711 G4S 2,889 0.82 696,371 Stagecoach 427 0.12
393,885 Grafton 2,633 0.74 7,352 TEN Entertainment 12 -
2,364,562 Hays 2,882 0.81 98,129 TUI 374 0.11
75,933 HomeServe 979 0.28 1,472,810 William Hill 1,739 0.49
468,828 Howden Joinery 2,622 0.74 16,676 Wizz Air 552 0.16
146,059 Interserve* - - 23,171 Young & Co's Brewery 'A' 237 0.07
1,066,852 IWG 2,861 0.81 22,097 6.24
129,221 John Menzies 156 0.04
359,563 Johnson Service 415 0.12 Portfolio of investments 99.81% (99.14%) 353,320 99.81
269,818 Kin & Carta 170 0.05 Net other assets 682 0.19
186,669 Mears 287 0.08 Net assets 354,002 100.00
4,272 Midwich 17 -
576,290 Mitie 502 0.14 Comparative figures shown in brackets next to each country heading relate to 31 December 2019.
507,919 Pagegroup 1,939 0.55
106,776 PayPoint 662 0.19
286,874 Redde Northgate 493 0.14 * Delisted and unquoted securities are held at the ACD's valuation.
24,209 Renew 108 0.03
1,408,192 Renewi 360 0.10
78,808 Ricardo 305 0.09
86,401 Robert Walters 346 0.10
380,349 RPS 173 0.05
13,768 RWS 81 0.02
28,387 Sanne 181 0.05
88,900 Serco 136 0.04
998,013 SIG 302 0.09
249,503 SIG New Shares - -
96,807 Smart Metering Systems 557 0.16
856,423 Speedy Hire 481 0.14
199,706 SThree 527 0.15
410,652 Travis Perkins 4,651 1.31
22,984 Vp 164 0.05
44,954 12.71
Technology Hardware & Equipment 0.63% (0.49%)
40,860 IQE 21 0.01
887,665 Spirent Communications 2,135 0.60
65,655 Telit Communications 73 0.02
2,229 0.63
Securities are admitted to an official stock exchange listing or traded on another regulated market unless otherwise
stated, if any.
Dimensional Fund Advisors Ltd. Interim Report and Financial Statements, 30 June 2019 135

United Kingdom Value Fund
Portfolio Statementas at 30 June 2020
Holding Investment
Fair
Value
£'000
Percentage
of total
net assets
% Holding Investment
Fair
Value
£'000
Percentage
of total
net assets
%
Aerospace & Defence 0.99% (1.66%) Financial Services (continued)
54,151 BAE Systems 264 0.06 11,375 Georgia Capital 52 0.01
301,753 Chemring 724 0.15 28,807 H&T 93 0.02
690,973 Meggitt 2,052 0.43 7,847 Intermediate Capital 103 0.02
383,012 QinetiQ 1,161 0.24 272,787 International Personal Finance 149 0.03
302,941 Senior 210 0.04 745,045 Investec 1,212 0.25
16,992 Ultra Electronics 343 0.07 53,695 IP 35 0.01
4,754 0.99 293,550 John Laing 1,032 0.22
95,464 Jupiter Fund Management 245 0.05
Banks 14.64% (17.67%) 984,289 M&G 1,673 0.35
1,293,558 Man 1,702 0.35
42,411 Bank of Georgia 454 0.10 1,699,856 Melrose Industries 1,972 0.41
11,158,328 Barclays 12,816 2.67 372,522 Ninety One 776 0.16
128,115 Close Brothers 1,427 0.30 129,963 OneSavings Bank 347 0.07
6,609,726 HSBC 25,048 5.21 309,394 Paragon Banking 1,102 0.23
58,555,741 Lloyds Banking 18,287 3.80 96,765 Provident Financial 172 0.04
3,837,638 Royal Bank of Scotland 4,672 0.97 871 Rathbone Brothers 13 -
1,581,078 Standard Chartered 6,841 1.42 43,525 Schroders 1,294 0.27
873,247 Virgin Money 808 0.17 1,574,486 Standard Life Aberdeen 4,338 0.90
70,353 14.64 666,479 TP ICAP 2,349 0.49
24,476 5.09
Beverages 0.16% (0.06%)
Fixed Line Telecommunications 1.83% (1.83%)
16,939 Coca-Cola 346 0.07
177,994 Stock Spirits 421 0.09 7,637,425 BT 8,806 1.83
767 0.16 8,806 1.83
Chemicals 0.55% (0.11%) Food & Drug Retailers 5.61% (5.42%)
381,937 Elementis 242 0.05 1,939,289 J Sainsbury 4,117 0.86
112,582 Johnson Matthey 2,385 0.50 13,905 McColl's Retail 6 -
2,627 0.55 7,827,633 Tesco 18,144 3.77
2,449,596 Wm Morrison Supermarkets 4,691 0.98
Construction & Materials 0.85% (0.78%) 26,958 5.61
577,149 Balfour Beatty 1,520 0.32 Food Producers 1.18% (1.05%)
158,379 Costain 113 0.02
103,604 Henry Boot 255 0.05 13,349 Anglo-Eastern Plantations 64 0.01
204,550 Ibstock 373 0.08 199,943 Associated British Foods 3,827 0.80
87,911 Keller 562 0.12 24,512 Carr's 26 -
149,147 Kier 147 0.03 118,526 Devro 180 0.04
37,153 Morgan Sindall 465 0.10 819,673 Premier Foods 579 0.12
17,876 Norcros 28 - 150,937 Tate & Lyle 1,018 0.21
42,856 Polypipe 190 0.04 5,694 1.18
150,292 Tyman 288 0.06
74,356 Volution 133 0.03 Forestry & Paper 0.93% (0.00%)
4,074 0.85
294,436 Mondi 4,456 0.93
Electricity 0.27% (0.23%) 4,456 0.93
495,158 Drax 1,308 0.27 Gas, Water & Multiutilities 0.22% (0.40%)
1,308 0.27
2,698,943 Centrica 1,047 0.22
Electronic & Electrical Equipment 0.38% (0.08%) 1,047 0.22
16,735 DiscoverIE 84 0.02 General Industrials 1.34% (0.68%)
56,850 Spectris 1,446 0.30
157,833 TT Electronics 269 0.05 1,018,359 DS Smith 3,392 0.71
55,456 Xaar 30 0.01 158,233 Smiths 2,211 0.46
1,829 0.38 209,347 Vesuvius 823 0.17
6,426 1.34
Financial Services 5.09% (5.86%)
General Retailers 2.78% (3.11%)
629,221 3i 5,342 1.11
122,270 Arrow Global 105 0.02 1,375,762 Debenhams* - -
38,480 Burford Capital 178 0.04 162,570 DFS Furniture 267 0.05
72,073 CMC Markets 192 0.04 1,270,828 Dixons Carphone 1,134 0.24
Dimensional Fund Advisors Ltd. Interim Report and Financial Statements, 30 June 2020 136

United Kingdom Value Fund
Portfolio Statement (continued)as at 30 June 2020
Holding Investment
Fair
Value
£'000
Percentage
of total
net assets
% Holding Investment
Fair
Value
£'000
Percentage
of total
net assets
%
General Retailers (continued) Life Insurance (continued)
205,127 Frasers 623 0.13 840,245 Just 449 0.09
280,362 Halfords 433 0.09 4,919,508 Legal & General 10,907 2.27
351,471 Inchcape 1,709 0.36 597,027 Phoenix 3,879 0.81
2,340,685 Kingfisher 5,206 1.08 451,806 Prudential 5,535 1.15
392,123 Lookers 74 0.01 33,051 6.88
2,007,322 Marks & Spencer 2,025 0.42
184,809 N Brown 65 0.01 Media 3.30% (3.91%)
19,061 Naked Wines 82 0.02
1,699,423 Pendragon 153 0.03 31,682 Ascential 92 0.02
558,247 Pets at Home 1,336 0.28 65,496 Bloomsbury Publishing 133 0.03
1,099,567 Saga 187 0.04 29,681 Centaur Media 6 -
373,838 Vertu Motors 93 0.02 5,348 Daily Mail & General Trust 37 0.01
13,387 2.78 4,834 Euromoney Institutional Investor 40 0.01
529,007 Informa 2,492 0.52
Health Care Equipment & Services 0.44% (0.49%) 642,657 Pearson 3,722 0.77
375,988 Reach 293 0.06
43,078 CareTech 186 0.04 1,426,504 WPP 9,024 1.88
528,941 Mediclinic International 1,412 0.29 15,839 3.30
328,542 Spire Healthcare 282 0.06
34,623 UDG Healthcare 249 0.05 Mining 16.85% (11.23%)
2,129 0.44
874,113 Anglo American 16,260 3.38
Household Goods & Home Construction 5.51% (6.04%) 199,240 Anglo Pacific 267 0.06
425,026 Antofagasta 3,949 0.82
1,034,361 Barratt Developments 5,137 1.07 1,153,117 BHP 18,969 3.95
128,140 Bellway 3,288 0.68 1,298,937 Centamin 2,295 0.48
109,291 Berkeley 4,559 0.95 56,503 Central Asia Metals 81 0.02
292,182 Countryside Properties 963 0.20 113,757 Gem Diamonds 31 0.01
311,402 Crest Nicholson 632 0.13 9,717,215 Glencore 16,438 3.42
158,129 Galliford Try 188 0.04 303,406 Highland Gold Mining 691 0.14
65,116 Headlam 178 0.04 224,253 Hochschild Mining 431 0.09
419,523 McCarthy & Stone 302 0.06 37,124 KAZ Minerals 182 0.04
9,069 MJ Gleeson 60 0.01 98,924 Pan African Resources 17 -
180,793 Persimmon 4,169 0.87 1,017,280 Petra Diamonds 18 -
223,689 Redrow 988 0.21 2,446,150 Petropavlovsk 627 0.13
2,981,696 Taylor Wimpey 4,228 0.88 459,170 Rio Tinto 20,743 4.31
247,872 Vistry 1,774 0.37 80,999 16.85
26,466 5.51
Mobile Telecommunications 3.98% (3.73%)
Industrial Engineering 0.39% (0.44%)
14,918,066 Vodafone 19,152 3.98
100,978 Bodycote 635 0.13 19,152 3.98
24,060 Castings 88 0.02
9,622 Flowtech Fluidpower 7 - Non-Life Insurance 2.00% (1.84%)
188,012 Severfield 114 0.02
36,846 Trifast 42 0.01 222,569 Beazley 916 0.19
92,104 Weir 985 0.21 1,346,297 Direct Line Insurance 3,713 0.77
1,871 0.39 53,212 Hiscox 415 0.09
150,999 Lancashire 1,225 0.25
Industrial Metals & Mining 0.07% (0.06%) 805,616 RSA Insurance 3,370 0.70
9,639 2.00
212,693 Ferrexpo 354 0.07
354 0.07 Oil & Gas Producers 11.19% (13.43%)
Industrial Transportation 0.91% (0.91%) 7,095,609 BP 21,975 4.57
1,855,032 EnQuest 258 0.05
30,101 Clarkson 676 0.14 130,496 Genel Energy 166 0.03
1,150,272 Royal Mail 2,099 0.43 251,951 Gulf Keystone Petroleum 225 0.05
670,112 Signature Aviation 1,578 0.33 302,235 Pharos Energy 52 0.01
81,602 Stobart 31 0.01 1,081,492 Premier Oil 527 0.11
4,384 0.91 1,060,130 Royal Dutch Shell 'A' 13,856 2.88
1,316,691 Royal Dutch Shell 'B' 16,377 3.41
Life Insurance 6.88% (6.04%) 1,199,065 Tullow Oil 372 0.08
53,808 11.19
4,310,352 Aviva 11,875 2.47
144,629 Chesnara 406 0.09
Dimensional Fund Advisors Ltd. Interim Report and Financial Statements, 30 June 2020 137

United Kingdom Value Fund
Portfolio Statement (continued)as at 30 June 2020
Holding Investment
Fair
Value
£'000
Percentage
of total
net assets
% Holding Investment
Fair
Value
£'000
Percentage
of total
net assets
%
Oil Equipment, Services & Distribution 0.17% (0.27%) Travel & Leisure (continued)
121,683 Hunting 257 0.05 639,905 Cineworld 383 0.08
258,254 John Wood 509 0.11 22,825 Dart 193 0.04
191,294 Lamprell 38 0.01 144,131 easyJet 1,005 0.21
804 0.17 1,673,024 Firstgroup 847 0.18
9,409 Fuller Smith & Turner 69 0.01
Personal Goods 0.08% (0.10%) 380,554 GVC 2,860 0.60
37,925 Gym 58 0.01
159,362 PZ Cussons 297 0.06 17,423 Hostelworld 11 -
51,113 Superdry 74 0.02 553,705 International Consolidated Airlines 1,260 0.26
371 0.08 836,772 Marston's 453 0.09
260,725 Mitchells & Butlers 486 0.10
Pharmaceuticals & Biotechnology 0.07% (0.04%) 418,334 National Express 813 0.17
385,285 Playtech 1,104 0.23
130,474 Alliance Pharma 98 0.02 152,510 Rank 231 0.05
13,607 Clinigen 107 0.02 82,134 Sportech 15 -
132,406 Vectura 125 0.03 10,703 SSP 28 0.01
330 0.07 320,026 TUI 1,218 0.25
94,564 Whitbread 2,098 0.44
Real Estate Investment & Services 0.48% (0.44%) 2,580 Young & Co's Brewery 'A' 26 0.01
880 Young & Co's Brewery (Non-Voting) 7 -
246,637 Foxtons 95 0.02 14,294 2.98
315,887 Grainger 907 0.19
136,935 Helical 433 0.09 Portfolio of investments 100.26% (100.27%) 481,907 100.26
43,255 LSL Property Services 89 0.02 Net other assets (1,255) (0.26)
13,518 Savills 112 0.02 Net assets 480,652 100.00
178,693 St Modwen Properties 609 0.13
85,244 U & I 64 0.01 Comparative figures shown in brackets next to each country heading relate to 31 December 2019.
2,309 0.48
stated, if any.
Software & Computer Services 0.17% (0.33%)
181,470 Micro Focus International 800 0.16
6,404 SDL 31 0.01
831 0.17
Support Services 2.87% (2.96%)
288,117 Aggreko 1,271 0.26
661,221 Babcock International 2,087 0.43
159,652 Biffa 324 0.07
77,439 Carillion* - -
37,084 DCC 2,488 0.52
324,164 Equiniti 474 0.10
184,400 Essentra 541 0.11
207,733 Grafton 1,389 0.29
170,161 IWG 456 0.09
50,297 Kin & Carta 32 0.01
84,852 Mears 131 0.03
168,968 Redde Northgate 290 0.06
970,950 Renewi 248 0.05
681 Ricardo 3 -
265,009 RPS 121 0.03
514,257 SIG 156 0.03
128,564 SIG New Shares - -
428,631 Speedy Hire 241 0.05
312,192 Travis Perkins 3,535 0.74
13,787 2.87
Tobacco 5.10% (4.25%)
783,236 British American Tobacco 24,527 5.10
24,527 5.10
Travel & Leisure 2.98% (4.82%)
115,510 Carnival 1,129 0.24
Securities are admitted to an official stock exchange listing or traded on another regulated market unless otherwise
* Delisted and unquoted securities are held at the ACD's valuation.
Dimensional Fund Advisors Ltd. Interim Report and Financial Statements, 30 June 2020 138

Dimensional Funds ICVC
Statement of Total Return
(unaudited) for the periods ended 30 June 2020 & 2019
2020 2019 2020 2019 2020 2019 2020 2019 2020 2019 2020 2019 2020 2019
£'000 £'000 £'000 £'000 £'000 £'000 £'000 £'000 £'000 £'000 £'000 £'000 £'000 £'000
Income
Net capital gains/(losses) (104,311) 113,712 16,431 86,889 (44,859) 122,718 (78,752) 51,935 (163,138) 67,248 (113,181) 46,070 (169,802) 43,721
Revenue 18,336 18,208 16,681 20,560 11,984 13,262 6,573 9,029 10,358 17,111 2,852 7,929 7,193 15,922
Expenses (3,552) (4,487) (7,286) (7,048) (1,538) (1,535) (781) (991) (744) (852) (1,054) (1,274) (944) (1,202)
Interest payable and similar charges (6) (3) (66) (14) (2) (7) (1) (1) (1) - - - (2) -
Net revenue before taxation 14,778 13,718 9,329 13,498 10,444 11,720 5,791 8,037 9,613 16,259 1,798 6,655 6,247 14,720
Taxation (1,963) (1,610) - - (1,232) (1,516) (751) (1,046) (67) (130) (21) (27) (77) (150)
Net revenue after taxation 12,815 12,108 9,329 13,498 9,212 10,204 5,040 6,991 9,546 16,129 1,777 6,628 6,170 14,570
Total return before distributions (91,496) 125,820 25,760 100,387 (35,647) 132,922 (73,712) 58,926 (153,592) 83,377 (111,404) 52,698 (163,632) 58,291
Distributions (6,111) (5,945) (9,329) (13,499) (4,627) (4,877) (2,498) (3,477) (9,449) (15,185) (848) (6,464) (6,170) (13,658)
Change in net assets attributable to shareholders from investment activities (97,607) 119,875 16,431 86,888 (40,274) 128,045 (76,210) 55,449 (163,041) 68,192 (112,252) 46,234 (169,802) 44,633
Statement of Change in Net Assets Attributable to Shareholders
(unaudited) for the periods ended 30 June 2020 & 2019
2020 2019 2020 2019 2020 2019 2020 2019 2020 2019 2020 2019 2020 2019
£'000 £'000 £'000 £'000 £'000 £'000 £'000 £'000 £'000 £'000 £'000 £'000 £'000 £'000
Opening net assets attributable to shareholders 1,280,547 1,304,707 5,051,100 4,649,425 1,057,462 782,951 478,165 439,773 798,405 630,612 474,515 385,464 602,279 522,369
Amounts receivable on issue of shares 187,717 146,676 530,955 541,007 98,279 130,521 47,311 41,818 69,923 73,217 40,379 33,536 91,709 59,958
Amount payable on cancellation shares (102,056) (135,358) (702,892) (349,695) (96,780) (55,251) (52,122) (54,001) (54,207) (46,009) (49,159) (36,516) (47,635) (49,746)
85,661 11,318 (171,937) 191,312 1,499 75,270 (4,811) (12,183) 15,716 27,208 (8,780) (2,980) 44,074 10,212
Dilution levy - - - - - - - - 211 228 122 97 283 179
Change in net assets attributable to shareholders from investment activities (see above) (97,607) 119,875 16,431 86,888 (40,274) 128,045 (76,210) 55,449 (163,041) 68,192 (112,252) 46,234 (169,802) 44,633 Retained distribution on accumulation shares 3,165 2,736 4,888 7,522 1,637 1,913 1,437 1,900 4,493 6,859 397 3,265 3,818 7,724 Closing net assets attributable to shareholders 1,271,766 1,438,636 4,900,482 4,935,147 1,020,324 988,179 398,581 484,939 655,784 733,099 354,002 432,080 480,652 585,117
*The opening net assets attributable to shareholders for 2020 differs to the closing position in 2019 by the change in shareholders' net assets for the second half of the comparative financial year.
Global Short-Dated Bond Fund
International Core Equity Fund International Value Fund
United Kingdom Core Equity Fund
United Kingdom Small Companies Fund
United Kingdom Value Fund
United Kingdom Core Equity Fund
United Kingdom Small Companies Fund
United Kingdom Value Fund
Emerging Markets Core Equity Fund
Emerging Markets Core Equity Fund
Global Short-Dated Bond Fund
International Core Equity Fund International Value Fund
Dimensional Fund Advisors Ltd. Interim Report and Financial Statements, 30 June 2020 139

Dimensional Funds ICVC
Balance Sheet
as at 30 June 2020 & 31 December 2019
2020 2019 2020 2019 2020 2019 2020 2019 2020 2019 2020 2019 2020 2019
£'000 £'000 £'000 £'000 £'000 £'000 £'000 £'000 £'000 £'000 £'000 £'000 £'000 £'000
Assets
Fixed assets:
Investments 1,267,407 1,280,020 4,931,006 4,791,679 1,018,204 1,056,499 397,800 479,392 658,045 796,413 353,320 470,424 481,907 603,877
Current assets:
Debtors 7,534 4,418 52,859 20,144 3,793 3,808 1,464 1,148 2,898 5,001 1,874 2,070 2,695 2,736
Cash and bank balances 3,206 8,511 62,656 283,801 4,383 6,689 1,399 1,212 1,709 5,627 676 5,653 1,428 2,001
Total assets 1,278,147 1,292,949 5,046,521 5,095,624 1,026,380 1,066,996 400,663 481,752 662,652 807,041 355,870 478,147 486,030 608,614
Liabilities
Investment liabilities - - (93,337) (9,209) - - - - - - - - - -
Creditors:
Bank overdrafts (6) (44) - (17,317) - - - - - (150) - - - -
Distribution payable on income shares (3,453) (9,591) (4,243) (5,587) (2,923) (7,941) (1,086) (3,084) (5,121) (7,390) (433) (2,801) (2,754) (5,398)
Other creditors (2,922) (2,767) (48,459) (12,411) (3,133) (1,593) (996) (503) (1,747) (1,096) (1,435) (831) (2,624) (937)
Total liabilities (6,381) (12,402) (146,039) (44,524) (6,056) (9,534) (2,082) (3,587) (6,868) (8,636) (1,868) (3,632) (5,378) (6,335)
Net assets attributable to shareholders 1,271,766 1,280,547 4,900,482 5,051,100 1,020,324 1,057,462 398,581 478,165 655,784 798,405 354,002 474,515 480,652 602,279
Note to the Financial StatementsThe interim financial statements have been prepared in accordance with the historical cost convention, as modified by the revaluation of investments, and in accordance with the Statement of Recommended Practice for Financial Statements of UK Authorised Funds issued by The Investment Association in May 2014.
Emerging Markets Core Equity Fund
Global Short-Dated Bond Fund
International Core Equity Fund International Value Fund
United Kingdom Core Equity Fund
United Kingdom Small Companies Fund
United Kingdom Value Fund
Dimensional Fund Advisors Ltd. Interim Report and Financial Statements, 30 June 2020 140

Emerging Markets Core Equity Fund
Distribution Tables for the period ended 30 June 2020
Interim Distribution (in pence per share)
Group 1: Shares purchased prior to 1 January 2020
Group 2: Shares purchased on or after 1 January 2020
Income Shares
2020 2019
Net Distribution Distribution
Group Revenue Equalisation Payable Paid
1 17.7390 — 17.7390 15.5425
2 5.5178 12.2212 17.7390 15.5425
Accumulation Shares
2020 2019
Net Distribution Distribution
Group Revenue Equalisation Payable Paid
1 23.1510 — 23.1510 19.9042
2 6.8687 16.2823 23.1510 19.9042
Interim Distribution (in cents per share)
Group 1: Shares purchased prior to 1 January 2020
Group 2: Shares purchased on or after 1 January 2020
Euro Income Shares
2020 2019
Net Distribution Distribution
Group Revenue Equalisation Payable Paid
1 5.5110 — 5.5110 4.8512
2 — 5.5110 5.5110 4.8512
Euro Accumulation Shares
2020 2019
Net Distribution Distribution
Group Revenue Equalisation Payable Paid
1 6.0925 — 6.0925 5.2623
2 0.7271 5.3654 6.0925 5.2623
Dimensional Fund Advisors Ltd. Interim Report and Financial Statements, 30 June 2020 141

Global Short-Dated Bond Fund
Distribution Tables for the period ended 30 June 2020
Interim Distribution (in pence per share)
Group 1: Shares purchased prior to 1 January 2020
Group 2: Shares purchased on or after 1 January 2020
Income Shares
2020 2019
Net Distribution Distribution
Group Revenue Equalisation Payable Paid
1 2.2904 — 2.2904 3.4216
2 1.1755 1.1149 2.2904 3.4216
Accumulation Shares
2020 2019
Net Distribution Distribution
Group Revenue Equalisation Payable Paid
1 3.0103 — 3.0103 4.4754
2 1.6538 1.3565 3.0103 4.4754
Interim Distribution (in cents per share)
Group 1: Shares purchased prior to 1 January 2020
Group 2: Shares purchased on or after 1 January 2020
Gross Income Shares
2020 2019
Net Distribution Distribution
Group Revenue Equalisation Payable Paid
1 1.9756 — 1.9756 2.9517
2 0.9856 0.9900 1.9756 2.9517
Gross Accumulation Shares
2020 2019
Net Distribution Distribution
Group Revenue Equalisation Payable Paid
1 2.1747 — 2.1747 3.2325
2 1.2097 0.9650 2.1747 3.2325
Dimensional Fund Advisors Ltd. Interim Report and Financial Statements, 30 June 2020 142

International Core Equity Fund
Distribution Tablesfor the period ended 30 June 2020
Interim Distribution (in pence per share)
Group 1: Shares purchased prior to 1 January 2020
Group 2: Shares purchased on or after 1 January 2020
Income Shares
2020 2019
Net Distribution Distribution
Group Revenue Equalisation Payable Paid
1 9.9713 — 9.9713 11.8609
2 2.0419 7.9294 9.9713 11.8609
Accumulation Shares
2020 2019
Net Distribution Distribution
Group Revenue Equalisation Payable Paid
1 12.2119 — 12.2119 14.2848
2 1.6904 10.5215 12.2119 14.2848
Dimensional Fund Advisors Ltd. Interim Report and Financial Statements, 30 June 2020 143

International Value Fund
Distribution Tablesfor the period ended 30 June 2020
Interim Distribution (in pence per share)
Group 1: Shares purchased prior to 1 January 2020 Group 2: Shares purchased on or after 1 January 2020
Income Shares
2020 2019
Net Distribution Distribution
Group Revenue Equalisation Payable Paid
1 13.6685 — 13.6685 17.7783
2 0.4070 13.2615 13.6685 17.7783
Accumulation Shares
2020 2019
Net Distribution Distribution
Group Revenue Equalisation Payable Paid
1 17.8141 — 17.8141 22.6666
2 0.7351 17.0790 17.8141 22.6666
Dimensional Fund Advisors Ltd. Interim Report and Financial Statements, 30 June 2020 144

United Kingdom Core Equity Fund
Distribution Tables for the period ended 30 June 2020
Interim Distribution (in pence per share)
Group 1: Shares purchased prior to 1 January 2020
Group 2: Shares purchased on or after 1 January 2020
Income Shares
2020 2019
Net Distribution Distribution
Group Revenue Equalisation Payable Paid
1 18.2642 — 18.2642 31.6525
2 7.4161 10.8481 18.2642 31.6525
Accumulation Shares
2020 2019
Net Distribution Distribution
Group Revenue Equalisation Payable Paid
1 27.6894 — 27.6894 46.2274
2 11.2238 16.4656 27.6894 46.2274
Dimensional Fund Advisors Ltd. Interim Report and Financial Statements, 30 June 2020 145

United Kingdom Small Companies Fund
Distribution Tables for the period ended 30 June 2020
Interim Distribution (in pence per share)
Group 1: Shares purchased prior to 1 January 2020
Group 2: Shares purchased on or after 1 January 2020
Income Shares
2020 2019
Net Distribution Distribution
Group Revenue Equalisation Payable Paid
1 6.2460 — 6.2460 46.5230
2 — 6.2460 6.2460 46.5230
Accumulation Shares
2020 2019
Net Distribution Distribution
Group Revenue Equalisation Payable Paid
1 8.9300 — 8.9300 64.8175
2 — 8.9300 8.9300 64.8175
Dimensional Fund Advisors Ltd. Interim Report and Financial Statements, 30 June 2020 146

United Kingdom Value Fund
Distribution Tables for the period ended 30 June 2020
Interim Distribution (in pence per share)
Group 1: Shares purchased prior to 1 January 2020 Group 2: Shares purchased on or after 1 January 2020
Income Shares
2020 2019
Net Distribution Distribution
Group Revenue Equalisation Payable Paid
1 16.1195 — 16.1195 37.8074
2 5.9725 10.1470 16.1195 37.8074
Accumulation Shares
2020 2019
Net Distribution Distribution
Group Revenue Equalisation Payable Paid
1 25.8344 — 25.8344 57.9866
2 10.5827 15.2517 25.8344 57.9866
Dimensional Fund Advisors Ltd. Interim Report and Financial Statements, 30 June 2020 147

Emerging Markets Core Equity Fund
Global Short-Dated Bond
Fund
International Core Equity
FundInternational
Value Fund
United Kingdom
Core Equity Fund
United Kingdom
Small Companies
Fund
United Kingdom
Value Fund
£’000 £’000 £’000 £’000 £’000 £’000 £’000
Total lendable assets 859,582 3,822,279 1,011,999 394,369 651,963 351,791 479,951
Securities lending 30 June 2020 103,128 13,343 68,556 18,482 18,315 26,511 7,765
Emerging Markets Core Equity Fund
Global Short-Dated Bond
Fund
International Core Equity
FundInternational
Value Fund
United Kingdom
Core Equity Fund
United Kingdom
Small Companies
Fund
United Kingdom
Value Fund
% % % % % % %
Securities lending as a % of total lendable assets 12.00 0.35 6.77 4.69 2.81 7.54 1.62
Securities lending as a % of assets under management 8.11 0.27 6.72 4.64 2.79 7.49 1.62
Return and Cost for Securities Lending
Emerging Markets Core Equity Fund
Global Short-Dated Bond
Fund
International Core Equity
FundInternational
Value Fund
United Kingdom
Core Equity Fund
United Kingdom
Small Companies
Fund
United Kingdom
Value Fund
£’000 £’000 £’000 £’000 £’000 £’000 £’000
Return to the Fund 591 4 144 36 76 125 50
Return to the Agent 66 0 16 4 8 14 6
% % % % % % %
Return to the Fund 90 90 90 90 90 90 90
Return to the Agent 10 10 10 10 10 10 10
Dimensional Funds ICVC
Supplemental Information (unaudited) Securities Financing Transaction and Reuse
The following information is presented with regard to Regulation (EU) 2015/2365 on transparency of securities financing and reuse (“SFTR”). As at 30 June 2020, the only type of securities financing applicable to the Company was securities lending.
Global Data
Securities lending as at 30 June 2020
Dimensional Fund Advisors Ltd. Interim Report and Financial Statements, 30 June 2020 148

Dimensional Funds ICVC
Supplemental Information (unaudited) (continued)Securities Financing Transaction and Reuse
Concentration Data
Top ten (or less) counterparties for collateral (Government Bonds only)
Emerging Markets Core Equity Fund
Global Short-Dated Bond
Fund
International Core Equity
FundInternational
Value Fund
United Kingdom
Core Equity Fund
United Kingdom
Small Companies
Fund
United Kingdom
Value Fund
£’000 £’000 £’000 £’000 £’000 £’000 £’000
Bank of Nova Scotia -* - -* - 429 -* 119
Barclays Bank -* 495 2,715 528 - - -
Barclays Capital Securities 7,004 - 2,932 498 3,143 3,338 1,274
BNP Paribas Arbitrage -* - -* -* - 5,632 -
Citigroup Global Markets (UK) 9,183 - 4,635 2,831 984 844 326
Credit Suisse (Ireland) 7,230 - 27,047 4,295 2,861 2,229 965
Credit Suisse Securities (Europe) -* 1,120 -* - 349 -* -
Deutsche Bank - - - - -* 422 -*
Goldman Sachs 14,486 - 2,644 1,400 1,135 3,611 695
HSBC Bank -* - 3,437 1,872 -* -* -*
JP Morgan Securities 28,050 10,583 3,771 1,675 1,794 1,691 2,519
Macquarie Bank 3,551 - -* - - - -
Merrill Lynch 14,914 - 6,617 947 3,749 2,715 1,216
Morgan Stanley International 6,827 - 3,342 1,399 -* -* 55
State Street Bank International - - -* - 850 3,126 128
UBS 4,201 - 14,198 3,938 3,757 4,076 1,138
UBS Europe 10,191 - - - - - -
105,637 12,198 71,338 19,383 19,051 27,684 8,435
*Others 8,299 - 1,359 77 742 923 40
Total 113,936 12,198 72,697 19,460 19,793 28,607 8,475
Top ten (or less) collateral issuers for securities on loan
Emerging Markets Core Equity Fund
Global Short-Dated Bond
Fund
International Core Equity
FundInternational
Value Fund
United Kingdom
Core Equity Fund
United Kingdom
Small Companies
Fund
United Kingdom
Value Fund
£’000 £’000 £’000 £’000 £’000 £’000 £’000
Commonwealth of Australia -* - - - - - -
Federal Republic of Germany 9,056 - 8,484 2,646 2,535 5,807 1,096
Government of Canada 1,278 - 2,349 425 603 1,203 551
Government of United Kingdom 4,786 - 8,665 2,574 2,191 2,738 1,157
Kingdom of Belgium 3,366 - 9,193 2,225 2,107 2,905 667
Kingdom of Denmark 129 - -* -* 173 250 26
Kingdom of Netherlands 2,534 - 6,667 1,941 1,907 2,505 724
Kingdom of Sweden -* - 79 70 -* -* -
Republic of Austria 405 - 841 153 526 425 233
Republic of Finland 1,016 - 548 126 280 68 76
Republic of France 17,836 - 15,574 4,442 4,091 4,344 1,676
United States of America Treasury 73,485 12,198 20,256 4,849 5,307 8,318 2,269
113,891 12,198 72,656 19,451 19,720 28,563 8,475
*Others 45 - 41 9 73 44 -
Total 113,936 12,198 72,697 19,460 19,793 28,607 8,475
Dimensional Fund Advisors Ltd. Interim Report and Financial Statements, 30 June 2020 149

Dimensional Funds ICVC
Supplemental Information (unaudited) (continued)Securities Financing Transaction and Reuse
Concentration Data (continued)
Top ten (or less) counterparties issuers for securities on loan
Emerging Markets Core Equity Fund
Global Short-Dated Bond
Fund
International Core Equity
FundInternational
Value Fund
United Kingdom
Core Equity Fund
United Kingdom
Small Companies
Fund
United Kingdom
Value Fund
£’000 £’000 £’000 £’000 £’000 £’000 £’000
Bank of Nova Scotia -* - -* - 402 -* 106
Barclays Bank -* 484 2,620 514 - - -
Barclays Capital Securities 6,645 - 2,787 473 2,991 3,174 1,210
BNP Paribas Arbitrage -* - -* -* - 5,332 -
Citigroup Global Markets (UK) 8,329 - 4,335 2,678 930 800 308
Credit Suisse (Ireland) 6,877 - 26,175 4,166 2,641 2,011 867
Credit Suisse Securities (Europe) -* 1,229 -* - -* -* -
Deutsche Bank - - - - -* 402 -*
Goldman Sachs 12,078 - 2,311 1,313 1,001 3,262 577
HSBC Bank -* - 3,276 1,780 -* -* -*
JP Morgan Securities 26,418 11,630 3,572 1,588 1,685 1,581 2,377
Macquarie Bank 3,033 - -* - - - -
Merrill Lynch 13,272 - 6,189 893 3,489 2,366 1,054
Morgan Stanley International 6,474 - 3,175 1,330 308 -* 52
State Street Bank International - - -* - 799 2,930 121
UBS 3,684 - 12,861 3,673 3,412 3,804 1,055
UBS Europe 8,433 - - - - - -
95,243 13,343 67,301 18,408 17,658 25,662 7,727
*Others 7,885 - 1,255 74 657 849 38
Total 103,128 13,343 68,556 18,482 18,315 26,511 7,765
Aggregate Transaction Data
Collateral currency by type (Government bonds only)
Emerging Markets Core Equity Fund
Global Short-Dated Bond
Fund
International Core Equity
FundInternational
Value Fund
United Kingdom
Core Equity Fund
United Kingdom
Small Companies
Fund
United Kingdom
Value Fund
£’000 £’000 £’000 £’000 £’000 £’000 £’000
Australian dollar 2 - - - - - -
Canadian dollar 1,278 - 2,349 425 603 1,203 551
Danish krone 129 - 39 7 173 250 26
Euro 34,213 - 41,308 11,535 11,445 16,054 4,473
Sterling 4,786 - 8,665 2,574 2,191 2,738 1,157
Swedish krona 43 - 79 70 74 44 -
US dollar 73,485 12,198 20,257 4,849 5,307 8,318 2,268
113,936 12,198 72,697 19,460 19,793 28,607 8,475
Dimensional Fund Advisors Ltd. Interim Report and Financial Statements, 30 June 2020 150

Dimensional Funds ICVC
Supplemental Information (unaudited) (continued)Securities Financing Transaction and Reuse
Concentration Data (continued)
Collateral value by maturity tenor (Government Bonds only)
Emerging Markets Core Equity Fund
Global Short-Dated Bond
Fund
International Core Equity
FundInternational
Value Fund
United Kingdom
Core Equity Fund
United Kingdom
Small Companies
Fund
United Kingdom
Value Fund
£’000 £’000 £’000 £’000 £’000 £’000 £’000
Less than one day - - - - - - -
One day to one week 993 - 314 55 - - -
One week to one month 911 - 822 372 43 70 34
One to three months 8,004 3,251 2,285 479 846 1,445 404
Three months to one year 3,642 1 1,926 738 1,116 947 743
Above one year 100,386 8,946 67,350 17,816 17,788 26,145 7,294
Open maturity - - - - - - -
113,936 12,198 72,697 19,460 19,793 28,607 8,475
Securities on loan by maturity tenor
Emerging Markets Core Equity Fund
Global Short-Dated Bond
Fund
International Core Equity
FundInternational
Value Fund
United Kingdom
Core Equity Fund
United Kingdom
Small Companies
Fund
United Kingdom
Value Fund
£’000 £’000 £’000 £’000 £’000 £’000 £’000
Less than one day - - - - - - -
One day to one week - - - - - - -
One week to one month - - - - - - -
One to three months - - - - - - -
Three months to one year - 8,547 - - - - -
Above one year - 4,796 - - - - -
Open maturity 103,128 - 68,556 18,482 18,315 26,511 7,765
103,128 13,343 68,556 18,482 18,315 26,511 7,765
By type of collateral
Government Bonds
Emerging Markets Core Equity Fund
Global Short-Dated Bond
Fund
International Core Equity
FundInternational
Value Fund
United Kingdom
Core Equity Fund
United Kingdom
Small Companies
Fund
United Kingdom
Value Fund
£’000 £’000 £’000 £’000 £’000 £’000 £’000
Investment Grade 113,936 12,198 72,697 19,460 19,793 28,607 8,475
Below Investment Grade - - - - - - -
113,936 12,198 72,697 19,460 19,793 28,607 8,475
Dimensional Fund Advisors Ltd. Interim Report and Financial Statements, 30 June 2020 151

Dimensional Funds ICVC
Supplemental Information (unaudited) (continued)Securities Financing Transaction and Reuse
Concentration Data (continued)
Country of counterparty exposure for securities on loan
Emerging Markets Core Equity Fund
Global Short-Dated Bond
Fund
International Core Equity
FundInternational
Value Fund
United Kingdom
Core Equity Fund
United Kingdom
Small Companies
Fund
United Kingdom
Value Fund
£’000 £’000 £’000 £’000 £’000 £’000 £’000
Australia 3,033 - 193 - - - -
Canada 415 - 47 - 402 354 106
France 1,205 - 262 73 - 5,332 -
Germany 8,433 - - - 98 402 37
Ireland 6,877 - 26,175 4,166 2,641 2,011 867
103,128 13,343 68,556 18,482 18,315 26,511 7,765
Safekeeping of collateral
Custodian
Values held £'000
Bank of New York 44,934
JP Morgan 55,839
State Street 174,393
The reuse of collateral is not permitted. Any cash collateral that would be taken would either be reinvested via tri-party repo or held on a Demand Deposit Cash Account in the United Statesof America.
Dimensional Fund Advisors Ltd. Interim Report and Financial Statements, 30 June 2020 152

dimensional.com
Authorised and Regulated by the Financial Conduct Authority
Firm Reference Number: 150100
Dimensional Fund Advisors Ltd.
20 Triton Street
Regent’s Place
London NW1 3BF
The value of investments and any income from them may fall as well as rise and past performance is not a guarantee of future results.
Prospectuses are available to download from http://www.dimensional.com
This is not a prospectus. Dimensional Funds ICVC are offered solely under the terms and conditions of the current prospectus and applicable Key Investor InformationDocument (“KIID”). Consider the investment objectives, risks, charges and expenses of Dimensional Funds ICVC carefully before investing. For this and other informationabout the Dimensional Funds ICVC, please read the prospectus and KIIDs carefully before investing. The latest version of the prospectus (available in English) andapplicable KIIDs (all in English and the appropriate local language) may be obtained at dimensional.com or by contacting the Dimensional Funds ICVC administrator, or theinvestment manager at +44 (0)203 033 3300.