fertiglobe financial statements 2020
TRANSCRIPT
FertiglobeFinancial Statements 2020
A vital catalyst for growth
Fertiglobe Financial Statements 2020 2
Company overview
Fertiglobe Holding Limited was established on December 23rd, 2018 pursuant to ADGM Company Regulations of 2015. In March 2019 OCI N.V. contributed its nitrogen fertilizer production and distribution assets in Egypt, Algeria and UAE to Fertiglobe and on June 26th, 2019 OCI and ADNOC signed a contribution agreement to combine ADNOC’s fertilizer business into the Company. With the completion of the transaction on September 30th, 2019, Fertiglobe became the largest export-focused nitrogen fertilizer platform globally, and the largest producer in the MENA region with a production capacity of 6.5 million tons per annum of urea and sellable ammonia. OCI N.V. is the majority stakeholder with 58% ownership, and ADNOC the minority stakeholder with 42% ownership.
Key assets within the Company perimeter include:
Egyptian Fertilizer Company (EFC): The largest private sector granular urea producer in Egypt, with a capacity to produce 1.65 million tons per annum of urea and 0.9 million tons per annum of ammonia.
Egypt Basic Industries Corporation (EBIC): Fertiglobe has 60% stake in the Egypt based ammonia plant EBIC, which has capacity of 0.73 million tons per annum.
Sorfert Algeria S.P.A: Fertiglobe has 51% stake in Sorfert, an Algerian producer of ammonia and urea with capacity of 1.6 million tons per annum and 1.26 million tons per annum respectively.
Fertiglobe Distribution limited (FDL) and OCI Fertilizer Trading Ltd (OFT): Fertiglobe established trading platform based in U.A.E. supported by export logistics network, strategic partnerships / relationships in Brazil, Spain, and USA.
Ruwais Fertilizers Industries LLC (Fertil): Headquartered in Abu Dhabi, Fertil is manufacturing Ammonia and Urea through two plants (Fertil 1 and Fertil 2). The business has a capacity to produce 2.1 million tons per annum of urea and 1.2 million tons per annum of ammonia.
Fertiglobe aims at achieving value through synergies which include:
Commercial synergies: Timing of sales and increased premiums over benchmark prices, reduced reliance on traders through a wider distribution network and access to key end markets (inc. Brazil, India and East Africa), re-routing of volumes through freight and logistics optimization, reduced freight rates, and sharing of best practices across the Fertiglobe platform.
Technical synergies: Shared maintenance expertise, coordinated turnarounds, procurement optimization and spare parts pooling.
Members of the Board of Directors:
The number of Directors on the Board of Fertiglobe is initially set to be 10 members with ADNOC appointing 4 members and OCI appointing 6 members as follows:
ADNOC MembersH.E. Dr. Sultan Ahmed Al Jaber - Chairperson
Abdulaziz Abdulla Ismail Mohamed AlHajri - Director
Mohamed Saif Ali Abed Alaryani – Director
Wafa Ibrahim Ali Mohamed Al Hammadi - Director
OCI MembersNassef Onsi Sawiris - Director
Hassan Badrawi - Director
Hesham Abdel Samie - Director
David Welch - Director
Philippe Ryckaert - Director
Ahmed El Hoshy - Director replacing Eric Bowles who resigned on 30th June, 2020
Current year’s results:
In 2020, Fertiglobe has shown its resilience towards the pandemic. The company achieved USD 1,550.8 million in revenues by selling 5.1 million tons of Urea and 1.0 million tons of Ammonia resulting in a total net profit of USD 127.1 million on consolidated basis vs 2019 revenue of USD 1,055.5 million and sales volumes of 2.9 million tons of Urea and 1.1million tons of Ammonia and total net profit of USD 38.4 million. Fertiglobe consolidated 12 months of Fertil performance in 2020 vs 3 months in 2019. The company has also signed two major contracts with Ethiopia and India achieving a higher netback compared to market prices by utilizing the strategic existence of Fertiglobe production facilities to better meet the customer demand.
Total assets reached USD 4,797.3 million vs USD 4,991.9 million last year.
Statement of disclosure to auditors:
The Directors of Fertiglobe certify that as far as they are aware, there is no relevant audit information of which the company’s auditor is unaware, and that they have taken all the steps that they ought to have taken as directors in order to make themselves aware of any relevant audit information and to establish that the company’s auditor is aware of that information.
On behalf of the board,
Hesham Abdel Samie Board member
DIRECTOR’S REPORT
Fertiglobe Financial Statements 2020
Financial Statements
A vital catalyst for growth
Consolidated Statement of Financial Position 4
Consolidated Statement of Profit or Loss and Other Comprehensive Income 6
Consolidated Statement of Changes in Equity 7
Consolidated Statement of Cash Flows 8
Notes to the Consolidated Financial Statements 10
Independent auditors’ report 41
Consolidated Financial Statements
Fertiglobe Financial Statements 2020 4
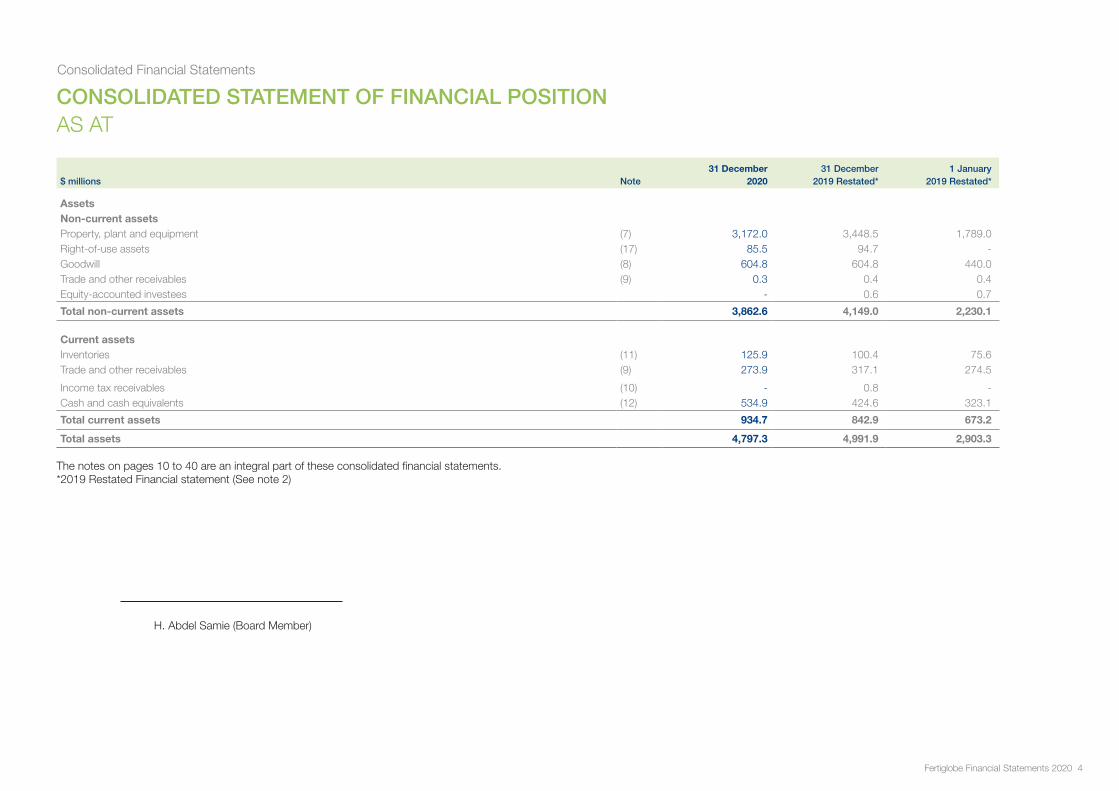
CONSOLIDATED STATEMENT OF FINANCIAL POSITION AS AT
$ millions Note31 December
202031 December
2019 Restated*1 January
2019 Restated*
AssetsNon-current assetsProperty, plant and equipment (7) 3,172.0 3,448.5 1,789.0Right-of-use assets (17) 85.5 94.7 -Goodwill (8) 604.8 604.8 440.0Trade and other receivables (9) 0.3 0.4 0.4Equity-accounted investees - 0.6 0.7
Total non-current assets 3,862.6 4,149.0 2,230.1
Current assetsInventories (11) 125.9 100.4 75.6Trade and other receivables (9) 273.9 317.1 274.5
Income tax receivables (10) - 0.8 -Cash and cash equivalents (12) 534.9 424.6 323.1
Total current assets 934.7 842.9 673.2
Total assets 4,797.3 4,991.9 2,903.3
The notes on pages 10 to 40 are an integral part of these consolidated financial statements.*2019 Restated Financial statement (See note 2)
H. Abdel Samie (Board Member)
Consolidated Financial Statements
Fertiglobe Financial Statements 2020 5
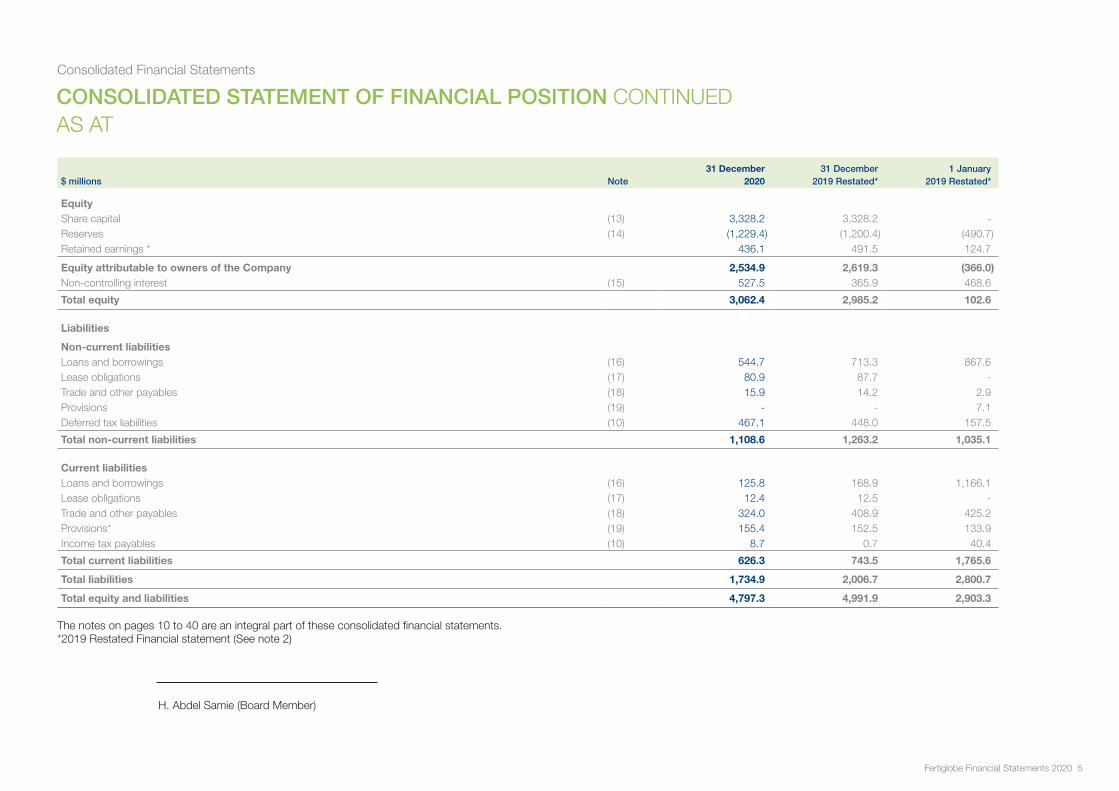
CONSOLIDATED STATEMENT OF FINANCIAL POSITION CONTINUEDAS AT
$ millions Note31 December
202031 December
2019 Restated*1 January
2019 Restated*
EquityShare capital (13) 3,328.2 3,328.2 -Reserves (14) (1,229.4) (1,200.4) (490.7)Retained earnings * 436.1 491.5 124.7
Equity attributable to owners of the Company 2,534.9 2,619.3 (366.0)Non-controlling interest (15) 527.5 365.9 468.6
Total equity 3,062.4 2,985.2 102.6
Liabilities
Non-current liabilitiesLoans and borrowings (16) 544.7 713.3 867.6Lease obligations (17) 80.9 87.7 -Trade and other payables (18) 15.9 14.2 2.9Provisions (19) - - 7.1Deferred tax liabilities (10) 467.1 448.0 157.5
Total non-current liabilities 1,108.6 1,263.2 1,035.1
Current liabilitiesLoans and borrowings (16) 125.8 168.9 1,166.1Lease obligations (17) 12.4 12.5 -Trade and other payables (18) 324.0 408.9 425.2Provisions* (19) 155.4 152.5 133.9Income tax payables (10) 8.7 0.7 40.4
Total current liabilities 626.3 743.5 1,765.6
Total liabilities 1,734.9 2,006.7 2,800.7
Total equity and liabilities 4,797.3 4,991.9 2,903.3
The notes on pages 10 to 40 are an integral part of these consolidated financial statements.*2019 Restated Financial statement (See note 2)
H. Abdel Samie (Board Member)
Consolidated Financial Statements
Fertiglobe Financial Statements 2020 6
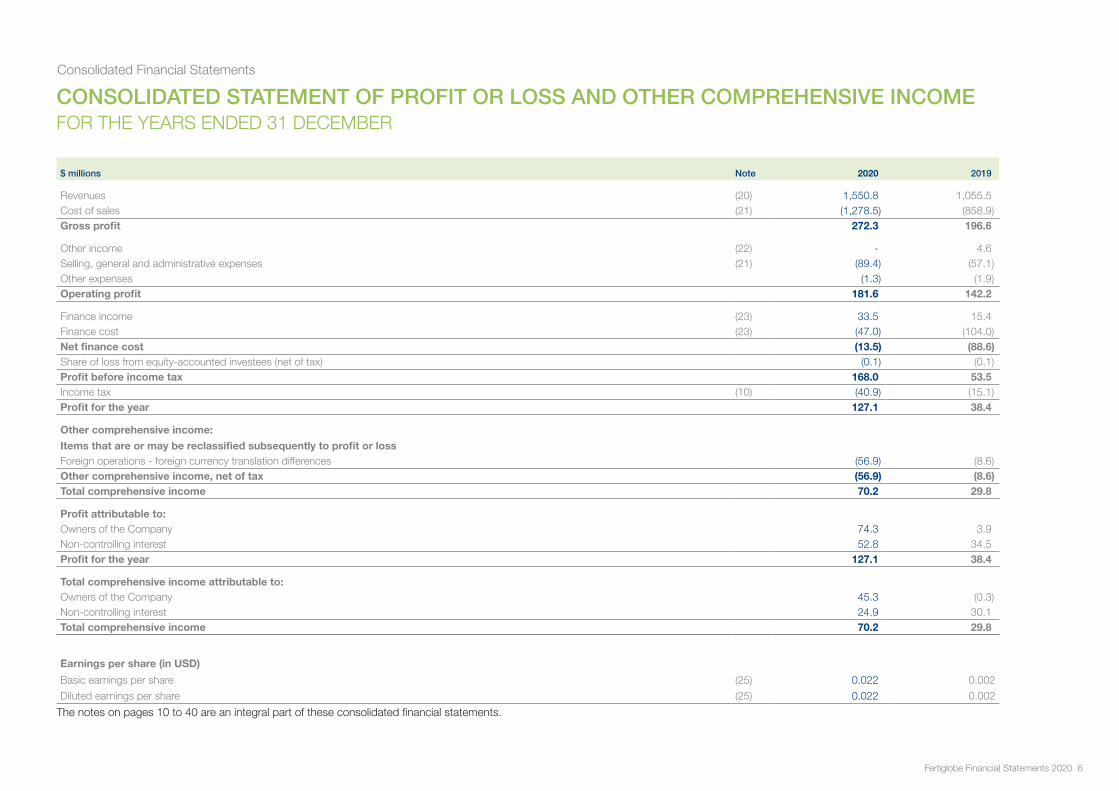
CONSOLIDATED STATEMENT OF PROFIT OR LOSS AND OTHER COMPREHENSIVE INCOME FOR THE YEARS ENDED 31 DECEMBER
$ millions Note 2020 2019
Revenues (20) 1,550.8 1,055.5Cost of sales (21) (1,278.5) (858.9)Gross profit 272.3 196.6
Other income (22) - 4.6Selling, general and administrative expenses (21) (89.4) (57.1)Other expenses (1.3) (1.9)Operating profit 181.6 142.2
Finance income (23) 33.5 15.4Finance cost (23) (47.0) (104.0)Net finance cost (13.5) (88.6)Share of loss from equity-accounted investees (net of tax) (0.1) (0.1)Profit before income tax 168.0 53.5Income tax (10) (40.9) (15.1)Profit for the year 127.1 38.4
Other comprehensive income:
Items that are or may be reclassified subsequently to profit or lossForeign operations - foreign currency translation differences (56.9) (8.6)Other comprehensive income, net of tax (56.9) (8.6)Total comprehensive income 70.2 29.8
Profit attributable to:Owners of the Company 74.3 3.9Non-controlling interest 52.8 34.5Profit for the year 127.1 38.4
Total comprehensive income attributable to:Owners of the Company 45.3 (0.3)Non-controlling interest 24.9 30.1Total comprehensive income 70.2 29.8
Earnings per share (in USD)
Basic earnings per share (25) 0.022 0.002
Diluted earnings per share (25) 0.022 0.002
The notes on pages 10 to 40 are an integral part of these consolidated financial statements.
Consolidated Financial Statements
Fertiglobe Financial Statements 2020 7
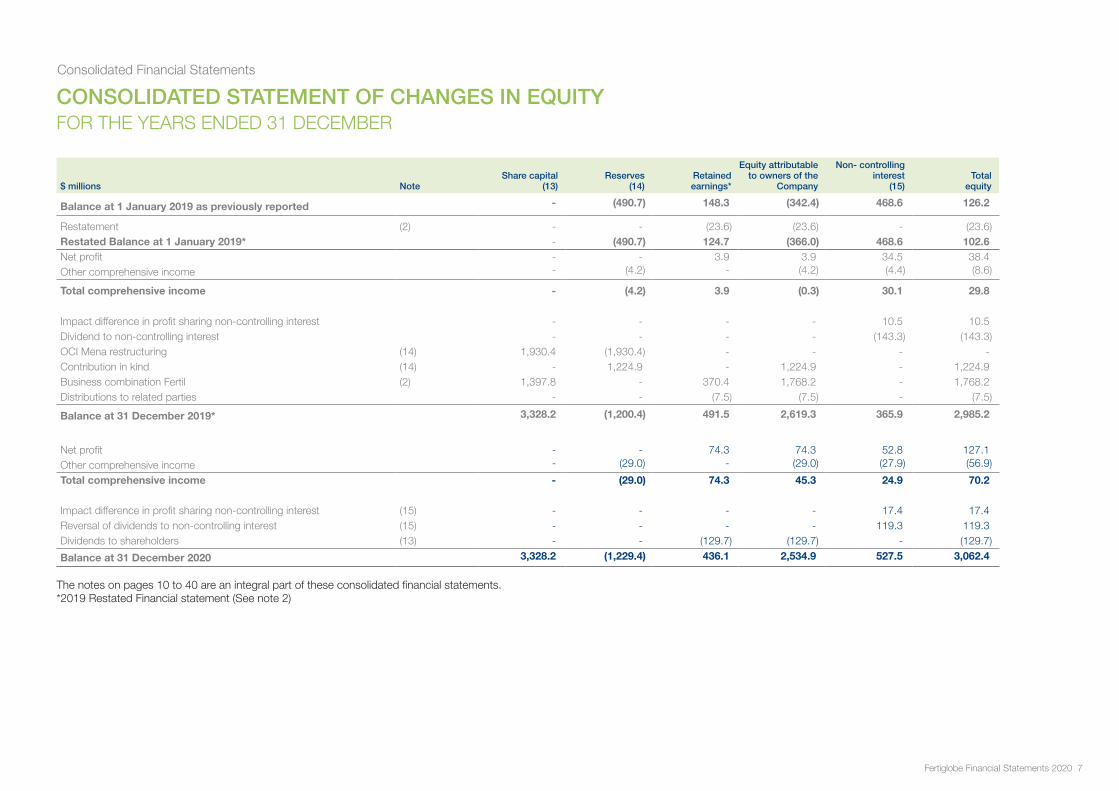
CONSOLIDATED STATEMENT OF CHANGES IN EQUITY FOR THE YEARS ENDED 31 DECEMBER
$ millions NoteShare capital
(13)Reserves
(14)Retainedearnings*
Equity attributable to owners of the
Company
Non- controlling interest
(15)Total
equity
Balance at 1 January 2019 as previously reported - (490.7) 148.3 (342.4) 468.6 126.2
Restatement (2) - - (23.6) (23.6) - (23.6)Restated Balance at 1 January 2019* - (490.7) 124.7 (366.0) 468.6 102.6Net profit - - 3.9 3.9 34.5 38.4Other comprehensive income - (4.2) - (4.2) (4.4) (8.6)
Total comprehensive income - (4.2) 3.9 (0.3) 30.1 29.8
Impact difference in profit sharing non-controlling interest - - - - 10.5 10.5Dividend to non-controlling interest - - - - (143.3) (143.3)OCI Mena restructuring (14) 1,930.4 (1,930.4) - - - -Contribution in kind (14) - 1,224.9 - 1,224.9 - 1,224.9Business combination Fertil (2) 1,397.8 - 370.4 1,768.2 - 1,768.2Distributions to related parties - - (7.5) (7.5) - (7.5)
Balance at 31 December 2019* 3,328.2 (1,200.4) 491.5 2,619.3 365.9 2,985.2
Net profit - - 74.3 74.3 52.8 127.1Other comprehensive income - (29.0) - (29.0) (27.9) (56.9)
Total comprehensive income - (29.0) 74.3 45.3 24.9 70.2
Impact difference in profit sharing non-controlling interest (15) - - - - 17.4 17.4Reversal of dividends to non-controlling interest (15) - - - - 119.3 119.3Dividends to shareholders (13) - - (129.7) (129.7) - (129.7)
Balance at 31 December 2020 3,328.2 (1,229.4) 436.1 2,534.9 527.5 3,062.4 The notes on pages 10 to 40 are an integral part of these consolidated financial statements.*2019 Restated Financial statement (See note 2)
Consolidated Financial Statements
Fertiglobe Financial Statements 2020 8
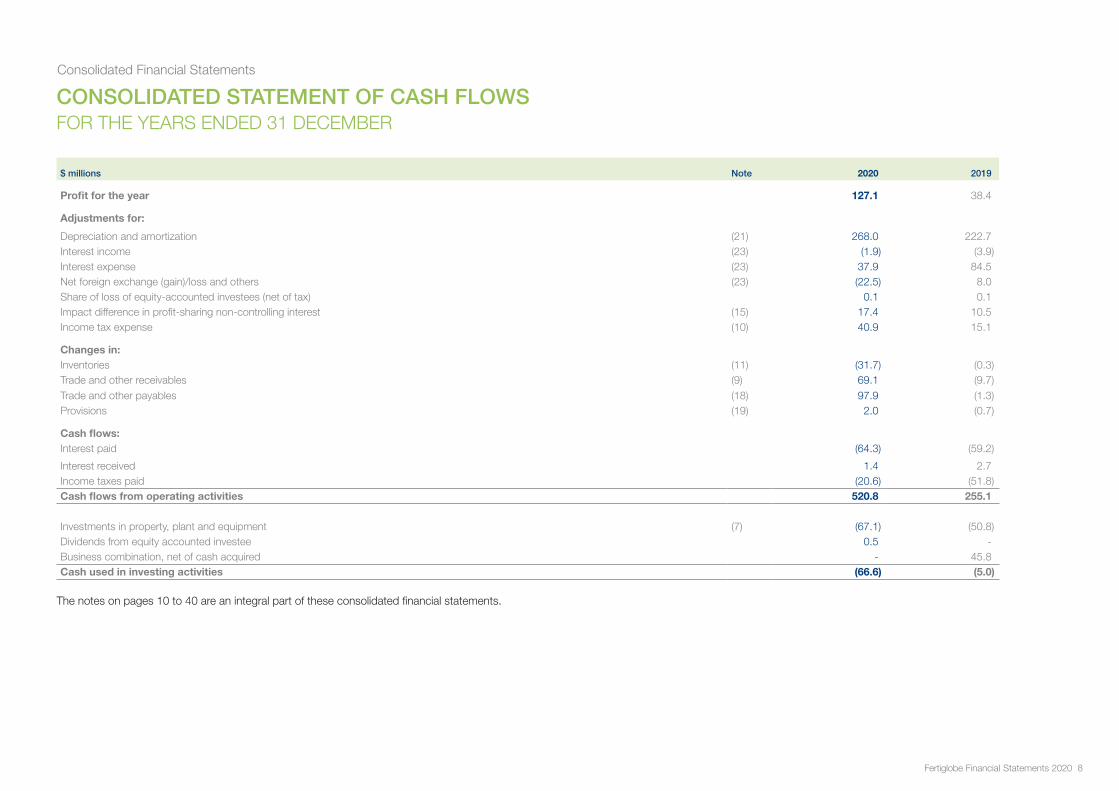
CONSOLIDATED STATEMENT OF CASH FLOWSFOR THE YEARS ENDED 31 DECEMBER
$ millions Note 2020 2019
Profit for the year 127.1 38.4
Adjustments for:
Depreciation and amortization (21) 268.0 222.7Interest income (23) (1.9) (3.9)Interest expense (23) 37.9 84.5Net foreign exchange (gain)/loss and others (23) (22.5) 8.0Share of loss of equity-accounted investees (net of tax) 0.1 0.1Impact difference in profit-sharing non-controlling interest (15) 17.4 10.5Income tax expense (10) 40.9 15.1
Changes in:Inventories (11) (31.7) (0.3)Trade and other receivables (9) 69.1 (9.7)Trade and other payables (18) 97.9 (1.3)Provisions (19) 2.0 (0.7)
Cash flows:Interest paid (64.3) (59.2)
Interest received 1.4 2.7Income taxes paid (20.6) (51.8)Cash flows from operating activities 520.8 255.1
Investments in property, plant and equipment (7) (67.1) (50.8)Dividends from equity accounted investee 0.5 -Business combination, net of cash acquired - 45.8Cash used in investing activities (66.6) (5.0)
The notes on pages 10 to 40 are an integral part of these consolidated financial statements.
Consolidated Financial Statements
Fertiglobe Financial Statements 2020 9
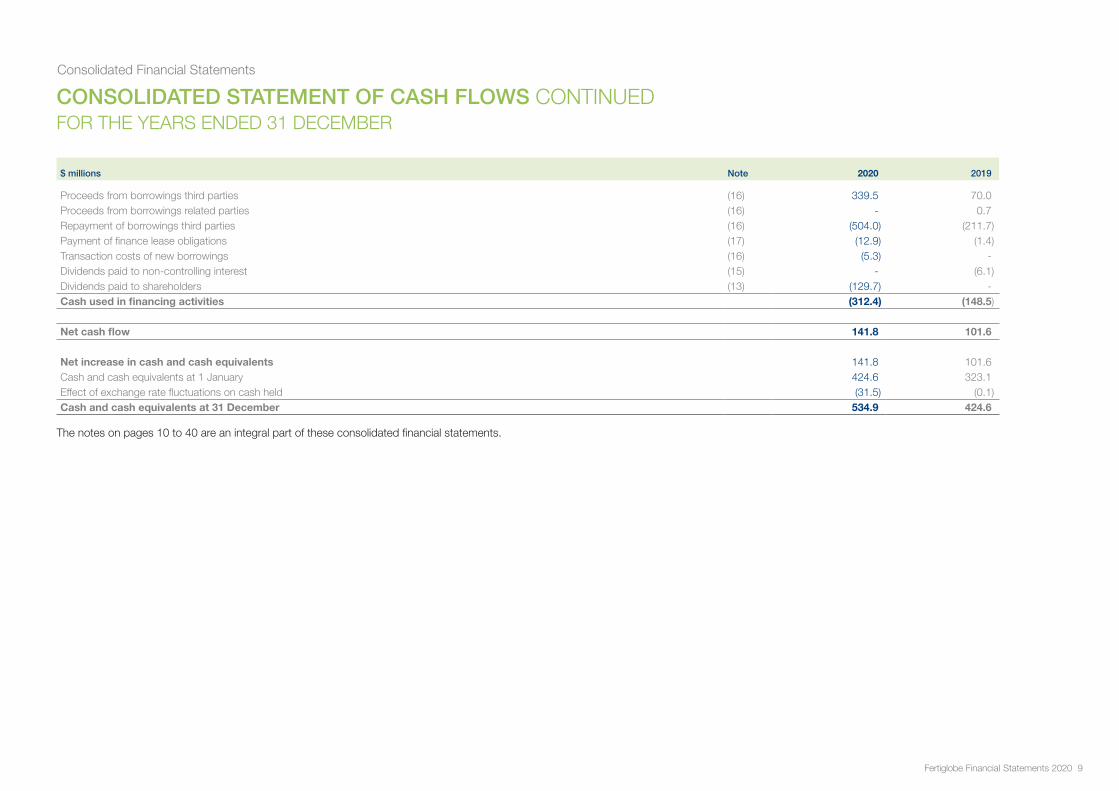
CONSOLIDATED STATEMENT OF CASH FLOWS CONTINUEDFOR THE YEARS ENDED 31 DECEMBER
$ millions Note 2020 2019
Proceeds from borrowings third parties (16) 339.5 70.0Proceeds from borrowings related parties (16) - 0.7Repayment of borrowings third parties (16) (504.0) (211.7)Payment of finance lease obligations (17) (12.9) (1.4)Transaction costs of new borrowings (16) (5.3) -Dividends paid to non-controlling interest (15) - (6.1)Dividends paid to shareholders (13) (129.7) -Cash used in financing activities (312.4) (148.5)
Net cash flow 141.8 101.6
Net increase in cash and cash equivalents 141.8 101.6Cash and cash equivalents at 1 January 424.6 323.1Effect of exchange rate fluctuations on cash held (31.5) (0.1)Cash and cash equivalents at 31 December 534.9 424.6
The notes on pages 10 to 40 are an integral part of these consolidated financial statements.

Consolidated Financial Statements
Fertiglobe Financial Statements 2020 10
NOTES TO THE CONSOLIDATED FINANCIAL STATEMENTSFOR THE YEARS ENDED 31 DECEMBER
1. General
Fertiglobe Holding Limited (‘Fertiglobe’ or ‘the Company’) was established on 23 December 2018 as Private Company Limited by Shares pursuant to Abu Dhabi Global Markets (ADGM) Companies Regulations 2015. It’s registered office is located at 2475-2476, 20th floor, Al Sila Tower, Abu Dhabi Global Market Square, Al Maryah Island, Abu Dhabi, United Arab Emirates. The Company is registered in the ADGM commercial register under no. 000001911. The consolidated financial statements comprise the financial statements of the Company and its subsidiaries (together referred to as the ‘Group’).
The Company was previously registered under the names OCI Fertilizers Exports holding limited and OCI Fertilizers Exports Holding RSC limited and then later changed to Fertiglobe Holding Limited during the business combination of Fertil.
The Group is consolidated under OCI.N.V (“ultimate Parent”) that holds 58% of the shares and voting rights in the Company.
The principal activity of the Group is the production and sale of nitrogen based products.
These consolidated financial statements were approved and authorized for issuance on 20 June 2021 by the Board of Directors.
2. Basis of preparation and main events
2.1 General
The consolidated financial statements have been prepared in accordance with International Financial Reporting Standards (‘IFRS’) as issued by the International Accounting Standards Board (‘IASB’) and in compliance with the applicable provisions of the Group’s Article of Association and the requirements of the Abu Dhabi Global Market Companies Regulation of 2020.
The consolidated financial statements have been prepared on the historical cost convention, except when otherwise indicated.
The financial year of the Group commences on 1st January and ends on 31 December.
These consolidated financial statements are presented in US Dollar (‘USD’), which is the Group’s functional and reporting currency. All amounts have been recorded to the nearest million, unless otherwise stated.
2.2 Main events
Covid- 19The year 2020 has been strongly impacted by the pandemic (Covid-19) which had far-reaching economic consequences beyond the spread of the disease itself. While most sectors of the world economy faced heavy losses specially the oil & gas and services sectors, the Fertilizer business was much less impacted with a relatively modest decline in prices (-3% and -10% in Urea and Ammonia average sales price respectively).
Neither the demand nor the supply chain were significantly impacted given the importance of fertilizers to the continuity of Worldwide food production. Despite the global lockdown, the Group’s facilities continued operation at close to normal levels and in accordance with plans.
Based on the recent strong recovery of the market, management expects this will not impact the long term outlook of the business and the valuation of the assets. Global urea and ammonia prices have increased in the first four months of 2021.
Although the long-term effects of COVID-19 are still unclear, our current outlook is that our financial and operating performance remains solid. We have operated our business in a remote working environment and could continue to do so for an extended period of time, if necessary. Developments in each jurisdiction are being closely monitored and protocols are flexible to allow for rapid adjustments as needed. The impressive resilience of our staff throughout the period gives all local management teams confidence to revert to a work-from-home policy again if needed, without interruptions to our operations and supply chain.
Business combinationsOn 30 September 2019, the Group OCI NV and Abu Dhabi National Oil Company (‘ADNOC’) completed a transaction to combine ADNOC’s fertilizer business into OCI’s Middle East and North Africa (‘OCI MENA’) nitrogen fertilizer platform.
As part of the transaction, the Group acquired 100% of the voting powers and economic returns from Ruwais Fertilizer Industries LLC. (‘Fertil’), a previously wholly owned subsidiary of ADNOC. Fertil is consolidated by the Group from 30 September 2019. Fertil is based out of the Emirate of Abu Dhabi, United Arab Emirates and is engaged in processing feedstock gas to produce nitrogen fertilizers. In exchange the Group transferred 42% of the total share capital of Fertiglobe to ADNOC. With the acquisition of Fertil, Fertiglobe has become the largest producer of nitrogen fertilizers in the MENA region.
For the three months ended 31 December 2019, Fertil contributed revenue (before intercompany revenue elimination) of USD 131 million and a loss before tax of USD 4 million to the Group’s results. If the acquisition had occurred on 1 January 2019, management estimates that consolidated revenue would have been USD 1,436 million and the consolidated profit before tax USD 71 million.
Consolidated Financial Statements
Fertiglobe Financial Statements 2020 11
NOTES TO THE CONSOLIDATED FINANCIAL STATEMENTSFOR THE YEARS ENDED 31 DECEMBER (CONTINUED)
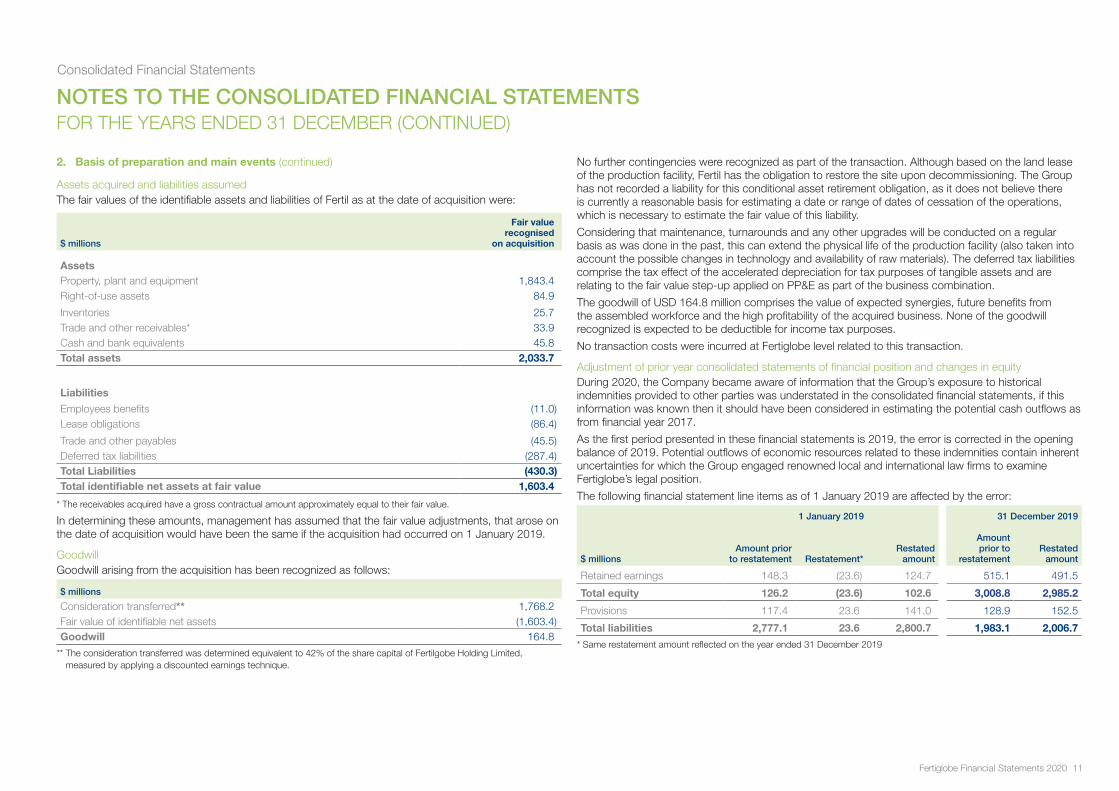
2. Basis of preparation and main events (continued)
Assets acquired and liabilities assumedThe fair values of the identifiable assets and liabilities of Fertil as at the date of acquisition were:
$ millions
Fair value recognised
on acquisition
AssetsProperty, plant and equipment 1,843.4Right-of-use assets 84.9
Inventories 25.7Trade and other receivables* 33.9Cash and bank equivalents 45.8Total assets 2,033.7
Liabilities
Employees benefits (11.0)Lease obligations (86.4)
Trade and other payables (45.5)Deferred tax liabilities (287.4)Total Liabilities (430.3)Total identifiable net assets at fair value 1,603.4
* The receivables acquired have a gross contractual amount approximately equal to their fair value.
In determining these amounts, management has assumed that the fair value adjustments, that arose on the date of acquisition would have been the same if the acquisition had occurred on 1 January 2019.
GoodwillGoodwill arising from the acquisition has been recognized as follows:
$ millions
Consideration transferred** 1,768.2Fair value of identifiable net assets (1,603.4)Goodwill 164.8
** The consideration transferred was determined equivalent to 42% of the share capital of Fertilgobe Holding Limited, measured by applying a discounted earnings technique.
No further contingencies were recognized as part of the transaction. Although based on the land lease of the production facility, Fertil has the obligation to restore the site upon decommissioning. The Group has not recorded a liability for this conditional asset retirement obligation, as it does not believe there is currently a reasonable basis for estimating a date or range of dates of cessation of the operations, which is necessary to estimate the fair value of this liability.
Considering that maintenance, turnarounds and any other upgrades will be conducted on a regular basis as was done in the past, this can extend the physical life of the production facility (also taken into account the possible changes in technology and availability of raw materials). The deferred tax liabilities comprise the tax effect of the accelerated depreciation for tax purposes of tangible assets and are relating to the fair value step-up applied on PP&E as part of the business combination.
The goodwill of USD 164.8 million comprises the value of expected synergies, future benefits from the assembled workforce and the high profitability of the acquired business. None of the goodwill recognized is expected to be deductible for income tax purposes.
No transaction costs were incurred at Fertiglobe level related to this transaction.
Adjustment of prior year consolidated statements of financial position and changes in equityDuring 2020, the Company became aware of information that the Group’s exposure to historical indemnities provided to other parties was understated in the consolidated financial statements, if this information was known then it should have been considered in estimating the potential cash outflows as from financial year 2017.
As the first period presented in these financial statements is 2019, the error is corrected in the opening balance of 2019. Potential outflows of economic resources related to these indemnities contain inherent uncertainties for which the Group engaged renowned local and international law firms to examine Fertiglobe’s legal position.
The following financial statement line items as of 1 January 2019 are affected by the error:
1 January 2019 31 December 2019
$ millionsAmount prior
to restatement Restatement*Restated
amount
Amount prior to
restatementRestated
amount
Retained earnings 148.3 (23.6) 124.7 515.1 491.5
Total equity 126.2 (23.6) 102.6 3,008.8 2,985.2
Provisions 117.4 23.6 141.0 128.9 152.5
Total liabilities 2,777.1 23.6 2,800.7 1,983.1 2,006.7
* Same restatement amount reflected on the year ended 31 December 2019
Consolidated Financial Statements
Fertiglobe Financial Statements 2020 12
NOTES TO THE CONSOLIDATED FINANCIAL STATEMENTSFOR THE YEARS ENDED 31 DECEMBER (CONTINUED)
3. Summary of significant accounting policies
The Group has consistently applied the following accounting policies to all periods presented in these consolidated financial statements, except if mentioned otherwise in note 4.
3.1 Consolidation
The consolidated financial statements include the financial statements of the Group, its subsidiaries and the Group’s interests in associates and joint ventures.
SubsidiariesSubsidiaries are all companies to which the Group is exposed or has rights to variable returns from its involvement with the investee and has the ability to affect those returns through its control over the investee, generally accompanying a shareholding of more than half of the shares issued and related voting power. Subsidiaries are fully consolidated from the date that control commences until the date that control ceases. When the Group ceases to have control over a subsidiary, it derecognizes the assets and liabilities of the subsidiary, and any related non-controlling interest and other components of equity. Any investment retained in the former subsidiary is recognized at fair value. The fair value shall be regarded as the fair value on initial recognition of a financial asset or, when appropriate, the cost on initial recognition of an investment in an associate or joint venture. Any resulting gain or loss is recognized in profit or loss including related cumulative translation adjustments accumulated in other comprehensive income. The principal subsidiaries are listed in note 28.
Transactions eliminated in the consolidated financial statementsIntra-group balances and transactions, and any unrealized income and expenses (except for foreign currency transaction gains or losses) arising from intra-group transactions, are eliminated in preparing the consolidated financial statements. Unrealized gains arising from transactions with equity-accounted investees are eliminated against the investment to the extent of the Group’s interest in the investees. Unrealized losses are eliminated in the same way as unrealized gains, but only to the extent that there is no evidence of impairment.
Non-controlling interestNCI are measured initially at their proportionate share of the acquiree’s identifiable net assets at the date of acquisition. Changes in the Group’s interest in a subsidiary that do not result in a loss of control are accounted for as equity transactions.
3.2 Business combinations
The group accounts for business combinations using the acquisition method when the acquired set of activities and assets meets the definition of a business and control is transferred to the Group. In determining whether a particular set of activities and assets is a business, the Group assesses whether the set of assets and activities acquired includes, at a minimum, an input and sustantive process and whether the acquired set has the ability to produce outputs.
The group has an option to apply a ‘concentration test‘ that permits a simplified assessment of whether an acquired set of activities and assets is not a business. The optional concentration test is met if substantially all of the fair value of the gross assets acquired is concentrated in a single identifiable asset or group of similar identifiable assets.
The cost of an acquisition is measured as the aggregate of the consideration transferred, measured at acquisition date, fair value and the amount of any non-controlling interest in the acquiree. For each business combination, the Group elects whether to measure the non-controlling interest in the acquiree at fair value or at the proportionate share of the acquiree’s identifiable net assets. Acquisition-related costs are expensed as incurred and included in administrative expenses.
When the Group acquires a business, it assesses the classification of particular financial assets and financial liabilities assumed as, at fair value through profit or loss, or at amortized cost or as a financial asset measured at fair value through other comprehensive income. The Group makes an assessment of whether embedded derivatives of the acquiree should be separates from their host contracts.
If the business combination is achieved in stages, the previously held equity interest is remeasured at its acquisition date fair value and any resulting gain or loss is recognized in profit or loss or other comprehensive income, as appropriate.
3.3 Foreign currency
Foreign currency transactionsTransactions in foreign currencies are translated into the respective functional currencies of Group companies at the exchange rates at the dates of the transactions.
Monetary assets and liabilities denominated in foreign currencies are translated into the functional currency at the exchange rate at the reporting date. Non-monetary assets and liabilities that are measured at fair value in a foreign currency are translated into the functional currency at the exchange rate when the fair value was determined. Non-monetary items that are measured based on historical cost in a foreign currency are translated at the exchange rate at the date of the transaction. Foreign currency differences are generally recognised in profit or loss and presented within finance costs.
Consolidated Financial Statements
Fertiglobe Financial Statements 2020 13
NOTES TO THE CONSOLIDATED FINANCIAL STATEMENTSFOR THE YEARS ENDED 31 DECEMBER (CONTINUED)
3.3 Foreign currency (continued)
Foreign operationsThe assets and liabilities of foreign operations, including goodwill and fair value adjustments arising on acquisition, are translated into USD at the exchange rates at the reporting date.
The income and expenses of foreign operations are translated into USD at the average exchange rates of the transaction’s period. Foreign currency differences are recognised in OCI and accumulated in the translation reserve, except to the extent that the translation difference is allocated to NCI.
When a foreign operation is disposed of in its entirety or partially such that control, significant influence or joint control is lost, the cumulative amount in the translation reserve related to that foreign operation is reclassified to profit or loss as part of the gain or loss on disposal. If the Group disposes of part of its interest in a subsidiary but retains control, then the relevant proportion of the cumulative amount is reattributed to NCI. When the Group disposes of only part of an associate or joint venture while retaining significant influence or joint control, the relevant proportion of the cumulative amount is reclassified to profit or loss.
3.4 Financial instruments
Financial assetsIFRS 9 contains three principal classification categories for financial assets:
- measured at amortized cost,
- at fair value through profit or loss (‘FVTPL’)
- and at fair value through other comprehensive income (‘FVOCI’).
The classification of financial assets under IFRS 9 is generally based on the business model in which a financial asset is managed and its contractual cash flow characteristics. IFRS 9 eliminates the previous IAS 39 categories of held to maturity, loans and receivables and available-for-sale.
Gas purchase contractsThe Group has purchase contracts in place to procure natural gas for its production activities. These contracts are not accounted for as financial instruments as they are excluded for the scope of IFRS 9 through the “own use exemption”. The own use exemption applies to contracts that are entered into and continue to be held for the receipt of a non-financial item in accordance with the Group’s expected purchase, sale or usage requirements.
i. Classification and subsequent measurement
Amortized costTrade and other receivables are held to collect contractual cash flows and are expected to give rise to cash flows representing solely payments of principal and interest. The Group analyzed the contractual cash flow characteristics of those instruments and concluded that they meet the ‘hold to collect’ business model criteria for amortized cost measurement. Interest income from these assets is included in finance income using the effective interest rate method. Any gain or loss on derecognition is recognized directly in profit or loss.
Debt instrument at FVOCIThe Group sells certain portfolios of trade receivables under a securitization agreement to a third party. For these selected debtors the Group uses the ‘hold-to-collect-and-sell business model’ as defined under IFRS 9 and measure these receivables at FVOCI.
ii. Derecognition
Financial assetThe group derecognises a financial asset when:
• the contractual rights to the cash flows from the financial assets expire; or
• it transfers the rights to receive the contractual cash flows in a transaction in which either:
• substantially all of the risks and rewards of ownerships of the financial asset are transferred; or
• the group neither transfers nor retains substantially all of the risks and rewards of ownership and it does not retain control of the financial asset.
The Group enters into transactions whereby it transfers assets recognised in its statement of financial position, but retains either all or substantially all of the risks and rewards of the transferred assets. In these cases, the transferred assets are not derecognized.
Financial liabilitiesThe Group derecognises a financial liability when its contractual obligations are discharged or cancelled, or expire. The Group also derecognises a financial liability when its terms are modified and the cash flows of the modified liability are substantially different, in which case a new financial liability based on the modified terms is recognised at fair value.
On derecognition of a financial liability, the difference between the carrying amount extinguished and the consideration paid (including any non-cash assets transferred or liabilities assumed) is recognised in profit or loss.
Financial liabilities, like loans and borrowings and trade and other payables, are measured at amortized cost.
iii. Offsetting
Financial assets and financial liabilities are offset and the net amount presented in the statement of financial position when, and only when, the Group currently has a legally enforceable right to set off the amounts and it intends either to settle them on a net basis or to realise the asset and settle the liability simultaneously.
Consolidated Financial Statements
Fertiglobe Financial Statements 2020 14
NOTES TO THE CONSOLIDATED FINANCIAL STATEMENTSFOR THE YEARS ENDED 31 DECEMBER (CONTINUED)
3.5 Cash and cash equivalents
Cash and cash equivalents comprise cash balances and call deposits with original maturities of three months or less from the acquisition date (original maturity) that are subject to an insignificant risk of changes in their fair value and are used by the Group in the management of its short-term commitments.
Restricted cash comprises cash balances where specific restrictions exist on the Group’s ability to use this cash. Restricted cash includes cash deposited as collateral for letters of credit issued by the Group. Restricted funds include bank balances reserved by the lending institution for installments of loan payments to be made in the near future.
3.6 Share capital
Ordinary shares are classified as equity. Incremental costs directly attributable to the issue of new shares are recognized in equity as a deduction, net of tax, from the proceeds.
3.7 Property, plant and equipment
Items of property, plant and equipment are measured at cost less accumulated depreciation and any impairment losses. Cost includes expenditure that is directly attributable to the acquisition of the asset.
The cost of self-constructed assets includes cost of material, direct labour, other directly attributable cost incurred to bring the asset ready to its intended use, cost of asset retirement obligations and any capitalized borrowing cost.
Purchased software that is integral to the functionality of the related equipment is capitalized as part of that equipment. When parts of property, plant and equipment have different useful lives, they are accounted for as separate items (major components) of property, plant and equipment.
Any gain or loss on disposal of an item of property, plant and equipment (calculated as the difference between the net proceeds from disposal and the carrying amount of the item) is recognized in profit or loss. Subsequent expenditures are capitalized only when it is probable that the future economic benefits associated with the expenditure will flow to the Group. Ongoing repairs and maintenance costs are expensed as incurred. Spare parts of property, plant and equipment are recognized under property, plant and equipment if the average turn-over exceeds 12 months or more, otherwise they are recognized within inventories.
Property, plant and equipment under construction Expenditures incurred for purchasing and constructing property, plant and equipment are initially recorded as ‘under construction’ until the asset is completed and becomes ready for use. Upon the completion of the assets, the recognized costs are reclassified from ‘under construction’ to its final category of property, plant and equipment. Assets under construction are not depreciated and measured at cost less any impairment losses.
Depreciation Items of property, plant and equipment are depreciated on a straight-line basis through profit or loss over the estimated useful lives of each component, taking into account any residual values.
Land is not depreciated. Items of property, plant and equipment are depreciated from the date that they are installed and are ready for intended use, or in respect of internally constructed assets, from the date that the asset is completed and ready for intended use.
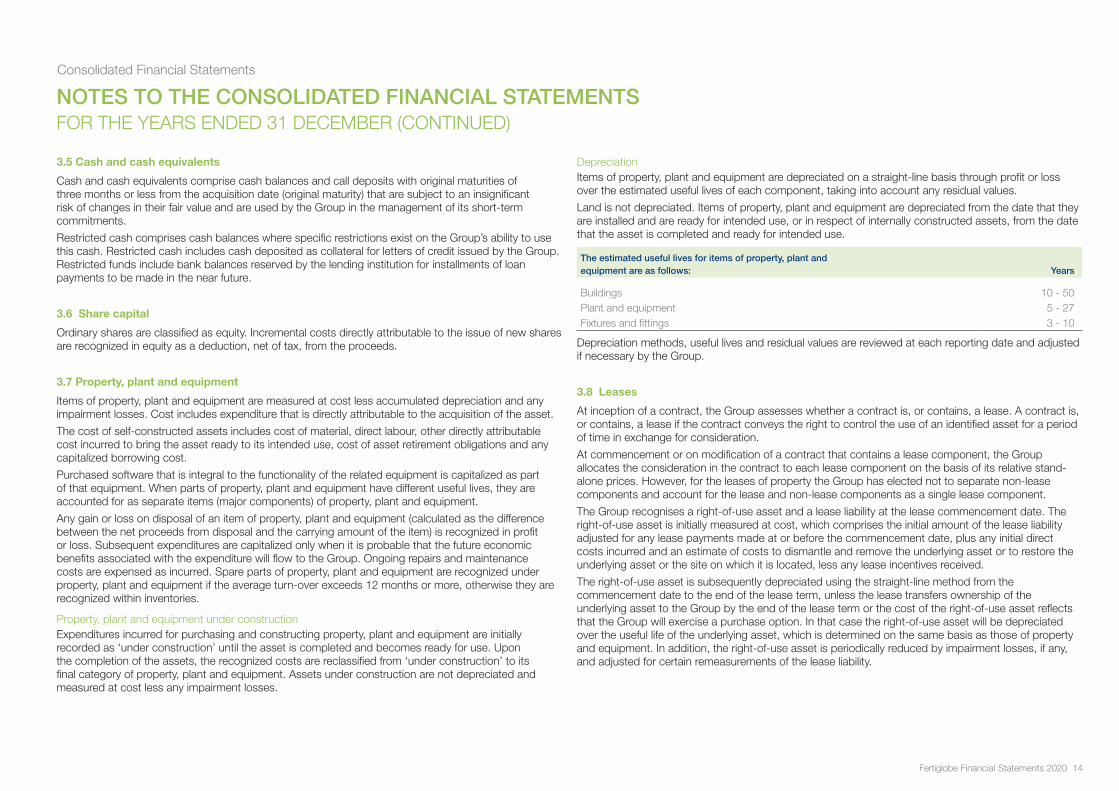
The estimated useful lives for items of property, plant and equipment are as follows: Years
Buildings 10 - 50Plant and equipment 5 - 27Fixtures and fittings 3 - 10
Depreciation methods, useful lives and residual values are reviewed at each reporting date and adjusted if necessary by the Group.
3.8 Leases
At inception of a contract, the Group assesses whether a contract is, or contains, a lease. A contract is, or contains, a lease if the contract conveys the right to control the use of an identified asset for a period of time in exchange for consideration.
At commencement or on modification of a contract that contains a lease component, the Group allocates the consideration in the contract to each lease component on the basis of its relative stand-alone prices. However, for the leases of property the Group has elected not to separate non-lease components and account for the lease and non-lease components as a single lease component.
The Group recognises a right-of-use asset and a lease liability at the lease commencement date. The right-of-use asset is initially measured at cost, which comprises the initial amount of the lease liability adjusted for any lease payments made at or before the commencement date, plus any initial direct costs incurred and an estimate of costs to dismantle and remove the underlying asset or to restore the underlying asset or the site on which it is located, less any lease incentives received.
The right-of-use asset is subsequently depreciated using the straight-line method from the commencement date to the end of the lease term, unless the lease transfers ownership of the underlying asset to the Group by the end of the lease term or the cost of the right-of-use asset reflects that the Group will exercise a purchase option. In that case the right-of-use asset will be depreciated over the useful life of the underlying asset, which is determined on the same basis as those of property and equipment. In addition, the right-of-use asset is periodically reduced by impairment losses, if any, and adjusted for certain remeasurements of the lease liability.
Consolidated Financial Statements
Fertiglobe Financial Statements 2020 15
NOTES TO THE CONSOLIDATED FINANCIAL STATEMENTSFOR THE YEARS ENDED 31 DECEMBER (CONTINUED)
3.8 Leases (continued)
The lease liability is initially measured at the present value of the lease payments that are not paid at the commencement date, discounted using the interest rate implicit in the lease or, if that rate cannot be readily determined, the Group’s incremental borrowing rate. Generally, the Group uses its incremental borrowing rate as the discount rate.
The Group determines its incremental borrowing rate by obtaining interest rates from various external financing sources and makes certain adjustments to reflect the terms of the lease and type of the asset leased.
Lease payments included in the measurement of the lease liability comprise the following:
- fixed payments, including in-substance fixed payments;
- variable lease payments that depend on an index or a rate, initially measured using the index or rate as at the commencement date;
- amounts expected to be payable under a residual value guarantee; and
- the exercise price under a purchase option that the Group is reasonably certain to exercise, lease payments in an optional renewal period if the Group is reasonably certain to exercise an extension option, and penalties for early termination of a lease unless the Group is reasonably certain not to terminate early.
The lease liability is measured at amortised cost using the effective interest method. It is remeasured when there is a change in future lease payments arising from a change in an index or rate, if there is a change in the Group’s estimate of the amount expected to be payable under a residual value guarantee, if the Group changes its assessment of whether it will exercise a purchase, extension or termination option or if there is a revised in-substance fixed lease payment.
When the lease liability is remeasured in this way, a corresponding adjustment is made to the carrying amount of the right-of-use asset, or is recorded in profit or loss if the carrying amount of the right-of-use asset has been reduced to zero.
Short-term leases and leases of low-value assetsThe Group has elected not to recognise right-of-use assets and lease liabilities for leases of low-value assets and short-term leases, including IT equipment. The Group recognises the lease payments associated with these leases as an expense on a straight-line basis over the lease term.
3.9 Goodwill
GoodwillGoodwill represents the excess of purchase price and related costs over the value assigned to the Groups’ share of identifiable assets acquired and liabilities assumed of businesses acquired that were directly attributable to the legal entities comprising the Group. If on the date of acquisition the fair value of the net assets acquired is in excess of the aggregate consideration transferred, the gain is recognized in profit or loss.
Goodwill on acquisition of entities that qualify as subsidiaries is presented under ‘Goodwill’. Goodwill on acquisitions of entities that qualify as associates or joint ventures is included in ‘Equity-accounted investees’. Goodwill on acquisition of subsidiaries is allocated to cash-generating units for the purpose of impairment testing.
The allocation is made to those cash-generating units or group of units that are expected to benefit from the business combination through which the goodwill arose, based on past experience.
After initial recognition, goodwill is measured at cost less any impairment losses. Goodwill is tested annually for impairment; an impairment loss is recognized for the amount by which the cash-generating unit’s carrying amount exceeds its recoverable amount. The recoverable amount of the cash-generating unit is determined by the higher of its fair value less cost to sell and its value in use. Impairment losses on goodwill are not reversed. Gains or losses on the disposal of an entity include the carrying amount of goodwill related to the entity sold. All other expenditures on internally generated goodwill and other intangible assets is recognized in profit or loss as incurred.
3.10 Inventories
Inventories are measured at the lower of cost and net realizable value. The cost of inventories of raw materials, spare parts and supplies are based on the weighted average principle and includes expenditure incurred in acquiring the inventories and bringing them to their existing location and condition. In case of manufactured inventories, cost includes an appropriate share of production overheads based on normal operating capacity. Net realizable value is the estimated selling price in the ordinary course of business, less the estimated costs of completion and selling expenses.
In case the net realisable value (NRV) is lower than the cost of inventory a write down is required. A write-down to NRV may be required when inventory is damaged; or becomes wholly or partially obsolete; or when the selling price for the product is reduced; or the estimated costs of completion, or the estimated costs to be incurred to make the sale, have increased;
Consolidated Financial Statements
Fertiglobe Financial Statements 2020 16
NOTES TO THE CONSOLIDATED FINANCIAL STATEMENTSFOR THE YEARS ENDED 31 DECEMBER (CONTINUED)
3.11 Impairment of assets
Non-derivative financial assetsThe Group assesses at each balance sheet date whether there is objective evidence that a non-derivative financial asset or a group of non-derivative financial assets is impaired. A non-derivative financial asset is considered to be impaired if the counterparty does not meet the agreed payment terms or when evidence exists that the counterpart will not be able to do so. The Group considers evidence of impairment for these assets at both an individual asset and a collective level. All individually significant assets are individually assessed for impairment. Those found not to be impaired are then collectively assessed for any impairment that has been incurred but not yet individually identified. Assets that are not individually significant are collectively assessed for impairment. Collective assessment is carried out by grouping together assets with similar risk characteristics. In assessing collective impairment, the Group uses historical information on the timing of recoveries and the amount of loss incurred, and makes an adjustment if current economic and credit conditions are such that the actual losses are likely to be greater or lesser than suggested by historical trends. An impairment loss is recognized for the amount by which the carrying amount of a non-derivative financial asset exceeds its estimated discounted future cash flows using the original interest rate. Impaired non-derivative financial assets are tested periodically to determine whether the estimated future cash flows have increased and the impairment has to be reversed. Reversal of impairments is only permitted if in a subsequent period after an impairment loss has been recognized, the amount of the impairment loss decreases and the decrease can be related objectively to an event after the impairment loss was recognized.
Non-financial assets Non-financial assets that have an indefinite useful life, for example goodwill, are not subject to amortization but are tested annually for impairment or more frequently when indicators arise. Assets with a finite useful life are subject to depreciation or amortization and are reviewed at each reporting date to determine whether there is an indication of impairment. If any such indication exists, then the assets’ recoverable amount is estimated. An impairment loss is recognized for the amount by which the assets’ carrying amount exceeds its recoverable amount. The recoverable amount is the higher of an asset’s fair value less costs of disposal and its value in use. The value in use is the present value of the future cash flows expected to be derived from an asset or cash-generating unit by continued use. For the purposes of assessing impairment, assets are grouped based on the lowest level for which there are separately identifiable cash flows (cash-generating units). Impairment losses are recognized in profit or loss.
They are allocated first to reduce the carrying amount of any goodwill allocated to the CGU, and then to reduce the carrying amounts of the other assets in the CGU on a pro-rata basis. Non-financial assets, which are impaired, are tested periodically to determine whether the recoverable amount has increased and the impairment be (partially) reversed. Impairment losses on goodwill are not reversed. For other assets, an impairment loss is reversed only to the extent that the asset’s carrying amount does not exceed the carrying amount that would have been determined, net of depreciation or amortization, if no impairment loss had been recognized. Reversal of impairments is only permitted if in a subsequent period after an impairment loss has been recognized, the amount of the impairment loss decreases and the decrease can be related objectively to an event after the impairment loss was recognized.
3.12 Provisions
Provisions are recognized when a present legal or constructive obligation based on past events exists, and it is probable that an outflow of economic benefits is required to settle the obligation. If the outflow is probable, but cannot be determined reliably, the obligation is disclosed. The non-current part of provisions is determined by discounting the expected future cash flows at a pre-tax rate that reflects current market assessments of the time value of money and the risks specific to the liability. The unwinding of the discount is recognized as finance cost.
Asset retirement obligationsThe Group recognizes a provision if the Group has an obligation to restore a leased asset in its original condition at the end of its lease term and in case of legal requirements with respect to cleanup of contamination of land, and the estimate can be made reliable. Based on the land lease of their production facilities, some entities have the obligation to restore their site upon decommissioning. The Group has not recorded a liability for this conditional asset retirement obligation, as it does not believe there is currently a reasonable basis for estimating a date or range of dates of cessation of the operations, which is necessary to estimate the fair value of this liability. Considering that maintenance, turnarounds and any other upgrades will be conducted on a regular basis as was done in the past, this can extend the physical life of the production facility indefinitely (also taken into account the possible changes in technology and availability of raw materials).
Claims and contingenciesThe Group is subject to legal and regulatory proceedings in various jurisdictions. Such proceedings may result in criminal or civil sanctions, penalties or disgorgements against the Group. If it is probable that an obligation to the Group exists, which will result in an outflow of resources and the amount of the outflow can be reliably estimated, a provision is recognized.
Donation provisionThe donation provision is recognized as a constructive obligation, the amount is undiscounted as the Group does not know the exact settlement date.
3.13 Segment reporting
An operating segment is a component of an entity that engages in business activities for which it mayearn revenues and incur expenses (including revenues and expenses relating to transactions with othercomponents of the same entity), whose operating results are regularly reviewed by the entity’s ChiefOperating Decision Maker (‘CODM’) to make decisions about resource allocation to the segment and toassess its performance and for which discrete financial information is available.The Group determinesand presents operating segments on the basis of information that internally is provided to the CODMduring the period. Operating segments are grouped into reporting segments based on similar economicenvironments and similar products.
Consolidated Financial Statements
Fertiglobe Financial Statements 2020 17
NOTES TO THE CONSOLIDATED FINANCIAL STATEMENTSFOR THE YEARS ENDED 31 DECEMBER (CONTINUED)
3.14 Revenue from contracts with customers
Revenues are recognized to depict the transfer of goods or services to customers in the ordinary course of the Group’s activities, in the amounts that reflect the considerations to which the Group expects to be entitled in exchange for those goods or services. Revenue is recognized when the Group satisfies the performance obligations by transferring promised goods or services to customers. The main performance obligation of the Group is the transfer of Fertilizer products to customers.
Goods are transferred when the customer obtains control of the asset. The timing of when control transfers depends on the sales and shipping terms agreed. Invoices are generated and revenue is recognised at that point in time. Invoices are usually payable within 30 days.
Revenue is recognized net of expected discounts to customers. Accumulated experience and management judgement is used to estimate and provide for the discounts and revenue is only recognized to the extent that it is highly probably that a significant reversal will not occur. The Group does not have any contracts where the period of time between the transfer of the promised goods or services to the customer and payment by the customer exceeds one year. Consequently, no adjustment is made to transaction prices for the time value of money.
3.15 Finance income and cost
Finance income comprises:
• interest income on funds invested (including on financial assets at fair value through other comprehensive income);
• gains on the disposal of financial assets at fair value through other comprehensive income;
• dividend income;
• fair value gains on financial assets at fair value through profit or loss;
• gains on hedging instruments related to foreign currency and interest rate derivatives that are recognized in profit or loss and reclassifications of amounts previously recognized in other comprehensive income; and
• interest income is recognized as it accrues in profit or loss, using the effective interest method.
Finance cost comprises:
• interest expense on borrowings;
• unwinding of the discount on provisions and contingent consideration;
• interest expense related to lease obligations;
• losses on disposal of financial assets at fair value through other comprehensive income;
• fair value losses on financial assets at fair value through profit or loss;
• loss on hedging instruments related to foreign currency and interest rate derivatives that are recognized in profit or loss and reclassifications of amounts previously recognized in other comprehensive income; and
• impairment losses recognized on financial assets (other than trade receivables).
Borrowing costs that are not directly attributable to the acquisition, construction or production of a qualifying asset are recognized in profit or loss and expensed as incurred.
3.16 Employee benefits
Defined contribution planCertain Group subsidiaries provide pension plans, end of service remuneration plans and long-term service benefits. These pension plans qualify as defined contribution plans. Obligations for contributions to defined contribution plans are expensed as the related service is provided. Prepaid contributions are recognized as an asset to the extent that a cash refund or a reduction in future payments is available.
Short-term employee benefitsShort-term employee benefits are expensed as the related service is provided. A liability is recognized for the amount expected to be paid if the Group has a present legal or constructive obligation to pay this amount as a result of past service provided by the employee and the obligation can be estimated reliably.
Long-term employee benefitsThe Group long-term employee benefits are recognized if the Group has a present legal or constructive obligation to pay this amount as a result of past service provided by the employee and the obligation can be estimated reliably to determine its present value. The discount rate is the yield at the balance sheet date on triple-A (‘AAA’) credit rated bonds that have maturity dates approximating to the terms of the Group’s obligations. Re-measurements are recognized in profit or loss in the period in which they arise.
Termination benefits Employee termination benefits are payable when employment is terminated before the normal retirement date, or whenever an employee accepts voluntary redundancy in exchange for these benefits. The Group recognizes termination benefits when it is demonstrably committed to either terminating the employment of current employees according to a detailed formal plan without possibility of withdrawal, or when the Group is providing termination benefits as a result of an offer made to encourage voluntary redundancy. Benefits falling due more than 12 months after balance sheet date are discounted to present value.
3.17 Income tax
Current taxCurrent tax is the expected tax payable or receivable on the taxable income or loss for the year, using tax rates enacted or substantively enacted at the reporting date, and any adjustment to tax payable or receivable in respect of previous years. The amount of current tax payable or receivable is the best estimate of the tax amount expected to be paid or received that reflects uncertainty related to income taxes, if any. Current tax payable also includes any tax liability arising from the declaration of dividends. Current income tax receivable and payable are offset when there is a legally enforceable right to offset and when the current income tax relates to the same fiscal authority.
Consolidated Financial Statements
Fertiglobe Financial Statements 2020 18
NOTES TO THE CONSOLIDATED FINANCIAL STATEMENTSFOR THE YEARS ENDED 31 DECEMBER (CONTINUED)
3.17 Income tax (continued)
Deferred taxDeferred income tax liabilities are recognized for all taxable temporary differences arising between the tax bases of assets and liabilities and their carrying amounts in the consolidated financial statements (‘balance sheet’ method). Deferred income tax assets are recognized for all deductible temporary differences, unused carry forward losses and unused carry forward tax credits, to the extent that it is probable that future taxable profit will be available against which the deferred income tax assets can be utilized.
Deferred income tax is not recognized if it arises from initial recognition of an asset or liability in a transaction that is not a business combination and at the time of the transaction affects neither accounting nor taxable profit or loss. Also, no deferred income tax is recognized regarding the initial recognition of goodwill and regarding investments in subsidiaries, associates and joint arrangements to the extent that the Group is able to control the timing of the reversal of the temporary differences and it is probable that they will not reverse in the foreseeable future.
Deferred income tax is measured at the tax rates that are expected to apply to the period when the asset is realized or the liability is settled, based on tax rates (and tax laws) that have been enacted or substantively enacted at the balance sheet date. Deferred income tax assets and liabilities are offset when there is a legally enforceable right to offset current tax assets against current tax liabilities and when the deferred income tax relates to the same fiscal authority.
In cases where it is concluded it is not probable that tax authorities will accept a tax treatment, the effect of the uncertainty is reflected in the recognition and measurement of tax assets and liabilities or, alternatively, a provision is made for the amount that is expected to be settled, where this can be reasonably estimated. This assessment relies on estimates and assumptions and may involve a series of judgments about future events. New information may become available that causes the company to change its judgment regarding the adequacy of existing tax assets and liabilities. Such changes to tax assets and liabilities will impact the income tax expense in the period during which such a determination is made.
3.18 Consolidated statement of cash flows
The consolidated statement of cash flows has been prepared using the ‘indirect’ method. Cash flows in foreign currencies have been translated applying average exchange rates. Currency translation differences are shown separately in the consolidated statement of cash flows. Cash flows from investing activities consist mostly of investments and divestments in property, plant and equipment, intangible assets, and acquisitions insofar as these are paid for in cash. Acquisitions or disposals of subsidiaries are presented as acquisition of subsidiary, net of cash.
3.19 Earnings per share
Earnings per ordinary share are calculated by dividing the profit or loss (net) attributable to holders ofordinary shares by the weighted average number of ordinary shares outstanding during the year. Inmaking this calculation the (ordinary) treasury shares are deducted from the number of ordinary sharesoutstanding.
4. New accounting standards and policies
On a regular basis, the IASB issues new accounting standards, amendments and revisions to existing standards and interpretations. These new accounting standards, amendments and revisions to existing standards and interpretations are subject to endorsement by the Abu Dhabi Global Market Companies Regulation of 2020.
4.1 Standards, amendments, revisions and interpretations that became effective to the Group during 2020
The standards and interpretations that became effective in 2020 do not have a material impact on Fertiglobe during 2020.
4.2 New revised IFRS in issue but not yet effective
IFRS standards and interpretations thereof not yet in force which may apply to the future Group’s consolidated financial statements are being assessed for their potential impact. Currently there are no standards and interpretations not yet effective that would have a significant impact on the Group.
Consolidated Financial Statements
Fertiglobe Financial Statements 2020 19
NOTES TO THE CONSOLIDATED FINANCIAL STATEMENTSFOR THE YEARS ENDED 31 DECEMBER (CONTINUED)
5. Critical accounting judgment, estimates and assumptions
The preparation of the consolidated financial statements in compliance with IFRS requires management to make judgments, estimates and assumptions that affect amounts reported in the consolidated financial statements. The estimates and assumptions are based on experience and various other factors that are believed to be reasonable under the circumstances and are used to judge the carrying values of assets and liabilities that are not readily apparent from other sources.
The estimates and underlying assumptions are reviewed on an ongoing basis. Revisions to accounting estimates are recognized in the period in which the estimate is revised or in the revision period and future periods, if the changed estimates affect both current and future periods.
The most critical accounting policies, involving a higher degree of judgment and complexity in applying principles of valuation and for which changes in the assumptions and estimates could result in significantly different results than those recorded in the financial statements, are the following:
Goodwill and other intangible assetsIntangible assets with finite useful lives are carried at cost less cumulative amortization and any impairment. Amortization is calculated using the ‘straight-line’ method based on the estimated useful lives. Management makes estimates regarding the useful lives and residual values and assumes that amortization takes place on a ‘straight-line’ basis. The assets’ useful lives are reviewed, and adjusted if appropriate, at each balance sheet date. For intangible assets with finite useful lives, Fertiglobe assesses annually or more frequently whether indicators exist that suggest the intangible asset might be impaired by comparing the recoverable amounts with their carrying amounts. In determining the recoverable amounts of intangible assets, Fertiglobe makes estimates and assumptions about future cash flows based on the value in use.
In doing so, Management also makes assumptions and estimates regarding the discount rates in order to calculate the net present value of the future cash flows. Management tests at least annually whether goodwill is impaired by comparing the recoverable amounts of cash-generating units with their carrying amounts. The recoverable amount is the higher of the fair value less cost of disposal and the value in use. In determining the recoverable amount, Management makes estimates and assumptions concerning future revenues, future costs, future working capital, future investments, Weighted Average Cost of Capital (‘WACC’) and future inflation rates. (Note 8)
Property, plant and equipmentDepreciation is calculated using the ‘straight-line’ method based on the estimated useful lives, taking into account any residual values. Management makes estimates regarding the useful lives and residual values and assumes that depreciation takes place on a ‘straight-line’ basis. The assets’ residual values and useful lives are reviewed, and adjusted if appropriate, at each balance sheet date. Management assesses annually, or more frequently, whether indicators exist that suggest that an item of property, plant and equipment might be impaired by comparing the recoverable amounts with their carrying amounts.
In determining the recoverable amounts of property, plant and equipment, management makes estimates and assumptions about future cash flows based on the value in use. The discount rate to be used in order to calculate the net present value of the future cash flows in the impairment analysis is based on the WACC. (Note 7)
Asset retirement obligations The Group recognizes a provision if the Group has an obligation to restore a leased asset in its original condition at the end of its lease term and in case of legal requirements with respect to clean-up of contamination of land, and the estimate can be made reliable. Based on the land lease of their production facilities, some entities have the obligation to restore their site upon decommissioning.
The Group has not recorded a liability for this conditional asset retirement obligation, as it does not believe there is currently a reasonable basis for estimating a date or range of dates of cessation of the operations, which is necessary to estimate the fair value of this liability. Considering that maintenance, turnarounds and any other upgrades will be conducted on a regular basis as was done in the past, this can extend the physical life of the production facility (also taken into account the possible changes in technology and availability of raw materials).
Inventories In determining the net realizable value of inventories, the Group estimates the selling prices in the ordinary course of business less cost to sell. In doing so, the Group makes estimates and assumptions based on current market prices, historical usage of various product categories versus current inventory levels and specific identified obsolescence risks (e.g. end of life of specific goods and spare parts and the impact of new environmental legislation). determining the net realizable value of inventories, the Group estimates the selling prices in the ordinary course of business, cost of completion and cost to sell. (Note 11)
Provisions Recognition of provisions include significant estimates, assumptions and judgments. IFRS requires only those provisions to be recognized if there is an expected outflow of resources in the near future and if the cost of these outflows can be estimated reliably.
Accordingly, management exercises considerable judgment in determining whether it is more likely than not that there is a present obligation as a result of a past event at the end of the reporting period, whether it is probable that such a proceeding will result in an outflow of resources and whether the amount of the obligation can be reliably estimated. These judgments are subject to change as new information becomes available.
The required amount of a provision may change in the future due to new developments in the matter. Revisions to estimates may significantly impact future profit or loss. Upon resolution, the Group may incur charges in excess of the recorded provisions for such matters. Provisions for asset retirement obligations, represent estimated costs of decommissioning. Due to the long time period over which future cash outflows are expected to occur, including the respective interest accretion, assumptions are required to be made. Amongst others, the estimated cash outflows could alter significantly if, and when, political developments affect future laws and regulation with respect to asset retirements. The Group has not recognized any asset retirement obligations because a reliable estimate of the amount of the obligations cannot be made.
With respect to legal cases, the Group has to estimate the outcome. Regulatory and legal proceedings as well as government investigations often involve complex legal issues and are subject to substantial uncertainties. The Group periodically reviews the status of these proceedings with both the internal and external legal counsels. (Note 19)
Consolidated Financial Statements
Fertiglobe Financial Statements 2020 20
5. Critical accounting judgment, estimates and assumptions (continued)
Income taxes The Group is subject to income taxes in several jurisdictions. Estimates are required in determining the group-wide provision for income taxes. There are some transactions and calculations for which the ultimate tax position is uncertain during the ordinary course of business. The Group recognizes provisions for anticipated tax audit issues based on estimates of whether additional taxes will be due. Where the final tax outcome of these matters is different from amounts that were initially recorded, such differences will impact the current income tax and deferred tax provisions in the period in which such determination is made. The Group recognizes deferred tax assets to the extent that it is probable that future taxable profits will be available for the deferred tax asset to be recovered. This is based on estimates of taxable future income by jurisdiction in which the Group operates and the period over which deferred tax assets are expected to be recoverable. In the event that actual results or new estimates differ from previous estimates and depending on the possible tax strategies that may be implemented, changes to the recognition of deferred tax assets could be required, which could impact the financial position and profit or loss. (Note 10)
Leases The assessment of whether a contract is or contains a lease requires judgment with respect to whether the lessor has substantive substitution rights, who obtains economic benefits from use of the asset and who takes the ‘how and for what purpose’ decisions during the period of use.
Judgement is also applied in order to assess whether the entity will exercise any extension or cancelation options of a lease. The group applies judgments in order to determine the incremental borrowing rate in order to calculate the lease liability. (Note 17)
Liquidity riskAs part of the preparation of the financial statements, the Group has assessed its liquidity risk and going concern. Liquidity risk is the risk that the Group may encounter difficulty in meeting the obligations associated with its financial liabilities that are settled by delivering cash or another financial asset. The Group has made a number of assumptions in assessing its ability to meet its covenant requirements (Note 16) and satisfy obligations as they become due. Determining these assumptions requires significant judgment about future results and cash flows.
Key assumptions include product pricing, gas pricing, utilization rates and the ability to arrange financing and obtain waivers for potential covenant breaches.
6. Financial risk and capital management
OverviewThe Group has exposure to credit, liquidity and market risks from financial instruments. These risks arise from exposures that occur in the normal course of business and are managed on a consolidated company basis. This note presents information about the Group’s exposure to each of the above risks, the Group’s objectives, policies and processes for measuring and managing these risks, additionally it also includes the Group’s management of capital.
Risk management frameworkThe Board has oversight responsibility on the establishment and monitoring of the Group’s risk management framework. Senior (local) management is responsible for the effective operation of the internal risk management and control systems.
The Finance department is responsible for the facilitation and supervision of the Risk Management function, compliance with the Group Internal Control Framework and supports the Board in the exercise of their risk management duties.
The Audit Committee oversees how management monitors compliance with the Group’s risk management policies and procedures and reviews the adequacy of the risk management framework in relation to the risks faced by the Group.
6.1 Credit risk
Credit risk is the risk of financial loss to the Group if a customer or counterparty to a financial instrument fails to meet its contractual obligations, and arises principally from the Group’s receivables from customers and investments in debt securities. The Group mitigates the exposure to credit risk on outstanding cash balances by placing funds at multiple financial institutions with a sufficient credit rating. The Group’s exposure to customer credit risk is monitored and mitigated by performing credit checks before selling any goods. No collateral is received.
The Group establishes an allowance, if needed, for impairment that represents its estimate of expected losses in respect of trade and other receivables.
The main components of this allowance are a specific loss component that relates to individually significant exposures, and a collective loss component established for groups of similar assets in respect of losses that are expected based on historical performance. IFRS 9 establishes a three-stage impairment model, based on whether there has been a significant increase in the credit risk of a financial asset since its initial recognition.
As at 31 December 2020, management assessed the credit risk based on internal and external factors related to the financial instruments and recognized an allowance related to credit risk. (Note 9)
With respect to transactions with financial institutions, the Group sets a minimum credit rating for the counterparties. The maximum exposure to credit risk is the carrying amount of financial instruments, for an overview reference is made to the tables financial instruments by category. There is no significant concentration of credit risk in trade and other receivables, financial assets at fair value through other comprehensive income or cash and cash equivalents. Significantly all of Fertiglobe trade and other receivables balances are with strategic customers that are collateralized by letters of credit, guarantees and securitization, or are due from government entities.
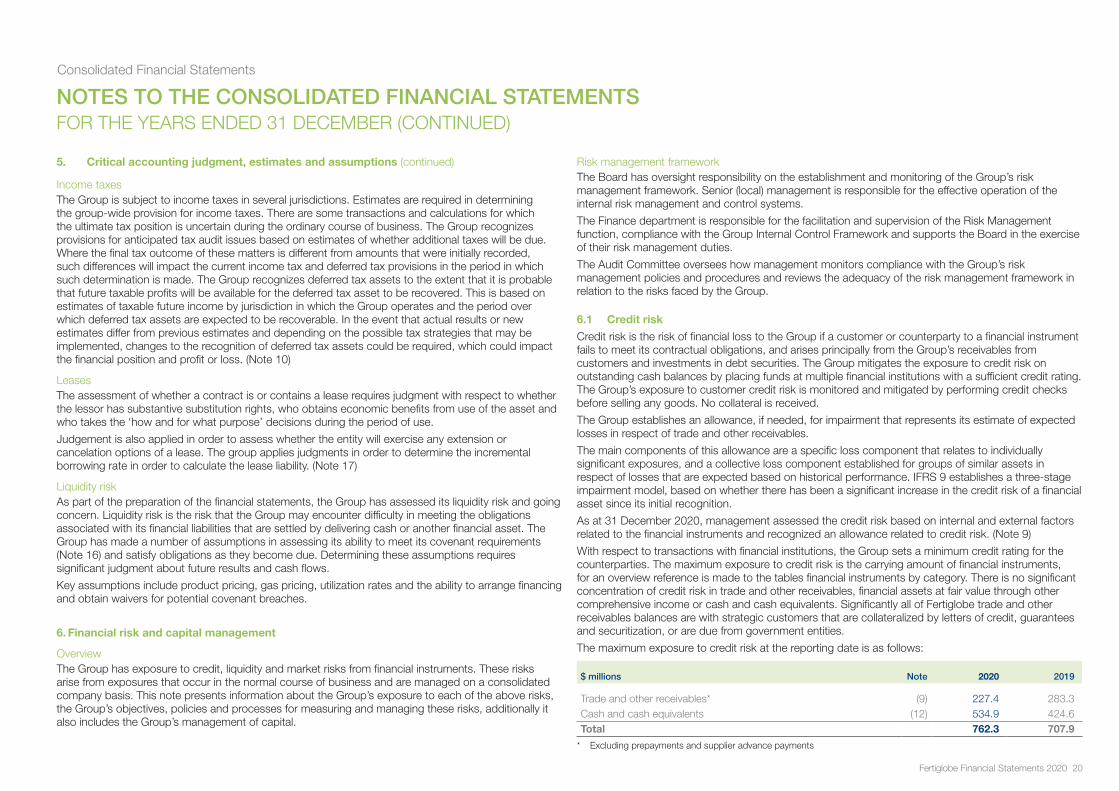
The maximum exposure to credit risk at the reporting date is as follows:
$ millions Note 2020 2019
Trade and other receivables* (9) 227.4 283.3Cash and cash equivalents (12) 534.9 424.6Total 762.3 707.9
* Excluding prepayments and supplier advance payments
NOTES TO THE CONSOLIDATED FINANCIAL STATEMENTSFOR THE YEARS ENDED 31 DECEMBER (CONTINUED)
Consolidated Financial Statements
Fertiglobe Financial Statements 2020 21
6. Credit risk (continued)
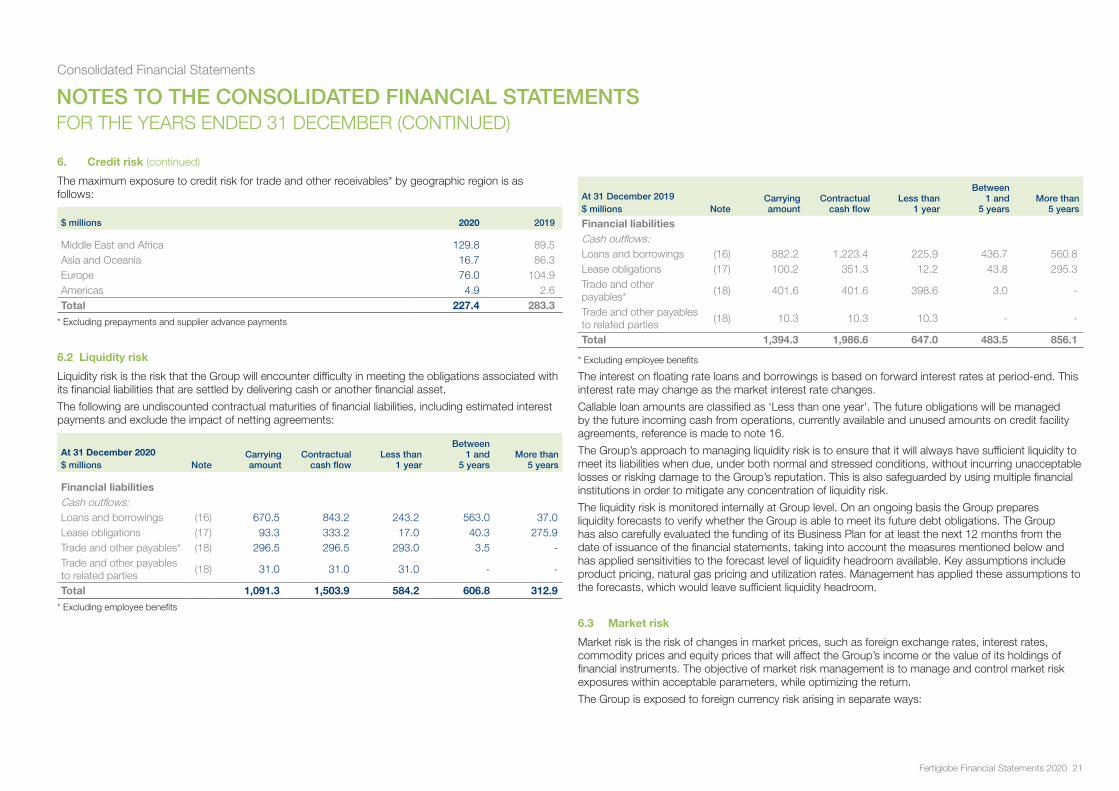
The maximum exposure to credit risk for trade and other receivables* by geographic region is as follows:
$ millions 2020 2019
Middle East and Africa 129.8 89.5Asia and Oceania 16.7 86.3Europe 76.0 104.9Americas 4.9 2.6Total 227.4 283.3
* Excluding prepayments and supplier advance payments
6.2 Liquidity risk
Liquidity risk is the risk that the Group will encounter difficulty in meeting the obligations associated with its financial liabilities that are settled by delivering cash or another financial asset.
The following are undiscounted contractual maturities of financial liabilities, including estimated interest payments and exclude the impact of netting agreements:
At 31 December 2020$ millions Note
Carryingamount
Contractualcash flow
Less than 1 year
Between 1 and
5 yearsMore than
5 years
Financial liabilitiesCash outflows:Loans and borrowings (16) 670.5 843.2 243.2 563.0 37.0Lease obligations (17) 93.3 333.2 17.0 40.3 275.9Trade and other payables* (18) 296.5 296.5 293.0 3.5 -Trade and other payables to related parties
(18) 31.0 31.0 31.0 - -
Total 1,091.3 1,503.9 584.2 606.8 312.9
* Excluding employee benefits
At 31 December 2019$ millions Note
Carryingamount
Contractualcash flow
Less than 1 year
Between 1 and
5 yearsMore than
5 years
Financial liabilitiesCash outflows:Loans and borrowings (16) 882.2 1,223.4 225.9 436.7 560.8Lease obligations (17) 100.2 351.3 12.2 43.8 295.3Trade and other payables*
(18) 401.6 401.6 398.6 3.0 -
Trade and other payables to related parties
(18) 10.3 10.3 10.3 - -
Total 1,394.3 1,986.6 647.0 483.5 856.1
* Excluding employee benefits
The interest on floating rate loans and borrowings is based on forward interest rates at period-end. This interest rate may change as the market interest rate changes.
Callable loan amounts are classified as ‘Less than one year’. The future obligations will be managed by the future incoming cash from operations, currently available and unused amounts on credit facility agreements, reference is made to note 16.
The Group’s approach to managing liquidity risk is to ensure that it will always have sufficient liquidity to meet its liabilities when due, under both normal and stressed conditions, without incurring unacceptable losses or risking damage to the Group’s reputation. This is also safeguarded by using multiple financial institutions in order to mitigate any concentration of liquidity risk.
The liquidity risk is monitored internally at Group level. On an ongoing basis the Group prepares liquidity forecasts to verify whether the Group is able to meet its future debt obligations. The Group has also carefully evaluated the funding of its Business Plan for at least the next 12 months from the date of issuance of the financial statements, taking into account the measures mentioned below and has applied sensitivities to the forecast level of liquidity headroom available. Key assumptions include product pricing, natural gas pricing and utilization rates. Management has applied these assumptions to the forecasts, which would leave sufficient liquidity headroom.
6.3 Market risk
Market risk is the risk of changes in market prices, such as foreign exchange rates, interest rates, commodity prices and equity prices that will affect the Group’s income or the value of its holdings of financial instruments. The objective of market risk management is to manage and control market risk exposures within acceptable parameters, while optimizing the return.
The Group is exposed to foreign currency risk arising in separate ways:
NOTES TO THE CONSOLIDATED FINANCIAL STATEMENTSFOR THE YEARS ENDED 31 DECEMBER (CONTINUED)
Consolidated Financial Statements
Fertiglobe Financial Statements 2020 22
6. Market risk (continued)
Foreign exchange translation risk Due to the Group’s international presence, the Group is exposed to foreign exchange fluctuations as these affect the translation of the Group’s business entities presented in foreign currencies that are different from the US dollar (which is the Group’s functional currency). The currencies concerned are mainly the Euro and the Algerian dinar. Foreign exchange translation exposure is considered a part of doing business on an international level; this risk is not hedged. The Group seeks to mitigate translation risk to our credit metrics by broadly matching the currency of debt with cashflows.
Foreign exchange transaction riskThe Group entities predominantly execute their activities in their respective functional currencies. The Group is however exposed to foreign exchange transaction risk to the extent that there is a mismatch between the currencies in which sales, purchases, investments and borrowings are denominated and the respective functional currencies of the Group entities. The Group monitors the exposure to foreign currency risk arising from operating activities and enters selectively into foreign exchange contracts to hedge foreign currency exposures. The functional currencies of the Group entities are primarily the US dollar, the Algerian dinar and the Euro. EFC and EBIC have exposure to fluctuations in the USD/EGP exchange rates.
The summary of balances of the Group’s exposure to foreign exchange transaction, where the main exposure currencies are different from the functional currencies, including intercompany balances, is as follows:
At 31 December 2020$ millions USD EUR EGP
Trade and other receivables 8.9 4.8 87.6Trade and other receivables intercompany 1,123.8 0.7 0.8Trade and other payables - (4.1) (7.6)Trade and other payables intercompany (3.8) (1.1) -Loans and borrowings - - -Loans and borrowings intercompany (1,118.3) - -Provisions - - (120.9)Cash and cash equivalents 233.1 8.8 26.5
At 31 December 2019$ millions USD EUR EGP
Trade and other receivables 7.3 6.4 77.8Trade and other receivables intercompany 1,090.3 3.4 0.1Trade and other payables (4.7) (0.8) (16.3)Trade and other payables intercompany (8.8) (1.0) (0.2)Loans and borrowings - - (51.4)Loans and borrowings intercompany (1,082.4) - -Provisions - - (118.7)Cash and cash equivalents 224.2 19.0 23.4
The Algerian dinar is not included in the above table of foreign exchange transaction exposure, since there are no entities in the Group which have monetary items denominated in Algerian dinar, except for Sorfert, which has the Algerian dinar as its functional currency.
Significant ratesThe following significant exchange rates applied during the year:
Average 2020
Average 2019
Closing 2020
Closing 2019
Euro 1.1418 1.1193 1.2225 1.1213Egyptian pound 0.0632 0.0596 0.0635 0.0623Algerian dinar 0.0079 0.0084 0.0076 0.0084
The following tables demonstrate the sensitivity to a reasonably possible change in USD foreign exchange rate against EUR, EGP and DZD exchange rates, with all other variables held constant. The Group’s exposure to foreign currency changes for all other currencies is not material.
31 December 2020$ millions
Change in FX rate
Effect on profit
before tax
Effect on other
comprehensive income
EUR - USD 8 percent 0.5 -
(8) percent (0.5) -
EGP - USD 3 percent (0.4) -
(3) percent 0.4 -
DZD - USD 3 percent 7.2 -(3) percent (7.2) -
NOTES TO THE CONSOLIDATED FINANCIAL STATEMENTSFOR THE YEARS ENDED 31 DECEMBER (CONTINUED)
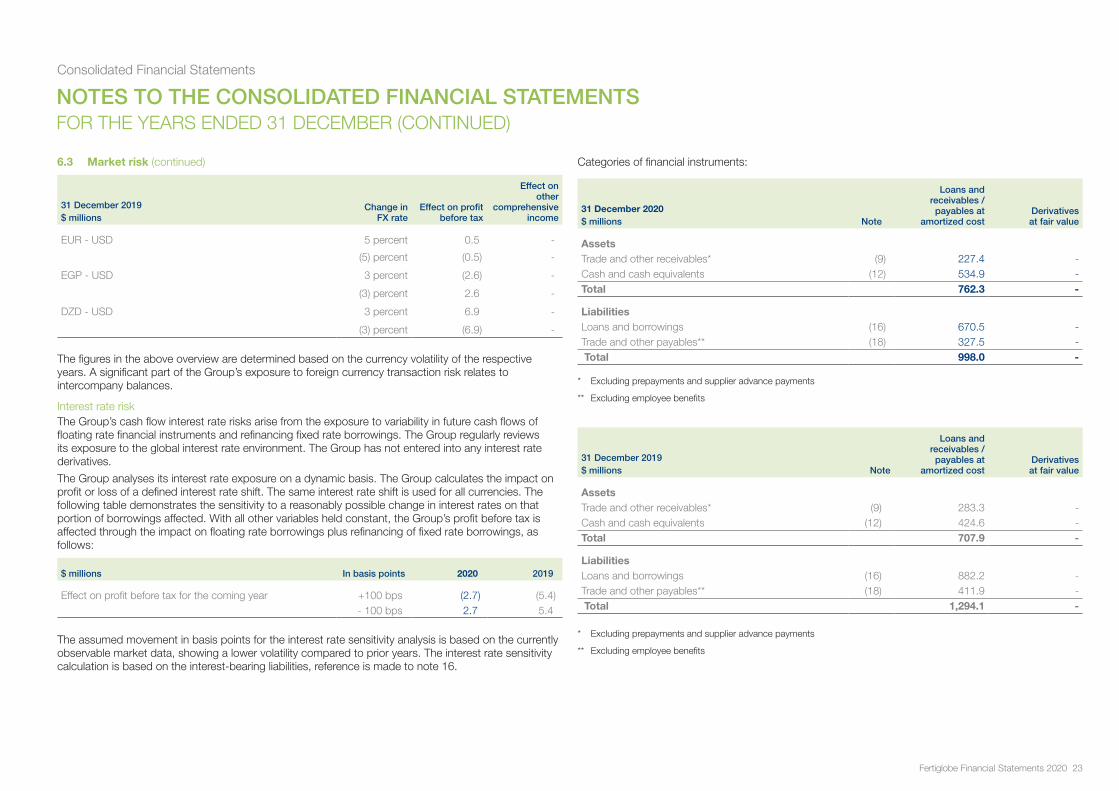
Consolidated Financial Statements
Fertiglobe Financial Statements 2020 23
6.3 Market risk (continued)
31 December 2019$ millions
Change in FX rate
Effect on profit before tax
Effect on other
comprehensive income
EUR - USD 5 percent 0.5 -
(5) percent (0.5) -
EGP - USD 3 percent (2.6) -
(3) percent 2.6 -
DZD - USD 3 percent 6.9 -
(3) percent (6.9) -
The figures in the above overview are determined based on the currency volatility of the respective years. A significant part of the Group’s exposure to foreign currency transaction risk relates to intercompany balances.
Interest rate riskThe Group’s cash flow interest rate risks arise from the exposure to variability in future cash flows of floating rate financial instruments and refinancing fixed rate borrowings. The Group regularly reviews its exposure to the global interest rate environment. The Group has not entered into any interest rate derivatives.
The Group analyses its interest rate exposure on a dynamic basis. The Group calculates the impact on profit or loss of a defined interest rate shift. The same interest rate shift is used for all currencies. The following table demonstrates the sensitivity to a reasonably possible change in interest rates on that portion of borrowings affected. With all other variables held constant, the Group’s profit before tax is affected through the impact on floating rate borrowings plus refinancing of fixed rate borrowings, as follows:
$ millions In basis points 2020 2019
Effect on profit before tax for the coming year +100 bps (2.7) (5.4)- 100 bps 2.7 5.4
The assumed movement in basis points for the interest rate sensitivity analysis is based on the currently observable market data, showing a lower volatility compared to prior years. The interest rate sensitivity calculation is based on the interest-bearing liabilities, reference is made to note 16.
Categories of financial instruments:
31 December 2020$ millions Note
Loans and receivables / payables at
amortized costDerivatives at fair value
AssetsTrade and other receivables* (9) 227.4 -Cash and cash equivalents (12) 534.9 -Total 762.3 -
LiabilitiesLoans and borrowings (16) 670.5 -Trade and other payables** (18) 327.5 - Total 998.0 -
* Excluding prepayments and supplier advance payments
** Excluding employee benefits
31 December 2019$ millions Note
Loans and receivables / payables at
amortized costDerivatives at fair value
AssetsTrade and other receivables* (9) 283.3 -Cash and cash equivalents (12) 424.6 -Total 707.9 -
LiabilitiesLoans and borrowings (16) 882.2 -Trade and other payables** (18) 411.9 - Total 1,294.1 -
* Excluding prepayments and supplier advance payments
** Excluding employee benefits
NOTES TO THE CONSOLIDATED FINANCIAL STATEMENTSFOR THE YEARS ENDED 31 DECEMBER (CONTINUED)
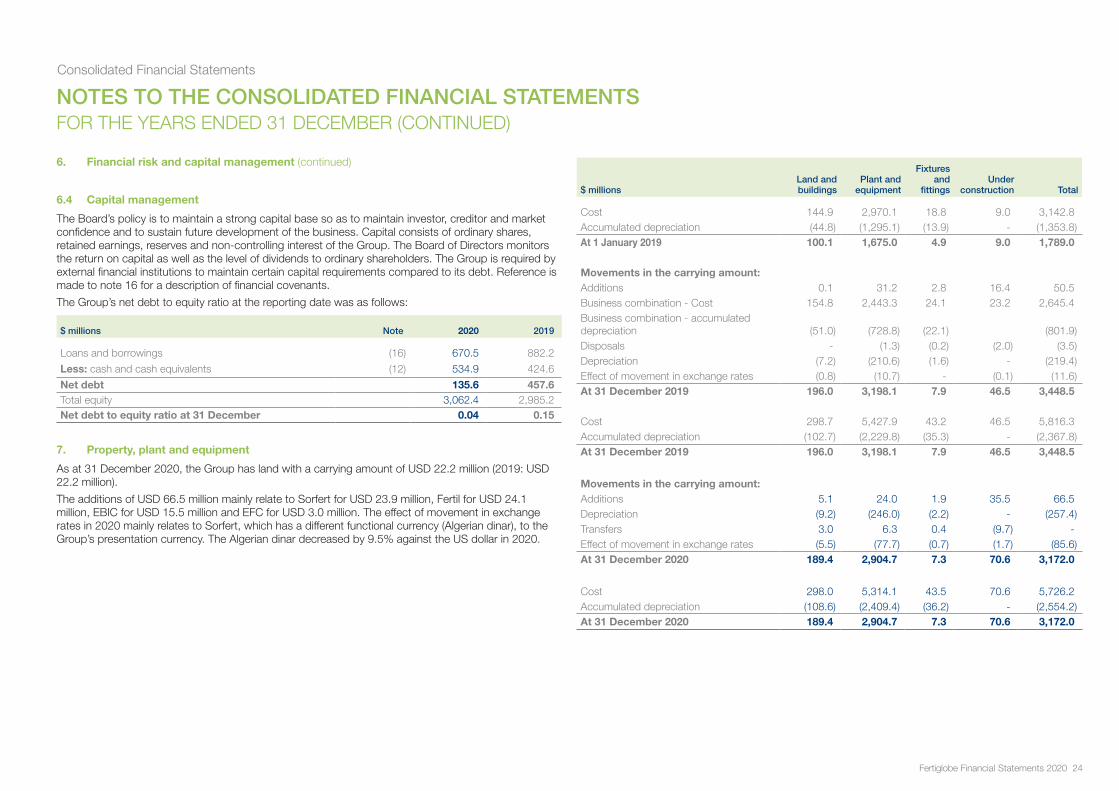
Consolidated Financial Statements
Fertiglobe Financial Statements 2020 24
6. Financial risk and capital management (continued)
6.4 Capital management
The Board’s policy is to maintain a strong capital base so as to maintain investor, creditor and market confidence and to sustain future development of the business. Capital consists of ordinary shares, retained earnings, reserves and non-controlling interest of the Group. The Board of Directors monitors the return on capital as well as the level of dividends to ordinary shareholders. The Group is required by external financial institutions to maintain certain capital requirements compared to its debt. Reference is made to note 16 for a description of financial covenants.
The Group’s net debt to equity ratio at the reporting date was as follows:
$ millions Note 2020 2019
Loans and borrowings (16) 670.5 882.2
Less: cash and cash equivalents (12) 534.9 424.6
Net debt 135.6 457.6Total equity 3,062.4 2,985.2Net debt to equity ratio at 31 December 0.04 0.15
7. Property, plant and equipment
As at 31 December 2020, the Group has land with a carrying amount of USD 22.2 million (2019: USD 22.2 million).
The additions of USD 66.5 million mainly relate to Sorfert for USD 23.9 million, Fertil for USD 24.1 million, EBIC for USD 15.5 million and EFC for USD 3.0 million. The effect of movement in exchange rates in 2020 mainly relates to Sorfert, which has a different functional currency (Algerian dinar), to the Group’s presentation currency. The Algerian dinar decreased by 9.5% against the US dollar in 2020.
$ millionsLand and buildings
Plant and equipment
Fixtures and
fittingsUnder
construction Total
Cost 144.9 2,970.1 18.8 9.0 3,142.8Accumulated depreciation (44.8) (1,295.1) (13.9) - (1,353.8)At 1 January 2019 100.1 1,675.0 4.9 9.0 1,789.0
Movements in the carrying amount:Additions 0.1 31.2 2.8 16.4 50.5Business combination - Cost 154.8 2,443.3 24.1 23.2 2,645.4Business combination - accumulated depreciation (51.0) (728.8) (22.1) (801.9)Disposals - (1.3) (0.2) (2.0) (3.5)Depreciation (7.2) (210.6) (1.6) - (219.4)Effect of movement in exchange rates (0.8) (10.7) - (0.1) (11.6)At 31 December 2019 196.0 3,198.1 7.9 46.5 3,448.5
Cost 298.7 5,427.9 43.2 46.5 5,816.3Accumulated depreciation (102.7) (2,229.8) (35.3) - (2,367.8)At 31 December 2019 196.0 3,198.1 7.9 46.5 3,448.5
Movements in the carrying amount:Additions 5.1 24.0 1.9 35.5 66.5Depreciation (9.2) (246.0) (2.2) - (257.4)Transfers 3.0 6.3 0.4 (9.7) -Effect of movement in exchange rates (5.5) (77.7) (0.7) (1.7) (85.6)At 31 December 2020 189.4 2,904.7 7.3 70.6 3,172.0
Cost 298.0 5,314.1 43.5 70.6 5,726.2Accumulated depreciation (108.6) (2,409.4) (36.2) - (2,554.2)At 31 December 2020 189.4 2,904.7 7.3 70.6 3,172.0
NOTES TO THE CONSOLIDATED FINANCIAL STATEMENTSFOR THE YEARS ENDED 31 DECEMBER (CONTINUED)
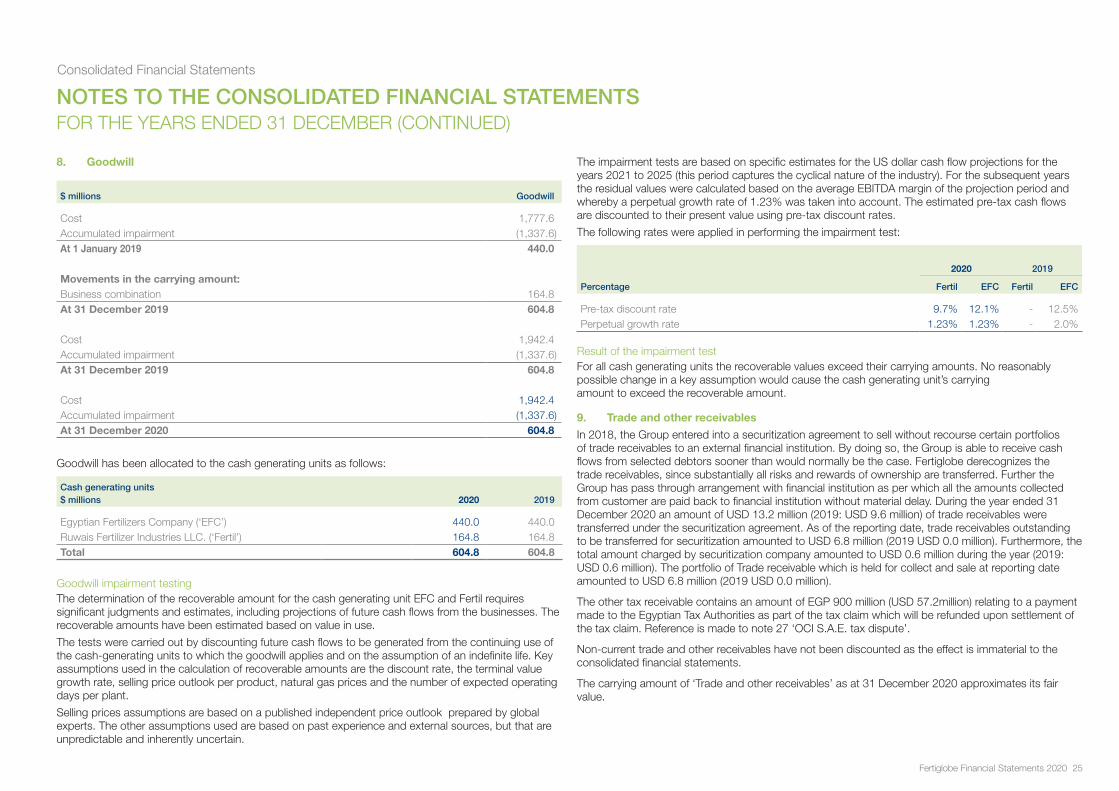
Consolidated Financial Statements
Fertiglobe Financial Statements 2020 25
8. Goodwill
$ millions Goodwill
Cost 1,777.6Accumulated impairment (1,337.6)At 1 January 2019 440.0
Movements in the carrying amount:Business combination 164.8At 31 December 2019 604.8
Cost 1,942.4Accumulated impairment (1,337.6)At 31 December 2019 604.8
Cost 1,942.4Accumulated impairment (1,337.6)At 31 December 2020 604.8
Goodwill has been allocated to the cash generating units as follows:
Cash generating units $ millions 2020 2019
Egyptian Fertilizers Company (‘EFC’) 440.0 440.0Ruwais Fertilizer Industries LLC. (‘Fertil’) 164.8 164.8Total 604.8 604.8
Goodwill impairment testing The determination of the recoverable amount for the cash generating unit EFC and Fertil requires significant judgments and estimates, including projections of future cash flows from the businesses. The recoverable amounts have been estimated based on value in use.
The tests were carried out by discounting future cash flows to be generated from the continuing use of the cash-generating units to which the goodwill applies and on the assumption of an indefinite life. Key assumptions used in the calculation of recoverable amounts are the discount rate, the terminal value growth rate, selling price outlook per product, natural gas prices and the number of expected operating days per plant.
Selling prices assumptions are based on a published independent price outlook prepared by global experts. The other assumptions used are based on past experience and external sources, but that are unpredictable and inherently uncertain.
The impairment tests are based on specific estimates for the US dollar cash flow projections for the years 2021 to 2025 (this period captures the cyclical nature of the industry). For the subsequent years the residual values were calculated based on the average EBITDA margin of the projection period and whereby a perpetual growth rate of 1.23% was taken into account. The estimated pre-tax cash flows are discounted to their present value using pre-tax discount rates.
The following rates were applied in performing the impairment test:
Percentage
2020 2019
Fertil EFC Fertil EFC
Pre-tax discount rate 9.7% 12.1% - 12.5%Perpetual growth rate 1.23% 1.23% - 2.0%
Result of the impairment test For all cash generating units the recoverable values exceed their carrying amounts. No reasonably possible change in a key assumption would cause the cash generating unit’s carrying amount to exceed the recoverable amount.
9. Trade and other receivables
In 2018, the Group entered into a securitization agreement to sell without recourse certain portfolios of trade receivables to an external financial institution. By doing so, the Group is able to receive cash flows from selected debtors sooner than would normally be the case. Fertiglobe derecognizes the trade receivables, since substantially all risks and rewards of ownership are transferred. Further the Group has pass through arrangement with financial institution as per which all the amounts collected from customer are paid back to financial institution without material delay. During the year ended 31 December 2020 an amount of USD 13.2 million (2019: USD 9.6 million) of trade receivables were transferred under the securitization agreement. As of the reporting date, trade receivables outstanding to be transferred for securitization amounted to USD 6.8 million (2019 USD 0.0 million). Furthermore, the total amount charged by securitization company amounted to USD 0.6 million during the year (2019: USD 0.6 million). The portfolio of Trade receivable which is held for collect and sale at reporting date amounted to USD 6.8 million (2019 USD 0.0 million).
The other tax receivable contains an amount of EGP 900 million (USD 57.2million) relating to a payment made to the Egyptian Tax Authorities as part of the tax claim which will be refunded upon settlement of the tax claim. Reference is made to note 27 ‘OCI S.A.E. tax dispute’.
Non-current trade and other receivables have not been discounted as the effect is immaterial to the consolidated financial statements.
The carrying amount of ‘Trade and other receivables’ as at 31 December 2020 approximates its fair value.
NOTES TO THE CONSOLIDATED FINANCIAL STATEMENTSFOR THE YEARS ENDED 31 DECEMBER (CONTINUED)
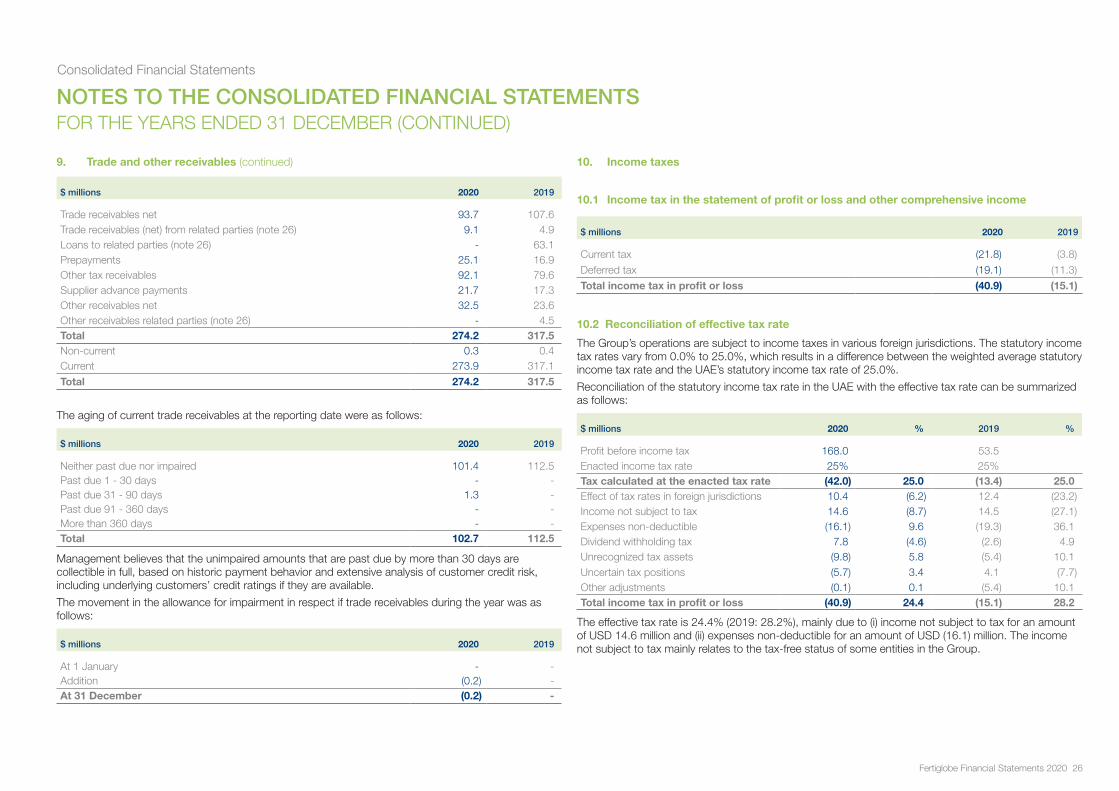
Consolidated Financial Statements
Fertiglobe Financial Statements 2020 26
9. Trade and other receivables (continued)
$ millions 2020 2019
Trade receivables net 93.7 107.6Trade receivables (net) from related parties (note 26) 9.1 4.9Loans to related parties (note 26) - 63.1Prepayments 25.1 16.9Other tax receivables 92.1 79.6Supplier advance payments 21.7 17.3Other receivables net 32.5 23.6Other receivables related parties (note 26) - 4.5Total 274.2 317.5Non-current 0.3 0.4Current 273.9 317.1
Total 274.2 317.5
The aging of current trade receivables at the reporting date were as follows:
$ millions 2020 2019
Neither past due nor impaired 101.4 112.5Past due 1 - 30 days - -Past due 31 - 90 days 1.3 -Past due 91 - 360 days - -More than 360 days - -Total 102.7 112.5
Management believes that the unimpaired amounts that are past due by more than 30 days are collectible in full, based on historic payment behavior and extensive analysis of customer credit risk, including underlying customers’ credit ratings if they are available.
The movement in the allowance for impairment in respect if trade receivables during the year was as follows:
$ millions 2020 2019
At 1 January - -Addition (0.2) -At 31 December (0.2) -
10. Income taxes
10.1 Income tax in the statement of profit or loss and other comprehensive income
$ millions 2020 2019
Current tax (21.8) (3.8)
Deferred tax (19.1) (11.3)
Total income tax in profit or loss (40.9) (15.1)
10.2 Reconciliation of effective tax rate
The Group’s operations are subject to income taxes in various foreign jurisdictions. The statutory income tax rates vary from 0.0% to 25.0%, which results in a difference between the weighted average statutory income tax rate and the UAE’s statutory income tax rate of 25.0%.
Reconciliation of the statutory income tax rate in the UAE with the effective tax rate can be summarized as follows:
$ millions 2020 % 2019 %
Profit before income tax 168.0 53.5Enacted income tax rate 25% 25%Tax calculated at the enacted tax rate (42.0) 25.0 (13.4) 25.0Effect of tax rates in foreign jurisdictions 10.4 (6.2) 12.4 (23.2)Income not subject to tax 14.6 (8.7) 14.5 (27.1)Expenses non-deductible (16.1) 9.6 (19.3) 36.1Dividend withholding tax 7.8 (4.6) (2.6) 4.9Unrecognized tax assets (9.8) 5.8 (5.4) 10.1Uncertain tax positions (5.7) 3.4 4.1 (7.7)Other adjustments (0.1) 0.1 (5.4) 10.1Total income tax in profit or loss (40.9) 24.4 (15.1) 28.2
The effective tax rate is 24.4% (2019: 28.2%), mainly due to (i) income not subject to tax for an amount of USD 14.6 million and (ii) expenses non-deductible for an amount of USD (16.1) million. The income not subject to tax mainly relates to the tax-free status of some entities in the Group.
NOTES TO THE CONSOLIDATED FINANCIAL STATEMENTSFOR THE YEARS ENDED 31 DECEMBER (CONTINUED)
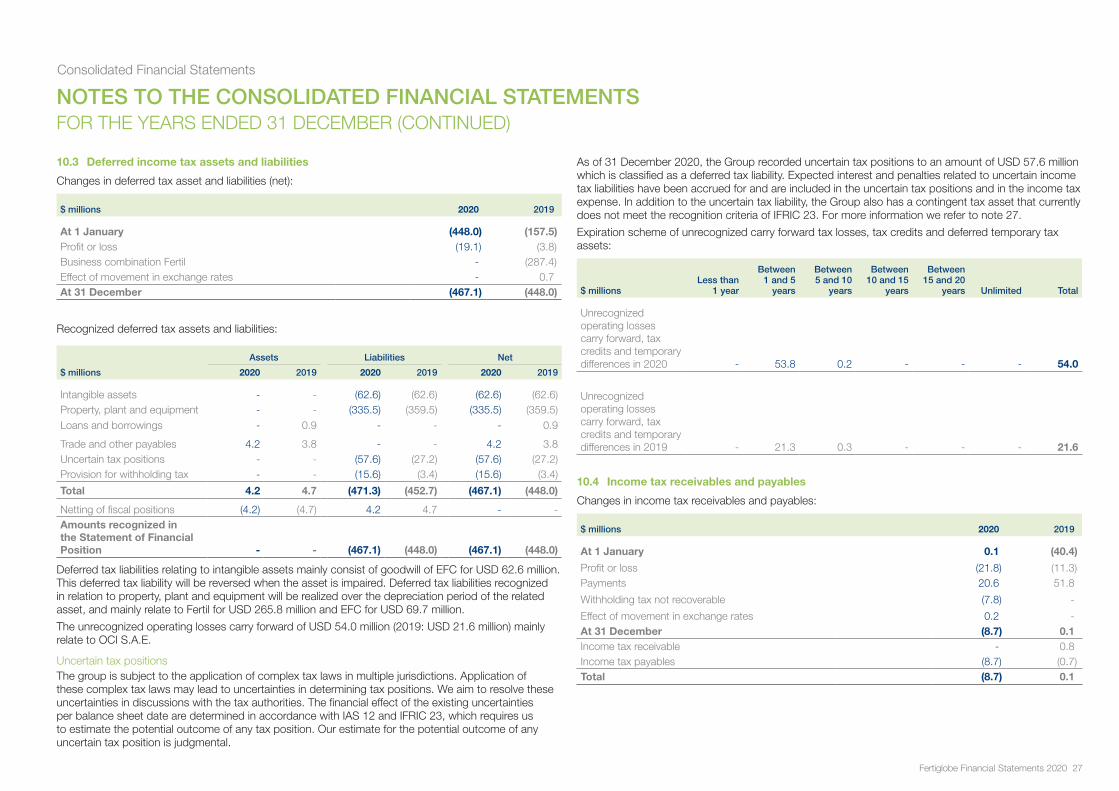
Consolidated Financial Statements
Fertiglobe Financial Statements 2020 27
10.3 Deferred income tax assets and liabilities
Changes in deferred tax asset and liabilities (net):
$ millions 2020 2019
At 1 January (448.0) (157.5)Profit or loss (19.1) (3.8)Business combination Fertil - (287.4)Effect of movement in exchange rates - 0.7At 31 December (467.1) (448.0)
Recognized deferred tax assets and liabilities:
Assets Liabilities Net
$ millions 2020 2019 2020 2019 2020 2019
Intangible assets - - (62.6) (62.6) (62.6) (62.6)Property, plant and equipment - - (335.5) (359.5) (335.5) (359.5)Loans and borrowings - 0.9 - - - 0.9
Trade and other payables 4.2 3.8 - - 4.2 3.8Uncertain tax positions - - (57.6) (27.2) (57.6) (27.2)Provision for withholding tax - - (15.6) (3.4) (15.6) (3.4)
Total 4.2 4.7 (471.3) (452.7) (467.1) (448.0)
Netting of fiscal positions (4.2) (4.7) 4.2 4.7 - -Amounts recognized in the Statement of Financial Position - - (467.1) (448.0) (467.1) (448.0)
Deferred tax liabilities relating to intangible assets mainly consist of goodwill of EFC for USD 62.6 million. This deferred tax liability will be reversed when the asset is impaired. Deferred tax liabilities recognized in relation to property, plant and equipment will be realized over the depreciation period of the related asset, and mainly relate to Fertil for USD 265.8 million and EFC for USD 69.7 million.
The unrecognized operating losses carry forward of USD 54.0 million (2019: USD 21.6 million) mainly relate to OCI S.A.E.
Uncertain tax positionsThe group is subject to the application of complex tax laws in multiple jurisdictions. Application of these complex tax laws may lead to uncertainties in determining tax positions. We aim to resolve these uncertainties in discussions with the tax authorities. The financial effect of the existing uncertainties per balance sheet date are determined in accordance with IAS 12 and IFRIC 23, which requires us to estimate the potential outcome of any tax position. Our estimate for the potential outcome of any uncertain tax position is judgmental.
As of 31 December 2020, the Group recorded uncertain tax positions to an amount of USD 57.6 million which is classified as a deferred tax liability. Expected interest and penalties related to uncertain income tax liabilities have been accrued for and are included in the uncertain tax positions and in the income tax expense. In addition to the uncertain tax liability, the Group also has a contingent tax asset that currently does not meet the recognition criteria of IFRIC 23. For more information we refer to note 27.
Expiration scheme of unrecognized carry forward tax losses, tax credits and deferred temporary tax assets:
$ millionsLess than
1 year
Between 1 and 5
years
Between 5 and 10
years
Between 10 and 15
years
Between 15 and 20
years Unlimited Total
Unrecognized operating losses carry forward, tax credits and temporary differences in 2020 - 53.8 0.2 - - - 54.0
Unrecognized operating losses carry forward, tax credits and temporary differences in 2019 - 21.3 0.3 - - - 21.6
10.4 Income tax receivables and payables
Changes in income tax receivables and payables:
$ millions 2020 2019
At 1 January 0.1 (40.4)
Profit or loss (21.8) (11.3)Payments 20.6 51.8
Withholding tax not recoverable (7.8) -
Effect of movement in exchange rates 0.2 -At 31 December (8.7) 0.1Income tax receivable - 0.8Income tax payables (8.7) (0.7)Total (8.7) 0.1
NOTES TO THE CONSOLIDATED FINANCIAL STATEMENTSFOR THE YEARS ENDED 31 DECEMBER (CONTINUED)
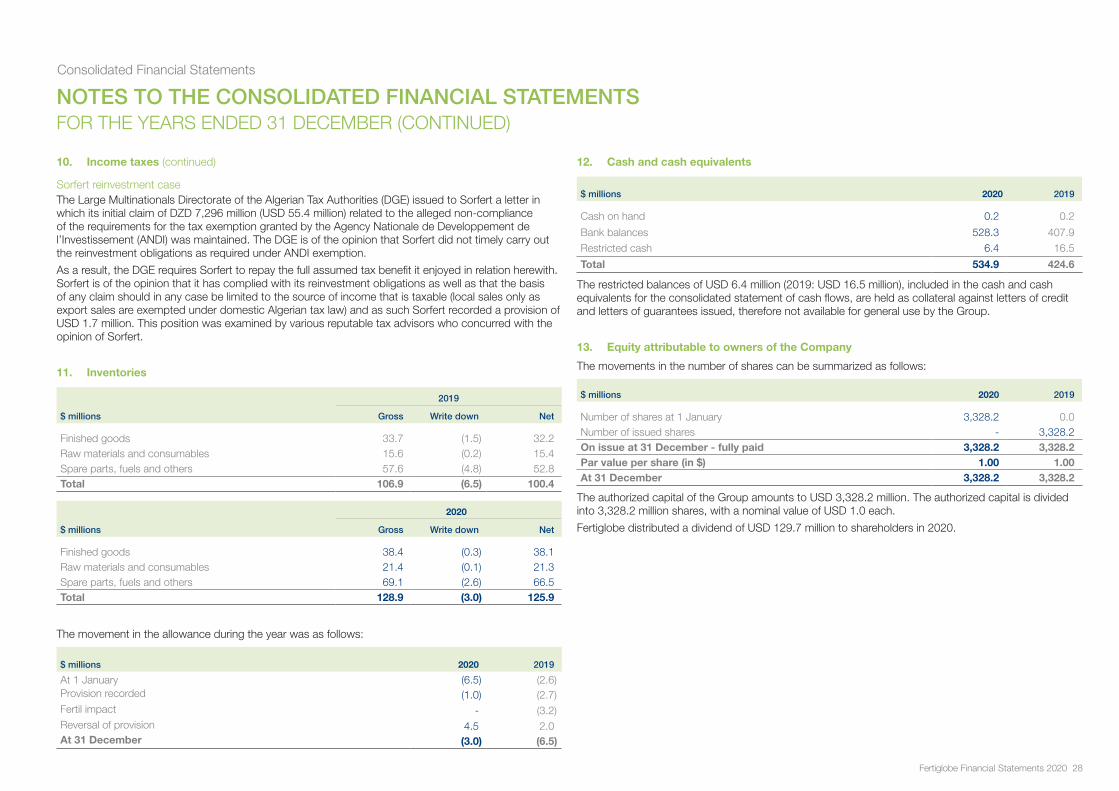
Consolidated Financial Statements
Fertiglobe Financial Statements 2020 28
10. Income taxes (continued)
Sorfert reinvestment caseThe Large Multinationals Directorate of the Algerian Tax Authorities (DGE) issued to Sorfert a letter in which its initial claim of DZD 7,296 million (USD 55.4 million) related to the alleged non-compliance of the requirements for the tax exemption granted by the Agency Nationale de Developpement de l’Investissement (ANDI) was maintained. The DGE is of the opinion that Sorfert did not timely carry out the reinvestment obligations as required under ANDI exemption.
As a result, the DGE requires Sorfert to repay the full assumed tax benefit it enjoyed in relation herewith. Sorfert is of the opinion that it has complied with its reinvestment obligations as well as that the basis of any claim should in any case be limited to the source of income that is taxable (local sales only as export sales are exempted under domestic Algerian tax law) and as such Sorfert recorded a provision of USD 1.7 million. This position was examined by various reputable tax advisors who concurred with the opinion of Sorfert.
11. Inventories
$ millions
2019
Gross Write down Net
Finished goods 33.7 (1.5) 32.2Raw materials and consumables 15.6 (0.2) 15.4Spare parts, fuels and others 57.6 (4.8) 52.8Total 106.9 (6.5) 100.4
$ millions
2020
Gross Write down Net
Finished goods 38.4 (0.3) 38.1Raw materials and consumables 21.4 (0.1) 21.3Spare parts, fuels and others 69.1 (2.6) 66.5Total 128.9 (3.0) 125.9
The movement in the allowance during the year was as follows:
$ millions 2020 2019
At 1 January (6.5) (2.6)Provision recorded (1.0) (2.7)Fertil impact - (3.2)Reversal of provision 4.5 2.0At 31 December (3.0) (6.5)
12. Cash and cash equivalents
$ millions 2020 2019
Cash on hand 0.2 0.2
Bank balances 528.3 407.9Restricted cash 6.4 16.5
Total 534.9 424.6
The restricted balances of USD 6.4 million (2019: USD 16.5 million), included in the cash and cash equivalents for the consolidated statement of cash flows, are held as collateral against letters of credit and letters of guarantees issued, therefore not available for general use by the Group.
13. Equity attributable to owners of the Company
The movements in the number of shares can be summarized as follows:
$ millions 2020 2019
Number of shares at 1 January 3,328.2 0.0Number of issued shares - 3,328.2On issue at 31 December - fully paid 3,328.2 3,328.2Par value per share (in $) 1.00 1.00At 31 December 3,328.2 3,328.2
The authorized capital of the Group amounts to USD 3,328.2 million. The authorized capital is divided into 3,328.2 million shares, with a nominal value of USD 1.0 each.
Fertiglobe distributed a dividend of USD 129.7 million to shareholders in 2020.
NOTES TO THE CONSOLIDATED FINANCIAL STATEMENTSFOR THE YEARS ENDED 31 DECEMBER (CONTINUED)
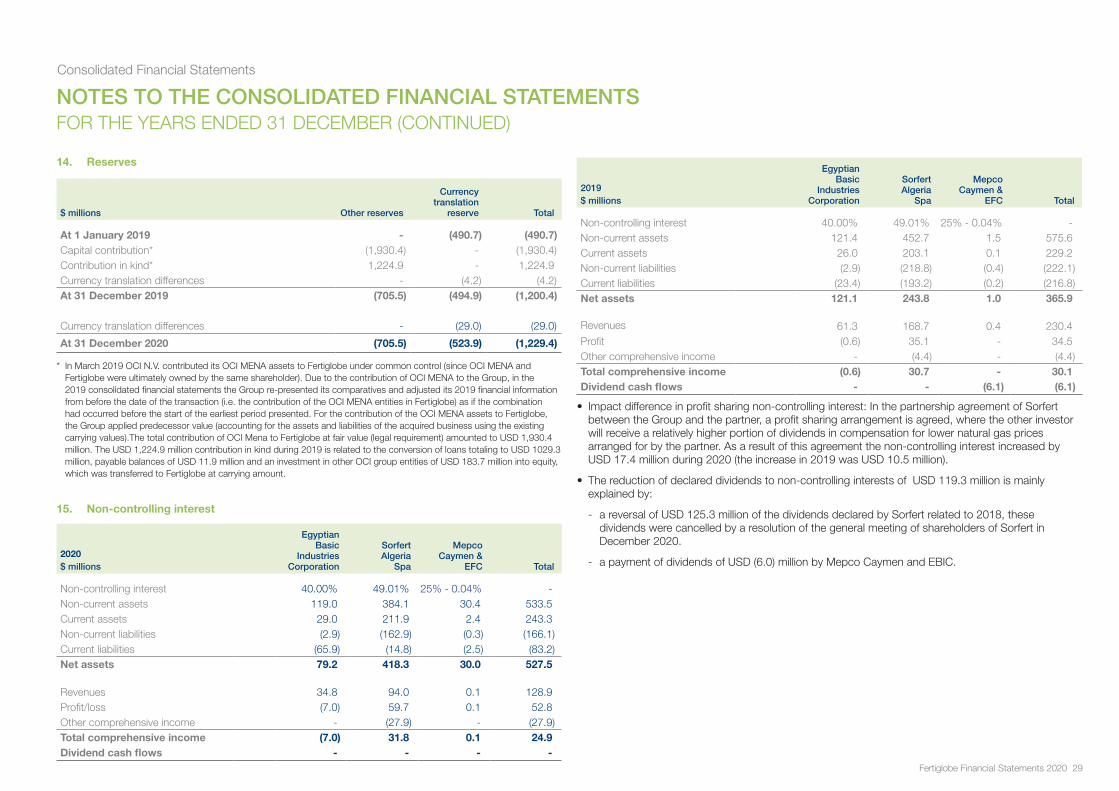
Consolidated Financial Statements
Fertiglobe Financial Statements 2020 29
14. Reserves
$ millions Other reserves
Currencytranslation
reserve Total
At 1 January 2019 - (490.7) (490.7)Capital contribution* (1,930.4) - (1,930.4)Contribution in kind* 1,224.9 - 1,224.9Currency translation differences - (4.2) (4.2)At 31 December 2019 (705.5) (494.9) (1,200.4)
Currency translation differences - (29.0) (29.0)
At 31 December 2020 (705.5) (523.9) (1,229.4)
* In March 2019 OCI N.V. contributed its OCI MENA assets to Fertiglobe under common control (since OCI MENA and Fertiglobe were ultimately owned by the same shareholder). Due to the contribution of OCI MENA to the Group, in the 2019 consolidated financial statements the Group re-presented its comparatives and adjusted its 2019 financial information from before the date of the transaction (i.e. the contribution of the OCI MENA entities in Fertiglobe) as if the combination had occurred before the start of the earliest period presented. For the contribution of the OCI MENA assets to Fertiglobe, the Group applied predecessor value (accounting for the assets and liabilities of the acquired business using the existing carrying values).The total contribution of OCI Mena to Fertiglobe at fair value (legal requirement) amounted to USD 1,930.4 million. The USD 1,224.9 million contribution in kind during 2019 is related to the conversion of loans totaling to USD 1029.3 million, payable balances of USD 11.9 million and an investment in other OCI group entities of USD 183.7 million into equity, which was transferred to Fertiglobe at carrying amount.
15. Non-controlling interest
2020$ millions
Egyptian Basic
Industries Corporation
SorfertAlgeria
Spa
Mepco Caymen &
EFC Total
Non-controlling interest 40.00% 49.01% 25% - 0.04% -Non-current assets 119.0 384.1 30.4 533.5Current assets 29.0 211.9 2.4 243.3Non-current liabilities (2.9) (162.9) (0.3) (166.1)Current liabilities (65.9) (14.8) (2.5) (83.2)Net assets 79.2 418.3 30.0 527.5
Revenues 34.8 94.0 0.1 128.9Profit/loss (7.0) 59.7 0.1 52.8Other comprehensive income - (27.9) - (27.9)Total comprehensive income (7.0) 31.8 0.1 24.9Dividend cash flows - - - -
2019$ millions
Egyptian Basic
Industries Corporation
SorfertAlgeria
Spa
Mepco Caymen &
EFC Total
Non-controlling interest 40.00% 49.01% 25% - 0.04% -Non-current assets 121.4 452.7 1.5 575.6Current assets 26.0 203.1 0.1 229.2Non-current liabilities (2.9) (218.8) (0.4) (222.1)Current liabilities (23.4) (193.2) (0.2) (216.8)Net assets 121.1 243.8 1.0 365.9
Revenues 61.3 168.7 0.4 230.4Profit (0.6) 35.1 - 34.5Other comprehensive income - (4.4) - (4.4)Total comprehensive income (0.6) 30.7 - 30.1Dividend cash flows - - (6.1) (6.1)
• Impact difference in profit sharing non-controlling interest: In the partnership agreement of Sorfert between the Group and the partner, a profit sharing arrangement is agreed, where the other investor will receive a relatively higher portion of dividends in compensation for lower natural gas prices arranged for by the partner. As a result of this agreement the non-controlling interest increased by USD 17.4 million during 2020 (the increase in 2019 was USD 10.5 million).
• The reduction of declared dividends to non-controlling interests of USD 119.3 million is mainly explained by:
- a reversal of USD 125.3 million of the dividends declared by Sorfert related to 2018, these dividends were cancelled by a resolution of the general meeting of shareholders of Sorfert in December 2020.
- a payment of dividends of USD (6.0) million by Mepco Caymen and EBIC.
NOTES TO THE CONSOLIDATED FINANCIAL STATEMENTSFOR THE YEARS ENDED 31 DECEMBER (CONTINUED)
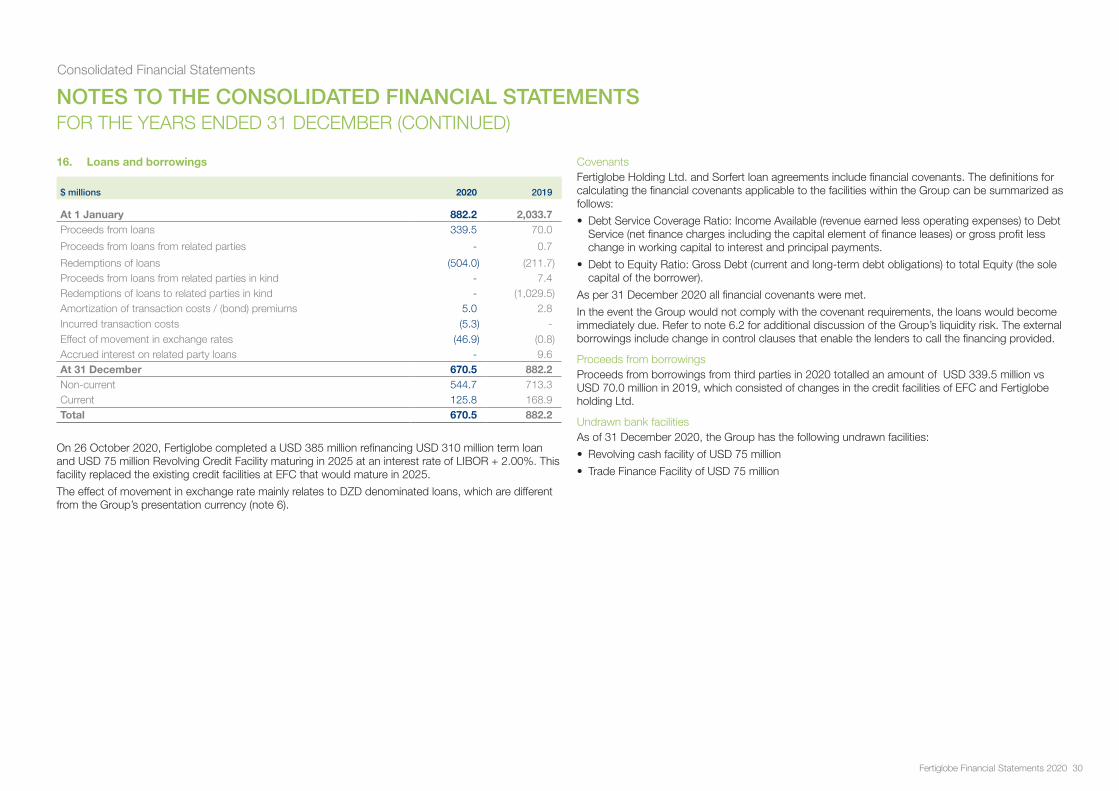
Consolidated Financial Statements
Fertiglobe Financial Statements 2020 30
16. Loans and borrowings
$ millions 2020 2019
At 1 January 882.2 2,033.7Proceeds from loans 339.5 70.0
Proceeds from loans from related parties - 0.7
Redemptions of loans (504.0) (211.7)Proceeds from loans from related parties in kind - 7.4Redemptions of loans to related parties in kind - (1,029.5)Amortization of transaction costs / (bond) premiums 5.0 2.8Incurred transaction costs (5.3) -Effect of movement in exchange rates (46.9) (0.8)Accrued interest on related party loans - 9.6At 31 December 670.5 882.2Non-current 544.7 713.3Current 125.8 168.9Total 670.5 882.2
On 26 October 2020, Fertiglobe completed a USD 385 million refinancing USD 310 million term loan and USD 75 million Revolving Credit Facility maturing in 2025 at an interest rate of LIBOR + 2.00%. This facility replaced the existing credit facilities at EFC that would mature in 2025.
The effect of movement in exchange rate mainly relates to DZD denominated loans, which are different from the Group’s presentation currency (note 6).
CovenantsFertiglobe Holding Ltd. and Sorfert loan agreements include financial covenants. The definitions for calculating the financial covenants applicable to the facilities within the Group can be summarized as follows:
• Debt Service Coverage Ratio: Income Available (revenue earned less operating expenses) to Debt Service (net finance charges including the capital element of finance leases) or gross profit less change in working capital to interest and principal payments.
• Debt to Equity Ratio: Gross Debt (current and long-term debt obligations) to total Equity (the sole capital of the borrower).
As per 31 December 2020 all financial covenants were met.
In the event the Group would not comply with the covenant requirements, the loans would become immediately due. Refer to note 6.2 for additional discussion of the Group’s liquidity risk. The external borrowings include change in control clauses that enable the lenders to call the financing provided.
Proceeds from borrowingsProceeds from borrowings from third parties in 2020 totalled an amount of USD 339.5 million vs USD 70.0 million in 2019, which consisted of changes in the credit facilities of EFC and Fertiglobe holding Ltd.
Undrawn bank facilitiesAs of 31 December 2020, the Group has the following undrawn facilities:
• Revolving cash facility of USD 75 million
• Trade Finance Facility of USD 75 million
NOTES TO THE CONSOLIDATED FINANCIAL STATEMENTSFOR THE YEARS ENDED 31 DECEMBER (CONTINUED)
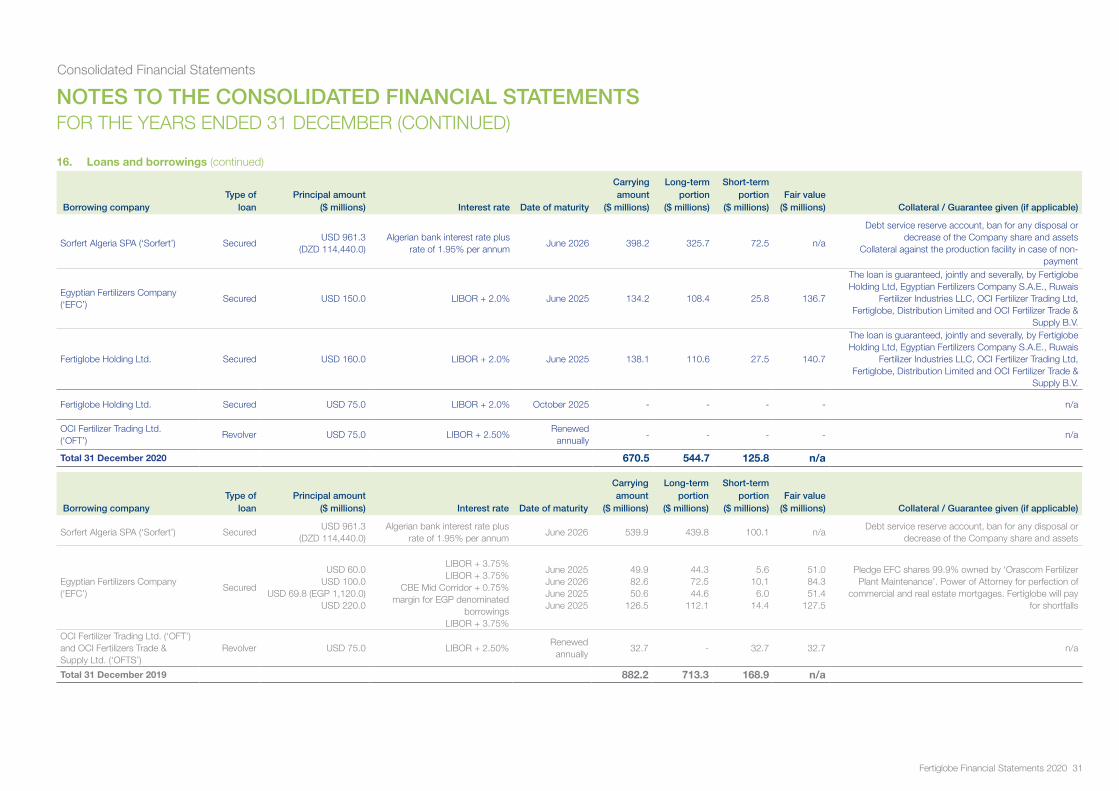
Consolidated Financial Statements
Fertiglobe Financial Statements 2020 31
16. Loans and borrowings (continued)
Borrowing company Type of
loan Principal amount
($ millions) Interest rate Date of maturity
Carrying amount
($ millions)
Long-term portion
($ millions)
Short-term portion
($ millions)Fair value
($ millions) Collateral / Guarantee given (if applicable)
Sorfert Algeria SPA (‘Sorfert’) SecuredUSD 961.3
(DZD 114,440.0)Algerian bank interest rate plus
rate of 1.95% per annumJune 2026 398.2 325.7 72.5 n/a
Debt service reserve account, ban for any disposal or decrease of the Company share and assets
Collateral against the production facility in case of non-payment
Egyptian Fertilizers Company (‘EFC’)
Secured USD 150.0 LIBOR + 2.0% June 2025 134.2 108.4 25.8 136.7
The loan is guaranteed, jointly and severally, by FertiglobeHolding Ltd, Egyptian Fertilizers Company S.A.E., Ruwais
Fertilizer Industries LLC, OCI Fertilizer Trading Ltd, Fertiglobe, Distribution Limited and OCI Fertilizer Trade &
Supply B.V.
Fertiglobe Holding Ltd. Secured USD 160.0 LIBOR + 2.0% June 2025 138.1 110.6 27.5 140.7
The loan is guaranteed, jointly and severally, by FertiglobeHolding Ltd, Egyptian Fertilizers Company S.A.E., Ruwais
Fertilizer Industries LLC, OCI Fertilizer Trading Ltd, Fertiglobe, Distribution Limited and OCI Fertilizer Trade &
Supply B.V.
Fertiglobe Holding Ltd. Secured USD 75.0 LIBOR + 2.0% October 2025 - - - - n/a
OCI Fertilizer Trading Ltd.(‘OFT’)
Revolver USD 75.0 LIBOR + 2.50%Renewed
annually- - - - n/a
Total 31 December 2020 670.5 544.7 125.8 n/a
Borrowing company Type of
loan Principal amount
($ millions) Interest rate Date of maturity
Carrying amount
($ millions)
Long-term portion
($ millions)
Short-term portion
($ millions)Fair value
($ millions) Collateral / Guarantee given (if applicable)
Sorfert Algeria SPA (‘Sorfert’) SecuredUSD 961.3
(DZD 114,440.0)Algerian bank interest rate plus
rate of 1.95% per annumJune 2026 539.9 439.8 100.1 n/a
Debt service reserve account, ban for any disposal or decrease of the Company share and assets
Egyptian Fertilizers Company (‘EFC’)
Secured
USD 60.0USD 100.0
USD 69.8 (EGP 1,120.0)USD 220.0
LIBOR + 3.75%LIBOR + 3.75%
CBE Mid Corridor + 0.75% margin for EGP denominated
borrowingsLIBOR + 3.75%
June 2025June 2026June 2025June 2025
49.982.650.6
126.5
44.372.544.6
112.1
5.610.1
6.014.4
51.084.351.4
127.5
Pledge EFC shares 99.9% owned by ‘Orascom Fertilizer Plant Maintenance’. Power of Attorney for perfection of
commercial and real estate mortgages. Fertiglobe will pay for shortfalls
OCI Fertilizer Trading Ltd. (‘OFT’) and OCI Fertilizers Trade & Supply Ltd. (‘OFTS’)
Revolver USD 75.0 LIBOR + 2.50%Renewed
annually32.7 - 32.7 32.7 n/a
Total 31 December 2019 882.2 713.3 168.9 n/a
NOTES TO THE CONSOLIDATED FINANCIAL STATEMENTSFOR THE YEARS ENDED 31 DECEMBER (CONTINUED)
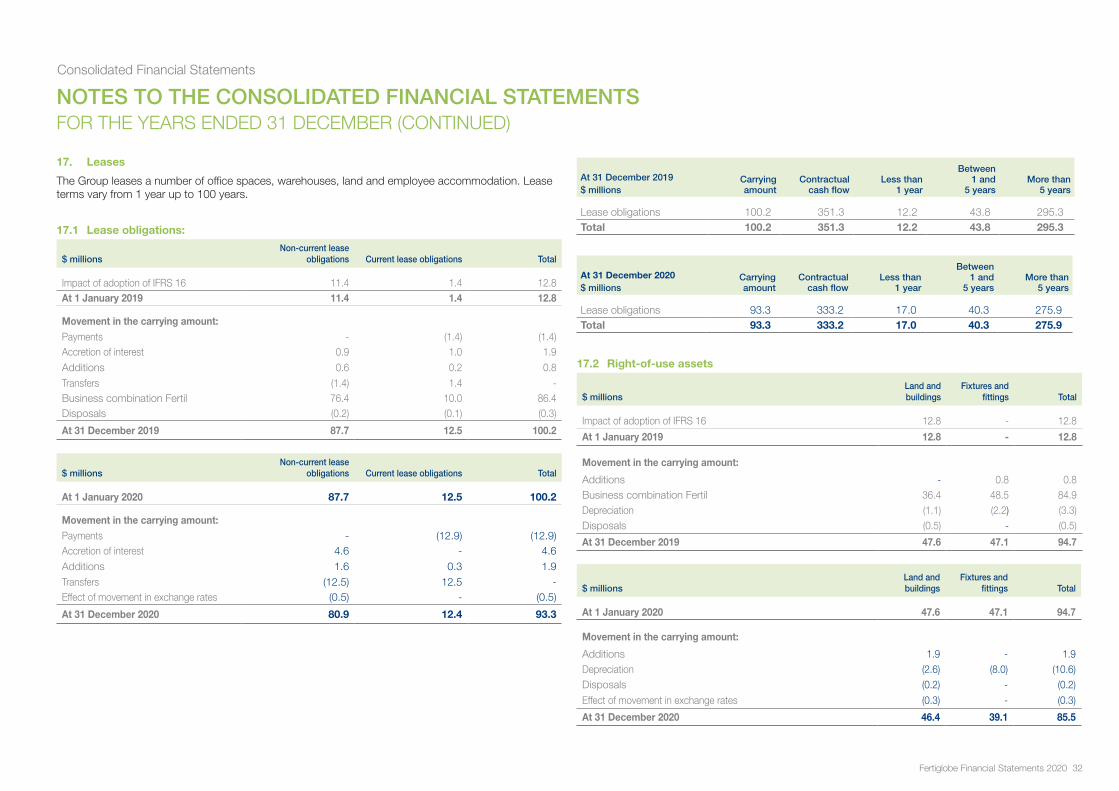
Consolidated Financial Statements
Fertiglobe Financial Statements 2020 32
17. Leases
The Group leases a number of office spaces, warehouses, land and employee accommodation. Lease terms vary from 1 year up to 100 years.
17.1 Lease obligations:
$ millionsNon-current lease
obligations Current lease obligations Total
Impact of adoption of IFRS 16 11.4 1.4 12.8At 1 January 2019 11.4 1.4 12.8
Movement in the carrying amount:Payments - (1.4) (1.4)Accretion of interest 0.9 1.0 1.9Additions 0.6 0.2 0.8Transfers (1.4) 1.4 -Business combination Fertil 76.4 10.0 86.4Disposals (0.2) (0.1) (0.3)
At 31 December 2019 87.7 12.5 100.2
$ millionsNon-current lease
obligations Current lease obligations Total
At 1 January 2020 87.7 12.5 100.2
Movement in the carrying amount:Payments - (12.9) (12.9)Accretion of interest 4.6 - 4.6Additions 1.6 0.3 1.9Transfers (12.5) 12.5 -Effect of movement in exchange rates (0.5) - (0.5)
At 31 December 2020 80.9 12.4 93.3
At 31 December 2019$ millions
Carryingamount
Contractualcash flow
Less than 1 year
Between 1 and
5 yearsMore than
5 years
Lease obligations 100.2 351.3 12.2 43.8 295.3Total 100.2 351.3 12.2 43.8 295.3
At 31 December 2020$ millions
Carryingamount
Contractualcash flow
Less than 1 year
Between 1 and
5 yearsMore than
5 years
Lease obligations 93.3 333.2 17.0 40.3 275.9Total 93.3 333.2 17.0 40.3 275.9
17.2 Right-of-use assets
$ millionsLand and buildings
Fixtures and fittings Total
Impact of adoption of IFRS 16 12.8 - 12.8
At 1 January 2019 12.8 - 12.8
Movement in the carrying amount:
Additions - 0.8 0.8Business combination Fertil 36.4 48.5 84.9Depreciation (1.1) (2.2) (3.3)Disposals (0.5) - (0.5)
At 31 December 2019 47.6 47.1 94.7
$ millionsLand and buildings
Fixtures and fittings Total
At 1 January 2020 47.6 47.1 94.7
Movement in the carrying amount:
Additions 1.9 - 1.9Depreciation (2.6) (8.0) (10.6)Disposals (0.2) - (0.2)Effect of movement in exchange rates (0.3) - (0.3)
At 31 December 2020 46.4 39.1 85.5
NOTES TO THE CONSOLIDATED FINANCIAL STATEMENTSFOR THE YEARS ENDED 31 DECEMBER (CONTINUED)
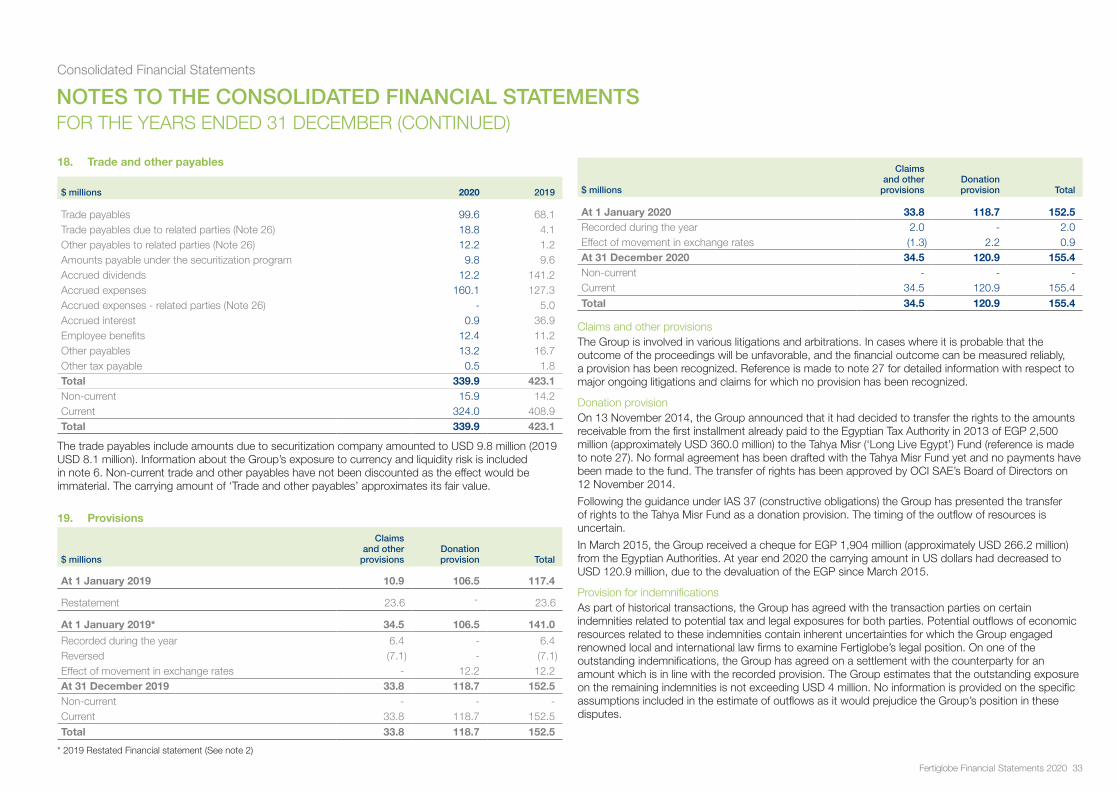
Consolidated Financial Statements
Fertiglobe Financial Statements 2020 33
18. Trade and other payables
$ millions 2020 2019
Trade payables 99.6 68.1Trade payables due to related parties (Note 26) 18.8 4.1Other payables to related parties (Note 26) 12.2 1.2Amounts payable under the securitization program 9.8 9.6Accrued dividends 12.2 141.2Accrued expenses 160.1 127.3Accrued expenses - related parties (Note 26) - 5.0Accrued interest 0.9 36.9Employee benefits 12.4 11.2Other payables 13.2 16.7Other tax payable 0.5 1.8Total 339.9 423.1Non-current 15.9 14.2Current 324.0 408.9Total 339.9 423.1
The trade payables include amounts due to securitization company amounted to USD 9.8 million (2019 USD 8.1 million). Information about the Group’s exposure to currency and liquidity risk is included in note 6. Non-current trade and other payables have not been discounted as the effect would be immaterial. The carrying amount of ‘Trade and other payables’ approximates its fair value.
19. Provisions
$ millions
Claimsand other
provisionsDonation provision Total
At 1 January 2019 10.9 106.5 117.4
Restatement 23.6 - 23.6
At 1 January 2019* 34.5 106.5 141.0
Recorded during the year 6.4 - 6.4Reversed (7.1) - (7.1)Effect of movement in exchange rates - 12.2 12.2At 31 December 2019 33.8 118.7 152.5Non-current - - -Current 33.8 118.7 152.5Total 33.8 118.7 152.5
* 2019 Restated Financial statement (See note 2)
$ millions
Claimsand other
provisionsDonation provision Total
At 1 January 2020 33.8 118.7 152.5Recorded during the year 2.0 - 2.0Effect of movement in exchange rates (1.3) 2.2 0.9At 31 December 2020 34.5 120.9 155.4Non-current - - -Current 34.5 120.9 155.4Total 34.5 120.9 155.4
Claims and other provisionsThe Group is involved in various litigations and arbitrations. In cases where it is probable that the outcome of the proceedings will be unfavorable, and the financial outcome can be measured reliably, a provision has been recognized. Reference is made to note 27 for detailed information with respect to major ongoing litigations and claims for which no provision has been recognized.
Donation provisionOn 13 November 2014, the Group announced that it had decided to transfer the rights to the amounts receivable from the first installment already paid to the Egyptian Tax Authority in 2013 of EGP 2,500 million (approximately USD 360.0 million) to the Tahya Misr (‘Long Live Egypt’) Fund (reference is made to note 27). No formal agreement has been drafted with the Tahya Misr Fund yet and no payments have been made to the fund. The transfer of rights has been approved by OCI SAE’s Board of Directors on 12 November 2014.
Following the guidance under IAS 37 (constructive obligations) the Group has presented the transfer of rights to the Tahya Misr Fund as a donation provision. The timing of the outflow of resources is uncertain.
In March 2015, the Group received a cheque for EGP 1,904 million (approximately USD 266.2 million) from the Egyptian Authorities. At year end 2020 the carrying amount in US dollars had decreased to USD 120.9 million, due to the devaluation of the EGP since March 2015.
Provision for indemnificationsAs part of historical transactions, the Group has agreed with the transaction parties on certain indemnities related to potential tax and legal exposures for both parties. Potential outflows of economic resources related to these indemnities contain inherent uncertainties for which the Group engaged renowned local and international law firms to examine Fertiglobe’s legal position. On one of the outstanding indemnifications, the Group has agreed on a settlement with the counterparty for an amount which is in line with the recorded provision. The Group estimates that the outstanding exposure on the remaining indemnities is not exceeding USD 4 million. No information is provided on the specific assumptions included in the estimate of outflows as it would prejudice the Group’s position in these disputes.
NOTES TO THE CONSOLIDATED FINANCIAL STATEMENTSFOR THE YEARS ENDED 31 DECEMBER (CONTINUED)
Consolidated Financial Statements
Fertiglobe Financial Statements 2020 34
20. Segment reporting
In the governance structure within Fertiglobe, the CODM is responsible for assessing the performance of the Group and its operating segments as well as for allocating resources. The CODM reviews monthly the performance of the following operating segments:
1. Egypt Basic Industries Corporation (EBIC)
2. Egyptian Fertilizers Company (EFC)
3. Sorfert Algerie (Sorfert)
4. Ruwais Fertilizers LLC (Fertil)
5. Trading entities - Own produced volumes
6. Trading entities - Third party sales
The production and marketing of own produced volumes are sharing the same characteristics:
- The nature of the products produced, the production processes (technology applied), output generated, pricing applied (based on international benchmark pricing), customers services are similar for all production plants within Fertiglobe;
- All entities are producing ammonia using gas as key input material. The largest part of this ammonia is used for the production of Urea. Both Ammonia and Urea are nitrogen-based Fertilizers and are belonging to the same product group. These products are sold into the international market and are subject to similar pricing conditions and market developments. The end customers for each of the plant are largely the same;
- Majority of the volumes produced by the Fertiglobe production entities are centrally marketed by the trading entities. As a result of the central marketing strategy, the cashflow and performance of each of the production entities is largely depended on the ability of trading entities to market the products;
- The production and marketing of own produced volumes have similar economic characteristics as the high margin production and marketing of own produced volumes are bifurcated from the (lower) margin trading activities;
- The production entities are all exposed to the same international fertilizer market on the sell side;
- The production entities all benefit from long term gas offtake agreements with no/limited price exposure on the supply of natural gas. In addition, other raw materials used for production largely consist of utilities, which are widely available in all production locations;
- All production locations are located close to one or more international sea ports which improves sourcing raw materials and/or ship products to customers;
- Although the production entities are subject to local laws and regulations from a legal/environmental perspective, these environments per country are largely based on the same fundamentals;
In the view of the above , aggregation will take place in two main reportable segments:
1. Production and Marketing of own produced volumes; comprises the operating segments EBIC, EFC, Sorfert, Fertil and trading entities – own produced volumes.
2. Third party trading (buy and sell of third-party volumes) comprises trading entities – third party sales.
Fertiglobe’s reportable segments are consistent with how the Chief Operating Decision Maker (‘CODM‘)manages the business operations and views the markets it serves. This segmentation will provide investors further insight on product mix and price impact.
Segment policyThe Company derives the results of the business segments directly from its internal management
reporting system. Both segments are reviewed separately by the management as they require different strategies and generate different margins. The entities grouped together in each segment have similar regulatory environments, macroeconomic conditions as they are trading is the global commodity market. The Group has one revenue stream from contracts with customers which is the sales of Fertilizers products (Ammonia and Urea).
A summary description of each reportable segment is as follows:
Production and Marketing of own produced volumesThis segment includes the performance of all the manufacturing and trading Operating companies that are producing Urea and Ammonia, but it excludes the third party trading activities (see, second segment) as the own-produced volumes are limited by the production capacity of the plants, and their pricing strategy and margins are different. Also the level of assets and investments are high for production activities and generally low for trading activities (limited to working capital).
Third party trading (buy and sell of third-party volumes)The third party trading segment includes the fertilizer products that are bought from third parties and sold to third parties. This segment generates generally low margins there is no volume limit on production capacity, and there is no need for material capital investments if any.
Other (corporate and other entities)
This segment consists of all remaining entities of the Group.
NOTES TO THE CONSOLIDATED FINANCIAL STATEMENTSFOR THE YEARS ENDED 31 DECEMBER (CONTINUED)
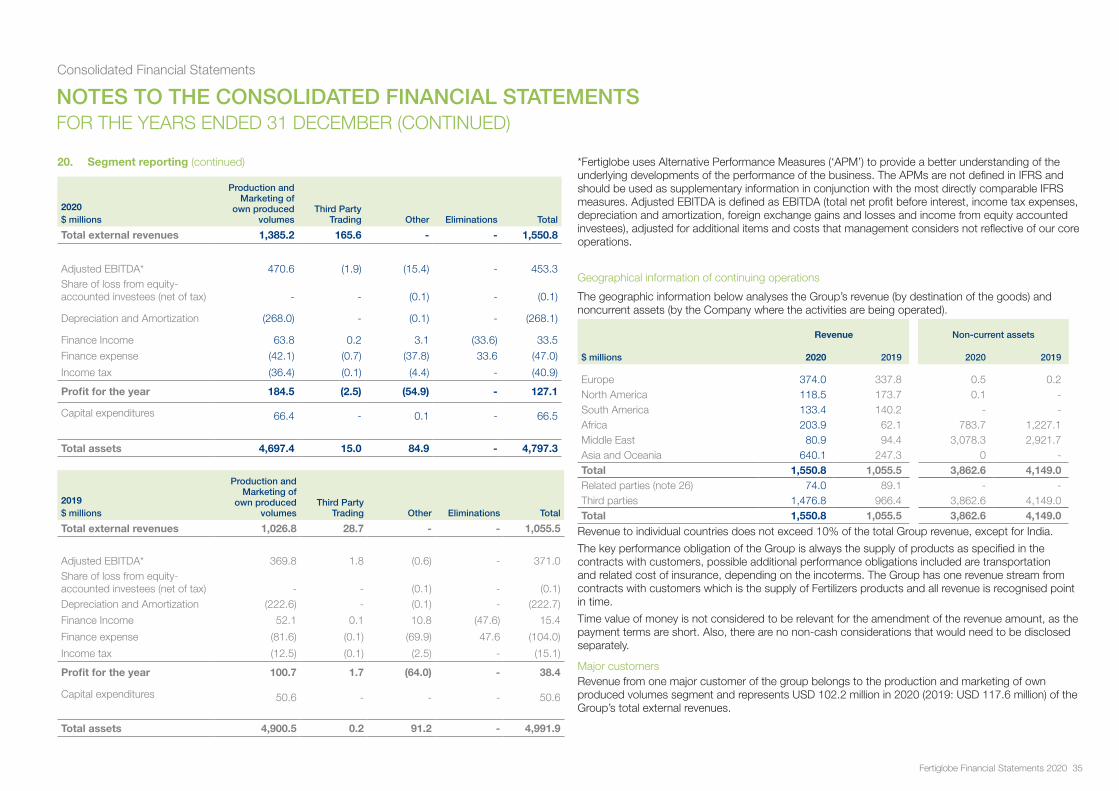
Consolidated Financial Statements
Fertiglobe Financial Statements 2020 35
20. Segment reporting (continued)
2020$ millions
Production and Marketing of
own produced volumes
Third Party Trading Other Eliminations Total
Total external revenues 1,385.2 165.6 - - 1,550.8
Adjusted EBITDA* 470.6 (1.9) (15.4) - 453.3Share of loss from equity-accounted investees (net of tax) - - (0.1) - (0.1)
Depreciation and Amortization (268.0) - (0.1) - (268.1)
Finance Income 63.8 0.2 3.1 (33.6) 33.5
Finance expense (42.1) (0.7) (37.8) 33.6 (47.0)
Income tax (36.4) (0.1) (4.4) - (40.9)
Profit for the year 184.5 (2.5) (54.9) - 127.1
Capital expenditures 66.4 - 0.1 - 66.5
Total assets 4,697.4 15.0 84.9 - 4,797.3
2019$ millions
Production and Marketing of
own produced volumes
Third Party Trading Other Eliminations Total
Total external revenues 1,026.8 28.7 - - 1,055.5
Adjusted EBITDA* 369.8 1.8 (0.6) - 371.0Share of loss from equity-accounted investees (net of tax) - - (0.1) - (0.1)Depreciation and Amortization (222.6) - (0.1) - (222.7)
Finance Income 52.1 0.1 10.8 (47.6) 15.4
Finance expense (81.6) (0.1) (69.9) 47.6 (104.0)
Income tax (12.5) (0.1) (2.5) - (15.1)
Profit for the year 100.7 1.7 (64.0) - 38.4
Capital expenditures 50.6 - - - 50.6
Total assets 4,900.5 0.2 91.2 - 4,991.9
*Fertiglobe uses Alternative Performance Measures (‘APM’) to provide a better understanding of the underlying developments of the performance of the business. The APMs are not defined in IFRS and should be used as supplementary information in conjunction with the most directly comparable IFRS measures. Adjusted EBITDA is defined as EBITDA (total net profit before interest, income tax expenses, depreciation and amortization, foreign exchange gains and losses and income from equity accounted investees), adjusted for additional items and costs that management considers not reflective of our core operations.
Geographical information of continuing operations
The geographic information below analyses the Group’s revenue (by destination of the goods) and noncurrent assets (by the Company where the activities are being operated).
Revenue Non-current assets
$ millions 2020 2019 2020 2019
Europe 374.0 337.8 0.5 0.2North America 118.5 173.7 0.1 -South America 133.4 140.2 - -Africa 203.9 62.1 783.7 1,227.1Middle East 80.9 94.4 3,078.3 2,921.7Asia and Oceania 640.1 247.3 0 -Total 1,550.8 1,055.5 3,862.6 4,149.0Related parties (note 26) 74.0 89.1 - -Third parties 1,476.8 966.4 3,862.6 4,149.0Total 1,550.8 1,055.5 3,862.6 4,149.0
Revenue to individual countries does not exceed 10% of the total Group revenue, except for India.
The key performance obligation of the Group is always the supply of products as specified in the contracts with customers, possible additional performance obligations included are transportation and related cost of insurance, depending on the incoterms. The Group has one revenue stream from contracts with customers which is the supply of Fertilizers products and all revenue is recognised point in time.
Time value of money is not considered to be relevant for the amendment of the revenue amount, as the payment terms are short. Also, there are no non-cash considerations that would need to be disclosed separately.
Major customersRevenue from one major customer of the group belongs to the production and marketing of own produced volumes segment and represents USD 102.2 million in 2020 (2019: USD 117.6 million) of the Group’s total external revenues.
NOTES TO THE CONSOLIDATED FINANCIAL STATEMENTSFOR THE YEARS ENDED 31 DECEMBER (CONTINUED)
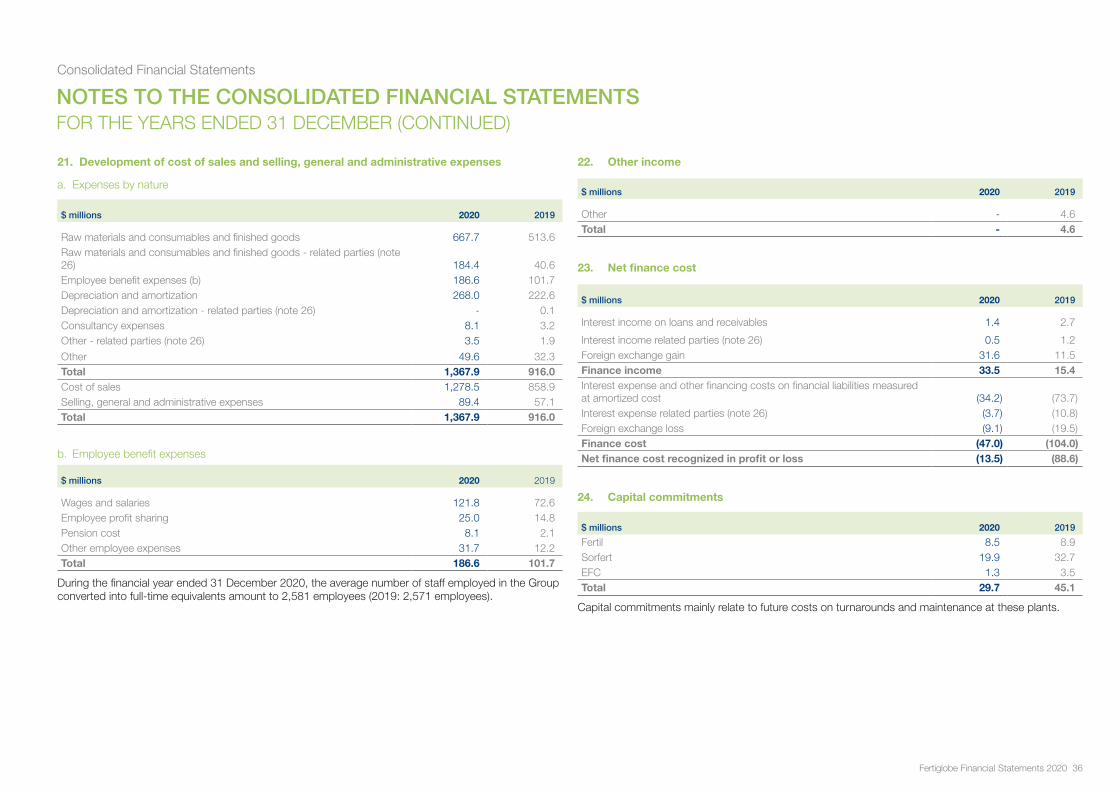
Consolidated Financial Statements
Fertiglobe Financial Statements 2020 36
21. Development of cost of sales and selling, general and administrative expenses
a. Expenses by nature
$ millions 2020 2019
Raw materials and consumables and finished goods 667.7 513.6Raw materials and consumables and finished goods - related parties (note 26) 184.4 40.6Employee benefit expenses (b) 186.6 101.7Depreciation and amortization 268.0 222.6Depreciation and amortization - related parties (note 26) - 0.1Consultancy expenses 8.1 3.2Other - related parties (note 26) 3.5 1.9
Other 49.6 32.3Total 1,367.9 916.0Cost of sales 1,278.5 858.9Selling, general and administrative expenses 89.4 57.1Total 1,367.9 916.0
b. Employee benefit expenses
$ millions 2020 2019
Wages and salaries 121.8 72.6Employee profit sharing 25.0 14.8Pension cost 8.1 2.1Other employee expenses 31.7 12.2Total 186.6 101.7
During the financial year ended 31 December 2020, the average number of staff employed in the Group converted into full-time equivalents amount to 2,581 employees (2019: 2,571 employees).
22. Other income
$ millions 2020 2019
Other - 4.6Total - 4.6
23. Net finance cost
$ millions 2020 2019
Interest income on loans and receivables 1.4 2.7
Interest income related parties (note 26) 0.5 1.2Foreign exchange gain 31.6 11.5Finance income 33.5 15.4Interest expense and other financing costs on financial liabilities measured at amortized cost (34.2) (73.7)Interest expense related parties (note 26) (3.7) (10.8)Foreign exchange loss (9.1) (19.5)Finance cost (47.0) (104.0)Net finance cost recognized in profit or loss (13.5) (88.6)
24. Capital commitments
$ millions 2020 2019
Fertil 8.5 8.9Sorfert 19.9 32.7EFC 1.3 3.5Total 29.7 45.1
Capital commitments mainly relate to future costs on turnarounds and maintenance at these plants.
NOTES TO THE CONSOLIDATED FINANCIAL STATEMENTSFOR THE YEARS ENDED 31 DECEMBER (CONTINUED)
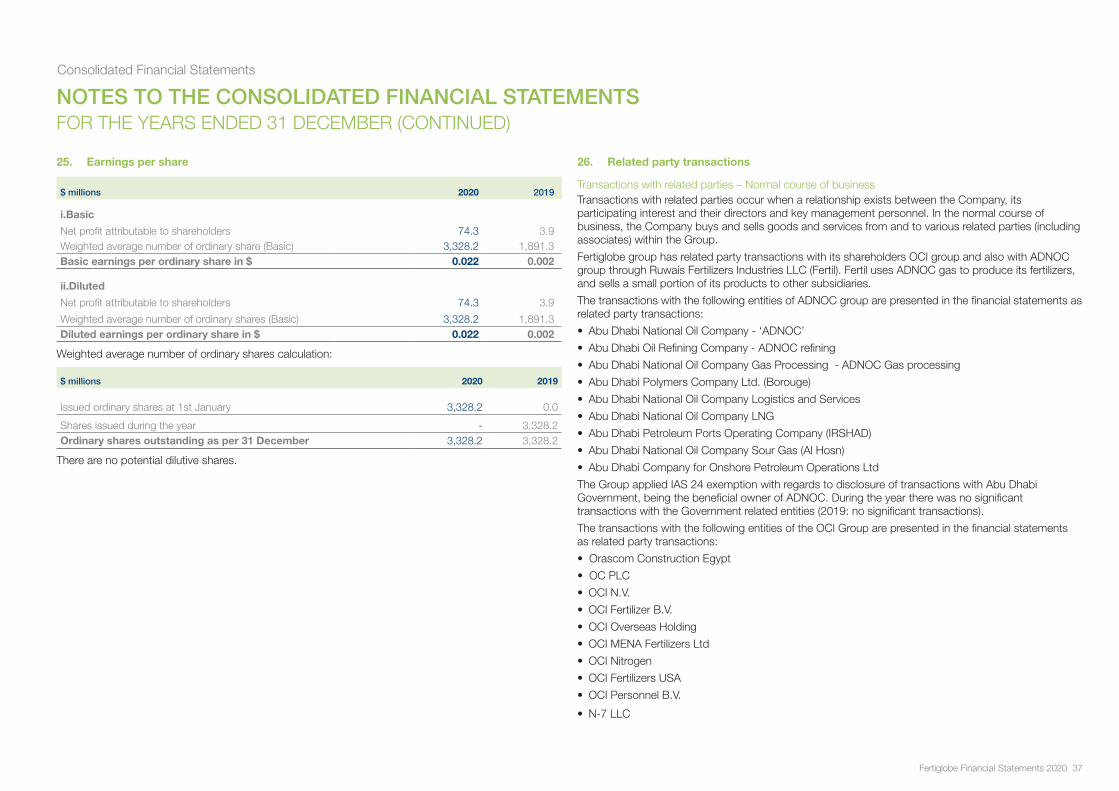
Consolidated Financial Statements
Fertiglobe Financial Statements 2020 37
25. Earnings per share
$ millions 2020 2019
i.Basic
Net profit attributable to shareholders 74.3 3.9Weighted average number of ordinary share (Basic) 3,328.2 1,891.3Basic earnings per ordinary share in $ 0.022 0.002
ii.Diluted
Net profit attributable to shareholders 74.3 3.9
Weighted average number of ordinary shares (Basic) 3,328.2 1,891.3Diluted earnings per ordinary share in $ 0.022 0.002
Weighted average number of ordinary shares calculation:
$ millions 2020 2019
Issued ordinary shares at 1st January 3,328.2 0.0
Shares issued during the year - 3,328.2Ordinary shares outstanding as per 31 December 3,328.2 3,328.2
There are no potential dilutive shares.
26. Related party transactions
Transactions with related parties – Normal course of businessTransactions with related parties occur when a relationship exists between the Company, its participating interest and their directors and key management personnel. In the normal course of business, the Company buys and sells goods and services from and to various related parties (including associates) within the Group.
Fertiglobe group has related party transactions with its shareholders OCI group and also with ADNOC group through Ruwais Fertilizers Industries LLC (Fertil). Fertil uses ADNOC gas to produce its fertilizers, and sells a small portion of its products to other subsidiaries.
The transactions with the following entities of ADNOC group are presented in the financial statements as related party transactions:
• Abu Dhabi National Oil Company - ‘ADNOC’
• Abu Dhabi Oil Refining Company - ADNOC refining
• Abu Dhabi National Oil Company Gas Processing - ADNOC Gas processing
• Abu Dhabi Polymers Company Ltd. (Borouge)
• Abu Dhabi National Oil Company Logistics and Services
• Abu Dhabi National Oil Company LNG
• Abu Dhabi Petroleum Ports Operating Company (IRSHAD)
• Abu Dhabi National Oil Company Sour Gas (Al Hosn)
• Abu Dhabi Company for Onshore Petroleum Operations Ltd
The Group applied IAS 24 exemption with regards to disclosure of transactions with Abu Dhabi Government, being the beneficial owner of ADNOC. During the year there was no significant transactions with the Government related entities (2019: no significant transactions).
The transactions with the following entities of the OCI Group are presented in the financial statements as related party transactions:
• Orascom Construction Egypt
• OC PLC
• OCI N.V.
• OCI Fertilizer B.V.
• OCI Overseas Holding
• OCI MENA Fertilizers Ltd
• OCI Nitrogen
• OCI Fertilizers USA
• OCI Personnel B.V.
• N-7 LLC
NOTES TO THE CONSOLIDATED FINANCIAL STATEMENTSFOR THE YEARS ENDED 31 DECEMBER (CONTINUED)
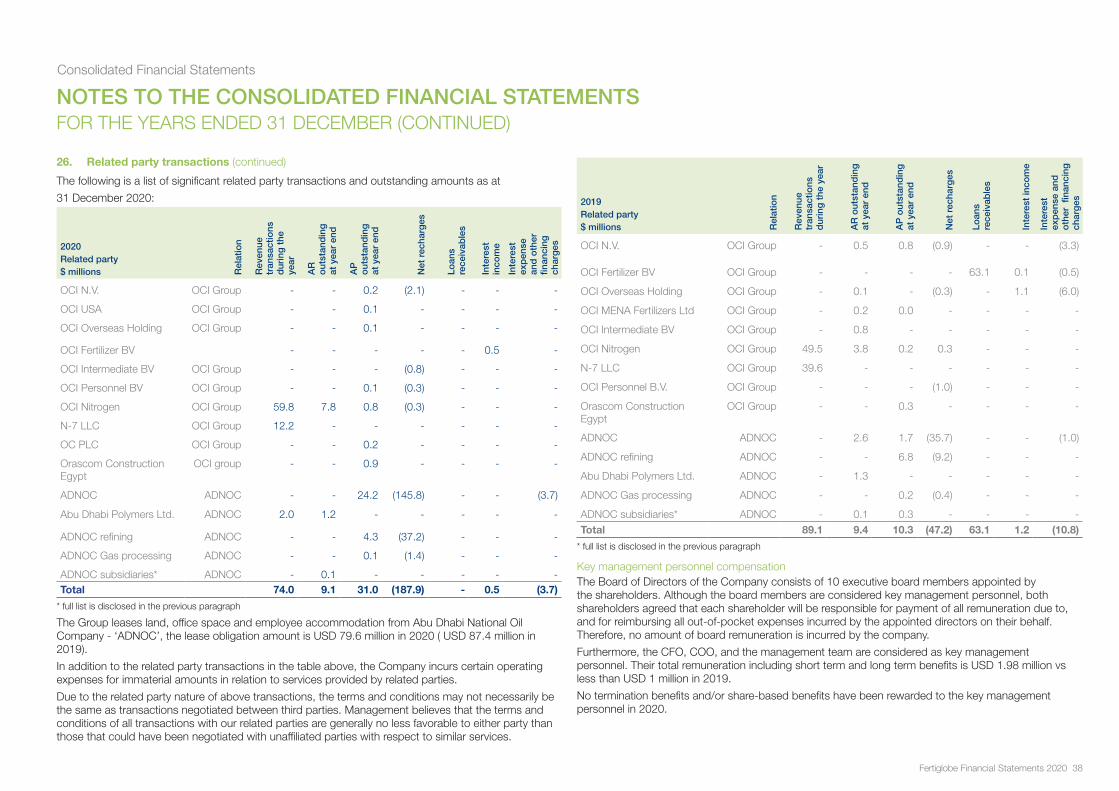
Consolidated Financial Statements
Fertiglobe Financial Statements 2020 38
26. Related party transactions (continued)
The following is a list of significant related party transactions and outstanding amounts as at
31 December 2020:
2020Related party $ millions R
elat
ion
Rev
enue
tr
ansa
ctio
ns
dur
ing
the
ye
ar
AR
o
utst
and
ing
at
yea
r en
d
AP
o
utst
and
ing
at
yea
r en
d
Net
rec
harg
es
Loan
s re
ceiv
able
s
Inte
rest
in
com
e
Inte
rest
ex
pen
se
and
oth
er
finan
cing
ch
arg
es
OCI N.V. OCI Group - - 0.2 (2.1) - - -
OCI USA OCI Group - - 0.1 - - - -
OCI Overseas Holding OCI Group - - 0.1 - - - -
OCI Fertilizer BV - - - - - 0.5 -
OCI Intermediate BV OCI Group - - - (0.8) - - -
OCI Personnel BV OCI Group - - 0.1 (0.3) - - -
OCI Nitrogen OCI Group 59.8 7.8 0.8 (0.3) - - -
N-7 LLC OCI Group 12.2 - - - - - -
OC PLC OCI Group - - 0.2 - - - -
Orascom Construction Egypt
OCI group - - 0.9 - - - -
ADNOC ADNOC - - 24.2 (145.8) - - (3.7)
Abu Dhabi Polymers Ltd. ADNOC 2.0 1.2 - - - - -
ADNOC refining ADNOC - - 4.3 (37.2) - - -
ADNOC Gas processing ADNOC - - 0.1 (1.4) - - -
ADNOC subsidiaries* ADNOC - 0.1 - - - - -Total 74.0 9.1 31.0 (187.9) - 0.5 (3.7)
* full list is disclosed in the previous paragraph
The Group leases land, office space and employee accommodation from Abu Dhabi National Oil Company - ‘ADNOC’, the lease obligation amount is USD 79.6 million in 2020 ( USD 87.4 million in 2019).
In addition to the related party transactions in the table above, the Company incurs certain operating expenses for immaterial amounts in relation to services provided by related parties.
Due to the related party nature of above transactions, the terms and conditions may not necessarily be the same as transactions negotiated between third parties. Management believes that the terms and conditions of all transactions with our related parties are generally no less favorable to either party than those that could have been negotiated with unaffiliated parties with respect to similar services.
2019 Related party $ millions R
elat
ion
Rev
enue
tr
ansa
ctio
ns
dur
ing
the
yea
r
AR
out
stan
din
g
at y
ear
end
AP
out
stan
din
g
at y
ear
end
Net
rec
harg
es
Loan
s re
ceiv
able
s
Inte
rest
inco
me
Inte
rest
ex
pen
se a
nd
oth
er fi
nanc
ing
ch
arg
es
OCI N.V. OCI Group - 0.5 0.8 (0.9) - - (3.3)
OCI Fertilizer BV OCI Group - - - - 63.1 0.1 (0.5)
OCI Overseas Holding OCI Group - 0.1 - (0.3) - 1.1 (6.0)
OCI MENA Fertilizers Ltd OCI Group - 0.2 0.0 - - - -
OCI Intermediate BV OCI Group - 0.8 - - - - -
OCI Nitrogen OCI Group 49.5 3.8 0.2 0.3 - - -
N-7 LLC OCI Group 39.6 - - - - - -
OCI Personnel B.V. OCI Group - - - (1.0) - - -
Orascom Construction Egypt
OCI Group - - 0.3 - - - -
ADNOC ADNOC - 2.6 1.7 (35.7) - - (1.0)
ADNOC refining ADNOC - - 6.8 (9.2) - - -
Abu Dhabi Polymers Ltd. ADNOC - 1.3 - - - - -
ADNOC Gas processing ADNOC - - 0.2 (0.4) - - -
ADNOC subsidiaries* ADNOC - 0.1 0.3 - - - -Total 89.1 9.4 10.3 (47.2) 63.1 1.2 (10.8)
* full list is disclosed in the previous paragraph
Key management personnel compensationThe Board of Directors of the Company consists of 10 executive board members appointed by the shareholders. Although the board members are considered key management personnel, both shareholders agreed that each shareholder will be responsible for payment of all remuneration due to, and for reimbursing all out-of-pocket expenses incurred by the appointed directors on their behalf. Therefore, no amount of board remuneration is incurred by the company.
Furthermore, the CFO, COO, and the management team are considered as key management personnel. Their total remuneration including short term and long term benefits is USD 1.98 million vs less than USD 1 million in 2019.
No termination benefits and/or share-based benefits have been rewarded to the key management personnel in 2020.
NOTES TO THE CONSOLIDATED FINANCIAL STATEMENTSFOR THE YEARS ENDED 31 DECEMBER (CONTINUED)
Consolidated Financial Statements
Fertiglobe Financial Statements 2020 39
27. Contingencies
Contingent liabilities
Letter of guarantee / letters of creditThe main trading entities of the Group have performance bonds and letter of guarantee provided by HSBC and Mashreq bank amounting to USD 18.8 million for its strategic customers, and they have performance bonds with governments issued by local banks for an amount of USD 0.4 million as at 31 December 2020.
Litigations and claimsIn the normal course of business, the Group entities and joint ventures are involved in some arbitration or court cases as defendants or claimants. These litigations are carefully monitored by the entities’ management and legal counsels, and are regularly assessed with due consideration for possible insurance coverage and recourse rights on third parties. The Group does not expect these proceedings to result in liabilities that have a material effect on the Group’s financial position. In cases where it is probable that the outcome of the proceedings will be unfavorable, and the financial outcome can be measured reliably, a provision has been recognized in the consolidated financial statements which is disclosed in note 19 ‘Provisions’. It should be understood that, in light of possible future developments, such as (a) potential additional lawsuits, (b) possible future settlements, and (c) rulings or judgments in pending lawsuits, certain cases may result in additional liabilities and related costs. At this point in time, the Group cannot estimate any additional amount of loss or range of loss in excess of the recorded amounts with sufficient certainty to allow such amount or range of amounts to be meaningful. Moreover, if and to the extent that the contingent liabilities materialize, they are typically paid over a number of years and the timing of such payments cannot be predicted with confidence. While the outcome of said cases, claims and disputes cannot be predicted with certainty, we believe, based upon legal advice and information received, that the final outcome will not materially affect our consolidated financial position but could be material to our results of operations or cash flows in any one accounting period.
EBIC free zone statusOn 20 April 2013, the Administrative Court ruled in favor of EBIC for the reinstatement of EBIC to its previous status as a free zone entity in Egypt. The General Authority for Investment and Free Zones (‘GAFI’) filed an appeal before the Administrative Court. The Court has not yet rendered a decision.
EBIC concluded to release the (deferred) tax liabilities totaling USD 138.2 million at 31 December 2015 and no tax filings have been done by EBIC since the filing for the year 2011. On 4 January 2018, GAFI issued an executive decision that allows for the enforcement of the Administrative Court’s judgment in favor of EBIC and EBIC received the Free Zone Status tax card. EBIC’s free zone status will remain subject to the outcome of the Appeal before the Administrative Court.
Sorfert legal caseOn 5 March 2018, the lower criminal court of Oran (Tribunal du pôle pénal spécialisé d’Oran) issued a judgment against Sorfert regarding an alleged violation of exchange control regulations as well as the regulation of public markets and public service delegations. The lower court ordered Sorfert to pay a fine in the amount of 5.5 billion Algerian dinars (about USD 42.1 million) and an officer of the company received a fine of DZD 2.8 billion (about USD 21.1 million). On 7 March 2018, Sorfert lodged an appeal with the Court of Appeal of Oran, Algeria who upheld the verdict against Sorfert in its judgment rendered on 28 November 2018. In January 2019, Sorfert lodged an appeal against this judgment with the Supreme Court. Sorfert disputes the validity of the judgment and continues to vigorously defend its case. To date, no Supreme Court hearing has been scheduled and during the appeal period the enforcement of the judgment is suspended. Various renowned local and international law firms have examined Sorfert legal position. No provision has been recorded by the Group related to this matter.
Asset retirement obligationsSorfert has a contractual asset retirement obligation in connection with the lease of its land. This asset retirement obligation is being disclosed as a contingent liability because it is not possible to determine a reliable estimate in both timing and value of this obligation.
Fertil entered into an agreement with ADNOC for the lease of the land on which it operates its plant. The agreement has an indefinite term and includes an asset dismantling obligation and the obligation to clean up environmental pollution occurred after decommissioning. This obligation has not been accounted for, since the company has no plans to end its business activities in the foreseeable future as such the financial impact is assessed as not material by the company’s management.
OCI S.A.E. tax dispute In October 2012, the Egyptian Tax Authority (‘ETA’) raised a tax evasion claim against our Egyptian subsidiary, Orascom Construction Industries S.A.E. (‘OCI S.A.E.’). The tax dispute related to the sale of OCI S.A.E.’s cement business to Lafarge SA in 2007. This was filed against OCI S.A.E. despite there being no official investigation. Although OCI S.A.E. and its legal and tax advisors believed that the aforementioned transaction was exempted of tax, management entered into a settlement agreement whereby EGP 7.1 billion would be paid over a 5-year period.
The agreement was followed by payment of a first installment of EGP 2.5 billion in 2013. Following the change in government, the company was exonerated from the tax claim by the Egyptian Public Prosecutor on 18 February 2014 and subsequently by the ETA’s Independent Appeals Committee on 4 November 2014. The ETA appealed this decision without including new facts or documents. The appeal is ongoing. OCI S.A.E. and its local counsel believe the likelihood of a judgment in favor of the ETA is not probable. On 13 November 2014 OCI S.A.E. announced that it would transfer its rights to EGP 1.9 billion undue paid tax amounts to the Tahya Misr Fund and recorded a provision for this amount, reference is made to note 19 Provisions.
NOTES TO THE CONSOLIDATED FINANCIAL STATEMENTSFOR THE YEARS ENDED 31 DECEMBER (CONTINUED)
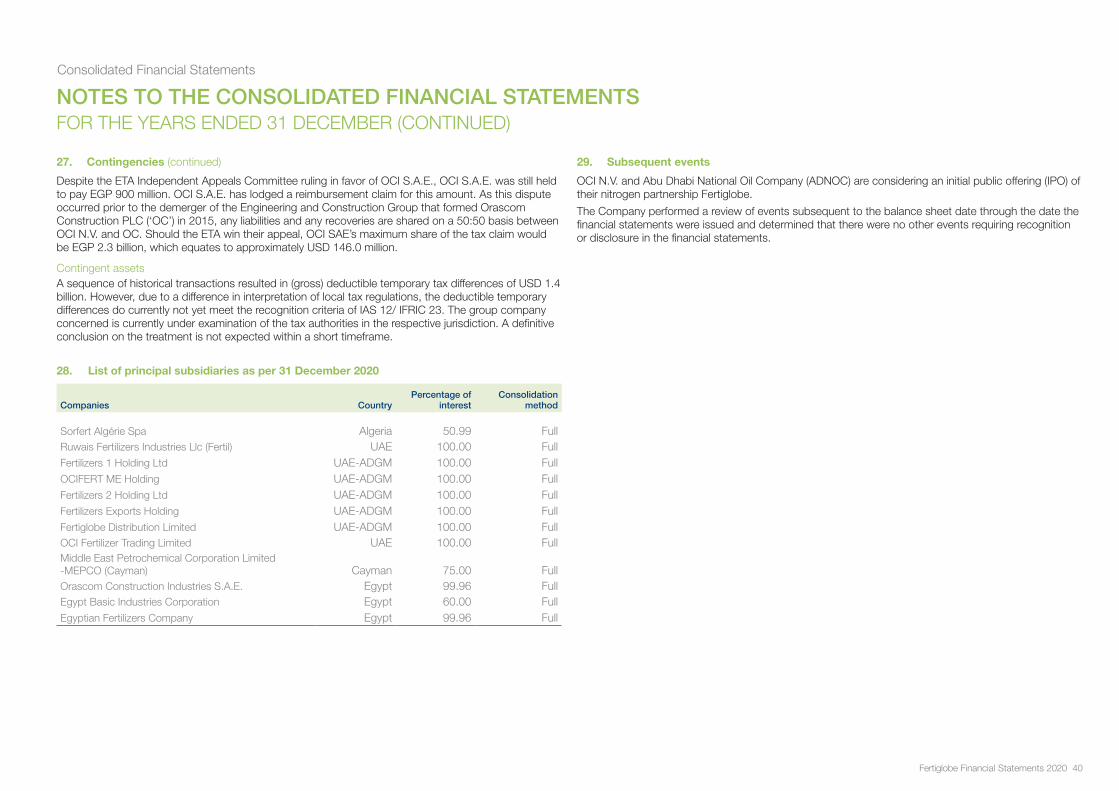
Consolidated Financial Statements
Fertiglobe Financial Statements 2020 40
NOTES TO THE CONSOLIDATED FINANCIAL STATEMENTSFOR THE YEARS ENDED 31 DECEMBER (CONTINUED)
27. Contingencies (continued)
Despite the ETA Independent Appeals Committee ruling in favor of OCI S.A.E., OCI S.A.E. was still held to pay EGP 900 million. OCI S.A.E. has lodged a reimbursement claim for this amount. As this dispute occurred prior to the demerger of the Engineering and Construction Group that formed Orascom Construction PLC (‘OC’) in 2015, any liabilities and any recoveries are shared on a 50:50 basis between OCI N.V. and OC. Should the ETA win their appeal, OCI SAE’s maximum share of the tax claim would be EGP 2.3 billion, which equates to approximately USD 146.0 million.
Contingent assetsA sequence of historical transactions resulted in (gross) deductible temporary tax differences of USD 1.4 billion. However, due to a difference in interpretation of local tax regulations, the deductible temporary differences do currently not yet meet the recognition criteria of IAS 12/ IFRIC 23. The group company concerned is currently under examination of the tax authorities in the respective jurisdiction. A definitive conclusion on the treatment is not expected within a short timeframe.
28. List of principal subsidiaries as per 31 December 2020
Companies Country Percentage of
interestConsolidation
method
Sorfert Algérie Spa Algeria 50.99 FullRuwais Fertilizers Industries Llc (Fertil) UAE 100.00 FullFertilizers 1 Holding Ltd UAE-ADGM 100.00 FullOCIFERT ME Holding UAE-ADGM 100.00 FullFertilizers 2 Holding Ltd UAE-ADGM 100.00 FullFertilizers Exports Holding UAE-ADGM 100.00 FullFertiglobe Distribution Limited UAE-ADGM 100.00 FullOCI Fertilizer Trading Limited UAE 100.00 FullMiddle East Petrochemical Corporation Limited -MEPCO (Cayman) Cayman 75.00 FullOrascom Construction Industries S.A.E. Egypt 99.96 FullEgypt Basic Industries Corporation Egypt 60.00 FullEgyptian Fertilizers Company Egypt 99.96 Full
29. Subsequent events
OCI N.V. and Abu Dhabi National Oil Company (ADNOC) are considering an initial public offering (IPO) of their nitrogen partnership Fertiglobe.
The Company performed a review of events subsequent to the balance sheet date through the date the financial statements were issued and determined that there were no other events requiring recognition or disclosure in the financial statements.