2020 financial statements
TRANSCRIPT

METROBANK I 2020 Annual Report & Sustainability Report A
2020 Financial Statements

METROBANK I 2020 Annual Report & Sustainability Report 1
SUMMARY OF FINANCIAL STATEMENTS(In Million Pesos, Except Per Share Amounts and Foreign Exchange Rates)
At Year End Consolidated Parent 2020 2019 2020 2019Total Assets 2,455,163 2,450,813 2,153,999 2,087,435Loans and Receivables – Net 1,252,929 1,483,568 1,048,742 1,177,101Investment Securities 670,289 516,015 618,531 454,870Others 531,945 451,230 486,726 455,464 Total Liabilities 2,121,988 2,132,322 1,829,110 1,767,443Deposit Liabilities 1,797,215 1,714,144 1,582,911 1,500,292Demand 515,378 411,873 467,545 372,303Savings 795,979 665,634 755,713 630,946Time 450,103 592,897 332,323 461,713Long-Term Negotiable Certificates of Deposit 35,755 43,740 27,330 35,330Others 324,773 418,178 246,199 267,151 Total Equity 333,175 318,491 324,889 319,992Attributable to: Equity Holders of the Parent Company 324,204 309,554 324,889 319,992Non-Controlling Interest 8,971 8,937 0 0 Book Value Per Share (BVPS) 72.10 68.84 72.26 71.17 Foreign Exchange (USD:PHP) BAP Closing Rate 48.02 50.64 BAP Weighted Average Rate 49.63 51.79 (BAP: Bankers Association of the Philippines)
For the Year Consolidated Parent 2020 2019 2020 2019Net Interest Income 86,107 76,997 68,118 49,921Interest Income 107,787 116,183 83,287 76,233Interest Expense 21,680 39,186 15,169 26,312 Non-interest Income 35,793 29,922 30,562 23,692Trading and Securities Gain (Loss) - Net 14,743 5,472 13,108 4,352Service Charges, Fees and Commissions 11,703 14,266 8,991 5,145Foreign Exchange Gain (Loss) - Net 4,409 3,798 4,320 3,521Leasing 2,007 2,122 200 210Income from Trust Operations 1,444 1,241 1,401 1,204Other Non-interest Income1 1,487 3,023 2,542 9,260 Total Operating Income 121,900 106,919 98,680 73,613 Total Operating Expenses 100,880 67,984 77,939 38,949Provision for Credit and Impairment Losses 40,760 10,078 32,745 1,644Other Operating Expenses 60,120 57,906 45,194 37,305 Provision for Income Tax 7,046 10,061 6,910 6,609 Net Income 13,974 28,874 13,831 28,055Attributable to: Equity Holders of the Parent Company 13,831 28,055 Non-controlling Interest 143 819 Basic/Diluted Earnings Per Share (EPS) 3.08 6.24 Attributable to Equity Holders of the Parent Company 1 - Includes share in net income of subsidiaries, associates and a joint venture
For the Year Consolidated Parent 2020 2019 2020 2019Net Interest Margin 4.0% 3.8% 3.8% 3.1%Return on Average Equity 4.4% 9.5% 4.3% 9.2%Return on Average Assets 0.6% 1.2% 0.7% 1.4%Non-performing Loans Ratio 2.4% 1.3% 1.7% 0.9% Capital Adequacy Ratio 20.2% 17.5% 19.5% 15.5%Tier 1 Capital 19.3% 16.2% 18.6% 14.1%Common Equity Tier 1 19.3% 16.2% 18.6% 14.1%
METROBANK I 2020 Annual Report & Sustainability Report 1
To be the country’s premiere financial
conglomerate, empowering our individual
and business clients to realize their goals
and reach their full potential. By creating
and customizing financial solutions in
response to our stakeholders’ needs,
continuously expanding our scope of reach,
and leading in community service, we live
up to our “You’re in Good Hands” promise
that embodies who we are and what we do.
We are Metrobank.*
The Trusted Financial Partner
Our business relies on the principles of
trust, honesty and integrity as we serve
our customers and help them attain their
financial goals.
The Employer of Choice
We strengthen the organization by
continuously developing and enhancing
the abilities of our people.
We nurture them into professional
individuals with integrity and passion
for service and excellence. We ensure
their future by providing them with
fulfilling careers.
A Responsible Bank
We adhere to the highest standards
of corporate governance, exercising
accountability, fairness, and transparency
across all our business operations.
We exercise good management to provide
our shareholders with sustainable returns
on their investments.
An Institution with a Heart
We give back to the communities we
serve, committed to making meaningful
contributions to the economic and social
development of our nation.
• Passion for Results
• Integrity
• Teamwork
• Commitment to Customer Service
• Heart for Community
*The Vision Mission Statement (VMS) was approved by the Board in January 2020
VISION MISSIONSTATEMENT
WE COMMIT TO BE
CORE VALUES
MEANINGFUL BANKING
IN THE NEW NORMAL
METROBANK I 2020 Annual Report & Sustainability Report 3 2 METROBANK I 2020 Annual Report & Sustainability Report
RESULTS OF OPERATIONS FINANCIAL CONDITION
Metropolitan Bank & Trust Company (Metrobank) reported income before provisions of Php61.8 billion
in 2020, up 26% year-on-year. In line with its strategy to better prepare for the risks associated with the
pandemic, Metrobank booked provisions of Php40.8 billion, resulting in a full year 2020 net income of
Php13.8 billion.
The growth in operating income was supported by strong revenues and improving operating efficiency.
Healthy CASA deposit generation helped ease the overall funding cost in 2020 and supported net interest
margins, which improved by 14 basis points to 3.98%. As a result, net interest income rose 11.8% from the
previous year.
Non-interest income expanded by 20%, lifted by trading and FX gains of Php19.2 billion as Metrobank
optimized its investment portfolio under a record-low interest rate environment.
Growth in operating expenses was kept at 4% to Php60.1 billion, underscored by continued efforts to enhance
productivity and operational efficiency. Cost-to-income ratio improved to 50% from 55%, previously.
In line with Metrobank’s conservative strategy to proactively manage asset quality risks, it has set aside
Php40.8 billion in provisions for bad loans, four times more than the Php10.1 billion provisions booked in 2019.
Metrobank’s share price at the end of 2020 was at Php49.05 per share for a market capitalization of
Php220.6 billion.
Metrobank ended 2020 as the country’s second largest bank with consolidated assets of Php2.5 trillion.
Gross loans recorded a 13% contraction to Php1.3 trillion as the economic impact of the pandemic affected
business and consumer confidence. Commercial clients trimmed working capital loans and deferred
expansion plans while consumer customers limited spending to essential goods and deferred big ticket
purchases.
Non-performing loans have been manageable, with an NPL ratio of 2.4% from 1.3% in 2019. Nonetheless,
the aggressive provisioning has raised NPL cover to 163% from 103% in 2019 strengthening Metrobank’s
capacity to withstand higher NPLs.
Metrobank’s low cost current and savings accounts (CASA) increased 22% to Php1.3 trillion, propelling
total deposits to reach Php1.8 trillion in 2020, reflecting Metrobank’s solid deposit franchise. CASA ratio
improved to 73% from 63% a year ago.
Metrobank’s capital ratios are among the highest in the industry, with capital adequacy ratio (CAR) of
20.2% and Common Equity Tier 1 (CET1) ratio of 19.3%, both substantially higher than the minimum
regulatory thresholds.
MEANINGFUL BANKING
IN THE NEW NORMAL
METROBANK I 2020 Annual Report & Sustainability Report 5 4 METROBANK I 2020 Annual Report & Sustainability Report
SUPPLEMENTARY MANAGEMENT DISCUSSION
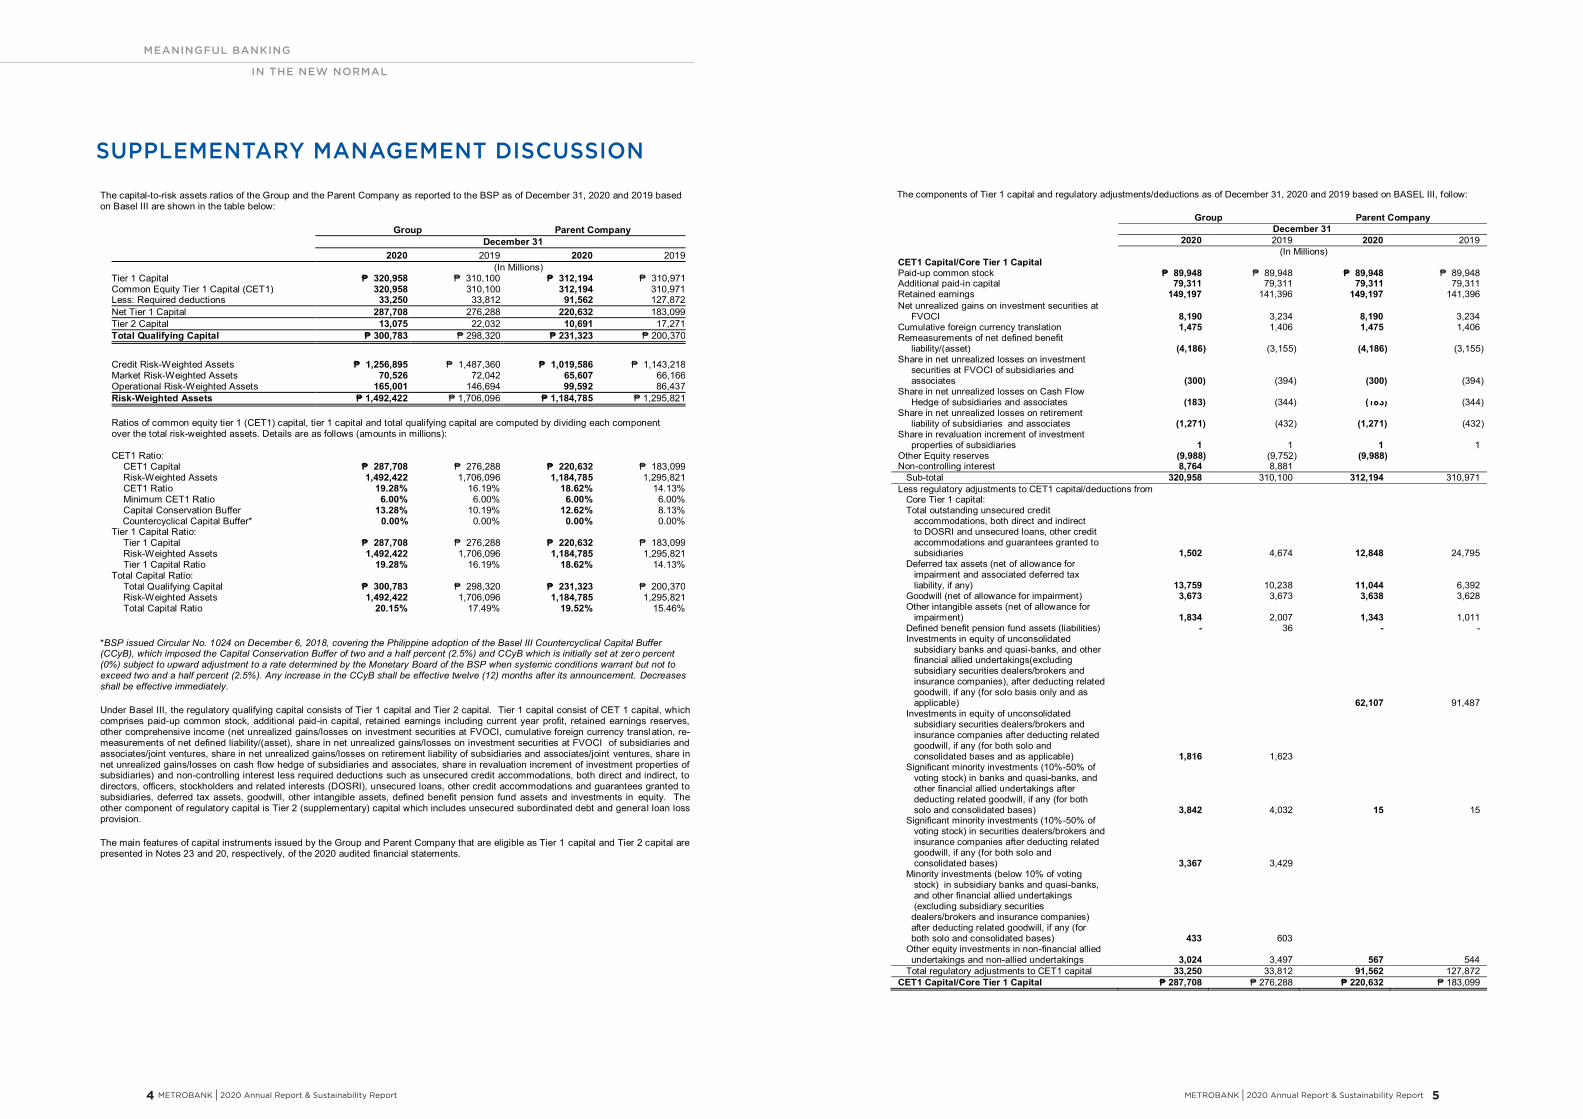
The capital-to-risk assets ratios of the Group and the Parent Company as reported to the BSP as of December 31, 2020 and 2019 based on Basel III are shown in the table below:
Group Parent Company December 31 2020 2019 2020 2019 (In Millions) Tier 1 Capital ₱ 320,958 ₱ 310,100 ₱ 312,194 ₱ 310,971 Common Equity Tier 1 Capital (CET1) 320,958 310,100 312,194 310,971 Less: Required deductions 33,250 33,812 91,562 127,872 Net Tier 1 Capital 287,708 276,288 220,632 183,099 Tier 2 Capital 13,075 22,032 10,691 17,271 Total Qualifying Capital ₱ 300,783 ₱ 298,320 ₱ 231,323 ₱ 200,370
Credit Risk-Weighted Assets ₱ 1,256,895 ₱ 1,487,360 ₱ 1,019,586 ₱ 1,143,218 Market Risk-Weighted Assets 70,526 72,042 65,607 66,166 Operational Risk-Weighted Assets 165,001 146,694 99,592 86,437 Risk-Weighted Assets ₱ 1,492,422 ₱ 1,706,096 ₱ 1,184,785 ₱ 1,295,821 Ratios of common equity tier 1 (CET1) capital, tier 1 capital and total qualifying capital are computed by dividing each component over the total risk-weighted assets. Details are as follows (amounts in millions): CET1 Ratio:
CET1 Capital ₱ 287,708 ₱ 276,288 ₱ 220,632 ₱ 183,099 Risk-Weighted Assets 1,492,422 1,706,096 1,184,785 1,295,821 CET1 Ratio 19.28% 16.19% 18.62% 14.13% Minimum CET1 Ratio 6.00% 6.00% 6.00% 6.00% Capital Conservation Buffer 13.28% 10.19% 12.62% 8.13%
Countercyclical Capital Buffer* 0.00% 0.00% 0.00% 0.00% Tier 1 Capital Ratio:
Tier 1 Capital ₱ 287,708 ₱ 276,288 ₱ 220,632 ₱ 183,099 Risk-Weighted Assets 1,492,422 1,706,096 1,184,785 1,295,821 Tier 1 Capital Ratio 19.28% 16.19% 18.62% 14.13%
Total Capital Ratio: Total Qualifying Capital ₱ 300,783 ₱ 298,320 ₱ 231,323 ₱ 200,370 Risk-Weighted Assets 1,492,422 1,706,096 1,184,785 1,295,821 Total Capital Ratio 20.15% 17.49% 19.52% 15.46%
*BSP issued Circular No. 1024 on December 6, 2018, covering the Philippine adoption of the Basel III Countercyclical Capital Buffer (CCyB), which imposed the Capital Conservation Buffer of two and a half percent (2.5%) and CCyB which is initially set at zero percent (0%) subject to upward adjustment to a rate determined by the Monetary Board of the BSP when systemic conditions warrant but not to exceed two and a half percent (2.5%). Any increase in the CCyB shall be effective twelve (12) months after its announcement. Decreases shall be effective immediately.
Under Basel III, the regulatory qualifying capital consists of Tier 1 capital and Tier 2 capital. Tier 1 capital consist of CET 1 capital, which comprises paid-up common stock, additional paid-in capital, retained earnings including current year profit, retained earnings reserves, other comprehensive income (net unrealized gains/losses on investment securities at FVOCI, cumulative foreign currency translation, re-measurements of net defined liability/(asset), share in net unrealized gains/losses on investment securities at FVOCI of subsidiaries and associates/joint ventures, share in net unrealized gains/losses on retirement liability of subsidiaries and associates/joint ventures, share in net unrealized gains/losses on cash flow hedge of subsidiaries and associates, share in revaluation increment of investment properties of subsidiaries) and non-controlling interest less required deductions such as unsecured credit accommodations, both direct and indirect, to directors, officers, stockholders and related interests (DOSRI), unsecured loans, other credit accommodations and guarantees granted to subsidiaries, deferred tax assets, goodwill, other intangible assets, defined benefit pension fund assets and investments in equity. The other component of regulatory capital is Tier 2 (supplementary) capital which includes unsecured subordinated debt and general loan loss provision.
The main features of capital instruments issued by the Group and Parent Company that are eligible as Tier 1 capital and Tier 2 capital are presented in Notes 23 and 20, respectively, of the 2020 audited financial statements.
The components of Tier 1 capital and regulatory adjustments/deductions as of December 31, 2020 and 2019 based on BASEL III, follow:
Group Parent Company
December 31
2020 2019 2020 2019
(In Millions)
CET1 Capital/Core Tier 1 Capital Paid-up common stock ₱ 89,948 ₱ 89,948 ₱ 89,948 ₱ 89,948
Additional paid-in capital 79,311 79,311 79,311 79,311 Retained earnings 149,197 141,396 149,197 141,396 Net unrealized gains on investment securities at FVOCI 8,190 3,234 8,190 3,234 Cumulative foreign currency translation 1,475 1,406 1,475 1,406 Remeasurements of net defined benefit liability/(asset) (4,186). (3,155). (4,186). (3,155). Share in net unrealized losses on investment
securities at FVOCI of subsidiaries and associates (300).
(394). (300).
(394).
Share in net unrealized losses on Cash Flow Hedge of subsidiaries and associates (183). (344). (183). (344).
Share in net unrealized losses on retirement liability of subsidiaries and associates (1,271). (432). (1,271). (432).
Share in revaluation increment of investment properties of subsidiaries 1
1 1
1
Other Equity reserves (9,988). (9,752). (9,988). Non-controlling interest 8,764 8,881
Sub-total 320,958 310,100 312,194 310,971 Less regulatory adjustments to CET1 capital/deductions from Core Tier 1 capital:
Total outstanding unsecured credit accommodations, both direct and indirect
to DOSRI and unsecured loans, other credit accommodations and guarantees granted to
subsidiaries 1,502
4,674 12,848
24,795 Deferred tax assets (net of allowance for impairment and associated deferred tax liability, if any) 13,759
10,238 11,044
6,392
Goodwill (net of allowance for impairment) 3,673 3,673 3,638 3,628 Other intangible assets (net of allowance for impairment) 1,834
2,007 1,343
1,011
Defined benefit pension fund assets (liabilities) - 36 - - Investments in equity of unconsolidated subsidiary banks and quasi-banks, and other financial allied undertakings(excluding subsidiary securities dealers/brokers and
insurance companies), after deducting related goodwill, if any (for solo basis only and as applicable)
62,107
91,487
Investments in equity of unconsolidated subsidiary securities dealers/brokers and insurance companies after deducting related goodwill, if any (for both solo and consolidated bases and as applicable) 1,816
1,623
Significant minority investments (10%-50% of voting stock) in banks and quasi-banks, and other financial allied undertakings after deducting related goodwill, if any (for both solo and consolidated bases) 3,842
4,032 15
15
Significant minority investments (10%-50% of voting stock) in securities dealers/brokers and insurance companies after deducting related goodwill, if any (for both solo and consolidated bases) 3,367
3,429
Minority investments (below 10% of voting stock) in subsidiary banks and quasi-banks, and other financial allied undertakings (excluding subsidiary securities dealers/brokers and insurance companies) after deducting related goodwill, if any (for both solo and consolidated bases) 433 603
Other equity investments in non-financial allied undertakings and non-allied undertakings 3,024 3,497 567 544
Total regulatory adjustments to CET1 capital 33,250 33,812 91,562 127,872 CET1 Capital/Core Tier 1 Capital ₱ 287,708 ₱ 276,288 ₱ 220,632 ₱ 183,099
MEANINGFUL BANKING
IN THE NEW NORMAL
METROBANK I 2020 Annual Report & Sustainability Report 7 6 METROBANK I 2020 Annual Report & Sustainability Report
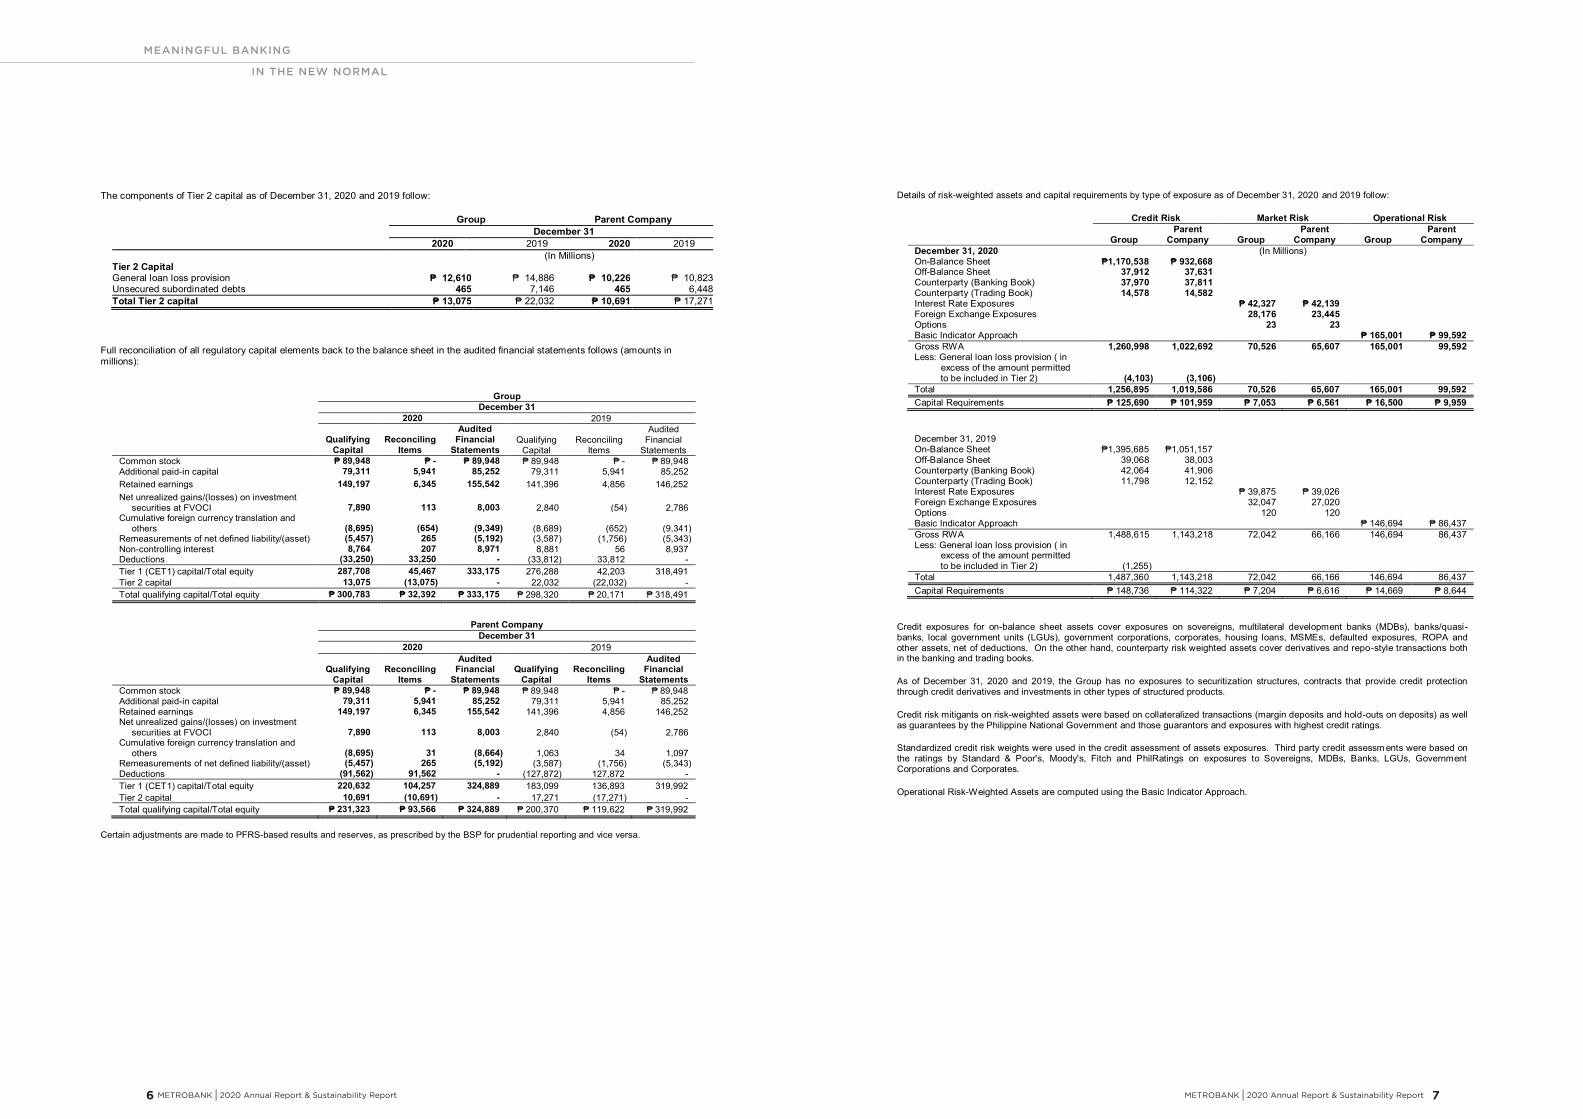
The components of Tier 2 capital as of December 31, 2020 and 2019 follow:
Group Parent Company December 31 2020 2019 2020 2019 (In Millions) Tier 2 Capital General loan loss provision ₱ 12,610 ₱ 14,886 ₱ 10,226 ₱ 10,823 Unsecured subordinated debts 465 7,146 465 6,448 Total Tier 2 capital ₱ 13,075 ₱ 22,032 ₱ 10,691 ₱ 17,271
Full reconciliation of all regulatory capital elements back to the balance sheet in the audited financial statements follows (amounts in millions):
Group
December 31
2020 2019
Qualifying Capital
Reconciling Items
Audited Financial
Statements Qualifying
Capital Reconciling
Items
Audited Financial
Statements Common stock ₱ 89,948 ₱ - ₱ 89,948 ₱ 89,948 ₱ - ₱ 89,948 Additional paid-in capital 79,311 5,941 85,252 79,311 5,941 85,252 Retained earnings 149,197 6,345 155,542 141,396 4,856 146,252 Net unrealized gains/(losses) on investment securities at FVOCI
7,890
113
8,003
2,840
(54).
2,786
Cumulative foreign currency translation and others
(8,695).
(654).
(9,349).
(8,689).
(652).
(9,341).
Remeasurements of net defined liability/(asset) (5,457). 265 (5,192). (3,587). (1,756). (5,343). Non-controlling interest 8,764 207 8,971 8,881 56 8,937 Deductions (33,250). 33,250 - (33,812). 33,812 - Tier 1 (CET1) capital/Total equity 287,708 45,467 333,175 276,288 42,203 318,491 Tier 2 capital 13,075 (13,075). - 22,032 (22,032). - Total qualifying capital/Total equity ₱ 300,783 ₱ 32,392 ₱ 333,175 ₱ 298,320 ₱ 20,171 ₱ 318,491
Parent Company
December 31
2020 2019
Qualifying Reconciling Audited
Financial Qualifying Reconciling Audited
Financial Capital Items Statements Capital Items Statements Common stock ₱ 89,948 ₱ - ₱ 89,948 ₱ 89,948 ₱ - ₱ 89,948 Additional paid-in capital 79,311 5,941 85,252 79,311 5,941 85,252 Retained earnings 149,197 6,345 155,542 141,396 4,856 146,252 Net unrealized gains/(losses) on investment securities at FVOCI
7,890
113
8,003
2,840
(54).
2,786
Cumulative foreign currency translation and others
(8,695).
31
(8,664).
1,063
34
1,097
Remeasurements of net defined liability/(asset) (5,457). 265 (5,192). (3,587). (1,756). (5,343). Deductions (91,562). 91,562 - (127,872). 127,872 - Tier 1 (CET1) capital/Total equity 220,632 104,257 324,889 183,099 136,893 319,992 Tier 2 capital 10,691 (10,691). - 17,271 (17,271). - Total qualifying capital/Total equity ₱ 231,323 ₱ 93,566 ₱ 324,889 ₱ 200,370 ₱ 119,622 ₱ 319,992
Certain adjustments are made to PFRS-based results and reserves, as prescribed by the BSP for prudential reporting and vice versa.
Details of risk-weighted assets and capital requirements by type of exposure as of December 31, 2020 and 2019 follow:
Credit Risk Market Risk Operational Risk
Group Parent
Company Group Parent
Company Group Parent
Company December 31, 2020 (In Millions) On-Balance Sheet ₱1,170,538 ₱ 932,668
Off-Balance Sheet 37,912 37,631 Counterparty (Banking Book) 37,970 37,811 Counterparty (Trading Book) 14,578 14,582 Interest Rate Exposures
₱ 42,327 ₱ 42,139
Foreign Exchange Exposures
28,176 23,445 Options
23 23
Basic Indicator Approach ₱ 165,001 ₱ 99,592 Gross RWA 1,260,998 1,022,692 70,526 65,607 165,001 99,592 Less: General loan loss provision ( in
excess of the amount permitted to be included in Tier 2) (4,103) (3,106)
Total 1,256,895 1,019,586 70,526 65,607 165,001 99,592 Capital Requirements ₱ 125,690 ₱ 101,959 ₱ 7,053 ₱ 6,561 ₱ 16,500 ₱ 9,959
December 31, 2019 On-Balance Sheet ₱1,395,685 ₱1,051,157
Off-Balance Sheet 39,068 38,003 Counterparty (Banking Book) 42,064 41,906 Counterparty (Trading Book) 11,798 12,152 Interest Rate Exposures
₱ 39,875 ₱ 39,026
Foreign Exchange Exposures
32,047 27,020 Options
120 120
Basic Indicator Approach ₱ 146,694 ₱ 86,437 Gross RWA 1,488,615 1,143,218 72,042 66,166 146,694 86,437 Less: General loan loss provision ( in
excess of the amount permitted to be included in Tier 2) (1,255) .
Total 1,487,360 1,143,218 72,042 66,166 146,694 86,437 Capital Requirements ₱ 148,736 ₱ 114,322 ₱ 7,204 ₱ 6,616 ₱ 14,669 ₱ 8,644
Credit exposures for on-balance sheet assets cover exposures on sovereigns, multilateral development banks (MDBs), banks/quasi-banks, local government units (LGUs), government corporations, corporates, housing loans, MSMEs, defaulted exposures, ROPA and other assets, net of deductions. On the other hand, counterparty risk weighted assets cover derivatives and repo-style transactions both in the banking and trading books.
As of December 31, 2020 and 2019, the Group has no exposures to securitization structures, contracts that provide credit protection through credit derivatives and investments in other types of structured products.
Credit risk mitigants on risk-weighted assets were based on collateralized transactions (margin deposits and hold-outs on deposits) as well as guarantees by the Philippine National Government and those guarantors and exposures with highest credit ratings.
Standardized credit risk weights were used in the credit assessment of assets exposures. Third party credit assessm ents were based on the ratings by Standard & Poor's, Moody's, Fitch and PhilRatings on exposures to Sovereigns, MDBs, Banks, LGUs, Government Corporations and Corporates.
Operational Risk-Weighted Assets are computed using the Basic Indicator Approach.
MEANINGFUL BANKING
IN THE NEW NORMAL
METROBANK I 2020 Annual Report & Sustainability Report 9 8 METROBANK I 2020 Annual Report & Sustainability Report
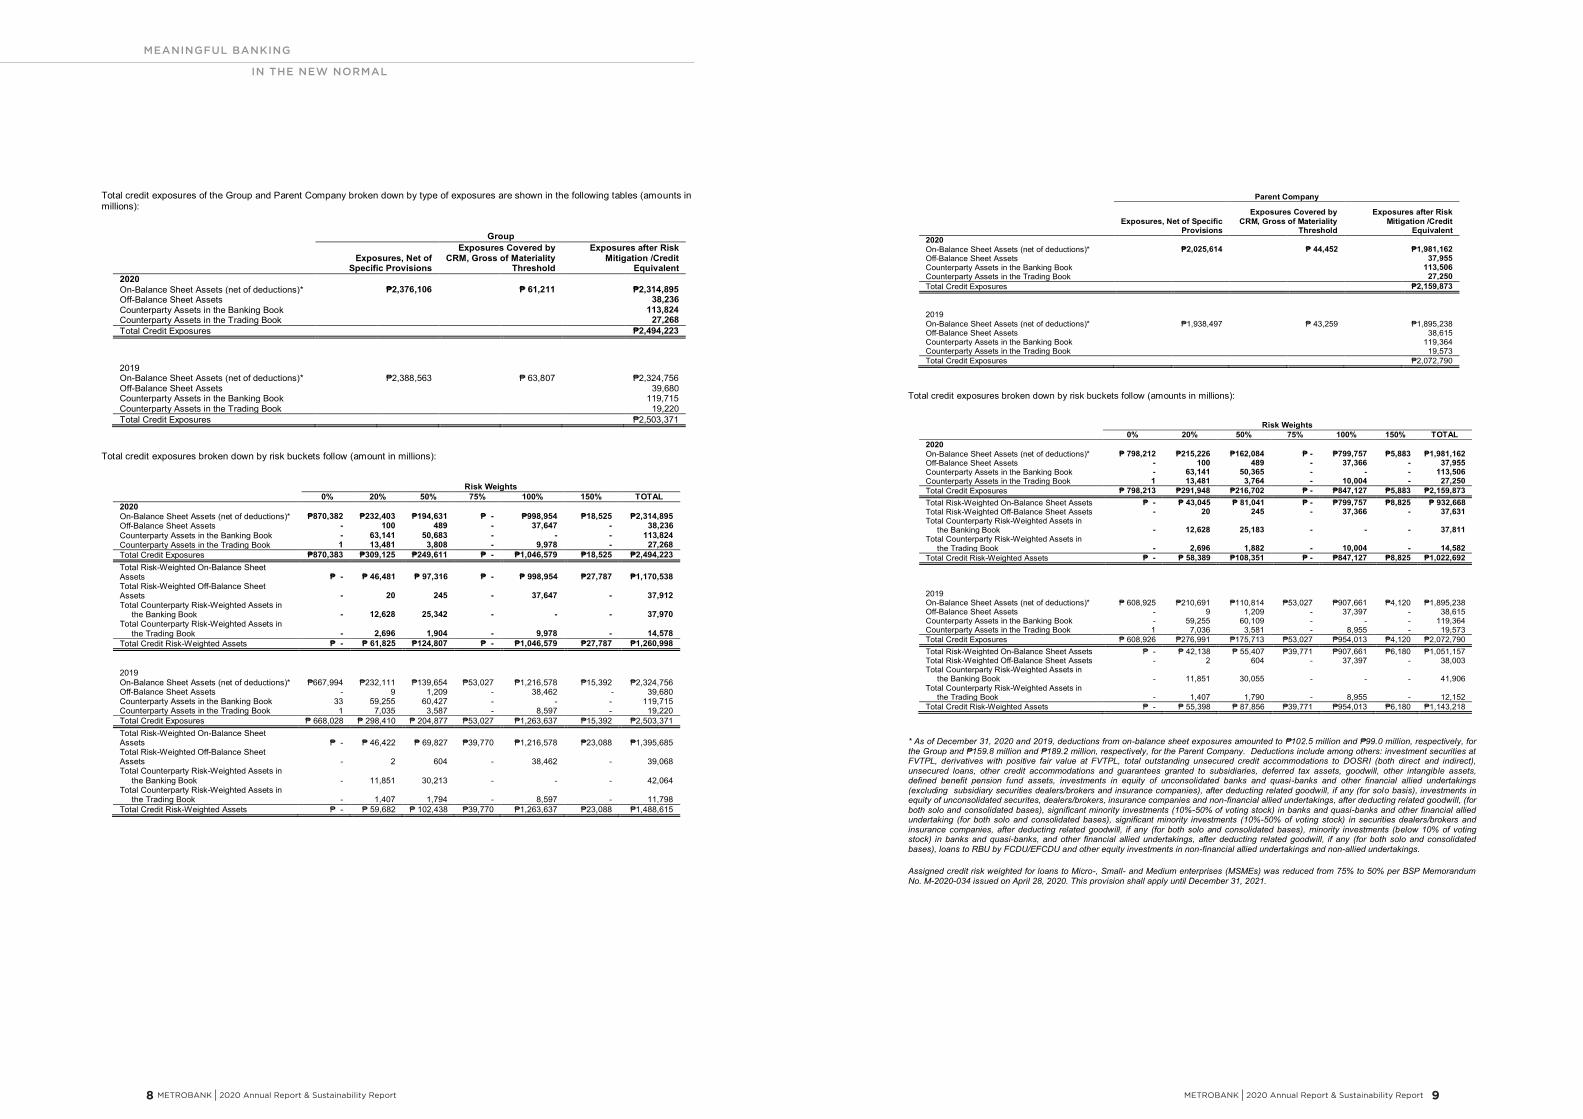
Total credit exposures of the Group and Parent Company broken down by type of exposures are shown in the following tables (amounts in millions):
Group
Exposures, Net of Specific Provisions
Exposures Covered by CRM, Gross of Materiality
Threshold
Exposures after Risk Mitigation /Credit
Equivalent 2020
On-Balance Sheet Assets (net of deductions)*
₱2,376,106
₱ 61,211
₱2,314,895 Off-Balance Sheet Assets
38,236
Counterparty Assets in the Banking Book
113,824 Counterparty Assets in the Trading Book
27,268
Total Credit Exposures ₱2,494,223
2019 On-Balance Sheet Assets (net of deductions)*
₱2,388,563
₱ 63,807
₱2,324,756 Off-Balance Sheet Assets
39,680
Counterparty Assets in the Banking Book
119,715 Counterparty Assets in the Trading Book
19,220
Total Credit Exposures ₱2,503,371
Total credit exposures broken down by risk buckets follow (amount in millions):
Risk Weights
0% 20% 50% 75% 100% 150% TOTAL 2020 On-Balance Sheet Assets (net of deductions)* ₱870,382 ₱232,403 ₱194,631 ₱ - ₱998,954 ₱18,525 ₱2,314,895 Off-Balance Sheet Assets - 100 489 - 37,647 - 38,236 Counterparty Assets in the Banking Book - 63,141 50,683 - - - 113,824 Counterparty Assets in the Trading Book 1 13,481 3,808 - 9,978 - 27,268 Total Credit Exposures ₱870,383 ₱309,125 ₱249,611 ₱ - ₱1,046,579 ₱18,525 ₱2,494,223 Total Risk-Weighted On-Balance Sheet Assets ₱ - ₱ 46,481 ₱ 97,316 ₱ - ₱ 998,954 ₱27,787 ₱1,170,538 Total Risk-Weighted Off-Balance Sheet Assets - 20 245 - 37,647 - 37,912 Total Counterparty Risk-Weighted Assets in the Banking Book
-
12,628
25,342
- -
-
37,970
Total Counterparty Risk-Weighted Assets in the Trading Book
-
2,696
1,904
-
9,978
-
14,578
Total Credit Risk-Weighted Assets ₱ - ₱ 61,825 ₱124,807 ₱ - ₱1,046,579 ₱27,787 ₱1,260,998
2019 On-Balance Sheet Assets (net of deductions)* ₱667,994 ₱232,111 ₱139,654 ₱53,027 ₱1,216,578 ₱15,392 ₱2,324,756
Off-Balance Sheet Assets - 9 1,209 - 38,462 - 39,680 Counterparty Assets in the Banking Book 33 59,255 60,427 - - - 119,715 Counterparty Assets in the Trading Book 1 7,035 3,587 - 8,597 - 19,220 Total Credit Exposures ₱ 668,028 ₱ 298,410 ₱ 204,877 ₱53,027 ₱1,263,637 ₱15,392 ₱2,503,371 Total Risk-Weighted On-Balance Sheet Assets ₱ - ₱ 46,422 ₱ 69,827 ₱39,770 ₱1,216,578 ₱23,088 ₱1,395,685 Total Risk-Weighted Off-Balance Sheet Assets - 2 604 - 38,462 - 39,068 Total Counterparty Risk-Weighted Assets in the Banking Book - 11,851 30,213 - - - 42,064 Total Counterparty Risk-Weighted Assets in the Trading Book - 1,407 1,794 - 8,597 - 11,798 Total Credit Risk-Weighted Assets ₱ - ₱ 59,682 ₱ 102,438 ₱39,770 ₱1,263,637 ₱23,088 ₱1,488,615
Parent Company
Exposures, Net of Specific Provisions
Exposures Covered by CRM, Gross of Materiality
Threshold
Exposures after Risk Mitigation /Credit
Equivalent 2020
On-Balance Sheet Assets (net of deductions)*
₱2,025,614
₱ 44,452
₱1,981,162 Off-Balance Sheet Assets
37,955
Counterparty Assets in the Banking Book
113,506 Counterparty Assets in the Trading Book
27,250
Total Credit Exposures ₱2,159,873
2019 On-Balance Sheet Assets (net of deductions)*
₱1,938,497
₱ 43,259
₱1,895,238 Off-Balance Sheet Assets
38,615
Counterparty Assets in the Banking Book
119,364 Counterparty Assets in the Trading Book
19,573
Total Credit Exposures ₱2,072,790
Total credit exposures broken down by risk buckets follow (amounts in millions):
Risk Weights
0% 20% 50% 75% 100% 150% TOTAL 2020
On-Balance Sheet Assets (net of deductions)* ₱ 798,212 ₱215,226 ₱162,084 ₱ - ₱799,757 ₱5,883 ₱1,981,162 Off-Balance Sheet Assets - 100 489 - 37,366 - 37,955 Counterparty Assets in the Banking Book - 63,141 50,365 - - - 113,506 Counterparty Assets in the Trading Book 1 13,481 3,764 - 10,004 - 27,250 Total Credit Exposures ₱ 798,213 ₱291,948 ₱216,702 ₱ - ₱847,127 ₱5,883 ₱2,159,873 Total Risk-Weighted On-Balance Sheet Assets ₱ - ₱ 43,045 ₱ 81,041 ₱ - ₱799,757 ₱8,825 ₱ 932,668 Total Risk-Weighted Off-Balance Sheet Assets - 20 245 - 37,366 - 37,631 Total Counterparty Risk-Weighted Assets in the Banking Book
-
12,628
25,183
-
-
-
37,811
Total Counterparty Risk-Weighted Assets in the Trading Book
-
2,696
1,882
-
10,004
-
14,582
Total Credit Risk-Weighted Assets ₱ - ₱ 58,389 ₱108,351 ₱ - ₱847,127 ₱8,825 ₱1,022,692
2019
On-Balance Sheet Assets (net of deductions)* ₱ 608,925 ₱210,691 ₱110,814 ₱53,027 ₱907,661 ₱4,120 ₱1,895,238 Off-Balance Sheet Assets - 9 1,209 - 37,397 - 38,615 Counterparty Assets in the Banking Book - 59,255 60,109 - - - 119,364 Counterparty Assets in the Trading Book 1 7,036 3,581 - 8,955 - 19,573 Total Credit Exposures ₱ 608,926 ₱276,991 ₱175,713 ₱53,027 ₱954,013 ₱4,120 ₱2,072,790 Total Risk-Weighted On-Balance Sheet Assets ₱ - ₱ 42,138 ₱ 55,407 ₱39,771 ₱907,661 ₱6,180 ₱1,051,157 Total Risk-Weighted Off-Balance Sheet Assets - 2 604 - 37,397 - 38,003 Total Counterparty Risk-Weighted Assets in the Banking Book
-
11,851
30,055
-
-
-
41,906
Total Counterparty Risk-Weighted Assets in the Trading Book
-
1,407
1,790
-
8,955
-
12,152
Total Credit Risk-Weighted Assets ₱ - ₱ 55,398 ₱ 87,856 ₱39,771 ₱954,013 ₱6,180 ₱1,143,218
* As of December 31, 2020 and 2019, deductions from on-balance sheet exposures amounted to ₱102.5 million and ₱99.0 million, respectively, for the Group and ₱159.8 million and ₱189.2 million, respectively, for the Parent Company. Deductions include among others: investment securities at FVTPL, derivatives with positive fair value at FVTPL, total outstanding unsecured credit accommodations to DOSRI (both direct and indirect), unsecured loans, other credit accommodations and guarantees granted to subsidiaries, deferred tax assets, goodwill, other intangible assets, defined benefit pension fund assets, investments in equity of unconsolidated banks and quasi-banks and other financial allied undertakings (excluding subsidiary securities dealers/brokers and insurance companies), after deducting related goodwill, if any (for solo basis), investments in equity of unconsolidated securites, dealers/brokers, insurance companies and non-financial allied undertakings, after deducting related goodwill, (for both solo and consolidated bases), significant minority investments (10%-50% of voting stock) in banks and quasi-banks and other financial allied undertaking (for both solo and consolidated bases), significant minority investments (10%-50% of voting stock) in securities dealers/brokers and insurance companies, after deducting related goodwill, if any (for both solo and consolidated bases), minority investments (below 10% of voting stock) in banks and quasi-banks, and other financial allied undertakings, after deducting related goodwill, if any (for both solo and consolidated bases), loans to RBU by FCDU/EFCDU and other equity investments in non-financial allied undertakings and non-allied undertakings.
Assigned credit risk weighted for loans to Micro-, Small- and Medium enterprises (MSMEs) was reduced from 75% to 50% per BSP Memorandum No. M-2020-034 issued on April 28, 2020. This provision shall apply until December 31, 2021.
MEANINGFUL BANKING
IN THE NEW NORMAL
METROBANK I 2020 Annual Report & Sustainability Report 11 10 METROBANK I 2020 Annual Report & Sustainability Report
The impact of reasonably possible changes in the interest rates on net interest income follows (amounts in millions):
Sensitivity of Net Interest Income
Group Parent Company
Movement in basis December 31 Currency points 2020 2019 2020 2019
PHP +10 ₱ 384.95 ₱ 701.14 ₱ 383.69 ₱ 626.47 USD +10 (28.66). (7.65). (19.15) (16.68) Others +10 18.08 25.95 18.08 25.95
PHP -10 (384.95). (701.14). (383.69). (626.47) USD -10 28.66 7.65 19.15 16.68 Others -10 (18.08). (25.95). (18.08). (25.95)
The Basel III Leverage ratios of the Group and the Parent Company as reported to the BSP as of December 31, 2020 and 2019 are shown in the table below:
Group Parent Company
December 31
2020 2019 2020 2019
(In Millions)
Exposure Measures On-balance sheet items ₱ 2,440,134 ₱ 2,440,430 ₱ 2,157,810 ₱ 2,082,311
Less deductions from Basel III Tier 1 Capital 33,250 33,812 91,562 127,872 Total On-balance sheet exposures 2,406,884 2,406,618 2,066,248 1,954,439 Replacement Cost associated with all derivatives transactions 11,846 8,490 11,829 8,488 Add-on amounts for potential future exposure associated with all derivative transactions 12,430 12,147 12,091 12,150 Adjusted effective notional amount of written credit derivatives - - - - Adjusted effective notional offsets of written credit derivatives and deducted add-on amounts - - - - Total Derivative exposures 24,276 20,637 23,920 20,638 Gross Securities Financing Transactions (SFT) assets (with no recognition of netting) 26,653 38,668 15,819 36,921 Counterparty Credit Risk exposures for SFT assets - - - - Agent transaction exposures - - - - Total SFT exposures 26,653 38,668 15,819 36,921 Off-balance sheet exposures 62,649 66,710 61,220 43,500 Adjustments for conversion to credit equivalent amounts - - - - Total Off-balance sheet exposures 62,649 66,710 61,220 43,500
Total Exposure Measures ₱ 2,520,462 ₱ 2,532,633 ₱ 2,167,207 ₱ 2,055,498
Tier 1 Capital ₱ 287,708 ₱ 276,288 ₱ 220,632 ₱ 183,099
Basel III Leverage Ratio * 11.41% 10.91% 10.18% 8.91%
* Basel III leverage ratio is computed by dividing Tier 1 capital over total exposure measures .
The Basel III Leverage ratio is designed to act as a supplementary measure to the risk-based capital requirements and shall not be less than 5.00%. It is defined as the capital measure divided by the exposure measure. Capital measure for the leverage ratio is Tier 1 capital (net of regulatory deductions). Exposure measure is the sum of on-balance sheet exposures, derivative exposures, Security Financing Transactions (SFT) exposures and off-balance sheet items. Items that are deducted completely from capital (regulatory deductions) do not contribute to leverage, hence, deducted from the exposure measure.
SFTs are transactions such as repurchase agreements, reverse repurchase agreements, security lending and borrowing and margin lending transactions, where the value of the transactions depends on market valuation and the transactions are often subject to margin agreements. As of December 31, 2020 and 2019, SFT assets are mainly repurchase agreements amounting to ₱26.7 billion and ₱38.7 billion, respectively, for the Group and ₱15.8 billion and ₱36.9 billion, respectively, for the Parent Company.
Total derivative exposures of the Group and the Parent Company as of December 31, 2020 and 2019 follow:
Group Parent Company
Notional Amount
Replacement Cost
Potential Future
Exposures
Total Derivative Exposures
1 Notional Amount
Replacement Cost
Potential Future
Exposures
Total Derivative Exposures
1
( In Millions) December 31, 2020
Interest Rate Contracts ₱150,104 ₱ 1,041 ₱ 707 ₱ 1,748 ₱146,222 ₱ 1,038 ₱ 707 ₱ 1,745 Exchange Rate Contracts 483,156 10,805 11,721 22,526 474,644 10,791 11,382 22,173 Equity Contracts - - - - - - - - Credit Derivatives 26 - 1 1 26 - 1 1 Total ₱ 633,286 ₱ 11,846 ₱ 12,430 ₱ 24,276 ₱ 620,892 ₱ 11,829 ₱ 12,091 ₱ 23,920
December 31, 2019 Interest Rate Contracts ₱ 130,160 ₱ 711 ₱ 737 ₱ 1,448 ₱ 130,160 ₱ 711 ₱ 737 ₱ 1,448
Exchange Rate Contracts 523,616 7,779 11,409 19,188 520,910 7,777 11,412 19,189
Equity Contracts - - - -
- - - - Credit Derivatives 28 - 1 1 28 - 1 1 Total ₱ 653,804 ₱ 8,490 ₱ 12,147 ₱ 20,637 ₱ 651,098 ₱ 8,488 ₱ 12,150 ₱ 20,638
1 Total derivative exposure is the sum of replacement cost and potential future exposures. The exposure measure for derivative contracts consist of an exposure arising from the underlying of the derivative contract and a counterparty credit risk exposure. The replacement cost represents the positive mark-to-market value of the contract (or zero if the mark-to-market value is zero or negative).
The potential future exposures of the Group and the Parent Company as of December 31, 2020 and 2019 follow (amounts in millions except credit conversion factor):
Group December 31 2020 2019
Notional Amount
Potential Future CCF
Potential Future
Exposures Notional Amount
Potential Future CCF
Potential Future
Exposures Interest Rate Contracts
With residual maturity of 1 year or less ₱ 24,308 0.0% ₱ - ₱ 24,628 0.0% ₱ - With residual maturity of more than 1 year to 5 years 117,963 0.5% 590 84,637 0.5% 423 With residual maturity of more than 5 years 7,833 1.5% 117 20,895 1.5% 314
150,104
707 130,160
737
Exchange Rate Contracts With original maturity of 14 calendar days or less 111,227 1.0% 1,112 77,946 1.0% 779
With residual maturity of 1 year or less 207,449 1.0% 2,074 303,903 1.0% 3,039 With residual maturity of more than 1 year to 5 years 152,060 5.0% 7,604 121,681 5.0% 6,085 With residual maturity of more than 5 years 12,420 7.5% 932 20,086 7.5% 1,506
483,156
11,721 523,616
11,409
Equity Contracts -
- -
- Credit Derivatives
With reference obligation that has an external credit of at least BBB- or its equivalent - Bank as
beneficiary 26 5.0% 1 28 5.0% 1
Total ₱ 633,286
₱ 12,430 ₱ 653,804
₱ 12,147
MEANINGFUL BANKING
IN THE NEW NORMAL
METROBANK I 2020 Annual Report & Sustainability Report 13 12 METROBANK I 2020 Annual Report & Sustainability Report
Parent Company December 31 2020 2019
Notional Amount
Potential Future CCF
Potential Future
Exposures Notional Amount
Potential Future CCF
Potential Future
Exposures Interest Rate Contracts
With residual maturity of 1 year or less ₱ 20,426 0.0% ₱ - ₱ 24,628 0.0% ₱ - With residual maturity of more than 1 year to 5 years 117,963 0.5% 590 84,637 0.5% 423 With residual maturity of more than 5 years 7,833 1.5% 117 20,895 1.5% 314
146,222
707 130,160
737
Exchange Rate Contracts With original maturity of 14 calendar days or less 109,211 1.0% 1,092 77,925 1.0% 779
With residual maturity of 1 year or less 207,306 1.0% 2,073 300,473 1.0% 3,005 With residual maturity of more than 1 year to 5 years 145,707 5.0% 7,286 122,425 5.0% 6,121 With residual maturity of more than 5 years 12,420 7.5% 932 20,087 7.5% 1,507
474,644
11,382 520,910
11,412
Equity Contracts -
-
-
-
Credit Derivatives With reference obligation that has an external credit
of at least BBB- or its equivalent - Bank as beneficiary
26 5.0%
1
28 5.0%
1
Total ₱620,892
₱ 12,091 ₱651,098
₱ 12,150
The potential future exposures represents an add-on arising from the potential exposure over the remaining life of the contract calculated by multiplying the notional principal amount of the contract to the potential future credit conversion factor (CCF). Add-on factors shall apply to financial derivatives, based on residual maturity.
Total off-balance sheet exposures of the Group and the Parent Company as of December 31, 2020 and 2019 follow:
Group Parent Company
December 31
2020 2019 2020 2019
Notional Amount
Total OBS
Exposure Notional Amount
Total OBS
Exposure Notional Amount
Total OBS
Exposure Notional Amount
Total OBS
Exposure Off-balance sheet (OBS) (In Millions) exposure with CCF of: 10% ₱244,117 ₱ 24,412 ₱270,302 ₱ 27,030 ₱232,641 ₱ 23,264 ₱ 48,850 ₱ 4,885 20% 24,676 4,935 26,519 5,304 23,324 4,665 23,410 4,682 50% 41,770 20,885 47,848 23,924 41,748 20,874 47,783 23,891 100% 12,417 12,417 10,452 10,452 12,417 12,417 10,042 10,042 Total ₱322,980 ₱ 62,649 ₱355,121 ₱ 66,710 ₱310,130 ₱ 61,220 ₱130,085 ₱ 43,500
The leverage ratio exposure measure for off-balance sheet items is calculated by multiplying its notional amount by a credit conversion factor (CCF) per type of OBS items. The 10% CCF shall apply to commitments that are unconditionally cancellable without prior notice (i.e. credit card lines), undrawn eligible cash servicer facilities that are unconditionally cancellable without prior notice and other contingent accounts not involving credit risk (spot exchange contracts - bought and sold, late deposits/payments received, inward/outward bills for collection, travelers' check unsold, deficiency claims receivable and others). 20% CCF shall apply to short-term self-liquidating trade letters of credit arising from movements of goods, e.g. documentary credits collateralized by the underlying shipments, such as trade related guarantees, letters of credit (LCs) - (sight/usance and deferred LCs - net of margin deposits) and revolving LCs (net of margin deposits) arising from movements of goods and/or services. 50% CCF shall apply to OBS securitization exposures that qualify as eligible liquidity facilities and certain transaction-related contingent items, e.g. performance bonds, bid bonds, warranties and performance standby letters of credit (net of margin deposits), established as a guarantee that a business transaction will be performed, note issuance facilities and revolving underwriting facilities and commitments with an original maturity over one year and underwritten accounts unsold. 100% CCF shall apply to OBS securitization exposures except an eligible liquidity facility or an eligible servicer cash advance facility, direct credit substitutes, e.g. general guarantees of indebtedness (including standby LCs serving as financial guarantees for loans and securities) and acceptances.
Comparison of accounting assets vs. leverage ratio exposure measure of the Group and the Parent Company as of December 31, 2020 and 2019 follow:
Group Parent Company
December 31
2020 2019 2020 2019
(In Millions)
Total consolidated assets per published financial statements ₱ 2,461,919 ₱ 2,471,446 ₱ 2,172,125 ₱ 2,116,897 Adjustments for derivative financial instruments 12,430 12,147 12,091 12,150 Adjustments for securities financial transactions - - - - Adjustments for off-balance sheet items 62,649 66,710 61,220 43,500 Other adjustments (16,536). (17,670) (78,229). (117,049) Leverage Ratio Exposure Measure ₱ 2,520,462 ₱ 2,532,633 ₱ 2,167,207 ₱ 2,055,498
MEANINGFUL BANKING
IN THE NEW NORMAL
METROBANK I 2020 Annual Report & Sustainability Report 15 14 METROBANK I 2020 Annual Report & Sustainability Report
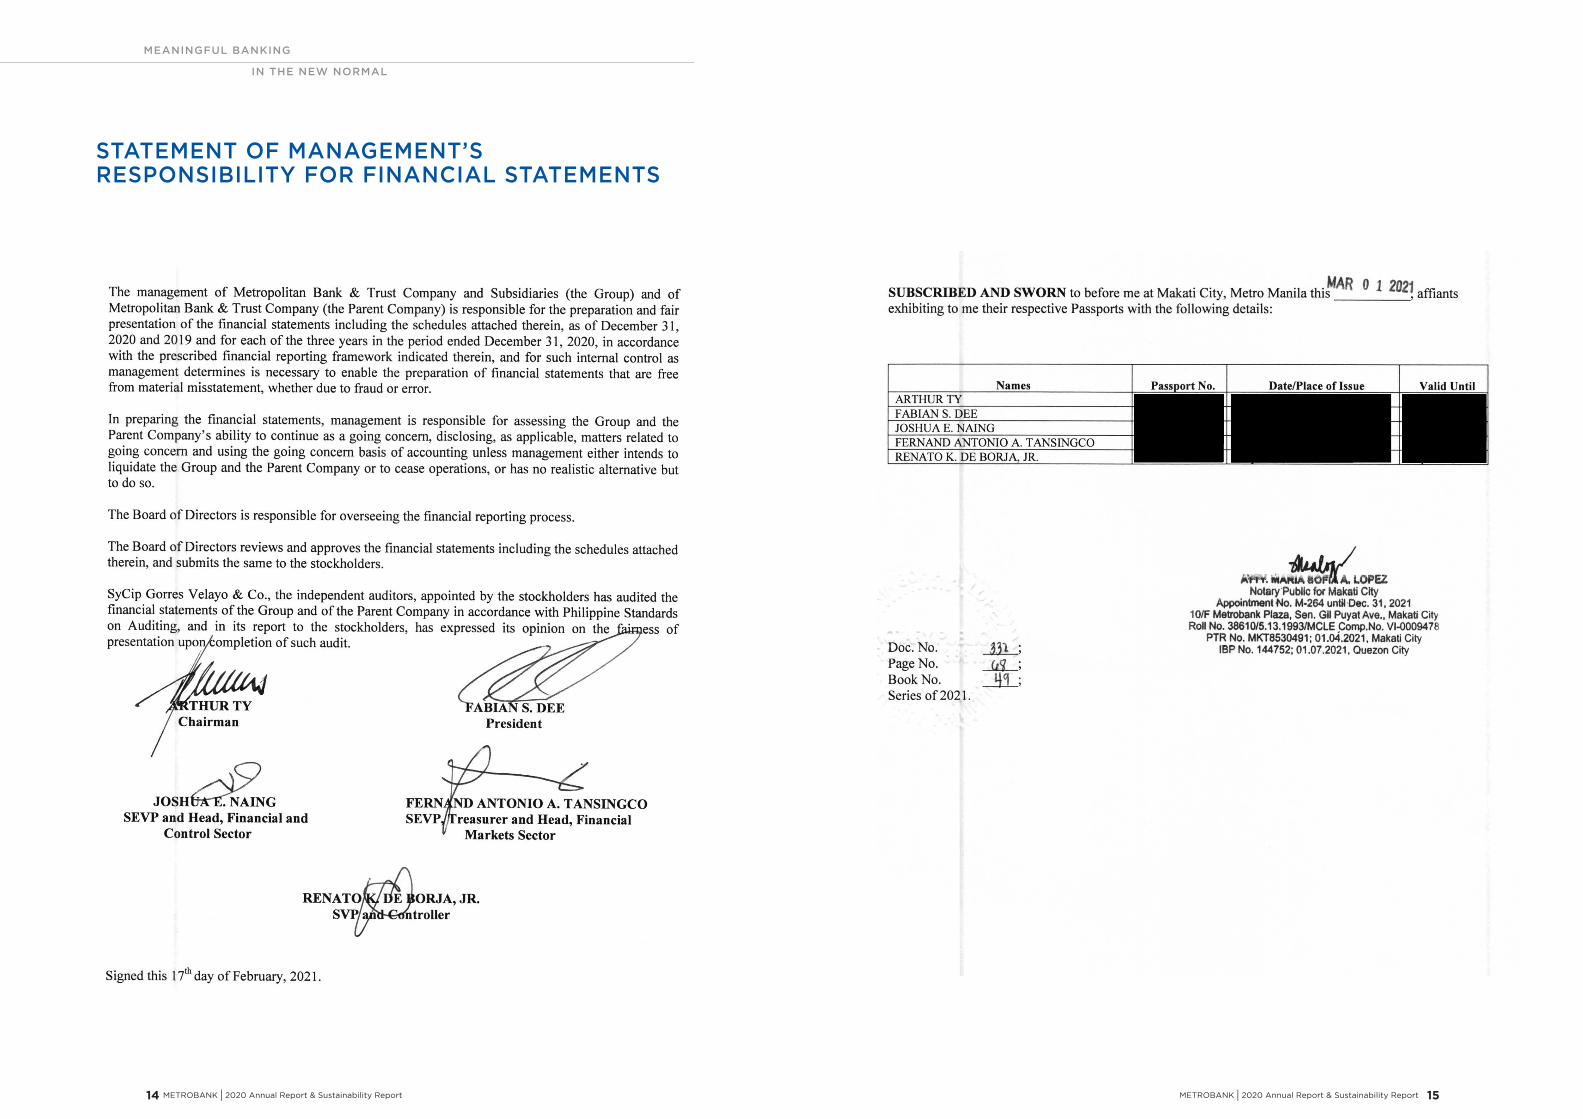
STATEMENT OF MANAGEMENT’S RESPONSIBILITY FOR FINANCIAL STATEMENTS
MEANINGFUL BANKING
IN THE NEW NORMAL
METROBANK I 2020 Annual Report & Sustainability Report 17 16 METROBANK I 2020 Annual Report & Sustainability Report
*SGVFSM005911*
INDEPENDENT AUDITOR’S REPORT
The Board of Directors and StockholdersMetropolitan Bank & Trust CompanyMetrobank Plaza, Sen. Gil Puyat AvenueUrdaneta Village, Makati CityMetro Manila, Philippines
Report on the Consolidated and Parent Company Financial Statements
Opinion
We have audited the consolidated financial statements of Metropolitan Bank & Trust Company and itssubsidiaries (the Group) and the parent company financial statements of Metropolitan Bank & TrustCompany (the Parent Company), which comprise the consolidated and parent company statements offinancial position as at December 31, 2020 and 2019, and the consolidated and parent companystatements of income, consolidated and parent company statements of comprehensive income,consolidated and parent company statements of changes in equity and consolidated and parent companystatements of cash flows for each of the three years in the period ended December 31, 2020, and notes tothe consolidated and parent company financial statements, including a summary of significant accountingpolicies.
In our opinion, the accompanying consolidated and parent company financial statements present fairly, inall material respects, the financial position of the Group and the Parent Company as at December 31,2020 and 2019, and their financial performance and their cash flows for each of the three years in theperiod ended December 31, 2020, in accordance with Philippine Financial Reporting Standards (PFRS).
Basis for Opinion
We conducted our audits in accordance with Philippine Standards on Auditing (PSAs). Ourresponsibilities under those standards are further described in the Auditor’s Responsibilities for the Auditof the Consolidated and Parent Company Financial Statements section of our report. We are independentof the Group and the Parent Company in accordance with the Code of Ethics for ProfessionalAccountants in the Philippines (Code of Ethics) together with the ethical requirements that are relevant toour audit of the consolidated and parent company financial statements in the Philippines, and we havefulfilled our other ethical responsibilities in accordance with these requirements and the Code of Ethics.We believe that the audit evidence we have obtained is sufficient and appropriate to provide a basis forour opinion.
SyCip Gorres Velayo & Co.6760 Ayala Avenue1226 Makati CityPhilippines
Tel: (632) 8891 0307Fax: (632) 8819 0872ey.com/ph
BOA/PRC Reg. No. 0001, October 4, 2018, valid until August 24, 2021SEC Accreditation No. 0012-FR-5 (Group A),
November 6, 2018, valid until November 5, 2021
A member firm of Ernst & Young Global Limited
INDEPENDENT AUDITOR’S REPORT
*SGVFSM005911*
- 2 -
Key Audit Matters
Key audit matters are those matters that, in our professional judgment, were of most significance in ouraudit of the consolidated and parent company financial statements of the current period. These matterswere addressed in the context of our audit of the consolidated and parent company financial statements asa whole, and in forming our opinion thereon, and we do not provide a separate opinion on these matters.For each matter below, our description of how our audit addressed the matter is provided in that context.
We have fulfilled the responsibilities described in the Auditor’s Responsibilities for the Audit of theConsolidated and Parent Company Financial Statements section of our report, including in relation tothese matters. Accordingly, our audit included the performance of procedures designed to respond to ourassessment of the risks of material misstatement of the consolidated and parent company financialstatements. The results of our audit procedures, including the procedures performed to address thematters below, provide the basis for our audit opinion on the accompanying consolidated and parentcompany financial statements.
Applicable to the audit of the consolidated and parent company financial statements
Allowance for Credit LossesThe Group’s and the Parent Company’s application of the expected credit loss (ECL) model in calculatingthe allowance for credit losses on loans and receivables is significant to our audit as it involves theexercise of significant management judgment. Key areas of judgment include: segmenting the Group’sand the Parent Company’s credit risk exposures; determining the method to estimate ECL; definingdefault; identifying exposures with significant deterioration in credit quality, taking into accountextension of payment terms and payment holidays provided as a result of the coronavirus pandemic;determining assumptions to be used in the ECL model such as the counterparty credit risk rating, theexpected life of the financial asset, expected recoveries from defaulted accounts, and impact of anyfinancial support and credit enhancements extended by any party; and incorporating forward-lookinginformation, including the impact of the coronavirus pandemic, in calculating ECL.
Allowance for credit losses as of December 31, 2020 for the Group and the Parent Company amounted toP=55.2 billion and P=44.4 billion, respectively. Provision for credit losses of the Group and the ParentCompany in 2020 amounted to P=40.8 billion and P=32.7 billion, respectively.
Refer to Notes 2, 3 and 15 of the financial statements for the disclosure on the details of the allowance forcredit losses using the ECL model.
Audit responseWe obtained an understanding of the board approved methodologies and models used for the Group’s andthe Parent Company’s different credit exposures and assessed whether these considered the requirementsof PFRS 9, Financial Instruments to reflect an unbiased and probability-weighted outcome, and toconsider time value of money and the best available forward-looking information.
A member firm of Ernst & Young Global Limited
MEANINGFUL BANKING
IN THE NEW NORMAL
METROBANK I 2020 Annual Report & Sustainability Report 19 18 METROBANK I 2020 Annual Report & Sustainability Report
*SGVFSM005911*
- 3 -
We (a) assessed the Group’s and the Parent Company’s segmentation of its credit risk exposures based onhomogeneity of credit risk characteristics; (b) tested the definition of default and significant increase incredit risk criteria against historical analysis of accounts, credit risk management policies and practices inplace, and management’s assessment of the impact of the coronavirus pandemic on the counterparties;(c) tested the Group’s and the Parent Company’s application of internal credit risk rating system,including the impact of the coronavirus pandemic on the borrowers, by reviewing the ratings of samplecredit exposures; (d) assessed whether expected life is different from the contractual life by testing thematurity dates reflected in the Group’s and the Parent Company’s records and considering management’sassumptions regarding future collections, advances, extensions, renewals and modifications; (e) testedloss given default by inspecting historical recoveries and related costs, write-offs and collateralvaluations, and the effects of any financial support and credit enhancements provided by any party;(f) tested exposure at default considering outstanding commitments and repayment scheme; (g) checkedthe forward-looking information used for overlay through statistical test and corroboration using publiclyavailable information and our understanding of the Group’s and the Parent Company’s lending portfoliosand broader industry knowledge, including the impact of the coronavirus pandemic; and (h) tested theeffective interest rate used in discounting the expected loss.
Further, we checked the data used in the ECL models by reconciling data from source system reports tothe data warehouse and from the data warehouse to the loss allowance analysis/models and financialreporting systems. To the extent that the loss allowance analysis is based on credit exposures that havebeen disaggregated into subsets of debt financial assets with similar risk characteristics, we traced orre-performed the disaggregation from source systems to the loss allowance analysis. We also assessedthe assumptions used where there are missing or insufficient data.
We recalculated impairment provisions on a sample basis. We involved our internal specialists in theperformance of the above procedures. We reviewed the completeness of the disclosures made in thefinancial statements.
Accounting for Disposals of Investment Securities under a Hold-to-collect Business ModelIn 2020, the Group and the Parent Company disposed investment securities managed under thehold-to-collect (HTC) business model with aggregate carrying amount of P=113.4 billion andP=93.9 billion, respectively. The disposals resulted in a gain of P=8.2 billion for the Group and P=6.9 billionfor the Parent Company. Investment securities held under an HTC business model, which are classifiedas ‘Investment securities at amortized cost’, are managed to realize cash flows by collecting contractualpayments over the life of the instrument.
The accounting for the disposals is significant to our audit because the amounts involved are material(45.1% and 43.3% of the total investment securities at amortized cost of the Group and the ParentCompany, respectively, and 5.7% and 6.1% of the total operating income of the Group and ParentCompany, respectively). Moreover, it involves the exercise of significant judgment by management inassessing whether the disposals are consistent with the HTC business model or that they resulted from achange in business model. A change in business model would impact the measurement of the remainingsecurities in the affected portfolios. Under PFRS 9, a change in business model is expected to be veryinfrequent as it must be significant to the Group’s and the Parent Company’s operations and demonstrableto external parties.
A member firm of Ernst & Young Global Limited
*SGVFSM005911*
- 4 -
Refer to Note 8 of the financial statements for the disclosure on the disposals of investment securities atamortized cost and change in business model.
Audit responseWe obtained an understanding of the Group’s and the Parent Company’s objectives for disposals ofinvestment securities at amortized cost through inquiries with management and review of approvedinternal documentations, including governance over the disposals. We evaluated management’sassessment of the impact of the disposals in reference to the Group’s and the Parent Company’s businessmodels and the provisions of the relevant accounting standards and regulatory issuances. For disposalsresulting from change in business model of the Parent Company, we reviewed the new business modeldocumentation to check whether the new policies and procedures for managing the investment securitiesreflect the change in the objective of the business model. We also reviewed the calculation of the gainson the disposals and the measurement of the remaining securities in the affected portfolios. We reviewedthe reclassification adjustment made by the Parent Company based on the requirements of PFRS 9.
We reviewed the disclosures related to the disposals and change in business model based on therequirements of PFRS 7, Financial Instruments: Disclosures, PFRS 9 and Philippine AccountingStandard (PAS 1), Presentation of Financial Statements.
Realizability of Deferred Tax AssetsAs of December 31, 2020, the deferred tax assets of the Group and the Parent Company amounted toP=14.0 billion and P=11.4 billion, respectively. The recognition of deferred tax assets is significant to ouraudit because it requires significant judgment and is based on assumptions such as availability of futuretaxable income and the timing of the reversal of the temporary differences that are affected by expectedfuture market or economic conditions and the expected performance of the Group and the ParentCompany. The estimation uncertainty on the Group’s and Parent Company’s expected performance hasincreased as a result of the uncertainties brought about by the coronavirus pandemic.
The disclosures in relation to deferred income taxes are included in Note 28 of the financial statements.
Audit ResponseWe involved our internal specialist in interpreting the tax regulations, testing the temporary differencesidentified by the Group and the Parent Company and the applicable tax rate. We also re-performed thecalculation of the deferred tax assets. We reviewed the management’s assessment on the availability offuture taxable income in reference to financial forecast and tax strategies. We evaluated management’sforecast by comparing the loan portfolio and deposit growth rates to the historical performance of theGroup and Parent Company and the industry, including future market circumstances and taking intoconsideration the impact associated with the coronavirus pandemic.
A member firm of Ernst & Young Global Limited
MEANINGFUL BANKING
IN THE NEW NORMAL
METROBANK I 2020 Annual Report & Sustainability Report 21 20 METROBANK I 2020 Annual Report & Sustainability Report
*SGVFSM005911*
- 5 -
Applicable to the audit of the consolidated financial statements
Recoverability of Investments in Associates and a Joint VentureThe Group assesses the impairment of its investments in associates and a joint venture whenever eventsor changes in circumstances indicate that the carrying amount of the investments may not be recoverable.As of December 31, 2020, the Group has an investment in associate amounting to P=1.9 billion whose fairvalue has declined significantly from acquisition cost. The Group performed impairment testing bycalculating both the fair value less costs to sell (FVLCTS) and value-in-use (VIU) to determine the higheramount that should be used as the recoverable amount. We considered the impairment testing of theGroup’s investment in this associate as a key audit matter as significant judgment and estimates areinvolved in the determination of the investment’s VIU.
The disclosures relating to investments in associates and a joint venture are included in Notes 3 and 11 tothe financial statements.
Audit responseWe discussed with management the investee’s current business performance and prospects and how thesewere reflected in the Group’s VIU calculation. We involved our internal specialist in evaluating themethodology and assumptions used. We compared the expected production volume and capitalexpenditures used in the calculation to the historical performance and plans of the investee, and the priceassumption, exchange rates and long-term growth rate to available industry, economic and financial dataincluding consensus market forecasts and the impact of the coronavirus pandemic. We also tested whetherthe discount rate used represents current market assessment of risks associated with the investment.
Recoverability of GoodwillAs of December 31, 2020, the Group has goodwill amounting to P=5.2 billion as a result of variousbusiness acquisitions. Under PFRS, the Group is required to annually test the amount of goodwill forimpairment. The Group performed the impairment testing using the cash generating unit’s (CGU)FVLCTS. The annual impairment test is significant to our audit because the determination of the CGU’sFVLCTS requires significant judgment and is based on assumptions which are subject to higher level ofestimation uncertainty due to the current economic conditions which have been impacted by thecoronavirus pandemic. The CGU’s assets include significant investments in unquoted equity shares andtheir fair values were determined using price-to-earnings (P/E) ratios of comparable companies andadjusted net asset valuation (NAV) method. Other assets of the CGU include investments in quotedequity shares and debt financial assets, and real properties, while liabilities include unquoted debtfinancial liabilities.
The disclosures relating to goodwill are included in Notes 3 and 11 to the financial statements.
A member firm of Ernst & Young Global Limited
*SGVFSM005911*
- 6 -
Audit responseWe involved our internal specialist in evaluating the assumptions and methodology used by the Group indetermining the FVLCTS of the CGU, in particular those relating to the use of P/E ratios of comparablecompanies and adjusted NAV method in the valuation of the unquoted equity shares. We tested the fairvalue of the other assets and liabilities by referring to the quoted prices of listed equity and debtinstruments, agreeing the appraised values of real estate properties to the appraisal reports, comparing thefuture cash flows of unquoted debt instruments to the related contracts, and comparing the discount ratesused against prevailing interest rates for similar instruments, taking into consideration the impactassociated with the coronavirus pandemic. We also re-performed the calculation of the FVLCTS.
Other Information
Management is responsible for the other information. The other information comprises the informationincluded in the SEC Form 20-IS (Definitive Information Statement), SEC Form 17-A and Annual Reportfor the year ended December 31, 2020, but does not include the consolidated and parent companyfinancial statements and our auditor’s report thereon. The SEC Form 20-IS (Definitive InformationStatement), SEC Form 17-A and Annual Report for the year ended December 31, 2020 are expected to bemade available to us after the date of this auditor’s report.
Our opinion on the consolidated and parent company financial statements does not cover the otherinformation and we will not express any form of assurance conclusion thereon.
In connection with our audits of the consolidated and parent company financial statements, ourresponsibility is to read the other information identified above when it becomes available and, in doingso, consider whether the other information is materially inconsistent with the consolidated and parentcompany financial statements or our knowledge obtained in the audits, or otherwise appears to bematerially misstated.
Responsibilities of Management and Those Charged with Governance for the Consolidated andParent Company Financial Statements
Management is responsible for the preparation and fair presentation of the consolidated and parentcompany financial statements in accordance with PFRS, and for such internal control as managementdetermines is necessary to enable the preparation of consolidated and parent company financialstatements that are free from material misstatement, whether due to fraud or error.
In preparing the consolidated and parent company financial statements, management is responsible forassessing the Group’s and the Parent Company’s ability to continue as a going concern, disclosing, asapplicable, matters related to going concern and using the going concern basis of accounting unlessmanagement either intends to liquidate the Group and the Parent Company or to cease operations, or hasno realistic alternative but to do so.
Those charged with governance are responsible for overseeing the Group’s and the Parent Company’sfinancial reporting process.
A member firm of Ernst & Young Global Limited

Notes:
METROBANK I 2020 Annual Report & Sustainability Report 23
MEANINGFUL BANKING
IN THE NEW NORMAL
22 METROBANK I 2020 Annual Report & Sustainability Report
*SGVFSM005911*
- 7 -
Auditor’s Responsibilities for the Audit of the Consolidated and Parent Company FinancialStatements
Our objectives are to obtain reasonable assurance about whether the consolidated and parent companyfinancial statements as a whole are free from material misstatement, whether due to fraud or error, and toissue an auditor’s report that includes our opinion. Reasonable assurance is a high level of assurance, butis not a guarantee that an audit conducted in accordance with PSAs will always detect a materialmisstatement when it exists. Misstatements can arise from fraud or error and are considered material if,individually or in the aggregate, they could reasonably be expected to influence the economic decisions ofusers taken on the basis of these consolidated and parent company financial statements.
As part of an audit in accordance with PSAs, we exercise professional judgment and maintainprofessional skepticism throughout the audit. We also:
Identify and assess the risks of material misstatement of the consolidated and parent companyfinancial statements, whether due to fraud or error, design and perform audit procedures responsive tothose risks, and obtain audit evidence that is sufficient and appropriate to provide a basis for ouropinion. The risk of not detecting a material misstatement resulting from fraud is higher than for oneresulting from error, as fraud may involve collusion, forgery, intentional omissions,misrepresentations, or the override of internal control.
Obtain an understanding of internal control relevant to the audit in order to design audit proceduresthat are appropriate in the circumstances, but not for the purpose of expressing an opinion on theeffectiveness of the Group’s and the Parent Company’s internal control.
Evaluate the appropriateness of accounting policies used and the reasonableness of accountingestimates and related disclosures made by management.
Conclude on the appropriateness of management’s use of the going concern basis of accounting and,based on the audit evidence obtained, whether a material uncertainty exists related to events orconditions that may cast significant doubt on the Group’s and the Parent Company’s ability tocontinue as a going concern. If we conclude that a material uncertainty exists, we are required todraw attention in our auditor’s report to the related disclosures in the consolidated and parentcompany financial statements or, if such disclosures are inadequate, to modify our opinion. Ourconclusions are based on the audit evidence obtained up to the date of our auditor’s report. However,future events or conditions may cause the Group and the Parent Company to cease to continue as agoing concern.
Evaluate the overall presentation, structure and content of the consolidated and parent companyfinancial statements, including the disclosures, and whether the consolidated and parent companyfinancial statements represent the underlying transactions and events in a manner that achieves fairpresentation.
Obtain sufficient appropriate audit evidence regarding the financial information of the entities orbusiness activities within the Group to express an opinion on the consolidated financial statements.We are responsible for the direction, supervision and performance of the audit. We remain solelyresponsible for our audit opinion.
A member firm of Ernst & Young Global Limited
*SGVFSM005911*
- 8 -
We communicate with those charged with governance regarding, among other matters, the planned scopeand timing of the audit and significant audit findings, including any significant deficiencies in internalcontrol that we identify during our audit.
We also provide those charged with governance with a statement that we have complied with relevantethical requirements regarding independence, and to communicate with them all relationships and othermatters that may reasonably be thought to bear on our independence, and where applicable, relatedsafeguards.
From the matters communicated with those charged with governance, we determine those matters thatwere of most significance in the audit of the consolidated and parent company financial statements of thecurrent period and are therefore the key audit matters. We describe these matters in our auditor’s reportunless law or regulation precludes public disclosure about the matter or when, in extremely rarecircumstances, we determine that a matter should not be communicated in our report because the adverseconsequences of doing so would reasonably be expected to outweigh the public interest benefits of suchcommunication.
Report on the Supplementary Information Required Under Bangko Sentral ng Pilipinas (BSP)Circular No. 1074 and Revenue Regulations No. 15-2010
Our audits were conducted for the purpose of forming an opinion on the basic financial statements takenas a whole. The supplementary information required under BSP Circular No. 1074 in Note 37 andRevenue Regulations No. 15-2010 in Note 38 to the financial statements is presented for purposes offiling with the BSP and Bureau of Internal Revenue, respectively, and is not a required part of the basicfinancial statements. Such information is the responsibility of the management of the Parent Company.The information has been subjected to the auditing procedures applied in our audit of the basic financialstatements. In our opinion, the information is fairly stated, in all material respects, in relation to the basicfinancial statements taken as a whole.
The engagement partner on the audit resulting in this independent auditor’s report isJosephine Adrienne A. Abarca.
SYCIP GORRES VELAYO & CO.
Josephine Adrienne A. AbarcaPartnerCPA Certificate No. 92126SEC Accreditation No. 0466-AR-4 (Group A), November 13, 2018, valid until November 12, 2021Tax Identification No. 163-257-145BIR Accreditation No. 08-001998-61-2018, February 26, 2018, valid until February 25, 2021PTR No. 8534208, January 4, 2021, Makati City
February 17, 2021
A member firm of Ernst & Young Global Limited
Notes:Notes:
MEANINGFUL BANKING
IN THE NEW NORMAL
METROBANK I 2020 Annual Report & Sustainability Report 25 24 METROBANK I 2020 Annual Report & Sustainability Report
*SGVFSM005911*
- 2 -
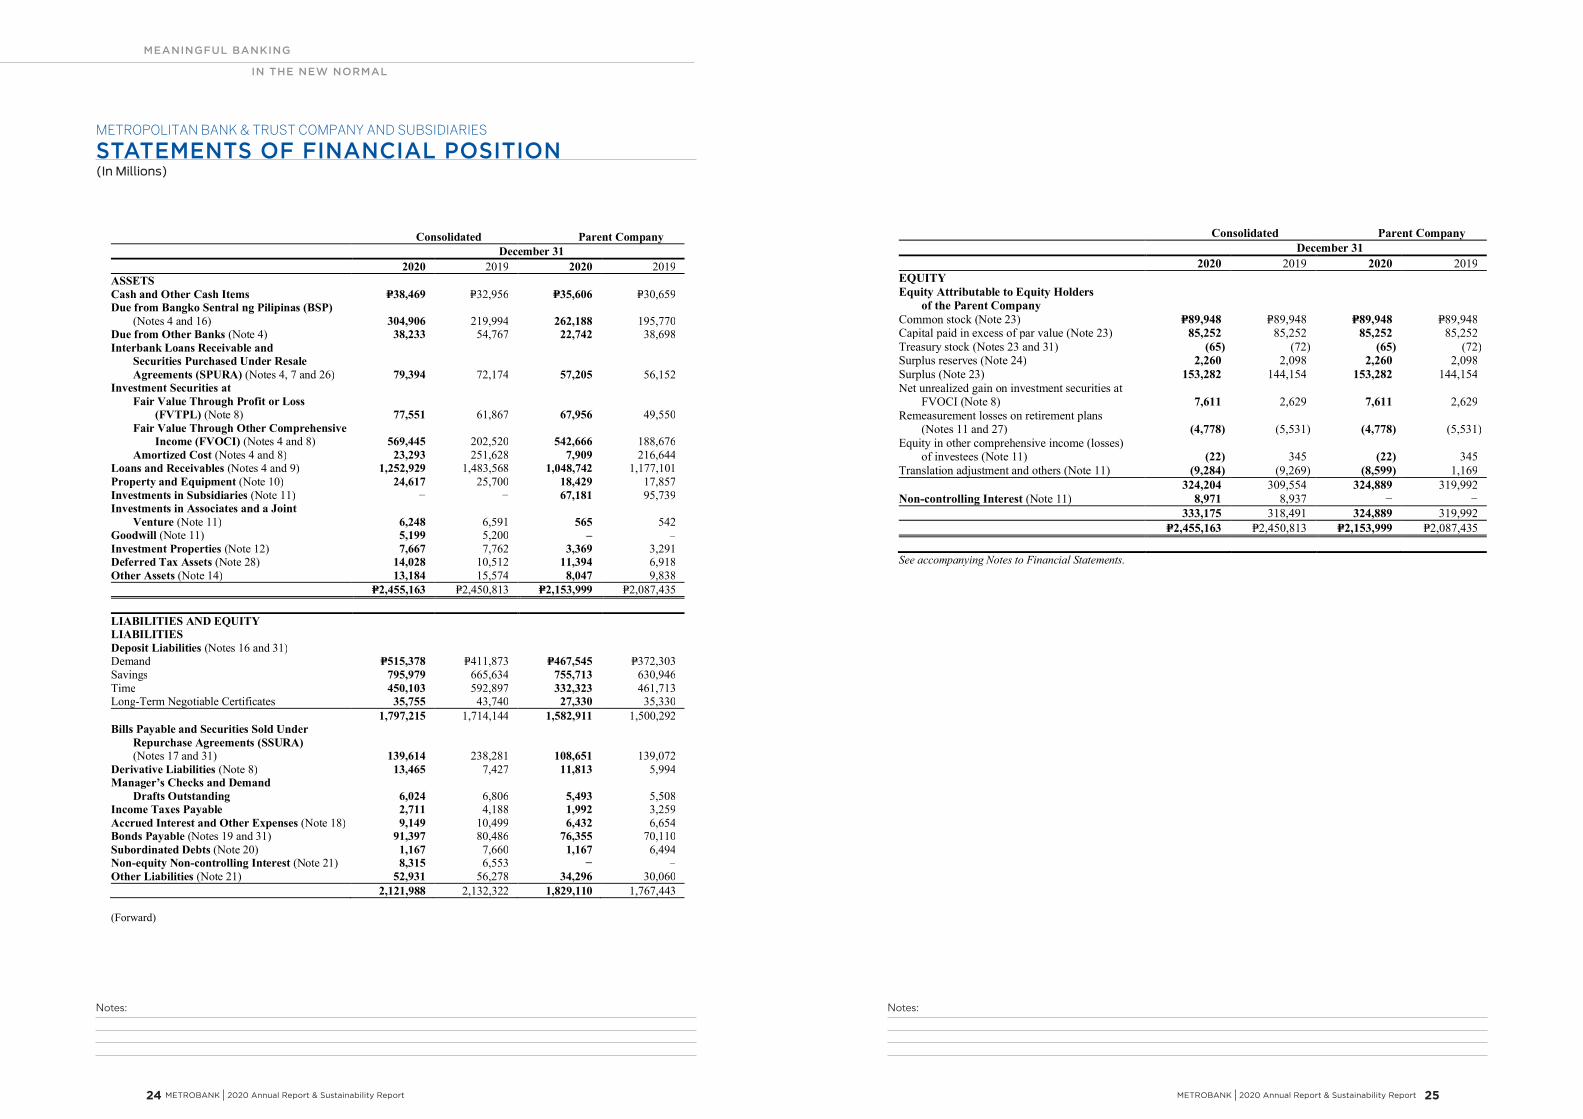
Consolidated Parent CompanyDecember 31
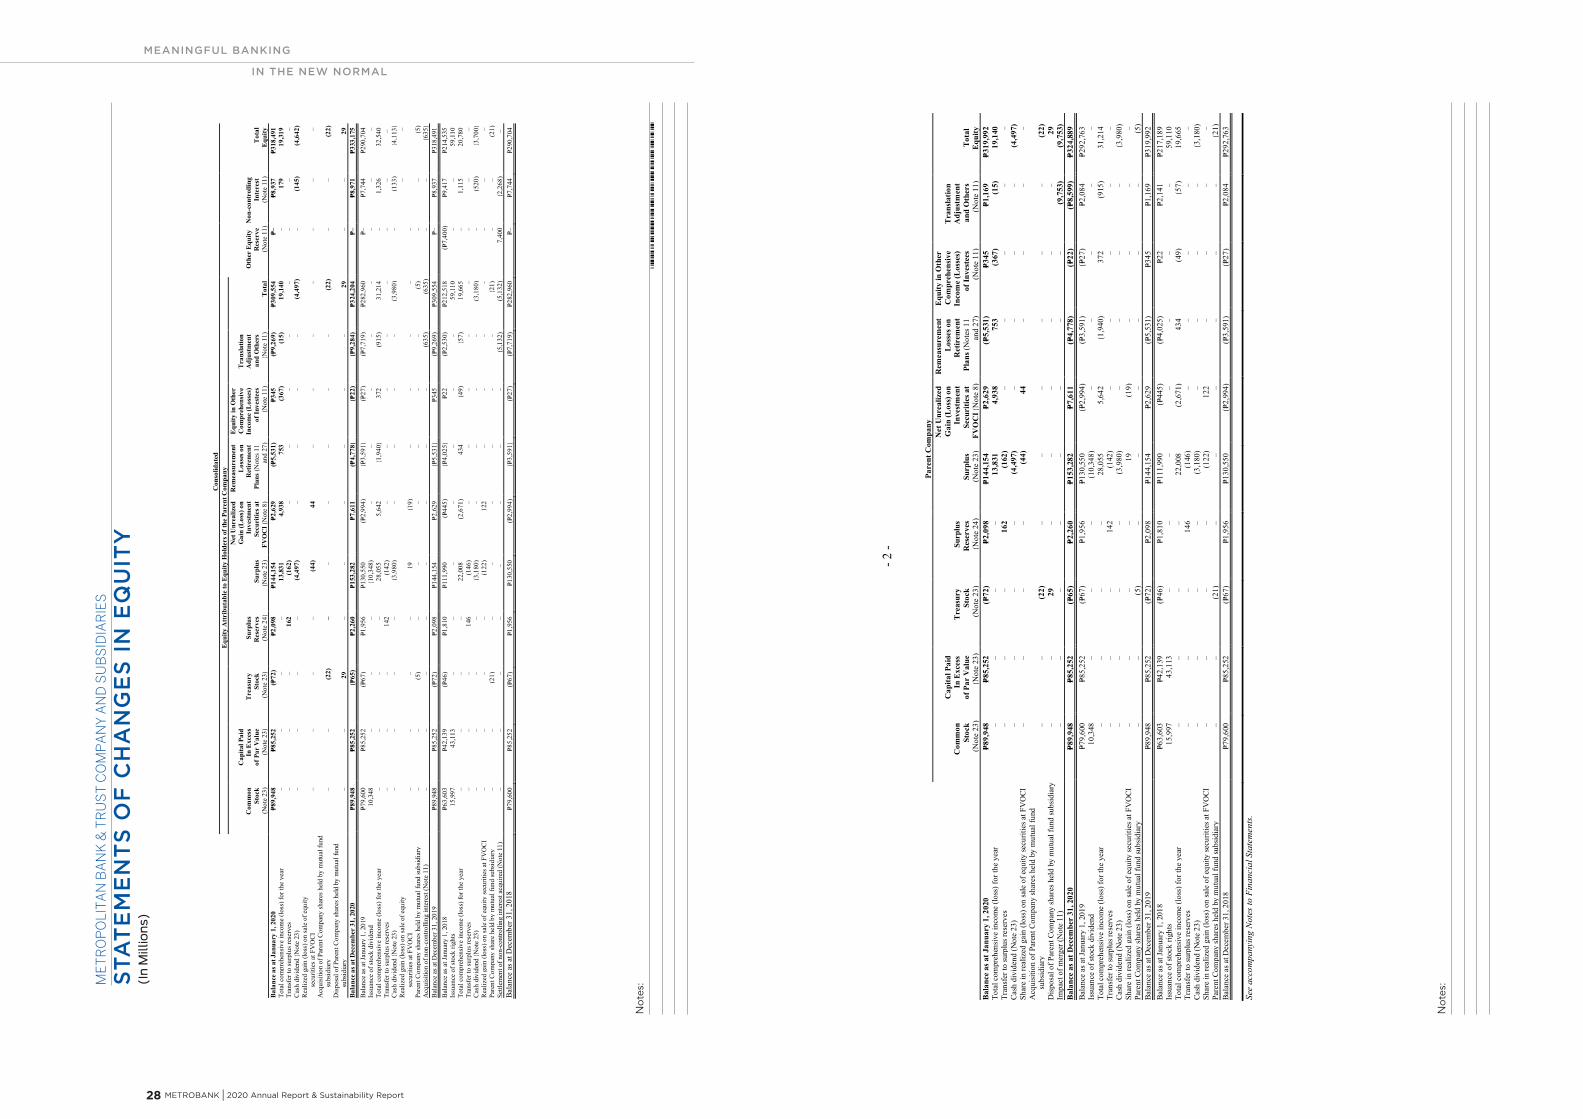
2020 2019 2020 2019EQUITYEquity Attributable to Equity Holders of the Parent CompanyCommon stock (Note 23) P=89,948 P=89,948 P=89,948 P=89,948Capital paid in excess of par value (Note 23) 85,252 85,252 85,252 85,252Treasury stock (Notes 23 and 31) (65) (72) (65) (72)Surplus reserves (Note 24) 2,260 2,098 2,260 2,098Surplus (Note 23) 153,282 144,154 153,282 144,154Net unrealized gain on investment securities at
FVOCI (Note 8) 7,611 2,629 7,611 2,629Remeasurement losses on retirement plans
(Notes 11 and 27) (4,778) (5,531) (4,778) (5,531)Equity in other comprehensive income (losses)
of investees (Note 11) (22) 345 (22) 345Translation adjustment and others (Note 11) (9,284) (9,269) (8,599) 1,169
324,204 309,554 324,889 319,992Non-controlling Interest (Note 11) 8,971 8,937 − −
333,175 318,491 324,889 319,992P=2,455,163 P=2,450,813 P=2,153,999 P=2,087,435
See accompanying Notes to Financial Statements.
*SGVFSM005911*
EXHIBIT B
METROPOLITAN BANK & TRUST COMPANY AND SUBSIDIARIESSTATEMENTS OF FINANCIAL POSITION(In Millions)
Consolidated Parent CompanyDecember 31
2020 2019 2020 2019ASSETSCash and Other Cash Items P=38,469 P=32,956 P=35,606 P=30,659Due from Bangko Sentral ng Pilipinas (BSP)
(Notes 4 and 16) 304,906 219,994 262,188 195,770Due from Other Banks (Note 4) 38,233 54,767 22,742 38,698Interbank Loans Receivable and Securities Purchased Under Resale Agreements (SPURA) (Notes 4, 7 and 26) 79,394 72,174 57,205 56,152Investment Securities at
Fair Value Through Profit or Loss (FVTPL) (Note 8) 77,551 61,867 67,956 49,550Fair Value Through Other Comprehensive Income (FVOCI) (Notes 4 and 8) 569,445 202,520 542,666 188,676Amortized Cost (Notes 4 and 8) 23,293 251,628 7,909 216,644
Loans and Receivables (Notes 4 and 9) 1,252,929 1,483,568 1,048,742 1,177,101Property and Equipment (Note 10) 24,617 25,700 18,429 17,857Investments in Subsidiaries (Note 11) − − 67,181 95,739Investments in Associates and a Joint Venture (Note 11) 6,248 6,591 565 542Goodwill (Note 11) 5,199 5,200 – ‒Investment Properties (Note 12) 7,667 7,762 3,369 3,291Deferred Tax Assets (Note 28) 14,028 10,512 11,394 6,918Other Assets (Note 14) 13,184 15,574 8,047 9,838
P=2,455,163 P=2,450,813 P=2,153,999 P=2,087,435
LIABILITIES AND EQUITYLIABILITIESDeposit Liabilities (Notes 16 and 31)Demand P=515,378 P=411,873 P=467,545 P=372,303Savings 795,979 665,634 755,713 630,946Time 450,103 592,897 332,323 461,713Long-Term Negotiable Certificates 35,755 43,740 27,330 35,330
1,797,215 1,714,144 1,582,911 1,500,292Bills Payable and Securities Sold Under Repurchase Agreements (SSURA)
(Notes 17 and 31) 139,614 238,281 108,651 139,072Derivative Liabilities (Note 8) 13,465 7,427 11,813 5,994Manager’s Checks and Demand Drafts Outstanding 6,024 6,806 5,493 5,508Income Taxes Payable 2,711 4,188 1,992 3,259Accrued Interest and Other Expenses (Note 18) 9,149 10,499 6,432 6,654Bonds Payable (Notes 19 and 31) 91,397 80,486 76,355 70,110Subordinated Debts (Note 20) 1,167 7,660 1,167 6,494Non-equity Non-controlling Interest (Note 21) 8,315 6,553 − –Other Liabilities (Note 21) 52,931 56,278 34,296 30,060
2,121,988 2,132,322 1,829,110 1,767,443
(Forward)
(In Millions)
METROPOLITAN BANK & TRUST COMPANY AND SUBSIDIARIES
STATEMENTS OF FINANCIAL POSITION
METROBANK I 2020 Annual Report & Sustainability Report 27
Notes:
MEANINGFUL BANKING
IN THE NEW NORMAL
26 METROBANK I 2020 Annual Report & Sustainability Report
*SGVFSM005911*
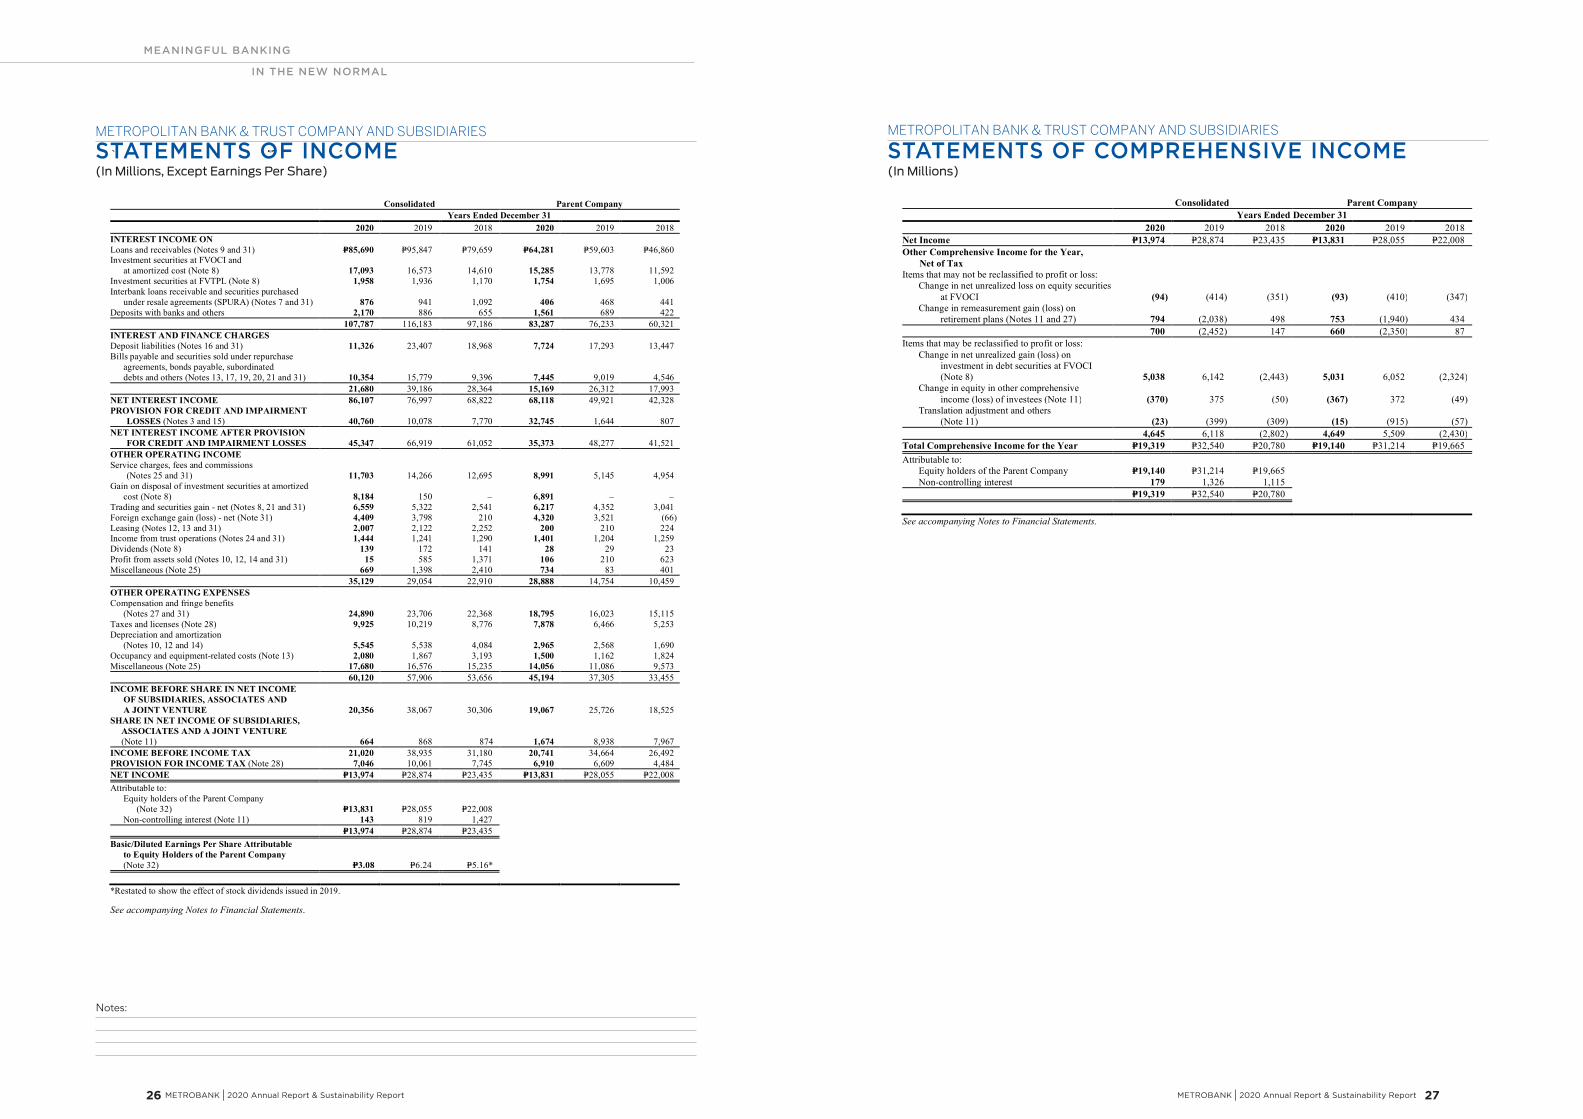
METROPOLITAN BANK & TRUST COMPANY AND SUBSIDIARIESSTATEMENTS OF COMPREHENSIVE INCOME(In Millions)
Consolidated Parent CompanyYears Ended December 31
2020 2019 2018 2020 2019 2018Net Income P=13,974 P=28,874 P=23,435 P=13,831 P=28,055 P=22,008Other Comprehensive Income for the Year, Net of TaxItems that may not be reclassified to profit or loss:
Change in net unrealized loss on equity securitiesat FVOCI (94) (414) (351) (93) (410) (347)
Change in remeasurement gain (loss) onretirement plans (Notes 11 and 27) 794 (2,038) 498 753 (1,940) 434
700 (2,452) 147 660 (2,350) 87Items that may be reclassified to profit or loss:
Change in net unrealized gain (loss) oninvestment in debt securities at FVOCI(Note 8) 5,038 6,142 (2,443) 5,031 6,052 (2,324)
Change in equity in other comprehensiveincome (loss) of investees (Note 11) (370) 375 (50) (367) 372 (49)
Translation adjustment and others(Note 11) (23) (399) (309) (15) (915) (57)
4,645 6,118 (2,802) 4,649 5,509 (2,430)Total Comprehensive Income for the Year P=19,319 P=32,540 P=20,780 P=19,140 P=31,214 P=19,665Attributable to:
Equity holders of the Parent Company P=19,140 P=31,214 P=19,665Non-controlling interest 179 1,326 1,115
P=19,319 P=32,540 P=20,780
See accompanying Notes to Financial Statements.
(In Millions)STATEMENTS OF COMPREHENSIVE INCOMEMETROPOLITAN BANK & TRUST COMPANY AND SUBSIDIARIES
*SGVFSM005911*
METROPOLITAN BANK & TRUST COMPANY AND SUBSIDIARIESSTATEMENTS OF INCOME(In Millions, Except Earnings Per Share)
Consolidated Parent CompanyYears Ended December 31
2020 2019 2018 2020 2019 2018INTEREST INCOME ONLoans and receivables (Notes 9 and 31) P=85,690 P=95,847 P=79,659 P=64,281 P=59,603 P=46,860Investment securities at FVOCI and at amortized cost (Note 8) 17,093 16,573 14,610 15,285 13,778 11,592Investment securities at FVTPL (Note 8) 1,958 1,936 1,170 1,754 1,695 1,006Interbank loans receivable and securities purchased under resale agreements (SPURA) (Notes 7 and 31) 876 941 1,092 406 468 441Deposits with banks and others 2,170 886 655 1,561 689 422
107,787 116,183 97,186 83,287 76,233 60,321INTEREST AND FINANCE CHARGESDeposit liabilities (Notes 16 and 31) 11,326 23,407 18,968 7,724 17,293 13,447Bills payable and securities sold under repurchase agreements, bonds payable, subordinated debts and others (Notes 13, 17, 19, 20, 21 and 31) 10,354 15,779 9,396 7,445 9,019 4,546
21,680 39,186 28,364 15,169 26,312 17,993NET INTEREST INCOME 86,107 76,997 68,822 68,118 49,921 42,328PROVISION FOR CREDIT AND IMPAIRMENT
LOSSES (Notes 3 and 15) 40,760 10,078 7,770 32,745 1,644 807NET INTEREST INCOME AFTER PROVISION
FOR CREDIT AND IMPAIRMENT LOSSES 45,347 66,919 61,052 35,373 48,277 41,521OTHER OPERATING INCOMEService charges, fees and commissions
(Notes 25 and 31) 11,703 14,266 12,695 8,991 5,145 4,954Gain on disposal of investment securities at amortized cost (Note 8) 8,184 150 – 6,891 – –Trading and securities gain - net (Notes 8, 21 and 31) 6,559 5,322 2,541 6,217 4,352 3,041Foreign exchange gain (loss) - net (Note 31) 4,409 3,798 210 4,320 3,521 (66)Leasing (Notes 12, 13 and 31) 2,007 2,122 2,252 200 210 224Income from trust operations (Notes 24 and 31) 1,444 1,241 1,290 1,401 1,204 1,259Dividends (Note 8) 139 172 141 28 29 23Profit from assets sold (Notes 10, 12, 14 and 31) 15 585 1,371 106 210 623Miscellaneous (Note 25) 669 1,398 2,410 734 83 401
35,129 29,054 22,910 28,888 14,754 10,459OTHER OPERATING EXPENSESCompensation and fringe benefits (Notes 27 and 31) 24,890 23,706 22,368 18,795 16,023 15,115Taxes and licenses (Note 28) 9,925 10,219 8,776 7,878 6,466 5,253Depreciation and amortization (Notes 10, 12 and 14) 5,545 5,538 4,084 2,965 2,568 1,690Occupancy and equipment-related costs (Note 13) 2,080 1,867 3,193 1,500 1,162 1,824Miscellaneous (Note 25) 17,680 16,576 15,235 14,056 11,086 9,573
60,120 57,906 53,656 45,194 37,305 33,455INCOME BEFORE SHARE IN NET INCOME OF SUBSIDIARIES, ASSOCIATES AND
A JOINT VENTURE 20,356 38,067 30,306 19,067 25,726 18,525SHARE IN NET INCOME OF SUBSIDIARIES,
ASSOCIATES AND A JOINT VENTURE(Note 11) 664 868 874 1,674 8,938 7,967
INCOME BEFORE INCOME TAX 21,020 38,935 31,180 20,741 34,664 26,492PROVISION FOR INCOME TAX (Note 28) 7,046 10,061 7,745 6,910 6,609 4,484NET INCOME P=13,974 P=28,874 P=23,435 P=13,831 P=28,055 P=22,008Attributable to: Equity holders of the Parent Company (Note 32) P=13,831 P=28,055 P=22,008 Non-controlling interest (Note 11) 143 819 1,427
P=13,974 P=28,874 P=23,435Basic/Diluted Earnings Per Share Attributable to Equity Holders of the Parent Company (Note 32) P=3.08 P=6.24 P=5.16*
*Restated to show the effect of stock dividends issued in 2019.
See accompanying Notes to Financial Statements.
(In Millions, Except Earnings Per Share)STATEMENTS OF INCOMEMETROPOLITAN BANK & TRUST COMPANY AND SUBSIDIARIES
Notes:
METROBANK I 2020 Annual Report & Sustainability Report 29
MEANINGFUL BANKING
IN THE NEW NORMAL
28 METROBANK I 2020 Annual Report & Sustainability Report
*SGVFSM005911*
- 2 -
Pare
nt C
ompa
ny
Com
mon
Stoc
k(N
ote
23)
Cap
ital P
aid
In E
xces
sof
Par
Val
ue(N
ote
23)
Tre
asur
ySt
ock
(Not
e 23
)
Surp
lus
Res
erve
s(N
ote
24)
Surp
lus
(Not
e 23
)
Net
Unr
ealiz
edG
ain
(Los
s) o
nIn
vest
men
tSe
curi
ties a
tFV
OC
I (N
ote
8)
Rem
easu
rem
ent
Los
ses o
nR
etir
emen
tPl
ans (
Not
es 1
1an
d 27
)
Equ
ity in
Oth
erC
ompr
ehen
sive
Inco
me
(Los
ses)
of In
vest
ees
(Not
e 11
)
Tra
nsla
tion
Adj
ustm
ent
and
Oth
ers
(Not
e 11
)To
tal
Equ
ityB
alan
ce a
s at J
anua
ry 1
, 202
0P=8
9,94
8P=8
5,25
2(P=
72)
P=2,0
98P=1
44,1
54P=2
,629
(P=5,
531)
P=345
P=1,1
69P=3
19,9
92To
tal c
ompr
ehen
sive
inco
me
(loss
)for
the
year
––
––
13,8
314,
938
753
(367
)(1
5)19
,140
Tran
sfer
to su
rplu
s res
erve
s–
––
162
(162
)–
––
––
Cash
div
iden
d(N
ote
23)
––
––
(4,4
97)
––
––
(4,4
97)
Shar
e in
real
ized
gai
n(lo
ss)o
n sa
le o
f equ
ity se
curit
iesa
t FV
OCI
––
––
(44)
44–
––
–A
cqui
sitio
n of
Par
ent C
ompa
ny sh
ares
hel
d by
mut
ual f
und
subs
idia
ry–
–(2
2)–
––
––
–(2
2)D
ispo
sal o
f Par
ent C
ompa
ny sh
ares
hel
d by
mut
ual f
und
subs
idia
ry–
–29
––
––
––
29Im
pact
of m
erge
r(N
ote
11)
––
––
––
––
(9,7
53)
(9,7
53)
Bal
ance
as a
t Dec
embe
r 31
, 202
0P=8
9,94
8P=8
5,25
2(P=
65)
P=2,2
60P=1
53,2
82P=7
,611
(P=4,
778)
(P=22
)(P=
8,59
9)P=3
24,8
89Ba
lanc
e as
at J
anua
ry 1
, 201
9P=7
9,60
0P=8
5,25
2(P=
67)
P=1,9
56P=1
30,5
50(P=
2,99
4)(P=
3,59
1)(P=
27)
P=2,0
84P=2
92,7
63Is
suan
ce o
f sto
ck d
ivid
end
10,3
48–
––
(10,
348)
––
––
–To
talc
ompr
ehen
sive
inco
me
(loss
) for
the
year
––
––
28,0
555,
642
(1,9
40)
372
(915
)31
,214
Tran
sfer
to su
rplu
s res
erve
s–
––
142
(142
)–
––
––
Cash
div
iden
d(N
ote
23)
––
––
(3,9
80)
––
––
(3,9
80)
Shar
e in
real
ized
gai
n (lo
ss) o
n sa
le o
f equ
ityse
curit
iesa
t FV
OCI
––
––
19(1
9)–
––
–Pa
rent
Com
pany
shar
es h
eld
by m
utua
l fun
d su
bsid
iary
––
(5)
––
––
––
(5)
Bala
nce
as a
t Dec
embe
r 31,
201
9P=8
9,94
8P=8
5,25
2(P=
72)
P=2,0
98P=1
44,1
54P=2
,629
(P=5,
531)
P=345
P=1,1
69P=3
19,9
92Ba
lanc
e as
at J
anua
ry 1
, 201
8P=6
3,60
3P=4
2,13
9(P=
46)
P=1,8
10P=1
11,9
90(P=
445)
(P=4,
025)
P=22
P=2,1
41P=2
17,1
89Is
suan
ce o
f sto
ck ri
ghts
15,9
9743
,113
––
––
––
–59
,110
Tota
l com
preh
ensi
ve in
com
e (lo
ss) f
or th
e ye
ar–
––
–22
,008
(2,6
71)
434
(49)
(57)
19,6
65Tr
ansf
er to
surp
lus r
eser
ves
––
–14
6(1
46)
––
––
–Ca
sh d
ivid
end
(Not
e 23
)–
––
–(3
,180
)–
––
–(3
,180
)Sh
are
in re
aliz
ed g
ain
(loss
) on
sale
of e
quity
secu
ritie
sat F
VO
CI–
––
–(1
22)
122
––
––
Pare
nt C
ompa
ny sh
ares
hel
d by
mut
ual f
und
subs
idia
ry–
–(2
1)–
––
––
–(2
1)Ba
lanc
e as
atD
ecem
ber 3
1, 2
018
P=79,
600
P=85,
252
(P=67
)P=1
,956
P=130
,550
(P=2,
994)
(P=3,
591)
(P=27
)P=2
,084
P=292
,763
See
acco
mpa
nyin
g N
otes
to F
inan
cial
Sta
tem
ents
.
Not
es:
Not
es:
*SGVFSM005911*
ME
TR
OPO
LIT
AN
BA
NK
& T
RU
ST C
OM
PAN
Y A
ND
SU
BSI
DIA
RIE
SST
AT
EM
EN
TS
OF
CH
AN
GE
S IN
EQ
UIT
Y(I
n M
illio
ns)
Con
solid
ated
Equ
ity A
ttrib
utab
le to
Equ
ity H
olde
rs o
f the
Par
ent C
ompa
ny
Com
mon
Stoc
k(N
ote
23)
Cap
ital P
aid
In E
xces
sof
Par
Val
ue(N
ote
23)
Tre
asur
ySt
ock
(Not
e 23
)
Surp
lus
Res
erve
s(N
ote
24)
Surp
lus
(Not
e 23
)
Net
Unr
ealiz
edG
ain
(Los
s) o
nIn
vest
men
tSe
curi
ties a
tFV
OC
I (N
ote
8)
Rem
easu
rem
ent
Los
ses o
nR
etir
emen
tPl
ans
(Not
es 1
1an
d 27
)
Equ
ity in
Oth
erC
ompr
ehen
sive
Inco
me
(Los
ses)
of In
vest
ees
(Not
e 11
)
Tra
nsla
tion
Adj
ustm
ent
and
Oth
ers
(Not
e 11
)T
otal
Oth
er E
quity
Res
erve
(Not
e 11
)Non
-con
trol
ling
Inte
rest
(Not
e 11
)T
otal
Equ
ityB
alan
ce a
s at J
anua
ry 1
, 202
0P=8
9,94
8P=8
5,25
2(P=
72)
P=2,0
98P=1
44,1
54P=2
,629
(P=5,
531)
P=345
(P=9,
269)
P=309
,554
P=–P=8
,937
P=318
,491
Tota
l com
preh
ensiv
e in
com
e(lo
ss)f
or th
e ye
ar–
––
–13
,831
4,93
875
3(3
67)
(15)
19,1
40–
179
19,3
19Tr
ansf
er to
surp
lus r
eser
ves
––
–16
2(1
62)
––
––
––
––
Cas
h di
vide
nd(N
ote
23)
––
––
(4,4
97)
––
––
(4,4
97)
–(1
45)
(4,6
42)
Rea
lized
gai
n (lo
ss) o
n sa
le o
f equ
ityse
curit
iesa
t FV
OC
I–
––
–(4
4)44
––
––
––
–A
cqui
sitio
n of
Par
ent C
ompa
ny sh
ares
hel
d by
mut
ualf
und
subs
idia
ry–
–(2
2)–
––
––
–(2
2)–
–(2
2)D
ispo
sal o
f Par
ent C
ompa
ny sh
ares
hel
d by
mut
ual f
und
subs
idia
ry–
–29
––
––
––
29–
–29
Bal
ance
as a
t Dec
embe
r 31
,202
0P=8
9,94
8P=8
5,25
2(P=
65)
P=2,2
60P=1
53,2
82P=7
,611
(P=4,
778)
(P=22
)(P=
9,28
4)P=3
24,2
04P=–
P=8,9
71P=3
33,1
75B
alan
ce a
s at J
anua
ry 1
, 201
9P=7
9,60
0P=8
5,25
2(P=
67)
P=1,9
56P=1
30,5
50(P=
2,99
4)(P=
3,59
1)(P=
27)
(P=7,
719)
P=282
,960
P=–P=7
,744
P=290
,704
Issu
ance
of s
tock
div
iden
d10
,348
––
–(1
0,34
8)–
––
––
––
–To
tal c
ompr
ehen
sive
inco
me
(loss
) for
the
year
––
––
28,0
555,
642
(1,9
40)
372
(915
)31
,214
–1,
326
32,5
40Tr
ansf
er to
surp
lus r
eser
ves
––
–14
2(1
42)
––
––
––
––
Cas
h di
vide
nd(N
ote
23)
––
––
(3,9
80)
––
––
(3,9
80)
–(1
33)
(4,1
13)
Rea
lized
gai
n (lo
ss) o
n sa
le o
f equ
ityse
curit
ies a
t FV
OC
I–
––
–19
(19)
––
––
––
–
Pare
nt C
ompa
ny sh
ares
hel
d by
mut
ual f
und
subs
idia
ry–
–(5
)–
––
––
–(5
)–
–(5
)A
cqui
sitio
n of
non
-con
trolli
ng in
tere
st (N
ote
11)
––
––
––
––
(635
)(6
35)
––
(635
)B
alan
ce a
s at D
ecem
ber 3
1, 2
019
P=89,
948
P=85,
252
(P=72
)P=2
,098
P=144
,154
P=2,6
29(P=
5,53
1)P=3
45(P=
9,26
9)P=3
09,5
54P=–
P=8,9
37P=3
18,4
91B
alan
ce a
s at J
anua
ry 1
, 201
8P=6
3,60
3P=4
2,13
9(P=
46)
P=1,8
10P=1
11,9
90(P=
445)
(P=4,
025)
P=22
(P=2,
530)
P=212
,518
(P=7,
400)
P=9,4
17P=2
14,5
35Is
suan
ce o
f sto
ck ri
ghts
15,9
9743
,113
––
––
––
–59
,110
––
59,1
10To
tal c
ompr
ehen
sive
inco
me
(loss
) for
the
year
––
––
22,0
08(2
,671
)43
4(4
9)(5
7)19
,665
–1,
115
20,7
80Tr
ansf
er to
surp
lus r
eser
ves
––
–14
6(1
46)
––
––
––
––
Cas
h di
vide
nd(N
ote
23)
––
––
(3,1
80)
––
––
(3,1
80)
–(5
20)
(3,7
00)
Rea
lized
gai
n (lo
ss) o
n sa
le o
fequ
ity se
curit
ies a
t FV
OC
I–
––
–(1
22)
122
––
––
––
–Pa
rent
Com
pany
shar
e he
ld b
y m
utua
l fun
d su
bsid
iary
––
(21)
––
––
––
(21)
––
(21)
Settl
emen
t of n
on-c
ontro
lling
inte
rest
acq
uire
d (N
ote
11)
––
––
––
––
(5,1
32)
(5,1
32)
7,40
0(2
,268
)–
Bala
nce
as a
t Dec
embe
r 31,
201
8P=7
9,60
0P=8
5,25
2(P=
67)
P=1,9
56P=1
30,5
50(P=
2,99
4)(P=
3,59
1)(P=
27)
(P=7,
719)
P=282
,960
P=–P=7
,744
P=290
,704
(In
Mill
ion
s)S
TA
TE
ME
NT
S O
F C
HA
NG
ES
IN
EQ
UIT
YM
ET
RO
PO
LIT
AN
BA
NK
& T
RU
ST
CO
MP
AN
Y A
ND
SU
BS
IDIA
RIE
S
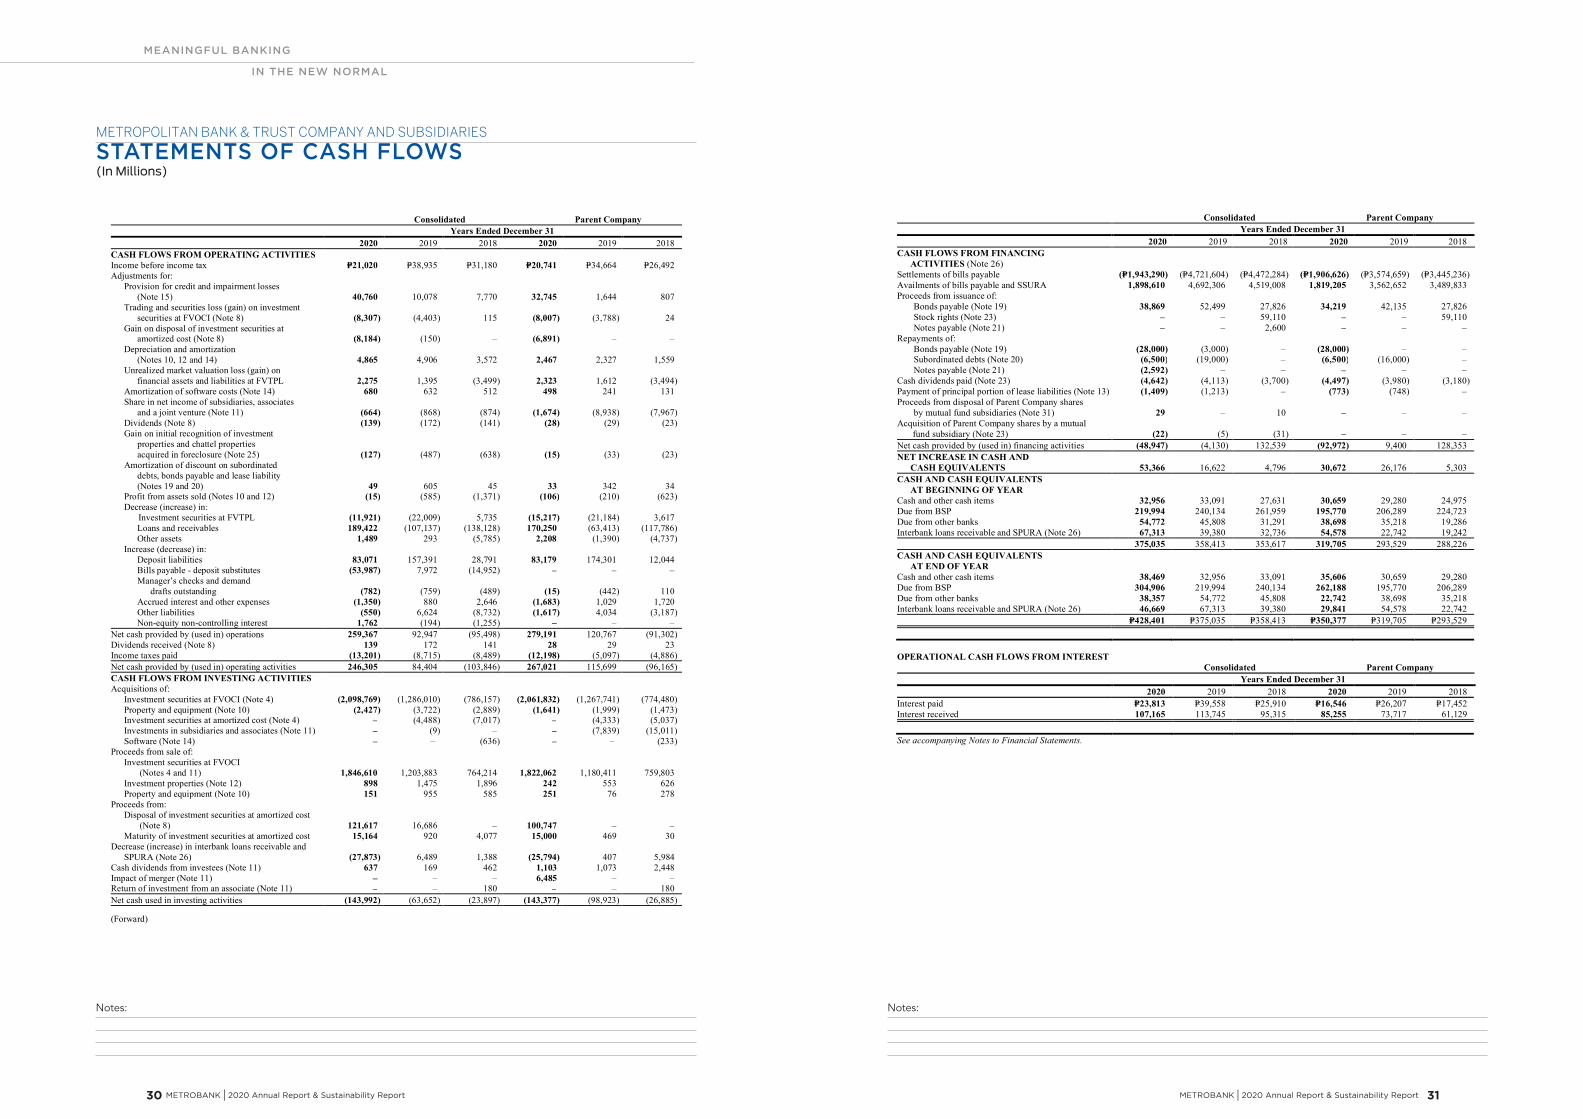
Notes:Notes:
MEANINGFUL BANKING
IN THE NEW NORMAL
METROBANK I 2020 Annual Report & Sustainability Report 31 30 METROBANK I 2020 Annual Report & Sustainability Report
*SGVFSM005911*
- 2 -
Consolidated Parent CompanyYears Ended December 31
2020 2019 2018 2020 2019 2018CASH FLOWS FROM FINANCING
ACTIVITIES (Note 26)Settlements of bills payable (P=1,943,290) (P=4,721,604) (P=4,472,284) (P=1,906,626) (P=3,574,659) (P=3,445,236)Availments of bills payable and SSURA 1,898,610 4,692,306 4,519,008 1,819,205 3,562,652 3,489,833Proceeds from issuance of:
Bonds payable (Note 19) 38,869 52,499 27,826 34,219 42,135 27,826Stock rights (Note 23) – – 59,110 – – 59,110Notes payable (Note 21) – – 2,600 – – ‒
Repayments of:Bonds payable (Note 19) (28,000) (3,000) – (28,000) – –Subordinated debts (Note 20) (6,500) (19,000) – (6,500) (16,000) –Notes payable (Note 21) (2,592) – – – – –
Cash dividends paid (Note 23) (4,642) (4,113) (3,700) (4,497) (3,980) (3,180)Payment of principal portion of lease liabilities (Note 13) (1,409) (1,213) – (773) (748) –Proceeds from disposal of Parent Company shares
by mutual fund subsidiaries (Note 31) 29 – 10 – – –Acquisition of Parent Company shares by a mutual
fund subsidiary (Note 23) (22) (5) (31) – – –Net cash provided by (used in) financing activities (48,947) (4,130) 132,539 (92,972) 9,400 128,353NET INCREASE IN CASH AND
CASH EQUIVALENTS 53,366 16,622 4,796 30,672 26,176 5,303CASH AND CASH EQUIVALENTS
AT BEGINNING OF YEARCash and other cash items 32,956 33,091 27,631 30,659 29,280 24,975Due from BSP 219,994 240,134 261,959 195,770 206,289 224,723Due from other banks 54,772 45,808 31,291 38,698 35,218 19,286Interbank loans receivable and SPURA (Note 26) 67,313 39,380 32,736 54,578 22,742 19,242
375,035 358,413 353,617 319,705 293,529 288,226CASH AND CASH EQUIVALENTS
AT END OF YEARCash and other cash items 38,469 32,956 33,091 35,606 30,659 29,280Due from BSP 304,906 219,994 240,134 262,188 195,770 206,289Due from other banks 38,357 54,772 45,808 22,742 38,698 35,218Interbank loans receivable and SPURA (Note 26) 46,669 67,313 39,380 29,841 54,578 22,742
P=428,401 P=375,035 P=358,413 P=350,377 P=319,705 P=293,529
OPERATIONAL CASH FLOWS FROM INTERESTConsolidated Parent Company
Years Ended December 312020 2019 2018 2020 2019 2018
Interest paid P=23,813 P=39,558 P=25,910 P=16,546 P=26,207 P=17,452Interest received 107,165 113,745 95,315 85,255 73,717 61,129
See accompanying Notes to Financial Statements.
*SGVFSM005911*
METROPOLITAN BANK & TRUST COMPANY AND SUBSIDIARIESSTATEMENTS OF CASH FLOWS(In Millions)
Consolidated Parent CompanyYears Ended December 31
2020 2019 2018 2020 2019 2018CASH FLOWS FROM OPERATING ACTIVITIESIncome before income tax P=21,020 P=38,935 P=31,180 P=20,741 P=34,664 P=26,492Adjustments for: Provision for credit and impairment losses
(Note 15) 40,760 10,078 7,770 32,745 1,644 807 Trading and securities loss (gain) on investment securities at FVOCI (Note 8) (8,307) (4,403) 115 (8,007) (3,788) 24 Gain on disposal of investment securities at
amortized cost (Note 8) (8,184) (150) – (6,891) – – Depreciation and amortization
(Notes 10, 12 and 14) 4,865 4,906 3,572 2,467 2,327 1,559 Unrealized market valuation loss (gain) on financial assets and liabilities at FVTPL 2,275 1,395 (3,499) 2,323 1,612 (3,494) Amortization of software costs (Note 14) 680 632 512 498 241 131 Share in net income of subsidiaries, associates and a joint venture (Note 11) (664) (868) (874) (1,674) (8,938) (7,967) Dividends (Note 8) (139) (172) (141) (28) (29) (23) Gain on initial recognition of investment
properties and chattel propertiesacquired in foreclosure (Note 25) (127) (487) (638) (15) (33) (23)
Amortization of discount on subordinated debts, bonds payable and lease liability (Notes 19 and 20) 49 605 45 33 342 34 Profit from assets sold (Notes 10 and 12) (15) (585) (1,371) (106) (210) (623) Decrease (increase) in:
Investment securities at FVTPL (11,921) (22,009) 5,735 (15,217) (21,184) 3,617 Loans and receivables 189,422 (107,137) (138,128) 170,250 (63,413) (117,786) Other assets 1,489 293 (5,785) 2,208 (1,390) (4,737) Increase (decrease) in: Deposit liabilities 83,071 157,391 28,791 83,179 174,301 12,044 Bills payable - deposit substitutes (53,987) 7,972 (14,952) – – – Manager’s checks and demand
drafts outstanding (782) (759) (489) (15) (442) 110 Accrued interest and other expenses (1,350) 880 2,646 (1,683) 1,029 1,720 Other liabilities (550) 6,624 (8,732) (1,617) 4,034 (3,187) Non-equity non-controlling interest 1,762 (194) (1,255) – – –Net cash provided by (used in) operations 259,367 92,947 (95,498) 279,191 120,767 (91,302)Dividends received (Note 8) 139 172 141 28 29 23Income taxes paid (13,201) (8,715) (8,489) (12,198) (5,097) (4,886)Net cash provided by (used in) operating activities 246,305 84,404 (103,846) 267,021 115,699 (96,165)CASH FLOWS FROM INVESTING ACTIVITIESAcquisitions of: Investment securities at FVOCI (Note 4) (2,098,769) (1,286,010) (786,157) (2,061,832) (1,267,741) (774,480) Property and equipment (Note 10) (2,427) (3,722) (2,889) (1,641) (1,999) (1,473) Investment securities at amortized cost (Note 4) – (4,488) (7,017) – (4,333) (5,037) Investments in subsidiaries and associates (Note 11) – (9) – – (7,839) (15,011) Software (Note 14) – – (636) – – (233)Proceeds from sale of: Investment securities at FVOCI (Notes 4 and 11) 1,846,610 1,203,883 764,214 1,822,062 1,180,411 759,803 Investment properties (Note 12) 898 1,475 1,896 242 553 626 Property and equipment (Note 10) 151 955 585 251 76 278Proceeds from: Disposal of investment securities at amortized cost (Note 8) 121,617 16,686 – 100,747 – – Maturity of investment securities at amortized cost 15,164 920 4,077 15,000 469 30Decrease (increase) in interbank loans receivable and SPURA (Note 26) (27,873) 6,489 1,388 (25,794) 407 5,984Cash dividends from investees (Note 11) 637 169 462 1,103 1,073 2,448Impact of merger (Note 11) – – – 6,485 – –Return of investment from an associate (Note 11) – – 180 – – 180Net cash used in investing activities (143,992) (63,652) (23,897) (143,377) (98,923) (26,885)
(Forward)
(In Millions)STATEMENTS OF CASH FLOWSMETROPOLITAN BANK & TRUST COMPANY AND SUBSIDIARIES
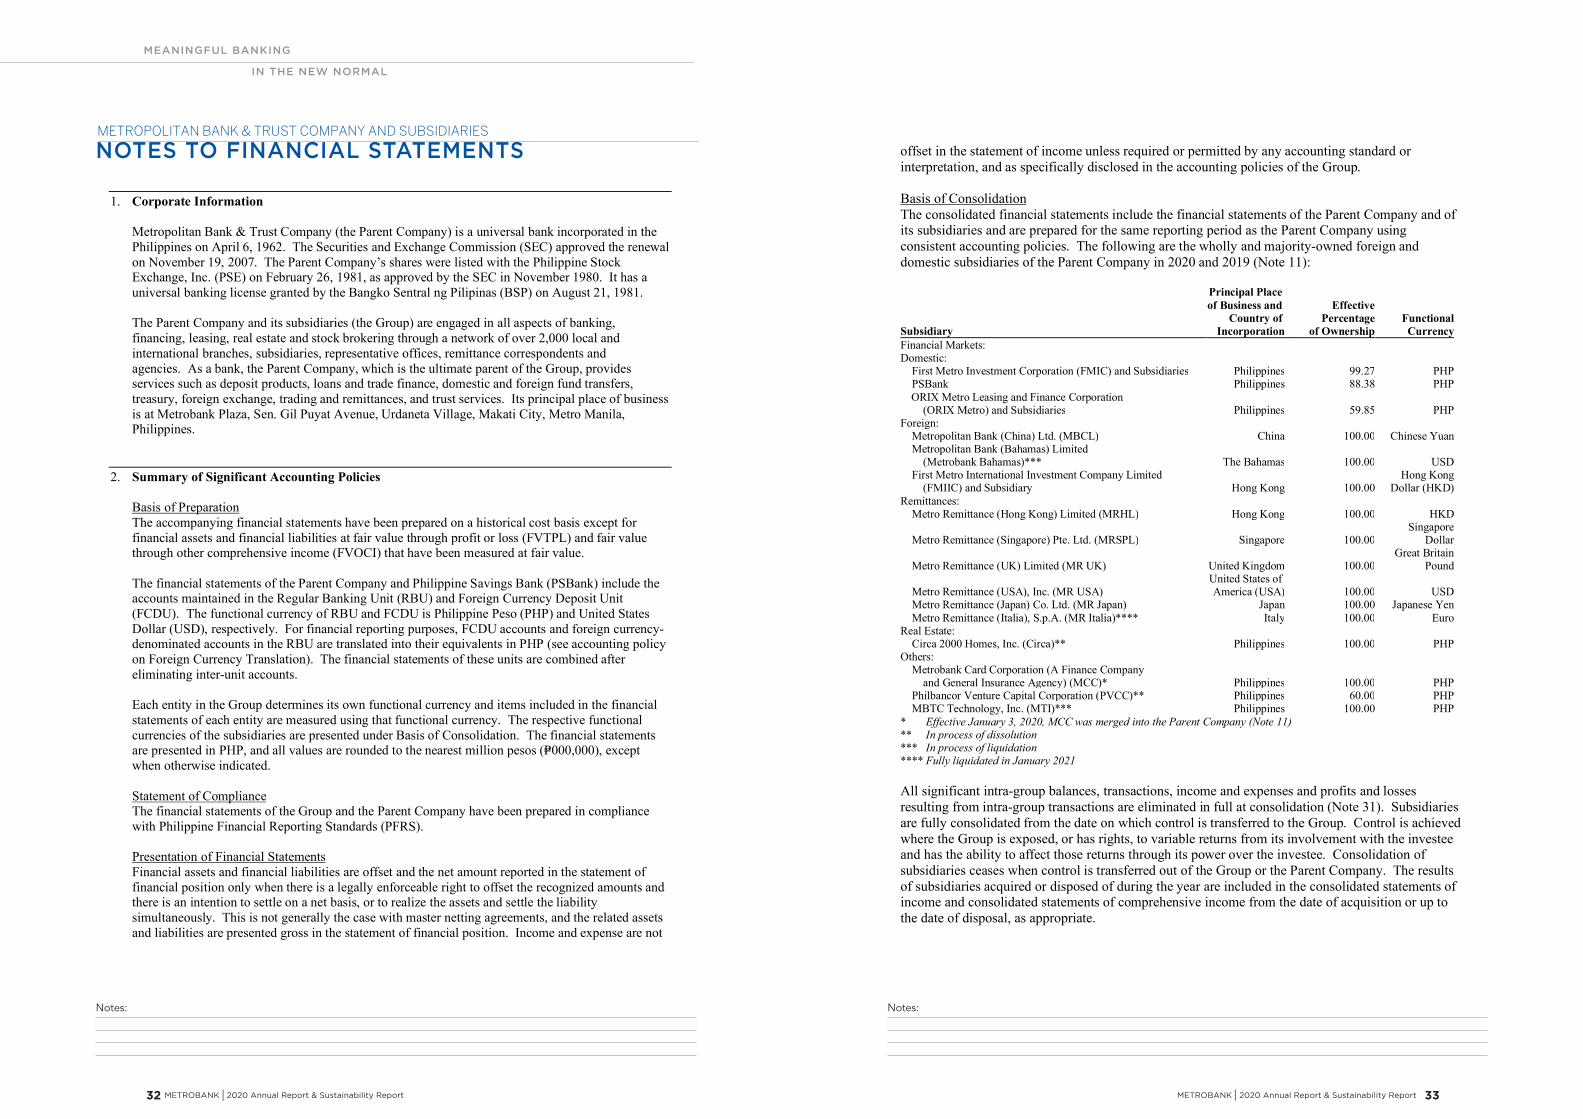
Notes:Notes:
MEANINGFUL BANKING
IN THE NEW NORMAL
METROBANK I 2020 Annual Report & Sustainability Report 33 32 METROBANK I 2020 Annual Report & Sustainability Report
- 2 -
*SGVFSM005911*
offset in the statement of income unless required or permitted by any accounting standard orinterpretation, and as specifically disclosed in the accounting policies of the Group.
Basis of ConsolidationThe consolidated financial statements include the financial statements of the Parent Company and ofits subsidiaries and are prepared for the same reporting period as the Parent Company usingconsistent accounting policies. The following are the wholly and majority-owned foreign anddomestic subsidiaries of the Parent Company in 2020 and 2019 (Note 11):
Subsidiary
Principal Placeof Business and
Country ofIncorporation
EffectivePercentage
of OwnershipFunctional
CurrencyFinancial Markets:Domestic:
First Metro Investment Corporation (FMIC) and Subsidiaries Philippines 99.27 PHPPSBank Philippines 88.38 PHPORIX Metro Leasing and Finance Corporation
(ORIX Metro) and Subsidiaries Philippines 59.85 PHPForeign:
Metropolitan Bank (China) Ltd. (MBCL) China 100.00 Chinese YuanMetropolitan Bank (Bahamas) Limited
(Metrobank Bahamas)*** The Bahamas 100.00 USDFirst Metro International Investment Company Limited (FMIIC) and Subsidiary Hong Kong 100.00
Hong KongDollar (HKD)
Remittances:Metro Remittance (Hong Kong) Limited (MRHL) Hong Kong 100.00 HKD
Metro Remittance (Singapore) Pte. Ltd. (MRSPL) Singapore 100.00Singapore
Dollar
Metro Remittance (UK) Limited (MR UK) United Kingdom 100.00Great Britain
Pound
Metro Remittance (USA), Inc. (MR USA)United States ofAmerica (USA) 100.00 USD
Metro Remittance (Japan) Co. Ltd. (MR Japan) Japan 100.00 Japanese YenMetro Remittance (Italia), S.p.A. (MR Italia)**** Italy 100.00 Euro
Real Estate:Circa 2000 Homes, Inc. (Circa)** Philippines 100.00 PHP
Others:Metrobank Card Corporation (A Finance Company
and General Insurance Agency) (MCC)* Philippines 100.00 PHPPhilbancor Venture Capital Corporation (PVCC)** Philippines 60.00 PHPMBTC Technology, Inc. (MTI)*** Philippines 100.00 PHP
* Effective January 3, 2020, MCC was merged into the Parent Company (Note 11)** In process of dissolution*** In process of liquidation**** Fully liquidated in January 2021
All significant intra-group balances, transactions, income and expenses and profits and lossesresulting from intra-group transactions are eliminated in full at consolidation (Note 31). Subsidiariesare fully consolidated from the date on which control is transferred to the Group. Control is achievedwhere the Group is exposed, or has rights, to variable returns from its involvement with the investeeand has the ability to affect those returns through its power over the investee. Consolidation ofsubsidiaries ceases when control is transferred out of the Group or the Parent Company. The resultsof subsidiaries acquired or disposed of during the year are included in the consolidated statements ofincome and consolidated statements of comprehensive income from the date of acquisition or up tothe date of disposal, as appropriate.
*SGVFSM005911*
METROPOLITAN BANK & TRUST COMPANY AND SUBSIDIARIESNOTES TO FINANCIAL STATEMENTS
1. Corporate Information
Metropolitan Bank & Trust Company (the Parent Company) is a universal bank incorporated in thePhilippines on April 6, 1962. The Securities and Exchange Commission (SEC) approved the renewalon November 19, 2007. The Parent Company’s shares were listed with the Philippine StockExchange, Inc. (PSE) on February 26, 1981, as approved by the SEC in November 1980. It has auniversal banking license granted by the Bangko Sentral ng Pilipinas (BSP) on August 21, 1981.
The Parent Company and its subsidiaries (the Group) are engaged in all aspects of banking,financing, leasing, real estate and stock brokering through a network of over 2,000 local andinternational branches, subsidiaries, representative offices, remittance correspondents andagencies. As a bank, the Parent Company, which is the ultimate parent of the Group, providesservices such as deposit products, loans and trade finance, domestic and foreign fund transfers,treasury, foreign exchange, trading and remittances, and trust services. Its principal place of businessis at Metrobank Plaza, Sen. Gil Puyat Avenue, Urdaneta Village, Makati City, Metro Manila,Philippines.
2. Summary of Significant Accounting Policies
Basis of PreparationThe accompanying financial statements have been prepared on a historical cost basis except forfinancial assets and financial liabilities at fair value through profit or loss (FVTPL) and fair valuethrough other comprehensive income (FVOCI) that have been measured at fair value.
The financial statements of the Parent Company and Philippine Savings Bank (PSBank) include theaccounts maintained in the Regular Banking Unit (RBU) and Foreign Currency Deposit Unit(FCDU). The functional currency of RBU and FCDU is Philippine Peso (PHP) and United StatesDollar (USD), respectively. For financial reporting purposes, FCDU accounts and foreign currency-denominated accounts in the RBU are translated into their equivalents in PHP (see accounting policyon Foreign Currency Translation). The financial statements of these units are combined aftereliminating inter-unit accounts.
Each entity in the Group determines its own functional currency and items included in the financialstatements of each entity are measured using that functional currency. The respective functionalcurrencies of the subsidiaries are presented under Basis of Consolidation. The financial statementsare presented in PHP, and all values are rounded to the nearest million pesos (P=000,000), exceptwhen otherwise indicated.
Statement of ComplianceThe financial statements of the Group and the Parent Company have been prepared in compliancewith Philippine Financial Reporting Standards (PFRS).
Presentation of Financial StatementsFinancial assets and financial liabilities are offset and the net amount reported in the statement offinancial position only when there is a legally enforceable right to offset the recognized amounts andthere is an intention to settle on a net basis, or to realize the assets and settle the liabilitysimultaneously. This is not generally the case with master netting agreements, and the related assetsand liabilities are presented gross in the statement of financial position. Income and expense are not
NOTES TO FINANCIAL STATEMENTSMETROPOLITAN BANK & TRUST COMPANY AND SUBSIDIARIES
Notes:Notes:
MEANINGFUL BANKING
IN THE NEW NORMAL
METROBANK I 2020 Annual Report & Sustainability Report 35 34 METROBANK I 2020 Annual Report & Sustainability Report
- 3 -
*SGVFSM005911*
Changes in the Parent Company’s ownership interest in a subsidiary that do not result in a loss ofcontrol are accounted for within equity. Any difference between the amount by which the non-controlling interests are adjusted and the fair value of the consideration paid (or to be paid) orreceived is recognized directly in equity included as part of ‘Translation adjustment and others’ andattributed to the owners of the Parent Company.
When a change in ownership interest in a subsidiary occurs which results in a loss of control over thesubsidiary, the Parent Company: (a) derecognizes the assets (including goodwill) and liabilities of thesubsidiary; (b) derecognizes the carrying amount of any non-controlling interest; (c) derecognizes therelated other comprehensive income (OCI) recorded in equity and recycles the same to statement ofincome or ‘Surplus’; (d) recognizes the fair value of the consideration received; (e) recognizes thefair value of any investment retained; (f) recognizes any surplus or deficit in statement of income;and (g) reclassifies the Parent Company’s share of components’ gains (losses) previously recognizedin OCI to profit or loss or surplus, as appropriate, as would be required if the Group had directlydisposed of the related assets or liabilities.
Entity with Significant Influence over the GroupGT Capital Holdings, Inc. (GT Capital) holds 37.15% and 36.65% interest in the Parent Company asof December 31, 2020 and 2019, respectively (Note 31).
Non-controlling InterestNon-controlling interest represents the portion of profit or loss and the net assets of the funds notheld by the Group and are presented separately in the consolidated statement of income, consolidatedstatement of comprehensive income and within equity in the consolidated statement of financialposition, separately from equity attributable to the Parent Company. Any losses applicable to thenon-controlling interests in excess of the non-controlling interests are allocated against the interestsof the non-controlling interest even if this results in the non-controlling interest having a deficitbalance. Acquisitions of non-controlling interests are accounted for as equity transactions.
Non-equity Non-controlling InterestThe Group has seed capital investments in a number of funds where it is in a position to be able tocontrol those funds. These funds are consolidated.
Non-equity non-controlling interest represents the portion of net assets of the consolidated funds notattributed, directly or indirectly, to the Parent Company and is presented separately in the liabilitysection in the consolidated statement of financial position. This liability is accounted for at FVTPLand measured using net asset value per unit with changes recognized in ‘Trading and securities gain -net’ in the consolidated statement of income.
Legal Merger between Parent Company and SubsidiaryIn the parent company financial statements, the legal merger between the Parent Company and itssubsidiary, with the Parent Company as the surviving entity, is accounted for as follows: The acquired assets and assumed liabilities are recognized at the carrying amounts in the
consolidated financial statements as of the date of the legal merger; The difference between the carrying amount of the net assets of the subsidiary and the carrying
amount of the investment in the merged subsidiary before the legal merger is recognized under“Translation adjustment and others” account in the equity section of the parent companystatement of financial position; and
The comparative financial information in the parent company financial statements for periodprior to the legal merger is not restated. The financial position and results of operations of the
- 4 -
*SGVFSM005911*
merged subsidiary are reflected in the parent company financial statements only from the date ofthe legal merger.
The legal merger has no impact in the consolidated financial statements.
Changes in Accounting Policies and DisclosuresExcept for these new and amended standards which were adopted as of January 1, 2020, theaccounting policies adopted are consistent with those of previous financial year.
The adoption of the following amendments did not have a significant impact on the consolidatedfinancial statements of the Group: Conceptual Framework for Financial Reporting issued on March 29, 2018 Amendments to PFRS 3, Business Combinations - Definition of a Business Amendments to PFRS 7, Financial Instruments: Disclosures and PFRS 9, Financial Instruments,
Interest Rate Benchmark Reform Amendments to PAS 1, Presentation of Financial Statements, and PAS 8, Accounting Policies,
Changes in Accounting Estimates and Errors - Definition of Material Amendments to PFRS 16, Leases, COVID-19-related Rent Concessions
Significant Accounting Policies
Foreign Currency TranslationTransactions and balancesFor financial reporting purposes, the foreign currency-denominated monetary assets and liabilities inthe RBU are translated in Philippine peso based on the Bankers Association of the Philippines (BAP)closing rate prevailing at the statement of financial position date and foreign currency-denominatedincome and expenses, at the prevailing exchange rates as at the date of transaction. Foreignexchange differences arising from revaluation and translation of foreign currency-denominated assetsand liabilities are credited to or charged against operations in the year in which the rates change.Non-monetary items that are measured in terms of historical cost in a foreign currency are translatedusing the exchange rates as at the dates of the initial transactions.
Non-monetary items measured at fair value in a foreign currency are translated using the exchangerates at the date when the fair value was determined.
FCDU, foreign branches and subsidiariesAs at the reporting date, the assets and liabilities of foreign branches and subsidiaries and FCDU ofthe Parent Company and PSBank are translated into the Parent Company’s presentation currency (thePHP) at BAP closing rate prevailing at the statement of financial position date, and their income andexpenses are translated at BAP weighted average rate. Exchange differences arising on translationare taken to the statement of comprehensive income under ‘Translation adjustment and others’.Upon disposal of a foreign entity or when the Parent Company ceases to have control over thesubsidiaries or upon actual remittance of FCDU profits to RBU, the deferred cumulative amountrecognized in the statement of comprehensive income is recognized in the statement of income.
Fair Value MeasurementThe Group measures certain financial instruments, such as derivatives, at fair value at each statementof financial position date. Also, fair values of financial instruments measured at amortized cost andinvestment properties are disclosed in Note 5.
Notes:Notes:
MEANINGFUL BANKING
IN THE NEW NORMAL
METROBANK I 2020 Annual Report & Sustainability Report 37 36 METROBANK I 2020 Annual Report & Sustainability Report
- 5 -
*SGVFSM005911*
Fair value is the price that would be received to sell an asset or paid to transfer a liability in anorderly transaction between market participants at the measurement date (i.e., an exit price). The fairvalue measurement is based on the presumption that the transaction to sell the asset or transfer theliability takes place either in the principal market for the asset or liability; or in the absence of aprincipal market, in the most advantageous market for the asset or liability. The principal or the mostadvantageous market must be accessible to the Group.
The fair value of an asset or a liability is measured using the assumptions that market participantswould use when pricing the asset or liability, assuming that market participants act in their economicbest interest.
If an asset or a liability measured at fair value has a bid price and an ask price, the price within thebid - ask spread that is most representative of fair value in the circumstances shall be used to measurefair value regardless of where the input is categorized within the fair value hierarchy.
A fair value measurement of a non-financial asset takes into account a market participant’s ability togenerate economic benefits by using the asset in its highest and best use or by selling it to anothermarket participant that would use the asset in its highest and best use.
For assets and liabilities not listed in an active market, the Group uses valuation techniques that areappropriate in the circumstances and for which sufficient data are available to measure fair value,maximizing the use of relevant observable inputs and minimizing the use of unobservable inputs.
All assets and liabilities for which fair value is measured or disclosed in the financial statements arecategorized within the fair value hierarchy, described as follows, based on the lowest level input thatis significant to the fair value measurement as a whole: Level 1 - Quoted (unadjusted) market prices in active markets for identical assets or liabilities Level 2 - Valuation techniques for which the lowest level input that is significant to the fair value
measurement is directly or indirectly observable Level 3 - Valuation techniques for which the lowest level input that is significant to the fair value
measurement is unobservable
For assets and liabilities that are recognized in the financial statements on a recurring basis, theGroup determines whether transfers have occurred between Levels in the hierarchy by re-assessingcategorization (based on the lowest level input that is significant to the fair value measurement as awhole) at the end of each reporting period. The Group determines the policies and procedures forboth recurring fair value measurement, such as financial assets and liabilities at FVTPL, and for non-recurring measurement, such as investment properties.
External valuers are involved for valuation of significant assets, such as investment properties.Selection criteria include market knowledge, reputation, independence and whether professionalstandards are maintained.
For the purpose of fair value disclosures, the Group has determined classes of assets and liabilities onthe basis of the nature, characteristics and risks of the asset or liability and the level of the fair valuehierarchy as explained above.
- 6 -
*SGVFSM005911*
Financial Instruments - Initial Recognition and Subsequent Measurement
Date of recognitionPurchases or sales of financial assets that require delivery of assets within the time frame establishedby regulation or convention in the marketplace are recognized on the settlement date. Derivatives arerecognized on trade date basis. Deposits, amounts due from banks and customers and loans andreceivables are recognized when cash is received by the Group or advanced to the borrowers.
Initial recognition of financial instrumentsAll financial instruments are initially measured at fair value. Except for financial assets and financialliabilities at FVTPL, the initial measurement of financial instruments includes transaction costs.
‘Day 1’ differenceWhere the transaction price in a non-active market is different from the fair value from otherobservable current market transactions in the same instrument or based on a valuation techniquewhose variables include only data from observable market, the Group recognizes the differencebetween the transaction price and fair value (a ‘Day 1’ difference) in the statement of income. Incases where the transaction price used is made of data which is not observable, the differencebetween the transaction price and model value is only recognized in the statement of income whenthe inputs become observable or when the instrument is derecognized. For each transaction, theGroup determines the appropriate method of recognizing the ‘Day 1’ difference amount.
Classification and Subsequent MeasurementFinancial assets are measured at FVTPL unless these are measured at FVOCI or at amortized cost.Financial liabilities are classified as either financial liabilities at FVTPL or financial liabilities atamortized cost. The classification of financial assets depends on the contractual terms and thebusiness model for managing the financial assets. Subsequent to initial recognition, the Group mayreclassify its financial assets only when there is a change in its business model for managing thesefinancial assets. Reclassification of financial liabilities is not allowed.
The Group determines its business model at the level that best reflects how it manages groups offinancial assets to achieve its business objective. The Group’s business model is not assessed on aninstrument-by-instrument basis, but at a higher level of aggregated portfolios. If cash flows afterinitial recognition are realized in a way that is different from the Group’s original expectations, theGroup does not change the classification of the remaining financial assets held in that businessmodel, but incorporates such information when assessing newly originated or newly purchasedfinancial assets going forward.
As a second step of its classification process, the Group assesses the contractual terms of financialassets to identify whether they pass the contractual cash flows test (SPPI test). For the purpose of theSPPI test, principal is defined as the fair value of the financial asset at initial recognition and maychange over the life of the financial asset (for example, if there are repayments of principal oramortization of the premium or discount). The most significant elements of interest within a lendingarrangement are typically the consideration for the time value of money and credit risk. In contrast,contractual terms that introduce a more than de minimis exposure to risks or volatility in thecontractual cash flows that are unrelated to a basic lending arrangement do not give rise tocontractual cash flows that are SPPI. In such cases, the financial asset is required to be measured atFVTPL.
Notes:Notes:
MEANINGFUL BANKING
IN THE NEW NORMAL
METROBANK I 2020 Annual Report & Sustainability Report 39 38 METROBANK I 2020 Annual Report & Sustainability Report
- 7 -
*SGVFSM005911*
Financial assets at FVTPLThese are recorded in the statements of financial position at fair value with changes in fair valuerecognized in ‘Trading, securities and foreign exchange gain - net’. Interest earned is recorded in‘Interest Income’ while dividend income is recorded in ‘Dividends’ when the right to receivepayment has been established. Included in this classification are debt and equity securities whichhave been acquired principally for the purpose of selling or repurchasing in the near term.
Derivatives recorded at FVTPLThe Parent Company and some of its subsidiaries are counterparties to derivative contracts, such ascurrency forwards, currency swaps, interest rate swaps (IRS), call options, non-deliverable forwards(NDF) and other interest rate derivatives. These derivatives are entered into as a service to customersand as a means of reducing or managing their respective foreign exchange and interest rateexposures, as well as for trading purposes. Such derivative financial instruments are initiallyrecorded at fair value on the date at which the derivative contract is entered into and are subsequentlyremeasured at fair value. Any gains or losses arising from changes in fair values of derivatives(except those accounted for as accounting hedges) are taken directly to the statement of income andare included in ‘Trading, securities and foreign exchange gain - net’. Derivatives are carried asassets when the fair value is positive and as liabilities when the fair value is negative.
Investment securities at FVOCIInvestment securities at FVOCI include debt and equity securities. After initial measurement,investment securities at FVOCI are subsequently measured at fair value. The unrealized gains andlosses arising from the fair valuation of investment securities at FVOCI are excluded, net of tax asapplicable, from the reported earnings and are included in the statement of comprehensive income as‘Change in net unrealized gain (loss) on investment securities at FVOCI’.
Debt securities at FVOCI are those that meet both of the following conditions: (i) the asset is heldwithin a business model whose objective is to hold the financial assets in order to both collectcontractual cash flows and sell financial assets; and (ii) the contractual terms of the financial assetgive rise on specified dates to cash flow that are SPPI on the outstanding principal amount. Theeffective yield component of debt securities at FVOCI, as well as the impact of restatement onforeign currency-denominated debt securities at FVOCI is reported in the statement of income.Interest earned on holding debt securities at FVOCI are reported as ‘Interest Income’ using theeffective interest rate (EIR) method. When the debt securities at FVOCI are disposed of, thecumulative gain or loss previously recognized in the statement of comprehensive income isrecognized as ‘Trading, securities and foreign exchange gain - net’ in the statement of income. Theexpected credit loss (ECL) arising from impairment of such investments are recognized in OCI witha corresponding charge to ‘Provision for credit and impairment losses’ in the statement of income.
Equity securities designated at FVOCI are those that the Group made an irrevocable election topresent in OCI the subsequent changes in fair value. Dividends earned on holding equity securities atFVOCI are recognized in the statement of income as ‘Dividends’ when the right of the payment hasbeen established, except when the Group benefits from such proceeds as a recovery part of the costof the instrument, in which case, such gains are recorded in OCI. Gains and losses on disposal ofthese equity securities are never recycled to profit or loss, but the cumulative gain or loss previouslyrecognized in the statement of comprehensive income is reclassified to ‘Surplus’ or any otherappropriate equity account upon disposal. Equity securities at FVOCI are not subject to impairmentassessment.
- 8 -
*SGVFSM005911*
Financial assets at amortized costFinancial assets at amortized cost are debt financial assets that meet both of the following conditions:(i) these are held within a business model whose objective is to hold the financial assets in order tocollect contractual cash flows; and (ii) the contractual terms give rise on specified dates to cash flowsthat are SPPI on the outstanding principal amount. This accounting policy relates to the statement offinancial position captions ‘Due from BSP’, ‘Due from other banks’, ‘Interbank loans receivable andSPURA’, ‘Investment securities at amortized cost’ and ‘Loans and receivables’.
After initial measurement, financial assets at amortized cost are subsequently measured at amortizedcost using the EIR method, less impairment in value. Amortized cost is calculated by taking intoaccount any discount or premium on acquisition and fees that are an integral part of the EIR. Theamortization is included in ‘Interest income’ in the statement of income. Gains and losses arerecognized in statement of income when these investments are derecognized or impaired, as well asthrough the amortization process. The ECL are recognized in the statement of income under‘Provision for credit and impairment losses’. The effects of revaluation on foreign currency-denominated investments are recognized in the statement of income.
Financial liabilities at amortized costIssued financial instruments or their components, which are not designated at FVTPL, are classifiedas liabilities under ‘Deposit liabilities’, ‘Bills payable and securities sold under repurchaseagreements (SSURA)’, ‘Bonds payable’, or ‘Subordinated debts’ or other appropriate financialliability accounts, where the substance of the contractual arrangement results in the Group having anobligation either to deliver cash or another financial asset to the holder, or to satisfy the obligationother than by the exchange of a fixed amount of cash or another financial asset for a fixed number ofown equity shares. The components of issued financial instruments that contain both liability andequity elements are accounted for separately, with the equity component being assigned the residualamount after deducting from the instrument as a whole the amount separately determined as the fairvalue of the liability component on the date of issue.
After initial measurement, bills payable and similar financial liabilities not qualified as and notdesignated at FVTPL, are subsequently measured at amortized cost using the EIR method.Amortized cost is calculated by taking into account any discount or premium on the issue and feesthat are an integral part of the EIR.
Financial Guarantees and Undrawn Loan CommitmentsThe Group issues financial guarantees and loan commitments. Financial guarantees are those issuedby the Group to creditors as allowed under existing rules and regulations whereby it guarantees thirdparty obligations by signing as guarantor in the contract/agreement. Undrawn loan commitments andletters of credit are commitments under which over the duration of the commitment, the Group isrequired to provide a loan with pre-specified terms to the customer. The nominal contractual valueof financial guarantees and undrawn loan commitments, where the loan agreed to be provided is onmarket terms, are not recorded in the statement of financial position. These contracts are in the scopeof the ECL requirements where the Group estimates the expected portion of the undrawn loancommitments that will be drawn over their expected life. The ECL related to financial guaranteesand undrawn loan commitments is recognized in ‘Miscellaneous liabilities’ under ‘Other liabilities’.
Notes:Notes:
MEANINGFUL BANKING
IN THE NEW NORMAL
METROBANK I 2020 Annual Report & Sustainability Report 41 40 METROBANK I 2020 Annual Report & Sustainability Report
- 9 -
*SGVFSM005911*
Derecognition of Financial Assets and Financial LiabilitiesFinancial assetsA financial asset (or, where applicable, a part of a financial asset or part of a group of financialassets) is derecognized when: the rights to receive cash flows from the asset have expired; or the Group retains the right to receive cash flows from the asset, but has assumed an obligation to
pay them in full without material delay to a third party under a “pass-through” arrangement; or the Group has transferred its rights to receive cash flows from the asset and either (a) has
transferred substantially all the risks and rewards of the asset, or (b) has neither transferred norretained the risks and rewards of the asset but has transferred the control of the asset.
Where the Group has transferred its rights to receive cash flows from an asset or has entered into apass-through arrangement, and has neither transferred nor retained substantially all the risks andrewards of the asset nor transferred control of the asset, the asset is recognized to the extent of theGroup’s continuing involvement in the asset. The extent of the Group’s continuing involvement inthe transferred asset is the extent to which it is exposed to changes in the value of the transferredasset. When the Group’s continuing involvement takes the form of guaranteeing the transferredasset, the extent of the Group’s continuing involvement is the lower of (i) the amount of the asset and(ii) the maximum amount of the consideration received that the Group could be required to repay(‘the guarantee amount’). When the Group’s continuing involvement takes the form of a written orpurchased option (or both) on the transferred asset, the extent of the Group’s continuing involvementis the amount of the transferred asset that the Group may repurchase. However, in case of a writtenput option to an asset that is measured at fair value, the extent of the Group’s continuing involvementis limited to the lower of the fair value of the transferred asset and the option exercise price. Whenthe Group’s continuing involvement takes the form of a cash-settled option or similar provision onthe transferred asset, the extent of the Group’s continuing involvement is measured in the same wayas that which results from non-cash settled options.
The Group derecognizes a financial asset such as a loan to a customer, when the terms and conditionshave been renegotiated to the extent that, substantially, it becomes a new loan, with the differencerecognized as a derecognition gain or loss, to the extent that an impairment loss has not already beenrecorded. The newly recognized loans are classified as Stage 1 for ECL measurement purposes,unless the new loan is deemed to be POCI.
When assessing whether or not to derecognize a loan to a customer, amongst others, the Groupconsiders the following factors: Change in currency of the loan Introduction of an equity feature Change in counterparty If the modification is such that the instrument would no longer meet the SPPI criterion
If the modification does not result in cash flows that are substantially different as set out below, themodification does not result in derecognition. Based on the change in cash flows discounted at theoriginal EIR, the Group records a modification gain or loss, to the extent that an impairment loss hasnot already been recorded. The Group considers a modification substantial based on qualitativefactors.
Financial assets are written off either partially or in their entirety only when the Group has stoppedpursuing the recovery. If a write-off is later recovered, any amounts formerly charged are credited to‘Recovery on Charged-off Assets’ under ‘Miscellaneous Income’ in the statements of income.
- 10 -
*SGVFSM005911*
Financial liabilitiesA financial liability is derecognized when the obligation under the liability is discharged, cancelledor has expired. Where an existing financial liability is replaced by another from the same lender onsubstantially different terms, or the terms of an existing liability are substantially modified, such anexchange or modification is treated as a derecognition of the original liability and the recognition of anew liability, and the difference in the respective carrying amounts is recognized in the statement ofincome.
The Group considers a modification substantial based on qualitative factors and if it results in adifference between the adjusted discounted present value and the original carrying amount of thefinancial liability of or greater than ten percent.
Similar with financial assets, when the modification of a financial liability is not consideredsubstantial, the Group records a modification gain or loss based on the change in cash flowsdiscounted at the original EIR.
Repurchase and reverse repurchase agreementsSecurities sold under agreements to repurchase at a specified future date (‘repos’) are notderecognized from the statement of financial position. The corresponding cash received, includingaccrued interest, is recognized in the statement of financial position as SSURA included in ‘Billspayable and SSURA’ and is considered as a loan to the Group, reflecting the economic substance ofsuch transaction.
Conversely, securities purchased under agreements to resell at a specified future date (‘reverserepos’) are not recognized in the statement of financial position. The corresponding cash paidincluding accrued interest, is recognized in the statement of financial position as SPURA, and isconsidered a loan to the counterparty. The difference between the purchase price and resale price istreated as interest income and is accrued over the life of the agreement using the EIR method.
Reclassification of Financial AssetsThe Group reclassifies its financial assets when there is a change in its business model for managingfinancial assets. A change in business model occurs when the Group either begins or ceases toperform an activity that is significant to its operations. The Group applies the reclassificationprospectively from the reclassification date (i.e. the first day of the next quarterly reporting periodfollowing the change in business model) and does not restate any previously recognized gains, lossesor interest.
Impairment of Financial AssetsThe adoption of PFRS 9 has changed the Group’s loss impairment method on financial assets byreplacing the previous incurred loss approach with a forward-looking ECL approach which covers allloans and other debt financial assets not held at FVTPL, together with loan commitments andfinancial guarantee contracts.
Overview of the ECL principlesECL represents credit losses that reflect an unbiased and probability weighted amount which is basedon reasonable and supportable information about past events, current conditions and forecasts offuture economic conditions, and time value of money. The ECL allowance is based on the creditlosses expected to arise on a 12-month duration if there has been no SICR of the financial asset sinceorigination. Otherwise if a SICR is observed, then the ECL estimation is extended until the end ofthe life of the financial asset. The 12-month ECL represents the losses that result from default eventson a financial asset which may happen within 12 months after the reporting date. The Lifetime ECLon the other hand represents the losses that result from default events on a financial asset which may
Notes:Notes:
MEANINGFUL BANKING
IN THE NEW NORMAL
METROBANK I 2020 Annual Report & Sustainability Report 43 42 METROBANK I 2020 Annual Report & Sustainability Report
- 11 -
*SGVFSM005911*
happen over its life. Both Lifetime ECLs and 12-month ECLs are calculated on either an individualbasis or a collective basis, depending on the nature of the underlying portfolio of financialinstruments.
The major portfolios of financial assets identified upon initial analysis of the Group’s credit exposureare loan receivables, treasury accounts, and other receivables. Loan receivables may be availed byspecific individuals, corporations or organizations. Hence, these portfolios can be further segmentedto commercial and consumer portfolios. After segmentation, financial assets are grouped intoStage 1, Stage 2, and Stage 3 as described below.
Definition of “default” and “cure”The Group defines a financial instrument as in default, which is fully aligned with the definition ofnon-performing loans i.e. credit impaired, in all cases when the borrower becomes more than 90 days(more than 30 days in 2018) past due on its contractual payments. As a part of a qualitativeassessment of whether a customer is in default, the Group also considers a variety of instances thatmay indicate unlikeliness to pay. When such events occur, the Group carefully considers whether theevent should result in treating the customer as defaulted. An instrument is considered to be no longerin default (i.e. to have cured) when it no longer meets any of the default criteria and has exhibited asatisfactory track record.
Treasury exposures are considered in default upon occurrence of a credit event such as but notlimited to bankruptcy of counterparty, restructuring, failure to pay on agreed settlement date, orrequest for moratorium.
SICRIn order to determine whether an instrument is subject to 12-month or Lifetime ECL, the Groupassesses whether there has been a SICR since initial recognition. The criteria for determiningwhether credit risk has increased significantly vary by portfolio and include quantitative andqualitative factors. The credit risk of a particular exposure is deemed to have increased significantlysince initial recognition if, based on the Group’s internal credit assessment, the borrower orcounterparty is determined to have well-defined credit weaknesses (i.e. with internal credit rating of6 due to financial or repayment concerns or lower). These may include adverse trends ordevelopments of financial, managerial, economic or political nature, or a significant weakness incollateral. Credit weakness may be manifested by unfavorable record or unsatisfactorycharacteristics or may only be potential that deserves management’s close attention and may lead tosignificant losses or may result in collection or liquidation of the outstanding loan amount to behighly improbable. For exposures without internal credit grades, if contractual payments are morethan 30 days past due, the credit risk is deemed to have increased significantly since initialrecognition. Days past due are determined by counting the number of days since the earliest elapseddue date in respect of which full payment has not been received. In subsequent reporting periods, ifthe credit risk of the financial asset improves over an observable period such that there is no longer aSICR since initial recognition, the Group shall revert to recognizing a 12-month ECL.
Staging assessmentFor non-credit-impaired financial assets: Stage 1 is comprised of all non-impaired financial assets which have not experienced a SICR
since initial recognition. The Group recognizes a 12-month ECL for Stage 1 financial assets. Stage 2 is comprised of all non-impaired financial assets which have experienced a SICR since
initial recognition. The Group recognizes a lifetime ECL for Stage 2 financial assets.
- 12 -
*SGVFSM005911*
For credit-impaired financial assets: Financial assets are classified as Stage 3 when there is objective evidence of impairment as a
result of one or more loss events that have occurred after initial recognition with a negativeimpact on the estimated future cash flows of a financial asset or a portfolio of financial assets.ECL for Stage 3 exposure are computed on a per account, taking into consideration the presentvalue of the expected recoverable cash flows from each transaction.
Financial assets that are credit-impaired on initial recognition are classified as purchased ororiginated credit-impaired (POCI) assets. These are recorded at fair value at original recognition andinterest income is subsequently recognized based on a credit-adjusted EIR. ECL is only recognizedor released to the extent that there is a subsequent change in the ECLs.
Assessment of ECL on a collective basisThe Group calculates ECL either on an individual or a collective basis. The Group performscollective impairment by grouping exposures into smaller homogenous portfolios based on acombination of borrower and account characteristics. Accounts with similar risk attributes (i.e.facility, security, credit rating, months-on-books, utilization and collateral type, etc.) are pooledtogether for calculating provisions based on the ECL models.
ECL parameters and methodologiesECL is a function of the probability of default (PD), exposure-at-default (EAD), and loss-givendefault (LGD), with the timing of the loss also considered, and is estimated by incorporatingforward-looking economic information and through the use of experienced credit judgement.
The PD represents the likelihood that a credit exposure will not be repaid and will go into default ineither a 12-month horizon for Stage 1 or lifetime horizon for Stage 2. The PD for each individualfinancial asset is modelled based on historical data and is estimated based on current marketconditions and reasonable and supportable information about future economic conditions. TheGroup segmented its credit exposures based on homogenous risk characteristics and developed acorresponding PD methodology for each portfolio. The PD methodology for each relevant portfoliois determined based on the underlying nature or characteristic of the portfolio, behavior of theaccounts and materiality of the segment as compared to the total portfolio.
EAD consists of the amortized cost and any accrued interest receivable. For off-balance sheet andundrawn committed amounts, EAD includes a credit conversion factor which is an estimate of anyfurther amount to be drawn at the time of default. For the credit card business, which was mergedwith the Parent Company in 2020, EAD is modelled based on historical data on card limit utilization.
LGD is the amount that may not be recovered in the event of default and is modelled based onhistorical cash flow recovery and reasonable and supportable information about future economicconditions, where appropriate. LGD takes into consideration the amount and quality of any collateralheld.
The Group applies a simplified ECL approach for its accounts receivables wherein the Group uses aprovisioning matrix that considers historical changes in the behavior of the portfolio to predictconditions over the span of a given observation period.
The Parent Company offers credit card facilities (previously under MCC), in which it has the right tocancel and/or reduce the facilities with one-day notice. It does not limit its exposure to credit lossesto the contractual notice period, but instead, calculates ECL over a period that reflects itsexpectations of the customers’ behavior, their likelihood of default, and its future risk mitigationprocedures, which could include reducing or cancelling the facilities. Based on past experience and
Notes:Notes:
MEANINGFUL BANKING
IN THE NEW NORMAL
METROBANK I 2020 Annual Report & Sustainability Report 45 44 METROBANK I 2020 Annual Report & Sustainability Report
- 13 -
*SGVFSM005911*
expectations, the period over which ECL is calculated for these products is two years. The interestrate used to discount the ECL for credit cards is based on contractual interest rate. These rates arealso used to discount future recoveries over a period of five years as these cover the cost of securingan equivalent fund. The contractual interest rate is used as discounting factor since the ParentCompany estimates that this rate is reflective of the EIR.
Forward-looking informationThe Group incorporates forward-looking information into both its assessment of whether the creditrisk of a financial asset has increased significantly since its initial recognition and its measurement ofECL. A broad range of forward-looking information are considered as economic inputs, such asgrowth of the gross domestic product, inflation rates, unemployment rates, interest rates and BSPstatistical indicators. The inputs and models used for calculating ECL may not always capture allcharacteristics of the market at the date of the financial statements. To reflect this, qualitativeadjustments or overlays are occasionally made as temporary adjustments when such differences aresignificantly material.
In 2019, after model reviews and validation, the Parent Company relied on the following aseconomic inputs in measuring ECL: Treasury Bill (T-Bill) Rates Philippine Stock Exchange (PSE) All Shares Index GDP growth External debt PSE Financials Index GDP Financial intermediation Government expenditure
In 2020, the Parent Company expanded its set of macroeconomic overlays to better capture thecharacteristics of specific financial asset classes (e.g. mortgage and auto loan exposures) and industryclusters (e.g. essential industries, secondary needs). The following economic inputs were determinedto be statistically significant in measuring ECL: GDP Growth Inflation rate Unemployment rate Minimum wage USDPHP exchange rate Unified R2-BV ALWTI Crude Oil Price Consumer confidence index
Debt investment securities measured at FVOCIThe ECL for debt securities at FVOCI do not reduce the carrying amount of these financial assets inthe statement of financial position, which remains at fair value. Instead, an amount equal to theallowance that would arise if the assets were measured at amortized cost is recognized in ‘Netunrealized gain (loss) on investment securities at FVOCI’ as an accumulated impairment amount,with a corresponding charge to profit or loss. The accumulated loss recognized in OCI is recycled toprofit or loss upon derecognition of these financial assets.
- 14 -
*SGVFSM005911*
Restructured LoansWhere possible, the Group seeks to restructure loans rather than to take possession of collateral. Thismay involve extending the payment arrangements and the agreement of new loan conditions. Oncethe terms have been renegotiated, the loan is no longer considered past due. Managementcontinuously reviews and monitors restructured loans until derecognition to ensure that all criteria aremet and that future payments are likely to occur. The loans continue to be subject to an individual orcollective impairment assessment, calculated using the loan’s original EIR. The difference betweenthe recorded value of the original loan and the present value of the restructured cash flows,discounted at the original EIR, is recognized in ‘Provision for credit and impairment losses’ in thestatement of income. When the loan has been restructured but not derecognized, the Group alsoreassesses whether there has been a SICR and considers whether the assets should be classified asStage 3. If the restructuring terms are substantially different, the loan is derecognized and a new‘asset’ is recognized at fair value using the revised EIR.
Collateral Valuation of Financial AssetsCollateral, unless repossessed, is not recorded in the Group’s statement of financial position.However, the fair value of collateral affects the calculation of ECLs. It is generally assessed, at aminimum, at inception and re-assessed every other year. However, some collaterals, for example,cash or securities relating to margining requirements, are valued daily.
Revenue RecognitionRevenue from contracts with customers is recognized upon transfer of services to the customer at anamount that reflects the consideration to which the Group expects to be entitled in exchange for thoseservices.
The Group assesses its revenue arrangements against specific criteria in order to determine if it isacting as a principal or agent. The Group concluded that it is acting as a principal in all of itsrevenue arrangements except for certain brokerage transactions. The following specific recognitioncriteria must also be met before revenue is recognized.
Fee and commission incomeThe Group earns fee and commission income from a diverse range of services it provides to itscustomers, which are divided into the following two categories:
a. Fee income earned from services that are provided over a certain period of timeFees earned for the provision of services over a period of time are accrued over that period as thecustomer simultaneously receives and consumes the benefits provided by the Group. Using anoutput method, revenue is recognized if the Group has a right to invoice the customer forservices directly corresponding to performance completed to date. These fees include investmentfund fees, custodian fees, fiduciary fees, asset management fees, and income from trustoperations.
b. Fee income from providing transaction servicesFees arising from negotiating or participating in the negotiation of a transaction for a third party -such as commission income, underwriting fees, corporate finance fees, advisory fees andbrokerage fees for the arrangement of the acquisition of shares or other securities or the purchaseor sale of businesses are recognized on completion of the underlying transaction. Fees orcomponents of fees that are linked to a certain performance are recognized after fulfilling thecorresponding criteria.
Notes:Notes:
MEANINGFUL BANKING
IN THE NEW NORMAL
METROBANK I 2020 Annual Report & Sustainability Report 47 46 METROBANK I 2020 Annual Report & Sustainability Report
- 15 -
*SGVFSM005911*
Discounts earned, membership fees and awards revenue on credit cardsThe following table provides information about the nature and timing of the satisfaction ofperformance obligations for the Parent Company’s credit card business (under MCC prior to merger -see Note 11), including significant payment terms, and the related revenue recognition policies.
Type ofproduct/service
Nature and timing of satisfaction of performanceobligations, including significant payment terms
Revenue recognitionunder PFRS 15
Discounts earned Charges arising from credit availments by the ParentCompany’s and other credit companies’ cardholders whenthe Parent Company is acting as an acquirer. Thesediscounts are computed based on certain agreed rates.These also include interchange income from transactionsprocessed by other acquirers through VISA andMastercard and fees from cash advance transactions ofcardholders.
Recognized as revenue upon receipt from memberestablishments of charges arising from credit availmentsby the Parent Company’s cardholders and other creditcompanies’ cardholders when the Parent Company isacting as an acquirer.
Membership feesand dues
Periodically charged to cardholders upfront. Deferred and recorded under ‘Deferred revenue’ andrecognized on a straight-line basis over the period thefee entitles the cardholders to use the card.
Awards revenue The Parent Company operates a loyalty points program,which allows customers to accumulate points when theypurchase from member establishments using the issuedcard of the Parent Company. The points accumulate anddo not expire.
The Parent Company allocates a portion of theconsideration received from discounts earned andinterchange fees from credit cards to the reward pointsbased on the estimated stand-alone selling prices. Theamount allocated to the loyalty program is deferred, andis recognized as revenue when loyalty points areredeemed or the likelihood of the customer redeemingthe loyalty points becomes remote.
Revenues outside the scope of PFRS 15Interest incomeFor all financial instruments measured at amortized cost and interest-bearing financial instrumentsclassified as investment securities at FVOCI investments, interest income is recorded at the EIR,which is the rate that exactly discounts estimated future cash receipts through the expected life of thefinancial instrument or a shorter period, where appropriate, to the net carrying amount of thefinancial asset. The calculation takes into account all contractual terms of the financial instrument(for example, prepayment options), including any fees or incremental costs that are directlyattributable to the instrument and are an integral part of the EIR. The adjusted carrying amount iscalculated based on the original EIR. The change in carrying amount is recorded as ‘Interestincome’. Loan commitment fees that are likely to be drawn down are deferred (together with anyincremental costs) and recognized as an adjustment to the EIR of the loan.
Under PFRS 9, when a financial asset becomes credit-impaired and is, therefore, regarded as Stage 3(as discussed in “Impairment of Financial Assets” above), the Group calculates interest income byapplying the EIR to the net amortized cost of the financial asset. If the financial asset cures and is nolonger credit-impaired, the Group reverts to calculating interest income on a gross basis.
Purchases by credit cardholders, collectible on an installment basis, are recorded at the cost of theitems purchased plus a certain percentage of cost. The excess over cost is credited to ‘Unearneddiscount’ and is shown as a deduction from ‘Loans and receivables’ in the consolidated statement offinancial position. The unearned discount is taken up to interest income over the installment termsand is computed using the EIR method.
Recovery on charged-off assetsIncome arising from collections on accounts or recoveries from impairment of items previouslywritten off are recognized in the year of recovery.
- 16 -
*SGVFSM005911*
Leasing income - Finance leaseThe excess of aggregate lease rentals plus the estimated residual value over the cost of the leasedequipment constitutes the unearned lease income. Residual values represent estimated proceeds fromthe disposal of equipment at the time lease is estimated. The unearned lease income is amortizedover the term of the lease, commencing on the month the lease is executed using the EIR method.
Dividend incomeDividend income is recognized when the Group’s right to receive payment is established.
Gain on disposal of investment securities at amortized costResults arising from gains and losses from disposal of investment securities at amortized cost.
Trading and securities gain - netResults arising from trading activities include all gains and losses from changes in fair value forfinancial assets and financial liabilities at FVTPL and gains and losses from disposal of debtsecurities at FVOCI.
Rental incomeRental income arising on leased properties is accounted for on a straight-line basis over the leaseterms on ongoing leases and is recorded in the statement of income under ‘Leasing’.
Income on direct financing leases and receivables financedIncome on loans and receivables financed with short-term maturities is recorded in ‘Interest income’and is recognized using the EIR method. Interest and finance fees on finance leases and loans andreceivables financed with long-term maturities and the excess of the aggregate lease rentals plus theestimated terminal value of the leased equipment over its cost are credited to unearned discount andamortized over the term of the note or lease using the EIR method.
Gain on sale of investment in associateUpon loss of significant influence over an associate, the Group measures and recognizes any retainedinvestment at its fair value. Any difference between the carrying amount of the associate upon lossof significant influence and the fair value of the retained investment and proceeds from disposal isrecognized in profit or loss.
Gain on sale of non-current asset held for saleThe gain or loss arising from the sale of non-current asset held for sale is included in profit or losswhen the item is derecognized. The gain or loss arising from the derecognition of non-current assetheld for sale is determined as the difference between the net disposal proceeds and its carryingamount on the date of the transaction.
Cash and Cash EquivalentsFor purposes of reporting cash flows, cash and cash equivalents include cash and other cash items,amounts due from BSP and other banks, and interbank loans receivable and SPURA with originalmaturities of three months or less from dates of placements and that are subject to insignificant riskof changes in value.
Property and EquipmentLand is stated at cost less any impairment in value and depreciable properties including buildings,furniture, fixtures and equipment and leasehold improvements are stated at cost less accumulateddepreciation and amortization, and any impairment in value. Such cost includes the cost of replacingpart of the property and equipment when that cost is incurred, if the recognition criteria are met butexcludes repairs and maintenance costs. Building under construction (BUC) is stated at cost and
Notes:Notes:
MEANINGFUL BANKING
IN THE NEW NORMAL
METROBANK I 2020 Annual Report & Sustainability Report 49 48 METROBANK I 2020 Annual Report & Sustainability Report
- 17 -
*SGVFSM005911*
includes cost of construction and other direct costs. BUC is not depreciated until such time that therelevant asset is completed and put into operational use.
Depreciation is calculated on the straight-line method over the estimated useful life of thedepreciable assets. Leasehold improvements are amortized over the shorter of the terms of thecovering leases and the estimated useful lives of the improvements. The range of estimated usefullives of property and equipment follows:
Buildings 25 to 50 yearsFurniture, fixtures and equipment 2 to 5 yearsLeasehold improvements 5 to 20 years
The depreciation and amortization method and useful life are reviewed periodically to ensure that themethod and period of depreciation and amortization are consistent with the expected pattern ofeconomic benefits from items of property and equipment.
An item of property and equipment is derecognized upon disposal or when no future economicbenefits are expected from its use or disposal. Any gain or loss arising on derecognition of the asset(calculated as the difference between the net disposal proceeds and the carrying amount of the asset)is included in the statement of income under ‘Profit from assets sold’ in the year the asset isderecognized.
Investments in Subsidiaries, Associates and a Joint Venture (JV)Investment in subsidiariesSubsidiaries pertain to all entities over which the Group has control. Control is achieved when theGroup is exposed, or has rights, to variable returns from its involvement with the investee and has theability to affect those returns through its power over the investee. When the Group has less than amajority of the voting or similar rights of an investee, the Group considers all relevant facts andcircumstances in assessing whether it has power over an investee, including: the contractual arrangement with the other vote holders of the investee; rights arising from other contractual arrangements; and the Group’s voting rights.
Investment in associatesAssociates pertain to all entities over which the Group and the Parent Company have significantinfluence. Significant influence is the power to participate in the financial and operating policydecisions of the investee, but is not control or joint control over those policies. Investment inassociates is accounted for under the equity method of accounting.
Investment in a JVA JV is a type of joint arrangement whereby the parties that have joint control of the arrangementhave rights to the net assets of the JV. Joint control is the contractually agreed sharing of control ofan arrangement, which exists only when decisions about the relevant activities require unanimousconsent of the parties sharing control. Investment in a JV is accounted for under the equity methodof accounting. The Group’s investment in a JV represents the 30% interest of PSBank in SumishoMotor Finance Corporation (SMFC) (Note 11).
Upon loss of significant influence over the associate or joint control over the JV, the Group and theParent Company measure and recognize any retained investment at its fair value. Any differencebetween the carrying amount of the associate or JV upon loss of significant influence or joint control
- 18 -
*SGVFSM005911*
and the fair value of the retained investment and proceeds from disposal is recognized in thestatement of income.
Under the equity method, investments in associates and a JV are carried in the statement of financialposition at cost plus post-acquisition changes in the Group’s and the Parent Company’s share of thenet assets of the associate or JV less any impairment in value. Post-acquisition changes in the shareof net assets of the associate or a JV include the share in the: (a) income or losses; and (b) unrealizedgain or loss on investment securities, remeasurement of retirement plans and others. Dividendsreceived are treated as a reduction in the carrying values of the investments. Goodwill relating to theassociate and a JV is included in the carrying value of the investment and is not amortized. When theGroup and the Parent Company increase its ownership interest in an associate or a JV that continuesto be accounted for under the equity method, the cost for the additional interest is added to theexisting carrying amount of the associate or JV and the existing interest in the associate or JV is notremeasured. The share in an associate or a JV’s post-acquisition profits or losses is recognized in thestatement of income as ‘Share in net income of subsidiaries, associates and a joint venture’ while itsshare of post-acquisition movements in the associate or JV’s equity reserves is recognized directly inthe statement of comprehensive income. When the share of losses in an associate or a JV equals orexceeds its interest in the associate or JV, including any other unsecured receivables, the Group andthe Parent Company do not recognize further losses, unless it incurred obligations or made paymentson behalf of the associate or JV which is recognized as miscellaneous liabilities. Profits and lossesresulting from transactions between the Group or the Parent Company and an associate or JV areeliminated to the extent of the Group or the Parent Company’s interest in the associate or JV.
Investments in subsidiaries in the separate financial statements are accounted for under the equitymethod similarly as investments in associates and JV. Equity in other comprehensive income(losses) of subsidiaries and changes therein are included in remeasurement losses on retirement plan,net unrealized gain on investment securities at FVOCI, and translation adjustments and others asappropriate together with the Parent Company in the separate statement of financial position andstatement of comprehensive income.
Investment PropertiesInvestment properties are measured initially at cost, including transaction costs. An investmentproperty acquired through an exchange transaction is measured at fair value of the asset acquiredunless the fair value of such an asset cannot be measured in which case the investment propertyacquired is measured at the carrying amount of asset given up. The difference between the fair valueof the asset received and the carrying amount of the asset given up is recorded as ‘Gain on initialrecognition of investment properties’ under ‘Miscellaneous income’. Foreclosed properties areclassified under ‘Investment properties’ upon: a.) entry of judgment in case of judicial foreclosure;b.) execution of the Sheriff’s Certificate of Sale in case of extra-judicial foreclosure; orc.) notarization of the Deed of Dacion in case of dation in payment (dacion en pago). Subsequent toinitial recognition, investment properties are carried at cost less accumulated depreciation (fordepreciable investment properties) and impairment in value.
Investment properties are derecognized when they have either been disposed of or when theinvestment property is permanently withdrawn from use and no future benefit is expected from itsdisposal. Any gains or losses on the retirement or disposal of an investment property are recognizedin the statement of income under ‘Profit from assets sold’ in the year of retirement or disposal.
Expenditures incurred after the investment properties have been put into operations, such as repairsand maintenance costs, are normally charged to operations in the year in which the costs are incurred.Depreciation is calculated on a straight-line basis using the remaining useful lives from the time of
Notes:Notes:
MEANINGFUL BANKING
IN THE NEW NORMAL
METROBANK I 2020 Annual Report & Sustainability Report 51 50 METROBANK I 2020 Annual Report & Sustainability Report
- 19 -
*SGVFSM005911*
acquisition of the investment properties based on appraisal reports but not to exceed 50 years forbuildings and condominium units.
Transfers are made to investment properties when, and only when, there is a change in use evidencedby ending of owner occupation, commencement of an operating lease to another party or ending ofconstruction or development. Transfers are made from investment properties when, and only when,there is a change in use evidenced by commencement of owner occupation or commencement ofdevelopment with a view to sale.
Interest in Joint OperationsThe Group is a party to joint operations whereby it contributed parcels of land for development intoresidential and commercial units. In respect of the Group’s interest in the joint operations, the Grouprecognizes the following: (a) the assets that it controls and the liabilities that it incurs; and (b) theexpenses that it incurs and its share of the income that it earns from the sale of units by the jointoperations. The assets contributed to the joint operations are measured at the lower of cost or netrealizable value. Net realizable value is the estimated selling price in the ordinary course of businessless estimated costs necessary to make the sale (Note 14).
Chattel Mortgage PropertiesChattel mortgage properties comprise of repossessed vehicles. Chattel mortgage properties are statedat cost less accumulated depreciation and impairment in value. Depreciation is calculated on astraight-line basis using the remaining useful lives from the time of acquisition of the vehicles. Theuseful lives of chattel mortgage properties are estimated to be five years.
Subordinated NotesSubordinated notes issued by Special Purpose Vehicles (SPV) (presented as ‘Investment in SPVs’under ‘Other assets’) are stated at amortized cost reduced by an allowance for credit losses. Theallowance for credit losses is determined based on the difference between the outstanding principalamount and the recoverable amount which is the present value of the future cash flow expected to bereceived as payment for the subordinated notes.
Intangible AssetsSoftware costsSoftware costs (presented under ‘Other assets’) are capitalized on the basis of the cost incurred toacquire and bring to use the specific software. These costs are amortized over three to five years on astraight-line basis. Costs associated with maintaining the computer software programs arerecognized as expense when incurred. Software costs are carried at cost less accumulatedamortization.
Exchange trading rightExchange trading right (included in ‘Miscellaneous assets’ presented under ‘Other assets’) is a resultof the PSE conversion plan to preserve access of First Metro Securities Brokerage Corporation(FMSBC), a subsidiary of FMIC, to the trading facilities and continue transacting business in thePSE. The exchange trading right has an indefinite useful life as there is no foreseeable limit to theperiod over which this asset is expected to generate net cash inflows. It is carried at the amountallocated from the original cost to the exchange membership seat (after a corresponding allocationwas made to the value of the PSE shares) less any allowance for impairment losses. FMSBC doesnot intend to sell the exchange trading right in the near future.
- 20 -
*SGVFSM005911*
GoodwillGoodwill acquired in a business combination is initially measured at cost being the excess of the costof the business combination over the Group’s interest in the net fair value of the acquiree’sidentifiable assets, liabilities and contingent liabilities. With respect to investments in associates anda JV, goodwill is included in the carrying amounts of the investments. Following initial recognition,goodwill is measured at cost net of impairment losses (see accounting policy on “Impairment ofNon-financial Assets”).
Customized System Development CostCustomized system development cost consists of payments for customization of various bankingsystems. This account will be reclassified to appropriate accounts upon completion and will bedepreciated and amortized from the time the asset is ready for its intended use (Note 14).
Impairment of Non-financial AssetsProperty and equipment, investments in subsidiaries, associates and a JV, investment properties,chattel mortgage properties, intangible assets with finite useful lives and other assetsAt each statement of financial position date, the Group assesses whether there is any indication thatits non-financial assets may be impaired. When an indicator of impairment exists or when an annualimpairment testing for an asset is required, the Group makes a formal estimate of recoverableamount. Recoverable amount is the higher of an asset’s fair value less costs to sell (FVLCTS) and itsvalue in use (VIU) and is determined for an individual asset, unless the asset does not generate cashinflows that are largely independent of those from other assets or groups of assets, in which case therecoverable amount is assessed as part of the cash generating unit to which it belongs. Where thecarrying amount of an asset exceeds its recoverable amount, the asset is considered impaired and iswritten down to its recoverable amount. In assessing VIU, the estimated future cash flows arediscounted to their present value using a pre-tax discount rate that reflects current marketassessments of the time value of money and the risks specific to the asset. An impairment loss ischarged to operations in the year in which it arises.
An assessment is made at each statement of financial position date as to whether there is anyindication that previously recognized impairment losses may no longer exist or may have decreased.If such indication exists, the recoverable amount is estimated. A previously recognized impairmentloss is reversed only if there has been a change in the estimates used to determine the asset’srecoverable amount since the last impairment loss was recognized. If that is the case, the carryingamount of the asset is increased to its recoverable amount. That increased amount cannot exceed thecarrying amount that would have been determined, net of depreciation and amortization, had noimpairment loss been recognized for the asset in prior years. Such reversal is recognized in thestatement of income. After such a reversal, the depreciation and amortization expense is adjusted infuture years to allocate the asset’s revised carrying amount, less any residual value, on a systematicbasis over its remaining life.
Intangible assets with indefinite useful lives and customized system development cost not yetavailable for useIntangible assets with indefinite useful lives such as exchange trading right and customized systemdevelopment cost not yet available for use are tested for impairment annually at statement offinancial position date either individually or at the cash generating unit level, as appropriate.
GoodwillGoodwill is reviewed for impairment, annually or more frequently if events or changes incircumstances indicate that the carrying value may be impaired. Impairment is determined forgoodwill by assessing the recoverable amount of the cash generating unit (CGU) (or group of CGUs)to which the goodwill relates. Where the recoverable amount of the CGU (or group of CGUs) is less
Notes:Notes:
MEANINGFUL BANKING
IN THE NEW NORMAL
METROBANK I 2020 Annual Report & Sustainability Report 53 52 METROBANK I 2020 Annual Report & Sustainability Report
- 21 -
*SGVFSM005911*
than the carrying amount of the CGU (or group of CGUs) to which goodwill has been allocated, animpairment loss is recognized immediately in the statement of income. The Group uses the higher ofFVLCTS and VIU using cash flow projections from financial budgets approved by seniormanagement in determining the recoverable amount.
LeasesGroup as lesseePolicies applicable beginning January 1, 2019The Group assesses at contract inception whether a contract is, or contains a lease. A contractcontains a lease if it conveys the right to control the use of an identified asset for a period of time inexchange for consideration. The Group applies a single recognition and measurement approach forall leases, except for short-term leases and leases of low-value assets. The Group recognizes leaseliabilities to make lease payments and ROU assets representing the right-of-use the underlying assets.
ROU assetsThe Group recognizes ROU assets (included in ‘Property and Equipment’) at the commencementdate of the lease (i.e. the date the underlying asset is available for use). ROU assets are measured atcost less any accumulated depreciation and impairment losses, and adjusted for any remeasurementof lease liabilities. The cost of ROU assets includes the amount of lease liabilities recognized andlease payments made at or before the commencement date less any lease incentives received. ROUassets are depreciated on a straight line basis over the shorter of the lease term and the estimateduseful lives of the assets, as follows:
Office space 1 to 29 yearsATM site and equipment 1 to 5 years
Lease liabilitiesAt the commencement date of the lease, the Group recognizes lease liabilities measured at thepresent value of lease payments to be made over the lease term. In calculating the present value oflease payments, the Group uses its incremental borrowing rate at the lease commencement datebecause the interest rate implicit in the lease is not readily determinable. After the commencementdate, the amount of lease liabilities is increased to reflect the accretion of interest (included in‘Interest expense on bills payable and SSURA, bonds payable, subordinated debt and others) andreduced for the lease payments made. In addition, the carrying amount of lease liabilities isremeasured if there is a modification, a change in the lease term or a change in the lease payments.
The Group’s lease liabilities are included in Other Liabilities (Note 21).
Short-term leases and leases of low-value assetsThe Group applies the short-term lease recognition exemption to its short-term leases of office spacesand ATM sites (i.e., those leases that have a lease term of 12 months or less from the commencementdate and do not contain a purchase option). It also applies the lease of low-value assets recognitionexemption to leases of ATM site and other equipment that are considered to be of low value (i.e.,those with value of less than P=250,000). Lease payments on short-term leases of low-value assets arerecognized as expense on a straight-line basis over the lease term.
Residual value of leased assets and deposits on lease contractsThe residual value of leased assets, which approximates the amount of guaranty deposit paid by thelessee at the inception of the lease, is the estimated proceeds from the sale of the leased asset at theend of the lease term. At the end of the lease term, the residual value of the leased asset is generallyapplied against the guaranty deposit of the lessee when the lessee decides to buy the leased asset.
- 22 -
*SGVFSM005911*
Policies applicable prior to January 1, 2019The determination of whether an arrangement is, or contains a lease is based on the substance of thearrangement and requires an assessment of whether the fulfillment of the arrangement is dependenton the use of a specific asset or assets and the arrangement conveys a right to use the asset. Areassessment is made after inception of the lease only if one of the following applies:(a) there is a change in contractual terms, other than a renewal or extension of the arrangement;(b) a renewal option is exercised or extension granted, unless that term of the renewal or extension
was initially included in the lease term;(c) there is a change in the determination of whether fulfillment is dependent on a specified asset; or(d) there is a substantial change to the asset.
Where a reassessment is made, lease accounting shall commence or cease from the date when thechange in circumstances gives rise to the reassessment for scenarios (a), (c) or (d) above, and at thedate of renewal or extension period for scenario (b).
Finance leases, which transfer to the Group substantially all the risks and benefits incidental to theownership of the leased item, are capitalized at the inception of the lease at the fair value of theleased property or, if lower, at the present value of the minimum lease payments and included in‘Property and equipment’ with the corresponding liability to the lessor included in ‘Other liabilities’.Lease payments are apportioned between the finance charges and reduction of the lease liability so asto achieve a constant rate of interest on the remaining balance of the liability. Finance charges arerecorded directly to ‘Interest expense’.
Capitalized leased assets are depreciated over the shorter of the estimated useful lives of the assets orthe respective lease terms, if there is no reasonable certainty that the Group will obtain ownership bythe end of the lease term.
Leases where the lessor retains substantially all the risk and benefits of ownership of the assets areclassified as operating leases. Operating lease payments are recognized as an expense in thestatement of income under ‘Occupancy and equipment-related cost’ on a straight-line basis over thelease term. Contingent rental payables are recognized as expense in the year in which they areincurred. Any prepaid rent and accrued rent were recognized under ‘Prepaid expenses’ lodged in‘Other assets’ and ‘Accrued other expenses’ lodged in ‘Accrued interest and other expenses’,respectively.
Group as lessorFinance leases, where the Group transfers substantially all the risks and benefits incidental to theownership of the leased item to the lessee, are included in the statement of financial position under‘Loans and receivables’. All income resulting from the receivable is included in ‘Interest income’ inthe statement of income.
Leases where the Group does not transfer substantially all the risks and benefits of ownership of theassets are classified as operating leases. Initial direct costs incurred in negotiating operating leasesare added to the carrying amount of the leased asset and recognized over the lease term on the samebasis as the rental income. Contingent rents are recognized as revenue in the year in which they areearned.
Retirement CostThe Group has a non-contributory defined benefit retirement plan except for FMIIC and itssubsidiary which follow the defined contribution retirement benefit plan and the MandatoryProvident Fund Scheme (MPFS). The retirement cost of the Parent Company and most of itssubsidiaries is determined using the projected unit credit method. Under this method, the current
Notes:Notes:
MEANINGFUL BANKING
IN THE NEW NORMAL
METROBANK I 2020 Annual Report & Sustainability Report 55 54 METROBANK I 2020 Annual Report & Sustainability Report
- 23 -
*SGVFSM005911*
service cost is the present value of retirement benefits payable in the future with respect to servicesrendered in the current year. The net defined benefit liability or asset is the aggregate of the presentvalue of the defined benefit obligation (DBO) at the end of the reporting period reduced by the fairvalue of plan assets (if any), adjusted for any effect of limiting a net defined benefit asset to the assetceiling. The asset ceiling is the present value of any economic benefits available in the form ofrefunds from the plan or reductions in future contributions to the plan. The cost of providing benefitsunder the defined benefit plans is actuarially determined using the projected unit credit method.
Defined benefit costs comprise the following: Service cost Net interest on the net defined benefit liability or asset Remeasurements of net defined benefit liability or asset
Service costs which include current service costs, past service costs and gains or losses on non-routine settlements are recognized as expense in profit or loss. Past service costs are recognizedwhen plan amendment or curtailment occurs. These amounts are calculated periodically byindependent qualified actuaries. Net interest on the net defined benefit liability or asset is the changeduring the year in the net defined benefit liability or asset that arises from the passage of time whichis determined by applying the discount rate based on government bonds to the net defined benefitliability or asset. Net interest on the net defined benefit liability or asset is recognized as expense orincome in profit or loss. Retirement expense is presented under ‘Compensation and fringe benefits’in the statement of income. Remeasurements comprising actuarial gains and losses, return on planassets and any change in the effect of the asset ceiling (excluding net interest on defined benefitliability) are recognized immediately in OCI in the period in which they arise. Remeasurements arenot reclassified to profit or loss in subsequent periods. Plan assets are assets that are held by a long-term employee benefit fund or qualifying insurance policies. Plan assets are not available to thecreditors of the Group, nor can they be paid directly to the Group. Fair value of plan assets is basedon market price information. When no market price is available, the fair value of plan assets isestimated by discounting expected future cash flows using a discount rate that reflects both the riskassociated with the plan assets and the maturity or expected disposal date of those assets (or, if theyhave no maturity, the expected period until the settlement of the related obligations). If the fair valueof the plan assets is higher than the present value of the DBO, the measurement of the resultingdefined benefit asset is limited to the present value of economic benefits available in the form ofrefunds from the plan or reductions in future contributions to the plan.
The Group’s right to be reimbursed of some or all of the expenditure required to settle a DBO isrecognized as a separate asset at fair value when and only when reimbursement is virtually certain.Payments to the defined contribution retirement benefit plans and the MPFS are recognized asexpenses when employees have rendered service entitling them to the contributions.
EquityWhen the shares are sold at a premium, the difference between the proceeds and par value is creditedto ‘Capital paid in excess of par value’, net of direct costs incurred related to the equity issuance. If‘Capital paid in excess of par value’ is not sufficient, the excess is charged against surplus. When theGroup issues more than one class of stock, a separate account is maintained for each class of stockand the number of stocks issued.
Surplus represents accumulated earnings of the Group less dividends declared.
- 24 -
*SGVFSM005911*
Own equity instruments which are reacquired or Parent Company’s shares acquired by itssubsidiaries (treasury stock) are recognized at cost and deducted from equity. No gain or loss isrecognized in the profit or loss on the purchase, sale, issue or cancellation of the Parent Company’sown equity instruments. Any difference between the carrying amount and the consideration, ifreissued, is recognized in ‘Capital paid in excess of par value’. Voting rights related to treasurystocks are nullified and no dividends are allocated. When the stocks are retired, the Common stockaccount is reduced by its par value and the excess of cost over par value upon retirement is debited tocapital paid in excess of par value at the time the stocks were issued and to surplus for the remainingbalance.
ProvisionsProvisions are recognized when the Group has a present obligation (legal or constructive) as a resultof a past event and it is probable that an outflow of resources embodying economic benefits will berequired to settle the obligation and a reliable estimate can be made of the amount of the obligation.Where the Group expects some or all of a provision to be reimbursed, for example, under aninsurance contract, the reimbursement is recognized as a separate asset but only when thereimbursement is virtually certain. The expense relating to any provision is presented in thestatement of income, net of any reimbursement. If the effect of the time value of money is material,provisions are determined by discounting the expected future cash flows at a pre-tax rate that reflectscurrent market assessments of the time value of money and, where appropriate, the risks specific tothe liability. Where discounting is used, the increase in the provision due to the passage of time isrecognized as ‘Interest expense’.
Contingent Liabilities and Contingent AssetsContingent liabilities are not recognized in the financial statements but are disclosed unless thepossibility of an outflow of resources embodying economic benefits is remote. Contingent assets arenot recognized but are disclosed in the financial statements when an inflow of economic benefits isprobable.
Income TaxesCurrent taxesCurrent tax assets and liabilities for the current and prior periods are measured at the amountexpected to be recovered from or paid to the taxing authorities. The tax rates and tax laws used tocompute the amount are those that are enacted or substantively enacted at the statement of financialposition date. Effective January 1, 2019, management periodically evaluates positions taken in thetax returns with respect to situations in which applicable tax regulations are subject to interpretationsand establishes provisions where appropriate.
Deferred taxesDeferred tax is provided on temporary differences at the statement of financial position date betweenthe tax bases of assets and liabilities and their carrying amounts for financial reporting purposes.
Deferred tax liabilities are recognized for all taxable temporary differences, except:a. Where the deferred tax liability arises from the initial recognition of goodwill or of an asset or
liability in a transaction that is not a business combination and, at the time of the transaction,affects neither the accounting profit nor taxable profit or loss.
b. In respect of taxable temporary differences associated with investments in subsidiaries, where thetiming of the reversal of the temporary differences can be controlled and it is probable that thetemporary differences will not reverse in the foreseeable future.
Notes:Notes:
MEANINGFUL BANKING
IN THE NEW NORMAL
METROBANK I 2020 Annual Report & Sustainability Report 57 56 METROBANK I 2020 Annual Report & Sustainability Report
- 25 -
*SGVFSM005911*
Deferred tax assets are recognized for all deductible temporary differences, carryforward of unusedtax credits from the excess of minimum corporate income tax (MCIT) over the regular income tax,and unused net operating loss carryover (NOLCO), to the extent that it is probable that taxableincome will be available against which the deductible temporary differences and carryforward ofunused tax credits from MCIT and unused NOLCO can be utilized except:a. Where the deferred tax asset relating to the deductible temporary difference arises from the initial
recognition of an asset or liability in a transaction that is not a business combination and, at thetime of the transaction, affects neither the accounting profit nor taxable profit or loss.
b. In respect of deductible temporary differences associated with investments in subsidiaries,deferred tax assets are recognized only to the extent that it is probable that the temporarydifferences will reverse in the foreseeable future and taxable profit will be available againstwhich the temporary differences can be utilized.
The carrying amount of deferred tax assets is reviewed at each statement of financial position dateand reduced to the extent that it is no longer probable that sufficient future taxable profit will beavailable to allow all or part of the deferred income tax asset to be utilized. Unrecognized deferredtax assets are reassessed at each statement of financial position date and are recognized to the extentthat it has become probable that future taxable income will allow the deferred tax asset to berecovered.
Deferred tax assets and liabilities are measured at the tax rates that are expected to apply in the yearwhen the asset is realized or the liability is settled, based on tax rates (and tax laws) that have beenenacted or substantively enacted at the statement of financial position date.
Current tax and deferred tax relating to items recognized directly in equity are recognized in OCI andnot in the statement of income.
Deferred tax assets and deferred tax liabilities are offset if a legally enforceable right exists to set offcurrent tax assets against current tax liabilities and deferred taxes relate to the same taxable entityand the same taxation authority.
Earnings Per ShareBasic earnings per share is computed by dividing net income for the year attributable to equityholders of the Parent Company by the weighted average number of common shares outstandingduring the year after giving retroactive effect to stock dividends declared and stock rights exercisedduring the year. The Group does not have dilutive potential common shares.
Dividends on Common SharesCash dividends on common shares are recognized as a liability and deducted from the equity whenapproved by the Board of Directors (BOD) of the Parent Company while stock dividends arededucted from equity when approved by BOD and shareholders of the Parent Company. Dividendsdeclared during the year but are paid or issued after the statement of financial position date are dealtwith as a subsequent event.
Debt Issuance CostsIssuance, underwriting and other related costs incurred in connection with the issuance of debtinstruments are deferred and amortized over the terms of the instruments using the EIR method.Unamortized debt issuance costs are included in the related carrying amount of the debt instrument inthe statement of financial position.
- 26 -
*SGVFSM005911*
Capital Securities Issuance CostsIssuance, underwriting and other related costs incurred in connection with the issuance of the capitalsecurities are treated as a reduction of equity against ‘Capital paid in excess of par value’.
Events after the Statement of Financial Position DatePost year-end events that provide additional information about the Group’s position at the statementof financial position date (adjusting event) are reflected in the financial statements. Post year-endevents that are not adjusting events, if any, are disclosed when material to the financial statements.
Segment ReportingThe Group’s operating businesses are organized and managed separately according to the nature ofthe products and services provided, with each segment representing a strategic business unit thatoffers different products and serves different markets. Financial information on business segments ispresented in Note 6.
Fiduciary ActivitiesAssets and income arising from fiduciary activities together with related undertakings to return suchassets to customers are excluded from the financial statements where the Parent Company andPSBank act in a fiduciary capacity such as nominee, trustee or agent.
Standards Issued but not yet Effective
The list below consists of standards and interpretations issued, which the Group reasonably expectsto be applicable at a future date. The Group intends to adopt these standards when they becomeeffective. Except as otherwise indicated, the Group does not expect the adoption of these new andamended standards and interpretations to have significant impact on its financial statements.
Effective beginning on or after January 1, 2021 Amendments to PFRS 9, PFRS 7, PFRS 4 and PFRS 16, Interest Rate Benchmark Reform -
Phase 2The amendments provide the following temporary reliefs which address the financial reportingeffects when an interbank offered rate (IBOR) is replaced with an alternative nearly risk-freeinterest rate (RFR):o Practical expedient for changes in the basis for determining the contractual cash flows as a
result of IBOR reformo Relief from discontinuing hedging relationshipso Relief from the separately identifiable requirement when an RFR instrument is designated as
a hedge of a risk component
The Group shall also disclose information about:o The about the nature and extent of risks to which the entity is exposed arising from financial
instruments subject to IBOR reform, and how the entity manages those risks; ando Their progress in completing the transition to alternative benchmark rates, and how the entity
is managing that transition
The amendments are effective for annual reporting periods beginning on or afterJanuary 1, 2021 and apply retrospectively, however, the Group is not required to restate priorperiods.
Notes:Notes:
MEANINGFUL BANKING
IN THE NEW NORMAL
METROBANK I 2020 Annual Report & Sustainability Report 59 58 METROBANK I 2020 Annual Report & Sustainability Report
- 27 -
*SGVFSM005911*
Effective beginning on or after January 1, 2022
Amendments to PFRS 3, Reference to the Conceptual FrameworkThe amendments added an exception to the recognition principle of PFRS 3, Business Combinationsto avoid the issue of potential ‘day 2’ gains or losses arising for liabilities and contingent liabilitiesthat would be within the scope of PAS 37, Provisions, Contingent Liabilities and Contingent Assetsor Philippine-IFRIC 21, Levies, if incurred separately. It also clarified that contingent assets do notqualify for recognition at the acquisition date. The Group applies these amendments prospectivelyfor annual reporting periods beginning on or after January 1, 2022.
Amendments to PAS 16 , Plant and Equipment: Proceeds before Intended UseThe amendments prohibit entities deducting from the cost of an item of property, plant andequipment, any proceeds from selling items produced while bringing that asset to the location andcondition necessary for it to be capable of operating in the manner intended by management.Instead, an entity recognizes the proceeds from selling such items, and the costs of producing thoseitems, in profit or loss.
The amendment are effective for annual reporting periods beginning on or after January 1, 2022 andmust be applied retrospectively to items of property, plant and equipment made available for use onor after the beginning of the earliest period presented when the entity first applies the amendment.
Amendments to PAS 37, Onerous Contract – Costs of Fulfilling a ContractThe amendments specify which costs an entity needs to include when assessing whether a contract isonerous or loss-making. The amendments apply a “directly related cost approach”. The costs thatrelate directly to a contract to provide goods or services include both incremental costs and anallocation of costs directly related to contract activities. General and administrative costs do notrelate directly to a contract and are excluded unless they are explicitly chargeable to the counterpartyunder the contract. The amendments are effective for annual reporting periods beginning on or afterJanuary 1, 2022. The Group will apply these amendments to contracts for which it has not yetfulfilled all its obligations at the beginning of the annual reporting period in which it first applies theamendments.
Annual Improvements to PFRSs 2018-2020 CycleAmendments to PFRS 1, First-time Adoption of Philippines Financial Reporting Standards,Subsidiary as a first-time adopterThe amendments permit a subsidiary, joint venture or associate that elects to apply paragraph D16(a)of PFRS 1 to measure cumulative translation differences using the amounts reported by the parent,based on the parent’s date of transition to PFRS. The amendment is effective for annual reportingperiods beginning on or after January 1, 2022 with earlier adoption permitted
Amendments to PFRS 9, Financial Instruments, Fees in the ’10 per cent’ test for derecognitionfinancial liabilitiesThe amendment clarifies the fees that an entity includes when assessing whether the terms of a newor modified financial liability are substantially different from the terms of the original financialliability. These fees include only those paid or received between the borrower and the lender,including fees paid or received by either the borrower or lender on the other’s behalf. An entityapplies the amendment to financial liabilities that are modified or exchanged on or after thebeginning of the annual reporting period in which the entity first applies the amendment. Theamendment is effective for annual reporting periods beginning on or after January 1, 2022 withearlier adoption permitted. The Group will apply the amendments to financial liabilities that aremodified or exchanged on or after the beginning of the annual reporting period in which the entityfirst applies the amendment.
- 28 -
*SGVFSM005911*
Amendments to PAS 41, Agriculture, Taxation in fair value measurementsThe amendment removes the requirement in paragraph 22 of PAS 41 that entities exclude cash flowsfor taxation when measuring the fair value of assets within the scope of PAS 41. An entity appliesthe amendment prospectively to fair value measurements on or after the beginning of the first annualreporting period beginning on or after January 1, 2022 with earlier adoption permitted.
Effective beginning on or after January 1, 2023
PFRS 17, Insurance ContractsPFRS 17 provides updated information about the obligation, risks and performance of insurancecontracts, increases transparency in financial information reported by insurance companies, andintroduces consistent accounting for all insurance contracts based on a current measurement model.The standard is effective for annual periods beginning on or after January 1, 2023. Early applicationis permitted but only if the entity also applies PFRS 9 and PFRS 15.
Amendments to PAS 1, Classification of Liabilities as Current and Non-CurrentThe amendments clarify the following to specify the requirements for classifying liabilities as currentor non-current: What is meant by a right to defer settlement; That a right to defer must exist at the end of the reporting period; That classification is unaffected by the likelihood that an entity will exercise its deferral right; That only if an embedded derivative in a convertible liability is itself an equity instrument would
the terms of a liability not impact its classification.
Deferred effectivityAmendments to PFRS 10, Consolidated Financial Statements and PAS 28, Investments in Associatesand Joint Ventures - Sale or Contribution of Assets between an Investor and its Associate or JointVentureThe amendments address the conflict between PFRS 10 and PAS 28 in dealing with the loss ofcontrol of a subsidiary that is sold or contributed to an associate or joint venture. The amendmentsclarify that a full gain or loss is recognized when a transfer to an associate or joint venture involves abusiness as defined in PFRS 3. Any gain or loss resulting from the sale or contribution of assets thatdoes not constitute a business, however, is recognized only to the extent of unrelated investor’sinterests in the associate or joint venture. On January 13, 2016, the Financial Reporting StandardsCouncil postponed the original effective date of January 1, 2016 of the said amendments until theInternational Accounting Standards Board has completed its broader review of the research projecton equity accounting that may result in the simplification of accounting for such transactions and ofother aspects of accounting for associates and joint ventures.
3. Significant Accounting Judgments and Estimates
The preparation of the financial statements in compliance with PFRS requires the Group to makeestimates and assumptions that affect the reported amounts of assets, liabilities, income and expensesand the disclosures of contingent assets and contingent liabilities. Future events may occur whichcan cause the assumptions used in arriving at the estimates to change. The effects of any change inestimates are reflected in the financial statements as they become reasonably determinable.Judgments and estimates are continually evaluated and are based on historical experience and otherfactors, including expectations of future events that are believed to be reasonable under thecircumstances. The following are the critical judgments and key assumptions that have a significant
Notes:Notes:
MEANINGFUL BANKING
IN THE NEW NORMAL
METROBANK I 2020 Annual Report & Sustainability Report 61 60 METROBANK I 2020 Annual Report & Sustainability Report
- 29 -
*SGVFSM005911*
risk of material adjustment to the carrying amounts of assets and liabilities within the next financialyear:
Judgmentsa. Classification of financial assets
The Group classifies its financial assets depending on the business model for managing thosefinancial assets and whether the contractual terms of the financial asset are SPPI on the principalamount outstanding. The Group performs the business model assessment based on observablefactors such as: How the performance of the business model and the financial assets held within that business
model are evaluated and reported to the Group’s key management personnel Risks that affect the performance of the business model (and the financial assets held within
that business model) and, in particular, the way those risks are managed Compensation of business units whether based on the fair value of the assets managed or on
the contractual cash flows collected Expected frequency, value and timing of sales
In performing the SPPI test, the Group applies judgment and considers relevant factors such asthe currency in which the financial asset is denominated, the period for which the interest rate isset, contingent events that would change the amount and timing of cash flows, leverage features,prepayment and extension terms and other features that may modify the consideration for thetime value of money.
In 2020, the Parent Company disposed investment securities at amortized cost and assessed thatthis resulted from a change in business model. PSBank also disposed investment securities atamortized cost and assessed that the disposal was not inconsistent with the hold-to-collect (HTC)business model (see Note 8).
In 2019, FMIC disposed all of its investment securities at amortized cost and assessed that thisresulted from unanticipated market changes that are significant to its operations (see Note 8).
b. Consolidation of subsidiariesThe determination whether the Group has control over an investee company requires significantjudgment. The Group considers that the following criteria are all met, including: (a) an investorhas the power over an investee; (b) the investor has exposure, or rights, to variable returns fromits involvement with the investee; and (c) the investor has the ability to use its power over theinvestee to affect the amount of the investor’s return.
In accordance with PFRS 10, the Group included the accounts of First Metro Save and LearnBalance Fund, Inc. (FMSALBF), First Metro Save and Learn Equity Fund, Inc. (FMSALEF),First Metro Save and Learn Fixed Income Fund, Inc. (FMSLFIF), First Metro Philippine EquityExchange Traded Fund, Inc. (FMPETF), First Metro Save and Learn F.O.C.C.U.S. DynamicFund, Inc. and First Metro Save and Learn Money Market Fund, Inc., collectively the “Funds”,in its consolidated financial statements. The Group re-assessed the control conclusion for theseFunds. Although the ownership is less than half of the voting power of these investees, theGroup has control due to its power to direct the relevant activities of the Funds through FirstMetro Asset Management Inc. (FAMI), a subsidiary of FMIC, which acts as the fund manager ofthe Funds. Further, the Group has the exposure to variable returns from its investments and itsability to use its power over the Funds to affect their returns.
- 30 -
*SGVFSM005911*
c. Existence of significant influence over an associate with less than 20.00% ownershipAs discussed in Note 11, there are instances that an investor exercises significant influence evenif its ownership is less than 20.00%. The Group applies significant judgment in assessingwhether it holds significant influence over an investee and considers the following:(a) representation in the board of directors or equivalent governing body of the investee;(b) participation in policy-making processes, including participation in decisions about dividendsor other distributions; (c) material transactions between the investor and the investee;(d) interchange of managerial personnel; (e) joint voting agreement with other investors; or(f) provision of essential technical information.
d. Fair value of financial instrumentsWhere the fair values of financial assets and financial liabilities recorded in the statement offinancial position or disclosed in the notes to financial statements cannot be derived from activemarkets, these are determined using internal valuation techniques using generally acceptedmarket valuation models. The inputs to these models are taken from observable markets wherepossible, but where this is not feasible, a degree of judgment is required in establishing fairvalues. These judgments may include considerations of liquidity and volatility for longer datedderivatives (Note 5).
e. LeasesGroup as lessorOperating leasesThe Group has entered into commercial property leases on its investment properties portfolio andover various items of furniture, fixtures and equipment. The Group has determined, based on anevaluation of the terms and conditions of the arrangements (i.e., the lease does not transferownership of the asset to the lessee by the end of the lease term, the lessee has no option topurchase the asset at a price that is expected to be sufficiently lower than the fair value at the datethe option is exercisable and the lease term is not for the major part of the asset’s economic life),that it retains all the significant risks and rewards of ownership of these properties which areleased out on operating leases.
Finance leasesThe Group has entered into leases on its transportation and office equipment portfolio. TheGroup has determined that it has transferred all the significant risks and rewards of ownership ofthe properties to the lessees, that at the inception of the lease, the present value of the minimumlease payments amounts to at least substantially all of the fair value of the lease asset.
Group as lesseeThe Group determines the lease term as the non-cancellable term of the lease, together with anyperiods covered by an option to extend the lease if it is reasonably certain to be exercised, or anyperiods covered by an option to terminate the lease, if it is reasonably certain not to be exercised.
Extension and termination optionsThe Group has several lease contracts that include extension and termination options. The Groupapplies judgment in evaluating whether it is reasonably certain whether or not to exercise theoption to renew or terminate the lease. That is, it considers all relevant factors such as leaseholdimprovements and location that create an economic incentive for it to exercise either the renewalor termination. After the commencement date, the Group reassess the lease term if there is asignificant event or change in circumstances that is within its control and affects its ability toexercise or not to exercise the option to renew or to terminate.
Notes:Notes:
MEANINGFUL BANKING
IN THE NEW NORMAL
METROBANK I 2020 Annual Report & Sustainability Report 63 62 METROBANK I 2020 Annual Report & Sustainability Report
- 31 -
*SGVFSM005911*
Estimating the IBR for lease liabilitiesThe Group cannot readily determine the interest rate implicit in the lease, therefore, it uses itsIBR to measure lease liabilities. The IBR for lease liabilities is the rate of interest that the Groupwould have to pay to borrow over a similar term, and with a similar security, the funds necessaryto obtain an asset of a similar value to the ROU asset in a similar economic environment. TheGroup estimates the IBR for lease liabilities using observable inputs (by reference to prevailingrisk-free rates) adjusted to take into account the entity’s credit risk (i.e., credit spread).
f. ContingenciesThe Group is currently involved in legal proceedings. The estimate of the probable cost for theresolution of claims has been developed in consultation with and the aid of the outside legalcounsel handling the Group’s defense in this matter and is based upon an analysis of potentialresults. It is probable, however, that future results of operations could be materially affected bychanges in the estimates or in the effectiveness of the strategies relating to these proceedings(Note 30).
Estimatesa. Credit losses on financial assets
The Group reviews its debt financial assets subject to ECL at least on a semi-annual basis withupdating provisions made during the intervals as necessary based on the continuing analysis andmonitoring of individual accounts by credit officers, as in the case in 2020 when quarterlyreviews and ECL adjustments were made in response to the changing credit environment broughtabout by the COVID-19 pandemic. The measurement of credit losses under PFRS 9 across allcategories of such financial assets requires judgment, in particular, the estimation of the amountand timing of future cash flows and collateral values when determining credit losses and theassessment of a SICR. These estimates are driven by a number of factors, changes in which canresult in different levels of allowances.
The Group’s ECL calculations are outputs of complex models with a number of underlyingassumptions regarding the choice of variable inputs and their interdependencies. Elements of theECL models that are considered accounting judgments and estimates include, among others: Segmentation of the portfolio, where the appropriate model or ECL approach is used Criteria for assessing if there has been a SICR and so allowances for debt financial assets
should be measured on a lifetime ECL basis and the qualitative assessment. In 2019, Stage 2included those accounts “Watchlisted” due to financial and repayment concerns, which werepreviously under Stage 1, and aligned the definition of default (previously more than 30 dayspast due) with the BSP’s definition of non-performing loans, i.e., more than 90 days pastdue. In 2020, exposures that were granted payment reprieve strictly as provided for by lawsand relevant regulations were retained under Stage 1, while exposures that were grantedextended reprieve, provided not impaired or not non-performing under relevant rules, wereincluded under Stage 2. The Parent Company likewise performed quarterly reviews of itscredit exposures to determine the occurrence of SICR notwithstanding said reprieves.Exposures belonging to sectors widely determined to be most at-risk and non-essential(e.g., tourism, entertainment and leisure, hotels and restaurants, airlines), and projected toexperience significant revenue and liquidity strain in the event of prolonged economicinactivity, were also included under Stage 2.
Segmentation of debt financial assets when their ECL is assessed on a collective basis
- 32 -
*SGVFSM005911*
Development of ECL models, including the various formulas and the choice of inputs. In2019, the Parent Company recalibrated its lifetime PD models and loss rates (for portfolios towhich the loss rate approach is applied). In 2020, the Company further recalibrated its PDand overlay models following the conclusion of validation of the same by an independentexternal party.
Determination of associations between macroeconomic scenarios and economic inputs, suchas unemployment levels and collateral values, and the effect on PDs, EADs and LGDs
Selection of forward-looking macroeconomic scenarios and their probability weightings, toderive the economic inputs into the ECL models
The gross carrying amounts of financial assets subject to ECL as of December 31, 2020 and 2019are disclosed in Note 4, while the related allowances for expected credit losses are disclosed inNote 15. In 2020 and 2019, provision for credit losses on these financial assets amounted toP=40.8 billion and P=9.6 billion, respectively, for the Group and P=32.7 billion and P=1.6 billion,respectively, for the Parent Company (Note 15). With the merger of MCC into the ParentCompany in 2020 (Note 11), the Parent Company’s provision for credit losses in 2020 includesthe provision for credit losses on credit card receivables .
b. Recognition of deferred income taxesDeferred tax assets are recognized for all unused tax losses and deductible temporary differencesto the extent that it is probable that taxable profit will be available against which the losses canbe utilized. Significant management judgment is required to determine the amount of deferredtax assets that can be recognized, based upon the likely timing and level of future taxable profitstogether with future tax planning strategies. The estimates of future taxable income indicate thatcertain temporary differences will be realized in the future. The Group and the Parent Companyhave considered the impact of the COVID-19 pandemic on future taxable income and on therecognition of deferred tax assets. The recognized net deferred tax assets and unrecognizeddeferred tax assets for the Group and the Parent Company are disclosed in Note 28.
c. Present value of retirement liabilityThe cost of defined retirement pension plan is determined using actuarial valuations. Theactuarial valuation involves making assumptions about discount rates, future salary increases,mortality rates and future pension increases. Due to the complexities involved in the valuationand the long-term nature of these plans, such estimates are subject to significant uncertainty. Theassumed discount rates were determined using the market yields on Philippine government bondswith terms consistent with the expected employee benefit payout as of the statement of financialposition date. The present values of the retirement liability of the Group and the ParentCompany are disclosed in Note 27.
d. Impairment of non-financial assetsThe Group assesses impairment on non-financial assets (property and equipment, investments insubsidiaries, associates and a JV, investment properties, software costs, chattel mortgageproperties and other assets) whenever events or changes in circumstances indicate that thecarrying amount of an asset may not be recoverable. The factors that the Group considersimportant which could trigger an impairment review include the following: a) significantunderperformance relative to expected historical or projected future operating results;b) significant changes in the manner of use of the acquired assets or the strategy for overallbusiness; and c) significant negative industry or economic trends.
Notes:Notes:
MEANINGFUL BANKING
IN THE NEW NORMAL
METROBANK I 2020 Annual Report & Sustainability Report 65 64 METROBANK I 2020 Annual Report & Sustainability Report
- 33 -
*SGVFSM005911*
The Group uses the higher of FVLCTS and VIU in determining the recoverable amount of theasset. As of December 31, 2020 and 2019, there has been a significant and prolonged decline inthe fair value of an associate. In 2019, the VIU was used as the recoverable amount while in2020, it was based on FVLCTS as it was higher than the VIU. The FVLCTS was based on thequoted price of the shares less expected selling costs. The VIU calculation is most sensitive tothe following assumptions: (a) production volume; (b) price; (c) exchange rates; (d) capitalexpenditures and (e) long-term growth rates. In 2020, the Group considered the impact of theCOVID-19 pandemic in determining the VIU. Based on the Group’s impairment testing as ofDecember 31, 2020 and 2019, allowance for impairment loss on investment on this associateamounted to P=439.2 million.
The carrying values of the property and equipment, investments in subsidiaries, associates and aJV, investment properties, software costs, chattel mortgage properties, and other assets of theGroup and the Parent Company are disclosed in Notes 10, 11, 12 and 14, respectively.
GoodwillGoodwill is reviewed for impairment, annually or more frequently if events or changes incircumstances indicate that the carrying value may be impaired. Impairment is determined forgoodwill by assessing the recoverable amount of the CGU (or group of CGUs) to which thegoodwill relates. Where the recoverable amount of the CGU (or group of CGUs) is less than thecarrying amount of the CGU (or group of CGUs) to which goodwill has been allocated, animpairment loss is recognized immediately in the statement of income. The recoverable amountof the CGU is determined based on FVLCTS.
The fair value of the CGU is determined using the cost approach, specifically the adjusted NetAsset Value (NAV) method. This method requires the measurement of the fair value of theindividual assets and liabilities recognized in the CGU, as well as the fair value of anyunrecognized assets and liabilities at the measurement date. The resulting net fair values of theassets and liabilities represent the fair value of the CGU. In determining the fair value of theCGU’s net assets, the Group used the discounted cash flow method for unquoted debt financialassets/liabilities at the appropriate market rate, the price-to-earnings (P/E) valuation and adjustedNAV model for unquoted equity investments, and the appraisal reports for the valuation of realproperties. Fair values of listed debt and equity securities are based on their quoted marketprices. The Group applied the P/E valuation model by reference to P/E ratios of listedcomparable companies of the investee company. The FVLCTS calculation of the CGU is mostsensitive to the P/E ratios of listed comparable companies of the investee company. Based on thesensitivity analysis performed, a one percent (1%) reduction in the P/E ratio used will result inimpairment of the goodwill. The Group considered the impact of the COVID-19 pandemic indetermining the recoverable amount. As of December 31, 2020 and 2019, the Group’s goodwillamounted to P=5.2 billion (Note 11).
- 34 -
*SGVFSM005911*
4. Financial Risk and Capital Management
IntroductionThe Group has exposure to the following risks from its use of financial instruments: (a) credit;(b) liquidity; and (c) market risks.
Risk management frameworkThe Board of Directors (BOD) has overall responsibility for the oversight of the Parent Company’srisk management process. On the other hand, the risk management processes of the subsidiaries arethe separate responsibilities of their respective BOD. Supporting the BOD in this function are certainBoard-level committees such as Risk Oversight Committee (ROC), Audit Committee (AC) andsenior management committees through the Executive Committee and Asset and Liability Committee(ALCO) among others.
The ROC, which is composed primarily of independent members of the BOD, is responsible foroverseeing the Parent Company’s risk infrastructure, the adequacy and relevance of risk policies, andthe compliance to defined risk appetite and levels of exposure. The ROC is assisted in thisresponsibility by the Risk Management Group (RSK). The RSK undertakes the implementation andexecution of the Parent Company’s Risk Management framework which involves the identification,assessment, control, monitoring and reporting of risks.
The Parent Company and its subsidiaries manage their respective financial risks separately. Thesubsidiaries have their own risk management processes but are structured similar to that of the ParentCompany. To a certain extent, the respective risk management programs and objectives are the sameacross the Group. The risk management policies adopted by the subsidiaries and affiliates arealigned with the Parent Company’s risk policies. To further promote compliance with PFRS andBasel III, the Parent Company created a Risk Management Coordinating Council (RMCC) composedof risk officers of the Parent Company and its financial institution subsidiaries.
Credit RiskCredit risk is the risk of financial loss to the Group if a counterparty to a financial instrument fails tomeet its contractual obligations. The Group manages and controls credit risk by setting limits on theamount of risk it is willing to accept for individual counterparties, related groups of borrowers,market segments, and industry concentrations, and by monitoring exposures in relation to such limits,among others. The same is true for treasury-related activities. Each business unit is responsible forthe quality of its credit portfolio and for monitoring and controlling all credit risks in its portfolio.Regular reviews and audits of business units and credit processes are undertaken by the RSK andInternal Audit Group, respectively.
Management of credit riskThe Group faces potential credit risks every time it extends funds to borrowers, commits funds tocounterparties, guarantees the paying performance of its clients, invests funds to issuers(e.g., investment securities issued by either sovereign or corporate entities) or enter into eithermarket-traded or over-the-counter derivatives, either through implied or actual contractualagreements (i.e., on- or off-balance sheet exposures). The Parent Company manages its credit risk atvarious levels (i.e., strategic level, portfolio level down to individual obligor or transaction) byadopting a credit risk management environment that has the following components: Formulating credit policies in consultation with business units, covering collateral requirements,
credit/financial assessment, risk grading and reporting and compliance with regulatoryrequirements;
Establishment of authorization limits for the approval and renewal of credit facilities;
Notes:Notes:
MEANINGFUL BANKING
IN THE NEW NORMAL
METROBANK I 2020 Annual Report & Sustainability Report 67 66 METROBANK I 2020 Annual Report & Sustainability Report
- 35 -
*SGVFSM005911*
Limiting concentrations of exposure to counterparties and industries (for loans), and by issuer(for investment securities);
Utilizing the Internal Credit Risk Rating System (ICRRS) in order to categorize exposuresaccording to their risk profile. The risk grading system is used for determining impairmentprovisions against credit exposures. The current risk grading framework consists of ten gradesreflecting varying degrees of risk of default and the availability of collateral or other credit riskmitigation; and
Monitoring compliance with approved exposure limits.
Borrowers, counterparties or group of related accounts across the Group are aggregated and managedby the Parent Company’s Institutional Banking Sector as the “Control Unit”. Group Limits forconglomerates are set-up and approved to guide subsidiaries and affiliates of the Group.Consolidated exposures are regularly reported to senior management and the ROC.
Credit risk at initial recognitionThe Group uses internal credit assessment and approvals at various levels to determine the credit riskof exposures at initial recognition. Assessment can be quantitative or qualitative and depends on themateriality of the facility or the complexity of the portfolio to be assessed.
ModificationIn certain circumstances, the Group modifies the original terms and conditions of a credit exposure toform a new loan agreement or payment schedule. The modifications can be given depending on theborrower’s or counterparty’s current or expected financial difficulty. The modifications may include,but are not limited to, change in interest rate and terms, principal amount, maturity date, date andamount of periodic payments and accrual of interest and charges.
On March 24, 2020, Republic Act No. 11469 or the “Bayanihan to Heal as One Act” (Bayanihan 1)was enacted declaring a state of national emergency over the entire country to control the spread ofthe Coronavirus Disease 2019 (COVID-19). Among the provisions of Bayanihan 1 is theimplementation of a 30-day grace period for all loans with principal and/or interest falling due withinthe period of the Enhanced Community Quarantine without incurring interest on interest, onpenalties, fees and other charges. Further, on September 11, 2020, Republic Act No. 11494 or the“Bayanihan to Recover as One Act” (Bayanihan 2) was enacted and part of the provisions of theBayanihan 2 is the implementation of a one-time 60-day grace period to be granted for the paymentof all existing, current and outstanding loans falling due, or any part thereof, on or beforeDecember 31, 2020, without incurring interest on interest, penalties, fees and other charges, therebyextending the maturity of said loans. In addition, Bayanihan 2 allows loans to be settled on astaggered basis without interest on interests, penalties, fees or other charges until December 31, 2020or as may be agreed upon by both parties.
The impact of loan modifications as a result of the Bayanihan 1 and Bayanihan 2 Acts amounted to aloss of P=1.7 billion for the Group and P=1.2 billion for the Parent Company. For the year endedDecember 31, 2020, the net impact of the loan modifications (i.e., after subsequent accretion of themodified loans) amounted to a loss of P=461.3 million, for the Group and nil for the Parent Company.
- 36 -
*SGVFSM005911*
Maximum exposure to credit riskAn analysis of the maximum credit risk exposure (net of allowance for ECL) relating to financialassets with collateral or credit enhancements is shown below:
Consolidated2020 2019
MaximumExposure toCredit Risk
Fair Valueof Collateral
FinancialEffect of
Collateralor Credit
EnhancementNet
Exposure
MaximumExposure toCredit Risk
Fair Valueof Collateral
FinancialEffect of
Collateralor Credit
EnhancementNet
ExposureInterbank loans receivable and
SPURA P=18,614 P=18,614 P=18,614 P=– P=401 P=401 P=401 P=–Loans and receivables - net
Receivables from customersCommercial loans 269,534 827,714 239,564 29,970 341,616 856,065 299,588 42,028Auto loans 95,625 161,750 92,087 3,538 116,069 202,470 115,636 433Residential mortgage loans 103,367 188,025 98,305 5,062 109,093 207,864 93,723 15,370Trade loans 34,314 34,216 33,440 874 61,260 59,907 59,785 1,475Others 268 300 262 6 796 738 702 94
503,108 1,212,005 463,658 39,450 628,834 1,327,044 569,434 59,400Accrued interest receivable 6,386 5,540 5,540 846 3,507 3,370 3,370 137Sales contract receivable 79 272 76 3 142 414 100 42
509,573 1,217,817 469,274 40,299 632,483 1,330,828 572,904 59,579Total P=528,187 P=1,236,431 P=487,888 P=40,299 P=632,884 P=1,331,229 P=573,305 P=59,579
Parent Company2020 2019
MaximumExposure toCredit Risk
Fair Valueof Collateral
FinancialEffect of
Collateralor Credit
EnhancementNet
Exposure
MaximumExposure toCredit Risk
Fair Valueof Collateral
FinancialEffect of
Collateralor Credit
EnhancementNet
ExposureInterbank loans receivable and
SPURA P=15,819 P=15,819 P=15,819 P=– P=– P=– P=– P=–Loans and receivables - net
Receivables from customersCommercial loans 249,523 794,103 227,841 21,682 296,577 806,784 264,137 32,440Auto loans 20,543 56,052 20,213 330 23,674 63,917 23,330 344Residential mortgage loans 53,810 113,501 53,600 210 56,977 114,374 56,780 197Trade loans 34,314 34,216 33,440 874 61,260 59,907 59,785 1,475Others 268 300 262 6 796 738 703 93
358,458 998,172 335,356 23,102 439,284 1,045,720 404,735 34,549Accrued interest receivable 1,787 1,776 1,776 11 1,659 1,656 1,656 3Sales contract receivable 54 189 54 – 100 187 100 –
360,299 1,000,137 337,186 23,113 441,043 1,047,563 406,491 34,552Total P=376,118 P=1,015,956 P=353,005 P=23,113 P=441,043 P=1,047,563 P=406,491 P=34,552
The maximum exposure to credit risks for the other financial assets is limited to their carrying valuesas of December 31, 2020 and 2019.
Collaterals on loans and receivables includes real estate and chattel mortgages, guarantees, and otherregistered securities over assets. Generally, collateral is not held over loans and advances to banksexcept for reverse repurchase agreements and certain due from other banks. Collateral usually is notheld against investment securities, and no such collateral was held as of December 31, 2020 and2019. Estimates of fair values of the collateral are based on the value of collateral assessed at thetime of borrowing and are regularly updated according to internal lending policies and regulatoryguidelines. The Group is not permitted to sell or repledge the collateral in the absence of default bythe counterparty.
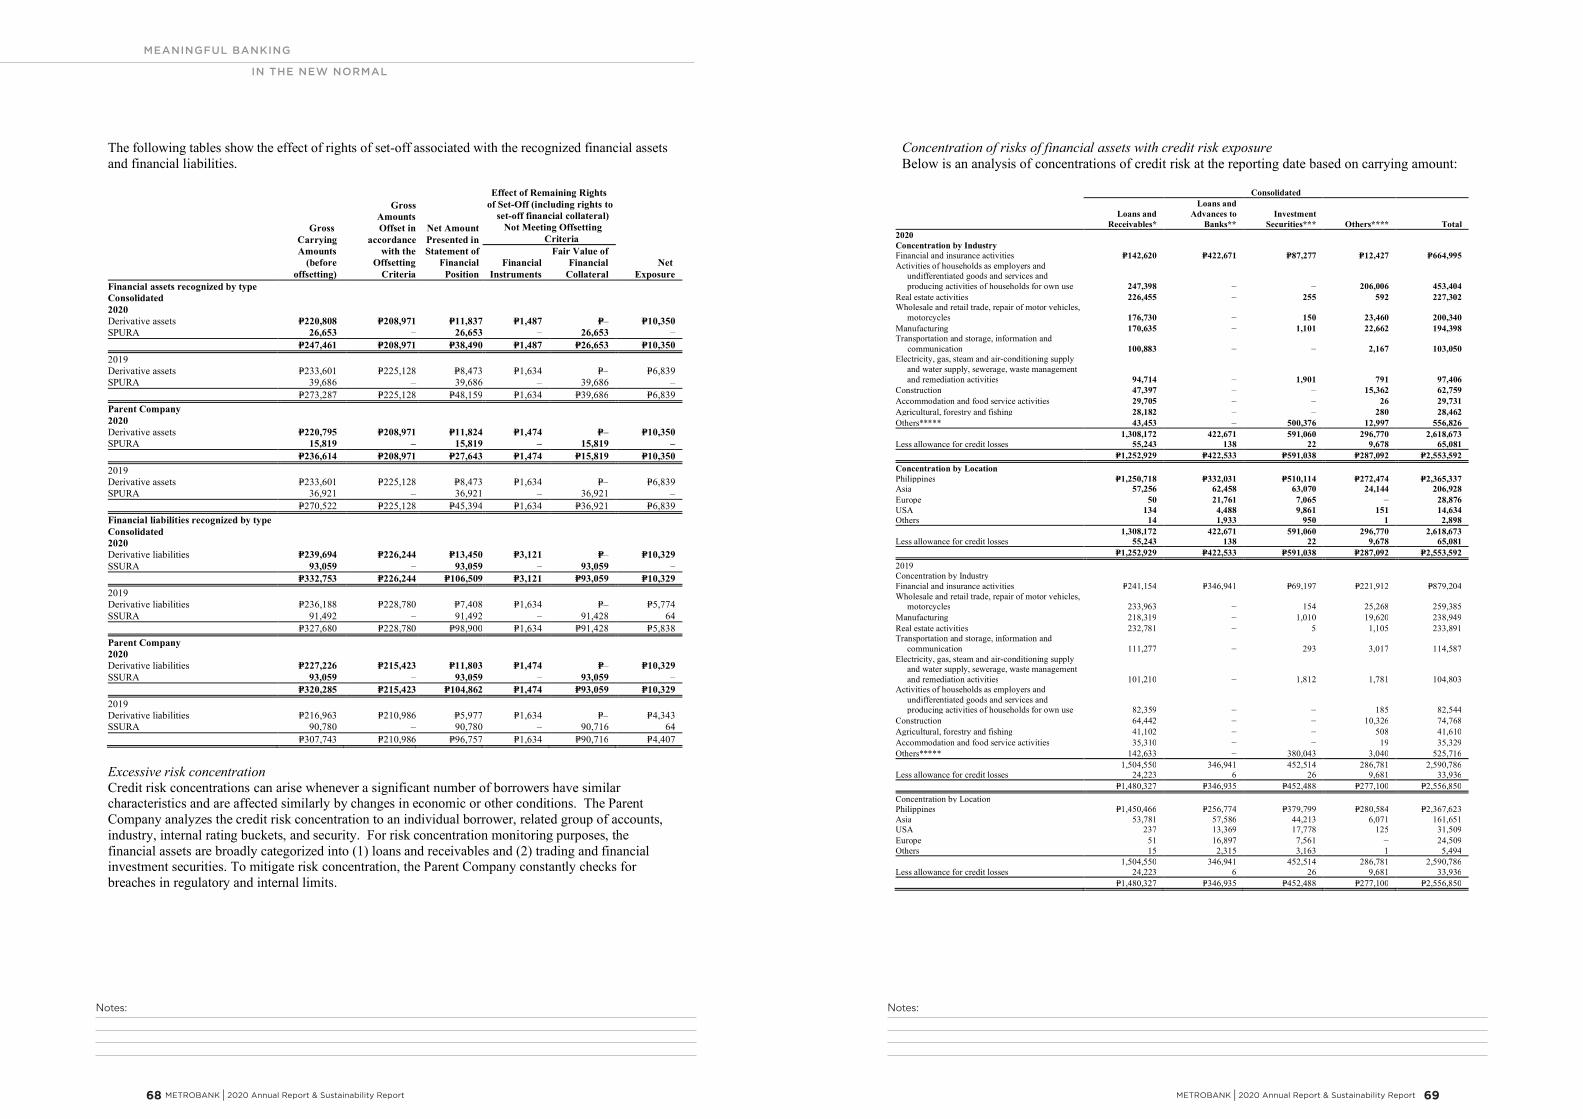
Notes:Notes:
MEANINGFUL BANKING
IN THE NEW NORMAL
METROBANK I 2020 Annual Report & Sustainability Report 69 68 METROBANK I 2020 Annual Report & Sustainability Report
- 37 -
*SGVFSM005911*
The following tables show the effect of rights of set-off associated with the recognized financial assetsand financial liabilities.
GrossCarryingAmounts
(beforeoffsetting)
GrossAmountsOffset in
accordancewith the
OffsettingCriteria
Net AmountPresented inStatement of
FinancialPosition
Effect of Remaining Rightsof Set-Off (including rights to
set-off financial collateral)Not Meeting Offsetting
Criteria
NetExposure
FinancialInstruments
Fair Value ofFinancial
CollateralFinancial assets recognized by typeConsolidated2020Derivative assets P=220,808 P=208,971 P=11,837 P=1,487 P=– P=10,350SPURA 26,653 – 26,653 – 26,653 –
P=247,461 P=208,971 P=38,490 P=1,487 P=26,653 P=10,3502019Derivative assets P=233,601 P=225,128 P=8,473 P=1,634 P=‒ P=6,839SPURA 39,686 ‒ 39,686 ‒ 39,686 ‒
P=273,287 P=225,128 P=48,159 P=1,634 P=39,686 P=6,839Parent Company2020Derivative assets P=220,795 P=208,971 P=11,824 P=1,474 P=‒ P=10,350SPURA 15,819 ‒ 15,819 ‒ 15,819 ‒
P=236,614 P=208,971 P=27,643 P=1,474 P=15,819 P=10,3502019Derivative assets P=233,601 P=225,128 P=8,473 P=1,634 P=‒ P=6,839SPURA 36,921 ‒ 36,921 ‒ 36,921 ‒
P=270,522 P=225,128 P=45,394 P=1,634 P=36,921 P=6,839Financial liabilities recognized by typeConsolidated2020Derivative liabilities P=239,694 P=226,244 P=13,450 P=3,121 P=– P=10,329SSURA 93,059 – 93,059 – 93,059 –
P=332,753 P=226,244 P=106,509 P=3,121 P=93,059 P=10,3292019Derivative liabilities P=236,188 P=228,780 P=7,408 P=1,634 P=– P=5,774SSURA 91,492 – 91,492 – 91,428 64
P=327,680 P=228,780 P=98,900 P=1,634 P=91,428 P=5,838Parent Company2020Derivative liabilities P=227,226 P=215,423 P=11,803 P=1,474 P=– P=10,329SSURA 93,059 – 93,059 – 93,059 –
P=320,285 P=215,423 P=104,862 P=1,474 P=93,059 P=10,3292019Derivative liabilities P=216,963 P=210,986 P=5,977 P=1,634 P=‒ P=4,343SSURA 90,780 ‒ 90,780 ‒ 90,716 64
P=307,743 P=210,986 P=96,757 P=1,634 P=90,716 P=4,407
Excessive risk concentrationCredit risk concentrations can arise whenever a significant number of borrowers have similarcharacteristics and are affected similarly by changes in economic or other conditions. The ParentCompany analyzes the credit risk concentration to an individual borrower, related group of accounts,industry, internal rating buckets, and security. For risk concentration monitoring purposes, thefinancial assets are broadly categorized into (1) loans and receivables and (2) trading and financialinvestment securities. To mitigate risk concentration, the Parent Company constantly checks forbreaches in regulatory and internal limits.
- 38 -
*SGVFSM005911*
Concentration of risks of financial assets with credit risk exposureBelow is an analysis of concentrations of credit risk at the reporting date based on carrying amount:
Consolidated
Loans andReceivables*
Loans andAdvances to
Banks**Investment
Securities*** Others**** Total2020Concentration by IndustryFinancial and insurance activities P=142,620 P=422,671 P=87,277 P=12,427 P=664,995Activities of households as employers and
undifferentiated goods and services andproducing activities of households for own use 247,398 – – 206,006 453,404
Real estate activities 226,455 – 255 592 227,302Wholesale and retail trade, repair of motor vehicles,
motorcycles 176,730 – 150 23,460 200,340Manufacturing 170,635 – 1,101 22,662 194,398Transportation and storage, information and
communication 100,883 – – 2,167 103,050Electricity, gas, steam and air-conditioning supply
and water supply, sewerage, waste managementand remediation activities 94,714 – 1,901 791 97,406
Construction 47,397 – – 15,362 62,759Accommodation and food service activities 29,705 – – 26 29,731Agricultural, forestry and fishing 28,182 – – 280 28,462Others***** 43,453 – 500,376 12,997 556,826
1,308,172 422,671 591,060 296,770 2,618,673Less allowance for credit losses 55,243 138 22 9,678 65,081
P=1,252,929 P=422,533 P=591,038 P=287,092 P=2,553,592Concentration by LocationPhilippines P=1,250,718 P=332,031 P=510,114 P=272,474 P=2,365,337Asia 57,256 62,458 63,070 24,144 206,928Europe 50 21,761 7,065 – 28,876USA 134 4,488 9,861 151 14,634Others 14 1,933 950 1 2,898
1,308,172 422,671 591,060 296,770 2,618,673Less allowance for credit losses 55,243 138 22 9,678 65,081
P=1,252,929 P=422,533 P=591,038 P=287,092 P=2,553,5922019Concentration by IndustryFinancial and insurance activities P=241,154 P=346,941 P=69,197 P=221,912 P=879,204Wholesale and retail trade, repair of motor vehicles,
motorcycles 233,963 – 154 25,268 259,385Manufacturing 218,319 – 1,010 19,620 238,949Real estate activities 232,781 – 5 1,105 233,891Transportation and storage, information and
communication 111,277 – 293 3,017 114,587Electricity, gas, steam and air-conditioning supply
and water supply, sewerage, waste managementand remediation activities 101,210 – 1,812 1,781 104,803
Activities of households as employers andundifferentiated goods and services andproducing activities of households for own use 82,359 – – 185 82,544
Construction 64,442 – – 10,326 74,768Agricultural, forestry and fishing 41,102 – – 508 41,610Accommodation and food service activities 35,310 – – 19 35,329Others***** 142,633 – 380,043 3,040 525,716
1,504,550 346,941 452,514 286,781 2,590,786Less allowance for credit losses 24,223 6 26 9,681 33,936
P=1,480,327 P=346,935 P=452,488 P=277,100 P=2,556,850Concentration by LocationPhilippines P=1,450,466 P=256,774 P=379,799 P=280,584 P=2,367,623Asia 53,781 57,586 44,213 6,071 161,651USA 237 13,369 17,778 125 31,509Europe 51 16,897 7,561 – 24,509Others 15 2,315 3,163 1 5,494
1,504,550 346,941 452,514 286,781 2,590,786Less allowance for credit losses 24,223 6 26 9,681 33,936
P=1,480,327 P=346,935 P=452,488 P=277,100 P=2,556,850
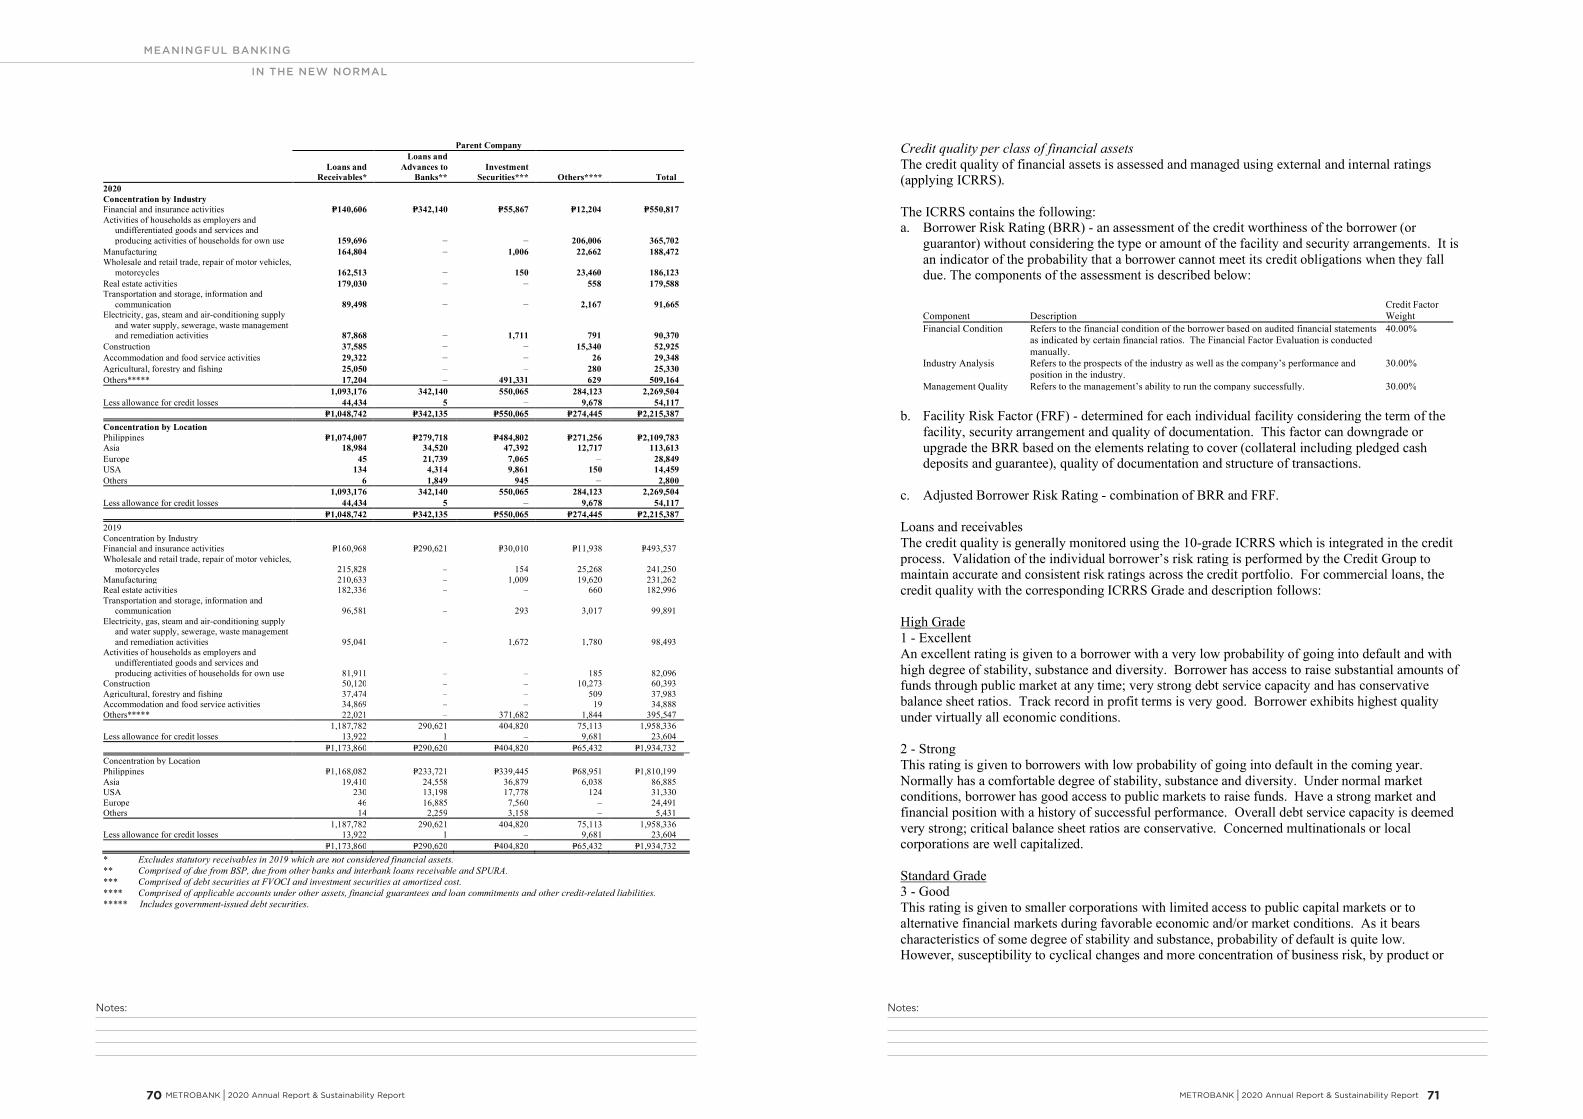
Notes:Notes:
MEANINGFUL BANKING
IN THE NEW NORMAL
METROBANK I 2020 Annual Report & Sustainability Report 71 70 METROBANK I 2020 Annual Report & Sustainability Report
- 39 -
*SGVFSM005911*
Parent Company
Loans andReceivables*
Loans andAdvances to
Banks**Investment
Securities*** Others**** Total2020Concentration by IndustryFinancial and insurance activities P=140,606 P=342,140 P=55,867 P=12,204 P=550,817Activities of households as employers and
undifferentiated goods and services andproducing activities of households for own use 159,696 – – 206,006 365,702
Manufacturing 164,804 – 1,006 22,662 188,472Wholesale and retail trade, repair of motor vehicles,
motorcycles 162,513 – 150 23,460 186,123Real estate activities 179,030 – – 558 179,588Transportation and storage, information and
communication 89,498 – – 2,167 91,665Electricity, gas, steam and air-conditioning supply
and water supply, sewerage, waste managementand remediation activities 87,868 – 1,711 791 90,370
Construction 37,585 – – 15,340 52,925Accommodation and food service activities 29,322 – – 26 29,348Agricultural, forestry and fishing 25,050 – – 280 25,330Others***** 17,204 – 491,331 629 509,164
1,093,176 342,140 550,065 284,123 2,269,504Less allowance for credit losses 44,434 5 – 9,678 54,117
P=1,048,742 P=342,135 P=550,065 P=274,445 P=2,215,387Concentration by LocationPhilippines P=1,074,007 P=279,718 P=484,802 P=271,256 P=2,109,783Asia 18,984 34,520 47,392 12,717 113,613Europe 45 21,739 7,065 – 28,849USA 134 4,314 9,861 150 14,459Others 6 1,849 945 – 2,800
1,093,176 342,140 550,065 284,123 2,269,504Less allowance for credit losses 44,434 5 – 9,678 54,117
P=1,048,742 P=342,135 P=550,065 P=274,445 P=2,215,3872019Concentration by IndustryFinancial and insurance activities P=160,968 P=290,621 P=30,010 P=11,938 P=493,537Wholesale and retail trade, repair of motor vehicles,
motorcycles 215,828 ‒ 154 25,268 241,250Manufacturing 210,633 ‒ 1,009 19,620 231,262Real estate activities 182,336 ‒ ‒ 660 182,996Transportation and storage, information and
communication 96,581 ‒ 293 3,017 99,891Electricity, gas, steam and air-conditioning supply
and water supply, sewerage, waste managementand remediation activities 95,041 ‒ 1,672 1,780 98,493
Activities of households as employers andundifferentiated goods and services andproducing activities of households for own use 81,911 ‒ ‒ 185 82,096
Construction 50,120 ‒ ‒ 10,273 60,393Agricultural, forestry and fishing 37,474 ‒ ‒ 509 37,983Accommodation and food service activities 34,869 ‒ ‒ 19 34,888Others***** 22,021 ‒ 371,682 1,844 395,547
1,187,782 290,621 404,820 75,113 1,958,336Less allowance for credit losses 13,922 1 ‒ 9,681 23,604
P=1,173,860 P=290,620 P=404,820 P=65,432 P=1,934,732Concentration by LocationPhilippines P=1,168,082 P=233,721 P=339,445 P=68,951 P=1,810,199Asia 19,410 24,558 36,879 6,038 86,885USA 230 13,198 17,778 124 31,330Europe 46 16,885 7,560 ‒ 24,491Others 14 2,259 3,158 ‒ 5,431
1,187,782 290,621 404,820 75,113 1,958,336Less allowance for credit losses 13,922 1 ‒ 9,681 23,604
P=1,173,860 P=290,620 P=404,820 P=65,432 P=1,934,732* Excludes statutory receivables in 2019 which are not considered financial assets.** Comprised of due from BSP, due from other banks and interbank loans receivable and SPURA.*** Comprised of debt securities at FVOCI and investment securities at amortized cost.**** Comprised of applicable accounts under other assets, financial guarantees and loan commitments and other credit-related liabilities.***** Includes government-issued debt securities.
- 40 -
*SGVFSM005911*
Credit quality per class of financial assetsThe credit quality of financial assets is assessed and managed using external and internal ratings(applying ICRRS).
The ICRRS contains the following:a. Borrower Risk Rating (BRR) - an assessment of the credit worthiness of the borrower (or
guarantor) without considering the type or amount of the facility and security arrangements. It isan indicator of the probability that a borrower cannot meet its credit obligations when they falldue. The components of the assessment is described below:
Component DescriptionCredit FactorWeight
Financial Condition Refers to the financial condition of the borrower based on audited financial statementsas indicated by certain financial ratios. The Financial Factor Evaluation is conductedmanually.
40.00%
Industry Analysis Refers to the prospects of the industry as well as the company’s performance andposition in the industry.
30.00%
Management Quality Refers to the management’s ability to run the company successfully. 30.00%
b. Facility Risk Factor (FRF) - determined for each individual facility considering the term of thefacility, security arrangement and quality of documentation. This factor can downgrade orupgrade the BRR based on the elements relating to cover (collateral including pledged cashdeposits and guarantee), quality of documentation and structure of transactions.
c. Adjusted Borrower Risk Rating - combination of BRR and FRF.
Loans and receivablesThe credit quality is generally monitored using the 10-grade ICRRS which is integrated in the creditprocess. Validation of the individual borrower’s risk rating is performed by the Credit Group tomaintain accurate and consistent risk ratings across the credit portfolio. For commercial loans, thecredit quality with the corresponding ICRRS Grade and description follows:
High Grade1 - ExcellentAn excellent rating is given to a borrower with a very low probability of going into default and withhigh degree of stability, substance and diversity. Borrower has access to raise substantial amounts offunds through public market at any time; very strong debt service capacity and has conservativebalance sheet ratios. Track record in profit terms is very good. Borrower exhibits highest qualityunder virtually all economic conditions.
2 - StrongThis rating is given to borrowers with low probability of going into default in the coming year.Normally has a comfortable degree of stability, substance and diversity. Under normal marketconditions, borrower has good access to public markets to raise funds. Have a strong market andfinancial position with a history of successful performance. Overall debt service capacity is deemedvery strong; critical balance sheet ratios are conservative. Concerned multinationals or localcorporations are well capitalized.
Standard Grade3 - GoodThis rating is given to smaller corporations with limited access to public capital markets or toalternative financial markets during favorable economic and/or market conditions. As it bearscharacteristics of some degree of stability and substance, probability of default is quite low.However, susceptibility to cyclical changes and more concentration of business risk, by product or

Notes:Notes:
MEANINGFUL BANKING
IN THE NEW NORMAL
METROBANK I 2020 Annual Report & Sustainability Report 73 72 METROBANK I 2020 Annual Report & Sustainability Report
- 41 -
*SGVFSM005911*
market, may be present. Typical is the combination of comfortable asset protection and anacceptable balance sheet structure. Debt service capacity is strong.
4 - SatisfactoryA ‘satisfactory’ rating is given to a borrower where clear risk elements exist and probability ofdefault is somewhat greater. Due to volatility of earnings and overall performance, borrowernormally has limited access to public markets. Borrower should be able to withstand normalbusiness cycles, but any prolonged unfavorable economic period would create deterioration beyondacceptable levels. With the combination of reasonable sound asset and cash flow protection, the debtservice capacity is adequate. Reported profits in the past year and is expected to report a profit in thecurrent year.
5 - AcceptableAn ‘acceptable’ rating is given to a borrower whose risk elements are sufficiently pronouncedalthough borrower should still be able to withstand normal business cycles. Any prolongedunfavorable economic and/or market period would create an immediate deterioration beyondacceptable levels. Risk is still acceptable as there is sufficient cash flow either historically orexpected in the future from new business or projected finance transaction; an existing borrowerwhere the nature of the exposure represents a higher risk because of extraordinary developments butfor which a decreasing risk within an acceptable period can be expected.
Substandard Grade6 - WatchlistThis rating is given to a borrower that belongs to an unfavorable industry or has company-specificrisk factors which represent a concern. Operating performance and financial strength may bemarginal and it is uncertain if borrower can attract alternative course of finance. Borrower finds ithard to cope with any significant economic downturn and a default in such a case is more than apossibility. Borrower which incurs net losses and has salient financial weaknesses specifically inprofitability. Credit exposure is not at risk of loss at the moment but performance of the borrowerhas weakened which, unless present trends are reversed, could lead to losses.
7 - Especially MentionedThis rating is given to a borrower that exhibits potential weaknesses that deserve management’s closeattention. These potential weaknesses, if left uncorrected, may affect the repayment of the loan andthus, increase credit risk of the Group.
Impaired8 - SubstandardThese are loans or portions thereof which appear to involve a substantial and unreasonable degree ofrisk to the Group because of unfavorable record or unsatisfactory characteristics. There exists thepossibility of future losses to the Group unless given closer supervision. Borrower has well-definedweaknesses or weaknesses that jeopardize loan liquidation. Such well-defined weaknesses mayinclude adverse trends or development of financial, managerial, economic or political nature, or asignificant weakness in collateral.
9 - DoubtfulThis rating is given to a nonperforming borrower whose loans or portions thereof have theweaknesses inherent in those classified as Substandard, with the added characteristics that existingfacts, conditions, and values make collection or liquidation in full, highly improbable and in whichsubstantial loss is probable.
- 42 -
*SGVFSM005911*
10 - LossThis rating is given to a borrower whose loans or portions thereof are considered uncollectible orworthless and of such little value that their continuance as bankable assets is not warranted althoughthe loans may have some recoveries or salvage value. The amount of loss is difficult to measure andit is not practical or desirable to defer writing off these basically worthless assets even though partialrecovery may be obtained in the future.
The credit quality of consumer loan applicants are currently evaluated using quantitative andqualitative criteria. For booked consumer loans, the description of credit quality is as follows:
High GradeGood credit ratingThis rating is given to a good repeat client with very satisfactory track record of its loan repayment(paid at least 50.00%) and whose account did not turn past due during the entire term of the loan.
Standard GradeGoodA good rating is given to accounts which did not turn past due for 90 days and over.
LimitedThis rating is given to borrowers who have average track record on loan repayment (paid less than50.00%) and whose account did not turn past due for 90 days and over.
Substandard GradePoorA poor rating is given to accounts who reached 90 days past due regardless of the number of timesand the number of months past due.
Poor litigationThis rating is given to accounts that were past due for 180 days and over and are currently beinghandled by lawyers.
ImpairedPoor repossessedThis rating is given to accounts whose collaterals were repossessed.
Poor written-offThis rating is given to accounts that were recommended for write-off.
Investment securitiesIn ensuring quality investment portfolio, the Group uses the credit risk rating from the published dataproviders like Moody’s, Standard & Poor’s (S&P) or other reputable rating agencies. The followingindicates the levels of equivalent credit quality and its relevant external rating:
Credit Quality External RatingHigh grade Aaa Aa1 Aa2 A1 A2 A3 Baa1 Baa2 Baa3Standard grade Ba1 Ba2 Ba3 B1 B2Substandard grade B3 Caa1 Caa2 Caa3 Ca CImpaired D
The Group considers a debt security to have low credit risk when its credit risk rating is equivalent tothose rated by external rating agencies as ‘Investment grade’ (i.e., those under High grade in the tableabove).
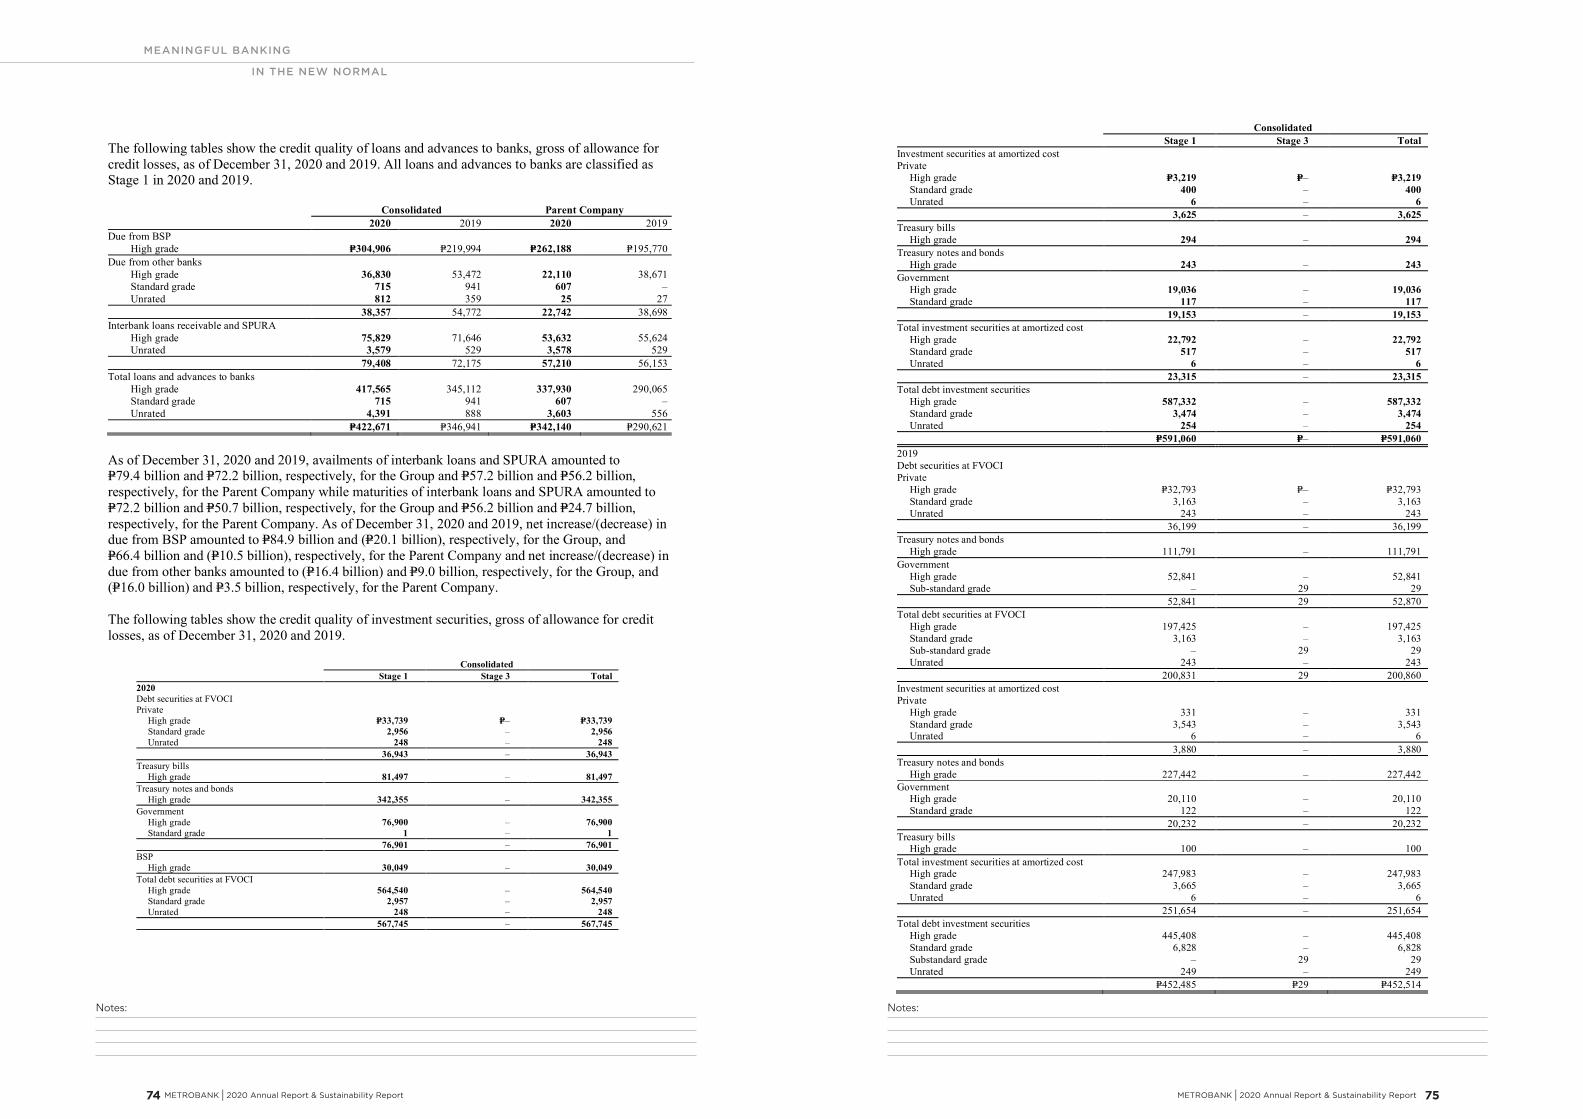
Notes:Notes:
MEANINGFUL BANKING
IN THE NEW NORMAL
METROBANK I 2020 Annual Report & Sustainability Report 75 74 METROBANK I 2020 Annual Report & Sustainability Report
- 43 -
*SGVFSM005911*
The following tables show the credit quality of loans and advances to banks, gross of allowance forcredit losses, as of December 31, 2020 and 2019. All loans and advances to banks are classified asStage 1 in 2020 and 2019.
Consolidated Parent Company2020 2019 2020 2019
Due from BSPHigh grade P=304,906 P=219,994 P=262,188 P=195,770
Due from other banksHigh grade 36,830 53,472 22,110 38,671Standard grade 715 941 607 –Unrated 812 359 25 27
38,357 54,772 22,742 38,698Interbank loans receivable and SPURA
High grade 75,829 71,646 53,632 55,624Unrated 3,579 529 3,578 529
79,408 72,175 57,210 56,153Total loans and advances to banks
High grade 417,565 345,112 337,930 290,065Standard grade 715 941 607 –Unrated 4,391 888 3,603 556
P=422,671 P=346,941 P=342,140 P=290,621
As of December 31, 2020 and 2019, availments of interbank loans and SPURA amounted toP=79.4 billion and P=72.2 billion, respectively, for the Group and P=57.2 billion and P=56.2 billion,respectively, for the Parent Company while maturities of interbank loans and SPURA amounted toP=72.2 billion and P=50.7 billion, respectively, for the Group and P=56.2 billion and P=24.7 billion,respectively, for the Parent Company. As of December 31, 2020 and 2019, net increase/(decrease) indue from BSP amounted to P=84.9 billion and (P=20.1 billion), respectively, for the Group, andP=66.4 billion and (P=10.5 billion), respectively, for the Parent Company and net increase/(decrease) indue from other banks amounted to (P=16.4 billion) and P=9.0 billion, respectively, for the Group, and(P=16.0 billion) and P=3.5 billion, respectively, for the Parent Company.
The following tables show the credit quality of investment securities, gross of allowance for creditlosses, as of December 31, 2020 and 2019.
ConsolidatedStage 1 Stage 3 Total
2020Debt securities at FVOCIPrivate
High grade P=33,739 P=– P=33,739Standard grade 2,956 – 2,956Unrated 248 – 248
36,943 – 36,943Treasury bills
High grade 81,497 – 81,497Treasury notes and bonds
High grade 342,355 – 342,355Government
High grade 76,900 – 76,900Standard grade 1 – 1
76,901 – 76,901BSP
High grade 30,049 – 30,049Total debt securities at FVOCI
High grade 564,540 – 564,540Standard grade 2,957 – 2,957Unrated 248 – 248
567,745 – 567,745
- 44 -
*SGVFSM005911*
ConsolidatedStage 1 Stage 3 Total
Investment securities at amortized costPrivate
High grade P=3,219 P=– P=3,219Standard grade 400 – 400Unrated 6 – 6
3,625 – 3,625Treasury bills
High grade 294 – 294Treasury notes and bonds
High grade 243 – 243Government
High grade 19,036 – 19,036Standard grade 117 – 117
19,153 – 19,153Total investment securities at amortized cost
High grade 22,792 – 22,792Standard grade 517 – 517Unrated 6 – 6
23,315 – 23,315Total debt investment securities
High grade 587,332 – 587,332Standard grade 3,474 – 3,474Unrated 254 – 254
P=591,060 P=– P=591,0602019Debt securities at FVOCIPrivate
High grade P=32,793 P=– P=32,793Standard grade 3,163 – 3,163Unrated 243 – 243
36,199 – 36,199Treasury notes and bonds
High grade 111,791 – 111,791Government
High grade 52,841 – 52,841Sub-standard grade – 29 29
52,841 29 52,870Total debt securities at FVOCI
High grade 197,425 – 197,425Standard grade 3,163 – 3,163Sub-standard grade – 29 29Unrated 243 – 243
200,831 29 200,860Investment securities at amortized costPrivate
High grade 331 – 331Standard grade 3,543 – 3,543Unrated 6 – 6
3,880 – 3,880Treasury notes and bonds
High grade 227,442 – 227,442Government
High grade 20,110 – 20,110Standard grade 122 – 122
20,232 – 20,232Treasury bills
High grade 100 – 100Total investment securities at amortized cost
High grade 247,983 – 247,983Standard grade 3,665 – 3,665Unrated 6 – 6
251,654 – 251,654Total debt investment securities
High grade 445,408 – 445,408Standard grade 6,828 – 6,828Substandard grade – 29 29Unrated 249 – 249
P=452,485 P=29 P=452,514
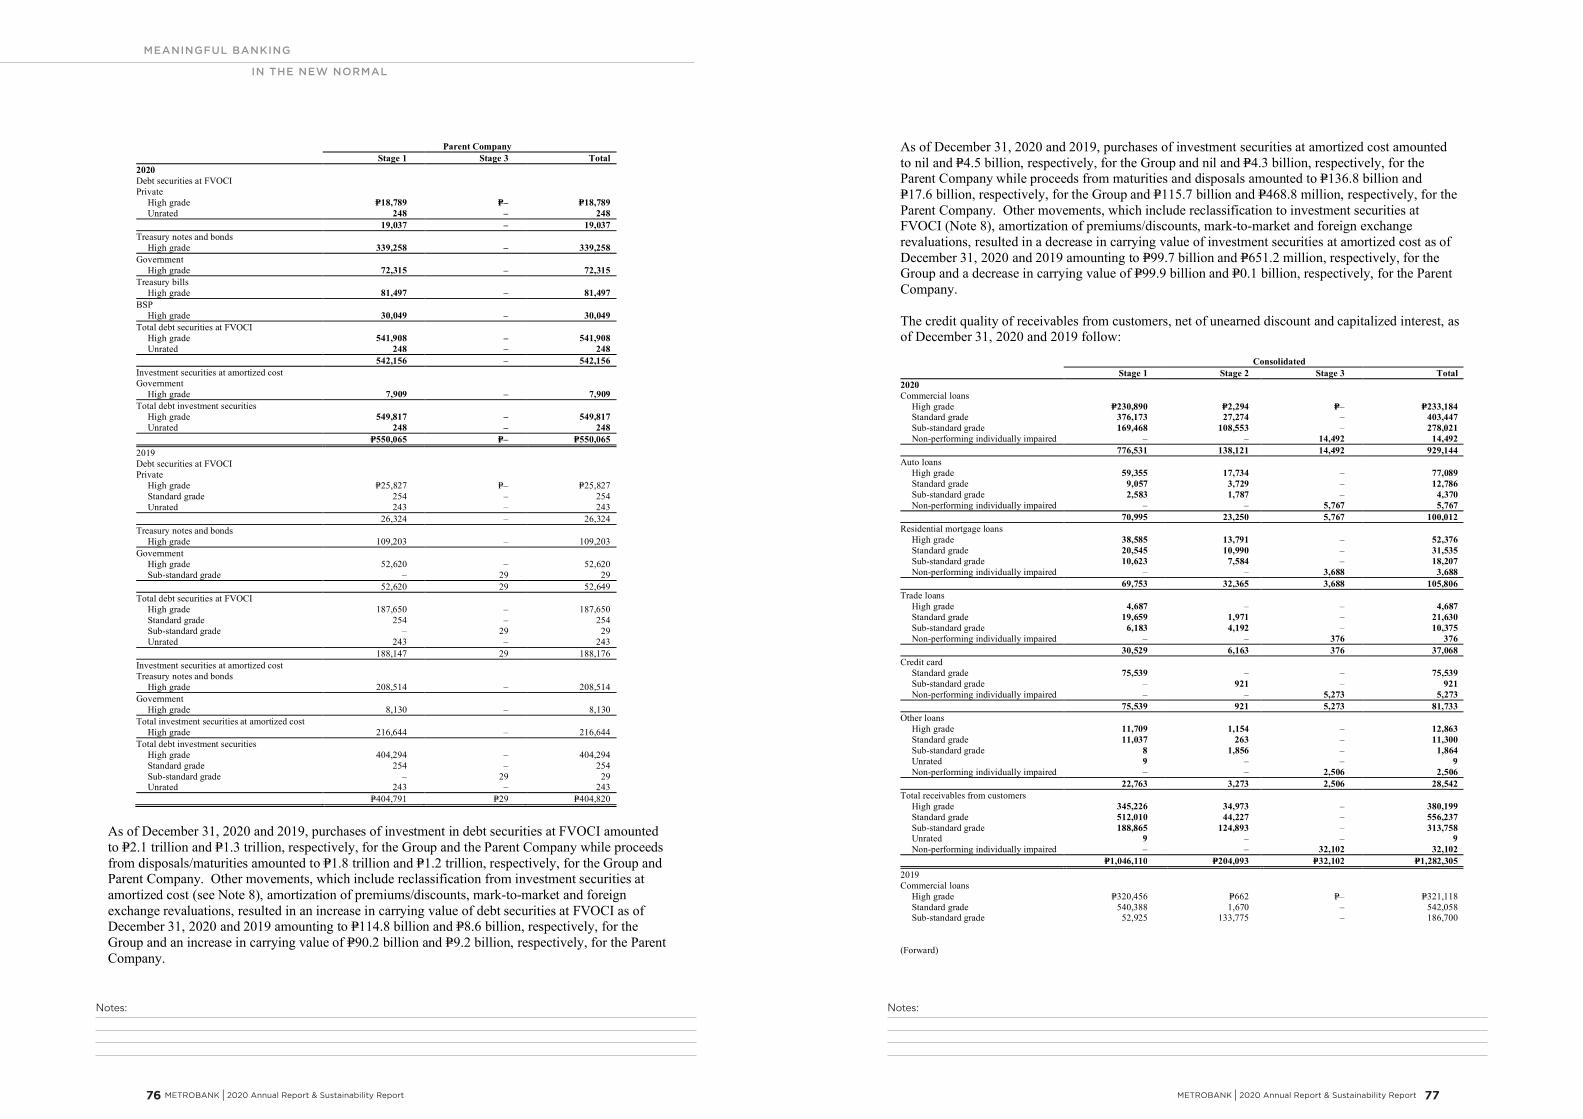
Notes:Notes:
MEANINGFUL BANKING
IN THE NEW NORMAL
METROBANK I 2020 Annual Report & Sustainability Report 77 76 METROBANK I 2020 Annual Report & Sustainability Report
- 45 -
*SGVFSM005911*
Parent CompanyStage 1 Stage 3 Total
2020Debt securities at FVOCIPrivate
High grade P=18,789 P=– P=18,789Unrated 248 – 248
19,037 – 19,037Treasury notes and bonds
High grade 339,258 – 339,258Government
High grade 72,315 – 72,315Treasury bills
High grade 81,497 – 81,497BSP
High grade 30,049 – 30,049Total debt securities at FVOCI
High grade 541,908 – 541,908Unrated 248 – 248
542,156 – 542,156Investment securities at amortized costGovernment High grade 7,909 – 7,909Total debt investment securities
High grade 549,817 – 549,817Unrated 248 – 248
P=550,065 P=– P=550,0652019Debt securities at FVOCIPrivate
High grade P=25,827 P=– P=25,827Standard grade 254 – 254Unrated 243 – 243
26,324 – 26,324Treasury notes and bonds
High grade 109,203 – 109,203Government
High grade 52,620 – 52,620Sub-standard grade – 29 29
52,620 29 52,649Total debt securities at FVOCI
High grade 187,650 – 187,650Standard grade 254 – 254Sub-standard grade – 29 29Unrated 243 – 243
188,147 29 188,176Investment securities at amortized costTreasury notes and bonds
High grade 208,514 – 208,514Government
High grade 8,130 – 8,130Total investment securities at amortized cost
High grade 216,644 – 216,644Total debt investment securities
High grade 404,294 – 404,294Standard grade 254 – 254Sub-standard grade – 29 29Unrated 243 – 243
P=404,791 P=29 P=404,820
As of December 31, 2020 and 2019, purchases of investment in debt securities at FVOCI amountedto P=2.1 trillion and P=1.3 trillion, respectively, for the Group and the Parent Company while proceedsfrom disposals/maturities amounted to P=1.8 trillion and P=1.2 trillion, respectively, for the Group andParent Company. Other movements, which include reclassification from investment securities atamortized cost (see Note 8), amortization of premiums/discounts, mark-to-market and foreignexchange revaluations, resulted in an increase in carrying value of debt securities at FVOCI as ofDecember 31, 2020 and 2019 amounting to P=114.8 billion and P=8.6 billion, respectively, for theGroup and an increase in carrying value of P=90.2 billion and P=9.2 billion, respectively, for the ParentCompany.
- 46 -
*SGVFSM005911*
As of December 31, 2020 and 2019, purchases of investment securities at amortized cost amountedto nil and P=4.5 billion, respectively, for the Group and nil and P=4.3 billion, respectively, for theParent Company while proceeds from maturities and disposals amounted to P=136.8 billion andP=17.6 billion, respectively, for the Group and P=115.7 billion and P=468.8 million, respectively, for theParent Company. Other movements, which include reclassification to investment securities atFVOCI (Note 8), amortization of premiums/discounts, mark-to-market and foreign exchangerevaluations, resulted in a decrease in carrying value of investment securities at amortized cost as ofDecember 31, 2020 and 2019 amounting to P=99.7 billion and P=651.2 million, respectively, for theGroup and a decrease in carrying value of P=99.9 billion and P=0.1 billion, respectively, for the ParentCompany.
The credit quality of receivables from customers, net of unearned discount and capitalized interest, asof December 31, 2020 and 2019 follow:
ConsolidatedStage 1 Stage 2 Stage 3 Total
2020Commercial loans
High grade P=230,890 P=2,294 P=– P=233,184Standard grade 376,173 27,274 – 403,447Sub-standard grade 169,468 108,553 – 278,021Non-performing individually impaired – – 14,492 14,492
776,531 138,121 14,492 929,144Auto loans
High grade 59,355 17,734 – 77,089Standard grade 9,057 3,729 – 12,786Sub-standard grade 2,583 1,787 – 4,370Non-performing individually impaired – – 5,767 5,767
70,995 23,250 5,767 100,012Residential mortgage loans
High grade 38,585 13,791 – 52,376Standard grade 20,545 10,990 – 31,535Sub-standard grade 10,623 7,584 – 18,207Non-performing individually impaired – – 3,688 3,688
69,753 32,365 3,688 105,806Trade loans
High grade 4,687 – – 4,687Standard grade 19,659 1,971 – 21,630Sub-standard grade 6,183 4,192 – 10,375Non-performing individually impaired – – 376 376
30,529 6,163 376 37,068Credit card
Standard grade 75,539 – – 75,539Sub-standard grade – 921 – 921Non-performing individually impaired – – 5,273 5,273
75,539 921 5,273 81,733Other loans
High grade 11,709 1,154 – 12,863Standard grade 11,037 263 – 11,300Sub-standard grade 8 1,856 – 1,864Unrated 9 – – 9Non-performing individually impaired – – 2,506 2,506
22,763 3,273 2,506 28,542Total receivables from customers
High grade 345,226 34,973 – 380,199Standard grade 512,010 44,227 – 556,237Sub-standard grade 188,865 124,893 – 313,758Unrated 9 – – 9Non-performing individually impaired – – 32,102 32,102
P=1,046,110 P=204,093 P=32,102 P=1,282,3052019Commercial loans
High grade P=320,456 P=662 P=– P=321,118Standard grade 540,388 1,670 – 542,058Sub-standard grade 52,925 133,775 – 186,700
(Forward)
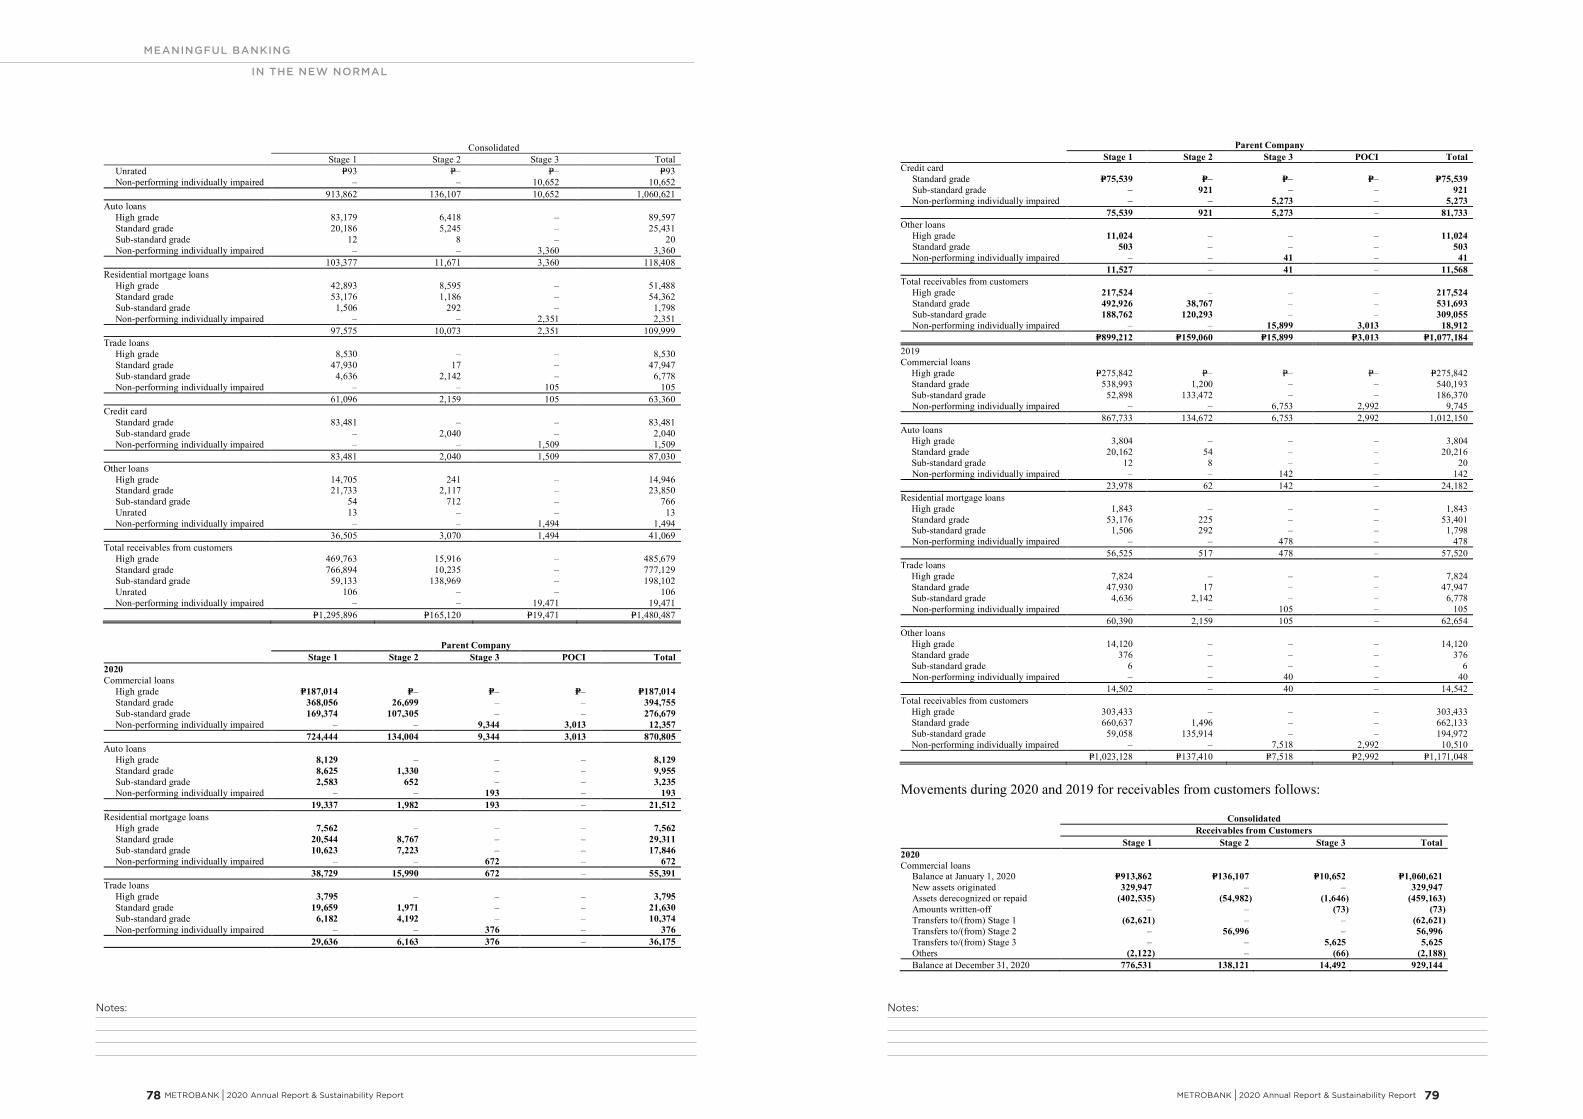
Notes:Notes:
MEANINGFUL BANKING
IN THE NEW NORMAL
METROBANK I 2020 Annual Report & Sustainability Report 79 78 METROBANK I 2020 Annual Report & Sustainability Report
- 47 -
*SGVFSM005911*
ConsolidatedStage 1 Stage 2 Stage 3 Total
Unrated P=93 P=– P=– P=93 Non-performing individually impaired – – 10,652 10,652
913,862 136,107 10,652 1,060,621Auto loans High grade 83,179 6,418 – 89,597 Standard grade 20,186 5,245 – 25,431 Sub-standard grade 12 8 – 20 Non-performing individually impaired – – 3,360 3,360
103,377 11,671 3,360 118,408Residential mortgage loans
High grade 42,893 8,595 – 51,488Standard grade 53,176 1,186 – 54,362Sub-standard grade 1,506 292 – 1,798Non-performing individually impaired – – 2,351 2,351
97,575 10,073 2,351 109,999Trade loans
High grade 8,530 – – 8,530Standard grade 47,930 17 – 47,947Sub-standard grade 4,636 2,142 – 6,778Non-performing individually impaired – – 105 105
61,096 2,159 105 63,360Credit card
Standard grade 83,481 – – 83,481Sub-standard grade – 2,040 – 2,040Non-performing individually impaired – – 1,509 1,509
83,481 2,040 1,509 87,030Other loans
High grade 14,705 241 – 14,946Standard grade 21,733 2,117 – 23,850Sub-standard grade 54 712 – 766Unrated 13 – – 13Non-performing individually impaired – – 1,494 1,494
36,505 3,070 1,494 41,069Total receivables from customers
High grade 469,763 15,916 – 485,679Standard grade 766,894 10,235 – 777,129Sub-standard grade 59,133 138,969 – 198,102Unrated 106 – – 106Non-performing individually impaired – – 19,471 19,471
P=1,295,896 P=165,120 P=19,471 P=1,480,487
Parent CompanyStage 1 Stage 2 Stage 3 POCI Total
2020Commercial loans
High grade P=187,014 P=– P=– P=– P=187,014Standard grade 368,056 26,699 – – 394,755Sub-standard grade 169,374 107,305 – – 276,679Non-performing individually impaired – – 9,344 3,013 12,357
724,444 134,004 9,344 3,013 870,805Auto loans
High grade 8,129 – – – 8,129Standard grade 8,625 1,330 – – 9,955Sub-standard grade 2,583 652 – – 3,235Non-performing individually impaired – – 193 – 193
19,337 1,982 193 – 21,512Residential mortgage loans
High grade 7,562 – – – 7,562Standard grade 20,544 8,767 – – 29,311Sub-standard grade 10,623 7,223 – – 17,846Non-performing individually impaired – – 672 – 672
38,729 15,990 672 – 55,391Trade loans
High grade 3,795 – – – 3,795Standard grade 19,659 1,971 – – 21,630Sub-standard grade 6,182 4,192 – – 10,374Non-performing individually impaired – – 376 – 376
29,636 6,163 376 – 36,175
- 48 -
*SGVFSM005911*
Parent CompanyStage 1 Stage 2 Stage 3 POCI Total
Credit cardStandard grade P=75,539 P=– P=– P=– P=75,539Sub-standard grade – 921 – – 921Non-performing individually impaired – – 5,273 – 5,273
75,539 921 5,273 – 81,733Other loans
High grade 11,024 – – – 11,024Standard grade 503 – – – 503Non-performing individually impaired – – 41 – 41
11,527 – 41 – 11,568Total receivables from customers
High grade 217,524 – – – 217,524Standard grade 492,926 38,767 – – 531,693Sub-standard grade 188,762 120,293 – – 309,055Non-performing individually impaired – – 15,899 3,013 18,912
P=899,212 P=159,060 P=15,899 P=3,013 P=1,077,1842019Commercial loans
High grade P=275,842 P=– P=– P=– P=275,842Standard grade 538,993 1,200 – – 540,193Sub-standard grade 52,898 133,472 – – 186,370Non-performing individually impaired – – 6,753 2,992 9,745
867,733 134,672 6,753 2,992 1,012,150Auto loans
High grade 3,804 – – – 3,804Standard grade 20,162 54 – – 20,216Sub-standard grade 12 8 – – 20Non-performing individually impaired – – 142 – 142
23,978 62 142 – 24,182Residential mortgage loans
High grade 1,843 – – – 1,843Standard grade 53,176 225 – – 53,401Sub-standard grade 1,506 292 – – 1,798Non-performing individually impaired – – 478 – 478
56,525 517 478 – 57,520Trade loans
High grade 7,824 – – – 7,824Standard grade 47,930 17 – – 47,947Sub-standard grade 4,636 2,142 – – 6,778Non-performing individually impaired – – 105 – 105
60,390 2,159 105 – 62,654Other loans
High grade 14,120 – – – 14,120Standard grade 376 – – – 376Sub-standard grade 6 – – – 6Non-performing individually impaired – – 40 – 40
14,502 – 40 – 14,542Total receivables from customers
High grade 303,433 – – – 303,433Standard grade 660,637 1,496 – – 662,133Sub-standard grade 59,058 135,914 – – 194,972Non-performing individually impaired – – 7,518 2,992 10,510
P=1,023,128 P=137,410 P=7,518 P=2,992 P=1,171,048
Movements during 2020 and 2019 for receivables from customers follows:
ConsolidatedReceivables from Customers
Stage 1 Stage 2 Stage 3 Total2020Commercial loans
Balance at January 1, 2020 P=913,862 P=136,107 P=10,652 P=1,060,621New assets originated 329,947 – – 329,947Assets derecognized or repaid (402,535) (54,982) (1,646) (459,163)Amounts written-off – – (73) (73)Transfers to/(from) Stage 1 (62,621) – – (62,621)Transfers to/(from) Stage 2 – 56,996 – 56,996Transfers to/(from) Stage 3 – – 5,625 5,625Others (2,122) – (66) (2,188)Balance at December 31, 2020 776,531 138,121 14,492 929,144
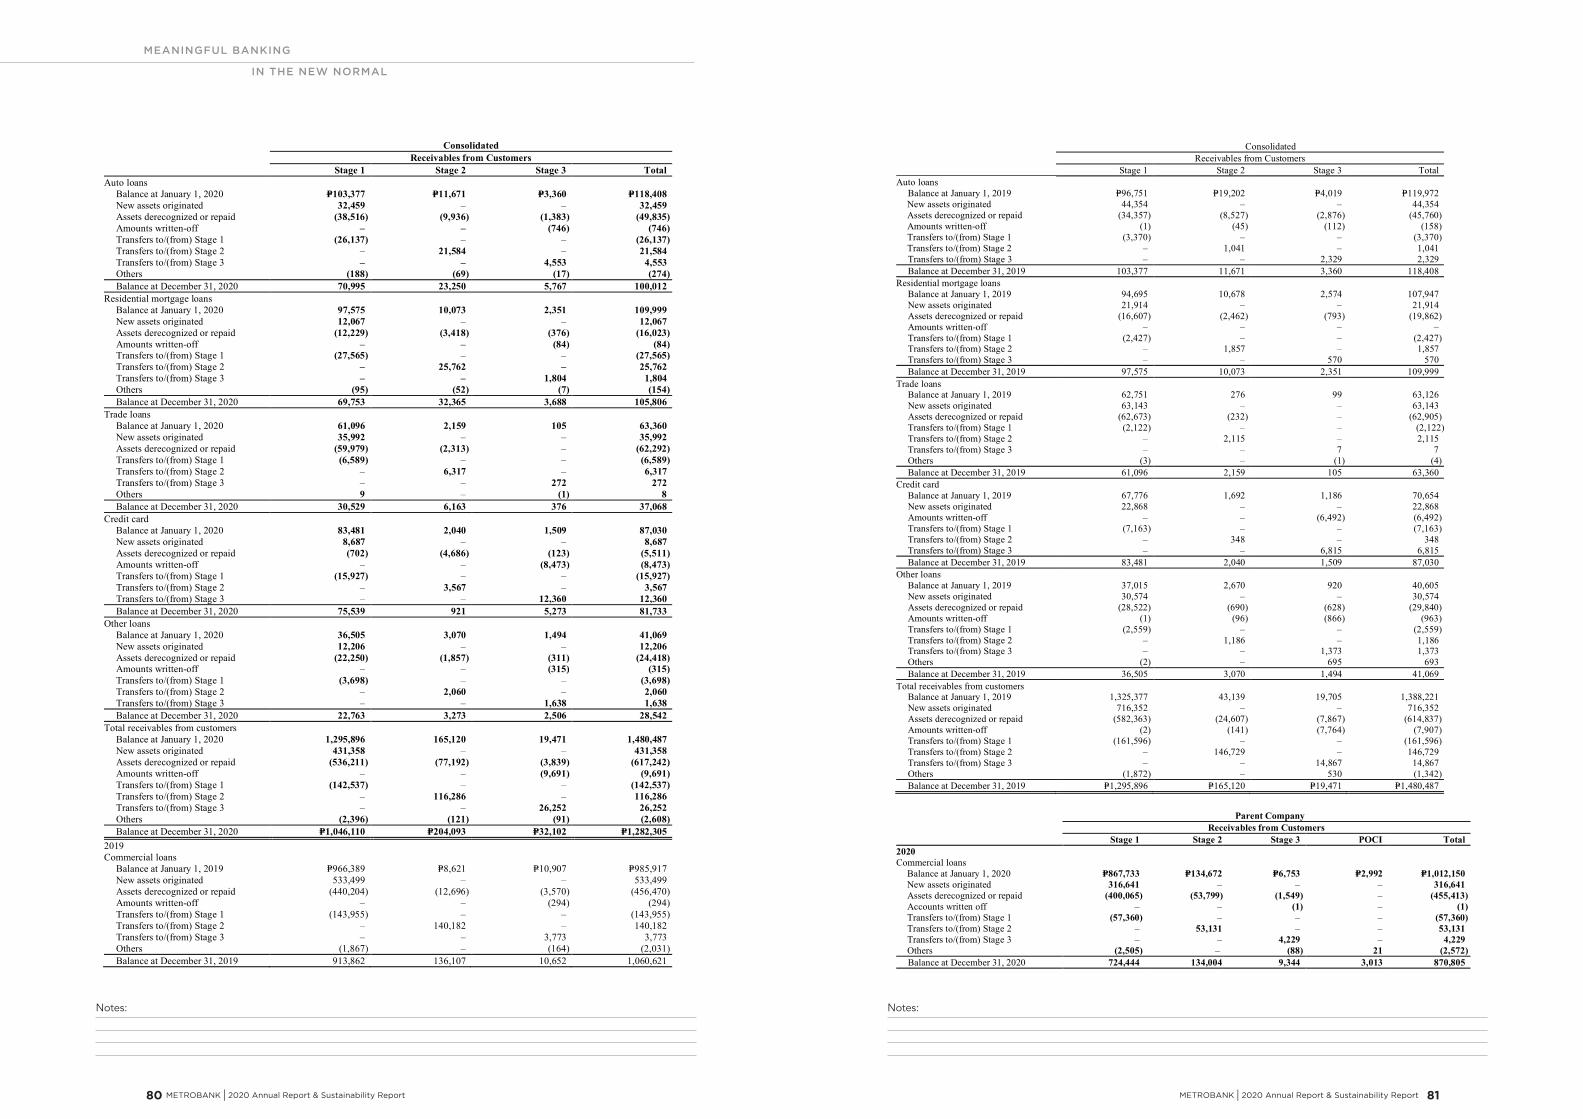
Notes:Notes:
MEANINGFUL BANKING
IN THE NEW NORMAL
METROBANK I 2020 Annual Report & Sustainability Report 81 80 METROBANK I 2020 Annual Report & Sustainability Report
- 49 -
*SGVFSM005911*
ConsolidatedReceivables from Customers
Stage 1 Stage 2 Stage 3 TotalAuto loans
Balance at January 1, 2020 P=103,377 P=11,671 P=3,360 P=118,408New assets originated 32,459 – – 32,459Assets derecognized or repaid (38,516) (9,936) (1,383) (49,835)Amounts written-off – – (746) (746)Transfers to/(from) Stage 1 (26,137) – – (26,137)Transfers to/(from) Stage 2 – 21,584 – 21,584Transfers to/(from) Stage 3 – – 4,553 4,553Others (188) (69) (17) (274)Balance at December 31, 2020 70,995 23,250 5,767 100,012
Residential mortgage loansBalance at January 1, 2020 97,575 10,073 2,351 109,999New assets originated 12,067 – – 12,067Assets derecognized or repaid (12,229) (3,418) (376) (16,023)Amounts written-off – – (84) (84)Transfers to/(from) Stage 1 (27,565) – – (27,565)Transfers to/(from) Stage 2 – 25,762 – 25,762Transfers to/(from) Stage 3 – – 1,804 1,804Others (95) (52) (7) (154)Balance at December 31, 2020 69,753 32,365 3,688 105,806
Trade loansBalance at January 1, 2020 61,096 2,159 105 63,360New assets originated 35,992 – – 35,992Assets derecognized or repaid (59,979) (2,313) – (62,292)Transfers to/(from) Stage 1 (6,589) – – (6,589)Transfers to/(from) Stage 2 – 6,317 – 6,317Transfers to/(from) Stage 3 – – 272 272Others 9 – (1) 8Balance at December 31, 2020 30,529 6,163 376 37,068
Credit cardBalance at January 1, 2020 83,481 2,040 1,509 87,030New assets originated 8,687 – – 8,687Assets derecognized or repaid (702) (4,686) (123) (5,511)Amounts written-off – – (8,473) (8,473)Transfers to/(from) Stage 1 (15,927) – – (15,927)Transfers to/(from) Stage 2 – 3,567 – 3,567Transfers to/(from) Stage 3 – – 12,360 12,360Balance at December 31, 2020 75,539 921 5,273 81,733
Other loansBalance at January 1, 2020 36,505 3,070 1,494 41,069New assets originated 12,206 – – 12,206Assets derecognized or repaid (22,250) (1,857) (311) (24,418)Amounts written-off – – (315) (315)Transfers to/(from) Stage 1 (3,698) – – (3,698)Transfers to/(from) Stage 2 – 2,060 – 2,060Transfers to/(from) Stage 3 – – 1,638 1,638Balance at December 31, 2020 22,763 3,273 2,506 28,542
Total receivables from customersBalance at January 1, 2020 1,295,896 165,120 19,471 1,480,487New assets originated 431,358 – – 431,358Assets derecognized or repaid (536,211) (77,192) (3,839) (617,242)Amounts written-off – – (9,691) (9,691)Transfers to/(from) Stage 1 (142,537) – – (142,537)Transfers to/(from) Stage 2 – 116,286 – 116,286Transfers to/(from) Stage 3 – – 26,252 26,252Others (2,396) (121) (91) (2,608)Balance at December 31, 2020 P=1,046,110 P=204,093 P=32,102 P=1,282,305
2019Commercial loans
Balance at January 1, 2019 P=966,389 P=8,621 P=10,907 P=985,917New assets originated 533,499 – – 533,499Assets derecognized or repaid (440,204) (12,696) (3,570) (456,470)Amounts written-off – – (294) (294)Transfers to/(from) Stage 1 (143,955) – – (143,955)Transfers to/(from) Stage 2 – 140,182 – 140,182Transfers to/(from) Stage 3 – – 3,773 3,773Others (1,867) – (164) (2,031)Balance at December 31, 2019 913,862 136,107 10,652 1,060,621
- 50 -
*SGVFSM005911*
ConsolidatedReceivables from Customers
Stage 1 Stage 2 Stage 3 TotalAuto loans Balance at January 1, 2019 P=96,751 P=19,202 P=4,019 P=119,972 New assets originated 44,354 – – 44,354 Assets derecognized or repaid (34,357) (8,527) (2,876) (45,760) Amounts written-off (1) (45) (112) (158) Transfers to/(from) Stage 1 (3,370) – – (3,370) Transfers to/(from) Stage 2 – 1,041 – 1,041 Transfers to/(from) Stage 3 – – 2,329 2,329 Balance at December 31, 2019 103,377 11,671 3,360 118,408Residential mortgage loans
Balance at January 1, 2019 94,695 10,678 2,574 107,947New assets originated 21,914 – – 21,914Assets derecognized or repaid (16,607) (2,462) (793) (19,862)Amounts written-off – – – –Transfers to/(from) Stage 1 (2,427) – – (2,427)Transfers to/(from) Stage 2 – 1,857 – 1,857Transfers to/(from) Stage 3 – – 570 570Balance at December 31, 2019 97,575 10,073 2,351 109,999
Trade loansBalance at January 1, 2019 62,751 276 99 63,126New assets originated 63,143 – – 63,143Assets derecognized or repaid (62,673) (232) – (62,905)Transfers to/(from) Stage 1 (2,122) – – (2,122)Transfers to/(from) Stage 2 – 2,115 – 2,115Transfers to/(from) Stage 3 – – 7 7Others (3) – (1) (4)Balance at December 31, 2019 61,096 2,159 105 63,360
Credit cardBalance at January 1, 2019 67,776 1,692 1,186 70,654New assets originated 22,868 – – 22,868Amounts written-off – – (6,492) (6,492)Transfers to/(from) Stage 1 (7,163) – – (7,163)Transfers to/(from) Stage 2 – 348 – 348Transfers to/(from) Stage 3 – – 6,815 6,815Balance at December 31, 2019 83,481 2,040 1,509 87,030
Other loansBalance at January 1, 2019 37,015 2,670 920 40,605New assets originated 30,574 – – 30,574Assets derecognized or repaid (28,522) (690) (628) (29,840)Amounts written-off (1) (96) (866) (963)Transfers to/(from) Stage 1 (2,559) – – (2,559)Transfers to/(from) Stage 2 – 1,186 – 1,186Transfers to/(from) Stage 3 – – 1,373 1,373Others (2) – 695 693Balance at December 31, 2019 36,505 3,070 1,494 41,069
Total receivables from customersBalance at January 1, 2019 1,325,377 43,139 19,705 1,388,221New assets originated 716,352 – – 716,352Assets derecognized or repaid (582,363) (24,607) (7,867) (614,837)Amounts written-off (2) (141) (7,764) (7,907)Transfers to/(from) Stage 1 (161,596) – – (161,596)Transfers to/(from) Stage 2 – 146,729 – 146,729Transfers to/(from) Stage 3 – – 14,867 14,867Others (1,872) – 530 (1,342)Balance at December 31, 2019 P=1,295,896 P=165,120 P=19,471 P=1,480,487
Parent CompanyReceivables from Customers
Stage 1 Stage 2 Stage 3 POCI Total2020Commercial loans
Balance at January 1, 2020 P=867,733 P=134,672 P=6,753 P=2,992 P=1,012,150New assets originated 316,641 – – – 316,641Assets derecognized or repaid (400,065) (53,799) (1,549) – (455,413)Accounts written off – – (1) – (1)Transfers to/(from) Stage 1 (57,360) – – – (57,360)Transfers to/(from) Stage 2 – 53,131 – – 53,131Transfers to/(from) Stage 3 – – 4,229 – 4,229Others (2,505) – (88) 21 (2,572)Balance at December 31, 2020 724,444 134,004 9,344 3,013 870,805
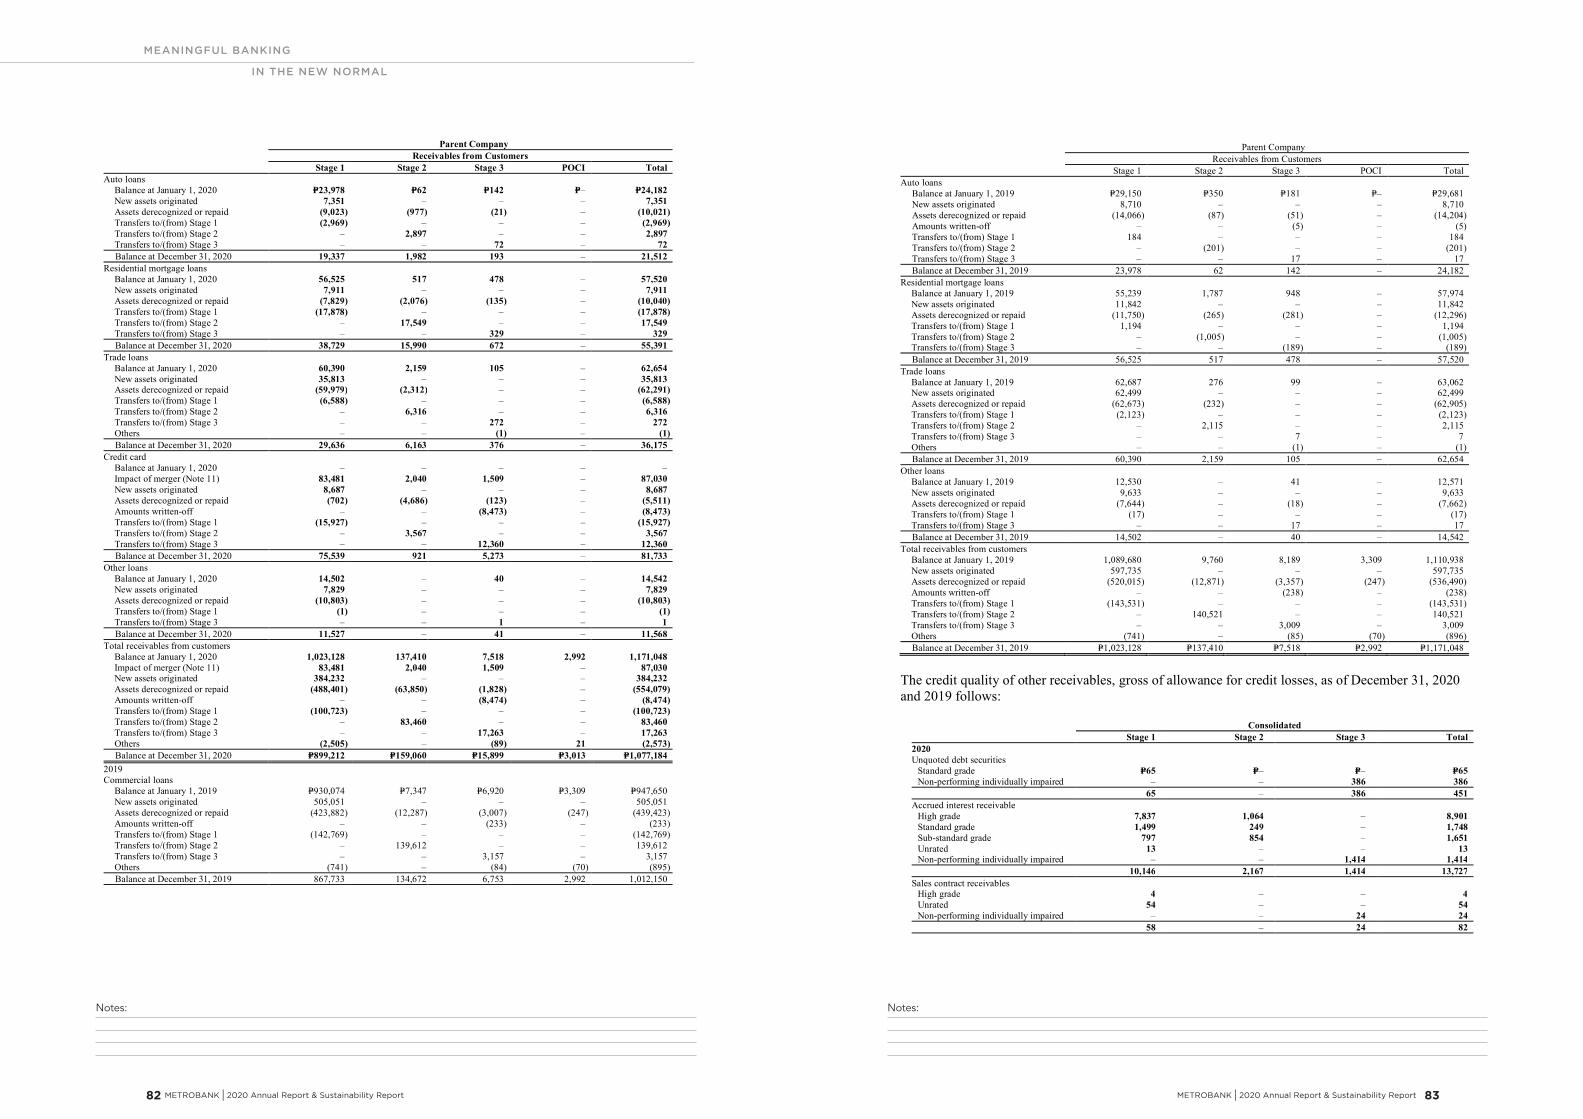
Notes:Notes:
MEANINGFUL BANKING
IN THE NEW NORMAL
METROBANK I 2020 Annual Report & Sustainability Report 83 82 METROBANK I 2020 Annual Report & Sustainability Report
- 51 -
*SGVFSM005911*
Parent CompanyReceivables from Customers
Stage 1 Stage 2 Stage 3 POCI TotalAuto loans
Balance at January 1, 2020 P=23,978 P=62 P=142 P=– P=24,182New assets originated 7,351 – – – 7,351Assets derecognized or repaid (9,023) (977) (21) – (10,021)Transfers to/(from) Stage 1 (2,969) – – – (2,969)Transfers to/(from) Stage 2 – 2,897 – – 2,897Transfers to/(from) Stage 3 – – 72 – 72Balance at December 31, 2020 19,337 1,982 193 – 21,512
Residential mortgage loansBalance at January 1, 2020 56,525 517 478 – 57,520New assets originated 7,911 – – – 7,911Assets derecognized or repaid (7,829) (2,076) (135) – (10,040)Transfers to/(from) Stage 1 (17,878) – – – (17,878)Transfers to/(from) Stage 2 – 17,549 – – 17,549Transfers to/(from) Stage 3 – – 329 – 329Balance at December 31, 2020 38,729 15,990 672 – 55,391
Trade loansBalance at January 1, 2020 60,390 2,159 105 – 62,654New assets originated 35,813 – – – 35,813Assets derecognized or repaid (59,979) (2,312) – – (62,291)Transfers to/(from) Stage 1 (6,588) – – – (6,588)Transfers to/(from) Stage 2 – 6,316 – – 6,316Transfers to/(from) Stage 3 – – 272 – 272Others – – (1) – (1)Balance at December 31, 2020 29,636 6,163 376 – 36,175
Credit cardBalance at January 1, 2020 – – – – –Impact of merger (Note 11) 83,481 2,040 1,509 – 87,030New assets originated 8,687 – – – 8,687Assets derecognized or repaid (702) (4,686) (123) – (5,511)Amounts written-off – – (8,473) – (8,473)Transfers to/(from) Stage 1 (15,927) – – – (15,927)Transfers to/(from) Stage 2 – 3,567 – – 3,567Transfers to/(from) Stage 3 – – 12,360 – 12,360Balance at December 31, 2020 75,539 921 5,273 – 81,733
Other loansBalance at January 1, 2020 14,502 – 40 – 14,542New assets originated 7,829 – – – 7,829Assets derecognized or repaid (10,803) – – – (10,803)Transfers to/(from) Stage 1 (1) – – – (1)Transfers to/(from) Stage 3 – – 1 – 1Balance at December 31, 2020 11,527 – 41 – 11,568
Total receivables from customersBalance at January 1, 2020 1,023,128 137,410 7,518 2,992 1,171,048Impact of merger (Note 11) 83,481 2,040 1,509 – 87,030New assets originated 384,232 – – – 384,232Assets derecognized or repaid (488,401) (63,850) (1,828) – (554,079)Amounts written-off – – (8,474) – (8,474)Transfers to/(from) Stage 1 (100,723) – – – (100,723)Transfers to/(from) Stage 2 – 83,460 – – 83,460Transfers to/(from) Stage 3 – – 17,263 – 17,263Others (2,505) – (89) 21 (2,573)Balance at December 31, 2020 P=899,212 P=159,060 P=15,899 P=3,013 P=1,077,184
2019Commercial loans
Balance at January 1, 2019 P=930,074 P=7,347 P=6,920 P=3,309 P=947,650New assets originated 505,051 – – – 505,051Assets derecognized or repaid (423,882) (12,287) (3,007) (247) (439,423)Amounts written-off – – (233) – (233)Transfers to/(from) Stage 1 (142,769) – – – (142,769)Transfers to/(from) Stage 2 – 139,612 – – 139,612Transfers to/(from) Stage 3 – – 3,157 – 3,157Others (741) – (84) (70) (895)Balance at December 31, 2019 867,733 134,672 6,753 2,992 1,012,150
- 52 -
*SGVFSM005911*
Parent CompanyReceivables from Customers
Stage 1 Stage 2 Stage 3 POCI TotalAuto loans Balance at January 1, 2019 P=29,150 P=350 P=181 P=– P=29,681 New assets originated 8,710 – – – 8,710 Assets derecognized or repaid (14,066) (87) (51) – (14,204) Amounts written-off – – (5) – (5) Transfers to/(from) Stage 1 184 – – – 184 Transfers to/(from) Stage 2 – (201) – – (201) Transfers to/(from) Stage 3 – – 17 – 17
Balance at December 31, 2019 23,978 62 142 – 24,182Residential mortgage loans
Balance at January 1, 2019 55,239 1,787 948 – 57,974New assets originated 11,842 – – – 11,842Assets derecognized or repaid (11,750) (265) (281) – (12,296)Transfers to/(from) Stage 1 1,194 – – – 1,194Transfers to/(from) Stage 2 – (1,005) – – (1,005)Transfers to/(from) Stage 3 – – (189) – (189)Balance at December 31, 2019 56,525 517 478 – 57,520
Trade loansBalance at January 1, 2019 62,687 276 99 – 63,062New assets originated 62,499 – – – 62,499Assets derecognized or repaid (62,673) (232) – – (62,905)Transfers to/(from) Stage 1 (2,123) – – – (2,123)Transfers to/(from) Stage 2 – 2,115 – – 2,115Transfers to/(from) Stage 3 – – 7 – 7Others – – (1) – (1)Balance at December 31, 2019 60,390 2,159 105 – 62,654
Other loansBalance at January 1, 2019 12,530 – 41 – 12,571New assets originated 9,633 – – – 9,633Assets derecognized or repaid (7,644) – (18) – (7,662)Transfers to/(from) Stage 1 (17) – – – (17)Transfers to/(from) Stage 3 – – 17 – 17Balance at December 31, 2019 14,502 – 40 – 14,542
Total receivables from customersBalance at January 1, 2019 1,089,680 9,760 8,189 3,309 1,110,938New assets originated 597,735 – – – 597,735Assets derecognized or repaid (520,015) (12,871) (3,357) (247) (536,490)Amounts written-off – – (238) – (238)Transfers to/(from) Stage 1 (143,531) – – – (143,531)Transfers to/(from) Stage 2 – 140,521 – – 140,521Transfers to/(from) Stage 3 – – 3,009 – 3,009Others (741) – (85) (70) (896)Balance at December 31, 2019 P=1,023,128 P=137,410 P=7,518 P=2,992 P=1,171,048
The credit quality of other receivables, gross of allowance for credit losses, as of December 31, 2020and 2019 follows:
ConsolidatedStage 1 Stage 2 Stage 3 Total
2020Unquoted debt securities
Standard grade P=65 P=– P=– P=65Non-performing individually impaired – – 386 386
65 – 386 451Accrued interest receivable
High grade 7,837 1,064 – 8,901Standard grade 1,499 249 – 1,748Sub-standard grade 797 854 – 1,651Unrated 13 – – 13Non-performing individually impaired – – 1,414 1,414
10,146 2,167 1,414 13,727Sales contract receivables
High grade 4 – – 4Unrated 54 – – 54Non-performing individually impaired – – 24 24
58 – 24 82
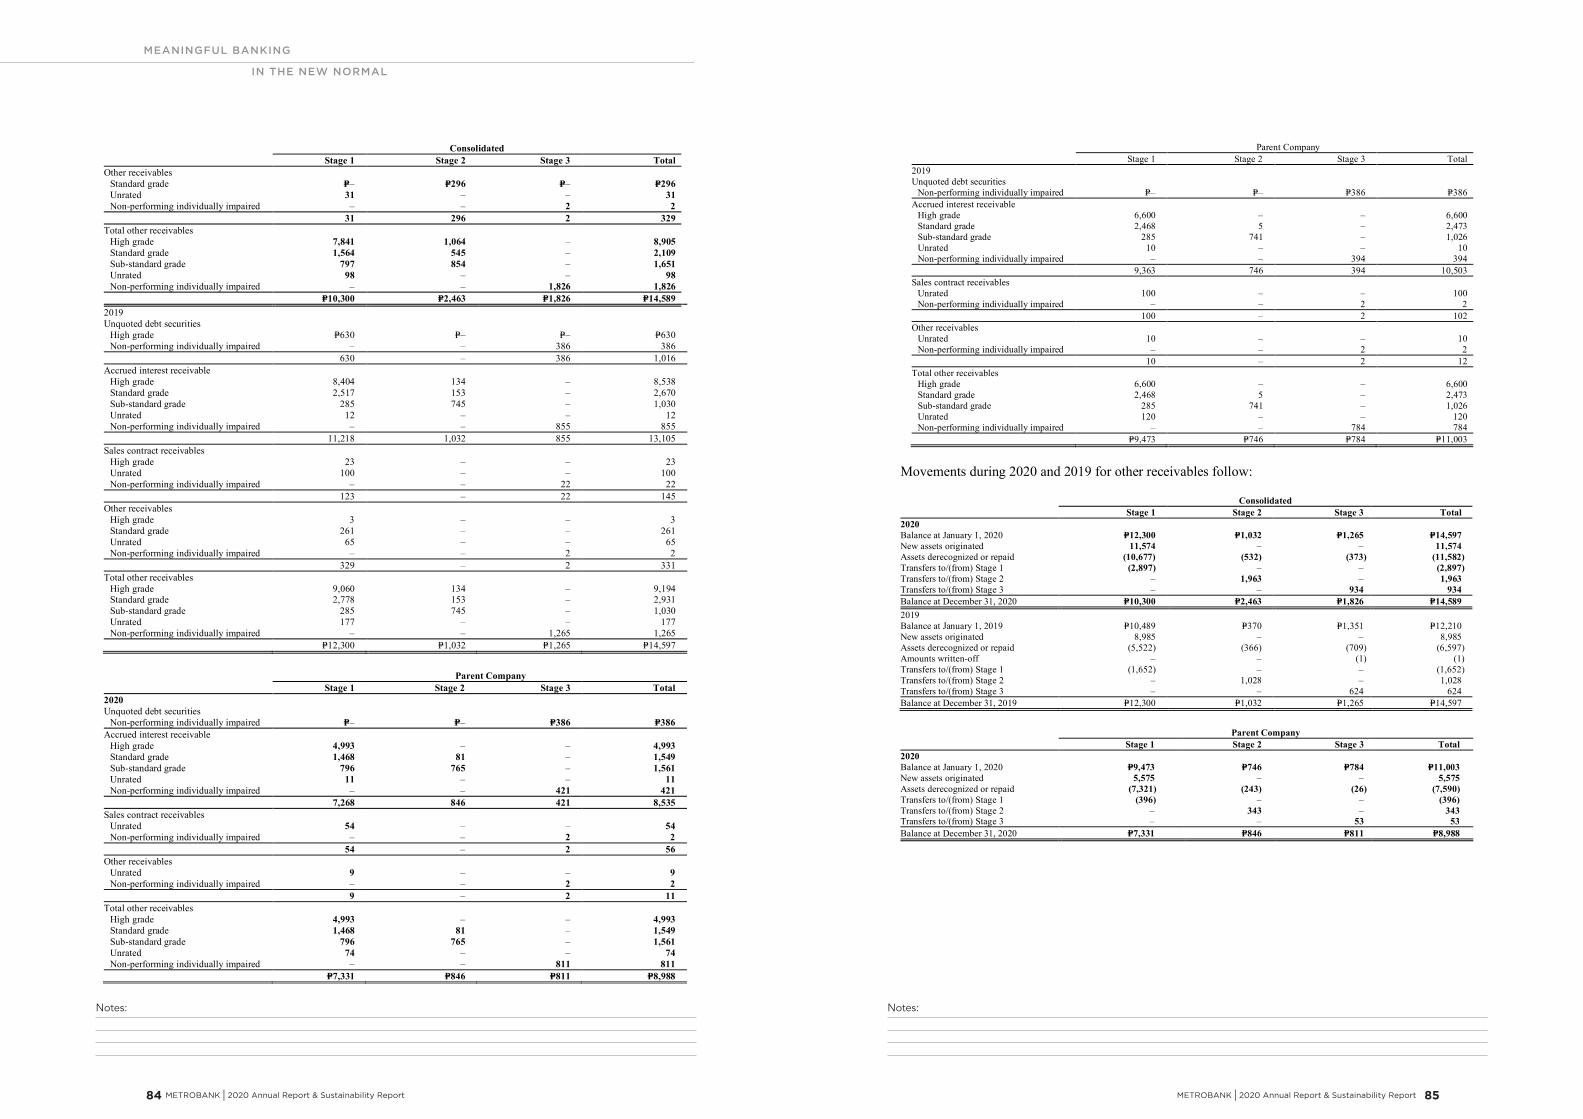
Notes:Notes:
MEANINGFUL BANKING
IN THE NEW NORMAL
METROBANK I 2020 Annual Report & Sustainability Report 85 84 METROBANK I 2020 Annual Report & Sustainability Report
- 53 -
*SGVFSM005911*
ConsolidatedStage 1 Stage 2 Stage 3 Total
Other receivablesStandard grade P=– P=296 P=– P=296Unrated 31 – – 31Non-performing individually impaired – – 2 2
31 296 2 329Total other receivables
High grade 7,841 1,064 – 8,905Standard grade 1,564 545 – 2,109Sub-standard grade 797 854 – 1,651Unrated 98 – – 98Non-performing individually impaired – – 1,826 1,826
P=10,300 P=2,463 P=1,826 P=14,5892019Unquoted debt securities
High grade P=630 P=– P=– P=630Non-performing individually impaired – – 386 386
630 – 386 1,016Accrued interest receivable
High grade 8,404 134 – 8,538Standard grade 2,517 153 – 2,670Sub-standard grade 285 745 – 1,030Unrated 12 – – 12Non-performing individually impaired – – 855 855
11,218 1,032 855 13,105Sales contract receivables
High grade 23 – – 23Unrated 100 – – 100Non-performing individually impaired – – 22 22
123 – 22 145Other receivables
High grade 3 – – 3Standard grade 261 – – 261Unrated 65 – – 65Non-performing individually impaired – – 2 2
329 – 2 331Total other receivables
High grade 9,060 134 – 9,194Standard grade 2,778 153 – 2,931Sub-standard grade 285 745 – 1,030Unrated 177 – – 177Non-performing individually impaired – – 1,265 1,265
P=12,300 P=1,032 P=1,265 P=14,597
Parent CompanyStage 1 Stage 2 Stage 3 Total
2020Unquoted debt securities
Non-performing individually impaired P=– P=– P=386 P=386Accrued interest receivable
High grade 4,993 – – 4,993Standard grade 1,468 81 – 1,549Sub-standard grade 796 765 – 1,561Unrated 11 – – 11Non-performing individually impaired – – 421 421
7,268 846 421 8,535Sales contract receivables
Unrated 54 – – 54Non-performing individually impaired – – 2 2
54 – 2 56Other receivables
Unrated 9 – – 9Non-performing individually impaired – – 2 2
9 – 2 11Total other receivables
High grade 4,993 – – 4,993Standard grade 1,468 81 – 1,549Sub-standard grade 796 765 – 1,561Unrated 74 – – 74Non-performing individually impaired – – 811 811
P=7,331 P=846 P=811 P=8,988
- 54 -
*SGVFSM005911*
Parent CompanyStage 1 Stage 2 Stage 3 Total
2019Unquoted debt securities
Non-performing individually impaired P=– P=– P=386 P=386Accrued interest receivable
High grade 6,600 – – 6,600Standard grade 2,468 5 – 2,473Sub-standard grade 285 741 – 1,026Unrated 10 – – 10Non-performing individually impaired – – 394 394
9,363 746 394 10,503Sales contract receivables
Unrated 100 – – 100Non-performing individually impaired – – 2 2
100 – 2 102Other receivables
Unrated 10 – – 10Non-performing individually impaired – – 2 2
10 – 2 12Total other receivables
High grade 6,600 – – 6,600Standard grade 2,468 5 – 2,473Sub-standard grade 285 741 – 1,026Unrated 120 – – 120Non-performing individually impaired – – 784 784
P=9,473 P=746 P=784 P=11,003
Movements during 2020 and 2019 for other receivables follow:
ConsolidatedStage 1 Stage 2 Stage 3 Total
2020Balance at January 1, 2020 P=12,300 P=1,032 P=1,265 P=14,597New assets originated 11,574 – – 11,574Assets derecognized or repaid (10,677) (532) (373) (11,582)Transfers to/(from) Stage 1 (2,897) – – (2,897)Transfers to/(from) Stage 2 – 1,963 – 1,963Transfers to/(from) Stage 3 – – 934 934Balance at December 31, 2020 P=10,300 P=2,463 P=1,826 P=14,5892019Balance at January 1, 2019 P=10,489 P=370 P=1,351 P=12,210New assets originated 8,985 – – 8,985Assets derecognized or repaid (5,522) (366) (709) (6,597)Amounts written-off – – (1) (1)Transfers to/(from) Stage 1 (1,652) – – (1,652)Transfers to/(from) Stage 2 – 1,028 – 1,028Transfers to/(from) Stage 3 – – 624 624Balance at December 31, 2019 P=12,300 P=1,032 P=1,265 P=14,597
Parent CompanyStage 1 Stage 2 Stage 3 Total
2020Balance at January 1, 2020 P=9,473 P=746 P=784 P=11,003New assets originated 5,575 – – 5,575Assets derecognized or repaid (7,321) (243) (26) (7,590)Transfers to/(from) Stage 1 (396) – – (396)Transfers to/(from) Stage 2 – 343 – 343Transfers to/(from) Stage 3 – – 53 53Balance at December 31, 2020 P=7,331 P=846 P=811 P=8,988
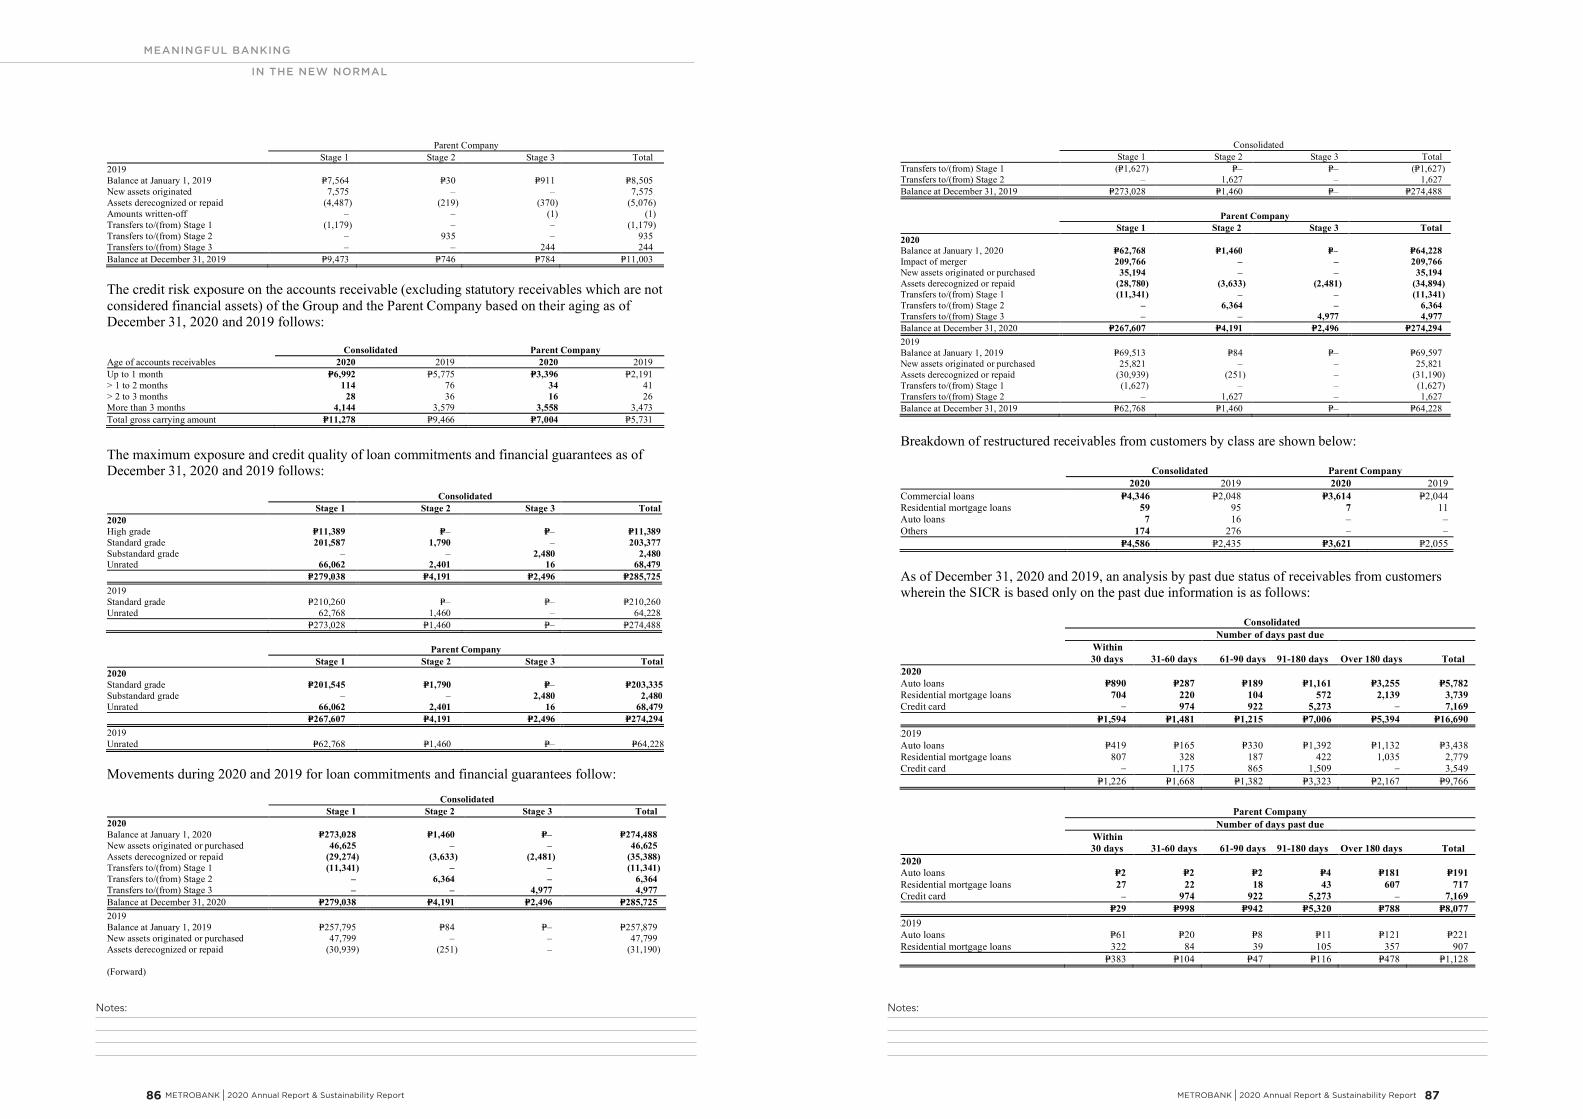
Notes:Notes:
MEANINGFUL BANKING
IN THE NEW NORMAL
METROBANK I 2020 Annual Report & Sustainability Report 87 86 METROBANK I 2020 Annual Report & Sustainability Report
- 55 -
*SGVFSM005911*
Parent CompanyStage 1 Stage 2 Stage 3 Total
2019Balance at January 1, 2019 P=7,564 P=30 P=911 P=8,505New assets originated 7,575 – – 7,575Assets derecognized or repaid (4,487) (219) (370) (5,076)Amounts written-off – – (1) (1)Transfers to/(from) Stage 1 (1,179) – – (1,179)Transfers to/(from) Stage 2 – 935 – 935Transfers to/(from) Stage 3 – – 244 244Balance at December 31, 2019 P=9,473 P=746 P=784 P=11,003
The credit risk exposure on the accounts receivable (excluding statutory receivables which are notconsidered financial assets) of the Group and the Parent Company based on their aging as ofDecember 31, 2020 and 2019 follows:
Consolidated Parent CompanyAge of accounts receivables 2020 2019 2020 2019Up to 1 month P=6,992 P=5,775 P=3,396 P=2,191> 1 to 2 months 114 76 34 41> 2 to 3 months 28 36 16 26More than 3 months 4,144 3,579 3,558 3,473Total gross carrying amount P=11,278 P=9,466 P=7,004 P=5,731
The maximum exposure and credit quality of loan commitments and financial guarantees as ofDecember 31, 2020 and 2019 follows:
ConsolidatedStage 1 Stage 2 Stage 3 Total
2020High grade P=11,389 P=– P=– P=11,389Standard grade 201,587 1,790 – 203,377Substandard grade – – 2,480 2,480Unrated 66,062 2,401 16 68,479
P=279,038 P=4,191 P=2,496 P=285,7252019Standard grade P=210,260 P=– P=– P=210,260Unrated 62,768 1,460 – 64,228
P=273,028 P=1,460 P=– P=274,488
Parent CompanyStage 1 Stage 2 Stage 3 Total
2020Standard grade P=201,545 P=1,790 P=– P=203,335Substandard grade – – 2,480 2,480Unrated 66,062 2,401 16 68,479
P=267,607 P=4,191 P=2,496 P=274,2942019Unrated P=62,768 P=1,460 P=– P=64,228
Movements during 2020 and 2019 for loan commitments and financial guarantees follow:
ConsolidatedStage 1 Stage 2 Stage 3 Total
2020Balance at January 1, 2020 P=273,028 P=1,460 P=– P=274,488New assets originated or purchased 46,625 – – 46,625Assets derecognized or repaid (29,274) (3,633) (2,481) (35,388)Transfers to/(from) Stage 1 (11,341) – – (11,341)Transfers to/(from) Stage 2 – 6,364 – 6,364Transfers to/(from) Stage 3 – – 4,977 4,977Balance at December 31, 2020 P=279,038 P=4,191 P=2,496 P=285,7252019Balance at January 1, 2019 P=257,795 P=84 P=– P=257,879New assets originated or purchased 47,799 – – 47,799Assets derecognized or repaid (30,939) (251) – (31,190)
(Forward)
- 56 -
*SGVFSM005911*
ConsolidatedStage 1 Stage 2 Stage 3 Total
Transfers to/(from) Stage 1 (P=1,627) P=– P=– (P=1,627)Transfers to/(from) Stage 2 – 1,627 – 1,627Balance at December 31, 2019 P=273,028 P=1,460 P=– P=274,488
Parent CompanyStage 1 Stage 2 Stage 3 Total
2020Balance at January 1, 2020 P=62,768 P=1,460 P=– P=64,228Impact of merger 209,766 – – 209,766New assets originated or purchased 35,194 – – 35,194Assets derecognized or repaid (28,780) (3,633) (2,481) (34,894)Transfers to/(from) Stage 1 (11,341) – – (11,341)Transfers to/(from) Stage 2 – 6,364 – 6,364Transfers to/(from) Stage 3 – – 4,977 4,977Balance at December 31, 2020 P=267,607 P=4,191 P=2,496 P=274,2942019Balance at January 1, 2019 P=69,513 P=84 P=– P=69,597New assets originated or purchased 25,821 – – 25,821Assets derecognized or repaid (30,939) (251) – (31,190)Transfers to/(from) Stage 1 (1,627) – – (1,627)Transfers to/(from) Stage 2 – 1,627 – 1,627Balance at December 31, 2019 P=62,768 P=1,460 P=– P=64,228
Breakdown of restructured receivables from customers by class are shown below:
Consolidated Parent Company2020 2019 2020 2019
Commercial loans P=4,346 P=2,048 P=3,614 P=2,044Residential mortgage loans 59 95 7 11Auto loans 7 16 ‒ ‒Others 174 276 ‒ ‒
P=4,586 P=2,435 P=3,621 P=2,055
As of December 31, 2020 and 2019, an analysis by past due status of receivables from customerswherein the SICR is based only on the past due information is as follows:
ConsolidatedNumber of days past due
Within30 days 31-60 days 61-90 days 91-180 days Over 180 days Total
22020Auto loans P=890 P=287 P=189 P=1,161 P=3,255 P=5,782Residential mortgage loans 704 220 104 572 2,139 3,739Credit card – 974 922 5,273 – 7,169
P=1,594 P=1,481 P=1,215 P=7,006 P=5,394 P=16,69022019Auto loans P=419 P=165 P=330 P=1,392 P=1,132 P=3,438Residential mortgage loans 807 328 187 422 1,035 2,779Credit card – 1,175 865 1,509 – 3,549
P=1,226 P=1,668 P=1,382 P=3,323 P=2,167 P=9,766
Parent CompanyNumber of days past due
Within30 days 31-60 days 61-90 days 91-180 days Over 180 days Total
22020Auto loans P=2 P=2 P=2 P=4 P=181 P=191Residential mortgage loans 27 22 18 43 607 717Credit card – 974 922 5,273 – 7,169
P=29 P=998 P=942 P=5,320 P=788 P=8,07722019Auto loans P=61 P=20 P=8 P=11 P=121 P=221Residential mortgage loans 322 84 39 105 357 907
P=383 P=104 P=47 P=116 P=478 P=1,128
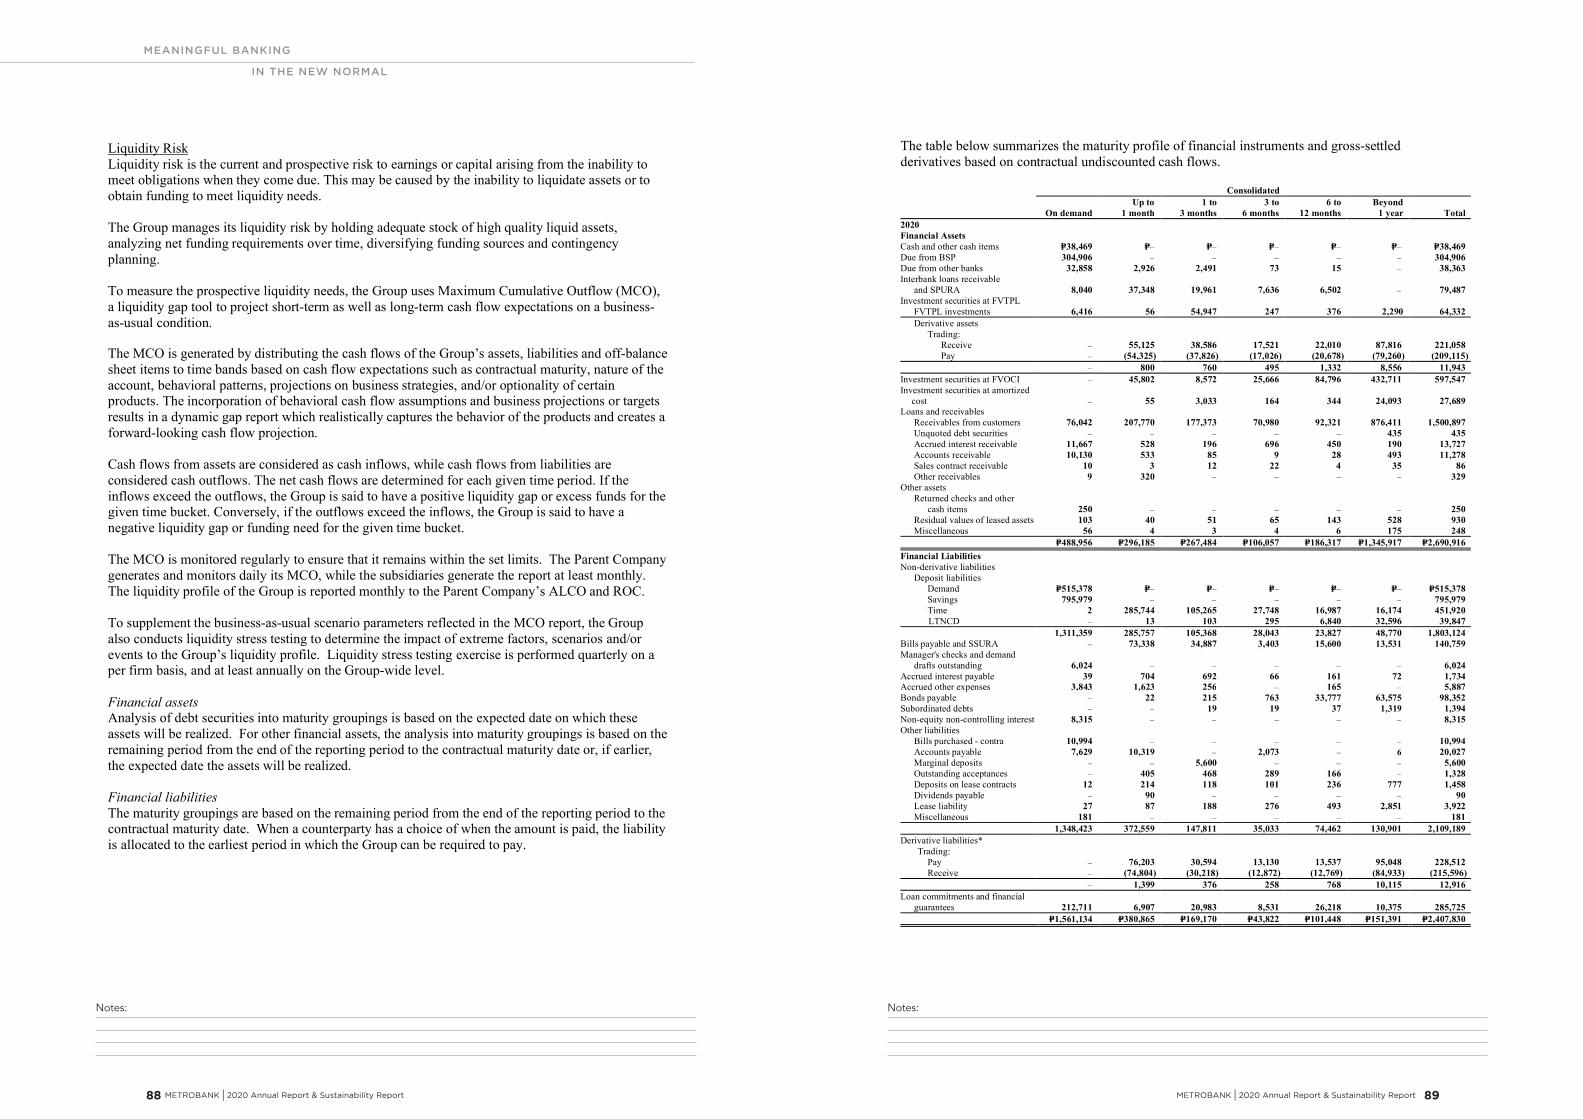
Notes:Notes:
MEANINGFUL BANKING
IN THE NEW NORMAL
METROBANK I 2020 Annual Report & Sustainability Report 89 88 METROBANK I 2020 Annual Report & Sustainability Report
- 57 -
*SGVFSM005911*
Liquidity RiskLiquidity risk is the current and prospective risk to earnings or capital arising from the inability tomeet obligations when they come due. This may be caused by the inability to liquidate assets or toobtain funding to meet liquidity needs.
The Group manages its liquidity risk by holding adequate stock of high quality liquid assets,analyzing net funding requirements over time, diversifying funding sources and contingencyplanning.
To measure the prospective liquidity needs, the Group uses Maximum Cumulative Outflow (MCO),a liquidity gap tool to project short-term as well as long-term cash flow expectations on a business-as-usual condition.
The MCO is generated by distributing the cash flows of the Group’s assets, liabilities and off-balancesheet items to time bands based on cash flow expectations such as contractual maturity, nature of theaccount, behavioral patterns, projections on business strategies, and/or optionality of certainproducts. The incorporation of behavioral cash flow assumptions and business projections or targetsresults in a dynamic gap report which realistically captures the behavior of the products and creates aforward-looking cash flow projection.
Cash flows from assets are considered as cash inflows, while cash flows from liabilities areconsidered cash outflows. The net cash flows are determined for each given time period. If theinflows exceed the outflows, the Group is said to have a positive liquidity gap or excess funds for thegiven time bucket. Conversely, if the outflows exceed the inflows, the Group is said to have anegative liquidity gap or funding need for the given time bucket.
The MCO is monitored regularly to ensure that it remains within the set limits. The Parent Companygenerates and monitors daily its MCO, while the subsidiaries generate the report at least monthly.The liquidity profile of the Group is reported monthly to the Parent Company’s ALCO and ROC.
To supplement the business-as-usual scenario parameters reflected in the MCO report, the Groupalso conducts liquidity stress testing to determine the impact of extreme factors, scenarios and/orevents to the Group’s liquidity profile. Liquidity stress testing exercise is performed quarterly on aper firm basis, and at least annually on the Group-wide level.
Financial assetsAnalysis of debt securities into maturity groupings is based on the expected date on which theseassets will be realized. For other financial assets, the analysis into maturity groupings is based on theremaining period from the end of the reporting period to the contractual maturity date or, if earlier,the expected date the assets will be realized.
Financial liabilitiesThe maturity groupings are based on the remaining period from the end of the reporting period to thecontractual maturity date. When a counterparty has a choice of when the amount is paid, the liabilityis allocated to the earliest period in which the Group can be required to pay.
- 58 -
*SGVFSM005911*
The table below summarizes the maturity profile of financial instruments and gross-settledderivatives based on contractual undiscounted cash flows.
Consolidated
On demandUp to
1 month1 to
3 months3 to
6 months6 to
12 monthsBeyond
1 year Total2020Financial AssetsCash and other cash items P=38,469 P=– P=– P=– P=– P=– P=38,469Due from BSP 304,906 – – – – – 304,906Due from other banks 32,858 2,926 2,491 73 15 – 38,363Interbank loans receivable
and SPURA 8,040 37,348 19,961 7,636 6,502 – 79,487Investment securities at FVTPL FVTPL investments 6,416 56 54,947 247 376 2,290 64,332 Derivative assets
Trading: Receive – 55,125 38,586 17,521 22,010 87,816 221,058 Pay – (54,325) (37,826) (17,026) (20,678) (79,260) (209,115)
– 800 760 495 1,332 8,556 11,943Investment securities at FVOCI – 45,802 8,572 25,666 84,796 432,711 597,547Investment securities at amortized
cost – 55 3,033 164 344 24,093 27,689Loans and receivables Receivables from customers 76,042 207,770 177,373 70,980 92,321 876,411 1,500,897 Unquoted debt securities – – – – – 435 435 Accrued interest receivable 11,667 528 196 696 450 190 13,727 Accounts receivable 10,130 533 85 9 28 493 11,278 Sales contract receivable 10 3 12 22 4 35 86 Other receivables 9 320 – – – – 329Other assets Returned checks and other
cash items 250 – – – – – 250 Residual values of leased assets 103 40 51 65 143 528 930 Miscellaneous 56 4 3 4 6 175 248
P=488,956 P=296,185 P=267,484 P=106,057 P=186,317 P=1,345,917 P=2,690,916Financial LiabilitiesNon-derivative liabilities Deposit liabilities Demand P=515,378 P=– P=– P=– P=– P=– P=515,378 Savings 795,979 – – – – – 795,979 Time 2 285,744 105,265 27,748 16,987 16,174 451,920
LTNCD – 13 103 295 6,840 32,596 39,8471,311,359 285,757 105,368 28,043 23,827 48,770 1,803,124
Bills payable and SSURA – 73,338 34,887 3,403 15,600 13,531 140,759Manager's checks and demand drafts outstanding 6,024 – – – – – 6,024Accrued interest payable 39 704 692 66 161 72 1,734Accrued other expenses 3,843 1,623 256 – 165 – 5,887Bonds payable – 22 215 763 33,777 63,575 98,352Subordinated debts – – 19 19 37 1,319 1,394Non-equity non-controlling interest 8,315 – – – – – 8,315Other liabilities Bills purchased - contra 10,994 – – – – – 10,994 Accounts payable 7,629 10,319 – 2,073 – 6 20,027 Marginal deposits – – 5,600 – – – 5,600 Outstanding acceptances – 405 468 289 166 – 1,328 Deposits on lease contracts 12 214 118 101 236 777 1,458 Dividends payable – 90 – – – – 90 Lease liability 27 87 188 276 493 2,851 3,922 Miscellaneous 181 – – – – – 181
1,348,423 372,559 147,811 35,033 74,462 130,901 2,109,189Derivative liabilities*
Trading: Pay – 76,203 30,594 13,130 13,537 95,048 228,512 Receive – (74,804) (30,218) (12,872) (12,769) (84,933) (215,596)
– 1,399 376 258 768 10,115 12,916Loan commitments and financial guarantees 212,711 6,907 20,983 8,531 26,218 10,375 285,725
P=1,561,134 P=380,865 P=169,170 P=43,822 P=101,448 P=151,391 P=2,407,830
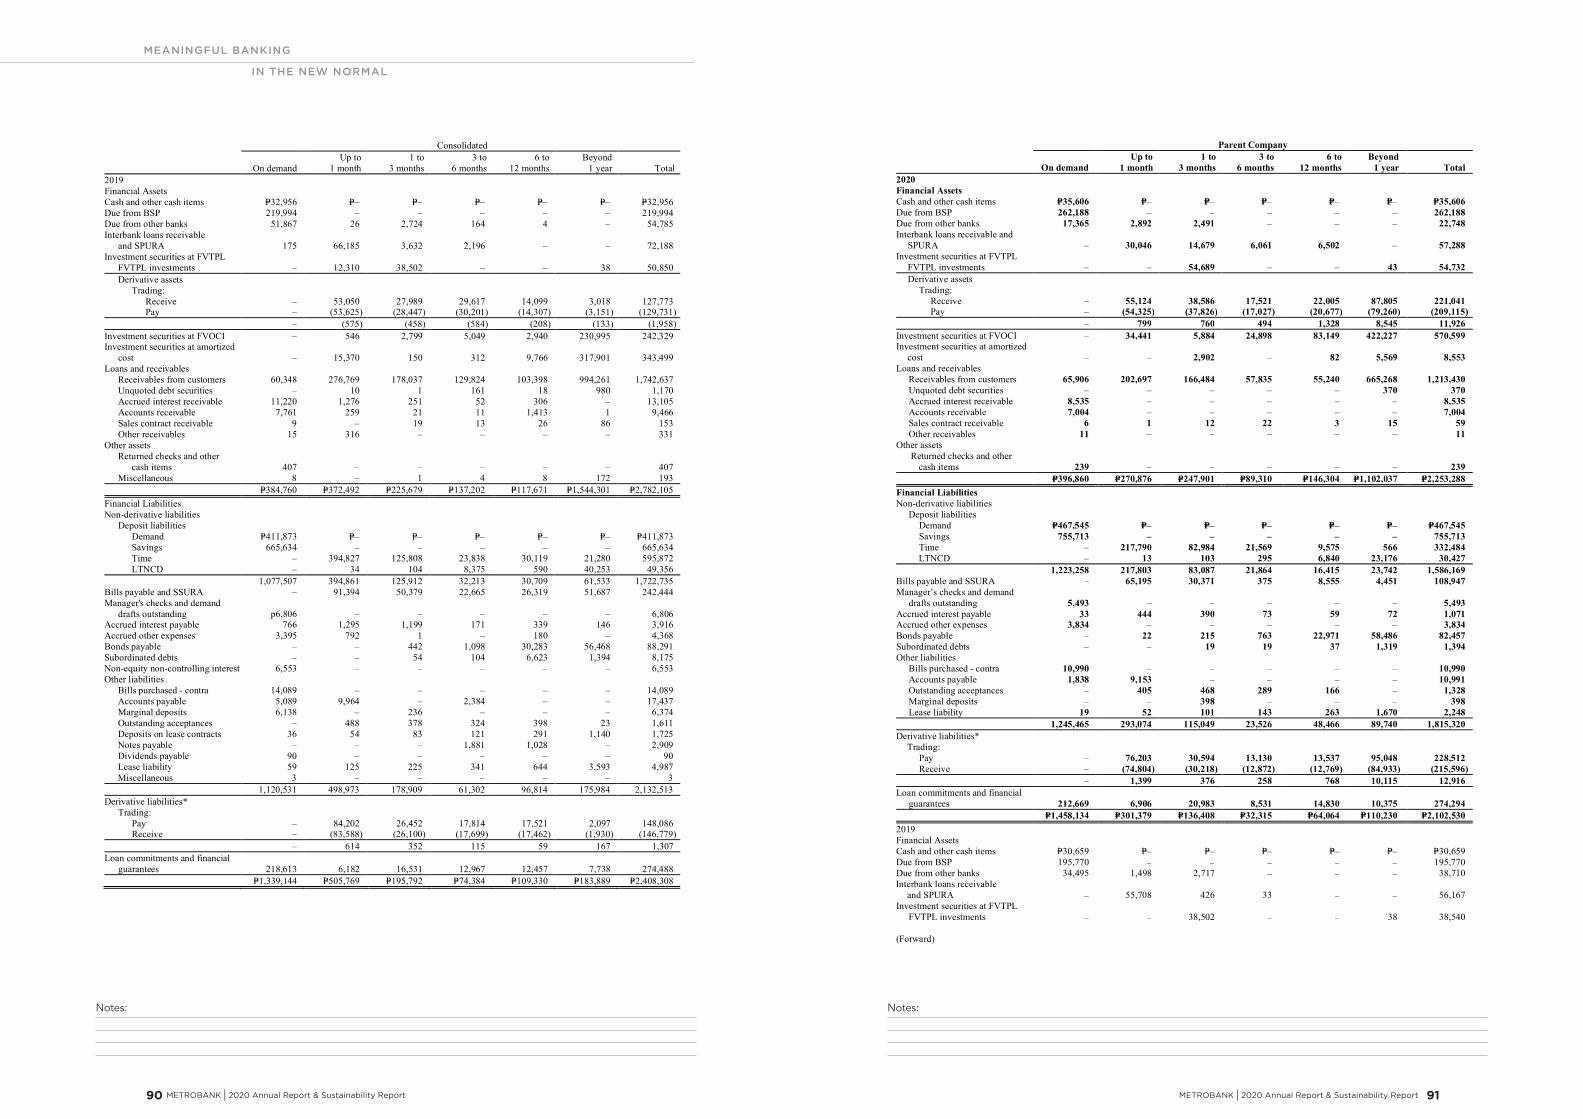
Notes:Notes:
MEANINGFUL BANKING
IN THE NEW NORMAL
METROBANK I 2020 Annual Report & Sustainability Report 91 90 METROBANK I 2020 Annual Report & Sustainability Report
- 59 -
*SGVFSM005911*
Consolidated
On demandUp to
1 month1 to
3 months3 to
6 months6 to
12 monthsBeyond
1 year Total2019Financial AssetsCash and other cash items P=32,956 P=– P=– P=– P=– P=– P=32,956Due from BSP 219,994 – – – – – 219,994Due from other banks 51,867 26 2,724 164 4 – 54,785Interbank loans receivable and SPURA 175 66,185 3,632 2,196 – – 72,188Investment securities at FVTPL FVTPL investments – 12,310 38,502 – – 38 50,850 Derivative assets Trading: Receive – 53,050 27,989 29,617 14,099 3,018 127,773 Pay – (53,625) (28,447) (30,201) (14,307) (3,151) (129,731)
– (575) (458) (584) (208) (133) (1,958)Investment securities at FVOCI – 546 2,799 5,049 2,940 230,995 242,329Investment securities at amortized cost – 15,370 150 312 9,766 317,901 343,499Loans and receivables Receivables from customers 60,348 276,769 178,037 129,824 103,398 994,261 1,742,637 Unquoted debt securities – 10 1 161 18 980 1,170 Accrued interest receivable 11,220 1,276 251 52 306 – 13,105 Accounts receivable 7,761 259 21 11 1,413 1 9,466 Sales contract receivable 9 – 19 13 26 86 153 Other receivables 15 316 – – – – 331Other assets Returned checks and other cash items 407 – – – – – 407 Miscellaneous 8 – 1 4 8 172 193
P=384,760 P=372,492 P=225,679 P=137,202 P=117,671 P=1,544,301 P=2,782,105Financial LiabilitiesNon-derivative liabilities Deposit liabilities Demand P=411,873 P=– P=– P=– P=– P=– P=411,873 Savings 665,634 – – – – – 665,634 Time – 394,827 125,808 23,838 30,119 21,280 595,872 LTNCD – 34 104 8,375 590 40,253 49,356
1,077,507 394,861 125,912 32,213 30,709 61,533 1,722,735Bills payable and SSURA – 91,394 50,379 22,665 26,319 51,687 242,444Manager's checks and demand drafts outstanding p6,806 – – – – – 6,806Accrued interest payable 766 1,295 1,199 171 339 146 3,916Accrued other expenses 3,395 792 1 – 180 – 4,368Bonds payable – – 442 1,098 30,283 56,468 88,291Subordinated debts – – 54 104 6,623 1,394 8,175Non-equity non-controlling interest 6,553 – – – – – 6,553Other liabilities Bills purchased - contra 14,089 – – – – – 14,089 Accounts payable 5,089 9,964 – 2,384 – – 17,437 Marginal deposits 6,138 – 236 – – – 6,374 Outstanding acceptances – 488 378 324 398 23 1,611 Deposits on lease contracts 36 54 83 121 291 1,140 1,725 Notes payable – – – 1,881 1,028 – 2,909 Dividends payable 90 – – – – – 90 Lease liability 59 125 225 341 644 3,593 4,987 Miscellaneous 3 – – – – – 3
1,120,531 498,973 178,909 61,302 96,814 175,984 2,132,513Derivative liabilities* Trading: Pay – 84,202 26,452 17,814 17,521 2,097 148,086 Receive – (83,588) (26,100) (17,699) (17,462) (1,930) (146,779)
– 614 352 115 59 167 1,307Loan commitments and financial guarantees 218,613 6,182 16,531 12,967 12,457 7,738 274,488
P=1,339,144 P=505,769 P=195,792 P=74,384 P=109,330 P=183,889 P=2,408,308
- 60 -
*SGVFSM005911*
Parent Company
On demandUp to
1 month1 to
3 months3 to
6 months6 to
12 monthsBeyond
1 year Total2020Financial AssetsCash and other cash items P=35,606 P=– P=– P=– P=– P=– P=35,606Due from BSP 262,188 – – – – – 262,188Due from other banks 17,365 2,892 2,491 – – – 22,748Interbank loans receivable and
SPURA – 30,046 14,679 6,061 6,502 – 57,288Investment securities at FVTPL FVTPL investments – – 54,689 – – 43 54,732 Derivative assets Trading: Receive – 55,124 38,586 17,521 22,005 87,805 221,041 Pay – (54,325) (37,826) (17,027) (20,677) (79,260) (209,115)
– 799 760 494 1,328 8,545 11,926Investment securities at FVOCI – 34,441 5,884 24,898 83,149 422,227 570,599Investment securities at amortized
cost – – 2,902 – 82 5,569 8,553Loans and receivables Receivables from customers 65,906 202,697 166,484 57,835 55,240 665,268 1,213,430 Unquoted debt securities – – – – – 370 370 Accrued interest receivable 8,535 – – – – – 8,535 Accounts receivable 7,004 – – – – – 7,004 Sales contract receivable 6 1 12 22 3 15 59 Other receivables 11 – – – – – 11Other assets Returned checks and other
cash items 239 – – – – – 239P=396,860 P=270,876 P=247,901 P=89,310 P=146,304 P=1,102,037 P=2,253,288
Financial LiabilitiesNon-derivative liabilities Deposit liabilities Demand P=467,545 P=– P=– P=– P=– P=– P=467,545 Savings 755,713 – – – – – 755,713 Time – 217,790 82,984 21,569 9,575 566 332,484
LTNCD – 13 103 295 6,840 23,176 30,4271,223,258 217,803 83,087 21,864 16,415 23,742 1,586,169
Bills payable and SSURA – 65,195 30,371 375 8,555 4,451 108,947Manager’s checks and demand drafts outstanding 5,493 – – – – – 5,493Accrued interest payable 33 444 390 73 59 72 1,071Accrued other expenses 3,834 – – – – – 3,834Bonds payable – 22 215 763 22,971 58,486 82,457Subordinated debts – – 19 19 37 1,319 1,394Other liabilities Bills purchased - contra 10,990 – – – – – 10,990 Accounts payable 1,838 9,153 – – – – 10,991 Outstanding acceptances – 405 468 289 166 – 1,328 Marginal deposits – – 398 – – – 398 Lease liability 19 52 101 143 263 1,670 2,248
1,245,465 293,074 115,049 23,526 48,466 89,740 1,815,320Derivative liabilities*
Trading: Pay – 76,203 30,594 13,130 13,537 95,048 228,512 Receive – (74,804) (30,218) (12,872) (12,769) (84,933) (215,596)
– 1,399 376 258 768 10,115 12,916Loan commitments and financial guarantees 212,669 6,906 20,983 8,531 14,830 10,375 274,294
P=1,458,134 P=301,379 P=136,408 P=32,315 P=64,064 P=110,230 P=2,102,5302019Financial AssetsCash and other cash items P=30,659 P=– P=– P=– P=– P=– P=30,659Due from BSP 195,770 – – – – – 195,770Due from other banks 34,495 1,498 2,717 – – – 38,710Interbank loans receivable
and SPURA – 55,708 426 33 – – 56,167Investment securities at FVTPL FVTPL investments – – 38,502 – – 38 38,540
(Forward)
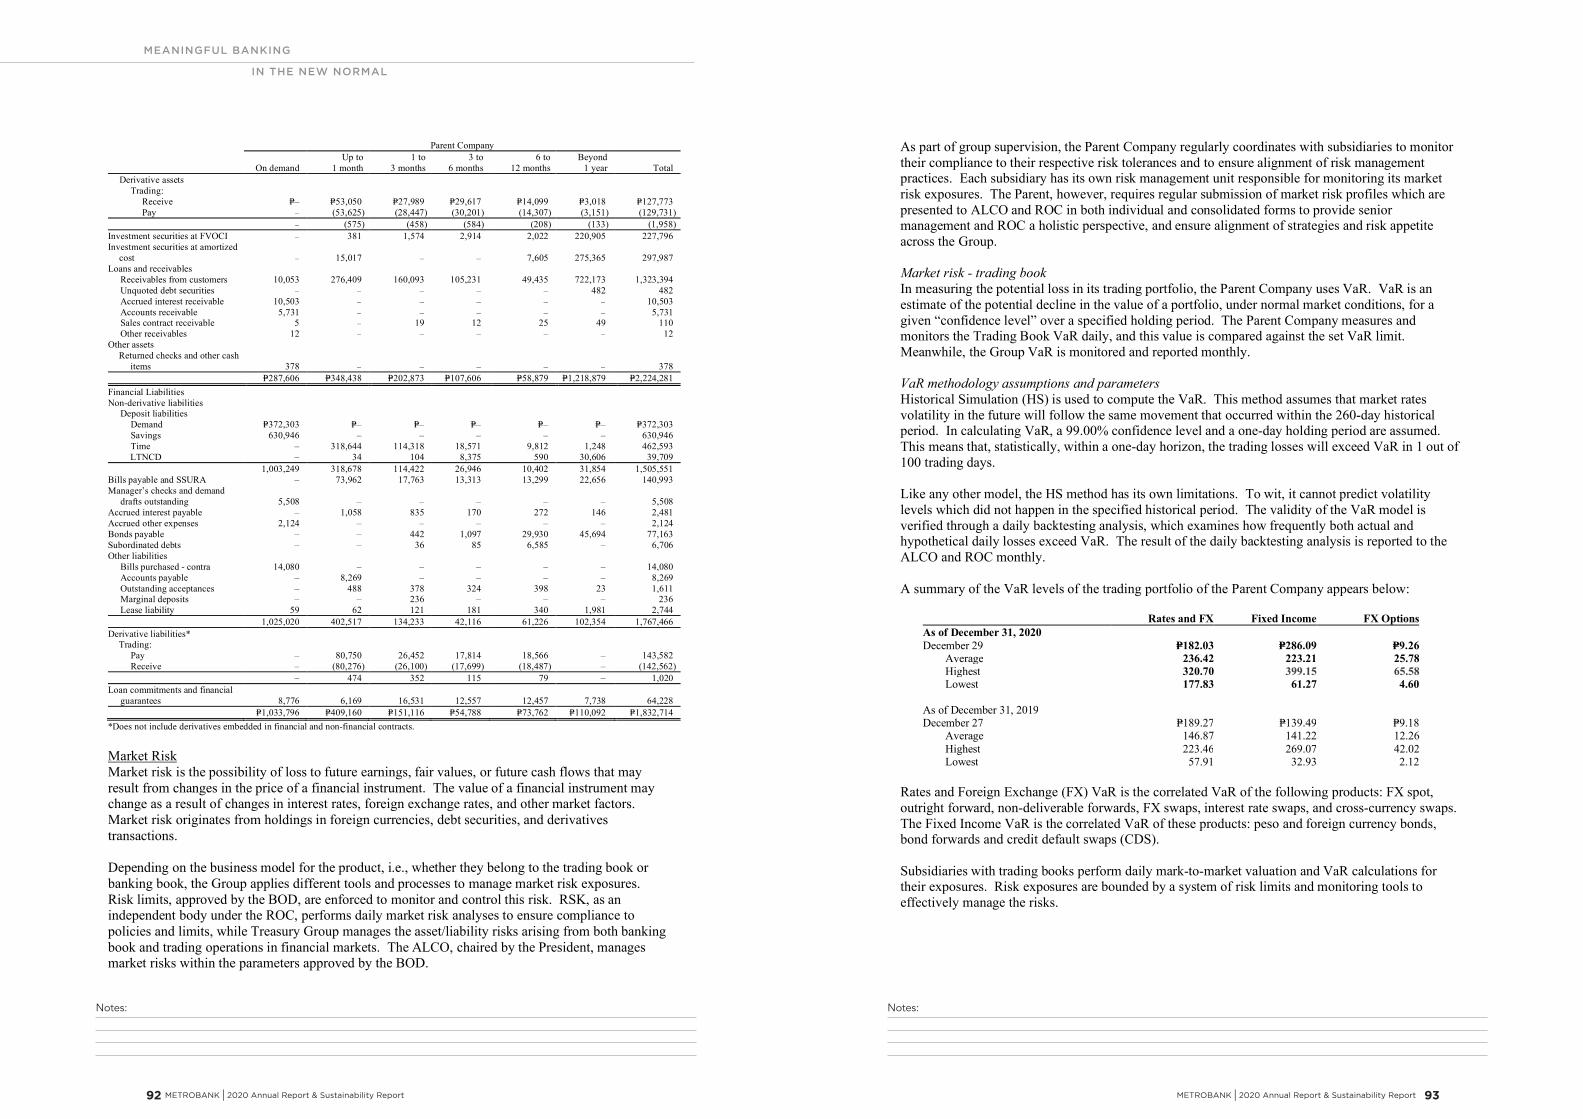
Notes:Notes:
MEANINGFUL BANKING
IN THE NEW NORMAL
METROBANK I 2020 Annual Report & Sustainability Report 93 92 METROBANK I 2020 Annual Report & Sustainability Report
- 61 -
*SGVFSM005911*
Parent Company
On demandUp to
1 month1 to
3 months3 to
6 months6 to
12 monthsBeyond
1 year Total Derivative assets Trading: Receive P=– P=53,050 P=27,989 P=29,617 P=14,099 P=3,018 P=127,773 Pay – (53,625) (28,447) (30,201) (14,307) (3,151) (129,731)
– (575) (458) (584) (208) (133) (1,958)Investment securities at FVOCI – 381 1,574 2,914 2,022 220,905 227,796Investment securities at amortized
cost – 15,017 – – 7,605 275,365 297,987Loans and receivables Receivables from customers 10,053 276,409 160,093 105,231 49,435 722,173 1,323,394 Unquoted debt securities – – – – – 482 482 Accrued interest receivable 10,503 – – – – – 10,503 Accounts receivable 5,731 – – – – – 5,731 Sales contract receivable 5 – 19 12 25 49 110 Other receivables 12 – – – – – 12Other assets
Returned checks and other cashitems 378 – – – – – 378
P=287,606 P=348,438 P=202,873 P=107,606 P=58,879 P=1,218,879 P=2,224,281Financial LiabilitiesNon-derivative liabilities Deposit liabilities Demand P=372,303 P=– P=– P=– P=– P=– P=372,303 Savings 630,946 – – – – – 630,946 Time – 318,644 114,318 18,571 9,812 1,248 462,593
LTNCD – 34 104 8,375 590 30,606 39,7091,003,249 318,678 114,422 26,946 10,402 31,854 1,505,551
Bills payable and SSURA – 73,962 17,763 13,313 13,299 22,656 140,993Manager’s checks and demand drafts outstanding 5,508 – – – – – 5,508Accrued interest payable – 1,058 835 170 272 146 2,481Accrued other expenses 2,124 – – – – – 2,124Bonds payable – – 442 1,097 29,930 45,694 77,163Subordinated debts – – 36 85 6,585 – 6,706Other liabilities Bills purchased - contra 14,080 – – – – – 14,080 Accounts payable – 8,269 – – – – 8,269 Outstanding acceptances – 488 378 324 398 23 1,611 Marginal deposits – – 236 – – – 236 Lease liability 59 62 121 181 340 1,981 2,744
1,025,020 402,517 134,233 42,116 61,226 102,354 1,767,466Derivative liabilities*
Trading: Pay – 80,750 26,452 17,814 18,566 – 143,582 Receive – (80,276) (26,100) (17,699) (18,487) – (142,562)
– 474 352 115 79 – 1,020Loan commitments and financial guarantees 8,776 6,169 16,531 12,557 12,457 7,738 64,228
P=1,033,796 P=409,160 P=151,116 P=54,788 P=73,762 P=110,092 P=1,832,714*Does not include derivatives embedded in financial and non-financial contracts.
Market RiskMarket risk is the possibility of loss to future earnings, fair values, or future cash flows that mayresult from changes in the price of a financial instrument. The value of a financial instrument maychange as a result of changes in interest rates, foreign exchange rates, and other market factors.Market risk originates from holdings in foreign currencies, debt securities, and derivativestransactions.
Depending on the business model for the product, i.e., whether they belong to the trading book orbanking book, the Group applies different tools and processes to manage market risk exposures.Risk limits, approved by the BOD, are enforced to monitor and control this risk. RSK, as anindependent body under the ROC, performs daily market risk analyses to ensure compliance topolicies and limits, while Treasury Group manages the asset/liability risks arising from both bankingbook and trading operations in financial markets. The ALCO, chaired by the President, managesmarket risks within the parameters approved by the BOD.
- 62 -
*SGVFSM005911*
As part of group supervision, the Parent Company regularly coordinates with subsidiaries to monitortheir compliance to their respective risk tolerances and to ensure alignment of risk managementpractices. Each subsidiary has its own risk management unit responsible for monitoring its marketrisk exposures. The Parent, however, requires regular submission of market risk profiles which arepresented to ALCO and ROC in both individual and consolidated forms to provide seniormanagement and ROC a holistic perspective, and ensure alignment of strategies and risk appetiteacross the Group.
Market risk - trading bookIn measuring the potential loss in its trading portfolio, the Parent Company uses VaR. VaR is anestimate of the potential decline in the value of a portfolio, under normal market conditions, for agiven “confidence level” over a specified holding period. The Parent Company measures andmonitors the Trading Book VaR daily, and this value is compared against the set VaR limit.Meanwhile, the Group VaR is monitored and reported monthly.
VaR methodology assumptions and parametersHistorical Simulation (HS) is used to compute the VaR. This method assumes that market ratesvolatility in the future will follow the same movement that occurred within the 260-day historicalperiod. In calculating VaR, a 99.00% confidence level and a one-day holding period are assumed.This means that, statistically, within a one-day horizon, the trading losses will exceed VaR in 1 out of100 trading days.
Like any other model, the HS method has its own limitations. To wit, it cannot predict volatilitylevels which did not happen in the specified historical period. The validity of the VaR model isverified through a daily backtesting analysis, which examines how frequently both actual andhypothetical daily losses exceed VaR. The result of the daily backtesting analysis is reported to theALCO and ROC monthly.
A summary of the VaR levels of the trading portfolio of the Parent Company appears below:
Rates and FX Fixed Income FX OptionsAs of December 31, 2020December 29 P=182.03 P=286.09 P=9.26
Average 236.42 223.21 25.78Highest 320.70 399.15 65.58Lowest 177.83 61.27 4.60
As of December 31, 2019December 27 P=189.27 P=139.49 P=9.18 Average 146.87 141.22 12.26
Highest 223.46 269.07 42.02Lowest 57.91 32.93 2.12
Rates and Foreign Exchange (FX) VaR is the correlated VaR of the following products: FX spot,outright forward, non-deliverable forwards, FX swaps, interest rate swaps, and cross-currency swaps.The Fixed Income VaR is the correlated VaR of these products: peso and foreign currency bonds,bond forwards and credit default swaps (CDS).
Subsidiaries with trading books perform daily mark-to-market valuation and VaR calculations fortheir exposures. Risk exposures are bounded by a system of risk limits and monitoring tools toeffectively manage the risks.
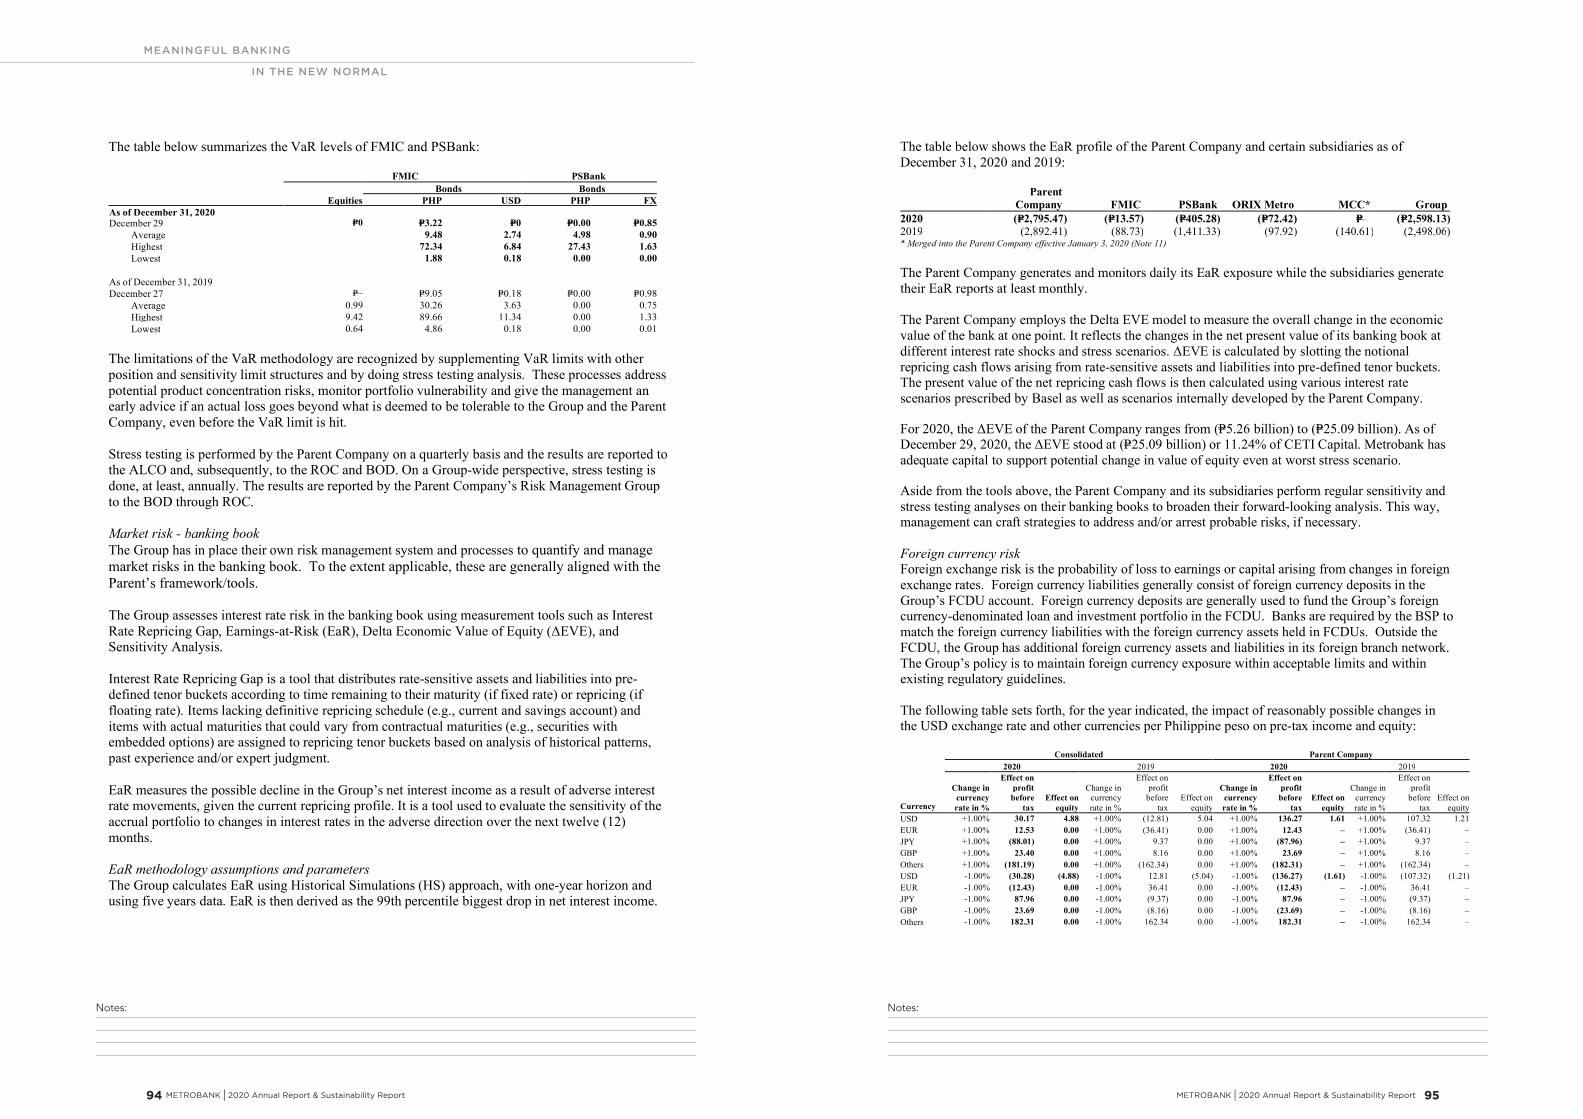
Notes:Notes:
MEANINGFUL BANKING
IN THE NEW NORMAL
METROBANK I 2020 Annual Report & Sustainability Report 95 94 METROBANK I 2020 Annual Report & Sustainability Report
- 63 -
*SGVFSM005911*
The table below summarizes the VaR levels of FMIC and PSBank:
FMIC PSBankBonds Bonds
Equities PHP USD PHP FXAs of December 31, 2020December 29 P=0 P=3.22 P=0 P=0.00 P=0.85
Average 9.48 2.74 4.98 0.90Highest 72.34 6.84 27.43 1.63Lowest 1.88 0.18 0.00 0.00
As of December 31, 2019December 27 P=– P=9.05 P=0.18 P=0.00 P=0.98
Average 0.99 30.26 3.63 0.00 0.75Highest 9.42 89.66 11.34 0.00 1.33Lowest 0.64 4.86 0.18 0.00 0.01
The limitations of the VaR methodology are recognized by supplementing VaR limits with otherposition and sensitivity limit structures and by doing stress testing analysis. These processes addresspotential product concentration risks, monitor portfolio vulnerability and give the management anearly advice if an actual loss goes beyond what is deemed to be tolerable to the Group and the ParentCompany, even before the VaR limit is hit.
Stress testing is performed by the Parent Company on a quarterly basis and the results are reported tothe ALCO and, subsequently, to the ROC and BOD. On a Group-wide perspective, stress testing isdone, at least, annually. The results are reported by the Parent Company’s Risk Management Groupto the BOD through ROC.
Market risk - banking bookThe Group has in place their own risk management system and processes to quantify and managemarket risks in the banking book. To the extent applicable, these are generally aligned with theParent’s framework/tools.
The Group assesses interest rate risk in the banking book using measurement tools such as InterestRate Repricing Gap, Earnings-at-Risk (EaR), Delta Economic Value of Equity (ΔEVE), andSensitivity Analysis.
Interest Rate Repricing Gap is a tool that distributes rate-sensitive assets and liabilities into pre-defined tenor buckets according to time remaining to their maturity (if fixed rate) or repricing (iffloating rate). Items lacking definitive repricing schedule (e.g., current and savings account) anditems with actual maturities that could vary from contractual maturities (e.g., securities withembedded options) are assigned to repricing tenor buckets based on analysis of historical patterns,past experience and/or expert judgment.
EaR measures the possible decline in the Group’s net interest income as a result of adverse interestrate movements, given the current repricing profile. It is a tool used to evaluate the sensitivity of theaccrual portfolio to changes in interest rates in the adverse direction over the next twelve (12)months.
EaR methodology assumptions and parametersThe Group calculates EaR using Historical Simulations (HS) approach, with one-year horizon andusing five years data. EaR is then derived as the 99th percentile biggest drop in net interest income.
- 64 -
*SGVFSM005911*
The table below shows the EaR profile of the Parent Company and certain subsidiaries as ofDecember 31, 2020 and 2019:
ParentCompany FMIC PSBank ORIX Metro MCC* Group
2020 (P=2,795.47) (P=13.57) (P=405.28) (P=72.42) P=– (P=2,598.13)2019 (2,892.41) (88.73) (1,411.33) (97.92) (140.61) (2,498.06)* Merged into the Parent Company effective January 3, 2020 (Note 11)
The Parent Company generates and monitors daily its EaR exposure while the subsidiaries generatetheir EaR reports at least monthly.
The Parent Company employs the Delta EVE model to measure the overall change in the economicvalue of the bank at one point. It reflects the changes in the net present value of its banking book atdifferent interest rate shocks and stress scenarios. ΔEVE is calculated by slotting the notionalrepricing cash flows arising from rate-sensitive assets and liabilities into pre-defined tenor buckets.The present value of the net repricing cash flows is then calculated using various interest ratescenarios prescribed by Basel as well as scenarios internally developed by the Parent Company.
For 2020, the ΔEVE of the Parent Company ranges from (P=5.26 billion) to (P=25.09 billion). As ofDecember 29, 2020, the ΔEVE stood at (P=25.09 billion) or 11.24% of CETI Capital. Metrobank hasadequate capital to support potential change in value of equity even at worst stress scenario.
Aside from the tools above, the Parent Company and its subsidiaries perform regular sensitivity andstress testing analyses on their banking books to broaden their forward-looking analysis. This way,management can craft strategies to address and/or arrest probable risks, if necessary.
Foreign currency riskForeign exchange risk is the probability of loss to earnings or capital arising from changes in foreignexchange rates. Foreign currency liabilities generally consist of foreign currency deposits in theGroup’s FCDU account. Foreign currency deposits are generally used to fund the Group’s foreigncurrency-denominated loan and investment portfolio in the FCDU. Banks are required by the BSP tomatch the foreign currency liabilities with the foreign currency assets held in FCDUs. Outside theFCDU, the Group has additional foreign currency assets and liabilities in its foreign branch network.The Group’s policy is to maintain foreign currency exposure within acceptable limits and withinexisting regulatory guidelines.
The following table sets forth, for the year indicated, the impact of reasonably possible changes inthe USD exchange rate and other currencies per Philippine peso on pre-tax income and equity:
Consolidated Parent Company2020 2019 2020 2019
Currency
Change incurrencyrate in %
Effect onprofitbefore
taxEffect on
equity
Change incurrencyrate in %
Effect onprofit
beforetax
Effect onequity
Change incurrencyrate in %
Effect onprofitbefore
taxEffect on
equity
Change incurrencyrate in %
Effect onprofit
beforetax
Effect onequity
USD +1.00% 30.17 4.88 +1.00% (12.81) 5.04 +1.00% 136.27 1.61 +1.00% 107.32 1.21EUR +1.00% 12.53 0.00 +1.00% (36.41) 0.00 +1.00% 12.43 – +1.00% (36.41) –JPY +1.00% (88.01) 0.00 +1.00% 9.37 0.00 +1.00% (87.96) – +1.00% 9.37 –GBP +1.00% 23.40 0.00 +1.00% 8.16 0.00 +1.00% 23.69 – +1.00% 8.16 –Others +1.00% (181.19) 0.00 +1.00% (162.34) 0.00 +1.00% (182.31) – +1.00% (162.34) –USD -1.00% (30.28) (4.88) -1.00% 12.81 (5.04) -1.00% (136.27) (1.61) -1.00% (107.32) (1.21)EUR -1.00% (12.43) 0.00 -1.00% 36.41 0.00 -1.00% (12.43) – -1.00% 36.41 –JPY -1.00% 87.96 0.00 -1.00% (9.37) 0.00 -1.00% 87.96 – -1.00% (9.37) –GBP -1.00% 23.69 0.00 -1.00% (8.16) 0.00 -1.00% (23.69) – -1.00% (8.16) –Others -1.00% 182.31 0.00 -1.00% 162.34 0.00 -1.00% 182.31 – -1.00% 162.34 –
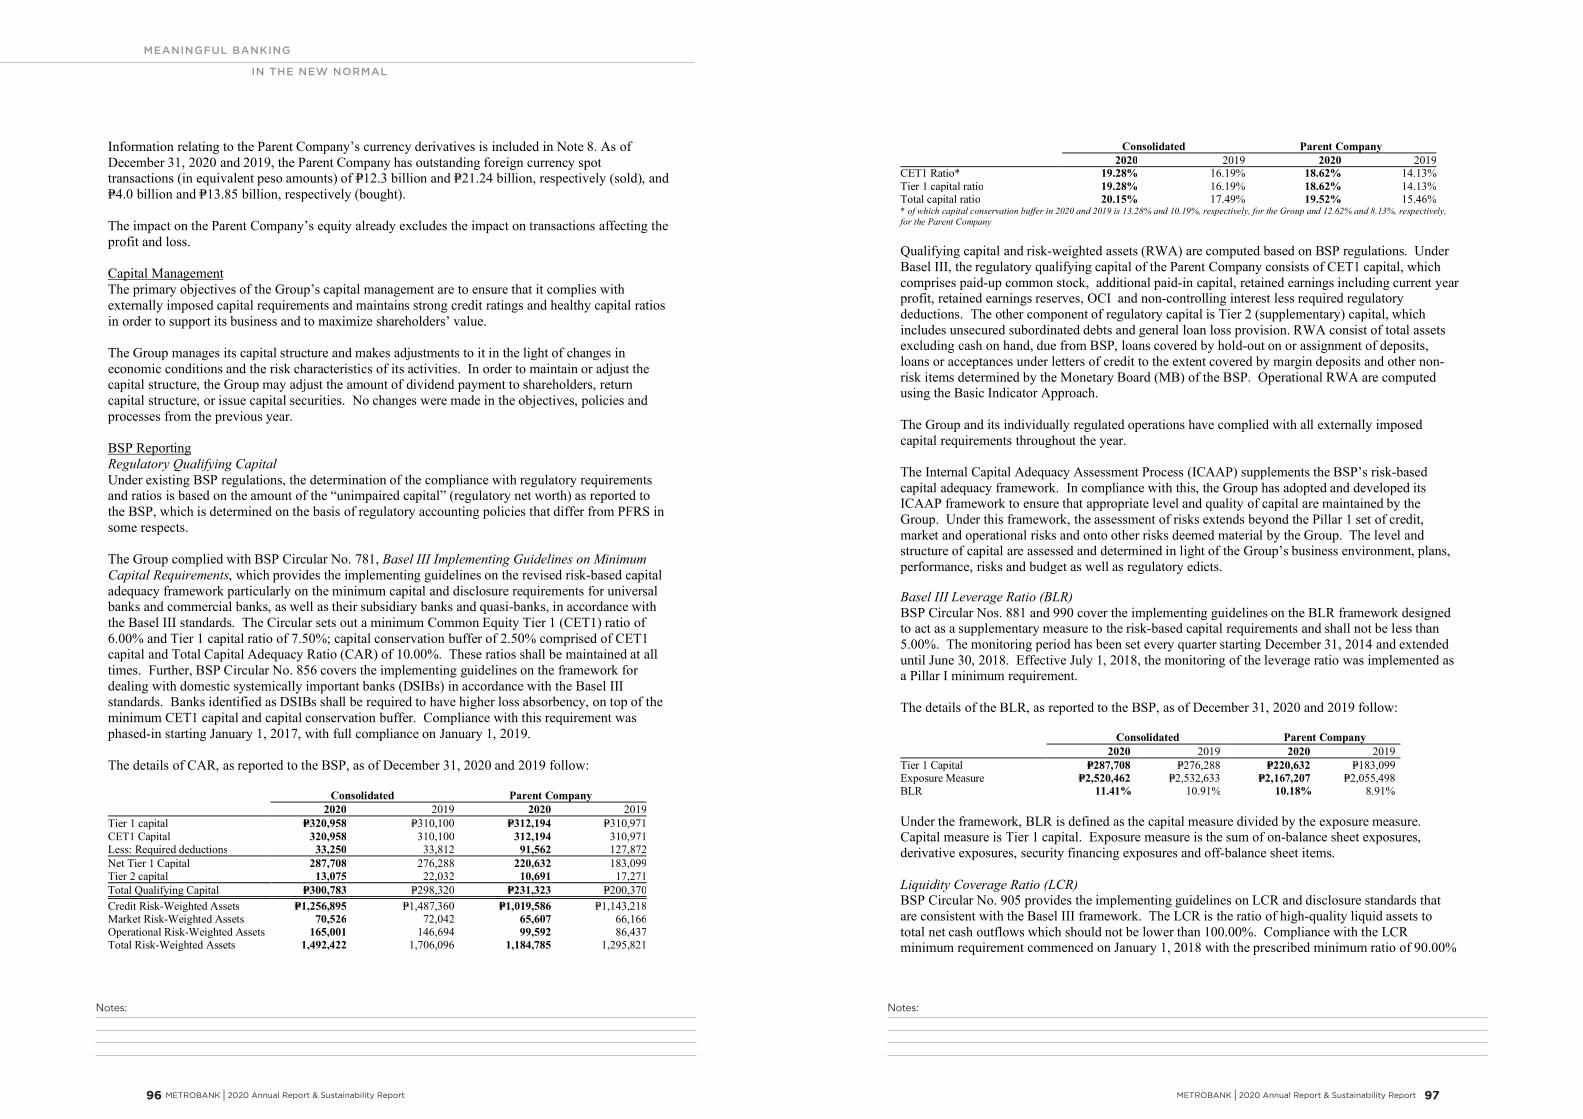
Notes:Notes:
MEANINGFUL BANKING
IN THE NEW NORMAL
METROBANK I 2020 Annual Report & Sustainability Report 97 96 METROBANK I 2020 Annual Report & Sustainability Report
- 65 -
*SGVFSM005911*
Information relating to the Parent Company’s currency derivatives is included in Note 8. As ofDecember 31, 2020 and 2019, the Parent Company has outstanding foreign currency spottransactions (in equivalent peso amounts) of P=12.3 billion and P=21.24 billion, respectively (sold), andP=4.0 billion and P=13.85 billion, respectively (bought).
The impact on the Parent Company’s equity already excludes the impact on transactions affecting theprofit and loss.
Capital ManagementThe primary objectives of the Group’s capital management are to ensure that it complies withexternally imposed capital requirements and maintains strong credit ratings and healthy capital ratiosin order to support its business and to maximize shareholders’ value.
The Group manages its capital structure and makes adjustments to it in the light of changes ineconomic conditions and the risk characteristics of its activities. In order to maintain or adjust thecapital structure, the Group may adjust the amount of dividend payment to shareholders, returncapital structure, or issue capital securities. No changes were made in the objectives, policies andprocesses from the previous year.
BSP ReportingRegulatory Qualifying CapitalUnder existing BSP regulations, the determination of the compliance with regulatory requirementsand ratios is based on the amount of the “unimpaired capital” (regulatory net worth) as reported tothe BSP, which is determined on the basis of regulatory accounting policies that differ from PFRS insome respects.
The Group complied with BSP Circular No. 781, Basel III Implementing Guidelines on MinimumCapital Requirements, which provides the implementing guidelines on the revised risk-based capitaladequacy framework particularly on the minimum capital and disclosure requirements for universalbanks and commercial banks, as well as their subsidiary banks and quasi-banks, in accordance withthe Basel III standards. The Circular sets out a minimum Common Equity Tier 1 (CET1) ratio of6.00% and Tier 1 capital ratio of 7.50%; capital conservation buffer of 2.50% comprised of CET1capital and Total Capital Adequacy Ratio (CAR) of 10.00%. These ratios shall be maintained at alltimes. Further, BSP Circular No. 856 covers the implementing guidelines on the framework fordealing with domestic systemically important banks (DSIBs) in accordance with the Basel IIIstandards. Banks identified as DSIBs shall be required to have higher loss absorbency, on top of theminimum CET1 capital and capital conservation buffer. Compliance with this requirement wasphased-in starting January 1, 2017, with full compliance on January 1, 2019.
The details of CAR, as reported to the BSP, as of December 31, 2020 and 2019 follow:
Consolidated Parent Company2020 2019 2020 2019
Tier 1 capital P=320,958 P=310,100 P=312,194 P=310,971CET1 Capital 320,958 310,100 312,194 310,971Less: Required deductions 33,250 33,812 91,562 127,872Net Tier 1 Capital 287,708 276,288 220,632 183,099Tier 2 capital 13,075 22,032 10,691 17,271Total Qualifying Capital P=300,783 P=298,320 P=231,323 P=200,370Credit Risk-Weighted Assets P=1,256,895 P=1,487,360 P=1,019,586 P=1,143,218Market Risk-Weighted Assets 70,526 72,042 65,607 66,166Operational Risk-Weighted Assets 165,001 146,694 99,592 86,437Total Risk-Weighted Assets 1,492,422 1,706,096 1,184,785 1,295,821
- 66 -
*SGVFSM005911*
Consolidated Parent Company2020 2019 2020 2019
CET1 Ratio* 19.28% 16.19% 18.62% 14.13%Tier 1 capital ratio 19.28% 16.19% 18.62% 14.13%Total capital ratio 20.15% 17.49% 19.52% 15.46%* of which capital conservation buffer in 2020 and 2019 is 13.28% and 10.19%, respectively, for the Group and 12.62% and 8.13%, respectively,for the Parent Company
Qualifying capital and risk-weighted assets (RWA) are computed based on BSP regulations. UnderBasel III, the regulatory qualifying capital of the Parent Company consists of CET1 capital, whichcomprises paid-up common stock, additional paid-in capital, retained earnings including current yearprofit, retained earnings reserves, OCI and non-controlling interest less required regulatorydeductions. The other component of regulatory capital is Tier 2 (supplementary) capital, whichincludes unsecured subordinated debts and general loan loss provision. RWA consist of total assetsexcluding cash on hand, due from BSP, loans covered by hold-out on or assignment of deposits,loans or acceptances under letters of credit to the extent covered by margin deposits and other non-risk items determined by the Monetary Board (MB) of the BSP. Operational RWA are computedusing the Basic Indicator Approach.
The Group and its individually regulated operations have complied with all externally imposedcapital requirements throughout the year.
The Internal Capital Adequacy Assessment Process (ICAAP) supplements the BSP’s risk-basedcapital adequacy framework. In compliance with this, the Group has adopted and developed itsICAAP framework to ensure that appropriate level and quality of capital are maintained by theGroup. Under this framework, the assessment of risks extends beyond the Pillar 1 set of credit,market and operational risks and onto other risks deemed material by the Group. The level andstructure of capital are assessed and determined in light of the Group’s business environment, plans,performance, risks and budget as well as regulatory edicts.
Basel III Leverage Ratio (BLR)BSP Circular Nos. 881 and 990 cover the implementing guidelines on the BLR framework designedto act as a supplementary measure to the risk-based capital requirements and shall not be less than5.00%. The monitoring period has been set every quarter starting December 31, 2014 and extendeduntil June 30, 2018. Effective July 1, 2018, the monitoring of the leverage ratio was implemented asa Pillar I minimum requirement.
The details of the BLR, as reported to the BSP, as of December 31, 2020 and 2019 follow:
Consolidated Parent Company2020 2019 2020 2019
Tier 1 Capital P=287,708 P=276,288 P=220,632 P=183,099Exposure Measure P=2,520,462 P=2,532,633 P=2,167,207 P=2,055,498BLR 11.41% 10.91% 10.18% 8.91%
Under the framework, BLR is defined as the capital measure divided by the exposure measure.Capital measure is Tier 1 capital. Exposure measure is the sum of on-balance sheet exposures,derivative exposures, security financing exposures and off-balance sheet items.
Liquidity Coverage Ratio (LCR)BSP Circular No. 905 provides the implementing guidelines on LCR and disclosure standards thatare consistent with the Basel III framework. The LCR is the ratio of high-quality liquid assets tototal net cash outflows which should not be lower than 100.00%. Compliance with the LCRminimum requirement commenced on January 1, 2018 with the prescribed minimum ratio of 90.00%
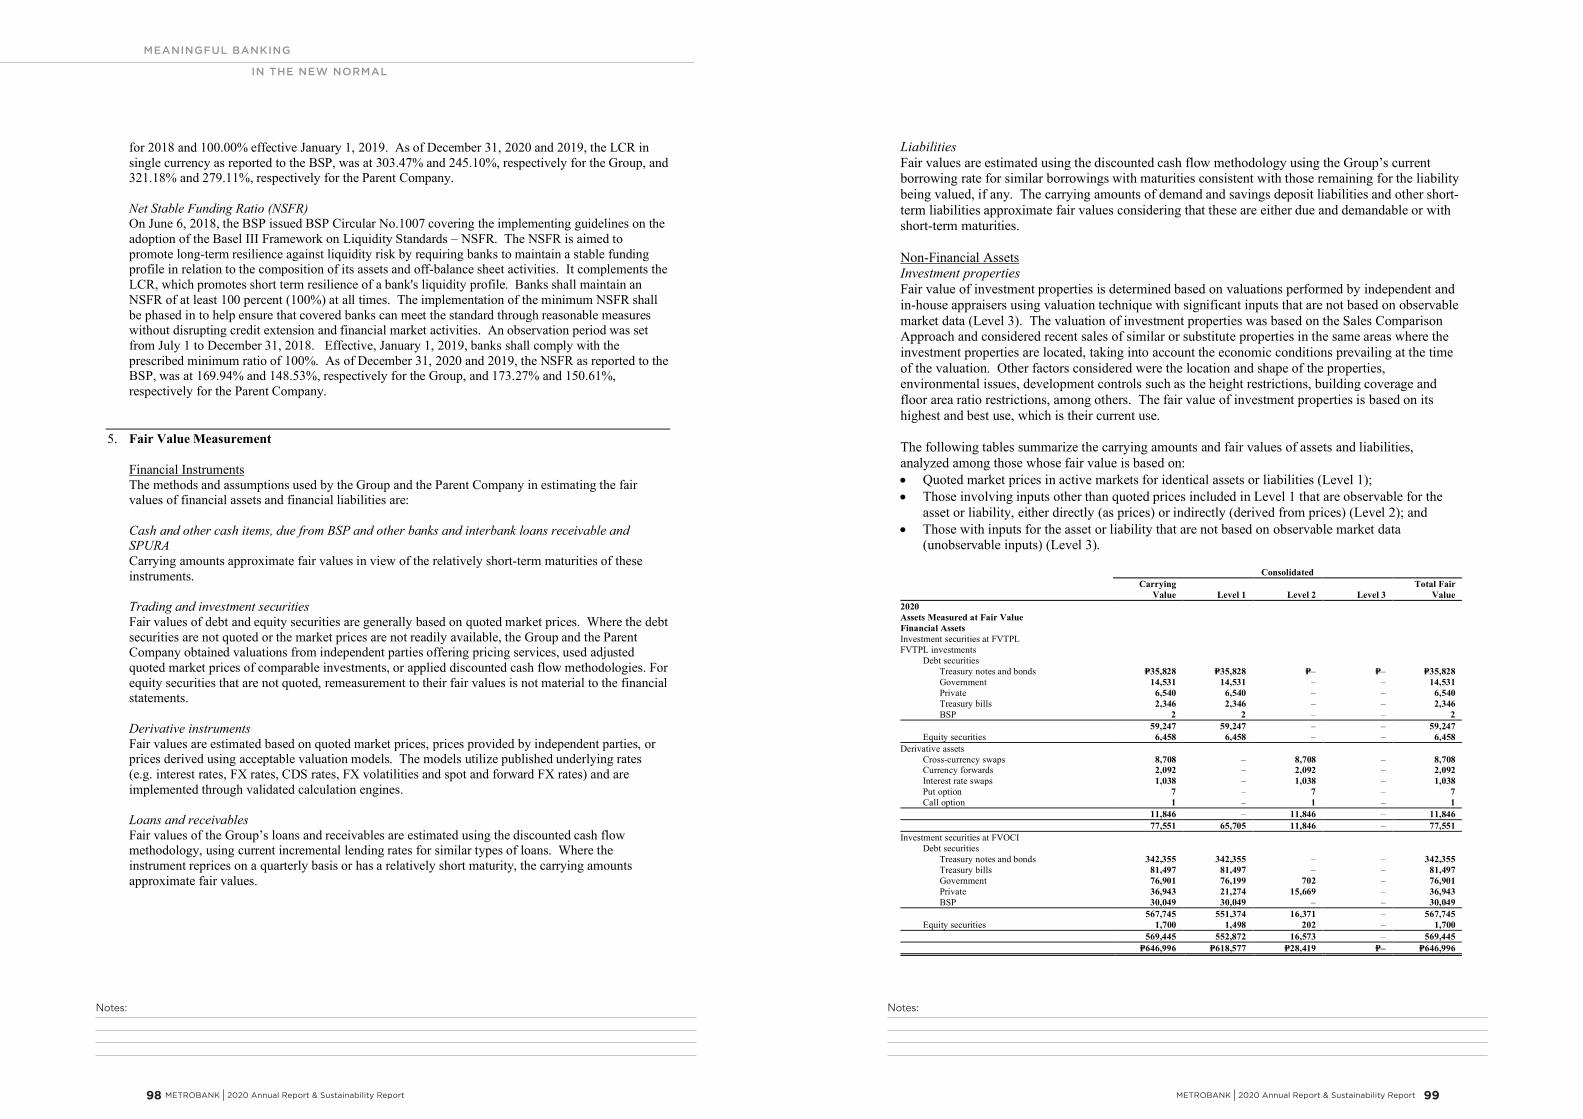
Notes:Notes:
MEANINGFUL BANKING
IN THE NEW NORMAL
METROBANK I 2020 Annual Report & Sustainability Report 99 98 METROBANK I 2020 Annual Report & Sustainability Report
- 67 -
*SGVFSM005911*
for 2018 and 100.00% effective January 1, 2019. As of December 31, 2020 and 2019, the LCR insingle currency as reported to the BSP, was at 303.47% and 245.10%, respectively for the Group, and321.18% and 279.11%, respectively for the Parent Company.
Net Stable Funding Ratio (NSFR)On June 6, 2018, the BSP issued BSP Circular No.1007 covering the implementing guidelines on theadoption of the Basel III Framework on Liquidity Standards – NSFR. The NSFR is aimed topromote long-term resilience against liquidity risk by requiring banks to maintain a stable fundingprofile in relation to the composition of its assets and off-balance sheet activities. It complements theLCR, which promotes short term resilience of a bank's liquidity profile. Banks shall maintain anNSFR of at least 100 percent (100%) at all times. The implementation of the minimum NSFR shallbe phased in to help ensure that covered banks can meet the standard through reasonable measureswithout disrupting credit extension and financial market activities. An observation period was setfrom July 1 to December 31, 2018. Effective, January 1, 2019, banks shall comply with theprescribed minimum ratio of 100%. As of December 31, 2020 and 2019, the NSFR as reported to theBSP, was at 169.94% and 148.53%, respectively for the Group, and 173.27% and 150.61%,respectively for the Parent Company.
5. Fair Value Measurement
Financial InstrumentsThe methods and assumptions used by the Group and the Parent Company in estimating the fairvalues of financial assets and financial liabilities are:
Cash and other cash items, due from BSP and other banks and interbank loans receivable andSPURACarrying amounts approximate fair values in view of the relatively short-term maturities of theseinstruments.
Trading and investment securitiesFair values of debt and equity securities are generally based on quoted market prices. Where the debtsecurities are not quoted or the market prices are not readily available, the Group and the ParentCompany obtained valuations from independent parties offering pricing services, used adjustedquoted market prices of comparable investments, or applied discounted cash flow methodologies. Forequity securities that are not quoted, remeasurement to their fair values is not material to the financialstatements.
Derivative instrumentsFair values are estimated based on quoted market prices, prices provided by independent parties, orprices derived using acceptable valuation models. The models utilize published underlying rates(e.g. interest rates, FX rates, CDS rates, FX volatilities and spot and forward FX rates) and areimplemented through validated calculation engines.
Loans and receivablesFair values of the Group’s loans and receivables are estimated using the discounted cash flowmethodology, using current incremental lending rates for similar types of loans. Where theinstrument reprices on a quarterly basis or has a relatively short maturity, the carrying amountsapproximate fair values.
- 68 -
*SGVFSM005911*
LiabilitiesFair values are estimated using the discounted cash flow methodology using the Group’s currentborrowing rate for similar borrowings with maturities consistent with those remaining for the liabilitybeing valued, if any. The carrying amounts of demand and savings deposit liabilities and other short-term liabilities approximate fair values considering that these are either due and demandable or withshort-term maturities.
Non-Financial AssetsInvestment propertiesFair value of investment properties is determined based on valuations performed by independent andin-house appraisers using valuation technique with significant inputs that are not based on observablemarket data (Level 3). The valuation of investment properties was based on the Sales ComparisonApproach and considered recent sales of similar or substitute properties in the same areas where theinvestment properties are located, taking into account the economic conditions prevailing at the timeof the valuation. Other factors considered were the location and shape of the properties,environmental issues, development controls such as the height restrictions, building coverage andfloor area ratio restrictions, among others. The fair value of investment properties is based on itshighest and best use, which is their current use.
The following tables summarize the carrying amounts and fair values of assets and liabilities,analyzed among those whose fair value is based on: Quoted market prices in active markets for identical assets or liabilities (Level 1); Those involving inputs other than quoted prices included in Level 1 that are observable for the
asset or liability, either directly (as prices) or indirectly (derived from prices) (Level 2); and Those with inputs for the asset or liability that are not based on observable market data
(unobservable inputs) (Level 3).
ConsolidatedCarrying
Value Level 1 Level 2 Level 3Total Fair
Value2020Assets Measured at Fair ValueFinancial AssetsInvestment securities at FVTPLFVTPL investments
Debt securitiesTreasury notes and bonds P=35,828 P=35,828 P=– P=– P=35,828Government 14,531 14,531 – – 14,531Private 6,540 6,540 – – 6,540Treasury bills 2,346 2,346 – – 2,346BSP 2 2 – – 2
59,247 59,247 – – 59,247Equity securities 6,458 6,458 – – 6,458
Derivative assetsCross-currency swaps 8,708 – 8,708 – 8,708Currency forwards 2,092 – 2,092 – 2,092Interest rate swaps 1,038 – 1,038 – 1,038Put option 7 – 7 – 7Call option 1 – 1 – 1
11,846 – 11,846 – 11,84677,551 65,705 11,846 – 77,551
Investment securities at FVOCIDebt securities
Treasury notes and bonds 342,355 342,355 – – 342,355Treasury bills 81,497 81,497 – – 81,497Government 76,901 76,199 702 – 76,901Private 36,943 21,274 15,669 – 36,943BSP 30,049 30,049 – – 30,049
567,745 551,374 16,371 – 567,745Equity securities 1,700 1,498 202 – 1,700
569,445 552,872 16,573 – 569,445P=646,996 P=618,577 P=28,419 P=– P=646,996
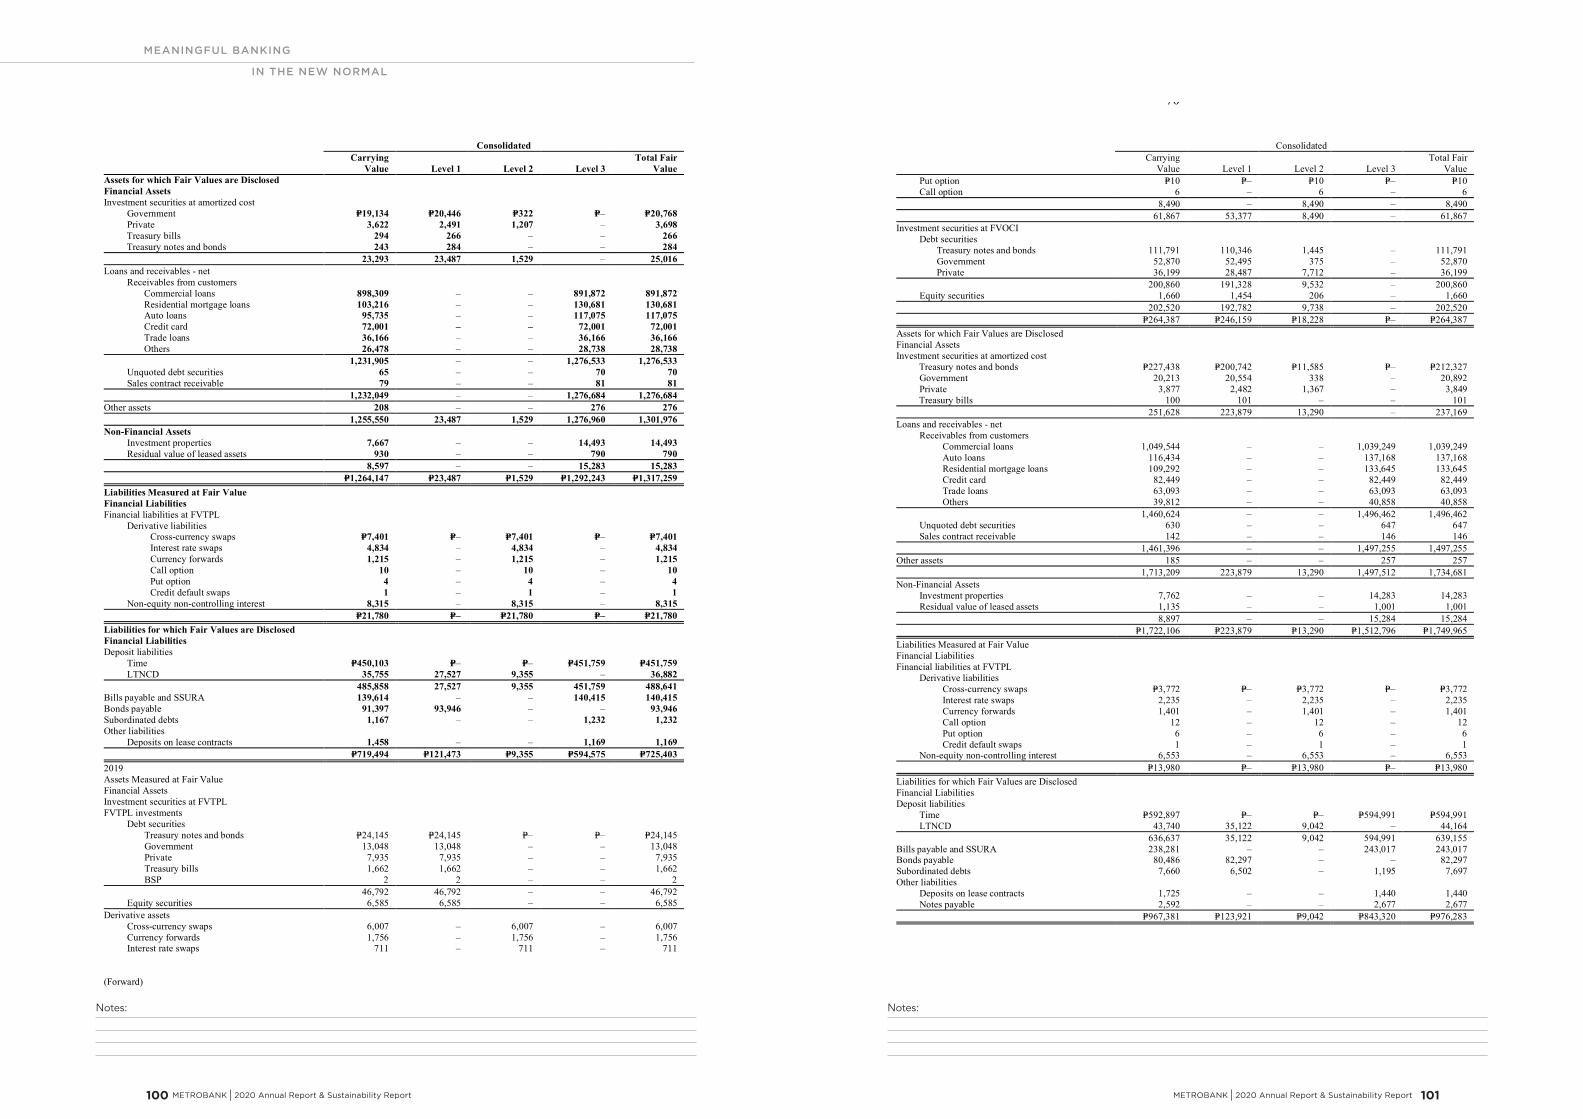
Notes:Notes:
MEANINGFUL BANKING
IN THE NEW NORMAL
METROBANK I 2020 Annual Report & Sustainability Report 101 100 METROBANK I 2020 Annual Report & Sustainability Report
- 69 -
*SGVFSM005911*
ConsolidatedCarrying
Value Level 1 Level 2 Level 3Total Fair
ValueAssets for which Fair Values are DisclosedFinancial AssetsInvestment securities at amortized cost
Government P=19,134 P=20,446 P=322 P=– P=20,768Private 3,622 2,491 1,207 – 3,698Treasury bills 294 266 – – 266Treasury notes and bonds 243 284 – – 284
23,293 23,487 1,529 – 25,016Loans and receivables - net
Receivables from customersCommercial loans 898,309 – – 891,872 891,872Residential mortgage loans 103,216 – – 130,681 130,681Auto loans 95,735 – – 117,075 117,075Credit card 72,001 – – 72,001 72,001Trade loans 36,166 – – 36,166 36,166Others 26,478 – – 28,738 28,738
1,231,905 – – 1,276,533 1,276,533Unquoted debt securities 65 – – 70 70Sales contract receivable 79 – – 81 81
1,232,049 – – 1,276,684 1,276,684Other assets 208 – – 276 276
1,255,550 23,487 1,529 1,276,960 1,301,976Non-Financial Assets
Investment properties 7,667 – – 14,493 14,493Residual value of leased assets 930 – – 790 790
8,597 – – 15,283 15,283P=1,264,147 P=23,487 P=1,529 P=1,292,243 P=1,317,259
Liabilities Measured at Fair ValueFinancial LiabilitiesFinancial liabilities at FVTPL
Derivative liabilitiesCross-currency swaps P=7,401 P=– P=7,401 P=– P=7,401Interest rate swaps 4,834 – 4,834 – 4,834Currency forwards 1,215 – 1,215 – 1,215Call option 10 – 10 – 10Put option 4 – 4 – 4Credit default swaps 1 – 1 – 1
Non-equity non-controlling interest 8,315 – 8,315 – 8,315P=21,780 P=– P=21,780 P=– P=21,780
Liabilities for which Fair Values are DisclosedFinancial LiabilitiesDeposit liabilities
Time P=450,103 P=– P=– P=451,759 P=451,759LTNCD 35,755 27,527 9,355 – 36,882
485,858 27,527 9,355 451,759 488,641Bills payable and SSURA 139,614 – – 140,415 140,415Bonds payable 91,397 93,946 – – 93,946Subordinated debts 1,167 – – 1,232 1,232Other liabilities
Deposits on lease contracts 1,458 – – 1,169 1,169P=719,494 P=121,473 P=9,355 P=594,575 P=725,403
2019Assets Measured at Fair ValueFinancial AssetsInvestment securities at FVTPLFVTPL investments
Debt securitiesTreasury notes and bonds P=24,145 P=24,145 P=– P=– P=24,145Government 13,048 13,048 – – 13,048Private 7,935 7,935 – – 7,935Treasury bills 1,662 1,662 – – 1,662BSP 2 2 – – 2
46,792 46,792 – – 46,792Equity securities 6,585 6,585 – – 6,585
Derivative assetsCross-currency swaps 6,007 – 6,007 – 6,007Currency forwards 1,756 – 1,756 – 1,756Interest rate swaps 711 – 711 – 711
(Forward)
- 70 -
*SGVFSM005911*
ConsolidatedCarrying
Value Level 1 Level 2 Level 3Total Fair
ValuePut option P=10 P=– P=10 P=– P=10Call option 6 – 6 – 6
8,490 – 8,490 – 8,49061,867 53,377 8,490 – 61,867
Investment securities at FVOCIDebt securities
Treasury notes and bonds 111,791 110,346 1,445 – 111,791Government 52,870 52,495 375 – 52,870Private 36,199 28,487 7,712 – 36,199
200,860 191,328 9,532 – 200,860Equity securities 1,660 1,454 206 – 1,660
202,520 192,782 9,738 – 202,520P=264,387 P=246,159 P=18,228 P=– P=264,387
Assets for which Fair Values are DisclosedFinancial AssetsInvestment securities at amortized cost
Treasury notes and bonds P=227,438 P=200,742 P=11,585 P=– P=212,327Government 20,213 20,554 338 – 20,892Private 3,877 2,482 1,367 – 3,849Treasury bills 100 101 – – 101
251,628 223,879 13,290 – 237,169Loans and receivables - net
Receivables from customersCommercial loans 1,049,544 – – 1,039,249 1,039,249Auto loans 116,434 – – 137,168 137,168Residential mortgage loans 109,292 – – 133,645 133,645Credit card 82,449 – – 82,449 82,449Trade loans 63,093 – – 63,093 63,093Others 39,812 – – 40,858 40,858
1,460,624 – – 1,496,462 1,496,462Unquoted debt securities 630 – – 647 647Sales contract receivable 142 – – 146 146
1,461,396 – – 1,497,255 1,497,255Other assets 185 – – 257 257
1,713,209 223,879 13,290 1,497,512 1,734,681Non-Financial Assets
Investment properties 7,762 – – 14,283 14,283Residual value of leased assets 1,135 – – 1,001 1,001
8,897 – – 15,284 15,284P=1,722,106 P=223,879 P=13,290 P=1,512,796 P=1,749,965
Liabilities Measured at Fair ValueFinancial LiabilitiesFinancial liabilities at FVTPL
Derivative liabilitiesCross-currency swaps P=3,772 P=– P=3,772 P=– P=3,772Interest rate swaps 2,235 – 2,235 – 2,235Currency forwards 1,401 – 1,401 – 1,401Call option 12 – 12 – 12Put option 6 – 6 – 6Credit default swaps 1 – 1 – 1
Non-equity non-controlling interest 6,553 – 6,553 – 6,553P=13,980 P=– P=13,980 P=– P=13,980
Liabilities for which Fair Values are DisclosedFinancial LiabilitiesDeposit liabilities
Time P=592,897 P=– P=– P=594,991 P=594,991LTNCD 43,740 35,122 9,042 – 44,164
636,637 35,122 9,042 594,991 639,155Bills payable and SSURA 238,281 – – 243,017 243,017Bonds payable 80,486 82,297 – – 82,297Subordinated debts 7,660 6,502 – 1,195 7,697Other liabilities
Deposits on lease contracts 1,725 – – 1,440 1,440Notes payable 2,592 – – 2,677 2,677
P=967,381 P=123,921 P=9,042 P=843,320 P=976,283
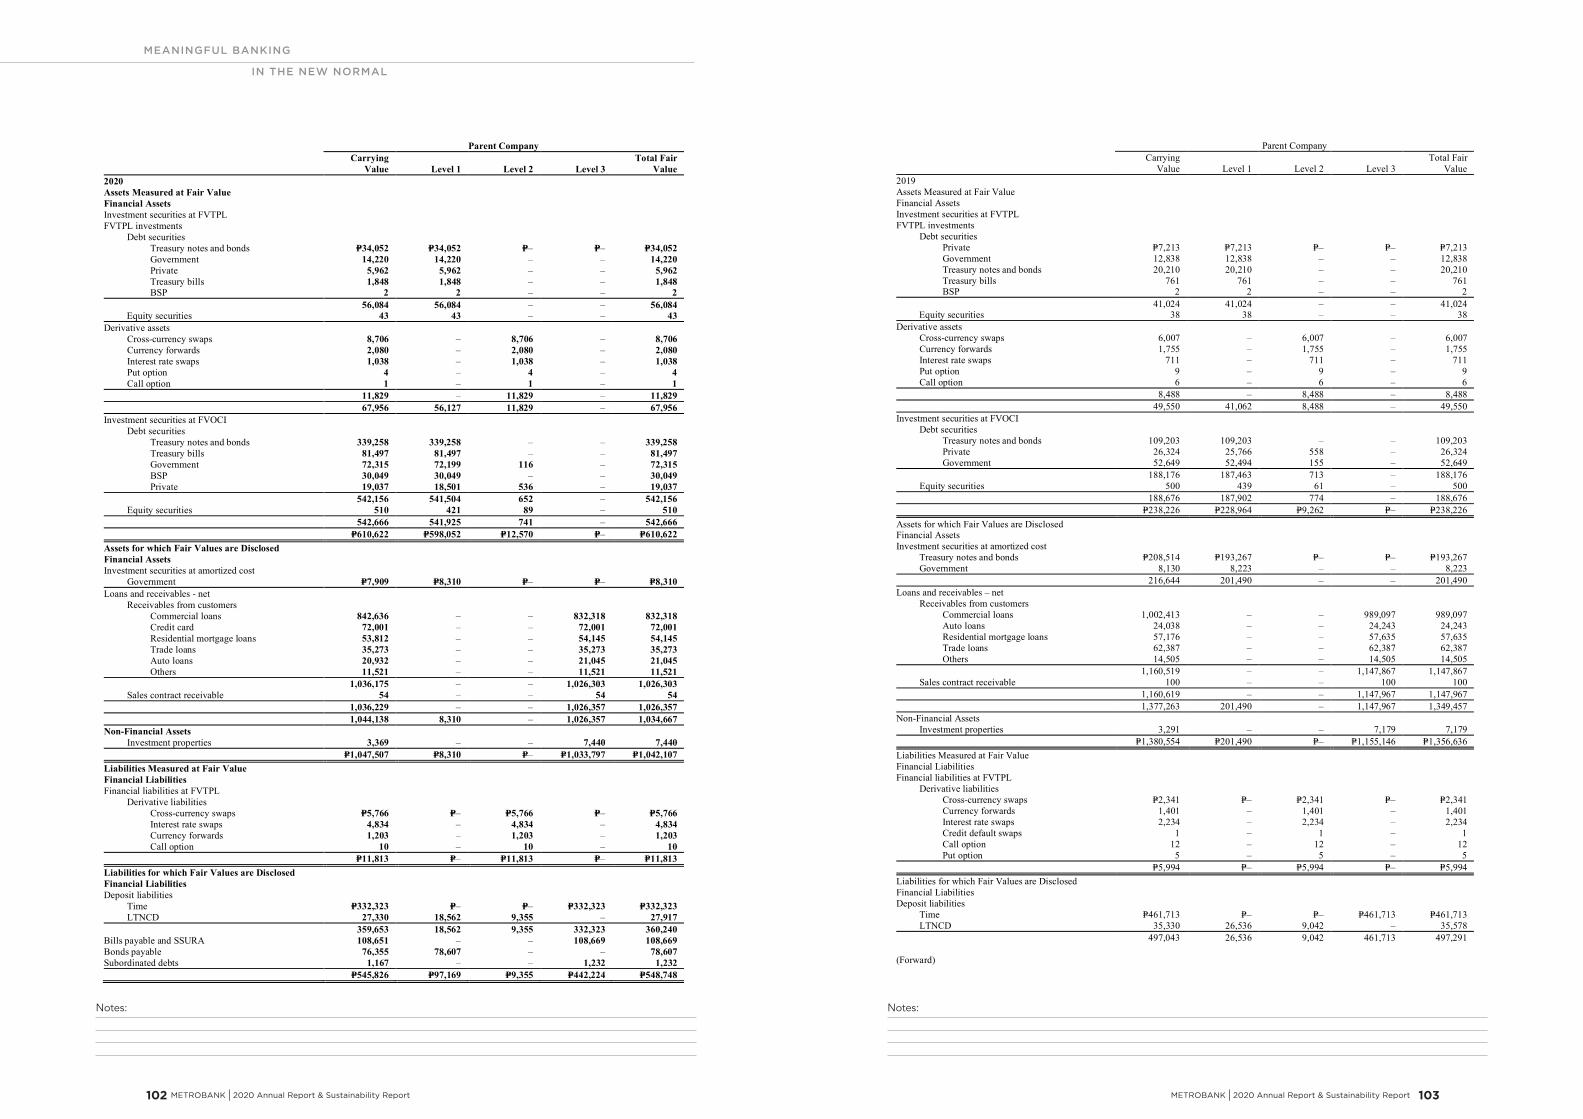
Notes:Notes:
MEANINGFUL BANKING
IN THE NEW NORMAL
METROBANK I 2020 Annual Report & Sustainability Report 103 102 METROBANK I 2020 Annual Report & Sustainability Report
- 71 -
*SGVFSM005911*
Parent CompanyCarrying
Value Level 1 Level 2 Level 3Total Fair
Value2020Assets Measured at Fair ValueFinancial AssetsInvestment securities at FVTPLFVTPL investments
Debt securitiesTreasury notes and bonds P=34,052 P=34,052 P=– P=– P=34,052Government 14,220 14,220 – – 14,220Private 5,962 5,962 – – 5,962Treasury bills 1,848 1,848 – – 1,848BSP 2 2 – – 2
56,084 56,084 – – 56,084Equity securities 43 43 – – 43
Derivative assetsCross-currency swaps 8,706 – 8,706 – 8,706Currency forwards 2,080 – 2,080 – 2,080Interest rate swaps 1,038 – 1,038 – 1,038Put option 4 – 4 – 4Call option 1 – 1 – 1
11,829 – 11,829 – 11,82967,956 56,127 11,829 – 67,956
Investment securities at FVOCIDebt securities
Treasury notes and bonds 339,258 339,258 – – 339,258Treasury bills 81,497 81,497 – – 81,497Government 72,315 72,199 116 – 72,315BSP 30,049 30,049 – – 30,049Private 19,037 18,501 536 – 19,037
542,156 541,504 652 – 542,156Equity securities 510 421 89 – 510
542,666 541,925 741 – 542,666P=610,622 P=598,052 P=12,570 P=– P=610,622
Assets for which Fair Values are DisclosedFinancial AssetsInvestment securities at amortized cost
Government P=7,909 P=8,310 P=– P=– P=8,310Loans and receivables - net
Receivables from customersCommercial loans 842,636 – – 832,318 832,318Credit card 72,001 – – 72,001 72,001Residential mortgage loans 53,812 – – 54,145 54,145Trade loans 35,273 – – 35,273 35,273Auto loans 20,932 – – 21,045 21,045Others 11,521 – – 11,521 11,521
1,036,175 – – 1,026,303 1,026,303Sales contract receivable 54 – – 54 54
1,036,229 – – 1,026,357 1,026,3571,044,138 8,310 – 1,026,357 1,034,667
Non-Financial AssetsInvestment properties 3,369 – – 7,440 7,440
P=1,047,507 P=8,310 P=– P=1,033,797 P=1,042,107Liabilities Measured at Fair ValueFinancial LiabilitiesFinancial liabilities at FVTPL
Derivative liabilitiesCross-currency swaps P=5,766 P=– P=5,766 P=– P=5,766Interest rate swaps 4,834 – 4,834 – 4,834Currency forwards 1,203 – 1,203 – 1,203Call option 10 – 10 – 10
P=11,813 P=– P=11,813 P=– P=11,813Liabilities for which Fair Values are DisclosedFinancial LiabilitiesDeposit liabilities
Time P=332,323 P=– P=– P=332,323 P=332,323LTNCD 27,330 18,562 9,355 – 27,917
359,653 18,562 9,355 332,323 360,240Bills payable and SSURA 108,651 – – 108,669 108,669Bonds payable 76,355 78,607 – – 78,607Subordinated debts 1,167 – – 1,232 1,232
P=545,826 P=97,169 P=9,355 P=442,224 P=548,748
- 72 -
*SGVFSM005911*
Parent CompanyCarrying
Value Level 1 Level 2 Level 3Total Fair
Value2019Assets Measured at Fair ValueFinancial AssetsInvestment securities at FVTPLFVTPL investments
Debt securitiesPrivate P=7,213 P=7,213 P=– P=– P=7,213Government 12,838 12,838 – – 12,838Treasury notes and bonds 20,210 20,210 – – 20,210Treasury bills 761 761 – – 761BSP 2 2 – – 2
41,024 41,024 – – 41,024Equity securities 38 38 – – 38
Derivative assetsCross-currency swaps 6,007 – 6,007 – 6,007Currency forwards 1,755 – 1,755 – 1,755Interest rate swaps 711 – 711 – 711Put option 9 – 9 – 9Call option 6 – 6 – 6
8,488 – 8,488 – 8,48849,550 41,062 8,488 – 49,550
Investment securities at FVOCIDebt securities
Treasury notes and bonds 109,203 109,203 – – 109,203Private 26,324 25,766 558 – 26,324Government 52,649 52,494 155 – 52,649
188,176 187,463 713 – 188,176Equity securities 500 439 61 – 500
188,676 187,902 774 – 188,676P=238,226 P=228,964 P=9,262 P=– P=238,226
Assets for which Fair Values are DisclosedFinancial AssetsInvestment securities at amortized cost
Treasury notes and bonds P=208,514 P=193,267 P=– P=– P=193,267Government 8,130 8,223 – – 8,223
216,644 201,490 – – 201,490Loans and receivables – net
Receivables from customersCommercial loans 1,002,413 – – 989,097 989,097Auto loans 24,038 – – 24,243 24,243Residential mortgage loans 57,176 – – 57,635 57,635Trade loans 62,387 – – 62,387 62,387Others 14,505 – – 14,505 14,505
1,160,519 – – 1,147,867 1,147,867Sales contract receivable 100 – – 100 100
1,160,619 – – 1,147,967 1,147,9671,377,263 201,490 – 1,147,967 1,349,457
Non-Financial AssetsInvestment properties 3,291 – – 7,179 7,179
P=1,380,554 P=201,490 P=– P=1,155,146 P=1,356,636Liabilities Measured at Fair ValueFinancial LiabilitiesFinancial liabilities at FVTPL
Derivative liabilitiesCross-currency swaps P=2,341 P=– P=2,341 P=– P=2,341Currency forwards 1,401 – 1,401 – 1,401Interest rate swaps 2,234 – 2,234 – 2,234Credit default swaps 1 – 1 – 1Call option 12 – 12 – 12Put option 5 – 5 – 5
P=5,994 P=– P=5,994 P=– P=5,994Liabilities for which Fair Values are DisclosedFinancial LiabilitiesDeposit liabilities
Time P=461,713 P=– P=– P=461,713 P=461,713LTNCD 35,330 26,536 9,042 – 35,578
497,043 26,536 9,042 461,713 497,291
(Forward)
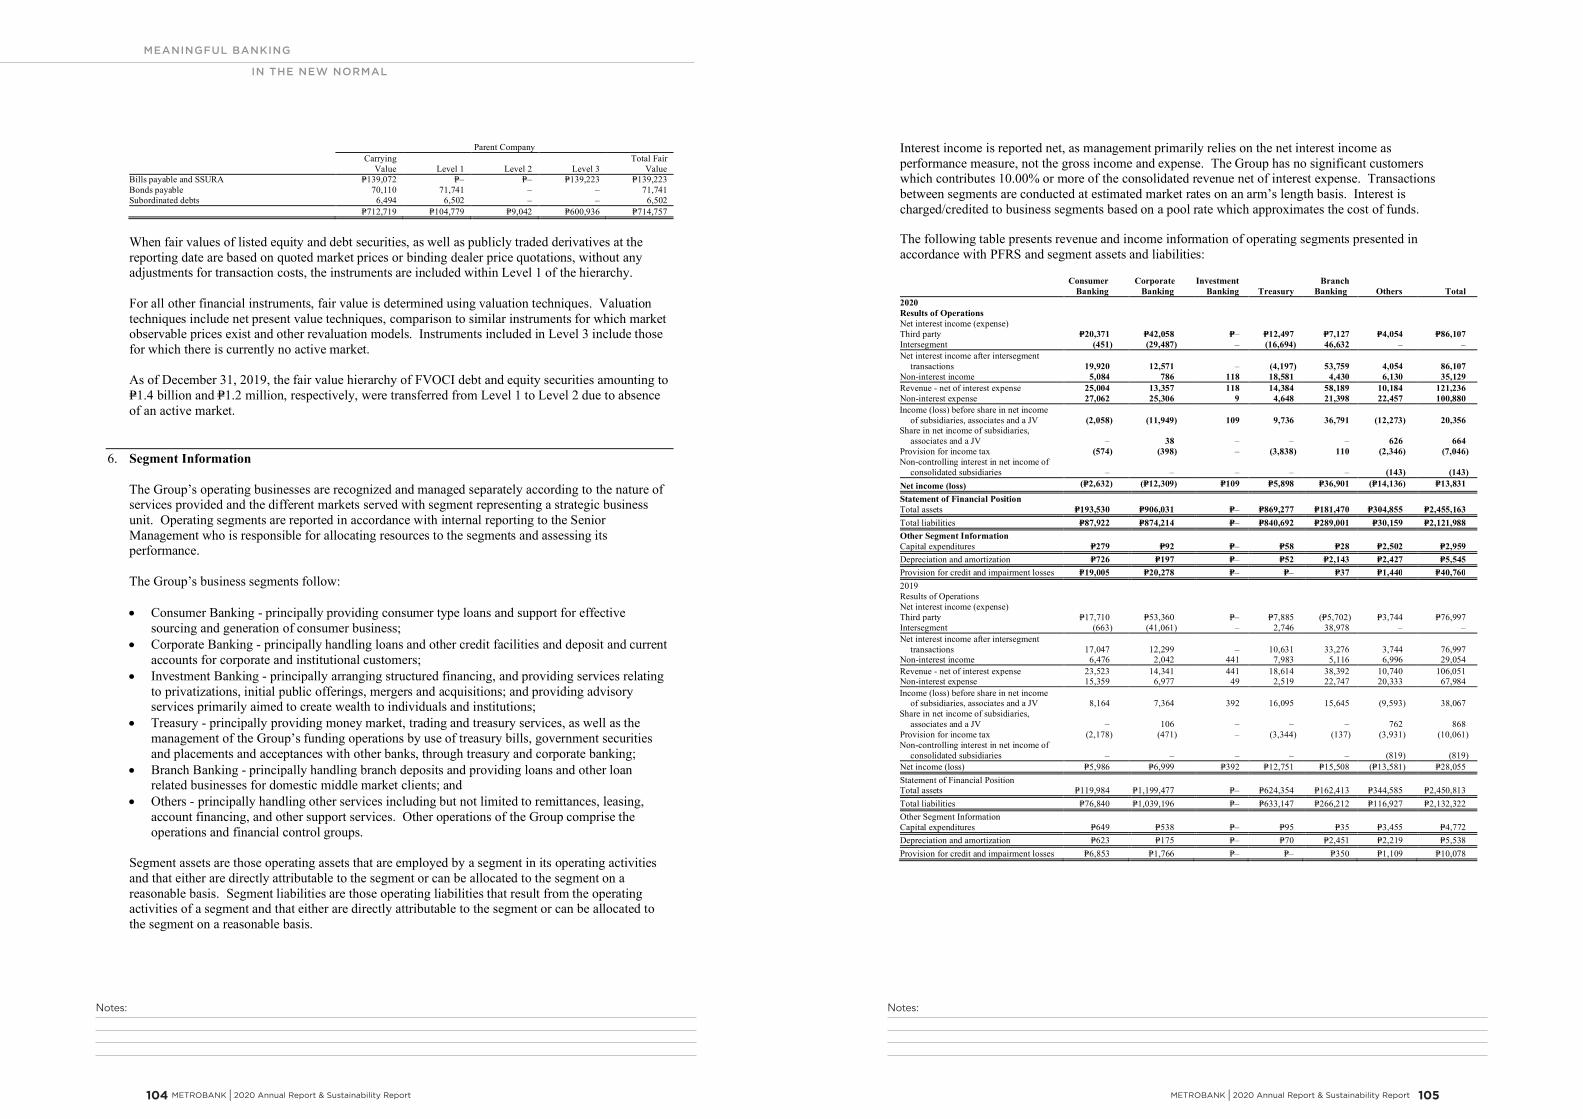
Notes:Notes:
MEANINGFUL BANKING
IN THE NEW NORMAL
METROBANK I 2020 Annual Report & Sustainability Report 105 104 METROBANK I 2020 Annual Report & Sustainability Report
- 73 -
*SGVFSM005911*
Parent CompanyCarrying
Value Level 1 Level 2 Level 3Total Fair
ValueBills payable and SSURA P=139,072 P=– P=– P=139,223 P=139,223Bonds payable 70,110 71,741 – – 71,741Subordinated debts 6,494 6,502 – – 6,502
P=712,719 P=104,779 P=9,042 P=600,936 P=714,757
When fair values of listed equity and debt securities, as well as publicly traded derivatives at thereporting date are based on quoted market prices or binding dealer price quotations, without anyadjustments for transaction costs, the instruments are included within Level 1 of the hierarchy.
For all other financial instruments, fair value is determined using valuation techniques. Valuationtechniques include net present value techniques, comparison to similar instruments for which marketobservable prices exist and other revaluation models. Instruments included in Level 3 include thosefor which there is currently no active market.
As of December 31, 2019, the fair value hierarchy of FVOCI debt and equity securities amounting toP=1.4 billion and P=1.2 million, respectively, were transferred from Level 1 to Level 2 due to absenceof an active market.
6. Segment Information
The Group’s operating businesses are recognized and managed separately according to the nature ofservices provided and the different markets served with segment representing a strategic businessunit. Operating segments are reported in accordance with internal reporting to the SeniorManagement who is responsible for allocating resources to the segments and assessing itsperformance.
The Group’s business segments follow:
Consumer Banking - principally providing consumer type loans and support for effectivesourcing and generation of consumer business;
Corporate Banking - principally handling loans and other credit facilities and deposit and currentaccounts for corporate and institutional customers;
Investment Banking - principally arranging structured financing, and providing services relatingto privatizations, initial public offerings, mergers and acquisitions; and providing advisoryservices primarily aimed to create wealth to individuals and institutions;
Treasury - principally providing money market, trading and treasury services, as well as themanagement of the Group’s funding operations by use of treasury bills, government securitiesand placements and acceptances with other banks, through treasury and corporate banking;
Branch Banking - principally handling branch deposits and providing loans and other loanrelated businesses for domestic middle market clients; and
Others - principally handling other services including but not limited to remittances, leasing,account financing, and other support services. Other operations of the Group comprise theoperations and financial control groups.
Segment assets are those operating assets that are employed by a segment in its operating activitiesand that either are directly attributable to the segment or can be allocated to the segment on areasonable basis. Segment liabilities are those operating liabilities that result from the operatingactivities of a segment and that either are directly attributable to the segment or can be allocated tothe segment on a reasonable basis.
- 74 -
*SGVFSM005911*
Interest income is reported net, as management primarily relies on the net interest income asperformance measure, not the gross income and expense. The Group has no significant customerswhich contributes 10.00% or more of the consolidated revenue net of interest expense. Transactionsbetween segments are conducted at estimated market rates on an arm’s length basis. Interest ischarged/credited to business segments based on a pool rate which approximates the cost of funds.
The following table presents revenue and income information of operating segments presented inaccordance with PFRS and segment assets and liabilities:
ConsumerBanking
CorporateBanking
InvestmentBanking Treasury
BranchBanking Others Total
2020Results of OperationsNet interest income (expense)Third party P=20,371 P=42,058 P=– P=12,497 P=7,127 P=4,054 P=86,107Intersegment (451) (29,487) – (16,694) 46,632 – –Net interest income after intersegment
transactions 19,920 12,571 – (4,197) 53,759 4,054 86,107Non-interest income 5,084 786 118 18,581 4,430 6,130 35,129Revenue - net of interest expense 25,004 13,357 118 14,384 58,189 10,184 121,236Non-interest expense 27,062 25,306 9 4,648 21,398 22,457 100,880Income (loss) before share in net income
of subsidiaries, associates and a JV (2,058) (11,949) 109 9,736 36,791 (12,273) 20,356Share in net income of subsidiaries,
associates and a JV – 38 – – – 626 664Provision for income tax (574) (398) – (3,838) 110 (2,346) (7,046)Non-controlling interest in net income of
consolidated subsidiaries – – – – – (143) (143)Net income (loss) (P=2,632) (P=12,309) P=109 P=5,898 P=36,901 (P=14,136) P=13,831
Statement of Financial PositionTotal assets P=193,530 P=906,031 P=– P=869,277 P=181,470 P=304,855 P=2,455,163Total liabilities P=87,922 P=874,214 P=– P=840,692 P=289,001 P=30,159 P=2,121,988Other Segment InformationCapital expenditures P=279 P=92 P=– P=58 P=28 P=2,502 P=2,959Depreciation and amortization P=726 P=197 P=– P=52 P=2,143 P=2,427 P=5,545Provision for credit and impairment losses P=19,005 P=20,278 P=– P=– P=37 P=1,440 P=40,7602019Results of OperationsNet interest income (expense)Third party P=17,710 P=53,360 P=– P=7,885 (P=5,702) P=3,744 P=76,997Intersegment (663) (41,061) – 2,746 38,978 – –Net interest income after intersegment
transactions 17,047 12,299 – 10,631 33,276 3,744 76,997Non-interest income 6,476 2,042 441 7,983 5,116 6,996 29,054Revenue - net of interest expense 23,523 14,341 441 18,614 38,392 10,740 106,051Non-interest expense 15,359 6,977 49 2,519 22,747 20,333 67,984Income (loss) before share in net income
of subsidiaries, associates and a JV 8,164 7,364 392 16,095 15,645 (9,593) 38,067Share in net income of subsidiaries,
associates and a JV – 106 – – – 762 868Provision for income tax (2,178) (471) – (3,344) (137) (3,931) (10,061)Non-controlling interest in net income of
consolidated subsidiaries – – – – – (819) (819)Net income (loss) P=5,986 P=6,999 P=392 P=12,751 P=15,508 (P=13,581) P=28,055Statement of Financial PositionTotal assets P=119,984 P=1,199,477 P=– P=624,354 P=162,413 P=344,585 P=2,450,813Total liabilities P=76,840 P=1,039,196 P=– P=633,147 P=266,212 P=116,927 P=2,132,322Other Segment InformationCapital expenditures P=649 P=538 P=– P=95 P=35 P=3,455 P=4,772Depreciation and amortization P=623 P=175 P=– P=70 P=2,451 P=2,219 P=5,538Provision for credit and impairment losses P=6,853 P=1,766 P=– P=– P=350 P=1,109 P=10,078
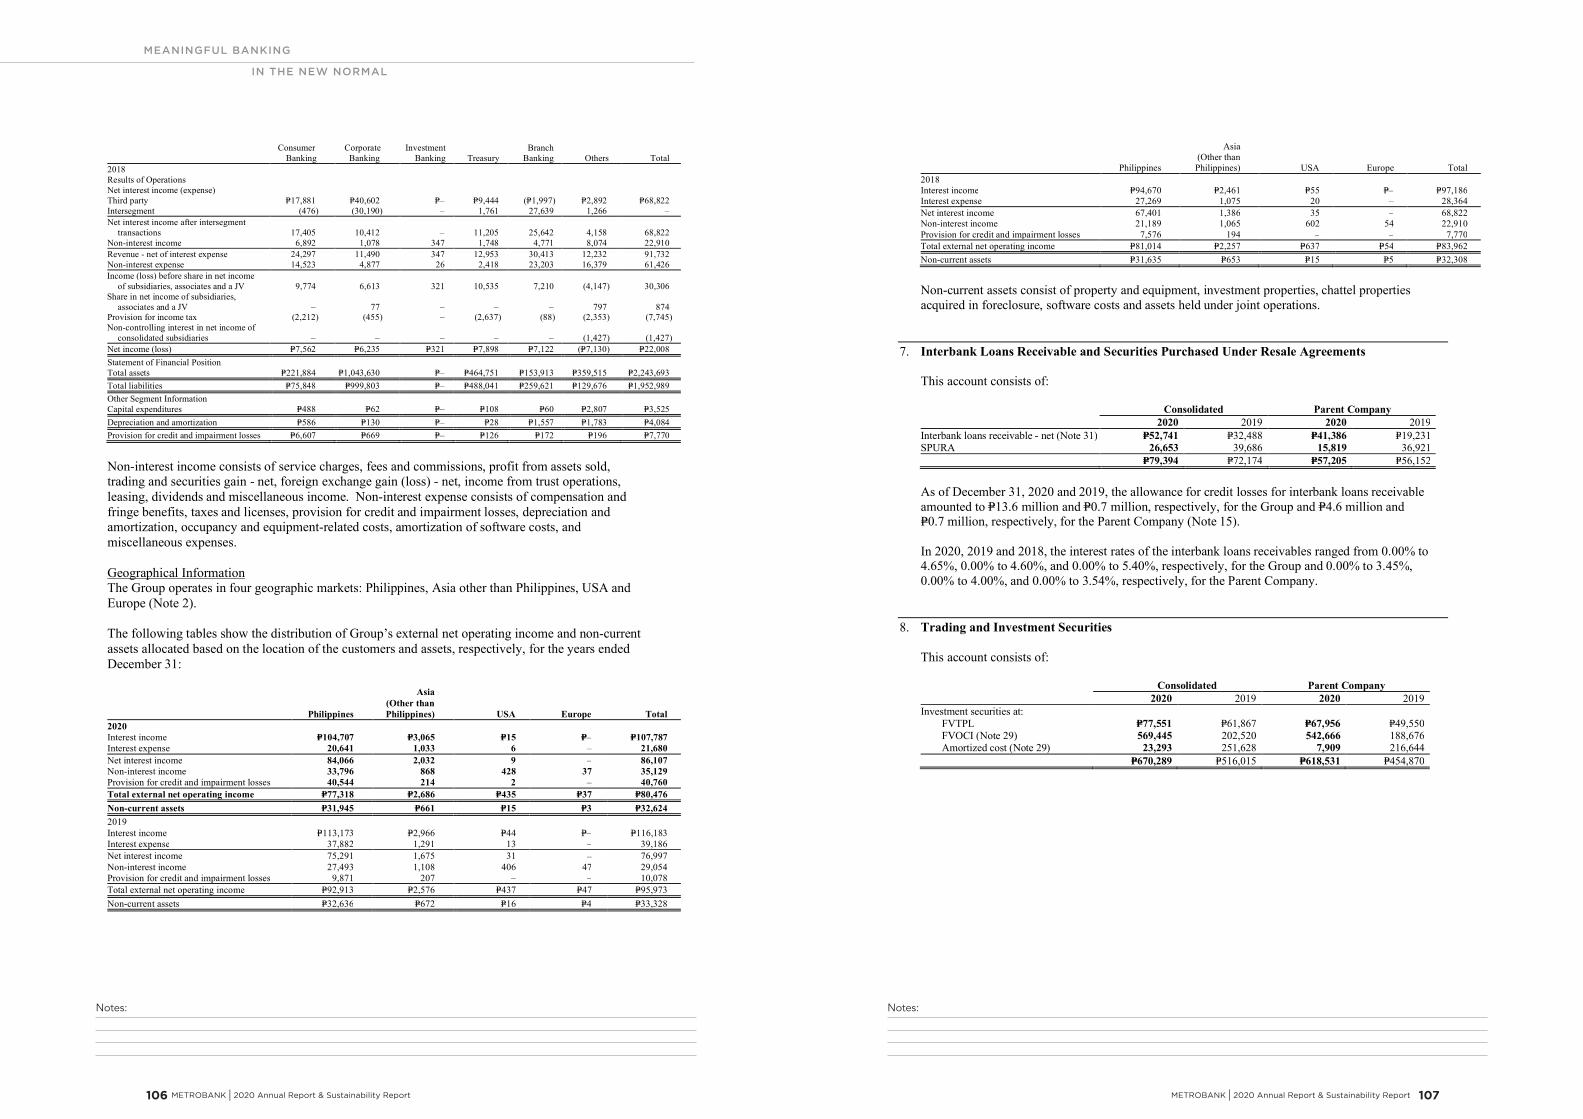
Notes:Notes:
MEANINGFUL BANKING
IN THE NEW NORMAL
METROBANK I 2020 Annual Report & Sustainability Report 107 106 METROBANK I 2020 Annual Report & Sustainability Report
- 75 -
*SGVFSM005911*
ConsumerBanking
CorporateBanking
InvestmentBanking Treasury
BranchBanking Others Total
2018Results of OperationsNet interest income (expense)Third party P=17,881 P=40,602 P=– P=9,444 (P=1,997) P=2,892 P=68,822Intersegment (476) (30,190) – 1,761 27,639 1,266 –Net interest income after intersegment
transactions 17,405 10,412 – 11,205 25,642 4,158 68,822Non-interest income 6,892 1,078 347 1,748 4,771 8,074 22,910Revenue - net of interest expense 24,297 11,490 347 12,953 30,413 12,232 91,732Non-interest expense 14,523 4,877 26 2,418 23,203 16,379 61,426Income (loss) before share in net income
of subsidiaries, associates and a JV 9,774 6,613 321 10,535 7,210 (4,147) 30,306Share in net income of subsidiaries,
associates and a JV – 77 – – – 797 874Provision for income tax (2,212) (455) – (2,637) (88) (2,353) (7,745)Non-controlling interest in net income of
consolidated subsidiaries – – – – – (1,427) (1,427)Net income (loss) P=7,562 P=6,235 P=321 P=7,898 P=7,122 (P=7,130) P=22,008Statement of Financial PositionTotal assets P=221,884 P=1,043,630 P=– P=464,751 P=153,913 P=359,515 P=2,243,693Total liabilities P=75,848 P=999,803 P=– P=488,041 P=259,621 P=129,676 P=1,952,989Other Segment InformationCapital expenditures P=488 P=62 P=– P=108 P=60 P=2,807 P=3,525Depreciation and amortization P=586 P=130 P=– P=28 P=1,557 P=1,783 P=4,084Provision for credit and impairment losses P=6,607 P=669 P=– P=126 P=172 P=196 P=7,770
Non-interest income consists of service charges, fees and commissions, profit from assets sold,trading and securities gain - net, foreign exchange gain (loss) - net, income from trust operations,leasing, dividends and miscellaneous income. Non-interest expense consists of compensation andfringe benefits, taxes and licenses, provision for credit and impairment losses, depreciation andamortization, occupancy and equipment-related costs, amortization of software costs, andmiscellaneous expenses.
Geographical InformationThe Group operates in four geographic markets: Philippines, Asia other than Philippines, USA andEurope (Note 2).
The following tables show the distribution of Group’s external net operating income and non-currentassets allocated based on the location of the customers and assets, respectively, for the years endedDecember 31:
Philippines
Asia(Other thanPhilippines) USA Europe Total
2020Interest income P=104,707 P=3,065 P=15 P=– P=107,787Interest expense 20,641 1,033 6 – 21,680Net interest income 84,066 2,032 9 – 86,107Non-interest income 33,796 868 428 37 35,129Provision for credit and impairment losses 40,544 214 2 – 40,760Total external net operating income P=77,318 P=2,686 P=435 P=37 P=80,476Non-current assets P=31,945 P=661 P=15 P=3 P=32,6242019Interest income P=113,173 P=2,966 P=44 P=– P=116,183Interest expense 37,882 1,291 13 – 39,186Net interest income 75,291 1,675 31 – 76,997Non-interest income 27,493 1,108 406 47 29,054Provision for credit and impairment losses 9,871 207 – – 10,078Total external net operating income P=92,913 P=2,576 P=437 P=47 P=95,973Non-current assets P=32,636 P=672 P=16 P=4 P=33,328
- 76 -
*SGVFSM005911*
Philippines
Asia(Other thanPhilippines) USA Europe Total
2018Interest income P=94,670 P=2,461 P=55 P=– P=97,186Interest expense 27,269 1,075 20 – 28,364Net interest income 67,401 1,386 35 – 68,822Non-interest income 21,189 1,065 602 54 22,910Provision for credit and impairment losses 7,576 194 – – 7,770Total external net operating income P=81,014 P=2,257 P=637 P=54 P=83,962Non-current assets P=31,635 P=653 P=15 P=5 P=32,308
Non-current assets consist of property and equipment, investment properties, chattel propertiesacquired in foreclosure, software costs and assets held under joint operations.
7. Interbank Loans Receivable and Securities Purchased Under Resale Agreements
This account consists of:
Consolidated Parent Company2020 2019 2020 2019
Interbank loans receivable - net (Note 31) P=52,741 P=32,488 P=41,386 P=19,231SPURA 26,653 39,686 15,819 36,921
P=79,394 P=72,174 P=57,205 P=56,152
As of December 31, 2020 and 2019, the allowance for credit losses for interbank loans receivableamounted to P=13.6 million and P=0.7 million, respectively, for the Group and P=4.6 million andP=0.7 million, respectively, for the Parent Company (Note 15).
In 2020, 2019 and 2018, the interest rates of the interbank loans receivables ranged from 0.00% to4.65%, 0.00% to 4.60%, and 0.00% to 5.40%, respectively, for the Group and 0.00% to 3.45%,0.00% to 4.00%, and 0.00% to 3.54%, respectively, for the Parent Company.
8. Trading and Investment Securities
This account consists of:
Consolidated Parent Company2020 2019 2020 2019
Investment securities at:FVTPL P=77,551 P=61,867 P=67,956 P=49,550FVOCI (Note 29) 569,445 202,520 542,666 188,676
Amortized cost (Note 29) 23,293 251,628 7,909 216,644P=670,289 P=516,015 P=618,531 P=454,870
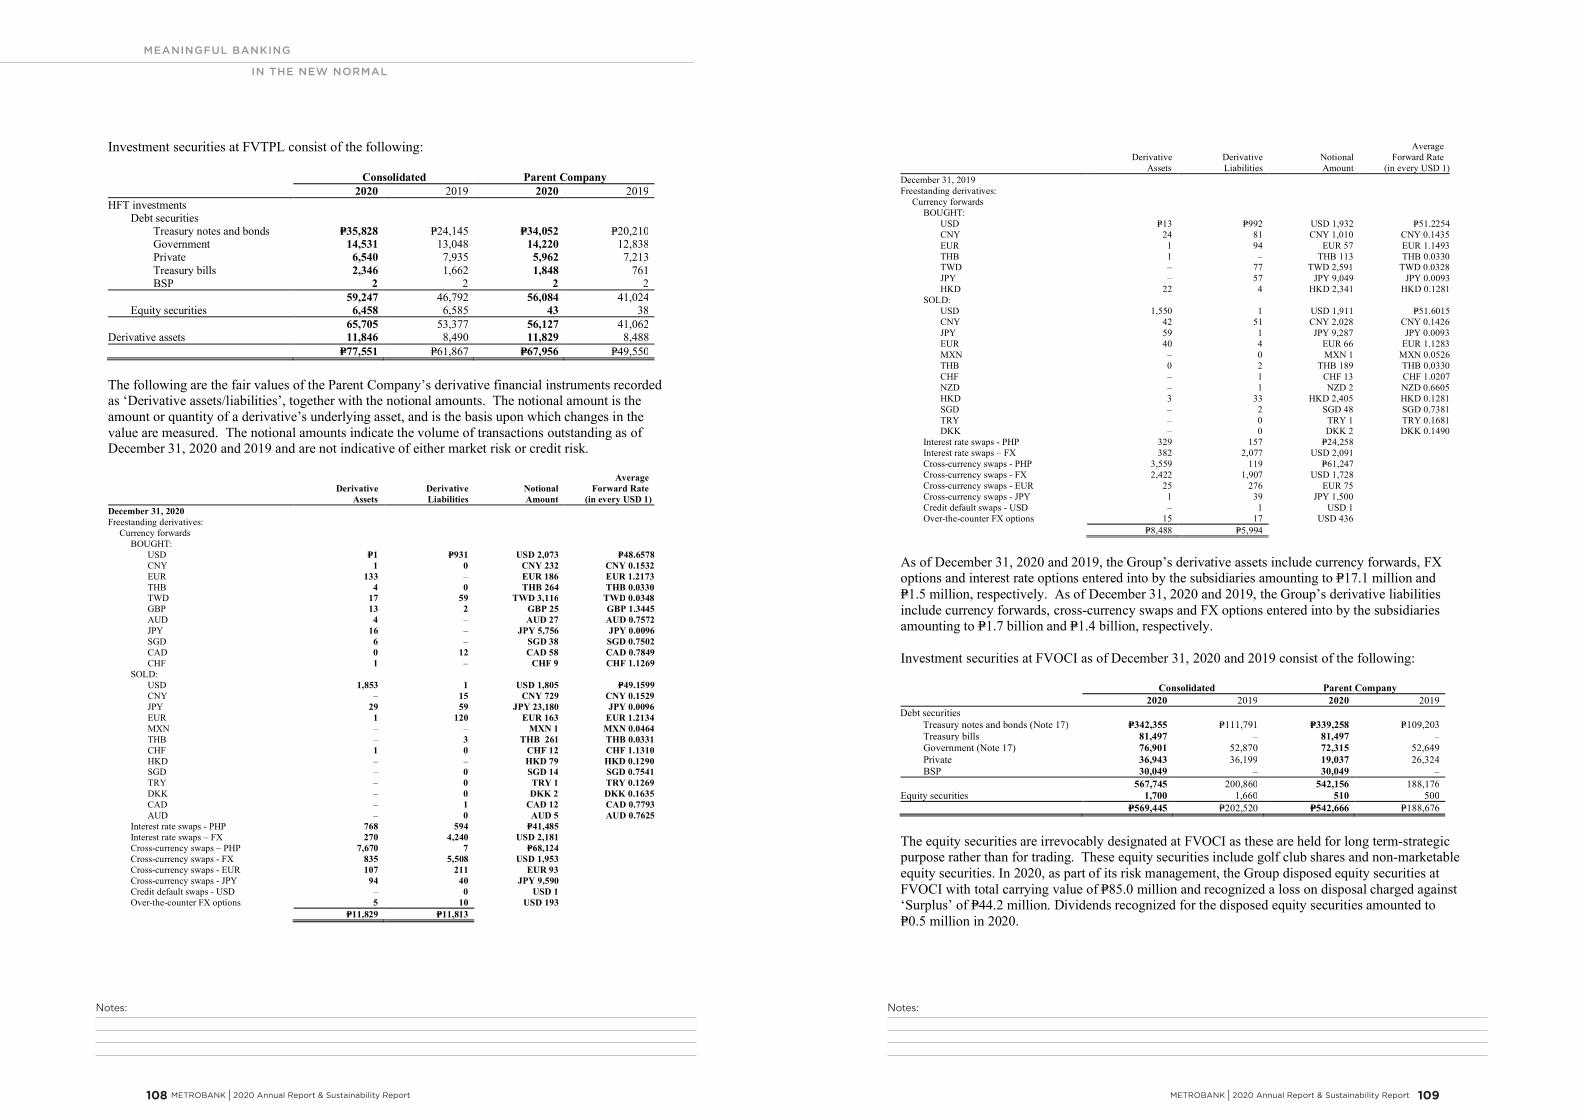
Notes:Notes:
MEANINGFUL BANKING
IN THE NEW NORMAL
METROBANK I 2020 Annual Report & Sustainability Report 109 108 METROBANK I 2020 Annual Report & Sustainability Report
- 77 -
*SGVFSM005911*
Investment securities at FVTPL consist of the following:
Consolidated Parent Company2020 2019 2020 2019
HFT investmentsDebt securities
Treasury notes and bonds P=35,828 P=24,145 P=34,052 P=20,210Government 14,531 13,048 14,220 12,838
Private 6,540 7,935 5,962 7,213Treasury bills 2,346 1,662 1,848 761BSP 2 2 2 2
59,247 46,792 56,084 41,024Equity securities 6,458 6,585 43 38
65,705 53,377 56,127 41,062Derivative assets 11,846 8,490 11,829 8,488
P=77,551 P=61,867 P=67,956 P=49,550
The following are the fair values of the Parent Company’s derivative financial instruments recordedas ‘Derivative assets/liabilities’, together with the notional amounts. The notional amount is theamount or quantity of a derivative’s underlying asset, and is the basis upon which changes in thevalue are measured. The notional amounts indicate the volume of transactions outstanding as ofDecember 31, 2020 and 2019 and are not indicative of either market risk or credit risk.
DerivativeAssets
DerivativeLiabilities
NotionalAmount
AverageForward Rate
(in every USD 1)December 31, 2020Freestanding derivatives:
Currency forwardsBOUGHT:
USD P=1 P=931 USD 2,073 P=48.6578CNY 1 0 CNY 232 CNY 0.1532EUR 133 – EUR 186 EUR 1.2173THB 4 0 THB 264 THB 0.0330TWD 17 59 TWD 3,116 TWD 0.0348GBP 13 2 GBP 25 GBP 1.3445AUD 4 – AUD 27 AUD 0.7572JPY 16 – JPY 5,756 JPY 0.0096SGD 6 – SGD 38 SGD 0.7502CAD 0 12 CAD 58 CAD 0.7849CHF 1 – CHF 9 CHF 1.1269
SOLD:USD 1,853 1 USD 1,805 P=49.1599CNY – 15 CNY 729 CNY 0.1529JPY 29 59 JPY 23,180 JPY 0.0096EUR 1 120 EUR 163 EUR 1.2134MXN – – MXN 1 MXN 0.0464THB – 3 THB 261 THB 0.0331CHF 1 0 CHF 12 CHF 1.1310HKD – – HKD 79 HKD 0.1290SGD – 0 SGD 14 SGD 0.7541TRY – 0 TRY 1 TRY 0.1269DKK – 0 DKK 2 DKK 0.1635CAD – 1 CAD 12 CAD 0.7793AUD – 0 AUD 5 AUD 0.7625
Interest rate swaps - PHP 768 594 P=41,485Interest rate swaps – FX 270 4,240 USD 2,181Cross-currency swaps – PHP 7,670 7 P=68,124Cross-currency swaps - FX 835 5,508 USD 1,953Cross-currency swaps - EUR 107 211 EUR 93Cross-currency swaps - JPY 94 40 JPY 9,590Credit default swaps - USD – 0 USD 1Over-the-counter FX options 5 10 USD 193
P=11,829 P=11,813
- 78 -
*SGVFSM005911*
DerivativeAssets
DerivativeLiabilities
NotionalAmount
AverageForward Rate
(in every USD 1)December 31, 2019Freestanding derivatives:
Currency forwardsBOUGHT:
USD P=13 P=992 USD 1,932 P=51.2254CNY 24 81 CNY 1,010 CNY 0.1435EUR 1 94 EUR 57 EUR 1.1493THB 1 – THB 113 THB 0.0330TWD – 77 TWD 2,591 TWD 0.0328JPY – 57 JPY 9,049 JPY 0.0093HKD 22 4 HKD 2,341 HKD 0.1281
SOLD:USD 1,550 1 USD 1,911 P=51.6015CNY 42 51 CNY 2,028 CNY 0.1426JPY 59 1 JPY 9,287 JPY 0.0093EUR 40 4 EUR 66 EUR 1.1283MXN – 0 MXN 1 MXN 0.0526THB 0 2 THB 189 THB 0.0330CHF – 1 CHF 13 CHF 1.0207NZD – 1 NZD 2 NZD 0.6605HKD 3 33 HKD 2,405 HKD 0.1281SGD – 2 SGD 48 SGD 0.7381TRY – 0 TRY 1 TRY 0.1681DKK – 0 DKK 2 DKK 0.1490
Interest rate swaps - PHP 329 157 P=24,258Interest rate swaps – FX 382 2,077 USD 2,091Cross-currency swaps - PHP 3,559 119 P=61,247Cross-currency swaps - FX 2,422 1,907 USD 1,728Cross-currency swaps - EUR 25 276 EUR 75Cross-currency swaps - JPY 1 39 JPY 1,500Credit default swaps - USD – 1 USD 1Over-the-counter FX options 15 17 USD 436
P=8,488 P=5,994
As of December 31, 2020 and 2019, the Group’s derivative assets include currency forwards, FXoptions and interest rate options entered into by the subsidiaries amounting to P=17.1 million andP=1.5 million, respectively. As of December 31, 2020 and 2019, the Group’s derivative liabilitiesinclude currency forwards, cross-currency swaps and FX options entered into by the subsidiariesamounting to P=1.7 billion and P=1.4 billion, respectively.
Investment securities at FVOCI as of December 31, 2020 and 2019 consist of the following:
Consolidated Parent Company2020 2019 2020 2019
Debt securitiesTreasury notes and bonds (Note 17) P=342,355 P=111,791 P=339,258 P=109,203Treasury bills 81,497 – 81,497 –Government (Note 17) 76,901 52,870 72,315 52,649Private 36,943 36,199 19,037 26,324BSP 30,049 – 30,049 –
567,745 200,860 542,156 188,176Equity securities 1,700 1,660 510 500
P=569,445 P=202,520 P=542,666 P=188,676
The equity securities are irrevocably designated at FVOCI as these are held for long term-strategicpurpose rather than for trading. These equity securities include golf club shares and non-marketableequity securities. In 2020, as part of its risk management, the Group disposed equity securities atFVOCI with total carrying value of P=85.0 million and recognized a loss on disposal charged against‘Surplus’ of P=44.2 million. Dividends recognized for the disposed equity securities amounted toP=0.5 million in 2020.
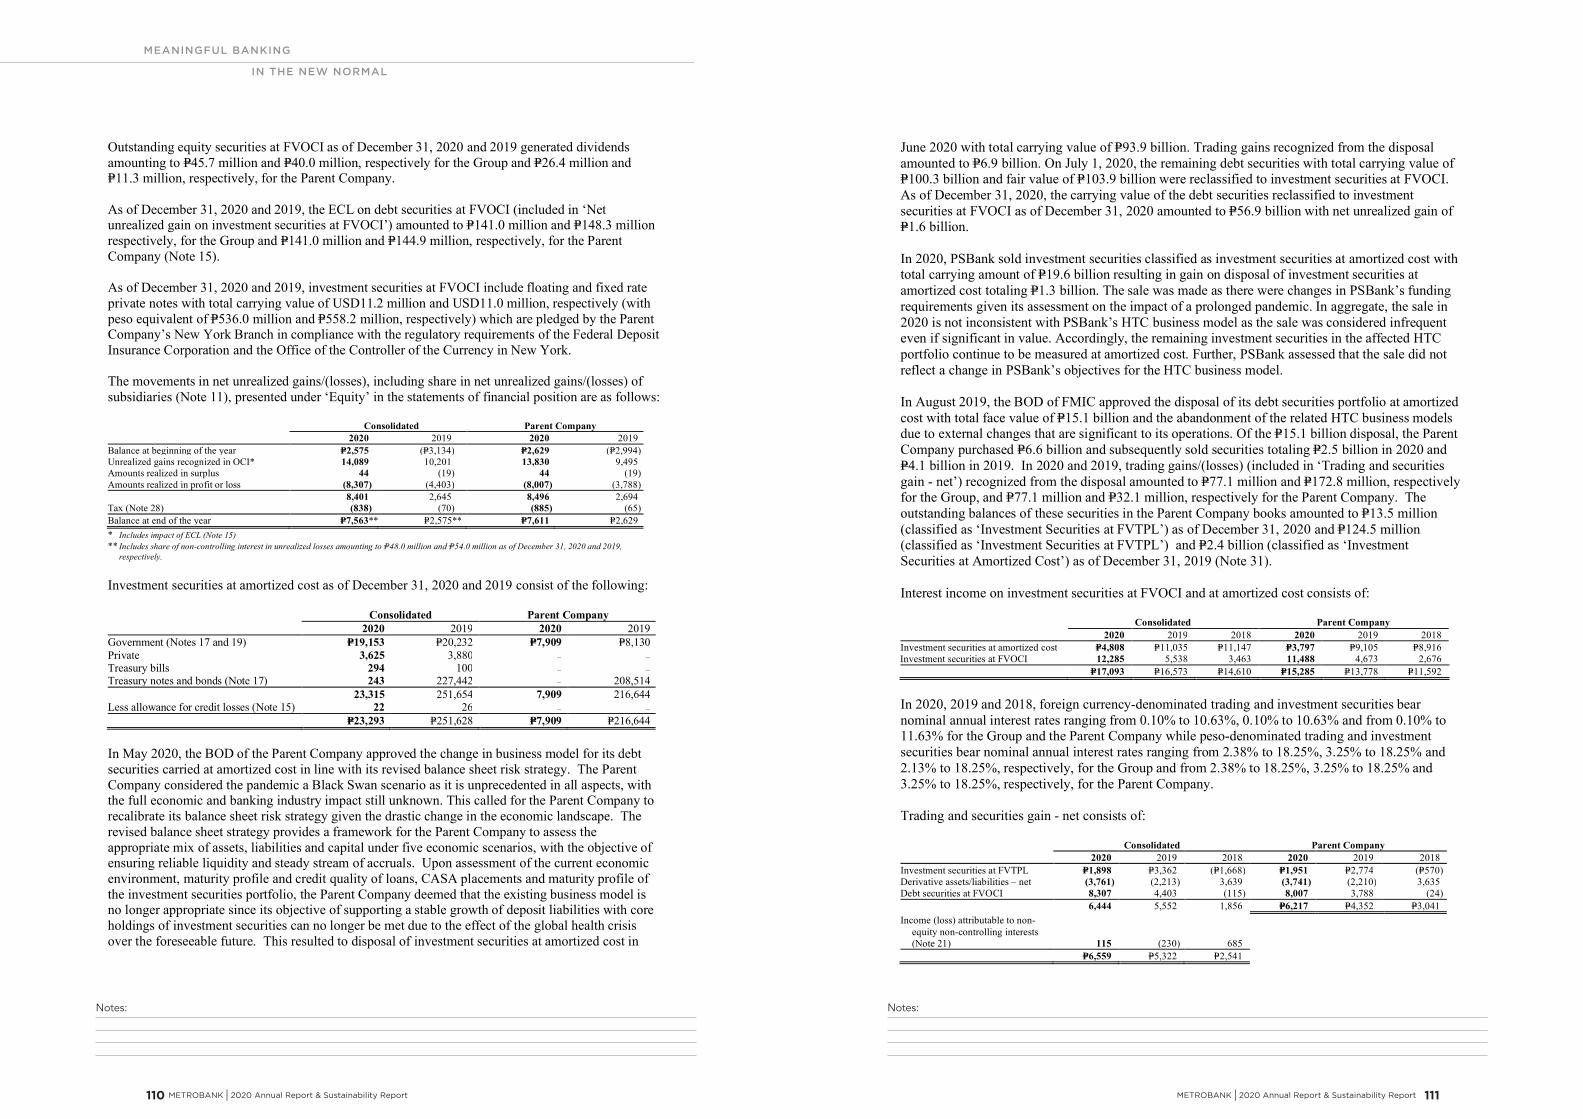
Notes:Notes:
MEANINGFUL BANKING
IN THE NEW NORMAL
METROBANK I 2020 Annual Report & Sustainability Report 111 110 METROBANK I 2020 Annual Report & Sustainability Report
- 79 -
*SGVFSM005911*
Outstanding equity securities at FVOCI as of December 31, 2020 and 2019 generated dividendsamounting to P=45.7 million and P=40.0 million, respectively for the Group and P=26.4 million andP=11.3 million, respectively, for the Parent Company.
As of December 31, 2020 and 2019, the ECL on debt securities at FVOCI (included in ‘Netunrealized gain on investment securities at FVOCI’) amounted to P=141.0 million and P=148.3 millionrespectively, for the Group and P=141.0 million and P=144.9 million, respectively, for the ParentCompany (Note 15).
As of December 31, 2020 and 2019, investment securities at FVOCI include floating and fixed rateprivate notes with total carrying value of USD11.2 million and USD11.0 million, respectively (withpeso equivalent of P=536.0 million and P=558.2 million, respectively) which are pledged by the ParentCompany’s New York Branch in compliance with the regulatory requirements of the Federal DepositInsurance Corporation and the Office of the Controller of the Currency in New York.
The movements in net unrealized gains/(losses), including share in net unrealized gains/(losses) ofsubsidiaries (Note 11), presented under ‘Equity’ in the statements of financial position are as follows:
Consolidated Parent Company2020 2019 2020 2019
Balance at beginning of the year P=2,575 (P=3,134) P=2,629 (P=2,994)Unrealized gains recognized in OCI* 14,089 10,201 13,830 9,495Amounts realized in surplus 44 (19) 44 (19)Amounts realized in profit or loss (8,307) (4,403) (8,007) (3,788)
8,401 2,645 8,496 2,694Tax (Note 28) (838) (70) (885) (65)Balance at end of the year P=7,563** P=2,575** P=7,611 P=2,629* Includes impact of ECL (Note 15)
** Includes share of non-controlling interest in unrealized losses amounting to P=48.0 million and P=54.0 million as of December 31, 2020 and 2019,respectively.
Investment securities at amortized cost as of December 31, 2020 and 2019 consist of the following:
Consolidated Parent Company2020 2019 2020 2019
Government (Notes 17 and 19) P=19,153 P=20,232 P=7,909 P=8,130Private 3,625 3,880 – –Treasury bills 294 100 – –Treasury notes and bonds (Note 17) 243 227,442 – 208,514
23,315 251,654 7,909 216,644Less allowance for credit losses (Note 15) 22 26 – –
P=23,293 P=251,628 P=7,909 P=216,644
In May 2020, the BOD of the Parent Company approved the change in business model for its debtsecurities carried at amortized cost in line with its revised balance sheet risk strategy. The ParentCompany considered the pandemic a Black Swan scenario as it is unprecedented in all aspects, withthe full economic and banking industry impact still unknown. This called for the Parent Company torecalibrate its balance sheet risk strategy given the drastic change in the economic landscape. Therevised balance sheet strategy provides a framework for the Parent Company to assess theappropriate mix of assets, liabilities and capital under five economic scenarios, with the objective ofensuring reliable liquidity and steady stream of accruals. Upon assessment of the current economicenvironment, maturity profile and credit quality of loans, CASA placements and maturity profile ofthe investment securities portfolio, the Parent Company deemed that the existing business model isno longer appropriate since its objective of supporting a stable growth of deposit liabilities with coreholdings of investment securities can no longer be met due to the effect of the global health crisisover the foreseeable future. This resulted to disposal of investment securities at amortized cost in
- 80 -
*SGVFSM005911*
June 2020 with total carrying value of P=93.9 billion. Trading gains recognized from the disposalamounted to P=6.9 billion. On July 1, 2020, the remaining debt securities with total carrying value ofP=100.3 billion and fair value of P=103.9 billion were reclassified to investment securities at FVOCI.As of December 31, 2020, the carrying value of the debt securities reclassified to investmentsecurities at FVOCI as of December 31, 2020 amounted to P=56.9 billion with net unrealized gain ofP=1.6 billion.
In 2020, PSBank sold investment securities classified as investment securities at amortized cost withtotal carrying amount of P=19.6 billion resulting in gain on disposal of investment securities atamortized cost totaling P=1.3 billion. The sale was made as there were changes in PSBank’s fundingrequirements given its assessment on the impact of a prolonged pandemic. In aggregate, the sale in2020 is not inconsistent with PSBank’s HTC business model as the sale was considered infrequenteven if significant in value. Accordingly, the remaining investment securities in the affected HTCportfolio continue to be measured at amortized cost. Further, PSBank assessed that the sale did notreflect a change in PSBank’s objectives for the HTC business model.
In August 2019, the BOD of FMIC approved the disposal of its debt securities portfolio at amortizedcost with total face value of P=15.1 billion and the abandonment of the related HTC business modelsdue to external changes that are significant to its operations. Of the P=15.1 billion disposal, the ParentCompany purchased P=6.6 billion and subsequently sold securities totaling P=2.5 billion in 2020 andP=4.1 billion in 2019. In 2020 and 2019, trading gains/(losses) (included in ‘Trading and securitiesgain - net’) recognized from the disposal amounted to P=77.1 million and P=172.8 million, respectivelyfor the Group, and P=77.1 million and P=32.1 million, respectively for the Parent Company. Theoutstanding balances of these securities in the Parent Company books amounted to P=13.5 million(classified as ‘Investment Securities at FVTPL’) as of December 31, 2020 and P=124.5 million(classified as ‘Investment Securities at FVTPL’) and P=2.4 billion (classified as ‘InvestmentSecurities at Amortized Cost’) as of December 31, 2019 (Note 31).
Interest income on investment securities at FVOCI and at amortized cost consists of:
Consolidated Parent Company2020 2019 2018 2020 2019 2018
Investment securities at amortized cost P=4,808 P=11,035 P=11,147 P=3,797 P=9,105 P=8,916Investment securities at FVOCI 12,285 5,538 3,463 11,488 4,673 2,676
P=17,093 P=16,573 P=14,610 P=15,285 P=13,778 P=11,592
In 2020, 2019 and 2018, foreign currency-denominated trading and investment securities bearnominal annual interest rates ranging from 0.10% to 10.63%, 0.10% to 10.63% and from 0.10% to11.63% for the Group and the Parent Company while peso-denominated trading and investmentsecurities bear nominal annual interest rates ranging from 2.38% to 18.25%, 3.25% to 18.25% and2.13% to 18.25%, respectively, for the Group and from 2.38% to 18.25%, 3.25% to 18.25% and3.25% to 18.25%, respectively, for the Parent Company.
Trading and securities gain - net consists of:
Consolidated Parent Company2020 2019 2018 2020 2019 2018
Investment securities at FVTPL P=1,898 P=3,362 (P=1,668) P=1,951 P=2,774 (P=570)Derivative assets/liabilities – net (3,761) (2,213) 3,639 (3,741) (2,210) 3,635Debt securities at FVOCI 8,307 4,403 (115) 8,007 3,788 (24)
6,444 5,552 1,856 P=6,217 P=4,352 P=3,041Income (loss) attributable to non-
equity non-controlling interests(Note 21) 115 (230) 685
P=6,559 P=5,322 P=2,541
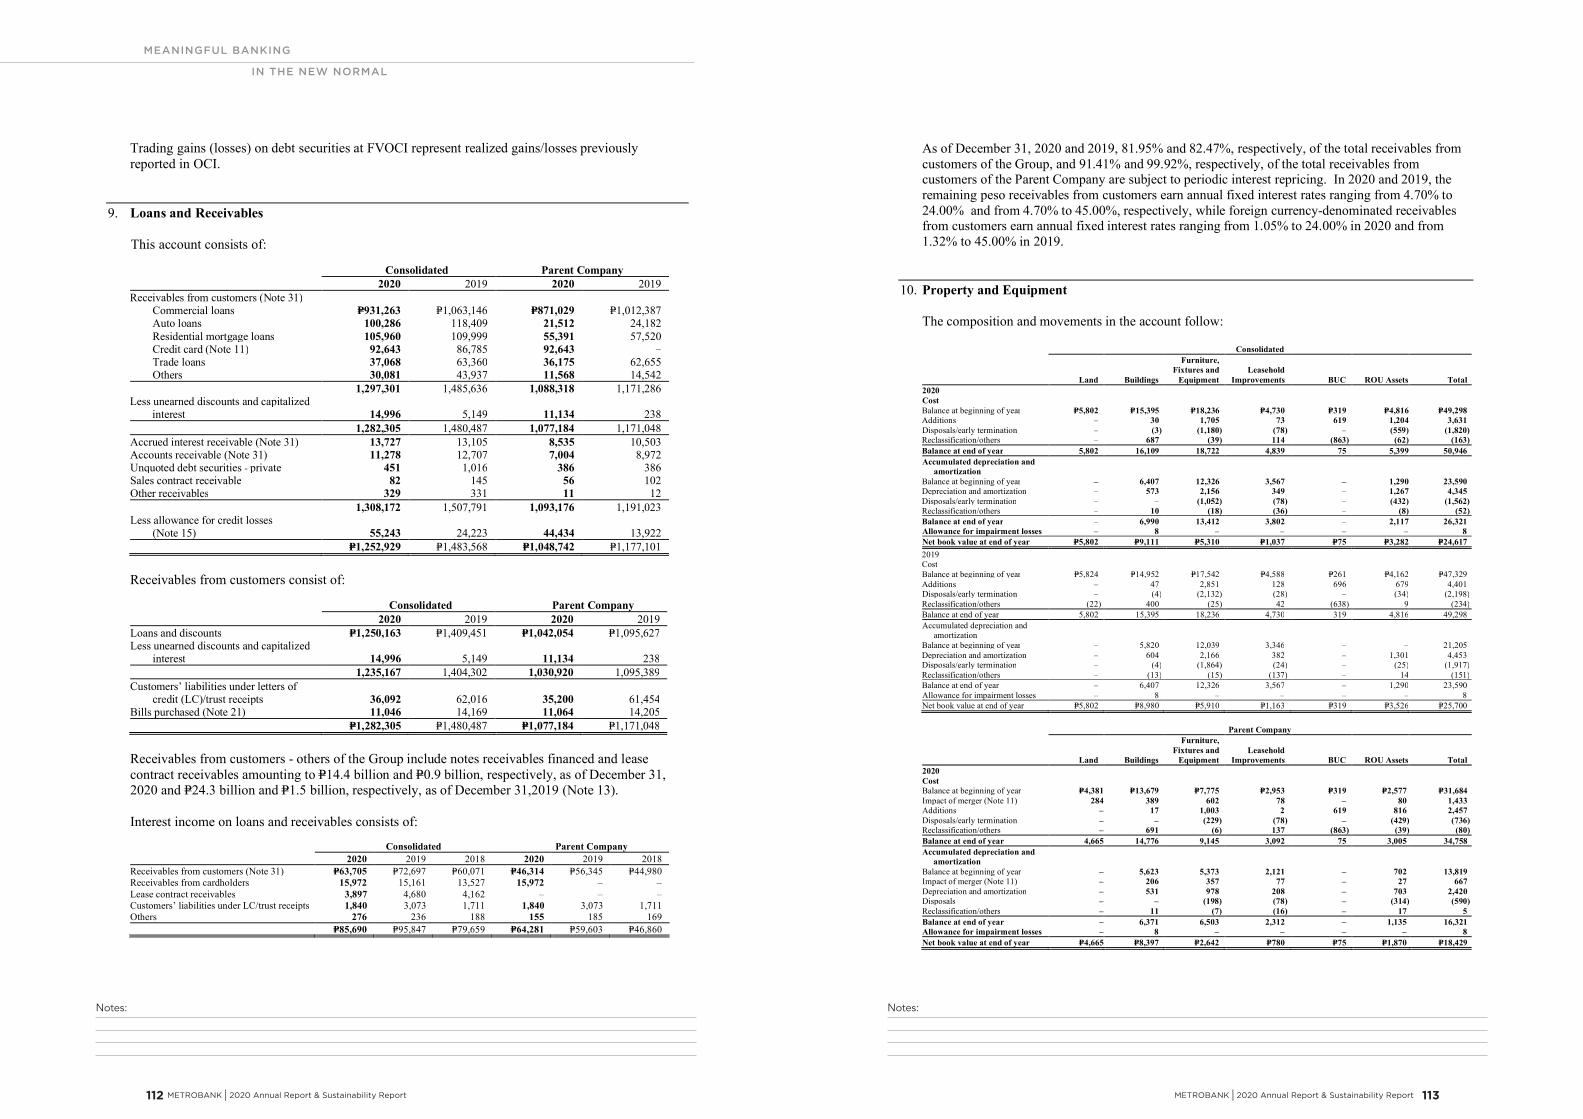
Notes:Notes:
MEANINGFUL BANKING
IN THE NEW NORMAL
METROBANK I 2020 Annual Report & Sustainability Report 113 112 METROBANK I 2020 Annual Report & Sustainability Report
- 81 -
*SGVFSM005911*
Trading gains (losses) on debt securities at FVOCI represent realized gains/losses previouslyreported in OCI.
9. Loans and Receivables
This account consists of:
Consolidated Parent Company2020 2019 2020 2019
Receivables from customers (Note 31)Commercial loans P=931,263 P=1,063,146 P=871,029 P=1,012,387
Auto loans 100,286 118,409 21,512 24,182Residential mortgage loans 105,960 109,999 55,391 57,520Credit card (Note 11) 92,643 86,785 92,643 –Trade loans 37,068 63,360 36,175 62,655Others 30,081 43,937 11,568 14,542
1,297,301 1,485,636 1,088,318 1,171,286Less unearned discounts and capitalized
interest 14,996 5,149 11,134 2381,282,305 1,480,487 1,077,184 1,171,048
Accrued interest receivable (Note 31) 13,727 13,105 8,535 10,503Accounts receivable (Note 31) 11,278 12,707 7,004 8,972Unquoted debt securities - private 451 1,016 386 386Sales contract receivable 82 145 56 102Other receivables 329 331 11 12
1,308,172 1,507,791 1,093,176 1,191,023Less allowance for credit losses
(Note 15) 55,243 24,223 44,434 13,922P=1,252,929 P=1,483,568 P=1,048,742 P=1,177,101
Receivables from customers consist of:
Consolidated Parent Company2020 2019 2020 2019
Loans and discounts P=1,250,163 P=1,409,451 P=1,042,054 P=1,095,627Less unearned discounts and capitalized
interest 14,996 5,149 11,134 2381,235,167 1,404,302 1,030,920 1,095,389
Customers’ liabilities under letters ofcredit (LC)/trust receipts 36,092 62,016 35,200 61,454
Bills purchased (Note 21) 11,046 14,169 11,064 14,205P=1,282,305 P=1,480,487 P=1,077,184 P=1,171,048
Receivables from customers - others of the Group include notes receivables financed and leasecontract receivables amounting to P=14.4 billion and P=0.9 billion, respectively, as of December 31,2020 and P=24.3 billion and P=1.5 billion, respectively, as of December 31,2019 (Note 13).
Interest income on loans and receivables consists of:
Consolidated Parent Company2020 2019 2018 2020 2019 2018
Receivables from customers (Note 31) P=63,705 P=72,697 P=60,071 P=46,314 P=56,345 P=44,980Receivables from cardholders 15,972 15,161 13,527 15,972 – –Lease contract receivables 3,897 4,680 4,162 – – –Customers’ liabilities under LC/trust receipts 1,840 3,073 1,711 1,840 3,073 1,711Others 276 236 188 155 185 169
P=85,690 P=95,847 P=79,659 P=64,281 P=59,603 P=46,860
- 82 -
*SGVFSM005911*
As of December 31, 2020 and 2019, 81.95% and 82.47%, respectively, of the total receivables fromcustomers of the Group, and 91.41% and 99.92%, respectively, of the total receivables fromcustomers of the Parent Company are subject to periodic interest repricing. In 2020 and 2019, theremaining peso receivables from customers earn annual fixed interest rates ranging from 4.70% to24.00% and from 4.70% to 45.00%, respectively, while foreign currency-denominated receivablesfrom customers earn annual fixed interest rates ranging from 1.05% to 24.00% in 2020 and from1.32% to 45.00% in 2019.
10. Property and Equipment
The composition and movements in the account follow:
Consolidated
Land Buildings
Furniture,Fixtures and
EquipmentLeasehold
Improvements BUC ROU Assets Total2020CostBalance at beginning of year P=5,802 P=15,395 P=18,236 P=4,730 P=319 P=4,816 P=49,298Additions – 30 1,705 73 619 1,204 3,631Disposals/early termination – (3) (1,180) (78) – (559) (1,820)Reclassification/others – 687 (39) 114 (863) (62) (163)Balance at end of year 5,802 16,109 18,722 4,839 75 5,399 50,946Accumulated depreciation and
amortizationBalance at beginning of year – 6,407 12,326 3,567 – 1,290 23,590Depreciation and amortization – 573 2,156 349 – 1,267 4,345Disposals/early termination – – (1,052) (78) – (432) (1,562)Reclassification/others – 10 (18) (36) – (8) (52)Balance at end of year – 6,990 13,412 3,802 – 2,117 26,321Allowance for impairment losses – 8 – – – – 8Net book value at end of year P=5,802 P=9,111 P=5,310 P=1,037 P=75 P=3,282 P=24,6172019CostBalance at beginning of year P=5,824 P=14,952 P=17,542 P=4,588 P=261 P=4,162 P=47,329Additions – 47 2,851 128 696 679 4,401Disposals/early termination – (4) (2,132) (28) – (34) (2,198)Reclassification/others (22) 400 (25) 42 (638) 9 (234)Balance at end of year 5,802 15,395 18,236 4,730 319 4,816 49,298Accumulated depreciation and
amortizationBalance at beginning of year – 5,820 12,039 3,346 – – 21,205Depreciation and amortization – 604 2,166 382 – 1,301 4,453Disposals/early termination – (4) (1,864) (24) – (25) (1,917)Reclassification/others – (13) (15) (137) – 14 (151)Balance at end of year – 6,407 12,326 3,567 – 1,290 23,590Allowance for impairment losses – 8 – – – – 8Net book value at end of year P=5,802 P=8,980 P=5,910 P=1,163 P=319 P=3,526 P=25,700
Parent Company
Land Buildings
Furniture,Fixtures and
EquipmentLeasehold
Improvements BUC ROU Assets Total2020CostBalance at beginning of year P=4,381 P=13,679 P=7,775 P=2,953 P=319 P=2,577 P=31,684Impact of merger (Note 11) 284 389 602 78 – 80 1,433Additions – 17 1,003 2 619 816 2,457Disposals/early termination – – (229) (78) – (429) (736)Reclassification/others – 691 (6) 137 (863) (39) (80)Balance at end of year 4,665 14,776 9,145 3,092 75 3,005 34,758Accumulated depreciation and
amortizationBalance at beginning of year – 5,623 5,373 2,121 – 702 13,819Impact of merger (Note 11) – 206 357 77 – 27 667Depreciation and amortization – 531 978 208 – 703 2,420Disposals – – (198) (78) – (314) (590)Reclassification/others – 11 (7) (16) – 17 5Balance at end of year – 6,371 6,503 2,312 – 1,135 16,321Allowance for impairment losses – 8 – – – – 8Net book value at end of year P=4,665 P=8,397 P=2,642 P=780 P=75 P=1,870 P=18,429
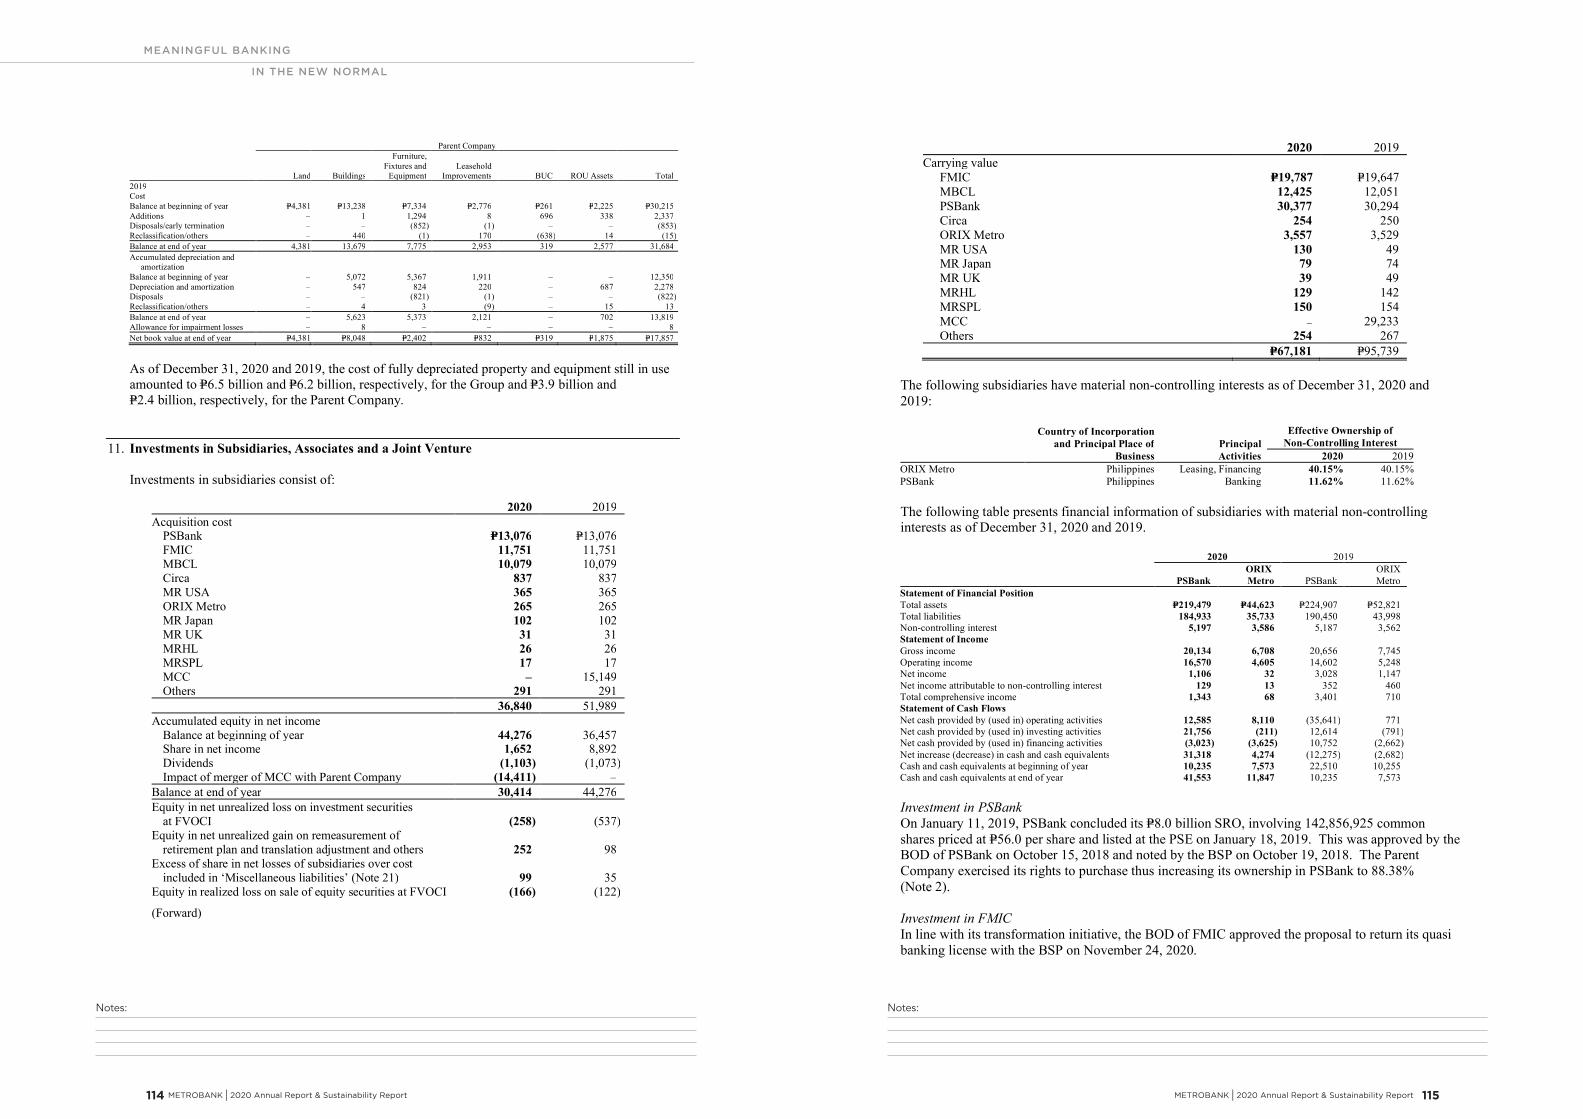
Notes:Notes:
MEANINGFUL BANKING
IN THE NEW NORMAL
METROBANK I 2020 Annual Report & Sustainability Report 115 114 METROBANK I 2020 Annual Report & Sustainability Report
- 83 -
*SGVFSM005911*
Parent Company
Land Buildings
Furniture,Fixtures and
EquipmentLeasehold
Improvements BUC ROU Assets Total2019CostBalance at beginning of year P=4,381 P=13,238 P=7,334 P=2,776 P=261 P=2,225 P=30,215Additions – 1 1,294 8 696 338 2,337Disposals/early termination – – (852) (1) – – (853)Reclassification/others – 440 (1) 170 (638) 14 (15)Balance at end of year 4,381 13,679 7,775 2,953 319 2,577 31,684Accumulated depreciation and
amortizationBalance at beginning of year – 5,072 5,367 1,911 – – 12,350Depreciation and amortization – 547 824 220 – 687 2,278Disposals – – (821) (1) – – (822)Reclassification/others – 4 3 (9) – 15 13Balance at end of year – 5,623 5,373 2,121 – 702 13,819Allowance for impairment losses – 8 – – – – 8Net book value at end of year P=4,381 P=8,048 P=2,402 P=832 P=319 P=1,875 P=17,857
As of December 31, 2020 and 2019, the cost of fully depreciated property and equipment still in useamounted to P=6.5 billion and P=6.2 billion, respectively, for the Group and P=3.9 billion andP=2.4 billion, respectively, for the Parent Company.
11. Investments in Subsidiaries, Associates and a Joint Venture
Investments in subsidiaries consist of:
2020 2019Acquisition cost
PSBank P=13,076 P=13,076FMIC 11,751 11,751MBCL 10,079 10,079Circa 837 837MR USA 365 365ORIX Metro 265 265MR Japan 102 102MR UK 31 31MRHL 26 26MRSPL 17 17MCC – 15,149Others 291 291
36,840 51,989Accumulated equity in net income
Balance at beginning of year 44,276 36,457Share in net income 1,652 8,892Dividends (1,103) (1,073)Impact of merger of MCC with Parent Company (14,411) –
Balance at end of year 30,414 44,276Equity in net unrealized loss on investment securities
at FVOCI (258) (537)Equity in net unrealized gain on remeasurement of
retirement plan and translation adjustment and others 252 98Excess of share in net losses of subsidiaries over cost
included in ‘Miscellaneous liabilities’ (Note 21) 99 35Equity in realized loss on sale of equity securities at FVOCI (166) (122)
(Forward)
- 84 -
*SGVFSM005911*
2020 2019Carrying value
FMIC P=19,787 P=19,647MBCL 12,425 12,051PSBank 30,377 30,294Circa 254 250ORIX Metro 3,557 3,529MR USA 130 49MR Japan 79 74MR UK 39 49MRHL 129 142MRSPL 150 154MCC – 29,233Others 254 267
P=67,181 P=95,739
The following subsidiaries have material non-controlling interests as of December 31, 2020 and2019:
Country of Incorporationand Principal Place of
BusinessPrincipalActivities
Effective Ownership ofNon-Controlling Interest
2020 2019ORIX Metro Philippines Leasing, Financing 40.15% 40.15%PSBank Philippines Banking 11.62% 11.62%
The following table presents financial information of subsidiaries with material non-controllinginterests as of December 31, 2020 and 2019.
2020 2019
PSBankORIXMetro PSBank
ORIXMetro
Statement of Financial PositionTotal assets P=219,479 P=44,623 P=224,907 P=52,821Total liabilities 184,933 35,733 190,450 43,998Non-controlling interest 5,197 3,586 5,187 3,562Statement of IncomeGross income 20,134 6,708 20,656 7,745Operating income 16,570 4,605 14,602 5,248Net income 1,106 32 3,028 1,147Net income attributable to non-controlling interest 129 13 352 460Total comprehensive income 1,343 68 3,401 710Statement of Cash FlowsNet cash provided by (used in) operating activities 12,585 8,110 (35,641) 771Net cash provided by (used in) investing activities 21,756 (211) 12,614 (791)Net cash provided by (used in) financing activities (3,023) (3,625) 10,752 (2,662)Net increase (decrease) in cash and cash equivalents 31,318 4,274 (12,275) (2,682)Cash and cash equivalents at beginning of year 10,235 7,573 22,510 10,255Cash and cash equivalents at end of year 41,553 11,847 10,235 7,573
Investment in PSBankOn January 11, 2019, PSBank concluded its P=8.0 billion SRO, involving 142,856,925 commonshares priced at P=56.0 per share and listed at the PSE on January 18, 2019. This was approved by theBOD of PSBank on October 15, 2018 and noted by the BSP on October 19, 2018. The ParentCompany exercised its rights to purchase thus increasing its ownership in PSBank to 88.38%(Note 2).
Investment in FMICIn line with its transformation initiative, the BOD of FMIC approved the proposal to return its quasibanking license with the BSP on November 24, 2020.
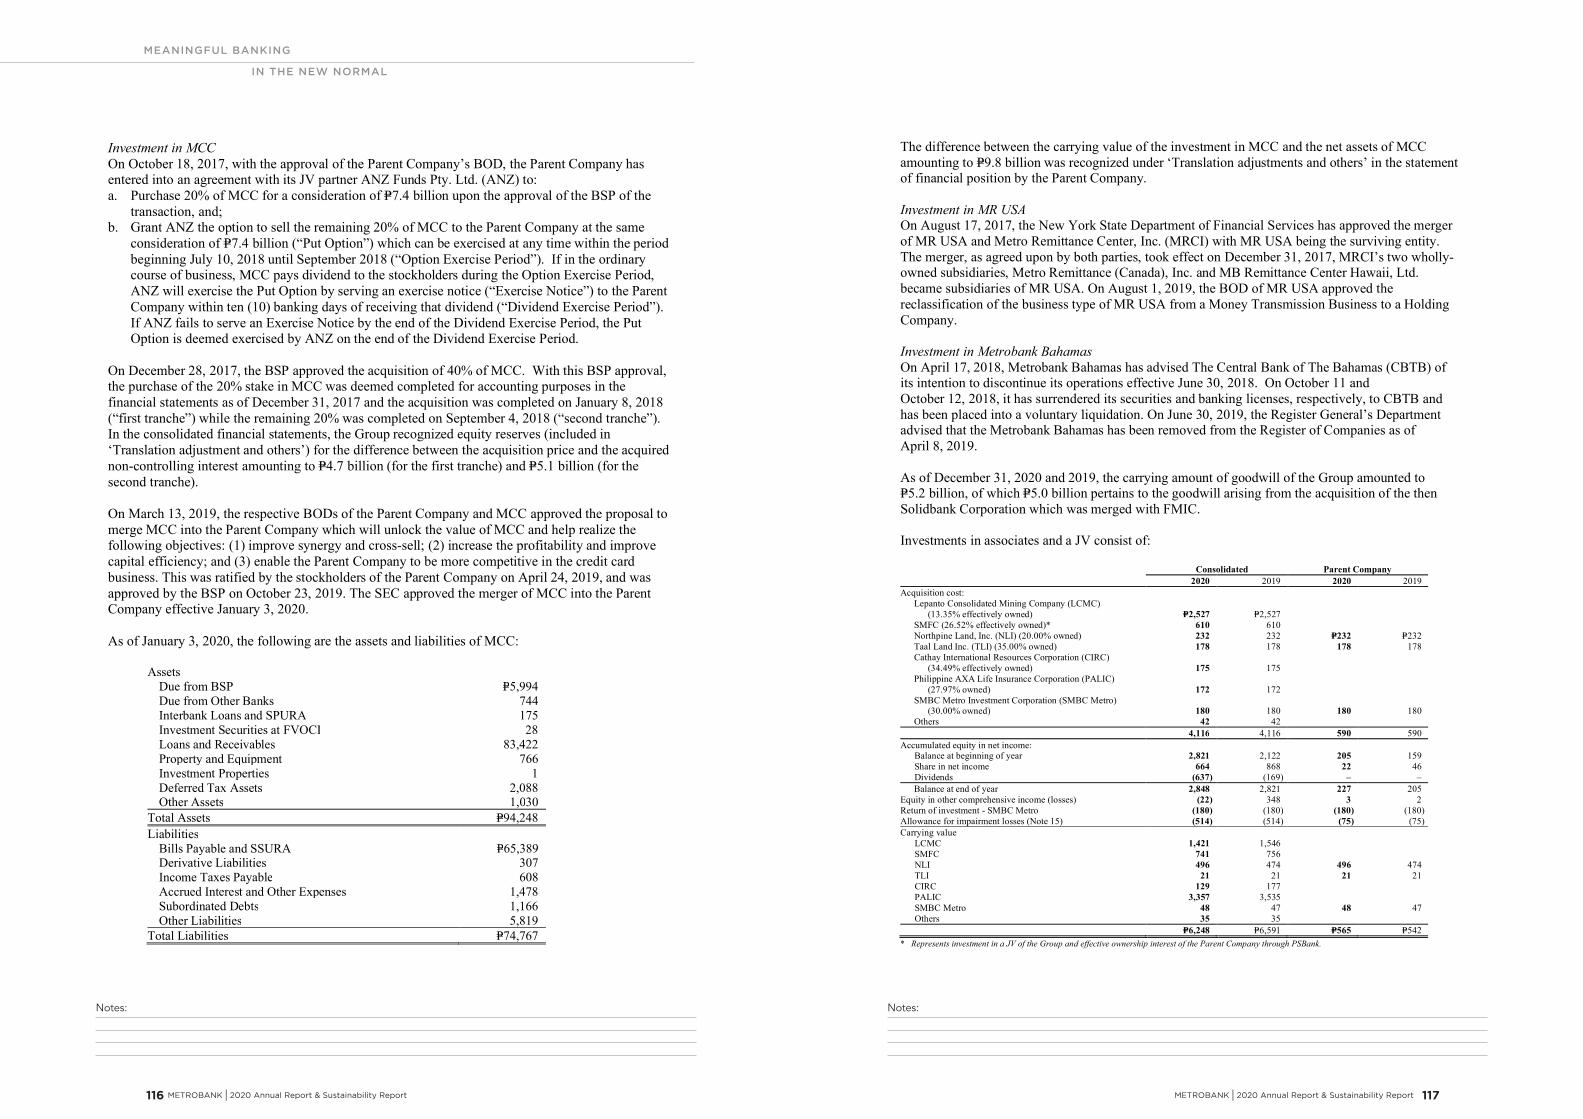
Notes:Notes:
MEANINGFUL BANKING
IN THE NEW NORMAL
METROBANK I 2020 Annual Report & Sustainability Report 117 116 METROBANK I 2020 Annual Report & Sustainability Report
- 85 -
*SGVFSM005911*
Investment in MCCOn October 18, 2017, with the approval of the Parent Company’s BOD, the Parent Company hasentered into an agreement with its JV partner ANZ Funds Pty. Ltd. (ANZ) to:a. Purchase 20% of MCC for a consideration of P=7.4 billion upon the approval of the BSP of the
transaction, and;b. Grant ANZ the option to sell the remaining 20% of MCC to the Parent Company at the same
consideration of P=7.4 billion (“Put Option”) which can be exercised at any time within the periodbeginning July 10, 2018 until September 2018 (“Option Exercise Period”). If in the ordinarycourse of business, MCC pays dividend to the stockholders during the Option Exercise Period,ANZ will exercise the Put Option by serving an exercise notice (“Exercise Notice”) to the ParentCompany within ten (10) banking days of receiving that dividend (“Dividend Exercise Period”).If ANZ fails to serve an Exercise Notice by the end of the Dividend Exercise Period, the PutOption is deemed exercised by ANZ on the end of the Dividend Exercise Period.
On December 28, 2017, the BSP approved the acquisition of 40% of MCC. With this BSP approval,the purchase of the 20% stake in MCC was deemed completed for accounting purposes in thefinancial statements as of December 31, 2017 and the acquisition was completed on January 8, 2018(“first tranche”) while the remaining 20% was completed on September 4, 2018 (“second tranche”).In the consolidated financial statements, the Group recognized equity reserves (included in‘Translation adjustment and others’) for the difference between the acquisition price and the acquirednon-controlling interest amounting to P=4.7 billion (for the first tranche) and P=5.1 billion (for thesecond tranche).
On March 13, 2019, the respective BODs of the Parent Company and MCC approved the proposal tomerge MCC into the Parent Company which will unlock the value of MCC and help realize thefollowing objectives: (1) improve synergy and cross-sell; (2) increase the profitability and improvecapital efficiency; and (3) enable the Parent Company to be more competitive in the credit cardbusiness. This was ratified by the stockholders of the Parent Company on April 24, 2019, and wasapproved by the BSP on October 23, 2019. The SEC approved the merger of MCC into the ParentCompany effective January 3, 2020.
As of January 3, 2020, the following are the assets and liabilities of MCC:
AssetsDue from BSP P=5,994Due from Other Banks 744Interbank Loans and SPURA 175Investment Securities at FVOCI 28Loans and Receivables 83,422Property and Equipment 766Investment Properties 1Deferred Tax Assets 2,088Other Assets 1,030
Total Assets P=94,248Liabilities
Bills Payable and SSURA P=65,389Derivative Liabilities 307Income Taxes Payable 608Accrued Interest and Other Expenses 1,478Subordinated Debts 1,166Other Liabilities 5,819
Total Liabilities P=74,767
- 86 -
*SGVFSM005911*
The difference between the carrying value of the investment in MCC and the net assets of MCCamounting to P=9.8 billion was recognized under ‘Translation adjustments and others’ in the statementof financial position by the Parent Company.
Investment in MR USAOn August 17, 2017, the New York State Department of Financial Services has approved the mergerof MR USA and Metro Remittance Center, Inc. (MRCI) with MR USA being the surviving entity.The merger, as agreed upon by both parties, took effect on December 31, 2017, MRCI’s two wholly-owned subsidiaries, Metro Remittance (Canada), Inc. and MB Remittance Center Hawaii, Ltd.became subsidiaries of MR USA. On August 1, 2019, the BOD of MR USA approved thereclassification of the business type of MR USA from a Money Transmission Business to a HoldingCompany.
Investment in Metrobank BahamasOn April 17, 2018, Metrobank Bahamas has advised The Central Bank of The Bahamas (CBTB) ofits intention to discontinue its operations effective June 30, 2018. On October 11 andOctober 12, 2018, it has surrendered its securities and banking licenses, respectively, to CBTB andhas been placed into a voluntary liquidation. On June 30, 2019, the Register General’s Departmentadvised that the Metrobank Bahamas has been removed from the Register of Companies as ofApril 8, 2019.
As of December 31, 2020 and 2019, the carrying amount of goodwill of the Group amounted toP=5.2 billion, of which P=5.0 billion pertains to the goodwill arising from the acquisition of the thenSolidbank Corporation which was merged with FMIC.
Investments in associates and a JV consist of:
Consolidated Parent Company2020 2019 2020 2019
Acquisition cost:Lepanto Consolidated Mining Company (LCMC) (13.35% effectively owned) P=2,527 P=2,527SMFC (26.52% effectively owned)* 610 610Northpine Land, Inc. (NLI) (20.00% owned) 232 232 P=232 P=232Taal Land Inc. (TLI) (35.00% owned) 178 178 178 178Cathay International Resources Corporation (CIRC) (34.49% effectively owned) 175 175Philippine AXA Life Insurance Corporation (PALIC) (27.97% owned) 172 172SMBC Metro Investment Corporation (SMBC Metro) (30.00% owned) 180 180 180 180Others 42 42
4,116 4,116 590 590Accumulated equity in net income:
Balance at beginning of year 2,821 2,122 205 159 Share in net income 664 868 22 46 Dividends (637) (169) – – Balance at end of year 2,848 2,821 227 205
Equity in other comprehensive income (losses) (22) 348 3 2Return of investment - SMBC Metro (180) (180) (180) (180)Allowance for impairment losses (Note 15) (514) (514) (75) (75)Carrying value
LCMC 1,421 1,546 SMFC 741 756 NLI 496 474 496 474 TLI 21 21 21 21 CIRC 129 177 PALIC 3,357 3,535 SMBC Metro 48 47 48 47 Others 35 35
P=6,248 P=6,591 P=565 P=542* Represents investment in a JV of the Group and effective ownership interest of the Parent Company through PSBank.
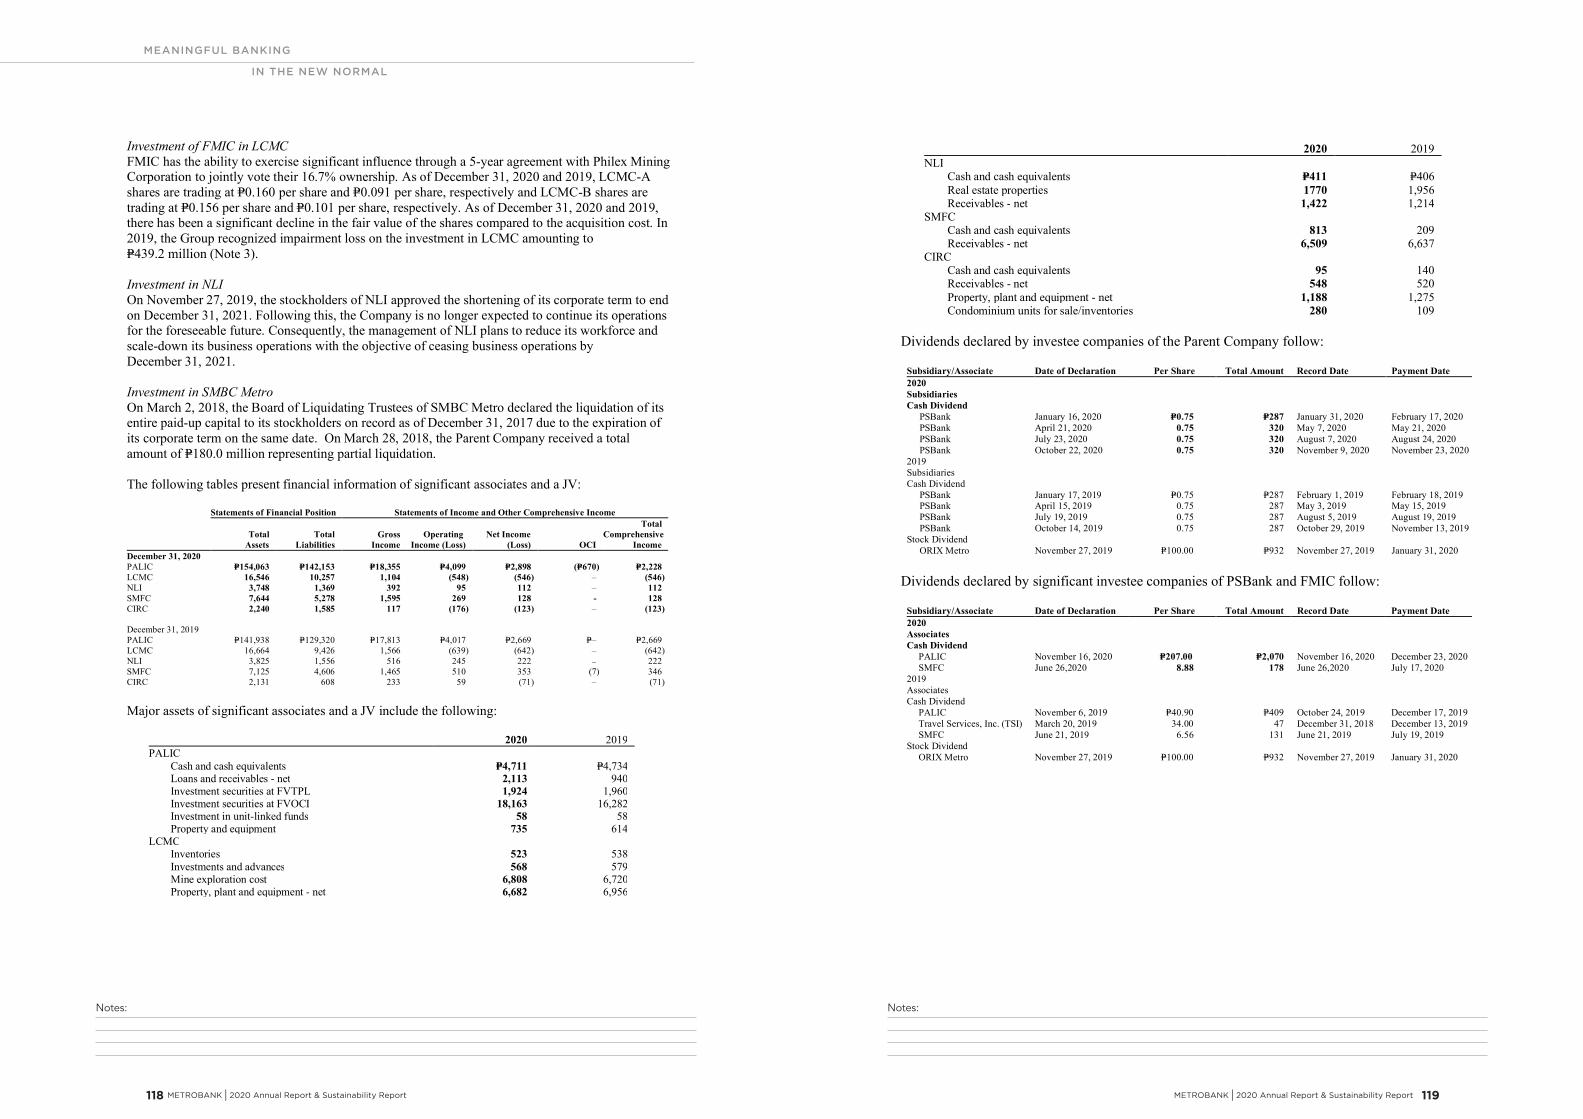
Notes:Notes:
MEANINGFUL BANKING
IN THE NEW NORMAL
METROBANK I 2020 Annual Report & Sustainability Report 119 118 METROBANK I 2020 Annual Report & Sustainability Report
- 87 -
*SGVFSM005911*
Investment of FMIC in LCMCFMIC has the ability to exercise significant influence through a 5-year agreement with Philex MiningCorporation to jointly vote their 16.7% ownership. As of December 31, 2020 and 2019, LCMC-Ashares are trading at P=0.160 per share and P=0.091 per share, respectively and LCMC-B shares aretrading at P=0.156 per share and P=0.101 per share, respectively. As of December 31, 2020 and 2019,there has been a significant decline in the fair value of the shares compared to the acquisition cost. In2019, the Group recognized impairment loss on the investment in LCMC amounting toP=439.2 million (Note 3).
Investment in NLIOn November 27, 2019, the stockholders of NLI approved the shortening of its corporate term to endon December 31, 2021. Following this, the Company is no longer expected to continue its operationsfor the foreseeable future. Consequently, the management of NLI plans to reduce its workforce andscale-down its business operations with the objective of ceasing business operations byDecember 31, 2021.
Investment in SMBC MetroOn March 2, 2018, the Board of Liquidating Trustees of SMBC Metro declared the liquidation of itsentire paid-up capital to its stockholders on record as of December 31, 2017 due to the expiration ofits corporate term on the same date. On March 28, 2018, the Parent Company received a totalamount of P=180.0 million representing partial liquidation.
The following tables present financial information of significant associates and a JV:
Statements of Financial Position Statements of Income and Other Comprehensive Income
TotalAssets
TotalLiabilities
GrossIncome
OperatingIncome (Loss)
Net Income(Loss) OCI
TotalComprehensive
IncomeDecember 31, 2020PALIC P=154,063 P=142,153 P=18,355 P=4,099 P=2,898 (P=670) P=2,228LCMC 16,546 10,257 1,104 (548) (546) – (546)NLI 3,748 1,369 392 95 112 – 112SMFC 7,644 5,278 1,595 269 128 - 128CIRC 2,240 1,585 117 (176) (123) – (123)
December 31, 2019PALIC P=141,938 P=129,320 P=17,813 P=4,017 P=2,669 P=– P=2,669LCMC 16,664 9,426 1,566 (639) (642) – (642)NLI 3,825 1,556 516 245 222 – 222SMFC 7,125 4,606 1,465 510 353 (7) 346CIRC 2,131 608 233 59 (71) – (71)
Major assets of significant associates and a JV include the following:
2020 2019PALIC
Cash and cash equivalents P=4,711 P=4,734Loans and receivables - net 2,113 940Investment securities at FVTPL 1,924 1,960Investment securities at FVOCI 18,163 16,282Investment in unit-linked funds 58 58Property and equipment 735 614
LCMC Inventories 523 538
Investments and advances 568 579Mine exploration cost 6,808 6,720Property, plant and equipment - net 6,682 6,956
- 88 -
*SGVFSM005911*
2020 2019NLI Cash and cash equivalents P=411 P=406
Real estate properties 1770 1,956Receivables - net 1,422 1,214
SMFCCash and cash equivalents 813 209Receivables - net 6,509 6,637
CIRCCash and cash equivalents 95 140
Receivables - net 548 520Property, plant and equipment - net 1,188 1,275Condominium units for sale/inventories 280 109
Dividends declared by investee companies of the Parent Company follow:
Subsidiary/Associate Date of Declaration Per Share Total Amount Record Date Payment Date2020SubsidiariesCash Dividend
PSBank January 16, 2020 P=0.75 P=287 January 31, 2020 February 17, 2020PSBank April 21, 2020 0.75 320 May 7, 2020 May 21, 2020PSBank July 23, 2020 0.75 320 August 7, 2020 August 24, 2020PSBank October 22, 2020 0.75 320 November 9, 2020 November 23, 2020
2019SubsidiariesCash Dividend
PSBank January 17, 2019 P=0.75 P=287 February 1, 2019 February 18, 2019PSBank April 15, 2019 0.75 287 May 3, 2019 May 15, 2019PSBank July 19, 2019 0.75 287 August 5, 2019 August 19, 2019PSBank October 14, 2019 0.75 287 October 29, 2019 November 13, 2019
Stock DividendORIX Metro November 27, 2019 P=100.00 P=932 November 27, 2019 January 31, 2020
Dividends declared by significant investee companies of PSBank and FMIC follow:
Subsidiary/Associate Date of Declaration Per Share Total Amount Record Date Payment Date2020AssociatesCash Dividend
PALIC November 16, 2020 P=207.00 P=2,070 November 16, 2020 December 23, 2020SMFC June 26,2020 8.88 178 June 26,2020 July 17, 2020
2019AssociatesCash Dividend
PALIC November 6, 2019 P=40.90 P=409 October 24, 2019 December 17, 2019Travel Services, Inc. (TSI) March 20, 2019 34.00 47 December 31, 2018 December 13, 2019SMFC June 21, 2019 6.56 131 June 21, 2019 July 19, 2019
Stock DividendORIX Metro November 27, 2019 P=100.00 P=932 November 27, 2019 January 31, 2020
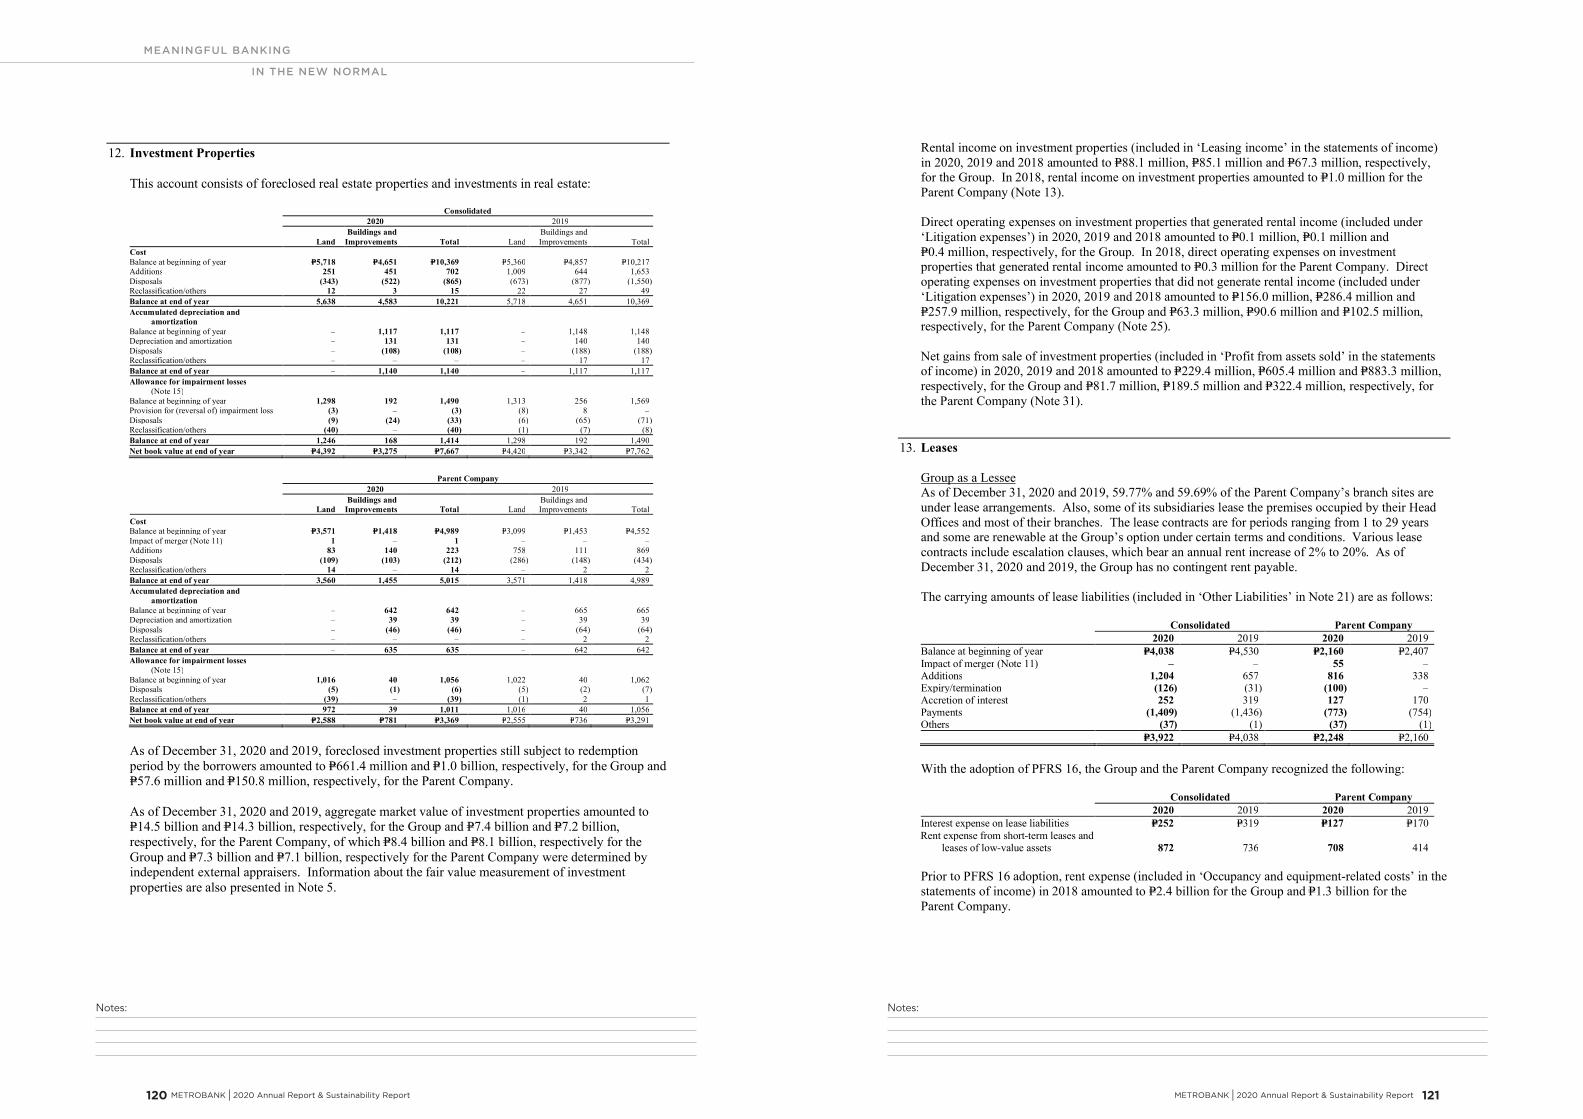
Notes:Notes:
MEANINGFUL BANKING
IN THE NEW NORMAL
METROBANK I 2020 Annual Report & Sustainability Report 121 120 METROBANK I 2020 Annual Report & Sustainability Report
- 89 -
*SGVFSM005911*
12. Investment Properties
This account consists of foreclosed real estate properties and investments in real estate:
Consolidated2020 2019
LandBuildings and
Improvements Total LandBuildings andImprovements Total
CostBalance at beginning of year P=5,718 P=4,651 P=10,369 P=5,360 P=4,857 P=10,217Additions 251 451 702 1,009 644 1,653Disposals (343) (522) (865) (673) (877) (1,550)Reclassification/others 12 3 15 22 27 49Balance at end of year 5,638 4,583 10,221 5,718 4,651 10,369Accumulated depreciation and
amortizationBalance at beginning of year – 1,117 1,117 – 1,148 1,148Depreciation and amortization – 131 131 – 140 140Disposals – (108) (108) – (188) (188)Reclassification/others – – – – 17 17Balance at end of year – 1,140 1,140 – 1,117 1,117Allowance for impairment losses
(Note 15)Balance at beginning of year 1,298 192 1,490 1,313 256 1,569Provision for (reversal of) impairment loss (3) – (3) (8) 8 –Disposals (9) (24) (33) (6) (65) (71)Reclassification/others (40) – (40) (1) (7) (8)Balance at end of year 1,246 168 1,414 1,298 192 1,490Net book value at end of year P=4,392 P=3,275 P=7,667 P=4,420 P=3,342 P=7,762
Parent Company2020 2019
LandBuildings and
Improvements Total LandBuildings andImprovements Total
CostBalance at beginning of year P=3,571 P=1,418 P=4,989 P=3,099 P=1,453 P=4,552Impact of merger (Note 11) 1 – 1 – – –Additions 83 140 223 758 111 869Disposals (109) (103) (212) (286) (148) (434)Reclassification/others 14 – 14 – 2 2Balance at end of year 3,560 1,455 5,015 3,571 1,418 4,989Accumulated depreciation and
amortizationBalance at beginning of year – 642 642 – 665 665Depreciation and amortization – 39 39 – 39 39Disposals – (46) (46) – (64) (64)Reclassification/others – – – – 2 2Balance at end of year – 635 635 – 642 642Allowance for impairment losses
(Note 15)Balance at beginning of year 1,016 40 1,056 1,022 40 1,062Disposals (5) (1) (6) (5) (2) (7)Reclassification/others (39) – (39) (1) 2 1Balance at end of year 972 39 1,011 1,016 40 1,056Net book value at end of year P=2,588 P=781 P=3,369 P=2,555 P=736 P=3,291
As of December 31, 2020 and 2019, foreclosed investment properties still subject to redemptionperiod by the borrowers amounted to P=661.4 million and P=1.0 billion, respectively, for the Group andP=57.6 million and P=150.8 million, respectively, for the Parent Company.
As of December 31, 2020 and 2019, aggregate market value of investment properties amounted toP=14.5 billion and P=14.3 billion, respectively, for the Group and P=7.4 billion and P=7.2 billion,respectively, for the Parent Company, of which P=8.4 billion and P=8.1 billion, respectively for theGroup and P=7.3 billion and P=7.1 billion, respectively for the Parent Company were determined byindependent external appraisers. Information about the fair value measurement of investmentproperties are also presented in Note 5.
- 90 -
*SGVFSM005911*
Rental income on investment properties (included in ‘Leasing income’ in the statements of income)in 2020, 2019 and 2018 amounted to P=88.1 million, P=85.1 million and P=67.3 million, respectively,for the Group. In 2018, rental income on investment properties amounted to P=1.0 million for theParent Company (Note 13).
Direct operating expenses on investment properties that generated rental income (included under‘Litigation expenses’) in 2020, 2019 and 2018 amounted to P=0.1 million, P=0.1 million andP=0.4 million, respectively, for the Group. In 2018, direct operating expenses on investmentproperties that generated rental income amounted to P=0.3 million for the Parent Company. Directoperating expenses on investment properties that did not generate rental income (included under‘Litigation expenses’) in 2020, 2019 and 2018 amounted to P=156.0 million, P=286.4 million andP=257.9 million, respectively, for the Group and P=63.3 million, P=90.6 million and P=102.5 million,respectively, for the Parent Company (Note 25).
Net gains from sale of investment properties (included in ‘Profit from assets sold’ in the statementsof income) in 2020, 2019 and 2018 amounted to P=229.4 million, P=605.4 million and P=883.3 million,respectively, for the Group and P=81.7 million, P=189.5 million and P=322.4 million, respectively, forthe Parent Company (Note 31).
13. Leases
Group as a LesseeAs of December 31, 2020 and 2019, 59.77% and 59.69% of the Parent Company’s branch sites areunder lease arrangements. Also, some of its subsidiaries lease the premises occupied by their HeadOffices and most of their branches. The lease contracts are for periods ranging from 1 to 29 yearsand some are renewable at the Group’s option under certain terms and conditions. Various leasecontracts include escalation clauses, which bear an annual rent increase of 2% to 20%. As ofDecember 31, 2020 and 2019, the Group has no contingent rent payable.
The carrying amounts of lease liabilities (included in ‘Other Liabilities’ in Note 21) are as follows:
Consolidated Parent Company2020 2019 2020 2019
Balance at beginning of year P=4,038 P=4,530 P=2,160 P=2,407Impact of merger (Note 11) – – 55 –Additions 1,204 657 816 338Expiry/termination (126) (31) (100) –Accretion of interest 252 319 127 170Payments (1,409) (1,436) (773) (754)Others (37) (1) (37) (1)
P=3,922 P=4,038 P=2,248 P=2,160
With the adoption of PFRS 16, the Group and the Parent Company recognized the following:
Consolidated Parent Company2020 2019 2020 2019
Interest expense on lease liabilities P=252 P=319 P=127 P=170Rent expense from short-term leases and
leases of low-value assets 872 736 708 414
Prior to PFRS 16 adoption, rent expense (included in ‘Occupancy and equipment-related costs’ in thestatements of income) in 2018 amounted to P=2.4 billion for the Group and P=1.3 billion for theParent Company.
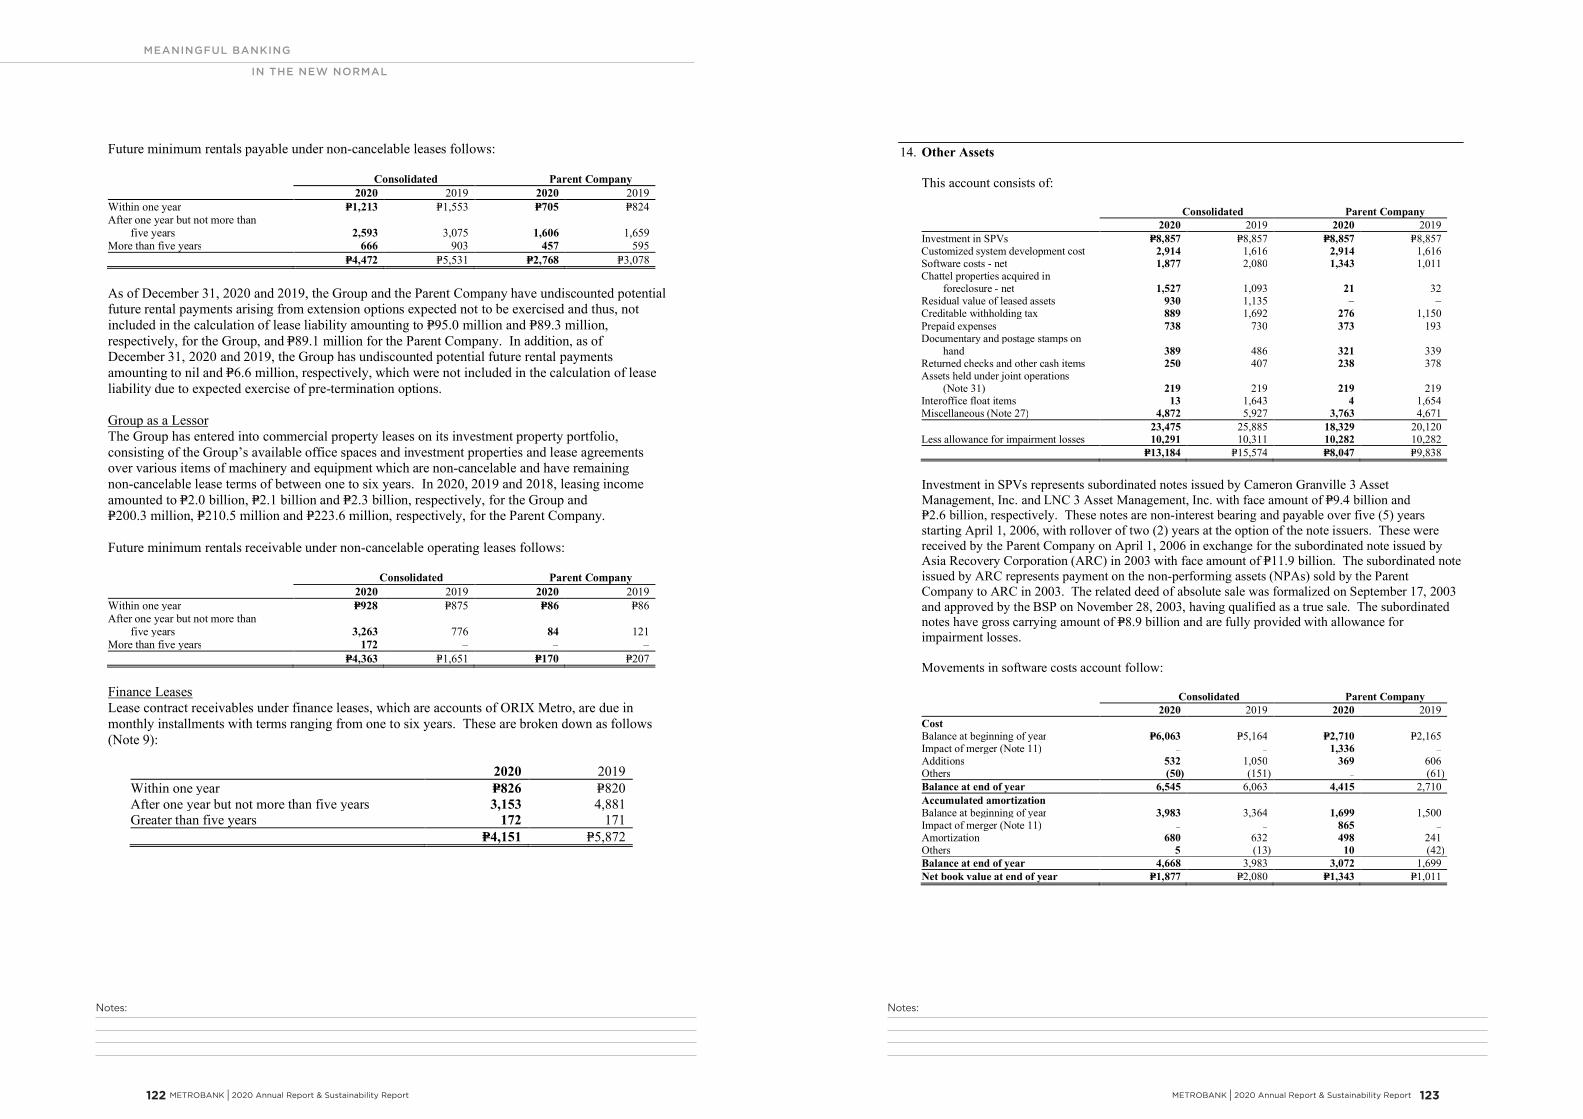
Notes:Notes:
MEANINGFUL BANKING
IN THE NEW NORMAL
METROBANK I 2020 Annual Report & Sustainability Report 123 122 METROBANK I 2020 Annual Report & Sustainability Report
- 91 -
*SGVFSM005911*
Future minimum rentals payable under non-cancelable leases follows:
Consolidated Parent Company2020 2019 2020 2019
Within one year P=1,213 P=1,553 P=705 P=824After one year but not more than
five years 2,593 3,075 1,606 1,659More than five years 666 903 457 595
P=4,472 P=5,531 P=2,768 P=3,078
As of December 31, 2020 and 2019, the Group and the Parent Company have undiscounted potentialfuture rental payments arising from extension options expected not to be exercised and thus, notincluded in the calculation of lease liability amounting to P=95.0 million and P=89.3 million,respectively, for the Group, and P=89.1 million for the Parent Company. In addition, as ofDecember 31, 2020 and 2019, the Group has undiscounted potential future rental paymentsamounting to nil and P=6.6 million, respectively, which were not included in the calculation of leaseliability due to expected exercise of pre-termination options.
Group as a LessorThe Group has entered into commercial property leases on its investment property portfolio,consisting of the Group’s available office spaces and investment properties and lease agreementsover various items of machinery and equipment which are non-cancelable and have remainingnon-cancelable lease terms of between one to six years. In 2020, 2019 and 2018, leasing incomeamounted to P=2.0 billion, P=2.1 billion and P=2.3 billion, respectively, for the Group andP=200.3 million, P=210.5 million and P=223.6 million, respectively, for the Parent Company.
Future minimum rentals receivable under non-cancelable operating leases follows:
Consolidated Parent Company2020 2019 2020 2019
Within one year P=928 P=875 P=86 P=86After one year but not more than
five years 3,263 776 84 121More than five years 172 ‒ ‒ ‒
P=4,363 P=1,651 P=170 P=207
Finance LeasesLease contract receivables under finance leases, which are accounts of ORIX Metro, are due inmonthly installments with terms ranging from one to six years. These are broken down as follows(Note 9):
2020 2019Within one year P=826 P=820After one year but not more than five years 3,153 4,881Greater than five years 172 171
P=4,151 P=5,872
- 92 -
*SGVFSM005911*
14. Other Assets
This account consists of:
Consolidated Parent Company2020 2019 2020 2019
Investment in SPVs P=8,857 P=8,857 P=8,857 P=8,857Customized system development cost 2,914 1,616 2,914 1,616Software costs - net 1,877 2,080 1,343 1,011Chattel properties acquired in
foreclosure - net 1,527 1,093 21 32Residual value of leased assets 930 1,135 ‒ ‒Creditable withholding tax 889 1,692 276 1,150Prepaid expenses 738 730 373 193Documentary and postage stamps on
hand 389 486 321 339Returned checks and other cash items 250 407 238 378Assets held under joint operations
(Note 31) 219 219 219 219Interoffice float items 13 1,643 4 1,654Miscellaneous (Note 27) 4,872 5,927 3,763 4,671
23,475 25,885 18,329 20,120Less allowance for impairment losses 10,291 10,311 10,282 10,282
P=13,184 P=15,574 P=8,047 P=9,838
Investment in SPVs represents subordinated notes issued by Cameron Granville 3 AssetManagement, Inc. and LNC 3 Asset Management, Inc. with face amount of P=9.4 billion andP=2.6 billion, respectively. These notes are non-interest bearing and payable over five (5) yearsstarting April 1, 2006, with rollover of two (2) years at the option of the note issuers. These werereceived by the Parent Company on April 1, 2006 in exchange for the subordinated note issued byAsia Recovery Corporation (ARC) in 2003 with face amount of P=11.9 billion. The subordinated noteissued by ARC represents payment on the non-performing assets (NPAs) sold by the ParentCompany to ARC in 2003. The related deed of absolute sale was formalized on September 17, 2003and approved by the BSP on November 28, 2003, having qualified as a true sale. The subordinatednotes have gross carrying amount of P=8.9 billion and are fully provided with allowance forimpairment losses.
Movements in software costs account follow:
Consolidated Parent Company2020 2019 2020 2019
CostBalance at beginning of year P=6,063 P=5,164 P=2,710 P=2,165Impact of merger (Note 11) – – 1,336 –Additions 532 1,050 369 606Others (50) (151) – (61)Balance at end of year 6,545 6,063 4,415 2,710Accumulated amortizationBalance at beginning of year 3,983 3,364 1,699 1,500Impact of merger (Note 11) – – 865 –Amortization 680 632 498 241Others 5 (13) 10 (42)Balance at end of year 4,668 3,983 3,072 1,699Net book value at end of year P=1,877 P=2,080 P=1,343 P=1,011
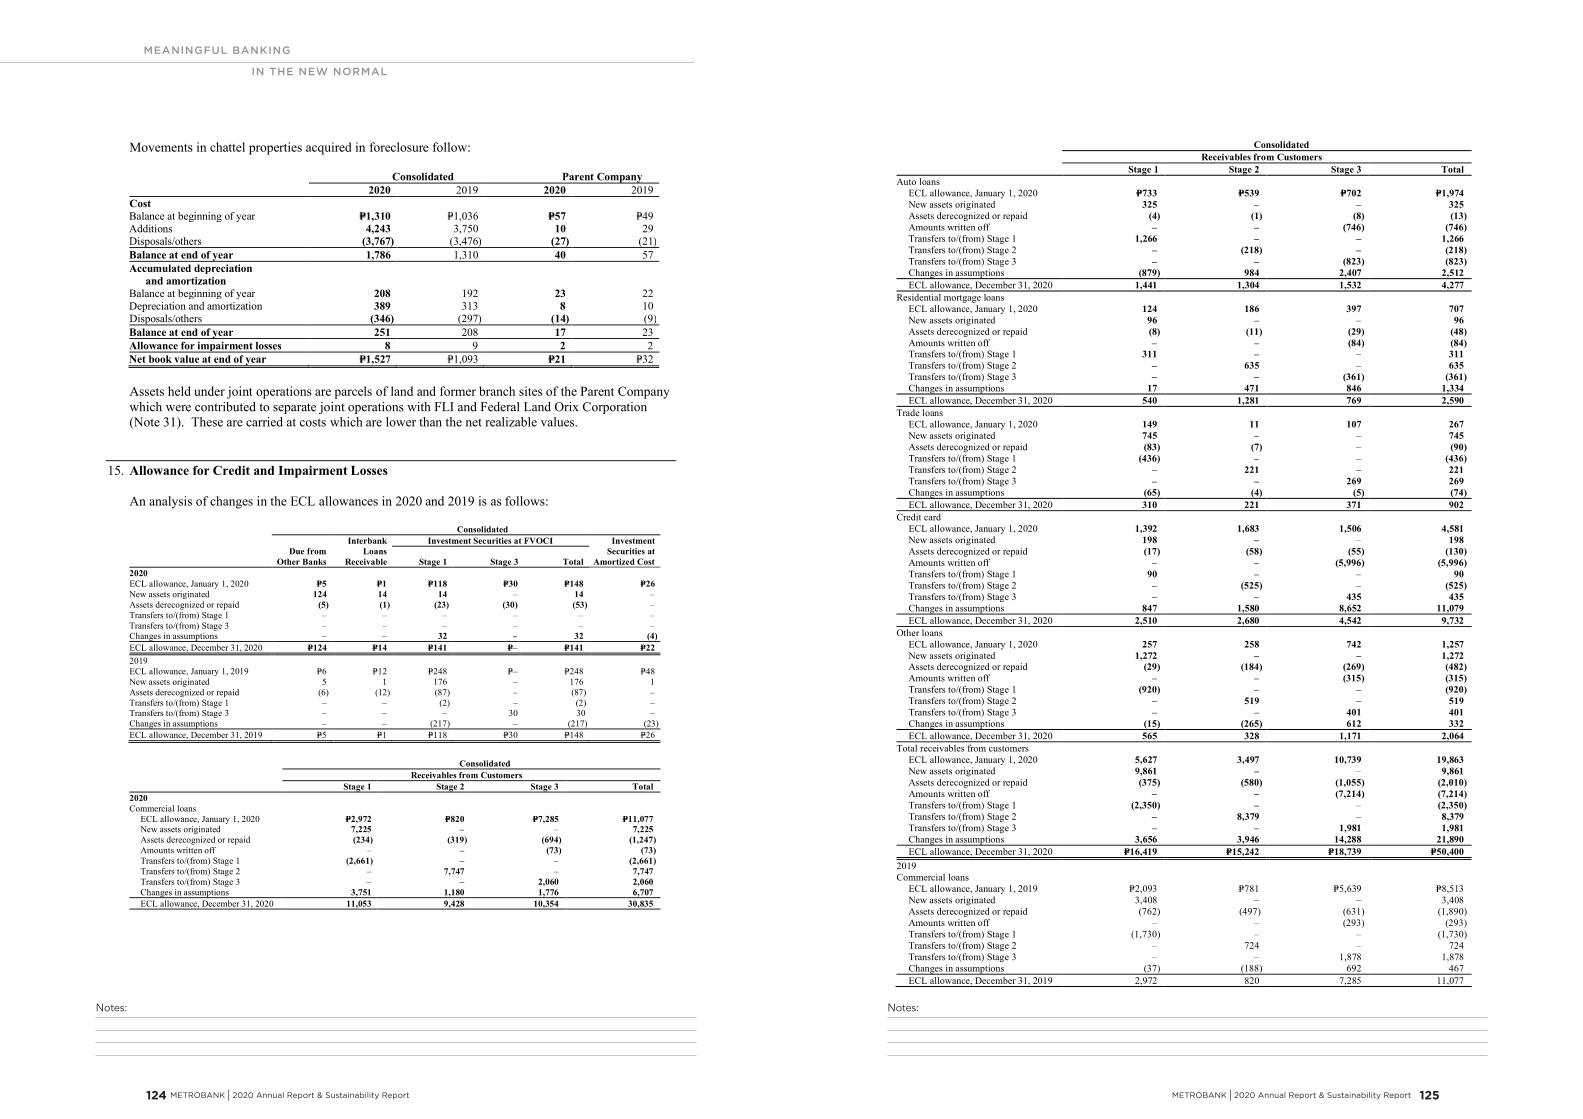
Notes:Notes:
MEANINGFUL BANKING
IN THE NEW NORMAL
METROBANK I 2020 Annual Report & Sustainability Report 125 124 METROBANK I 2020 Annual Report & Sustainability Report
- 93 -
*SGVFSM005911*
Movements in chattel properties acquired in foreclosure follow:
Consolidated Parent Company2020 2019 2020 2019
CostBalance at beginning of year P=1,310 P=1,036 P=57 P=49Additions 4,243 3,750 10 29Disposals/others (3,767) (3,476) (27) (21)Balance at end of year 1,786 1,310 40 57Accumulated depreciation
and amortizationBalance at beginning of year 208 192 23 22Depreciation and amortization 389 313 8 10Disposals/others (346) (297) (14) (9)Balance at end of year 251 208 17 23Allowance for impairment losses 8 9 2 2Net book value at end of year P=1,527 P=1,093 P=21 P=32
Assets held under joint operations are parcels of land and former branch sites of the Parent Companywhich were contributed to separate joint operations with FLI and Federal Land Orix Corporation(Note 31). These are carried at costs which are lower than the net realizable values.
15. Allowance for Credit and Impairment Losses
An analysis of changes in the ECL allowances in 2020 and 2019 is as follows:
Consolidated
Due fromOther Banks
InterbankLoans
Receivable
Investment Securities at FVOCI InvestmentSecurities at
Amortized CostStage 1 Stage 3 Total2020ECL allowance, January 1, 2020 P=5 P=1 P=118 P=30 P=148 P=26New assets originated 124 14 14 – 14 –Assets derecognized or repaid (5) (1) (23) (30) (53) –Transfers to/(from) Stage 1 – – – – – –Transfers to/(from) Stage 3 – – – – – –Changes in assumptions – – 32 – 32 (4)ECL allowance, December 31, 2020 P=124 P=14 P=141 P=– P=141 P=222019ECL allowance, January 1, 2019 P=6 P=12 P=248 P=– P=248 P=48New assets originated 5 1 176 – 176 1Assets derecognized or repaid (6) (12) (87) – (87) –Transfers to/(from) Stage 1 – – (2) – (2) –Transfers to/(from) Stage 3 – – – 30 30 –Changes in assumptions – – (217) – (217) (23)ECL allowance, December 31, 2019 P=5 P=1 P=118 P=30 P=148 P=26
ConsolidatedReceivables from Customers
Stage 1 Stage 2 Stage 3 Total2020Commercial loans
ECL allowance, January 1, 2020 P=2,972 P=820 P=7,285 P=11,077New assets originated 7,225 – – 7,225Assets derecognized or repaid (234) (319) (694) (1,247)Amounts written off – – (73) (73)Transfers to/(from) Stage 1 (2,661) – – (2,661)Transfers to/(from) Stage 2 – 7,747 – 7,747Transfers to/(from) Stage 3 – – 2,060 2,060Changes in assumptions 3,751 1,180 1,776 6,707ECL allowance, December 31, 2020 11,053 9,428 10,354 30,835
- 94 -
*SGVFSM005911*
ConsolidatedReceivables from Customers
Stage 1 Stage 2 Stage 3 TotalAuto loans
ECL allowance, January 1, 2020 P=733 P=539 P=702 P=1,974New assets originated 325 – – 325Assets derecognized or repaid (4) (1) (8) (13)Amounts written off – – (746) (746)Transfers to/(from) Stage 1 1,266 – – 1,266Transfers to/(from) Stage 2 – (218) – (218)Transfers to/(from) Stage 3 – – (823) (823)Changes in assumptions (879) 984 2,407 2,512ECL allowance, December 31, 2020 1,441 1,304 1,532 4,277
Residential mortgage loansECL allowance, January 1, 2020 124 186 397 707New assets originated 96 – – 96Assets derecognized or repaid (8) (11) (29) (48)Amounts written off – – (84) (84)Transfers to/(from) Stage 1 311 – – 311Transfers to/(from) Stage 2 – 635 – 635Transfers to/(from) Stage 3 – – (361) (361)Changes in assumptions 17 471 846 1,334ECL allowance, December 31, 2020 540 1,281 769 2,590
Trade loansECL allowance, January 1, 2020 149 11 107 267New assets originated 745 – – 745Assets derecognized or repaid (83) (7) – (90)Transfers to/(from) Stage 1 (436) – – (436)Transfers to/(from) Stage 2 – 221 – 221Transfers to/(from) Stage 3 – – 269 269Changes in assumptions (65) (4) (5) (74)ECL allowance, December 31, 2020 310 221 371 902
Credit cardECL allowance, January 1, 2020 1,392 1,683 1,506 4,581New assets originated 198 – – 198Assets derecognized or repaid (17) (58) (55) (130)Amounts written off – – (5,996) (5,996)Transfers to/(from) Stage 1 90 – – 90Transfers to/(from) Stage 2 – (525) – (525)Transfers to/(from) Stage 3 – – 435 435Changes in assumptions 847 1,580 8,652 11,079ECL allowance, December 31, 2020 2,510 2,680 4,542 9,732
Other loansECL allowance, January 1, 2020 257 258 742 1,257New assets originated 1,272 – – 1,272Assets derecognized or repaid (29) (184) (269) (482)Amounts written off – – (315) (315)Transfers to/(from) Stage 1 (920) – – (920)Transfers to/(from) Stage 2 – 519 – 519Transfers to/(from) Stage 3 – – 401 401Changes in assumptions (15) (265) 612 332ECL allowance, December 31, 2020 565 328 1,171 2,064
Total receivables from customersECL allowance, January 1, 2020 5,627 3,497 10,739 19,863New assets originated 9,861 – – 9,861Assets derecognized or repaid (375) (580) (1,055) (2,010)Amounts written off – – (7,214) (7,214)Transfers to/(from) Stage 1 (2,350) – – (2,350)Transfers to/(from) Stage 2 – 8,379 – 8,379Transfers to/(from) Stage 3 – – 1,981 1,981Changes in assumptions 3,656 3,946 14,288 21,890ECL allowance, December 31, 2020 P=16,419 P=15,242 P=18,739 P=50,400
2019Commercial loans
ECL allowance, January 1, 2019 P=2,093 P=781 P=5,639 P=8,513New assets originated 3,408 – – 3,408Assets derecognized or repaid (762) (497) (631) (1,890)Amounts written off – – (293) (293)Transfers to/(from) Stage 1 (1,730) – – (1,730)Transfers to/(from) Stage 2 – 724 – 724Transfers to/(from) Stage 3 – – 1,878 1,878Changes in assumptions (37) (188) 692 467ECL allowance, December 31, 2019 2,972 820 7,285 11,077
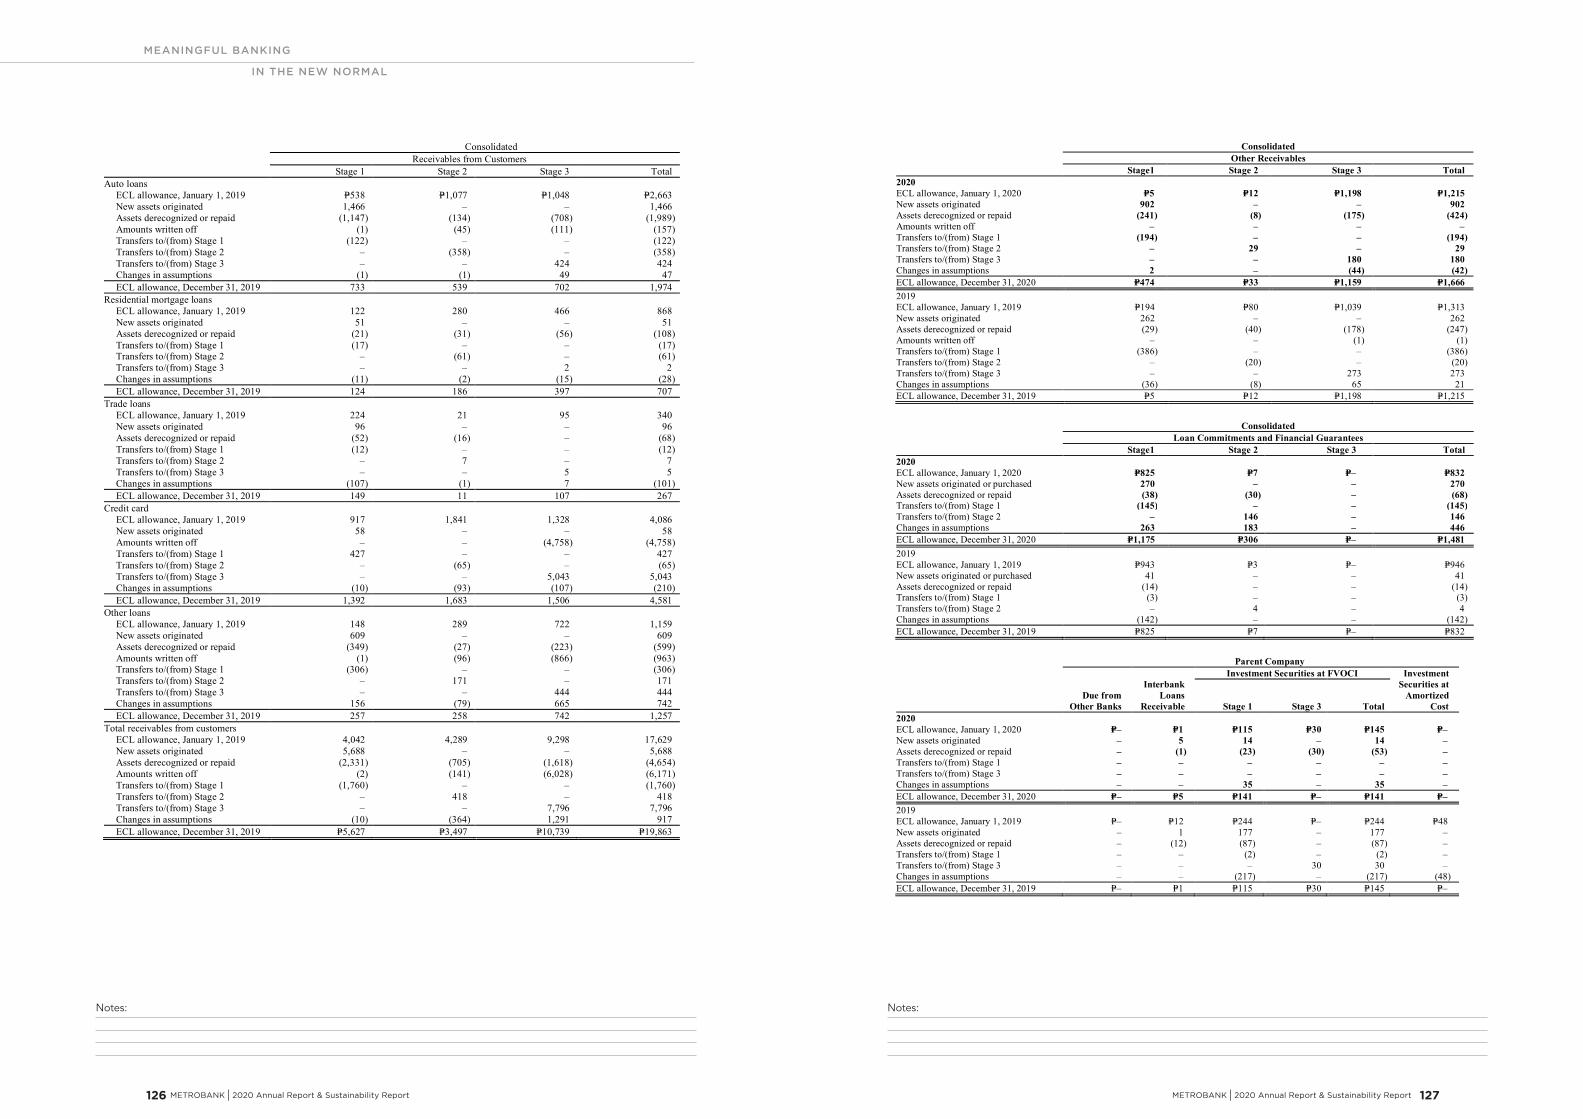
Notes:Notes:
MEANINGFUL BANKING
IN THE NEW NORMAL
METROBANK I 2020 Annual Report & Sustainability Report 127 126 METROBANK I 2020 Annual Report & Sustainability Report
- 95 -
*SGVFSM005911*
ConsolidatedReceivables from Customers
Stage 1 Stage 2 Stage 3 TotalAuto loans
ECL allowance, January 1, 2019 P=538 P=1,077 P=1,048 P=2,663New assets originated 1,466 – – 1,466Assets derecognized or repaid (1,147) (134) (708) (1,989)Amounts written off (1) (45) (111) (157)Transfers to/(from) Stage 1 (122) – – (122)Transfers to/(from) Stage 2 – (358) – (358)Transfers to/(from) Stage 3 – – 424 424Changes in assumptions (1) (1) 49 47ECL allowance, December 31, 2019 733 539 702 1,974
Residential mortgage loansECL allowance, January 1, 2019 122 280 466 868New assets originated 51 – – 51Assets derecognized or repaid (21) (31) (56) (108)Transfers to/(from) Stage 1 (17) – – (17)Transfers to/(from) Stage 2 – (61) – (61)Transfers to/(from) Stage 3 – – 2 2Changes in assumptions (11) (2) (15) (28)ECL allowance, December 31, 2019 124 186 397 707
Trade loansECL allowance, January 1, 2019 224 21 95 340New assets originated 96 – – 96Assets derecognized or repaid (52) (16) – (68)Transfers to/(from) Stage 1 (12) – – (12)Transfers to/(from) Stage 2 – 7 – 7Transfers to/(from) Stage 3 – – 5 5Changes in assumptions (107) (1) 7 (101)ECL allowance, December 31, 2019 149 11 107 267
Credit cardECL allowance, January 1, 2019 917 1,841 1,328 4,086New assets originated 58 – – 58Amounts written off – – (4,758) (4,758)Transfers to/(from) Stage 1 427 – – 427Transfers to/(from) Stage 2 – (65) – (65)Transfers to/(from) Stage 3 – – 5,043 5,043Changes in assumptions (10) (93) (107) (210)ECL allowance, December 31, 2019 1,392 1,683 1,506 4,581
Other loansECL allowance, January 1, 2019 148 289 722 1,159New assets originated 609 – – 609Assets derecognized or repaid (349) (27) (223) (599)Amounts written off (1) (96) (866) (963)Transfers to/(from) Stage 1 (306) – – (306)Transfers to/(from) Stage 2 – 171 – 171Transfers to/(from) Stage 3 – – 444 444Changes in assumptions 156 (79) 665 742ECL allowance, December 31, 2019 257 258 742 1,257
Total receivables from customersECL allowance, January 1, 2019 4,042 4,289 9,298 17,629New assets originated 5,688 – – 5,688Assets derecognized or repaid (2,331) (705) (1,618) (4,654)Amounts written off (2) (141) (6,028) (6,171)Transfers to/(from) Stage 1 (1,760) – – (1,760)Transfers to/(from) Stage 2 – 418 – 418Transfers to/(from) Stage 3 – – 7,796 7,796Changes in assumptions (10) (364) 1,291 917ECL allowance, December 31, 2019 P=5,627 P=3,497 P=10,739 P=19,863
- 96 -
*SGVFSM005911*
ConsolidatedOther Receivables
Stage1 Stage 2 Stage 3 Total2020ECL allowance, January 1, 2020 P=5 P=12 P=1,198 P=1,215New assets originated 902 – – 902Assets derecognized or repaid (241) (8) (175) (424)Amounts written off – – – –Transfers to/(from) Stage 1 (194) – – (194)Transfers to/(from) Stage 2 – 29 – 29Transfers to/(from) Stage 3 – – 180 180Changes in assumptions 2 – (44) (42)ECL allowance, December 31, 2020 P=474 P=33 P=1,159 P=1,6662019ECL allowance, January 1, 2019 P=194 P=80 P=1,039 P=1,313New assets originated 262 ‒ ‒ 262Assets derecognized or repaid (29) (40) (178) (247)Amounts written off ‒ ‒ (1) (1)Transfers to/(from) Stage 1 (386) ‒ ‒ (386)Transfers to/(from) Stage 2 ‒ (20) ‒ (20)Transfers to/(from) Stage 3 ‒ ‒ 273 273Changes in assumptions (36) (8) 65 21ECL allowance, December 31, 2019 P=5 P=12 P=1,198 P=1,215
ConsolidatedLoan Commitments and Financial Guarantees
Stage1 Stage 2 Stage 3 Total2020ECL allowance, January 1, 2020 P=825 P=7 P=– P=832New assets originated or purchased 270 – – 270Assets derecognized or repaid (38) (30) – (68)Transfers to/(from) Stage 1 (145) – – (145)Transfers to/(from) Stage 2 – 146 – 146Changes in assumptions 263 183 – 446ECL allowance, December 31, 2020 P=1,175 P=306 P=– P=1,4812019ECL allowance, January 1, 2019 P=943 P=3 P=– P=946New assets originated or purchased 41 – – 41Assets derecognized or repaid (14) – – (14)Transfers to/(from) Stage 1 (3) – – (3)Transfers to/(from) Stage 2 – 4 – 4Changes in assumptions (142) – – (142)ECL allowance, December 31, 2019 P=825 P=7 P=– P=832
Parent Company
Due fromOther Banks
InterbankLoans
Receivable
Investment Securities at FVOCI InvestmentSecurities at
AmortizedCostStage 1 Stage 3 Total
2020ECL allowance, January 1, 2020 P=– P=1 P=115 P=30 P=145 P=–New assets originated – 5 14 – 14 –Assets derecognized or repaid – (1) (23) (30) (53) –Transfers to/(from) Stage 1 – – – – – –Transfers to/(from) Stage 3 – – – – – –Changes in assumptions – – 35 – 35 –ECL allowance, December 31, 2020 P=– P=5 P=141 P=– P=141 P=–2019ECL allowance, January 1, 2019 P=– P=12 P=244 P=– P=244 P=48New assets originated – 1 177 – 177 –Assets derecognized or repaid – (12) (87) – (87) –Transfers to/(from) Stage 1 – – (2) – (2) –Transfers to/(from) Stage 3 – – – 30 30 –Changes in assumptions – – (217) – (217) (48)ECL allowance, December 31, 2019 P=– P=1 P=115 P=30 P=145 P=–
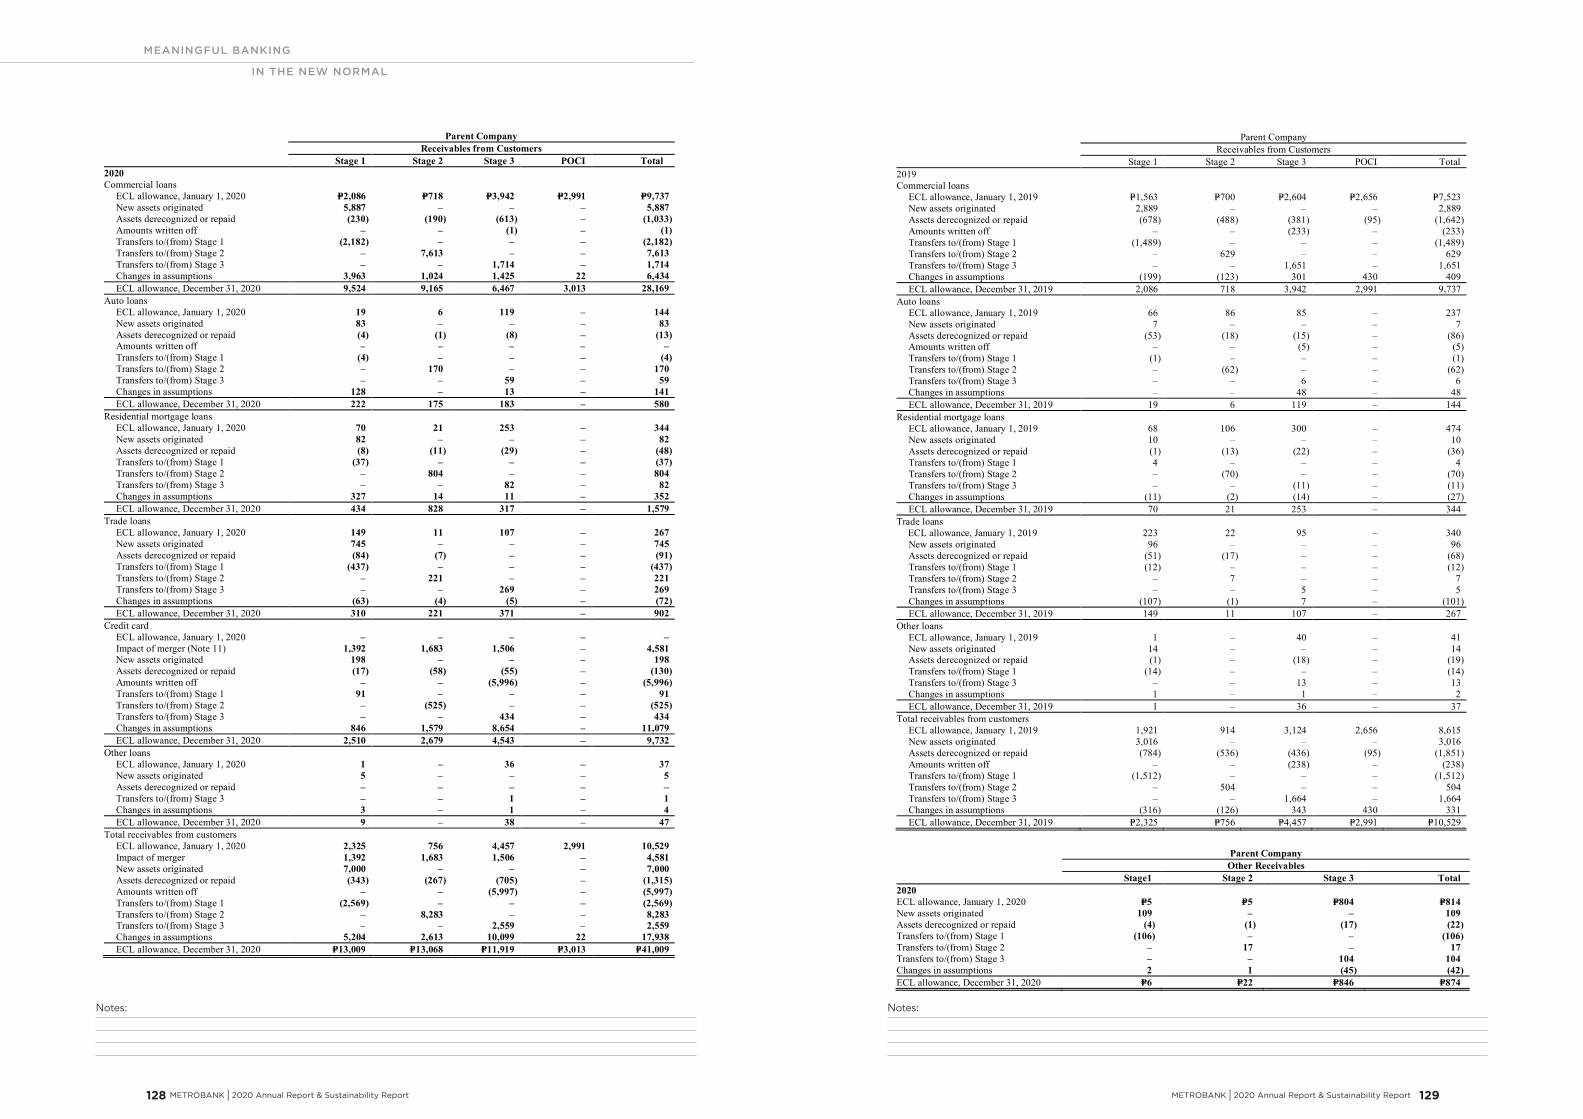
Notes:Notes:
MEANINGFUL BANKING
IN THE NEW NORMAL
METROBANK I 2020 Annual Report & Sustainability Report 129 128 METROBANK I 2020 Annual Report & Sustainability Report
- 97 -
*SGVFSM005911*
Parent CompanyReceivables from Customers
Stage 1 Stage 2 Stage 3 POCI Total2020Commercial loans
ECL allowance, January 1, 2020 P=2,086 P=718 P=3,942 P=2,991 P=9,737New assets originated 5,887 – – – 5,887Assets derecognized or repaid (230) (190) (613) – (1,033)Amounts written off – – (1) – (1)Transfers to/(from) Stage 1 (2,182) – – – (2,182)Transfers to/(from) Stage 2 – 7,613 – – 7,613Transfers to/(from) Stage 3 – – 1,714 – 1,714Changes in assumptions 3,963 1,024 1,425 22 6,434ECL allowance, December 31, 2020 9,524 9,165 6,467 3,013 28,169
Auto loansECL allowance, January 1, 2020 19 6 119 – 144New assets originated 83 – – – 83Assets derecognized or repaid (4) (1) (8) – (13)Amounts written off – – – – –Transfers to/(from) Stage 1 (4) – – – (4)Transfers to/(from) Stage 2 – 170 – – 170Transfers to/(from) Stage 3 – – 59 – 59Changes in assumptions 128 – 13 – 141ECL allowance, December 31, 2020 222 175 183 – 580
Residential mortgage loansECL allowance, January 1, 2020 70 21 253 – 344New assets originated 82 – – – 82Assets derecognized or repaid (8) (11) (29) – (48)Transfers to/(from) Stage 1 (37) – – – (37)Transfers to/(from) Stage 2 – 804 – – 804Transfers to/(from) Stage 3 – – 82 – 82Changes in assumptions 327 14 11 – 352ECL allowance, December 31, 2020 434 828 317 – 1,579
Trade loansECL allowance, January 1, 2020 149 11 107 – 267New assets originated 745 – – – 745Assets derecognized or repaid (84) (7) – – (91)Transfers to/(from) Stage 1 (437) – – – (437)Transfers to/(from) Stage 2 – 221 – – 221Transfers to/(from) Stage 3 – – 269 – 269Changes in assumptions (63) (4) (5) – (72)ECL allowance, December 31, 2020 310 221 371 – 902
Credit cardECL allowance, January 1, 2020 – – – – –Impact of merger (Note 11) 1,392 1,683 1,506 – 4,581New assets originated 198 – – – 198Assets derecognized or repaid (17) (58) (55) – (130)Amounts written off – – (5,996) – (5,996)Transfers to/(from) Stage 1 91 – – – 91Transfers to/(from) Stage 2 – (525) – – (525)Transfers to/(from) Stage 3 – – 434 – 434Changes in assumptions 846 1,579 8,654 – 11,079ECL allowance, December 31, 2020 2,510 2,679 4,543 – 9,732
Other loansECL allowance, January 1, 2020 1 – 36 – 37New assets originated 5 – – – 5Assets derecognized or repaid – – – – –Transfers to/(from) Stage 3 – – 1 – 1Changes in assumptions 3 – 1 – 4ECL allowance, December 31, 2020 9 – 38 – 47
Total receivables from customersECL allowance, January 1, 2020 2,325 756 4,457 2,991 10,529Impact of merger 1,392 1,683 1,506 – 4,581New assets originated 7,000 – – – 7,000Assets derecognized or repaid (343) (267) (705) – (1,315)Amounts written off – – (5,997) – (5,997)Transfers to/(from) Stage 1 (2,569) – – – (2,569)Transfers to/(from) Stage 2 – 8,283 – – 8,283Transfers to/(from) Stage 3 – – 2,559 – 2,559Changes in assumptions 5,204 2,613 10,099 22 17,938ECL allowance, December 31, 2020 P=13,009 P=13,068 P=11,919 P=3,013 P=41,009
- 98 -
*SGVFSM005911*
Parent CompanyReceivables from Customers
Stage 1 Stage 2 Stage 3 POCI Total2019Commercial loans
ECL allowance, January 1, 2019 P=1,563 P=700 P=2,604 P=2,656 P=7,523New assets originated 2,889 – – – 2,889Assets derecognized or repaid (678) (488) (381) (95) (1,642)Amounts written off – – (233) – (233)Transfers to/(from) Stage 1 (1,489) – – – (1,489)Transfers to/(from) Stage 2 – 629 – – 629Transfers to/(from) Stage 3 – – 1,651 – 1,651Changes in assumptions (199) (123) 301 430 409ECL allowance, December 31, 2019 2,086 718 3,942 2,991 9,737
Auto loansECL allowance, January 1, 2019 66 86 85 – 237New assets originated 7 – – – 7Assets derecognized or repaid (53) (18) (15) – (86)Amounts written off – – (5) – (5)Transfers to/(from) Stage 1 (1) – – – (1)Transfers to/(from) Stage 2 – (62) – – (62)Transfers to/(from) Stage 3 – – 6 – 6Changes in assumptions – – 48 – 48ECL allowance, December 31, 2019 19 6 119 – 144
Residential mortgage loansECL allowance, January 1, 2019 68 106 300 – 474New assets originated 10 – – – 10Assets derecognized or repaid (1) (13) (22) – (36)Transfers to/(from) Stage 1 4 – – – 4Transfers to/(from) Stage 2 – (70) – – (70)Transfers to/(from) Stage 3 – – (11) – (11)Changes in assumptions (11) (2) (14) – (27)ECL allowance, December 31, 2019 70 21 253 – 344
Trade loansECL allowance, January 1, 2019 223 22 95 – 340New assets originated 96 – – – 96Assets derecognized or repaid (51) (17) – – (68)Transfers to/(from) Stage 1 (12) – – – (12)Transfers to/(from) Stage 2 – 7 – – 7Transfers to/(from) Stage 3 – – 5 – 5Changes in assumptions (107) (1) 7 – (101)ECL allowance, December 31, 2019 149 11 107 – 267
Other loansECL allowance, January 1, 2019 1 – 40 – 41New assets originated 14 – – – 14Assets derecognized or repaid (1) – (18) – (19)Transfers to/(from) Stage 1 (14) – – – (14)Transfers to/(from) Stage 3 – – 13 – 13Changes in assumptions 1 – 1 – 2ECL allowance, December 31, 2019 1 – 36 – 37
Total receivables from customersECL allowance, January 1, 2019 1,921 914 3,124 2,656 8,615New assets originated 3,016 – – – 3,016Assets derecognized or repaid (784) (536) (436) (95) (1,851)Amounts written off – – (238) – (238)Transfers to/(from) Stage 1 (1,512) – – – (1,512)Transfers to/(from) Stage 2 – 504 – – 504Transfers to/(from) Stage 3 – – 1,664 – 1,664Changes in assumptions (316) (126) 343 430 331ECL allowance, December 31, 2019 P=2,325 P=756 P=4,457 P=2,991 P=10,529
Parent CompanyOther Receivables
Stage1 Stage 2 Stage 3 Total2020ECL allowance, January 1, 2020 P=5 P=5 P=804 P=814New assets originated 109 – – 109Assets derecognized or repaid (4) (1) (17) (22)Transfers to/(from) Stage 1 (106) – – (106)Transfers to/(from) Stage 2 – 17 – 17Transfers to/(from) Stage 3 – – 104 104Changes in assumptions 2 1 (45) (42)ECL allowance, December 31, 2020 P=6 P=22 P=846 P=874
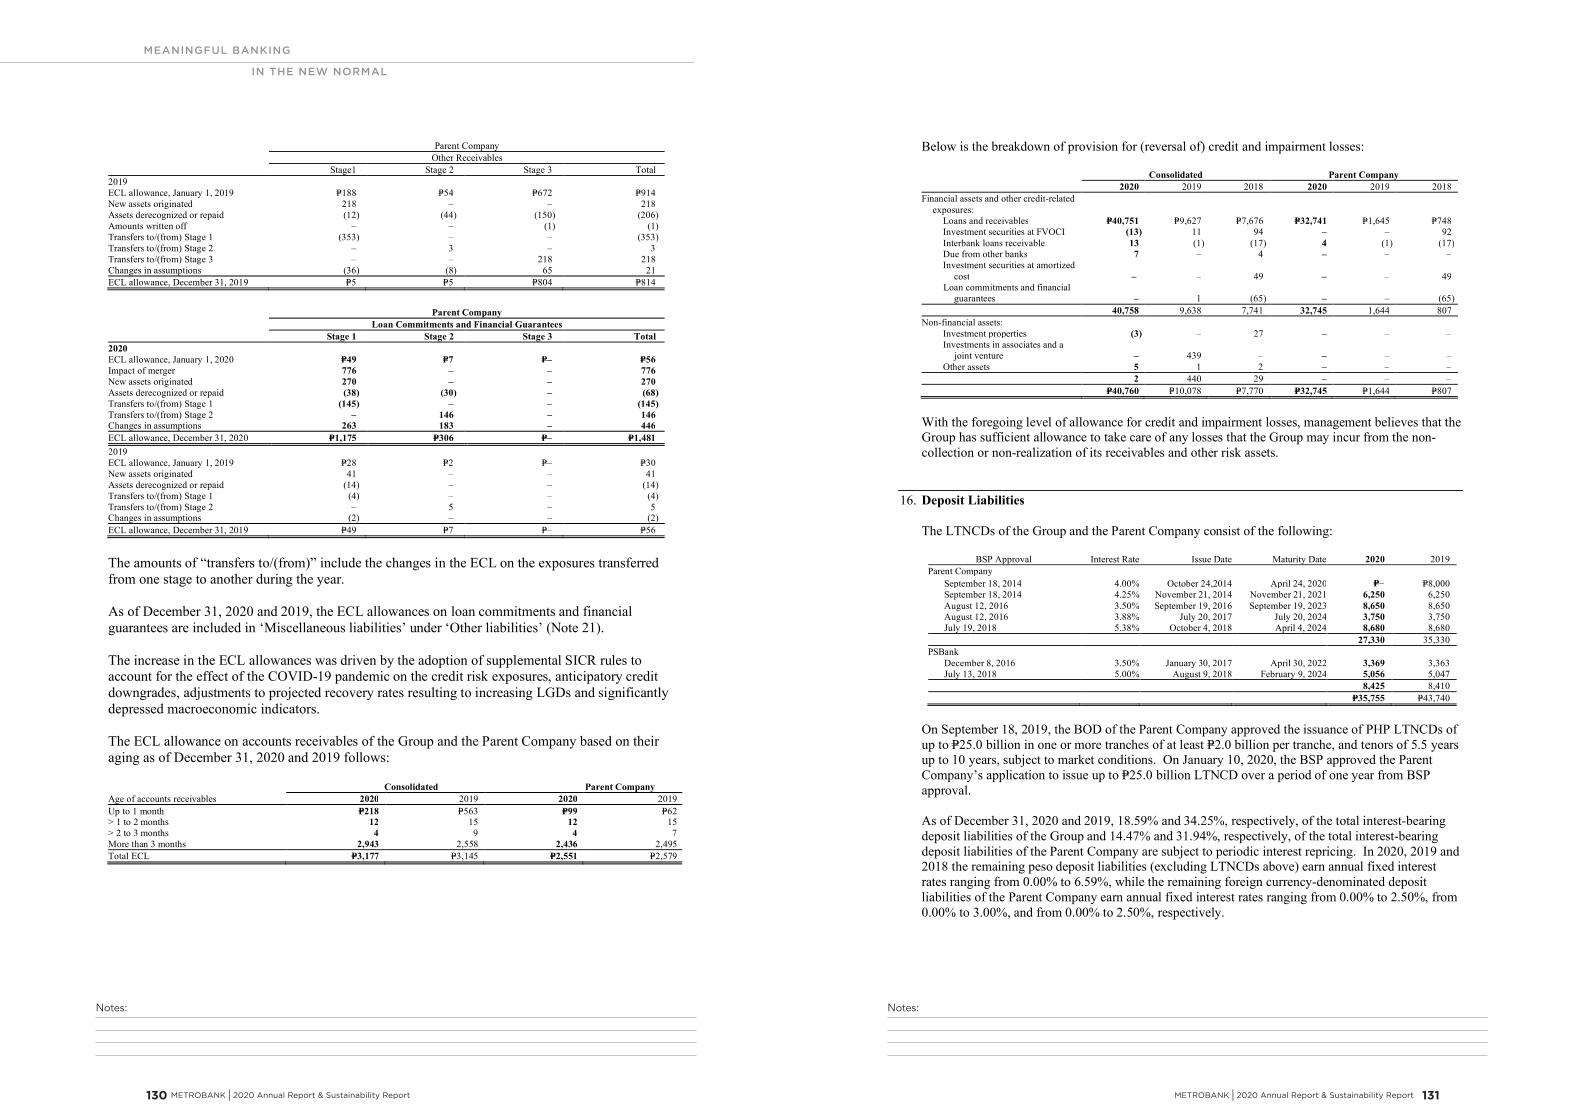
Notes:Notes:
MEANINGFUL BANKING
IN THE NEW NORMAL
METROBANK I 2020 Annual Report & Sustainability Report 131 130 METROBANK I 2020 Annual Report & Sustainability Report
- 99 -
*SGVFSM005911*
Parent CompanyOther Receivables
Stage1 Stage 2 Stage 3 Total2019ECL allowance, January 1, 2019 P=188 P=54 P=672 P=914New assets originated 218 – – 218Assets derecognized or repaid (12) (44) (150) (206)Amounts written off – – (1) (1)Transfers to/(from) Stage 1 (353) – – (353)Transfers to/(from) Stage 2 – 3 – 3Transfers to/(from) Stage 3 – – 218 218Changes in assumptions (36) (8) 65 21ECL allowance, December 31, 2019 P=5 P=5 P=804 P=814
Parent CompanyLoan Commitments and Financial Guarantees
Stage 1 Stage 2 Stage 3 Total2020ECL allowance, January 1, 2020 P=49 P=7 P=– P=56Impact of merger 776 – – 776New assets originated 270 – – 270Assets derecognized or repaid (38) (30) – (68)Transfers to/(from) Stage 1 (145) – – (145)Transfers to/(from) Stage 2 – 146 – 146Changes in assumptions 263 183 – 446ECL allowance, December 31, 2020 P=1,175 P=306 P=– P=1,4812019ECL allowance, January 1, 2019 P=28 P=2 P=– P=30New assets originated 41 – – 41Assets derecognized or repaid (14) – – (14)Transfers to/(from) Stage 1 (4) – – (4)Transfers to/(from) Stage 2 – 5 – 5Changes in assumptions (2) – – (2)ECL allowance, December 31, 2019 P=49 P=7 P=– P=56
The amounts of “transfers to/(from)” include the changes in the ECL on the exposures transferredfrom one stage to another during the year.
As of December 31, 2020 and 2019, the ECL allowances on loan commitments and financialguarantees are included in ‘Miscellaneous liabilities’ under ‘Other liabilities’ (Note 21).
The increase in the ECL allowances was driven by the adoption of supplemental SICR rules toaccount for the effect of the COVID-19 pandemic on the credit risk exposures, anticipatory creditdowngrades, adjustments to projected recovery rates resulting to increasing LGDs and significantlydepressed macroeconomic indicators.
The ECL allowance on accounts receivables of the Group and the Parent Company based on theiraging as of December 31, 2020 and 2019 follows:
Consolidated Parent CompanyAge of accounts receivables 2020 2019 2020 2019Up to 1 month P=218 P=563 P=99 P=62> 1 to 2 months 12 15 12 15> 2 to 3 months 4 9 4 7More than 3 months 2,943 2,558 2,436 2,495Total ECL P=3,177 P=3,145 P=2,551 P=2,579
- 100 -
*SGVFSM005911*
Below is the breakdown of provision for (reversal of) credit and impairment losses:
Consolidated Parent Company2020 2019 2018 2020 2019 2018
Financial assets and other credit-relatedexposures:
Loans and receivables P=40,751 P=9,627 P=7,676 P=32,741 P=1,645 P=748Investment securities at FVOCI (13) 11 94 ‒ ‒ 92Interbank loans receivable 13 (1) (17) 4 (1) (17)Due from other banks 7 – 4 ‒ ‒ –Investment securities at amortized
cost – – 49 ‒ ‒ 49Loan commitments and financial
guarantees – 1 (65) ‒ ‒ (65)40,758 9,638 7,741 32,745 1,644 807
Non-financial assets:Investment properties (3) – 27 ‒ ‒ –Investments in associates and a
joint venture – 439 ‒ ‒ ‒ –Other assets 5 1 2 ‒ ‒ –
2 440 29 ‒ ‒ ‒P=40,760 P=10,078 P=7,770 P=32,745 P=1,644 P=807
With the foregoing level of allowance for credit and impairment losses, management believes that theGroup has sufficient allowance to take care of any losses that the Group may incur from the non-collection or non-realization of its receivables and other risk assets.
16. Deposit Liabilities
The LTNCDs of the Group and the Parent Company consist of the following:
BSP Approval Interest Rate Issue Date Maturity Date 2020 2019Parent Company
September 18, 2014 4.00% October 24,2014 April 24, 2020 P=‒ P=8,000September 18, 2014 4.25% November 21, 2014 November 21, 2021 6,250 6,250August 12, 2016 3.50% September 19, 2016 September 19, 2023 8,650 8,650August 12, 2016 3.88% July 20, 2017 July 20, 2024 3,750 3,750July 19, 2018 5.38% October 4, 2018 April 4, 2024 8,680 8,680
27,330 35,330PSBank
December 8, 2016 3.50% January 30, 2017 April 30, 2022 3,369 3,363July 13, 2018 5.00% August 9, 2018 February 9, 2024 5,056 5,047
8,425 8,410P=35,755 P=43,740
On September 18, 2019, the BOD of the Parent Company approved the issuance of PHP LTNCDs ofup to P=25.0 billion in one or more tranches of at least P=2.0 billion per tranche, and tenors of 5.5 yearsup to 10 years, subject to market conditions. On January 10, 2020, the BSP approved the ParentCompany’s application to issue up to P=25.0 billion LTNCD over a period of one year from BSPapproval.
As of December 31, 2020 and 2019, 18.59% and 34.25%, respectively, of the total interest-bearingdeposit liabilities of the Group and 14.47% and 31.94%, respectively, of the total interest-bearingdeposit liabilities of the Parent Company are subject to periodic interest repricing. In 2020, 2019 and2018 the remaining peso deposit liabilities (excluding LTNCDs above) earn annual fixed interestrates ranging from 0.00% to 6.59%, while the remaining foreign currency-denominated depositliabilities of the Parent Company earn annual fixed interest rates ranging from 0.00% to 2.50%, from0.00% to 3.00%, and from 0.00% to 2.50%, respectively.
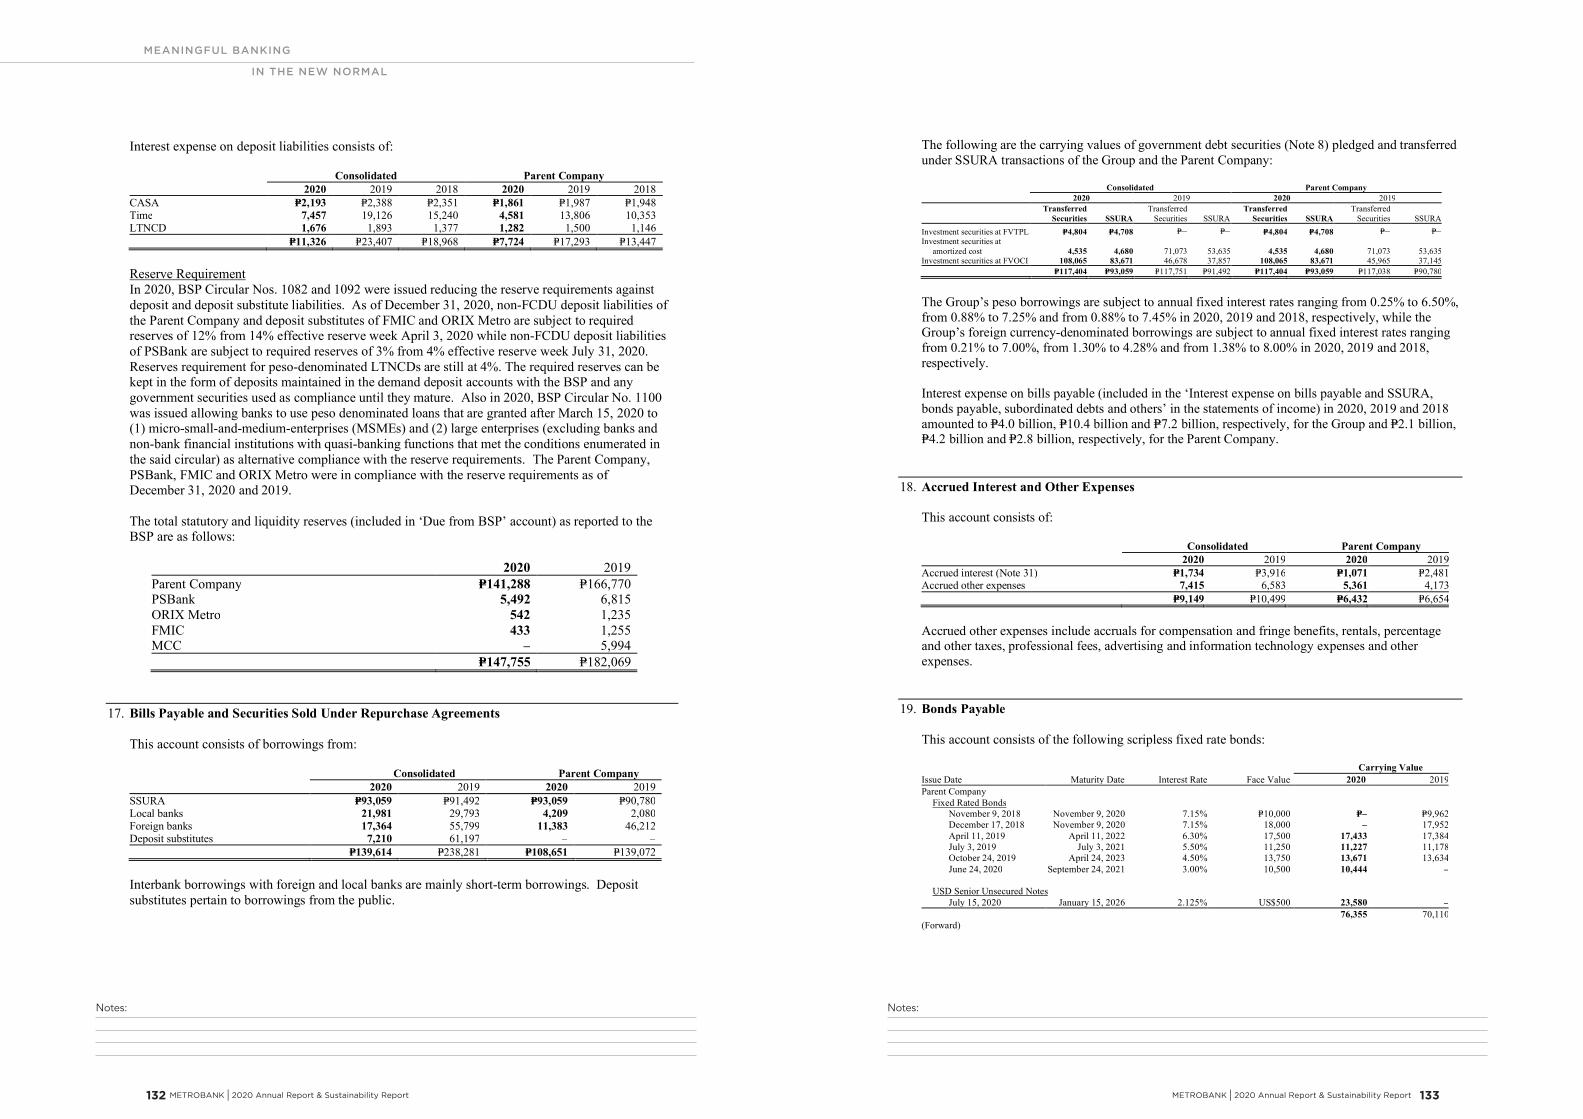
Notes:Notes:
MEANINGFUL BANKING
IN THE NEW NORMAL
METROBANK I 2020 Annual Report & Sustainability Report 133 132 METROBANK I 2020 Annual Report & Sustainability Report
- 101 -
*SGVFSM005911*
Interest expense on deposit liabilities consists of:
Consolidated Parent Company2020 2019 2018 2020 2019 2018
CASA P=2,193 P=2,388 P=2,351 P=1,861 P=1,987 P=1,948Time 7,457 19,126 15,240 4,581 13,806 10,353LTNCD 1,676 1,893 1,377 1,282 1,500 1,146
P=11,326 P=23,407 P=18,968 P=7,724 P=17,293 P=13,447
Reserve RequirementIn 2020, BSP Circular Nos. 1082 and 1092 were issued reducing the reserve requirements againstdeposit and deposit substitute liabilities. As of December 31, 2020, non-FCDU deposit liabilities ofthe Parent Company and deposit substitutes of FMIC and ORIX Metro are subject to requiredreserves of 12% from 14% effective reserve week April 3, 2020 while non-FCDU deposit liabilitiesof PSBank are subject to required reserves of 3% from 4% effective reserve week July 31, 2020.Reserves requirement for peso-denominated LTNCDs are still at 4%. The required reserves can bekept in the form of deposits maintained in the demand deposit accounts with the BSP and anygovernment securities used as compliance until they mature. Also in 2020, BSP Circular No. 1100was issued allowing banks to use peso denominated loans that are granted after March 15, 2020 to(1) micro-small-and-medium-enterprises (MSMEs) and (2) large enterprises (excluding banks andnon-bank financial institutions with quasi-banking functions that met the conditions enumerated inthe said circular) as alternative compliance with the reserve requirements. The Parent Company,PSBank, FMIC and ORIX Metro were in compliance with the reserve requirements as ofDecember 31, 2020 and 2019.
The total statutory and liquidity reserves (included in ‘Due from BSP’ account) as reported to theBSP are as follows:
2020 2019Parent Company P=141,288 P=166,770PSBank 5,492 6,815ORIX Metro 542 1,235FMIC 433 1,255MCC – 5,994
P=147,755 P=182,069
17. Bills Payable and Securities Sold Under Repurchase Agreements
This account consists of borrowings from:
Consolidated Parent Company2020 2019 2020 2019
SSURA P=93,059 P=91,492 P=93,059 P=90,780Local banks 21,981 29,793 4,209 2,080Foreign banks 17,364 55,799 11,383 46,212Deposit substitutes 7,210 61,197 ‒ ‒
P=139,614 P=238,281 P=108,651 P=139,072
Interbank borrowings with foreign and local banks are mainly short-term borrowings. Depositsubstitutes pertain to borrowings from the public.
- 102 -
*SGVFSM005911*
The following are the carrying values of government debt securities (Note 8) pledged and transferredunder SSURA transactions of the Group and the Parent Company:
Consolidated Parent Company2020 2019 2020 2019
TransferredSecurities SSURA
TransferredSecurities SSURA
TransferredSecurities SSURA
TransferredSecurities SSURA
Investment securities at FVTPL P=4,804 P=4,708 P=‒ P=‒ P=4,804 P=4,708 P=‒ P=‒Investment securities at
amortized cost 4,535 4,680 71,073 53,635 4,535 4,680 71,073 53,635Investment securities at FVOCI 108,065 83,671 46,678 37,857 108,065 83,671 45,965 37,145
P=117,404 P=93,059 P=117,751 P=91,492 P=117,404 P=93,059 P=117,038 P=90,780
The Group’s peso borrowings are subject to annual fixed interest rates ranging from 0.25% to 6.50%,from 0.88% to 7.25% and from 0.88% to 7.45% in 2020, 2019 and 2018, respectively, while theGroup’s foreign currency-denominated borrowings are subject to annual fixed interest rates rangingfrom 0.21% to 7.00%, from 1.30% to 4.28% and from 1.38% to 8.00% in 2020, 2019 and 2018,respectively.
Interest expense on bills payable (included in the ‘Interest expense on bills payable and SSURA,bonds payable, subordinated debts and others’ in the statements of income) in 2020, 2019 and 2018amounted to P=4.0 billion, P=10.4 billion and P=7.2 billion, respectively, for the Group and P=2.1 billion,P=4.2 billion and P=2.8 billion, respectively, for the Parent Company.
18. Accrued Interest and Other Expenses
This account consists of:
Consolidated Parent Company2020 2019 2020 2019
Accrued interest (Note 31) P=1,734 P=3,916 P=1,071 P=2,481Accrued other expenses 7,415 6,583 5,361 4,173
P=9,149 P=10,499 P=6,432 P=6,654
Accrued other expenses include accruals for compensation and fringe benefits, rentals, percentageand other taxes, professional fees, advertising and information technology expenses and otherexpenses.
19. Bonds Payable
This account consists of the following scripless fixed rate bonds:
Carrying ValueIssue Date Maturity Date Interest Rate Face Value 2020 2019Parent Company
Fixed Rated BondsNovember 9, 2018 November 9, 2020 7.15% P=10,000 P=‒ P=9,962December 17, 2018 November 9, 2020 7.15% 18,000 ‒ 17,952April 11, 2019 April 11, 2022 6.30% 17,500 17,433 17,384July 3, 2019 July 3, 2021 5.50% 11,250 11,227 11,178October 24, 2019 April 24, 2023 4.50% 13,750 13,671 13,634June 24, 2020 September 24, 2021 3.00% 10,500 10,444 ‒
USD Senior Unsecured NotesJuly 15, 2020 January 15, 2026 2.125% US$500 23,580 ‒
76,355 70,110(Forward)
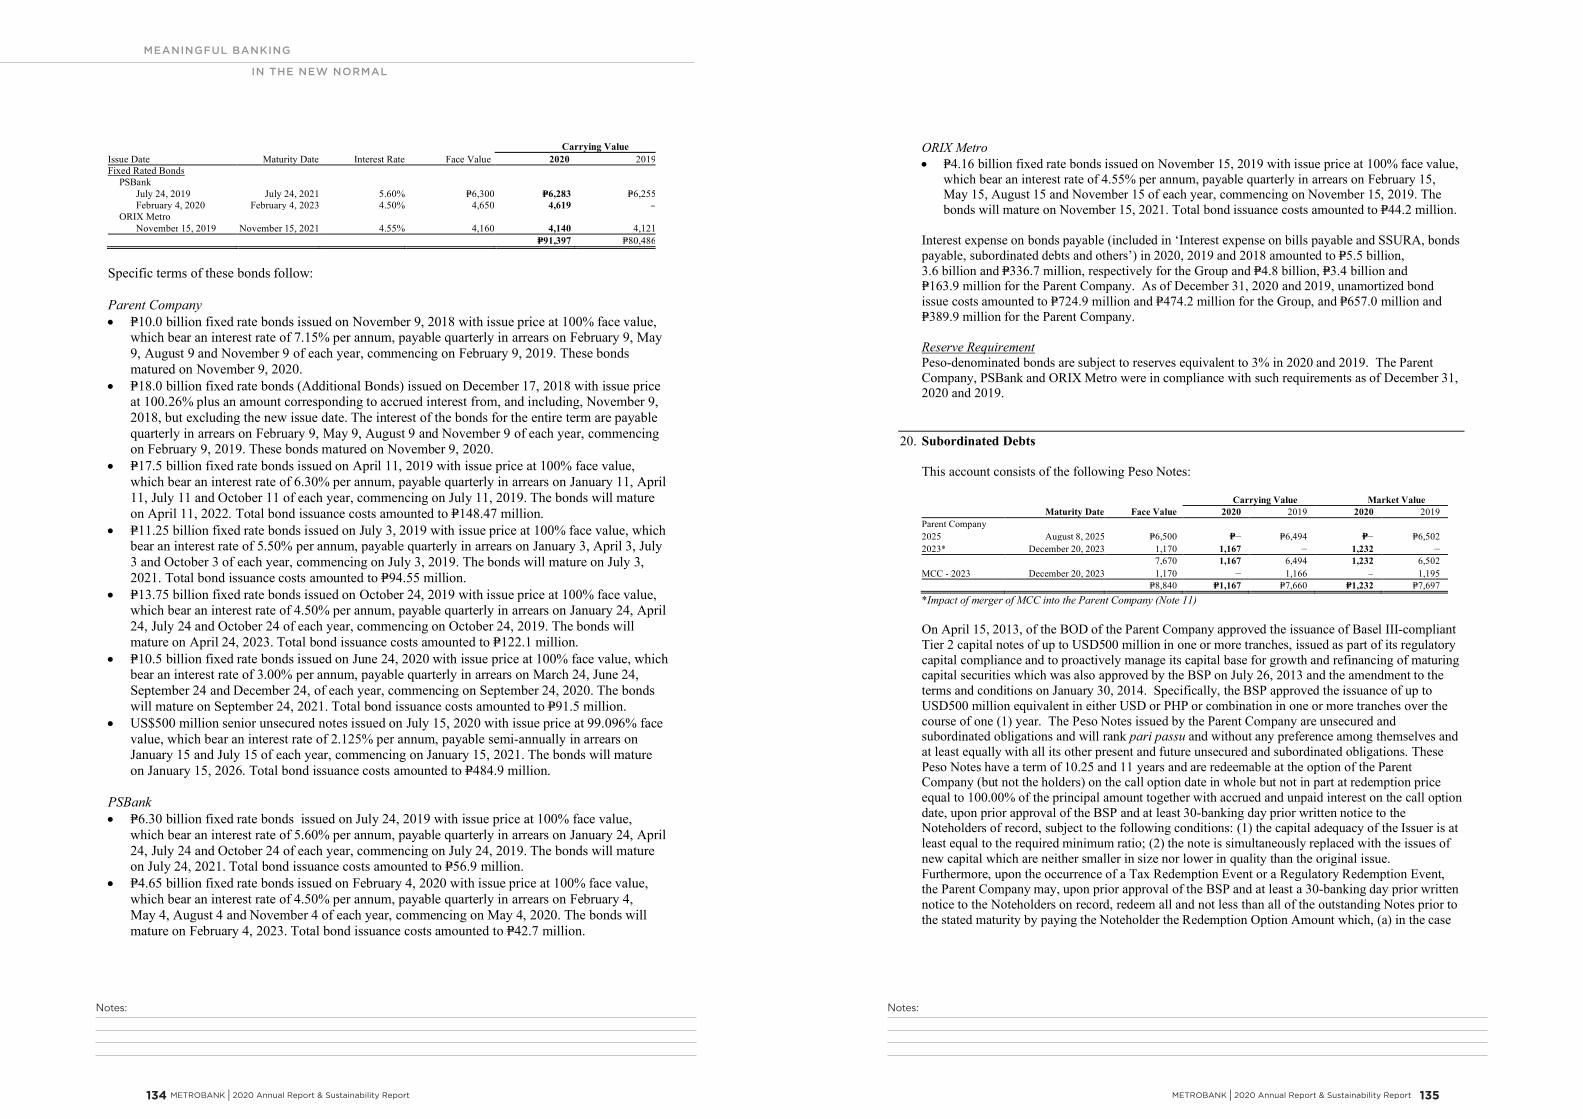
Notes:Notes:
MEANINGFUL BANKING
IN THE NEW NORMAL
METROBANK I 2020 Annual Report & Sustainability Report 135 134 METROBANK I 2020 Annual Report & Sustainability Report
- 103 -
*SGVFSM005911*
Carrying ValueIssue Date Maturity Date Interest Rate Face Value 2020 2019Fixed Rated Bonds
PSBankJuly 24, 2019 July 24, 2021 5.60% P=6,300 P=6,283 P=6,255February 4, 2020 February 4, 2023 4.50% 4,650 4,619 ‒
ORIX MetroNovember 15, 2019 November 15, 2021 4.55% 4,160 4,140 4,121
P=91,397 P=80,486
Specific terms of these bonds follow:
Parent Company P=10.0 billion fixed rate bonds issued on November 9, 2018 with issue price at 100% face value,
which bear an interest rate of 7.15% per annum, payable quarterly in arrears on February 9, May9, August 9 and November 9 of each year, commencing on February 9, 2019. These bondsmatured on November 9, 2020.
P=18.0 billion fixed rate bonds (Additional Bonds) issued on December 17, 2018 with issue priceat 100.26% plus an amount corresponding to accrued interest from, and including, November 9,2018, but excluding the new issue date. The interest of the bonds for the entire term are payablequarterly in arrears on February 9, May 9, August 9 and November 9 of each year, commencingon February 9, 2019. These bonds matured on November 9, 2020.
P=17.5 billion fixed rate bonds issued on April 11, 2019 with issue price at 100% face value,which bear an interest rate of 6.30% per annum, payable quarterly in arrears on January 11, April11, July 11 and October 11 of each year, commencing on July 11, 2019. The bonds will matureon April 11, 2022. Total bond issuance costs amounted to P=148.47 million.
P=11.25 billion fixed rate bonds issued on July 3, 2019 with issue price at 100% face value, whichbear an interest rate of 5.50% per annum, payable quarterly in arrears on January 3, April 3, July3 and October 3 of each year, commencing on July 3, 2019. The bonds will mature on July 3,2021. Total bond issuance costs amounted to P=94.55 million.
P=13.75 billion fixed rate bonds issued on October 24, 2019 with issue price at 100% face value,which bear an interest rate of 4.50% per annum, payable quarterly in arrears on January 24, April24, July 24 and October 24 of each year, commencing on October 24, 2019. The bonds willmature on April 24, 2023. Total bond issuance costs amounted to P=122.1 million.
P=10.5 billion fixed rate bonds issued on June 24, 2020 with issue price at 100% face value, whichbear an interest rate of 3.00% per annum, payable quarterly in arrears on March 24, June 24,September 24 and December 24, of each year, commencing on September 24, 2020. The bondswill mature on September 24, 2021. Total bond issuance costs amounted to P=91.5 million.
US$500 million senior unsecured notes issued on July 15, 2020 with issue price at 99.096% facevalue, which bear an interest rate of 2.125% per annum, payable semi-annually in arrears onJanuary 15 and July 15 of each year, commencing on January 15, 2021. The bonds will matureon January 15, 2026. Total bond issuance costs amounted to P=484.9 million.
PSBank P=6.30 billion fixed rate bonds issued on July 24, 2019 with issue price at 100% face value,
which bear an interest rate of 5.60% per annum, payable quarterly in arrears on January 24, April24, July 24 and October 24 of each year, commencing on July 24, 2019. The bonds will matureon July 24, 2021. Total bond issuance costs amounted to P=56.9 million.
P=4.65 billion fixed rate bonds issued on February 4, 2020 with issue price at 100% face value,which bear an interest rate of 4.50% per annum, payable quarterly in arrears on February 4,May 4, August 4 and November 4 of each year, commencing on May 4, 2020. The bonds willmature on February 4, 2023. Total bond issuance costs amounted to P=42.7 million.
- 104 -
*SGVFSM005911*
ORIX Metro P=4.16 billion fixed rate bonds issued on November 15, 2019 with issue price at 100% face value,
which bear an interest rate of 4.55% per annum, payable quarterly in arrears on February 15,May 15, August 15 and November 15 of each year, commencing on November 15, 2019. Thebonds will mature on November 15, 2021. Total bond issuance costs amounted to P=44.2 million.
Interest expense on bonds payable (included in ‘Interest expense on bills payable and SSURA, bondspayable, subordinated debts and others’) in 2020, 2019 and 2018 amounted to P=5.5 billion,3.6 billion and P=336.7 million, respectively for the Group and P=4.8 billion, P=3.4 billion andP=163.9 million for the Parent Company. As of December 31, 2020 and 2019, unamortized bondissue costs amounted to P=724.9 million and P=474.2 million for the Group, and P=657.0 million andP=389.9 million for the Parent Company.
Reserve RequirementPeso-denominated bonds are subject to reserves equivalent to 3% in 2020 and 2019. The ParentCompany, PSBank and ORIX Metro were in compliance with such requirements as of December 31,2020 and 2019.
20. Subordinated Debts
This account consists of the following Peso Notes:
Carrying Value Market ValueMaturity Date Face Value 2020 2019 2020 2019
Parent Company2025 August 8, 2025 P=6,500 P=‒ P=6,494 P=‒ P=6,5022023* December 20, 2023 1,170 1,167 ‒ 1,232 ‒
7,670 1,167 6,494 1,232 6,502MCC - 2023 December 20, 2023 1,170 ‒ 1,166 ‒ 1,195
P=8,840 P=1,167 P=7,660 P=1,232 P=7,697 *Impact of merger of MCC into the Parent Company (Note 11)
On April 15, 2013, of the BOD of the Parent Company approved the issuance of Basel III-compliantTier 2 capital notes of up to USD500 million in one or more tranches, issued as part of its regulatorycapital compliance and to proactively manage its capital base for growth and refinancing of maturingcapital securities which was also approved by the BSP on July 26, 2013 and the amendment to theterms and conditions on January 30, 2014. Specifically, the BSP approved the issuance of up toUSD500 million equivalent in either USD or PHP or combination in one or more tranches over thecourse of one (1) year. The Peso Notes issued by the Parent Company are unsecured andsubordinated obligations and will rank pari passu and without any preference among themselves andat least equally with all its other present and future unsecured and subordinated obligations. ThesePeso Notes have a term of 10.25 and 11 years and are redeemable at the option of the ParentCompany (but not the holders) on the call option date in whole but not in part at redemption priceequal to 100.00% of the principal amount together with accrued and unpaid interest on the call optiondate, upon prior approval of the BSP and at least 30-banking day prior written notice to theNoteholders of record, subject to the following conditions: (1) the capital adequacy of the Issuer is atleast equal to the required minimum ratio; (2) the note is simultaneously replaced with the issues ofnew capital which are neither smaller in size nor lower in quality than the original issue.Furthermore, upon the occurrence of a Tax Redemption Event or a Regulatory Redemption Event,the Parent Company may, upon prior approval of the BSP and at least a 30-banking day prior writtennotice to the Noteholders on record, redeem all and not less than all of the outstanding Notes prior tothe stated maturity by paying the Noteholder the Redemption Option Amount which, (a) in the case
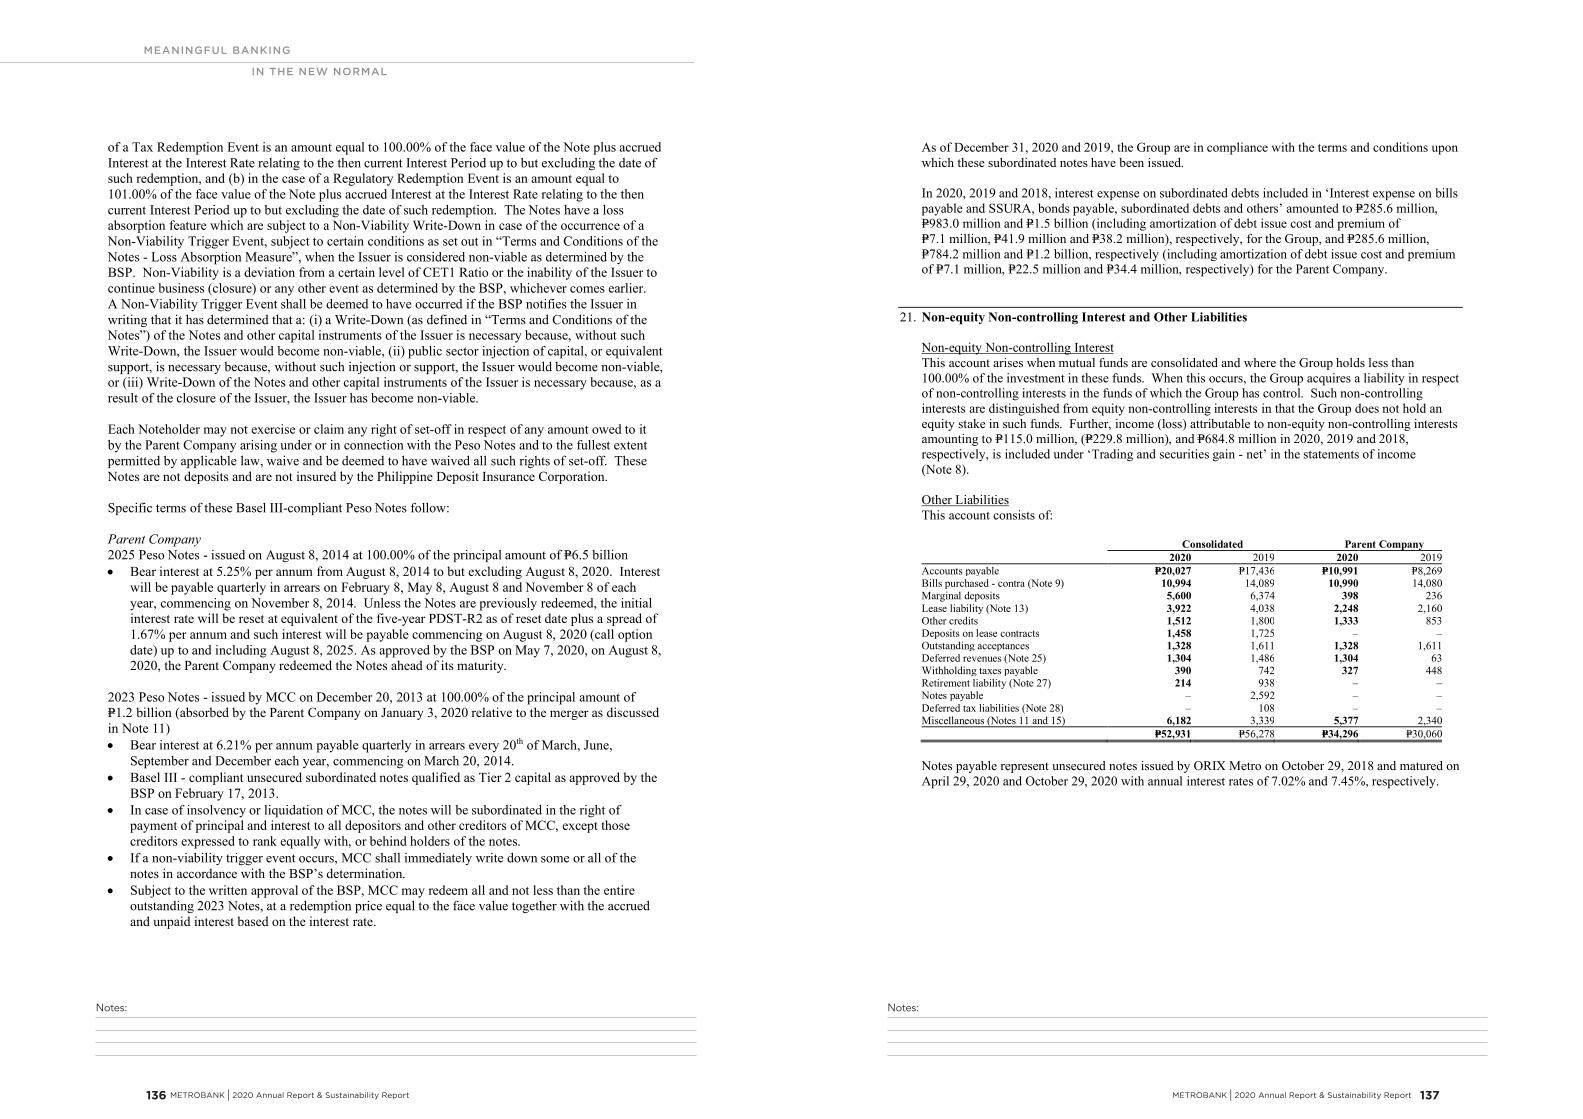
Notes:Notes:
MEANINGFUL BANKING
IN THE NEW NORMAL
METROBANK I 2020 Annual Report & Sustainability Report 137 136 METROBANK I 2020 Annual Report & Sustainability Report
- 105 -
*SGVFSM005911*
of a Tax Redemption Event is an amount equal to 100.00% of the face value of the Note plus accruedInterest at the Interest Rate relating to the then current Interest Period up to but excluding the date ofsuch redemption, and (b) in the case of a Regulatory Redemption Event is an amount equal to101.00% of the face value of the Note plus accrued Interest at the Interest Rate relating to the thencurrent Interest Period up to but excluding the date of such redemption. The Notes have a lossabsorption feature which are subject to a Non-Viability Write-Down in case of the occurrence of aNon-Viability Trigger Event, subject to certain conditions as set out in “Terms and Conditions of theNotes - Loss Absorption Measure”, when the Issuer is considered non-viable as determined by theBSP. Non-Viability is a deviation from a certain level of CET1 Ratio or the inability of the Issuer tocontinue business (closure) or any other event as determined by the BSP, whichever comes earlier.A Non-Viability Trigger Event shall be deemed to have occurred if the BSP notifies the Issuer inwriting that it has determined that a: (i) a Write-Down (as defined in “Terms and Conditions of theNotes”) of the Notes and other capital instruments of the Issuer is necessary because, without suchWrite-Down, the Issuer would become non-viable, (ii) public sector injection of capital, or equivalentsupport, is necessary because, without such injection or support, the Issuer would become non-viable,or (iii) Write-Down of the Notes and other capital instruments of the Issuer is necessary because, as aresult of the closure of the Issuer, the Issuer has become non-viable.
Each Noteholder may not exercise or claim any right of set-off in respect of any amount owed to itby the Parent Company arising under or in connection with the Peso Notes and to the fullest extentpermitted by applicable law, waive and be deemed to have waived all such rights of set-off. TheseNotes are not deposits and are not insured by the Philippine Deposit Insurance Corporation.
Specific terms of these Basel III-compliant Peso Notes follow:
Parent Company2025 Peso Notes - issued on August 8, 2014 at 100.00% of the principal amount of P=6.5 billion Bear interest at 5.25% per annum from August 8, 2014 to but excluding August 8, 2020. Interest
will be payable quarterly in arrears on February 8, May 8, August 8 and November 8 of eachyear, commencing on November 8, 2014. Unless the Notes are previously redeemed, the initialinterest rate will be reset at equivalent of the five-year PDST-R2 as of reset date plus a spread of1.67% per annum and such interest will be payable commencing on August 8, 2020 (call optiondate) up to and including August 8, 2025. As approved by the BSP on May 7, 2020, on August 8,2020, the Parent Company redeemed the Notes ahead of its maturity.
2023 Peso Notes - issued by MCC on December 20, 2013 at 100.00% of the principal amount ofP=1.2 billion (absorbed by the Parent Company on January 3, 2020 relative to the merger as discussedin Note 11) Bear interest at 6.21% per annum payable quarterly in arrears every 20th of March, June,
September and December each year, commencing on March 20, 2014. Basel III - compliant unsecured subordinated notes qualified as Tier 2 capital as approved by the
BSP on February 17, 2013. In case of insolvency or liquidation of MCC, the notes will be subordinated in the right of
payment of principal and interest to all depositors and other creditors of MCC, except thosecreditors expressed to rank equally with, or behind holders of the notes.
If a non-viability trigger event occurs, MCC shall immediately write down some or all of thenotes in accordance with the BSP’s determination.
Subject to the written approval of the BSP, MCC may redeem all and not less than the entireoutstanding 2023 Notes, at a redemption price equal to the face value together with the accruedand unpaid interest based on the interest rate.
- 106 -
*SGVFSM005911*
As of December 31, 2020 and 2019, the Group are in compliance with the terms and conditions uponwhich these subordinated notes have been issued.
In 2020, 2019 and 2018, interest expense on subordinated debts included in ‘Interest expense on billspayable and SSURA, bonds payable, subordinated debts and others’ amounted to P=285.6 million,P=983.0 million and P=1.5 billion (including amortization of debt issue cost and premium ofP=7.1 million, P=41.9 million and P=38.2 million), respectively, for the Group, and P=285.6 million,P=784.2 million and P=1.2 billion, respectively (including amortization of debt issue cost and premiumof P=7.1 million, P=22.5 million and P=34.4 million, respectively) for the Parent Company.
21. Non-equity Non-controlling Interest and Other Liabilities
Non-equity Non-controlling InterestThis account arises when mutual funds are consolidated and where the Group holds less than100.00% of the investment in these funds. When this occurs, the Group acquires a liability in respectof non-controlling interests in the funds of which the Group has control. Such non-controllinginterests are distinguished from equity non-controlling interests in that the Group does not hold anequity stake in such funds. Further, income (loss) attributable to non-equity non-controlling interestsamounting to P=115.0 million, (P=229.8 million), and P=684.8 million in 2020, 2019 and 2018,respectively, is included under ‘Trading and securities gain - net’ in the statements of income(Note 8).
Other LiabilitiesThis account consists of:
Consolidated Parent Company2020 2019 2020 2019
Accounts payable P=20,027 P=17,436 P=10,991 P=8,269Bills purchased - contra (Note 9) 10,994 14,089 10,990 14,080Marginal deposits 5,600 6,374 398 236Lease liability (Note 13) 3,922 4,038 2,248 2,160Other credits 1,512 1,800 1,333 853Deposits on lease contracts 1,458 1,725 ‒ ‒Outstanding acceptances 1,328 1,611 1,328 1,611Deferred revenues (Note 25) 1,304 1,486 1,304 63Withholding taxes payable 390 742 327 448Retirement liability (Note 27) 214 938 ‒ ‒Notes payable ‒ 2,592 ‒ ‒Deferred tax liabilities (Note 28) ‒ 108 ‒ ‒Miscellaneous (Notes 11 and 15) 6,182 3,339 5,377 2,340
P=52,931 P=56,278 P=34,296 P=30,060
Notes payable represent unsecured notes issued by ORIX Metro on October 29, 2018 and matured onApril 29, 2020 and October 29, 2020 with annual interest rates of 7.02% and 7.45%, respectively.
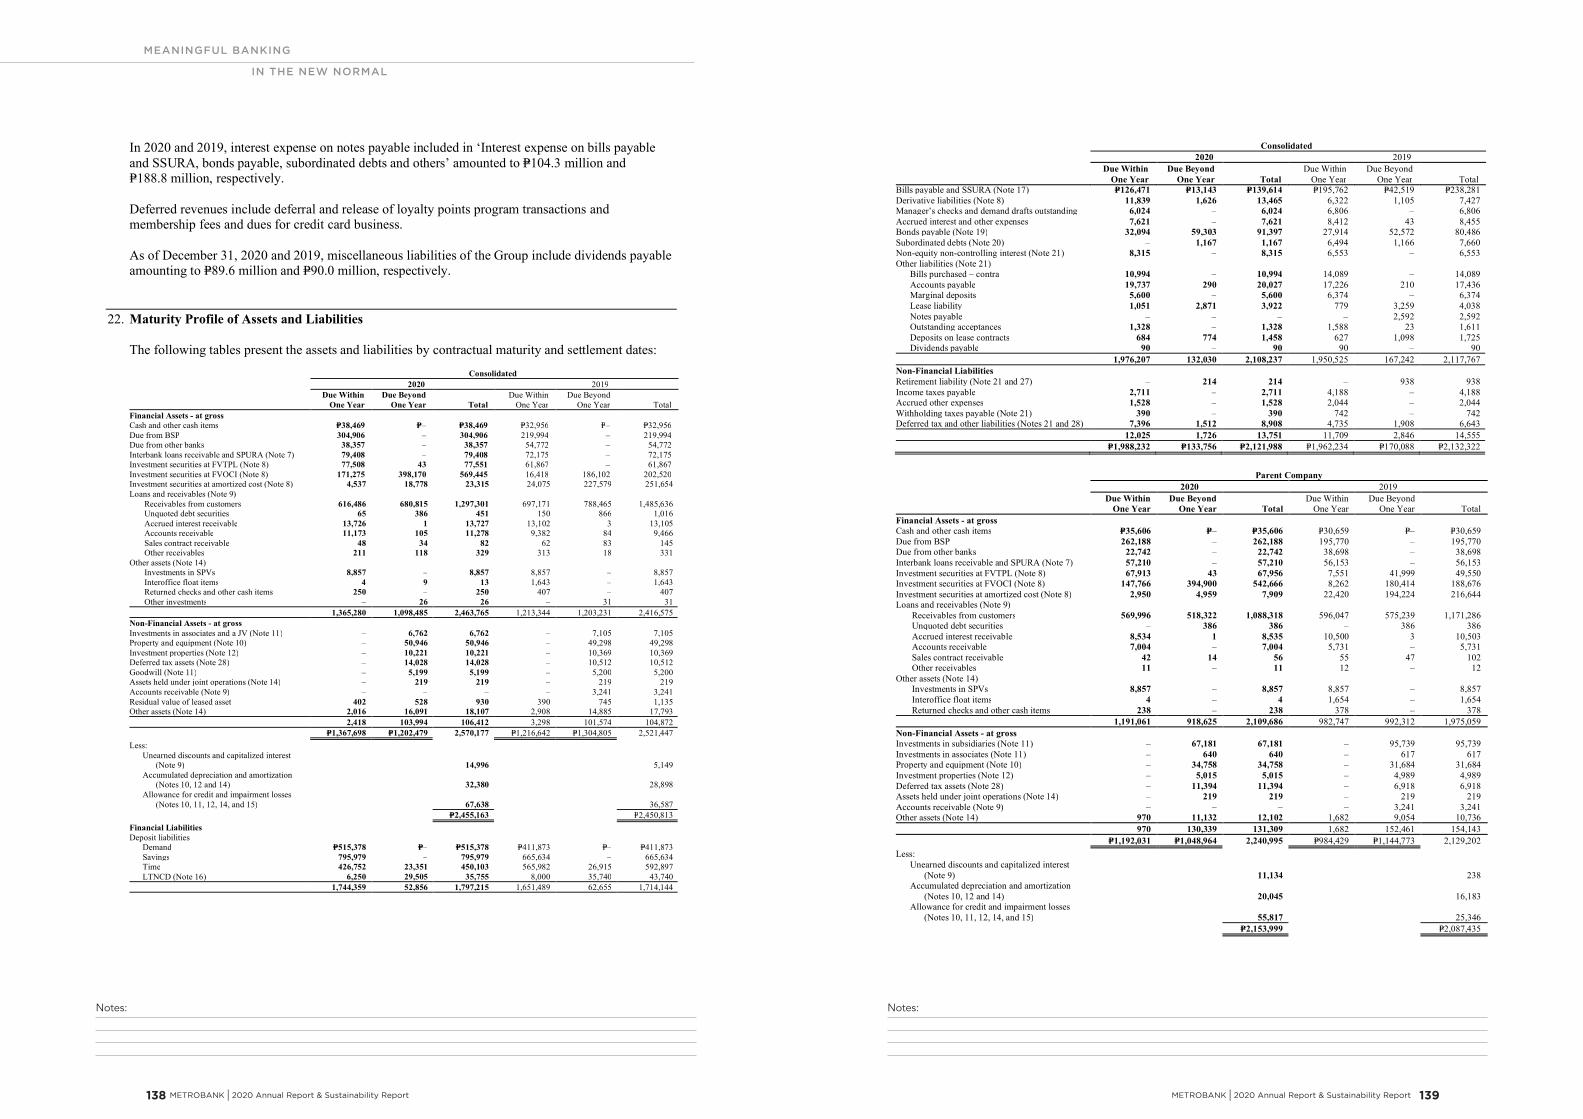
Notes:Notes:
MEANINGFUL BANKING
IN THE NEW NORMAL
METROBANK I 2020 Annual Report & Sustainability Report 139 138 METROBANK I 2020 Annual Report & Sustainability Report
- 107 -
*SGVFSM005911*
In 2020 and 2019, interest expense on notes payable included in ‘Interest expense on bills payableand SSURA, bonds payable, subordinated debts and others’ amounted to P=104.3 million andP=188.8 million, respectively.
Deferred revenues include deferral and release of loyalty points program transactions andmembership fees and dues for credit card business.
As of December 31, 2020 and 2019, miscellaneous liabilities of the Group include dividends payableamounting to P=89.6 million and P=90.0 million, respectively.
22. Maturity Profile of Assets and Liabilities
The following tables present the assets and liabilities by contractual maturity and settlement dates:Consolidated
2020 2019Due Within
One YearDue Beyond
One Year TotalDue Within
One YearDue Beyond
One Year TotalFinancial Assets - at grossCash and other cash items P=38,469 P=– P=38,469 P=32,956 P=– P=32,956Due from BSP 304,906 – 304,906 219,994 – 219,994Due from other banks 38,357 – 38,357 54,772 – 54,772Interbank loans receivable and SPURA (Note 7) 79,408 – 79,408 72,175 – 72,175Investment securities at FVTPL (Note 8) 77,508 43 77,551 61,867 – 61,867Investment securities at FVOCI (Note 8) 171,275 398,170 569,445 16,418 186,102 202,520Investment securities at amortized cost (Note 8) 4,537 18,778 23,315 24,075 227,579 251,654Loans and receivables (Note 9)
Receivables from customers 616,486 680,815 1,297,301 697,171 788,465 1,485,636Unquoted debt securities 65 386 451 150 866 1,016Accrued interest receivable 13,726 1 13,727 13,102 3 13,105Accounts receivable 11,173 105 11,278 9,382 84 9,466Sales contract receivable 48 34 82 62 83 145Other receivables 211 118 329 313 18 331
Other assets (Note 14)Investments in SPVs 8,857 – 8,857 8,857 – 8,857Interoffice float items 4 9 13 1,643 – 1,643Returned checks and other cash items 250 – 250 407 – 407Other investments – 26 26 – 31 31
1,365,280 1,098,485 2,463,765 1,213,344 1,203,231 2,416,575Non-Financial Assets - at grossInvestments in associates and a JV (Note 11) – 6,762 6,762 – 7,105 7,105Property and equipment (Note 10) – 50,946 50,946 – 49,298 49,298Investment properties (Note 12) – 10,221 10,221 – 10,369 10,369Deferred tax assets (Note 28) – 14,028 14,028 – 10,512 10,512Goodwill (Note 11) – 5,199 5,199 – 5,200 5,200Assets held under joint operations (Note 14) – 219 219 – 219 219Accounts receivable (Note 9) – – – – 3,241 3,241Residual value of leased asset 402 528 930 390 745 1,135Other assets (Note 14) 2,016 16,091 18,107 2,908 14,885 17,793
2,418 103,994 106,412 3,298 101,574 104,872P=1,367,698 P=1,202,479 2,570,177 P=1,216,642 P=1,304,805 2,521,447
Less: Unearned discounts and capitalized interest
(Note 9) 14,996 5,149 Accumulated depreciation and amortization
(Notes 10, 12 and 14) 32,380 28,898 Allowance for credit and impairment losses
(Notes 10, 11, 12, 14, and 15) 67,638 36,587P=2,455,163 P=2,450,813
Financial LiabilitiesDeposit liabilities
Demand P=515,378 P=– P=515,378 P=411,873 P=– P=411,873Savings 795,979 – 795,979 665,634 – 665,634Time 426,752 23,351 450,103 565,982 26,915 592,897LTNCD (Note 16) 6,250 29,505 35,755 8,000 35,740 43,740
1,744,359 52,856 1,797,215 1,651,489 62,655 1,714,144
- 108 -
*SGVFSM005911*
Consolidated2020 2019
Due WithinOne Year
Due BeyondOne Year Total
Due WithinOne Year
Due BeyondOne Year Total
Bills payable and SSURA (Note 17) P=126,471 P=13,143 P=139,614 P=195,762 P=42,519 P=238,281Derivative liabilities (Note 8) 11,839 1,626 13,465 6,322 1,105 7,427Manager’s checks and demand drafts outstanding 6,024 – 6,024 6,806 – 6,806Accrued interest and other expenses 7,621 – 7,621 8,412 43 8,455Bonds payable (Note 19) 32,094 59,303 91,397 27,914 52,572 80,486Subordinated debts (Note 20) – 1,167 1,167 6,494 1,166 7,660Non-equity non-controlling interest (Note 21) 8,315 – 8,315 6,553 – 6,553Other liabilities (Note 21)
Bills purchased – contra 10,994 – 10,994 14,089 – 14,089Accounts payable 19,737 290 20,027 17,226 210 17,436Marginal deposits 5,600 – 5,600 6,374 – 6,374Lease liability 1,051 2,871 3,922 779 3,259 4,038Notes payable – – – – 2,592 2,592Outstanding acceptances 1,328 – 1,328 1,588 23 1,611Deposits on lease contracts 684 774 1,458 627 1,098 1,725Dividends payable 90 – 90 90 – 90
1,976,207 132,030 2,108,237 1,950,525 167,242 2,117,767Non-Financial LiabilitiesRetirement liability (Note 21 and 27) – 214 214 – 938 938Income taxes payable 2,711 – 2,711 4,188 – 4,188Accrued other expenses 1,528 – 1,528 2,044 – 2,044Withholding taxes payable (Note 21) 390 – 390 742 – 742Deferred tax and other liabilities (Notes 21 and 28) 7,396 1,512 8,908 4,735 1,908 6,643
12,025 1,726 13,751 11,709 2,846 14,555P=1,988,232 P=133,756 P=2,121,988 P=1,962,234 P=170,088 P=2,132,322
Parent Company2020 2019
Due Within Due Beyond Due Within Due BeyondOne Year One Year Total One Year One Year Total
Financial Assets - at grossCash and other cash items P=35,606 P=– P=35,606 P=30,659 P=– P=30,659Due from BSP 262,188 – 262,188 195,770 – 195,770Due from other banks 22,742 – 22,742 38,698 – 38,698Interbank loans receivable and SPURA (Note 7) 57,210 – 57,210 56,153 – 56,153Investment securities at FVTPL (Note 8) 67,913 43 67,956 7,551 41,999 49,550Investment securities at FVOCI (Note 8) 147,766 394,900 542,666 8,262 180,414 188,676Investment securities at amortized cost (Note 8) 2,950 4,959 7,909 22,420 194,224 216,644Loans and receivables (Note 9)
Receivables from customers 569,996 518,322 1,088,318 596,047 575,239 1,171,286Unquoted debt securities – 386 386 – 386 386Accrued interest receivable 8,534 1 8,535 10,500 3 10,503Accounts receivable 7,004 – 7,004 5,731 – 5,731Sales contract receivable 42 14 56 55 47 102Other receivables 11 – 11 12 – 12
Other assets (Note 14)Investments in SPVs 8,857 – 8,857 8,857 – 8,857Interoffice float items 4 – 4 1,654 – 1,654Returned checks and other cash items 238 – 238 378 – 378
1,191,061 918,625 2,109,686 982,747 992,312 1,975,059Non-Financial Assets - at grossInvestments in subsidiaries (Note 11) – 67,181 67,181 – 95,739 95,739Investments in associates (Note 11) – 640 640 – 617 617Property and equipment (Note 10) – 34,758 34,758 – 31,684 31,684Investment properties (Note 12) – 5,015 5,015 – 4,989 4,989Deferred tax assets (Note 28) – 11,394 11,394 – 6,918 6,918Assets held under joint operations (Note 14) – 219 219 – 219 219Accounts receivable (Note 9) – – – – 3,241 3,241Other assets (Note 14) 970 11,132 12,102 1,682 9,054 10,736
970 130,339 131,309 1,682 152,461 154,143P=1,192,031 P=1,048,964 2,240,995 P=984,429 P=1,144,773 2,129,202
Less: Unearned discounts and capitalized interest
(Note 9) 11,134 238 Accumulated depreciation and amortization
(Notes 10, 12 and 14) 20,045 16,183 Allowance for credit and impairment losses
(Notes 10, 11, 12, 14, and 15) 55,817 25,346P=2,153,999 P=2,087,435
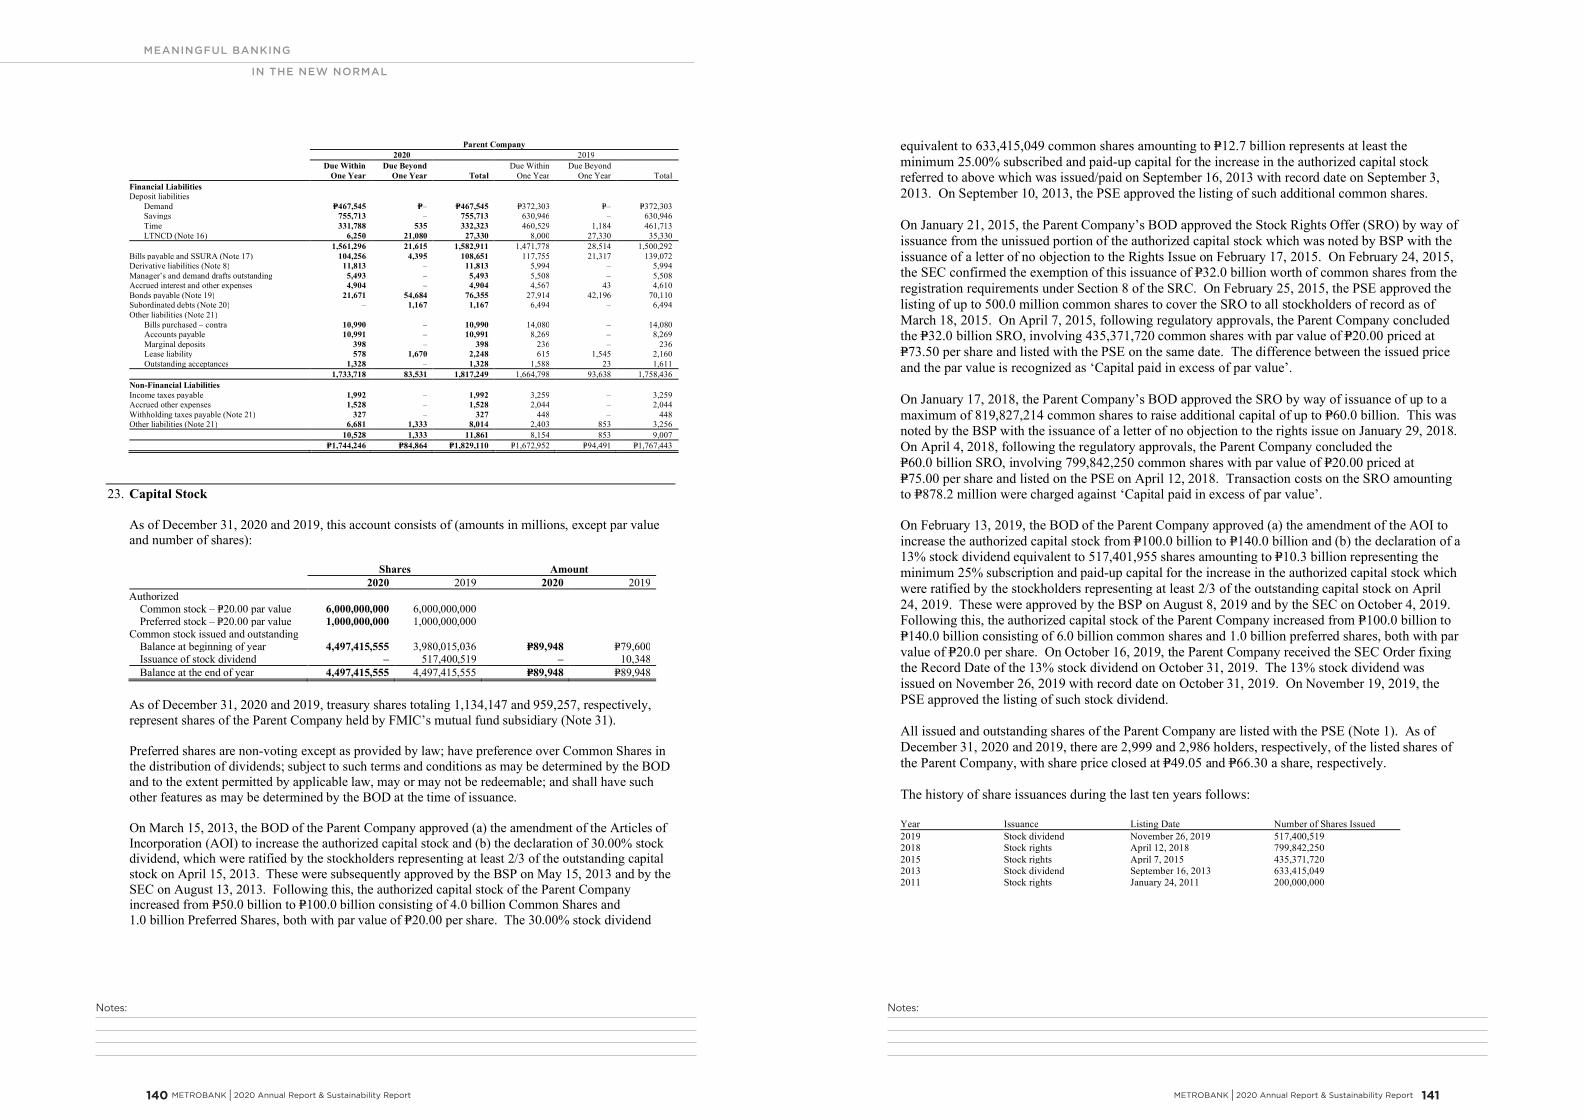
Notes:Notes:
MEANINGFUL BANKING
IN THE NEW NORMAL
METROBANK I 2020 Annual Report & Sustainability Report 141 140 METROBANK I 2020 Annual Report & Sustainability Report
- 109 -
*SGVFSM005911*
Parent Company2020 2019
Due Within Due Beyond Due Within Due BeyondOne Year One Year Total One Year One Year Total
Financial LiabilitiesDeposit liabilities
Demand P=467,545 P=– P=467,545 P=372,303 P=– P=372,303Savings 755,713 – 755,713 630,946 – 630,946Time 331,788 535 332,323 460,529 1,184 461,713LTNCD (Note 16) 6,250 21,080 27,330 8,000 27,330 35,330
1,561,296 21,615 1,582,911 1,471,778 28,514 1,500,292Bills payable and SSURA (Note 17) 104,256 4,395 108,651 117,755 21,317 139,072Derivative liabilities (Note 8) 11,813 – 11,813 5,994 – 5,994Manager’s and demand drafts outstanding 5,493 – 5,493 5,508 – 5,508Accrued interest and other expenses 4,904 – 4,904 4,567 43 4,610Bonds payable (Note 19) 21,671 54,684 76,355 27,914 42,196 70,110Subordinated debts (Note 20) – 1,167 1,167 6,494 – 6,494Other liabilities (Note 21)
Bills purchased – contra 10,990 – 10,990 14,080 – 14,080Accounts payable 10,991 – 10,991 8,269 – 8,269Marginal deposits 398 – 398 236 – 236Lease liability 578 1,670 2,248 615 1,545 2,160Outstanding acceptances 1,328 – 1,328 1,588 23 1,611
1,733,718 83,531 1,817,249 1,664,798 93,638 1,758,436Non-Financial LiabilitiesIncome taxes payable 1,992 – 1,992 3,259 – 3,259Accrued other expenses 1,528 – 1,528 2,044 – 2,044Withholding taxes payable (Note 21) 327 – 327 448 – 448Other liabilities (Note 21) 6,681 1,333 8,014 2,403 853 3,256
10,528 1,333 11,861 8,154 853 9,007P=1,744,246 P=84,864 P=1,829,110 P=1,672,952 P=94,491 P=1,767,443
23. Capital Stock
As of December 31, 2020 and 2019, this account consists of (amounts in millions, except par valueand number of shares):
Shares Amount2020 2019 2020 2019
AuthorizedCommon stock – P=20.00 par value 6,000,000,000 6,000,000,000Preferred stock – P=20.00 par value 1,000,000,000 1,000,000,000
Common stock issued and outstandingBalance at beginning of year 4,497,415,555 3,980,015,036 P=89,948 P=79,600Issuance of stock dividend – 517,400,519 – 10,348Balance at the end of year 4,497,415,555 4,497,415,555 P=89,948 P=89,948
As of December 31, 2020 and 2019, treasury shares totaling 1,134,147 and 959,257, respectively,represent shares of the Parent Company held by FMIC’s mutual fund subsidiary (Note 31).
Preferred shares are non-voting except as provided by law; have preference over Common Shares inthe distribution of dividends; subject to such terms and conditions as may be determined by the BODand to the extent permitted by applicable law, may or may not be redeemable; and shall have suchother features as may be determined by the BOD at the time of issuance.
On March 15, 2013, the BOD of the Parent Company approved (a) the amendment of the Articles ofIncorporation (AOI) to increase the authorized capital stock and (b) the declaration of 30.00% stockdividend, which were ratified by the stockholders representing at least 2/3 of the outstanding capitalstock on April 15, 2013. These were subsequently approved by the BSP on May 15, 2013 and by theSEC on August 13, 2013. Following this, the authorized capital stock of the Parent Companyincreased from P=50.0 billion to P=100.0 billion consisting of 4.0 billion Common Shares and1.0 billion Preferred Shares, both with par value of P=20.00 per share. The 30.00% stock dividend
- 110 -
*SGVFSM005911*
equivalent to 633,415,049 common shares amounting to P=12.7 billion represents at least theminimum 25.00% subscribed and paid-up capital for the increase in the authorized capital stockreferred to above which was issued/paid on September 16, 2013 with record date on September 3,2013. On September 10, 2013, the PSE approved the listing of such additional common shares.
On January 21, 2015, the Parent Company’s BOD approved the Stock Rights Offer (SRO) by way ofissuance from the unissued portion of the authorized capital stock which was noted by BSP with theissuance of a letter of no objection to the Rights Issue on February 17, 2015. On February 24, 2015,the SEC confirmed the exemption of this issuance of P=32.0 billion worth of common shares from theregistration requirements under Section 8 of the SRC. On February 25, 2015, the PSE approved thelisting of up to 500.0 million common shares to cover the SRO to all stockholders of record as ofMarch 18, 2015. On April 7, 2015, following regulatory approvals, the Parent Company concludedthe P=32.0 billion SRO, involving 435,371,720 common shares with par value of P=20.00 priced atP=73.50 per share and listed with the PSE on the same date. The difference between the issued priceand the par value is recognized as ‘Capital paid in excess of par value’.
On January 17, 2018, the Parent Company’s BOD approved the SRO by way of issuance of up to amaximum of 819,827,214 common shares to raise additional capital of up to P=60.0 billion. This wasnoted by the BSP with the issuance of a letter of no objection to the rights issue on January 29, 2018.On April 4, 2018, following the regulatory approvals, the Parent Company concluded theP=60.0 billion SRO, involving 799,842,250 common shares with par value of P=20.00 priced atP=75.00 per share and listed on the PSE on April 12, 2018. Transaction costs on the SRO amountingto P=878.2 million were charged against ‘Capital paid in excess of par value’.
On February 13, 2019, the BOD of the Parent Company approved (a) the amendment of the AOI toincrease the authorized capital stock from P=100.0 billion to P=140.0 billion and (b) the declaration of a13% stock dividend equivalent to 517,401,955 shares amounting to P=10.3 billion representing theminimum 25% subscription and paid-up capital for the increase in the authorized capital stock whichwere ratified by the stockholders representing at least 2/3 of the outstanding capital stock on April24, 2019. These were approved by the BSP on August 8, 2019 and by the SEC on October 4, 2019.Following this, the authorized capital stock of the Parent Company increased from P=100.0 billion toP=140.0 billion consisting of 6.0 billion common shares and 1.0 billion preferred shares, both with parvalue of P=20.0 per share. On October 16, 2019, the Parent Company received the SEC Order fixingthe Record Date of the 13% stock dividend on October 31, 2019. The 13% stock dividend wasissued on November 26, 2019 with record date on October 31, 2019. On November 19, 2019, thePSE approved the listing of such stock dividend.
All issued and outstanding shares of the Parent Company are listed with the PSE (Note 1). As ofDecember 31, 2020 and 2019, there are 2,999 and 2,986 holders, respectively, of the listed shares ofthe Parent Company, with share price closed at P=49.05 and P=66.30 a share, respectively.
The history of share issuances during the last ten years follows:
Year Issuance Listing Date Number of Shares Issued2019 Stock dividend November 26, 2019 517,400,5192018 Stock rights April 12, 2018 799,842,2502015 Stock rights April 7, 2015 435,371,7202013 Stock dividend September 16, 2013 633,415,0492011 Stock rights January 24, 2011 200,000,000
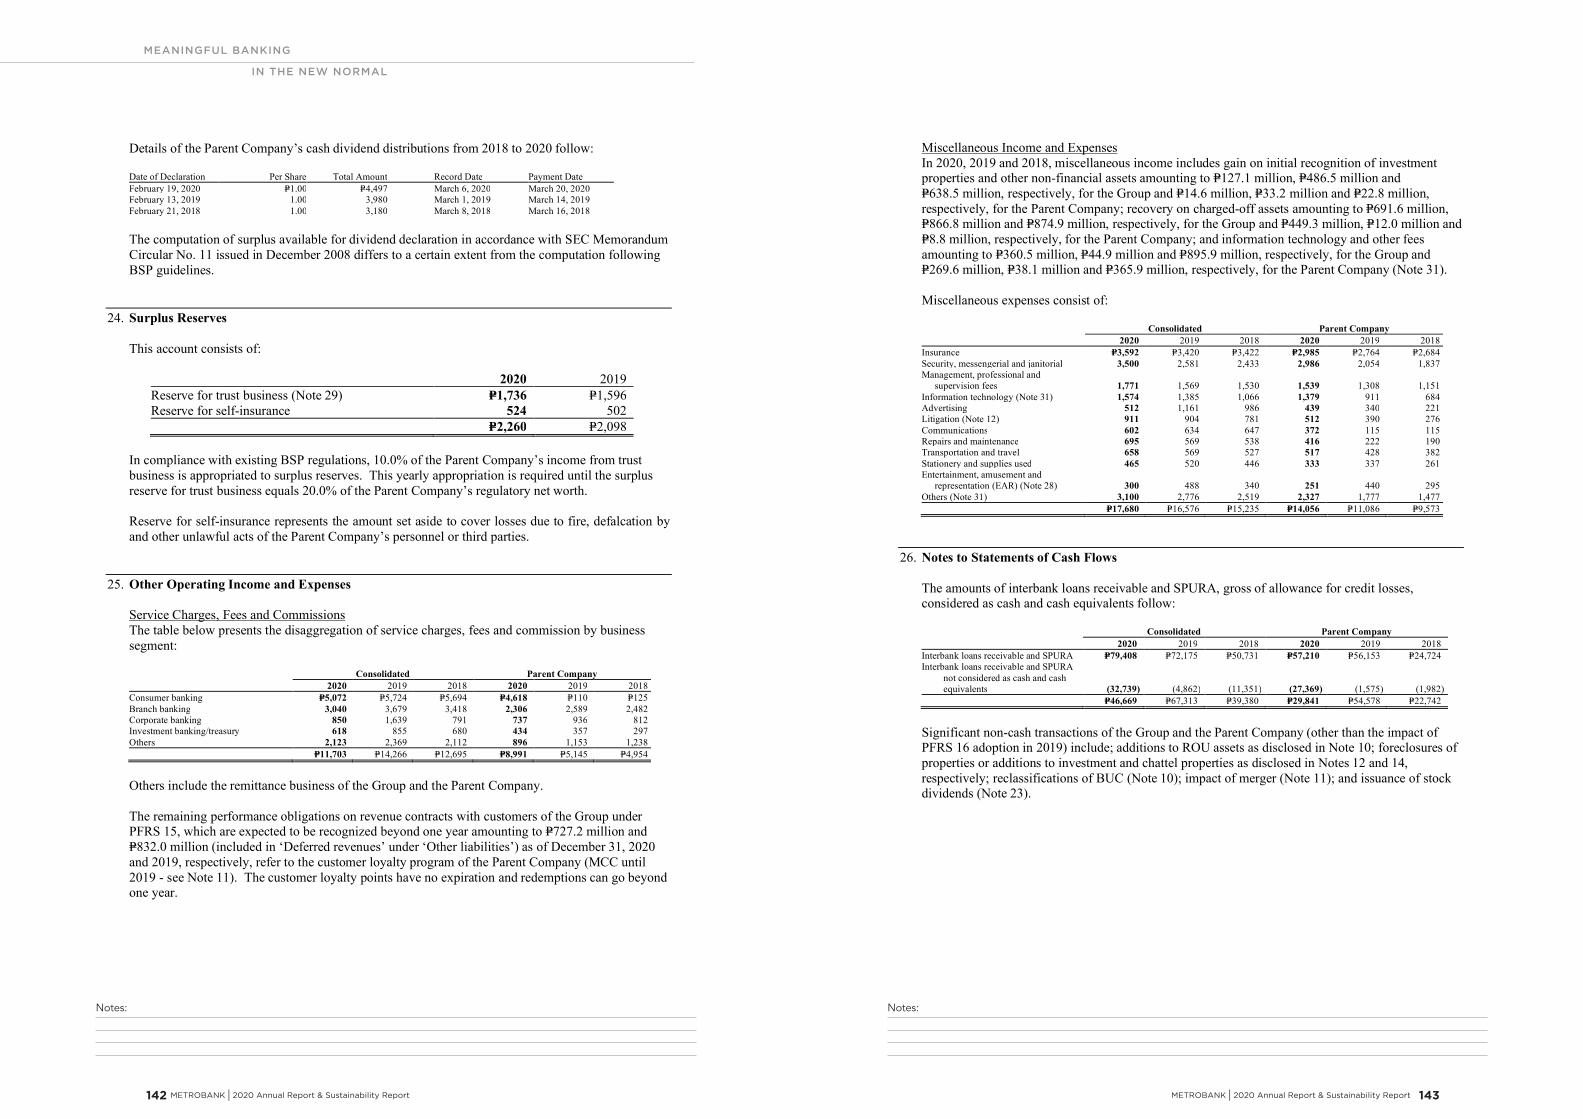
Notes:Notes:
MEANINGFUL BANKING
IN THE NEW NORMAL
METROBANK I 2020 Annual Report & Sustainability Report 143 142 METROBANK I 2020 Annual Report & Sustainability Report
- 111 -
*SGVFSM005911*
Details of the Parent Company’s cash dividend distributions from 2018 to 2020 follow:
Date of Declaration Per Share Total Amount Record Date Payment DateFebruary 19, 2020 P=1.00 P=4,497 March 6, 2020 March 20, 2020February 13, 2019 1.00 3,980 March 1, 2019 March 14, 2019February 21, 2018 1.00 3,180 March 8, 2018 March 16, 2018
The computation of surplus available for dividend declaration in accordance with SEC MemorandumCircular No. 11 issued in December 2008 differs to a certain extent from the computation followingBSP guidelines.
24. Surplus Reserves
This account consists of:
2020 2019Reserve for trust business (Note 29) P=1,736 P=1,596Reserve for self-insurance 524 502
P=2,260 P=2,098
In compliance with existing BSP regulations, 10.0% of the Parent Company’s income from trustbusiness is appropriated to surplus reserves. This yearly appropriation is required until the surplusreserve for trust business equals 20.0% of the Parent Company’s regulatory net worth.
Reserve for self-insurance represents the amount set aside to cover losses due to fire, defalcation byand other unlawful acts of the Parent Company’s personnel or third parties.
25. Other Operating Income and Expenses
Service Charges, Fees and CommissionsThe table below presents the disaggregation of service charges, fees and commission by businesssegment:
Consolidated Parent Company2020 2019 2018 2020 2019 2018
Consumer banking P=5,072 P=5,724 P=5,694 P=4,618 P=110 P=125Branch banking 3,040 3,679 3,418 2,306 2,589 2,482Corporate banking 850 1,639 791 737 936 812Investment banking/treasury 618 855 680 434 357 297Others 2,123 2,369 2,112 896 1,153 1,238
P=11,703 P=14,266 P=12,695 P=8,991 P=5,145 P=4,954
Others include the remittance business of the Group and the Parent Company.
The remaining performance obligations on revenue contracts with customers of the Group underPFRS 15, which are expected to be recognized beyond one year amounting to P=727.2 million andP=832.0 million (included in ‘Deferred revenues’ under ‘Other liabilities’) as of December 31, 2020and 2019, respectively, refer to the customer loyalty program of the Parent Company (MCC until2019 - see Note 11). The customer loyalty points have no expiration and redemptions can go beyondone year.
- 112 -
*SGVFSM005911*
Miscellaneous Income and ExpensesIn 2020, 2019 and 2018, miscellaneous income includes gain on initial recognition of investmentproperties and other non-financial assets amounting to P=127.1 million, P=486.5 million andP=638.5 million, respectively, for the Group and P=14.6 million, P=33.2 million and P=22.8 million,respectively, for the Parent Company; recovery on charged-off assets amounting to P=691.6 million,P=866.8 million and P=874.9 million, respectively, for the Group and P=449.3 million, P=12.0 million andP=8.8 million, respectively, for the Parent Company; and information technology and other feesamounting to P=360.5 million, P=44.9 million and P=895.9 million, respectively, for the Group andP=269.6 million, P=38.1 million and P=365.9 million, respectively, for the Parent Company (Note 31).
Miscellaneous expenses consist of:
Consolidated Parent Company2020 2019 2018 2020 2019 2018
Insurance P=3,592 P=3,420 P=3,422 P=2,985 P=2,764 P=2,684Security, messengerial and janitorial 3,500 2,581 2,433 2,986 2,054 1,837Management, professional and
supervision fees 1,771 1,569 1,530 1,539 1,308 1,151Information technology (Note 31) 1,574 1,385 1,066 1,379 911 684Advertising 512 1,161 986 439 340 221Litigation (Note 12) 911 904 781 512 390 276Communications 602 634 647 372 115 115Repairs and maintenance 695 569 538 416 222 190Transportation and travel 658 569 527 517 428 382Stationery and supplies used 465 520 446 333 337 261Entertainment, amusement and
representation (EAR) (Note 28) 300 488 340 251 440 295Others (Note 31) 3,100 2,776 2,519 2,327 1,777 1,477
P=17,680 P=16,576 P=15,235 P=14,056 P=11,086 P=9,573
26. Notes to Statements of Cash Flows
The amounts of interbank loans receivable and SPURA, gross of allowance for credit losses,considered as cash and cash equivalents follow:
Consolidated Parent Company2020 2019 2018 2020 2019 2018
Interbank loans receivable and SPURA P=79,408 P=72,175 P=50,731 P=57,210 P=56,153 P=24,724Interbank loans receivable and SPURA
not considered as cash and cashequivalents (32,739) (4,862) (11,351) (27,369) (1,575) (1,982)
P=46,669 P=67,313 P=39,380 P=29,841 P=54,578 P=22,742
Significant non-cash transactions of the Group and the Parent Company (other than the impact ofPFRS 16 adoption in 2019) include; additions to ROU assets as disclosed in Note 10; foreclosures ofproperties or additions to investment and chattel properties as disclosed in Notes 12 and 14,respectively; reclassifications of BUC (Note 10); impact of merger (Note 11); and issuance of stockdividends (Note 23).
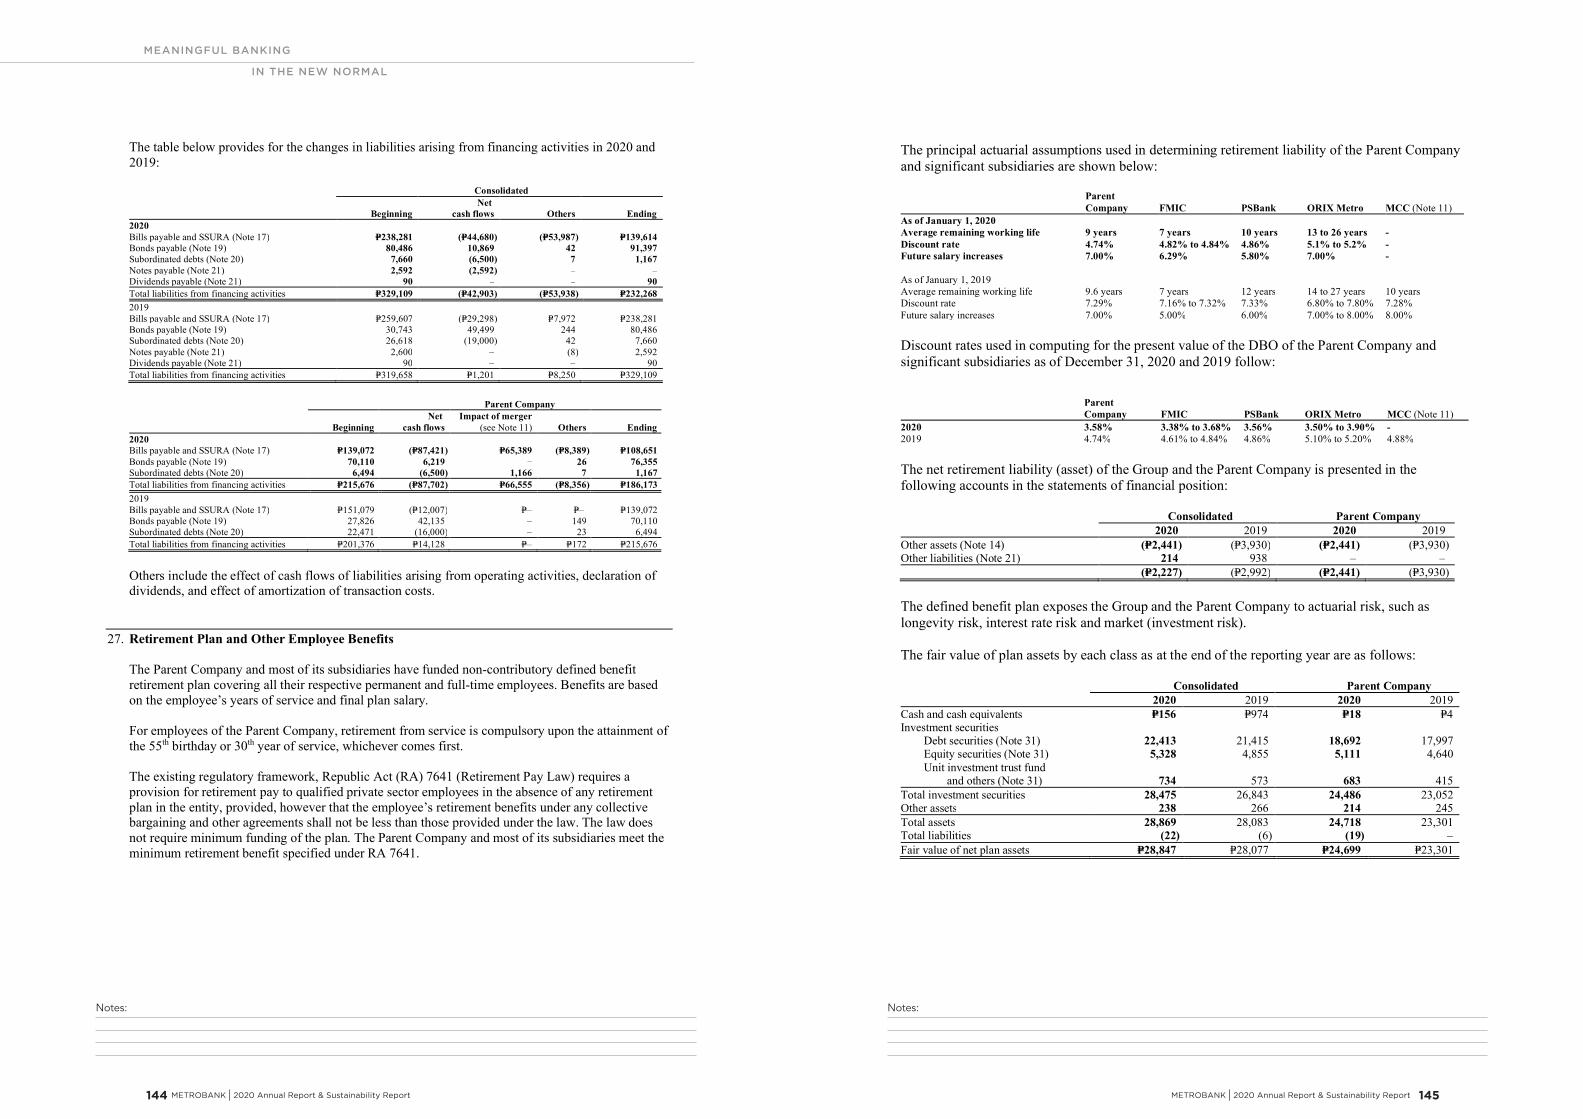
Notes:Notes:
MEANINGFUL BANKING
IN THE NEW NORMAL
METROBANK I 2020 Annual Report & Sustainability Report 145 144 METROBANK I 2020 Annual Report & Sustainability Report
- 113 -
*SGVFSM005911*
The table below provides for the changes in liabilities arising from financing activities in 2020 and2019:
Consolidated
BeginningNet
cash flows Others Ending2020Bills payable and SSURA (Note 17) P=238,281 (P=44,680) (P=53,987) P=139,614Bonds payable (Note 19) 80,486 10,869 42 91,397Subordinated debts (Note 20) 7,660 (6,500) 7 1,167Notes payable (Note 21) 2,592 (2,592) – –Dividends payable (Note 21) 90 – – 90Total liabilities from financing activities P=329,109 (P=42,903) (P=53,938) P=232,2682019Bills payable and SSURA (Note 17) P=259,607 (P=29,298) P=7,972 P=238,281Bonds payable (Note 19) 30,743 49,499 244 80,486Subordinated debts (Note 20) 26,618 (19,000) 42 7,660Notes payable (Note 21) 2,600 – (8) 2,592Dividends payable (Note 21) 90 – – 90Total liabilities from financing activities P=319,658 P=1,201 P=8,250 P=329,109
Parent Company
BeginningNet
cash flowsImpact of merger
(see Note 11) Others Ending2020Bills payable and SSURA (Note 17) P=139,072 (P=87,421) P=65,389 (P=8,389) P=108,651Bonds payable (Note 19) 70,110 6,219 – 26 76,355Subordinated debts (Note 20) 6,494 (6,500) 1,166 7 1,167Total liabilities from financing activities P=215,676 (P=87,702) P=66,555 (P=8,356) P=186,1732019Bills payable and SSURA (Note 17) P=151,079 (P=12,007) P=– P=– P=139,072Bonds payable (Note 19) 27,826 42,135 – 149 70,110Subordinated debts (Note 20) 22,471 (16,000) – 23 6,494Total liabilities from financing activities P=201,376 P=14,128 P=– P=172 P=215,676
Others include the effect of cash flows of liabilities arising from operating activities, declaration ofdividends, and effect of amortization of transaction costs.
27. Retirement Plan and Other Employee Benefits
The Parent Company and most of its subsidiaries have funded non-contributory defined benefitretirement plan covering all their respective permanent and full-time employees. Benefits are basedon the employee’s years of service and final plan salary.
For employees of the Parent Company, retirement from service is compulsory upon the attainment ofthe 55th birthday or 30th year of service, whichever comes first.
The existing regulatory framework, Republic Act (RA) 7641 (Retirement Pay Law) requires aprovision for retirement pay to qualified private sector employees in the absence of any retirementplan in the entity, provided, however that the employee’s retirement benefits under any collectivebargaining and other agreements shall not be less than those provided under the law. The law doesnot require minimum funding of the plan. The Parent Company and most of its subsidiaries meet theminimum retirement benefit specified under RA 7641.
- 114 -
*SGVFSM005911*
The principal actuarial assumptions used in determining retirement liability of the Parent Companyand significant subsidiaries are shown below:
ParentCompany FMIC PSBank ORIX Metro MCC (Note 11)
As of January 1, 2020Average remaining working life 9 years 7 years 10 years 13 to 26 years -Discount rate 4.74% 4.82% to 4.84% 4.86% 5.1% to 5.2% -Future salary increases 7.00% 6.29% 5.80% 7.00% -
As of January 1, 2019Average remaining working life 9.6 years 7 years 12 years 14 to 27 years 10 yearsDiscount rate 7.29% 7.16% to 7.32% 7.33% 6.80% to 7.80% 7.28%Future salary increases 7.00% 5.00% 6.00% 7.00% to 8.00% 8.00%
Discount rates used in computing for the present value of the DBO of the Parent Company andsignificant subsidiaries as of December 31, 2020 and 2019 follow:
ParentCompany FMIC PSBank ORIX Metro MCC (Note 11)
2020 3.58% 3.38% to 3.68% 3.56% 3.50% to 3.90% -2019 4.74% 4.61% to 4.84% 4.86% 5.10% to 5.20% 4.88%
The net retirement liability (asset) of the Group and the Parent Company is presented in thefollowing accounts in the statements of financial position:
Consolidated Parent Company2020 2019 2020 2019
Other assets (Note 14) (P=2,441) (P=3,930) (P=2,441) (P=3,930)Other liabilities (Note 21) 214 938 ‒ ‒
(P=2,227) (P=2,992) (P=2,441) (P=3,930)
The defined benefit plan exposes the Group and the Parent Company to actuarial risk, such aslongevity risk, interest rate risk and market (investment risk).
The fair value of plan assets by each class as at the end of the reporting year are as follows:
Consolidated Parent Company2020 2019 2020 2019
Cash and cash equivalents P=156 P=974 P=18 P=4Investment securities
Debt securities (Note 31) 22,413 21,415 18,692 17,997 Equity securities (Note 31) 5,328 4,855 5,111 4,640 Unit investment trust fund
and others (Note 31) 734 573 683 415Total investment securities 28,475 26,843 24,486 23,052Other assets 238 266 214 245Total assets 28,869 28,083 24,718 23,301Total liabilities (22) (6) (19) –Fair value of net plan assets P=28,847 P=28,077 P=24,699 P=23,301
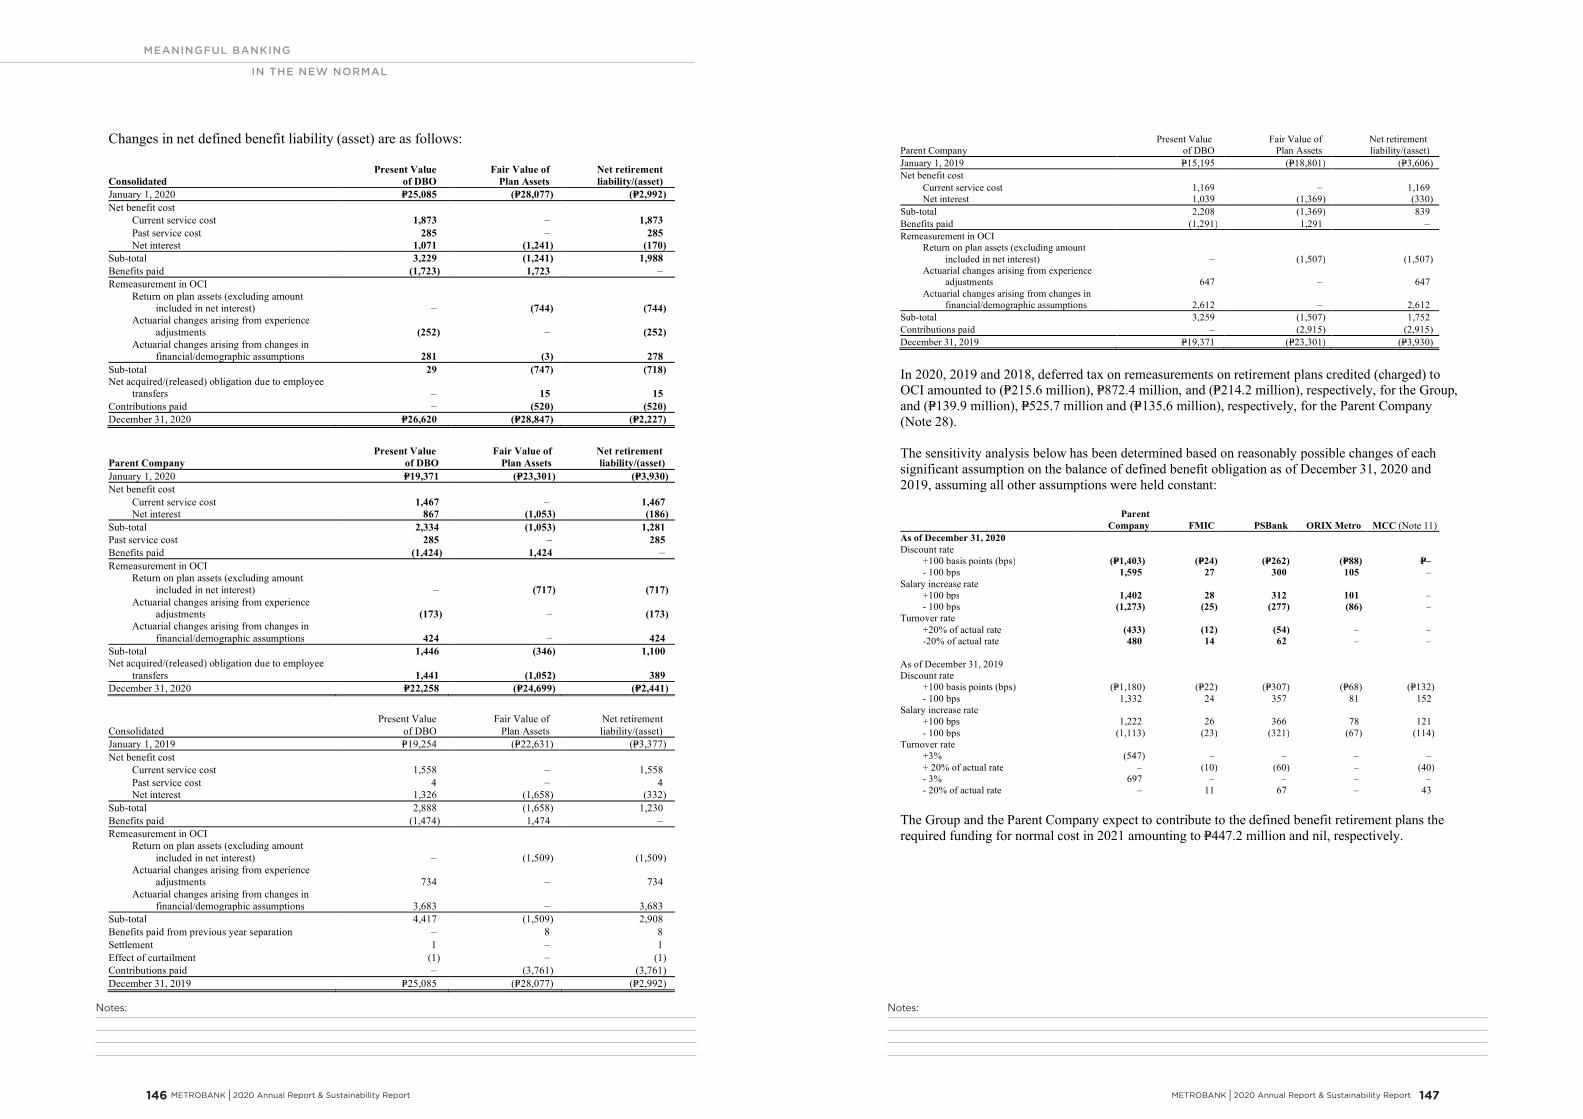
Notes:Notes:
MEANINGFUL BANKING
IN THE NEW NORMAL
METROBANK I 2020 Annual Report & Sustainability Report 147 146 METROBANK I 2020 Annual Report & Sustainability Report
- 115 -
*SGVFSM005911*
Changes in net defined benefit liability (asset) are as follows:
ConsolidatedPresent Value
of DBOFair Value of
Plan AssetsNet retirementliability/(asset)
January 1, 2020 P=25,085 (P=28,077) (P=2,992)Net benefit cost
Current service cost 1,873 – 1,873Past service cost 285 – 285Net interest 1,071 (1,241) (170)
Sub-total 3,229 (1,241) 1,988Benefits paid (1,723) 1,723 –Remeasurement in OCI
Return on plan assets (excluding amountincluded in net interest) – (744) (744)
Actuarial changes arising from experienceadjustments (252) – (252)
Actuarial changes arising from changes infinancial/demographic assumptions 281 (3) 278
Sub-total 29 (747) (718)Net acquired/(released) obligation due to employee
transfers – 15 15Contributions paid – (520) (520)December 31, 2020 P=26,620 (P=28,847) (P=2,227)
Parent CompanyPresent Value
of DBOFair Value of
Plan AssetsNet retirementliability/(asset)
January 1, 2020 P=19,371 (P=23,301) (P=3,930)Net benefit cost
Current service cost 1,467 – 1,467Net interest 867 (1,053) (186)
Sub-total 2,334 (1,053) 1,281Past service cost 285 – 285Benefits paid (1,424) 1,424 –Remeasurement in OCI
Return on plan assets (excluding amountincluded in net interest) – (717) (717)
Actuarial changes arising from experienceadjustments (173) – (173)
Actuarial changes arising from changes infinancial/demographic assumptions 424 – 424
Sub-total 1,446 (346) 1,100Net acquired/(released) obligation due to employee
transfers 1,441 (1,052) 389December 31, 2020 P=22,258 (P=24,699) (P=2,441)
ConsolidatedPresent Value
of DBOFair Value of
Plan AssetsNet retirementliability/(asset)
January 1, 2019 P=19,254 (P=22,631) (P=3,377)Net benefit cost
Current service cost 1,558 – 1,558Past service cost 4 – 4Net interest 1,326 (1,658) (332)
Sub-total 2,888 (1,658) 1,230Benefits paid (1,474) 1,474 –Remeasurement in OCI
Return on plan assets (excluding amountincluded in net interest) – (1,509) (1,509)
Actuarial changes arising from experienceadjustments 734 – 734
Actuarial changes arising from changes infinancial/demographic assumptions 3,683 – 3,683
Sub-total 4,417 (1,509) 2,908Benefits paid from previous year separation – 8 8Settlement 1 – 1Effect of curtailment (1) – (1)Contributions paid – (3,761) (3,761)December 31, 2019 P=25,085 (P=28,077) (P=2,992)
- 116 -
*SGVFSM005911*
Parent CompanyPresent Value
of DBOFair Value of
Plan AssetsNet retirementliability/(asset)
January 1, 2019 P=15,195 (P=18,801) (P=3,606)Net benefit cost
Current service cost 1,169 – 1,169Net interest 1,039 (1,369) (330)
Sub-total 2,208 (1,369) 839Benefits paid (1,291) 1,291 –Remeasurement in OCI
Return on plan assets (excluding amountincluded in net interest) – (1,507) (1,507)
Actuarial changes arising from experienceadjustments 647 – 647
Actuarial changes arising from changes infinancial/demographic assumptions 2,612 – 2,612
Sub-total 3,259 (1,507) 1,752Contributions paid – (2,915) (2,915)December 31, 2019 P=19,371 (P=23,301) (P=3,930)
In 2020, 2019 and 2018, deferred tax on remeasurements on retirement plans credited (charged) toOCI amounted to (P=215.6 million), P=872.4 million, and (P=214.2 million), respectively, for the Group,and (P=139.9 million), P=525.7 million and (P=135.6 million), respectively, for the Parent Company(Note 28).
The sensitivity analysis below has been determined based on reasonably possible changes of eachsignificant assumption on the balance of defined benefit obligation as of December 31, 2020 and2019, assuming all other assumptions were held constant:
ParentCompany FMIC PSBank ORIX Metro MCC (Note 11)
As of December 31, 2020Discount rate
+100 basis points (bps) (P=1,403) (P=24) (P=262) (P=88) P=–- 100 bps 1,595 27 300 105 –
Salary increase rate+100 bps 1,402 28 312 101 –- 100 bps (1,273) (25) (277) (86) –
Turnover rate+20% of actual rate (433) (12) (54) – –-20% of actual rate 480 14 62 – –
As of December 31, 2019Discount rate
+100 basis points (bps) (P=1,180) (P=22) (P=307) (P=68) (P=132)- 100 bps 1,332 24 357 81 152
Salary increase rate+100 bps 1,222 26 366 78 121- 100 bps (1,113) (23) (321) (67) (114)
Turnover rate+3% (547) – – – –+ 20% of actual rate – (10) (60) – (40)- 3% 697 – – – –- 20% of actual rate – 11 67 – 43
The Group and the Parent Company expect to contribute to the defined benefit retirement plans therequired funding for normal cost in 2021 amounting to P=447.2 million and nil, respectively.
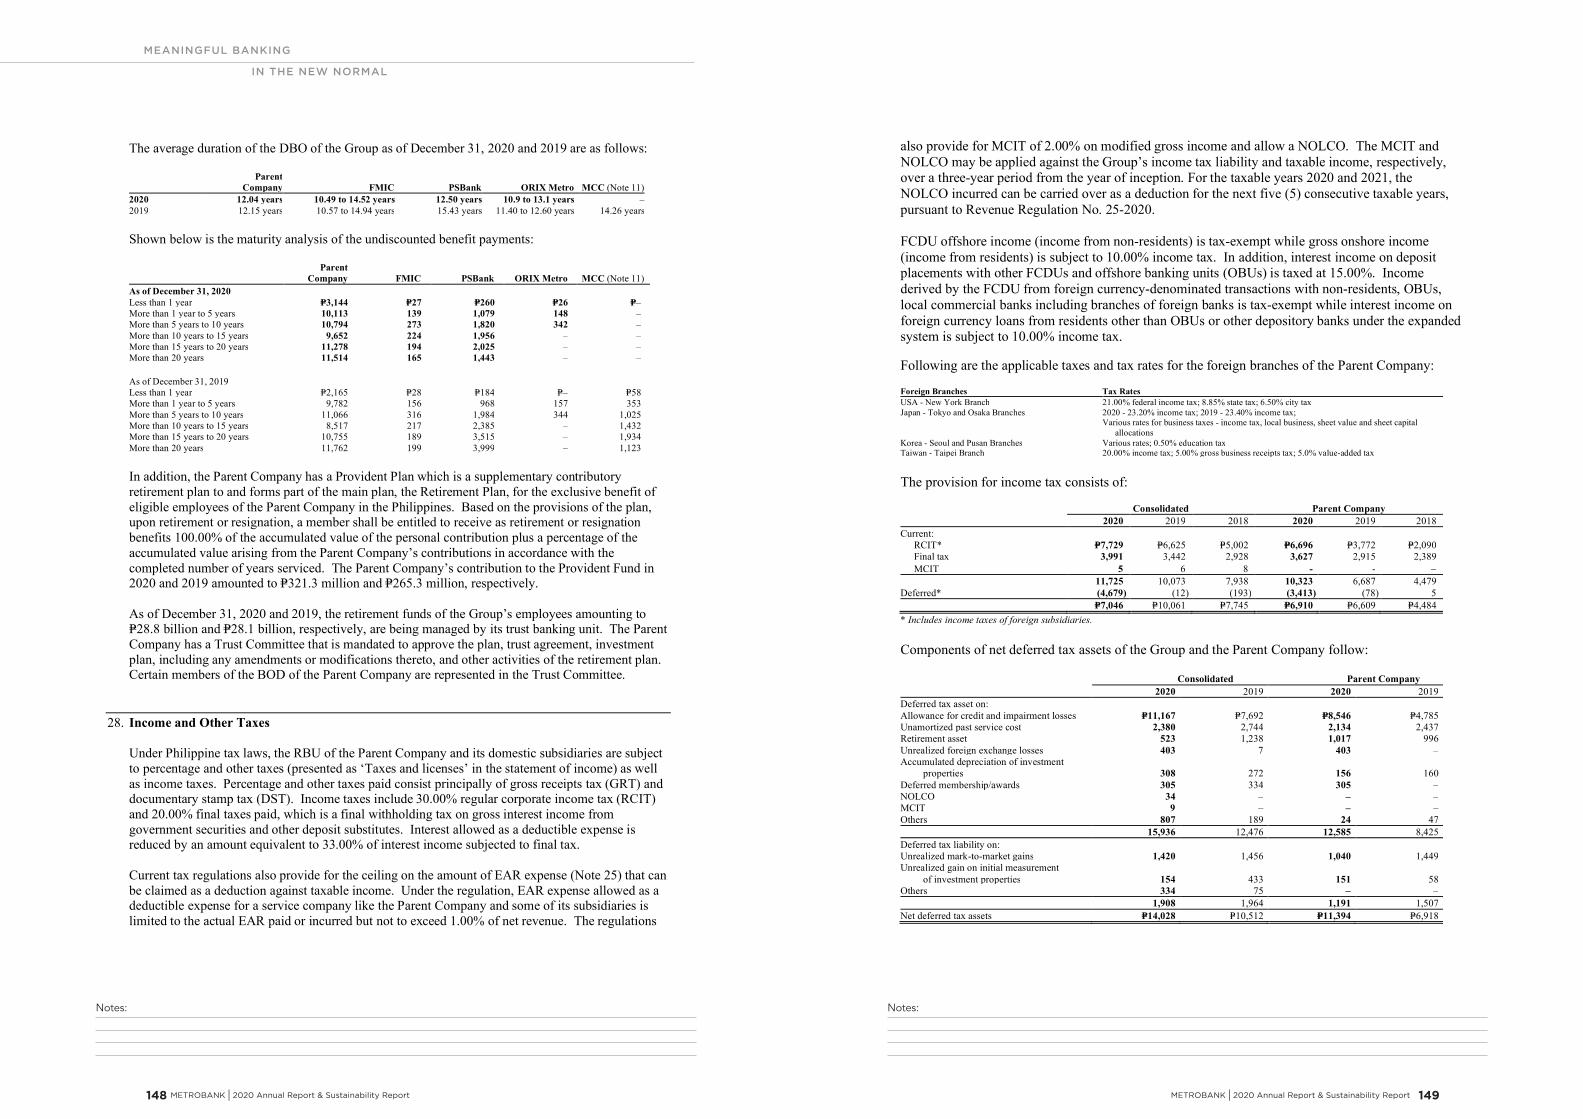
Notes:Notes:
MEANINGFUL BANKING
IN THE NEW NORMAL
METROBANK I 2020 Annual Report & Sustainability Report 149 148 METROBANK I 2020 Annual Report & Sustainability Report
- 117 -
*SGVFSM005911*
The average duration of the DBO of the Group as of December 31, 2020 and 2019 are as follows:
ParentCompany FMIC PSBank ORIX Metro MCC (Note 11)
2020 12.04 years 10.49 to 14.52 years 12.50 years 10.9 to 13.1 years –2019 12.15 years 10.57 to 14.94 years 15.43 years 11.40 to 12.60 years 14.26 years
Shown below is the maturity analysis of the undiscounted benefit payments:
ParentCompany FMIC PSBank ORIX Metro MCC (Note 11)
As of December 31, 2020Less than 1 year P=3,144 P=27 P=260 P=26 P=–More than 1 year to 5 years 10,113 139 1,079 148 –More than 5 years to 10 years 10,794 273 1,820 342 –More than 10 years to 15 years 9,652 224 1,956 – –More than 15 years to 20 years 11,278 194 2,025 – –More than 20 years 11,514 165 1,443 – –
As of December 31, 2019Less than 1 year P=2,165 P=28 P=184 P=– P=58More than 1 year to 5 years 9,782 156 968 157 353More than 5 years to 10 years 11,066 316 1,984 344 1,025More than 10 years to 15 years 8,517 217 2,385 – 1,432More than 15 years to 20 years 10,755 189 3,515 – 1,934More than 20 years 11,762 199 3,999 – 1,123
In addition, the Parent Company has a Provident Plan which is a supplementary contributoryretirement plan to and forms part of the main plan, the Retirement Plan, for the exclusive benefit ofeligible employees of the Parent Company in the Philippines. Based on the provisions of the plan,upon retirement or resignation, a member shall be entitled to receive as retirement or resignationbenefits 100.00% of the accumulated value of the personal contribution plus a percentage of theaccumulated value arising from the Parent Company’s contributions in accordance with thecompleted number of years serviced. The Parent Company’s contribution to the Provident Fund in2020 and 2019 amounted to P=321.3 million and P=265.3 million, respectively.
As of December 31, 2020 and 2019, the retirement funds of the Group’s employees amounting toP=28.8 billion and P=28.1 billion, respectively, are being managed by its trust banking unit. The ParentCompany has a Trust Committee that is mandated to approve the plan, trust agreement, investmentplan, including any amendments or modifications thereto, and other activities of the retirement plan.Certain members of the BOD of the Parent Company are represented in the Trust Committee.
28. Income and Other Taxes
Under Philippine tax laws, the RBU of the Parent Company and its domestic subsidiaries are subjectto percentage and other taxes (presented as ‘Taxes and licenses’ in the statement of income) as wellas income taxes. Percentage and other taxes paid consist principally of gross receipts tax (GRT) anddocumentary stamp tax (DST). Income taxes include 30.00% regular corporate income tax (RCIT)and 20.00% final taxes paid, which is a final withholding tax on gross interest income fromgovernment securities and other deposit substitutes. Interest allowed as a deductible expense isreduced by an amount equivalent to 33.00% of interest income subjected to final tax.
Current tax regulations also provide for the ceiling on the amount of EAR expense (Note 25) that canbe claimed as a deduction against taxable income. Under the regulation, EAR expense allowed as adeductible expense for a service company like the Parent Company and some of its subsidiaries islimited to the actual EAR paid or incurred but not to exceed 1.00% of net revenue. The regulations
- 118 -
*SGVFSM005911*
also provide for MCIT of 2.00% on modified gross income and allow a NOLCO. The MCIT andNOLCO may be applied against the Group’s income tax liability and taxable income, respectively,over a three-year period from the year of inception. For the taxable years 2020 and 2021, theNOLCO incurred can be carried over as a deduction for the next five (5) consecutive taxable years,pursuant to Revenue Regulation No. 25-2020.
FCDU offshore income (income from non-residents) is tax-exempt while gross onshore income(income from residents) is subject to 10.00% income tax. In addition, interest income on depositplacements with other FCDUs and offshore banking units (OBUs) is taxed at 15.00%. Incomederived by the FCDU from foreign currency-denominated transactions with non-residents, OBUs,local commercial banks including branches of foreign banks is tax-exempt while interest income onforeign currency loans from residents other than OBUs or other depository banks under the expandedsystem is subject to 10.00% income tax.
Following are the applicable taxes and tax rates for the foreign branches of the Parent Company:
Foreign Branches Tax RatesUSA - New York Branch 21.00% federal income tax; 8.85% state tax; 6.50% city taxJapan - Tokyo and Osaka Branches 2020 - 23.20% income tax; 2019 - 23.40% income tax;
Various rates for business taxes - income tax, local business, sheet value and sheet capitalallocations
Korea - Seoul and Pusan Branches Various rates; 0.50% education taxTaiwan - Taipei Branch 20.00% income tax; 5.00% gross business receipts tax; 5.0% value-added tax
The provision for income tax consists of:
Consolidated Parent Company2020 2019 2018 2020 2019 2018
Current:RCIT* P=7,729 P=6,625 P=5,002 P=6,696 P=3,772 P=2,090
Final tax 3,991 3,442 2,928 3,627 2,915 2,389MCIT 5 6 8 - -
11,725 10,073 7,938 10,323 6,687 4,479Deferred* (4,679) (12) (193) (3,413) (78) 5
P=7,046 P=10,061 P=7,745 P=6,910 P=6,609 P=4,484* Includes income taxes of foreign subsidiaries.
Components of net deferred tax assets of the Group and the Parent Company follow:
Consolidated Parent Company2020 2019 2020 2019
Deferred tax asset on:Allowance for credit and impairment losses P=11,167 P=7,692 P=8,546 P=4,785Unamortized past service cost 2,380 2,744 2,134 2,437Retirement asset 523 1,238 1,017 996Unrealized foreign exchange losses 403 7 403 –Accumulated depreciation of investment
properties 308 272 156 160Deferred membership/awards 305 334 305 –NOLCO 34 – – –MCIT 9 – – –Others 807 189 24 47
15,936 12,476 12,585 8,425Deferred tax liability on:Unrealized mark-to-market gains 1,420 1,456 1,040 1,449Unrealized gain on initial measurement
of investment properties 154 433 151 58Others 334 75 – –
1,908 1,964 1,191 1,507Net deferred tax assets P=14,028 P=10,512 P=11,394 P=6,918
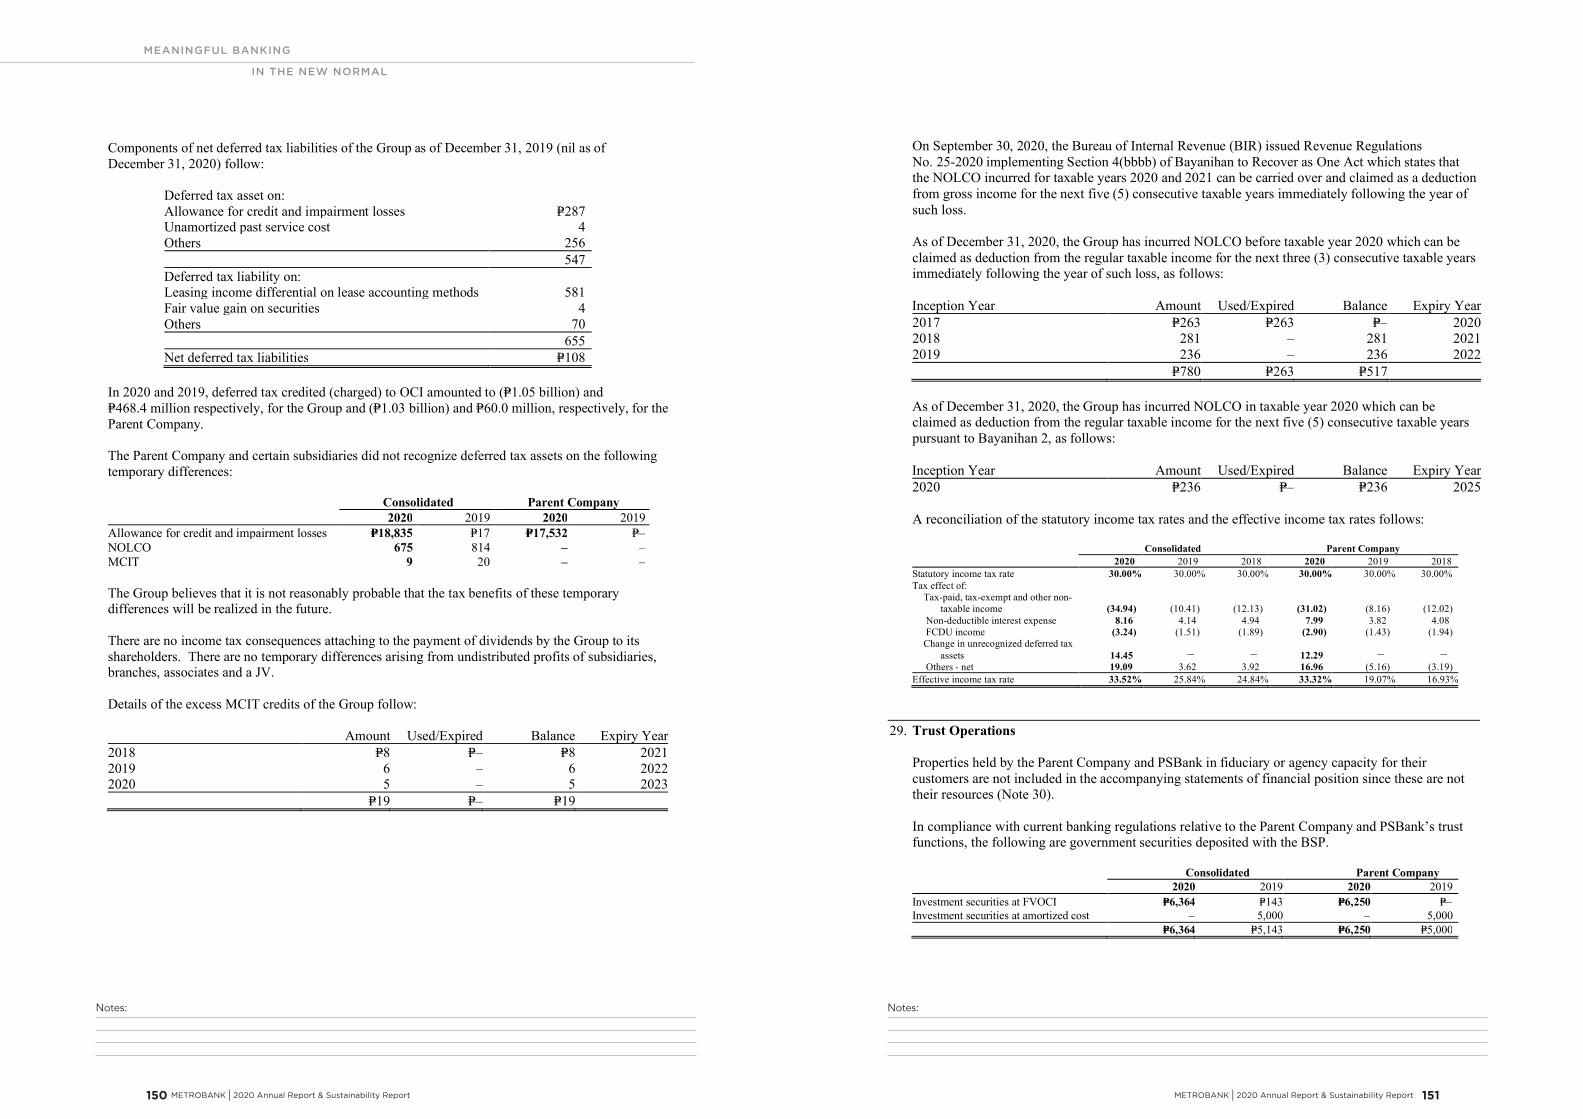
Notes:Notes:
MEANINGFUL BANKING
IN THE NEW NORMAL
METROBANK I 2020 Annual Report & Sustainability Report 151 150 METROBANK I 2020 Annual Report & Sustainability Report
- 119 -
*SGVFSM005911*
Components of net deferred tax liabilities of the Group as of December 31, 2019 (nil as ofDecember 31, 2020) follow:
Deferred tax asset on:Allowance for credit and impairment losses P=287Unamortized past service cost 4Others 256
547Deferred tax liability on:Leasing income differential on lease accounting methods 581Fair value gain on securities 4Others 70
655Net deferred tax liabilities P=108
In 2020 and 2019, deferred tax credited (charged) to OCI amounted to (P=1.05 billion) andP=468.4 million respectively, for the Group and (P=1.03 billion) and P=60.0 million, respectively, for theParent Company.
The Parent Company and certain subsidiaries did not recognize deferred tax assets on the followingtemporary differences:
Consolidated Parent Company2020 2019 2020 2019
Allowance for credit and impairment losses P=18,835 P=17 P=17,532 P=–NOLCO 675 814 – –MCIT 9 20 – –
The Group believes that it is not reasonably probable that the tax benefits of these temporarydifferences will be realized in the future.
There are no income tax consequences attaching to the payment of dividends by the Group to itsshareholders. There are no temporary differences arising from undistributed profits of subsidiaries,branches, associates and a JV.
Details of the excess MCIT credits of the Group follow:
Amount Used/Expired Balance Expiry Year2018 P=8 P=– P=8 20212019 6 – 6 20222020 5 – 5 2023
P=19 P=– P=19
- 120 -
*SGVFSM005911*
On September 30, 2020, the Bureau of Internal Revenue (BIR) issued Revenue RegulationsNo. 25-2020 implementing Section 4(bbbb) of Bayanihan to Recover as One Act which states thatthe NOLCO incurred for taxable years 2020 and 2021 can be carried over and claimed as a deductionfrom gross income for the next five (5) consecutive taxable years immediately following the year ofsuch loss.
As of December 31, 2020, the Group has incurred NOLCO before taxable year 2020 which can beclaimed as deduction from the regular taxable income for the next three (3) consecutive taxable yearsimmediately following the year of such loss, as follows:
Inception Year Amount Used/Expired Balance Expiry Year2017 P=263 P=263 P=– 20202018 281 – 281 20212019 236 – 236 2022
P=780 P=263 P=517
As of December 31, 2020, the Group has incurred NOLCO in taxable year 2020 which can beclaimed as deduction from the regular taxable income for the next five (5) consecutive taxable yearspursuant to Bayanihan 2, as follows:
Inception Year Amount Used/Expired Balance Expiry Year2020 P=236 P=– P=236 2025
A reconciliation of the statutory income tax rates and the effective income tax rates follows:
Consolidated Parent Company2020 2019 2018 2020 2019 2018
Statutory income tax rate 30.00% 30.00% 30.00% 30.00% 30.00% 30.00%Tax effect of:
Tax-paid, tax-exempt and other non-taxable income (34.94) (10.41) (12.13) (31.02) (8.16) (12.02)
Non-deductible interest expense 8.16 4.14 4.94 7.99 3.82 4.08FCDU income (3.24) (1.51) (1.89) (2.90) (1.43) (1.94)Change in unrecognized deferred tax
assets 14.45 – – 12.29 – –Others - net 19.09 3.62 3.92 16.96 (5.16) (3.19)
Effective income tax rate 33.52% 25.84% 24.84% 33.32% 19.07% 16.93%
29. Trust Operations
Properties held by the Parent Company and PSBank in fiduciary or agency capacity for theircustomers are not included in the accompanying statements of financial position since these are nottheir resources (Note 30).
In compliance with current banking regulations relative to the Parent Company and PSBank’s trustfunctions, the following are government securities deposited with the BSP.
Consolidated Parent Company2020 2019 2020 2019
Investment securities at FVOCI P=6,364 P=143 P=6,250 P=Investment securities at amortized cost 5,000 5,000
P=6,364 P=5,143 P=6,250 P=5,000
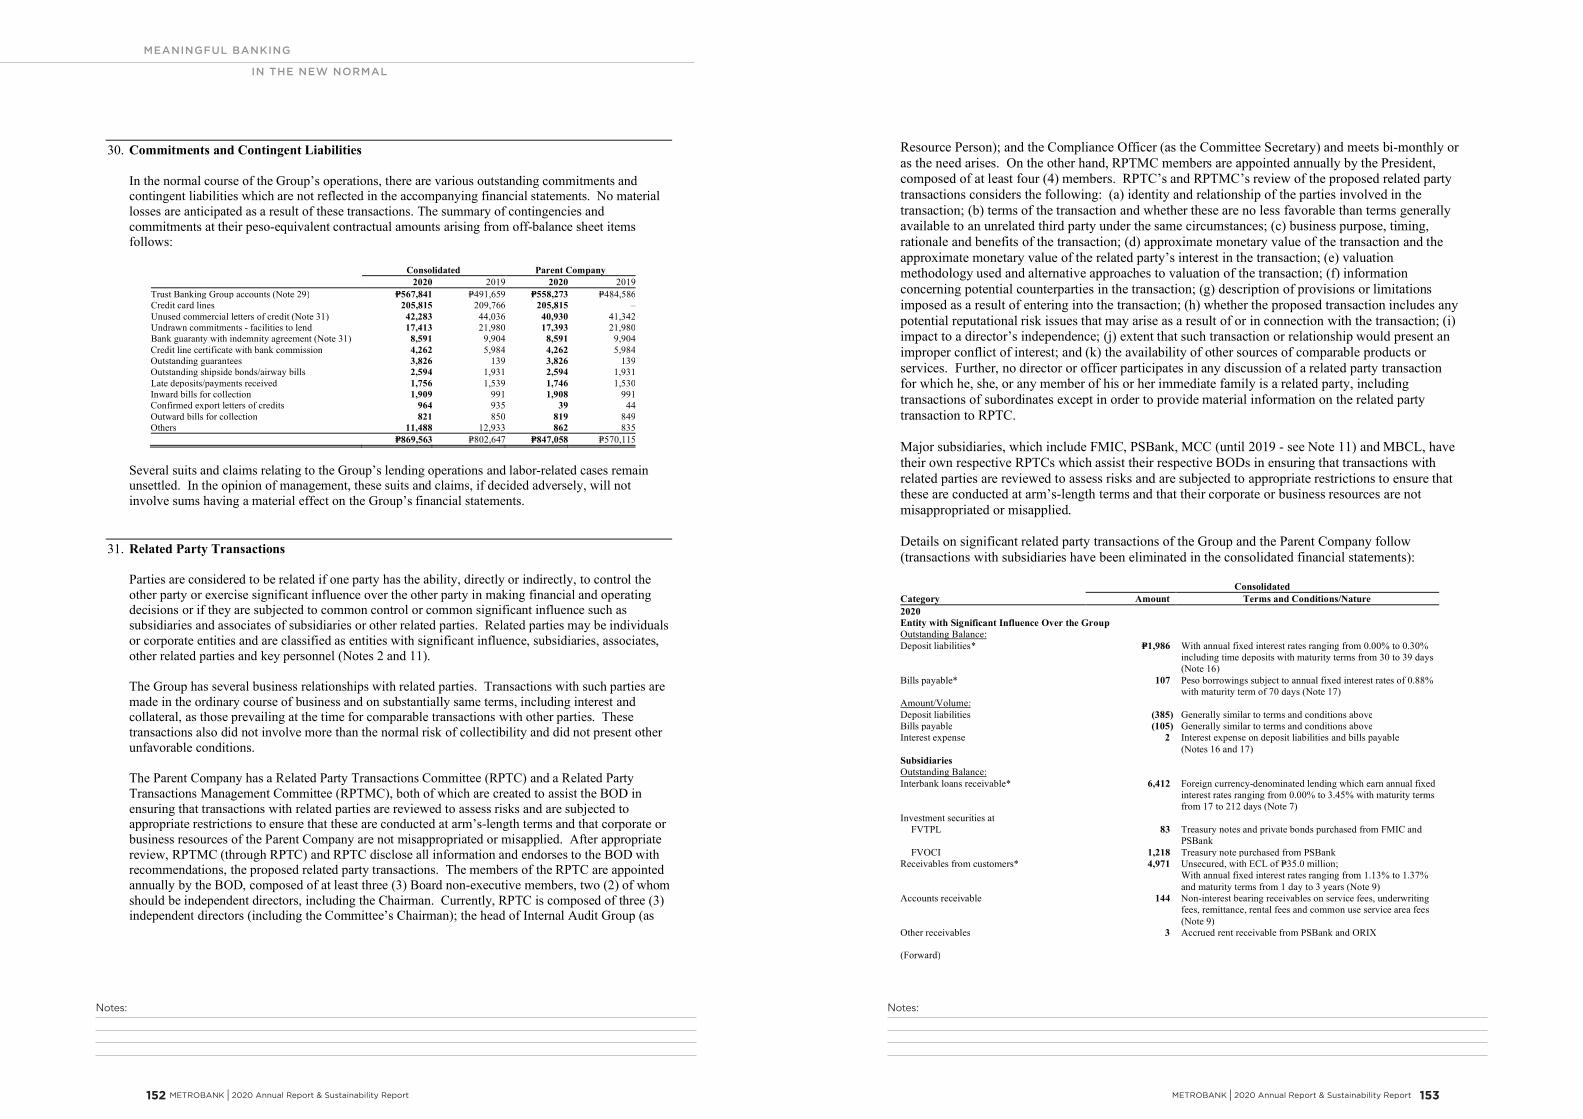
Notes:Notes:
MEANINGFUL BANKING
IN THE NEW NORMAL
METROBANK I 2020 Annual Report & Sustainability Report 153 152 METROBANK I 2020 Annual Report & Sustainability Report
- 121 -
*SGVFSM005911*
30. Commitments and Contingent Liabilities
In the normal course of the Group’s operations, there are various outstanding commitments andcontingent liabilities which are not reflected in the accompanying financial statements. No materiallosses are anticipated as a result of these transactions. The summary of contingencies andcommitments at their peso-equivalent contractual amounts arising from off-balance sheet itemsfollows:
Consolidated Parent Company2020 2019 2020 2019
Trust Banking Group accounts (Note 29) P=567,841 P=491,659 P=558,273 P=484,586Credit card lines 205,815 209,766 205,815 –Unused commercial letters of credit (Note 31) 42,283 44,036 40,930 41,342Undrawn commitments - facilities to lend 17,413 21,980 17,393 21,980Bank guaranty with indemnity agreement (Note 31) 8,591 9,904 8,591 9,904Credit line certificate with bank commission 4,262 5,984 4,262 5,984Outstanding guarantees 3,826 139 3,826 139Outstanding shipside bonds/airway bills 2,594 1,931 2,594 1,931Late deposits/payments received 1,756 1,539 1,746 1,530Inward bills for collection 1,909 991 1,908 991Confirmed export letters of credits 964 935 39 44Outward bills for collection 821 850 819 849Others 11,488 12,933 862 835
P=869,563 P=802,647 P=847,058 P=570,115
Several suits and claims relating to the Group’s lending operations and labor-related cases remainunsettled. In the opinion of management, these suits and claims, if decided adversely, will notinvolve sums having a material effect on the Group’s financial statements.
31. Related Party Transactions
Parties are considered to be related if one party has the ability, directly or indirectly, to control theother party or exercise significant influence over the other party in making financial and operatingdecisions or if they are subjected to common control or common significant influence such assubsidiaries and associates of subsidiaries or other related parties. Related parties may be individualsor corporate entities and are classified as entities with significant influence, subsidiaries, associates,other related parties and key personnel (Notes 2 and 11).
The Group has several business relationships with related parties. Transactions with such parties aremade in the ordinary course of business and on substantially same terms, including interest andcollateral, as those prevailing at the time for comparable transactions with other parties. Thesetransactions also did not involve more than the normal risk of collectibility and did not present otherunfavorable conditions.
The Parent Company has a Related Party Transactions Committee (RPTC) and a Related PartyTransactions Management Committee (RPTMC), both of which are created to assist the BOD inensuring that transactions with related parties are reviewed to assess risks and are subjected toappropriate restrictions to ensure that these are conducted at arm’s-length terms and that corporate orbusiness resources of the Parent Company are not misappropriated or misapplied. After appropriatereview, RPTMC (through RPTC) and RPTC disclose all information and endorses to the BOD withrecommendations, the proposed related party transactions. The members of the RPTC are appointedannually by the BOD, composed of at least three (3) Board non-executive members, two (2) of whomshould be independent directors, including the Chairman. Currently, RPTC is composed of three (3)independent directors (including the Committee’s Chairman); the head of Internal Audit Group (as
- 122 -
*SGVFSM005911*
Resource Person); and the Compliance Officer (as the Committee Secretary) and meets bi-monthly oras the need arises. On the other hand, RPTMC members are appointed annually by the President,composed of at least four (4) members. RPTC’s and RPTMC’s review of the proposed related partytransactions considers the following: (a) identity and relationship of the parties involved in thetransaction; (b) terms of the transaction and whether these are no less favorable than terms generallyavailable to an unrelated third party under the same circumstances; (c) business purpose, timing,rationale and benefits of the transaction; (d) approximate monetary value of the transaction and theapproximate monetary value of the related party’s interest in the transaction; (e) valuationmethodology used and alternative approaches to valuation of the transaction; (f) informationconcerning potential counterparties in the transaction; (g) description of provisions or limitationsimposed as a result of entering into the transaction; (h) whether the proposed transaction includes anypotential reputational risk issues that may arise as a result of or in connection with the transaction; (i)impact to a director’s independence; (j) extent that such transaction or relationship would present animproper conflict of interest; and (k) the availability of other sources of comparable products orservices. Further, no director or officer participates in any discussion of a related party transactionfor which he, she, or any member of his or her immediate family is a related party, includingtransactions of subordinates except in order to provide material information on the related partytransaction to RPTC.
Major subsidiaries, which include FMIC, PSBank, MCC (until 2019 - see Note 11) and MBCL, havetheir own respective RPTCs which assist their respective BODs in ensuring that transactions withrelated parties are reviewed to assess risks and are subjected to appropriate restrictions to ensure thatthese are conducted at arm’s-length terms and that their corporate or business resources are notmisappropriated or misapplied.
Details on significant related party transactions of the Group and the Parent Company follow(transactions with subsidiaries have been eliminated in the consolidated financial statements):
ConsolidatedCategory Amount Terms and Conditions/Nature2020Entity with Significant Influence Over the GroupOutstanding Balance:Deposit liabilities* P=1,986 With annual fixed interest rates ranging from 0.00% to 0.30%
including time deposits with maturity terms from 30 to 39 days(Note 16)
Bills payable* 107 Peso borrowings subject to annual fixed interest rates of 0.88%with maturity term of 70 days (Note 17)
Amount/Volume:Deposit liabilities (385) Generally similar to terms and conditions aboveBills payable (105) Generally similar to terms and conditions aboveInterest expense 2 Interest expense on deposit liabilities and bills payable
(Notes 16 and 17)SubsidiariesOutstanding Balance:Interbank loans receivable* 6,412 Foreign currency-denominated lending which earn annual fixed
interest rates ranging from 0.00% to 3.45% with maturity termsfrom 17 to 212 days (Note 7)
Investment securities at FVTPL 83 Treasury notes and private bonds purchased from FMIC and
PSBankFVOCI 1,218 Treasury note purchased from PSBank
Receivables from customers* 4,971 Unsecured, with ECL of P=35.0 million;With annual fixed interest rates ranging from 1.13% to 1.37%and maturity terms from 1 day to 3 years (Note 9)
Accounts receivable 144 Non-interest bearing receivables on service fees, underwritingfees, remittance, rental fees and common use service area fees(Note 9)
Other receivables 3 Accrued rent receivable from PSBank and ORIX
(Forward)
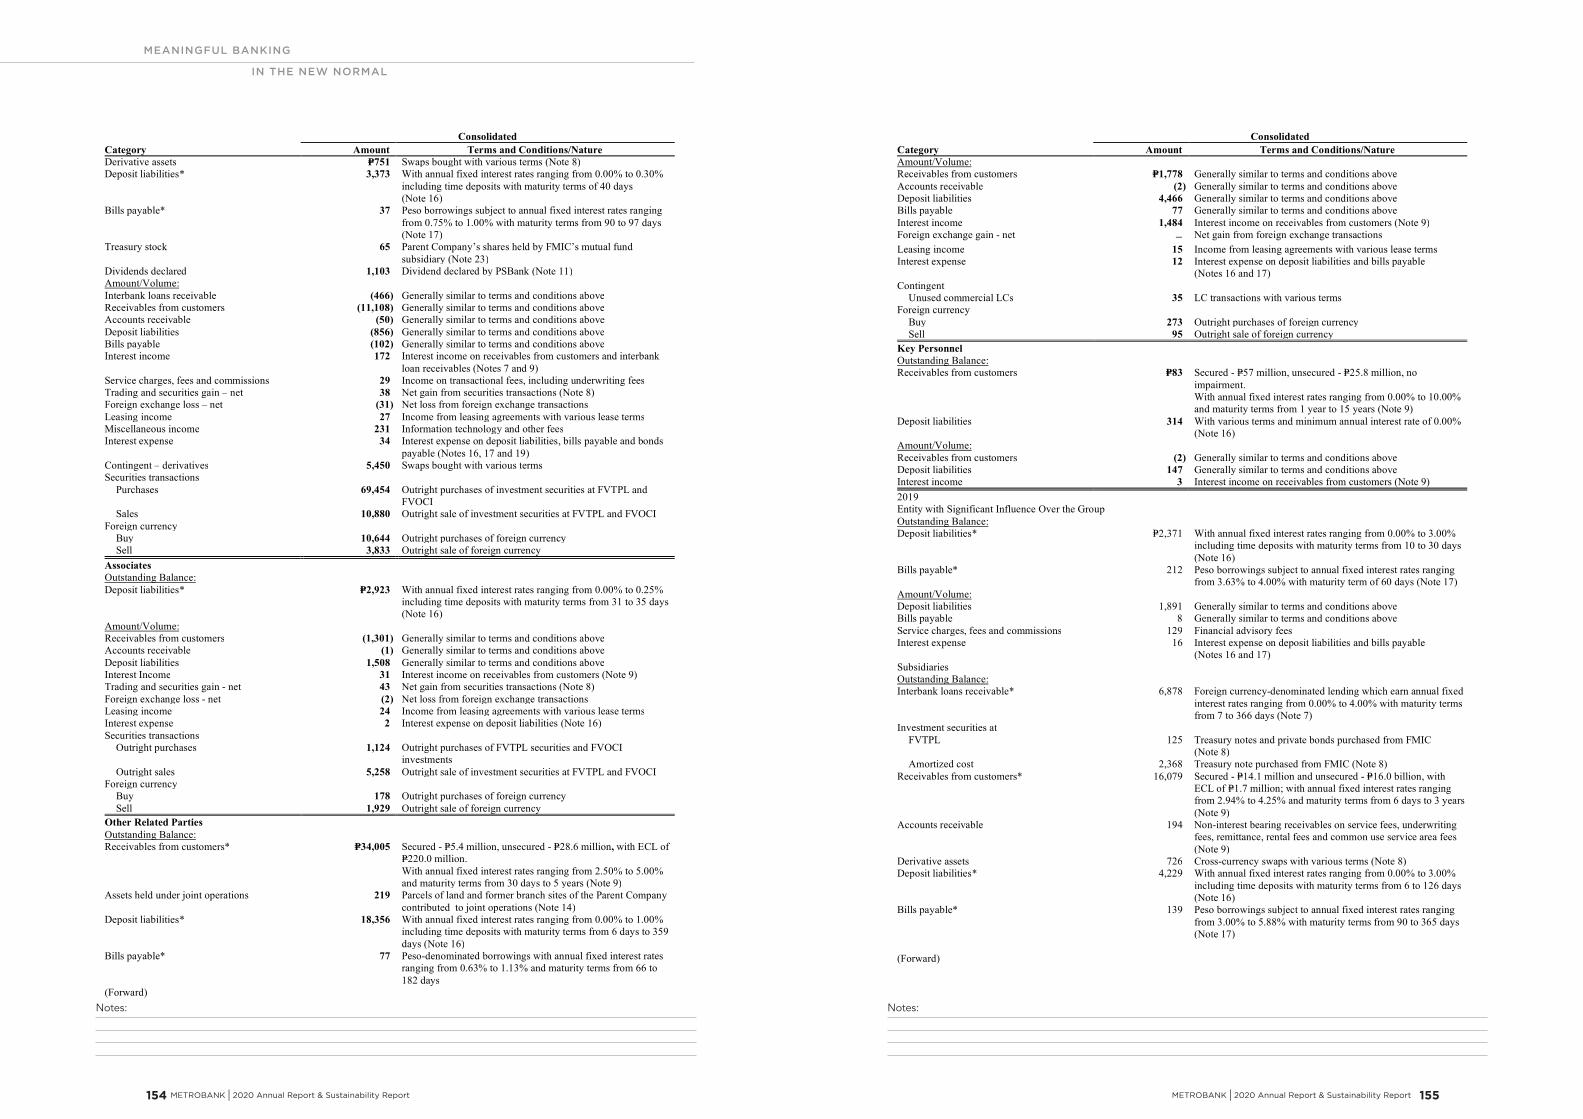
Notes:Notes:
MEANINGFUL BANKING
IN THE NEW NORMAL
METROBANK I 2020 Annual Report & Sustainability Report 155 154 METROBANK I 2020 Annual Report & Sustainability Report
- 123 -
*SGVFSM005911*
ConsolidatedCategory Amount Terms and Conditions/NatureDerivative assets P=751 Swaps bought with various terms (Note 8)Deposit liabilities* 3,373 With annual fixed interest rates ranging from 0.00% to 0.30%
including time deposits with maturity terms of 40 days(Note 16)
Bills payable* 37 Peso borrowings subject to annual fixed interest rates rangingfrom 0.75% to 1.00% with maturity terms from 90 to 97 days(Note 17)
Treasury stock 65 Parent Company’s shares held by FMIC’s mutual fundsubsidiary (Note 23)
Dividends declared 1,103 Dividend declared by PSBank (Note 11)Amount/Volume:Interbank loans receivable (466) Generally similar to terms and conditions aboveReceivables from customers (11,108) Generally similar to terms and conditions aboveAccounts receivable (50) Generally similar to terms and conditions aboveDeposit liabilities (856) Generally similar to terms and conditions aboveBills payable (102) Generally similar to terms and conditions aboveInterest income 172 Interest income on receivables from customers and interbank
loan receivables (Notes 7 and 9)Service charges, fees and commissions 29 Income on transactional fees, including underwriting feesTrading and securities gain – net 38 Net gain from securities transactions (Note 8)Foreign exchange loss – net (31) Net loss from foreign exchange transactionsLeasing income 27 Income from leasing agreements with various lease termsMiscellaneous income 231 Information technology and other feesInterest expense 34 Interest expense on deposit liabilities, bills payable and bonds
payable (Notes 16, 17 and 19)Contingent – derivatives 5,450 Swaps bought with various termsSecurities transactions Purchases 69,454 Outright purchases of investment securities at FVTPL and
FVOCI Sales 10,880 Outright sale of investment securities at FVTPL and FVOCIForeign currency
Buy 10,644 Outright purchases of foreign currency Sell 3,833 Outright sale of foreign currencyAssociatesOutstanding Balance:Deposit liabilities* P=2,923 With annual fixed interest rates ranging from 0.00% to 0.25%
including time deposits with maturity terms from 31 to 35 days(Note 16)
Amount/Volume:Receivables from customers (1,301) Generally similar to terms and conditions aboveAccounts receivable (1) Generally similar to terms and conditions aboveDeposit liabilities 1,508 Generally similar to terms and conditions aboveInterest Income 31 Interest income on receivables from customers (Note 9)Trading and securities gain - net 43 Net gain from securities transactions (Note 8)Foreign exchange loss - net (2) Net loss from foreign exchange transactionsLeasing income 24 Income from leasing agreements with various lease termsInterest expense 2 Interest expense on deposit liabilities (Note 16)Securities transactions Outright purchases 1,124 Outright purchases of FVTPL securities and FVOCI
investmentsOutright sales 5,258 Outright sale of investment securities at FVTPL and FVOCI
Foreign currency Buy 178 Outright purchases of foreign currency
Sell 1,929 Outright sale of foreign currencyOther Related PartiesOutstanding Balance:Receivables from customers* P=34,005 Secured - P=5.4 million, unsecured - P=28.6 million, with ECL of
P=220.0 million.With annual fixed interest rates ranging from 2.50% to 5.00%and maturity terms from 30 days to 5 years (Note 9)
Assets held under joint operations 219 Parcels of land and former branch sites of the Parent Companycontributed to joint operations (Note 14)
Deposit liabilities* 18,356 With annual fixed interest rates ranging from 0.00% to 1.00%including time deposits with maturity terms from 6 days to 359days (Note 16)
Bills payable* 77 Peso-denominated borrowings with annual fixed interest ratesranging from 0.63% to 1.13% and maturity terms from 66 to182 days
(Forward)
- 124 -
*SGVFSM005911*
ConsolidatedCategory Amount Terms and Conditions/NatureAmount/Volume:Receivables from customers P=1,778 Generally similar to terms and conditions aboveAccounts receivable (2) Generally similar to terms and conditions aboveDeposit liabilities 4,466 Generally similar to terms and conditions aboveBills payable 77 Generally similar to terms and conditions aboveInterest income 1,484 Interest income on receivables from customers (Note 9)Foreign exchange gain - net Net gain from foreign exchange transactionsLeasing income 15 Income from leasing agreements with various lease termsInterest expense 12 Interest expense on deposit liabilities and bills payable
(Notes 16 and 17)Contingent
Unused commercial LCs 35 LC transactions with various termsForeign currency
Buy 273 Outright purchases of foreign currencySell 95 Outright sale of foreign currency
Key PersonnelOutstanding Balance:Receivables from customers P=83 Secured - P=57 million, unsecured - P=25.8 million, no
impairment.With annual fixed interest rates ranging from 0.00% to 10.00%and maturity terms from 1 year to 15 years (Note 9)
Deposit liabilities 314 With various terms and minimum annual interest rate of 0.00%(Note 16)
Amount/Volume:Receivables from customers (2) Generally similar to terms and conditions aboveDeposit liabilities 147 Generally similar to terms and conditions aboveInterest income 3 Interest income on receivables from customers (Note 9)2019Entity with Significant Influence Over the GroupOutstanding Balance:Deposit liabilities* P=2,371 With annual fixed interest rates ranging from 0.00% to 3.00%
including time deposits with maturity terms from 10 to 30 days(Note 16)
Bills payable* 212 Peso borrowings subject to annual fixed interest rates rangingfrom 3.63% to 4.00% with maturity term of 60 days (Note 17)
Amount/Volume:Deposit liabilities 1,891 Generally similar to terms and conditions aboveBills payable 8 Generally similar to terms and conditions aboveService charges, fees and commissions 129 Financial advisory feesInterest expense 16 Interest expense on deposit liabilities and bills payable
(Notes 16 and 17)SubsidiariesOutstanding Balance:Interbank loans receivable* 6,878 Foreign currency-denominated lending which earn annual fixed
interest rates ranging from 0.00% to 4.00% with maturity termsfrom 7 to 366 days (Note 7)
Investment securities at FVTPL 125 Treasury notes and private bonds purchased from FMIC
(Note 8) Amortized cost 2,368 Treasury note purchased from FMIC (Note 8)Receivables from customers* 16,079 Secured - P=14.1 million and unsecured - P=16.0 billion, with
ECL of P=1.7 million; with annual fixed interest rates rangingfrom 2.94% to 4.25% and maturity terms from 6 days to 3 years(Note 9)
Accounts receivable 194 Non-interest bearing receivables on service fees, underwritingfees, remittance, rental fees and common use service area fees(Note 9)
Derivative assets 726 Cross-currency swaps with various terms (Note 8)Deposit liabilities* 4,229 With annual fixed interest rates ranging from 0.00% to 3.00%
including time deposits with maturity terms from 6 to 126 days(Note 16)
Bills payable* 139 Peso borrowings subject to annual fixed interest rates rangingfrom 3.00% to 5.88% with maturity terms from 90 to 365 days(Note 17)
(Forward)
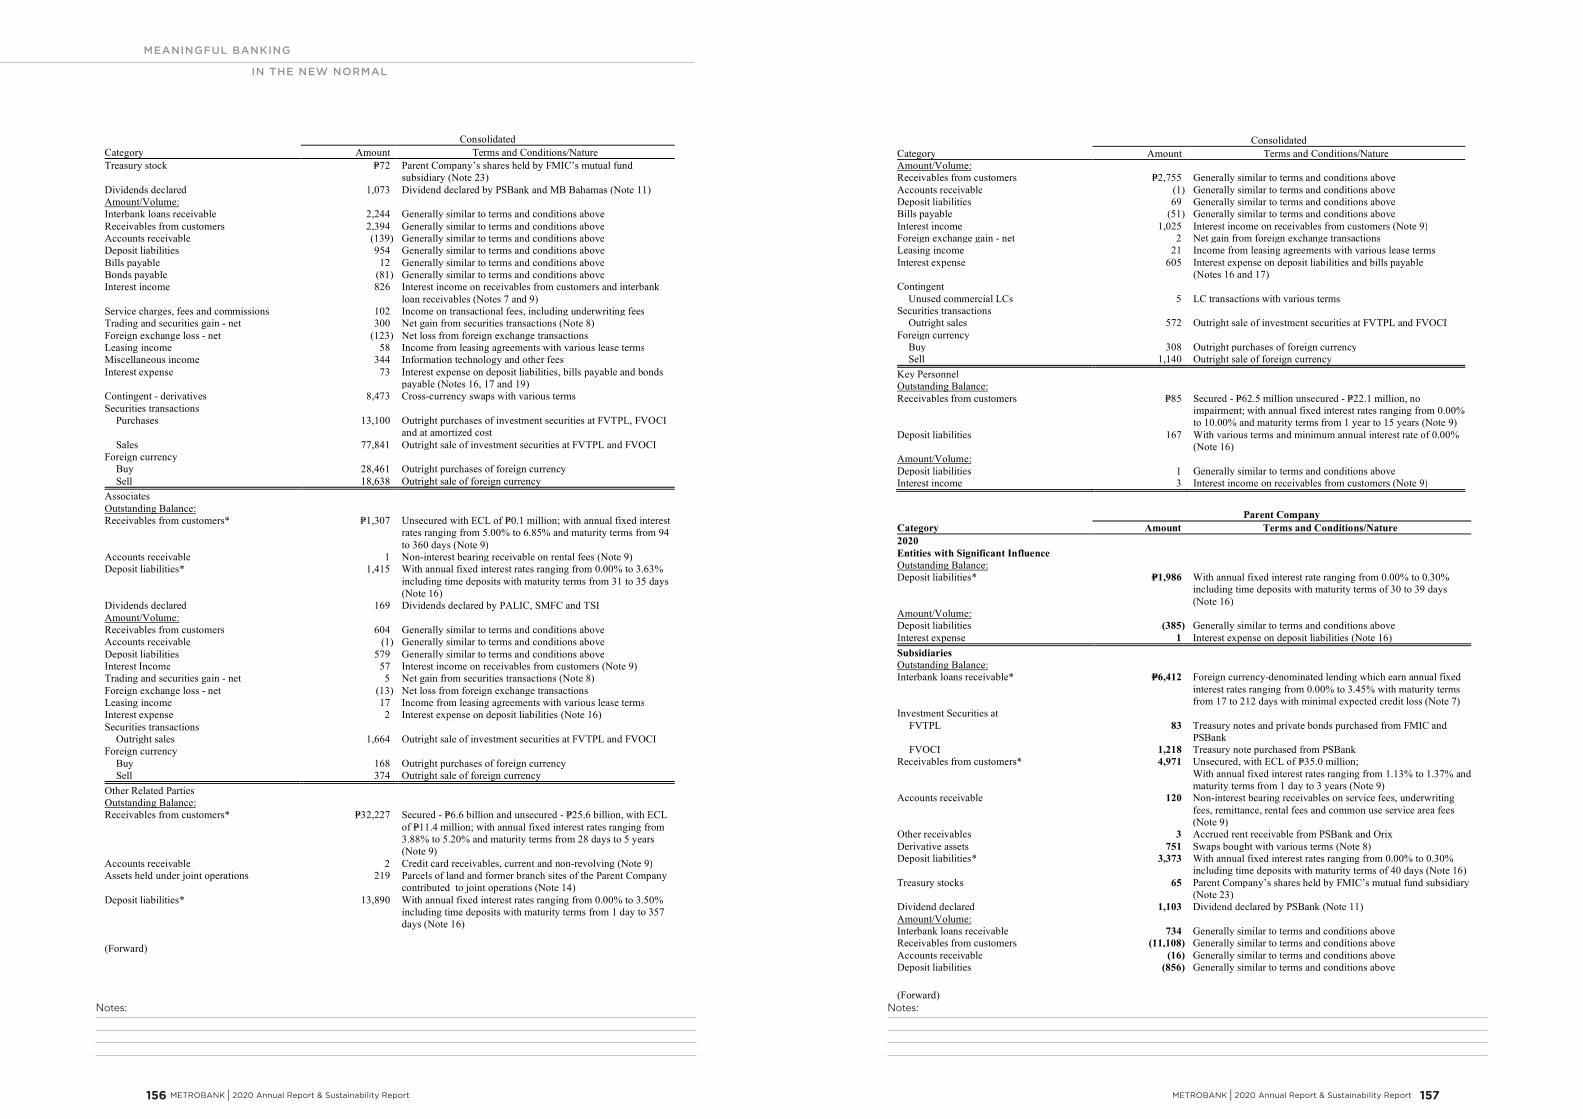
Notes:Notes:
MEANINGFUL BANKING
IN THE NEW NORMAL
METROBANK I 2020 Annual Report & Sustainability Report 157 156 METROBANK I 2020 Annual Report & Sustainability Report
- 125 -
*SGVFSM005911*
ConsolidatedCategory Amount Terms and Conditions/NatureTreasury stock P=72 Parent Company’s shares held by FMIC’s mutual fund
subsidiary (Note 23)Dividends declared 1,073 Dividend declared by PSBank and MB Bahamas (Note 11)Amount/Volume:Interbank loans receivable 2,244 Generally similar to terms and conditions aboveReceivables from customers 2,394 Generally similar to terms and conditions aboveAccounts receivable (139) Generally similar to terms and conditions aboveDeposit liabilities 954 Generally similar to terms and conditions aboveBills payable 12 Generally similar to terms and conditions aboveBonds payable (81) Generally similar to terms and conditions aboveInterest income 826 Interest income on receivables from customers and interbank
loan receivables (Notes 7 and 9)Service charges, fees and commissions 102 Income on transactional fees, including underwriting feesTrading and securities gain - net 300 Net gain from securities transactions (Note 8)Foreign exchange loss - net (123) Net loss from foreign exchange transactionsLeasing income 58 Income from leasing agreements with various lease termsMiscellaneous income 344 Information technology and other feesInterest expense 73 Interest expense on deposit liabilities, bills payable and bonds
payable (Notes 16, 17 and 19)Contingent - derivatives 8,473 Cross-currency swaps with various termsSecurities transactions Purchases 13,100 Outright purchases of investment securities at FVTPL, FVOCI
and at amortized costSales 77,841 Outright sale of investment securities at FVTPL and FVOCI
Foreign currency Buy 28,461 Outright purchases of foreign currency
Sell 18,638 Outright sale of foreign currencyAssociatesOutstanding Balance:Receivables from customers* P=1,307 Unsecured with ECL of P=0.1 million; with annual fixed interest
rates ranging from 5.00% to 6.85% and maturity terms from 94to 360 days (Note 9)
Accounts receivable 1 Non-interest bearing receivable on rental fees (Note 9)Deposit liabilities* 1,415 With annual fixed interest rates ranging from 0.00% to 3.63%
including time deposits with maturity terms from 31 to 35 days(Note 16)
Dividends declared 169 Dividends declared by PALIC, SMFC and TSIAmount/Volume:Receivables from customers 604 Generally similar to terms and conditions aboveAccounts receivable (1) Generally similar to terms and conditions aboveDeposit liabilities 579 Generally similar to terms and conditions aboveInterest Income 57 Interest income on receivables from customers (Note 9)Trading and securities gain - net 5 Net gain from securities transactions (Note 8)Foreign exchange loss - net (13) Net loss from foreign exchange transactionsLeasing income 17 Income from leasing agreements with various lease termsInterest expense 2 Interest expense on deposit liabilities (Note 16)Securities transactions
Outright sales 1,664 Outright sale of investment securities at FVTPL and FVOCIForeign currency
Buy 168 Outright purchases of foreign currencySell 374 Outright sale of foreign currency
Other Related PartiesOutstanding Balance:Receivables from customers* P=32,227 Secured - P=6.6 billion and unsecured - P=25.6 billion, with ECL
of P=11.4 million; with annual fixed interest rates ranging from3.88% to 5.20% and maturity terms from 28 days to 5 years(Note 9)
Accounts receivable 2 Credit card receivables, current and non-revolving (Note 9)Assets held under joint operations 219 Parcels of land and former branch sites of the Parent Company
contributed to joint operations (Note 14)Deposit liabilities* 13,890 With annual fixed interest rates ranging from 0.00% to 3.50%
including time deposits with maturity terms from 1 day to 357days (Note 16)
(Forward)
- 126 -
*SGVFSM005911*
ConsolidatedCategory Amount Terms and Conditions/NatureAmount/Volume:Receivables from customers P=2,755 Generally similar to terms and conditions aboveAccounts receivable (1) Generally similar to terms and conditions aboveDeposit liabilities 69 Generally similar to terms and conditions aboveBills payable (51) Generally similar to terms and conditions aboveInterest income 1,025 Interest income on receivables from customers (Note 9)Foreign exchange gain - net 2 Net gain from foreign exchange transactionsLeasing income 21 Income from leasing agreements with various lease termsInterest expense 605 Interest expense on deposit liabilities and bills payable
(Notes 16 and 17)Contingent
Unused commercial LCs 5 LC transactions with various termsSecurities transactions
Outright sales 572 Outright sale of investment securities at FVTPL and FVOCIForeign currency
Buy 308 Outright purchases of foreign currency Sell 1,140 Outright sale of foreign currencyKey PersonnelOutstanding Balance:Receivables from customers P=85 Secured - P=62.5 million unsecured - P=22.1 million, no
impairment; with annual fixed interest rates ranging from 0.00%to 10.00% and maturity terms from 1 year to 15 years (Note 9)
Deposit liabilities 167 With various terms and minimum annual interest rate of 0.00%(Note 16)
Amount/Volume:Deposit liabilities 1 Generally similar to terms and conditions aboveInterest income 3 Interest income on receivables from customers (Note 9)
Parent CompanyCategory Amount Terms and Conditions/Nature2020Entities with Significant InfluenceOutstanding Balance:Deposit liabilities* P=1,986 With annual fixed interest rate ranging from 0.00% to 0.30%
including time deposits with maturity terms of 30 to 39 days(Note 16)
Amount/Volume:Deposit liabilities (385) Generally similar to terms and conditions aboveInterest expense 1 Interest expense on deposit liabilities (Note 16)SubsidiariesOutstanding Balance:Interbank loans receivable* P=6,412 Foreign currency-denominated lending which earn annual fixed
interest rates ranging from 0.00% to 3.45% with maturity termsfrom 17 to 212 days with minimal expected credit loss (Note 7)
Investment Securities atFVTPL 83 Treasury notes and private bonds purchased from FMIC and
PSBankFVOCI 1,218 Treasury note purchased from PSBank
Receivables from customers* 4,971 Unsecured, with ECL of P=35.0 million;With annual fixed interest rates ranging from 1.13% to 1.37% andmaturity terms from 1 day to 3 years (Note 9)
Accounts receivable 120 Non-interest bearing receivables on service fees, underwritingfees, remittance, rental fees and common use service area fees(Note 9)
Other receivables 3 Accrued rent receivable from PSBank and OrixDerivative assets 751 Swaps bought with various terms (Note 8)Deposit liabilities* 3,373 With annual fixed interest rates ranging from 0.00% to 0.30%
including time deposits with maturity terms of 40 days (Note 16)Treasury stocks 65 Parent Company’s shares held by FMIC’s mutual fund subsidiary
(Note 23)Dividend declared 1,103 Dividend declared by PSBank (Note 11)Amount/Volume:Interbank loans receivable 734 Generally similar to terms and conditions aboveReceivables from customers (11,108) Generally similar to terms and conditions aboveAccounts receivable (16) Generally similar to terms and conditions aboveDeposit liabilities (856) Generally similar to terms and conditions above
(Forward)
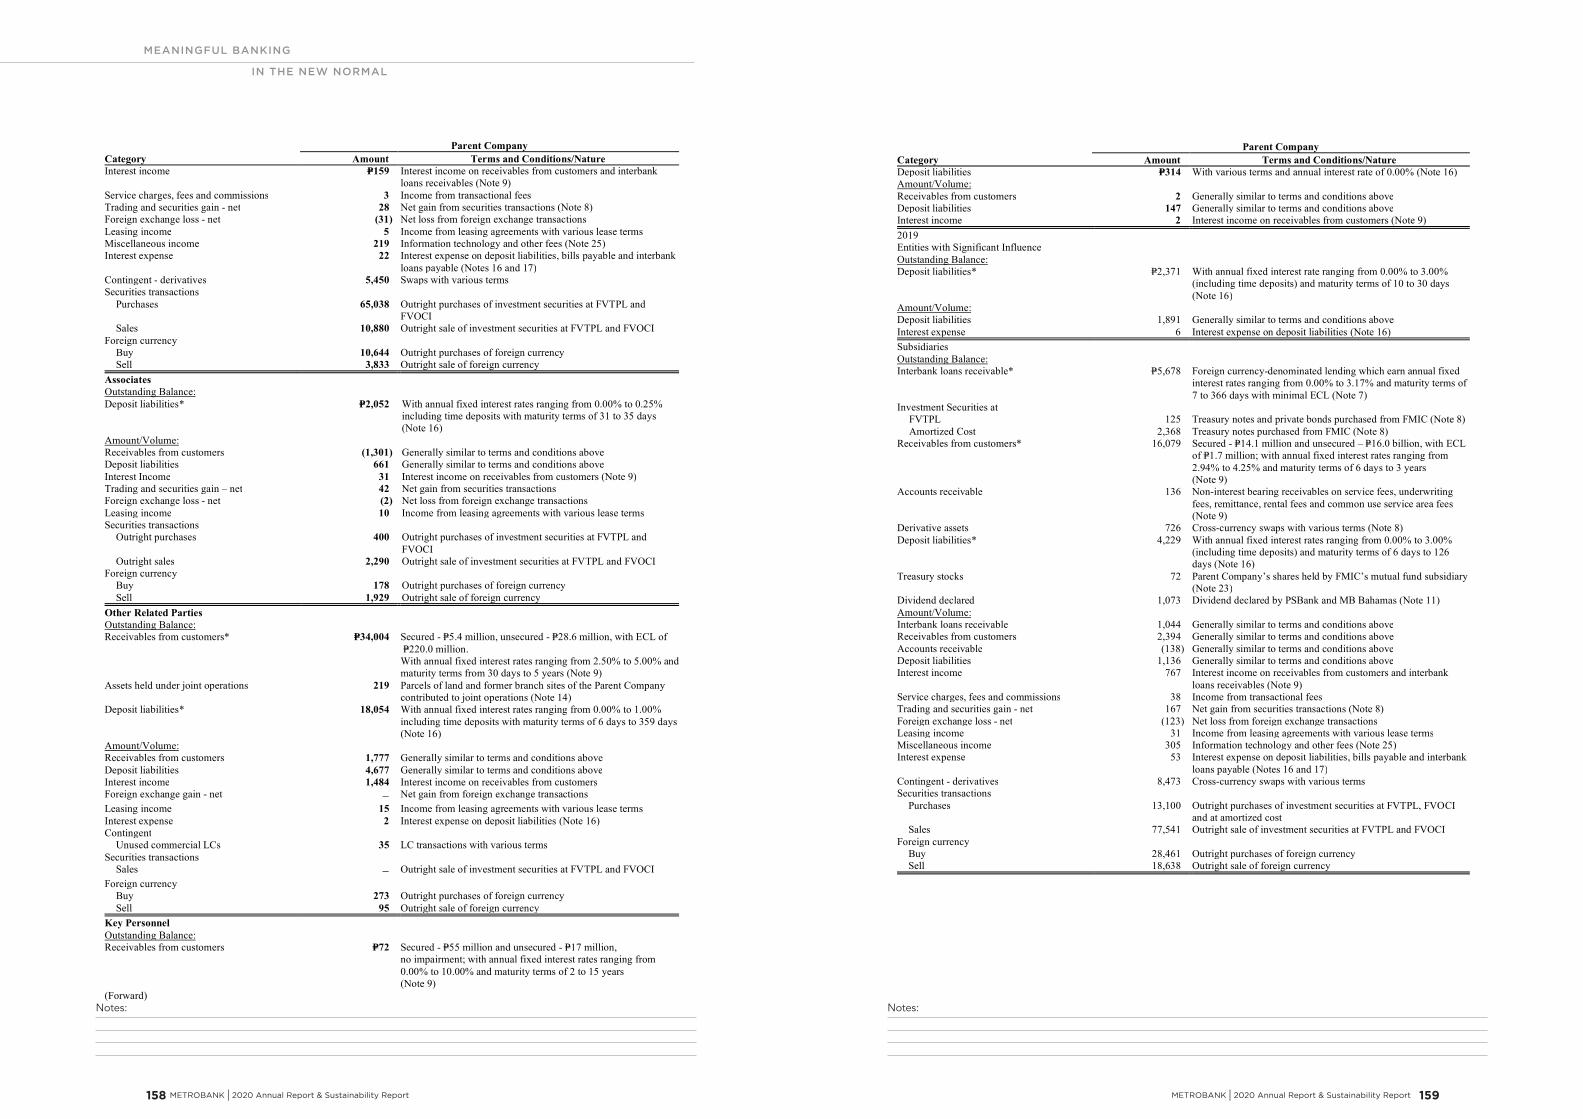
Notes:Notes:
MEANINGFUL BANKING
IN THE NEW NORMAL
METROBANK I 2020 Annual Report & Sustainability Report 159 158 METROBANK I 2020 Annual Report & Sustainability Report
- 127 -
*SGVFSM005911*
Parent CompanyCategory Amount Terms and Conditions/NatureInterest income P=159 Interest income on receivables from customers and interbank
loans receivables (Note 9)Service charges, fees and commissions 3 Income from transactional feesTrading and securities gain - net 28 Net gain from securities transactions (Note 8)Foreign exchange loss - net (31) Net loss from foreign exchange transactionsLeasing income 5 Income from leasing agreements with various lease termsMiscellaneous income 219 Information technology and other fees (Note 25)Interest expense 22 Interest expense on deposit liabilities, bills payable and interbank
loans payable (Notes 16 and 17)Contingent - derivatives 5,450 Swaps with various termsSecurities transactions Purchases 65,038 Outright purchases of investment securities at FVTPL and
FVOCI Sales 10,880 Outright sale of investment securities at FVTPL and FVOCIForeign currency
Buy 10,644 Outright purchases of foreign currency Sell 3,833 Outright sale of foreign currencyAssociatesOutstanding Balance:Deposit liabilities* P=2,052 With annual fixed interest rates ranging from 0.00% to 0.25%
including time deposits with maturity terms of 31 to 35 days(Note 16)
Amount/Volume:Receivables from customers (1,301) Generally similar to terms and conditions aboveDeposit liabilities 661 Generally similar to terms and conditions aboveInterest Income 31 Interest income on receivables from customers (Note 9)Trading and securities gain – net 42 Net gain from securities transactionsForeign exchange loss - net (2) Net loss from foreign exchange transactionsLeasing income 10 Income from leasing agreements with various lease termsSecurities transactions Outright purchases 400 Outright purchases of investment securities at FVTPL and
FVOCIOutright sales 2,290 Outright sale of investment securities at FVTPL and FVOCI
Foreign currency Buy 178 Outright purchases of foreign currency
Sell 1,929 Outright sale of foreign currencyOther Related PartiesOutstanding Balance:Receivables from customers* P=34,004 Secured - P=5.4 million, unsecured - P=28.6 million, with ECL of
P=220.0 million.With annual fixed interest rates ranging from 2.50% to 5.00% andmaturity terms from 30 days to 5 years (Note 9)
Assets held under joint operations 219 Parcels of land and former branch sites of the Parent Companycontributed to joint operations (Note 14)
Deposit liabilities* 18,054 With annual fixed interest rates ranging from 0.00% to 1.00%including time deposits with maturity terms of 6 days to 359 days(Note 16)
Amount/Volume:Receivables from customers 1,777 Generally similar to terms and conditions aboveDeposit liabilities 4,677 Generally similar to terms and conditions aboveInterest income 1,484 Interest income on receivables from customersForeign exchange gain - net Net gain from foreign exchange transactionsLeasing income 15 Income from leasing agreements with various lease termsInterest expense 2 Interest expense on deposit liabilities (Note 16)Contingent Unused commercial LCs 35 LC transactions with various termsSecurities transactions Sales Outright sale of investment securities at FVTPL and FVOCIForeign currency Buy 273 Outright purchases of foreign currency
Sell 95 Outright sale of foreign currencyKey PersonnelOutstanding Balance:Receivables from customers P=72 Secured - P=55 million and unsecured - P=17 million,
no impairment; with annual fixed interest rates ranging from0.00% to 10.00% and maturity terms of 2 to 15 years(Note 9)
(Forward)
- 128 -
*SGVFSM005911*
Parent CompanyCategory Amount Terms and Conditions/NatureDeposit liabilities P=314 With various terms and annual interest rate of 0.00% (Note 16)Amount/Volume:Receivables from customers 2 Generally similar to terms and conditions aboveDeposit liabilities 147 Generally similar to terms and conditions aboveInterest income 2 Interest income on receivables from customers (Note 9)2019Entities with Significant InfluenceOutstanding Balance:Deposit liabilities* P=2,371 With annual fixed interest rate ranging from 0.00% to 3.00%
(including time deposits) and maturity terms of 10 to 30 days(Note 16)
Amount/Volume:Deposit liabilities 1,891 Generally similar to terms and conditions aboveInterest expense 6 Interest expense on deposit liabilities (Note 16)SubsidiariesOutstanding Balance:Interbank loans receivable* P=5,678 Foreign currency-denominated lending which earn annual fixed
interest rates ranging from 0.00% to 3.17% and maturity terms of7 to 366 days with minimal ECL (Note 7)
Investment Securities atFVTPL 125 Treasury notes and private bonds purchased from FMIC (Note 8)Amortized Cost 2,368 Treasury notes purchased from FMIC (Note 8)
Receivables from customers* 16,079 Secured - P=14.1 million and unsecured – P=16.0 billion, with ECLof P=1.7 million; with annual fixed interest rates ranging from2.94% to 4.25% and maturity terms of 6 days to 3 years(Note 9)
Accounts receivable 136 Non-interest bearing receivables on service fees, underwritingfees, remittance, rental fees and common use service area fees(Note 9)
Derivative assets 726 Cross-currency swaps with various terms (Note 8)Deposit liabilities* 4,229 With annual fixed interest rates ranging from 0.00% to 3.00%
(including time deposits) and maturity terms of 6 days to 126days (Note 16)
Treasury stocks 72 Parent Company’s shares held by FMIC’s mutual fund subsidiary(Note 23)
Dividend declared 1,073 Dividend declared by PSBank and MB Bahamas (Note 11)Amount/Volume:Interbank loans receivable 1,044 Generally similar to terms and conditions aboveReceivables from customers 2,394 Generally similar to terms and conditions aboveAccounts receivable (138) Generally similar to terms and conditions aboveDeposit liabilities 1,136 Generally similar to terms and conditions aboveInterest income 767 Interest income on receivables from customers and interbank
loans receivables (Note 9)Service charges, fees and commissions 38 Income from transactional feesTrading and securities gain - net 167 Net gain from securities transactions (Note 8)Foreign exchange loss - net (123) Net loss from foreign exchange transactionsLeasing income 31 Income from leasing agreements with various lease termsMiscellaneous income 305 Information technology and other fees (Note 25)Interest expense 53 Interest expense on deposit liabilities, bills payable and interbank
loans payable (Notes 16 and 17)Contingent - derivatives 8,473 Cross-currency swaps with various termsSecurities transactions Purchases 13,100 Outright purchases of investment securities at FVTPL, FVOCI
and at amortized cost Sales 77,541 Outright sale of investment securities at FVTPL and FVOCIForeign currency
Buy 28,461 Outright purchases of foreign currency Sell 18,638 Outright sale of foreign currency
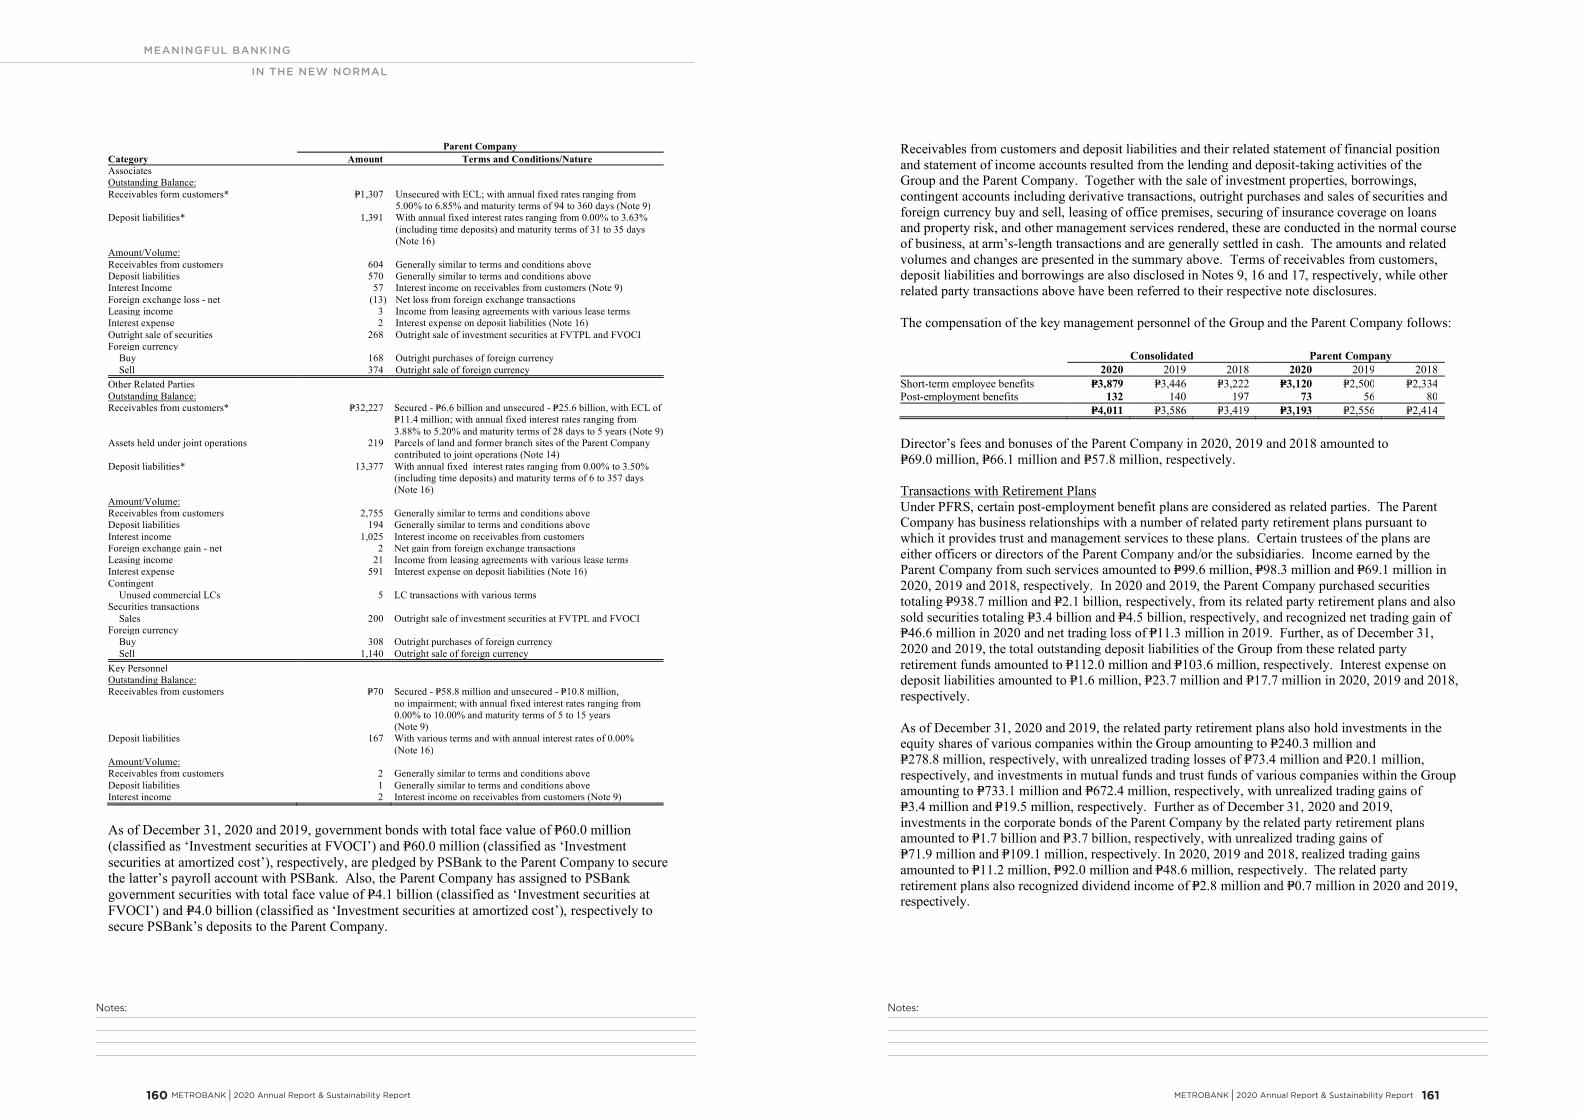
Notes:Notes:
MEANINGFUL BANKING
IN THE NEW NORMAL
METROBANK I 2020 Annual Report & Sustainability Report 161 160 METROBANK I 2020 Annual Report & Sustainability Report
- 129 -
*SGVFSM005911*
Parent CompanyCategory Amount Terms and Conditions/NatureAssociatesOutstanding Balance:Receivables form customers* P=1,307 Unsecured with ECL; with annual fixed rates ranging from
5.00% to 6.85% and maturity terms of 94 to 360 days (Note 9)Deposit liabilities* 1,391 With annual fixed interest rates ranging from 0.00% to 3.63%
(including time deposits) and maturity terms of 31 to 35 days(Note 16)
Amount/Volume:Receivables from customers 604 Generally similar to terms and conditions aboveDeposit liabilities 570 Generally similar to terms and conditions aboveInterest Income 57 Interest income on receivables from customers (Note 9)Foreign exchange loss - net (13) Net loss from foreign exchange transactionsLeasing income 3 Income from leasing agreements with various lease termsInterest expense 2 Interest expense on deposit liabilities (Note 16)Outright sale of securities 268 Outright sale of investment securities at FVTPL and FVOCIForeign currency Buy 168 Outright purchases of foreign currency
Sell 374 Outright sale of foreign currencyOther Related PartiesOutstanding Balance:Receivables from customers* P=32,227 Secured - P=6.6 billion and unsecured - P=25.6 billion, with ECL of
P=11.4 million; with annual fixed interest rates ranging from3.88% to 5.20% and maturity terms of 28 days to 5 years (Note 9)
Assets held under joint operations 219 Parcels of land and former branch sites of the Parent Companycontributed to joint operations (Note 14)
Deposit liabilities* 13,377 With annual fixed interest rates ranging from 0.00% to 3.50%(including time deposits) and maturity terms of 6 to 357 days(Note 16)
Amount/Volume:Receivables from customers 2,755 Generally similar to terms and conditions aboveDeposit liabilities 194 Generally similar to terms and conditions aboveInterest income 1,025 Interest income on receivables from customersForeign exchange gain - net 2 Net gain from foreign exchange transactionsLeasing income 21 Income from leasing agreements with various lease termsInterest expense 591 Interest expense on deposit liabilities (Note 16)Contingent
Unused commercial LCs 5 LC transactions with various termsSecurities transactions
Sales 200 Outright sale of investment securities at FVTPL and FVOCIForeign currency Buy 308 Outright purchases of foreign currency
Sell 1,140 Outright sale of foreign currencyKey PersonnelOutstanding Balance:Receivables from customers P=70 Secured - P=58.8 million and unsecured - P=10.8 million,
no impairment; with annual fixed interest rates ranging from0.00% to 10.00% and maturity terms of 5 to 15 years(Note 9)
Deposit liabilities 167 With various terms and with annual interest rates of 0.00%(Note 16)
Amount/Volume:Receivables from customers 2 Generally similar to terms and conditions aboveDeposit liabilities 1 Generally similar to terms and conditions aboveInterest income 2 Interest income on receivables from customers (Note 9)
As of December 31, 2020 and 2019, government bonds with total face value of P=60.0 million(classified as ‘Investment securities at FVOCI’) and P=60.0 million (classified as ‘Investmentsecurities at amortized cost’), respectively, are pledged by PSBank to the Parent Company to securethe latter’s payroll account with PSBank. Also, the Parent Company has assigned to PSBankgovernment securities with total face value of P=4.1 billion (classified as ‘Investment securities atFVOCI’) and P=4.0 billion (classified as ‘Investment securities at amortized cost’), respectively tosecure PSBank’s deposits to the Parent Company.
- 130 -
*SGVFSM005911*
Receivables from customers and deposit liabilities and their related statement of financial positionand statement of income accounts resulted from the lending and deposit-taking activities of theGroup and the Parent Company. Together with the sale of investment properties, borrowings,contingent accounts including derivative transactions, outright purchases and sales of securities andforeign currency buy and sell, leasing of office premises, securing of insurance coverage on loansand property risk, and other management services rendered, these are conducted in the normal courseof business, at arm’s-length transactions and are generally settled in cash. The amounts and relatedvolumes and changes are presented in the summary above. Terms of receivables from customers,deposit liabilities and borrowings are also disclosed in Notes 9, 16 and 17, respectively, while otherrelated party transactions above have been referred to their respective note disclosures.
The compensation of the key management personnel of the Group and the Parent Company follows:
Consolidated Parent Company2020 2019 2018 2020 2019 2018
Short-term employee benefits P=3,879 P=3,446 P=3,222 P=3,120 P=2,500 P=2,334Post-employment benefits 132 140 197 73 56 80
P=4,011 P=3,586 P=3,419 P=3,193 P=2,556 P=2,414
Director’s fees and bonuses of the Parent Company in 2020, 2019 and 2018 amounted toP=69.0 million, P=66.1 million and P=57.8 million, respectively.
Transactions with Retirement PlansUnder PFRS, certain post-employment benefit plans are considered as related parties. The ParentCompany has business relationships with a number of related party retirement plans pursuant towhich it provides trust and management services to these plans. Certain trustees of the plans areeither officers or directors of the Parent Company and/or the subsidiaries. Income earned by theParent Company from such services amounted to P=99.6 million, P=98.3 million and P=69.1 million in2020, 2019 and 2018, respectively. In 2020 and 2019, the Parent Company purchased securitiestotaling P=938.7 million and P=2.1 billion, respectively, from its related party retirement plans and alsosold securities totaling P=3.4 billion and P=4.5 billion, respectively, and recognized net trading gain ofP=46.6 million in 2020 and net trading loss of P=11.3 million in 2019. Further, as of December 31,2020 and 2019, the total outstanding deposit liabilities of the Group from these related partyretirement funds amounted to P=112.0 million and P=103.6 million, respectively. Interest expense ondeposit liabilities amounted to P=1.6 million, P=23.7 million and P=17.7 million in 2020, 2019 and 2018,respectively.
As of December 31, 2020 and 2019, the related party retirement plans also hold investments in theequity shares of various companies within the Group amounting to P=240.3 million andP=278.8 million, respectively, with unrealized trading losses of P=73.4 million and P=20.1 million,respectively, and investments in mutual funds and trust funds of various companies within the Groupamounting to P=733.1 million and P=672.4 million, respectively, with unrealized trading gains ofP=3.4 million and P=19.5 million, respectively. Further as of December 31, 2020 and 2019,investments in the corporate bonds of the Parent Company by the related party retirement plansamounted to P=1.7 billion and P=3.7 billion, respectively, with unrealized trading gains ofP=71.9 million and P=109.1 million, respectively. In 2020, 2019 and 2018, realized trading gainsamounted to P=11.2 million, P=92.0 million and P=48.6 million, respectively. The related partyretirement plans also recognized dividend income of P=2.8 million and P=0.7 million in 2020 and 2019,respectively.
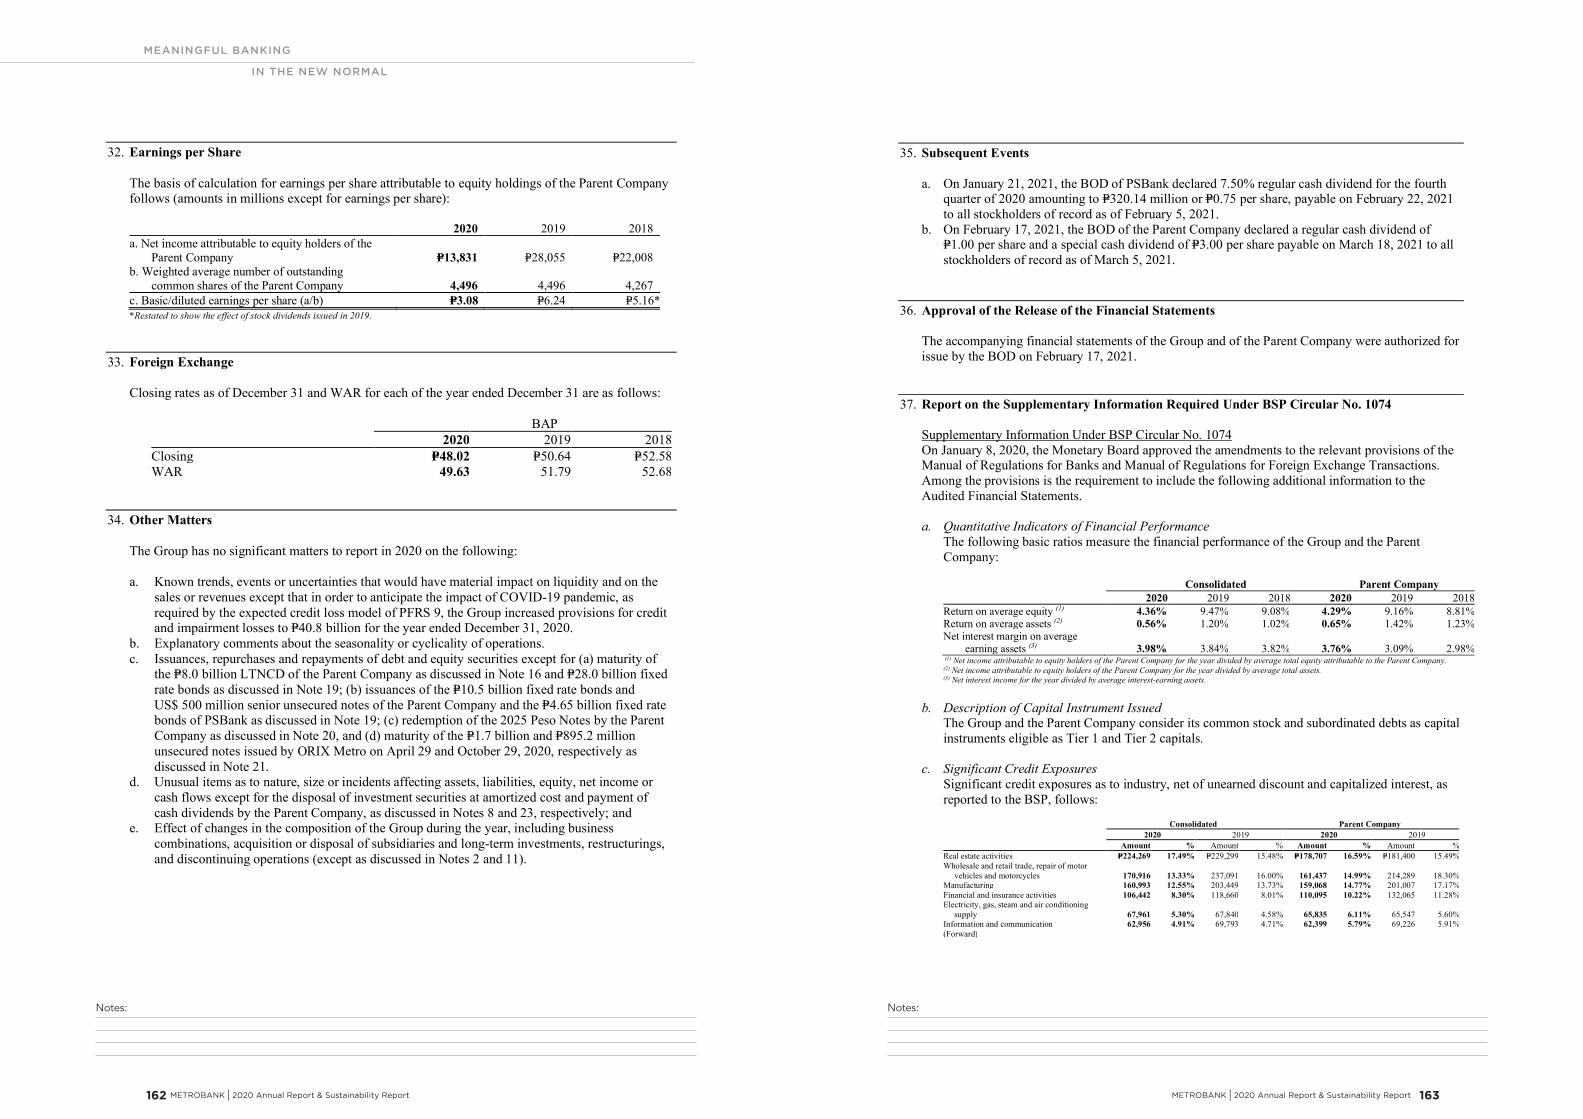
Notes:Notes:
MEANINGFUL BANKING
IN THE NEW NORMAL
METROBANK I 2020 Annual Report & Sustainability Report 163 162 METROBANK I 2020 Annual Report & Sustainability Report
- 131 -
*SGVFSM005911*
32. Earnings per Share
The basis of calculation for earnings per share attributable to equity holdings of the Parent Companyfollows (amounts in millions except for earnings per share):
2020 2019 2018a. Net income attributable to equity holders of the
Parent Company P=13,831 P=28,055 P=22,008b. Weighted average number of outstanding
common shares of the Parent Company 4,496 4,496 4,267c. Basic/diluted earnings per share (a/b) P=3.08 P=6.24 P=5.16**Restated to show the effect of stock dividends issued in 2019.
33. Foreign Exchange
Closing rates as of December 31 and WAR for each of the year ended December 31 are as follows:
BAP2020 2019 2018
Closing P=48.02 P=50.64 P=52.58WAR 49.63 51.79 52.68
34. Other Matters
The Group has no significant matters to report in 2020 on the following:
a. Known trends, events or uncertainties that would have material impact on liquidity and on thesales or revenues except that in order to anticipate the impact of COVID-19 pandemic, asrequired by the expected credit loss model of PFRS 9, the Group increased provisions for creditand impairment losses to P=40.8 billion for the year ended December 31, 2020.
b. Explanatory comments about the seasonality or cyclicality of operations.c. Issuances, repurchases and repayments of debt and equity securities except for (a) maturity of
the P=8.0 billion LTNCD of the Parent Company as discussed in Note 16 and P=28.0 billion fixedrate bonds as discussed in Note 19; (b) issuances of the P=10.5 billion fixed rate bonds andUS$ 500 million senior unsecured notes of the Parent Company and the P=4.65 billion fixed ratebonds of PSBank as discussed in Note 19; (c) redemption of the 2025 Peso Notes by the ParentCompany as discussed in Note 20, and (d) maturity of the P=1.7 billion and P=895.2 millionunsecured notes issued by ORIX Metro on April 29 and October 29, 2020, respectively asdiscussed in Note 21.
d. Unusual items as to nature, size or incidents affecting assets, liabilities, equity, net income orcash flows except for the disposal of investment securities at amortized cost and payment ofcash dividends by the Parent Company, as discussed in Notes 8 and 23, respectively; and
e. Effect of changes in the composition of the Group during the year, including businesscombinations, acquisition or disposal of subsidiaries and long-term investments, restructurings,and discontinuing operations (except as discussed in Notes 2 and 11).
- 132 -
*SGVFSM005911*
35. Subsequent Events
a. On January 21, 2021, the BOD of PSBank declared 7.50% regular cash dividend for the fourthquarter of 2020 amounting to P=320.14 million or P=0.75 per share, payable on February 22, 2021to all stockholders of record as of February 5, 2021.
b. On February 17, 2021, the BOD of the Parent Company declared a regular cash dividend ofP=1.00 per share and a special cash dividend of P=3.00 per share payable on March 18, 2021 to allstockholders of record as of March 5, 2021.
36. Approval of the Release of the Financial Statements
The accompanying financial statements of the Group and of the Parent Company were authorized forissue by the BOD on February 17, 2021.
37. Report on the Supplementary Information Required Under BSP Circular No. 1074
Supplementary Information Under BSP Circular No. 1074On January 8, 2020, the Monetary Board approved the amendments to the relevant provisions of theManual of Regulations for Banks and Manual of Regulations for Foreign Exchange Transactions.Among the provisions is the requirement to include the following additional information to theAudited Financial Statements.
a. Quantitative Indicators of Financial PerformanceThe following basic ratios measure the financial performance of the Group and the ParentCompany:
Consolidated Parent Company2020 2019 2018 2020 2019 2018
Return on average equity (1) 4.36% 9.47% 9.08% 4.29% 9.16% 8.81%Return on average assets (2) 0.56% 1.20% 1.02% 0.65% 1.42% 1.23%Net interest margin on average
earning assets (3) 3.98% 3.84% 3.82% 3.76% 3.09% 2.98% (1) Net income attributable to equity holders of the Parent Company for the year divided by average total equity attributable to the Parent Company.(2) Net income attributable to equity holders of the Parent Company for the year divided by average total assets.(3) Net interest income for the year divided by average interest-earning assets.
b. Description of Capital Instrument IssuedThe Group and the Parent Company consider its common stock and subordinated debts as capitalinstruments eligible as Tier 1 and Tier 2 capitals.
c. Significant Credit ExposuresSignificant credit exposures as to industry, net of unearned discount and capitalized interest, asreported to the BSP, follows:
Consolidated Parent Company2020 2019 2020 2019
Amount % Amount % Amount % Amount %Real estate activities P=224,269 17.49% P=229,299 15.48% P=178,707 16.59% P=181,400 15.49%Wholesale and retail trade, repair of motor
vehicles and motorcycles 170,916 13.33% 237,091 16.00% 161,437 14.99% 214,289 18.30%Manufacturing 160,993 12.55% 203,449 13.73% 159,068 14.77% 201,007 17.17%Financial and insurance activities 106,442 8.30% 118,660 8.01% 110,095 10.22% 132,065 11.28%Electricity, gas, steam and air conditioning
supply 67,961 5.30% 67,840 4.58% 65,835 6.11% 65,547 5.60%Information and communication 62,956 4.91% 69,793 4.71% 62,399 5.79% 69,226 5.91%(Forward)
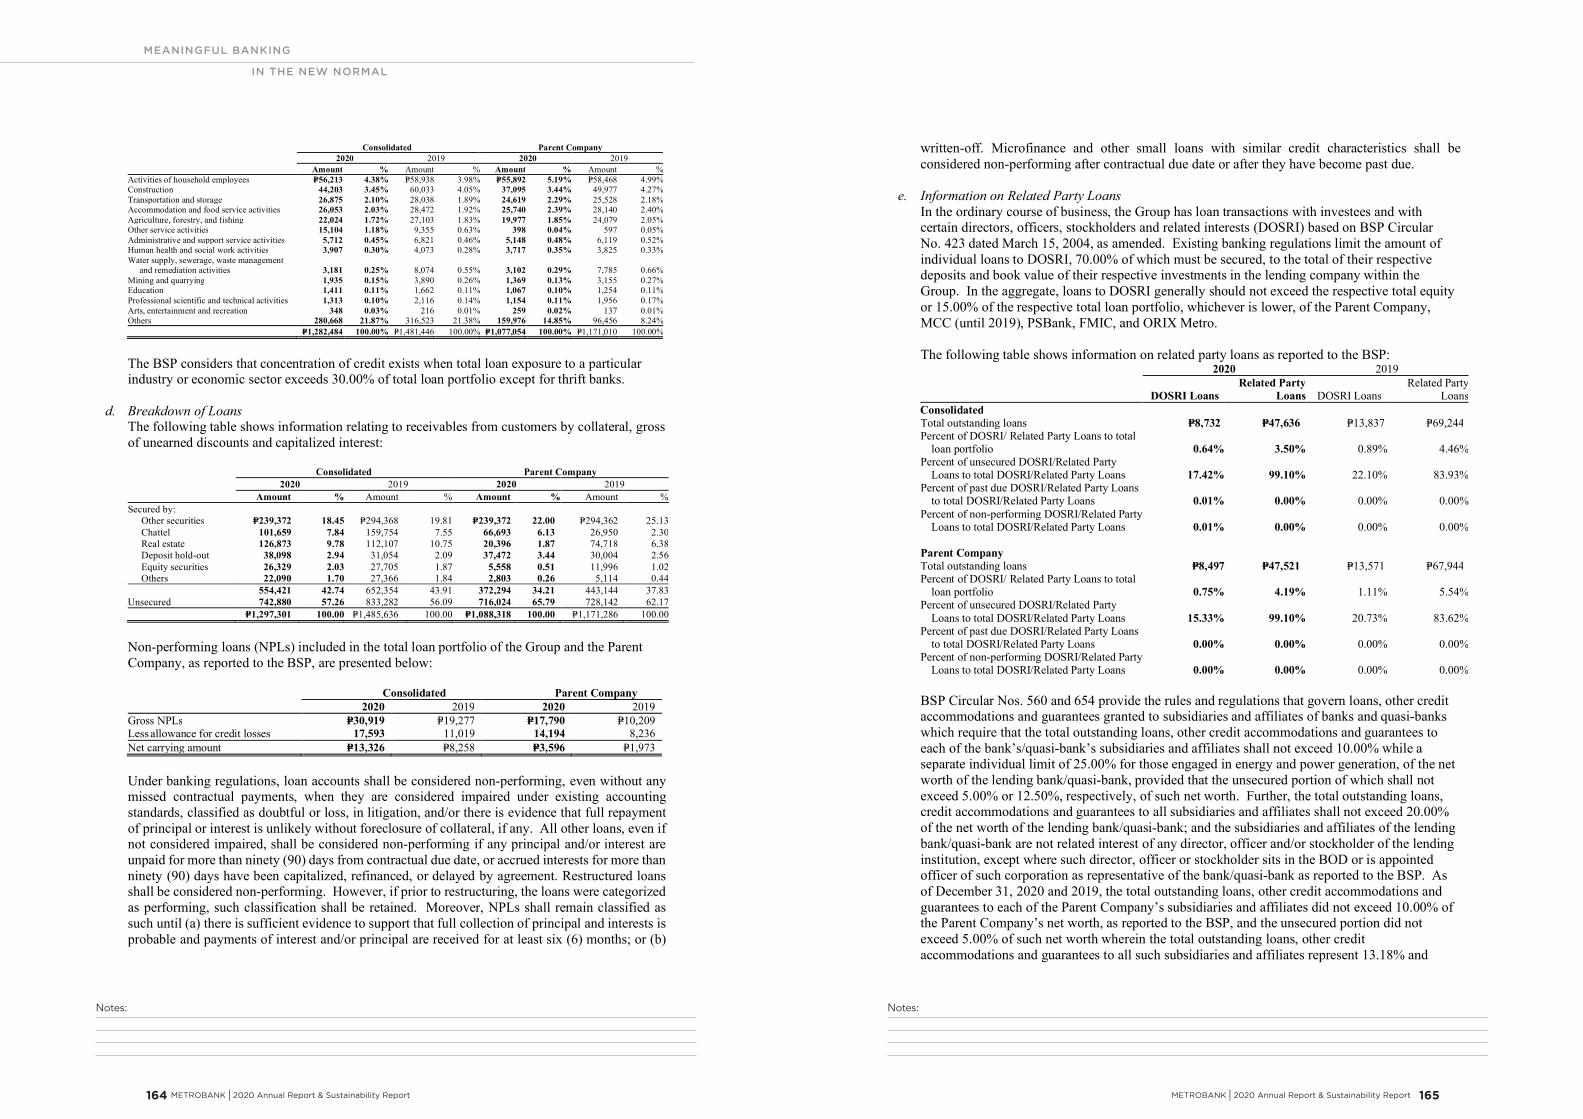
Notes:Notes:
MEANINGFUL BANKING
IN THE NEW NORMAL
METROBANK I 2020 Annual Report & Sustainability Report 165 164 METROBANK I 2020 Annual Report & Sustainability Report
- 133 -
*SGVFSM005911*
Consolidated Parent Company2020 2019 2020 2019
Amount % Amount % Amount % Amount %Activities of household employees P=56,213 4.38% P=58,938 3.98% P=55,892 5.19% P=58,468 4.99%Construction 44,203 3.45% 60,033 4.05% 37,095 3.44% 49,977 4.27%Transportation and storage 26,875 2.10% 28,038 1.89% 24,619 2.29% 25,528 2.18%Accommodation and food service activities 26,053 2.03% 28,472 1.92% 25,740 2.39% 28,140 2.40%Agriculture, forestry, and fishing 22,024 1.72% 27,103 1.83% 19,977 1.85% 24,079 2.05%Other service activities 15,104 1.18% 9,355 0.63% 398 0.04% 597 0.05%Administrative and support service activities 5,712 0.45% 6,821 0.46% 5,148 0.48% 6,119 0.52%Human health and social work activities 3,907 0.30% 4,073 0.28% 3,717 0.35% 3,825 0.33%Water supply, sewerage, waste management
and remediation activities 3,181 0.25% 8,074 0.55% 3,102 0.29% 7,785 0.66%Mining and quarrying 1,935 0.15% 3,890 0.26% 1,369 0.13% 3,155 0.27%Education 1,411 0.11% 1,662 0.11% 1,067 0.10% 1,254 0.11%Professional scientific and technical activities 1,313 0.10% 2,116 0.14% 1,154 0.11% 1,956 0.17%Arts, entertainment and recreation 348 0.03% 216 0.01% 259 0.02% 137 0.01%Others 280,668 21.87% 316,523 21.38% 159,976 14.85% 96,456 8.24%
P=1,282,484 100.00% P=1,481,446 100.00% P=1,077,054 100.00% P=1,171,010 100.00%
The BSP considers that concentration of credit exists when total loan exposure to a particularindustry or economic sector exceeds 30.00% of total loan portfolio except for thrift banks.
d. Breakdown of LoansThe following table shows information relating to receivables from customers by collateral, grossof unearned discounts and capitalized interest:
Consolidated Parent Company2020 2019 2020 2019
Amount % Amount % Amount % Amount %Secured by: Other securities P=239,372 18.45 P=294,368 19.81 P=239,372 22.00 P=294,362 25.13
Chattel 101,659 7.84 159,754 7.55 66,693 6.13 26,950 2.30Real estate 126,873 9.78 112,107 10.75 20,396 1.87 74,718 6.38
Deposit hold-out 38,098 2.94 31,054 2.09 37,472 3.44 30,004 2.56Equity securities 26,329 2.03 27,705 1.87 5,558 0.51 11,996 1.02Others 22,090 1.70 27,366 1.84 2,803 0.26 5,114 0.44
554,421 42.74 652,354 43.91 372,294 34.21 443,144 37.83Unsecured 742,880 57.26 833,282 56.09 716,024 65.79 728,142 62.17
P=1,297,301 100.00 P=1,485,636 100.00 P=1,088,318 100.00 P=1,171,286 100.00
Non-performing loans (NPLs) included in the total loan portfolio of the Group and the ParentCompany, as reported to the BSP, are presented below:
Consolidated Parent Company2020 2019 2020 2019
Gross NPLs P=30,919 P=19,277 P=17,790 P=10,209Less allowance for credit losses 17,593 11,019 14,194 8,236Net carrying amount P=13,326 P=8,258 P=3,596 P=1,973
Under banking regulations, loan accounts shall be considered non-performing, even without anymissed contractual payments, when they are considered impaired under existing accountingstandards, classified as doubtful or loss, in litigation, and/or there is evidence that full repaymentof principal or interest is unlikely without foreclosure of collateral, if any. All other loans, even ifnot considered impaired, shall be considered non-performing if any principal and/or interest areunpaid for more than ninety (90) days from contractual due date, or accrued interests for more thanninety (90) days have been capitalized, refinanced, or delayed by agreement. Restructured loansshall be considered non-performing. However, if prior to restructuring, the loans were categorizedas performing, such classification shall be retained. Moreover, NPLs shall remain classified assuch until (a) there is sufficient evidence to support that full collection of principal and interests isprobable and payments of interest and/or principal are received for at least six (6) months; or (b)
- 134 -
*SGVFSM005911*
written-off. Microfinance and other small loans with similar credit characteristics shall beconsidered non-performing after contractual due date or after they have become past due.
e. Information on Related Party LoansIn the ordinary course of business, the Group has loan transactions with investees and withcertain directors, officers, stockholders and related interests (DOSRI) based on BSP CircularNo. 423 dated March 15, 2004, as amended. Existing banking regulations limit the amount ofindividual loans to DOSRI, 70.00% of which must be secured, to the total of their respectivedeposits and book value of their respective investments in the lending company within theGroup. In the aggregate, loans to DOSRI generally should not exceed the respective total equityor 15.00% of the respective total loan portfolio, whichever is lower, of the Parent Company,MCC (until 2019), PSBank, FMIC, and ORIX Metro.
The following table shows information on related party loans as reported to the BSP:2020 2019
DOSRI LoansRelated Party
Loans DOSRI LoansRelated Party
LoansConsolidatedTotal outstanding loans P=8,732 P=47,636 P=13,837 P=69,244Percent of DOSRI/ Related Party Loans to total
loan portfolio 0.64% 3.50% 0.89% 4.46%Percent of unsecured DOSRI/Related Party
Loans to total DOSRI/Related Party Loans 17.42% 99.10% 22.10% 83.93%Percent of past due DOSRI/Related Party Loans
to total DOSRI/Related Party Loans 0.01% 0.00% 0.00% 0.00%Percent of non-performing DOSRI/Related Party
Loans to total DOSRI/Related Party Loans 0.01% 0.00% 0.00% 0.00%
Parent CompanyTotal outstanding loans P=8,497 P=47,521 P=13,571 P=67,944Percent of DOSRI/ Related Party Loans to total
loan portfolio 0.75% 4.19% 1.11% 5.54%Percent of unsecured DOSRI/Related Party
Loans to total DOSRI/Related Party Loans 15.33% 99.10% 20.73% 83.62%Percent of past due DOSRI/Related Party Loans
to total DOSRI/Related Party Loans 0.00% 0.00% 0.00% 0.00%Percent of non-performing DOSRI/Related Party
Loans to total DOSRI/Related Party Loans 0.00% 0.00% 0.00% 0.00%
BSP Circular Nos. 560 and 654 provide the rules and regulations that govern loans, other creditaccommodations and guarantees granted to subsidiaries and affiliates of banks and quasi-bankswhich require that the total outstanding loans, other credit accommodations and guarantees toeach of the bank’s/quasi-bank’s subsidiaries and affiliates shall not exceed 10.00% while aseparate individual limit of 25.00% for those engaged in energy and power generation, of the networth of the lending bank/quasi-bank, provided that the unsecured portion of which shall notexceed 5.00% or 12.50%, respectively, of such net worth. Further, the total outstanding loans,credit accommodations and guarantees to all subsidiaries and affiliates shall not exceed 20.00%of the net worth of the lending bank/quasi-bank; and the subsidiaries and affiliates of the lendingbank/quasi-bank are not related interest of any director, officer and/or stockholder of the lendinginstitution, except where such director, officer or stockholder sits in the BOD or is appointedofficer of such corporation as representative of the bank/quasi-bank as reported to the BSP. Asof December 31, 2020 and 2019, the total outstanding loans, other credit accommodations andguarantees to each of the Parent Company’s subsidiaries and affiliates did not exceed 10.00% ofthe Parent Company’s net worth, as reported to the BSP, and the unsecured portion did notexceed 5.00% of such net worth wherein the total outstanding loans, other creditaccommodations and guarantees to all such subsidiaries and affiliates represent 13.18% and
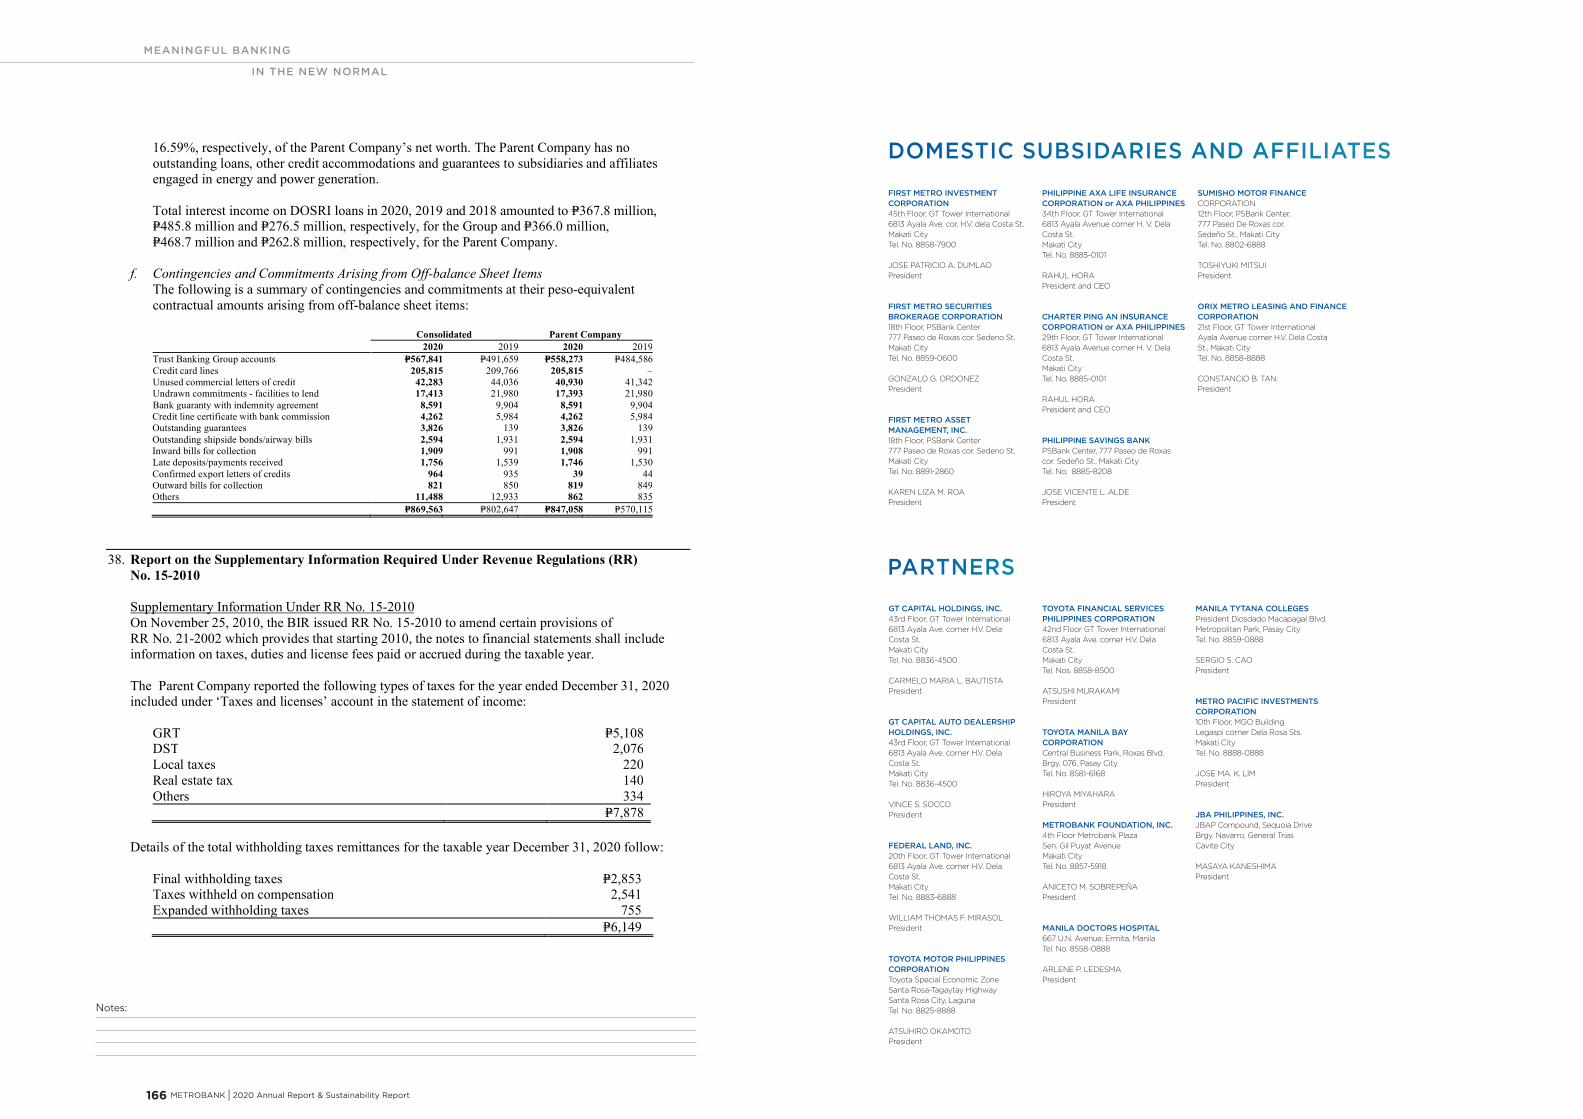
Notes:
MEANINGFUL BANKING
IN THE NEW NORMAL
166 METROBANK I 2020 Annual Report & Sustainability Report
DOMESTIC SUBSIDARIES AND AFFILIATES
PHILIPPINE AXA LIFE INSURANCE CORPORATION or AXA PHILIPPINES34th Floor, GT Tower International6813 Ayala Avenue corner H. V. Dela Costa St.Makati CityTel. No. 8885-0101
RAHUL HORAPresident and CEO
CHARTER PING AN INSURANCE CORPORATION or AXA PHILIPPINES29th Floor, GT Tower International6813 Ayala Avenue corner H. V. Dela Costa St.Makati CityTel. No. 8885-0101
RAHUL HORAPresident and CEO
PHILIPPINE SAVINGS BANKPSBank Center, 777 Paseo de Roxascor. Sedeño St., Makati CityTel. No. 8885-8208
JOSE VICENTE L. ALDEPresident
FIRST METRO INVESTMENT CORPORATION45th Floor, GT Tower International6813 Ayala Ave. cor. H.V. dela Costa St.Makati CityTel. No. 8858-7900
JOSE PATRICIO A. DUMLAOPresident
FIRST METRO SECURITIES BROKERAGE CORPORATION18th Floor, PSBank Center777 Paseo de Roxas cor. Sedeno St.Makati CityTel. No. 8859-0600
GONZALO G. ORDONEZPresident
FIRST METRO ASSET MANAGEMENT, INC.18th Floor, PSBank Center777 Paseo de Roxas cor. Sedeno St.Makati CityTel. No. 8891-2860
KAREN LIZA M. ROAPresident
SUMISHO MOTOR FINANCE CORPORATION12th Floor, PSBank Center,777 Paseo De Roxas cor.Sedeño St., Makati CityTel. No. 8802-6888
TOSHIYUKI MITSUIPresident
ORIX METRO LEASING AND FINANCE CORPORATION21st Floor, GT Tower InternationalAyala Avenue corner H.V. Dela CostaSt., Makati CityTel. No. 8858-8888
CONSTANCIO B. TANPresident
TOYOTA FINANCIAL SERVICES PHILIPPINES CORPORATION42nd Floor GT Tower International6813 Ayala Ave. corner H.V. Dela Costa St.Makati CityTel. Nos. 8858-8500
ATSUSHI MURAKAMIPresident
TOYOTA MANILA BAY CORPORATIONCentral Business Park, Roxas Blvd. Brgy. 076, Pasay CityTel. No. 8581-6168
HIROYA MIYAHARAPresident
METROBANK FOUNDATION, INC.4th Floor Metrobank PlazaSen. Gil Puyat AvenueMakati CityTel. No. 8857-5918
ANICETO M. SOBREPEÑAPresident
MANILA DOCTORS HOSPITAL667 U.N. Avenue, Ermita, ManilaTel. No. 8558-0888
ARLENE P. LEDESMAPresident
MANILA TYTANA COLLEGESPresident Diosdado Macapagal Blvd.Metropolitan Park, Pasay CityTel. No. 8859-0888
SERGIO S. CAOPresident
METRO PACIFIC INVESTMENTS CORPORATION10th Floor, MGO BuildingLegaspi corner Dela Rosa Sts.Makati CityTel. No. 8888-0888
JOSE MA. K. LIMPresident
JBA PHILIPPINES, INC.JBAP Compound, Sequoia DriveBrgy. Navarro, General TriasCavite City
MASAYA KANESHIMAPresident
GT CAPITAL HOLDINGS, INC.43rd Floor, GT Tower International6813 Ayala Ave. corner H.V. Dela Costa St.Makati CityTel. No. 8836-4500
CARMELO MARIA L. BAUTISTAPresident
GT CAPITAL AUTO DEALERSHIP HOLDINGS, INC.43rd Floor, GT Tower International6813 Ayala Ave. corner H.V. Dela Costa St.Makati CityTel. No. 8836-4500
VINCE S. SOCCOPresident
FEDERAL LAND, INC.20th Floor, GT Tower International6813 Ayala Ave. corner H.V. Dela Costa St.Makati CityTel. No. 8883-6888
WILLIAM THOMAS F. MIRASOLPresident
TOYOTA MOTOR PHILIPPINES CORPORATIONToyota Special Economic ZoneSanta Rosa-Tagaytay HighwaySanta Rosa City, LagunaTel. No. 8825-8888
ATSUHIRO OKAMOTOPresident
PARTNERS
- 135 -
*SGVFSM005911*
16.59%, respectively, of the Parent Company’s net worth. The Parent Company has nooutstanding loans, other credit accommodations and guarantees to subsidiaries and affiliatesengaged in energy and power generation.
Total interest income on DOSRI loans in 2020, 2019 and 2018 amounted to P=367.8 million,P=485.8 million and P=276.5 million, respectively, for the Group and P=366.0 million,P=468.7 million and P=262.8 million, respectively, for the Parent Company.
f. Contingencies and Commitments Arising from Off-balance Sheet ItemsThe following is a summary of contingencies and commitments at their peso-equivalentcontractual amounts arising from off-balance sheet items:
Consolidated Parent Company2020 2019 2020 2019
Trust Banking Group accounts P=567,841 P=491,659 P=558,273 P=484,586Credit card lines 205,815 209,766 205,815 –Unused commercial letters of credit 42,283 44,036 40,930 41,342Undrawn commitments - facilities to lend 17,413 21,980 17,393 21,980Bank guaranty with indemnity agreement 8,591 9,904 8,591 9,904Credit line certificate with bank commission 4,262 5,984 4,262 5,984Outstanding guarantees 3,826 139 3,826 139Outstanding shipside bonds/airway bills 2,594 1,931 2,594 1,931Inward bills for collection 1,909 991 1,908 991Late deposits/payments received 1,756 1,539 1,746 1,530Confirmed export letters of credits 964 935 39 44Outward bills for collection 821 850 819 849Others 11,488 12,933 862 835
P=869,563 P=802,647 P=847,058 P=570,115
38. Report on the Supplementary Information Required Under Revenue Regulations (RR)No. 15-2010
Supplementary Information Under RR No. 15-2010On November 25, 2010, the BIR issued RR No. 15-2010 to amend certain provisions ofRR No. 21-2002 which provides that starting 2010, the notes to financial statements shall includeinformation on taxes, duties and license fees paid or accrued during the taxable year.
The Parent Company reported the following types of taxes for the year ended December 31, 2020included under ‘Taxes and licenses’ account in the statement of income:
GRT P=5,108DST 2,076Local taxes 220Real estate tax 140Others 334
P=7,878
Details of the total withholding taxes remittances for the taxable year December 31, 2020 follow:
Final withholding taxes P=2,853Taxes withheld on compensation 2,541Expanded withholding taxes 755
P=6,149

Head Office: Metrobank PlazaSen. Gil Puyat Avenue
Makati City, Philippines 1200