financial statements 2021 - elkem
TRANSCRIPT
Financial Statements 2021
150 151Annual report 2021
Elkem history Highlights Letter from the CEO The business The Elkem share Board of directors’ report Board and management Corporate governance Risk managment ESG report Financial statements ESG assurance Contact
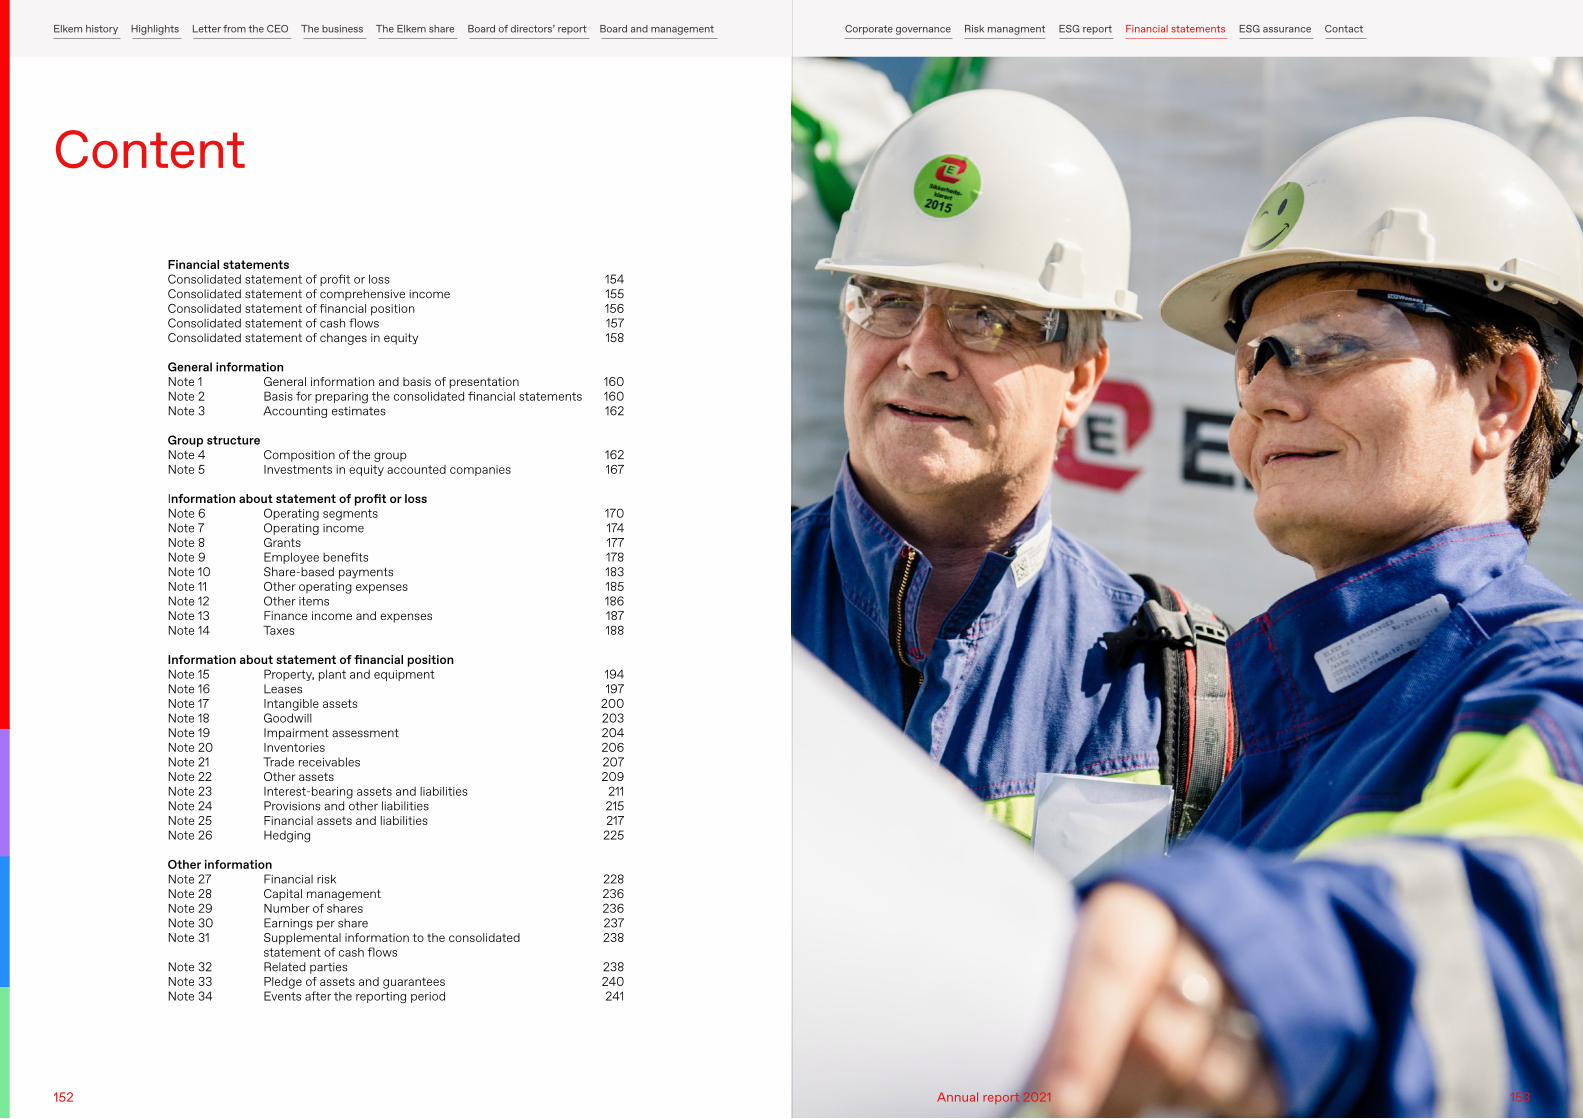
Financial statements Consolidated statement of profit or loss 154Consolidated statement of comprehensive income 155Consolidated statement of financial position 156Consolidated statement of cash flows 157Consolidated statement of changes in equity 158
General information Note 1 General information and basis of presentation 160Note 2 Basis for preparing the consolidated financial statements 160Note 3 Accounting estimates 162
Group structure Note 4 Composition of the group 162Note 5 Investments in equity accounted companies 167 Information about statement of profit or loss Note 6 Operating segments 170Note 7 Operating income 174Note 8 Grants 177Note 9 Employee benefits 178Note 10 Share-based payments 183Note 11 Other operating expenses 185Note 12 Other items 186Note 13 Finance income and expenses 187Note 14 Taxes 188
Information about statement of financial position Note 15 Property, plant and equipment 194Note 16 Leases 197Note 17 Intangible assets 200Note 18 Goodwill 203Note 19 Impairment assessment 204Note 20 Inventories 206Note 21 Trade receivables 207Note 22 Other assets 209Note 23 Interest-bearing assets and liabilities 211Note 24 Provisions and other liabilities 215Note 25 Financial assets and liabilities 217Note 26 Hedging 225
Other information Note 27 Financial risk 228Note 28 Capital management 236Note 29 Number of shares 236Note 30 Earnings per share 237Note 31 Supplemental information to the consolidated 238 statement of cash flows Note 32 Related parties 238Note 33 Pledge of assets and guarantees 240Note 34 Events after the reporting period 241
Content
152 153Annual report 2021
Elkem history Highlights Letter from the CEO The business The Elkem share Board of directors’ report Board and management Corporate governance Risk managment ESG report Financial statements ESG assurance Contact
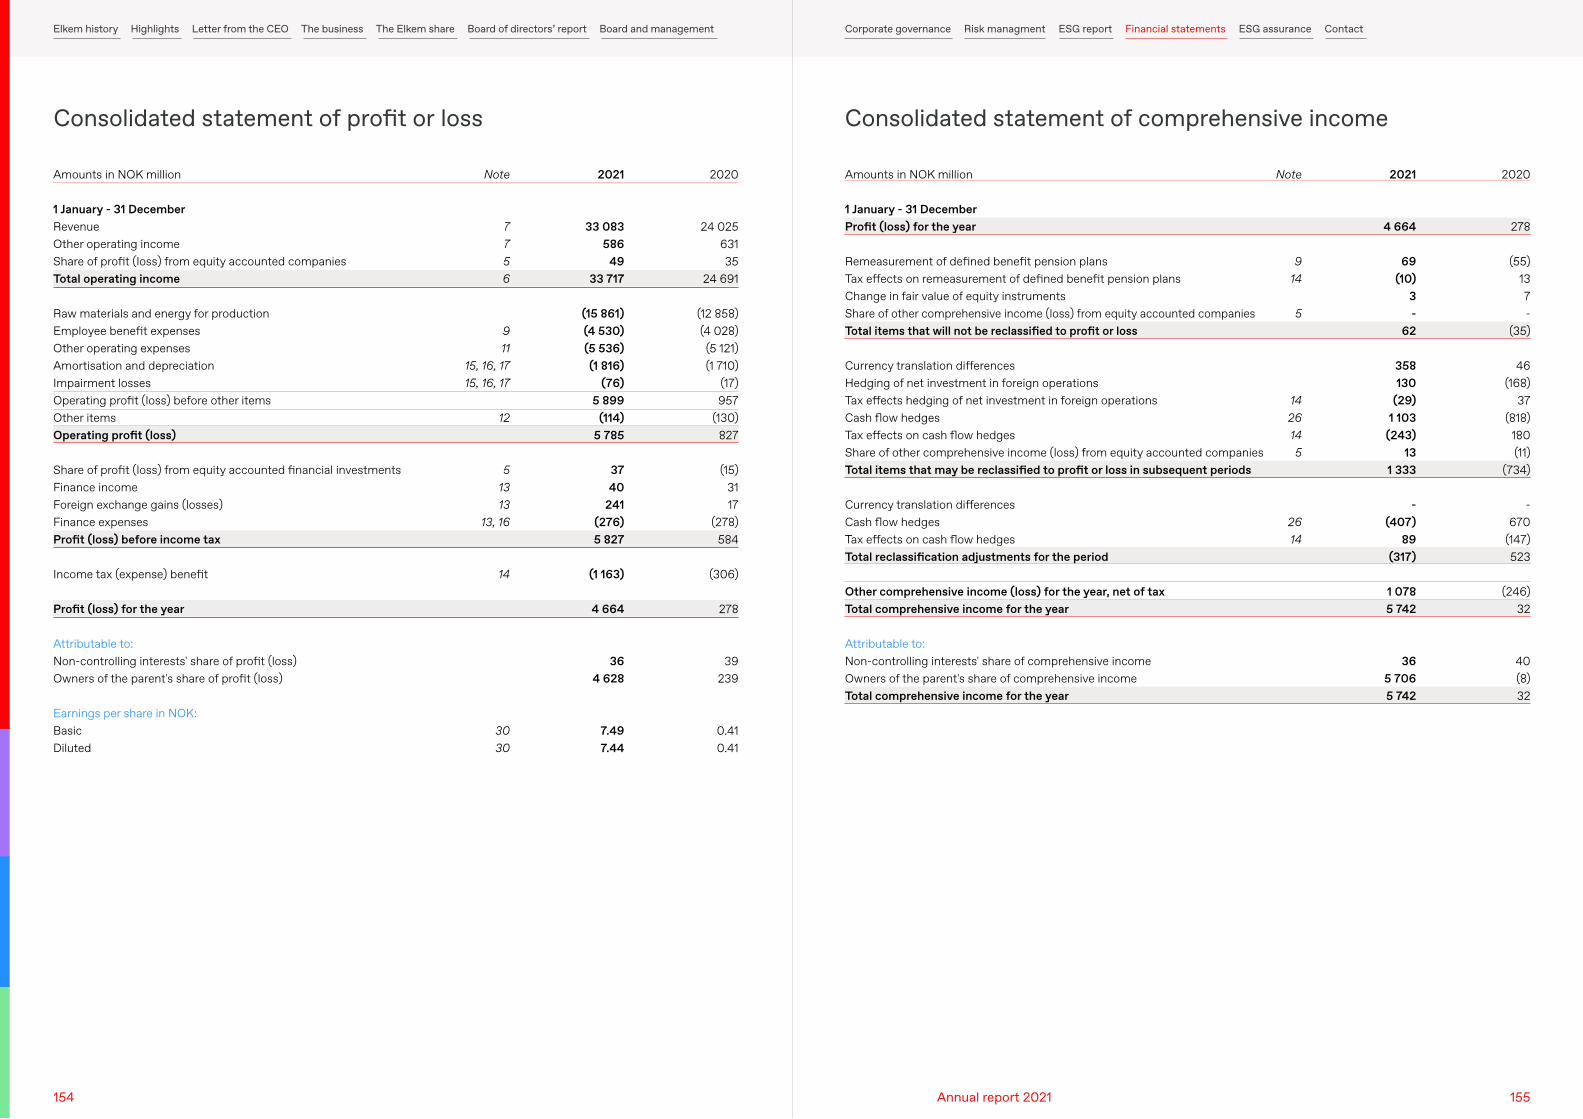
Consolidated statement of profit or loss
Amounts in NOK million
1 January - 31 DecemberRevenueOther operating incomeShare of profit (loss) from equity accounted companiesTotal operating income
Raw materials and energy for productionEmployee benefit expensesOther operating expensesAmortisation and depreciationImpairment lossesOperating profit (loss) before other itemsOther itemsOperating profit (loss)
Share of profit (loss) from equity accounted financial investmentsFinance incomeForeign exchange gains (losses)Finance expensesProfit (loss) before income tax
Income tax (expense) benefit
Profit (loss) for the year
Attributable to:Non-controlling interests' share of profit (loss)Owners of the parent's share of profit (loss)
Earnings per share in NOK:BasicDiluted
Note
7756
911
15, 16, 1715, 16, 17
12
51313
13, 16
14
3030
2021
33 083586
4933 717
(15 861)(4 530)(5 536)(1 816)
(76)5 899
(114)5 785
3740
241(276)5 827
(1 163)
4 664
364 628
7.497.44
2020
24 02563135
24 691
(12 858)(4 028)(5 121)(1 710)
(17)957
(130)827
(15)3117
(278)584
(306)
278
39239
0.410.41
Consolidated statement of comprehensive income
Amounts in NOK million
1 January - 31 DecemberProfit (loss) for the year
Remeasurement of defined benefit pension plansTax effects on remeasurement of defined benefit pension plansChange in fair value of equity instrumentsShare of other comprehensive income (loss) from equity accounted companiesTotal items that will not be reclassified to profit or loss
Currency translation differencesHedging of net investment in foreign operationsTax effects hedging of net investment in foreign operationsCash flow hedgesTax effects on cash flow hedgesShare of other comprehensive income (loss) from equity accounted companiesTotal items that may be reclassified to profit or loss in subsequent periods
Currency translation differencesCash flow hedgesTax effects on cash flow hedgesTotal reclassification adjustments for the period
Other comprehensive income (loss) for the year, net of taxTotal comprehensive income for the year
Attributable to:Non-controlling interests' share of comprehensive incomeOwners of the parent's share of comprehensive incomeTotal comprehensive income for the year
Note
914
5
1426145
2614
2021
4 664
69(10)
3-
62
358130
(29)1 103
(243)13
1 333
-(407)
89(317)
1 0785 742
365 7065 742
2020
278
(55)137-
(35)
46(168)
37(818)
180(11)
(734)
-670
(147)523
(246)32
40(8)32
154 155Annual report 2021
Elkem history Highlights Letter from the CEO The business The Elkem share Board of directors’ report Board and management Corporate governance Risk managment ESG report Financial statements ESG assurance Contact
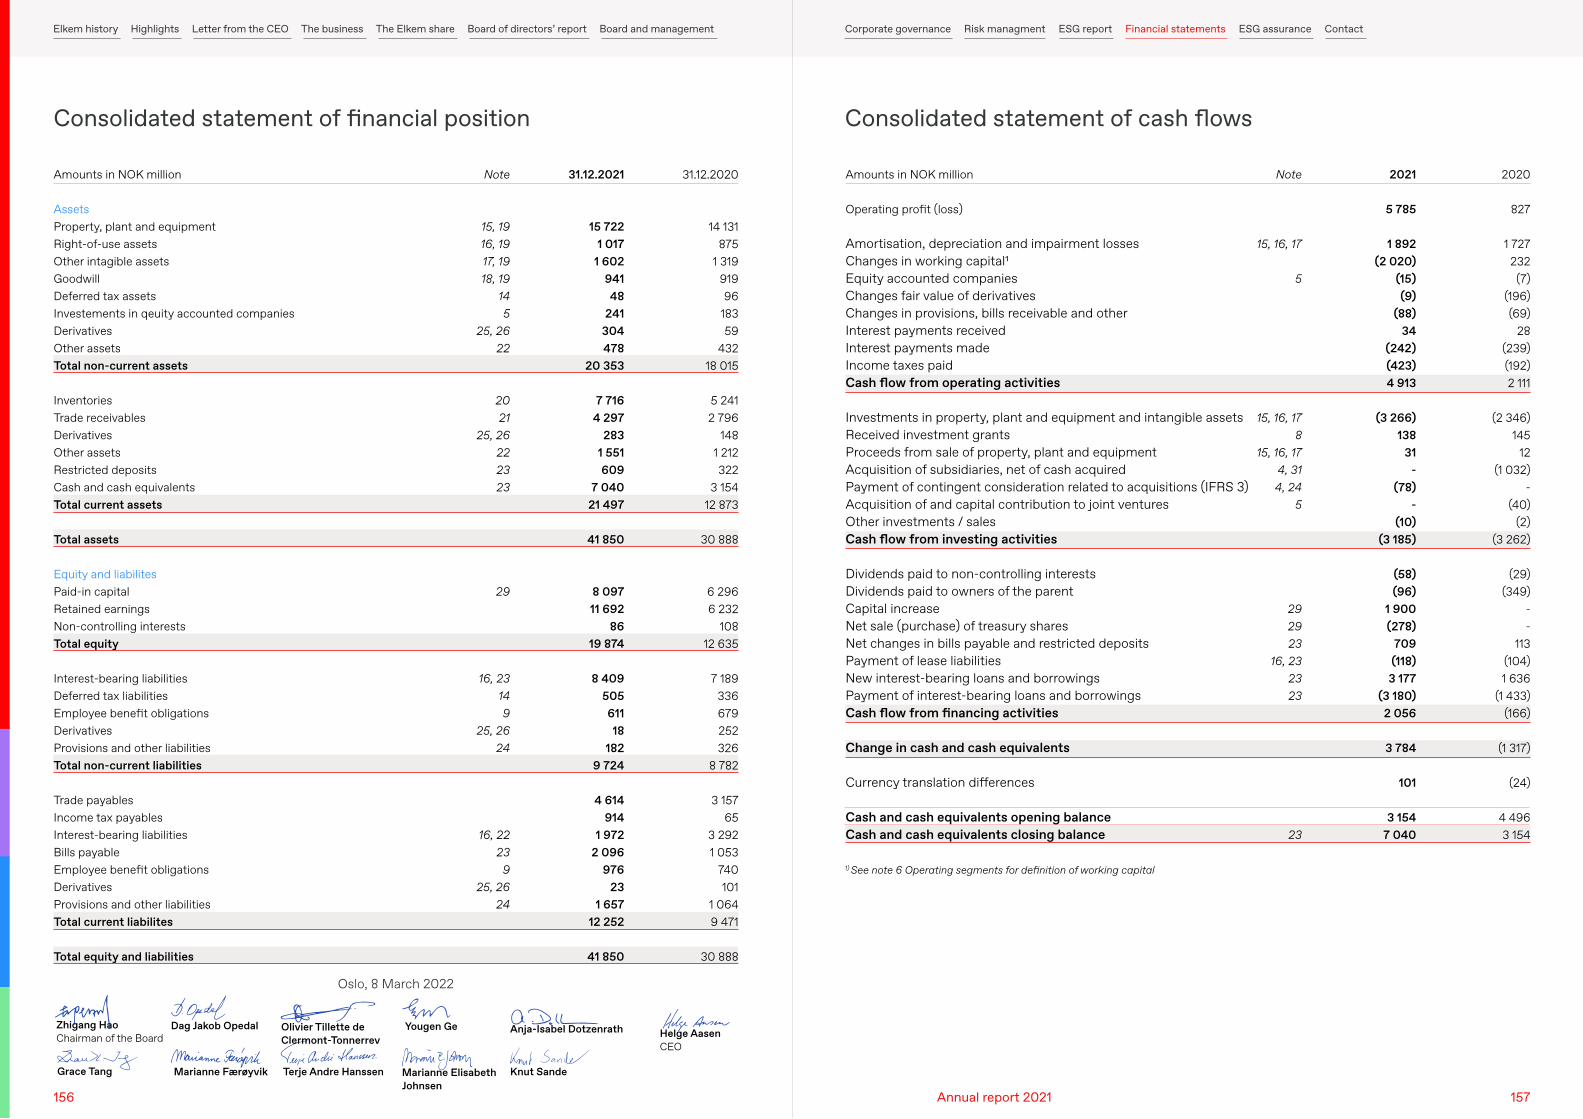
Amounts in NOK million
AssetsProperty, plant and equipmentRight-of-use assetsOther intagible assetsGoodwillDeferred tax assetsInvestements in qeuity accounted companiesDerivativesOther assetsTotal non-current assets
InventoriesTrade receivablesDerivativesOther assetsRestricted depositsCash and cash equivalentsTotal current assets
Total assets
Equity and liabilitesPaid-in capitalRetained earningsNon-controlling interestsTotal equity
Interest-bearing liabilitiesDeferred tax liabilitiesEmployee benefit obligationsDerivativesProvisions and other liabilitiesTotal non-current liabilities
Trade payablesIncome tax payablesInterest-bearing liabilitiesBills payableEmployee benefit obligationsDerivativesProvisions and other liabilitiesTotal current liabilites
Total equity and liabilities
Note
15, 1916, 1917, 1918, 19
145
25, 2622
2021
25, 26222323
29
16, 23149
25, 2624
16, 2223
925, 26
24
31.12.2021
15 7221 017
1 60294148
241304478
20 353
7 7164 297
2831 551609
7 04021 497
41 850
8 09711 692
8619 874
8 40950561118
1829 724
4 614914
1 9722 096
97623
1 65712 252
41 850
31.12.2020
14 131875
1 31991996
18359
43218 015
5 2412 796
1481 212322
3 15412 873
30 888
6 2966 232
10812 635
7 189336679252326
8 782
3 15765
3 2921 053
740101
1 0649 471
30 888
Consolidated statement of financial position
Amounts in NOK million
Operating profit (loss)
Amortisation, depreciation and impairment lossesChanges in working capital1Equity accounted companiesChanges fair value of derivativesChanges in provisions, bills receivable and otherInterest payments receivedInterest payments madeIncome taxes paidCash flow from operating activities
Investments in property, plant and equipment and intangible assetsReceived investment grantsProceeds from sale of property, plant and equipmentAcquisition of subsidiaries, net of cash acquiredPayment of contingent consideration related to acquisitions (IFRS 3)Acquisition of and capital contribution to joint venturesOther investments / salesCash flow from investing activities
Dividends paid to non-controlling interestsDividends paid to owners of the parentCapital increaseNet sale (purchase) of treasury shares Net changes in bills payable and restricted depositsPayment of lease liabilitiesNew interest-bearing loans and borrowingsPayment of interest-bearing loans and borrowingsCash flow from financing activities
Change in cash and cash equivalents
Currency translation differences
Cash and cash equivalents opening balanceCash and cash equivalents closing balance
Note
15, 16, 17
5
15, 16, 178
15, 16, 174, 314, 24
5
292923
16, 232323
23
2021
5 785
1 892(2 020)
(15)(9)
(88)34
(242)(423)4 913
(3 266)138
31-
(78)-
(10)(3 185)
(58)(96)
1 900(278)
709(118)
3 177(3 180)2 056
3 784
101
3 1547 040
2020
827
1 727232(7)
(196)(69)
28(239)(192)2 111
(2 346)145
12(1 032)
-(40)
(2)(3 262)
(29)(349)
--
113(104)1 636
(1 433)(166)
(1 317)
(24)
4 4963 154
Consolidated statement of cash flows
Yougen Ge
Marianne Elisabeth Johnsen
Terje Andre Hanssen
Olivier Tillette de Clermont-Tonnerrev
Anja-Isabel Dotzenrath
Knut Sande
Zhigang HaoChairman of the Board
Grace Tang
Oslo, 8 March 2022
Helge AasenCEO
Marianne Færøyvik
Dag Jakob Opedal
1) See note 6 Operating segments for definition of working capital
156 157Annual report 2021
Elkem history Highlights Letter from the CEO The business The Elkem share Board of directors’ report Board and management Corporate governance Risk managment ESG report Financial statements ESG assurance Contact
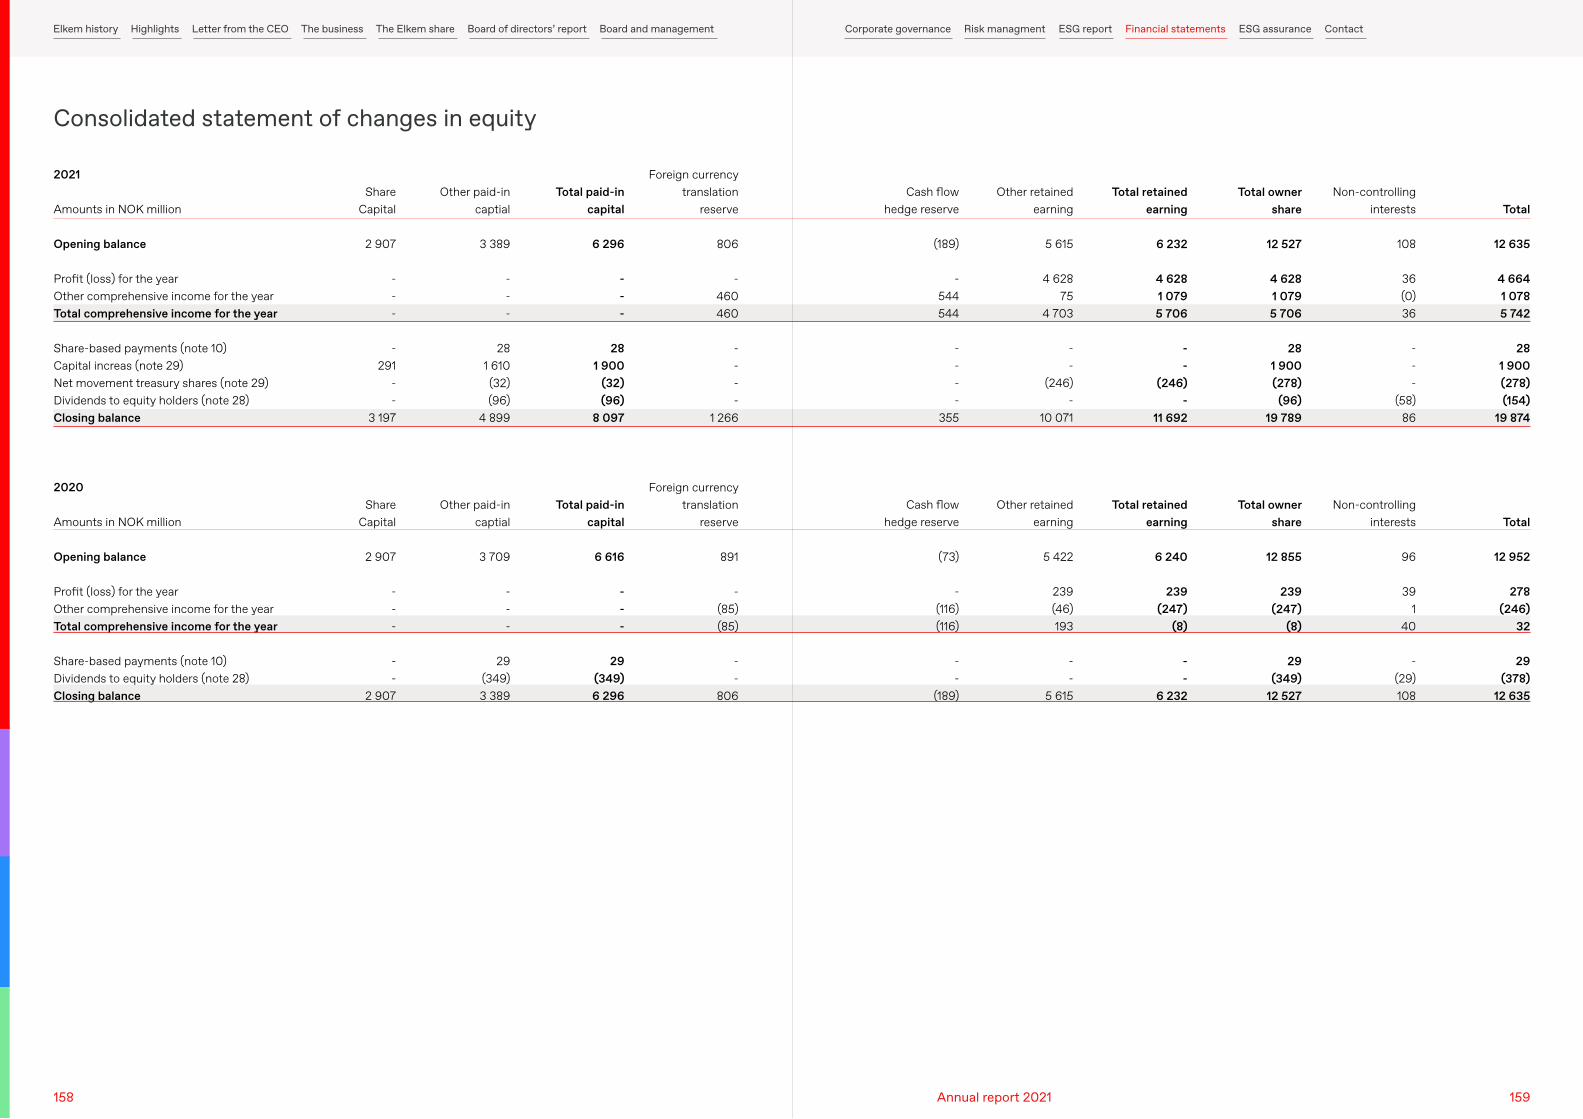
Amounts in NOK million
Opening balance
Profit (loss) for the yearOther comprehensive income for the yearTotal comprehensive income for the year
Share-based payments (note 10)Capital increas (note 29)Net movement treasury shares (note 29)Dividends to equity holders (note 28)Closing balance
Amounts in NOK million
Opening balance
Profit (loss) for the yearOther comprehensive income for the yearTotal comprehensive income for the year
Share-based payments (note 10)Dividends to equity holders (note 28)Closing balance
2021
2020
Share Capital
2 907
---
-291
--
3 197
Share Capital
2 907
---
--
2 907
Other paid-incaptial
3 389
---
281 610(32)(96)
4 899
Other paid-incaptial
3 709
---
29(349)3 389
Total paid-incapital
6 296
---
281 900
(32)(96)
8 097
Total paid-incapital
6 616
---
29(349)6 296
Foreign currency translation
reserve
806
-460460
----
1 266
Foreign currency translation
reserve
891
-(85)(85)
--
806
Consolidated statement of changes in equity
Cash flow hedge reserve
(189)
-544544
----
355
Cash flow hedge reserve
(73)
-(116)(116)
--
(189)
Other retainedearning
5 615
4 62875
4 703
--
(246)-
10 071
Other retainedearning
5 422
239(46)193
--
5 615
Non-controllinginterests
108
36(0)36
---
(58)86
Non-controllinginterests
96
391
40
-(29)108
Total
12 635
4 6641 0785 742
281 900(278)(154)
19 874
Total
12 952
278(246)
32
29(378)
12 635
Total retainedearning
6 232
4 6281 0795 706
--
(246)-
11 692
Total retainedearning
6 240
239(247)
(8)
--
6 232
Total ownershare
12 527
4 6281 0795 706
281 900(278)
(96)19 789
Total ownershare
12 855
239(247)
(8)
29(349)
12 527
158 159Annual report 2021
Elkem history Highlights Letter from the CEO The business The Elkem share Board of directors’ report Board and management Corporate governance Risk managment ESG report Financial statements ESG assurance Contact
Consolidated statement of financial position
Elkem ASA is a limited liability company located in Norway and whose shares are publicly traded on Oslo Børs. Elkem ASA is owned 52.9% by Bluestar Elkem International Co. Ltd S.A., Luxembourg, which is under the control of Sinochem Holdings Co., Ltd (Sinochem), a company registered and domiciled in China.
Elkem is one of the world’s leading providers of advanced material solutions shaping a better and more sustainable future. The company develops silicones, silicon products and carbon solutions by combining natural raw materials, renewable energy and human ingenuity. Elkem helps its customers create and improve essential innovations like electric mobility, digital communications, health and personal care as well as smarter and more sustainable cities. With a strong track record since 1904, its global team of more than
ComplianceThe consolidated financial statements are prepared and based on International Financial Reporting Standards (IFRS) as endorsed by the European Union (EU) and effective at 31 December 2021. All subsidiaries are using accounting policies consistent within the group.
Relevant financial reporting principles are described in each note to the consolidated financial statements.
Preparation of consolidated financial statementsThe consolidated financial statements are prepared on a historical cost basis, with the exception of derivative financial instruments and financial assets available for sale, which are measured at fair value.
The presentation currency of Elkem is Norwegian Krone (NOK). All financial information is presented in NOK million, unless otherwise stated. As a result of rounding adjustments, the amounts shown in one or more columns included in the consolidated financial statements, may not add up to the total. In text, the current year's figures are presented outside parentheses, followed by the comparative figures presented in parentheses.
1. General information items. Currency effects recognised in finance income and expenses are only related to financing activities such as loans, lease liabilities, long-term placements and dividends.
Foreign currency differences are recognised in other comprehensive income for the following items:
→ a financial asset or liability designated as a hedging instrument in a cash flow hedge, to the extent that the hedge is effective
→ loans in foreign currencies designated as hedging instruments in a hedge of a net investment in a foreign operation
Consolidated financial statementsIn consolidation of the statement of profit or loss and the statement of financial position, separate group entities with other functional currency than the group's presentation currency, are translated directly into the presentation currency as follows:
→ Assets and liabilities are translated using the exchange rate at the end of the reporting period
→ Income and expenses are translated using an average exchange rate per month
→ Equity transactions, except for profit or loss for the period, are translated using the transaction date rates
All resulting exchange differences are booked as a separate component in other comprehensive income (OCI)
Any goodwill arising on acquisition of a foreign operation and any fair value adjustment to the carrying amount of assets and liabilities arising on the acquisition, are treated as assets and liabilities of the foreign operations. On disposal of a foreign entity, the deferred cumulative amount recognised in other comprehensive income relating to that particular foreign operation, is recognised in the statement of profit or loss.
Statement of cash flowsThe statement of cash flows is prepared under the indirect method. Cash inflows and outflows are shown separately for investing and financing activities, while operating activities include both cash and non-cash effect items. Interest received and paid and other financial expenses, such as bank guarantee expenses,
7,000 people has a joint commitment to stakeholders: Delivering your potential. In 2021, Elkem achieved an operating income of NOK 33,717 million.
Following changes in Elkem's internal reporting to management the composition of Elkem's operating and reporting segments has changed as of the first quarter of 2021. Segment information for prior periods has been restated to align with the new segment presentation. For further information see Note 6 Operating segments.
The consolidated financial statements for Elkem ASA (hereafter Elkem/the group), including notes, for the year 2021 were approved by the Board of Directors of Elkem ASA on 8 March 2022 and will be proposed to the Annual General Meeting on 27 April 2022.
The consolidated financial statements have been prepared based on the going concern assumption.
Foreign currency translationSeparate financial statementsEach entity in the group determines its functional currency based on the economic environment in which it operates, and items included in the financial statements of each entity are measured using that functional currency. When preparing the financial statements of each individual group entity, transactions in currencies other than the entity's functional currency are recognised in the functional currency, using the transaction date’s currency rate.
Monetary items denominated in foreign currencies are translated using the closing rate at the end of the reporting period, and any gains (losses) are reported in the statement of profit or loss. Non-monetary items that are measured at fair value in a foreign currency are translated using the exchange rate at the date when the fair value was measured. Currency gains (losses) related to operating activities, i.e. receivables, payables, bank accounts for operating purposes including current intragroup balances, are recognised as a part of other
are reported as a part of operating activities. Net currency gains or losses related to financing activities are reported as part of financing activities. Dividends received from joint ventures and associates that do not operate within Elkem's main business areas are included in investing activities.
Dividend to shareholdersDividend is recognised as a liability when the shareholders right to payment is established which is the time of Annual General Meeting.
Changes in accounting policies and correction of material errorsChanges in accounting policies and correction of material errors are recognised retrospectively by restating the comparative amounts for the prior period presented, including the opening balance of the prior year.
Elkem has previously recognized the yearly cost of purchased CO2 quotas as other operating expenses from the period the need to purchase quotas occurred. From 2021 the cost of purchased CO2 allowances are recognised as part of raw materials and energy for production and is distributed linearly over the year. It is deemed that the change in principle will provide more reliable and relevant information about the cost of CO2 quotas. The change in principle does not have a material impact on the annual accounts but will impact the recognition of cost between quarters. Further, the change in principle does not impact comparable figures as Elkem had a surplus of quotas in 2020 and therefore no quota cost. For more information see note 8 Grants.
New and revised standard- adoptedNew or revised accounting standards and interpretations implemented as of 1 January 2021 are among others COVID-19-Related Rent Concessions (Amendments to IFRS 16) and Interest Rate Benchmark Reform – Phase 2 (Amendments to IFRS 9, IFRS 7, IFRS 4 and IFRS 16). The new or revised accounting standards and interpretations do not represent a significant impact to Elkem's accounting policies.
New standards, interpretations and amendments - not yet effective The consolidated financial statements will be affected by future changes in IFRS. No standards, interpretations or amendments published at the balance sheet date are expected to have significant effect on the group.
2. Basis for preparing the consolidated financial statements
160 161Annual report 2021
Elkem history Highlights Letter from the CEO The business The Elkem share Board of directors’ report Board and management Corporate governance Risk managment ESG report Financial statements ESG assurance Contact
During a measurement period of maximum one year provisional amounts recognised at the acquisition date are adjusted to reflect new information obtained about facts and circumstances that existed on the date of acquisition. Any adjustments of identified assets or liabilities in the acquisition are offset by a corresponding increase / decrease in goodwill.
Business combinations under common controlBusiness combinations involving entities under common control are accounted for on a historical cost basis. This means applying book value accounting, which is applied in the following manner:
→ Assets and liabilities of the combining entities are reflected at their carrying amounts.
→ No new goodwill is recognised as a result of the combination.
→ The statement of profit or loss reflects the result of the combining entities for the full year, irrespective of when the combination took place.
→ Comparative figures are restated. → The purchase price is booked against equity at the
acquisition date.
Judgements and estimatesBusiness combinationsElkem uses valuation models as a basis for the measurement of the fair value of net identifiable value of transferred assets and liabilities in a business combination. Fair values are normally not readily observable in an active market for individual assets and liabilities in the business which Elkem operates.
Property, plant and equipment is valued using the cost approach and by estimating the current cost to purchase or replace the asset, at today’s current condition. Intangible assets are identified and valued based on a relief from royalty method and multi-period excess earnings method, whereby; the relief from royalty method considers the discounted estimated royalty payments that are expected to be avoided as a result of the patents being owned, and the multi-period excess earnings method considers the present value of net cash flows expected to be generated by the customer relationships, by excluding any cash flows related to contributory assets.
Valuations are subject to numerous assumptions, the fair value estimates may impact assessment of possible impairment of assets and / or goodwill in future periods.
The preparation of the consolidated financial statements according to IFRS requires management to make judgments, estimates and assumptions that affect the application of accounting policies and the reported amounts of assets, liabilities, income and expenses. When management makes estimates and assumptions concerning the future, the resulting accounting estimates will, by definition, seldom equal the actual outcome.
Estimates and judgements are continually evaluated and are based on historical experience and other factors, including expectations of future events that are believed to be reasonable under the circumstances. Revisions of reported estimates are recognised in the period in which the estimates are revised and in any future period affected. Changes in accounting estimates are recognised prospectively by including them in the statement of profit or loss in the period of the change and future periods, if the change affects both.
PrincipleConsolidationThe consolidated financial statements include the financial statements of Elkem ASA and entities controlled directly or indirectly by Elkem ASA. The group controls an entity when the group is exposed to, or has rights to, variable returns from its involvement with the entity and has the ability to affect those returns through its power over the entity. Subsidiaries are fully consolidated from the date on which the group obtains control, and are deconsolidated from the date that control ceases.
Profit or loss and each component of OCI are attributed to the equity holders of the parent of the group and to non-controlling interests, presented on separate lines in the financial statements.
All intra-group assets and liabilities, equity, income and expenses and gains and losses are eliminated in full on consolidation.
The estimates and assumptions that have a significant risk of causing a material adjustment to the carrying amounts of assets and liabilities within the next financial year are addressed in the different notes.
Information about judgements, assumptions and estimation uncertainties at 31 December 2021 that have the most significant effects on the amounts recognised in the financial statements is included in the following notes:
→ Note 4 Composition of the group → Note 8 Grants → Note 9 Employee benefits → Note 14 Taxes → Note 15 Property, plant and equipment → Note 16 Leases → Note 17 Intangible assets → Note 18 Goodwill → Note 19 Impairment assessment → Note 24 Provisions and other liabilities → Note 25 Financial assets and liabilities
Business combinationsBusiness combinations are accounted for using the acquisition method in accordance with IFRS 3. The consideration transferred in a business combination is measured at fair value, and goodwill is measured as the excess of the sum of consideration transferred, and net identifiable fair value of transferred assets and liabilities. Elkem's contingent consideration is classified as a financial liability and measured at fair value at the acquisition date. The liability is subsequently measured at fair value at each reporting date, with changes recognised in other items in the statement of profit or loss. Acquisition-related costs are expensed as incurred.
Acquisitions of non-controlling interests are accounted for as transactions with owners in their capacity as owners, and therefore no goodwill is recognised as a result. Adjustments to non-controlling interests arising from transactions that do not involve the loss of control, are based on a proportionate amount of the net assets of the subsidiary.
3. Accounting estimates
4. Composition of the group
162 163Annual report 2021
Elkem history Highlights Letter from the CEO The business The Elkem share Board of directors’ report Board and management Corporate governance Risk managment ESG report Financial statements ESG assurance Contact
Company
Elkania DAElkem (Thailand) Co., Ltd.Elkem Carbon (China) Co., Ltd.
Elkem Carbon ASElkem Carbon Malaysia Sdn. Bhd.Elkem Carbon Singapore Pte. Ltd.Elkem Chartering Holding ASElkem Digital Office ASElkem Distribution Center B.V.Elkem Dronfield Ltd.Elkem Egypt for Industry, Contracting & Trading S.A.E.Elkem Ferroveld JVElkem Foundry (China) Co., Ltd.Elkem GmbHElkem Iberia S.L.UElkem International ASElkem International Trade (Shanghai) Co., Ltd.Elkem Ísland ehf.Elkem Japan K.K.Elkem Korea Co., Ltd.Elkem Ltd.Elkem Madencilik Metalurji Sanayi Ve Ticaret Ltd. STIElkem Materials, Inc.Elkem Materials Delaware, Inc.Elkem Materials Processing (Tianjin) Co., Ltd.Elkem Materials Processing Services BVElkem Materials South America Ltda.Elkem Metal Canada Inc.Elkem Milling Services GmbHElkem Nordic A.S.Elkem Oilfield Chemicals FZCO Ltd.Elkem Paraguay S.A.Elkem Participaçòes Indústria e Comércio LimitadaElkem S.a.r.l.Elkem S.r.l.
Company
Elkem Silicon Materials (Lanzhou) Co., Ltd. 1)
Elkem Silicon Product Development ASElkem Siliconas España S.A.UElkem Silicones (UK) Ltd.Elkem Silicones Brasil Ltda.Elkem Silicones Canada CorpElkem Silicones Czech Republic, s.r.o.Elkem Silicones Finland OYElkem Silicones France SASElkem Silicones Germany GmbHElkem Silicones Guangdong Co., Ltd. 2)
Elkem Silicones Hong Kong Co., Ltd.Elkem Silicones Korea Co., Ltd.Elkem Silicones Material Zhongshan Co., Ltd. 3)
Elkem Silicones México S. De R.L. De C.V.Elkem Silicones Poland sp. z o.o.Elkem Silicones Scandinavia ASElkem Silicones Services S.à.r.l.Elkem Silicones Shanghai Co., Ltd.Elkem Silicones USA Corp.Elkem Siliconi Italia S.r.l.Elkem Singapore Materials Pte. Ltd.Elkem South Asia Private LimitedElkem UK Holdings Ltd.Elkem Uruguay S.A.Euro Nordic Logistics BV
Euro Nordic Netherlands BVExplotación de Rocas Industriales y Minerales S.A. (ERIMSA)Iniconce, S.L
Jiangxi Bluestar Xinghuo Silicones Co., Ltd.NEH LLCNorenoComercial Importada e Exportadora Limitada
Norsil, S.A.Tifwer Trade S.A.Vianode AS 4)
Functional currency
NOKTHBCNY
NOKMYRSGDNOK NOK EUR GBPUSD
ZARCNYEUREURNOKCNYNOKJPYKRWGBPEUR
USDUSDCNYEURBRLCADEURDKKAEDUSDBRLEUREUR
Functional currency
CNYNOKEURGBPBRLCADCZKEUREUREURCNYHKDKRWCNY
MXNPLNNOKEURCNYUSDEURSGDINRGBPUSDEUR
EUREUR
EUR
CNYUSDBRL
EURUSDNOK
Country of incorporation
NorwayThailandChina
NorwayMalaysiaSingaporeNorwayNorwayNetherlandsUnited KingdomEgypt
South AfricaChinaGermanySpainNorwayChinaIcelandJapanRepublic of KoreaUnited KingdomTurkey
USAUSAChinaNetherlandsBrazilCanadaGermanyDenmarkUAEParaguayBrazilFranceItaly
Country of incorporation
ChinaNorwaySpainUnited KingdomBrazilCanadaCzech RepublicFinlandFranceGermanyChinaHong KongRepulic of KoreaChina
MexicoPolandNorwayFranceChinaUSAItalySingaporeIndiaUnited KingdomUruguayNetherlands
NetherlandsSpain
Spain
ChinaUSABrazil
SpainUruguayNorway
31.12.2021Equity interest
50%100%100%
100%100%100%80%100%100%100%100%
50%100%100%100%100%100%100%100%100%100%100%
100%100%100%100%100%100%100%100%51%100%100%100%100%
31.12.2021Equity interest
100%100%100%100%100%100%100%100%100%100%100%100%100%100%
100%100%100%100%100%100%100%100%100%100%100%80%
80%100%
100%
100%100%100%
100%100%100%
31.12.2020 Equity interest
50%100%100%
100%100%100%80%100%100%100%100%
50%100%100%100%100%100%100%100%100%100%100%
100%100%100%100%100%100%100%100%51%100%100%100%100%
31.12.2020 Equity interest
100%100%100%100%100%100%100%100%100%100%100%100%100%100%
100%100%100%100%100%100%100%100%100%100%100%80%
80%100%
100%
100%100%100%
100%100%100%
Owner
Elkem ASAElkem ASAElkem Carbon Singapore Pte. Ltd.Elkem ASAElkem Carbon ASElkem Carbon ASElkem ASAElkem ASAElkem ASAElkem UK Holdings Ltd.Elkem International AS
Elkem Carbon ASElkem ASAElkem ASAElkem ASAElkem ASAElkem International ASElkem ASAElkem ASAElkem ASAElkem UK Holdings Ltd.Elkem International AS
NEH LLCElkem Materials, Inc.Elkem ASAElkem ASAElkem Materials, Inc.Elkem ASAElkem ASAElkem ASAElkem ASAElkem ASA 5)
Elkem Carbon ASElkem ASAElkem ASA
Owner
Elkem ASAElkem ASAElkem ASAElkem UK Holdings Ltd.Elkem ASAElkem ASA Elkem ASAElkem ASAElkem ASAElkem ASAElkem ASAElkem ASAElkem ASAElkem Silicones Guangdong Co., Ltd.Elkem ASAElkem ASAElkem ASAElkem ASAElkem ASAElkem ASAElkem ASAElkem ASAElkem ASAElkem ASAElkem ASAElkem Chartering Holding ASEuro Nordic Logistics BVElkem ASA
Explotación de Rocas Industriales y Minerales S.A.Elkem ASAElkem ASA Elkem Participaçòes Indústria e Comércio LimitadaIniconce, S.LElkem Uruguay S.A.Elkem ASA
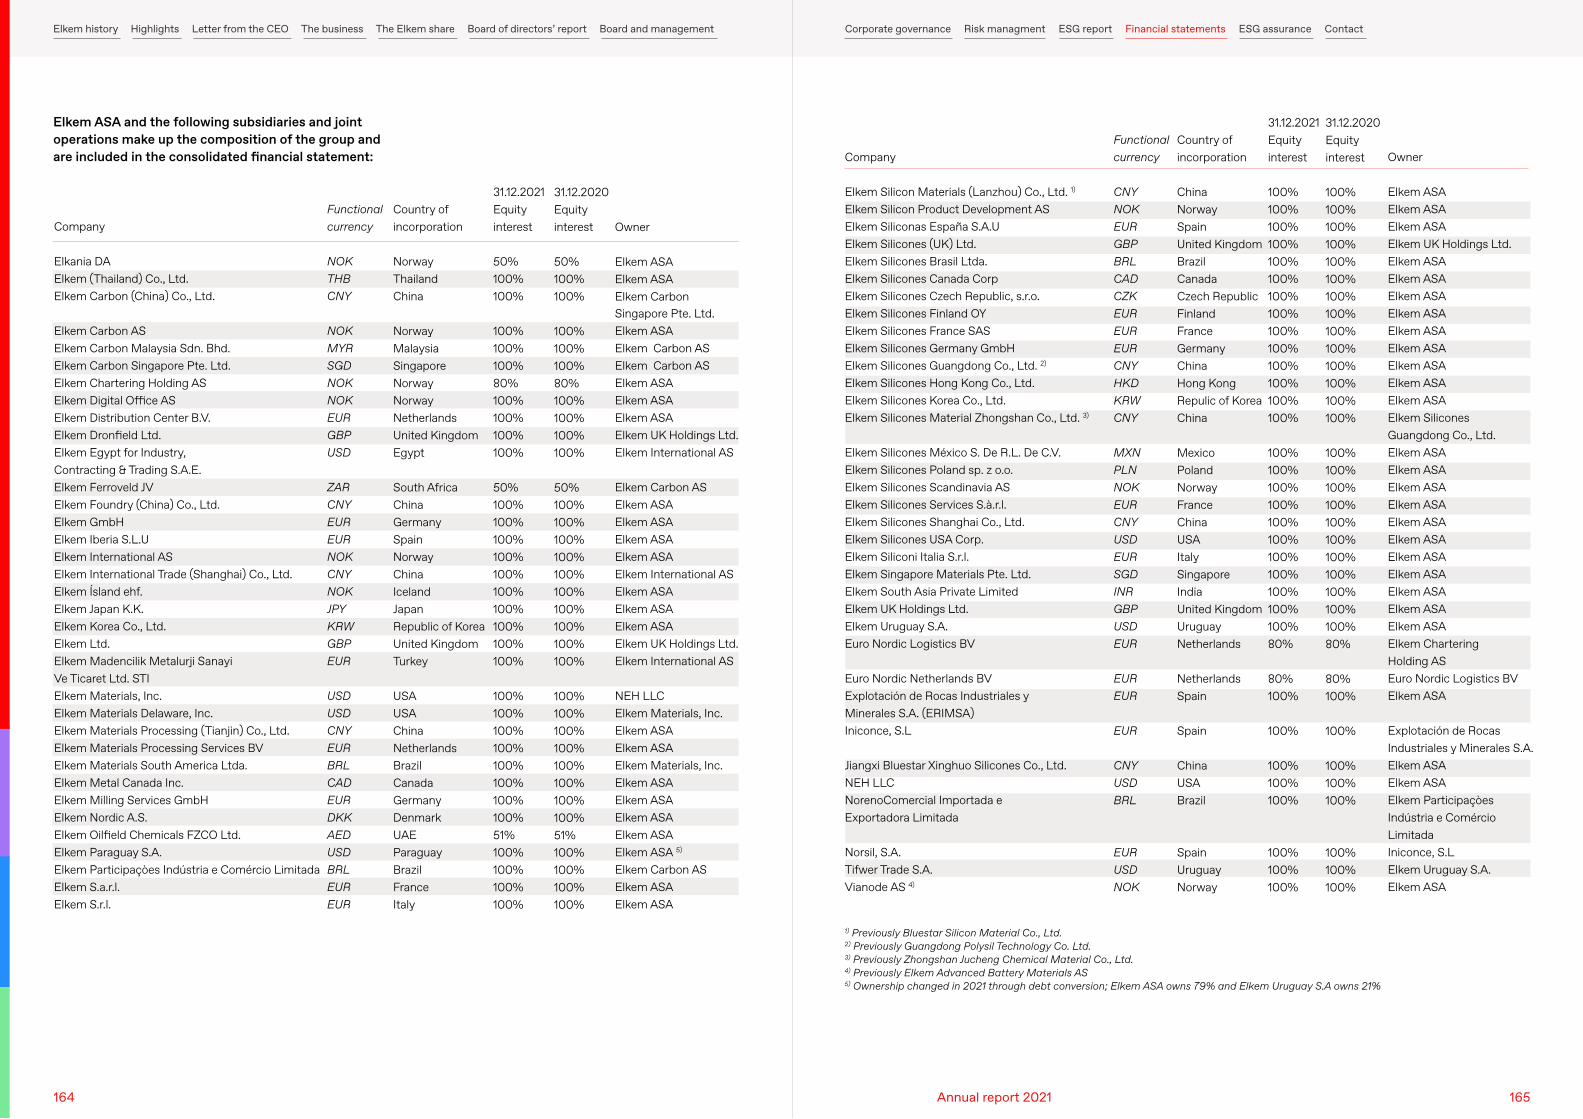
Elkem ASA and the following subsidiaries and joint operations make up the composition of the group and are included in the consolidated financial statement:
1) Previously Bluestar Silicon Material Co., Ltd.2) Previously Guangdong Polysil Technology Co. Ltd.3) Previously Zhongshan Jucheng Chemical Material Co., Ltd.4) Previously Elkem Advanced Battery Materials AS5) Ownership changed in 2021 through debt conversion; Elkem ASA owns 79% and Elkem Uruguay S.A owns 21%
164 165Annual report 2021
Elkem history Highlights Letter from the CEO The business The Elkem share Board of directors’ report Board and management Corporate governance Risk managment ESG report Financial statements ESG assurance Contact
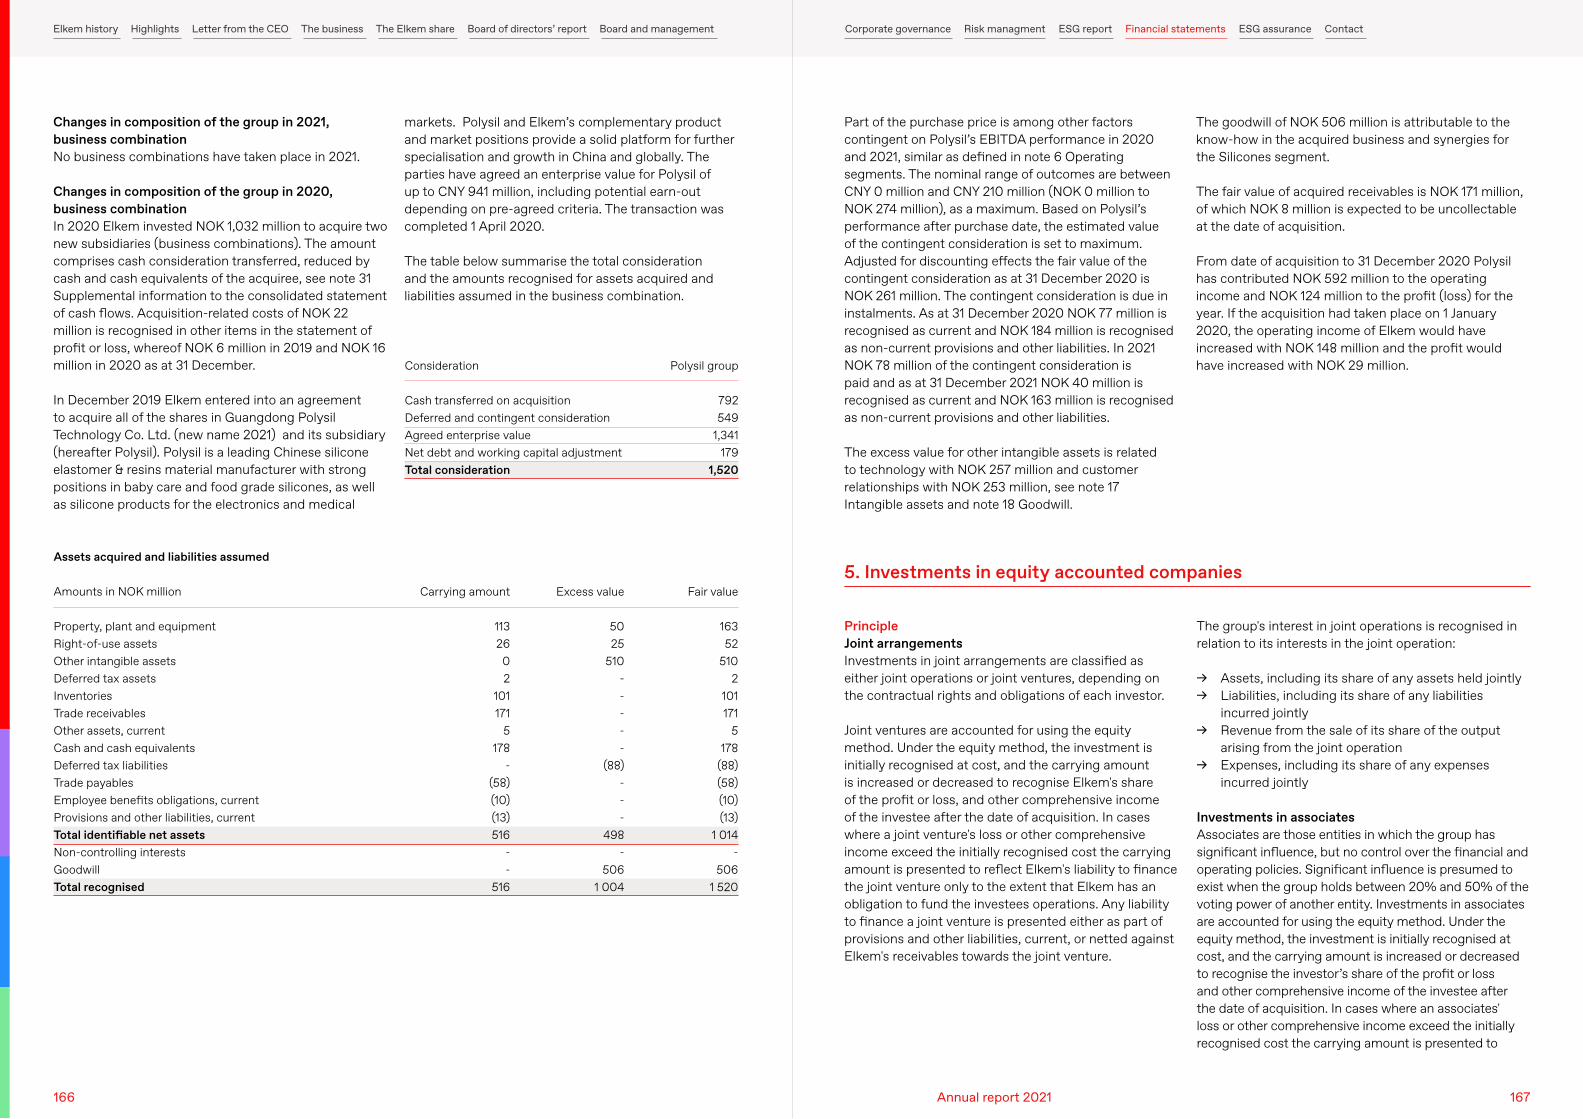
Changes in composition of the group in 2021, business combinationNo business combinations have taken place in 2021.
Changes in composition of the group in 2020, business combinationIn 2020 Elkem invested NOK 1,032 million to acquire two new subsidiaries (business combinations). The amount comprises cash consideration transferred, reduced by cash and cash equivalents of the acquiree, see note 31 Supplemental information to the consolidated statement of cash flows. Acquisition-related costs of NOK 22 million is recognised in other items in the statement of profit or loss, whereof NOK 6 million in 2019 and NOK 16 million in 2020 as at 31 December.
In December 2019 Elkem entered into an agreement to acquire all of the shares in Guangdong Polysil Technology Co. Ltd. (new name 2021) and its subsidiary (hereafter Polysil). Polysil is a leading Chinese silicone elastomer & resins material manufacturer with strong positions in baby care and food grade silicones, as well as silicone products for the electronics and medical
Part of the purchase price is among other factors contingent on Polysil’s EBITDA performance in 2020 and 2021, similar as defined in note 6 Operating segments. The nominal range of outcomes are between CNY 0 million and CNY 210 million (NOK 0 million to NOK 274 million), as a maximum. Based on Polysil’s performance after purchase date, the estimated value of the contingent consideration is set to maximum. Adjusted for discounting effects the fair value of the contingent consideration as at 31 December 2020 is NOK 261 million. The contingent consideration is due in instalments. As at 31 December 2020 NOK 77 million is recognised as current and NOK 184 million is recognised as non-current provisions and other liabilities. In 2021 NOK 78 million of the contingent consideration is paid and as at 31 December 2021 NOK 40 million is recognised as current and NOK 163 million is recognised as non-current provisions and other liabilities.
The excess value for other intangible assets is related to technology with NOK 257 million and customer relationships with NOK 253 million, see note 17 Intangible assets and note 18 Goodwill.
markets. Polysil and Elkem’s complementary product and market positions provide a solid platform for further specialisation and growth in China and globally. The parties have agreed an enterprise value for Polysil of up to CNY 941 million, including potential earn-out depending on pre-agreed criteria. The transaction was completed 1 April 2020.
The table below summarise the total consideration and the amounts recognised for assets acquired and liabilities assumed in the business combination.
The goodwill of NOK 506 million is attributable to the know-how in the acquired business and synergies for the Silicones segment.
The fair value of acquired receivables is NOK 171 million, of which NOK 8 million is expected to be uncollectable at the date of acquisition.
From date of acquisition to 31 December 2020 Polysil has contributed NOK 592 million to the operating income and NOK 124 million to the profit (loss) for the year. If the acquisition had taken place on 1 January 2020, the operating income of Elkem would have increased with NOK 148 million and the profit would have increased with NOK 29 million.Consideration
Cash transferred on acquisitionDeferred and contingent considerationAgreed enterprise valueNet debt and working capital adjustmentTotal consideration
Polysil group
792549
1,341179
1,520
Amounts in NOK million
Property, plant and equipmentRight-of-use assetsOther intangible assetsDeferred tax assetsInventoriesTrade receivablesOther assets, currentCash and cash equivalentsDeferred tax liabilitiesTrade payablesEmployee benefits obligations, currentProvisions and other liabilities, currentTotal identifiable net assetsNon-controlling interestsGoodwillTotal recognised
Carrying amount
113 26
0 2
101 171
5 178
- (58) (10) (13) 516
- -
516
Excess value
50 25
510 - - - - -
(88) - - -
498 -
506 1 004
Fair value
163 52
510 2
101 171
5 178
(88) (58) (10) (13)
1 014 -
506 1 520
PrincipleJoint arrangementsInvestments in joint arrangements are classified as either joint operations or joint ventures, depending on the contractual rights and obligations of each investor.
Joint ventures are accounted for using the equity method. Under the equity method, the investment is initially recognised at cost, and the carrying amount is increased or decreased to recognise Elkem's share of the profit or loss, and other comprehensive income of the investee after the date of acquisition. In cases where a joint venture's loss or other comprehensive income exceed the initially recognised cost the carrying amount is presented to reflect Elkem's liability to finance the joint venture only to the extent that Elkem has an obligation to fund the investees operations. Any liability to finance a joint venture is presented either as part of provisions and other liabilities, current, or netted against Elkem's receivables towards the joint venture.
The group's interest in joint operations is recognised in relation to its interests in the joint operation:
→ Assets, including its share of any assets held jointly → Liabilities, including its share of any liabilities
incurred jointly → Revenue from the sale of its share of the output
arising from the joint operation → Expenses, including its share of any expenses
incurred jointly
Investments in associatesAssociates are those entities in which the group has significant influence, but no control over the financial and operating policies. Significant influence is presumed to exist when the group holds between 20% and 50% of the voting power of another entity. Investments in associates are accounted for using the equity method. Under the equity method, the investment is initially recognised at cost, and the carrying amount is increased or decreased to recognise the investor’s share of the profit or loss and other comprehensive income of the investee after the date of acquisition. In cases where an associates' loss or other comprehensive income exceed the initially recognised cost the carrying amount is presented to
5. Investments in equity accounted companiesAssets acquired and liabilities assumed
166 167Annual report 2021
Elkem history Highlights Letter from the CEO The business The Elkem share Board of directors’ report Board and management Corporate governance Risk managment ESG report Financial statements ESG assurance Contact
reflect Elkem's liability to finance the associate only to the extent that Elkem has an obligation to fund the investees operations. Any liability to finance an associate is presented either as part of provisions and other liabilities, current, or netted against Elkem's receivables towards the associate. The group’s investments in associates includes goodwill identified on acquisition.
Upon disposal of an associate that results in the group losing significant influence over that associate, any retained investment is measured at fair value at that date.
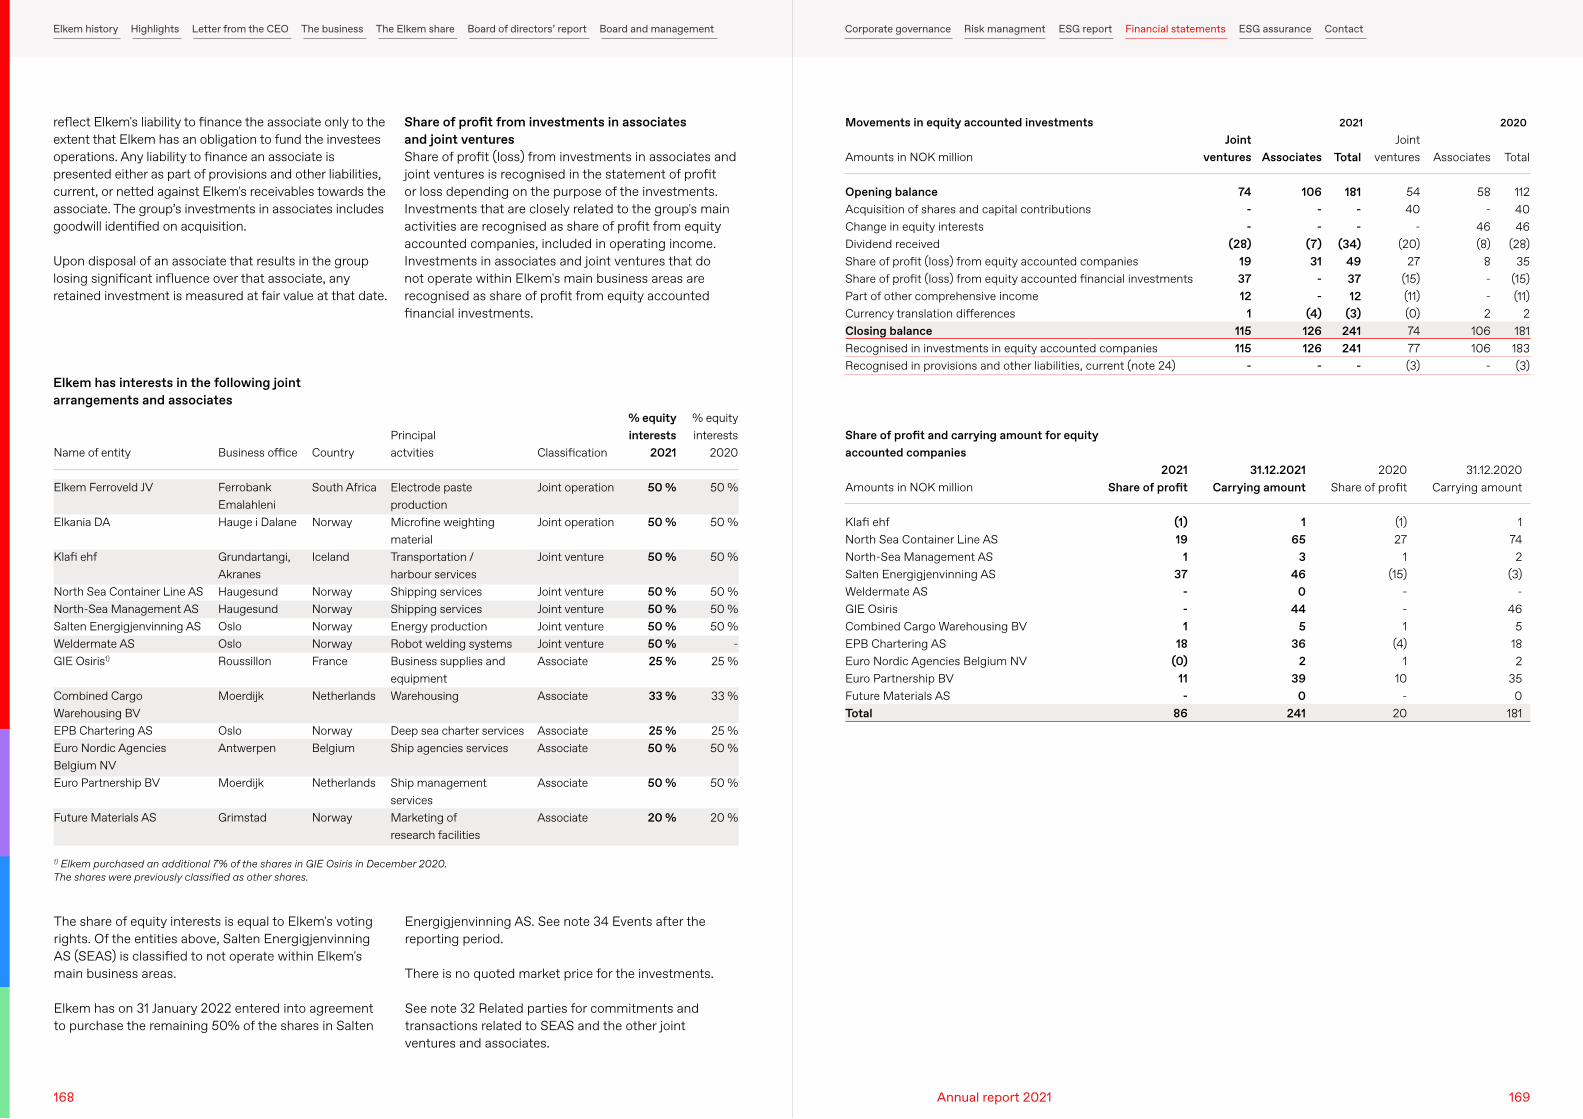
The share of equity interests is equal to Elkem's voting rights. Of the entities above, Salten Energigjenvinning AS (SEAS) is classified to not operate within Elkem's main business areas.
Elkem has on 31 January 2022 entered into agreement to purchase the remaining 50% of the shares in Salten
Elkem has interests in the following joint arrangements and associates
Share of profit from investments in associates and joint venturesShare of profit (loss) from investments in associates and joint ventures is recognised in the statement of profit or loss depending on the purpose of the investments. Investments that are closely related to the group's main activities are recognised as share of profit from equity accounted companies, included in operating income. Investments in associates and joint ventures that do not operate within Elkem's main business areas are recognised as share of profit from equity accounted financial investments.
Energigjenvinning AS. See note 34 Events after the reporting period.
There is no quoted market price for the investments.
See note 32 Related parties for commitments and transactions related to SEAS and the other joint ventures and associates.
Name of entity
Elkem Ferroveld JV
Elkania DA
Klafi ehf
North Sea Container Line ASNorth-Sea Management ASSalten Energigjenvinning ASWeldermate ASGIE Osiris1)
Combined Cargo Warehousing BVEPB Chartering AS Euro Nordic Agencies Belgium NVEuro Partnership BV
Future Materials AS
Business office
Ferrobank EmalahleniHauge i Dalane
Grundartangi, AkranesHaugesundHaugesundOsloOsloRoussillon
Moerdijk
OsloAntwerpen
Moerdijk
Grimstad
Country
South Africa
Norway
Iceland
NorwayNorwayNorwayNorwayFrance
Netherlands
NorwayBelgium
Netherlands
Norway
Principal actvities
Electrode paste productionMicrofine weighting material Transportation / harbour servicesShipping servicesShipping servicesEnergy productionRobot welding systemsBusiness supplies and equipmentWarehousing
Deep sea charter servicesShip agencies services
Ship management servicesMarketing of research facilities
Classification
Joint operation
Joint operation
Joint venture
Joint ventureJoint ventureJoint ventureJoint ventureAssociate
Associate
AssociateAssociate
Associate
Associate
% equity interests
2021
50 %
50 %
50 %
50 %50 %50 %50 %25 %
33 %
25 %50 %
50 %
20 %
% equity interests
2020
50 %
50 %
50 %
50 %50 %50 %
-25 %
33 %
25 %50 %
50 %
20 %
1) Elkem purchased an additional 7% of the shares in GIE Osiris in December 2020. The shares were previously classified as other shares.
Amounts in NOK million
Opening balanceAcquisition of shares and capital contributionsChange in equity interestsDividend receivedShare of profit (loss) from equity accounted companiesShare of profit (loss) from equity accounted financial investmentsPart of other comprehensive incomeCurrency translation differencesClosing balanceRecognised in investments in equity accounted companiesRecognised in provisions and other liabilities, current (note 24)
Amounts in NOK million
Klafi ehfNorth Sea Container Line ASNorth-Sea Management ASSalten Energigjenvinning ASWeldermate ASGIE OsirisCombined Cargo Warehousing BVEPB Chartering ASEuro Nordic Agencies Belgium NVEuro Partnership BVFuture Materials ASTotal
Joint ventures
74 - -
(28) 19 37 12
1 115 115
-
2021Share of profit
(1) 19
1 37
- - 1
18 (0)
11 -
86
Joint ventures
54 40
- (20)
27 (15) (11) (0) 74 77(3)
2020Share of profit
(1) 27
1 (15)
- - 1
(4) 1
10 -
20
Associates
106 - -
(7) 31
- -
(4) 126 126
-
31.12.2021Carrying amount
1 65
3 46
0 44
5 36
2 39
0 241
Associates
58 -
46 (8)
8 - - 2
106 106
-
31.12.2020Carrying amount
1 74 2
(3) -
46 5
18 2
35 0
181
Total
181 - -
(34) 49 37 12
(3) 241 241
-
Total
112 40 46
(28) 35
(15) (11)
2 181 183 (3)
Movements in equity accounted investments
Share of profit and carrying amount for equity accounted companies
2021 2020
168 169Annual report 2021
Elkem history Highlights Letter from the CEO The business The Elkem share Board of directors’ report Board and management Corporate governance Risk managment ESG report Financial statements ESG assurance Contact
Amounts in NOK million
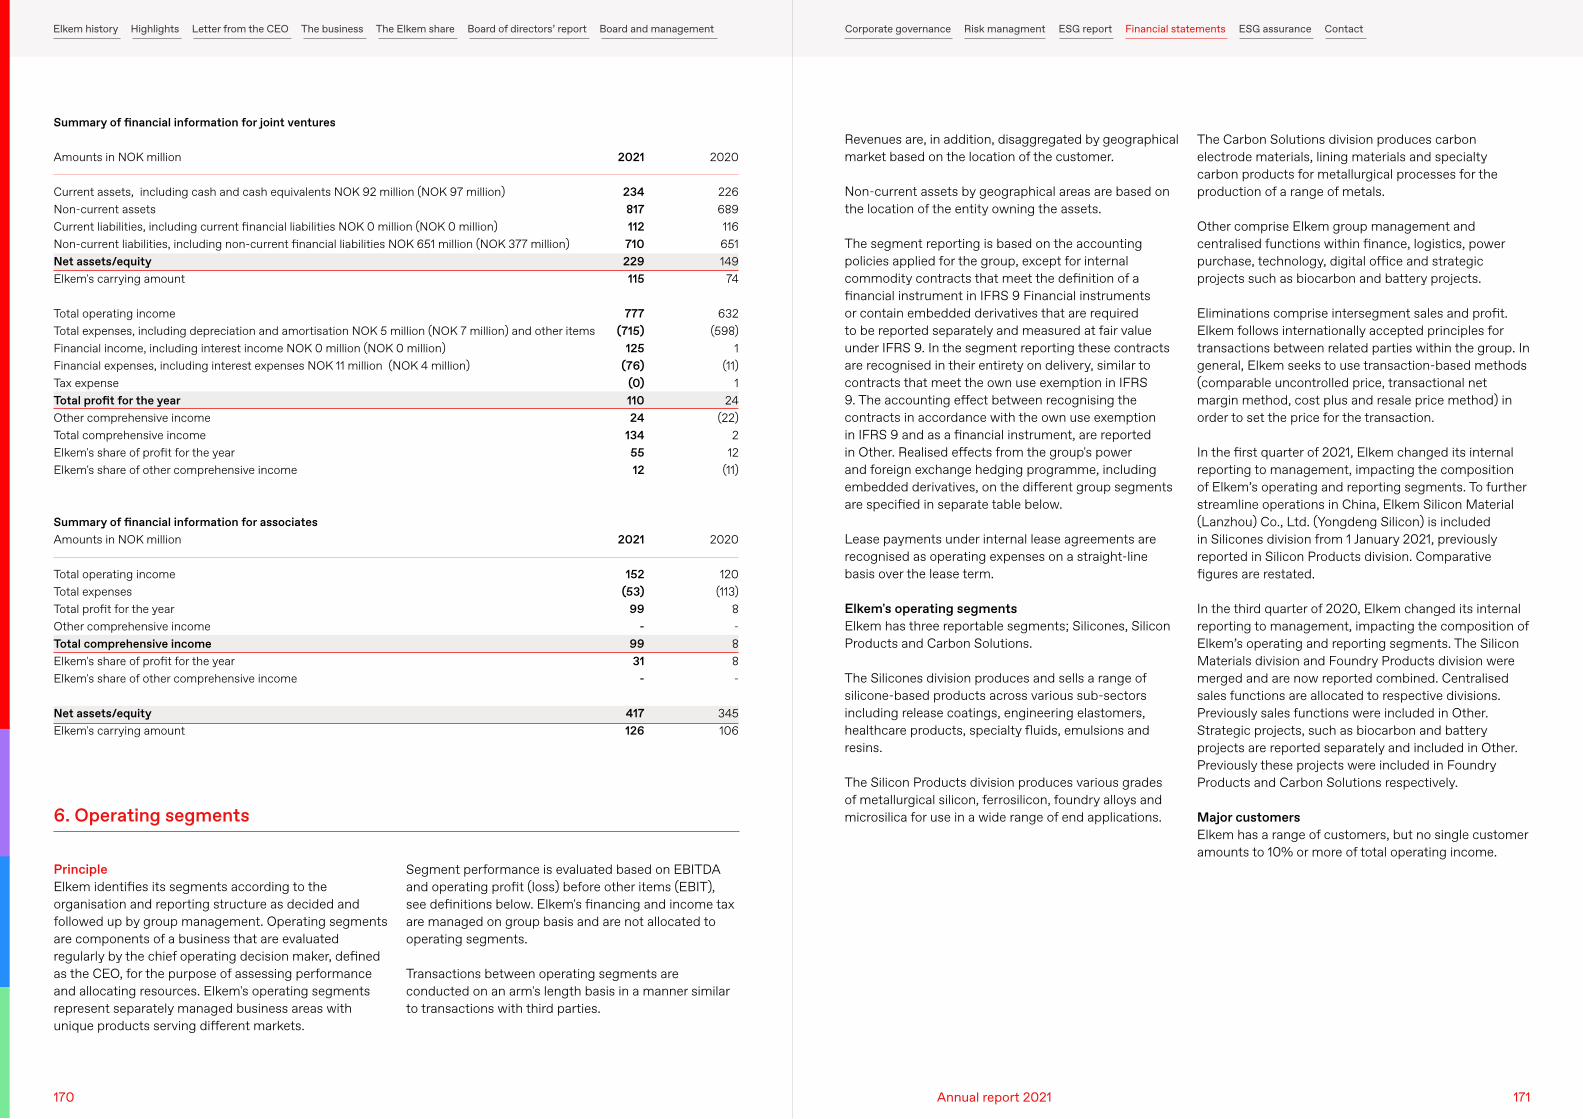
Current assets, including cash and cash equivalents NOK 92 million (NOK 97 million)Non-current assetsCurrent liabilities, including current financial liabilities NOK 0 million (NOK 0 million)Non-current liabilities, including non-current financial liabilities NOK 651 million (NOK 377 million)Net assets/equity Elkem's carrying amount
Total operating incomeTotal expenses, including depreciation and amortisation NOK 5 million (NOK 7 million) and other itemsFinancial income, including interest income NOK 0 million (NOK 0 million)Financial expenses, including interest expenses NOK 11 million (NOK 4 million)Tax expenseTotal profit for the year Other comprehensive incomeTotal comprehensive incomeElkem's share of profit for the yearElkem's share of other comprehensive income
Amounts in NOK million
Total operating incomeTotal expensesTotal profit for the year Other comprehensive incomeTotal comprehensive incomeElkem's share of profit for the yearElkem's share of other comprehensive income
Net assets/equity Elkem's carrying amount
2021
234 817 112
710 229 115
777 (715)
125 (76)
(0) 110 24
134 55 12
2021
152 (53)
99 -
99 31
-
417 126
2020
226 689 116 651 149
74
632 (598)
1 (11)
1 24
(22) 2
12 (11)
2020
120 (113)
8 - 8 8 -
345 106
Summary of financial information for joint ventures
Summary of financial information for associates
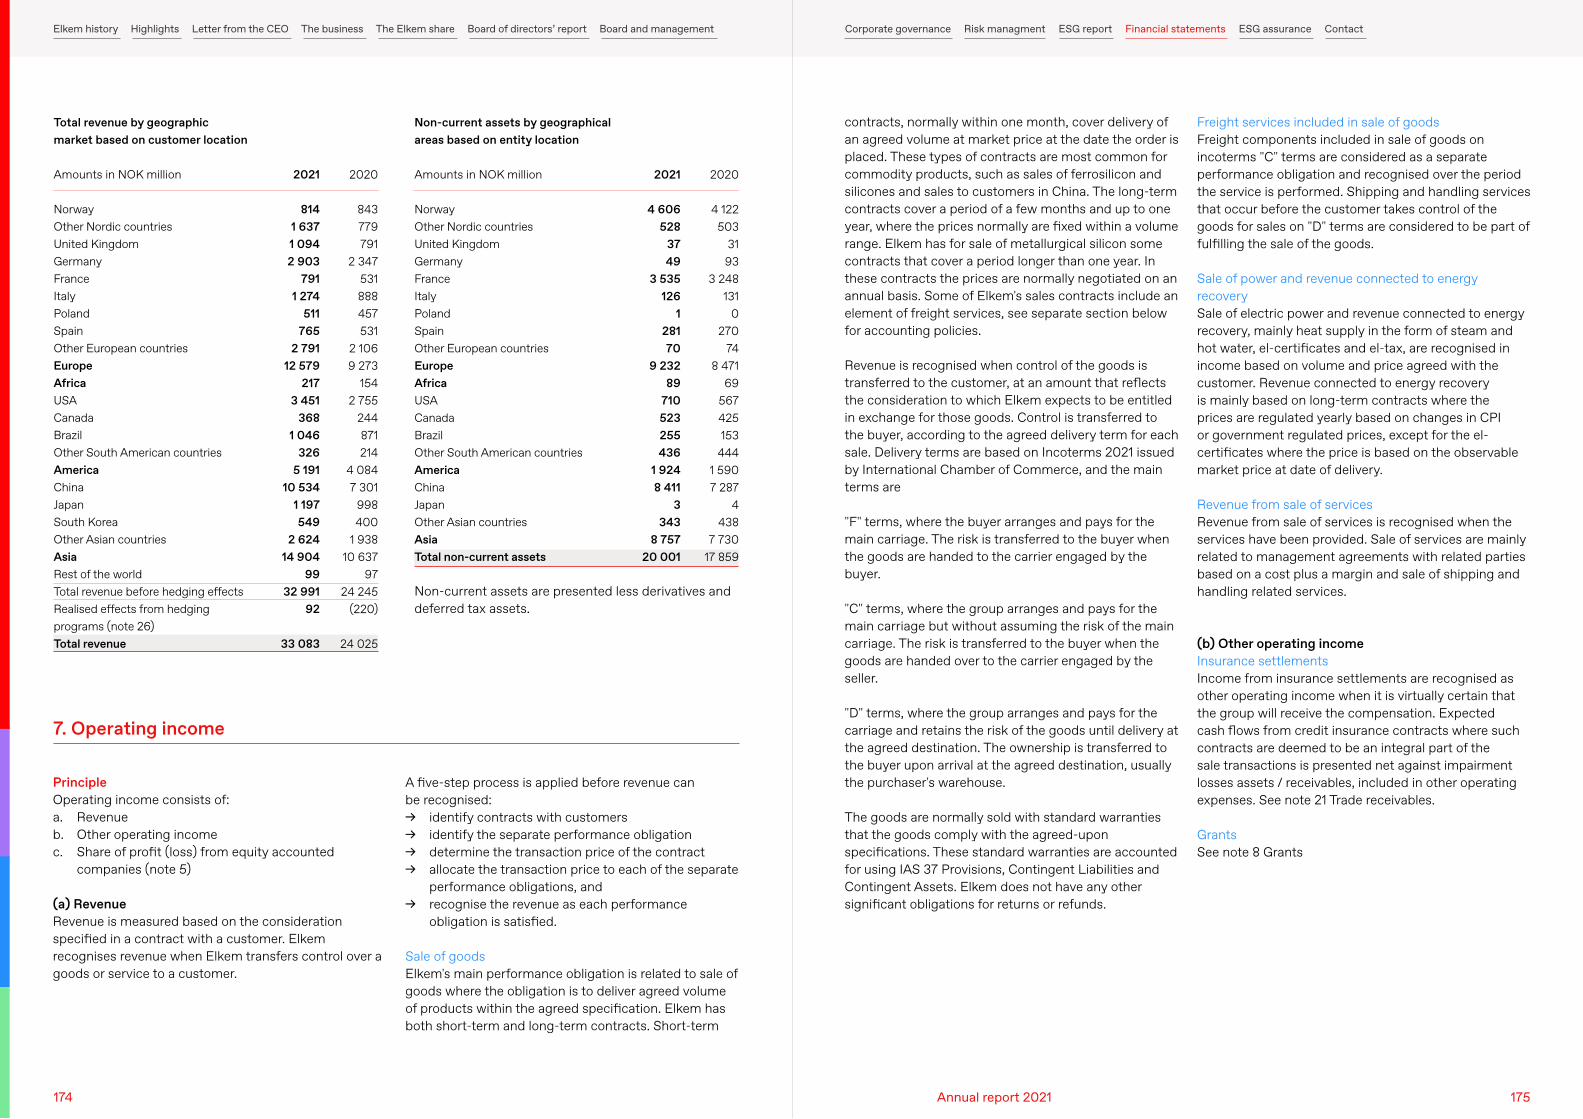
Revenues are, in addition, disaggregated by geographical market based on the location of the customer.
Non-current assets by geographical areas are based on the location of the entity owning the assets.
The segment reporting is based on the accounting policies applied for the group, except for internal commodity contracts that meet the definition of a financial instrument in IFRS 9 Financial instruments or contain embedded derivatives that are required to be reported separately and measured at fair value under IFRS 9. In the segment reporting these contracts are recognised in their entirety on delivery, similar to contracts that meet the own use exemption in IFRS 9. The accounting effect between recognising the contracts in accordance with the own use exemption in IFRS 9 and as a financial instrument, are reported in Other. Realised effects from the group's power and foreign exchange hedging programme, including embedded derivatives, on the different group segments are specified in separate table below.
Lease payments under internal lease agreements are recognised as operating expenses on a straight-line basis over the lease term.
Elkem's operating segmentsElkem has three reportable segments; Silicones, Silicon Products and Carbon Solutions.
The Silicones division produces and sells a range of silicone-based products across various sub-sectors including release coatings, engineering elastomers, healthcare products, specialty fluids, emulsions and resins.
The Silicon Products division produces various grades of metallurgical silicon, ferrosilicon, foundry alloys and microsilica for use in a wide range of end applications.
PrincipleElkem identifies its segments according to the organisation and reporting structure as decided and followed up by group management. Operating segments are components of a business that are evaluated regularly by the chief operating decision maker, defined as the CEO, for the purpose of assessing performance and allocating resources. Elkem's operating segments represent separately managed business areas with unique products serving different markets.
The Carbon Solutions division produces carbon electrode materials, lining materials and specialty carbon products for metallurgical processes for the production of a range of metals.
Other comprise Elkem group management and centralised functions within finance, logistics, power purchase, technology, digital office and strategic projects such as biocarbon and battery projects.
Eliminations comprise intersegment sales and profit. Elkem follows internationally accepted principles for transactions between related parties within the group. In general, Elkem seeks to use transaction-based methods (comparable uncontrolled price, transactional net margin method, cost plus and resale price method) in order to set the price for the transaction.
In the first quarter of 2021, Elkem changed its internal reporting to management, impacting the composition of Elkem’s operating and reporting segments. To further streamline operations in China, Elkem Silicon Material (Lanzhou) Co., Ltd. (Yongdeng Silicon) is included in Silicones division from 1 January 2021, previously reported in Silicon Products division. Comparative figures are restated.
In the third quarter of 2020, Elkem changed its internal reporting to management, impacting the composition of Elkem’s operating and reporting segments. The Silicon Materials division and Foundry Products division were merged and are now reported combined. Centralised sales functions are allocated to respective divisions. Previously sales functions were included in Other. Strategic projects, such as biocarbon and battery projects are reported separately and included in Other. Previously these projects were included in Foundry Products and Carbon Solutions respectively.
Major customersElkem has a range of customers, but no single customer amounts to 10% or more of total operating income.
Segment performance is evaluated based on EBITDA and operating profit (loss) before other items (EBIT), see definitions below. Elkem's financing and income tax are managed on group basis and are not allocated to operating segments.
Transactions between operating segments are conducted on an arm's length basis in a manner similar to transactions with third parties.
6. Operating segments
170 171Annual report 2021
Elkem history Highlights Letter from the CEO The business The Elkem share Board of directors’ report Board and management Corporate governance Risk managment ESG report Financial statements ESG assurance Contact
Amounts in NOK million
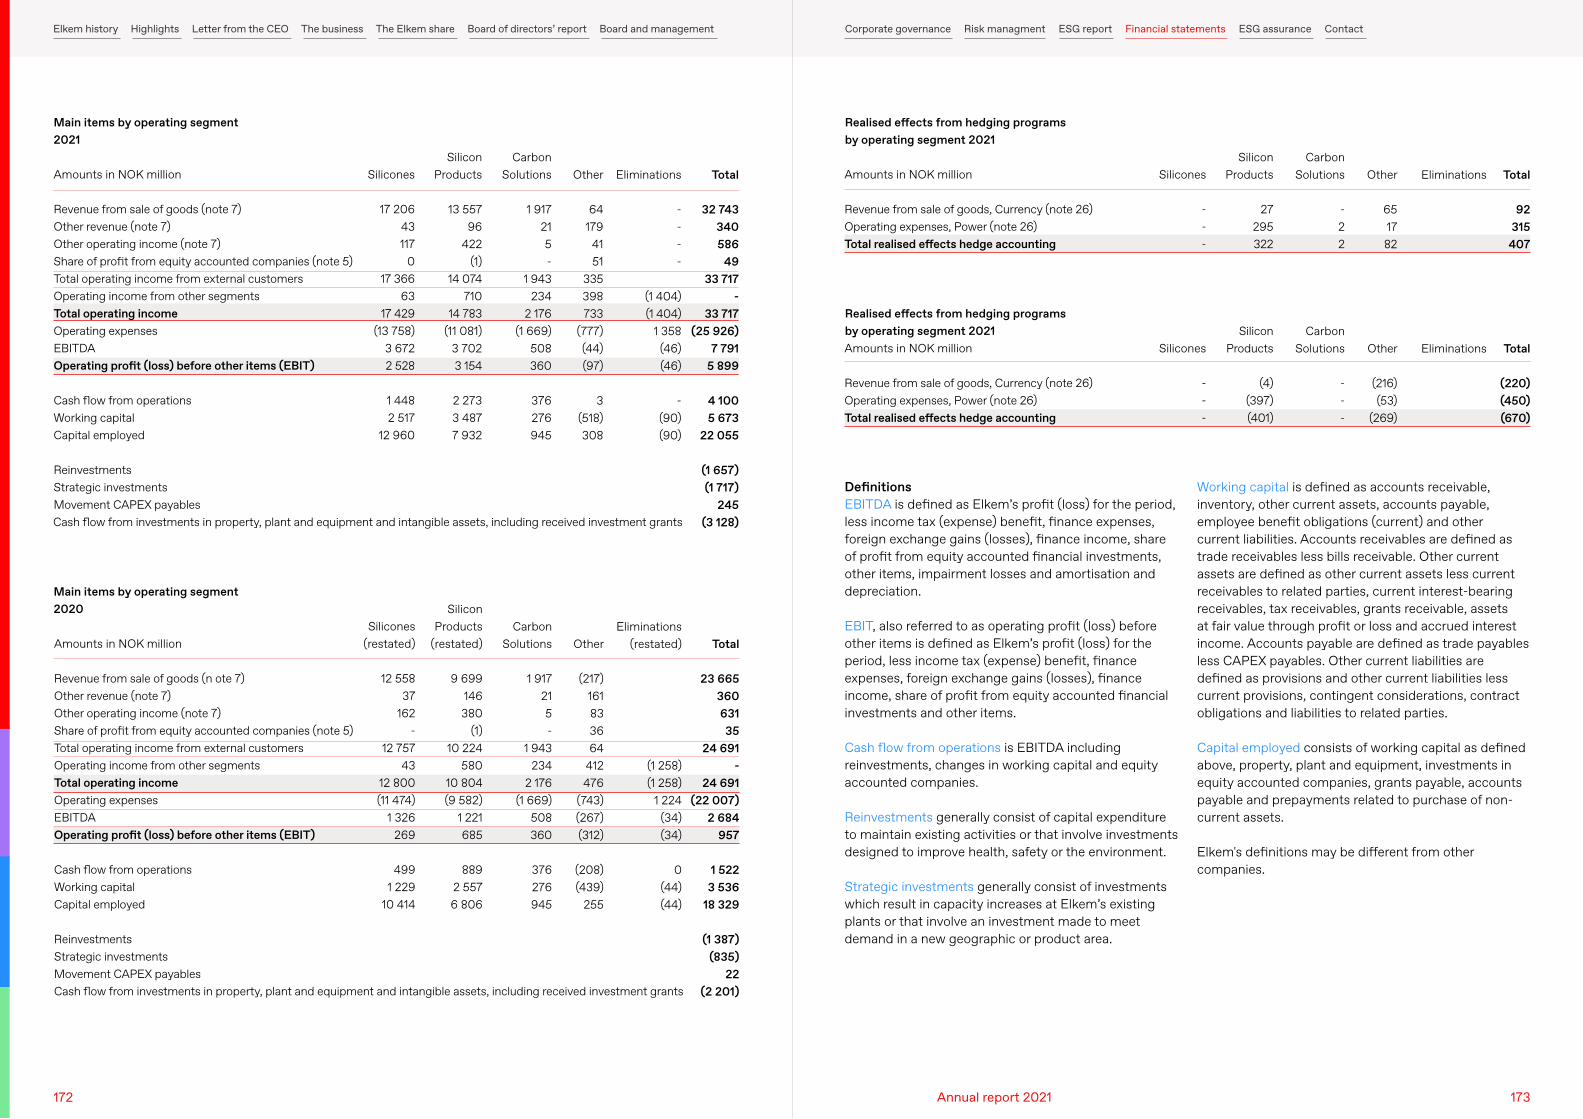
Revenue from sale of goods (note 7)Other revenue (note 7)Other operating income (note 7)Share of profit from equity accounted companies (note 5)Total operating income from external customersOperating income from other segmentsTotal operating incomeOperating expensesEBITDAOperating profit (loss) before other items (EBIT)
Cash flow from operationsWorking capitalCapital employed
ReinvestmentsStrategic investmentsMovement CAPEX payables
Amounts in NOK million
Revenue from sale of goods (n ote 7)Other revenue (note 7)Other operating income (note 7)Share of profit from equity accounted companies (note 5)Total operating income from external customersOperating income from other segmentsTotal operating incomeOperating expensesEBITDAOperating profit (loss) before other items (EBIT)
Cash flow from operationsWorking capitalCapital employed
ReinvestmentsStrategic investmentsMovement CAPEX payables
Amounts in NOK million
Revenue from sale of goods, Currency (note 26)Operating expenses, Power (note 26)Total realised effects hedge accounting
Amounts in NOK million
Revenue from sale of goods, Currency (note 26)Operating expenses, Power (note 26)Total realised effects hedge accounting
Main items by operating segment2021
Main items by operating segment2020
Realised effects from hedging programs by operating segment 2021
Realised effects from hedging programs by operating segment 2021
Silicones
17 206 43 117
0 17 366
63 17 429
(13 758)3 672 2 528
1 448 2 517
12 960
Silicones(restated)
12 558 37
162 -
12 757 43
12 800 (11 474)
1 326 269
499 1 229
10 414
Silicones
- - -
Silicones
- - -
Silicon Products
13 557 96
422 (1)
14 074 710
14 783 (11 081)
3 702 3 154
2 273 3 487 7 932
Silicon Products
(restated)
9 699 146 380
(1) 10 224
580 10 804 (9 582)
1 221 685
889 2 557 6 806
Silicon Products
27 295 322
Silicon Products
(4) (397) (401)
Carbon Solutions
1 917 21 5 -
1 943 234
2 176 (1 669)
508 360
376 276 945
Carbon Solutions
1 917 21 5 -
1 943 234
2 176 (1 669)
508 360
376 276 945
Carbon Solutions
- 2 2
Carbon Solutions
- - -
Other
64 179
41 51
335 398 733
(777)(44)(97)
3 (518) 308
Other
(217) 161 83 36 64 412
476 (743)(267)(312)
(208)(439)
255
Other
65 17 82
Other
(216) (53)
(269)
Eliminations
- - - -
(1 404) (1 404)
1 358 (46)(46)
- (90) (90)
Eliminations (restated)
(1 258)(1 258)
1 224 (34)(34)
0 (44)(44)
Eliminations
Eliminations
Total
32 743 340 586
49 33 717
- 33 717
(25 926)7 791
5 899
4 100 5 673
22 055
(1 657) (1 717)
245 (3 128)
Total
23 665 360 631 35
24 691 -
24 691 (22 007)
2 684 957
1 522 3 536
18 329
(1 387) (835)
22 (2 201)
Total
92 315
407
Total
(220) (450) (670)
Cash flow from investments in property, plant and equipment and intangible assets, including received investment grants
Cash flow from investments in property, plant and equipment and intangible assets, including received investment grants
Definitions EBITDA is defined as Elkem’s profit (loss) for the period, less income tax (expense) benefit, finance expenses, foreign exchange gains (losses), finance income, share of profit from equity accounted financial investments, other items, impairment losses and amortisation and depreciation.
EBIT, also referred to as operating profit (loss) before other items is defined as Elkem’s profit (loss) for the period, less income tax (expense) benefit, finance expenses, foreign exchange gains (losses), finance income, share of profit from equity accounted financial investments and other items.
Cash flow from operations is EBITDA including reinvestments, changes in working capital and equity accounted companies.
Reinvestments generally consist of capital expenditure to maintain existing activities or that involve investments designed to improve health, safety or the environment.
Strategic investments generally consist of investments which result in capacity increases at Elkem’s existing plants or that involve an investment made to meet demand in a new geographic or product area.
Working capital is defined as accounts receivable, inventory, other current assets, accounts payable, employee benefit obligations (current) and other current liabilities. Accounts receivables are defined as trade receivables less bills receivable. Other current assets are defined as other current assets less current receivables to related parties, current interest-bearing receivables, tax receivables, grants receivable, assets at fair value through profit or loss and accrued interest income. Accounts payable are defined as trade payables less CAPEX payables. Other current liabilities are defined as provisions and other current liabilities less current provisions, contingent considerations, contract obligations and liabilities to related parties.
Capital employed consists of working capital as defined above, property, plant and equipment, investments in equity accounted companies, grants payable, accounts payable and prepayments related to purchase of non-current assets.
Elkem's definitions may be different from other companies.
172 173Annual report 2021
Elkem history Highlights Letter from the CEO The business The Elkem share Board of directors’ report Board and management Corporate governance Risk managment ESG report Financial statements ESG assurance Contact
Amounts in NOK million
NorwayOther Nordic countriesUnited KingdomGermanyFranceItalyPolandSpainOther European countriesEuropeAfricaUSACanadaBrazilOther South American countriesAmericaChinaJapanSouth KoreaOther Asian countriesAsiaRest of the worldTotal revenue before hedging effectsRealised effects from hedging programs (note 26)Total revenue
Amounts in NOK million
NorwayOther Nordic countriesUnited KingdomGermanyFranceItalyPolandSpainOther European countriesEuropeAfricaUSACanadaBrazilOther South American countriesAmericaChinaJapanOther Asian countriesAsiaTotal non-current assets
Total revenue by geographic market based on customer location
Non-current assets by geographical areas based on entity location
2021
8141 6371 0942 903
7911 274
511765
2 79112 579
2173 451
3681 046
3265 191
10 5341 197549
2 62414 904
9932 991
92
33 083
2021
4 606 528
37 49
3 535 126
1 281 70
9 232 89
710 523 255 436
1 924 8 411
3 343
8 757 20 001
2020
843779791
2 347531888457531
2 1069 273
1542 755
244871214
4 0847 301
998400
1 93810 637
9724 245
(220)
24 025
2020
4 122 503
31 93
3 248 131
0 270
74 8 471
69 567 425 153
444 1 590 7 287
4 438
7 730 17 859
Non-current assets are presented less derivatives and deferred tax assets.
PrincipleOperating income consists of:a. Revenueb. Other operating incomec. Share of profit (loss) from equity accounted
companies (note 5)
(a) RevenueRevenue is measured based on the consideration specified in a contract with a customer. Elkem recognises revenue when Elkem transfers control over a goods or service to a customer.
contracts, normally within one month, cover delivery of an agreed volume at market price at the date the order is placed. These types of contracts are most common for commodity products, such as sales of ferrosilicon and silicones and sales to customers in China. The long-term contracts cover a period of a few months and up to one year, where the prices normally are fixed within a volume range. Elkem has for sale of metallurgical silicon some contracts that cover a period longer than one year. In these contracts the prices are normally negotiated on an annual basis. Some of Elkem's sales contracts include an element of freight services, see separate section below for accounting policies.
Revenue is recognised when control of the goods is transferred to the customer, at an amount that reflects the consideration to which Elkem expects to be entitled in exchange for those goods. Control is transferred to the buyer, according to the agreed delivery term for each sale. Delivery terms are based on Incoterms 2021 issued by International Chamber of Commerce, and the main terms are
"F" terms, where the buyer arranges and pays for the main carriage. The risk is transferred to the buyer when the goods are handed to the carrier engaged by the buyer.
"C" terms, where the group arranges and pays for the main carriage but without assuming the risk of the main carriage. The risk is transferred to the buyer when the goods are handed over to the carrier engaged by the seller.
"D" terms, where the group arranges and pays for the carriage and retains the risk of the goods until delivery at the agreed destination. The ownership is transferred to the buyer upon arrival at the agreed destination, usually the purchaser's warehouse.
The goods are normally sold with standard warranties that the goods comply with the agreed-upon specifications. These standard warranties are accounted for using IAS 37 Provisions, Contingent Liabilities and Contingent Assets. Elkem does not have any other significant obligations for returns or refunds.
A five-step process is applied before revenue can be recognised:
→ identify contracts with customers → identify the separate performance obligation → determine the transaction price of the contract → allocate the transaction price to each of the separate
performance obligations, and → recognise the revenue as each performance
obligation is satisfied.
Sale of goodsElkem's main performance obligation is related to sale of goods where the obligation is to deliver agreed volume of products within the agreed specification. Elkem has both short-term and long-term contracts. Short-term
Freight services included in sale of goodsFreight components included in sale of goods on incoterms "C" terms are considered as a separate performance obligation and recognised over the period the service is performed. Shipping and handling services that occur before the customer takes control of the goods for sales on "D" terms are considered to be part of fulfilling the sale of the goods.
Sale of power and revenue connected to energy recoverySale of electric power and revenue connected to energy recovery, mainly heat supply in the form of steam and hot water, el-certificates and el-tax, are recognised in income based on volume and price agreed with the customer. Revenue connected to energy recovery is mainly based on long-term contracts where the prices are regulated yearly based on changes in CPI or government regulated prices, except for the el-certificates where the price is based on the observable market price at date of delivery.
Revenue from sale of servicesRevenue from sale of services is recognised when the services have been provided. Sale of services are mainly related to management agreements with related parties based on a cost plus a margin and sale of shipping and handling related services.
(b) Other operating incomeInsurance settlementsIncome from insurance settlements are recognised as other operating income when it is virtually certain that the group will receive the compensation. Expected cash flows from credit insurance contracts where such contracts are deemed to be an integral part of the sale transactions is presented net against impairment losses assets / receivables, included in other operating expenses. See note 21 Trade receivables.
GrantsSee note 8 Grants
7. Operating income
174 175Annual report 2021
Elkem history Highlights Letter from the CEO The business The Elkem share Board of directors’ report Board and management Corporate governance Risk managment ESG report Financial statements ESG assurance Contact
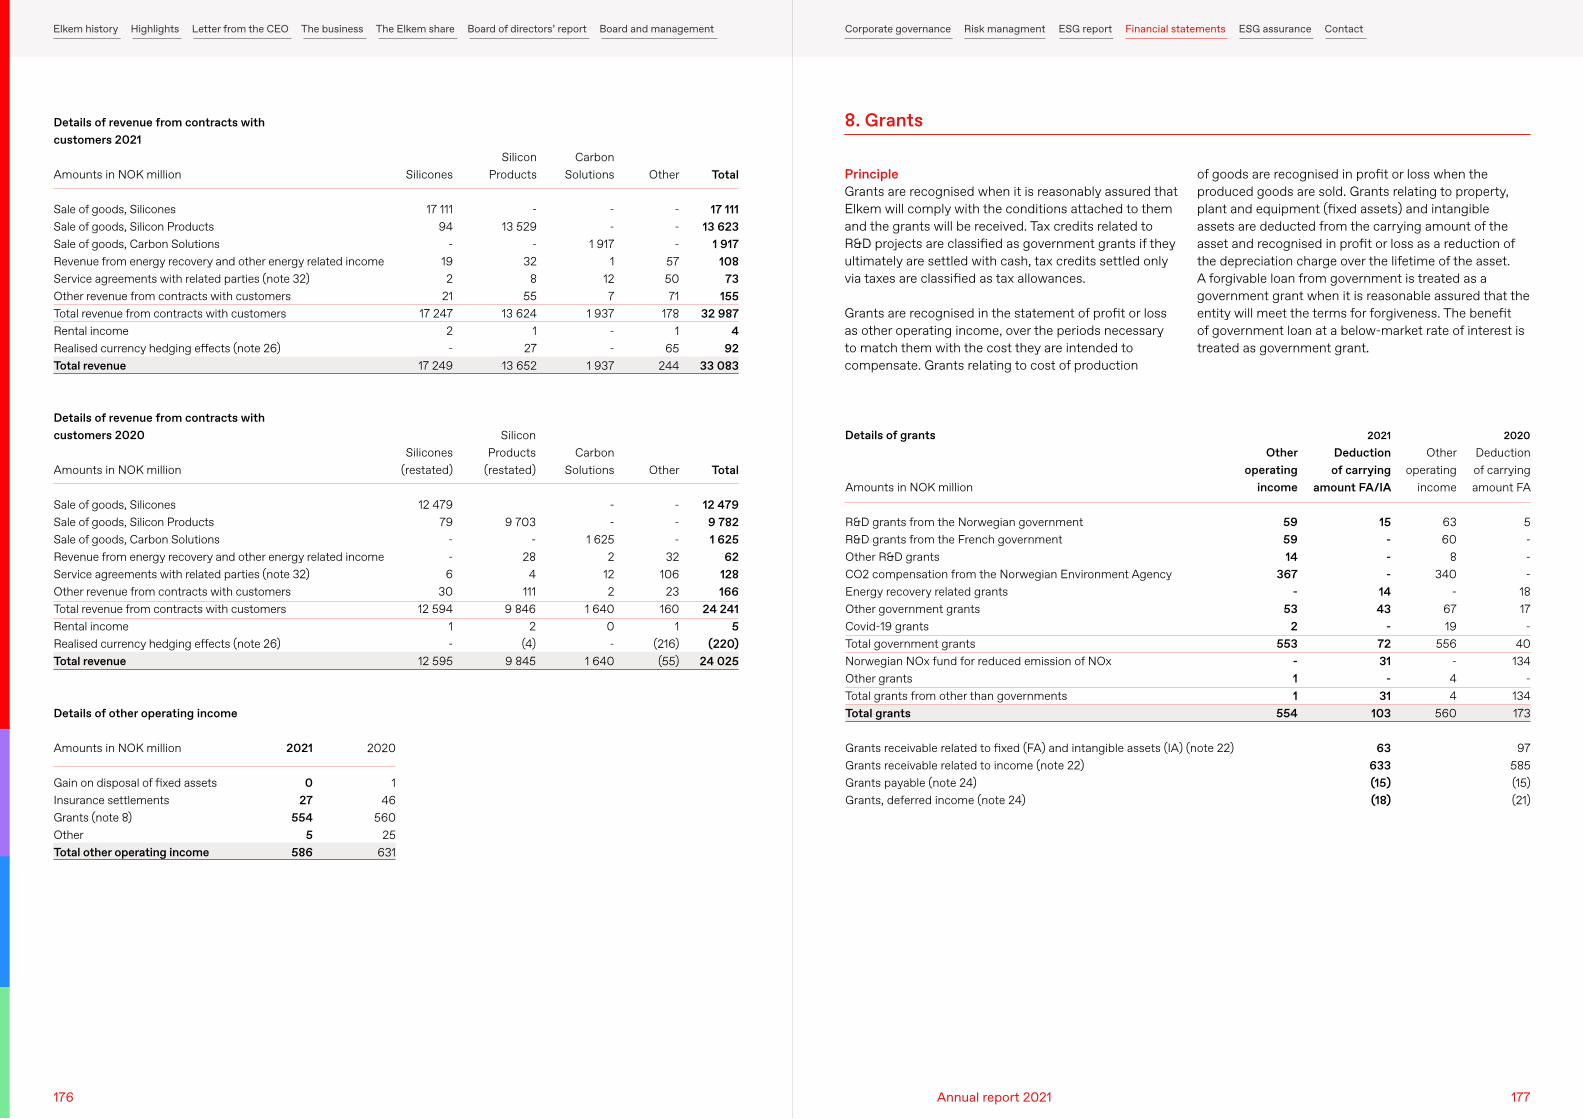
Amounts in NOK million
Sale of goods, SiliconesSale of goods, Silicon ProductsSale of goods, Carbon SolutionsRevenue from energy recovery and other energy related incomeService agreements with related parties (note 32)Other revenue from contracts with customersTotal revenue from contracts with customersRental incomeRealised currency hedging effects (note 26)Total revenue
Amounts in NOK million
Gain on disposal of fixed assetsInsurance settlementsGrants (note 8)OtherTotal other operating income
Details of revenue from contracts with customers 2021
Details of revenue from contracts with customers 2020
Details of other operating income
Silicones
17 111 94
- 19 2
21 17 247
2 -
17 249
Silicones (restated)
12 479 79
- - 6
30 12 594
1 -
12 595
Silicon Products
- 13 529
- 32
8 55
13 624 1
27 13 652
Silicon Products
(restated)
9 703 -
28 4
111 9 846
2 (4)
9 845
Carbon Solutions
- -
1 917 1
12 7
1 937 - -
1 937
Carbon Solutions
- -
1 625 2
12 2
1 640 0 -
1 640
2021
027
5545
586
Other
- - -
57 50 71
178 1
65 244
Other
- - -
32 106 23 160
1 (216) (55)
Total
17 111 13 623
1 917 108
73 155
32 987 4
92 33 083
Total
12 479 9 782 1 625
62 128 166
24 241 5
(220) 24 025
2020
146
56025
631
PrincipleGrants are recognised when it is reasonably assured that Elkem will comply with the conditions attached to them and the grants will be received. Tax credits related to R&D projects are classified as government grants if they ultimately are settled with cash, tax credits settled only via taxes are classified as tax allowances.
Grants are recognised in the statement of profit or loss as other operating income, over the periods necessary to match them with the cost they are intended to compensate. Grants relating to cost of production
of goods are recognised in profit or loss when the produced goods are sold. Grants relating to property, plant and equipment (fixed assets) and intangible assets are deducted from the carrying amount of the asset and recognised in profit or loss as a reduction of the depreciation charge over the lifetime of the asset. A forgivable loan from government is treated as a government grant when it is reasonable assured that the entity will meet the terms for forgiveness. The benefit of government loan at a below-market rate of interest is treated as government grant.
8. Grants
Amounts in NOK million
R&D grants from the Norwegian governmentR&D grants from the French governmentOther R&D grantsCO2 compensation from the Norwegian Environment AgencyEnergy recovery related grantsOther government grantsCovid-19 grantsTotal government grantsNorwegian NOx fund for reduced emission of NOxOther grantsTotal grants from other than governmentsTotal grants
Grants receivable related to fixed (FA) and intangible assets (IA) (note 22)Grants receivable related to income (note 22)Grants payable (note 24)Grants, deferred income (note 24)
Other operating
income
59 59 14
367 -
53 2
553 - 1 1
554
Other operating
income
63 60
8 340
- 67 19
556 - 4 4
560
Deduction of carrying amount FA
5 - - -
18 17 -
40 134
- 134 173
97
585 (15) (21)
Deduction of carrying
amount FA/IA
15 - - -
14 43
- 72 31
- 31
103
63 633 (15) (18)
Details of grants 2021 2020
176 177Annual report 2021
Elkem history Highlights Letter from the CEO The business The Elkem share Board of directors’ report Board and management Corporate governance Risk managment ESG report Financial statements ESG assurance Contact
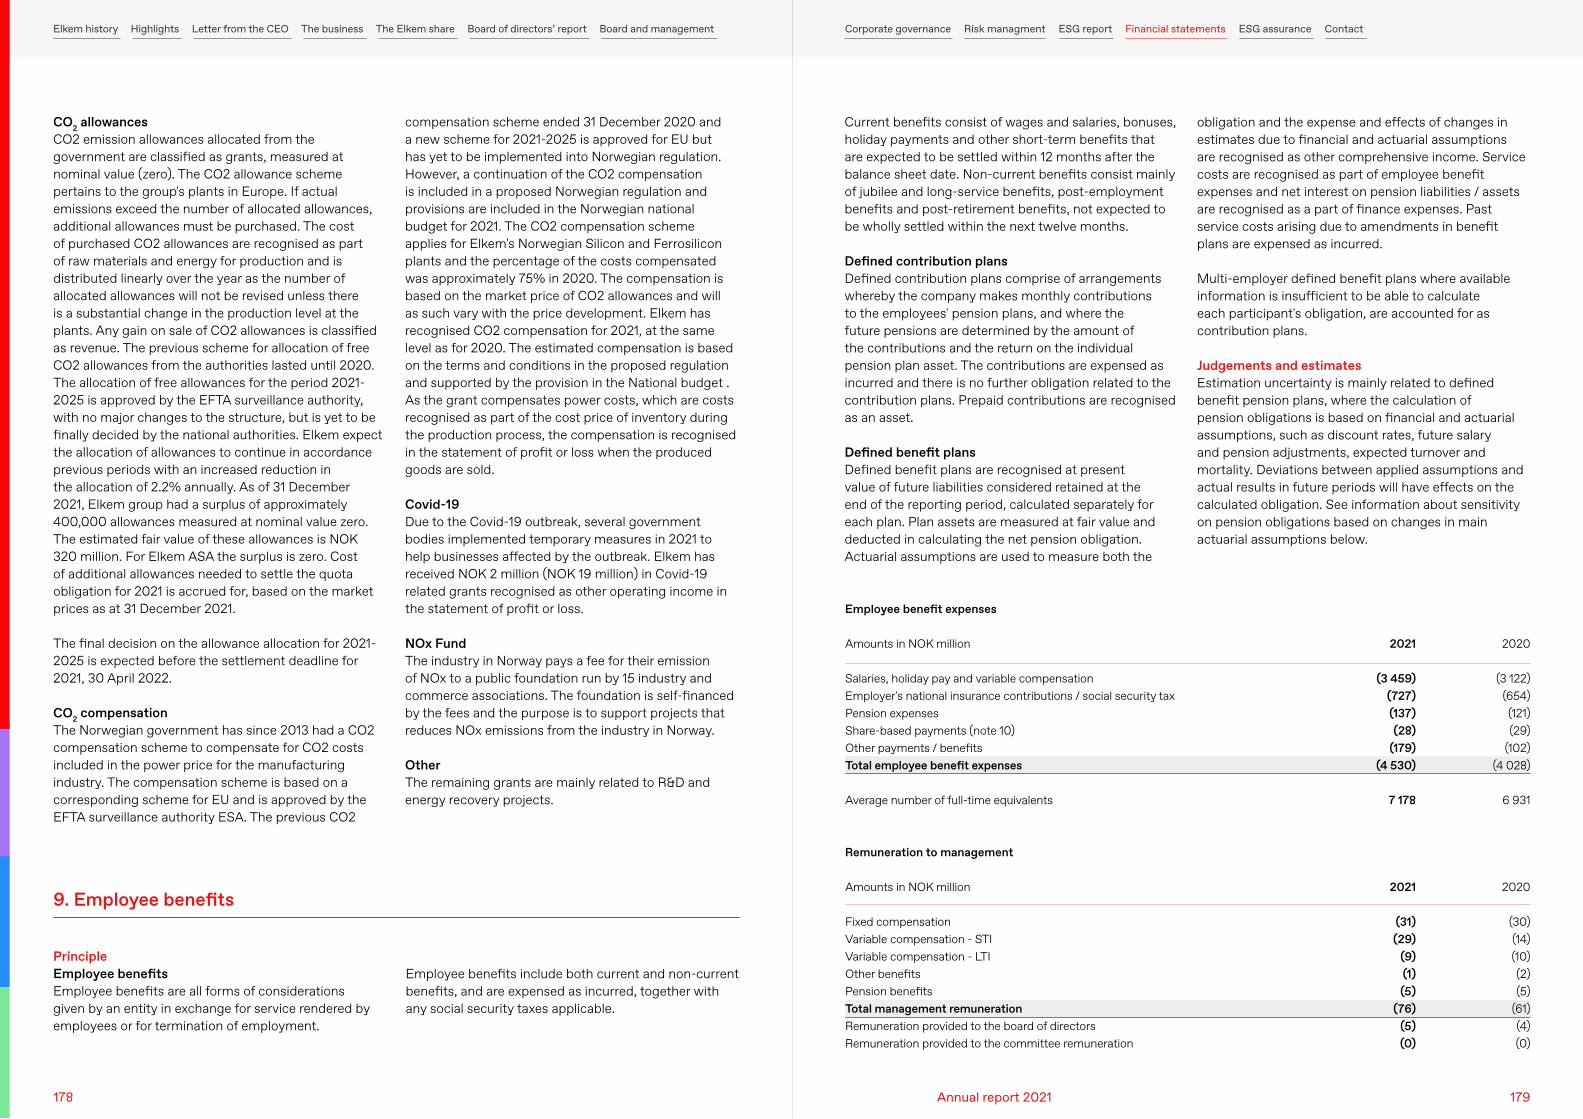
CO2 allowancesCO2 emission allowances allocated from the government are classified as grants, measured at nominal value (zero). The CO2 allowance scheme pertains to the group's plants in Europe. If actual emissions exceed the number of allocated allowances, additional allowances must be purchased. The cost of purchased CO2 allowances are recognised as part of raw materials and energy for production and is distributed linearly over the year as the number of allocated allowances will not be revised unless there is a substantial change in the production level at the plants. Any gain on sale of CO2 allowances is classified as revenue. The previous scheme for allocation of free CO2 allowances from the authorities lasted until 2020. The allocation of free allowances for the period 2021-2025 is approved by the EFTA surveillance authority, with no major changes to the structure, but is yet to be finally decided by the national authorities. Elkem expect the allocation of allowances to continue in accordance previous periods with an increased reduction in the allocation of 2.2% annually. As of 31 December 2021, Elkem group had a surplus of approximately 400,000 allowances measured at nominal value zero. The estimated fair value of these allowances is NOK 320 million. For Elkem ASA the surplus is zero. Cost of additional allowances needed to settle the quota obligation for 2021 is accrued for, based on the market prices as at 31 December 2021.
The final decision on the allowance allocation for 2021-2025 is expected before the settlement deadline for 2021, 30 April 2022.
CO2 compensationThe Norwegian government has since 2013 had a CO2 compensation scheme to compensate for CO2 costs included in the power price for the manufacturing industry. The compensation scheme is based on a corresponding scheme for EU and is approved by the EFTA surveillance authority ESA. The previous CO2
compensation scheme ended 31 December 2020 and a new scheme for 2021-2025 is approved for EU but has yet to be implemented into Norwegian regulation. However, a continuation of the CO2 compensation is included in a proposed Norwegian regulation and provisions are included in the Norwegian national budget for 2021. The CO2 compensation scheme applies for Elkem's Norwegian Silicon and Ferrosilicon plants and the percentage of the costs compensated was approximately 75% in 2020. The compensation is based on the market price of CO2 allowances and will as such vary with the price development. Elkem has recognised CO2 compensation for 2021, at the same level as for 2020. The estimated compensation is based on the terms and conditions in the proposed regulation and supported by the provision in the National budget . As the grant compensates power costs, which are costs recognised as part of the cost price of inventory during the production process, the compensation is recognised in the statement of profit or loss when the produced goods are sold.
Covid-19Due to the Covid-19 outbreak, several government bodies implemented temporary measures in 2021 to help businesses affected by the outbreak. Elkem has received NOK 2 million (NOK 19 million) in Covid-19 related grants recognised as other operating income in the statement of profit or loss.
NOx FundThe industry in Norway pays a fee for their emission of NOx to a public foundation run by 15 industry and commerce associations. The foundation is self-financed by the fees and the purpose is to support projects that reduces NOx emissions from the industry in Norway.
OtherThe remaining grants are mainly related to R&D and energy recovery projects.
Current benefits consist of wages and salaries, bonuses, holiday payments and other short-term benefits that are expected to be settled within 12 months after the balance sheet date. Non-current benefits consist mainly of jubilee and long-service benefits, post-employment benefits and post-retirement benefits, not expected to be wholly settled within the next twelve months.
Defined contribution plansDefined contribution plans comprise of arrangements whereby the company makes monthly contributions to the employees' pension plans, and where the future pensions are determined by the amount of the contributions and the return on the individual pension plan asset. The contributions are expensed as incurred and there is no further obligation related to the contribution plans. Prepaid contributions are recognised as an asset.
Defined benefit plansDefined benefit plans are recognised at present value of future liabilities considered retained at the end of the reporting period, calculated separately for each plan. Plan assets are measured at fair value and deducted in calculating the net pension obligation. Actuarial assumptions are used to measure both the
PrincipleEmployee benefitsEmployee benefits are all forms of considerations given by an entity in exchange for service rendered by employees or for termination of employment.
obligation and the expense and effects of changes in estimates due to financial and actuarial assumptions are recognised as other comprehensive income. Service costs are recognised as part of employee benefit expenses and net interest on pension liabilities / assets are recognised as a part of finance expenses. Past service costs arising due to amendments in benefit plans are expensed as incurred.
Multi-employer defined benefit plans where available information is insufficient to be able to calculate each participant's obligation, are accounted for as contribution plans.
Judgements and estimatesEstimation uncertainty is mainly related to defined benefit pension plans, where the calculation of pension obligations is based on financial and actuarial assumptions, such as discount rates, future salary and pension adjustments, expected turnover and mortality. Deviations between applied assumptions and actual results in future periods will have effects on the calculated obligation. See information about sensitivity on pension obligations based on changes in main actuarial assumptions below.
Employee benefits include both current and non-current benefits, and are expensed as incurred, together with any social security taxes applicable.
9. Employee benefits
Amounts in NOK million
Salaries, holiday pay and variable compensation Employer's national insurance contributions / social security taxPension expenses Share-based payments (note 10)Other payments / benefitsTotal employee benefit expenses
Average number of full-time equivalents
Amounts in NOK million
Fixed compensationVariable compensation - STIVariable compensation - LTIOther benefitsPension benefitsTotal management remunerationRemuneration provided to the board of directorsRemuneration provided to the committee remuneration
Employee benefit expenses
Remuneration to management
2021
(3 459)(727)(137)(28)
(179)(4 530)
7 178
2021
(31) (29)
(9) (1)(5)
(76) (5)
(0)
2020
(3 122)(654)(121)(29)
(102)(4 028)
6 931
2020
(30)(14)(10)(2)(5)
(61)(4)(0)
178 179Annual report 2021
Elkem history Highlights Letter from the CEO The business The Elkem share Board of directors’ report Board and management Corporate governance Risk managment ESG report Financial statements ESG assurance Contact
Amounts in NOK million
Pension contribution fund (note 22)Employee prepayments etc. Total employee benefit assets
Salaries, holiday pay and variable compensationSocial security tax / contributionsPension plan obligations, netOther benefit plansTotal employee benefit obligations
31.12.2021
1 - 1
- -
492 119 611
31.12.2021
2 8
10
761 203
- 12
976
31.12.2020
3 10 13
547 177
- 16
740
31.12.2020
3 - 3
- -
554 125 679
Employee benefit assets and obligationsNon-current
2021
31.12.2021
Current
2020
31.12.2020
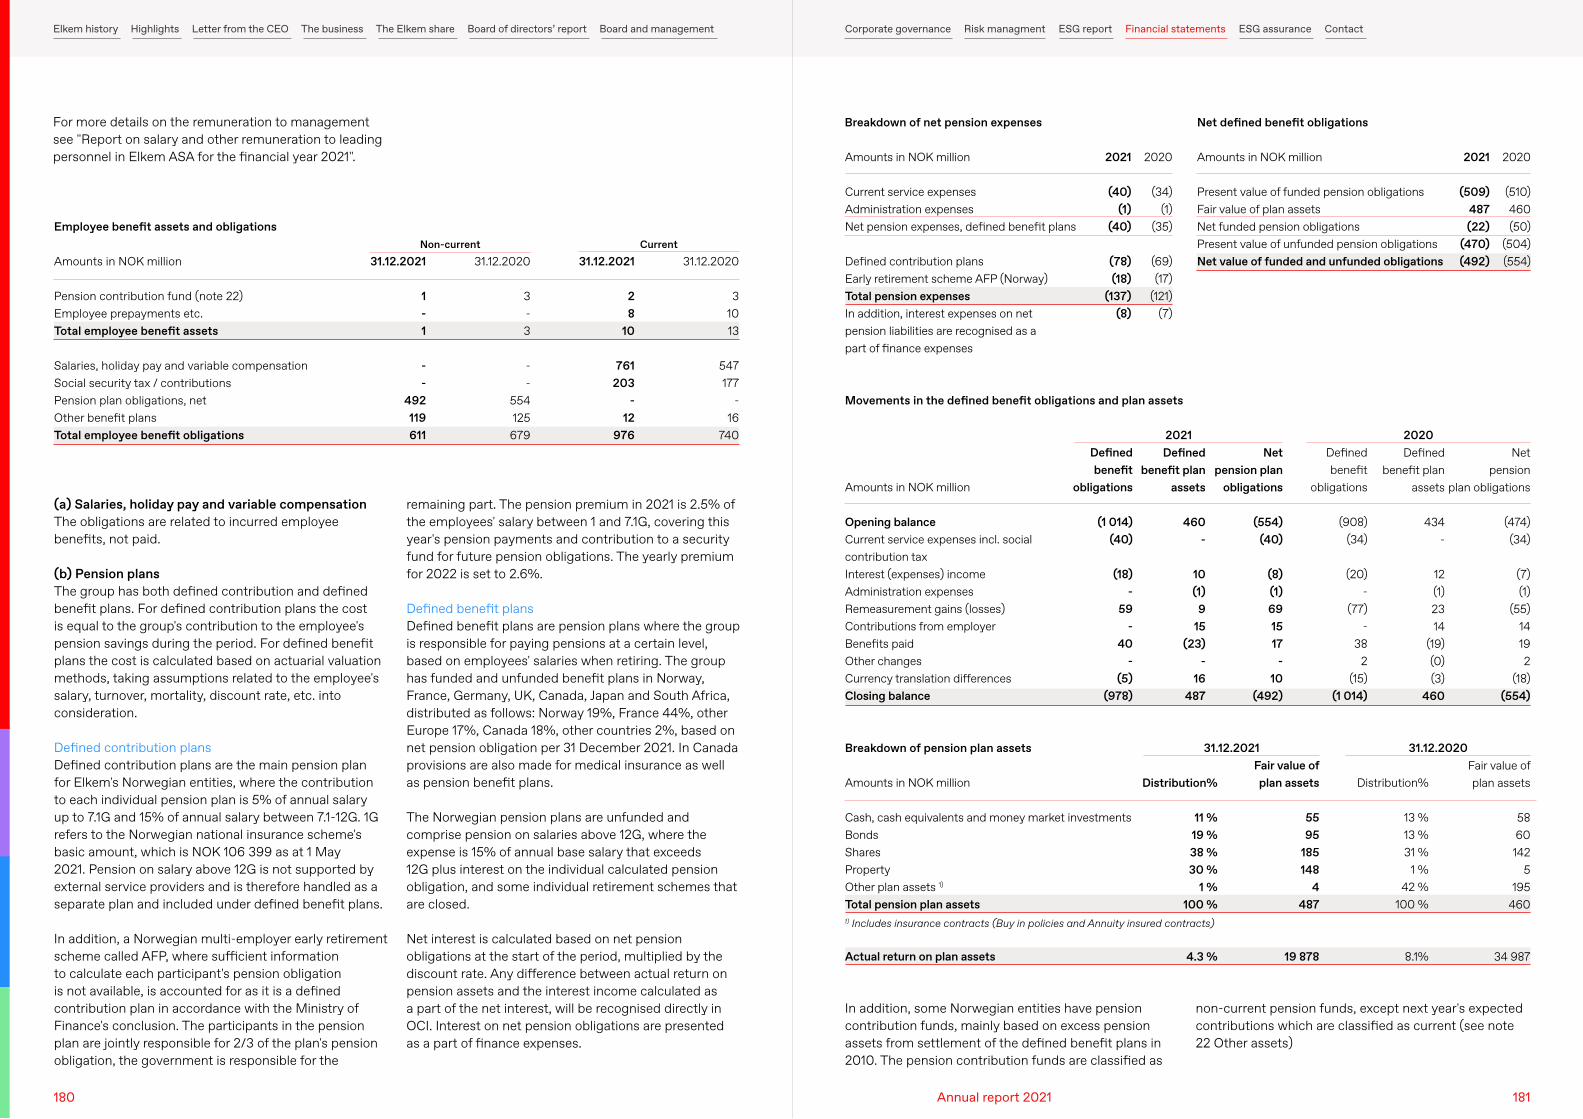
(a) Salaries, holiday pay and variable compensation The obligations are related to incurred employee benefits, not paid.
(b) Pension plansThe group has both defined contribution and defined benefit plans. For defined contribution plans the cost is equal to the group's contribution to the employee's pension savings during the period. For defined benefit plans the cost is calculated based on actuarial valuation methods, taking assumptions related to the employee's salary, turnover, mortality, discount rate, etc. into consideration.
Defined contribution plansDefined contribution plans are the main pension plan for Elkem's Norwegian entities, where the contribution to each individual pension plan is 5% of annual salary up to 7.1G and 15% of annual salary between 7.1-12G. 1G refers to the Norwegian national insurance scheme's basic amount, which is NOK 106 399 as at 1 May 2021. Pension on salary above 12G is not supported by external service providers and is therefore handled as a separate plan and included under defined benefit plans.
In addition, a Norwegian multi-employer early retirement scheme called AFP, where sufficient information to calculate each participant's pension obligation is not available, is accounted for as it is a defined contribution plan in accordance with the Ministry of Finance's conclusion. The participants in the pension plan are jointly responsible for 2/3 of the plan's pension obligation, the government is responsible for the
remaining part. The pension premium in 2021 is 2.5% of the employees' salary between 1 and 7.1G, covering this year's pension payments and contribution to a security fund for future pension obligations. The yearly premium for 2022 is set to 2.6%.
Defined benefit plansDefined benefit plans are pension plans where the group is responsible for paying pensions at a certain level, based on employees' salaries when retiring. The group has funded and unfunded benefit plans in Norway, France, Germany, UK, Canada, Japan and South Africa, distributed as follows: Norway 19%, France 44%, other Europe 17%, Canada 18%, other countries 2%, based on net pension obligation per 31 December 2021. In Canada provisions are also made for medical insurance as well as pension benefit plans.
The Norwegian pension plans are unfunded and comprise pension on salaries above 12G, where the expense is 15% of annual base salary that exceeds 12G plus interest on the individual calculated pension obligation, and some individual retirement schemes that are closed.
Net interest is calculated based on net pension obligations at the start of the period, multiplied by the discount rate. Any difference between actual return on pension assets and the interest income calculated as a part of the net interest, will be recognised directly in OCI. Interest on net pension obligations are presented as a part of finance expenses.
Amounts in NOK million
Current service expensesAdministration expensesNet pension expenses, defined benefit plans
Defined contribution plansEarly retirement scheme AFP (Norway)Total pension expensesIn addition, interest expenses on net pension liabilities are recognised as a part of finance expenses
Amounts in NOK million
Present value of funded pension obligationsFair value of plan assetsNet funded pension obligationsPresent value of unfunded pension obligationsNet value of funded and unfunded obligations
Breakdown of net pension expenses Net defined benefit obligations
2021
(40) (1)
(40)
(78) (18)
(137)(8)
2021
(509) 487 (22)
(470) (492)
2020
(34) (1)
(35)
(69) (17)
(121) (7)
2020
(510) 460 (50)
(504) (554)
Amounts in NOK million
Opening balanceCurrent service expenses incl. social contribution taxInterest (expenses) incomeAdministration expensesRemeasurement gains (losses)Contributions from employer Benefits paidOther changesCurrency translation differencesClosing balance
Amounts in NOK million
Cash, cash equivalents and money market investmentsBondsSharesPropertyOther plan assets 1)
Total pension plan assets
Actual return on plan assets
Defined benefit
obligations
(1 014) (40)
(18) -
59 -
40 -
(5) (978)
Defined benefit
obligations
(908) (34)
(20) -
(77) -
38 2
(15) (1 014)
Distribution%
13 %13 %31 %
1 %42 %
100 %
8.1%
Net pension plan
obligations
(554) (40)
(8) (1) 69 15 17
- 10
(492)
Fair value of plan assets
55 95
185 148
4 487
19 878
Net pension
plan obligations
(474) (34)
(7) (1)
(55) 14 19 2
(18) (554)
Defined benefit plan
assets
460 -
10 (1)
9 15
(23) -
16 487
Distribution%
11 %19 %38 %30 %
1 %100 %
4.3 %
Defined benefit plan
assets
434 -
12 (1) 23 14
(19) (0) (3)
460
Fair value of plan assets
58 60 142
5 195
460
34 987
Movements in the defined benefit obligations and plan assets
Breakdown of pension plan assets
1) Includes insurance contracts (Buy in policies and Annuity insured contracts)
In addition, some Norwegian entities have pension contribution funds, mainly based on excess pension assets from settlement of the defined benefit plans in 2010. The pension contribution funds are classified as
non-current pension funds, except next year's expected contributions which are classified as current (see note 22 Other assets)
For more details on the remuneration to management see "Report on salary and other remuneration to leading personnel in Elkem ASA for the financial year 2021".
180 181Annual report 2021
Elkem history Highlights Letter from the CEO The business The Elkem share Board of directors’ report Board and management Corporate governance Risk managment ESG report Financial statements ESG assurance Contact
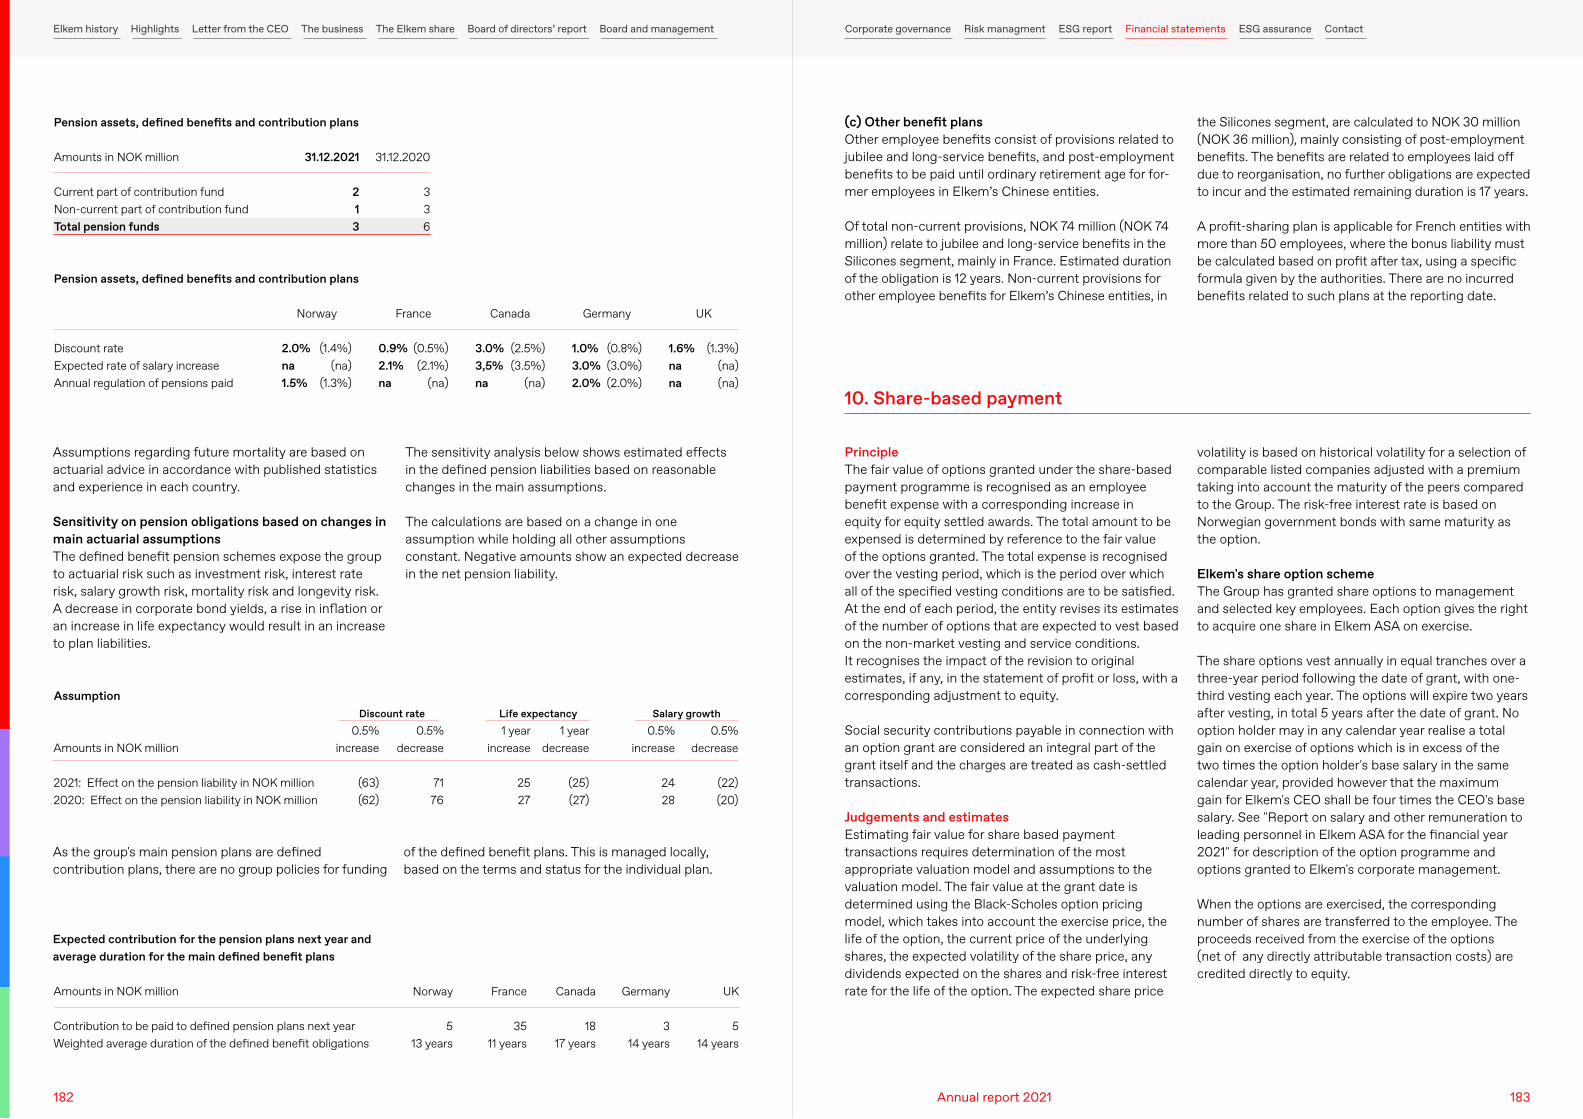
Amounts in NOK million
Current part of contribution fundNon-current part of contribution fundTotal pension funds
Discount rateExpected rate of salary increaseAnnual regulation of pensions paid
Amounts in NOK million
2021: Effect on the pension liability in NOK million2020: Effect on the pension liability in NOK million
Amounts in NOK million
Contribution to be paid to defined pension plans next yearWeighted average duration of the defined benefit obligations
Pension assets, defined benefits and contribution plans
Pension assets, defined benefits and contribution plans
Assumption
Expected contribution for the pension plans next year and average duration for the main defined benefit plans
31.12.2021
213
Norway
2.0% (1.4%)na (na)1.5% (1.3%)
0.5% increase
(63) (62)
France
0.9% (0.5%)2.1% (2.1%)na (na)
0.5% decrease
71 76
Canada
3.0% (2.5%)3,5% (3.5%)na (na)
1 year increase
25 27
Norway 5
13 years
Germany
1.0% (0.8%)3.0% (3.0%)2.0% (2.0%)
1 year decrease
(25) (27)
France
35 11 years
UK
1.6% (1.3%)na (na)na (na)
0.5% increase
24 28
Canada
18 17 years
0.5% decrease
(22) (20)
Germany
3 14 years
UK
5 14 years
31.12.2020
336
Assumptions regarding future mortality are based on actuarial advice in accordance with published statistics and experience in each country.
Sensitivity on pension obligations based on changes in main actuarial assumptionsThe defined benefit pension schemes expose the group to actuarial risk such as investment risk, interest rate risk, salary growth risk, mortality risk and longevity risk. A decrease in corporate bond yields, a rise in inflation or an increase in life expectancy would result in an increase to plan liabilities.
(c) Other benefit plansOther employee benefits consist of provisions related to jubilee and long-service benefits, and post-employment benefits to be paid until ordinary retirement age for for-mer employees in Elkem’s Chinese entities.
Of total non-current provisions, NOK 74 million (NOK 74 million) relate to jubilee and long-service benefits in the Silicones segment, mainly in France. Estimated duration of the obligation is 12 years. Non-current provisions for other employee benefits for Elkem’s Chinese entities, in
As the group's main pension plans are defined contribution plans, there are no group policies for funding
of the defined benefit plans. This is managed locally, based on the terms and status for the individual plan.
The sensitivity analysis below shows estimated effects in the defined pension liabilities based on reasonable changes in the main assumptions.
The calculations are based on a change in one assumption while holding all other assumptions constant. Negative amounts show an expected decrease in the net pension liability.
the Silicones segment, are calculated to NOK 30 million (NOK 36 million), mainly consisting of post-employment benefits. The benefits are related to employees laid off due to reorganisation, no further obligations are expected to incur and the estimated remaining duration is 17 years.
A profit-sharing plan is applicable for French entities with more than 50 employees, where the bonus liability must be calculated based on profit after tax, using a specific formula given by the authorities. There are no incurred benefits related to such plans at the reporting date.
Discount rate Life expectancy Salary growth
PrincipleThe fair value of options granted under the share-based payment programme is recognised as an employee benefit expense with a corresponding increase in equity for equity settled awards. The total amount to be expensed is determined by reference to the fair value of the options granted. The total expense is recognised over the vesting period, which is the period over which all of the specified vesting conditions are to be satisfied. At the end of each period, the entity revises its estimates of the number of options that are expected to vest based on the non-market vesting and service conditions. It recognises the impact of the revision to original estimates, if any, in the statement of profit or loss, with a corresponding adjustment to equity.
Social security contributions payable in connection with an option grant are considered an integral part of the grant itself and the charges are treated as cash-settled transactions.
Judgements and estimatesEstimating fair value for share based payment transactions requires determination of the most appropriate valuation model and assumptions to the valuation model. The fair value at the grant date is determined using the Black-Scholes option pricing model, which takes into account the exercise price, the life of the option, the current price of the underlying shares, the expected volatility of the share price, any dividends expected on the shares and risk-free interest rate for the life of the option. The expected share price
volatility is based on historical volatility for a selection of comparable listed companies adjusted with a premium taking into account the maturity of the peers compared to the Group. The risk-free interest rate is based on Norwegian government bonds with same maturity as the option.
Elkem's share option schemeThe Group has granted share options to management and selected key employees. Each option gives the right to acquire one share in Elkem ASA on exercise.
The share options vest annually in equal tranches over a three-year period following the date of grant, with one-third vesting each year. The options will expire two years after vesting, in total 5 years after the date of grant. No option holder may in any calendar year realise a total gain on exercise of options which is in excess of the two times the option holder's base salary in the same calendar year, provided however that the maximum gain for Elkem's CEO shall be four times the CEO's base salary. See "Report on salary and other remuneration to leading personnel in Elkem ASA for the financial year 2021" for description of the option programme and options granted to Elkem's corporate management.
When the options are exercised, the corresponding number of shares are transferred to the employee. The proceeds received from the exercise of the options (net of any directly attributable transaction costs) are credited directly to equity.
10. Share-based payment
182 183Annual report 2021
Elkem history Highlights Letter from the CEO The business The Elkem share Board of directors’ report Board and management Corporate governance Risk managment ESG report Financial statements ESG assurance Contact
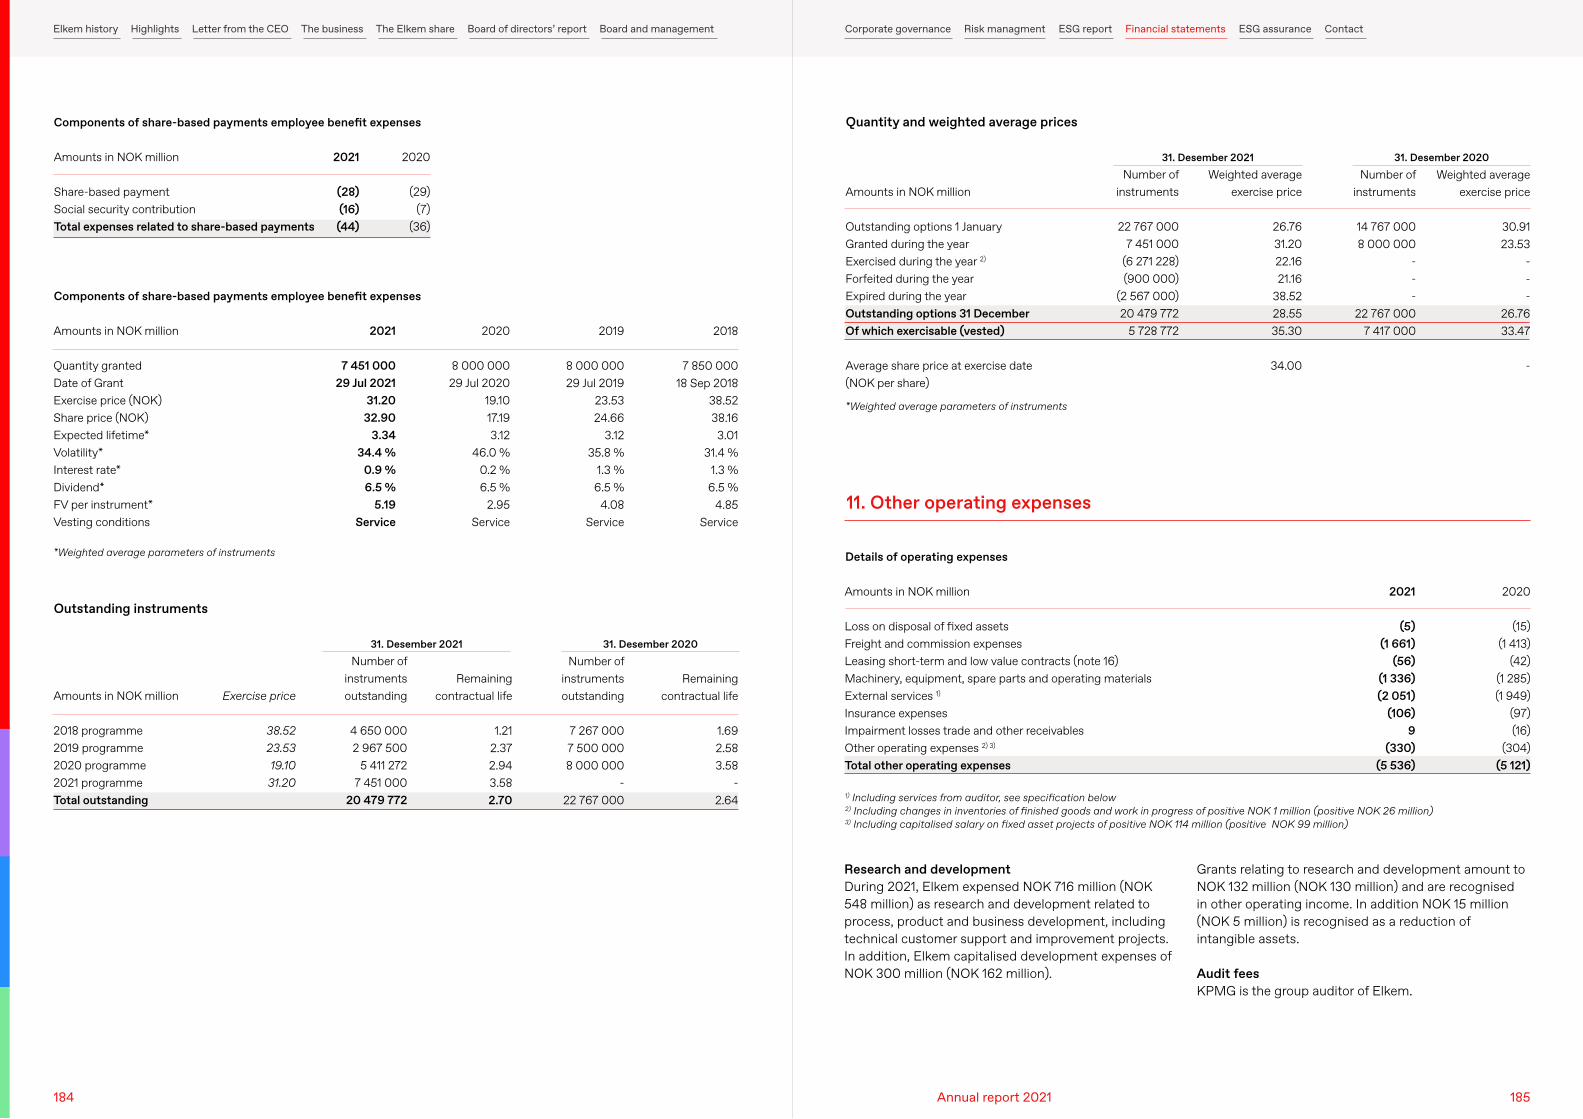
Amounts in NOK million
Share-based paymentSocial security contributionTotal expenses related to share-based payments
Amounts in NOK million
Loss on disposal of fixed assetsFreight and commission expensesLeasing short-term and low value contracts (note 16)Machinery, equipment, spare parts and operating materialsExternal services 1)
Insurance expensesImpairment losses trade and other receivables Other operating expenses 2) 3)
Total other operating expenses
Components of share-based payments employee benefit expenses
Details of operating expenses
Components of share-based payments employee benefit expenses
Outstanding instruments
Quantity and weighted average prices
2021
(28) (16) (44)
2021
(5) (1 661)
(56) (1 336) (2 051)
(106) 9
(330)(5 536)
2020
(29) (7)
(36)
2020
(15) (1 413)
(42) (1 285) (1 949)
(97) (16)
(304)(5 121)
Amounts in NOK million
Quantity grantedDate of GrantExercise price (NOK)Share price (NOK)Expected lifetime*Volatility*Interest rate*Dividend*FV per instrument*Vesting conditions
Amounts in NOK million
2018 programme2019 programme2020 programme2021 programmeTotal outstanding
Amounts in NOK million
Outstanding options 1 JanuaryGranted during the yearExercised during the year 2) Forfeited during the yearExpired during the yearOutstanding options 31 DecemberOf which exercisable (vested)
Average share price at exercise date (NOK per share)
2021
7 451 000 29 Jul 2021
31.20 32.90
3.34 34.4 %
0.9 %6.5 %
5.19 Service
Exercise price
38.52 23.53 19.10 31.20
Number of instruments
22 767 000 7 451 000
(6 271 228) (900 000)
(2 567 000) 20 479 772
5 728 772 2020
8 000 000 29 Jul 2020
19.10 17.19 3.12
46.0 %0.2 %6.5 % 2.95
Service
Number of instruments outstanding
4 650 000 2 967 500
5 411 272 7 451 000
20 479 772
Weighted average exercise price
26.7631.2022.1621.16
38.5228.5535.30
34.00
2019
8 000 000 29 Jul 2019
23.53 24.66
3.1235.8 %
1.3 %6.5 % 4.08
Service
Remaining contractual life
1.212.372.943.58
2.70
Number of instruments
14 767 000 8 000 000
- - -
22 767 000 7 417 000 2018
7 850 000 18 Sep 2018
38.52 38.16 3.01
31.4 %1.3 %6.5 % 4.85
Service
Number of instruments outstanding
7 267 000 7 500 000 8 000 000
- 22 767 000
Remaining contractual life
1.692.583.58
- 2.64
Weighted average exercise price
30.91 23.53
- - -
26.7633.47
-
*Weighted average parameters of instruments
*Weighted average parameters of instruments
1) Including services from auditor, see specification below2) Including changes in inventories of finished goods and work in progress of positive NOK 1 million (positive NOK 26 million)3) Including capitalised salary on fixed asset projects of positive NOK 114 million (positive NOK 99 million)
11. Other operating expenses
Research and developmentDuring 2021, Elkem expensed NOK 716 million (NOK 548 million) as research and development related to process, product and business development, including technical customer support and improvement projects. In addition, Elkem capitalised development expenses of NOK 300 million (NOK 162 million).
Grants relating to research and development amount to NOK 132 million (NOK 130 million) and are recognised in other operating income. In addition NOK 15 million (NOK 5 million) is recognised as a reduction of intangible assets.
Audit feesKPMG is the group auditor of Elkem.
31. Desember 2021 31. Desember 2020
31. Desember 2021 31. Desember 2020
184 185Annual report 2021
Elkem history Highlights Letter from the CEO The business The Elkem share Board of directors’ report Board and management Corporate governance Risk managment ESG report Financial statements ESG assurance Contact
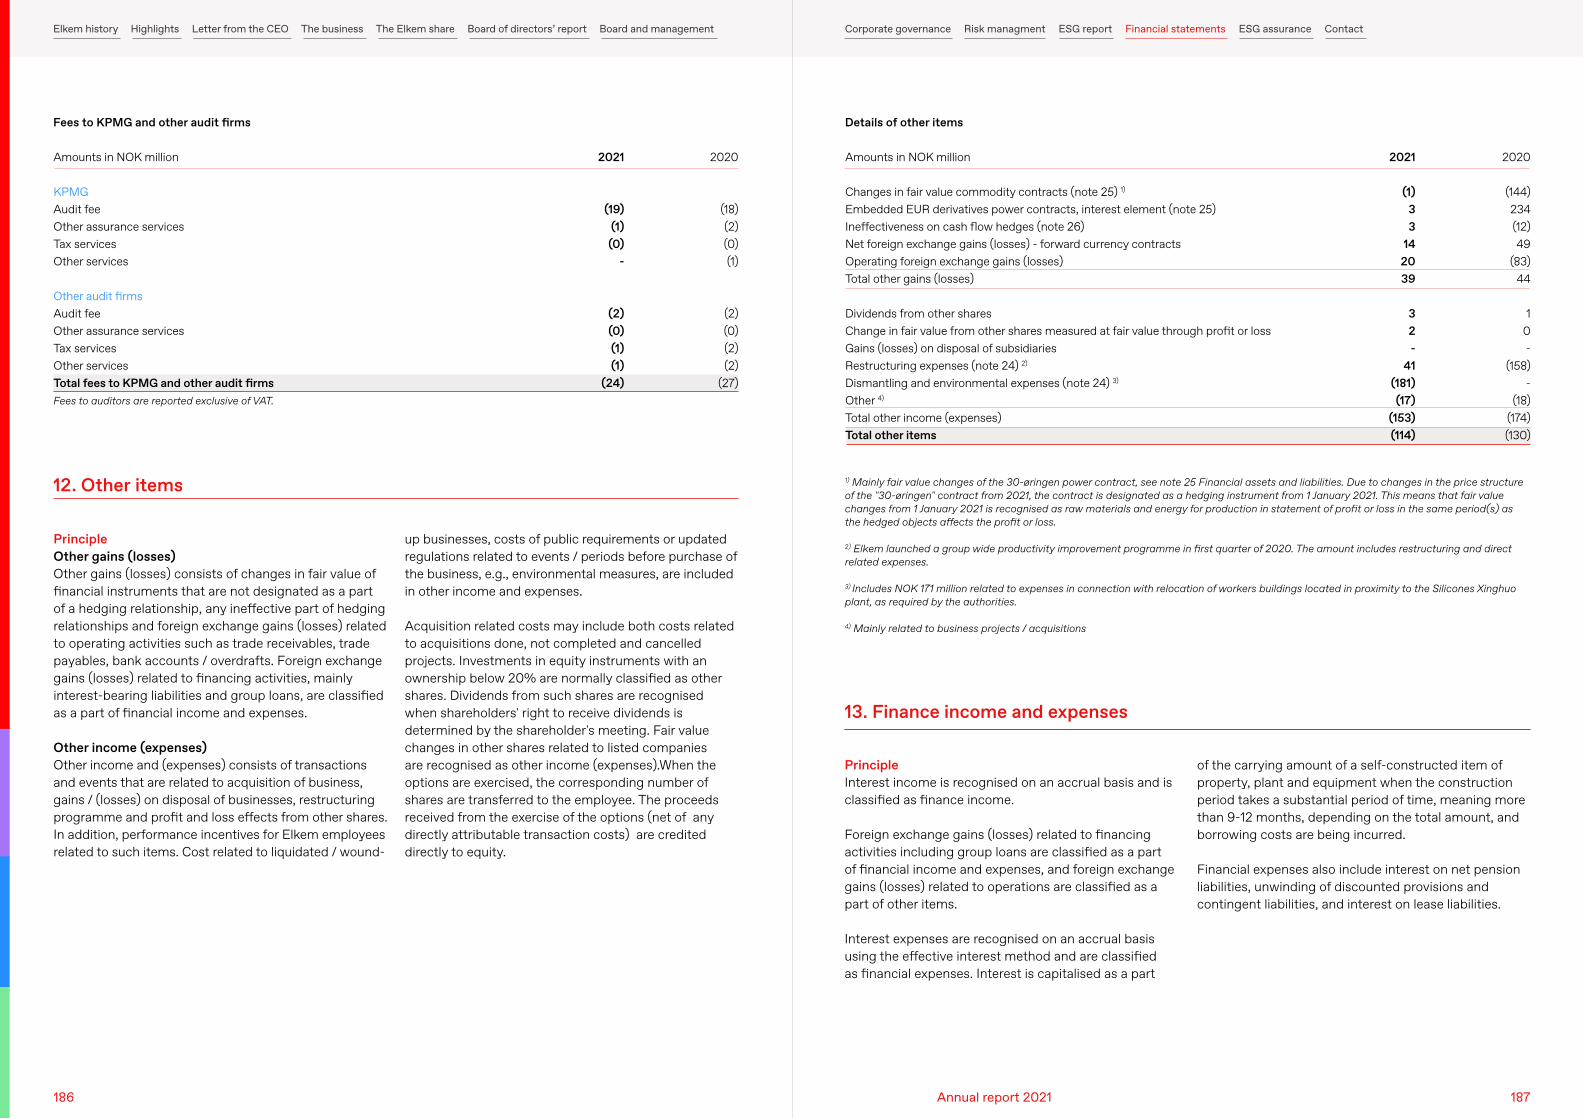
Amounts in NOK million
KPMGAudit fee Other assurance servicesTax servicesOther services
Other audit firmsAudit fee Other assurance servicesTax servicesOther servicesTotal fees to KPMG and other audit firms
Amounts in NOK million
Changes in fair value commodity contracts (note 25) 1)
Embedded EUR derivatives power contracts, interest element (note 25)Ineffectiveness on cash flow hedges (note 26)Net foreign exchange gains (losses) - forward currency contractsOperating foreign exchange gains (losses)Total other gains (losses)
Dividends from other shares Change in fair value from other shares measured at fair value through profit or lossGains (losses) on disposal of subsidiariesRestructuring expenses (note 24) 2)
Dismantling and environmental expenses (note 24) 3) Other 4)
Total other income (expenses) Total other items
Fees to KPMG and other audit firms Details of other items
2021
(19) (1) (0)
-
(2) (0) (1) (1)
(24)
2021
(1) 3 3
14 20 39
3 2 -
41 (181) (17)
(153)(114)
2020
(18) (2) (0) (1)
(2) (0) (2) (2)
(27)
2020
(144) 234 (12) 49
(83) 44
1 0 -
(158) -
(18)(174)(130)
Fees to auditors are reported exclusive of VAT.
1) Mainly fair value changes of the 30-øringen power contract, see note 25 Financial assets and liabilities. Due to changes in the price structure of the "30-øringen" contract from 2021, the contract is designated as a hedging instrument from 1 January 2021. This means that fair value changes from 1 January 2021 is recognised as raw materials and energy for production in statement of profit or loss in the same period(s) as the hedged objects affects the profit or loss.
2) Elkem launched a group wide productivity improvement programme in first quarter of 2020. The amount includes restructuring and direct related expenses.
3) Includes NOK 171 million related to expenses in connection with relocation of workers buildings located in proximity to the Silicones Xinghuo plant, as required by the authorities.
4) Mainly related to business projects / acquisitions
PrincipleOther gains (losses) Other gains (losses) consists of changes in fair value of financial instruments that are not designated as a part of a hedging relationship, any ineffective part of hedging relationships and foreign exchange gains (losses) related to operating activities such as trade receivables, trade payables, bank accounts / overdrafts. Foreign exchange gains (losses) related to financing activities, mainly interest-bearing liabilities and group loans, are classified as a part of financial income and expenses.
Other income (expenses) Other income and (expenses) consists of transactions and events that are related to acquisition of business, gains / (losses) on disposal of businesses, restructuring programme and profit and loss effects from other shares. In addition, performance incentives for Elkem employees related to such items. Cost related to liquidated / wound-
PrincipleInterest income is recognised on an accrual basis and is classified as finance income.
Foreign exchange gains (losses) related to financing activities including group loans are classified as a part of financial income and expenses, and foreign exchange gains (losses) related to operations are classified as a part of other items.
Interest expenses are recognised on an accrual basis using the effective interest method and are classified as financial expenses. Interest is capitalised as a part
up businesses, costs of public requirements or updated regulations related to events / periods before purchase of the business, e.g., environmental measures, are included in other income and expenses.
Acquisition related costs may include both costs related to acquisitions done, not completed and cancelled projects. Investments in equity instruments with an ownership below 20% are normally classified as other shares. Dividends from such shares are recognised when shareholders' right to receive dividends is determined by the shareholder's meeting. Fair value changes in other shares related to listed companies are recognised as other income (expenses).When the options are exercised, the corresponding number of shares are transferred to the employee. The proceeds received from the exercise of the options (net of any directly attributable transaction costs) are credited directly to equity.
of the carrying amount of a self-constructed item of property, plant and equipment when the construction period takes a substantial period of time, meaning more than 9-12 months, depending on the total amount, and borrowing costs are being incurred.
Financial expenses also include interest on net pension liabilities, unwinding of discounted provisions and contingent liabilities, and interest on lease liabilities.
12. Other items
13. Finance income and expenses
186 187Annual report 2021
Elkem history Highlights Letter from the CEO The business The Elkem share Board of directors’ report Board and management Corporate governance Risk managment ESG report Financial statements ESG assurance Contact
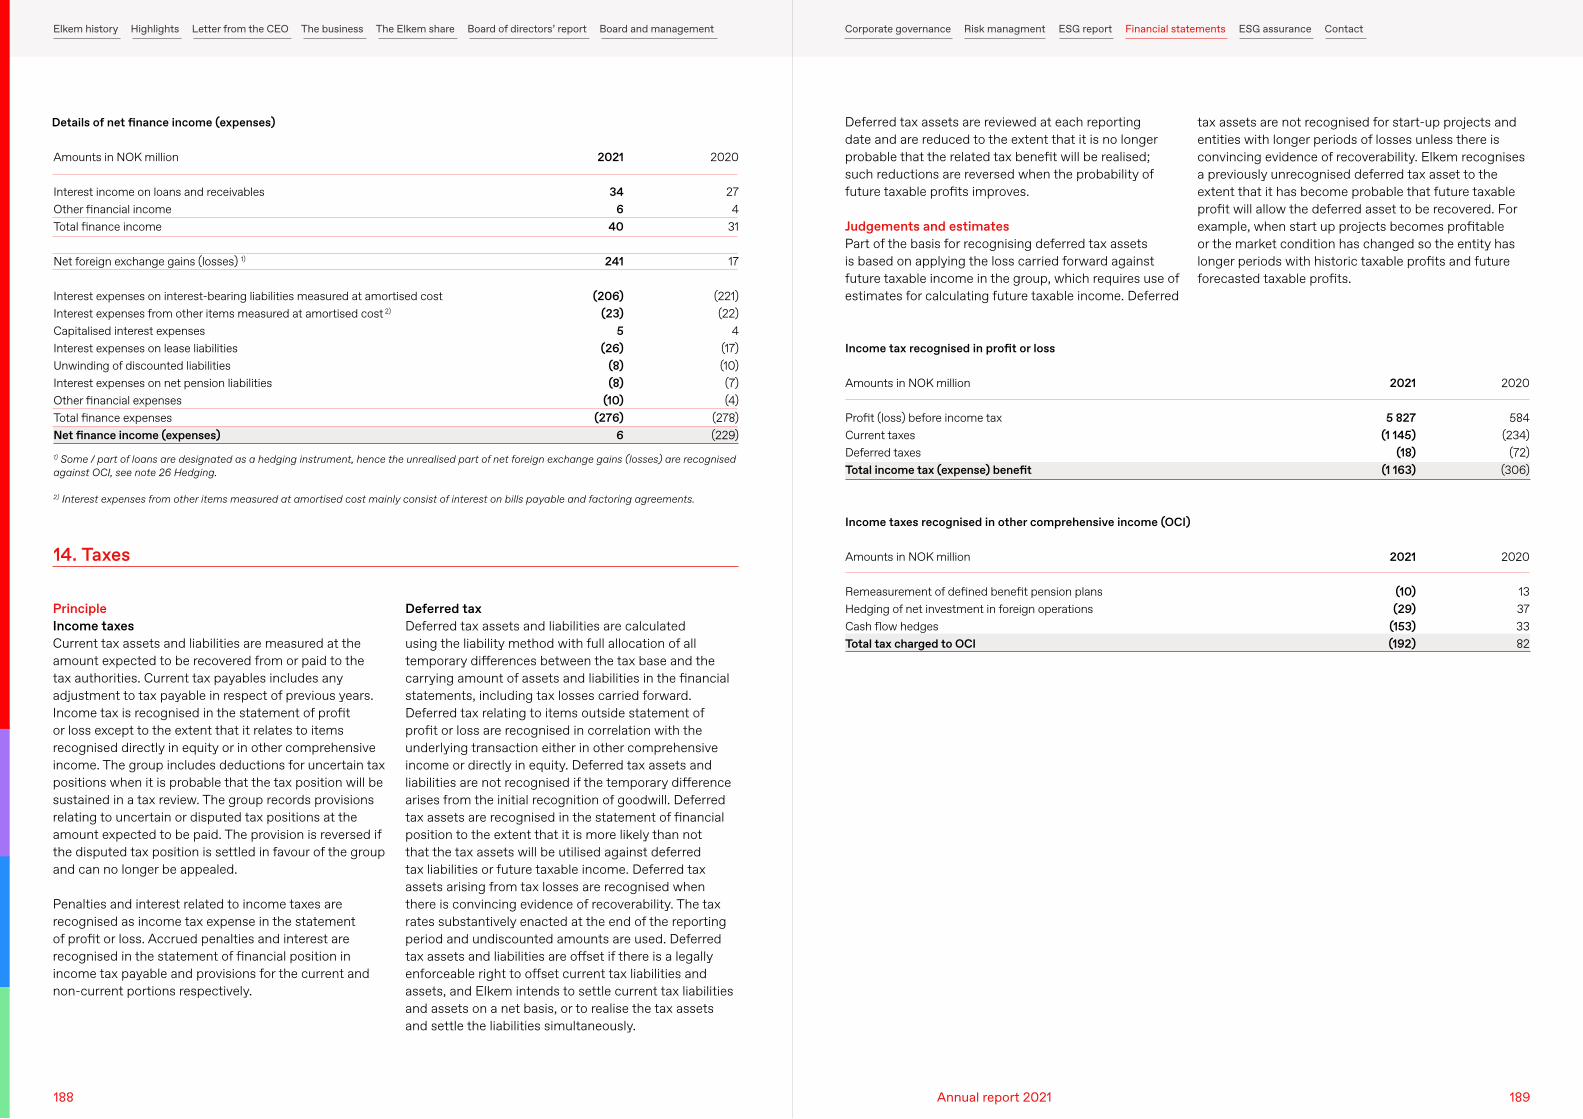
Amounts in NOK million
Interest income on loans and receivablesOther financial incomeTotal finance income
Net foreign exchange gains (losses) 1)
Interest expenses on interest-bearing liabilities measured at amortised costInterest expenses from other items measured at amortised cost 2)
Capitalised interest expensesInterest expenses on lease liabilitiesUnwinding of discounted liabilitiesInterest expenses on net pension liabilitiesOther financial expensesTotal finance expensesNet finance income (expenses)
Amounts in NOK million
Profit (loss) before income taxCurrent taxesDeferred taxesTotal income tax (expense) benefit
Amounts in NOK million
Remeasurement of defined benefit pension plansHedging of net investment in foreign operationsCash flow hedgesTotal tax charged to OCI
Details of net finance income (expenses)
Income tax recognised in profit or loss
Income taxes recognised in other comprehensive income (OCI)
2021
346
40
241
(206)(23)
5(26)
(8)(8)
(10)(276)
6
2021
5 827(1 145)
(18)(1 163)
2021
(10)(29)
(153)(192)
2020
274
31
17
(221)(22)
4(17)(10)(7)(4)
(278)(229)
2020
584(234)
(72)(306)
2020
13373382
1) Some / part of loans are designated as a hedging instrument, hence the unrealised part of net foreign exchange gains (losses) are recognised against OCI, see note 26 Hedging.
2) Interest expenses from other items measured at amortised cost mainly consist of interest on bills payable and factoring agreements.
PrincipleIncome taxes Current tax assets and liabilities are measured at the amount expected to be recovered from or paid to the tax authorities. Current tax payables includes any adjustment to tax payable in respect of previous years. Income tax is recognised in the statement of profit or loss except to the extent that it relates to items recognised directly in equity or in other comprehensive income. The group includes deductions for uncertain tax positions when it is probable that the tax position will be sustained in a tax review. The group records provisions relating to uncertain or disputed tax positions at the amount expected to be paid. The provision is reversed if the disputed tax position is settled in favour of the group and can no longer be appealed.
Penalties and interest related to income taxes are recognised as income tax expense in the statement of profit or loss. Accrued penalties and interest are recognised in the statement of financial position in income tax payable and provisions for the current and non-current portions respectively.
Deferred tax assets are reviewed at each reporting date and are reduced to the extent that it is no longer probable that the related tax benefit will be realised; such reductions are reversed when the probability of future taxable profits improves.
Judgements and estimatesPart of the basis for recognising deferred tax assets is based on applying the loss carried forward against future taxable income in the group, which requires use of estimates for calculating future taxable income. Deferred
Deferred tax Deferred tax assets and liabilities are calculated using the liability method with full allocation of all temporary differences between the tax base and the carrying amount of assets and liabilities in the financial statements, including tax losses carried forward. Deferred tax relating to items outside statement of profit or loss are recognised in correlation with the underlying transaction either in other comprehensive income or directly in equity. Deferred tax assets and liabilities are not recognised if the temporary difference arises from the initial recognition of goodwill. Deferred tax assets are recognised in the statement of financial position to the extent that it is more likely than not that the tax assets will be utilised against deferred tax liabilities or future taxable income. Deferred tax assets arising from tax losses are recognised when there is convincing evidence of recoverability. The tax rates substantively enacted at the end of the reporting period and undiscounted amounts are used. Deferred tax assets and liabilities are offset if there is a legally enforceable right to offset current tax liabilities and assets, and Elkem intends to settle current tax liabilities and assets on a net basis, or to realise the tax assets and settle the liabilities simultaneously.
tax assets are not recognised for start-up projects and entities with longer periods of losses unless there is convincing evidence of recoverability. Elkem recognises a previously unrecognised deferred tax asset to the extent that it has become probable that future taxable profit will allow the deferred asset to be recovered. For example, when start up projects becomes profitable or the market condition has changed so the entity has longer periods with historic taxable profits and future forecasted taxable profits.
14. Taxes
188 189Annual report 2021
Elkem history Highlights Letter from the CEO The business The Elkem share Board of directors’ report Board and management Corporate governance Risk managment ESG report Financial statements ESG assurance Contact
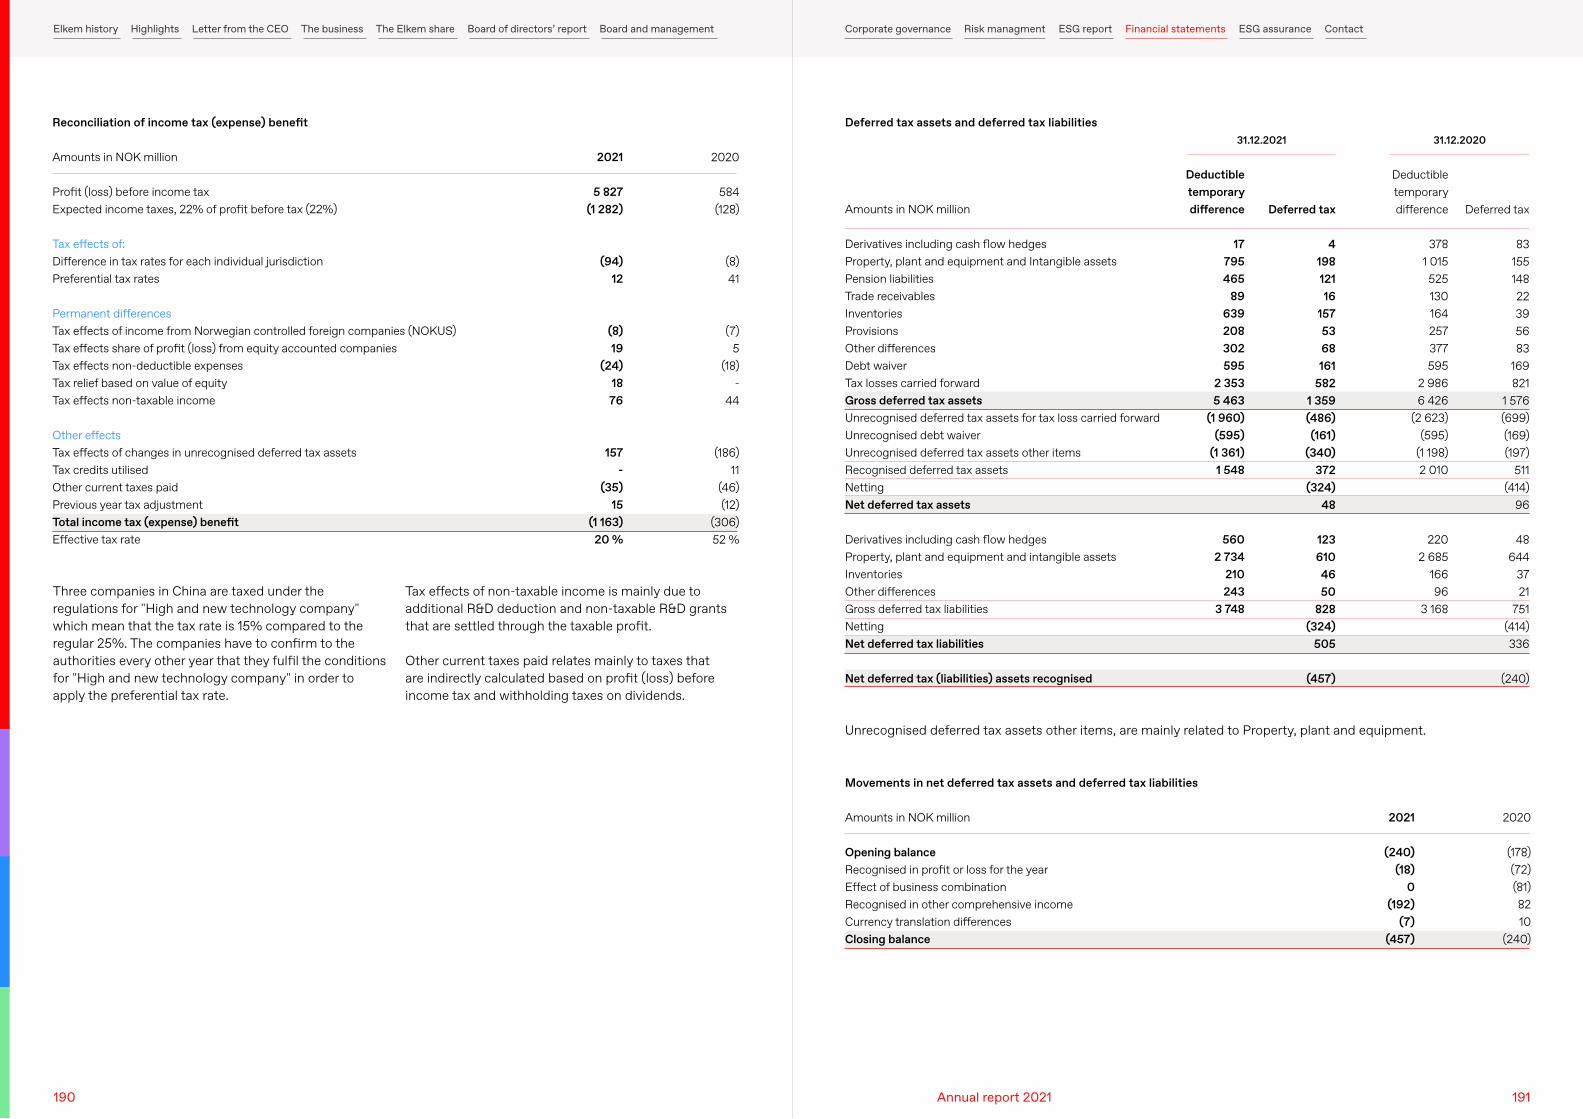
Amounts in NOK million
Profit (loss) before income taxExpected income taxes, 22% of profit before tax (22%)
Tax effects of:Difference in tax rates for each individual jurisdictionPreferential tax rates
Permanent differencesTax effects of income from Norwegian controlled foreign companies (NOKUS)Tax effects share of profit (loss) from equity accounted companiesTax effects non-deductible expensesTax relief based on value of equityTax effects non-taxable income
Other effects Tax effects of changes in unrecognised deferred tax assetsTax credits utilisedOther current taxes paidPrevious year tax adjustmentTotal income tax (expense) benefit Effective tax rate
Amounts in NOK million
Derivatives including cash flow hedgesProperty, plant and equipment and Intangible assetsPension liabilitiesTrade receivablesInventoriesProvisionsOther differences Debt waiverTax losses carried forwardGross deferred tax assetsUnrecognised deferred tax assets for tax loss carried forwardUnrecognised debt waiverUnrecognised deferred tax assets other itemsRecognised deferred tax assetsNetting Net deferred tax assets
Derivatives including cash flow hedgesProperty, plant and equipment and intangible assetsInventoriesOther differences Gross deferred tax liabilitiesNetting Net deferred tax liabilities
Net deferred tax (liabilities) assets recognised
Reconciliation of income tax (expense) benefit Deferred tax assets and deferred tax liabilities
2021
5 827 (1 282)
(94) 12
(8) 19
(24) 18 76
157 -
(35) 15
(1 163)20 %
Deductible temporary difference
17 795 465
89 639 208 302 595
2 353 5 463
(1 960) (595)
(1 361) 1 548
560 2 734
210 243
3 748
Deductible temporary difference
378 1 015 525 130 164 257 377 595
2 986 6 426
(2 623) (595)
(1 198) 2 010
220 2 685
166 96
3 168
2020
584(128)
(8) 41
(7) 5
(18) -
44
(186) 11
(46) (12)
(306)52 %
Deferred tax
4 198 121 16
157 53 68 161
582 1 359 (486) (161)
(340) 372
(324) 48
123 610 46 50
828 (324)
505
(457)
Deferred tax
83 155 148 22 39 56 83
169 821
1 576 (699) (169) (197)
511 (414)
96
48 644
37 21
751 (414) 336
(240)
Three companies in China are taxed under the regulations for "High and new technology company" which mean that the tax rate is 15% compared to the regular 25%. The companies have to confirm to the authorities every other year that they fulfil the conditions for "High and new technology company" in order to apply the preferential tax rate.
Unrecognised deferred tax assets other items, are mainly related to Property, plant and equipment.
Tax effects of non-taxable income is mainly due to additional R&D deduction and non-taxable R&D grants that are settled through the taxable profit.
Other current taxes paid relates mainly to taxes that are indirectly calculated based on profit (loss) before income tax and withholding taxes on dividends.
31.12.2021 31.12.2020
Amounts in NOK million
Opening balanceRecognised in profit or loss for the yearEffect of business combinationRecognised in other comprehensive incomeCurrency translation differencesClosing balance
Movements in net deferred tax assets and deferred tax liabilities
2021
(240)(18)
0(192)
(7)(457)
2020
(178)(72)(81)8210
(240)
190 191Annual report 2021
Elkem history Highlights Letter from the CEO The business The Elkem share Board of directors’ report Board and management Corporate governance Risk managment ESG report Financial statements ESG assurance Contact
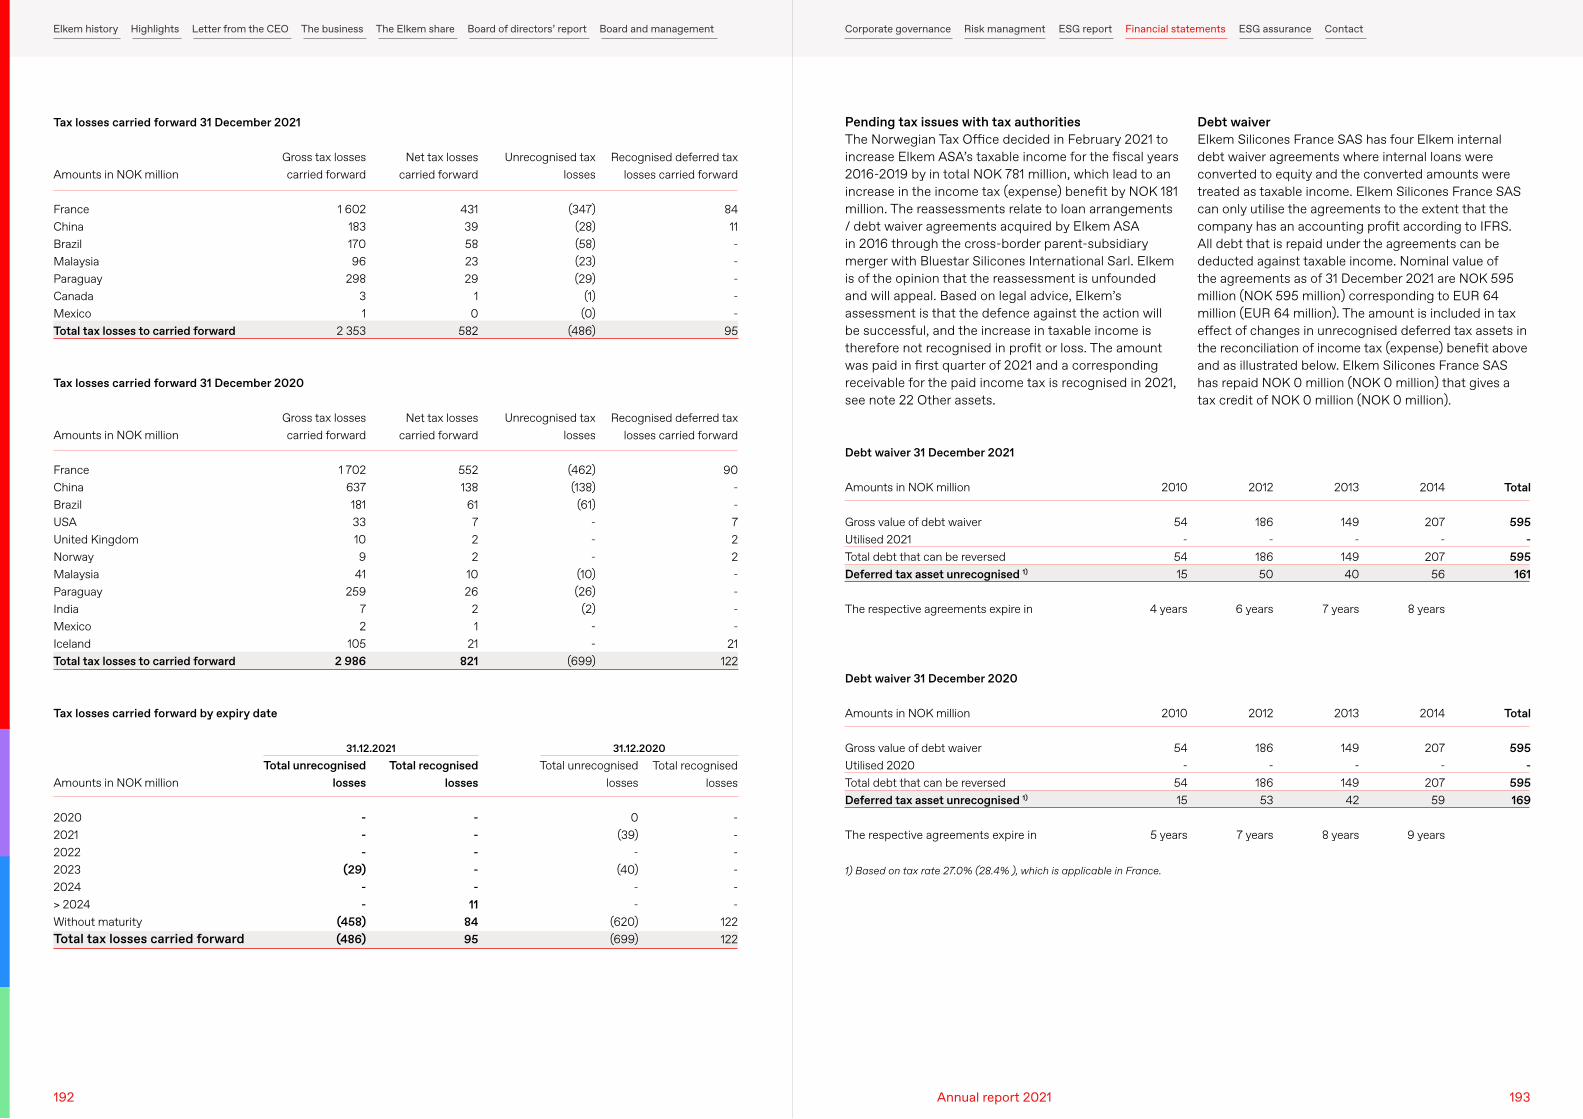
Amounts in NOK million
FranceChinaBrazilMalaysiaParaguayCanadaMexicoTotal tax losses to carried forward
Amounts in NOK million
FranceChinaBrazilUSAUnited KingdomNorwayMalaysiaParaguayIndiaMexicoIcelandTotal tax losses to carried forward
Amounts in NOK million
20202021202220232024> 2024Without maturityTotal tax losses carried forward
Tax losses carried forward 31 December 2021
Tax losses carried forward 31 December 2020
Tax losses carried forward by expiry date
Gross tax losses carried forward
1 602 183 170 96
298 3 1
2 353
Gross tax losses carried forward
1 702 637 181 33 10 9
41 259
7 2
105 2 986
Total unrecognised losses
- - -
(29) - -
(458)(486)
Unrecognised tax losses
(347) (28) (58) (23) (29)
(1) (0)
(486)
Unrecognised tax losses
(462) (138)
(61) - - -
(10) (26)
(2) - -
(699)
Total unrecognised losses
0(39)
- (40)
- -
(620)(699)
Net tax losses carried forward
431 39 58 23 29
1 0
582
Net tax losses carried forward
552 138
61 7 2 2
10 26
2 1
21 821
Total recognised losses
- - - - -
11 84 95
Recognised deferred tax losses carried forward
84 11 - - - - -
95
Recognised deferred tax losses carried forward
90 - - 7 2 2 - - - -
21 122
Total recognised losses
- - - - - -
122122
31.12.2021 31.12.2020
Pending tax issues with tax authoritiesThe Norwegian Tax Office decided in February 2021 to increase Elkem ASA’s taxable income for the fiscal years 2016-2019 by in total NOK 781 million, which lead to an increase in the income tax (expense) benefit by NOK 181 million. The reassessments relate to loan arrangements / debt waiver agreements acquired by Elkem ASA in 2016 through the cross-border parent-subsidiary merger with Bluestar Silicones International Sarl. Elkem is of the opinion that the reassessment is unfounded and will appeal. Based on legal advice, Elkem’s assessment is that the defence against the action will be successful, and the increase in taxable income is therefore not recognised in profit or loss. The amount was paid in first quarter of 2021 and a corresponding receivable for the paid income tax is recognised in 2021, see note 22 Other assets.
Debt waiverElkem Silicones France SAS has four Elkem internal debt waiver agreements where internal loans were converted to equity and the converted amounts were treated as taxable income. Elkem Silicones France SAS can only utilise the agreements to the extent that the company has an accounting profit according to IFRS. All debt that is repaid under the agreements can be deducted against taxable income. Nominal value of the agreements as of 31 December 2021 are NOK 595 million (NOK 595 million) corresponding to EUR 64 million (EUR 64 million). The amount is included in tax effect of changes in unrecognised deferred tax assets in the reconciliation of income tax (expense) benefit above and as illustrated below. Elkem Silicones France SAS has repaid NOK 0 million (NOK 0 million) that gives a tax credit of NOK 0 million (NOK 0 million).
Amounts in NOK million
Gross value of debt waiver Utilised 2021 Total debt that can be reversed Deferred tax asset unrecognised 1) The respective agreements expire in
Amounts in NOK million
Gross value of debt waiver Utilised 2020 Total debt that can be reversed Deferred tax asset unrecognised 1)
The respective agreements expire in
Debt waiver 31 December 2021
Debt waiver 31 December 2020
2010
54 -
54 15
4 years
2010
54 -
54 15
5 years
2012
186 -
186 50
6 years
2012
186 -
186 53
7 years
2013
149 -
149 40
7 years
2013
149 -
149 42
8 years
2014
207 -
207 56
8 years
2014
207 -
207 59
9 years
Total
595 -
595 161
Total
595 -
595 169
1) Based on tax rate 27.0% (28.4% ), which is applicable in France.
192 193Annual report 2021
Elkem history Highlights Letter from the CEO The business The Elkem share Board of directors’ report Board and management Corporate governance Risk managment ESG report Financial statements ESG assurance Contact
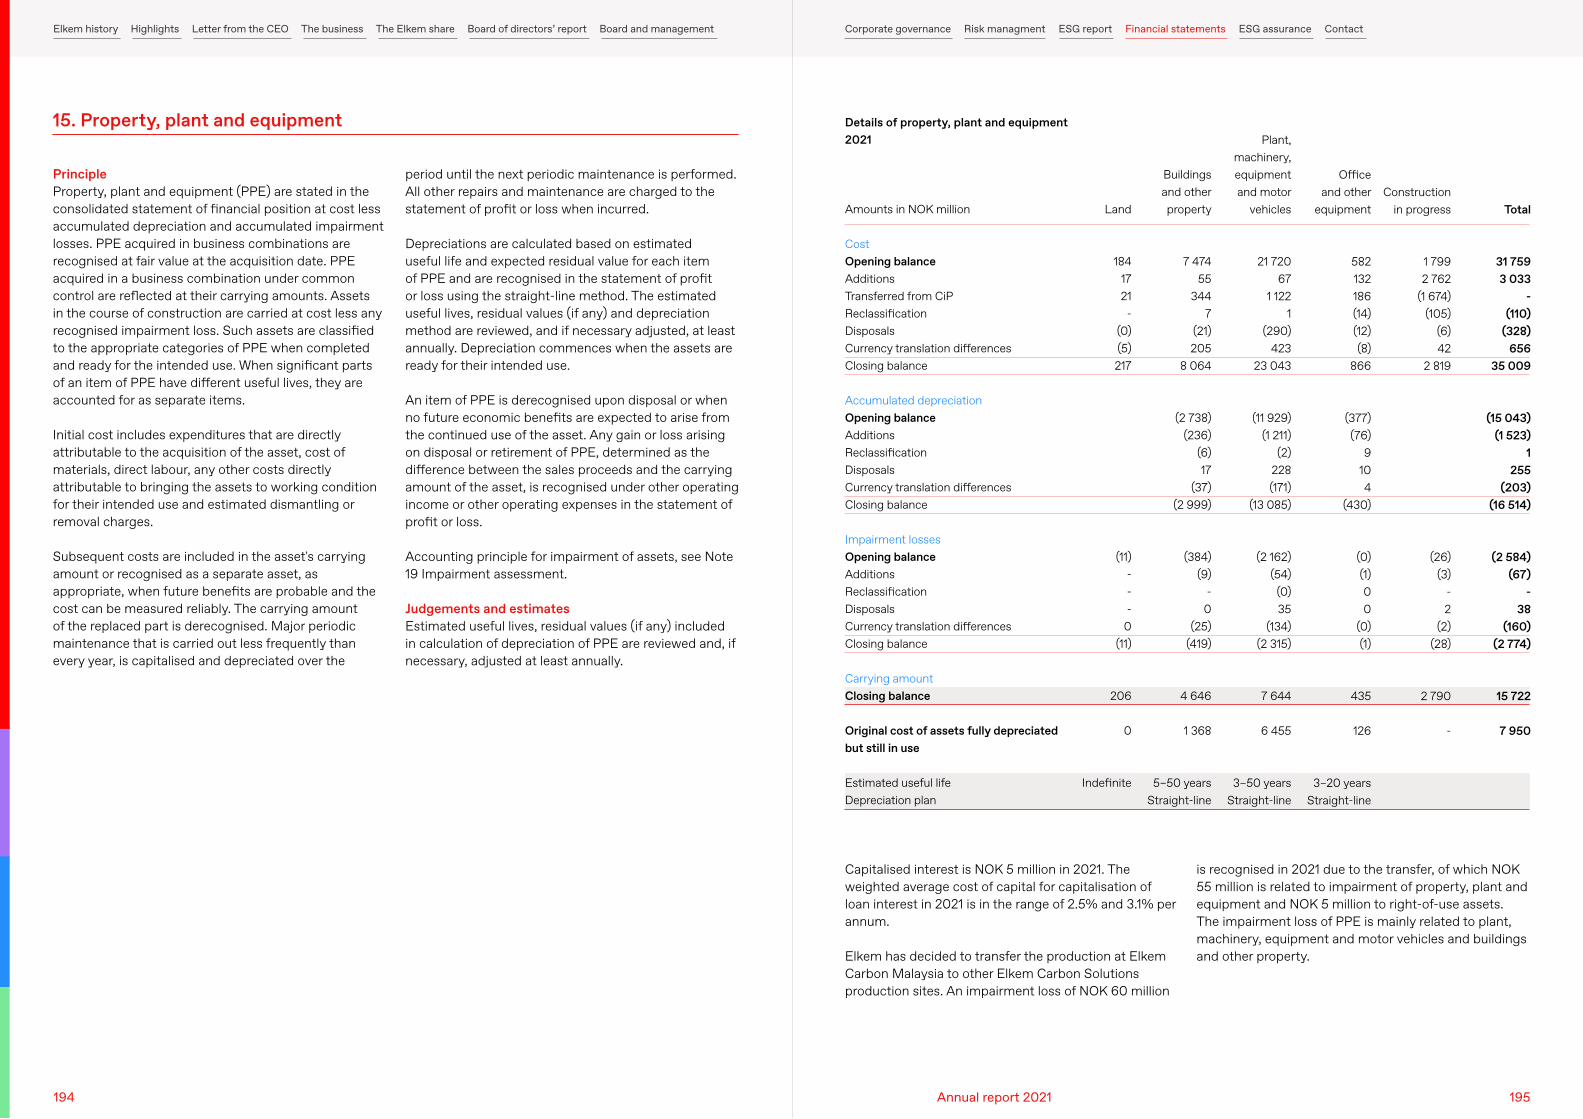
PrincipleProperty, plant and equipment (PPE) are stated in the consolidated statement of financial position at cost less accumulated depreciation and accumulated impairment losses. PPE acquired in business combinations are recognised at fair value at the acquisition date. PPE acquired in a business combination under common control are reflected at their carrying amounts. Assets in the course of construction are carried at cost less any recognised impairment loss. Such assets are classified to the appropriate categories of PPE when completed and ready for the intended use. When significant parts of an item of PPE have different useful lives, they are accounted for as separate items.
Initial cost includes expenditures that are directly attributable to the acquisition of the asset, cost of materials, direct labour, any other costs directly attributable to bringing the assets to working condition for their intended use and estimated dismantling or removal charges.
Subsequent costs are included in the asset's carrying amount or recognised as a separate asset, as appropriate, when future benefits are probable and the cost can be measured reliably. The carrying amount of the replaced part is derecognised. Major periodic maintenance that is carried out less frequently than every year, is capitalised and depreciated over the
Capitalised interest is NOK 5 million in 2021. The weighted average cost of capital for capitalisation of loan interest in 2021 is in the range of 2.5% and 3.1% per annum.
Elkem has decided to transfer the production at Elkem Carbon Malaysia to other Elkem Carbon Solutions production sites. An impairment loss of NOK 60 million
is recognised in 2021 due to the transfer, of which NOK 55 million is related to impairment of property, plant and equipment and NOK 5 million to right-of-use assets. The impairment loss of PPE is mainly related to plant, machinery, equipment and motor vehicles and buildings and other property.
period until the next periodic maintenance is performed. All other repairs and maintenance are charged to the statement of profit or loss when incurred.
Depreciations are calculated based on estimated useful life and expected residual value for each item of PPE and are recognised in the statement of profit or loss using the straight-line method. The estimated useful lives, residual values (if any) and depreciation method are reviewed, and if necessary adjusted, at least annually. Depreciation commences when the assets are ready for their intended use.
An item of PPE is derecognised upon disposal or when no future economic benefits are expected to arise from the continued use of the asset. Any gain or loss arising on disposal or retirement of PPE, determined as the difference between the sales proceeds and the carrying amount of the asset, is recognised under other operating income or other operating expenses in the statement of profit or loss.
Accounting principle for impairment of assets, see Note 19 Impairment assessment.
Judgements and estimatesEstimated useful lives, residual values (if any) included in calculation of depreciation of PPE are reviewed and, if necessary, adjusted at least annually.
15. Property, plant and equipment
Amounts in NOK million
CostOpening balanceAdditionsTransferred from CiPReclassificationDisposalsCurrency translation differencesClosing balance
Accumulated depreciationOpening balanceAdditionsReclassificationDisposalsCurrency translation differencesClosing balance
Impairment lossesOpening balanceAdditionsReclassificationDisposalsCurrency translation differencesClosing balance
Carrying amountClosing balance
Original cost of assets fully depreciated but still in use
Estimated useful lifeDepreciation plan
Details of property, plant and equipment 2021
Land
184 17 21
- (0) (5) 217
(11) - - -
0 (11)
206
0
Indefinite
Buildings and other property
7 474 55
344 7
(21) 205
8 064
(2 738) (236)
(6) 17
(37) (2 999)
(384) (9)
- 0
(25) (419)
4 646
1 368
5–50 yearsStraight-line
Plant, machinery, equipment and motor
vehicles
21 720 67
1 122 1
(290) 423
23 043
(11 929) (1 211)
(2) 228 (171)
(13 085)
(2 162) (54)
(0) 35
(134) (2 315)
7 644
6 455
3–50 yearsStraight-line
Office and other
equipment
582 132 186 (14) (12) (8)
866
(377) (76)
9 10 4
(430)
(0) (1) 0 0
(0) (1)
435
126
3–20 yearsStraight-line
Construction in progress
1 799 2 762
(1 674) (105)
(6) 42
2 819
(26) (3)
- 2
(2) (28)
2 790
-
Total
31 759 3 033
- (110)
(328) 656
35 009
(15 043) (1 523)
1 255
(203) (16 514)
(2 584) (67)
- 38
(160) (2 774)
15 722
7 950
194 195Annual report 2021
Elkem history Highlights Letter from the CEO The business The Elkem share Board of directors’ report Board and management Corporate governance Risk managment ESG report Financial statements ESG assurance Contact
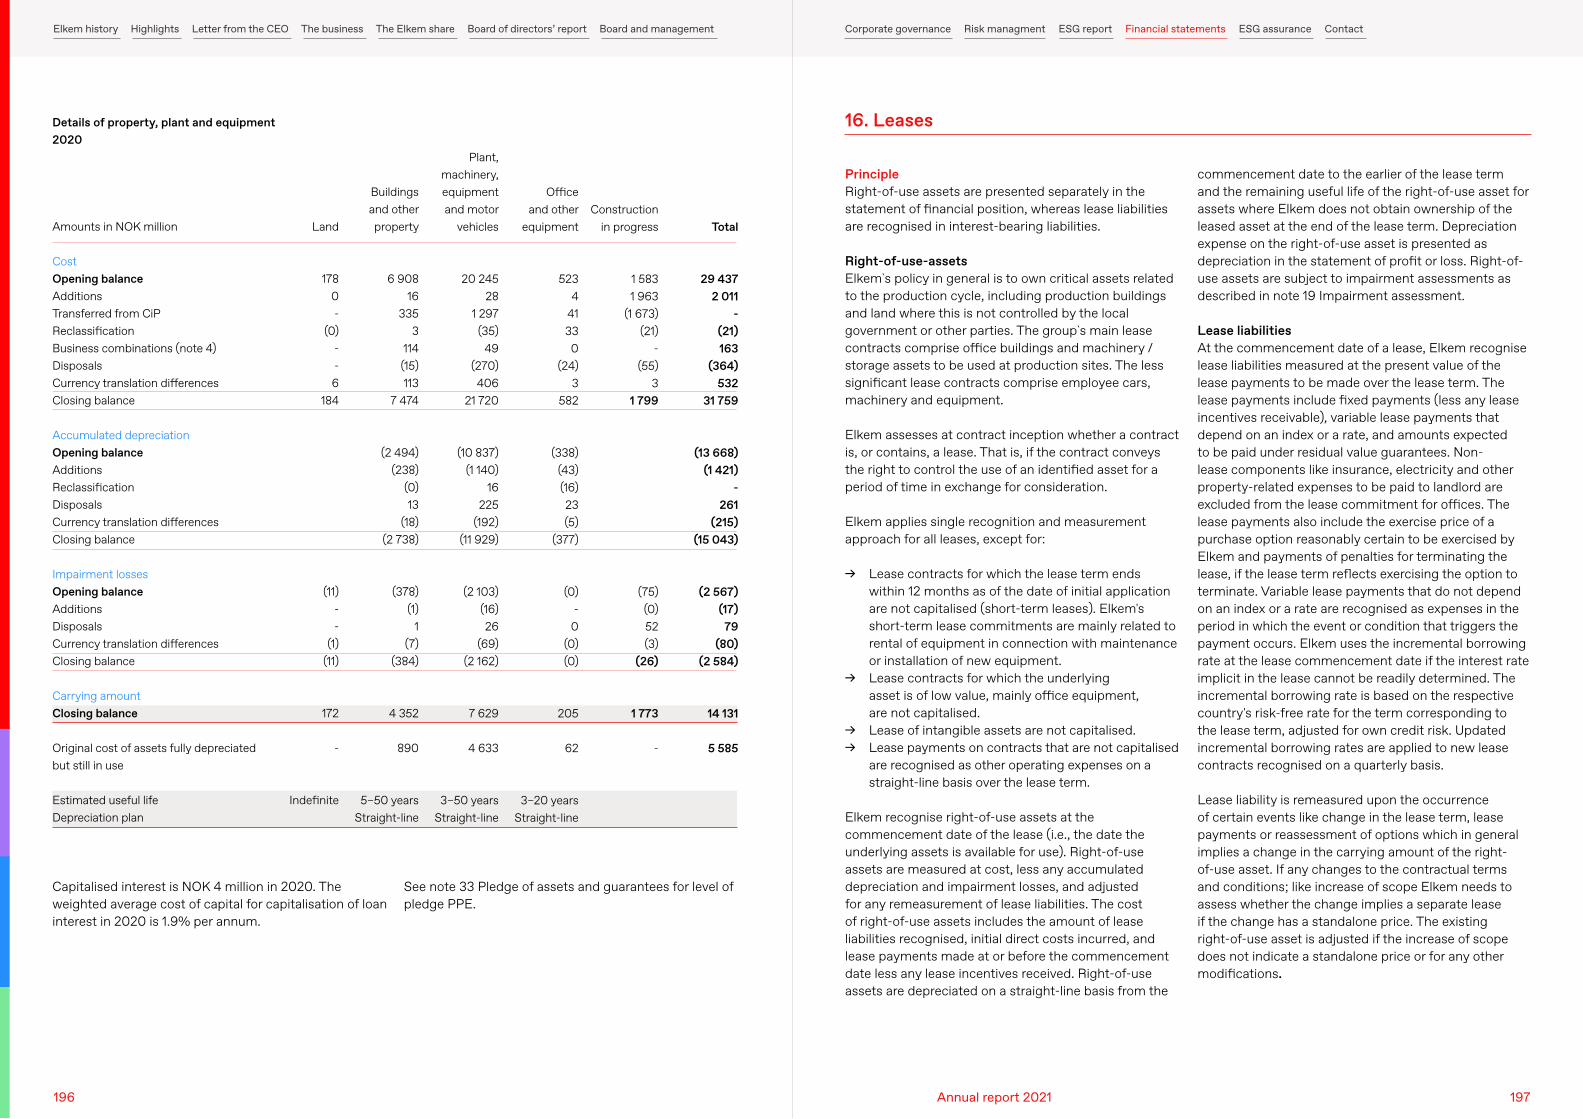
Capitalised interest is NOK 4 million in 2020. The weighted average cost of capital for capitalisation of loan interest in 2020 is 1.9% per annum.
See note 33 Pledge of assets and guarantees for level of pledge PPE.
Amounts in NOK million
CostOpening balanceAdditionsTransferred from CiPReclassificationBusiness combinations (note 4)DisposalsCurrency translation differencesClosing balance
Accumulated depreciationOpening balanceAdditionsReclassificationDisposalsCurrency translation differencesClosing balance
Impairment lossesOpening balanceAdditionsDisposalsCurrency translation differencesClosing balance
Carrying amountClosing balance
Original cost of assets fully depreciated but still in use
Estimated useful lifeDepreciation plan
Details of property, plant and equipment 2020
Land
178 0 -
(0) - - 6
184
(11) - -
(1) (11)
172
-
Indefinite
Buildings and other property
6 908 16
335 3
114 (15) 113
7 474
(2 494) (238)
(0) 13
(18) (2 738)
(378) (1)
1 (7)
(384)
4 352
890
5–50 yearsStraight-line
Plant, machinery, equipment and motor
vehicles
20 245 28
1 297 (35)
49 (270) 406
21 720
(10 837) (1 140)
16 225
(192) (11 929)
(2 103) (16) 26
(69) (2 162)
7 629
4 633
3–50 yearsStraight-line
Office and other
equipment
523 4
41 33 0
(24) 3
582
(338) (43) (16) 23 (5)
(377)
(0) -
0 (0) (0)
205
62
3–20 yearsStraight-line
Construction in progress
1 583 1 963
(1 673) (21)
- (55)
3 1 799
(75) (0) 52 (3)
(26)
1 773
-
Total
29 437 2 011
- (21) 163
(364) 532
31 759
(13 668) (1 421)
- 261
(215) (15 043)
(2 567) (17)
79 (80)
(2 584)
14 131
5 585
PrincipleRight-of-use assets are presented separately in the statement of financial position, whereas lease liabilities are recognised in interest-bearing liabilities.
Right-of-use-assetsElkem`s policy in general is to own critical assets related to the production cycle, including production buildings and land where this is not controlled by the local government or other parties. The group`s main lease contracts comprise office buildings and machinery / storage assets to be used at production sites. The less significant lease contracts comprise employee cars, machinery and equipment.
Elkem assesses at contract inception whether a contract is, or contains, a lease. That is, if the contract conveys the right to control the use of an identified asset for a period of time in exchange for consideration.
Elkem applies single recognition and measurement approach for all leases, except for:
→ Lease contracts for which the lease term ends within 12 months as of the date of initial application are not capitalised (short-term leases). Elkem's short-term lease commitments are mainly related to rental of equipment in connection with maintenance or installation of new equipment.
→ Lease contracts for which the underlying asset is of low value, mainly office equipment, are not capitalised.
→ Lease of intangible assets are not capitalised. → Lease payments on contracts that are not capitalised
are recognised as other operating expenses on a straight-line basis over the lease term.
Elkem recognise right-of-use assets at the commencement date of the lease (i.e., the date the underlying assets is available for use). Right-of-use assets are measured at cost, less any accumulated depreciation and impairment losses, and adjusted for any remeasurement of lease liabilities. The cost of right-of-use assets includes the amount of lease liabilities recognised, initial direct costs incurred, and lease payments made at or before the commencement date less any lease incentives received. Right-of-use assets are depreciated on a straight-line basis from the
commencement date to the earlier of the lease term and the remaining useful life of the right-of-use asset for assets where Elkem does not obtain ownership of the leased asset at the end of the lease term. Depreciation expense on the right-of-use asset is presented as depreciation in the statement of profit or loss. Right-of-use assets are subject to impairment assessments as described in note 19 Impairment assessment.
Lease liabilitiesAt the commencement date of a lease, Elkem recognise lease liabilities measured at the present value of the lease payments to be made over the lease term. The lease payments include fixed payments (less any lease incentives receivable), variable lease payments that depend on an index or a rate, and amounts expected to be paid under residual value guarantees. Non-lease components like insurance, electricity and other property-related expenses to be paid to landlord are excluded from the lease commitment for offices. The lease payments also include the exercise price of a purchase option reasonably certain to be exercised by Elkem and payments of penalties for terminating the lease, if the lease term reflects exercising the option to terminate. Variable lease payments that do not depend on an index or a rate are recognised as expenses in the period in which the event or condition that triggers the payment occurs. Elkem uses the incremental borrowing rate at the lease commencement date if the interest rate implicit in the lease cannot be readily determined. The incremental borrowing rate is based on the respective country's risk-free rate for the term corresponding to the lease term, adjusted for own credit risk. Updated incremental borrowing rates are applied to new lease contracts recognised on a quarterly basis.
Lease liability is remeasured upon the occurrence of certain events like change in the lease term, lease payments or reassessment of options which in general implies a change in the carrying amount of the right-of-use asset. If any changes to the contractual terms and conditions; like increase of scope Elkem needs to assess whether the change implies a separate lease if the change has a standalone price. The existing right-of-use asset is adjusted if the increase of scope does not indicate a standalone price or for any other modifications.
16. Leases
196 197Annual report 2021
Elkem history Highlights Letter from the CEO The business The Elkem share Board of directors’ report Board and management Corporate governance Risk managment ESG report Financial statements ESG assurance Contact
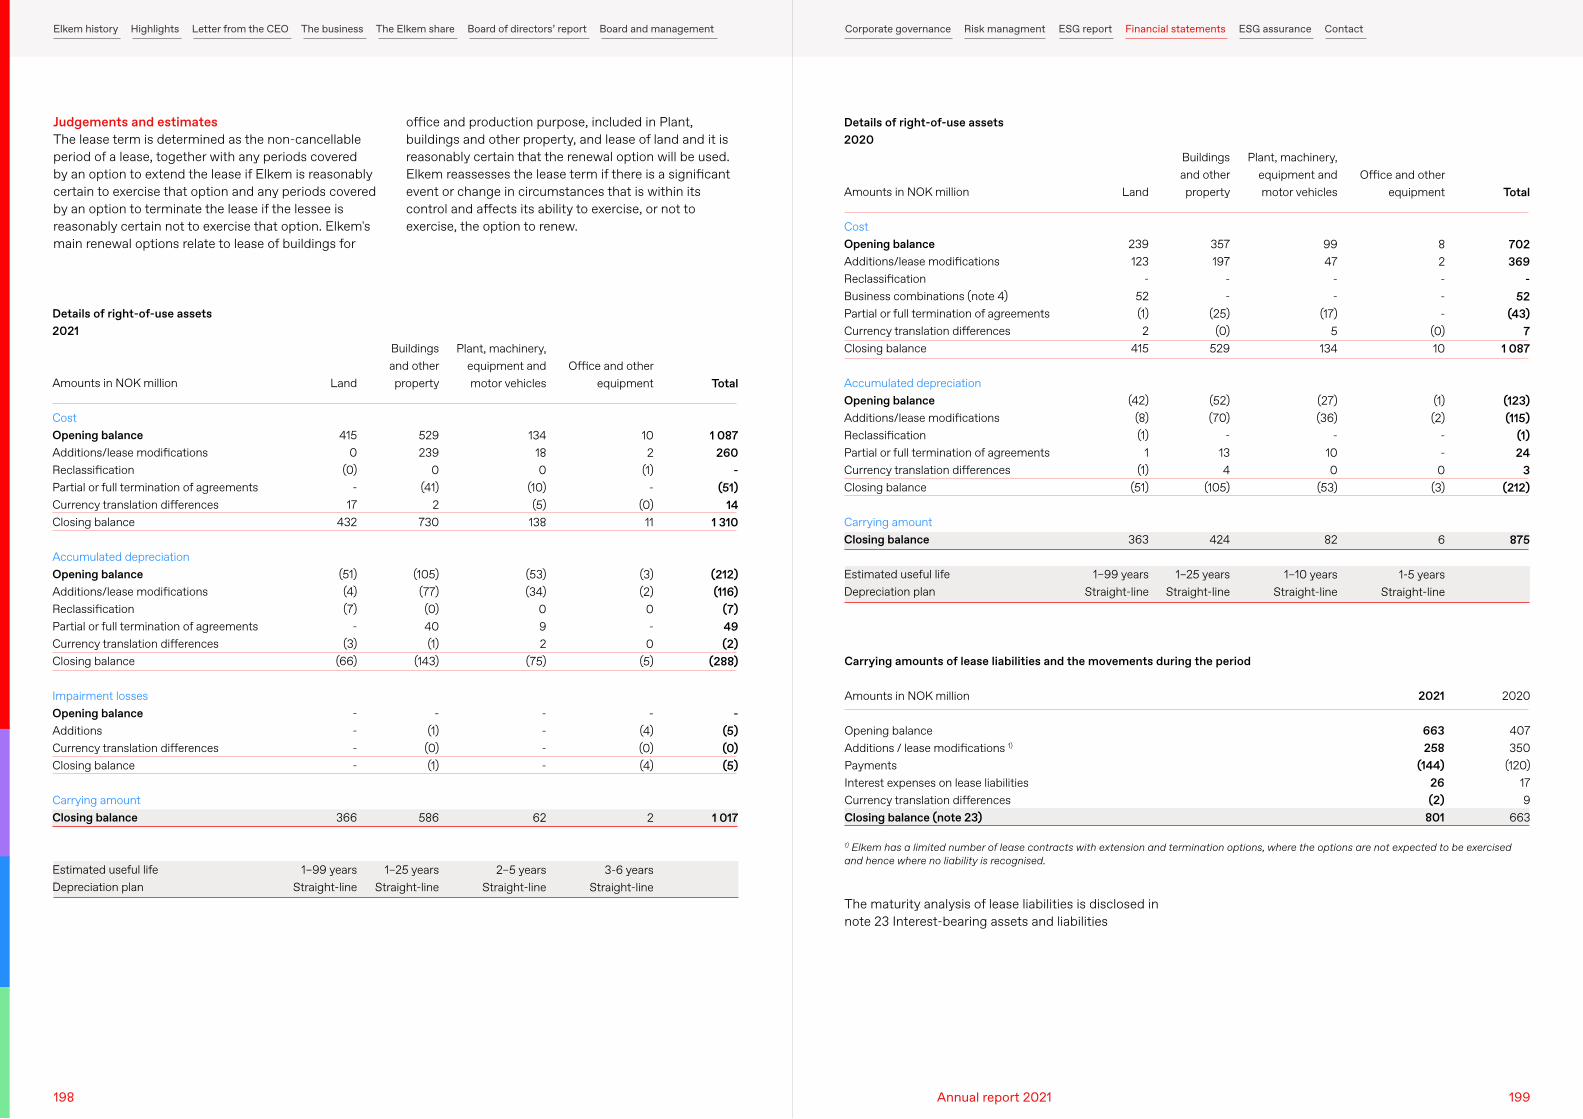
Judgements and estimatesThe lease term is determined as the non-cancellable period of a lease, together with any periods covered by an option to extend the lease if Elkem is reasonably certain to exercise that option and any periods covered by an option to terminate the lease if the lessee is reasonably certain not to exercise that option. Elkem's main renewal options relate to lease of buildings for
office and production purpose, included in Plant, buildings and other property, and lease of land and it is reasonably certain that the renewal option will be used. Elkem reassesses the lease term if there is a significant event or change in circumstances that is within its control and affects its ability to exercise, or not to exercise, the option to renew.
Amounts in NOK million
CostOpening balanceAdditions/lease modificationsReclassificationPartial or full termination of agreementsCurrency translation differencesClosing balance
Accumulated depreciationOpening balanceAdditions/lease modificationsReclassificationPartial or full termination of agreementsCurrency translation differencesClosing balance
Impairment lossesOpening balanceAdditionsCurrency translation differencesClosing balance
Carrying amountClosing balance
Estimated useful lifeDepreciation plan
Amounts in NOK million
CostOpening balanceAdditions/lease modificationsReclassificationBusiness combinations (note 4)Partial or full termination of agreementsCurrency translation differencesClosing balance
Accumulated depreciationOpening balanceAdditions/lease modificationsReclassificationPartial or full termination of agreementsCurrency translation differencesClosing balance
Carrying amountClosing balance
Estimated useful lifeDepreciation plan
Details of right-of-use assets2021
Details of right-of-use assets2020
Land
415 0
(0) -
17 432
(51) (4) (7)
- (3)
(66)
- - - -
366
1–99 yearsStraight-line
Land
239 123
- 52 (1) 2
415
(42) (8) (1)
1 (1)
(51)
363
1–99 yearsStraight-line
Buildingsand otherproperty
529 239
0 (41)
2 730
(105) (77) (0) 40 (1)
(143)
- (1)
(0) (1)
586
1–25 yearsStraight-line
Buildingsand otherproperty
357 197
- -
(25) (0)
529
(52) (70)
- 13 4
(105)
424
1–25 yearsStraight-line
Plant, machinery,equipment andmotor vehicles
134 18 0
(10) (5)
138
(53) (34)
0 9 2
(75)
- - - -
62
2–5 yearsStraight-line
Plant, machinery,equipment andmotor vehicles
99 47
- -
(17) 5
134
(27) (36)
- 10 0
(53)
82
1–10 yearsStraight-line
Office and other equipment
10 2
(1) -
(0) 11
(3) (2)
0 -
0 (5)
- (4) (0) (4)
2
3-6 yearsStraight-line
Office and other equipment
8 2 - - -
(0) 10
(1) (2)
- -
0 (3)
6
1-5 yearsStraight-line
Total
1 087 260
- (51)
14 1 310
(212) (116)
(7) 49 (2)
(288)
- (5) (0) (5)
1 017
Total
702 369
- 52
(43) 7
1 087
(123) (115)
(1) 24
3 (212)
875
Amounts in NOK million
Opening balanceAdditions / lease modifications 1)
PaymentsInterest expenses on lease liabilitiesCurrency translation differencesClosing balance (note 23)
Carrying amounts of lease liabilities and the movements during the period
2021
663 258
(144) 26 (2)
801
2020
407 350
(120) 17 9
663
1) Elkem has a limited number of lease contracts with extension and termination options, where the options are not expected to be exercised and hence where no liability is recognised.
The maturity analysis of lease liabilities is disclosed in note 23 Interest-bearing assets and liabilities
198 199Annual report 2021
Elkem history Highlights Letter from the CEO The business The Elkem share Board of directors’ report Board and management Corporate governance Risk managment ESG report Financial statements ESG assurance Contact
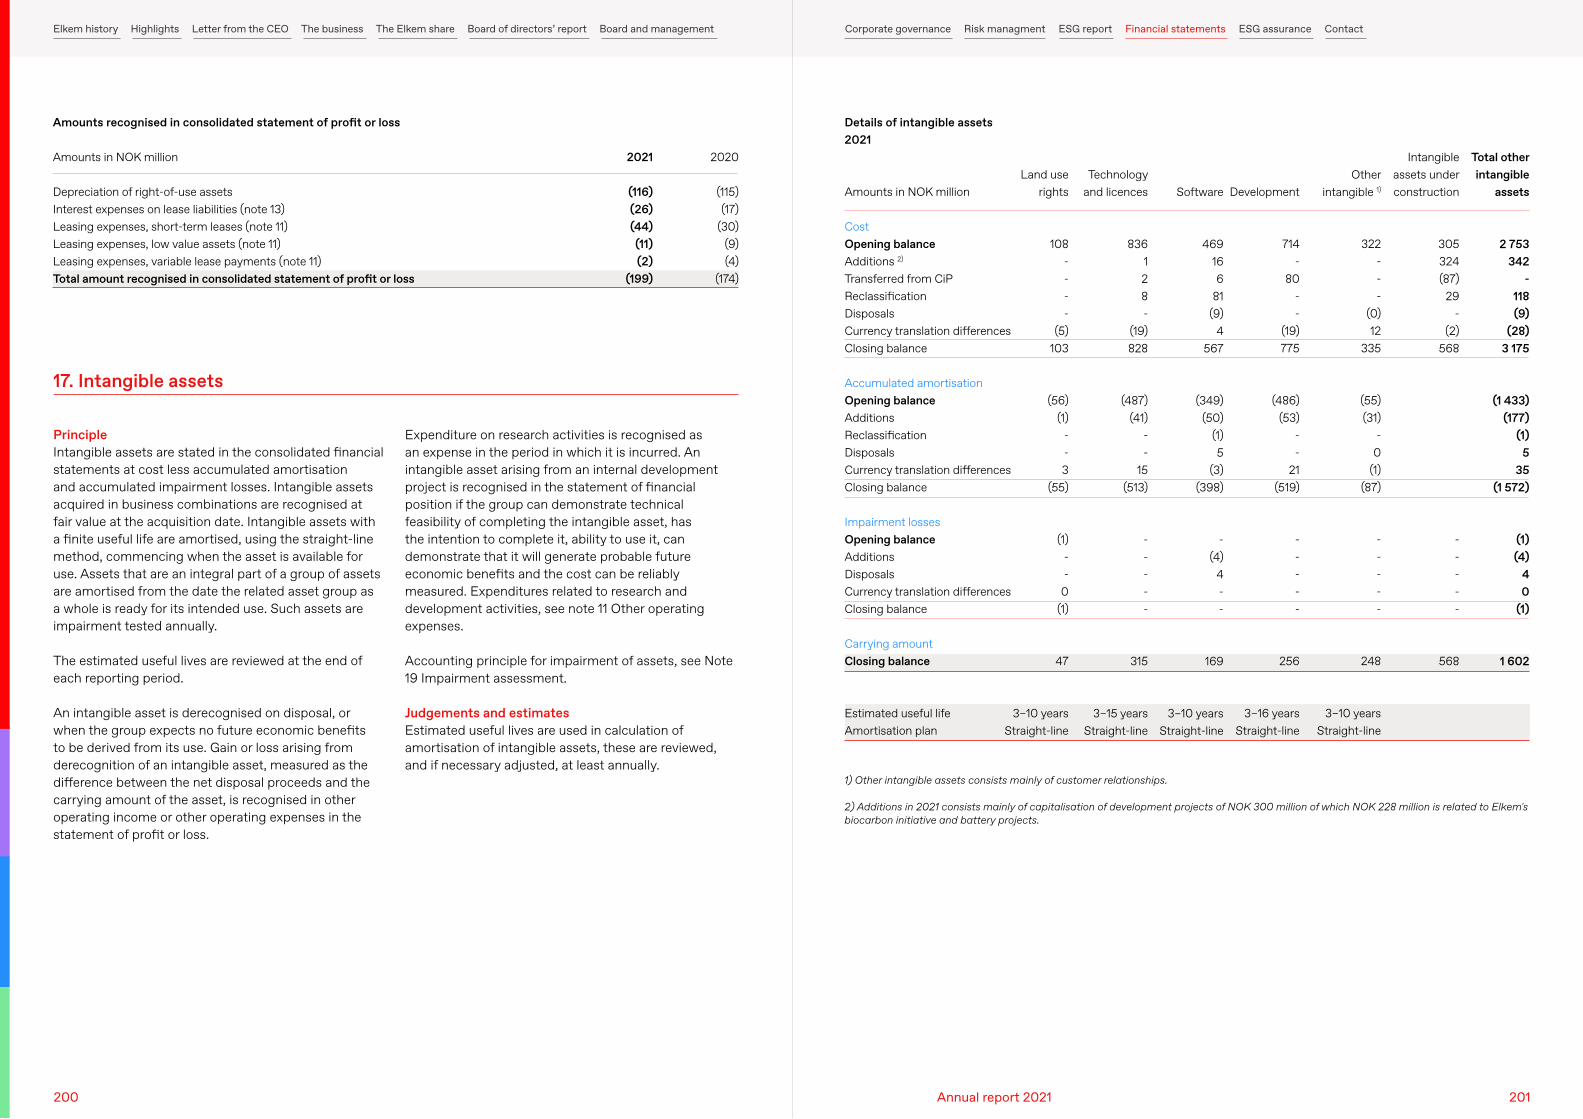
Amounts in NOK million
Depreciation of right-of-use assetsInterest expenses on lease liabilities (note 13)Leasing expenses, short-term leases (note 11)Leasing expenses, low value assets (note 11)Leasing expenses, variable lease payments (note 11)Total amount recognised in consolidated statement of profit or loss
Amounts recognised in consolidated statement of profit or loss
2021
(116) (26) (44) (11) (2)
(199)
2020
(115) (17)
(30) (9) (4)
(174)
PrincipleIntangible assets are stated in the consolidated financial statements at cost less accumulated amortisation and accumulated impairment losses. Intangible assets acquired in business combinations are recognised at fair value at the acquisition date. Intangible assets with a finite useful life are amortised, using the straight-line method, commencing when the asset is available for use. Assets that are an integral part of a group of assets are amortised from the date the related asset group as a whole is ready for its intended use. Such assets are impairment tested annually.
The estimated useful lives are reviewed at the end of each reporting period.
An intangible asset is derecognised on disposal, or when the group expects no future economic benefits to be derived from its use. Gain or loss arising from derecognition of an intangible asset, measured as the difference between the net disposal proceeds and the carrying amount of the asset, is recognised in other operating income or other operating expenses in the statement of profit or loss.
Expenditure on research activities is recognised as an expense in the period in which it is incurred. An intangible asset arising from an internal development project is recognised in the statement of financial position if the group can demonstrate technical feasibility of completing the intangible asset, has the intention to complete it, ability to use it, can demonstrate that it will generate probable future economic benefits and the cost can be reliably measured. Expenditures related to research and development activities, see note 11 Other operating expenses.
Accounting principle for impairment of assets, see Note 19 Impairment assessment.
Judgements and estimatesEstimated useful lives are used in calculation of amortisation of intangible assets, these are reviewed, and if necessary adjusted, at least annually.
17. Intangible assets
Amounts in NOK million
CostOpening balanceAdditions 2)
Transferred from CiPReclassificationDisposalsCurrency translation differencesClosing balance
Accumulated amortisationOpening balanceAdditionsReclassificationDisposalsCurrency translation differencesClosing balance
Impairment lossesOpening balanceAdditionsDisposalsCurrency translation differencesClosing balance
Carrying amountClosing balance
Estimated useful lifeAmortisation plan
Details of intangible assets2021
Land use rights
108 - - - -
(5) 103
(56) (1)
- - 3
(55)
(1) - -
0 (1)
47
3–10 yearsStraight-line
Technology and licences
836 1 2 8 -
(19) 828
(487) (41)
- -
15 (513)
- - - - -
315
3–15 yearsStraight-line
Software
469 16 6
81 (9)
4 567
(349) (50)
(1) 5
(3) (398)
- (4)
4 - -
169
3–10 yearsStraight-line
Other intangible 1)
322 - - -
(0) 12
335
(55) (31)
- 0
(1) (87)
- - - - -
248
3–10 yearsStraight-line
Development
714 -
80 - -
(19) 775
(486) (53)
- -
21 (519)
- - - - -
256
3–16 yearsStraight-line
Intangible assets under construction
305 324 (87)
29 -
(2) 568
- - - - -
568
Total other intangible
assets
2 753 342
- 118 (9)
(28) 3 175
(1 433) (177)
(1) 5
35 (1 572)
(1) (4)
4 0
(1)
1 602
1) Other intangible assets consists mainly of customer relationships.
2) Additions in 2021 consists mainly of capitalisation of development projects of NOK 300 million of which NOK 228 million is related to Elkem's biocarbon initiative and battery projects.
200 201Annual report 2021
Elkem history Highlights Letter from the CEO The business The Elkem share Board of directors’ report Board and management Corporate governance Risk managment ESG report Financial statements ESG assurance Contact
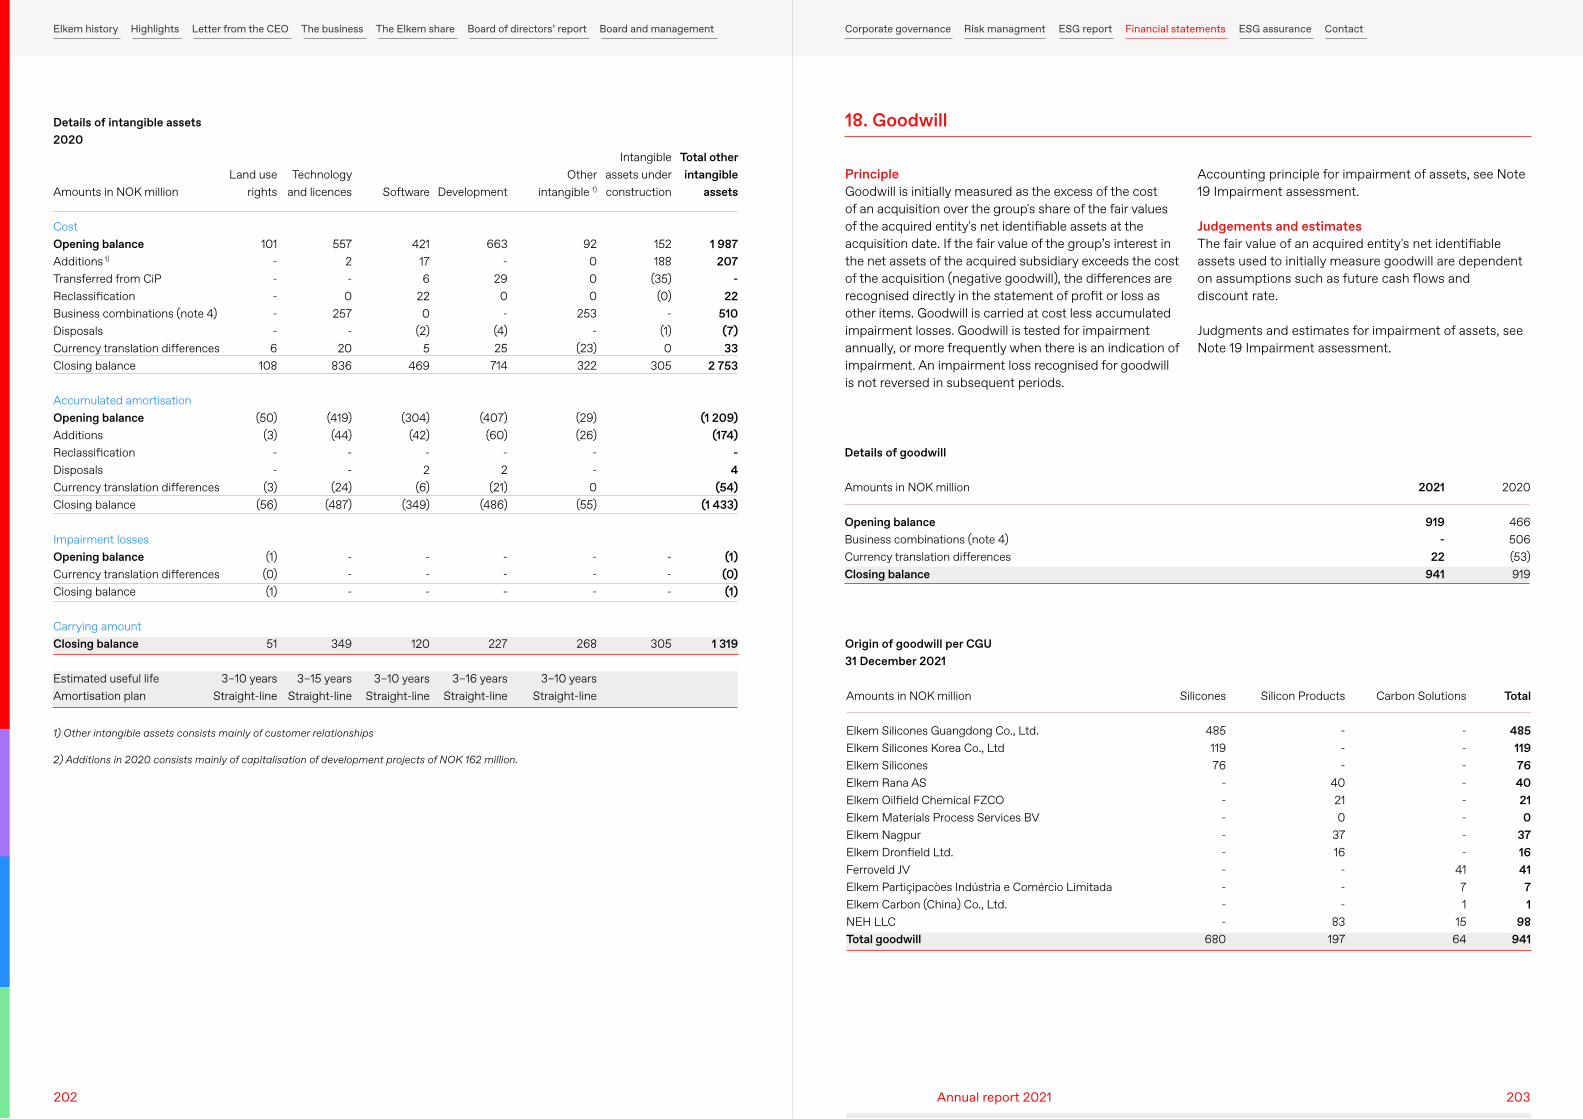
Amounts in NOK million
CostOpening balanceAdditions 1)
Transferred from CiPReclassification Business combinations (note 4)DisposalsCurrency translation differencesClosing balance
Accumulated amortisationOpening balanceAdditionsReclassification DisposalsCurrency translation differencesClosing balance
Impairment lossesOpening balanceCurrency translation differencesClosing balance
Carrying amountClosing balance
Estimated useful lifeAmortisation plan
Details of intangible assets2020
Land use rights
101 - - - - - 6
108
(50) (3)
- -
(3) (56)
(1) (0) (1)
51
3–10 yearsStraight-line
Technology and licences
557 2 -
0 257
- 20
836
(419) (44)
- -
(24) (487)
- - -
349
3–15 yearsStraight-line
Software
421 17 6
22 0
(2) 5
469
(304) (42)
- 2
(6) (349)
- - -
120
3–10 yearsStraight-line
Other intangible 1)
92 0 0 0
253 -
(23) 322
(29) (26)
- -
0 (55)
- - -
268
3–10 yearsStraight-line
Development
663 -
29 0 -
(4) 25
714
(407) (60)
- 2
(21) (486)
- - -
227
3–16 yearsStraight-line
Intangible assets under construction
152 188
(35) (0)
- (1) 0
305
- - -
305
Total other intangible
assets
1 987 207
- 22
510 (7) 33
2 753
(1 209) (174)
- 4
(54) (1 433)
(1) (0) (1)
1 319
1) Other intangible assets consists mainly of customer relationships
2) Additions in 2020 consists mainly of capitalisation of development projects of NOK 162 million.
PrincipleGoodwill is initially measured as the excess of the cost of an acquisition over the group's share of the fair values of the acquired entity's net identifiable assets at the acquisition date. If the fair value of the group’s interest in the net assets of the acquired subsidiary exceeds the cost of the acquisition (negative goodwill), the differences are recognised directly in the statement of profit or loss as other items. Goodwill is carried at cost less accumulated impairment losses. Goodwill is tested for impairment annually, or more frequently when there is an indication of impairment. An impairment loss recognised for goodwill is not reversed in subsequent periods.
Accounting principle for impairment of assets, see Note 19 Impairment assessment.
Judgements and estimatesThe fair value of an acquired entity's net identifiable assets used to initially measure goodwill are dependent on assumptions such as future cash flows and discount rate.
Judgments and estimates for impairment of assets, see Note 19 Impairment assessment.
18. Goodwill
Amounts in NOK million
Opening balanceBusiness combinations (note 4)Currency translation differencesClosing balance
Details of goodwill
2021
919 -
22 941
2020
466 506 (53) 919
Amounts in NOK million
Elkem Silicones Guangdong Co., Ltd.Elkem Silicones Korea Co., Ltd Elkem SiliconesElkem Rana ASElkem Oilfield Chemical FZCOElkem Materials Process Services BVElkem NagpurElkem Dronfield Ltd.Ferroveld JVElkem Partiçipacòes Indústria e Comércio LimitadaElkem Carbon (China) Co., Ltd.NEH LLCTotal goodwill
Origin of goodwill per CGU31 December 2021
Silicon Products
- - -
40 21 0
37 16
- - -
83 197
Silicones
485 119 76
- - - - - - - - -
680
Carbon Solutions
- - - - - - - -
41 7 1
15 64
Total
485 119 76 40 21 0
37 16 41 7 1
98 941
202 203Annual report 2021
Elkem history Highlights Letter from the CEO The business The Elkem share Board of directors’ report Board and management Corporate governance Risk managment ESG report Financial statements ESG assurance Contact
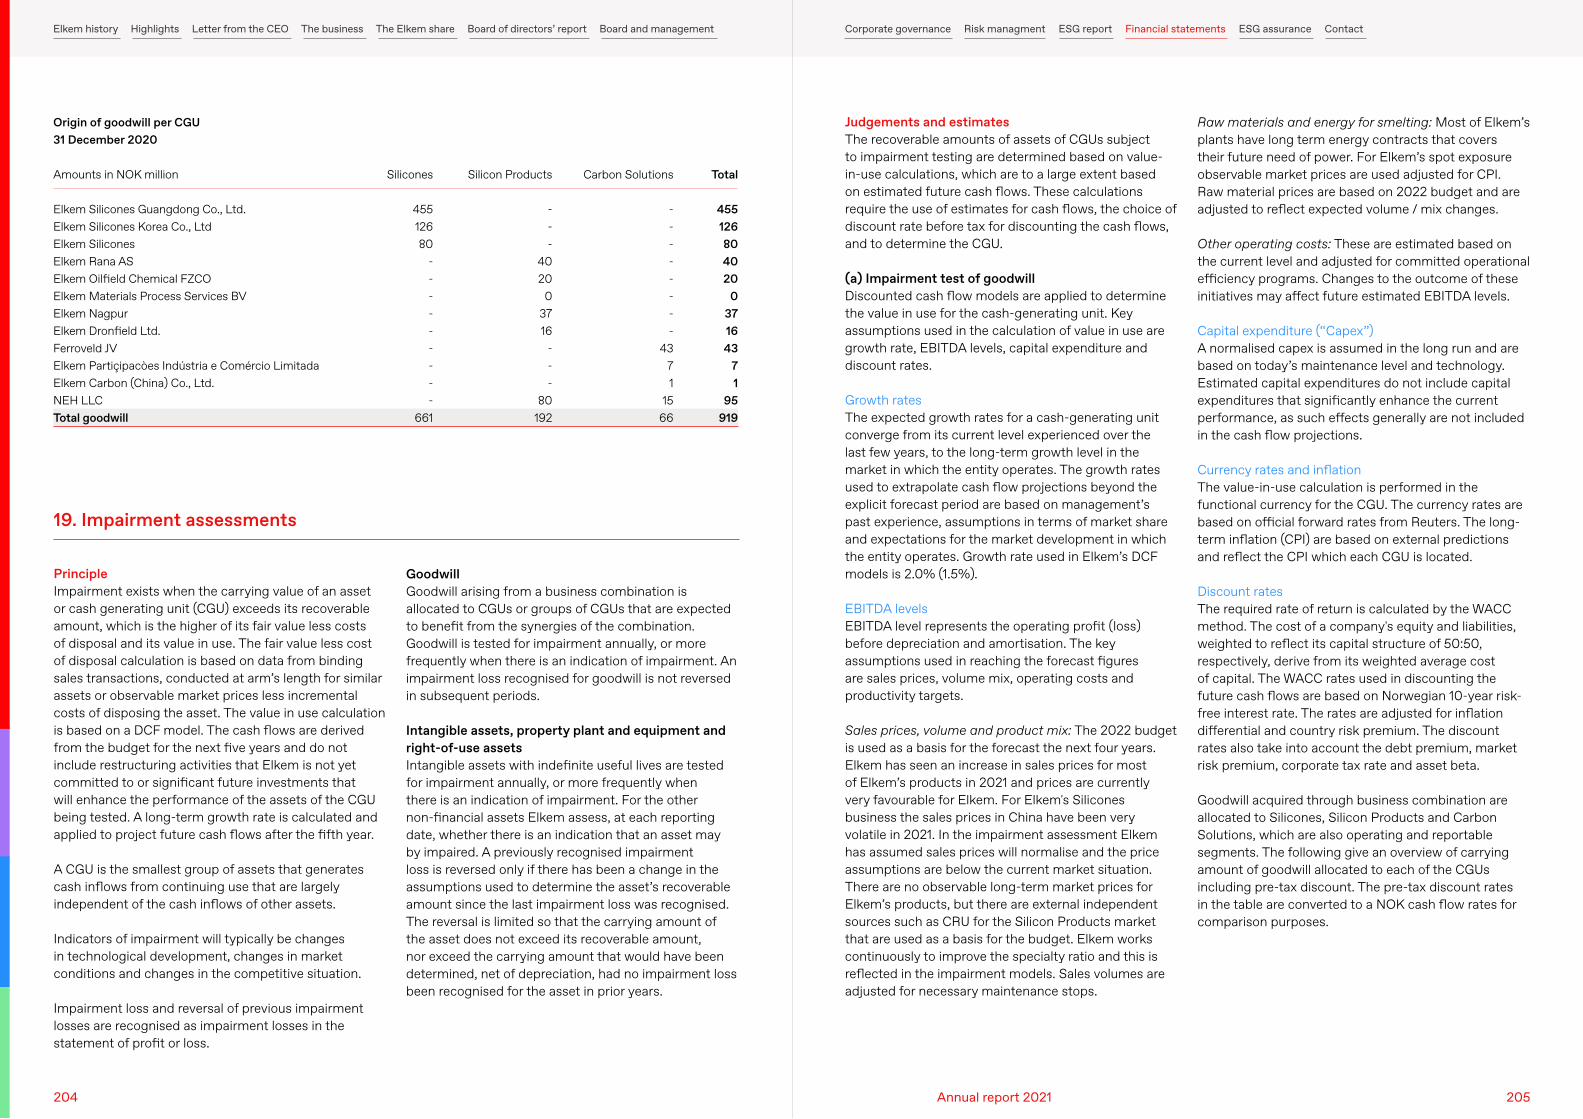
Amounts in NOK million
Elkem Silicones Guangdong Co., Ltd.Elkem Silicones Korea Co., Ltd Elkem SiliconesElkem Rana ASElkem Oilfield Chemical FZCOElkem Materials Process Services BVElkem NagpurElkem Dronfield Ltd.Ferroveld JVElkem Partiçipacòes Indústria e Comércio LimitadaElkem Carbon (China) Co., Ltd.NEH LLCTotal goodwill
Origin of goodwill per CGU31 December 2020
Silicon Products
- - -
40 20
0 37 16
- - -
80 192
Silicones
455 126 80
- - - - - - - - -
661
Carbon Solutions
- - - - - - - -
43 7 1
15 66
Total
455 126 80 40 20
0 37 16 43
7 1
95 919
PrincipleImpairment exists when the carrying value of an asset or cash generating unit (CGU) exceeds its recoverable amount, which is the higher of its fair value less costs of disposal and its value in use. The fair value less cost of disposal calculation is based on data from binding sales transactions, conducted at arm’s length for similar assets or observable market prices less incremental costs of disposing the asset. The value in use calculation is based on a DCF model. The cash flows are derived from the budget for the next five years and do not include restructuring activities that Elkem is not yet committed to or significant future investments that will enhance the performance of the assets of the CGU being tested. A long-term growth rate is calculated and applied to project future cash flows after the fifth year.
A CGU is the smallest group of assets that generates cash inflows from continuing use that are largely independent of the cash inflows of other assets.
Indicators of impairment will typically be changes in technological development, changes in market conditions and changes in the competitive situation.
Impairment loss and reversal of previous impairment losses are recognised as impairment losses in the statement of profit or loss.
Judgements and estimatesThe recoverable amounts of assets of CGUs subject to impairment testing are determined based on value-in-use calculations, which are to a large extent based on estimated future cash flows. These calculations require the use of estimates for cash flows, the choice of discount rate before tax for discounting the cash flows, and to determine the CGU.
(a) Impairment test of goodwill Discounted cash flow models are applied to determine the value in use for the cash-generating unit. Key assumptions used in the calculation of value in use are growth rate, EBITDA levels, capital expenditure and discount rates.
Growth ratesThe expected growth rates for a cash-generating unit converge from its current level experienced over the last few years, to the long-term growth level in the market in which the entity operates. The growth rates used to extrapolate cash flow projections beyond the explicit forecast period are based on management’s past experience, assumptions in terms of market share and expectations for the market development in which the entity operates. Growth rate used in Elkem’s DCF models is 2.0% (1.5%).
EBITDA levelsEBITDA level represents the operating profit (loss) before depreciation and amortisation. The key assumptions used in reaching the forecast figures are sales prices, volume mix, operating costs and productivity targets.
Sales prices, volume and product mix: The 2022 budget is used as a basis for the forecast the next four years. Elkem has seen an increase in sales prices for most of Elkem’s products in 2021 and prices are currently very favourable for Elkem. For Elkem's Silicones business the sales prices in China have been very volatile in 2021. In the impairment assessment Elkem has assumed sales prices will normalise and the price assumptions are below the current market situation. There are no observable long-term market prices for Elkem’s products, but there are external independent sources such as CRU for the Silicon Products market that are used as a basis for the budget. Elkem works continuously to improve the specialty ratio and this is reflected in the impairment models. Sales volumes are adjusted for necessary maintenance stops.
GoodwillGoodwill arising from a business combination is allocated to CGUs or groups of CGUs that are expected to benefit from the synergies of the combination. Goodwill is tested for impairment annually, or more frequently when there is an indication of impairment. An impairment loss recognised for goodwill is not reversed in subsequent periods.
Intangible assets, property plant and equipment and right-of-use assetsIntangible assets with indefinite useful lives are tested for impairment annually, or more frequently when there is an indication of impairment. For the other non-financial assets Elkem assess, at each reporting date, whether there is an indication that an asset may by impaired. A previously recognised impairment loss is reversed only if there has been a change in the assumptions used to determine the asset’s recoverable amount since the last impairment loss was recognised. The reversal is limited so that the carrying amount of the asset does not exceed its recoverable amount, nor exceed the carrying amount that would have been determined, net of depreciation, had no impairment loss been recognised for the asset in prior years.
Raw materials and energy for smelting: Most of Elkem’s plants have long term energy contracts that covers their future need of power. For Elkem’s spot exposure observable market prices are used adjusted for CPI. Raw material prices are based on 2022 budget and are adjusted to reflect expected volume / mix changes.
Other operating costs: These are estimated based on the current level and adjusted for committed operational efficiency programs. Changes to the outcome of these initiatives may affect future estimated EBITDA levels.
Capital expenditure (“Capex”)A normalised capex is assumed in the long run and are based on today’s maintenance level and technology. Estimated capital expenditures do not include capital expenditures that significantly enhance the current performance, as such effects generally are not included in the cash flow projections.
Currency rates and inflationThe value-in-use calculation is performed in the functional currency for the CGU. The currency rates are based on official forward rates from Reuters. The long-term inflation (CPI) are based on external predictions and reflect the CPI which each CGU is located.
Discount ratesThe required rate of return is calculated by the WACC method. The cost of a company's equity and liabilities, weighted to reflect its capital structure of 50:50, respectively, derive from its weighted average cost of capital. The WACC rates used in discounting the future cash flows are based on Norwegian 10-year risk-free interest rate. The rates are adjusted for inflation differential and country risk premium. The discount rates also take into account the debt premium, market risk premium, corporate tax rate and asset beta.
Goodwill acquired through business combination are allocated to Silicones, Silicon Products and Carbon Solutions, which are also operating and reportable segments. The following give an overview of carrying amount of goodwill allocated to each of the CGUs including pre-tax discount. The pre-tax discount rates in the table are converted to a NOK cash flow rates for comparison purposes.
19. Impairment assessments
204 205Annual report 2021
Elkem history Highlights Letter from the CEO The business The Elkem share Board of directors’ report Board and management Corporate governance Risk managment ESG report Financial statements ESG assurance Contact
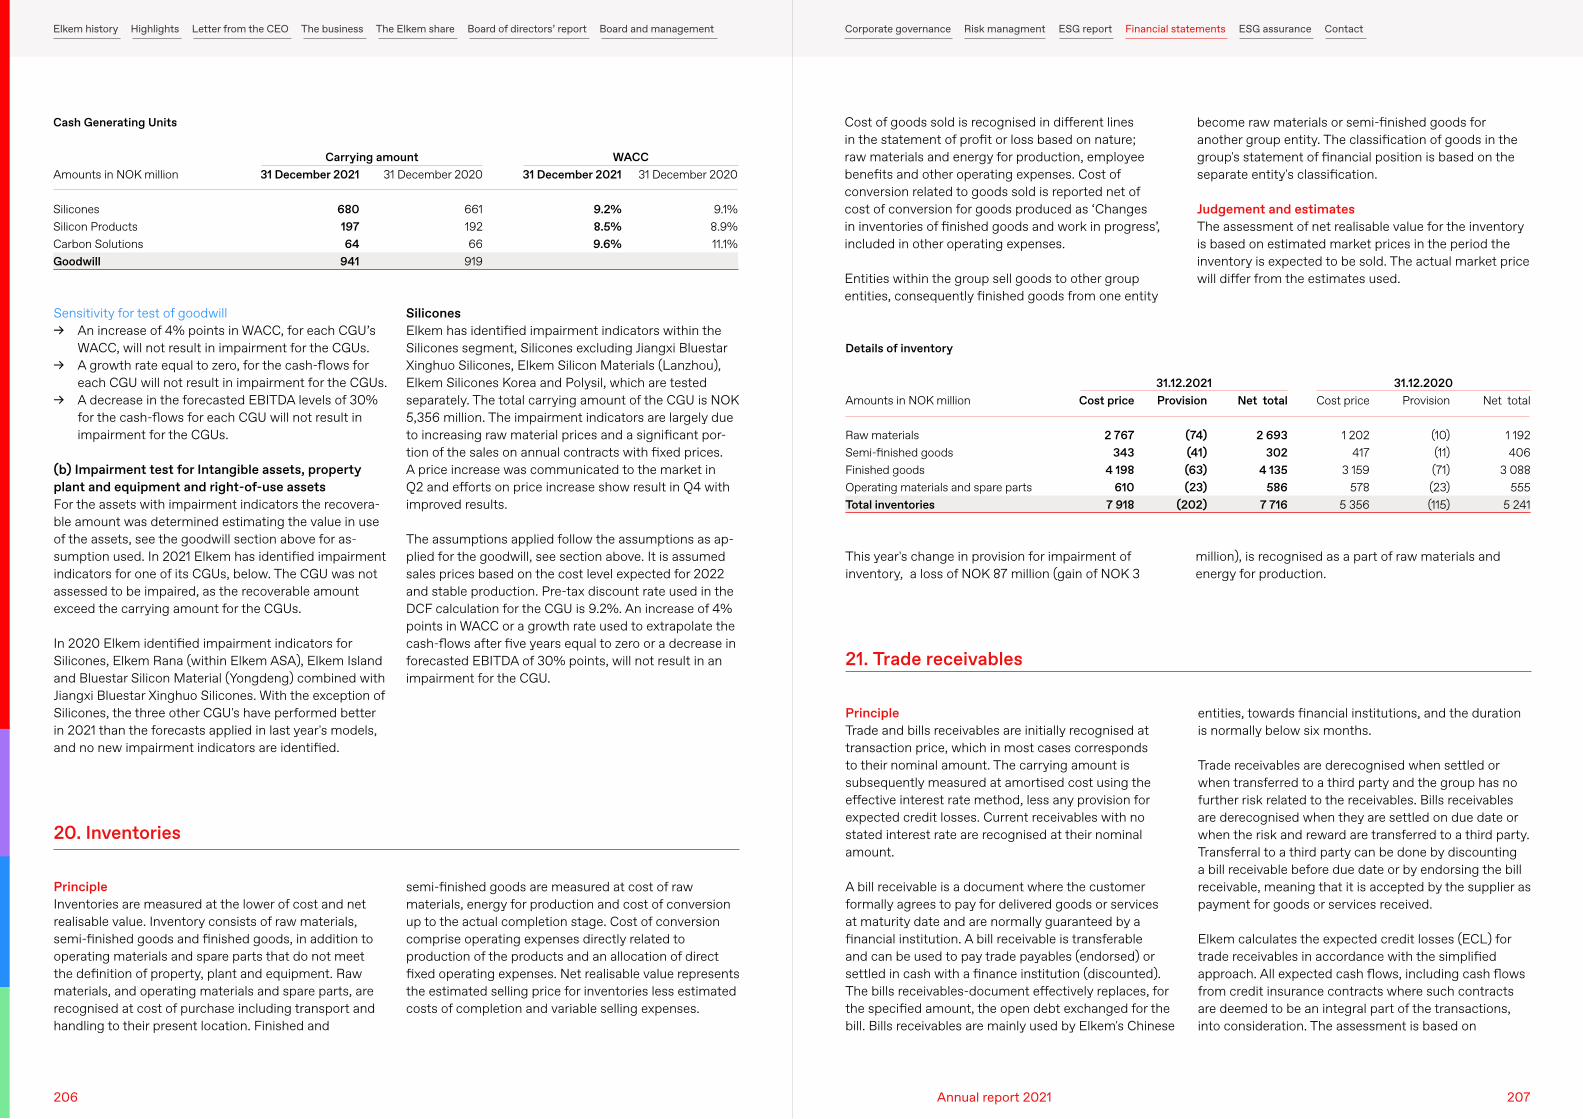
Amounts in NOK million
SiliconesSilicon ProductsCarbon SolutionsGoodwill
Amounts in NOK million
Raw materialsSemi-finished goodsFinished goodsOperating materials and spare partsTotal inventories
Cash Generating Units
Details of inventory
Carrying amount
31.12.2021
WACC
31.12.2020
31 December 2020
661 192 66
919
Provision
(74) (41) (63) (23)
(202)
Provision
(10) (11) (71) (23)(115)
31 December 2021
680 197 64
941
Cost price
2 767 343
4 198 610
7 918
Cost price
1 202 417
3 159 578
5 356
31 December 2021
9.2% 8.5% 9.6%
Net total
2 693 302
4 135 586
7 716
Net total
1 192 406
3 088 555
5 241
31 December 2020
9.1% 8.9% 11.1%
Sensitivity for test of goodwill → An increase of 4% points in WACC, for each CGU’s
WACC, will not result in impairment for the CGUs. → A growth rate equal to zero, for the cash-flows for
each CGU will not result in impairment for the CGUs. → A decrease in the forecasted EBITDA levels of 30%
for the cash-flows for each CGU will not result in impairment for the CGUs.
(b) Impairment test for Intangible assets, property plant and equipment and right-of-use assetsFor the assets with impairment indicators the recovera-ble amount was determined estimating the value in use of the assets, see the goodwill section above for as-sumption used. In 2021 Elkem has identified impairment indicators for one of its CGUs, below. The CGU was not assessed to be impaired, as the recoverable amount exceed the carrying amount for the CGUs.
In 2020 Elkem identified impairment indicators for Silicones, Elkem Rana (within Elkem ASA), Elkem Island and Bluestar Silicon Material (Yongdeng) combined with Jiangxi Bluestar Xinghuo Silicones. With the exception of Silicones, the three other CGU's have performed better in 2021 than the forecasts applied in last year's models, and no new impairment indicators are identified.
SiliconesElkem has identified impairment indicators within the Silicones segment, Silicones excluding Jiangxi Bluestar Xinghuo Silicones, Elkem Silicon Materials (Lanzhou), Elkem Silicones Korea and Polysil, which are tested separately. The total carrying amount of the CGU is NOK 5,356 million. The impairment indicators are largely due to increasing raw material prices and a significant por-tion of the sales on annual contracts with fixed prices. A price increase was communicated to the market in Q2 and efforts on price increase show result in Q4 with improved results.
The assumptions applied follow the assumptions as ap-plied for the goodwill, see section above. It is assumed sales prices based on the cost level expected for 2022 and stable production. Pre-tax discount rate used in the DCF calculation for the CGU is 9.2%. An increase of 4% points in WACC or a growth rate used to extrapolate the cash-flows after five years equal to zero or a decrease in forecasted EBITDA of 30% points, will not result in an impairment for the CGU.
PrincipleInventories are measured at the lower of cost and net realisable value. Inventory consists of raw materials, semi-finished goods and finished goods, in addition to operating materials and spare parts that do not meet the definition of property, plant and equipment. Raw materials, and operating materials and spare parts, are recognised at cost of purchase including transport and handling to their present location. Finished and
PrincipleTrade and bills receivables are initially recognised at transaction price, which in most cases corresponds to their nominal amount. The carrying amount is subsequently measured at amortised cost using the effective interest rate method, less any provision for expected credit losses. Current receivables with no stated interest rate are recognised at their nominal amount.
A bill receivable is a document where the customer formally agrees to pay for delivered goods or services at maturity date and are normally guaranteed by a financial institution. A bill receivable is transferable and can be used to pay trade payables (endorsed) or settled in cash with a finance institution (discounted). The bills receivables-document effectively replaces, for the specified amount, the open debt exchanged for the bill. Bills receivables are mainly used by Elkem's Chinese
Cost of goods sold is recognised in different lines in the statement of profit or loss based on nature; raw materials and energy for production, employee benefits and other operating expenses. Cost of conversion related to goods sold is reported net of cost of conversion for goods produced as ‘Changes in inventories of finished goods and work in progress’, included in other operating expenses.
Entities within the group sell goods to other group entities, consequently finished goods from one entity
semi-finished goods are measured at cost of raw materials, energy for production and cost of conversion up to the actual completion stage. Cost of conversion comprise operating expenses directly related to production of the products and an allocation of direct fixed operating expenses. Net realisable value represents the estimated selling price for inventories less estimated costs of completion and variable selling expenses.
entities, towards financial institutions, and the duration is normally below six months.
Trade receivables are derecognised when settled or when transferred to a third party and the group has no further risk related to the receivables. Bills receivables are derecognised when they are settled on due date or when the risk and reward are transferred to a third party. Transferral to a third party can be done by discounting a bill receivable before due date or by endorsing the bill receivable, meaning that it is accepted by the supplier as payment for goods or services received.
Elkem calculates the expected credit losses (ECL) for trade receivables in accordance with the simplified approach. All expected cash flows, including cash flows from credit insurance contracts where such contracts are deemed to be an integral part of the transactions, into consideration. The assessment is based on
become raw materials or semi-finished goods for another group entity. The classification of goods in the group's statement of financial position is based on the separate entity's classification.
Judgement and estimatesThe assessment of net realisable value for the inventory is based on estimated market prices in the period the inventory is expected to be sold. The actual market price will differ from the estimates used.
20. Inventories
21. Trade receivables
This year's change in provision for impairment of inventory, a loss of NOK 87 million (gain of NOK 3
million), is recognised as a part of raw materials and energy for production.
206 207Annual report 2021
Elkem history Highlights Letter from the CEO The business The Elkem share Board of directors’ report Board and management Corporate governance Risk managment ESG report Financial statements ESG assurance Contact
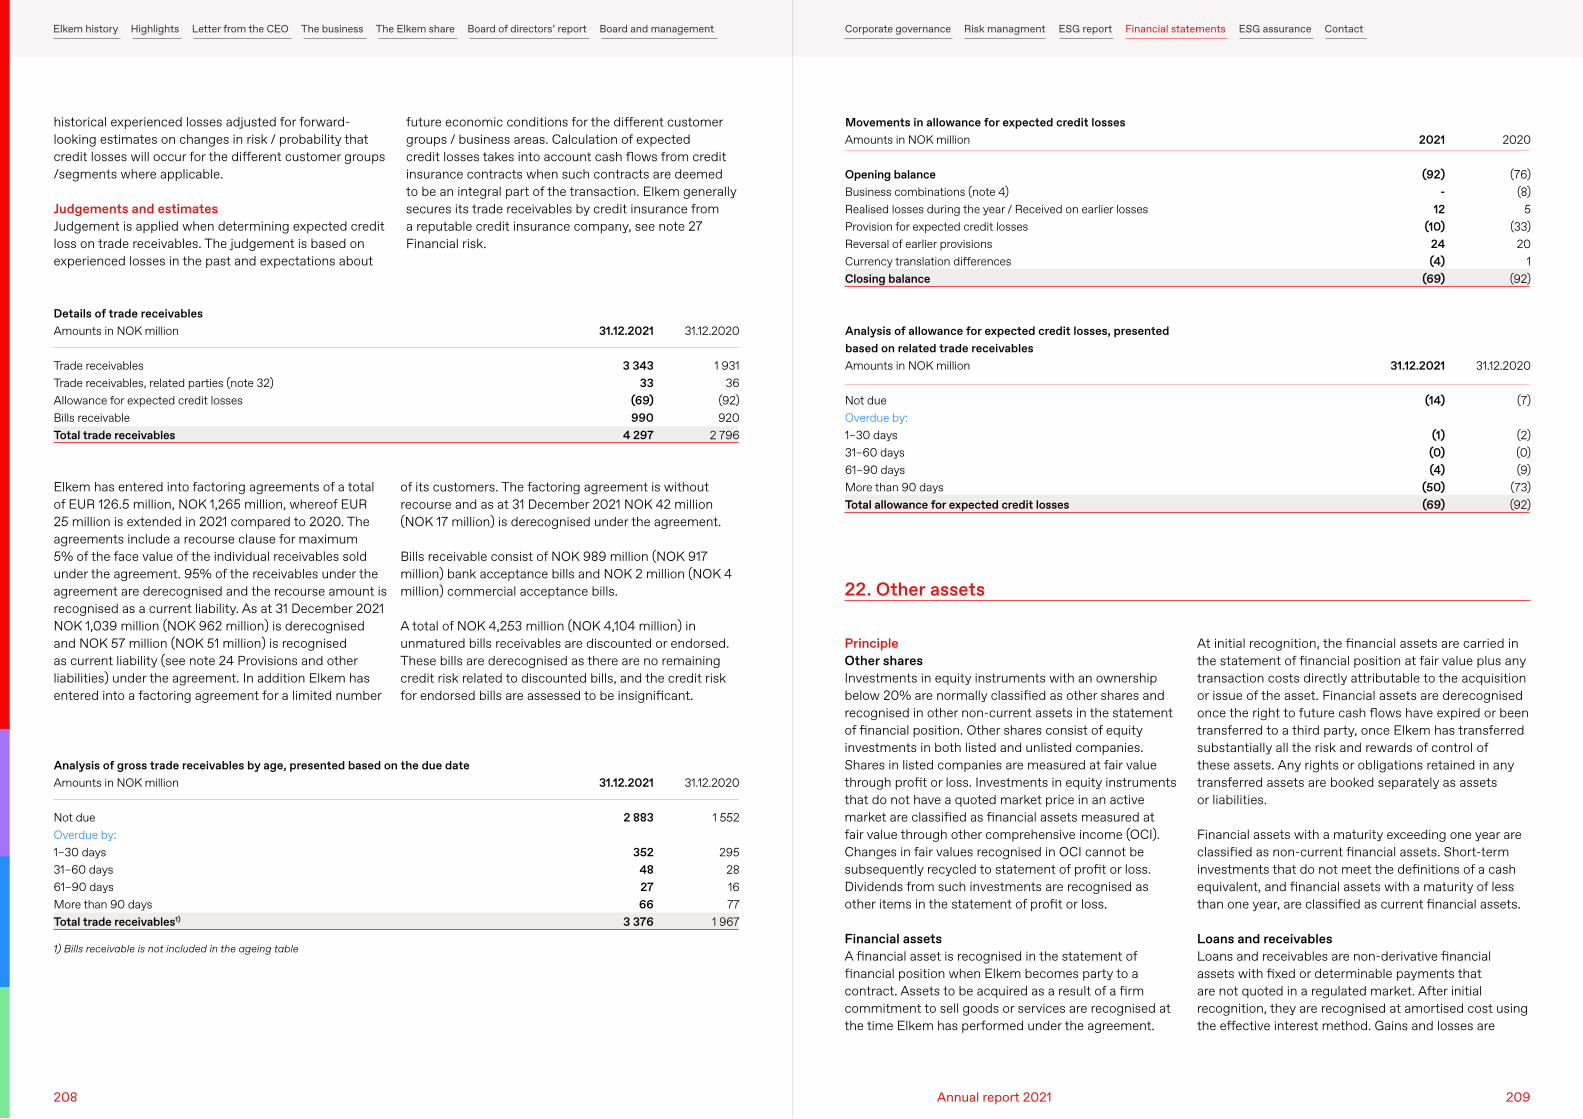
historical experienced losses adjusted for forward-looking estimates on changes in risk / probability that credit losses will occur for the different customer groups /segments where applicable.
Judgements and estimatesJudgement is applied when determining expected credit loss on trade receivables. The judgement is based on experienced losses in the past and expectations about
Elkem has entered into factoring agreements of a total of EUR 126.5 million, NOK 1,265 million, whereof EUR 25 million is extended in 2021 compared to 2020. The agreements include a recourse clause for maximum 5% of the face value of the individual receivables sold under the agreement. 95% of the receivables under the agreement are derecognised and the recourse amount is recognised as a current liability. As at 31 December 2021 NOK 1,039 million (NOK 962 million) is derecognised and NOK 57 million (NOK 51 million) is recognised as current liability (see note 24 Provisions and other liabilities) under the agreement. In addition Elkem has entered into a factoring agreement for a limited number
future economic conditions for the different customer groups / business areas. Calculation of expected credit losses takes into account cash flows from credit insurance contracts when such contracts are deemed to be an integral part of the transaction. Elkem generally secures its trade receivables by credit insurance from a reputable credit insurance company, see note 27 Financial risk.
of its customers. The factoring agreement is without recourse and as at 31 December 2021 NOK 42 million (NOK 17 million) is derecognised under the agreement.
Bills receivable consist of NOK 989 million (NOK 917 million) bank acceptance bills and NOK 2 million (NOK 4 million) commercial acceptance bills.
A total of NOK 4,253 million (NOK 4,104 million) in unmatured bills receivables are discounted or endorsed. These bills are derecognised as there are no remaining credit risk related to discounted bills, and the credit risk for endorsed bills are assessed to be insignificant.
Amounts in NOK million
Trade receivablesTrade receivables, related parties (note 32)Allowance for expected credit lossesBills receivableTotal trade receivables
Amounts in NOK million
Not dueOverdue by:1–30 days31–60 days61–90 daysMore than 90 daysTotal trade receivables1)
Amounts in NOK million
Opening balanceBusiness combinations (note 4)Realised losses during the year / Received on earlier lossesProvision for expected credit lossesReversal of earlier provisionsCurrency translation differencesClosing balance
Amounts in NOK million
Not dueOverdue by:1–30 days31–60 days61–90 daysMore than 90 daysTotal allowance for expected credit losses
Details of trade receivables
Analysis of gross trade receivables by age, presented based on the due date
Movements in allowance for expected credit losses
Analysis of allowance for expected credit losses, presented based on related trade receivables
31.12.2021
3 343 33
(69) 990
4 297
31.12.2021
2 883
352 48 27 66
3 376
2021
(92) -
12 (10)
24 (4)
(69)
31.12.2021
(14)
(1) (0) (4)
(50) (69)
31.12.2020
1 931 36
(92) 920
2 796
31.12.2020
1 552
295 28 16 77
1 967
2020
(76) (8)
5 (33)
20 1
(92)
31.12.2020
(7)
(2) (0) (9)
(73) (92)
1) Bills receivable is not included in the ageing table
PrincipleOther sharesInvestments in equity instruments with an ownership below 20% are normally classified as other shares and recognised in other non-current assets in the statement of financial position. Other shares consist of equity investments in both listed and unlisted companies. Shares in listed companies are measured at fair value through profit or loss. Investments in equity instruments that do not have a quoted market price in an active market are classified as financial assets measured at fair value through other comprehensive income (OCI). Changes in fair values recognised in OCI cannot be subsequently recycled to statement of profit or loss. Dividends from such investments are recognised as other items in the statement of profit or loss.
Financial assetsA financial asset is recognised in the statement of financial position when Elkem becomes party to a contract. Assets to be acquired as a result of a firm commitment to sell goods or services are recognised at the time Elkem has performed under the agreement.
At initial recognition, the financial assets are carried in the statement of financial position at fair value plus any transaction costs directly attributable to the acquisition or issue of the asset. Financial assets are derecognised once the right to future cash flows have expired or been transferred to a third party, once Elkem has transferred substantially all the risk and rewards of control of these assets. Any rights or obligations retained in any transferred assets are booked separately as assets or liabilities.
Financial assets with a maturity exceeding one year are classified as non-current financial assets. Short-term investments that do not meet the definitions of a cash equivalent, and financial assets with a maturity of less than one year, are classified as current financial assets.
Loans and receivablesLoans and receivables are non-derivative financial assets with fixed or determinable payments that are not quoted in a regulated market. After initial recognition, they are recognised at amortised cost using the effective interest method. Gains and losses are
22. Other assets
208 209Annual report 2021
Elkem history Highlights Letter from the CEO The business The Elkem share Board of directors’ report Board and management Corporate governance Risk managment ESG report Financial statements ESG assurance Contact
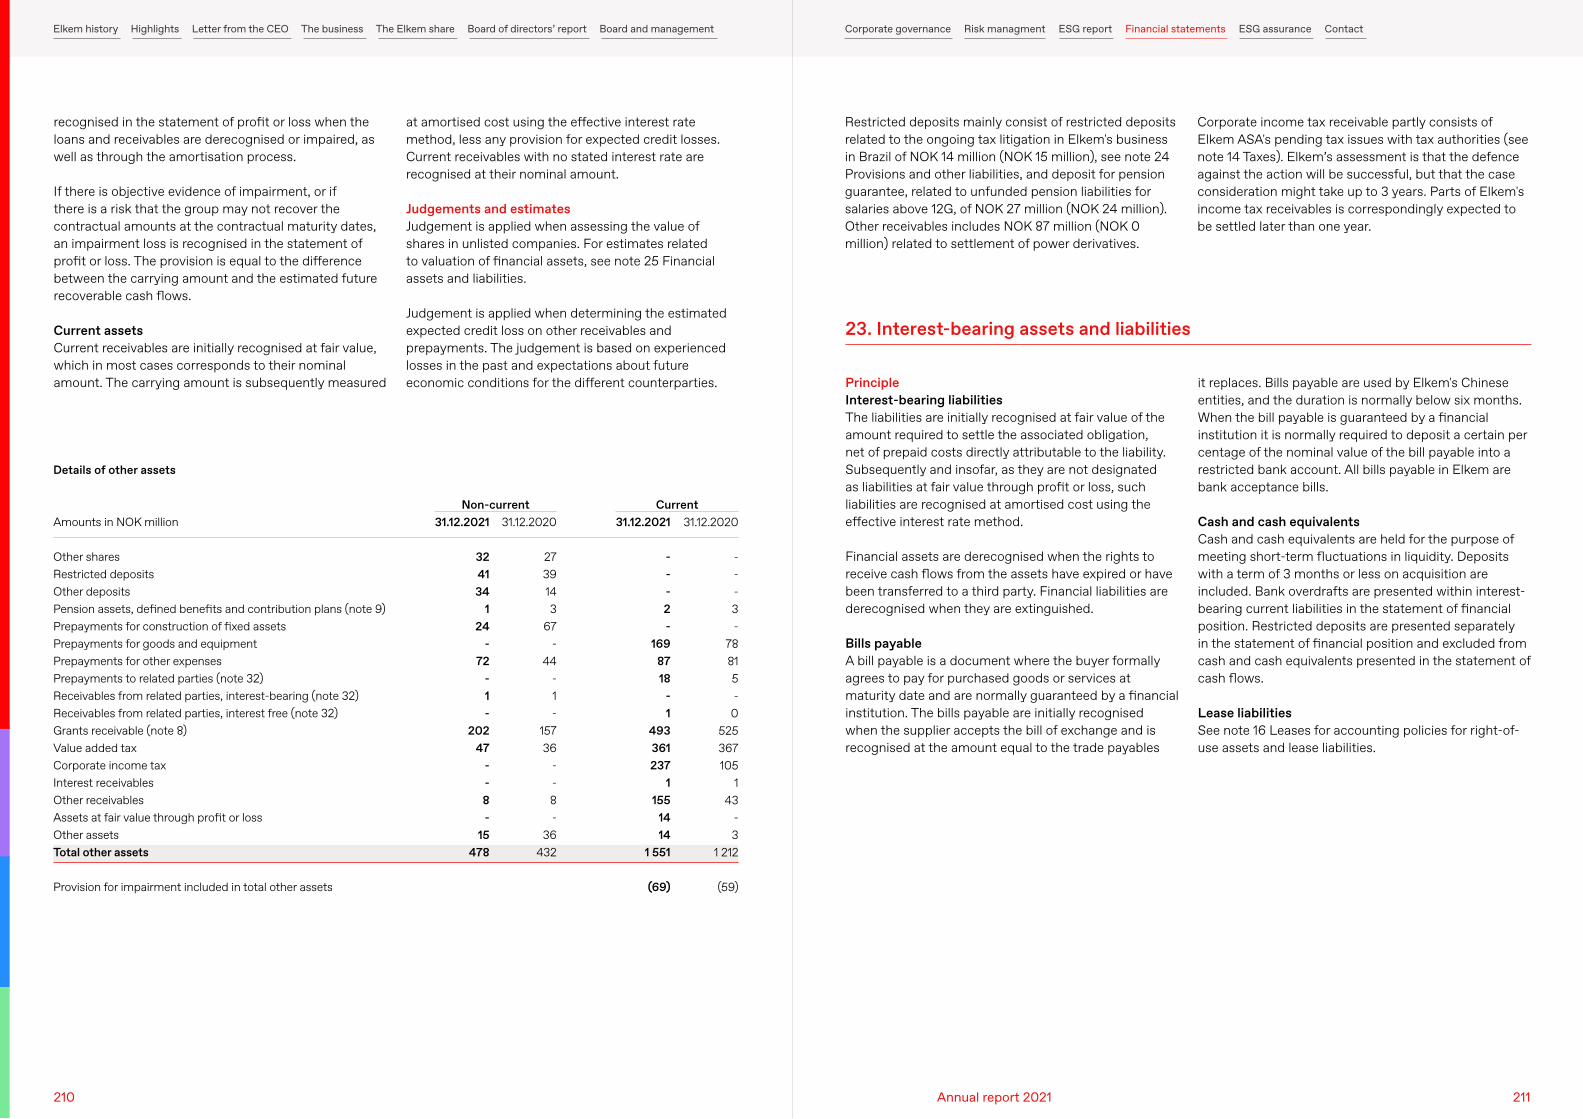
recognised in the statement of profit or loss when the loans and receivables are derecognised or impaired, as well as through the amortisation process.
If there is objective evidence of impairment, or if there is a risk that the group may not recover the contractual amounts at the contractual maturity dates, an impairment loss is recognised in the statement of profit or loss. The provision is equal to the difference between the carrying amount and the estimated future recoverable cash flows.
Current assetsCurrent receivables are initially recognised at fair value, which in most cases corresponds to their nominal amount. The carrying amount is subsequently measured
Restricted deposits mainly consist of restricted deposits related to the ongoing tax litigation in Elkem's business in Brazil of NOK 14 million (NOK 15 million), see note 24 Provisions and other liabilities, and deposit for pension guarantee, related to unfunded pension liabilities for salaries above 12G, of NOK 27 million (NOK 24 million). Other receivables includes NOK 87 million (NOK 0 million) related to settlement of power derivatives.
at amortised cost using the effective interest rate method, less any provision for expected credit losses. Current receivables with no stated interest rate are recognised at their nominal amount.
Judgements and estimatesJudgement is applied when assessing the value of shares in unlisted companies. For estimates related to valuation of financial assets, see note 25 Financial assets and liabilities.
Judgement is applied when determining the estimated expected credit loss on other receivables and prepayments. The judgement is based on experienced losses in the past and expectations about future economic conditions for the different counterparties.
Corporate income tax receivable partly consists of Elkem ASA's pending tax issues with tax authorities (see note 14 Taxes). Elkem’s assessment is that the defence against the action will be successful, but that the case consideration might take up to 3 years. Parts of Elkem's income tax receivables is correspondingly expected to be settled later than one year.
Amounts in NOK million
Other sharesRestricted depositsOther depositsPension assets, defined benefits and contribution plans (note 9)Prepayments for construction of fixed assetsPrepayments for goods and equipmentPrepayments for other expensesPrepayments to related parties (note 32)Receivables from related parties, interest-bearing (note 32)Receivables from related parties, interest free (note 32)Grants receivable (note 8)Value added taxCorporate income taxInterest receivablesOther receivablesAssets at fair value through profit or lossOther assetsTotal other assets
Provision for impairment included in total other assets
Details of other assets
CurrentNon-current31.12.2021
- - - 2 -
169 87 18
- 1
493 361 237
1 155
14 14
1 551
(69)
31.12.2020
27 39 14 3
67 -
44 - 1 -
157 36
- - 8 -
36 432
31.12.2021
32 41 34
1 24
- 72
- 1 -
202 47
- - 8 -
15 478
31.12.2020
- - - 3 -
78 81 5 -
0 525 367 105
1 43
- 3
1 212
(59)
PrincipleInterest-bearing liabilitiesThe liabilities are initially recognised at fair value of the amount required to settle the associated obligation, net of prepaid costs directly attributable to the liability. Subsequently and insofar, as they are not designated as liabilities at fair value through profit or loss, such liabilities are recognised at amortised cost using the effective interest rate method.
Financial assets are derecognised when the rights to receive cash flows from the assets have expired or have been transferred to a third party. Financial liabilities are derecognised when they are extinguished.
Bills payableA bill payable is a document where the buyer formally agrees to pay for purchased goods or services at maturity date and are normally guaranteed by a financial institution. The bills payable are initially recognised when the supplier accepts the bill of exchange and is recognised at the amount equal to the trade payables
it replaces. Bills payable are used by Elkem's Chinese entities, and the duration is normally below six months. When the bill payable is guaranteed by a financial institution it is normally required to deposit a certain per centage of the nominal value of the bill payable into a restricted bank account. All bills payable in Elkem are bank acceptance bills.
Cash and cash equivalentsCash and cash equivalents are held for the purpose of meeting short-term fluctuations in liquidity. Deposits with a term of 3 months or less on acquisition are included. Bank overdrafts are presented within interest-bearing current liabilities in the statement of financial position. Restricted deposits are presented separately in the statement of financial position and excluded from cash and cash equivalents presented in the statement of cash flows.
Lease liabilitiesSee note 16 Leases for accounting policies for right-of-use assets and lease liabilities.
23. Interest-bearing assets and liabilities
210 211Annual report 2021
Elkem history Highlights Letter from the CEO The business The Elkem share Board of directors’ report Board and management Corporate governance Risk managment ESG report Financial statements ESG assurance Contact
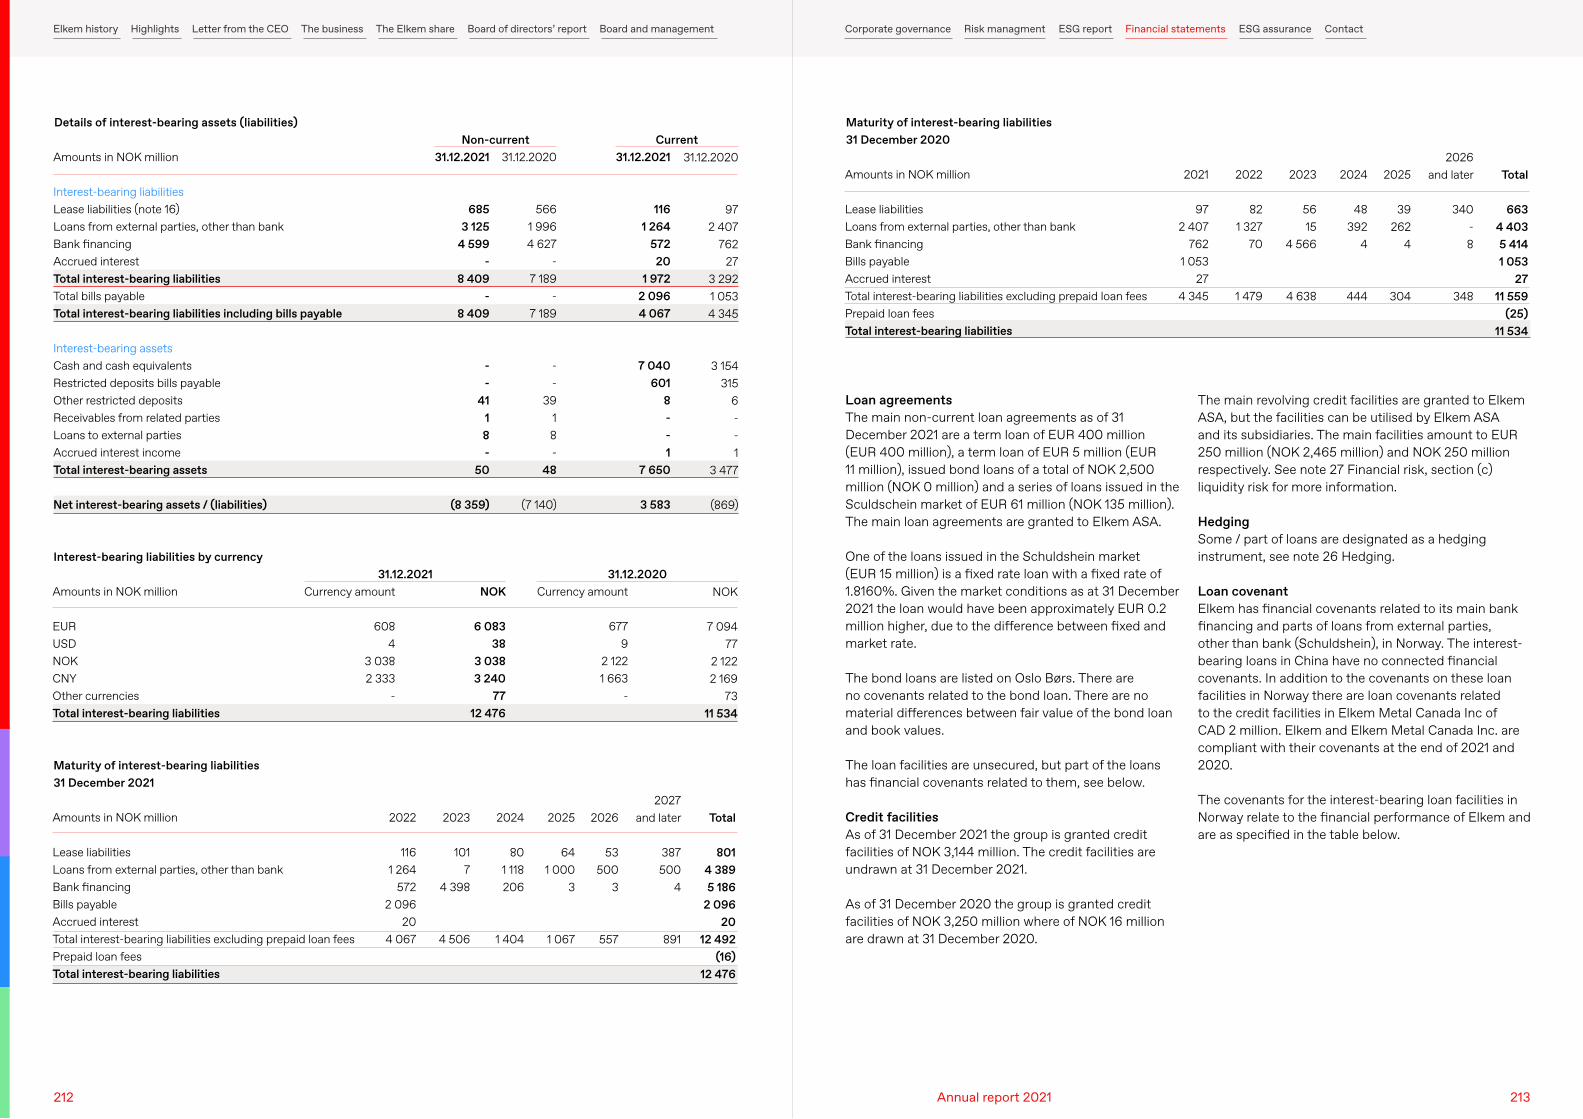
Amounts in NOK million
Interest-bearing liabilitiesLease liabilities (note 16)Loans from external parties, other than bankBank financing Accrued interestTotal interest-bearing liabilitiesTotal bills payableTotal interest-bearing liabilities including bills payable
Interest-bearing assetsCash and cash equivalentsRestricted deposits bills payableOther restricted depositsReceivables from related partiesLoans to external partiesAccrued interest incomeTotal interest-bearing assets
Net interest-bearing assets / (liabilities)
Amounts in NOK million
EURUSDNOKCNYOther currenciesTotal interest-bearing liabilities
Amounts in NOK million
Lease liabilitiesLoans from external parties, other than bankBank financingBills payableAccrued interestTotal interest-bearing liabilities excluding prepaid loan feesPrepaid loan feesTotal interest-bearing liabilities
Amounts in NOK million
Lease liabilitiesLoans from external parties, other than bankBank financingBills payableAccrued interestTotal interest-bearing liabilities excluding prepaid loan feesPrepaid loan feesTotal interest-bearing liabilities
Details of interest-bearing assets (liabilities)
Interest-bearing liabilities by currency
Maturity of interest-bearing liabilities 31 December 2021
Maturity of interest-bearing liabilities 31 December 2020Current
31.12.2020
Non-current
31.12.2021
31.12.2021
116 1 264
572 20
1 972 2 096 4 067
7 040 601
8 - - 1
7 650
3 583
Currency amount
677 9
2 122 1 663
-
31.12.2020
566 1 996 4 627
- 7 189
- 7 189
- -
39 1 8 -
48
(7 140)
NOK
6 083 38
3 038 3 240
77 12 476
31.12.2021
685 3 125
4 599 -
8 409 -
8 409
- -
41 1 8 -
50
(8 359)
Currency amount
608 4
3 038 2 333
-
2022
116 1 264
572 2 096
20 4 067
2021
97 2 407
762 1 053
27 4 345
2023
101 7
4 398
4 506
2022
82 1 327
70
1 479
2024
80 1 118 206
1 404
2023
56 15
4 566
4 638
2025
64 1 000
3
1 067
2024
48 392
4
444
2026
53 500
3
557
2025
39 262
4
304
2027 and later
387 500
4
891
2026 and later
340 - 8
348
Total
801 4 389 5 186
2 096 20
12 492 (16)
12 476
Total
663 4 403 5 414 1 053
27 11 559
(25) 11 534
31.12.2020
97 2 407
762 27
3 292 1 053 4 345
3 154 315
6 - - 1
3 477
(869)
NOK
7 094 77
2 122 2 169
73 11 534
Loan agreementsThe main non-current loan agreements as of 31 December 2021 are a term loan of EUR 400 million (EUR 400 million), a term loan of EUR 5 million (EUR 11 million), issued bond loans of a total of NOK 2,500 million (NOK 0 million) and a series of loans issued in the Sculdschein market of EUR 61 million (NOK 135 million). The main loan agreements are granted to Elkem ASA.
One of the loans issued in the Schuldshein market (EUR 15 million) is a fixed rate loan with a fixed rate of 1.8160%. Given the market conditions as at 31 December 2021 the loan would have been approximately EUR 0.2 million higher, due to the difference between fixed and market rate.
The bond loans are listed on Oslo Børs. There are no covenants related to the bond loan. There are no material differences between fair value of the bond loan and book values.
The loan facilities are unsecured, but part of the loans has financial covenants related to them, see below.
Credit facilitiesAs of 31 December 2021 the group is granted credit facilities of NOK 3,144 million. The credit facilities are undrawn at 31 December 2021.
As of 31 December 2020 the group is granted credit facilities of NOK 3,250 million where of NOK 16 million are drawn at 31 December 2020.
The main revolving credit facilities are granted to Elkem ASA, but the facilities can be utilised by Elkem ASA and its subsidiaries. The main facilities amount to EUR 250 million (NOK 2,465 million) and NOK 250 million respectively. See note 27 Financial risk, section (c) liquidity risk for more information.
HedgingSome / part of loans are designated as a hedging instrument, see note 26 Hedging.
Loan covenantElkem has financial covenants related to its main bank financing and parts of loans from external parties, other than bank (Schuldshein), in Norway. The interest-bearing loans in China have no connected financial covenants. In addition to the covenants on these loan facilities in Norway there are loan covenants related to the credit facilities in Elkem Metal Canada Inc of CAD 2 million. Elkem and Elkem Metal Canada Inc. are compliant with their covenants at the end of 2021 and 2020.
The covenants for the interest-bearing loan facilities in Norway relate to the financial performance of Elkem and are as specified in the table below.
212 213Annual report 2021
Elkem history Highlights Letter from the CEO The business The Elkem share Board of directors’ report Board and management Corporate governance Risk managment ESG report Financial statements ESG assurance Contact
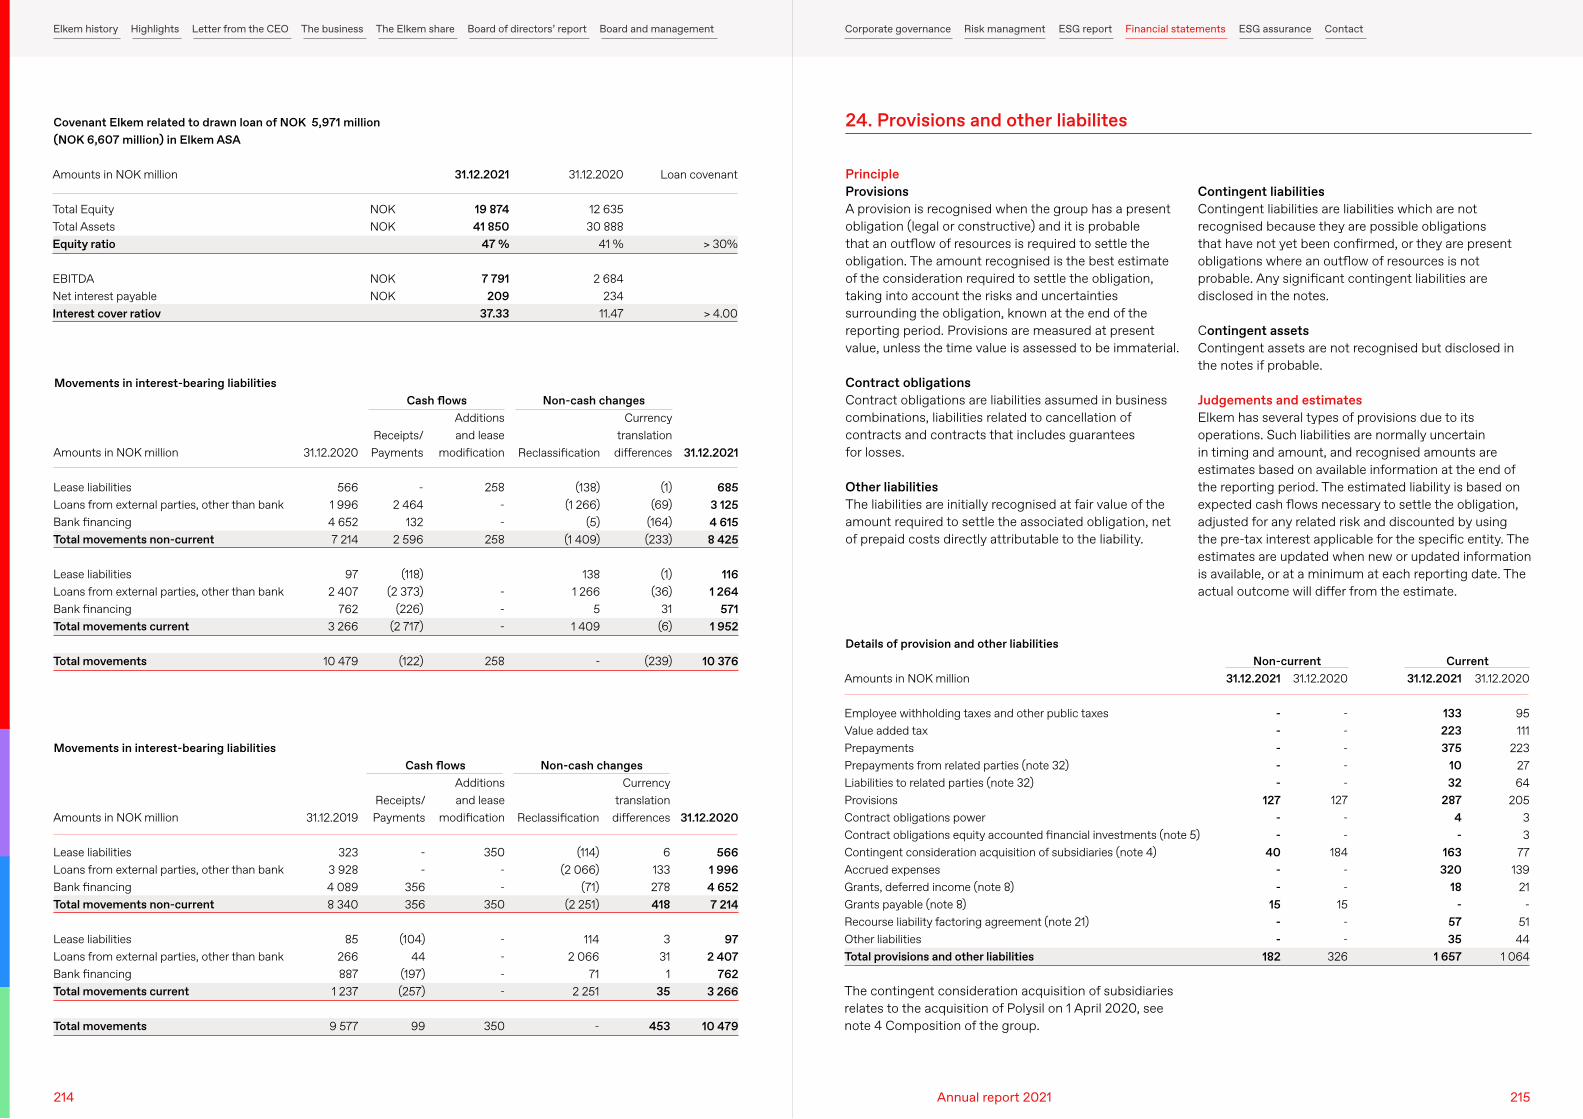
Amounts in NOK million
Total EquityTotal AssetsEquity ratio
EBITDANet interest payableInterest cover ratiov
Covenant Elkem related to drawn loan of NOK 5,971 million (NOK 6,607 million) in Elkem ASA
31.12.2020
12 635 30 888
41 %
2 684 234
11.47
31.12.2021
19 874 41 850
47 %
7 791 209
37.33
NOKNOK
NOKNOK
Loan covenant
> 30%
> 4.00
Amounts in NOK million
Lease liabilitiesLoans from external parties, other than bankBank financingTotal movements non-current
Lease liabilitiesLoans from external parties, other than bankBank financingTotal movements current
Total movements
Amounts in NOK million
Lease liabilitiesLoans from external parties, other than bankBank financingTotal movements non-current
Lease liabilitiesLoans from external parties, other than bankBank financingTotal movements current
Total movements
Movements in interest-bearing liabilities
Movements in interest-bearing liabilities
Non-cash changes
Non-cash changes
Cash flows
Cash flows
Additions and lease
modification
258 - -
258
- - -
258
Additions and lease
modification
350 - -
350
- - - -
350
Currency translation
differences
(1) (69)
(164) (233)
(1) (36)
31 (6)
(239)
Currency translation
differences
6 133 278 418
3 31
1 35
453
Receipts/ Payments
- 2 464
132 2 596
(118) (2 373)
(226) (2 717)
(122)
Receipts/ Payments
- -
356 356
(104) 44
(197) (257)
99
31.12.2020
566 1 996 4 652 7 214
97 2 407
762 3 266
10 479
31.12.2019
323 3 928 4 089 8 340
85 266 887
1 237
9 577
Reclassification
(138) (1 266)
(5) (1 409)
138 1 266
5 1 409
-
Reclassification
(114) (2 066)
(71) (2 251)
114 2 066
71 2 251
-
31.12.2021
685 3 125 4 615 8 425
116 1 264
571 1 952
10 376
31.12.2020
566 1 996 4 652 7 214
97 2 407
762 3 266
10 479
PrincipleProvisionsA provision is recognised when the group has a present obligation (legal or constructive) and it is probable that an outflow of resources is required to settle the obligation. The amount recognised is the best estimate of the consideration required to settle the obligation, taking into account the risks and uncertainties surrounding the obligation, known at the end of the reporting period. Provisions are measured at present value, unless the time value is assessed to be immaterial.
Contract obligationsContract obligations are liabilities assumed in business combinations, liabilities related to cancellation of contracts and contracts that includes guarantees for losses.
Other liabilitiesThe liabilities are initially recognised at fair value of the amount required to settle the associated obligation, net of prepaid costs directly attributable to the liability.
Contingent liabilitiesContingent liabilities are liabilities which are not recognised because they are possible obligations that have not yet been confirmed, or they are present obligations where an outflow of resources is not probable. Any significant contingent liabilities are disclosed in the notes.
Contingent assetsContingent assets are not recognised but disclosed in the notes if probable.
Judgements and estimatesElkem has several types of provisions due to its operations. Such liabilities are normally uncertain in timing and amount, and recognised amounts are estimates based on available information at the end of the reporting period. The estimated liability is based on expected cash flows necessary to settle the obligation, adjusted for any related risk and discounted by using the pre-tax interest applicable for the specific entity. The estimates are updated when new or updated information is available, or at a minimum at each reporting date. The actual outcome will differ from the estimate.
24. Provisions and other liabilites
Amounts in NOK million
Employee withholding taxes and other public taxesValue added taxPrepaymentsPrepayments from related parties (note 32)Liabilities to related parties (note 32)ProvisionsContract obligations powerContract obligations equity accounted financial investments (note 5)Contingent consideration acquisition of subsidiaries (note 4)Accrued expensesGrants, deferred income (note 8)Grants payable (note 8)Recourse liability factoring agreement (note 21)Other liabilitiesTotal provisions and other liabilities
Details of provision and other liabilitiesCurrentNon-current
31.12.2021
133223375
1032
2874-
163320
18-
5735
1 657
31.12.2020
-----
127--
184--
15--
326
31.12.2021
-----
127--
40--
15--
182
31.12.2020
95111
2232764
20533
77139
21-
5144
1 064
The contingent consideration acquisition of subsidiaries relates to the acquisition of Polysil on 1 April 2020, see note 4 Composition of the group.
214 215Annual report 2021
Elkem history Highlights Letter from the CEO The business The Elkem share Board of directors’ report Board and management Corporate governance Risk managment ESG report Financial statements ESG assurance Contact
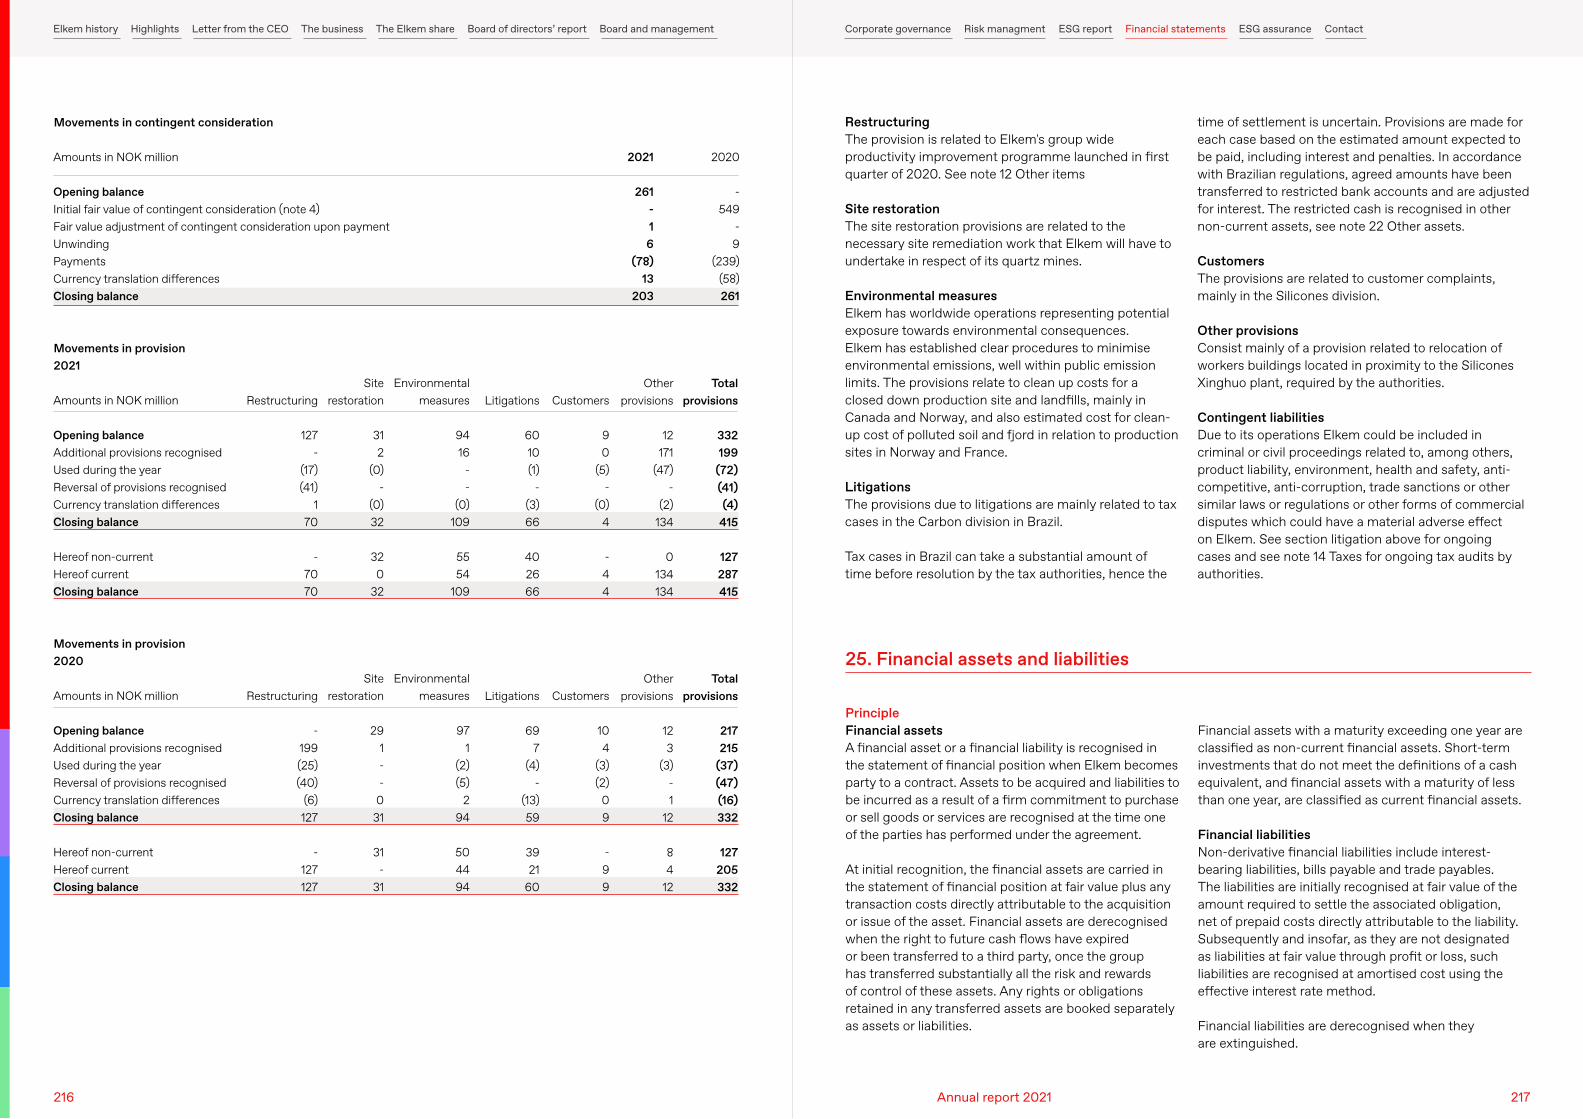
Amounts in NOK million
Opening balanceInitial fair value of contingent consideration (note 4)Fair value adjustment of contingent consideration upon paymentUnwinding PaymentsCurrency translation differencesClosing balance
Movements in contingent consideration
2021
261 - 1 6
(78) 13
203
2020
- 549
- 9
(239) (58)261
Amounts in NOK million
Opening balanceAdditional provisions recognisedUsed during the yearReversal of provisions recognisedCurrency translation differencesClosing balance
Hereof non-currentHereof current Closing balance
Amounts in NOK million
Opening balanceAdditional provisions recognisedUsed during the yearReversal of provisions recognisedCurrency translation differencesClosing balance
Hereof non-currentHereof current Closing balance
Movements in provision2021
Movements in provision2020
Environmental measures
94 16
- -
(0) 109
55 54
109
Environmental measures
97 1
(2) (5)
2 94
50 44 94
Customers
9 0
(5) -
(0) 4
- 4 4
Customers
10 4
(3) (2)
0 9
- 9 9
Site restoration
31 2
(0) -
(0) 32
32 0
32
Site restoration
29 1 - -
0 31
31 -
31
Restructuring
127 -
(17) (41)
1 70
- 70 70
Restructuring
- 199 (25) (40)
(6) 127
- 127 127
Litigations
60 10 (1)
- (3) 66
40 26 66
Litigations
69 7
(4) -
(13) 59
39 21
60
Other provisions
12 171
(47) -
(2) 134
0 134 134
Other provisions
12 3
(3) - 1
12
8 4
12
Total provisions
332 199
(72) (41) (4)
415
127 287 415
Total provisions
217 215
(37) (47) (16) 332
127 205 332
RestructuringThe provision is related to Elkem's group wide productivity improvement programme launched in first quarter of 2020. See note 12 Other items
Site restorationThe site restoration provisions are related to the necessary site remediation work that Elkem will have to undertake in respect of its quartz mines.
Environmental measuresElkem has worldwide operations representing potential exposure towards environmental consequences. Elkem has established clear procedures to minimise environmental emissions, well within public emission limits. The provisions relate to clean up costs for a closed down production site and landfills, mainly in Canada and Norway, and also estimated cost for clean-up cost of polluted soil and fjord in relation to production sites in Norway and France.
LitigationsThe provisions due to litigations are mainly related to tax cases in the Carbon division in Brazil.
Tax cases in Brazil can take a substantial amount of time before resolution by the tax authorities, hence the
time of settlement is uncertain. Provisions are made for each case based on the estimated amount expected to be paid, including interest and penalties. In accordance with Brazilian regulations, agreed amounts have been transferred to restricted bank accounts and are adjusted for interest. The restricted cash is recognised in other non-current assets, see note 22 Other assets.
CustomersThe provisions are related to customer complaints, mainly in the Silicones division.
Other provisionsConsist mainly of a provision related to relocation of workers buildings located in proximity to the Silicones Xinghuo plant, required by the authorities.
Contingent liabilitiesDue to its operations Elkem could be included in criminal or civil proceedings related to, among others, product liability, environment, health and safety, anti-competitive, anti-corruption, trade sanctions or other similar laws or regulations or other forms of commercial disputes which could have a material adverse effect on Elkem. See section litigation above for ongoing cases and see note 14 Taxes for ongoing tax audits by authorities.
PrincipleFinancial assetsA financial asset or a financial liability is recognised in the statement of financial position when Elkem becomes party to a contract. Assets to be acquired and liabilities to be incurred as a result of a firm commitment to purchase or sell goods or services are recognised at the time one of the parties has performed under the agreement.
At initial recognition, the financial assets are carried in the statement of financial position at fair value plus any transaction costs directly attributable to the acquisition or issue of the asset. Financial assets are derecognised when the right to future cash flows have expired or been transferred to a third party, once the group has transferred substantially all the risk and rewards of control of these assets. Any rights or obligations retained in any transferred assets are booked separately as assets or liabilities.
Financial assets with a maturity exceeding one year are classified as non-current financial assets. Short-term investments that do not meet the definitions of a cash equivalent, and financial assets with a maturity of less than one year, are classified as current financial assets.
Financial liabilitiesNon-derivative financial liabilities include interest-bearing liabilities, bills payable and trade payables. The liabilities are initially recognised at fair value of the amount required to settle the associated obligation, net of prepaid costs directly attributable to the liability. Subsequently and insofar, as they are not designated as liabilities at fair value through profit or loss, such liabilities are recognised at amortised cost using the effective interest rate method.
Financial liabilities are derecognised when they are extinguished.
25. Financial assets and liabilities
216 217Annual report 2021
Elkem history Highlights Letter from the CEO The business The Elkem share Board of directors’ report Board and management Corporate governance Risk managment ESG report Financial statements ESG assurance Contact
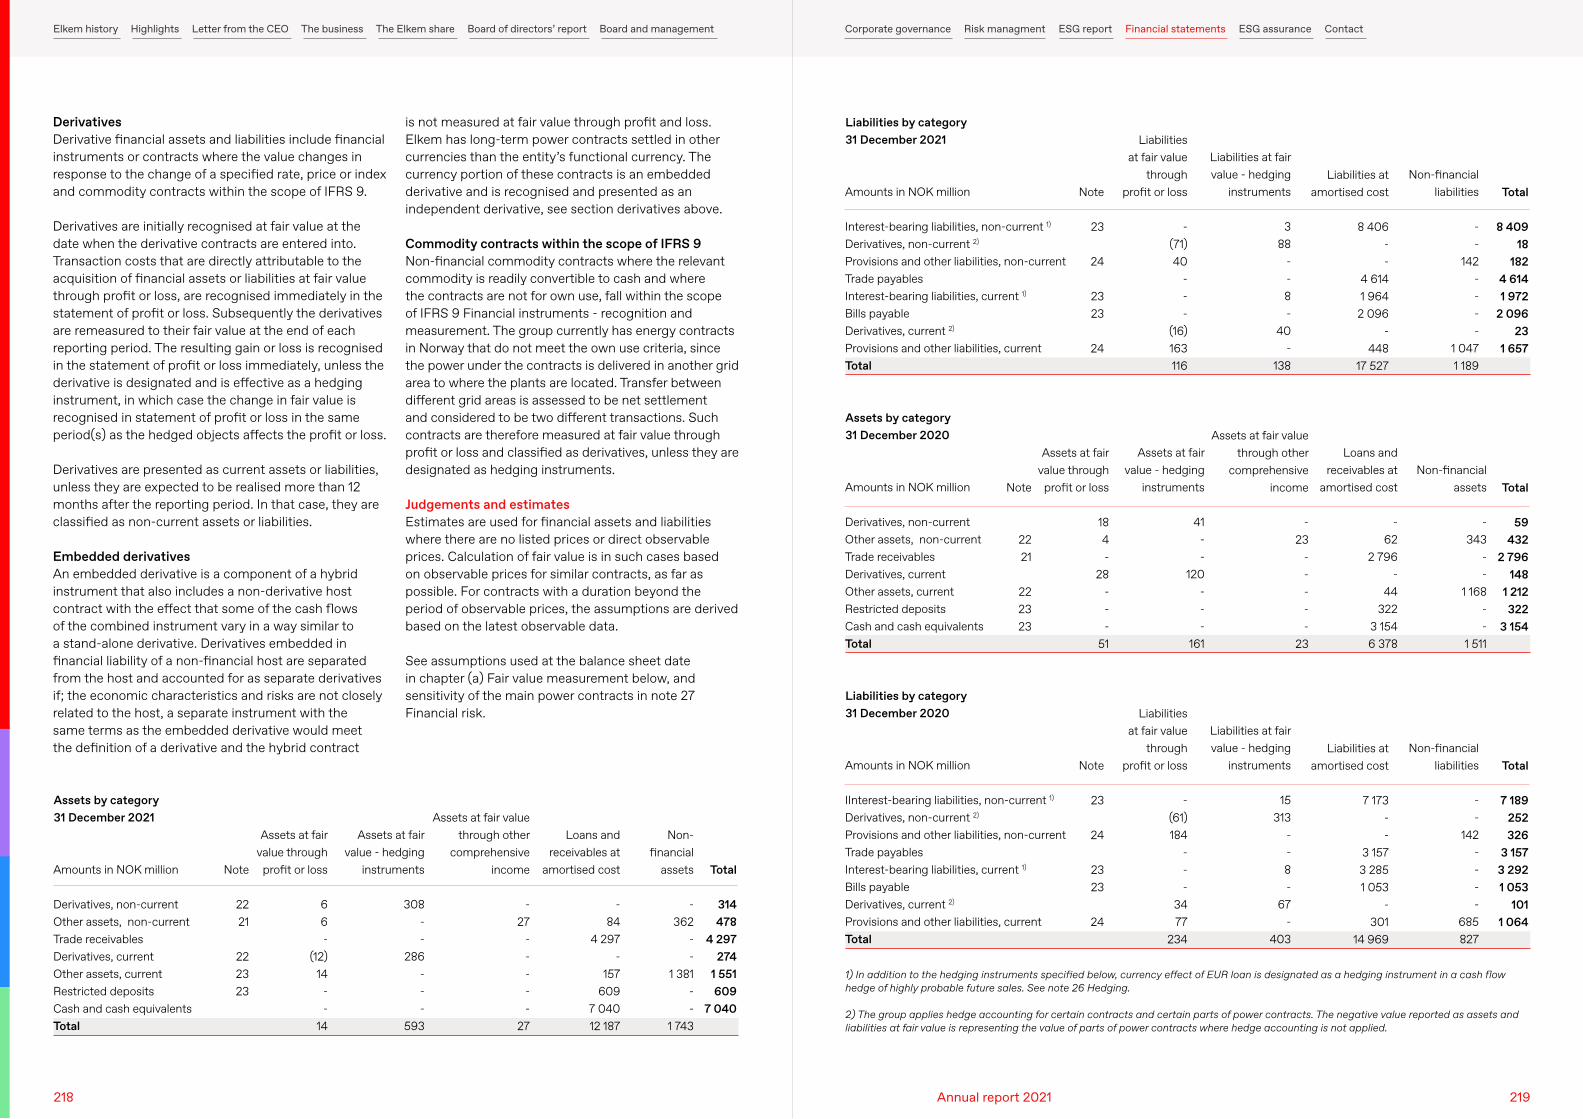
DerivativesDerivative financial assets and liabilities include financial instruments or contracts where the value changes in response to the change of a specified rate, price or index and commodity contracts within the scope of IFRS 9.
Derivatives are initially recognised at fair value at the date when the derivative contracts are entered into. Transaction costs that are directly attributable to the acquisition of financial assets or liabilities at fair value through profit or loss, are recognised immediately in the statement of profit or loss. Subsequently the derivatives are remeasured to their fair value at the end of each reporting period. The resulting gain or loss is recognised in the statement of profit or loss immediately, unless the derivative is designated and is effective as a hedging instrument, in which case the change in fair value is recognised in statement of profit or loss in the same period(s) as the hedged objects affects the profit or loss.
Derivatives are presented as current assets or liabilities, unless they are expected to be realised more than 12 months after the reporting period. In that case, they are classified as non-current assets or liabilities.
Embedded derivativesAn embedded derivative is a component of a hybrid instrument that also includes a non-derivative host contract with the effect that some of the cash flows of the combined instrument vary in a way similar to a stand-alone derivative. Derivatives embedded in financial liability of a non-financial host are separated from the host and accounted for as separate derivatives if; the economic characteristics and risks are not closely related to the host, a separate instrument with the same terms as the embedded derivative would meet the definition of a derivative and the hybrid contract
is not measured at fair value through profit and loss. Elkem has long-term power contracts settled in other currencies than the entity’s functional currency. The currency portion of these contracts is an embedded derivative and is recognised and presented as an independent derivative, see section derivatives above.
Commodity contracts within the scope of IFRS 9Non-financial commodity contracts where the relevant commodity is readily convertible to cash and where the contracts are not for own use, fall within the scope of IFRS 9 Financial instruments - recognition and measurement. The group currently has energy contracts in Norway that do not meet the own use criteria, since the power under the contracts is delivered in another grid area to where the plants are located. Transfer between different grid areas is assessed to be net settlement and considered to be two different transactions. Such contracts are therefore measured at fair value through profit or loss and classified as derivatives, unless they are designated as hedging instruments.
Judgements and estimatesEstimates are used for financial assets and liabilities where there are no listed prices or direct observable prices. Calculation of fair value is in such cases based on observable prices for similar contracts, as far as possible. For contracts with a duration beyond the period of observable prices, the assumptions are derived based on the latest observable data.
See assumptions used at the balance sheet date in chapter (a) Fair value measurement below, and sensitivity of the main power contracts in note 27 Financial risk.
Amounts in NOK million
Derivatives, non-currentOther assets, non-currentTrade receivablesDerivatives, currentOther assets, current Restricted depositsCash and cash equivalentsTotal
Assets by category 31 December 2021
Assets at fair value - hedging
instruments
308--
286---
593
Loans and receivables at
amortised cost
-84
4 297-
157609
7 040 12 187
Assets at fair value through
profit or loss
66-
(12)14
--
14
Note
2221
222323
Assets at fair value through other
comprehensive income
-27
-----
27
Non-financial
assets
- 362
--
1 381--
1 743
Total
314478
4 297274
1 551609
7 040
Amounts in NOK million
Interest-bearing liabilities, non-current 1)
Derivatives, non-current 2)
Provisions and other liabilities, non-currentTrade payablesInterest-bearing liabilities, current 1)
Bills payableDerivatives, current 2)
Provisions and other liabilities, currentTotal
Amounts in NOK million
IInterest-bearing liabilities, non-current 1)
Derivatives, non-current 2)
Provisions and other liabilities, non-currentTrade payablesInterest-bearing liabilities, current 1)
Bills payableDerivatives, current 2)
Provisions and other liabilities, currentTotal
Amounts in NOK million
Derivatives, non-currentOther assets, non-currentTrade receivablesDerivatives, currentOther assets, current Restricted depositsCash and cash equivalentsTotal
Liabilities by category 31 December 2021
Liabilities by category 31 December 2020
Assets by category 31 December 2020
Liabilities at fair value - hedging
instruments
388
--8-
40-
138
Liabilities at fair value - hedging
instruments
15313
--8-
67-
403
Assets at fair value - hedging
instruments
41--
120---
161
Non-financial liabilities
--
142----
1 047 1 189
Non-financial liabilities
--
142----
685 827
Loans and receivables at
amortised cost
-62
2 796-
44322
3 154 6 378
Non-financial assets
- 343
--
1 168--
1 511
Liabilities at fair value
through profit or loss
-
(71) 40
- - -
(16)163 116
Liabilities at fair value
through profit or loss
-
(61)184
---
3477
234
Assets at fair value through
profit or loss
184-
28---
51
Note
23
24
2323
24
Note
23
24
2323
24
Note
2221
222323
Liabilities at amortised cost
8 406--
4 6141 964
2 096-
448 17 527
Liabilities at amortised cost
7 173--
3 1573 2851 053
-301
14 969
Assets at fair value through other
comprehensive income
-23
-----
23
Total
8 40918
1824 6141 972
2 09623
1 657
Total
7 189252326
3 1573 2921 053
1011 064
Total
59432
2 796148
1 212322
3 154
1) In addition to the hedging instruments specified below, currency effect of EUR loan is designated as a hedging instrument in a cash flow hedge of highly probable future sales. See note 26 Hedging.
2) The group applies hedge accounting for certain contracts and certain parts of power contracts. The negative value reported as assets and liabilities at fair value is representing the value of parts of power contracts where hedge accounting is not applied.
218 219Annual report 2021
Elkem history Highlights Letter from the CEO The business The Elkem share Board of directors’ report Board and management Corporate governance Risk managment ESG report Financial statements ESG assurance Contact
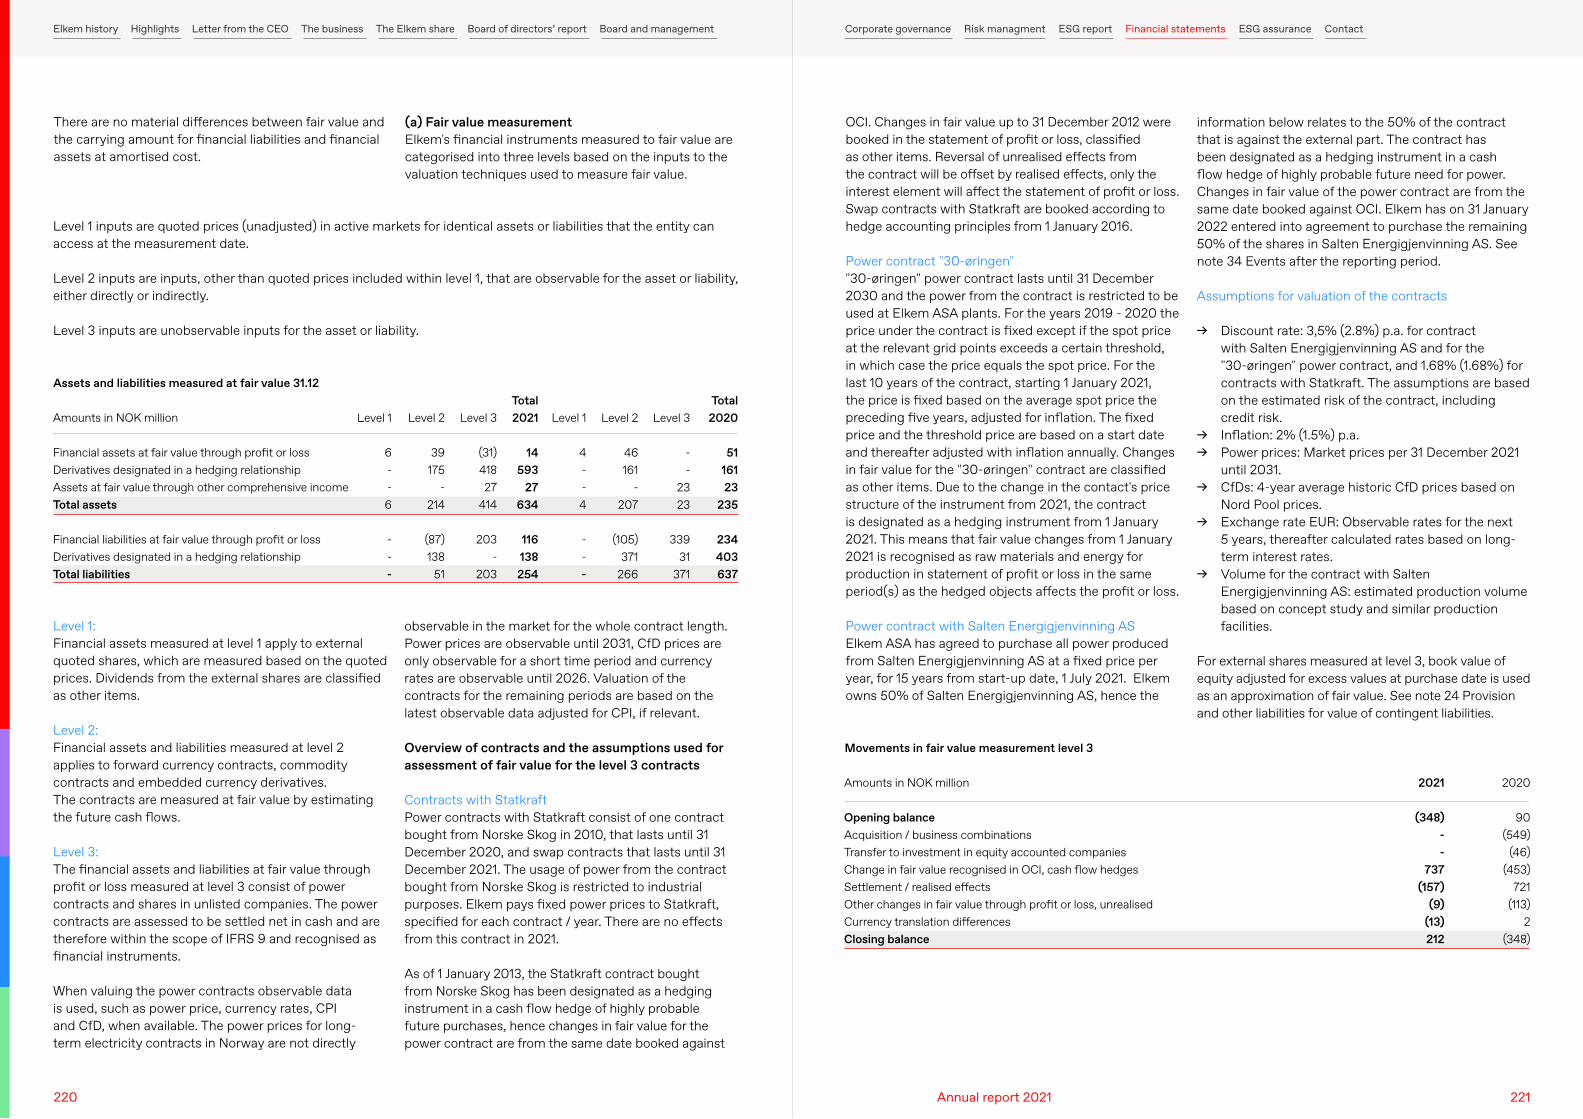
There are no material differences between fair value and the carrying amount for financial liabilities and financial assets at amortised cost.
Level 1 inputs are quoted prices (unadjusted) in active markets for identical assets or liabilities that the entity can access at the measurement date.
Level 2 inputs are inputs, other than quoted prices included within level 1, that are observable for the asset or liability, either directly or indirectly.
Level 3 inputs are unobservable inputs for the asset or liability.
Level 1:Financial assets measured at level 1 apply to external quoted shares, which are measured based on the quoted prices. Dividends from the external shares are classified as other items.
Level 2:Financial assets and liabilities measured at level 2 applies to forward currency contracts, commodity contracts and embedded currency derivatives.The contracts are measured at fair value by estimating the future cash flows.
Level 3:The financial assets and liabilities at fair value through profit or loss measured at level 3 consist of power contracts and shares in unlisted companies. The power contracts are assessed to be settled net in cash and are therefore within the scope of IFRS 9 and recognised as financial instruments.
When valuing the power contracts observable data is used, such as power price, currency rates, CPI and CfD, when available. The power prices for long-term electricity contracts in Norway are not directly
OCI. Changes in fair value up to 31 December 2012 were booked in the statement of profit or loss, classified as other items. Reversal of unrealised effects from the contract will be offset by realised effects, only the interest element will affect the statement of profit or loss. Swap contracts with Statkraft are booked according to hedge accounting principles from 1 January 2016.
Power contract "30-øringen""30-øringen" power contract lasts until 31 December 2030 and the power from the contract is restricted to be used at Elkem ASA plants. For the years 2019 - 2020 the price under the contract is fixed except if the spot price at the relevant grid points exceeds a certain threshold, in which case the price equals the spot price. For the last 10 years of the contract, starting 1 January 2021, the price is fixed based on the average spot price the preceding five years, adjusted for inflation. The fixed price and the threshold price are based on a start date and thereafter adjusted with inflation annually. Changes in fair value for the "30-øringen" contract are classified as other items. Due to the change in the contact's price structure of the instrument from 2021, the contract is designated as a hedging instrument from 1 January 2021. This means that fair value changes from 1 January 2021 is recognised as raw materials and energy for production in statement of profit or loss in the same period(s) as the hedged objects affects the profit or loss.
Power contract with Salten Energigjenvinning ASElkem ASA has agreed to purchase all power produced from Salten Energigjenvinning AS at a fixed price per year, for 15 years from start-up date, 1 July 2021. Elkem owns 50% of Salten Energigjenvinning AS, hence the
(a) Fair value measurementElkem's financial instruments measured to fair value are categorised into three levels based on the inputs to the valuation techniques used to measure fair value.
observable in the market for the whole contract length. Power prices are observable until 2031, CfD prices are only observable for a short time period and currency rates are observable until 2026. Valuation of the contracts for the remaining periods are based on the latest observable data adjusted for CPI, if relevant.
Overview of contracts and the assumptions used for assessment of fair value for the level 3 contracts
Contracts with StatkraftPower contracts with Statkraft consist of one contract bought from Norske Skog in 2010, that lasts until 31 December 2020, and swap contracts that lasts until 31 December 2021. The usage of power from the contract bought from Norske Skog is restricted to industrial purposes. Elkem pays fixed power prices to Statkraft, specified for each contract / year. There are no effects from this contract in 2021.
As of 1 January 2013, the Statkraft contract bought from Norske Skog has been designated as a hedging instrument in a cash flow hedge of highly probable future purchases, hence changes in fair value for the power contract are from the same date booked against
information below relates to the 50% of the contract that is against the external part. The contract has been designated as a hedging instrument in a cash flow hedge of highly probable future need for power. Changes in fair value of the power contract are from the same date booked against OCI. Elkem has on 31 January 2022 entered into agreement to purchase the remaining 50% of the shares in Salten Energigjenvinning AS. See note 34 Events after the reporting period.
Assumptions for valuation of the contracts
→ Discount rate: 3,5% (2.8%) p.a. for contract with Salten Energigjenvinning AS and for the "30-øringen" power contract, and 1.68% (1.68%) for contracts with Statkraft. The assumptions are based on the estimated risk of the contract, including credit risk.
→ Inflation: 2% (1.5%) p.a. → Power prices: Market prices per 31 December 2021
until 2031. → CfDs: 4-year average historic CfD prices based on
Nord Pool prices. → Exchange rate EUR: Observable rates for the next
5 years, thereafter calculated rates based on long-term interest rates.
→ Volume for the contract with Salten Energigjenvinning AS: estimated production volume based on concept study and similar production facilities.
For external shares measured at level 3, book value of equity adjusted for excess values at purchase date is used as an approximation of fair value. See note 24 Provision and other liabilities for value of contingent liabilities.
Amounts in NOK million
Financial assets at fair value through profit or lossDerivatives designated in a hedging relationshipAssets at fair value through other comprehensive incomeTotal assets
Financial liabilities at fair value through profit or lossDerivatives designated in a hedging relationshipTotal liabilities
Assets and liabilities measured at fair value 31.12
Level 3
(31)41827
414
203 -
203
Level 1
4--
4
--
-
Level 2
39175
- 214
(87)138 51
Level 1
6--
6
--
-
Total 2021
14 593
27 634
116 138 254
Total 2020
51 161 23
235
234 403 637
Level 2
46161
- 207
(105)371
266
Level 3
--
23 23
33931
371
Amounts in NOK million
Opening balanceAcquisition / business combinationsTransfer to investment in equity accounted companiesChange in fair value recognised in OCI, cash flow hedgesSettlement / realised effectsOther changes in fair value through profit or loss, unrealisedCurrency translation differencesClosing balance
Movements in fair value measurement level 3
2021
(348) - -
737 (157)
(9) (13)212
2020
90 (549)
(46) (453)
721 (113)
2 (348)
220 221Annual report 2021
Elkem history Highlights Letter from the CEO The business The Elkem share Board of directors’ report Board and management Corporate governance Risk managment ESG report Financial statements ESG assurance Contact
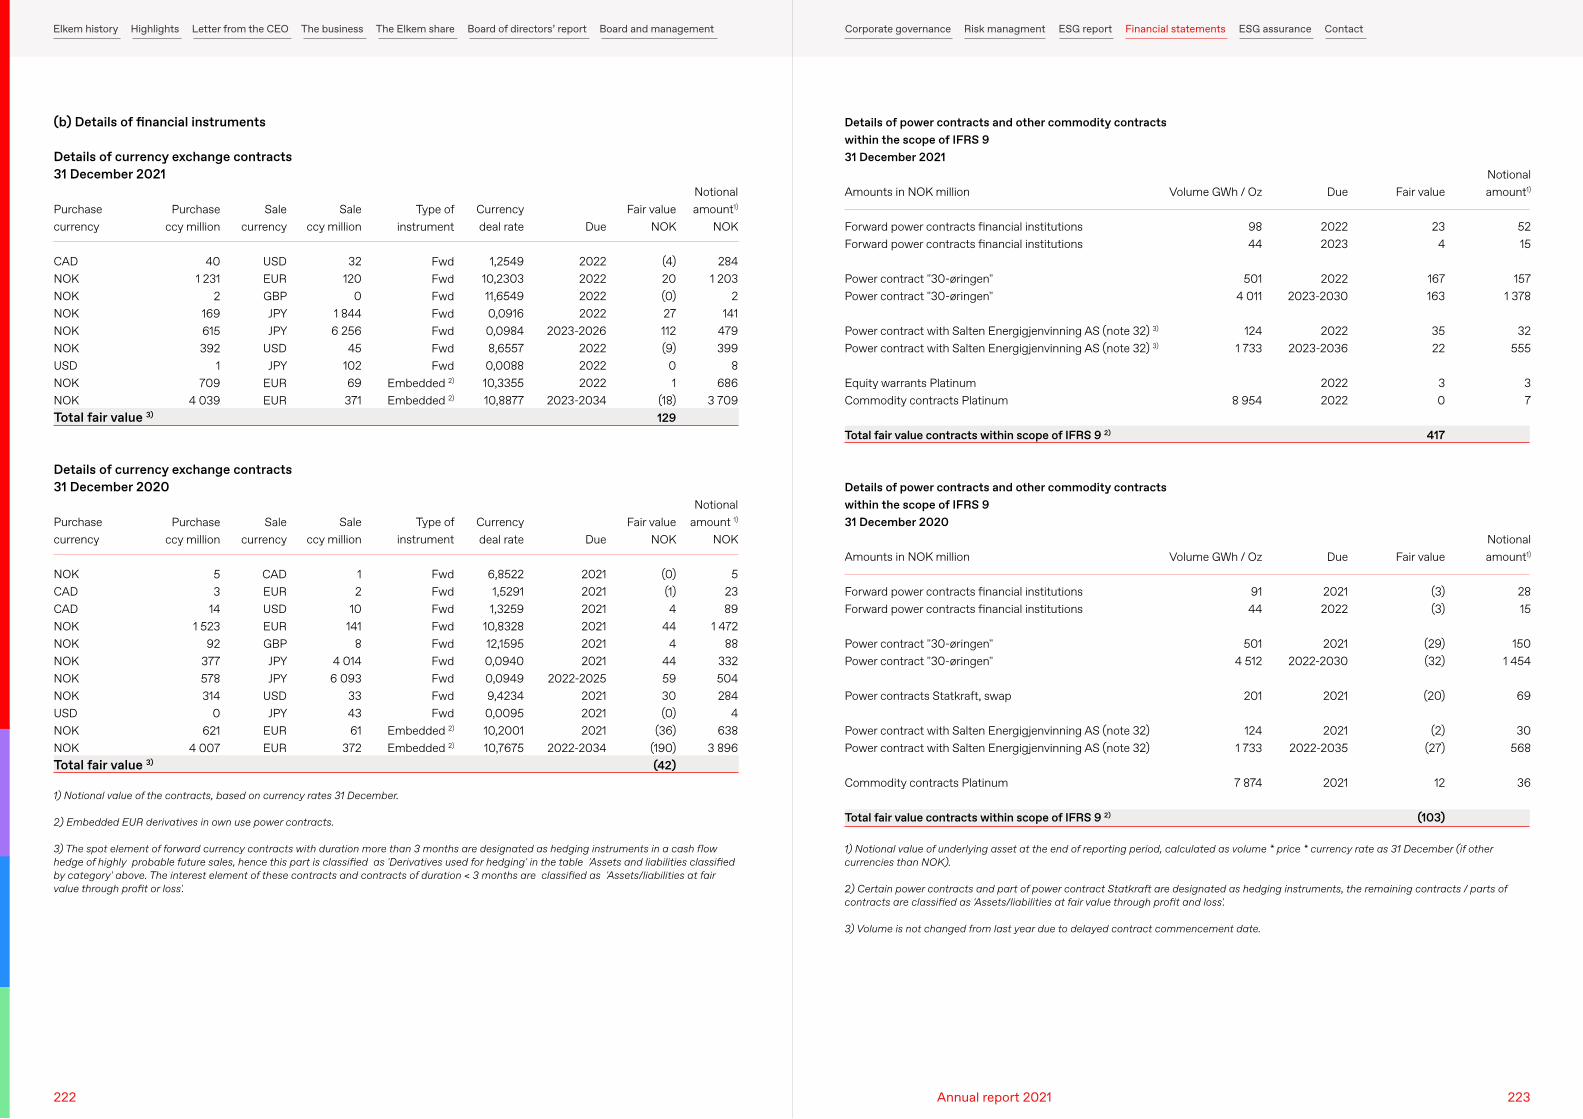
Purchasecurrency
CADNOKNOKNOKNOKNOKUSDNOKNOKTotal fair value 3)
Purchasecurrency
NOKCADCADNOKNOKNOKNOKNOKUSDNOKNOKTotal fair value 3)
(b) Details of financial instruments
Details of currency exchange contracts 31 December 2021
Details of currency exchange contracts 31 December 2020
Saleccy million
32120
01 8446 256
4510269371
Saleccy million
12
10141
84 0146 093
334361
372
Currency deal rate
1,254910,230311,65490,09160,09848,65570,008810,335510,8877
Currency deal rate
6,85221,52911,3259
10,832812,15950,09400,09499,42340,009510,200110,7675
Salecurrency
USDEURGBPJPYJPY
USDJPY
EUREUR
Salecurrency
CADEURUSDEURGBPJPYJPY
USDJPY
EUREUR
Purchaseccy million
401 231
2169615392
1709
4 039
Purchaseccy million
53
141 523
92377578314
0621
4 007
Type of instrument
FwdFwdFwdFwdFwdFwdFwd
Embedded 2)
Embedded 2)
Type of instrument
FwdFwdFwdFwdFwdFwdFwdFwdFwd
Embedded 2)
Embedded 2)
Notionalamount1)
NOK
2841 203
2141
479399
8686
3 709
Notionalamount 1)
NOK
52389
1 47288
332504284
4638
3 896
Due
2022202220222022
2023-2026202220222022
2023-2034
Due
202120212021202120212021
2022-2025202120212021
2022-2034
Fair value NOK
(4)20(0)27112(9)
01
(18)129
Fair value NOK
(0)(1)4
444
445930(0)
(36)(190)(42)
1) Notional value of the contracts, based on currency rates 31 December.
2) Embedded EUR derivatives in own use power contracts.
3) The spot element of forward currency contracts with duration more than 3 months are designated as hedging instruments in a cash flow hedge of highly probable future sales, hence this part is classified as 'Derivatives used for hedging' in the table 'Assets and liabilities classified by category' above. The interest element of these contracts and contracts of duration < 3 months are classified as 'Assets/liabilities at fair value through profit or loss'.
1) Notional value of underlying asset at the end of reporting period, calculated as volume * price * currency rate as 31 December (if other currencies than NOK). 2) Certain power contracts and part of power contract Statkraft are designated as hedging instruments, the remaining contracts / parts of contracts are classified as 'Assets/liabilities at fair value through profit and loss'.
3) Volume is not changed from last year due to delayed contract commencement date.
Amounts in NOK million
Forward power contracts financial institutionsForward power contracts financial institutions
Power contract "30-øringen"Power contract "30-øringen"
Power contract with Salten Energigjenvinning AS (note 32) 3)
Power contract with Salten Energigjenvinning AS (note 32) 3)
Equity warrants PlatinumCommodity contracts Platinum
Total fair value contracts within scope of IFRS 9 2)
Amounts in NOK million
Forward power contracts financial institutionsForward power contracts financial institutions
Power contract "30-øringen"Power contract "30-øringen"
Power contracts Statkraft, swap
Power contract with Salten Energigjenvinning AS (note 32) Power contract with Salten Energigjenvinning AS (note 32)
Commodity contracts Platinum
Total fair value contracts within scope of IFRS 9 2)
Details of power contracts and other commodity contracts within the scope of IFRS 9 31 December 2021
Details of power contracts and other commodity contracts within the scope of IFRS 9 31 December 2020
Fair value
234
167163
3522
30
417
Fair value
(3)(3)
(29)(32)
(20)
(2)(27)
12
(103)
Volume GWh / Oz
9844
5014 011
1241 733
8 954
Volume GWh / Oz
9144
5014 512
201
1241 733
7 874
Notional amount1)
5215
1571 378
32555
37
Notional amount1)
2815
1501 454
69
30568
36
Due
20222023
20222023-2030
20222023-2036
20222022
Due
20212022
20212022-2030
2021
20212022-2035
2021
222 223Annual report 2021
Elkem history Highlights Letter from the CEO The business The Elkem share Board of directors’ report Board and management Corporate governance Risk managment ESG report Financial statements ESG assurance Contact
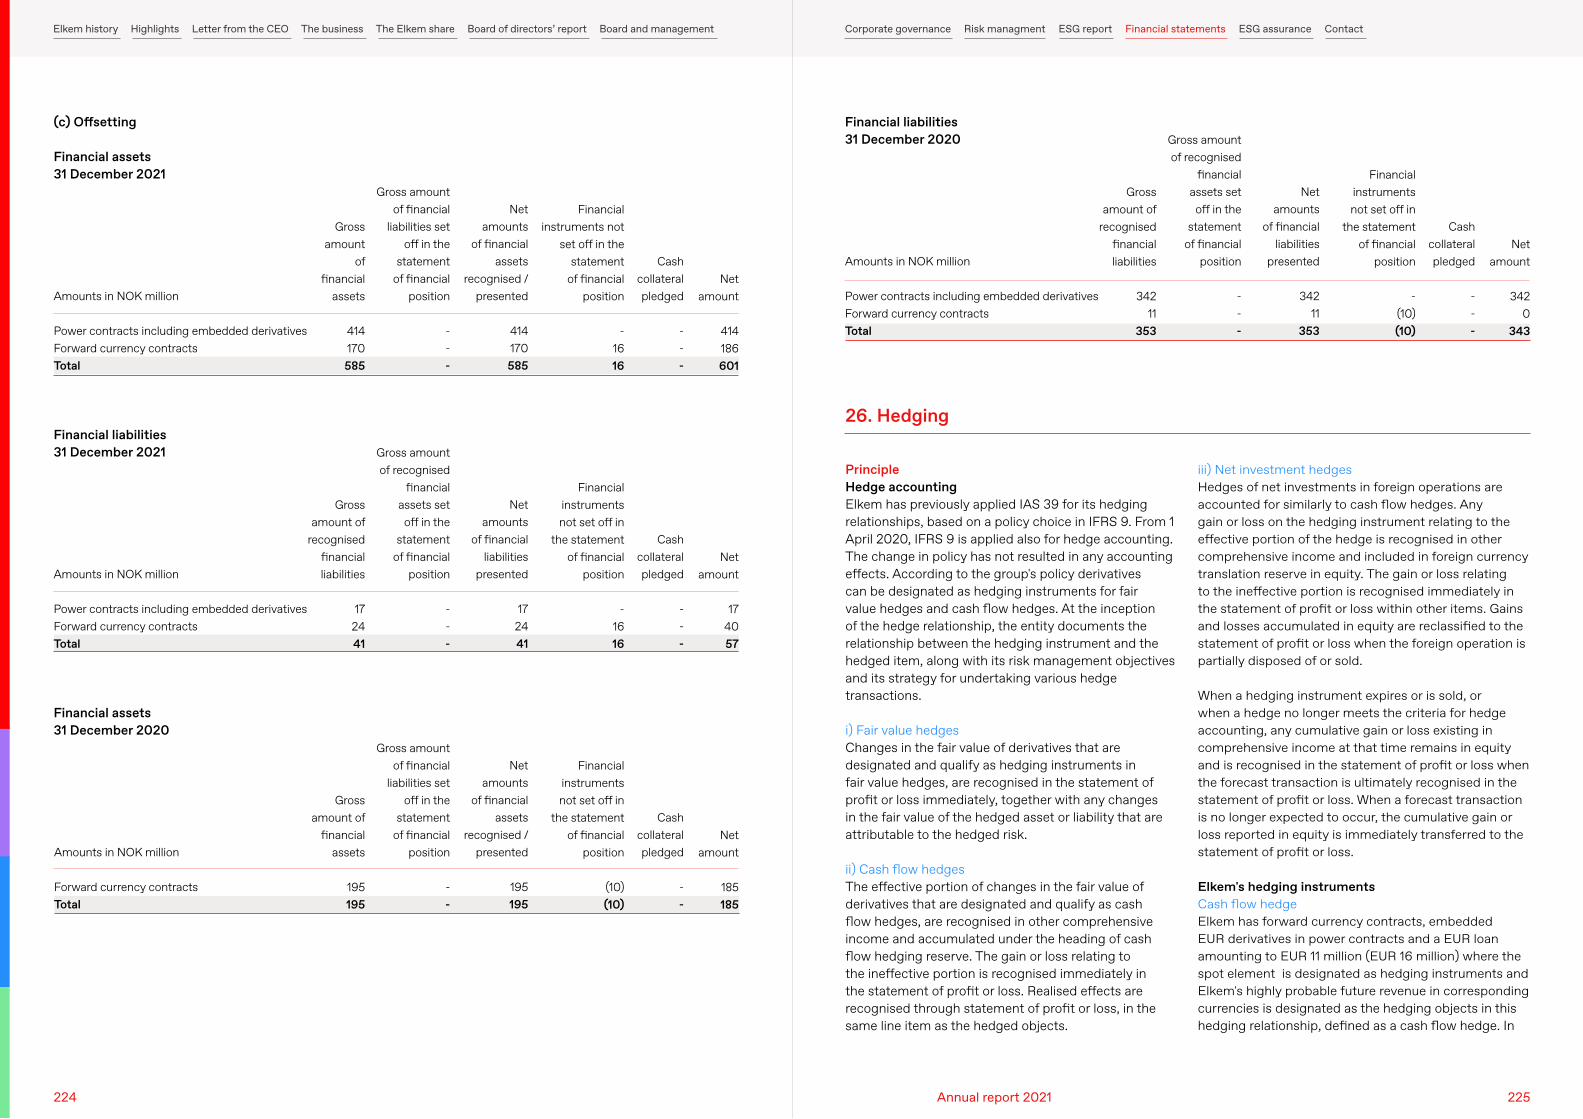
Amounts in NOK million
Power contracts including embedded derivativesForward currency contractsTotal
Amounts in NOK million
Power contracts including embedded derivativesForward currency contractsTotal
Amounts in NOK million
Power contracts including embedded derivativesForward currency contractsTotal
Amounts in NOK million
Forward currency contractsTotal
(c) Offsetting
Financial assets 31 December 2021
Financial liabilities 31 December 2021
Financial liabilities 31 December 2020
Financial assets 31 December 2020
Net amounts
of financial assets
recognised / presented
414 170 585
Net amounts
of financial liabilities
presented
17 24 41
Net amounts
of financial liabilities
presented
342 11
353
Net amounts
of financial assets
recognised / presented
195 195
Cash collateral pledged
- - -
Cash collateral pledged
- - -
Cash collateral pledged
- - -
Cash collateral pledged
- -
Gross amount of financial
liabilities set off in the
statement of financial
position
- - -
Gross amount of recognised
financial assets set off in the
statement of financial
position
- - -
Gross amount of recognised
financial assets set off in the
statement of financial
position
- - -
Gross amount of financial
liabilities set off in the
statement of financial
position
- -
Gross amount
of financial
assets
414 170 585
Gross amount of
recognised financial liabilities
17 24 41
Gross amount of
recognised financial liabilities
342 11
353
Gross amount of
financial assets
195 195
Financial instruments not
set off in the statement
of financial position
- 16 16
Financial instruments not set off in
the statement of financial
position
- 16 16
Financial instruments not set off in
the statement of financial
position
- (10) (10)
Financial instruments not set off in
the statement of financial
position
(10) (10)
Net amount
414 186 601
Net amount
17 40 57
Net amount
342 0
343
Net amount
185 185
PrincipleHedge accountingElkem has previously applied IAS 39 for its hedging relationships, based on a policy choice in IFRS 9. From 1 April 2020, IFRS 9 is applied also for hedge accounting. The change in policy has not resulted in any accounting effects. According to the group's policy derivatives can be designated as hedging instruments for fair value hedges and cash flow hedges. At the inception of the hedge relationship, the entity documents the relationship between the hedging instrument and the hedged item, along with its risk management objectives and its strategy for undertaking various hedge transactions.
i) Fair value hedgesChanges in the fair value of derivatives that are designated and qualify as hedging instruments in fair value hedges, are recognised in the statement of profit or loss immediately, together with any changes in the fair value of the hedged asset or liability that are attributable to the hedged risk.
ii) Cash flow hedgesThe effective portion of changes in the fair value of derivatives that are designated and qualify as cash flow hedges, are recognised in other comprehensive income and accumulated under the heading of cash flow hedging reserve. The gain or loss relating to the ineffective portion is recognised immediately in the statement of profit or loss. Realised effects are recognised through statement of profit or loss, in the same line item as the hedged objects.
iii) Net investment hedges Hedges of net investments in foreign operations are accounted for similarly to cash flow hedges. Any gain or loss on the hedging instrument relating to the effective portion of the hedge is recognised in other comprehensive income and included in foreign currency translation reserve in equity. The gain or loss relating to the ineffective portion is recognised immediately in the statement of profit or loss within other items. Gains and losses accumulated in equity are reclassified to the statement of profit or loss when the foreign operation is partially disposed of or sold.
When a hedging instrument expires or is sold, or when a hedge no longer meets the criteria for hedge accounting, any cumulative gain or loss existing in comprehensive income at that time remains in equity and is recognised in the statement of profit or loss when the forecast transaction is ultimately recognised in the statement of profit or loss. When a forecast transaction is no longer expected to occur, the cumulative gain or loss reported in equity is immediately transferred to the statement of profit or loss.
Elkem's hedging instrumentsCash flow hedgeElkem has forward currency contracts, embedded EUR derivatives in power contracts and a EUR loan amounting to EUR 11 million (EUR 16 million) where the spot element is designated as hedging instruments and Elkem's highly probable future revenue in corresponding currencies is designated as the hedging objects in this hedging relationship, defined as a cash flow hedge. In
26. Hedging
224 225Annual report 2021
Elkem history Highlights Letter from the CEO The business The Elkem share Board of directors’ report Board and management Corporate governance Risk managment ESG report Financial statements ESG assurance Contact
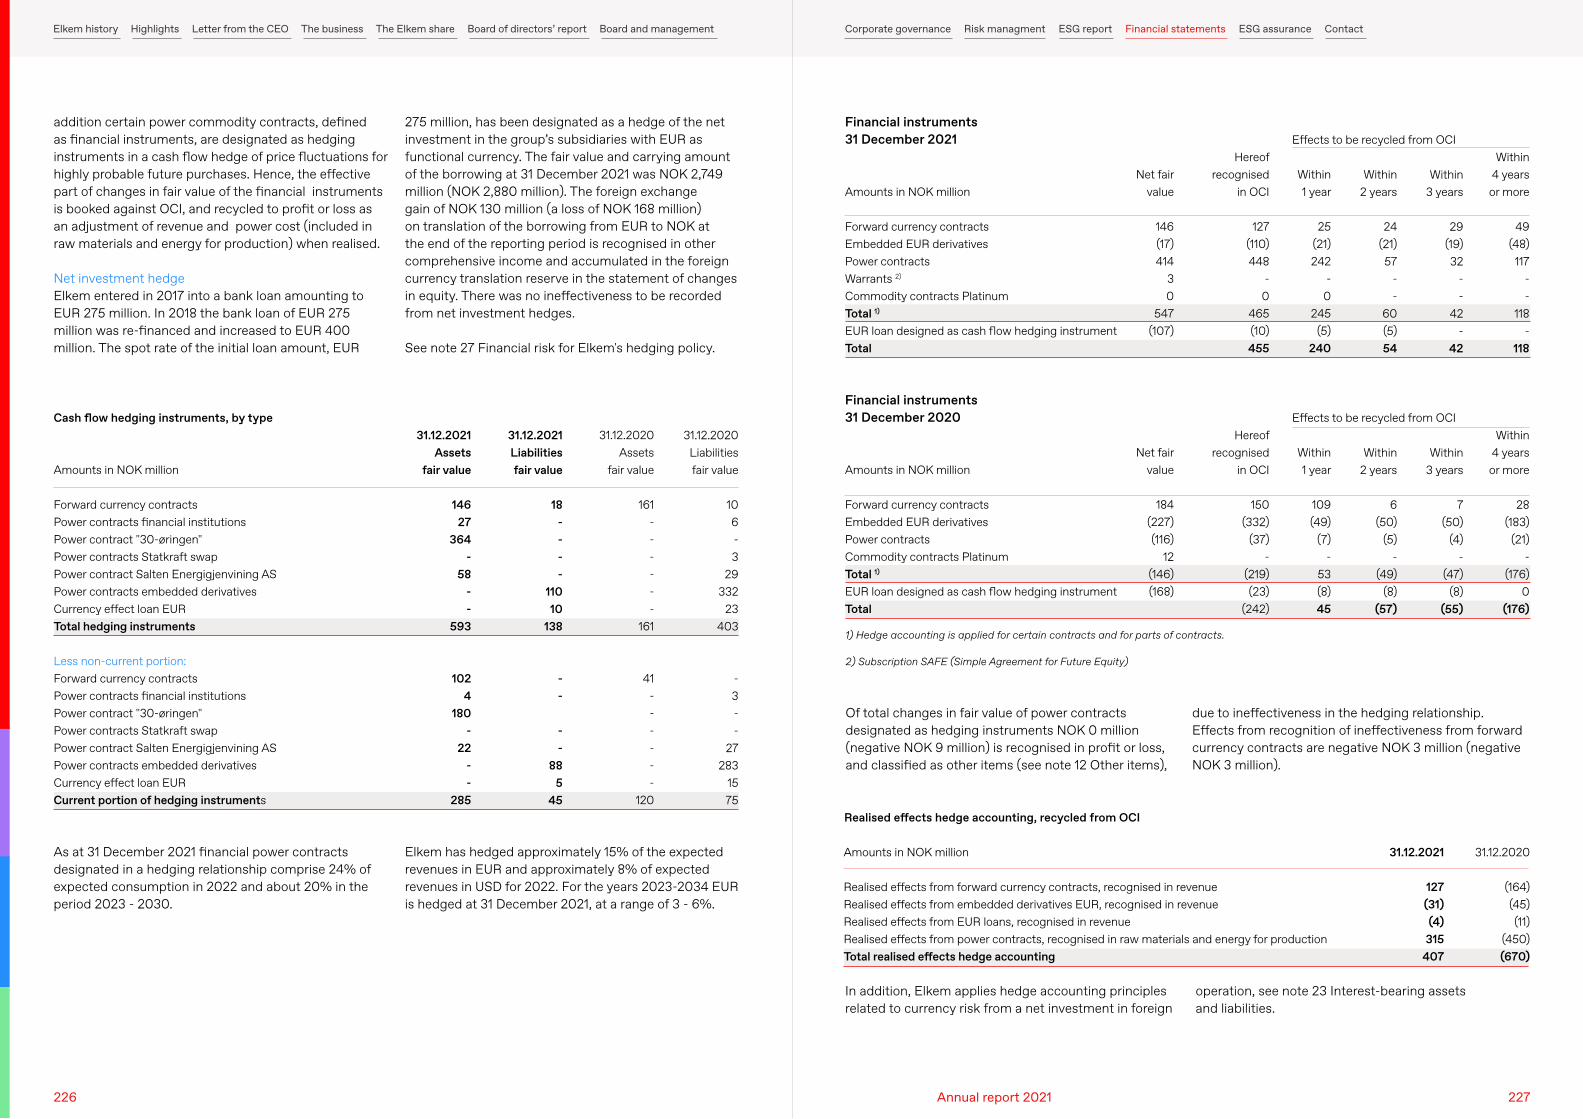
addition certain power commodity contracts, defined as financial instruments, are designated as hedging instruments in a cash flow hedge of price fluctuations for highly probable future purchases. Hence, the effective part of changes in fair value of the financial instruments is booked against OCI, and recycled to profit or loss as an adjustment of revenue and power cost (included in raw materials and energy for production) when realised.
Net investment hedgeElkem entered in 2017 into a bank loan amounting to EUR 275 million. In 2018 the bank loan of EUR 275 million was re-financed and increased to EUR 400 million. The spot rate of the initial loan amount, EUR
As at 31 December 2021 financial power contracts designated in a hedging relationship comprise 24% of expected consumption in 2022 and about 20% in the period 2023 - 2030.
Of total changes in fair value of power contracts designated as hedging instruments NOK 0 million (negative NOK 9 million) is recognised in profit or loss, and classified as other items (see note 12 Other items),
In addition, Elkem applies hedge accounting principles related to currency risk from a net investment in foreign
operation, see note 23 Interest-bearing assets and liabilities.
1) Hedge accounting is applied for certain contracts and for parts of contracts. 2) Subscription SAFE (Simple Agreement for Future Equity)
275 million, has been designated as a hedge of the net investment in the group’s subsidiaries with EUR as functional currency. The fair value and carrying amount of the borrowing at 31 December 2021 was NOK 2,749 million (NOK 2,880 million). The foreign exchange gain of NOK 130 million (a loss of NOK 168 million) on translation of the borrowing from EUR to NOK at the end of the reporting period is recognised in other comprehensive income and accumulated in the foreign currency translation reserve in the statement of changes in equity. There was no ineffectiveness to be recorded from net investment hedges.
See note 27 Financial risk for Elkem's hedging policy.
Elkem has hedged approximately 15% of the expected revenues in EUR and approximately 8% of expected revenues in USD for 2022. For the years 2023-2034 EUR is hedged at 31 December 2021, at a range of 3 - 6%.
due to ineffectiveness in the hedging relationship. Effects from recognition of ineffectiveness from forward currency contracts are negative NOK 3 million (negative NOK 3 million).
Amounts in NOK million
Forward currency contractsPower contracts financial institutionsPower contract "30-øringen"Power contracts Statkraft swapPower contract Salten Energigjenvining ASPower contracts embedded derivativesCurrency effect loan EURTotal hedging instruments
Less non-current portion:Forward currency contractsPower contracts financial institutionsPower contract "30-øringen"Power contracts Statkraft swapPower contract Salten Energigjenvining ASPower contracts embedded derivativesCurrency effect loan EURCurrent portion of hedging instruments
Cash flow hedging instruments, by type31.12.2020
Assetsfair value
161
- - - - - -
161
41 - - - - - -
120
31.12.2021Assets
fair value
146 27
364 -
58 - -
593
102 4
180 -
22 - -
285
31.12.2020Liabilitiesfair value
10 6 - 3
29 332
23 403
- 3 - -
27 283
15 75
31.12.2021Liabilitiesfair value
18 - - - -
110 10
138
- -
- -
88 5
45
Amounts in NOK million
Forward currency contractsEmbedded EUR derivativesPower contractsWarrants 2)
Commodity contracts PlatinumTotal 1)
EUR loan designed as cash flow hedging instrumentTotal
Amounts in NOK million
Forward currency contractsEmbedded EUR derivativesPower contractsCommodity contracts PlatinumTotal 1)
EUR loan designed as cash flow hedging instrumentTotal
Financial instruments 31 December 2021
Financial instruments 31 December 2020
Net fair value
146 (17) 414
3 0
547 (107)
Net fair value
184
(227) (116)
12 (146) (168)
Within 1 year
25 (21) 242
- 0
245 (5)
240
Within 1 year
109 (49)
(7) -
53 (8)
45
Hereof recognised
in OCI
127 (110) 448
- 0
465 (10) 455
Hereof recognised
in OCI
150 (332)
(37) -
(219) (23)
(242)
Within 4 years or more
49 (48) 117
- -
118 -
118
Within 4 years or more
28 (183)
(21) -
(176)0
(176)
Within 2 years
24 (21) 57
- -
60 (5)
54
Within 2 years
6 (50)
(5) -
(49)(8)
(57)
Within 3 years
29 (19) 32
- -
42 -
42
Within 3 years
7 (50)
(4) -
(47)(8)
(55)
Effects to be recycled from OCI
Effects to be recycled from OCI
Amounts in NOK million
Realised effects from forward currency contracts, recognised in revenueRealised effects from embedded derivatives EUR, recognised in revenueRealised effects from EUR loans, recognised in revenueRealised effects from power contracts, recognised in raw materials and energy for productionTotal realised effects hedge accounting
Realised effects hedge accounting, recycled from OCI
31.12.2021
127(31)(4)
315407
31.12.2020
(164)(45)(11)
(450)(670)
226 227Annual report 2021
Elkem history Highlights Letter from the CEO The business The Elkem share Board of directors’ report Board and management Corporate governance Risk managment ESG report Financial statements ESG assurance Contact
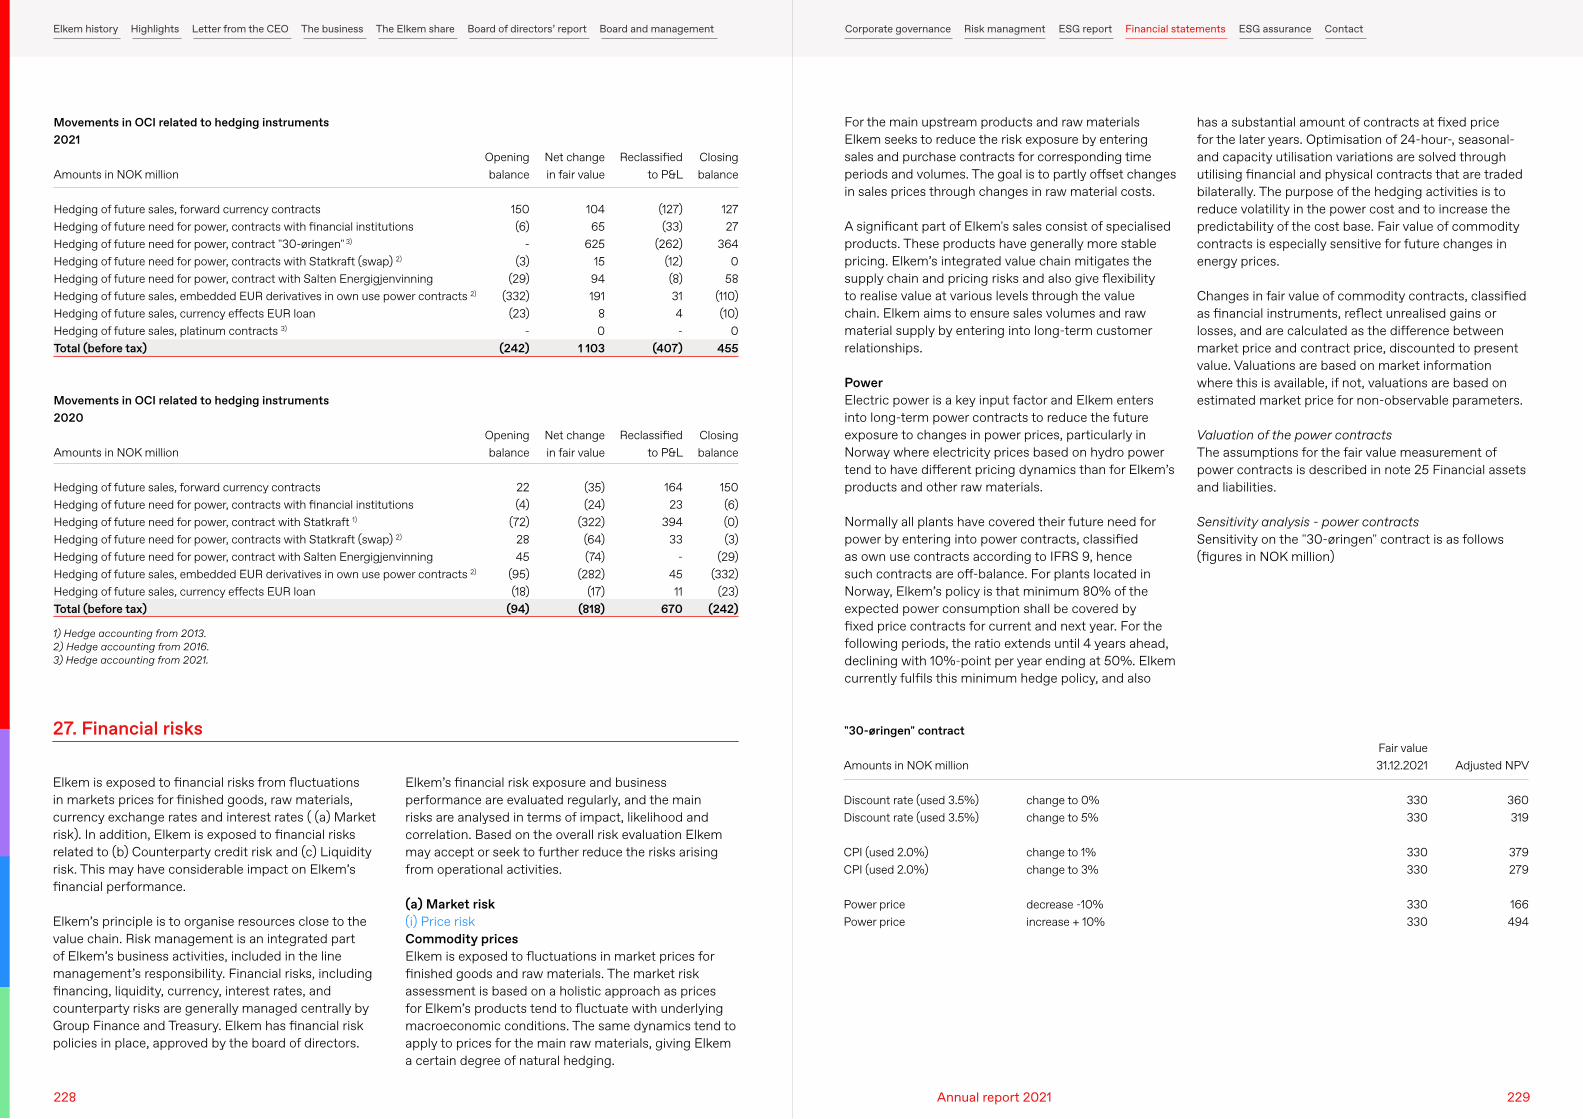
Amounts in NOK million
Hedging of future sales, forward currency contractsHedging of future need for power, contracts with financial institutionsHedging of future need for power, contract "30-øringen" 3)
Hedging of future need for power, contracts with Statkraft (swap) 2)
Hedging of future need for power, contract with Salten EnergigjenvinningHedging of future sales, embedded EUR derivatives in own use power contracts 2)
Hedging of future sales, currency effects EUR loanHedging of future sales, platinum contracts 3)
Total (before tax)
Amounts in NOK million
Hedging of future sales, forward currency contractsHedging of future need for power, contracts with financial institutionsHedging of future need for power, contract with Statkraft 1)
Hedging of future need for power, contracts with Statkraft (swap) 2)
Hedging of future need for power, contract with Salten EnergigjenvinningHedging of future sales, embedded EUR derivatives in own use power contracts 2)
Hedging of future sales, currency effects EUR loanTotal (before tax)
Movements in OCI related to hedging instruments2021
Movements in OCI related to hedging instruments2020
Reclassified to P&L
(127) (33)
(262) (12) (8) 31 4 -
(407)
Reclassified to P&L
164 23
394 33
- 45 11
670
Opening balance
150 (6)
- (3)
(29) (332)
(23) -
(242)
Opening balance
22 (4)
(72) 28 45
(95) (18)
(94)
Closing balance
127 27
364 0
58 (110) (10)
0 455
Closing balance
150 (6) (0) (3)
(29) (332)
(23) (242)
Net change in fair value
104 65
625 15
94 191
8 0
1 103
Net change in fair value
(35) (24)
(322) (64) (74)
(282) (17)
(818)
1) Hedge accounting from 2013. 2) Hedge accounting from 2016.3) Hedge accounting from 2021.
Elkem is exposed to financial risks from fluctuations in markets prices for finished goods, raw materials, currency exchange rates and interest rates ( (a) Market risk). In addition, Elkem is exposed to financial risks related to (b) Counterparty credit risk and (c) Liquidity risk. This may have considerable impact on Elkem’s financial performance.
Elkem’s principle is to organise resources close to the value chain. Risk management is an integrated part of Elkem’s business activities, included in the line management’s responsibility. Financial risks, including financing, liquidity, currency, interest rates, and counterparty risks are generally managed centrally by Group Finance and Treasury. Elkem has financial risk policies in place, approved by the board of directors.
For the main upstream products and raw materials Elkem seeks to reduce the risk exposure by entering sales and purchase contracts for corresponding time periods and volumes. The goal is to partly offset changes in sales prices through changes in raw material costs.
A significant part of Elkem's sales consist of specialised products. These products have generally more stable pricing. Elkem’s integrated value chain mitigates the supply chain and pricing risks and also give flexibility to realise value at various levels through the value chain. Elkem aims to ensure sales volumes and raw material supply by entering into long-term customer relationships.
Power Electric power is a key input factor and Elkem enters into long-term power contracts to reduce the future exposure to changes in power prices, particularly in Norway where electricity prices based on hydro power tend to have different pricing dynamics than for Elkem’s products and other raw materials.
Normally all plants have covered their future need for power by entering into power contracts, classified as own use contracts according to IFRS 9, hence such contracts are off-balance. For plants located in Norway, Elkem’s policy is that minimum 80% of the expected power consumption shall be covered by fixed price contracts for current and next year. For the following periods, the ratio extends until 4 years ahead, declining with 10%-point per year ending at 50%. Elkem currently fulfils this minimum hedge policy, and also
Elkem’s financial risk exposure and business performance are evaluated regularly, and the main risks are analysed in terms of impact, likelihood and correlation. Based on the overall risk evaluation Elkem may accept or seek to further reduce the risks arising from operational activities.
(a) Market risk(i) Price riskCommodity pricesElkem is exposed to fluctuations in market prices for finished goods and raw materials. The market risk assessment is based on a holistic approach as prices for Elkem’s products tend to fluctuate with underlying macroeconomic conditions. The same dynamics tend to apply to prices for the main raw materials, giving Elkem a certain degree of natural hedging.
has a substantial amount of contracts at fixed price for the later years. Optimisation of 24-hour-, seasonal- and capacity utilisation variations are solved through utilising financial and physical contracts that are traded bilaterally. The purpose of the hedging activities is to reduce volatility in the power cost and to increase the predictability of the cost base. Fair value of commodity contracts is especially sensitive for future changes in energy prices.
Changes in fair value of commodity contracts, classified as financial instruments, reflect unrealised gains or losses, and are calculated as the difference between market price and contract price, discounted to present value. Valuations are based on market information where this is available, if not, valuations are based on estimated market price for non-observable parameters.
Valuation of the power contractsThe assumptions for the fair value measurement of power contracts is described in note 25 Financial assets and liabilities.
Sensitivity analysis - power contractsSensitivity on the "30-øringen" contract is as follows (figures in NOK million)
27. Financial risks
Amounts in NOK million
Discount rate (used 3.5%)Discount rate (used 3.5%)
CPI (used 2.0%)CPI (used 2.0%)
Power pricePower price
"30-øringen" contractFair value 31.12.2021
330 330
330 330
330 330
Adjusted NPV
360 319
379 279
166 494
change to 0%change to 5%
change to 1%change to 3%
decrease -10%increase + 10%
228 229Annual report 2021
Elkem history Highlights Letter from the CEO The business The Elkem share Board of directors’ report Board and management Corporate governance Risk managment ESG report Financial statements ESG assurance Contact
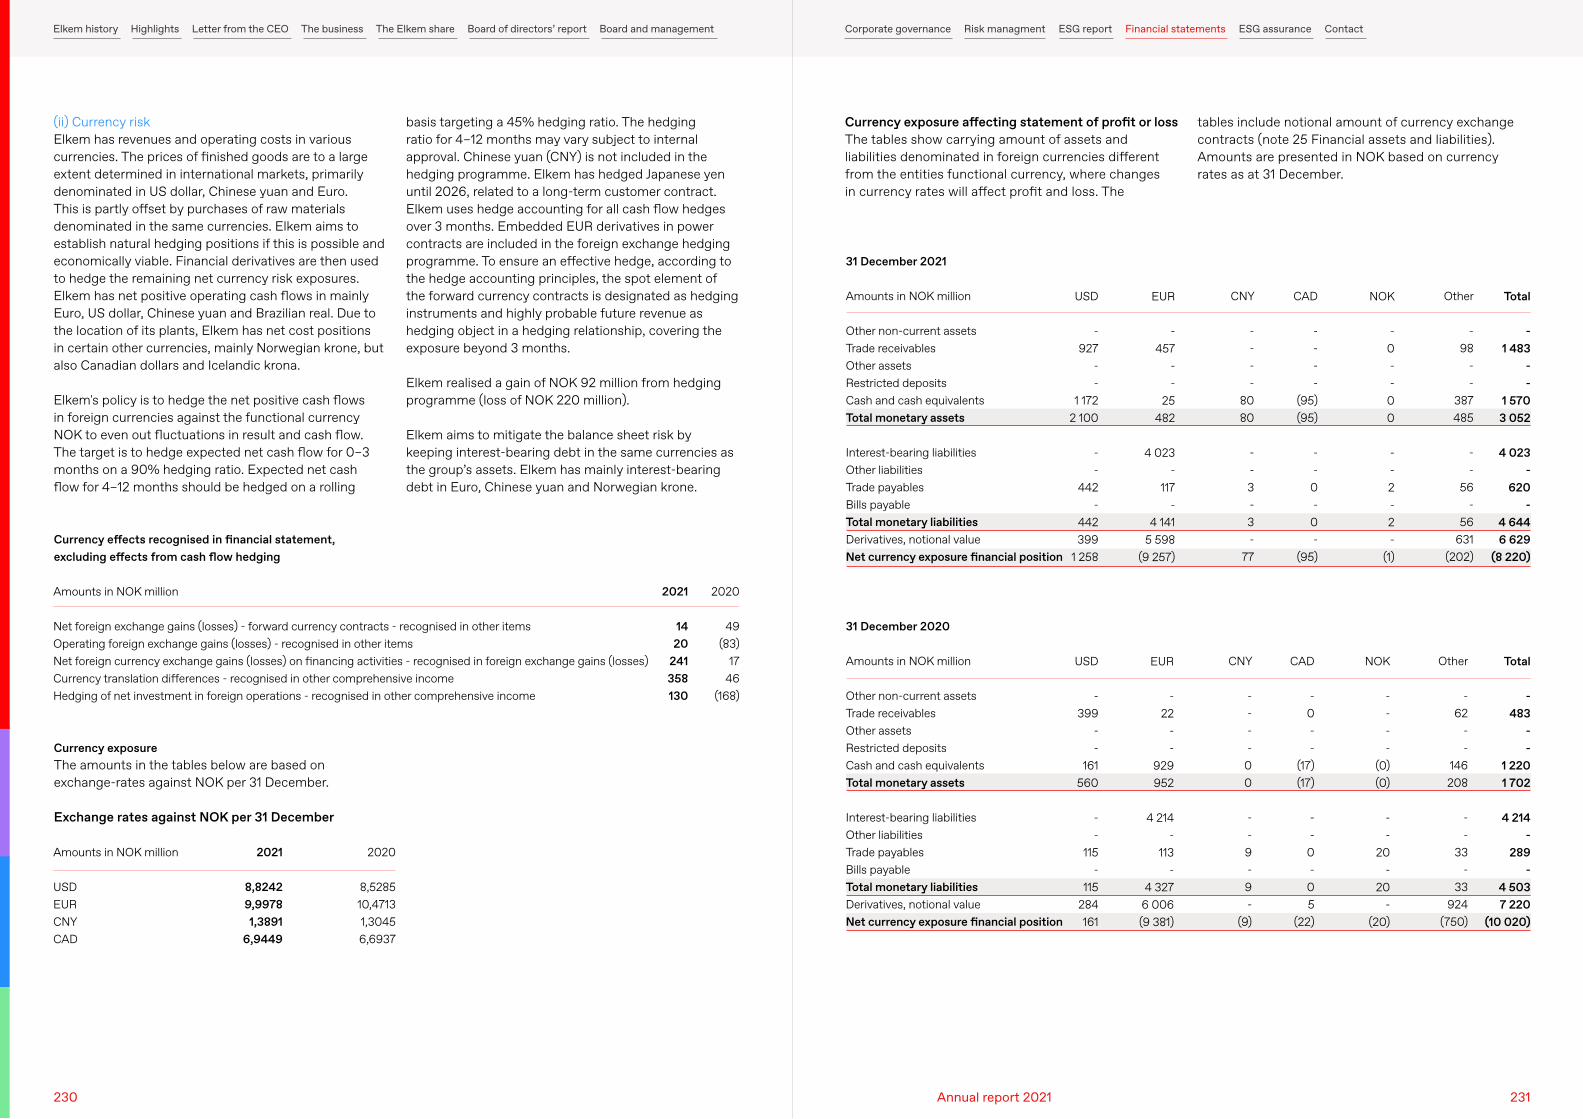
(ii) Currency riskElkem has revenues and operating costs in various currencies. The prices of finished goods are to a large extent determined in international markets, primarily denominated in US dollar, Chinese yuan and Euro. This is partly offset by purchases of raw materials denominated in the same currencies. Elkem aims to establish natural hedging positions if this is possible and economically viable. Financial derivatives are then used to hedge the remaining net currency risk exposures. Elkem has net positive operating cash flows in mainly Euro, US dollar, Chinese yuan and Brazilian real. Due to the location of its plants, Elkem has net cost positions in certain other currencies, mainly Norwegian krone, but also Canadian dollars and Icelandic krona. Elkem's policy is to hedge the net positive cash flows in foreign currencies against the functional currency NOK to even out fluctuations in result and cash flow. The target is to hedge expected net cash flow for 0–3 months on a 90% hedging ratio. Expected net cash flow for 4–12 months should be hedged on a rolling
Currency exposure affecting statement of profit or loss The tables show carrying amount of assets and liabilities denominated in foreign currencies different from the entities functional currency, where changes in currency rates will affect profit and loss. The
basis targeting a 45% hedging ratio. The hedging ratio for 4–12 months may vary subject to internal approval. Chinese yuan (CNY) is not included in the hedging programme. Elkem has hedged Japanese yen until 2026, related to a long-term customer contract. Elkem uses hedge accounting for all cash flow hedges over 3 months. Embedded EUR derivatives in power contracts are included in the foreign exchange hedging programme. To ensure an effective hedge, according to the hedge accounting principles, the spot element of the forward currency contracts is designated as hedging instruments and highly probable future revenue as hedging object in a hedging relationship, covering the exposure beyond 3 months.
Elkem realised a gain of NOK 92 million from hedging programme (loss of NOK 220 million).
Elkem aims to mitigate the balance sheet risk by keeping interest-bearing debt in the same currencies as the group’s assets. Elkem has mainly interest-bearing debt in Euro, Chinese yuan and Norwegian krone.
tables include notional amount of currency exchange contracts (note 25 Financial assets and liabilities). Amounts are presented in NOK based on currency rates as at 31 December.
Amounts in NOK million
Net foreign exchange gains (losses) - forward currency contracts - recognised in other itemsOperating foreign exchange gains (losses) - recognised in other itemsNet foreign currency exchange gains (losses) on financing activities - recognised in foreign exchange gains (losses)Currency translation differences - recognised in other comprehensive incomeHedging of net investment in foreign operations - recognised in other comprehensive income
Amounts in NOK million
USDEURCNYCAD
Currency effects recognised in financial statement, excluding effects from cash flow hedging
Currency exposure The amounts in the tables below are based on exchange-rates against NOK per 31 December.
Exchange rates against NOK per 31 December
2021
14 20
241 358 130
2021
8,82429,99781,3891
6,9449
2020
49 (83)
17 46
(168)
2020
8,528510,47131,30456,6937
Amounts in NOK million
Other non-current assetsTrade receivablesOther assetsRestricted depositsCash and cash equivalentsTotal monetary assets
Interest-bearing liabilitiesOther liabilitiesTrade payablesBills payableTotal monetary liabilitiesDerivatives, notional valueNet currency exposure financial position
31 December 2021
31 December 2020
Other
- 98
- -
387 485
- -
56 -
56 631
(202)
Other
- 62
- -
146 208
- -
33 -
33 924
(750)
CNY
- - - -
80 80
- - 3 - 3 -
77
CNY
- - - -
0 0
- - 9 - 9 -
(9)
CAD
- - - -
(95) (95)
- -
0 -
0 -
(95)
CAD
- 0 - -
(17) (17)
- -
0 -
0 5
(22)
USD
- 927
- -
1 172 2 100
- -
442 -
442 399
1 258
USD
- 399
- -
161 560
- -
115 -
115 284 161
Total
- 1 483
- -
1 570 3 052
4 023 -
620 -
4 644 6 629
(8 220)
Total
- 483
- -
1 220 1 702
4 214 -
289 -
4 503 7 220
(10 020)
NOK
- 0 - -
0 0
- - 2 - 2 -
(1)
NOK
- - - -
(0) (0)
- -
20 -
20 -
(20)
EUR
- 457
- -
25 482
4 023 -
117 -
4 141 5 598
(9 257)
EUR
- 22
- -
929 952
4 214 -
113 -
4 327 6 006 (9 381)
230 231Annual report 2021
Elkem history Highlights Letter from the CEO The business The Elkem share Board of directors’ report Board and management Corporate governance Risk managment ESG report Financial statements ESG assurance Contact
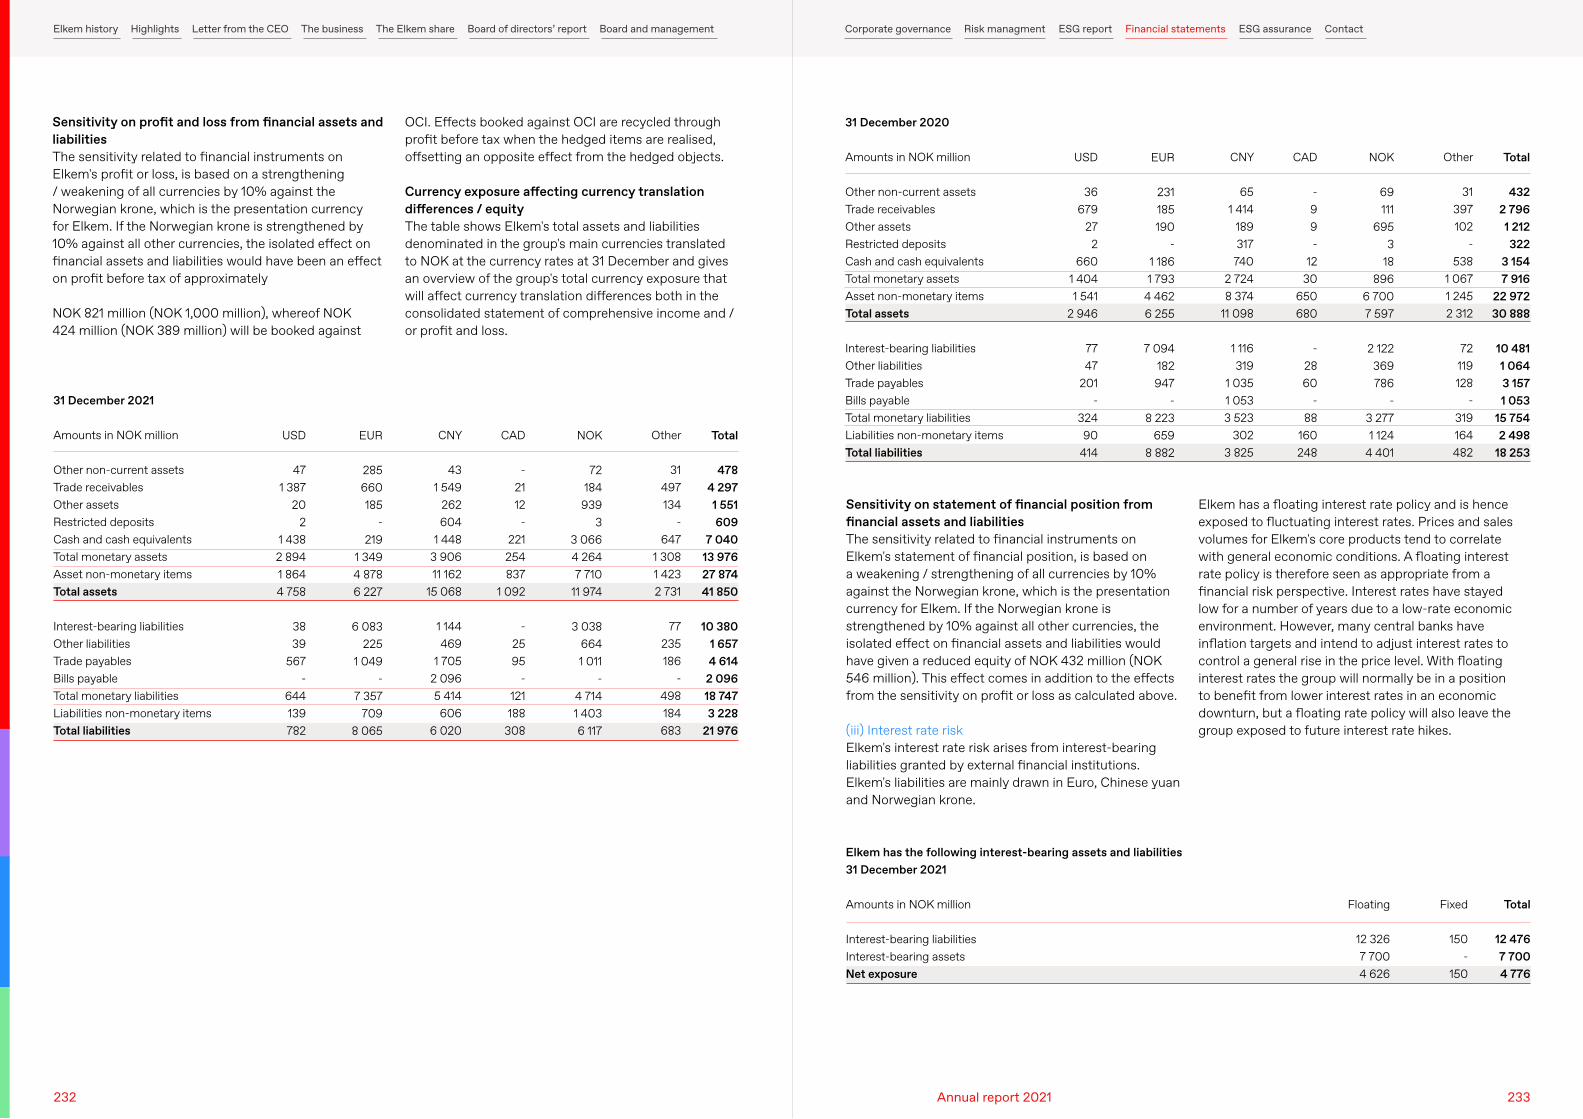
Sensitivity on profit and loss from financial assets and liabilitiesThe sensitivity related to financial instruments on Elkem's profit or loss, is based on a strengthening / weakening of all currencies by 10% against the Norwegian krone, which is the presentation currency for Elkem. If the Norwegian krone is strengthened by 10% against all other currencies, the isolated effect on financial assets and liabilities would have been an effect on profit before tax of approximately
NOK 821 million (NOK 1,000 million), whereof NOK 424 million (NOK 389 million) will be booked against
Sensitivity on statement of financial position from financial assets and liabilitiesThe sensitivity related to financial instruments on Elkem's statement of financial position, is based on a weakening / strengthening of all currencies by 10% against the Norwegian krone, which is the presentation currency for Elkem. If the Norwegian krone is strengthened by 10% against all other currencies, the isolated effect on financial assets and liabilities would have given a reduced equity of NOK 432 million (NOK 546 million). This effect comes in addition to the effects from the sensitivity on profit or loss as calculated above.
(iii) Interest rate riskElkem's interest rate risk arises from interest-bearing liabilities granted by external financial institutions. Elkem's liabilities are mainly drawn in Euro, Chinese yuan and Norwegian krone.
OCI. Effects booked against OCI are recycled through profit before tax when the hedged items are realised, offsetting an opposite effect from the hedged objects.
Currency exposure affecting currency translation differences / equityThe table shows Elkem's total assets and liabilities denominated in the group's main currencies translated to NOK at the currency rates at 31 December and gives an overview of the group's total currency exposure that will affect currency translation differences both in the consolidated statement of comprehensive income and / or profit and loss.
Elkem has a floating interest rate policy and is hence exposed to fluctuating interest rates. Prices and sales volumes for Elkem's core products tend to correlate with general economic conditions. A floating interest rate policy is therefore seen as appropriate from a financial risk perspective. Interest rates have stayed low for a number of years due to a low-rate economic environment. However, many central banks have inflation targets and intend to adjust interest rates to control a general rise in the price level. With floating interest rates the group will normally be in a position to benefit from lower interest rates in an economic downturn, but a floating rate policy will also leave the group exposed to future interest rate hikes.
Amounts in NOK million
Other non-current assetsTrade receivablesOther assetsRestricted depositsCash and cash equivalentsTotal monetary assetsAsset non-monetary items Total assets
Interest-bearing liabilitiesOther liabilitiesTrade payablesBills payableTotal monetary liabilitiesLiabilities non-monetary itemsTotal liabilities
31 December 2021
31 December 2020
Other
31 497 134
- 647
1 308 1 423 2 731
77 235 186
- 498 184 683
Other
31 397 102
- 538
1 067 1 245 2 312
72 119 128
- 319 164 482
CNY
43 1 549
262 604
1 448 3 906 11 162
15 068
1 144 469
1 705 2 096 5 414 606
6 020
CNY
65 1 414
189 317 740
2 724 8 374
11 098
1 116 319
1 035 1 053 3 523
302 3 825
CAD
- 21 12
- 221 254 837
1 092
- 25 95
- 121 188
308
CAD
- 9 9 -
12 30
650 680
- 28 60
- 88
160 248
USD
47 1 387
20 2
1 438 2 894 1 864 4 758
38 39
567 -
644 139 782
USD
36 679
27 2
660 1 404 1 541
2 946
77 47
201 -
324 90
414 Total
478 4 297 1 551 609
7 040 13 976 27 874 41 850
10 380 1 657 4 614
2 096 18 747 3 228
21 976
Total
432 2 796 1 212 322
3 154 7 916
22 972 30 888
10 481 1 064 3 157 1 053
15 754 2 498
18 253 NOK
72 184
939 3
3 066 4 264 7 710
11 974
3 038 664 1 011
- 4 714 1 403 6 117
NOK
69 111
695 3
18 896
6 700 7 597
2 122 369 786
- 3 277 1 124
4 401 EUR
285 660 185
- 219
1 349 4 878 6 227
6 083 225
1 049 -
7 357 709
8 065
EUR
231 185 190
- 1 186 1 793
4 462 6 255
7 094 182 947
- 8 223
659 8 882
Amounts in NOK million
Interest-bearing liabilitiesInterest-bearing assetsNet exposure
Elkem has the following interest-bearing assets and liabilities 31 December 2021
Fixed
150 -
150
Total
12 476 7 700 4 776
Floating
12 326 7 700 4 626
232 233Annual report 2021
Elkem history Highlights Letter from the CEO The business The Elkem share Board of directors’ report Board and management Corporate governance Risk managment ESG report Financial statements ESG assurance Contact
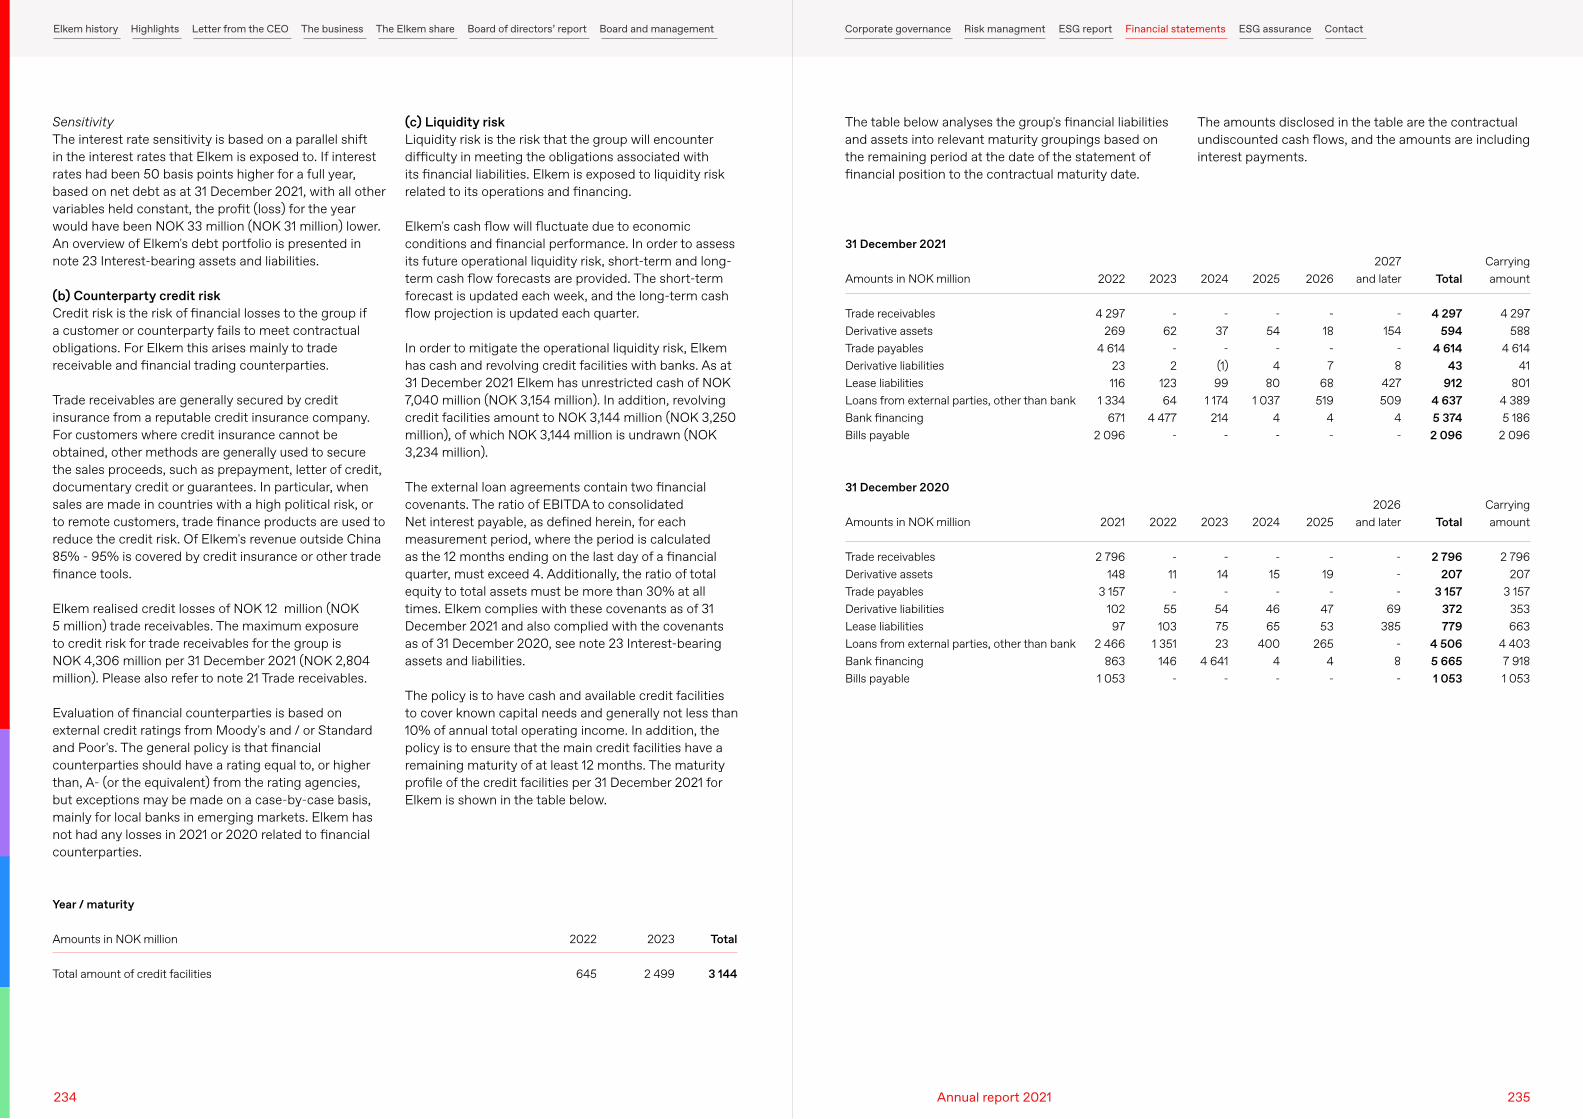
SensitivityThe interest rate sensitivity is based on a parallel shift in the interest rates that Elkem is exposed to. If interest rates had been 50 basis points higher for a full year, based on net debt as at 31 December 2021, with all other variables held constant, the profit (loss) for the year would have been NOK 33 million (NOK 31 million) lower. An overview of Elkem's debt portfolio is presented in note 23 Interest-bearing assets and liabilities.
(b) Counterparty credit risk Credit risk is the risk of financial losses to the group if a customer or counterparty fails to meet contractual obligations. For Elkem this arises mainly to trade receivable and financial trading counterparties.
Trade receivables are generally secured by credit insurance from a reputable credit insurance company. For customers where credit insurance cannot be obtained, other methods are generally used to secure the sales proceeds, such as prepayment, letter of credit, documentary credit or guarantees. In particular, when sales are made in countries with a high political risk, or to remote customers, trade finance products are used to reduce the credit risk. Of Elkem's revenue outside China 85% - 95% is covered by credit insurance or other trade finance tools.
Elkem realised credit losses of NOK 12 million (NOK 5 million) trade receivables. The maximum exposure to credit risk for trade receivables for the group is NOK 4,306 million per 31 December 2021 (NOK 2,804 million). Please also refer to note 21 Trade receivables.
Evaluation of financial counterparties is based on external credit ratings from Moody's and / or Standard and Poor's. The general policy is that financial counterparties should have a rating equal to, or higher than, A- (or the equivalent) from the rating agencies, but exceptions may be made on a case-by-case basis, mainly for local banks in emerging markets. Elkem has not had any losses in 2021 or 2020 related to financial counterparties.
The table below analyses the group's financial liabilities and assets into relevant maturity groupings based on the remaining period at the date of the statement of financial position to the contractual maturity date.
(c) Liquidity risk Liquidity risk is the risk that the group will encounter difficulty in meeting the obligations associated with its financial liabilities. Elkem is exposed to liquidity risk related to its operations and financing.
Elkem's cash flow will fluctuate due to economic conditions and financial performance. In order to assess its future operational liquidity risk, short-term and long-term cash flow forecasts are provided. The short-term forecast is updated each week, and the long-term cash flow projection is updated each quarter.
In order to mitigate the operational liquidity risk, Elkem has cash and revolving credit facilities with banks. As at 31 December 2021 Elkem has unrestricted cash of NOK 7,040 million (NOK 3,154 million). In addition, revolving credit facilities amount to NOK 3,144 million (NOK 3,250 million), of which NOK 3,144 million is undrawn (NOK 3,234 million).
The external loan agreements contain two financial covenants. The ratio of EBITDA to consolidated Net interest payable, as defined herein, for each measurement period, where the period is calculated as the 12 months ending on the last day of a financial quarter, must exceed 4. Additionally, the ratio of total equity to total assets must be more than 30% at all times. Elkem complies with these covenants as of 31 December 2021 and also complied with the covenants as of 31 December 2020, see note 23 Interest-bearing assets and liabilities.
The policy is to have cash and available credit facilities to cover known capital needs and generally not less than 10% of annual total operating income. In addition, the policy is to ensure that the main credit facilities have a remaining maturity of at least 12 months. The maturity profile of the credit facilities per 31 December 2021 for Elkem is shown in the table below.
The amounts disclosed in the table are the contractual undiscounted cash flows, and the amounts are including interest payments.
Amounts in NOK million
Total amount of credit facilities
Year / maturity
2023
2 499
Total
3 144
2022
645
Amounts in NOK million
Trade receivablesDerivative assetsTrade payablesDerivative liabilitiesLease liabilitiesLoans from external parties, other than bankBank financingBills payable
Amounts in NOK million
Trade receivablesDerivative assetsTrade payablesDerivative liabilitiesLease liabilitiesLoans from external parties, other than bankBank financingBills payable
31 December 2021
31 December 2020
2027 and later
- 154
- 8
427 509
4 -
2026 and later
- - -
69 385
- 8 -
Carrying amount
4 297 588
4 614 41
801 4 389 5 186
2 096
Carrying amount
2 796 207
3 157 353 663
4 403 7 918 1 053
2024
- 37
- (1) 99
1 174 214
-
2023
- 14
- 54 75 23
4 641 -
2025
- 54
- 4
80 1 037
4 -
2024
- 15
- 46 65
400 4 -
2022
4 297 269
4 614 23 116
1 334 671
2 096
2021
2 796 148
3 157 102 97
2 466 863
1 053
Total
4 297 594
4 614 43
912 4 637 5 374 2 096
Total
2 796 207
3 157 372 779
4 506 5 665 1 053
2026
- 18
- 7
68 519
4 -
2025
- 19
- 47 53
265 4 -
2023
- 62
- 2
123 64
4 477 -
2022
- 11 -
55 103
1 351 146
-
234 235Annual report 2021
Elkem history Highlights Letter from the CEO The business The Elkem share Board of directors’ report Board and management Corporate governance Risk managment ESG report Financial statements ESG assurance Contact
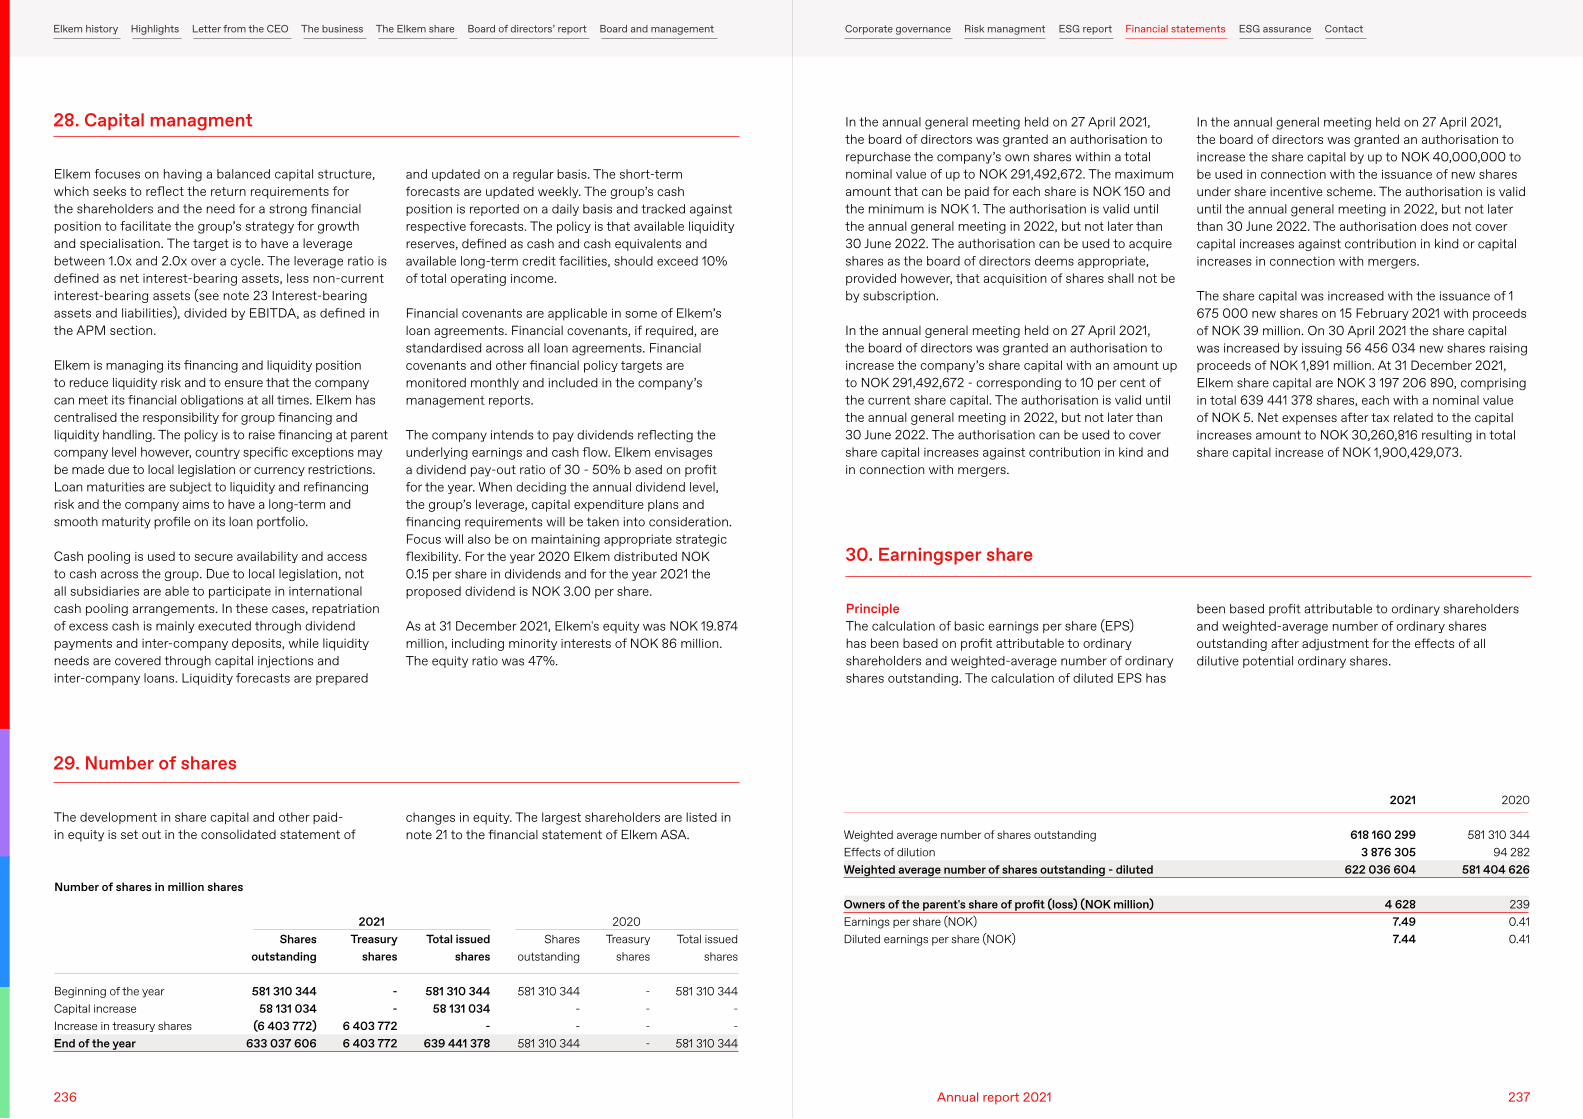
Elkem focuses on having a balanced capital structure, which seeks to reflect the return requirements for the shareholders and the need for a strong financial position to facilitate the group’s strategy for growth and specialisation. The target is to have a leverage between 1.0x and 2.0x over a cycle. The leverage ratio is defined as net interest-bearing assets, less non-current interest-bearing assets (see note 23 Interest-bearing assets and liabilities), divided by EBITDA, as defined in the APM section.
Elkem is managing its financing and liquidity position to reduce liquidity risk and to ensure that the company can meet its financial obligations at all times. Elkem has centralised the responsibility for group financing and liquidity handling. The policy is to raise financing at parent company level however, country specific exceptions may be made due to local legislation or currency restrictions. Loan maturities are subject to liquidity and refinancing risk and the company aims to have a long-term and smooth maturity profile on its loan portfolio.
Cash pooling is used to secure availability and access to cash across the group. Due to local legislation, not all subsidiaries are able to participate in international cash pooling arrangements. In these cases, repatriation of excess cash is mainly executed through dividend payments and inter-company deposits, while liquidity needs are covered through capital injections and inter-company loans. Liquidity forecasts are prepared
In the annual general meeting held on 27 April 2021, the board of directors was granted an authorisation to repurchase the company’s own shares within a total nominal value of up to NOK 291,492,672. The maximum amount that can be paid for each share is NOK 150 and the minimum is NOK 1. The authorisation is valid until the annual general meeting in 2022, but not later than 30 June 2022. The authorisation can be used to acquire shares as the board of directors deems appropriate, provided however, that acquisition of shares shall not be by subscription.
In the annual general meeting held on 27 April 2021, the board of directors was granted an authorisation to increase the company’s share capital with an amount up to NOK 291,492,672 - corresponding to 10 per cent of the current share capital. The authorisation is valid until the annual general meeting in 2022, but not later than 30 June 2022. The authorisation can be used to cover share capital increases against contribution in kind and in connection with mergers.
The development in share capital and other paid-in equity is set out in the consolidated statement of
PrincipleThe calculation of basic earnings per share (EPS) has been based on profit attributable to ordinary shareholders and weighted-average number of ordinary shares outstanding. The calculation of diluted EPS has
and updated on a regular basis. The short-term forecasts are updated weekly. The group’s cash position is reported on a daily basis and tracked against respective forecasts. The policy is that available liquidity reserves, defined as cash and cash equivalents and available long-term credit facilities, should exceed 10% of total operating income.
Financial covenants are applicable in some of Elkem’s loan agreements. Financial covenants, if required, are standardised across all loan agreements. Financial covenants and other financial policy targets are monitored monthly and included in the company’s management reports.
The company intends to pay dividends reflecting the underlying earnings and cash flow. Elkem envisages a dividend pay-out ratio of 30 - 50% b ased on profit for the year. When deciding the annual dividend level, the group’s leverage, capital expenditure plans and financing requirements will be taken into consideration. Focus will also be on maintaining appropriate strategic flexibility. For the year 2020 Elkem distributed NOK 0.15 per share in dividends and for the year 2021 the proposed dividend is NOK 3.00 per share.
As at 31 December 2021, Elkem's equity was NOK 19.874 million, including minority interests of NOK 86 million. The equity ratio was 47%.
In the annual general meeting held on 27 April 2021, the board of directors was granted an authorisation to increase the share capital by up to NOK 40,000,000 to be used in connection with the issuance of new shares under share incentive scheme. The authorisation is valid until the annual general meeting in 2022, but not later than 30 June 2022. The authorisation does not cover capital increases against contribution in kind or capital increases in connection with mergers.
The share capital was increased with the issuance of 1 675 000 new shares on 15 February 2021 with proceeds of NOK 39 million. On 30 April 2021 the share capital was increased by issuing 56 456 034 new shares raising proceeds of NOK 1,891 million. At 31 December 2021, Elkem share capital are NOK 3 197 206 890, comprising in total 639 441 378 shares, each with a nominal value of NOK 5. Net expenses after tax related to the capital increases amount to NOK 30,260,816 resulting in total share capital increase of NOK 1,900,429,073.
changes in equity. The largest shareholders are listed in note 21 to the financial statement of Elkem ASA.
been based profit attributable to ordinary shareholders and weighted-average number of ordinary shares outstanding after adjustment for the effects of all dilutive potential ordinary shares.
28. Capital managment
29. Number of shares
30. Earningsper share
Beginning of the yearCapital increaseIncrease in treasury sharesEnd of the year
Number of shares in million shares
Treasury shares
- -
6 403 772 6 403 772
Treasury shares
- - - -
Total issued shares
581 310 344 58 131 034
- 639 441 378
Total issued shares
581 310 344 - -
581 310 344
Shares outstanding
581 310 344 58 131 034
(6 403 772) 633 037 606
Shares outstanding
581 310 344 - -
581 310 344
Weighted average number of shares outstandingEffects of dilutionWeighted average number of shares outstanding - diluted
Owners of the parent's share of profit (loss) (NOK million)Earnings per share (NOK)Diluted earnings per share (NOK)
2021
618 160 299 3 876 305
622 036 604
4 628 7.497.44
2020
581 310 344 94 282
581 404 626
239 0.410.41
2021 2020
236 237Annual report 2021
Elkem history Highlights Letter from the CEO The business The Elkem share Board of directors’ report Board and management Corporate governance Risk managment ESG report Financial statements ESG assurance Contact
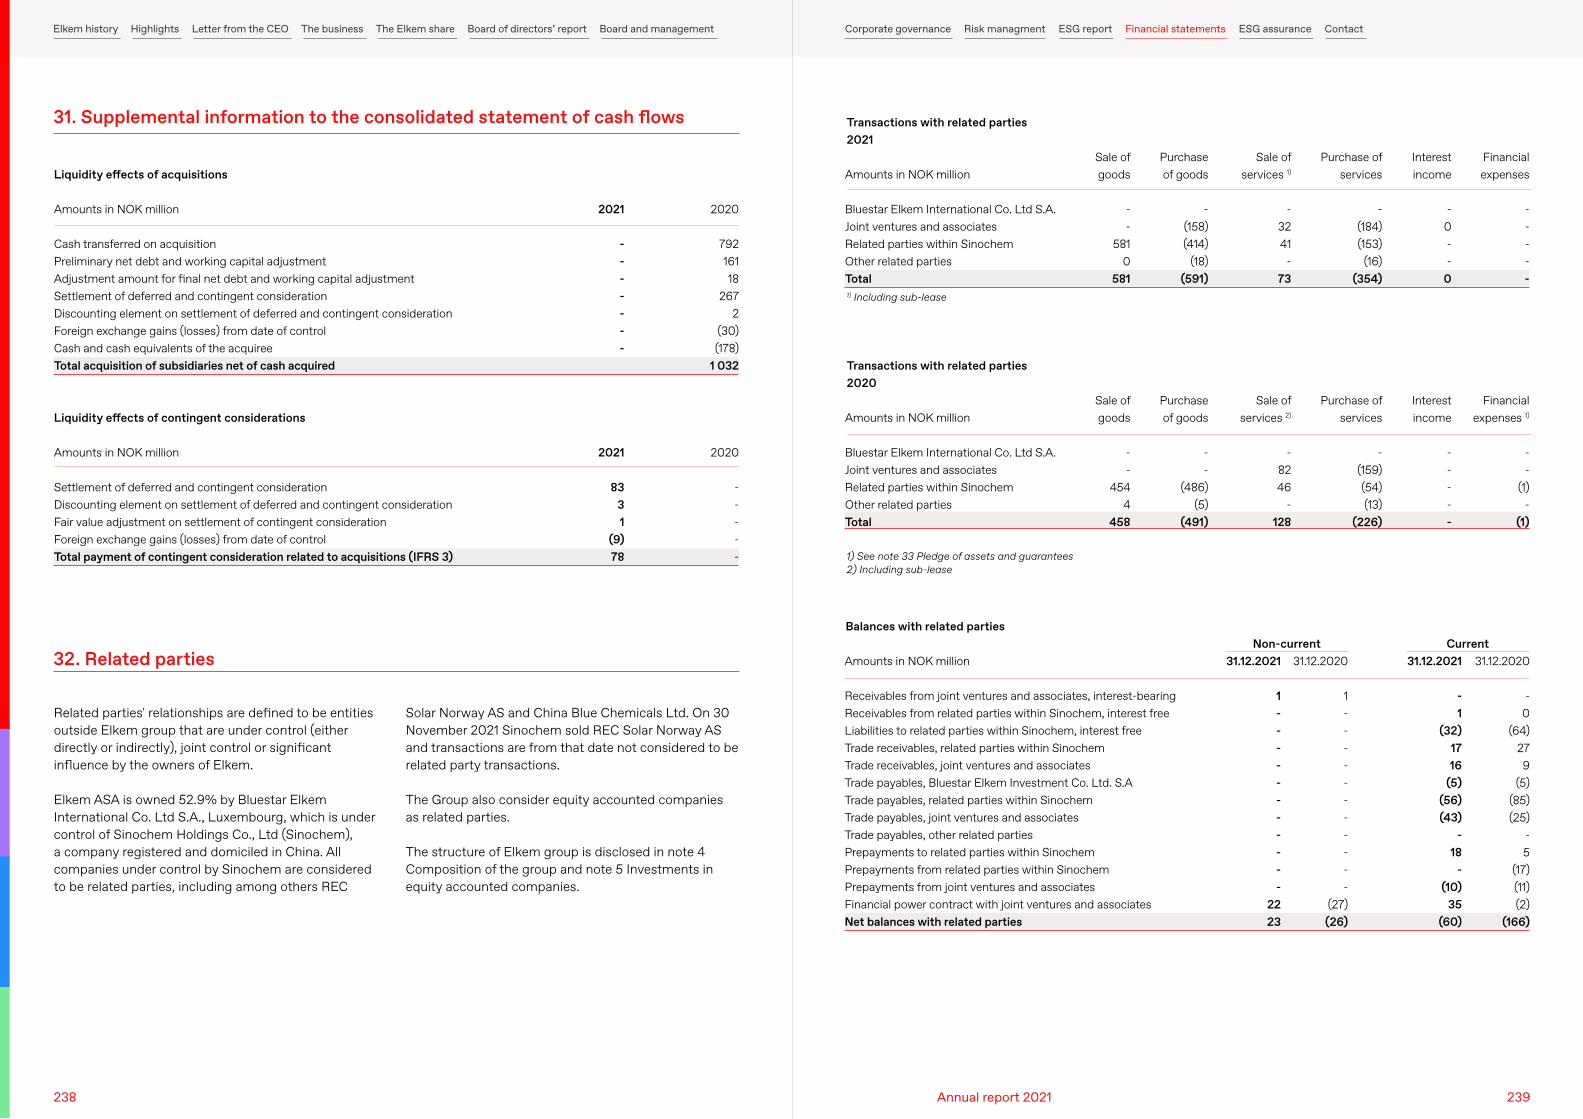
31. Supplemental information to the consolidated statement of cash flows
Liquidity effects of acquisitions
Liquidity effects of contingent considerations
2021
- - - - - - - -
Amounts in NOK million
Cash transferred on acquisitionPreliminary net debt and working capital adjustmentAdjustment amount for final net debt and working capital adjustmentSettlement of deferred and contingent considerationDiscounting element on settlement of deferred and contingent considerationForeign exchange gains (losses) from date of controlCash and cash equivalents of the acquireeTotal acquisition of subsidiaries net of cash acquired
Amounts in NOK million
Settlement of deferred and contingent considerationDiscounting element on settlement of deferred and contingent considerationFair value adjustment on settlement of contingent considerationForeign exchange gains (losses) from date of controlTotal payment of contingent consideration related to acquisitions (IFRS 3)
2020
792 161 18
267 2
(30) (178)
1 032
2020
- - - - -
Related parties' relationships are defined to be entities outside Elkem group that are under control (either directly or indirectly), joint control or significant influence by the owners of Elkem.
Elkem ASA is owned 52.9% by Bluestar Elkem International Co. Ltd S.A., Luxembourg, which is under control of Sinochem Holdings Co., Ltd (Sinochem), a company registered and domiciled in China. All companies under control by Sinochem are considered to be related parties, including among others REC
Solar Norway AS and China Blue Chemicals Ltd. On 30 November 2021 Sinochem sold REC Solar Norway AS and transactions are from that date not considered to be related party transactions.
The Group also consider equity accounted companies as related parties.
The structure of Elkem group is disclosed in note 4 Composition of the group and note 5 Investments in equity accounted companies.
32. Related parties
Amounts in NOK million
Bluestar Elkem International Co. Ltd S.A.Joint ventures and associatesRelated parties within SinochemOther related partiesTotal
Amounts in NOK million
Bluestar Elkem International Co. Ltd S.A.Joint ventures and associatesRelated parties within SinochemOther related partiesTotal
Transactions with related parties2021
Transactions with related parties2020
Purchase of goods
- (158) (414)
(18) (591)
Purchase of goods
- -
(486) (5)
(491)
Interest income
- 0 - -
0
Interest income
- - - - -
Sale of services 1)
- 32 41
- 73
Sale of services 2)
- 82 46
- 128
Financial expenses
- - - - -
Financial expenses 1)
- -
(1) -
(1)
Sale of goods
- -
581 0
581
Sale of goods
- -
454 4
458
Purchase of services
- (184) (153)
(16) (354)
Purchase of services
- (159) (54) (13)
(226)
1) Including sub-lease
1) See note 33 Pledge of assets and guarantees2) Including sub-lease
Amounts in NOK million
Receivables from joint ventures and associates, interest-bearingReceivables from related parties within Sinochem, interest freeLiabilities to related parties within Sinochem, interest freeTrade receivables, related parties within Sinochem Trade receivables, joint ventures and associates Trade payables, Bluestar Elkem Investment Co. Ltd. S.ATrade payables, related parties within SinochemTrade payables, joint ventures and associatesTrade payables, other related partiesPrepayments to related parties within Sinochem Prepayments from related parties within Sinochem Prepayments from joint ventures and associates Financial power contract with joint ventures and associatesNet balances with related parties
Balances with related partiesCurrentNon-current
31.12.2021
- 1
(32) 17 16
(5) (56) (43)
- 18
- (10)
35 (60)
31.12.2020
1 - - - - - - - - - - -
(27) (26)
31.12.2021
1 - - - - - - - - - - -
22 23
31.12.2020
- 0
(64) 27 9
(5) (85) (25)
- 5
(17) (11) (2)
(166)
2021
83 3 1
(9) 78
238 239Annual report 2021
Elkem history Highlights Letter from the CEO The business The Elkem share Board of directors’ report Board and management Corporate governance Risk managment ESG report Financial statements ESG assurance Contact
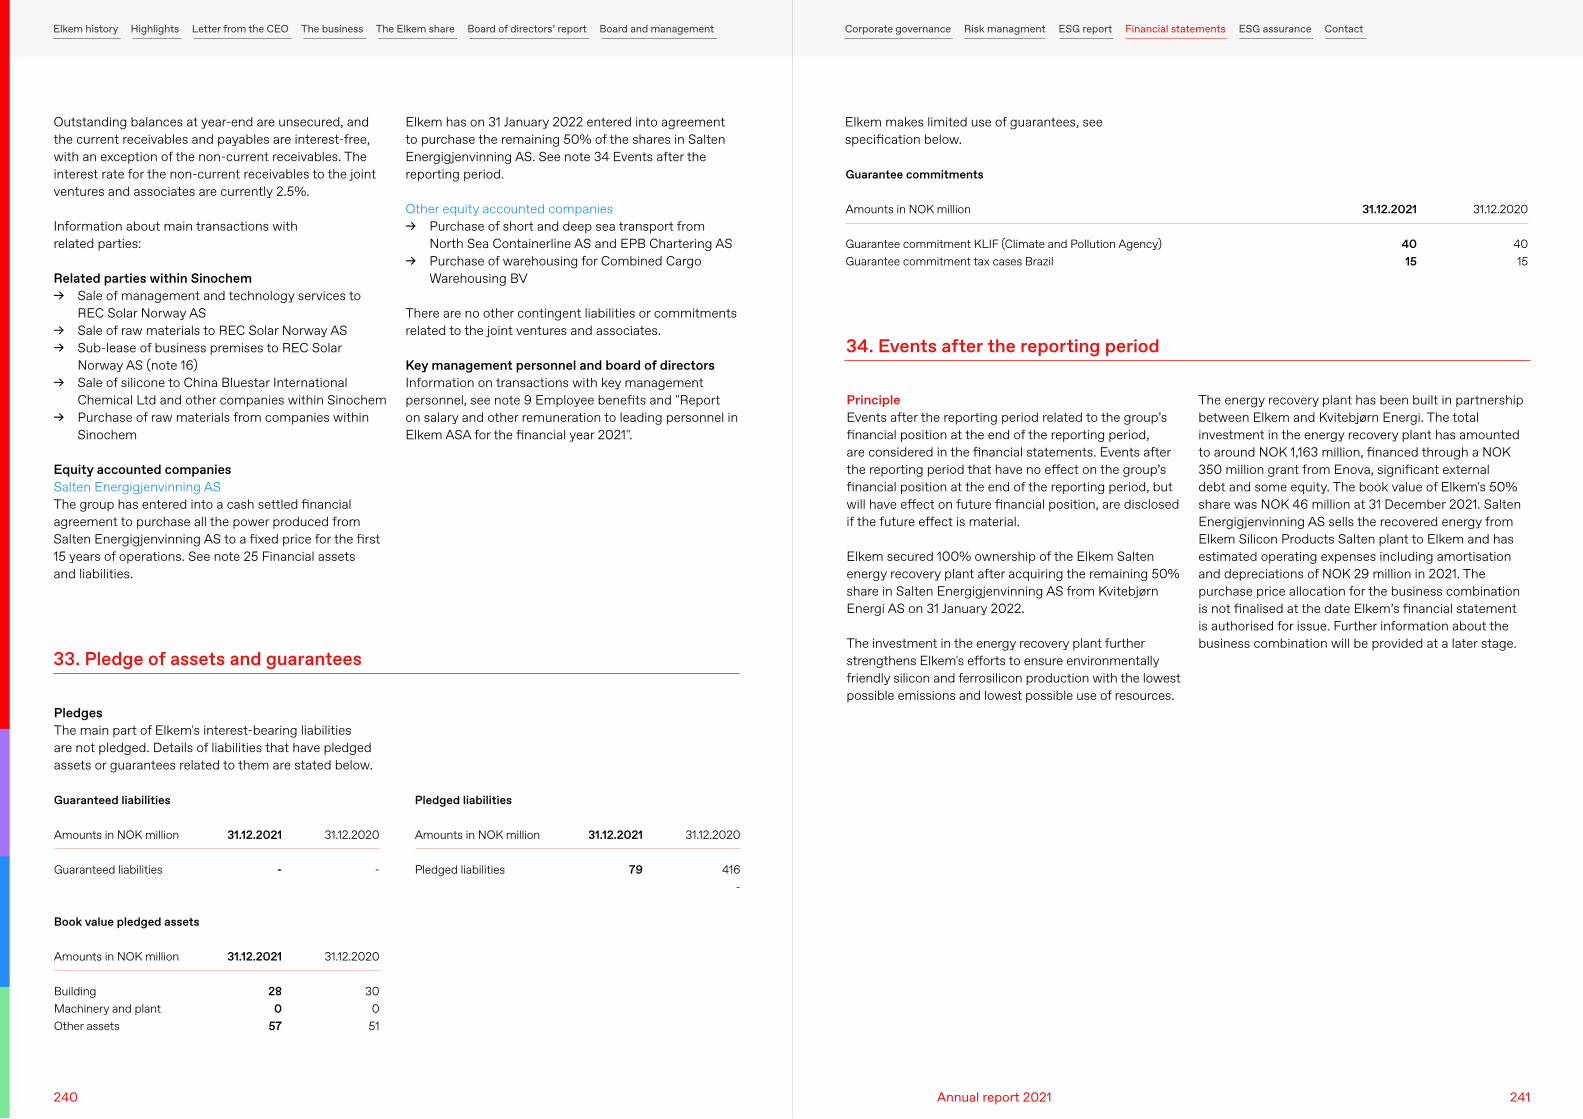
Outstanding balances at year-end are unsecured, and the current receivables and payables are interest-free, with an exception of the non-current receivables. The interest rate for the non-current receivables to the joint ventures and associates are currently 2.5%.
Information about main transactions with related parties:
Related parties within Sinochem → Sale of management and technology services to
REC Solar Norway AS → Sale of raw materials to REC Solar Norway AS → Sub-lease of business premises to REC Solar
Norway AS (note 16) → Sale of silicone to China Bluestar International
Chemical Ltd and other companies within Sinochem → Purchase of raw materials from companies within
Sinochem
Equity accounted companiesSalten Energigjenvinning AS The group has entered into a cash settled financial agreement to purchase all the power produced from Salten Energigjenvinning AS to a fixed price for the first 15 years of operations. See note 25 Financial assets and liabilities.
Elkem has on 31 January 2022 entered into agreement to purchase the remaining 50% of the shares in Salten Energigjenvinning AS. See note 34 Events after the reporting period.
Other equity accounted companies → Purchase of short and deep sea transport from
North Sea Containerline AS and EPB Chartering AS → Purchase of warehousing for Combined Cargo
Warehousing BV
There are no other contingent liabilities or commitments related to the joint ventures and associates.
Key management personnel and board of directorsInformation on transactions with key management personnel, see note 9 Employee benefits and "Report on salary and other remuneration to leading personnel in Elkem ASA for the financial year 2021".
PledgesThe main part of Elkem's interest-bearing liabilities are not pledged. Details of liabilities that have pledged assets or guarantees related to them are stated below.
Elkem makes limited use of guarantees, see specification below.
33. Pledge of assets and guarantees
Guaranteed liabilities
Book value pledged assets
Pledged liabilities
31.12.2021
-
31.12.2021
28 0
57
31.12.2021
79
Amounts in NOK million
Guaranteed liabilities
Amounts in NOK million
BuildingMachinery and plantOther assets
Amounts in NOK million
Pledged liabilities
31.12.2020
-
31.12.2020
30 0
51
31.12.2020
416 -
Guarantee commitments
31.12.2021
40 15
Amounts in NOK million
Guarantee commitment KLIF (Climate and Pollution Agency)Guarantee commitment tax cases Brazil
31.12.2020
40 15
PrincipleEvents after the reporting period related to the group’s financial position at the end of the reporting period, are considered in the financial statements. Events after the reporting period that have no effect on the group’s financial position at the end of the reporting period, but will have effect on future financial position, are disclosed if the future effect is material.
Elkem secured 100% ownership of the Elkem Salten energy recovery plant after acquiring the remaining 50% share in Salten Energigjenvinning AS from Kvitebjørn Energi AS on 31 January 2022.
The investment in the energy recovery plant further strengthens Elkem's efforts to ensure environmentally friendly silicon and ferrosilicon production with the lowest possible emissions and lowest possible use of resources.
The energy recovery plant has been built in partnership between Elkem and Kvitebjørn Energi. The total investment in the energy recovery plant has amounted to around NOK 1,163 million, financed through a NOK 350 million grant from Enova, significant external debt and some equity. The book value of Elkem's 50% share was NOK 46 million at 31 December 2021. Salten Energigjenvinning AS sells the recovered energy from Elkem Silicon Products Salten plant to Elkem and has estimated operating expenses including amortisation and depreciations of NOK 29 million in 2021. The purchase price allocation for the business combination is not finalised at the date Elkem’s financial statement is authorised for issue. Further information about the business combination will be provided at a later stage.
34. Events after the reporting period
240 241Annual report 2021
Elkem history Highlights Letter from the CEO The business The Elkem share Board of directors’ report Board and management Corporate governance Risk managment ESG report Financial statements ESG assurance Contact