seismic performance assessment of stainless steel frames
TRANSCRIPT
Journal of Constructional Steel Research 59 (2003) 1289–1319www.elsevier.com/locate/jcsr
Seismic performance assessment of stainlesssteel frames
L. Di Sarnoa,∗, A.S. Elnashaib, D.A. Nethercotc
a Department of Structural Analysis and Design, University of Naples, Federico II, 80125 Naples, Italyb Department of Civil and Environmental Engineering, University of Illinois, Urbana, IL 61801, USA
c Department of Civil and Environmental Engineering, Imperial College, London SW7 2BU, UK
Abstract
The use of stainless steel for civil engineering structural applications provides possibilities fora more efficient balance between whole-life costs and in-service performance. To achieve a safeand economic design it is necessary to investigate the mechanical response of structural compo-nents, connections and the overall system, thus leading to suitable design provisions. This paperassesses the feasibility of the application of stainless steel in the seismic design of regular andirregular framed structures. Towards this aim, static and dynamic analyses have been carried outon a set of 50 moment resisting frames designed in accordance with the European codes ofpractice (EC3 and EC8). The seismic performance has been assessed in terms of global para-meters, i.e. resistance (base shears, system overstrengths), deformation (interstorey drifts andtranslation ductilities) and energy absorption and redistribution capacity (behaviour factors). Theperformed analyses show that stainless steel is a viable alternative to carbon steel, provided thatproper design choices are employed for the structural configuration and material distributionwithin the members of the adopted systems. The optimal amount of such metal alloy to enhancethe energy absorption capacity is also established on the basis of numerical analyses. 2003 Published by Elsevier Ltd.
Keywords: Steel; Stainless steel; Frames; Seismic design; Structural performance; Overstrength;Behaviour factor
Abbreviations: AFSS, austenitic–ferritic (Duplex) stainless steel; ASS, austenitic stainless steel; CBMR, col-umn-to-beam moment ratio; COV, coefficient of variation; Cr, chromium; CS, carbon steel; FSS, ferriticstainless steel; ID, interstorey drift; IMRF, irregular moment resisting frame; LEPP, linear elastic perfectlyplastic model; LESH, linear elastic strain hardening model; LENLH, linear elastic non-linear hardening model;LS, limit state; MRF, moment resisting frame; MSS, martensitic stainless steel; MSM, multi-surface model;Ni, nickel; OLT, overlay techniques; PHSS, precipitation hardening stainless steel; ROM, Ramberg–Osgoodmodel; RMRF, regular moment resisting frame; SET, moment resisting frame with setback; SI, stability index;SS, stainless steel; UB, universal beam; UC, universal column; ULS, ultimate limit state; YLS, yield limit state
∗ Corresponding author.E-mail address: [email protected] (L. Di Sarno).
0143-974X/03/$ - see front matter 2003 Published by Elsevier Ltd.doi:10.1016/S0143-974X(03)00067-1
1290 L. Di Sarno et al. / Journal of Constructional Steel Research 59 (2003) 1289–1319
Nomenclature
d lateral displacementdtop roof lateral displacementdtop,u roof lateral displacement at ULSdtop,y roof lateral displacement at YLSE0 Young’s modulus at originE0.2 Young’s modulus at proof stressfy yield strengthfu ultimate strengthh Storey heightHtot frame total heightp total vertical loadPcr frame critical loadq behaviour factorT fundamental periodV base shearVD design base shearVU base shear at ULSVY base shear at YLSW frame seismic weightacrit frame elastic critical multiplier� horizontal displacementey yield elongationeu ultimate elongationsy proof stresssu ultimate tensile strength
1. Introduction
Stainless steel (SS) is a metal alloy with a high percentage of chromium (Cr);normal grades are obtained by adding at least 12% by weight to low-alloy carbonsteel. The presence of Cr allows the formation of a protective oxide on the materialsurface (stainless metal). Furthermore, Cr is employed along with nickel (Ni) in theclassification of SS groups (Fig. 1), based on their micro-structure, as follows:
� Austenitic (ASS).� Ferritic (FSS).� Austenitic–ferritic (AFSS) or duplex.� Martensitic (MSS).� Precipitation hardening (PHSS).
These SSs have been produced in the last half century to improve specific material

1291L. Di Sarno et al. / Journal of Constructional Steel Research 59 (2003) 1289–1319
Fig. 1. Schaeffler diagram for stainless steel (after EC3, 1996).
characteristics, e.g. (i) corrosion resistance in harsh environments, (ii) heat resistance,(iii) weldability and (iv) mechanical properties. Their properties are often distinctfrom carbon steel (CS) as discussed below.
The choice of the most suitable type and grade of SS depends upon the requiredcorrosion resistance for the ambient conditions, namely the ‘service environment’[1]. SS life expectancy cannot be separately treated from structural design as in CS[2], but is strictly related to (i) the initial selection of material grade, (ii) the designprocess, (iii) the fabrication route and (iv) the surface finishing and maintenance.Therefore, among the aforementioned sub-groups, the ASS and the AFSS are usuallyemployed for structural applications. So far, the former has been the more success-fully used due to the wide range of available industrial products manufactured fromit. Therefore, ASS has been employed for the structures assessed within this study.
It is noteworthy that the application of SS in ordinary structural systems wasencouraged by recent analytical and experimental studies carried out worldwide [3–6]. However, the design procedures are still in an early stage [1,2] and further devel-opments as well as improvements are required to achieve the desired reliability andcost-effectiveness. The present work assesses the feasibility of the SS applicationfor regular and irregular framed structures, subjected to earthquake ground motions.Firstly, mechanical properties, i.e. static yield and ultimate strengths, material over-strength, elongation and ductility, strain-rate sensitivity and toughness are discussedin order to provide a comprehensive description of the material behaviour for usein the analysis and design of sample frames. Available formulations for materialmodelling under cyclic actions have been investigated with the aim of highlightingmain advantages and drawbacks of each model. Finally, a set of 50 CS, SS and‘hybrid’ (CS & SS) moment resisting frames (MRFs) were designed and assessedthrough elastic static and dynamic analyses and static pushovers. Comparisons of
1292 L. Di Sarno et al. / Journal of Constructional Steel Research 59 (2003) 1289–1319
their structural performance were carried out in order to establish the optimumamount of SS, if any, which enhances the seismic response. The performance ofthe MRFs has been assessed through system overstrengths, interstorey drifts, globaltranslation ductilities and behaviour factors.
2. Material properties
The mechanical characteristics of SS are first discussed and then contrasted CSin order to provide a comprehensive description of material behaviour for use in theanalysis and design of the sample frames.
Uni-axial and multi-axial formulations for cyclic response of CS and SS undercomplex stress states are briefly reviewed to highlight advantages and disadvantagesof each model. Finally, the simplified uni-axial material model employed in thepresent paper is discussed.
2.1. Mechanical characteristics
2.1.1. Static yield and ultimate strengthThe stress–strain response of SS does not show a well-defined yield strength, as
observed in CS, therefore a conventional value of 0.20% offset permanent strain(proof stress) is commonly employed. In addition, its mechanical response is stronglydependent on the material composition. Recent, recent experimental tests carried outon three SS grades, namely 304 and 316 (both ASS) and AFSS, showed that [3–5]:
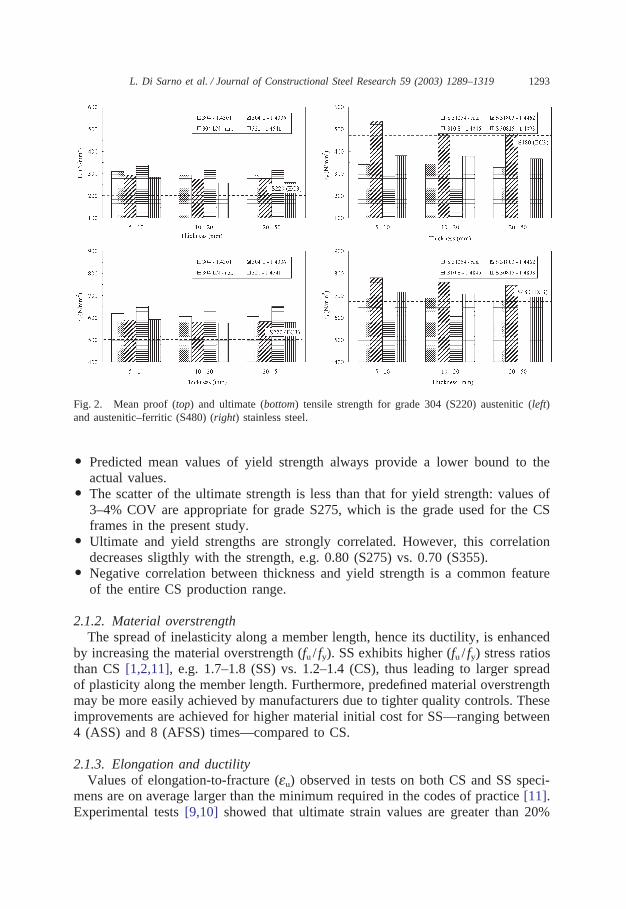
� The strength properties of AFSS are higher than those of ASS: about 1.20 timeshigher for ultimate tensile strength (fu) and about double for yield strength (fy) asshown in Fig. 2, where the SS grades are named in compliance with both Europeanand British standards [1,2]. Minimum strengths required in the Eurocode 3 forgrades S220 (ASS) and S480 (AFSS) are also provided as benchmark values inFig. 2.
� Negligible variations in tensile strength for a given grade with changes in thick-ness have been found for hot-formed plates. Tensile resistance—both proof andultimate strength—is slightly larger for thickness less than 20 mm. This tendencyis more noticeable for lower alloyed grades.
� The variation in the proof stress is generally small for ASS and the greater 0.2%proof stress may occur either in the longitudinal or transverse direction.
� The ultimate strength generally exhibits less scatter than the proof stress.� The strength—both yield and ultimate—depends significantly upon the alloying
elements. Carbon and nitrogen exert the strongest influence, followed by titanium,niobium and copper. The latter components affect ultimate strength more thanyield strength. Other chemical elements have negligible effect on materialstrength.
For CS, it has been recognized [7–10] that for current steel production:
1293L. Di Sarno et al. / Journal of Constructional Steel Research 59 (2003) 1289–1319
Fig. 2. Mean proof (top) and ultimate (bottom) tensile strength for grade 304 (S220) austenitic (left)and austenitic–ferritic (S480) (right) stainless steel.
� Predicted mean values of yield strength always provide a lower bound to theactual values.
� The scatter of the ultimate strength is less than that for yield strength: values of3–4% COV are appropriate for grade S275, which is the grade used for the CSframes in the present study.
� Ultimate and yield strengths are strongly correlated. However, this correlationdecreases sligthly with the strength, e.g. 0.80 (S275) vs. 0.70 (S355).
� Negative correlation between thickness and yield strength is a common featureof the entire CS production range.
2.1.2. Material overstrengthThe spread of inelasticity along a member length, hence its ductility, is enhanced
by increasing the material overstrength (fu / fy). SS exhibits higher (fu / fy) stress ratiosthan CS [1,2,11], e.g. 1.7–1.8 (SS) vs. 1.2–1.4 (CS), thus leading to larger spreadof plasticity along the member length. Furthermore, predefined material overstrengthmay be more easily achieved by manufacturers due to tighter quality controls. Theseimprovements are achieved for higher material initial cost for SS—ranging between4 (ASS) and 8 (AFSS) times—compared to CS.
2.1.3. Elongation and ductilityValues of elongation-to-fracture (eu) observed in tests on both CS and SS speci-
mens are on average larger than the minimum required in the codes of practice [11].Experimental tests [9,10] showed that ultimate strain values are greater than 20%
1294 L. Di Sarno et al. / Journal of Constructional Steel Research 59 (2003) 1289–1319
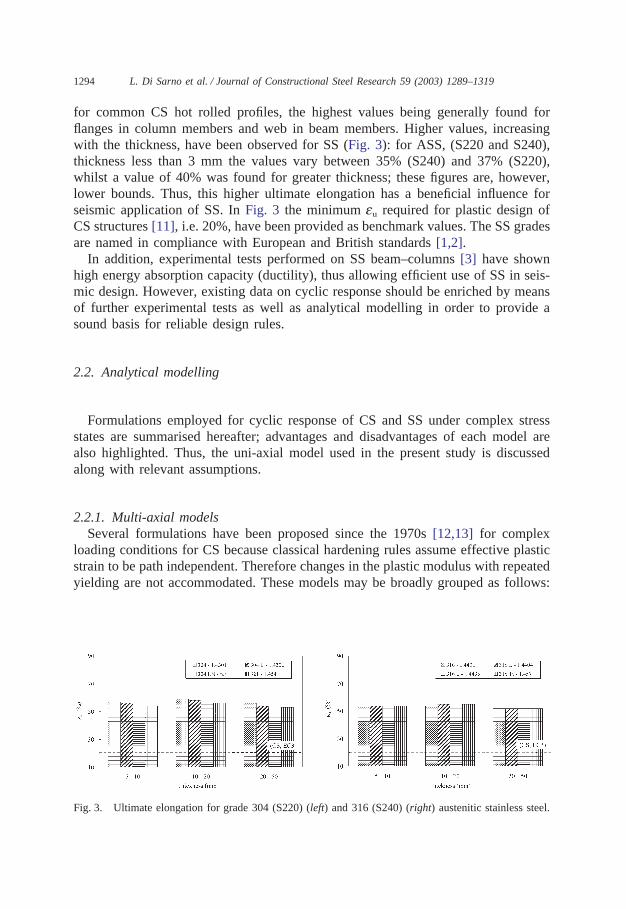
for common CS hot rolled profiles, the highest values being generally found forflanges in column members and web in beam members. Higher values, increasingwith the thickness, have been observed for SS (Fig. 3): for ASS, (S220 and S240),thickness less than 3 mm the values vary between 35% (S240) and 37% (S220),whilst a value of 40% was found for greater thickness; these figures are, however,lower bounds. Thus, this higher ultimate elongation has a beneficial influence forseismic application of SS. In Fig. 3 the minimum eu required for plastic design ofCS structures [11], i.e. 20%, have been provided as benchmark values. The SS gradesare named in compliance with European and British standards [1,2].
In addition, experimental tests performed on SS beam–columns [3] have shownhigh energy absorption capacity (ductility), thus allowing efficient use of SS in seis-mic design. However, existing data on cyclic response should be enriched by meansof further experimental tests as well as analytical modelling in order to provide asound basis for reliable design rules.
2.2. Analytical modelling
Formulations employed for cyclic response of CS and SS under complex stressstates are summarised hereafter; advantages and disadvantages of each model arealso highlighted. Thus, the uni-axial model used in the present study is discussedalong with relevant assumptions.
2.2.1. Multi-axial modelsSeveral formulations have been proposed since the 1970s [12,13] for complex
loading conditions for CS because classical hardening rules assume effective plasticstrain to be path independent. Therefore changes in the plastic modulus with repeatedyielding are not accommodated. These models may be broadly grouped as follows:
Fig. 3. Ultimate elongation for grade 304 (S220) (left) and 316 (S240) (right) austenitic stainless steel.

1295L. Di Sarno et al. / Journal of Constructional Steel Research 59 (2003) 1289–1319
� Overlay (or sub-layer) techniques (OLTs).� Multi-surface models (MSMs).
Both approaches attempt to deal with plastic modulus variability that in cyclicplasticity cannot be expressed simply as a function of the accumulated plastic strainas for the monotonic elasto–plastic transition. Indeed, OLTs describe the materialconstitutive law by means of two or more layers in parallel, each one characterisedby an elastic–perfectly plastic relationship at different yield strength levels. The mainadvantage of this scheme is the improvement of the approximation achieved forhysteretic loops with respect to the bilinear kinematic hardening model.
In MSMs each surface is associated with a specific value of the plastic modulusand is represented in stress space as having a different size but similar shape. Theinnermost surface, corresponding to the initial yield surface, is not allowed to inter-sect the others (each representing continuously changing hardening surface). Duringplastic flow, the domain translates and progressively reaches the outer surfaces, thusrepresenting kinematic hardening. If stress reversal takes place, the inner surfacemoves towards the point on the next surface with equal outwards normal (translationwithout expansion, i.e. isotropic hardening). The MSM simulates successfully thematerial response under transient loading conditions [14]; indeed, it exhibits thefollowing three features:
� Hardening at high strain amplitude.� Softening at low strain amplitude.� Mean-stress relaxation under constant strain amplitudes.
These features result from the different shape of virgin and cyclic curves and arecoupled with relaxation to zero mean stress. This phenomenon (mean stressrelaxation) takes place typically in mild steel (high stacking energy metals), whichconverges to a stabilised saturation loop, which is a function of the cycle amplitude.
To overcome the problems of the standard plasticity models for continua, e.g.isotropic and kinematic hardening, two basic nested boundary surfaces were proposed[14]. These models consist of an inner loading surface (yield surface) and an outerlimit surface (bounding or failure surface); their stress evolution relies upon bothtranslation and expansion (mixed hardening). Provided that the assumptions of equalshapes and rule of translation are satisfied, the above boundary surfaces do not inter-sect each other. Moreover, the evaluation of the plastic modulus may be carried outas a function of the distance between the actual stress point on the inner surface andits conjugate on the external one. Numerical results computed for steel membersunder cyclic loads employing these advanced/refined plasticity models are generallysatisfactory in the range of relatively large strain amplitudes typical of earthquake-induced deformations [15]. Therefore, it is used for the constitutive relationships ofCS and SS in the assessed frames. However, a simplified uni-axial formulation ofMSM is used in the present study as discussed in the next section.
Finally, it is worth mentioning that a further two-surface-based formulation withdistortional rules has recently been proposed [5]; it seems to be well suited for SS
1296 L. Di Sarno et al. / Journal of Constructional Steel Research 59 (2003) 1289–1319
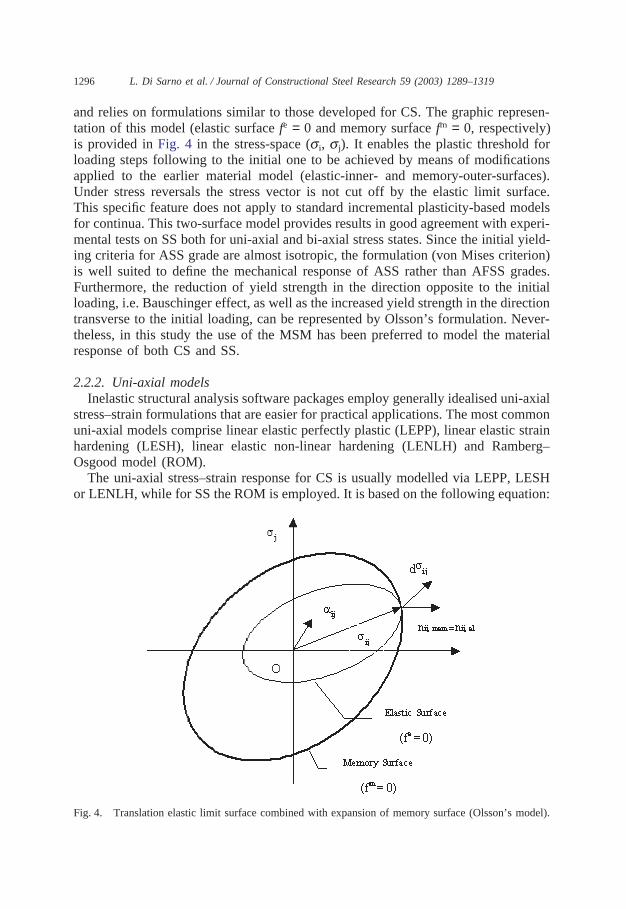
and relies on formulations similar to those developed for CS. The graphic represen-tation of this model (elastic surface fe = 0 and memory surface fm = 0, respectively)is provided in Fig. 4 in the stress-space (si, sj). It enables the plastic threshold forloading steps following to the initial one to be achieved by means of modificationsapplied to the earlier material model (elastic-inner- and memory-outer-surfaces).Under stress reversals the stress vector is not cut off by the elastic limit surface.This specific feature does not apply to standard incremental plasticity-based modelsfor continua. This two-surface model provides results in good agreement with experi-mental tests on SS both for uni-axial and bi-axial stress states. Since the initial yield-ing criteria for ASS grade are almost isotropic, the formulation (von Mises criterion)is well suited to define the mechanical response of ASS rather than AFSS grades.Furthermore, the reduction of yield strength in the direction opposite to the initialloading, i.e. Bauschinger effect, as well as the increased yield strength in the directiontransverse to the initial loading, can be represented by Olsson’s formulation. Never-theless, in this study the use of the MSM has been preferred to model the materialresponse of both CS and SS.
2.2.2. Uni-axial modelsInelastic structural analysis software packages employ generally idealised uni-axial
stress–strain formulations that are easier for practical applications. The most commonuni-axial models comprise linear elastic perfectly plastic (LEPP), linear elastic strainhardening (LESH), linear elastic non-linear hardening (LENLH) and Ramberg–Osgood model (ROM).
The uni-axial stress–strain response for CS is usually modelled via LEPP, LESHor LENLH, while for SS the ROM is employed. It is based on the following equation:
Fig. 4. Translation elastic limit surface combined with expansion of memory surface (Olsson’s model).
1297L. Di Sarno et al. / Journal of Constructional Steel Research 59 (2003) 1289–1319
e � ee � ep �sE0
� c·�ssy�n
(1)
where e is the total strain, expressed as the sum of the elastic and plastic part, s isthe actual stress, E0 the elastic (initial) modulus, sy is a proof stress while c and nare model constants. The latter two parameters should be calibrated through tests oncompression and/or tensile coupons, or more reliably from stub columns using curvefitting [16]. The ROM is characterised by a progressive decrease of the plastic modu-lus and is unsuitable when employed for a limited strain range in the SS uni-axialresponse. Nonetheless, recent experimental investigations [17] carried out on cou-pons from square and rectangular hollow sections and I-sections, showed that theRamberg–Osgood curve matches perfectly the actual (experimental) stress strainrelationship up to the equivalent yield point. Beyond this stress value, the mismatchtends to diverge and hence an improvement of the original formula is required. There-fore, a composite Ramberg–Osgood formula may be used, as follows:
� for s�sy:
e �sE0
� epy·�ssy�n
(2.1)
� for s � sy:
e �s�sy
E0.2� epu·�s�sy
su�sy�n�
� ety (2.2)
where n and n� are parameters calibrated by fitting the experimental curves, epy andepu are plastic strains corresponding to 0.2% proof stress (sy) and ultimate strength(su), respectively, while ety is the total strain corresponding to sy. E0 and E0.2 arethe initial and the proof stress moduli. It is worth noting that the second branch ofthe curve has been derived by employing translation of the coordinate system fromthe origin to the 0.2% stress point and expressing the basic formula in the newreference system.
In the present study, the material response of CS and SS has been modelled byusing uni-axial stress strain relationships of the Petersson and Popov multi-surfaceformulation. The latter employs a mixed isotropic and kinematic hardening rule andhas been successfully adopted for several studies [15,18–20]. Its main advantagewith respect to other simplified models, i.e. bilinear with/without hardening, wasobserved [15] particularly in large strain cyclic amplitudes. Moreover, MSM givesa reliable estimate of the plastic hinge length as opposed to an overestimate of upto 50%, when employing simplified piecewise models, e.g. bilinear ones. Thus, toobtain a realistic prediction of system ductility as well as to achieve a rational rep-resentation of structural (rather than numerical) collapse, MSM is a reliable formu-lation. Therefore, modelling of mechanical response for both CS and SS was carriedout by means of uni-axial stress strain relationships for MSM as implemented inthe finite element method code ADAPTIC [21]. Furthermore, for SS the composite
1298 L. Di Sarno et al. / Journal of Constructional Steel Research 59 (2003) 1289–1319
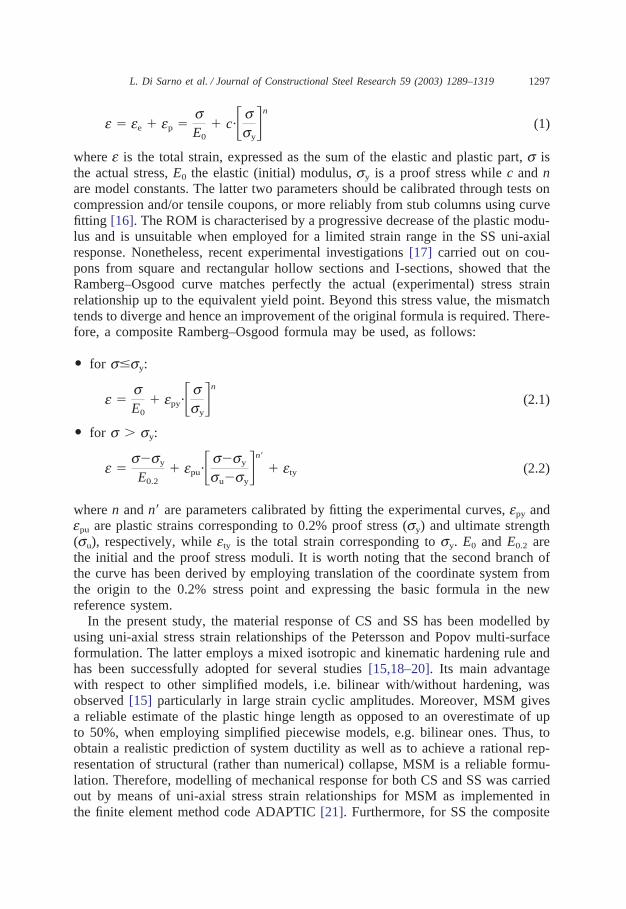
Ramberg–Osgood formulation as expressed in Eq. (2.1) and (2.2) was used to obtainthe skeleton curve. The calibration of the ADAPTIC model parameters relies uponthe definition of the following analytical functions (Fig. 5):
� Monotonic curve (ka-curve).� Cyclic curve (kb-curve).� Weighting function curve (W-curve).
The latter was performed in accordance with previous analytical investigations[15,19] and experimental studies [14,18] for CS. In addition, a compound Ramberg–
Fig. 5. Parameters for MSM: virgin curve (top), cyclic curve (middle) and weighting function curve(bottom).
1299L. Di Sarno et al. / Journal of Constructional Steel Research 59 (2003) 1289–1319
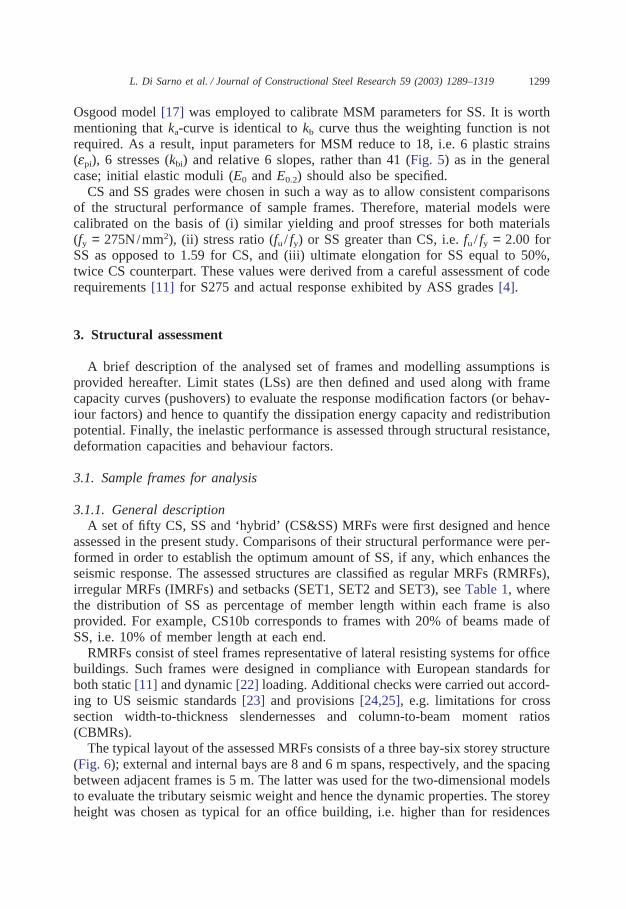
Osgood model [17] was employed to calibrate MSM parameters for SS. It is worthmentioning that ka-curve is identical to kb curve thus the weighting function is notrequired. As a result, input parameters for MSM reduce to 18, i.e. 6 plastic strains(epi), 6 stresses (kbi) and relative 6 slopes, rather than 41 (Fig. 5) as in the generalcase; initial elastic moduli (E0 and E0.2) should also be specified.
CS and SS grades were chosen in such a way as to allow consistent comparisonsof the structural performance of sample frames. Therefore, material models werecalibrated on the basis of (i) similar yielding and proof stresses for both materials(fy = 275N/mm2), (ii) stress ratio (fu / fy) or SS greater than CS, i.e. fu / fy = 2.00 forSS as opposed to 1.59 for CS, and (iii) ultimate elongation for SS equal to 50%,twice CS counterpart. These values were derived from a careful assessment of coderequirements [11] for S275 and actual response exhibited by ASS grades [4].
3. Structural assessment
A brief description of the analysed set of frames and modelling assumptions isprovided hereafter. Limit states (LSs) are then defined and used along with framecapacity curves (pushovers) to evaluate the response modification factors (or behav-iour factors) and hence to quantify the dissipation energy capacity and redistributionpotential. Finally, the inelastic performance is assessed through structural resistance,deformation capacities and behaviour factors.
3.1. Sample frames for analysis
3.1.1. General descriptionA set of fifty CS, SS and ‘hybrid’ (CS&SS) MRFs were first designed and hence
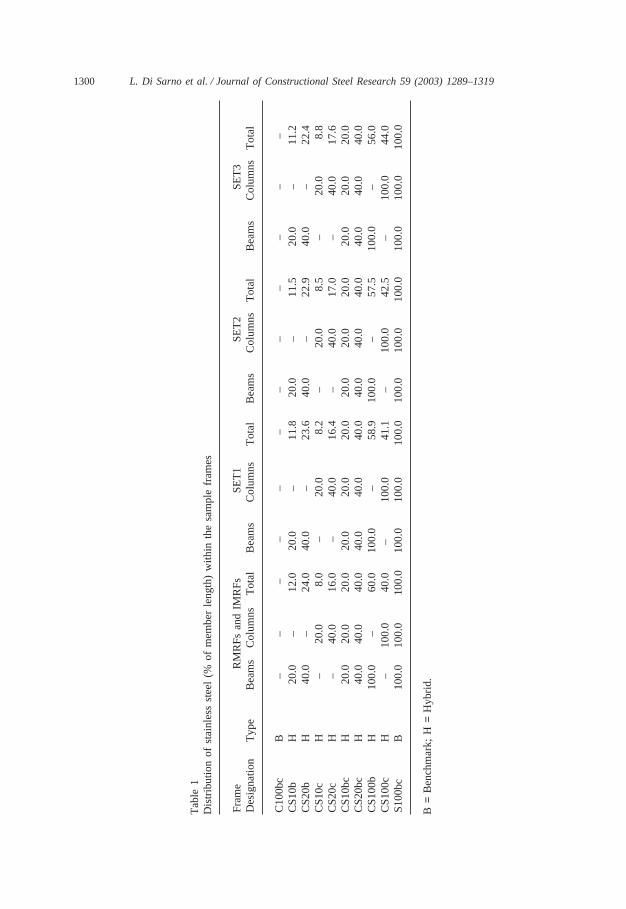
assessed in the present study. Comparisons of their structural performance were per-formed in order to establish the optimum amount of SS, if any, which enhances theseismic response. The assessed structures are classified as regular MRFs (RMRFs),irregular MRFs (IMRFs) and setbacks (SET1, SET2 and SET3), see Table 1, wherethe distribution of SS as percentage of member length within each frame is alsoprovided. For example, CS10b corresponds to frames with 20% of beams made ofSS, i.e. 10% of member length at each end.
RMRFs consist of steel frames representative of lateral resisting systems for officebuildings. Such frames were designed in compliance with European standards forboth static [11] and dynamic [22] loading. Additional checks were carried out accord-ing to US seismic standards [23] and provisions [24,25], e.g. limitations for crosssection width-to-thickness slendernesses and column-to-beam moment ratios(CBMRs).
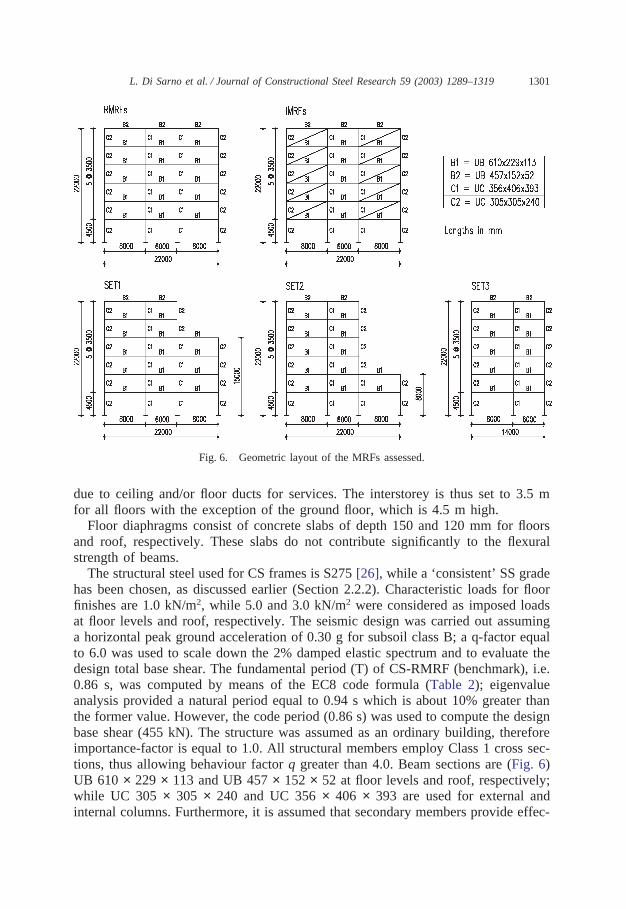
The typical layout of the assessed MRFs consists of a three bay-six storey structure(Fig. 6); external and internal bays are 8 and 6 m spans, respectively, and the spacingbetween adjacent frames is 5 m. The latter was used for the two-dimensional modelsto evaluate the tributary seismic weight and hence the dynamic properties. The storeyheight was chosen as typical for an office building, i.e. higher than for residences
1300 L. Di Sarno et al. / Journal of Constructional Steel Research 59 (2003) 1289–1319
Tab
le1
Dis
trib
utio
nof
stai
nles
sst
eel
(%of
mem
ber
leng
th)
with
inth
esa
mpl
efr
ames
Fram
eR
MR
Fsan
dIM
RFs
SET
1SE
T2
SET
3D
esig
natio
nT
ype
Bea
ms
Col
umns
Tot
alB
eam
sC
olum
nsT
otal
Bea
ms
Col
umns
Tot
alB
eam
sC
olum
nsT
otal
C10
0bc
B–
––
––
––
––
––
–C
S10b
H20
.0–
12.0
20.0
–11
.820
.0–
11.5
20.0
–11
.2C
S20b
H40
.0–
24.0
40.0
–23
.640
.0–
22.9
40.0
–22
.4C
S10c
H–
20.0
8.0
–20
.08.
2–
20.0
8.5
–20
.08.
8C
S20c
H–
40.0
16.0
–40
.016
.4–
40.0
17.0
–40
.017
.6C
S10b
cH
20.0
20.0
20.0
20.0
20.0
20.0
20.0
20.0
20.0
20.0
20.0
20.0
CS2
0bc
H40
.040
.040
.040
.040
.040
.040
.040
.040
.040
.040
.040
.0C
S100
bH
100.
0–
60.0
100.
0–
58.9
100.
0–
57.5
100.
0–
56.0
CS1
00c
H–
100.
040
.0–
100.
041
.1–
100.
042
.5–
100.
044
.0S1
00bc
B10
0.0
100.
010
0.0
100.
010
0.0
100.
010
0.0
100.
010
0.0
100.
010
0.0
100.
0
B=
Ben
chm
ark;
H=
Hyb
rid.
1301L. Di Sarno et al. / Journal of Constructional Steel Research 59 (2003) 1289–1319
Fig. 6. Geometric layout of the MRFs assessed.
due to ceiling and/or floor ducts for services. The interstorey is thus set to 3.5 mfor all floors with the exception of the ground floor, which is 4.5 m high.
Floor diaphragms consist of concrete slabs of depth 150 and 120 mm for floorsand roof, respectively. These slabs do not contribute significantly to the flexuralstrength of beams.
The structural steel used for CS frames is S275 [26], while a ‘consistent’ SS gradehas been chosen, as discussed earlier (Section 2.2.2). Characteristic loads for floorfinishes are 1.0 kN/m2, while 5.0 and 3.0 kN/m2 were considered as imposed loadsat floor levels and roof, respectively. The seismic design was carried out assuminga horizontal peak ground acceleration of 0.30 g for subsoil class B; a q-factor equalto 6.0 was used to scale down the 2% damped elastic spectrum and to evaluate thedesign total base shear. The fundamental period (T) of CS-RMRF (benchmark), i.e.0.86 s, was computed by means of the EC8 code formula (Table 2); eigenvalueanalysis provided a natural period equal to 0.94 s which is about 10% greater thanthe former value. However, the code period (0.86 s) was used to compute the designbase shear (455 kN). The structure was assumed as an ordinary building, thereforeimportance-factor is equal to 1.0. All structural members employ Class 1 cross sec-tions, thus allowing behaviour factor q greater than 4.0. Beam sections are (Fig. 6)UB 610 × 229 × 113 and UB 457 × 152 × 52 at floor levels and roof, respectively;while UC 305 × 305 × 240 and UC 356 × 406 × 393 are used for external andinternal columns. Furthermore, it is assumed that secondary members provide effec-

1302 L. Di Sarno et al. / Journal of Constructional Steel Research 59 (2003) 1289–1319
Tab
le2
Des
ign
para
met
ers
eval
uate
dfo
rth
esa
mpl
efr
ames
Equ
ival
ent
stat
ican
alys
isD
ynam
ican
alys
isT
Fram
eT
(sec
)V
(kN
)V
/W(%
)d/
h(%
)d t
op/H
toT
(%)
CB
MR
Stab
ility
inde
xa
crit
(sec
)d t
op/H
tot
(%)
Min
Max
Min
Max
RM
RFs
0.86
455
13.0
1.40
0.18
2.27
(1)
3.84
(6)
0.03
(6)
0.10
(2)
10.2
0.94
0.10
IMR
Fs0.
8645
513
.00.
900.
062.
25(1
)3.
83(6
)0.
01(6
)0.
06(1
)15
.40.
560.
04SE
T1
0.86
406
13.0
1.29
0.16
1.27
(4)
3.84
(6)
0.04
(6)
0.10
(2)
10.3
0.85
0.09
SET
20.
8634
813
.01.
260.
161.
27(2
)3.
84(6
)0.
04(6
)0.
11(3
)9.
30.
830.
09SE
T3
0.86
290
13.0
1.40
0.17
2.31
(1)
3.84
(6)
0.04
(6)
0.15
(2)
6.9
0.91
0.09
CB
MR
=C
olum
n-to
-bea
mm
omen
tra
tio,a
crit
=fr
ame
criti
cal
mul
tiplie
r.B
rack
eted
valu
esfo
rC
BM
Ran
dst
abili
tyin
dex
corr
espo
ndto
the
floor
leve
l.
1303L. Di Sarno et al. / Journal of Constructional Steel Research 59 (2003) 1289–1319
tive restraint to beam flanges against lateral torsional buckling and adequate stiffenersprevent shear panel distortion in columns and web instability in beams. Local buck-ling, i.e. slenderness ratios for beam–column flanges (c/tf) and webs (d/tw), waschecked on the basis of width-to-thickness ratios provided for hot rolled sections inEuropean [11,22] and American [23,24] standards. The most stringent limits for websand flanges were found satisfactory, e.g. slenderness ratios were compliant with theUS recommendations for special moment frames. Additional checks were performedusing the interaction formula for flange–web coupled buckling [27]. For beam–col-umns different levels of axial loads were considered and the values given by theinteraction formula were not found critical. They range between 0.15 and 0.30, thusthe threshold value (1.0) of the interaction formula is fully satisfied.
Stability indices (SIs) computed for RMRFs in CS (Table 2) show that theseframes do not possess sensitivity to second-order effects, generally named P-�effects, in which P is the total vertical load and � the relative system horizontaldisplacement. The frame critical multiplier P/Pcr is 10.2, in which Pcr is the elasticcritical load value for failure in a sway mode. SIs provided by several codes ofpractice worldwide [22,23], are utilised for framed structures, to compute the elasticcritical vertical load ratio [28]. This ratio is given as P/Pcr; however, the computedvalue of Pcr is a conservative approximation of the buckling load that can be derivedvia eigenvalue analysis [29].
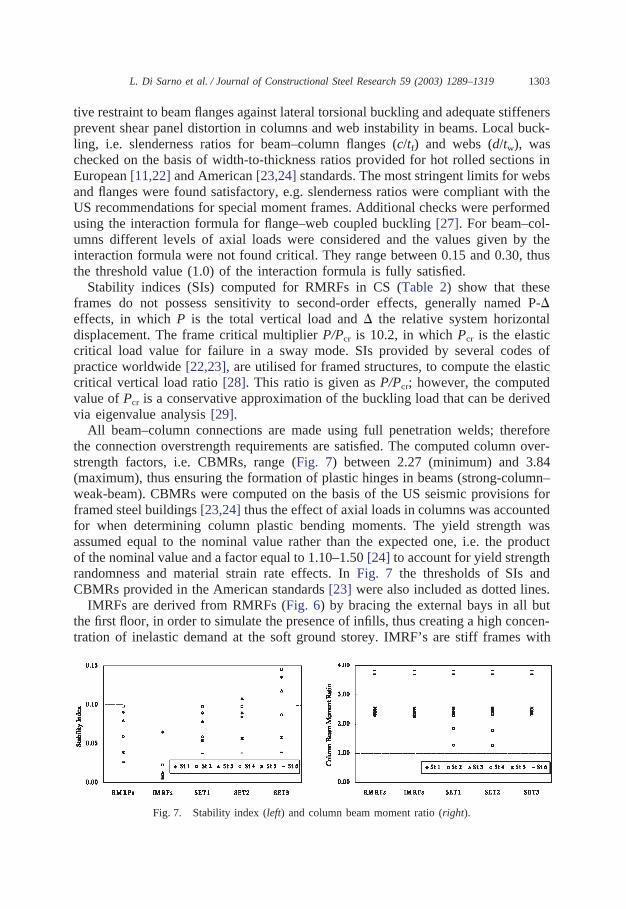
All beam–column connections are made using full penetration welds; thereforethe connection overstrength requirements are satisfied. The computed column over-strength factors, i.e. CBMRs, range (Fig. 7) between 2.27 (minimum) and 3.84(maximum), thus ensuring the formation of plastic hinges in beams (strong-column–weak-beam). CBMRs were computed on the basis of the US seismic provisions forframed steel buildings [23,24] thus the effect of axial loads in columns was accountedfor when determining column plastic bending moments. The yield strength wasassumed equal to the nominal value rather than the expected one, i.e. the productof the nominal value and a factor equal to 1.10–1.50 [24] to account for yield strengthrandomness and material strain rate effects. In Fig. 7 the thresholds of SIs andCBMRs provided in the American standards [23] were also included as dotted lines.
IMRFs are derived from RMRFs (Fig. 6) by bracing the external bays in all butthe first floor, in order to simulate the presence of infills, thus creating a high concen-tration of inelastic demand at the soft ground storey. IMRF’s are stiff frames with
Fig. 7. Stability index (left) and column beam moment ratio (right).

1304 L. Di Sarno et al. / Journal of Constructional Steel Research 59 (2003) 1289–1319
maximum interstorey drifts (d/h) at first floor and the upper storey responding rigidly.For IMRFs in CS the maximum drift d/h is (Fig. 8) 0.90% at first floor and roofdrift non-dimensionalised to the total height, i.e. dtop/Htot, is 0.06%, about 1/3 ofRMRFs in CS. In Fig. 8 the storey drift at serviceability limit state (SLS) as inEurocode 8 [22] has also been provided as a reference.
The set of frames with setbacks (Fig. 6) were derived from RMRFs by suppressingrespectively two (SET1), four (SET2) and six (SET3) floors in the external bay.Thus other frames with irregularities in elevation were obtained; however theirirregularity differs from IMRFs. For the latter the response is influenced mainly bythe concentration of deformation at ground floor and the increase of axial loads incolumns due to braces. In contrast, setbacks may have high inelastic demand through-out the frame height; the detrimental increase of axial loads due to braces is notpresent. CS-SET3 is (Fig. 6) two bay-six storey MRF, which may experience anelevated increase of axial loads in the external columns due to overturning moments.Furthermore, it exhibits sensitivity to second-order effects, i.e. P-� effects: the criti-cal multiplier (acrit) is in fact equal to 6.9, see e.g. Table 2. As a consequence, theset of framed structures, either regular or irregular, assessed in the present study,are representative of a wide design scenario.
3.1.2. Modelling assumptionsElastic and inelastic static (pushover) analyses were performed on the set of 50
regular and irregular CS, SS and hybrid MRFs described in the previous section.Elastic analyses, static and dynamic, were carried out by means of SAP2000 [30],
which is a general purpose finite element program with user-friendly graphic inter-face. Such a program, however, does not allow a detailed description of the non-linear behaviour of materials. Bare frames, employing centreline dimensions, weremodelled as two-dimensional assemblages of elastic beam–column elements. Sheardeformability of beams and columns were included in the linear elastic model. Geo-metric non-linearities, i.e. P-� effects were included within both static and dynamicanalyses. Panel zone strengths and deformations were not considered. Additionalstiffness and strength due to concrete deck slabs were not accounted for in the ana-lysed plane systems; diaphragms are assumed rigid at each floor.
The stiffness of the foundations was assumed to be very high, hence the soil
Fig. 8. Lateral displacements (left) and storey drifts (right).
1305L. Di Sarno et al. / Journal of Constructional Steel Research 59 (2003) 1289–1319
deformability was not included in the structural model (fixed base frames). Dynamicelastic analyses were based upon a 2% equivalent viscous damping because theframes employ welded connections.
The results of linear elastic static design analyses are provided in Figs. 7 and 8and summarised in Table 2. Total base design shears (V), ratios of base shear-to-seismic weight (V/W) along with non-dimensionalised storey (d/h) and roof (dtop/Htot)displacements are included for comparisons. Results of dynamic elastic analysesshowed that higher mode effects are negligible.
Displacement-controlled pushover (static) analyses were performed using ADAP-TIC [21], a program for static and dynamic large displacement non-linear analysisof space frames by adaptive mesh refinement. Further information regarding the pro-gram and its validation can be found elsewhere [15,20]. Modelling of CS and SSwas based on cyclic plasticity formulations as described in Section 2.2.2. In thefinite element models assumed, beams and columns were discretised using six cubicelements, including two short elements at either end. The latter represent 10% ofthe corresponding member lengths. Thus, it was ensured that three Gauss sectionslie within each potential plastic hinge zone, allowing the spread of plasticity acrosssections and along members to be adequately modelled.
The section yield capacity was evaluated in the present work by taking intoaccount moment-thrust interaction for both the beams and the beam–columnelements.
3.2. Limit state criteria
Limit states were defined in order to evaluate response modification factors (orbehaviour factors) and hence to quantify the energy absorption capacity and plasticredistribution for the assessed MRFs. The criteria monitored in each LS were selectedto be consistent with design guidelines provided in modern seismic InternationalCodes [22,23] and recommendations [24,25]. Such criteria were also in agreementwith the values found in previous experimental [31] and numerical [20] studies car-ried out on steel and composite structures.
Two sets of LSs were used to assess the structural performance, namely yieldinglimit state (YLS) and ultimate limit state (ULS); a brief description of these LSs isprovided hereunder.
3.2.1. Yield limit stateThe YLS corresponds to the onset of yielding and identifies a change in the
response mode of the structure. This LS is relatively easy to detect because it isdirectly dependent upon the mechanical properties of the material used and may beevaluated through static analyses. Several structural analysis programs, as e.g.ADAPTIC [21], have the feature of representing the spread of inelasticity within themember cross section and along the member length by utilising fibre approach.Therefore, employing such fibre-based FEM programs, the structural assessment pro-vides extreme fibre stress–strain information for both Gauss points, at each elementof the spatial discretisation and at each step of the calculations.

1306 L. Di Sarno et al. / Journal of Constructional Steel Research 59 (2003) 1289–1319
3.2.2. Ultimate limit stateThe ULS is a measure by which the imminent collapse of the structure is detected.
Abrupt changes in the structural response of framed structures may generally occurat or near collapse. As a consequence, this LS is more difficult to deal with thanthe YLS. A set of local and global measures is therefore required to ensure thatcollapse does not go undetected. These ULSs were selected as follows:
� Local: (i) beam failure, (ii) column failure and (iii) beam–column connection fail-ure.
� Global: (i) interstorey drift, (ii) storey stability, (iii) collapse mechanism formationand (iv) lateral resistance degradation.
However, recent analytical and experimental work has shown [31,32] that theinterstorey drift (ID) (global criterion) is more suitable for certain construction typesthan local (member) failure. This applies also for the current analytical study, wherea 4% ID was deemed critical for RMRFs and frames with setbacks, i.e. SET1, SET2and SET3. The non-uniform stiffening effect that characterises IMRFs introduceshigh axial load in the columns and causes member buckling.
3.3. Performance assessment
3.3.1. Performance parametersThe seismic performance of the sample frames has been assessed in terms of
global parameters, i.e. resistance (base shears, system overstrengths), deformation(interstorey drifts and translation ductilities) and energy absorption and redistributioncapacity (behaviour factors).
System overstrength has been quantified in this study through the following:
� Design overstrength factor representing the strength reserve (VY/VD) that existsbetween the actual structural yield level (VY) in the idealised bilinear force–dis-placement response curve and the lateral strength (VD) as prescribed in seismiccodes of practice and/or recommendations (e.g. [22,33]).
� System overstrength factor expressed as ratio VU/VY of the load that produces theformation of plastic hinge in any member (VY) and the ultimate lateral resist-ance (VU).
Horizontal deflections of the MRFs are monitored herein through two quantities,i.e. interstorey drift and global translation ductility (du,top/dy,top). Such quantities allowthe concentrations of high inelastic demands along the frame height to be detected.
Seismic forces are evaluated in modern codes from an elastic response spectrumemploying the response modification factor (R in the US codes and guidelines) orbehaviour factor (q in the Eurocodes). Such all-embracing factor accounts forinherent ductility, overstrength and damping of structures. Therefore, this responseparameter is calculated for the sample frames to obtain a relative measure of theirseismic energy absorption capacity and redistribution potential. Several definitions

1307L. Di Sarno et al. / Journal of Constructional Steel Research 59 (2003) 1289–1319
exist in the literature [34]. Hereafter, the force reduction factor ‘supply’ [35] isutilised.
A recent study [36] proposed the definition of R-factor as product of the follow-ing terms:
R �VE
VD
� R�·Rm·RR (3.1)
in which VE is the elastic base shear computed from the elastic response spectrumand VD is the design base shear for the inelastic response. R� is the strength factorand is defined as the ratio between the supply resistance and design resistance, alsoconsidered as an overstrength factor. Rm is the ductility factor, i.e. the ratio of themaximum inelastic force to the yield force required to limit the maximum inelasticresponse to a displacement ductility m. RR is the redundancy factor introduced toaccount for the number and distribution of active plastic hinges. Structures withsimilar resistance exhibit different reliability because of the different number of plas-tic hinges. Overstrength and redundancy are generally considered as one componentbecause R� accounts implicitly for redundancy through redistribution of actions,which gives rise to higher overstrength. As a consequence, the force reduction factormay be defined as the product of two components only, i.e. the overstrength R� andthe ductility factor Rm as follows:
R �VE
VD
� R�·Rm (3.2)
In the present study the definition of the behaviour factor (q) used is similar tothat in Eq. (3.2), i.e. the ratio of the ultimate and design base shear:
q1 �VU
VD
(4)
Additionally, two more definitions have been employed to quantify the systemenergy absorption capacity and plastic redistribution. The following relationship hasbeen used for the parameter q:
q2 � Rs1·du,top
dy,top(5.1)
with the coefficient Rs1 given by:
Rs1 �VU
VD·qcode(5.2)
where qcode is the value provided by the design standards [22]; it is assumed equalto 6.0 for the sample frames in this study. The q-factor has also been defined as:
q3 � Rs2·du,top
dy,top(6.1)
where Rs2 is as follows:
1308 L. Di Sarno et al. / Journal of Constructional Steel Research 59 (2003) 1289–1319
Rs2 �VU
VY·
VY
VD·qcode(6.2)
It is instructive to note that relationships expressed by eqns. 6.1 and 6.2 providerealistic values. In particular, they give rise to q-factors close to the design value(6.0) and hence it is used hereafter for the comparisons between CS, SS and hybrid(CS&SS) MRFs.
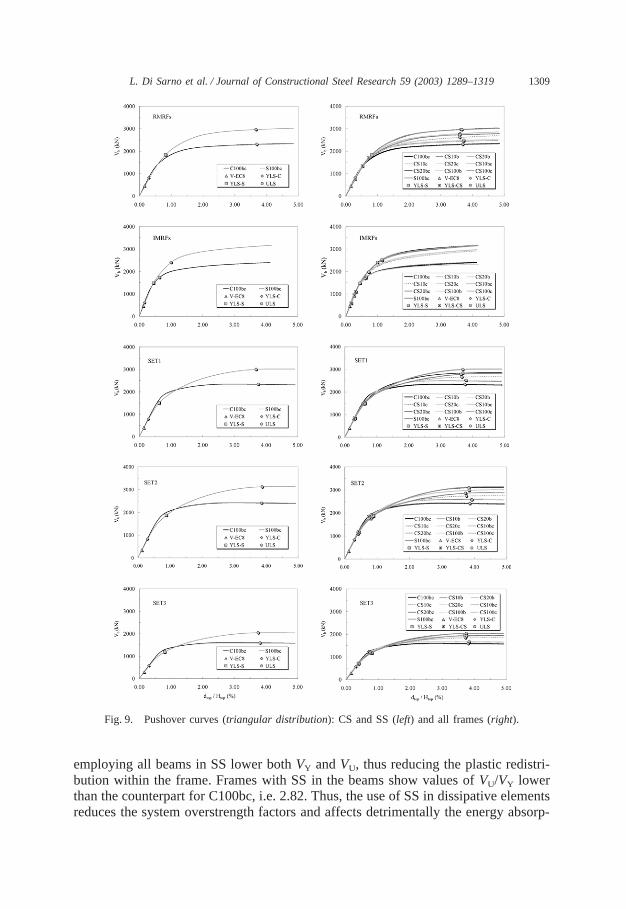
3.3.2. System overstrengthsThe attainment of YLSs and ULSs has been indicated on the capacity curves (Fig.
9), thus allowing comparisons between the assessed frame configurations. Occur-rence of first yield is governed by CS maximum strain at the extreme fibre ofH-sections. This finding applies to all hybrid RMRFs, IMRFs as well as frames withsetbacks (SET1, SET2 and SET3). Furthermore, the first yield and hence the forma-tion of the first plastic hinge for C100bc (benchmark) was observed in the beamsat the roof level. This is, however, not the case for S100bc and CS10bc which exhibityielding in central first-storey beam. The yielding was found in central first floorcolumn for CS10b, CS20b and CS100b. Therefore, it follows that all MRFs possesssignificant overstrength (Fig. 9) due to the delay in the formation of the first plastichinge. Furthermore, the round-house s–e behaviour of SS causes the system lateralresistance to continue to increase, even at large drifts as shown in Fig. 9.
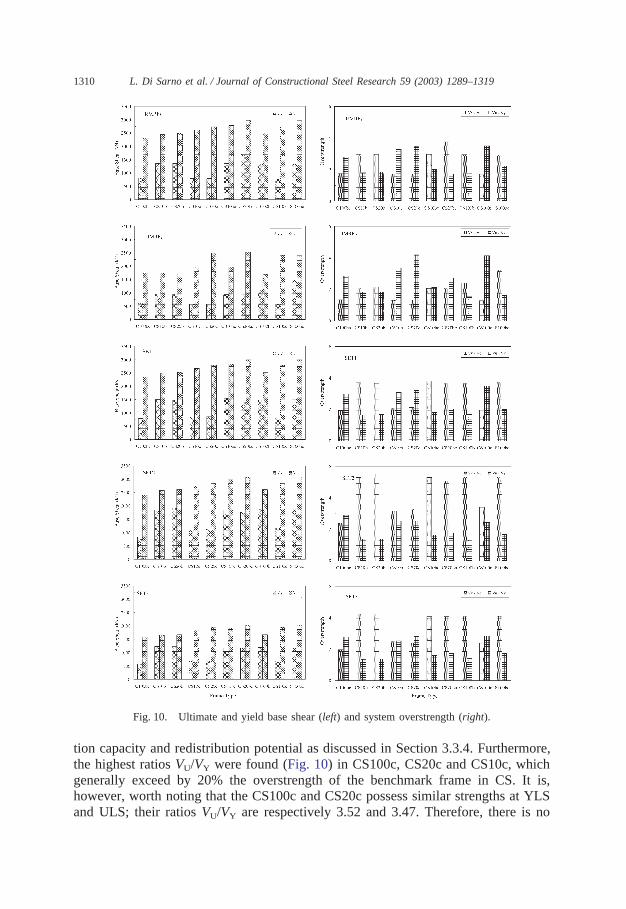
The computed values of global overstrengths, namely design and system over-strength factors defined in Section 3.3.1, are provided in Fig. 10. Mean values andcoefficients of variation of such factors are summarised in Table 3. For each frametype, the values were computed as mean and COVs of the ratios VU/VY and VY/VD
relative to RMRFs, IMRFs and setbacks (SET1, SET2 and SET3). It is noted thatthe COVs vary between 0.15 (VU/VY) and 0.30 (VY/VD); they increase as a functionof the amount of SS. Therefore, the latter renders the strength reserve more disperse.Mean values of the ratios VY/VD and VU/VY are around 3.0 and 2.3, respectively.
In the case of RMRFs the first significant yielding, i.e. VY, increases on averageby 65% for the hybrid and the basic configurations employing SS, except for theCS10c, CS20c and CS100c (Fig. 10). The latter are characterised by slight reductions(less than 5%) of the yield base shear with regard to S100bc. Moreover, frameCS20bc exhibits a yield force twice that of the benchmark, i.e.1716 kN (CS20bc)vs. 819 kN (C100bc). This difference in response may be attributed to the stressdistribution in the softer axially loaded members in the elastic range. Therefore,increasing the amount of SS gives rise to a higher reserve of the global (or system)resistance capacity, thus implying a safer design with regard to CS. Nevertheless,to achieve an economic design reduced cross sections of the SS components shouldbe employed.
Design overstrength factors (VY/VD) are a function of the SS in the beams. FramesCS10c, CS20c and CS100c exhibit VY/VD close to 1.80, which is the value computedfor the CS frame, while values twice as high were found in CS10b, CS20b, CS10bc,CS20bc and CS100b.
The increase of SS in columns enhances the ultimate base shear (VU); in contrast,
1309L. Di Sarno et al. / Journal of Constructional Steel Research 59 (2003) 1289–1319
Fig. 9. Pushover curves (triangular distribution): CS and SS (left) and all frames (right).
employing all beams in SS lower both VY and VU, thus reducing the plastic redistri-bution within the frame. Frames with SS in the beams show values of VU/VY lowerthan the counterpart for C100bc, i.e. 2.82. Thus, the use of SS in dissipative elementsreduces the system overstrength factors and affects detrimentally the energy absorp-
1310 L. Di Sarno et al. / Journal of Constructional Steel Research 59 (2003) 1289–1319
Fig. 10. Ultimate and yield base shear (left) and system overstrength (right).
tion capacity and redistribution potential as discussed in Section 3.3.4. Furthermore,the highest ratios VU/VY were found (Fig. 10) in CS100c, CS20c and CS10c, whichgenerally exceed by 20% the overstrength of the benchmark frame in CS. It is,however, worth noting that the CS100c and CS20c possess similar strengths at YLSand ULS; their ratios VU/VY are respectively 3.52 and 3.47. Therefore, there is no
1311L. Di Sarno et al. / Journal of Constructional Steel Research 59 (2003) 1289–1319
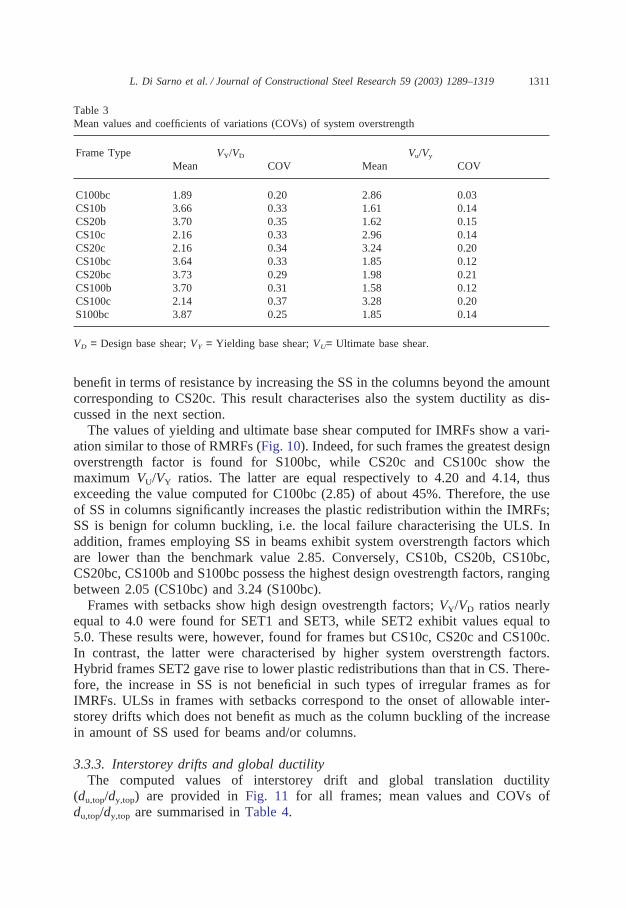
Table 3Mean values and coefficients of variations (COVs) of system overstrength
Frame Type VY/VD Vu/Vy
Mean COV Mean COV
C100bc 1.89 0.20 2.86 0.03CS10b 3.66 0.33 1.61 0.14CS20b 3.70 0.35 1.62 0.15CS10c 2.16 0.33 2.96 0.14CS20c 2.16 0.34 3.24 0.20CS10bc 3.64 0.33 1.85 0.12CS20bc 3.73 0.29 1.98 0.21CS100b 3.70 0.31 1.58 0.12CS100c 2.14 0.37 3.28 0.20S100bc 3.87 0.25 1.85 0.14
VD = Design base shear; VY = Yielding base shear; VU= Ultimate base shear.
benefit in terms of resistance by increasing the SS in the columns beyond the amountcorresponding to CS20c. This result characterises also the system ductility as dis-cussed in the next section.
The values of yielding and ultimate base shear computed for IMRFs show a vari-ation similar to those of RMRFs (Fig. 10). Indeed, for such frames the greatest designoverstrength factor is found for S100bc, while CS20c and CS100c show themaximum VU/VY ratios. The latter are equal respectively to 4.20 and 4.14, thusexceeding the value computed for C100bc (2.85) of about 45%. Therefore, the useof SS in columns significantly increases the plastic redistribution within the IMRFs;SS is benign for column buckling, i.e. the local failure characterising the ULS. Inaddition, frames employing SS in beams exhibit system overstrength factors whichare lower than the benchmark value 2.85. Conversely, CS10b, CS20b, CS10bc,CS20bc, CS100b and S100bc possess the highest design ovestrength factors, rangingbetween 2.05 (CS10bc) and 3.24 (S100bc).
Frames with setbacks show high design ovestrength factors; VY/VD ratios nearlyequal to 4.0 were found for SET1 and SET3, while SET2 exhibit values equal to5.0. These results were, however, found for frames but CS10c, CS20c and CS100c.In contrast, the latter were characterised by higher system overstrength factors.Hybrid frames SET2 gave rise to lower plastic redistributions than that in CS. There-fore, the increase in SS is not beneficial in such types of irregular frames as forIMRFs. ULSs in frames with setbacks correspond to the onset of allowable inter-storey drifts which does not benefit as much as the column buckling of the increasein amount of SS used for beams and/or columns.
3.3.3. Interstorey drifts and global ductilityThe computed values of interstorey drift and global translation ductility
(du,top/dy,top) are provided in Fig. 11 for all frames; mean values and COVs ofdu,top/dy,top are summarised in Table 4.
1312 L. Di Sarno et al. / Journal of Constructional Steel Research 59 (2003) 1289–1319
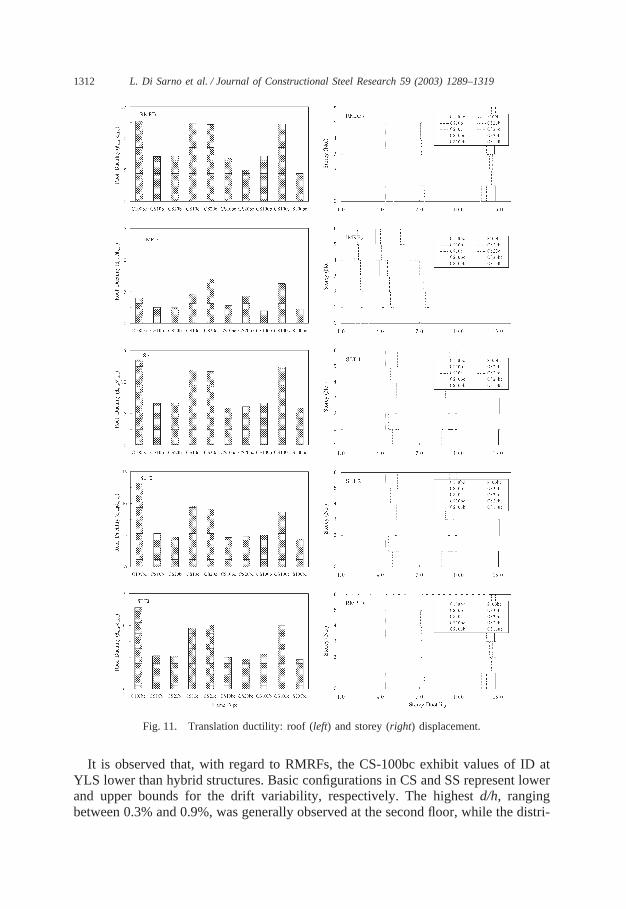
Fig. 11. Translation ductility: roof (left) and storey (right) displacement.
It is observed that, with regard to RMRFs, the CS-100bc exhibit values of ID atYLS lower than hybrid structures. Basic configurations in CS and SS represent lowerand upper bounds for the drift variability, respectively. The highest d/h, rangingbetween 0.3% and 0.9%, was generally observed at the second floor, while the distri-
1313L. Di Sarno et al. / Journal of Constructional Steel Research 59 (2003) 1289–1319
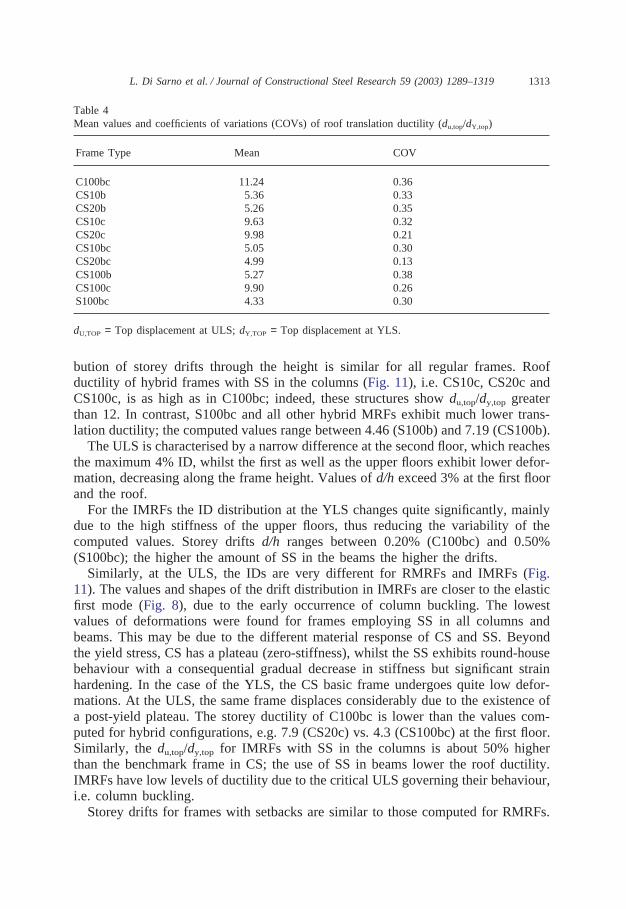
Table 4Mean values and coefficients of variations (COVs) of roof translation ductility (du,top/dY,top)
Frame Type Mean COV
C100bc 11.24 0.36CS10b 5.36 0.33CS20b 5.26 0.35CS10c 9.63 0.32CS20c 9.98 0.21CS10bc 5.05 0.30CS20bc 4.99 0.13CS100b 5.27 0.38CS100c 9.90 0.26S100bc 4.33 0.30
dU,TOP = Top displacement at ULS; dY,TOP = Top displacement at YLS.
bution of storey drifts through the height is similar for all regular frames. Roofductility of hybrid frames with SS in the columns (Fig. 11), i.e. CS10c, CS20c andCS100c, is as high as in C100bc; indeed, these structures show du,top/dy,top greaterthan 12. In contrast, S100bc and all other hybrid MRFs exhibit much lower trans-lation ductility; the computed values range between 4.46 (S100b) and 7.19 (CS100b).
The ULS is characterised by a narrow difference at the second floor, which reachesthe maximum 4% ID, whilst the first as well as the upper floors exhibit lower defor-mation, decreasing along the frame height. Values of d/h exceed 3% at the first floorand the roof.
For the IMRFs the ID distribution at the YLS changes quite significantly, mainlydue to the high stiffness of the upper floors, thus reducing the variability of thecomputed values. Storey drifts d/h ranges between 0.20% (C100bc) and 0.50%(S100bc); the higher the amount of SS in the beams the higher the drifts.
Similarly, at the ULS, the IDs are very different for RMRFs and IMRFs (Fig.11). The values and shapes of the drift distribution in IMRFs are closer to the elasticfirst mode (Fig. 8), due to the early occurrence of column buckling. The lowestvalues of deformations were found for frames employing SS in all columns andbeams. This may be due to the different material response of CS and SS. Beyondthe yield stress, CS has a plateau (zero-stiffness), whilst the SS exhibits round-housebehaviour with a consequential gradual decrease in stiffness but significant strainhardening. In the case of the YLS, the CS basic frame undergoes quite low defor-mations. At the ULS, the same frame displaces considerably due to the existence ofa post-yield plateau. The storey ductility of C100bc is lower than the values com-puted for hybrid configurations, e.g. 7.9 (CS20c) vs. 4.3 (CS100bc) at the first floor.Similarly, the du,top/dy,top for IMRFs with SS in the columns is about 50% higherthan the benchmark frame in CS; the use of SS in beams lower the roof ductility.IMRFs have low levels of ductility due to the critical ULS governing their behaviour,i.e. column buckling.
Storey drifts for frames with setbacks are similar to those computed for RMRFs.
1314 L. Di Sarno et al. / Journal of Constructional Steel Research 59 (2003) 1289–1319
At YLS, CS and SS frames possess the lowest and highest deformability, respect-ively; the drifts range between 0.26% (SET1) and 0.95% (SET3). In SET2 the distri-bution of d/h as a function of the amount of SS is less uniform than in SET1 andSET3. This response may be due to the particular geometry of the assessed setbacks.Frame SET2 (Fig. 6) has only two storeys with three bays while SET1 has a setbackat the top floors and SET3 is a two bay MRF. At ULS the SS setbacks show lowerd/h throughout the height than CS counterparts. Drifts range between 3.4% and 4.0%,which corresponds to the ULS; the onset of such LS was found at the second floorfor SET1 and SET3, while SET2 shows the 4% ID simultaneously between thesecond and fourth storey. The roof ductility (Fig. 11) presents the same variation asfor RMRFs; however, the values computed for SET2 are slightly lower.
Computed mean values of du,top/dy,top (Table 4) confirm the ductile behaviour ofthe hybrid configurations. Frames CS10c, CS20c and CS100c show roof ductility ashigh as C100bc, whilst for the other MRFs the ductility drops by an average of 50%.These results may be explained in the light of the values of the drifts relative at theYLS as discussed above. For all frames but CS20bc the values of COVs are high;their average is 0.30, thus confirming the variability of the roof ductility parameter.
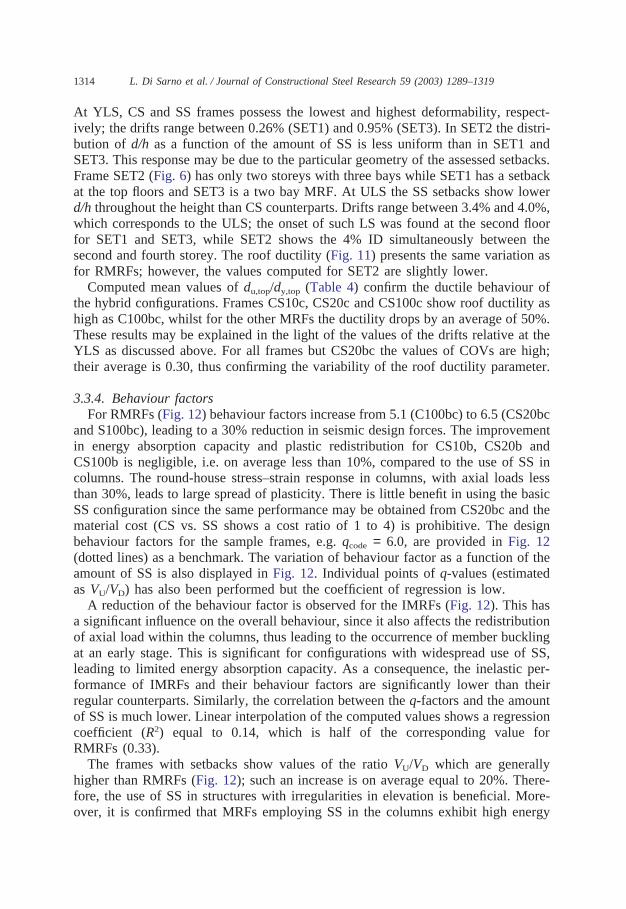
3.3.4. Behaviour factorsFor RMRFs (Fig. 12) behaviour factors increase from 5.1 (C100bc) to 6.5 (CS20bc
and S100bc), leading to a 30% reduction in seismic design forces. The improvementin energy absorption capacity and plastic redistribution for CS10b, CS20b andCS100b is negligible, i.e. on average less than 10%, compared to the use of SS incolumns. The round-house stress–strain response in columns, with axial loads lessthan 30%, leads to large spread of plasticity. There is little benefit in using the basicSS configuration since the same performance may be obtained from CS20bc and thematerial cost (CS vs. SS shows a cost ratio of 1 to 4) is prohibitive. The designbehaviour factors for the sample frames, e.g. qcode = 6.0, are provided in Fig. 12(dotted lines) as a benchmark. The variation of behaviour factor as a function of theamount of SS is also displayed in Fig. 12. Individual points of q-values (estimatedas VU/VD) has also been performed but the coefficient of regression is low.
A reduction of the behaviour factor is observed for the IMRFs (Fig. 12). This hasa significant influence on the overall behaviour, since it also affects the redistributionof axial load within the columns, thus leading to the occurrence of member bucklingat an early stage. This is significant for configurations with widespread use of SS,leading to limited energy absorption capacity. As a consequence, the inelastic per-formance of IMRFs and their behaviour factors are significantly lower than theirregular counterparts. Similarly, the correlation between the q-factors and the amountof SS is much lower. Linear interpolation of the computed values shows a regressioncoefficient (R2) equal to 0.14, which is half of the corresponding value forRMRFs (0.33).
The frames with setbacks show values of the ratio VU/VD which are generallyhigher than RMRFs (Fig. 12); such an increase is on average equal to 20%. There-fore, the use of SS in structures with irregularities in elevation is beneficial. More-over, it is confirmed that MRFs employing SS in the columns exhibit high energy
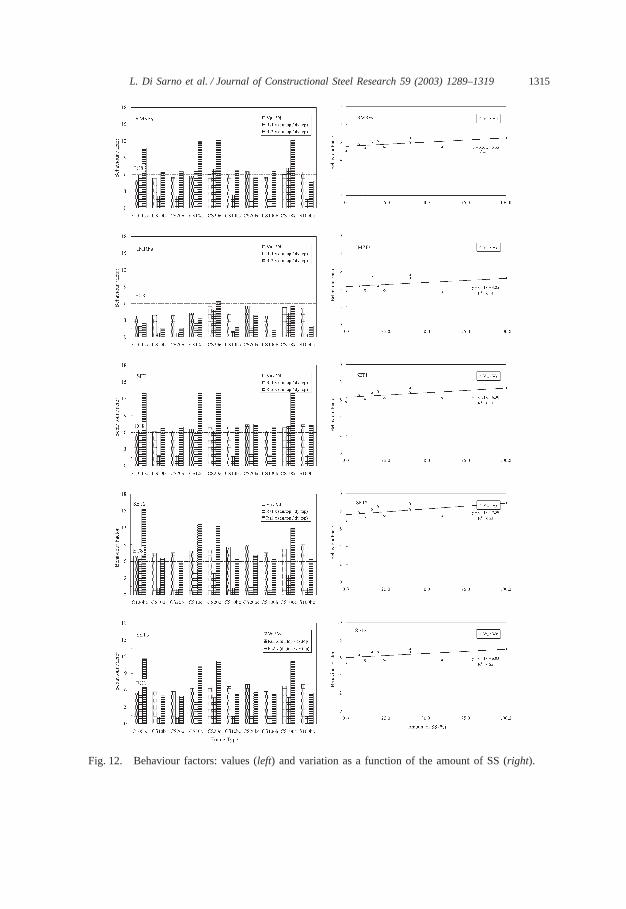
1315L. Di Sarno et al. / Journal of Constructional Steel Research 59 (2003) 1289–1319
Fig. 12. Behaviour factors: values (left) and variation as a function of the amount of SS (right).

1316 L. Di Sarno et al. / Journal of Constructional Steel Research 59 (2003) 1289–1319
absorption capacity and plastic redistribution. The increase is about 14% for CS10cand 20% for CS10c with regard to the benchmark CS frames. It is also instructiveto observe that frames with all columns in SS (CS100c) possess the same values ofVU/VD. Similarly the systems employing 10, 20 and 100% respectively, of SS in thebeams have the dissipation capacity.
Mean values and COVs of behaviour factors for the sample of assessed framesare provided in Table 5. The dispersion of the data is similar for all the structures,i.e. the COVs is about 0.20. The increase of behaviour factor depends significantlyupon the spreading of the SS within the members. The higher the amount of SS inthe columns the higher the behaviour factor and hence the higher are the energyabsorption and redistribution capacity. For example, the frames CS20c, CS20bc andCS100c exhibit ratios VU/VD which are 20–30% higher than the C100bc. Conversely,the use of SS in beams does not enhance the inelastic performance; increases as lowas 5% were found for CS10b, CS20b and CS100b. As a result, the computed meanvales of behaviour factors show that that benefits can arise by spreading SS in thecolumns and that the optimal amount of metal corresponds to 40% of the memberlength, i.e. 20% at each column end.
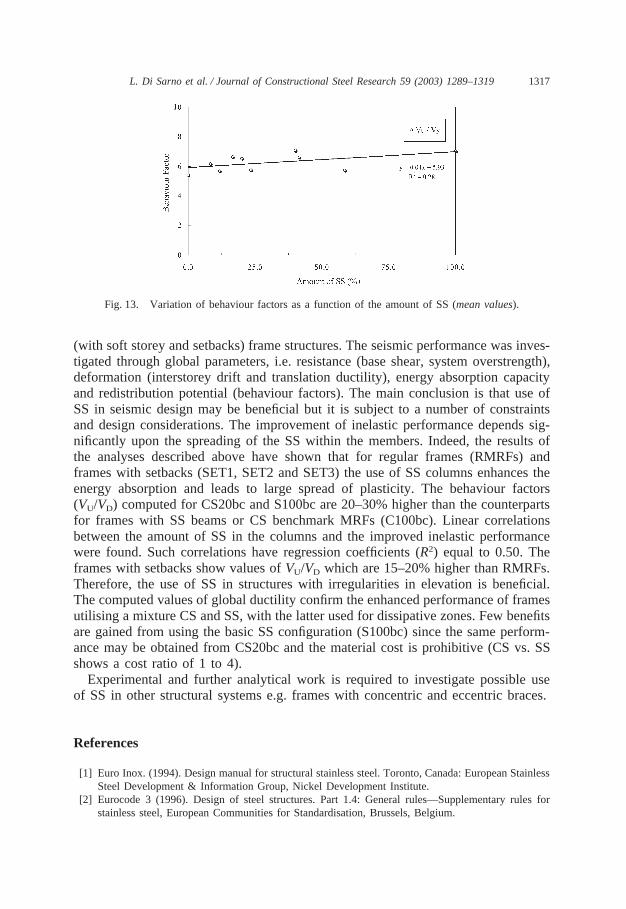
Finally, the increase of behaviour factors as a function of the amount of SSdepicted in Fig. 13 shows that the variation is nearly linear with a regression coef-ficient R2 of 0.28. The R2 increases to 0.51 if the frames with SS in beams are notincluded in the regression analysis, thus showing higher correlation between theamount of alloy in the columns and enhanced energy absorption and redistributionpotential.
4. Conclusions
In this paper the feasibility of employing SS in seismic design was assessed byperforming static inelastic analyses (pushovers) on a set of 50 regular and irregular
Table 5Mean values and coefficients of variations (COVs) of behaviour factors (VU/VD)
Frame Type Mean COV
C100bc 5.41 0.21CS10b 5.70 0.23CS20b 5.76 0.23CS10c 6.17 0.21CS20c 6.65 0.16CS10bc 6.53 0.23CS20bc 7.08 0.17CS100b 5.73 0.24CS100c 6.61 0.16S100bc 7.03 0.19
VD = design base shear; VU = base shear at ULS.
1317L. Di Sarno et al. / Journal of Constructional Steel Research 59 (2003) 1289–1319
Fig. 13. Variation of behaviour factors as a function of the amount of SS (mean values).
(with soft storey and setbacks) frame structures. The seismic performance was inves-tigated through global parameters, i.e. resistance (base shear, system overstrength),deformation (interstorey drift and translation ductility), energy absorption capacityand redistribution potential (behaviour factors). The main conclusion is that use ofSS in seismic design may be beneficial but it is subject to a number of constraintsand design considerations. The improvement of inelastic performance depends sig-nificantly upon the spreading of the SS within the members. Indeed, the results ofthe analyses described above have shown that for regular frames (RMRFs) andframes with setbacks (SET1, SET2 and SET3) the use of SS columns enhances theenergy absorption and leads to large spread of plasticity. The behaviour factors(VU/VD) computed for CS20bc and S100bc are 20–30% higher than the counterpartsfor frames with SS beams or CS benchmark MRFs (C100bc). Linear correlationsbetween the amount of SS in the columns and the improved inelastic performancewere found. Such correlations have regression coefficients (R2) equal to 0.50. Theframes with setbacks show values of VU/VD which are 15–20% higher than RMRFs.Therefore, the use of SS in structures with irregularities in elevation is beneficial.The computed values of global ductility confirm the enhanced performance of framesutilising a mixture CS and SS, with the latter used for dissipative zones. Few benefitsare gained from using the basic SS configuration (S100bc) since the same perform-ance may be obtained from CS20bc and the material cost is prohibitive (CS vs. SSshows a cost ratio of 1 to 4).
Experimental and further analytical work is required to investigate possible useof SS in other structural systems e.g. frames with concentric and eccentric braces.
References
[1] Euro Inox. (1994). Design manual for structural stainless steel. Toronto, Canada: European StainlessSteel Development & Information Group, Nickel Development Institute.
[2] Eurocode 3 (1996). Design of steel structures. Part 1.4: General rules—Supplementary rules forstainless steel, European Communities for Standardisation, Brussels, Belgium.
1318 L. Di Sarno et al. / Journal of Constructional Steel Research 59 (2003) 1289–1319
[3] Aoki H. Establishment of design standards and current practice for stainless steel structural designin Japan. Journal of Constructional Steel Research 2000;54(1):191–210.
[4] Burgan BA, Baddoo NR, Gilsenan KA. Structural design of stainless steel members: comparisonbetween Eurocode 3, Part 1.4 and tests results. Journal of Constructional Steel Research2000;54(1):51–73.
[5] Johansson B, Olsson A. Current design practice and research on stainless steel structures in Sweden.Journal of Constructional Steel Research 2000;54(1):3–29.
[6] Di Sarno, L., Elnashai, A.S. and Nethercot, D.A. (2002). Comparison between seismic responsecharacteristics of carbon steel and stainless steel. Proceedings of the 12th European Conference ofEarthquake Engineering, London, UK, Paper No.765 (CD-ROM).
[7] Manzocchi, G.M.E., Chryssanthopoulos, M. and Elnashai, A.S. (1992). Statistical analysis of steeltensile test data and implications on seismic design criteria. ESEE Research Report No. 92-7, Lon-don, UK: Imperial College.
[8] Byfield, M.P. (1996). Steel design and reliability using Eurocode 3. PhD Thesis, University of Not-tingham, Department of Civil Engineering, Nottingham, UK.
[9] Cecconi, A., Croce, P. and Salvatore, W. (1997). Statistical properties of the European productionof structural steels. Proceedings of ESREL 97 in Advances in Safety and Reliability, 1567-1574.
[10] Byfield MP, Nethercot DA. Material and geometric properties of structural steel for use in design.Journal of the Institution of Structural Engineers 1997;75(21):363–7.
[11] Eurocode 3 (1992). Design of steel structures. Part 1.1: General rules and rules for buildings, Euro-pean Communities for Standardisation, Brussels, Belgium.
[12] Krieg RD. A practical two surface plasticity theory. Journal of Applied Mechanics Trans ASME1975;42:641–6.
[13] Petersson H, Popov EP. Constitutive relations for generalized loadings. Journal of the EngineeringMechanics Division 1977;103(EM4):611–27.
[14] Popov EP, Petersson H. Cyclic metal plasticity: experiments and theory. Journal of the EngineeringMechanics Division 1978;104(EM6):1371–88.
[15] Elnashai AS, Izzuddin BA. Modelling of material non linearities in steel structures subjected totransient dynamic loading. Earthquake Engineering and Structural Dynamics 1993;22(6):509–32.
[16] Rasmussen KJR. Recent research on stainless steel tubular structures. Journal of Constructional SteelResearch 2000;54(1):68–75.
[17] Mirambell E, Real E. On the calculation of deflections in structural stainless beams: an experimentaland numerical investigation. Journal of Constructional Steel Research 2000;54(1):109–33.
[18] Mizuno E, Kato M, Fukumoto Y. Multi-surface model application to beam–columns subjected tocyclic loads. Journal of Constructional Steel Research 1987;7(4):253–77.
[19] Broderick BM, Elnashai AS. Seismic resistance of composite beam–columns in multistorey struc-tures. Part 2: Analytical model and discussion of results. Journal of Constructional Steel Research1994;30(1):231–58.
[20] Elnashai AS, Broderick BM. Seismic response of composite frames-II. Calculation of behaviourfactors. Engineering Structures 1996;18(9):707–23.
[21] Izzuddin BA, Elnashai AS. ADAPT, A Program for the adaptive large displacement elasto–plasticdynamic analysis of steel, concrete and composite frames. ESEE Research Report No.7-89. London,UK: Imperial College; 1989.
[22] Eurocode 8 (1998). Design provisions for earthquake resistance of structures. Part 1.3: Generalrules. Specific rules for various materials and elements. European Communities for Standardisation,Brussels, Belgium.
[23] International Code Council (2000). International Building Code. Whittier, California.[24] American Institute of Steel Construction. Seismic provisions for structural steel buildings. Chicago,
IL: AISC, 1997.[25] Federal Emergency Management Agency (2000). Recommended seismic design criteria for new
steel moment-frame buildings. Report No. FEMA 350. Washington, DC.[26] EN 10025 (1990). Hot rolled products of non alloy structural steels. Technical delivery condition,
European Communities for Standardisation, Brussels, Belgium.
1319L. Di Sarno et al. / Journal of Constructional Steel Research 59 (2003) 1289–1319
[27] Kato B. Rotation capacity of H-section members as determined by local buckling. Journal of Con-structional Steel Research 1989;13(2-3):95–109.
[28] Horne MR. An approximate method for calculating the elastic critical loads of multistorey planeframes. The Structural Engineering 1975;53(6):242–8.
[29] Bernal D. Instability of buildings during seismic response. Engineering Structures 1998;20(4-6):496–502.
[30] CSI (1999). SAP2000: Integrated structural design and analysis software. Berkeley, CA: Computerand Structures, Inc.
[31] Elnashai AS, Elghazouli AY, Danesh Ashtiani FA. Response of semirigid steel frames to cyclic andearthquake loads. Journal of Structural Engineering, ASCE 1998;124(8):857–67.
[32] Federal Emergency Management Agency (2000). State of Art Report on past performance of steelmoment frame buildings in earthquakes. Report No. FEMA 355E. Washington, DC.
[33] Federal Emergency Management Agency (2001). NEHRP Recommended provisions for seismicregulations for new buildings and other structures. Part 2—Commentary. Report No. FEMA 369,Washington, DC.
[34] Mwafy AM, Elnashai AS. Calibration of force reduction factors of RC buildings. Journal of Earth-quake Engineering 2002;6(2):239–73.
[35] Borzi B, Elnashai AS. Refined force reduction factor for seismic design. Engineering Structures2000;22(10):1244–60.
[36] Applied Technology Council (1995). Structural response modification factors, ATC Report No.19,Redwood City, CA.