a new damage index for plane steel frames exhibiting strength and stiffness degradation under...
TRANSCRIPT

Engineering Structures 46 (2013) 727–736
Contents lists available at SciVerse ScienceDirect
Engineering Structures
journal homepage: www.elsevier .com/ locate /engstruct
A new damage index for plane steel frames exhibiting strengthand stiffness degradation under seismic motion
0141-0296/$ - see front matter � 2012 Published by Elsevier Ltd.http://dx.doi.org/10.1016/j.engstruct.2012.07.037
⇑ Corresponding author. Tel./fax: +30 25410 79373.E-mail address: [email protected] (G.D. Hatzigeorgiou).
George S. Kamaris a, George D. Hatzigeorgiou b,⇑, Dimitri E. Beskos a,c
a Department of Civil Engineering, University of Patras, GR-26500 Patras, Greeceb Department of Environmental Engineering, Democritus University of Thrace, GR-67100 Xanthi, Greecec Office of Theoretical and Applied Mechanics, Academy of Athens, 4 Soranou Efessiou, GR-11527 Athens, Greece
a r t i c l e i n f o
Article history:Received 10 December 2011Revised 9 July 2012Accepted 31 July 2012Available online 6 October 2012
Keywords:Damage indicesPlane steel framesFinite element methodElastoplastic behaviorSeismic analysisStrength and stiffness degradation
a b s t r a c t
A new damage index for plane steel frames under earthquake ground motion is proposed. This index isdefined at a section of a steel member and takes into account the interaction between the axial force Nand bending moment M acting there. This interaction is defined by two curves in the N–M plane. The firstcurve is the limit between elastic and inelastic material behavior, where damage is zero, while the secondone is the limit between inelastic behavior and complete failure, where damage is equal to one. The dam-age index is defined by assuming a linear variation of damage between the two abovementioned curves.Thus, for a given N–M combination at a member section, obtained with the aid of a two dimensional finiteelement program, one easily defines the damage index of that section. Material nonlinearities are takeninto account by a stress–strain bilinear model including cyclic strength and stiffness degradation in theframework of lumped plasticity (plastic hinge model), while geometrical nonlinearities are modeled byincluding large deflection effects. The increase of damage related to strength reduction due to low-cyclefatigue is also taken into account. Several illustrative examples serve to demonstrate the use of theproposed damage index and to compare it with other well known damage indices.
� 2012 Published by Elsevier Ltd.
1. Introduction
Damage in a structure under loading can be defined as the deg-radation or deterioration of its integrity resulting in reduction of itsload capacity. In earthquake-resistant design of structures, somedegree of damage in the structural members is generally accepted.This is done because the cost of a structure designed to remainelastic during a severe earthquake would be very large. Thus, exist-ing seismic codes, e.g., EC8 [1], in an implicit way and more recentperformance-based seismic design methods [2,3] in an explicit andmore systematic way employ the concept of damage to establishstructural performance levels corresponding to increasing levelsof earthquake actions. These performance levels mainly describethe damage of a structure through damage indices, such as theinterstory drift ratio (IDR), or the member plastic rotations.
Several methods to determine damage indices as functions ofcertain response parameters have been presented in the literature.In general, these methods can be noncumulative or cumulative innature. The most commonly used parameter of the first class isductility, which relates damage only to the maximum deformationand is still regarded as a critical design parameter by codes. To ac-count for the effects of cyclic loading, simple rules of stiffness and
strength degradation have been included in further noncumulativeindices [4–6], mainly referred to reinforced concrete members.Cumulative-type indices can be divided in deformation based [7]or hysteretic based [8,9] formulations and methods that considerthe effective distribution of inelastic cycles and generalize the lin-ear law of low-cycle fatigue of metals, in a hypothesis of lineardamage accumulation [10]. Combinations of deformation andenergy dissipation have been also proposed to establish damageindices [11]. In these methods damage is expressed as a linearcombination of the damage caused by excessive deformation andthat contributed by repeated cyclic loading effects [11]. Finally,the concept of continuum damage mechanics [12] in conjunctionwith the finite element method of concentrated inelasticity hasbeen employed in the analysis of steel and reinforced concretestructures [13,14] for the determination of their damage. In thispaper, a new damage index for plane steel frames under earth-quake ground motion is proposed.
2. Hysteresis models that incorporate strength and stiffnessdegradation
Several hysteresis models have been proposed in the literature.Some of them have hysteresis rules that account for stiffnessdegradation by modifying the path by which the reloading branch

728 G.S. Kamaris et al. / Engineering Structures 46 (2013) 727–736
approaches the backbone curve, e.g., the peak oriented model [15] orvarious ‘pinching’ models [16]. In 1970, Takeda et al. [16] developeda model with a trilinear backbone curve that degrades the unloadingstiffness based on the maximum displacement of the system. Inaddition, smooth hysteresis models have been developed thatinclude a continuous change of stiffness due to yielding, and sharpchanges due to unloading, e.g. the Wen–Bouc model [17]. The needto model both stiffness and strength degradation led to the develop-ment of more versatile models like those of Sivaselvan and Reinhorn[18], which include rules for stiffness and strength degradation aswell as pinching. Song and Pincheira [19] developed a model thatis capable of representing cyclic strength and stiffness degradationbased on dissipated hysteretic energy. This is essentially a peak-oriented model that considers pinching based on degradationparameters. Erberik and Sucuoglu [20] and Sucuoglu and Erberik[21] developed low-cycle fatigue, hysteresis and damage modelsfor deteriorating systems on the basis of test data and analysis.Ibarra et al. [22] created a model in which four modes of cyclic deg-radation are defined with respect to the backbone curve based on thehysteretic response of the component. This was improved later byLignos and Krawinkler [23]. In the commercial computer programRuaumoko [24] stiffness and strength degradation can be taken intoaccount through a linear function that depends on the inelastic cy-cles a member sustains. This model is described next and used in thiswork because of its simplicity and agreement with experiments.
Ruaumoko [24] is a program that performs nonlinear dynamicanalysis with the aid of the finite element method. It utilizes, amongothers, a material behavior model that takes into account strengthdegradation with the number of inelastic cycles, n. More specifi-cally, for the two dimensional (2D) case, the reduced strength ineach loading direction is obtained by multiplying the initialstrength by a parameter, which is a linear function of the numberof inelastic cycles. This parameter f is given by the equation
f ¼ Sr � 1n2 � n1
ðn� n1Þ þ 1 ð1Þ
where n1 is the cycle at which degradation begins, n2 the cycle atwhich degradation stops and Sr the residual strength factor that
Fig. 1. Interior connection steel sp
multiplies the initial yield strength to produce the residual strength.It is assumed that the stiffness deteriorates so that the yield dis-placement remains constant.
For the calibration of the above material model of Ruaumoko 2D[24], results from experiments performed by Ricles et al. [25] at theATLSS laboratory of Lehigh University were used. These experi-ments focused on the cyclic inelastic performance of full-scalewelded unreinforced flange moment connection specimens.
The beam size for all specimens was a W36�150 section ofA572 Grade50 steel. Six exterior connection specimens (SpecimensT1, T2, T3, T4, T5 and T6) and five interior connection specimens(Specimens C1, C2, C3, C4 and C5) were tested. For the exteriorconnection, one W36�150 beam was connected to the flange ofa W14�311 A572 Grade 50 column. A pair of parallel horizontalactuators were placed at the top of the column to impose the storydrift to the specimen. The displacement history followed the SACProtocol [26]. A test was terminated when either fracture occurred,resulting in a significant loss of capacity, or after reaching aninterstorey drift ratio of 0.06 radians. In order to prevent the out-of-plane movement and twisting of the beam and column, lateralbracing was provided. The setup of the experiment is shown inFig. 1.
The experiment for specimen C2 was simulated by Ruaumoko2D [24] and the moment–rotation curves of the right beam ofthe connection were evaluated. The experimental curve is shownin Fig. 2, together with the one simulated by Ruaumoko 2D [24].The agreement between the experimental and the numericalcurves is considered to be satisfactory.
It should be noticed herein that the displacement protocol usedin the adopted experiment is cyclic with monotonically increasingcyclic displacement amplitudes. This is the case with the majorityof the experiments conducted and published in the pertinent liter-ature, such protocols are utilized. For example, SAC [26] proposestwo different loading history protocols, the standard SAC and thenear-fault one with each one of them leading to a different struc-tural response. However, the energy dissipation capacity, whichis related to structural damage, is insensitive to the different typesof loading protocols in the case of steel structures [27].
ecimen under cyclic loading.

-0.06 -0.04 -0.02 0.00 0.02 0.04 0.06 0.08
-40000
-20000
0
20000
40000
Mom
ent (
kips
-in)
Rotation
Experiment Ruaumoko 2D
Fig. 2. Moment–rotation hysteresis loops for the specimen of Fig. 1.
G.S. Kamaris et al. / Engineering Structures 46 (2013) 727–736 729
3. Proposed damage index
In this section the proposed damage index is presented. It is de-fined at a section of a steel member and has the following form:
DS ¼cd¼
ffiffiffiffiffiffiffiffiffiffiffiffiffiffiffiffiffiffiffiffiffiffiffiffiffiffiffiffiffiffiffiffiffiffiffiffiffiffiffiffiffiffiffiffiffiffiffiffiffiffiffiffiffiðMS �MAÞ2 þ ðNS � NAÞ2
qffiffiffiffiffiffiffiffiffiffiffiffiffiffiffiffiffiffiffiffiffiffiffiffiffiffiffiffiffiffiffiffiffiffiffiffiffiffiffiffiffiffiffiffiffiffiffiffiffiffiffiffiffiffiðMB �MAÞ2 þ ðNB � NAÞ2
q ð2Þ
In the above, the bending moments MA, MS and MB and the axialforces NA, NS and NB as well as the distances c and d are thoseshown in the bending moment M–axial force N interaction diagramof Fig. 3 for a plane beam–column element. The proposed damageindex takes into account the interaction between the bendingmoment MS and axial force NS acting at the specific section S at acertain time during the loading history.
Fig. 3 includes a lower bound damage curve, the limit betweenelastic and inelastic material behavior and an upper bound damagecurve, the limit between inelastic behavior and complete failure.Thus, damage at the former curve is zero, while at the latter curveis one. Eq. (2) is based on the assumption that damage evolutionvaries linearly between the above two damage bounds. Points(MA, NA) and (MB, NB), can be found by drawing a line that connectspoint (MS, NS) to the origin of the axes. The intersection of the lower
Fig. 3. Bending moment–axial force interaction diagram and definition parametersof proposed damage index.
and upper bound damage curves to the above line determines theabovementioned points.
The lower bound curve of Fig. 3 is the one found in finiteelement programs of lumped plasticity and indicates the formationof a plastic hinge at a member. In the Ruaumoko program [24],used herein, this lower bound curve is described as
0:88Mf �Mpl
þ Nf � Npl
¼ 1 for M 6 0:9Mpl and N 6 0:2Npl
M �Mpl
f �Mplþ N
f � Npl¼ 1 for M > 0:9Mpl and N > 0:2Npl
ð3Þ
where Npl and Mpl are given by the expressions
Mpl ¼ fyWpl; Npl ¼ fyA ð4Þ
with fy being the yield stress of steel, Wpl the section plastic modu-lus and A the sectional area.
The upper bound curve of Fig. 3 has a similar form with the M–Ninteraction formula given in EC3 [28] provisions, with the harden-ing effect not taken into account, i.e., with ru = ry or equivalently,Nu = Ny. Thus, this curve can be expressed as
Mf �Mu
þ Nf � Nu
� �2
¼ 1 ð5Þ
where Nu and Mu are the ultimate axial force and bending moment,respectively, which cause failure of the section and are equal to
Mu ¼ fuWpl; Nu ¼ fuA ð6Þ
with fu being the ultimate stress of steel. The factor f in Eqs. (3) and(5) is the scale factor of Eq. (1) that is used so as phenomena ofstrength and stiffness degradation to be taken into account.
The increase of damage related to strength reduction due tolow-cycle fatigue is taken into account by following the work ofSucuoglu and Erberik [21]. Thus, an amount of damage DDs, relatedto this phenomenon, is added to damage, Ds, computed by Eq. (2).Here the case that the axial force is zero is examined and thus thedamage can be expressed with the aid of Eq. (2) as
DS ¼MS �My
Mu �My¼ kf
MuMy
ko � kf
!MS
My
ko
k� 1
� �ð7Þ
where ko is the initial elastic stiffness, kf is the secant stiffness at theultimate rotation hu of the current cycle and k is the secant stiffnessat the current cycle.
Fig. 4 shows the moment yield values My and Mny at the constant
amplitude yield rotation hy, which correspond to the 1st and nthpositive cycle, respectively. Accordingly, k1 and kn are the
Fig. 4. Increase of damage due to low-cycle fatigue in a moment–rotation diagram.

730 G.S. Kamaris et al. / Engineering Structures 46 (2013) 727–736
corresponding effective stiffnesses, which are substituted for k inEq. (7) in order to determine the damages Ds1 and Dsn, in the 1stand nth cycle, respectively. Eventually, the moment Ms at the 1stcycle reduces to Mn
s at the nth cycle by an amount DMn, leadingto an increase in damage due to the associated reduction in theeffective stiffness from k1 to kn according to Eq. (7). The projectionof the point A0, which is the intersection of lines B0A0 and AA0, on therotation axis, h0m, indicates that the same amount of damage wouldbe experienced at the nth cycle if the system were pushed to therotation h0m to reach the moment M0
s. Hence, Eq. (7) yields theassociated damage Dsn at the nth cycle when Ms is replaced byM0
s. In this case, the moment M0s is composed of the moment Ms
and an additional moment DMs arising from strength loss. Thus,an amount of damage DDs should be added to the system due tothe moment increase which is equal to
DDS ¼M0
S �Ms
Mu �Myð8Þ
This methodology can be extended to the case that the axialforce is not zero. In this case the additional moment due tostrength loss is found in the same way as above and the total dam-age is calculated as the sum of the damage of Eq. (2) and the DDs.
The calculation of DDs, following the aforementioned method-ology, is difficult and impractical for plane steel frameworks seis-mically analyzed by the Ruaumoko [24] program. For this reason,DDs was calculated with the aid of results of extensive parametricstudies on a cantilever beam under cyclic excitation conductedwith the aid of the Ruaumoko program [24]. The cantilever beamconsisted of various standard HEB and IPE sections (40 of them)and the excitation history followed the SAC Protocol [26]. Thus,an empirical equation that gives DDs as a function of the numberof inelastic cycles n and the damage Ds the member has sustainedin the current cycle was constructed. More specifically, in everyloading cycle, the damage index Ds and the damage incrementDDs were calculated according to Eqs. (2) and (8), respectively.Then, a databank of the results was formed and analyzed withthe aid of nonlinear regression analysis, leading to the followingexpression for DDs:
DDs ¼ 0:56 � n0:292 � D0:914s ð9Þ
Consequently, for a combination of moment MS and axial forceNS computed at a member section, one can easily evaluate thedamage index there by using Eqs. (2) and (9) at each time step ofa nonlinear dynamic analysis. It is supposed that the damage indexat a section is the maximum value of all its values calculated ateach time step. The calculation of M–N pairs is conducted withthe aid of the Ruaumoko 2D finite element program [24]. In thisprogram, material nonlinearities are taken into account througha bilinear moment–rotation model that incorporates strength andstiffness degradation in the framework of lumped plasticity (plas-tic hinge model), while, geometrical nonlinearities are modeled byincluding large displacement effects. Finally, the computation ofthe proposed damage index, is accomplished with the aid of a com-puter program in FORTRAN created by the authors.
4. Other damage indices
The proposed damage index will be compared with five otherdamage indices existing in the literature. These are the damageindices of Park and Ang [11], Bracci et al. [9], Roufaiel and Meyer[5], Cosenza et al. [6] and Banon and Veneziano [4]. These indiceshave been selected here because (i) are the most widely used inapplications and (ii) can be easily employed with the aid of theRuaumoko 2D program [24]. In the following, a brief description
of all these five damage indices will be given for reasons ofcompleteness.
The damage index DPA of Park and Ang [11] is expressed as a lin-ear combination of the damage caused by excessive deformationand that contributed by repeated cyclic loading effects, as shownin the following equation:
DPA ¼dm
duþ b
Q ydu
ZdE ð10Þ
In the above, the first part of the index is expressed as the ratioof the maximum experienced deformation dm to the ultimatedeformation du under monotonic loading. The second part is de-fined as the ratio of the dissipated energy to the term b/(Qydu),where Qy is the yield strength and the coefficient b is a non-nega-tive parameter determined from experimental calibration. In thispaper b is taken equal to 0.025, which is a typical value for steelstructures [29].
Bracci et al. [9] suggested a damage index equal to the ratio of‘damage consumption’ (loss in damage capacity) to ‘damage poten-tial’ (capacity), defined as appropriate areas under the monotonicand the low-cycle fatigue envelopes. Thus, the ‘damage potential’.DP, is defined as the total area between monotonic load–deforma-tion curve and the fatigue failure envelope. As damage proceeds,the load–deformation curve degrades, resulting in the damage Ds
due to the loss of strength and the irrecoverable deformationcauses deformation damage DD. Thus, this damage index DB is ex-pressed as
DB ¼DD þ DS
DPð11Þ
Roufaiel and Meyer [5] proposed that the ratio between thesecant stiffness at the onset of failure Mm//m and the minimum se-cant stiffness reached so far Mx//x, can be used as a good indicatorof damage. Based on that, they defined their damage index DRM asthe modified flexural damage ratio (MFDR) of the form
DRM ¼ MFDR ¼max½MFDRþ;MFDR�� ð12Þ
MFDRþ ¼ /þxMþ
x
�/þyMþ
y
,/þmMþ
m
�/þyMþ
y
;
MFDR� ¼ /�xM�
x�
/�yM�
y
,/�mM�
m�
/�yM�
yð13Þ
where / is the beam curvature due to a bending moment M, theterm My//y is the initial elastic stiffness and superscripts + and �denote the loading direction.
The Consenza et al. [6] damage index is defined as
DCM ¼l� 1
lu;mon � 1ð14Þ
where l is the maximum ductility during the loading history andlu,mon is the maximum allowable value of ductility equal to xu,mon/xy with the xu,mon being the ultimate displacement given by mono-tonic tests and xy the yield displacement. For members that are un-der flexure, l, lu,mon, xu,mon and xy are replaced by lh, lh,mon, hu,mon,and hy, respectively. The terms lh, lh,mon are the rotation ductilityduring the loading history and the maximum allowable value ofrotation ductility under monotonic tests, respectively, while hu,mon,and hy are the ultimate and the yield rotation, respectively.
The Banon and Veneziano [4] analysis is set in a probabilisticcontext and the model has been calibrated on the basis of 29 differ-ent tests on reinforced concrete elements and structures, selectedfrom among the most representative ones in the technical litera-ture. In particular, the damage parameters dl and d2 are defined,respectively, as the ratio of stiffness at yielding point to secant

0.00 0.02 0.04 0.06 0.08 0.10 0.12 0.140
1
2
3
4
5
PGA
(g)
IDR
1 2 3 4 5 6 7
G.S. Kamaris et al. / Engineering Structures 46 (2013) 727–736 731
stiffness at failure, and the plastic dissipated energy Eh normalizedwith respect to the absorbed energy at the elastic limit. If theelastic–plastic model is used, d1 is obviously equal to the ratio ofthe maximum displacement to the displacement xmax at the elasticlimit xy. Therefore, according to the notation introduced above,parameters d1 and d2 can be expressed as
d1 ¼ xmax=xy; d2 ¼ Eh=ð1=2ÞFyxy ð15Þ
where Fy is the yield strength. Furthermore, modified damageparameters d�1 and d�2 are introduced of the form
d�1 ¼ d1 � 1; d�2 ¼ adb2 ð16Þ
where a and b are two parameters which characterize the structuralproblem and are defined experimentally. For flexure, x and F arereplaced by h and M, respectively. Thus, the damage index DBV isdefined as
DBV ¼ffiffiffiffiffiffiffiffiffiffiffiffiffiffiffiffiffiffiffiffiffiffiffiffiffiffiffiðd�1Þ
2 þ ðd�2Þ2
qð17Þ
Fig. 6. IDA curves of the three storey steel frame under the seven ground motions ofTable 1.
5. Examples and comparisons
In this section, two numerical examples are presented in orderto demonstrate the use of the proposed damage index and com-pare it with the five well known damage indices briefly describedin the previous section.
5.1. Three storey steel frame
A plane three storey–three bay steel frame, as shown in Fig. 5, isexamined in this example. The bay width is assumed equal to 5 mand the story height equal to 3 m. Columns consist of standardHEB240 sections and beams of standard IPE330 sections. The frameis subjected to the uniform load 27.5 kN/m (dead and live loads offloors), while the material properties correspond to structural steelgrade S235. The frame has been designed in accordance with theprovisions of EC3 [28] and EC8 [1] and its fundamental natural per-iod is equal to 0.73 s. The expected ground motion is defined by the
C
B
Fig. 5. Geometry of the three storey plane steel frame.
Table 1Characteristics of ground motions used in examples.
No. Date Record name
1 1992/04/25 Cape Mendocino2 1992/06/28 Landers3 1994/01/17 Northridge4 1994/01/17 Northridge5 1994/01/17 Northridge6 1994/01/17 Northridge7 1994/01/17 Northridge
elastic acceleration design spectrum of the EC8 seismic code [1],with a peak ground acceleration equal to 0.4 g and a soil class B.The SAP2000 [30] software package has been used for elastic anal-ysis and steel design.
For this frame, incremental nonlinear dynamic analyses (IDA)were performed with the aid of the Ruaumoko 2D program [24].The frame was excited with seven (7) ground motions, which werescaled in order that several performance levels to be reached untilthe state of dynamic instability and collapse. Table 1 shows the or-dinary seismic motions used in this example and Fig. 6 depicts thecurves of maximum interstorey drift ratios (IDR) versus the peakground acceleration (PGA) values of the seven (7) ground motions.Collapse is indicated through the plateau that is formed in thosecurves after a certain value of PGA.
Figs. 7 and 8 show the five damage indices of Section 4 togetherwith the proposed one as functions of the peak ground accelera-tion, for ground motions 1 and 4 of Table 1, respectively. The firstfigure refers to damage of beam B of the first floor of the frame (seeFig. 5) and the second one to damage of column C of the first floorof the same frame. It is observed that the proposed damage index isin between the others and close to those of Bracci et al. [9] and Co-senza et al. [6] for small values of peak ground acceleration. Thiscomes from the fact that these damage indices are associated withthe ratio of demand to capacity, i.e. they are defined in a similarmanner with the proposed one. For larger values of the peakground acceleration, for which the frame has sustained extensiveplastification, the proposed damage index is very close to Parkand Ang [11], Roufaiel and Meyer [5] and Banon and Veneziano[4] damage indices, which account for the combination of maxi-mum displacement and energy dissipation as an indicator of dam-age. This is because the extensive plastification corresponds to alarger number of inelastic cycles, which lead to an increase of the
Station name PGA (g)
89509 Eureka 0.15424577 Fort Irwin 0.11424389 LA – Century City CC North 0.25624538 Santa Monica City Hall 0.88324400 LA – Obregon Park 0.355127 Lake Hughes #9 0.16524401 San Marino, SW Academy 0.116

0.0 0.5 1.0 1.50.0
0.2
0.4
0.6
0.8
1.0
Dam
age
PGA (g)
Park and Ang Bracci et al. Roufaiel and Meyer Cosenza and Manfredi Banon and Veneziano Proposed
Fig. 7. Comparison of various damage indices with the proposed one at beam B of the three storey frame for ground motion 1.
0.0 0.5 1.0 1.5 2.00.0
0.4
0.8
1.2
Dam
age
PGA (g)
Park and Ang Bracci et al. Roufaiel and Meyer Cosenza and Manfredi Banon and Veneziano Proposed
Fig. 8. Comparison of various damage indices with the proposed one at column C of the three storey frame for ground motion 4.
0.0 0.2 0.4 0.6 0.8 1.0 1.20.0
0.2
0.4
0.6
0.8
1.0
R2=0.75
y=1.005x
Prop
osed
Park & Ang
Fig. 9. Correlation between the proposed damage index and that of Park and Angthat corresponds to all columns of the three storey frame.
732 G.S. Kamaris et al. / Engineering Structures 46 (2013) 727–736
proposed damage index as indicated by Eq. (9). This increase is rea-sonable, because the more a member gets in the plastic region andits capacity reduces, the more its damage increases, something thatis satisfied by the proposed damage index. In addition, for verylarge values of peak ground acceleration the proposed damage in-dex is larger than the Bracci et al. [9] and Cosenza et al. [6] damageindices, which do not take into account the effects of low-cyclefatigue. The same results are observed at the other members ofthe frame and for the other motions of Table 1, but they are notpresented herein due to lack of space.
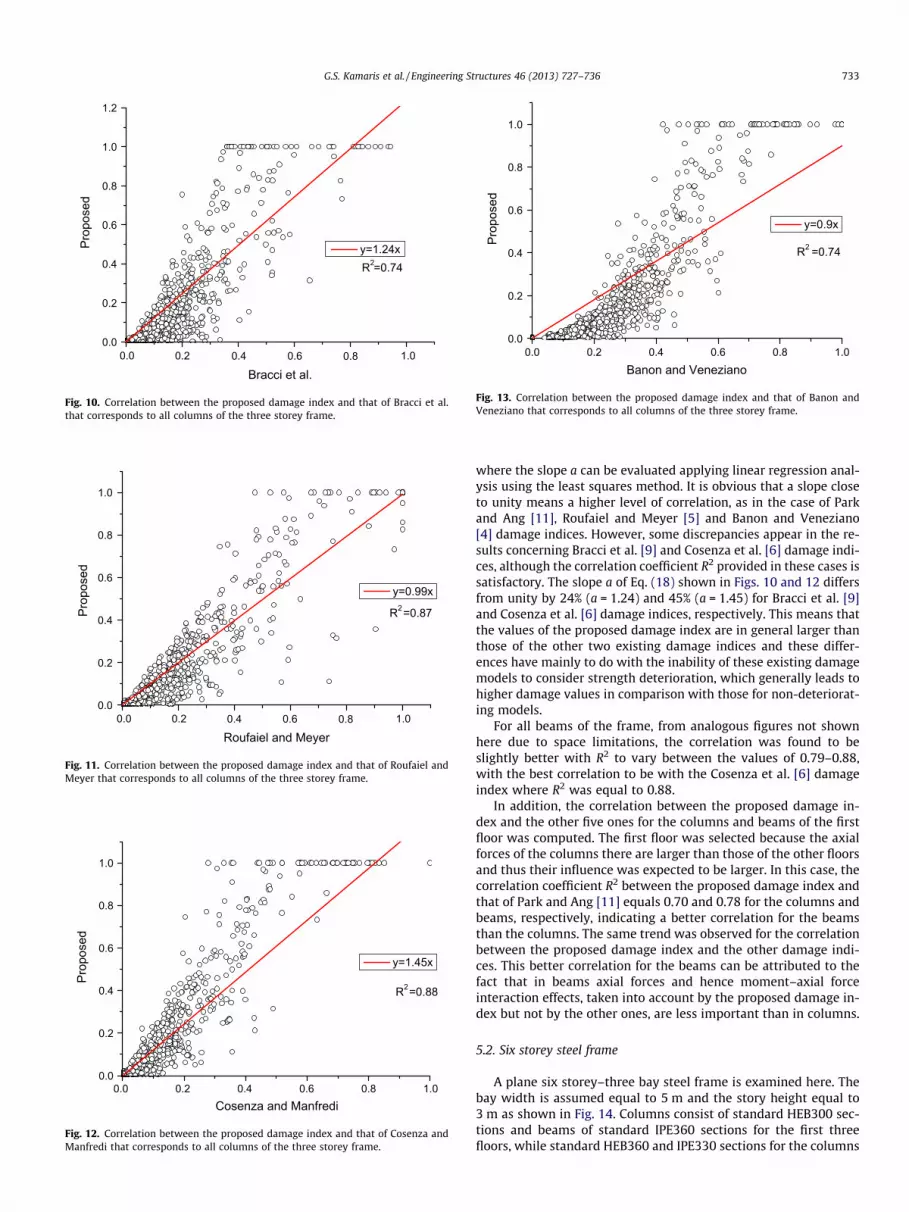
Finally, Figs. 9–13 show the correlation between the five dam-age indices of Section 4 and the proposed one that correspondsto all columns of the frame under consideration for all the groundmotions. The correlation of the proposed damage index to theother damage indices is considered to be satisfactory as it providesvalues for the correlation coefficient R2 between 0.74 and 0.88,with the larger correlation to be with the Cosenza et al. [6] damageindex, where R2 was equal to 0.88. However, the R factor is not thesingle parameter that can examine the correlation between theexisting damage indices with the proposed one. Perhaps, the sim-plest relation, between an existing (x) and the proposed damageindex (y) is
y ¼ ax ð18Þ
0.0
0.2
0.4
0.6
0.8
1.0
1.2
R2=0.74 y=1.24xPr
opos
ed
Bracci et al. 0.0 0.2 0.4 0.6 0.8 1.0
Fig. 10. Correlation between the proposed damage index and that of Bracci et al.that corresponds to all columns of the three storey frame.
0.0
0.2
0.4
0.6
0.8
1.0
R2=0.87
y=0.99x
Prop
osed
Roufaiel and Meyer0.0 0.2 0.4 0.6 0.8 1.0
Fig. 11. Correlation between the proposed damage index and that of Roufaiel andMeyer that corresponds to all columns of the three storey frame.
0.0
0.2
0.4
0.6
0.8
1.0
R2=0.88
y=1.45x
Prop
osed
Cosenza and Manfredi0.0 0.2 0.4 0.6 0.8 1.0
Fig. 12. Correlation between the proposed damage index and that of Cosenza andManfredi that corresponds to all columns of the three storey frame.
0.0 0.2 0.4 0.6 0.8 1.00.0
0.2
0.4
0.6
0.8
1.0
R2 =0.74
y=0.9x
Prop
osed
Banon and Veneziano
Fig. 13. Correlation between the proposed damage index and that of Banon andVeneziano that corresponds to all columns of the three storey frame.
G.S. Kamaris et al. / Engineering Structures 46 (2013) 727–736 733
where the slope a can be evaluated applying linear regression anal-ysis using the least squares method. It is obvious that a slope closeto unity means a higher level of correlation, as in the case of Parkand Ang [11], Roufaiel and Meyer [5] and Banon and Veneziano[4] damage indices. However, some discrepancies appear in the re-sults concerning Bracci et al. [9] and Cosenza et al. [6] damage indi-ces, although the correlation coefficient R2 provided in these cases issatisfactory. The slope a of Eq. (18) shown in Figs. 10 and 12 differsfrom unity by 24% (a = 1.24) and 45% (a = 1.45) for Bracci et al. [9]and Cosenza et al. [6] damage indices, respectively. This means thatthe values of the proposed damage index are in general larger thanthose of the other two existing damage indices and these differ-ences have mainly to do with the inability of these existing damagemodels to consider strength deterioration, which generally leads tohigher damage values in comparison with those for non-deteriorat-ing models.
For all beams of the frame, from analogous figures not shownhere due to space limitations, the correlation was found to beslightly better with R2 to vary between the values of 0.79–0.88,with the best correlation to be with the Cosenza et al. [6] damageindex where R2 was equal to 0.88.
In addition, the correlation between the proposed damage in-dex and the other five ones for the columns and beams of the firstfloor was computed. The first floor was selected because the axialforces of the columns there are larger than those of the other floorsand thus their influence was expected to be larger. In this case, thecorrelation coefficient R2 between the proposed damage index andthat of Park and Ang [11] equals 0.70 and 0.78 for the columns andbeams, respectively, indicating a better correlation for the beamsthan the columns. The same trend was observed for the correlationbetween the proposed damage index and the other damage indi-ces. This better correlation for the beams can be attributed to thefact that in beams axial forces and hence moment–axial forceinteraction effects, taken into account by the proposed damage in-dex but not by the other ones, are less important than in columns.
5.2. Six storey steel frame
A plane six storey–three bay steel frame is examined here. Thebay width is assumed equal to 5 m and the story height equal to3 m as shown in Fig. 14. Columns consist of standard HEB300 sec-tions and beams of standard IPE360 sections for the first threefloors, while standard HEB360 and IPE330 sections for the columns

B
C
Fig. 14. Geometry of the six storey plane steel frame.
0
1
2
3
4
5
IDR
0
1
2
3
4
5
1 2 3 4 5 6 7
0.00 0.01 0.02 0.03 0.04 0.05 0.06 0.07 0.08 0.09 0.10
PGA
(g)
Fig. 15. IDA curves of the six storey steel frame under the seven ground motions ofTable 1.
734 G.S. Kamaris et al. / Engineering Structures 46 (2013) 727–736
and beams, respectively, were used for the rest of the floors. Thevalues of the uniform load on the beams of the frame and the yieldstress of the steel are the same with those of the previous example.The frame has been designed in accordance with the provisions of
0.0 0.50.0
0.2
0.4
0.6
0.8
1.0
1.2
Dam
age
PGA (g)
Park and Ang Bracci et al. Roufaiel and Meyer Cosenza and Manfredi Banon and Veneziano Proposed
Fig. 16. Comparison of various damage indices with the proposed
EC3 [28] and EC8 [1] and its fundamental natural period is equal to1.17 s. The SAP2000 [30] software package has been used for elas-tic analysis and steel design.
For this frame, incremental nonlinear dynamic analyses (IDA)were performed with the aid of the Ruaumoko 2D program [24].The frame was excited with the seven (7) ground motions of Ta-ble 1, which were scaled again so as several performance levelsto be reached until collapse. Fig. 15 depicts the curves of IDR versusPGA for the ground motions considered.
Figs. 16 and 17 show the five damage indices of Section 4 to-gether with the proposed one as functions of the peak groundacceleration, for ground motions 1 and 3 of Table 1, respectively.The first figure refers to damage of beam B of the first floor ofthe frame (see Fig. 14) and the second one to damage of columnC of the first floor of the same frame. One can observe again thatthe proposed damage index is in between the others, close to thoseof Bracci et al. [9] and Cosenza et al. [6] for small values of PGA andvery close to Park and Ang [11], Roufaiel and Meyer [5] and Banonand Veneziano [4] damage indices for larger values of PGA. Thisbehavior can be interpreted by the same reasoning as in the previ-ous example. It was also found that, as in the previous example, thecorrelation coefficient R2 between the proposed damage index andthe other five ones of Section 4 was better for beams than for col-umns indicating the importance of the moment–axial force inter-action effects taken into account by the proposed damage index.
It should be also noted that the proposed damage index for col-umn C, shown in Fig. 17, gives larger values of damage than theother five damage indices for a value of PGA greater than 0.6 g cor-responding to a value of IDR equal to 0.017. Thus, the proposedmodel gives higher damage values for maximum inelastic driftshigher than 0.017, compared to the other damage indices. Thiscan be explained by the fact that the proposed damage index takesinto account strength and stiffness degradation resulting to highervalues of the maximum inelastic displacement, which is physicallyrelated to damage. In contrary, the other five damage indices,which are obtained using non-degrading models resulting to smal-ler values of the maximum inelastic displacement, provide smallervalues of damage. Furthermore, Fig. 18 shows two IDA curves ofthe frame for ground motion 3 of Table 1. The first one correspondsto the proposed degrading model, while the second one to a non-degrading model produced from the proposed one by assumingthe parameter f of Eq. (1) to be equal to 1. It is observed that fora value of PGA greater than 0.6 g the values of IDR for the degradingsystem are larger than those for the non-degrading one.
1.0 1.5
one at beam B of the six storey frame for ground motion 1.

0.0 0.5 1.0 1.5 2.00.0
0.2
0.4
0.6
0.8
1.0
1.2
Dam
age
PGA (g)
Park and Ang Bracci et al. Roufaiel and Meyer Cosenza and Manfredi Banon and Veneziano Proposed
Fig. 17. Comparison of various damage indices with the proposed one at column C of the six storey frame for ground motion 3.
0.00 0.01 0.02 0.03 0.04 0.05 0.06 0.07 0.080.0
0.2
0.4
0.6
0.8
1.0
1.2
1.4
1.6
1.8
PGA
(g)
IDR
non-degrading model degrading model
Fig. 18. IDA curves for the six storey steel frame under ground motion 3, using adegrading and a non-degrading model.
G.S. Kamaris et al. / Engineering Structures 46 (2013) 727–736 735
6. Conclusions
On the basis of the preceding developments, the following con-clusions can be stated:
(1) A new damage index for plane steel moment resisting framesunder seismic loading has been developed and efficientlyused in conjunction with the finite element method thattakes into account material and geometric nonlinearities.
(2) The proposed damage index is conceptually simple and real-istic because
� It accounts for the interaction between the axial forceand the bending moment at a member section.
� It incorporates cyclic strength and stiffness deteriorationbased on a law calibrated with experimental results.
� It accounts for the phenomenon of low-cycle fatigue,which influences the damage of frames that are subjectedto ground motions.
(3) In comparison with five well known damage indices in theliterature, the proposed damage index provides results inbetween those indices, is close to those of Bracci et al. andCosenza and Manfredi for small values of PGA and very closeto Park and Ang, Roufaiel and Meyer and Banon and Venezi-ano damage indices for larger values of PGA.
(4) The correlation of the proposed damage index with five wellknown indices in the literature seems to be satisfactory. Theimportance of the moment–axial force interaction effects incolumns, taken into account only by the proposed damageindex, was verified.
References
[1] EC8. Design of structures for earthquake resistance. Part 1: general rules,seismic actions and rules for buildings. European Standard EN 1998-1,European Committee for Standardization (CEN), Brussels; 1998.
[2] Fajfar P, Krawinkler H. Seismic design methodologies for the next generation ofcodes. Bled; 24–27 June, 1997. Rotterdam: Balkema.
[3] FEMA. FEMA-273 Building Seismic Safety Council, NEHRP guidelines for theseismic rehabilitation of buildings. Federal Emergency Management Agency,Washington, DC; 1997.
[4] Banon H, Veneziano D. Seismic safety of reinforced concrete members andstructures. Earthq Eng Struct Dynam 1982;10:173–9.
[5] Roufaiel MS, Meyer C. Analytical modeling of hysteretic behavior of R/C frames.J Struct Eng, ASCE 1987;113:429–44.
[6] Cosenza E, Manfredi G, Ramasco R. The use of damage functionals inearthquake engineering: a comparison between different methods. EarthqEng Struct Dynam 1993;22(10):855–68.
[7] Stephens JE, Yao JTP. Damage assessment using response measurements. JStruct Eng, ASCE 1987;113:787–801.
[8] McCabe SL, Hall WJ. Assessment of seismic structural damage. J Struct Eng,ASCE 1989;115:2166–83.
[9] Bracci JM, Reinhorn, AM, Mander JB. Deterministic model for seismic damageevaluation of reinforced concrete structures. Technical report NCEER 89-0033.State University of New York at Buffalo; 1989.
[10] Krawinkler H, Zohrei M. Cumulative damage in steel structures subjected toearthquake ground motions. Comput Struct 1983;16:531–41.
[11] Park Y-J, Ang AH-S. Mechanistic seismic damage model for reinforcedconcrete. J Struct Eng, ASCE 1985;111:722–39.
[12] Lemaitre J. A course on damage mechanics. Berlin: Springer-Verlag; 1992.[13] Hatzigeorgiou GD, Beskos DE. Direct damage controlled design of concrete
structures. J Struct Eng, ASCE 2007;133:205–15.[14] Kamaris GS, Hatzigeorgiou GD, Beskos DE. Direct damage controlled design of
plane steel-moment resisting frames using static inelastic analysis. J MechMater Struct 2009;4:1375–93.
[15] Clough RW, Johnston SB. Effects of stiffness degradation on earthquakeductility requirements. In: Proceedings of the Japan earthquake engineeringsymposium, Tokyo, Japan; 1966.

736 G.S. Kamaris et al. / Engineering Structures 46 (2013) 727–736
[16] Takeda T, Sozen MA, Nielson NN. Reinforced concrete response to simulatedearthquakes. J Struct Div, ASCE 1970;96:2557–73.
[17] Wen YK. Method for random vibration of hysteretic systems. J Eng Mech Div,ASCE 1976;112:249–63.
[18] Sivaselvan MV, Reinhorn AM. Hysteretic models for deteriorating inelasticstructures. J Eng Mech, ASCE 2000;126:633–40.
[19] Song J, Pincheira J. Spectral displacement demands of stiffness and strengthdegrading systems. Earthq Spectra 2000;16:817–51.
[20] Erberik A, Sucuoglu H. Seismic energy dissipation in deteriorating systemsthrough low-cycle fatigue. Earthq Eng Struct Dynam 2004;33:49–67.
[21] Sucuoglu H, Erberik A. Energy-based hysteresis and damage models fordeteriorating systems. Earthq Eng Struct Dynam 2004;33:69–88.
[22] Ibarra LF, Medina RA, Krawinkler H. Hysteretic models that incorporatestrength and stiffness degradation. Earthq Eng Struct Dynam2005;34:1489–511.
[23] Lignos DG, Krawinkler H. Deterioration modeling of steel components insupport of collapse prediction of steel moment frames under earthquakeloading. J Struct Eng, ASCE 2011;137(11):1291–302.
[24] Carr AJ. RUAUMOKO-2D. Inelastic time-history analysis of two-dimensionalframed structures. Department of Civil Engineering, University of Canterbury,New Zealand; 2006.
[25] Ricles JM, Mao C, Lu L-W, Fisher JW. Development and evaluation of improveddetails for ductile welded unreinforced flange connections. ATLSS report no:00-04. Lehigh University, Bethlehem; 2000.
[26] SAC Joint Venture. Protocol for fabrication, inspection, testing, anddocumentation of beam–column connection tests and other experimentalspecimens. Report no. SAC/BD-97/02, SAC Joint Venture, Sacramento,California; 1997.
[27] Uang CM, Yu QS, Gilton CS. Effects of loading history on cyclic performance ofsteel RBS moment connections. In: Proceedings of the 12th WCEE, Upper Hutt,New Zealand; 2000.
[28] EC3. Design of steel structures. Part 1-1: general rules for buildings, ENV1993-1-1, European Standard EN 1998-1, European Committee for Standardization(CEN), Brussels; 1992.
[29] Castiglioni CA, Pucinotti R. Failure criteria and cumulative damage models forsteel components under cyclic loading. J Constr Steel Res 2009;65:751–65.
[30] SAP2000. Static and dynamic finite element analysis of structures. Version9.1.4. Computers and Structures Inc., Berkeley, California; 2005.