nonlinear seismic response of multistory steel frames with
TRANSCRIPT
applied sciences
Article
Nonlinear Seismic Response of Multistory SteelFrames with Self-Centering Tension-Only Braces
Pei Chi 1,* , Jun Dong 2, Wenlong Tian 1 and Dafu Cao 1
1 College of Civil Science and Engineering, Yangzhou University, Yangzhou 225009, China;[email protected] (W.T.); [email protected] (D.C.)
2 College of Civil Engineering, Nanjing Tech University, Nanjing 211816, China; [email protected]* Correspondence: [email protected]
Received: 27 November 2019; Accepted: 3 March 2020; Published: 6 March 2020�����������������
Abstract: The self-centering tension-only brace (SC-TOB) is a new and innovative bracing systemthat provides both a flag-shaped recentering hysteresis and load mitigation to structures. This paperpresents an extensive investigation of the nonlinear seismic response of multistory steel framesbuilt with SC-TOBs to internal force, drift, and energy dissipation. Pushover analysis subjectedto two lateral load distributions and nonlinear dynamic analysis under ground motion ensemblescorresponding to four hazard levels were conducted. The SC-TOBs can be designed to serve asconventional tension-only braces (TOBs) only providing lateral stiffness during minor earthquakes,to function with energy dissipation as intensity increases, and to fully recenter a structure evenafter severe earthquakes. The findings show that with an increase in the earthquake intensity, boththe force response and drift response of the SC-TOB frames (SC-TOBFs) increased; however, the forcedistribution and drift distribution shapes of the SC-TOBFs remained almost constant. The SC-TOBFsgenerally experienced more energy dissipation in the lower parts of the building, while the upperstories dissipated almost no energy under certain load conditions, suggesting that the bracingson those stories could be replaced by conventional TOBs for economy. It is demonstrated thatthe SC-TOBs have immense potential to effectively improve seismic resilience to structures such thatrehabilitation costs and operational disruptions after earthquakes are minimized.
Keywords: self-centering; tension-only; brace; damping systems; seismic response; resilience
1. Introduction
Although conventional earthquake-resistant systems (e.g., ductile moment frames, braced frames,or concrete shear walls) designed conforming to current seismic codes are confirmed to achieve lifesafety and collapse prevention performances, there is wide consensus emerging within the structuralengineering community that preventing collapse is simply not sufficient for a more resilient structure.Because those systems are prone to permanent, nonrecoverable deformations (residual deformations)after a significant seismic event, leading to substantial losses associated with costs of rehabilitation andoperational disruption. For example, many structures that suffered damage in the 2011 ChristchurchEarthquake had to be demolished because of excessive residual deformations even though they hadnot collapsed [1]. A study by McCormick et al. suggested that for buildings with residual drift greaterthan 0.5%, it is more economical to demolish and reconstruct them than repair them [2].
To address this drawback with residual deformations, a novel category of seismic-resilientstructural system (SRSS) was developed. A typical SRSS generally employs a restoring force mechanismto achieve self-centering (SC), in conjunction with an energy dissipation (ED) mechanism to protectthe primary structure. The main approaches to SC can be classified into four categories: rocking systems,
Appl. Sci. 2020, 10, 1819; doi:10.3390/app10051819 www.mdpi.com/journal/applsci
Appl. Sci. 2020, 10, 1819 2 of 17
post-tensioned moment frames, shape memory alloy (SMA)-based components, and self-centeringbraces (SCBs).
The key aspect of rocking systems, including rocking walls [3,4] and rocking braced frames [5,6],is the gap-opening mechanism taking place between the structure and foundation, which softensthe structural lateral response without any residual deformations. The gap-opening mechanism canalso be applied to beam-column interface to form a post-tensioned moment frame in which the beam iscompressed to the side of a column by using post-tensioning (PT) technology [7,8]. However, bothrocking systems and post-tensioned frames may suffer from issues of installation complexity anddeformation incompatibility [5,9]. Superelastic SMAs, characterized by inherent hysteretic dampingand spontaneous recentering, have currently emerged as one class of smart materials for achievingSRSS. Various types of SMA-based components, such as connections, dampers, and braces have beenproposed [10–12].
In the family of SRSSs, SCBs are a promising candidate because of their satisfactory SC capabilityand especially because SC can be developed within the brace elements such that deformationincompatibility can be avoided, and conventional field techniques are sufficient for installation andreplacement. Christopoulos et al. [13] were among the pioneers to develop self-centering energydissipative (SCED) braces. Erochko et al. [14] conducted a shake table test to confirm the behaviorof SCED braces within structural systems. Wiebe and Christopoulos [15] adopted Bézier curves tomitigate the sharp stiffness transition in the hysteresis. Karavasilis et al. [16] developed a new nonlinearmodel for seismic analysis of structures with SCBs. To further improve the recentering capacity, twotypes of SC-enhanced brace configurations incorporating multiple SC systems, that is, the dual-coreSCB [17–20] and the telescoping SCED brace [21,22], were developed independently. More recently,pre-pressed disc springs have been utilized to develop SC, by which the limitations in deformabilitycan be improved further [23–25]. Comparative studies of SCB frames (SCBFs) and buckling-restrainedbraced (BRB) frames, however, revealed that amplified seismic demands have emerged as a majorconcern to SCBFs owing to moderate ED capacity depending on the flag-shaped hysteresis loop ofSCBs, which was not as full as that of BRBs [26].
Unlike those rigid SCBs, tension-only braces (TOBs) are flexible and can enable the full use oftensile strength of high strength materials without compressive-flexural buckling, thereby reducingthe axial stiffness as well as the cross-sectional dimensions of the brace significantly [27,28]. As a result,a mitigating seismic response can be obtained due to the elongated fundamental period of vibrationof the resulting structure. In addition, TOBs are lighter in weight, making them easier to install andrelatively simple to replace. In view of this, the authors developed a self-centering tension-only brace(SC-TOB) system, in consideration of the load mitigation characteristics of TOBs, to reduce the seismicdemands of SCB structures [29]. Several response parameters were studied to compare the behavior ofthe SC-TOBFs and BRB frames [30].
This study investigated how the SC-TOB can be implemented in multistory steel frames toimprove seismic performance in terms of internal force, drift, and energy dissipation. Pushoveranalysis subjected to two lateral load distributions and nonlinear dynamic analysis under groundmotion ensembles scaled to four hazard levels were performed.
2. Analytical Model of SC-TOBFs
2.1. Mechanics of SC-TOB
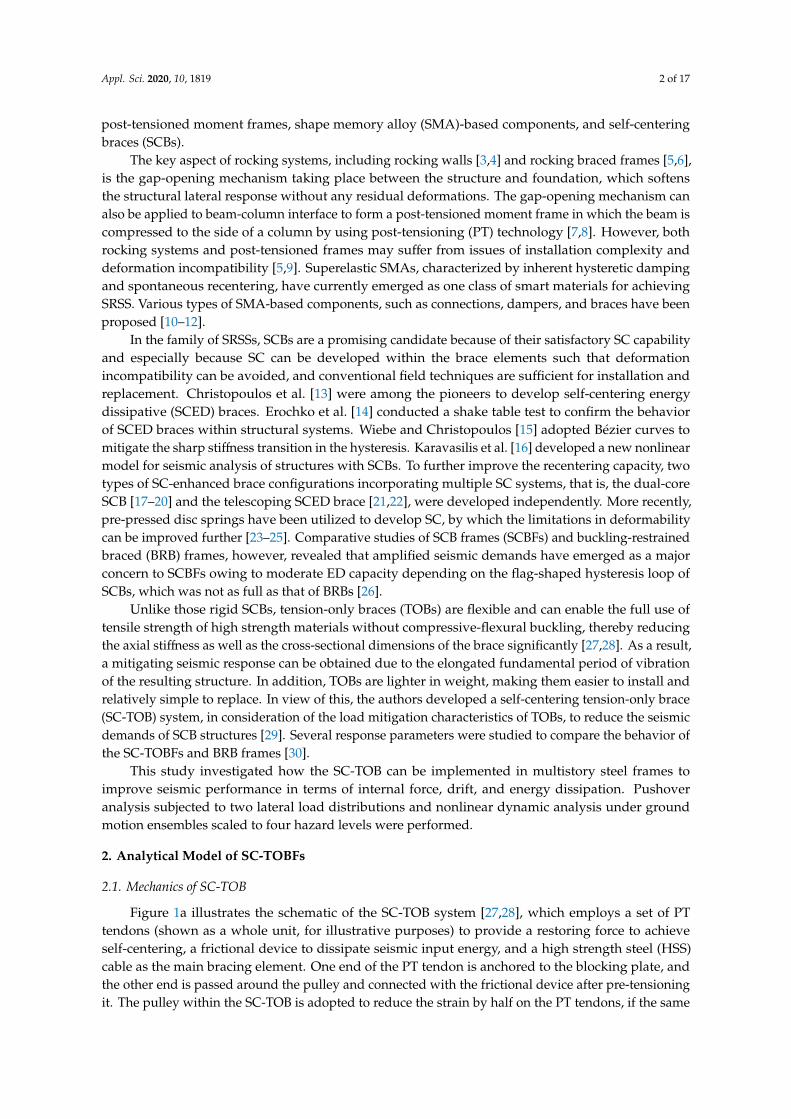
Figure 1a illustrates the schematic of the SC-TOB system [27,28], which employs a set of PTtendons (shown as a whole unit, for illustrative purposes) to provide a restoring force to achieveself-centering, a frictional device to dissipate seismic input energy, and a high strength steel (HSS)cable as the main bracing element. One end of the PT tendon is anchored to the blocking plate, andthe other end is passed around the pulley and connected with the frictional device after pre-tensioningit. The pulley within the SC-TOB is adopted to reduce the strain by half on the PT tendons, if the same
Appl. Sci. 2020, 10, 1819 3 of 17
elongation occurs, leading to a double elongation capacity of the bracing system. The mechanics ofthe SC-TOB system can be explained using an analytical model as presented in Figure 1b, whereinkt, kf, and kc = the axial stiffnesses of the PT tendons, frictional device, and HSS cable, respectively;F = the frictional resistance provided by the frictional device; and Tt,0 = the pre-tension of the PTtendons. R represents the blocking plate to restrict the left movement of the frictional device.
Appl. Sci. 2020, 10, x FOR PEER REVIEW 3 of 17
other end is passed around the pulley and connected with the frictional device after pre-tensioning it. The pulley within the SC-TOB is adopted to reduce the strain by half on the PT tendons, if the same elongation occurs, leading to a double elongation capacity of the bracing system. The mechanics of the SC-TOB system can be explained using an analytical model as presented in Figure 1b, wherein 𝑘 , 𝑘 , and 𝑘 = the axial stiffnesses of the PT tendons, frictional device, and HSS cable, respectively; 𝐹 = the frictional resistance provided by the frictional device; and 𝑇 , = the pre-tension of the PT tendons. R represents the blocking plate to restrict the left movement of the frictional device.
Figure 1c depicts the flag-shaped hysteresis of the SC-TOB. When the load 𝑃 is too small to overcome the sum of 𝑇 , and 𝐹, only the HSS cable works at stage o-a, hence the initial stiffness of the SC-TOB, 𝑘 , is equal to 𝑘 . As 𝑃 increases to reach the activation load 𝑃 , given by 𝑃 = 𝑇 , 𝐹, the PT tendons start to stretch, and meanwhile the energy dissipation mechanism is activated. At stage a-b, the axial stiffness of the SC-TOB decreases from 𝑘 to the post-activation stiffness 𝑘 , given by 𝑘 = 𝑘 𝑘 𝑘 . Upon unloading, the friction device is locked, with the friction value varying from 𝐹 at event b to −𝐹 at event c. During this stage, as the frictional device remains stationary, the stiffness of the SC-TOB is recovered to 𝑘 . As 𝑃 further unloads (stage c-d), the SC-TOB is pulled back to its initial position under the influence of the tensioning tendons, and the stiffness is once again reduced to 𝑘 . With continuous unloading during stage d-o, as the movement of the friction device is restricted by the blocking plate, the stiffness of the system once again recovers to 𝑘 .
Figure 1. Self-centering tension-only brace (SC-TOB) system: (a) schematic; (b) analytical model; and (c) hysteretic behavior [27,28].
2.2. Modeling of an SC-TOBF
A typical steel frame equipped with SC-TOBs subjected to lateral loading, P, is illustrated in Figure 2; the solid line indicates a taut HSS cable experiencing positive elongation, while the dotted line indicates a slack, on stand-by for the load reversal. Note that the pulleys mounted on the beam
(a)
(b)
(c)
Figure 1. Self-centering tension-only brace (SC-TOB) system: (a) schematic; (b) analytical model; and(c) hysteretic behavior [27,28].
Figure 1c depicts the flag-shaped hysteresis of the SC-TOB. When the load P is too small toovercome the sum of Tt,0 and F, only the HSS cable works at stage o-a, hence the initial stiffness ofthe SC-TOB, k1, is equal to kc. As P increases to reach the activation load Pa, given by Pa = Tt,0 + F,the PT tendons start to stretch, and meanwhile the energy dissipation mechanism is activated. Atstage a-b, the axial stiffness of the SC-TOB decreases from k1 to the post-activation stiffness k2, given
by k2 =(k−1
t + k−1f + k−1
c
)−1. Upon unloading, the friction device is locked, with the friction value
varying from F at event b to −F at event c. During this stage, as the frictional device remains stationary,the stiffness of the SC-TOB is recovered to k1. As P further unloads (stage c-d), the SC-TOB is pulledback to its initial position under the influence of the tensioning tendons, and the stiffness is once againreduced to k2. With continuous unloading during stage d-o, as the movement of the friction device isrestricted by the blocking plate, the stiffness of the system once again recovers to k1.
2.2. Modeling of an SC-TOBF
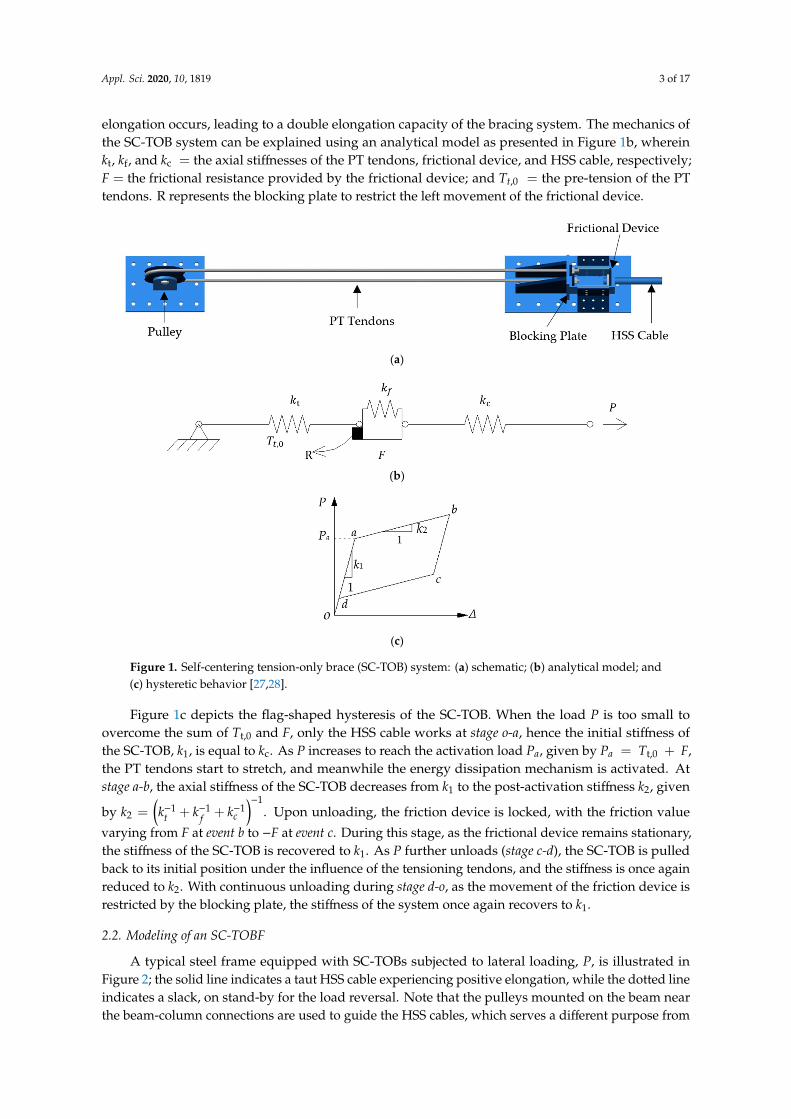
A typical steel frame equipped with SC-TOBs subjected to lateral loading, P, is illustrated inFigure 2; the solid line indicates a taut HSS cable experiencing positive elongation, while the dotted lineindicates a slack, on stand-by for the load reversal. Note that the pulleys mounted on the beam nearthe beam-column connections are used to guide the HSS cables, which serves a different purpose from
Appl. Sci. 2020, 10, 1819 4 of 17
those within the SC-TOBs. The analytical model is constructed using SAP2000 [31]. Key modelingtechniques are as follows:
(a) Beam and column modeling. The beams and columns are modeled using frame elements, whichconcentrate their inelastic behaviors in nonlinear hinges (lumped plasticity).
(b) SC-TOB modeling. The multilinear elastic element (MEE) and the multilinear plastic element (MPE)are used to model the nonlinear elastic behavior of PT tendons and the energy dissipation fromthe frictional device, respectively. For both tendons and frictional device, only the second-stagecurves with a softened stiffness of the elements are required; hence, a negligible first-stagedeformation has to be specified. For the HSS cable modeling, however, the MEE with a sufficientlylong first-stage curve is adopted, because the cable is only permitted to behave in a linearelastic way.
(c) Pulley modeling. The pulley is modeled using five hinged frame elements within the dotted circle,in which nodes 1, 2, and 3 are located around the center point O. Because a pulley is almost a rigidbody in real structures, the axial stiffness of each frame element has to be assigned a sufficientlylarge value.
(d) Models assembly. A “body constraint” is specified between nodes O, A, and B, and their verticalprojection O’, A’, and B’, respectively, to ensure that each pair of nodes moves together as a 3Drigid body, except that the translational degree of freedom of node A is released to allow itsaxial movement.
Appl. Sci. 2020, 10, x FOR PEER REVIEW 4 of 17
near the beam-column connections are used to guide the HSS cables, which serves a different purpose from those within the SC-TOBs. The analytical model is constructed using SAP2000 [31]. Key modeling techniques are as follows:
(a) Beam and column modeling. The beams and columns are modeled using frame elements, which concentrate their inelastic behaviors in nonlinear hinges (lumped plasticity).
(b) SC-TOB modeling. The multilinear elastic element (MEE) and the multilinear plastic element (MPE) are used to model the nonlinear elastic behavior of PT tendons and the energy dissipation from the frictional device, respectively. For both tendons and frictional device, only the second-stage curves with a softened stiffness of the elements are required; hence, a negligible first-stage deformation has to be specified. For the HSS cable modeling, however, the MEE with a sufficiently long first-stage curve is adopted, because the cable is only permitted to behave in a linear elastic way.
(c) Pulley modeling. The pulley is modeled using five hinged frame elements within the dotted circle, in which nodes 1, 2, and 3 are located around the center point O. Because a pulley is almost a rigid body in real structures, the axial stiffness of each frame element has to be assigned a sufficiently large value.
(d) Models assembly. A “body constraint” is specified between nodes O, A, and B, and their vertical projection O’, A’, and B’, respectively, to ensure that each pair of nodes moves together as a 3D rigid body, except that the translational degree of freedom of node A is released to allow its axial movement.
(a)
(b) (c) (d)
Figure 2. Simulation of the SC-TOB frame (SC-TOBF): (a) SC-TOB arrangement; (b) multilinear elastic element (MEE) hysteresis; (c) multilinear plastic element (MPE) hysteresis; and (d) SC-TOB hysteresis.
2.3. Prototype Building Design
As illustrated in Figure 3, the prototype building is a steel-framed office building with nine stories and five bays, which can be considered as typical of intermediate structures. It has a constant story height of 3.9 m totaling 35.1 m and a constant bay width of 9 m totaling 45 m. Column types 1 to 6 are identified in Figure 3. Nonmoment-resisting beam-column connections are assumed in the design, because such connections have sufficient rotation capacity to accommodate a large drift
Figure 2. Simulation of the SC-TOB frame (SC-TOBF): (a) SC-TOB arrangement; (b) multilinear elasticelement (MEE) hysteresis; (c) multilinear plastic element (MPE) hysteresis; and (d) SC-TOB hysteresis.
2.3. Prototype Building Design
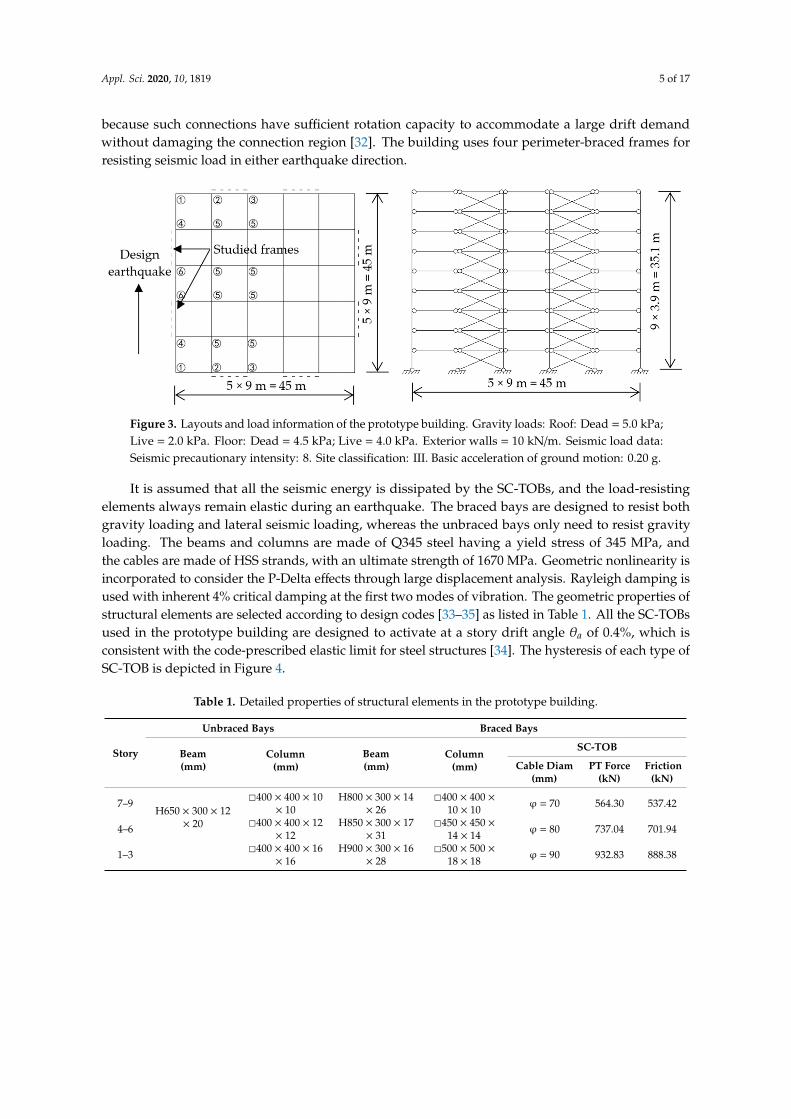
As illustrated in Figure 3, the prototype building is a steel-framed office building with nine storiesand five bays, which can be considered as typical of intermediate structures. It has a constant storyheight of 3.9 m totaling 35.1 m and a constant bay width of 9 m totaling 45 m. Column types 1 to 6 areidentified in Figure 3. Nonmoment-resisting beam-column connections are assumed in the design,
Appl. Sci. 2020, 10, 1819 5 of 17
because such connections have sufficient rotation capacity to accommodate a large drift demandwithout damaging the connection region [32]. The building uses four perimeter-braced frames forresisting seismic load in either earthquake direction.
Appl. Sci. 2020, 10, x FOR PEER REVIEW 5 of 17
demand without damaging the connection region [32]. The building uses four perimeter-braced frames for resisting seismic load in either earthquake direction.
Figure 3. Layouts and load information of the prototype building. Gravity loads: Roof: Dead = 5.0 kPa; Live = 2.0 kPa. Floor: Dead = 4.5 kPa; Live = 4.0 kPa. Exterior walls = 10 kN/m. Seismic load data: Seismic precautionary intensity: 8. Site classification: III. Basic acceleration of ground motion: 0.20 g.
It is assumed that all the seismic energy is dissipated by the SC-TOBs, and the load-resisting elements always remain elastic during an earthquake. The braced bays are designed to resist both gravity loading and lateral seismic loading, whereas the unbraced bays only need to resist gravity loading. The beams and columns are made of Q345 steel having a yield stress of 345 MPa, and the cables are made of HSS strands, with an ultimate strength of 1670 MPa. Geometric nonlinearity is incorporated to consider the P-Delta effects through large displacement analysis. Rayleigh damping is used with inherent 4% critical damping at the first two modes of vibration. The geometric properties of structural elements are selected according to design codes [33–35] as listed in Table 1. All the SC-TOBs used in the prototype building are designed to activate at a story drift angle 𝜃 of 0.4%, which is consistent with the code-prescribed elastic limit for steel structures [34]. The hysteresis of each type of SC-TOB is depicted in Figure 4.
Table 1. Detailed properties of structural elements in the prototype building.
Story
Unbraced Bays Braced Bays
Beam (mm)
Column (mm)
Beam (mm)
Column (mm)
SC-TOB
Cable Diam (mm)
PT Force (kN)
Friction (kN)
7–9
H650 × 300 × 12 × 20
400 × 400 × 10 × 10 H800 × 300 × 14 × 26 400 × 400 × 10 ×
10 φ = 70 564.30 537.42
4–6 400 × 400 × 12 × 12 H850 × 300 × 17 × 31 450 × 450 × 14 × 14
φ = 80 737.04 701.94
1–3 400 × 400 × 16 × 16 H900 × 300 × 16 × 28 500 × 500 × 18 ×
18 φ = 90 932.83 888.38
0
500
1000
1500
2000
2500
0 20 40 60 80
Load
(kN
)
Deformation (mm)
φ = 90 mm
φ = 80 mm
φ = 70 mm
Figure 3. Layouts and load information of the prototype building. Gravity loads: Roof: Dead = 5.0 kPa;Live = 2.0 kPa. Floor: Dead = 4.5 kPa; Live = 4.0 kPa. Exterior walls = 10 kN/m. Seismic load data:Seismic precautionary intensity: 8. Site classification: III. Basic acceleration of ground motion: 0.20 g.
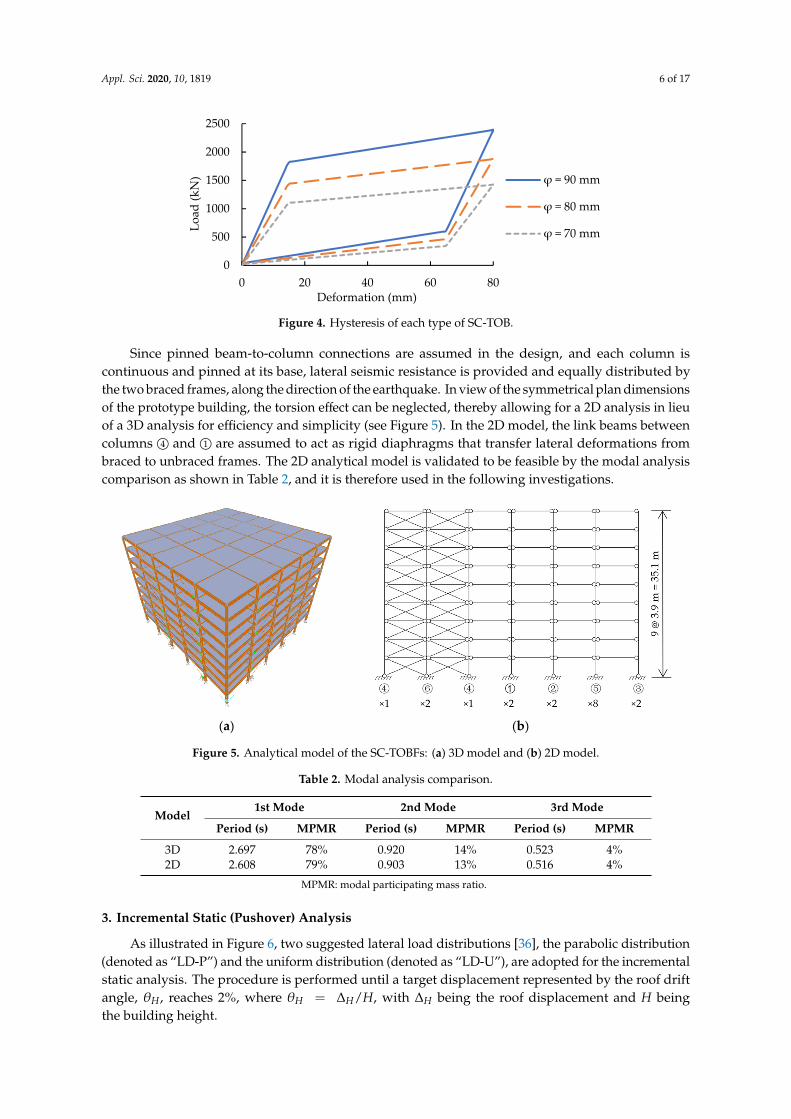
It is assumed that all the seismic energy is dissipated by the SC-TOBs, and the load-resistingelements always remain elastic during an earthquake. The braced bays are designed to resist bothgravity loading and lateral seismic loading, whereas the unbraced bays only need to resist gravityloading. The beams and columns are made of Q345 steel having a yield stress of 345 MPa, andthe cables are made of HSS strands, with an ultimate strength of 1670 MPa. Geometric nonlinearity isincorporated to consider the P-Delta effects through large displacement analysis. Rayleigh damping isused with inherent 4% critical damping at the first two modes of vibration. The geometric properties ofstructural elements are selected according to design codes [33–35] as listed in Table 1. All the SC-TOBsused in the prototype building are designed to activate at a story drift angle θa of 0.4%, which isconsistent with the code-prescribed elastic limit for steel structures [34]. The hysteresis of each type ofSC-TOB is depicted in Figure 4.
Table 1. Detailed properties of structural elements in the prototype building.
Story
Unbraced Bays Braced Bays
Beam(mm)
Column(mm)
Beam(mm)
Column(mm)
SC-TOB
Cable Diam(mm)
PT Force(kN)
Friction(kN)
7–9H650 × 300 × 12
× 20
2400 × 400 × 10× 10
H800 × 300 × 14× 26
2400 × 400 ×10 × 10 ϕ = 70 564.30 537.42
4–6 2400 × 400 × 12× 12
H850 × 300 × 17× 31
2450 × 450 ×14 × 14 ϕ = 80 737.04 701.94
1–3 2400 × 400 × 16× 16
H900 × 300 × 16× 28
2500 × 500 ×18 × 18 ϕ = 90 932.83 888.38
Appl. Sci. 2020, 10, 1819 6 of 17
Appl. Sci. 2020, 10, x FOR PEER REVIEW 5 of 17
demand without damaging the connection region [32]. The building uses four perimeter-braced frames for resisting seismic load in either earthquake direction.
Figure 3. Layouts and load information of the prototype building. Gravity loads: Roof: Dead = 5.0 kPa; Live = 2.0 kPa. Floor: Dead = 4.5 kPa; Live = 4.0 kPa. Exterior walls = 10 kN/m. Seismic load data: Seismic precautionary intensity: 8. Site classification: III. Basic acceleration of ground motion: 0.20 g.
It is assumed that all the seismic energy is dissipated by the SC-TOBs, and the load-resisting elements always remain elastic during an earthquake. The braced bays are designed to resist both gravity loading and lateral seismic loading, whereas the unbraced bays only need to resist gravity loading. The beams and columns are made of Q345 steel having a yield stress of 345 MPa, and the cables are made of HSS strands, with an ultimate strength of 1670 MPa. Geometric nonlinearity is incorporated to consider the P-Delta effects through large displacement analysis. Rayleigh damping is used with inherent 4% critical damping at the first two modes of vibration. The geometric properties of structural elements are selected according to design codes [33–35] as listed in Table 1. All the SC-TOBs used in the prototype building are designed to activate at a story drift angle 𝜃 of 0.4%, which is consistent with the code-prescribed elastic limit for steel structures [34]. The hysteresis of each type of SC-TOB is depicted in Figure 4.
Table 1. Detailed properties of structural elements in the prototype building.
Story
Unbraced Bays Braced Bays
Beam (mm)
Column (mm)
Beam (mm)
Column (mm)
SC-TOB
Cable Diam (mm)
PT Force (kN)
Friction (kN)
7–9
H650 × 300 × 12 × 20
400 × 400 × 10 × 10 H800 × 300 × 14 × 26 400 × 400 × 10 ×
10 φ = 70 564.30 537.42
4–6 400 × 400 × 12 × 12 H850 × 300 × 17 × 31 450 × 450 × 14 × 14
φ = 80 737.04 701.94
1–3 400 × 400 × 16 × 16 H900 × 300 × 16 × 28 500 × 500 × 18 ×
18 φ = 90 932.83 888.38
0
500
1000
1500
2000
2500
0 20 40 60 80
Load
(kN
)
Deformation (mm)
φ = 90 mm
φ = 80 mm
φ = 70 mm
Figure 4. Hysteresis of each type of SC-TOB.
Since pinned beam-to-column connections are assumed in the design, and each column iscontinuous and pinned at its base, lateral seismic resistance is provided and equally distributed bythe two braced frames, along the direction of the earthquake. In view of the symmetrical plan dimensionsof the prototype building, the torsion effect can be neglected, thereby allowing for a 2D analysis in lieuof a 3D analysis for efficiency and simplicity (see Figure 5). In the 2D model, the link beams betweencolumns 4O and 1O are assumed to act as rigid diaphragms that transfer lateral deformations frombraced to unbraced frames. The 2D analytical model is validated to be feasible by the modal analysiscomparison as shown in Table 2, and it is therefore used in the following investigations.
Appl. Sci. 2020, 10, x FOR PEER REVIEW 6 of 17
Figure 4. Hysteresis of each type of SC-TOB.
Since pinned beam-to-column connections are assumed in the design, and each column is continuous and pinned at its base, lateral seismic resistance is provided and equally distributed by the two braced frames, along the direction of the earthquake. In view of the symmetrical plan dimensions of the prototype building, the torsion effect can be neglected, thereby allowing for a 2D analysis in lieu of a 3D analysis for efficiency and simplicity (see Figure 5). In the 2D model, the link beams between columns ④ and ① are assumed to act as rigid diaphragms that transfer lateral deformations from braced to unbraced frames. The 2D analytical model is validated to be feasible by the modal analysis comparison as shown in Table 2, and it is therefore used in the following investigations.
(a) (b)
Figure 5. Analytical model of the SC-TOBFs: (a) 3D model and (b) 2D model.
Table 2. Modal analysis comparison.
Model 1st Mode 2nd Mode 3rd Mode
Period (s) MPMR Period (s) MPMR Period (s) MPMR 3D 2.697 78% 0.920 14% 0.523 4% 2D 2.608 79% 0.903 13% 0.516 4%
MPMR: modal participating mass ratio.
3. Incremental Static (Pushover) Analysis
As illustrated in Figure 6, two suggested lateral load distributions [36], the parabolic distribution (denoted as “LD-P”) and the uniform distribution (denoted as “LD-U”), are adopted for the incremental static analysis. The procedure is performed until a target displacement represented by the roof drift angle, 𝜃 , reaches 2%, where 𝜃 = 𝛥 /𝐻, with 𝛥 being the roof displacement and 𝐻 being the building height.
(a) (b)
Figure 5. Analytical model of the SC-TOBFs: (a) 3D model and (b) 2D model.
Table 2. Modal analysis comparison.
Model1st Mode 2nd Mode 3rd Mode
Period (s) MPMR Period (s) MPMR Period (s) MPMR
3D 2.697 78% 0.920 14% 0.523 4%2D 2.608 79% 0.903 13% 0.516 4%
MPMR: modal participating mass ratio.
3. Incremental Static (Pushover) Analysis
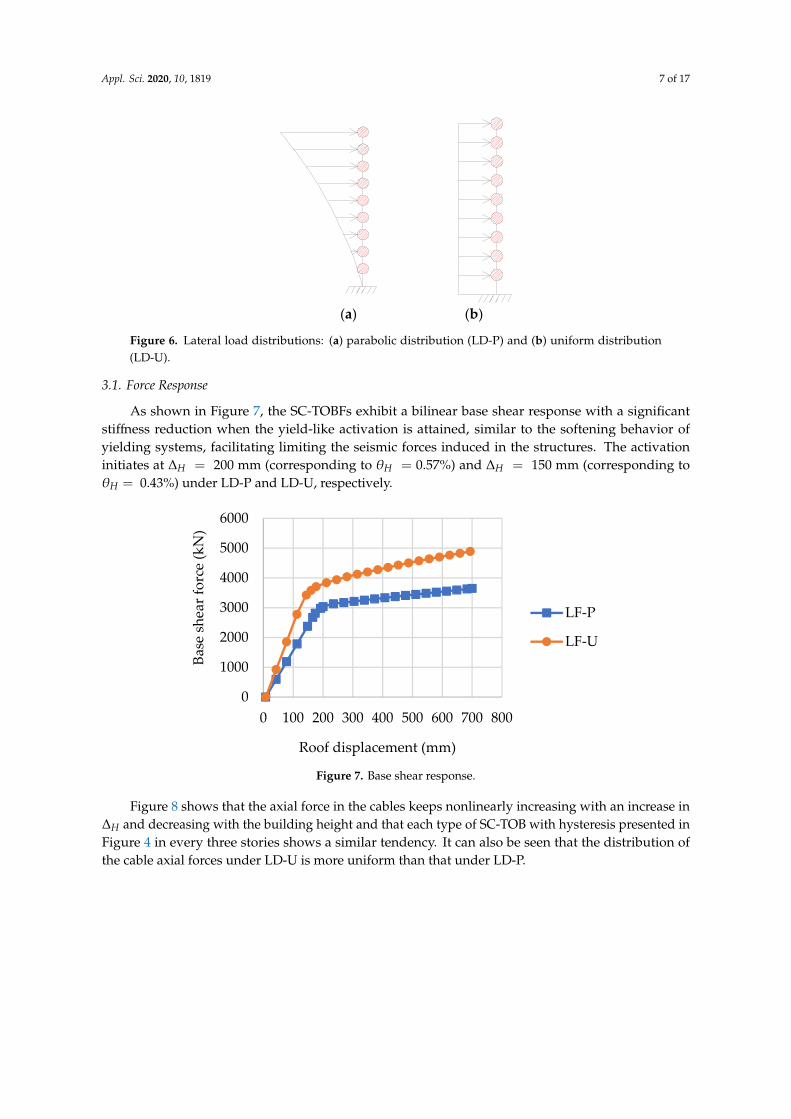
As illustrated in Figure 6, two suggested lateral load distributions [36], the parabolic distribution(denoted as “LD-P”) and the uniform distribution (denoted as “LD-U”), are adopted for the incrementalstatic analysis. The procedure is performed until a target displacement represented by the roof driftangle, θH, reaches 2%, where θH = ∆H/H, with ∆H being the roof displacement and H beingthe building height.
Appl. Sci. 2020, 10, 1819 7 of 17
Appl. Sci. 2020, 10, x FOR PEER REVIEW 6 of 17
Figure 4. Hysteresis of each type of SC-TOB.
Since pinned beam-to-column connections are assumed in the design, and each column is continuous and pinned at its base, lateral seismic resistance is provided and equally distributed by the two braced frames, along the direction of the earthquake. In view of the symmetrical plan dimensions of the prototype building, the torsion effect can be neglected, thereby allowing for a 2D analysis in lieu of a 3D analysis for efficiency and simplicity (see Figure 5). In the 2D model, the link beams between columns ④ and ① are assumed to act as rigid diaphragms that transfer lateral deformations from braced to unbraced frames. The 2D analytical model is validated to be feasible by the modal analysis comparison as shown in Table 2, and it is therefore used in the following investigations.
(a) (b)
Figure 5. Analytical model of the SC-TOBFs: (a) 3D model and (b) 2D model.
Table 2. Modal analysis comparison.
Model 1st Mode 2nd Mode 3rd Mode
Period (s) MPMR Period (s) MPMR Period (s) MPMR 3D 2.697 78% 0.920 14% 0.523 4% 2D 2.608 79% 0.903 13% 0.516 4%
MPMR: modal participating mass ratio.
3. Incremental Static (Pushover) Analysis
As illustrated in Figure 6, two suggested lateral load distributions [36], the parabolic distribution (denoted as “LD-P”) and the uniform distribution (denoted as “LD-U”), are adopted for the incremental static analysis. The procedure is performed until a target displacement represented by the roof drift angle, 𝜃 , reaches 2%, where 𝜃 = 𝛥 /𝐻, with 𝛥 being the roof displacement and 𝐻 being the building height.
(a) (b)
Figure 6. Lateral load distributions: (a) parabolic distribution (LD-P) and (b) uniform distribution(LD-U).
3.1. Force Response
As shown in Figure 7, the SC-TOBFs exhibit a bilinear base shear response with a significantstiffness reduction when the yield-like activation is attained, similar to the softening behavior ofyielding systems, facilitating limiting the seismic forces induced in the structures. The activationinitiates at ∆H = 200 mm (corresponding to θH = 0.57%) and ∆H = 150 mm (corresponding toθH = 0.43%) under LD-P and LD-U, respectively.
Appl. Sci. 2020, 10, x FOR PEER REVIEW 7 of 17
Figure 6. Lateral load distributions: (a) parabolic distribution (LD-P) and (b) uniform distribution (LD-U).
3.1. Force Response
As shown in Figure 7, the SC-TOBFs exhibit a bilinear base shear response with a significant stiffness reduction when the yield-like activation is attained, similar to the softening behavior of yielding systems, facilitating limiting the seismic forces induced in the structures. The activation initiates at 𝛥 = 200 mm (corresponding to 𝜃 = 0.57%) and 𝛥 = 150 mm (corresponding to 𝜃 = 0.43%) under LD-P and LD-U, respectively.
Figure 7. Base shear response.
Figure 8 shows that the axial force in the cables keeps nonlinearly increasing with an increase in 𝛥 and decreasing with the building height and that each type of SC-TOB with hysteresis presented in Figure 4 in every three stories shows a similar tendency. It can also be seen that the distribution of the cable axial forces under LD-U is more uniform than that under LD-P.
(a)
0
1000
2000
3000
4000
5000
6000
0 100 200 300 400 500 600 700 800
Base
she
ar fo
rce
(kN
)
Roof displacement (mm)
LF-P
LF-U
0
500
1000
1500
2000
2500
3000
0 100 200 300 400 500 600 700 800
Cab
le a
xial
forc
e (k
N)
Roof displacement (mm)
Story 9
Story 8
Story 7
Story 6
Story 5
Story 4
Story 3
Story 2
Story 1
Figure 7. Base shear response.
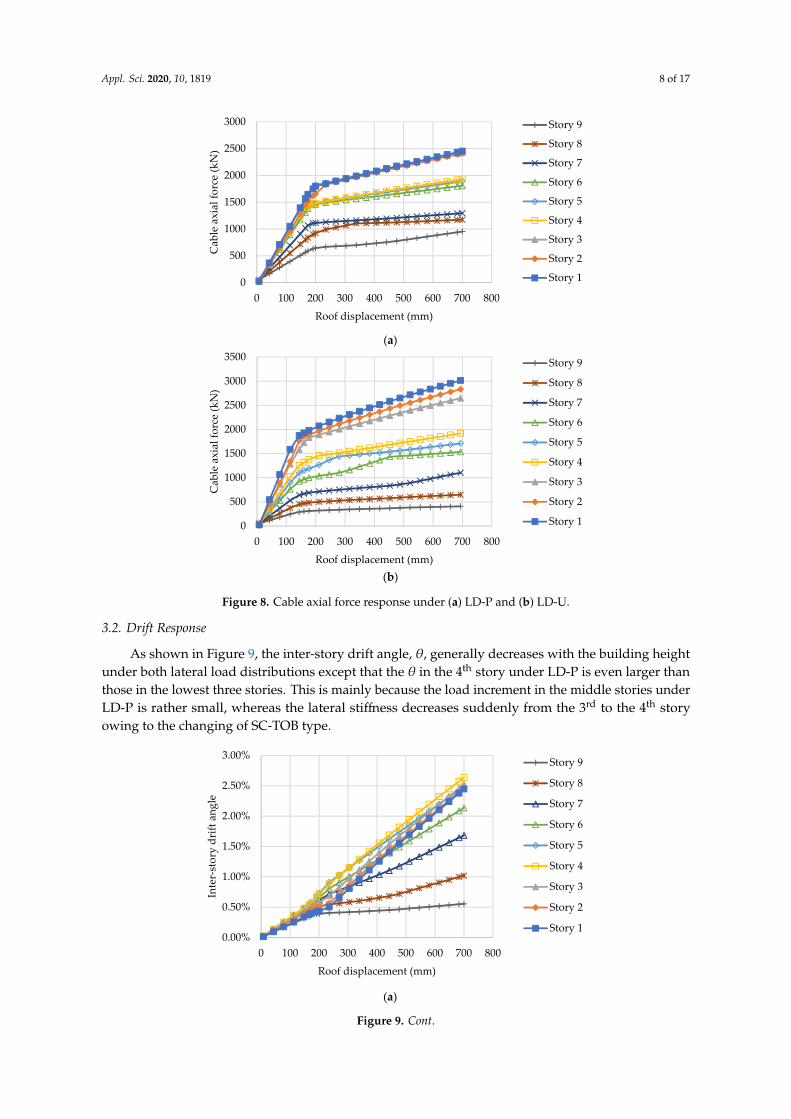
Figure 8 shows that the axial force in the cables keeps nonlinearly increasing with an increase in∆H and decreasing with the building height and that each type of SC-TOB with hysteresis presented inFigure 4 in every three stories shows a similar tendency. It can also be seen that the distribution ofthe cable axial forces under LD-U is more uniform than that under LD-P.
Appl. Sci. 2020, 10, 1819 8 of 17
Appl. Sci. 2020, 10, x FOR PEER REVIEW 7 of 17
Figure 6. Lateral load distributions: (a) parabolic distribution (LD-P) and (b) uniform distribution (LD-U).
3.1. Force Response
As shown in Figure 7, the SC-TOBFs exhibit a bilinear base shear response with a significant stiffness reduction when the yield-like activation is attained, similar to the softening behavior of yielding systems, facilitating limiting the seismic forces induced in the structures. The activation initiates at 𝛥 = 200 mm (corresponding to 𝜃 = 0.57%) and 𝛥 = 150 mm (corresponding to 𝜃 = 0.43%) under LD-P and LD-U, respectively.
Figure 7. Base shear response.
Figure 8 shows that the axial force in the cables keeps nonlinearly increasing with an increase in 𝛥 and decreasing with the building height and that each type of SC-TOB with hysteresis presented in Figure 4 in every three stories shows a similar tendency. It can also be seen that the distribution of the cable axial forces under LD-U is more uniform than that under LD-P.
(a)
0
1000
2000
3000
4000
5000
6000
0 100 200 300 400 500 600 700 800
Base
she
ar fo
rce
(kN
)
Roof displacement (mm)
LF-P
LF-U
0
500
1000
1500
2000
2500
3000
0 100 200 300 400 500 600 700 800
Cab
le a
xial
forc
e (k
N)
Roof displacement (mm)
Story 9
Story 8
Story 7
Story 6
Story 5
Story 4
Story 3
Story 2
Story 1
Appl. Sci. 2020, 10, x FOR PEER REVIEW 8 of 17
(b)
Figure 8. Cable axial force response under (a) LD-P and (b) LD-U.
3.2. Drift Response
As shown in Figure 9, the inter-story drift angle, 𝜃, generally decreases with the building height under both lateral load distributions except that the 𝜃 in the 4th story under LD-P is even larger than those in the lowest three stories. This is mainly because the load increment in the middle stories under LD-P is rather small, whereas the lateral stiffness decreases suddenly from the 3rd to the 4th story owing to the changing of SC-TOB type.
(a)
0
500
1000
1500
2000
2500
3000
3500
0 100 200 300 400 500 600 700 800
Cab
le a
xial
forc
e (k
N)
Roof displacement (mm)
Story 9
Story 8
Story 7
Story 6
Story 5
Story 4
Story 3
Story 2
Story 1
0.00%
0.50%
1.00%
1.50%
2.00%
2.50%
3.00%
0 100 200 300 400 500 600 700 800
Inte
r-st
ory
drift
ang
le
Roof displacement (mm)
Story 9
Story 8
Story 7
Story 6
Story 5
Story 4
Story 3
Story 2
Story 1
Figure 8. Cable axial force response under (a) LD-P and (b) LD-U.
3.2. Drift Response
As shown in Figure 9, the inter-story drift angle, θ, generally decreases with the building heightunder both lateral load distributions except that the θ in the 4th story under LD-P is even larger thanthose in the lowest three stories. This is mainly because the load increment in the middle stories underLD-P is rather small, whereas the lateral stiffness decreases suddenly from the 3rd to the 4th storyowing to the changing of SC-TOB type.
Appl. Sci. 2020, 10, x FOR PEER REVIEW 8 of 17
(b)
Figure 8. Cable axial force response under (a) LD-P and (b) LD-U.
3.2. Drift Response
As shown in Figure 9, the inter-story drift angle, 𝜃, generally decreases with the building height under both lateral load distributions except that the 𝜃 in the 4th story under LD-P is even larger than those in the lowest three stories. This is mainly because the load increment in the middle stories under LD-P is rather small, whereas the lateral stiffness decreases suddenly from the 3rd to the 4th story owing to the changing of SC-TOB type.
(a)
0
500
1000
1500
2000
2500
3000
3500
0 100 200 300 400 500 600 700 800
Cab
le a
xial
forc
e (k
N)
Roof displacement (mm)
Story 9
Story 8
Story 7
Story 6
Story 5
Story 4
Story 3
Story 2
Story 1
0.00%
0.50%
1.00%
1.50%
2.00%
2.50%
3.00%
0 100 200 300 400 500 600 700 800
Inte
r-st
ory
drift
ang
le
Roof displacement (mm)
Story 9
Story 8
Story 7
Story 6
Story 5
Story 4
Story 3
Story 2
Story 1
Figure 9. Cont.
Appl. Sci. 2020, 10, 1819 9 of 17Appl. Sci. 2020, 10, x FOR PEER REVIEW 9 of 17
(b)
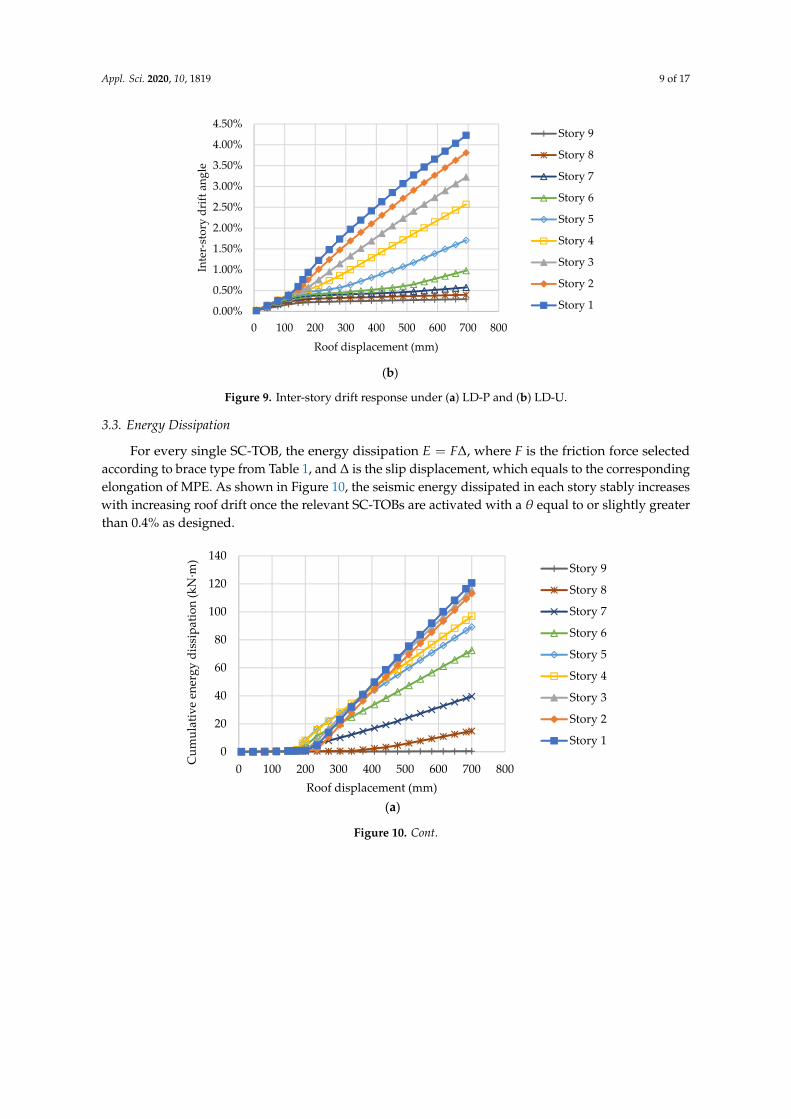
Figure 9. Inter-story drift response under (a) LD-P and (b) LD-U.
3.3. Energy Dissipation
For every single SC-TOB, the energy dissipation 𝐸 = 𝐹∆, where 𝐹 is the friction force selected according to brace type from Table 1, and ∆ is the slip displacement, which equals to the corresponding elongation of MPE. As shown in Figure 10, the seismic energy dissipated in each story stably increases with increasing roof drift once the relevant SC-TOBs are activated with a 𝜃 equal to or slightly greater than 0.4% as designed.
(a)
0.00%
0.50%
1.00%
1.50%
2.00%
2.50%
3.00%
3.50%
4.00%
4.50%
0 100 200 300 400 500 600 700 800
Inte
r-st
ory
drift
ang
le
Roof displacement (mm)
Story 9
Story 8
Story 7
Story 6
Story 5
Story 4
Story 3
Story 2
Story 1
0
20
40
60
80
100
120
140
0 100 200 300 400 500 600 700 800
Cum
ulat
ive
ener
gy d
issi
patio
n (k
N·m
)
Roof displacement (mm)
Story 9
Story 8
Story 7
Story 6
Story 5
Story 4
Story 3
Story 2
Story 1
Figure 9. Inter-story drift response under (a) LD-P and (b) LD-U.
3.3. Energy Dissipation
For every single SC-TOB, the energy dissipation E = F∆, where F is the friction force selectedaccording to brace type from Table 1, and ∆ is the slip displacement, which equals to the correspondingelongation of MPE. As shown in Figure 10, the seismic energy dissipated in each story stably increaseswith increasing roof drift once the relevant SC-TOBs are activated with a θ equal to or slightly greaterthan 0.4% as designed.
Appl. Sci. 2020, 10, x FOR PEER REVIEW 9 of 17
(b)
Figure 9. Inter-story drift response under (a) LD-P and (b) LD-U.
3.3. Energy Dissipation
For every single SC-TOB, the energy dissipation 𝐸 = 𝐹∆, where 𝐹 is the friction force selected according to brace type from Table 1, and ∆ is the slip displacement, which equals to the corresponding elongation of MPE. As shown in Figure 10, the seismic energy dissipated in each story stably increases with increasing roof drift once the relevant SC-TOBs are activated with a 𝜃 equal to or slightly greater than 0.4% as designed.
(a)
0.00%
0.50%
1.00%
1.50%
2.00%
2.50%
3.00%
3.50%
4.00%
4.50%
0 100 200 300 400 500 600 700 800
Inte
r-st
ory
drift
ang
le
Roof displacement (mm)
Story 9
Story 8
Story 7
Story 6
Story 5
Story 4
Story 3
Story 2
Story 1
0
20
40
60
80
100
120
140
0 100 200 300 400 500 600 700 800
Cum
ulat
ive
ener
gy d
issi
patio
n (k
N·m
)
Roof displacement (mm)
Story 9
Story 8
Story 7
Story 6
Story 5
Story 4
Story 3
Story 2
Story 1
Figure 10. Cont.
Appl. Sci. 2020, 10, 1819 10 of 17Appl. Sci. 2020, 10, x FOR PEER REVIEW 10 of 17
(b)
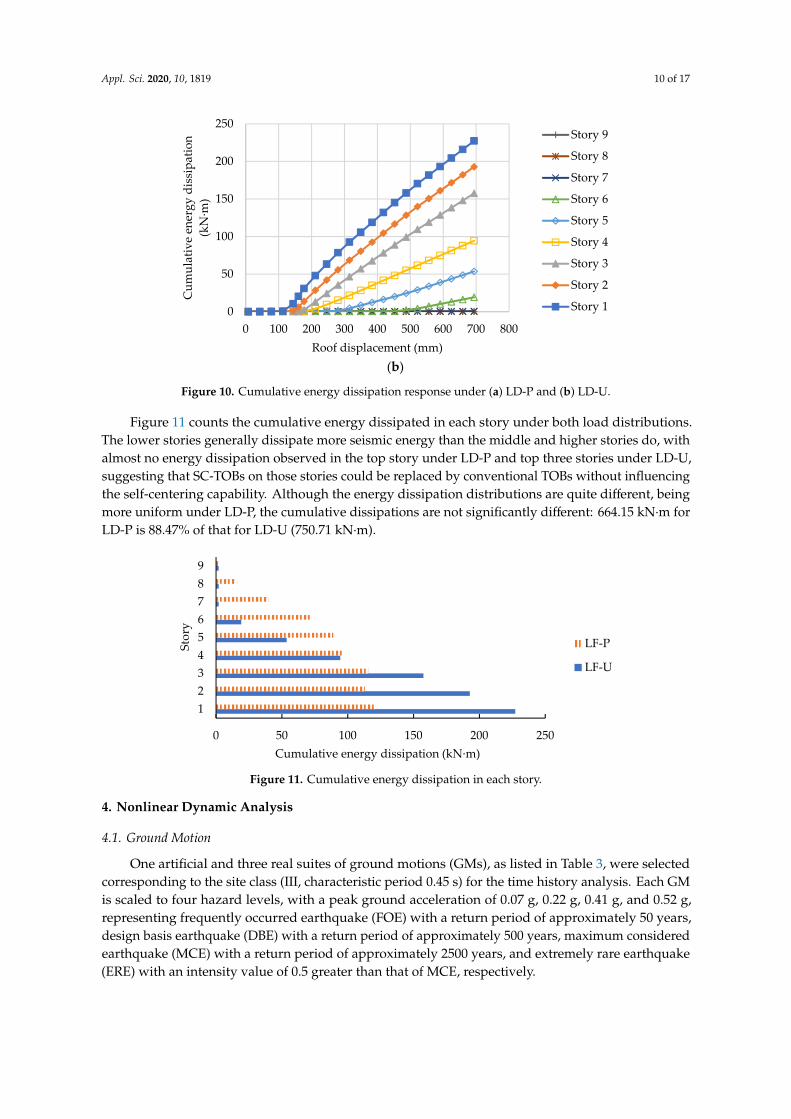
Figure 10. Cumulative energy dissipation response under (a) LD-P and (b) LD-U.
Figure 11 counts the cumulative energy dissipated in each story under both load distributions. The lower stories generally dissipate more seismic energy than the middle and higher stories do, with almost no energy dissipation observed in the top story under LD-P and top three stories under LD-U, suggesting that SC-TOBs on those stories could be replaced by conventional TOBs without influencing the self-centering capability. Although the energy dissipation distributions are quite different, being more uniform under LD-P, the cumulative dissipations are not significantly different: 664.15 kN·m for LD-P is 88.47% of that for LD-U (750.71 kN·m).
Figure 11. Cumulative energy dissipation in each story.
4. Nonlinear Dynamic Analysis
4.1. Ground Motion
One artificial and three real suites of ground motions (GMs), as listed in Table 3, were selected corresponding to the site class (III, characteristic period 0.45 s) for the time history analysis. Each GM is scaled to four hazard levels, with a peak ground acceleration of 0.07 g, 0.22 g, 0.41 g, and 0.52 g, representing frequently occurred earthquake (FOE) with a return period of approximately 50 years, design basis earthquake (DBE) with a return period of approximately 500 years, maximum considered earthquake (MCE) with a return period of approximately 2500 years, and extremely rare earthquake (ERE) with an intensity value of 0.5 greater than that of MCE, respectively.
0
50
100
150
200
250
0 100 200 300 400 500 600 700 800
Cum
ulat
ive
ener
gy d
issi
patio
n (k
N·m
)
Roof displacement (mm)
Story 9
Story 8
Story 7
Story 6
Story 5
Story 4
Story 3
Story 2
Story 1
0 50 100 150 200 250
123456789
Cumulative energy dissipation (kN·m)
Stor
y
LF-P
LF-U
Figure 10. Cumulative energy dissipation response under (a) LD-P and (b) LD-U.
Figure 11 counts the cumulative energy dissipated in each story under both load distributions.The lower stories generally dissipate more seismic energy than the middle and higher stories do, withalmost no energy dissipation observed in the top story under LD-P and top three stories under LD-U,suggesting that SC-TOBs on those stories could be replaced by conventional TOBs without influencingthe self-centering capability. Although the energy dissipation distributions are quite different, beingmore uniform under LD-P, the cumulative dissipations are not significantly different: 664.15 kN·m forLD-P is 88.47% of that for LD-U (750.71 kN·m).
Appl. Sci. 2020, 10, x FOR PEER REVIEW 10 of 17
(b)
Figure 10. Cumulative energy dissipation response under (a) LD-P and (b) LD-U.
Figure 11 counts the cumulative energy dissipated in each story under both load distributions. The lower stories generally dissipate more seismic energy than the middle and higher stories do, with almost no energy dissipation observed in the top story under LD-P and top three stories under LD-U, suggesting that SC-TOBs on those stories could be replaced by conventional TOBs without influencing the self-centering capability. Although the energy dissipation distributions are quite different, being more uniform under LD-P, the cumulative dissipations are not significantly different: 664.15 kN·m for LD-P is 88.47% of that for LD-U (750.71 kN·m).
Figure 11. Cumulative energy dissipation in each story.
4. Nonlinear Dynamic Analysis
4.1. Ground Motion
One artificial and three real suites of ground motions (GMs), as listed in Table 3, were selected corresponding to the site class (III, characteristic period 0.45 s) for the time history analysis. Each GM is scaled to four hazard levels, with a peak ground acceleration of 0.07 g, 0.22 g, 0.41 g, and 0.52 g, representing frequently occurred earthquake (FOE) with a return period of approximately 50 years, design basis earthquake (DBE) with a return period of approximately 500 years, maximum considered earthquake (MCE) with a return period of approximately 2500 years, and extremely rare earthquake (ERE) with an intensity value of 0.5 greater than that of MCE, respectively.
0
50
100
150
200
250
0 100 200 300 400 500 600 700 800
Cum
ulat
ive
ener
gy d
issi
patio
n (k
N·m
)
Roof displacement (mm)
Story 9
Story 8
Story 7
Story 6
Story 5
Story 4
Story 3
Story 2
Story 1
0 50 100 150 200 250
123456789
Cumulative energy dissipation (kN·m)
Stor
y
LF-P
LF-U
Figure 11. Cumulative energy dissipation in each story.
4. Nonlinear Dynamic Analysis
4.1. Ground Motion
One artificial and three real suites of ground motions (GMs), as listed in Table 3, were selectedcorresponding to the site class (III, characteristic period 0.45 s) for the time history analysis. Each GMis scaled to four hazard levels, with a peak ground acceleration of 0.07 g, 0.22 g, 0.41 g, and 0.52 g,representing frequently occurred earthquake (FOE) with a return period of approximately 50 years,design basis earthquake (DBE) with a return period of approximately 500 years, maximum consideredearthquake (MCE) with a return period of approximately 2500 years, and extremely rare earthquake(ERE) with an intensity value of 0.5 greater than that of MCE, respectively.
Appl. Sci. 2020, 10, 1819 11 of 17
Table 3. Ground motion properties for nonlinear dynamic analysis (4 suites of 16 excitations).
Suite No. Earthquake Duration (s) Peak Ground Acceleration (g)
GM 1 El-Centro1940
53.4Origin TH1-1 TH1-2 TH1-3 TH1-4
0.35 0.07 0.22 0.41 0.52
GM 2 Taft1952
54.2Origin TH2-1 TH2-2 TH2-3 TH2-4
0.16 0.07 0.22 0.41 0.52
GM 3 Tianjin1976
19.2Origin TH3-1 TH3-2 TH3-3 TH3-4
0.15 0.07 0.22 0.41 0.52
GM 4 Artificial 30.0Origin TH4-1 TH4-2 TH4-3 TH4-4
0.10 0.07 0.22 0.41 0.52
4.2. Force Response
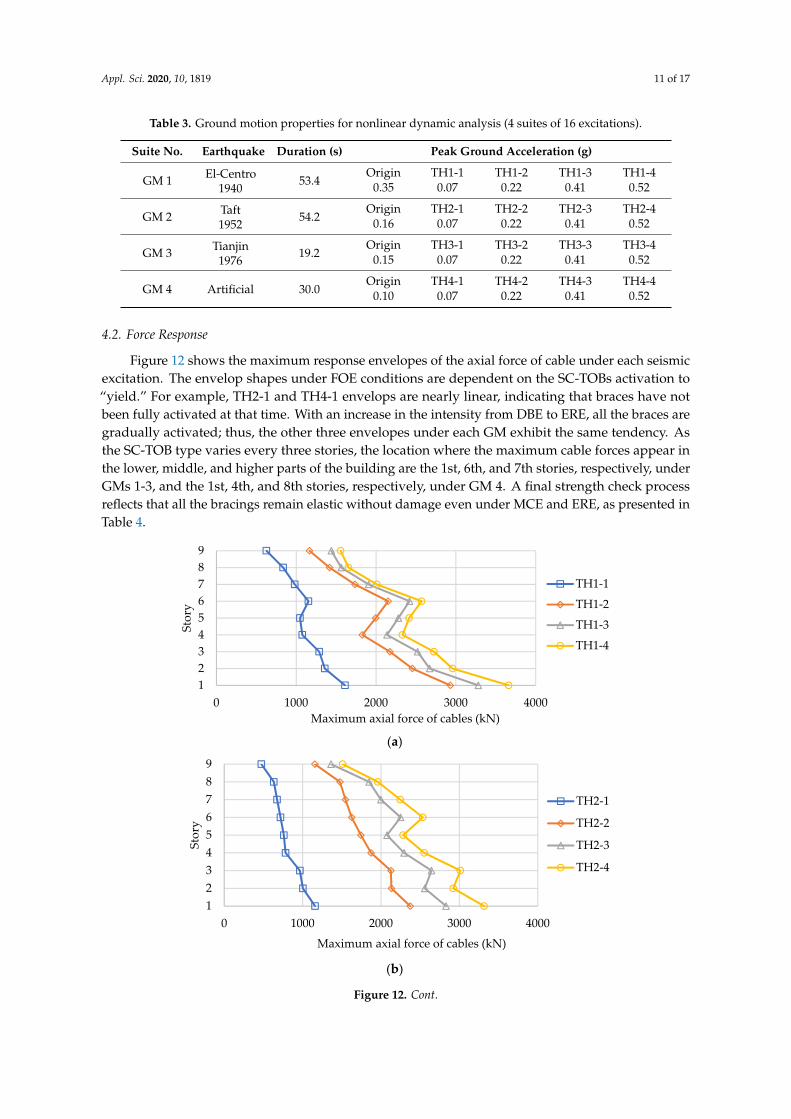
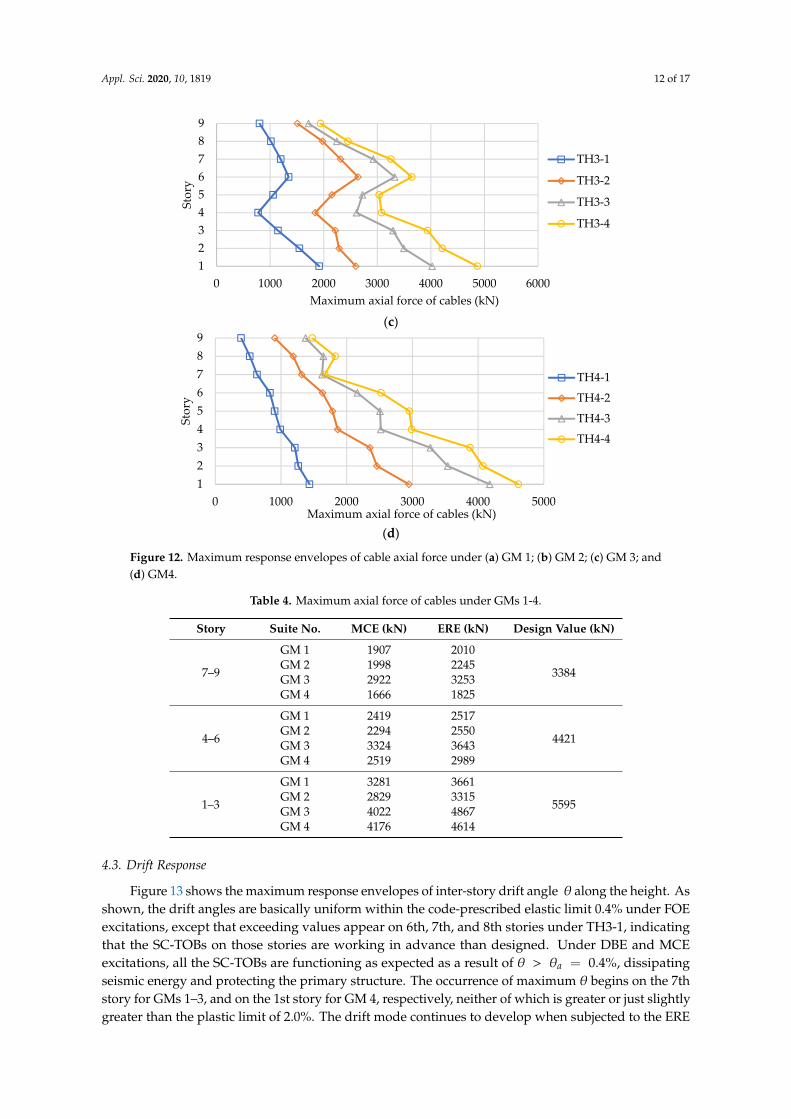
Figure 12 shows the maximum response envelopes of the axial force of cable under each seismicexcitation. The envelop shapes under FOE conditions are dependent on the SC-TOBs activation to“yield.” For example, TH2-1 and TH4-1 envelops are nearly linear, indicating that braces have notbeen fully activated at that time. With an increase in the intensity from DBE to ERE, all the braces aregradually activated; thus, the other three envelopes under each GM exhibit the same tendency. Asthe SC-TOB type varies every three stories, the location where the maximum cable forces appear inthe lower, middle, and higher parts of the building are the 1st, 6th, and 7th stories, respectively, underGMs 1-3, and the 1st, 4th, and 8th stories, respectively, under GM 4. A final strength check processreflects that all the bracings remain elastic without damage even under MCE and ERE, as presented inTable 4.
Appl. Sci. 2020, 10, x FOR PEER REVIEW 11 of 17
Table 3. Ground motion properties for nonlinear dynamic analysis (4 suites of 16 excitations).
Suite No. Earthquake Duration (s) Peak Ground Acceleration (g)
GM 1 El-Centro
1940 53.4
Origin TH1-1 TH1-2 TH1-3 TH1-4 0.35 0.07 0.22 0.41 0.52
GM 2 Taft 1952
54.2 Origin TH2-1 TH2-2 TH2-3 TH2-4
0.16 0.07 0.22 0.41 0.52
GM 3 Tianjin
1976 19.2
Origin TH3-1 TH3-2 TH3-3 TH3-4 0.15 0.07 0.22 0.41 0.52
GM 4 Artificial 30.0 Origin TH4-1 TH4-2 TH4-3 TH4-4
0.10 0.07 0.22 0.41 0.52
4.2. Force Response
Figure 12 shows the maximum response envelopes of the axial force of cable under each seismic excitation. The envelop shapes under FOE conditions are dependent on the SC-TOBs activation to “yield.” For example, TH2-1 and TH4-1 envelops are nearly linear, indicating that braces have not been fully activated at that time. With an increase in the intensity from DBE to ERE, all the braces are gradually activated; thus, the other three envelopes under each GM exhibit the same tendency. As the SC-TOB type varies every three stories, the location where the maximum cable forces appear in the lower, middle, and higher parts of the building are the 1st, 6th, and 7th stories, respectively, under GMs 1-3, and the 1st, 4th, and 8th stories, respectively, under GM 4. A final strength check process reflects that all the bracings remain elastic without damage even under MCE and ERE, as presented in Table 4.
(a)
(b)
123456789
0 1000 2000 3000 4000
Stor
y
Maximum axial force of cables (kN)
TH1-1
TH1-2
TH1-3
TH1-4
123456789
0 1000 2000 3000 4000
Stor
y
Maximum axial force of cables (kN)
TH2-1
TH2-2
TH2-3
TH2-4
Figure 12. Cont.
Appl. Sci. 2020, 10, 1819 12 of 17Appl. Sci. 2020, 10, x FOR PEER REVIEW 12 of 17
(c)
(d)
Figure 12. Maximum response envelopes of cable axial force under (a) GM 1; (b) GM 2; (c) GM 3; and (d) GM4.
Table 4. Maximum axial force of cables under GMs 1-4.
Story Suite No. MCE (kN) ERE (kN) Design Value (kN)
7–9
GM 1 1907 2010
3384 GM 2 1998 2245 GM 3 2922 3253 GM 4 1666 1825
4–6
GM 1 2419 2517
4421 GM 2 2294 2550 GM 3 3324 3643 GM 4 2519 2989
1–3
GM 1 3281 3661
5595 GM 2 2829 3315 GM 3 4022 4867 GM 4 4176 4614
4.3. Drift Response
Figure 13 shows the maximum response envelopes of inter-story drift angle 𝜃 along the height. As shown, the drift angles are basically uniform within the code-prescribed elastic limit 0.4% under FOE excitations, except that exceeding values appear on 6th, 7th, and 8th stories under TH3-1, indicating that the SC-TOBs on those stories are working in advance than designed. Under DBE and MCE excitations, all the SC-TOBs are functioning as expected as a result of 𝜃 > 𝜃 = 0.4% , dissipating seismic energy and protecting the primary structure. The occurrence of maximum 𝜃 begins on the 7th story for GMs 1–3, and on the 1st story for GM 4, respectively, neither of which is greater or just slightly greater than the plastic limit of 2.0%. The drift mode continues to develop
123456789
0 1000 2000 3000 4000 5000 6000
Stor
y
Maximum axial force of cables (kN)
TH3-1
TH3-2
TH3-3
TH3-4
123456789
0 1000 2000 3000 4000 5000
Stor
y
Maximum axial force of cables (kN)
TH4-1
TH4-2
TH4-3
TH4-4
Figure 12. Maximum response envelopes of cable axial force under (a) GM 1; (b) GM 2; (c) GM 3; and(d) GM4.
Table 4. Maximum axial force of cables under GMs 1-4.
Story Suite No. MCE (kN) ERE (kN) Design Value (kN)
7–9
GM 1 1907 2010
3384GM 2 1998 2245GM 3 2922 3253GM 4 1666 1825
4–6
GM 1 2419 2517
4421GM 2 2294 2550GM 3 3324 3643GM 4 2519 2989
1–3
GM 1 3281 3661
5595GM 2 2829 3315GM 3 4022 4867GM 4 4176 4614
4.3. Drift Response
Figure 13 shows the maximum response envelopes of inter-story drift angle θ along the height. Asshown, the drift angles are basically uniform within the code-prescribed elastic limit 0.4% under FOEexcitations, except that exceeding values appear on 6th, 7th, and 8th stories under TH3-1, indicatingthat the SC-TOBs on those stories are working in advance than designed. Under DBE and MCEexcitations, all the SC-TOBs are functioning as expected as a result of θ > θa = 0.4%, dissipatingseismic energy and protecting the primary structure. The occurrence of maximum θ begins on the 7thstory for GMs 1–3, and on the 1st story for GM 4, respectively, neither of which is greater or just slightlygreater than the plastic limit of 2.0%. The drift mode continues to develop when subjected to the ERE
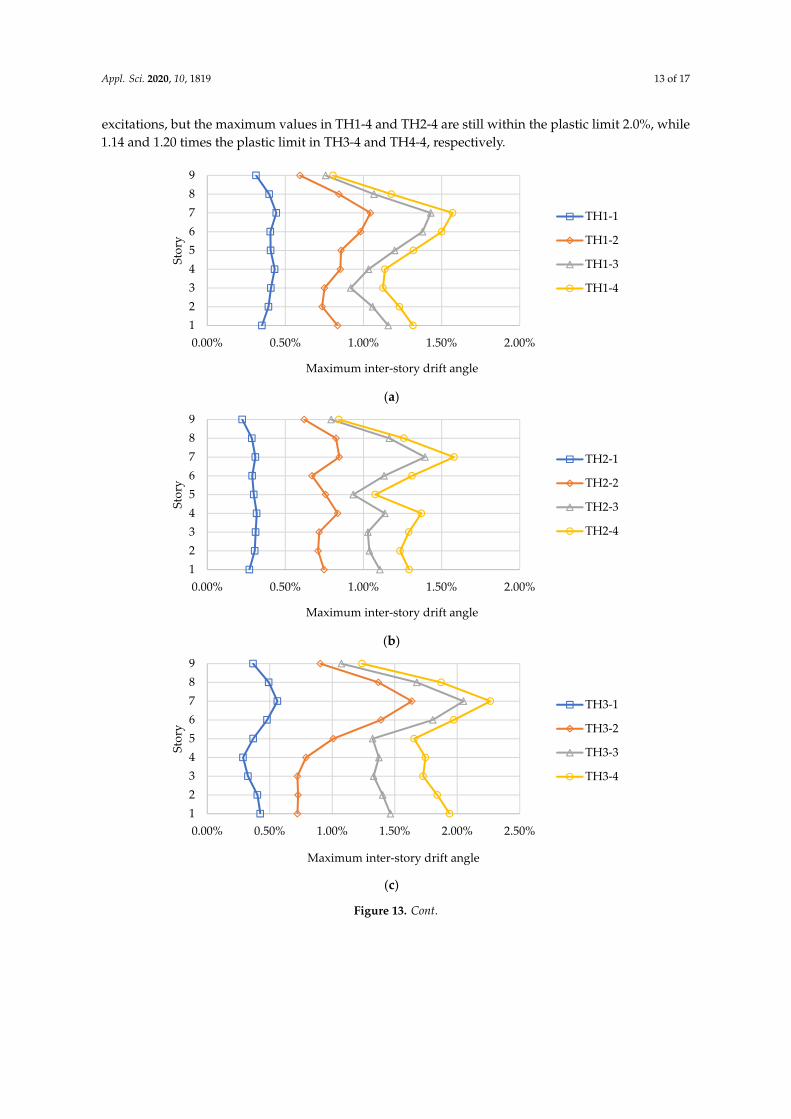
Appl. Sci. 2020, 10, 1819 13 of 17
excitations, but the maximum values in TH1-4 and TH2-4 are still within the plastic limit 2.0%, while1.14 and 1.20 times the plastic limit in TH3-4 and TH4-4, respectively.
Appl. Sci. 2020, 10, x FOR PEER REVIEW 13 of 17
when subjected to the ERE excitations, but the maximum values in TH1-4 and TH2-4 are still within the plastic limit 2.0%, while 1.14 and 1.20 times the plastic limit in TH3-4 and TH4-4, respectively.
(a)
(b)
(c)
123456789
0.00% 0.50% 1.00% 1.50% 2.00%
Stor
y
Maximum inter-story drift angle
TH1-1
TH1-2
TH1-3
TH1-4
123456789
0.00% 0.50% 1.00% 1.50% 2.00%
Stor
y
Maximum inter-story drift angle
TH2-1
TH2-2
TH2-3
TH2-4
123456789
0.00% 0.50% 1.00% 1.50% 2.00% 2.50%
Stor
y
Maximum inter-story drift angle
TH3-1
TH3-2
TH3-3
TH3-4
Figure 13. Cont.
Appl. Sci. 2020, 10, 1819 14 of 17Appl. Sci. 2020, 10, x FOR PEER REVIEW 14 of 17
(d)
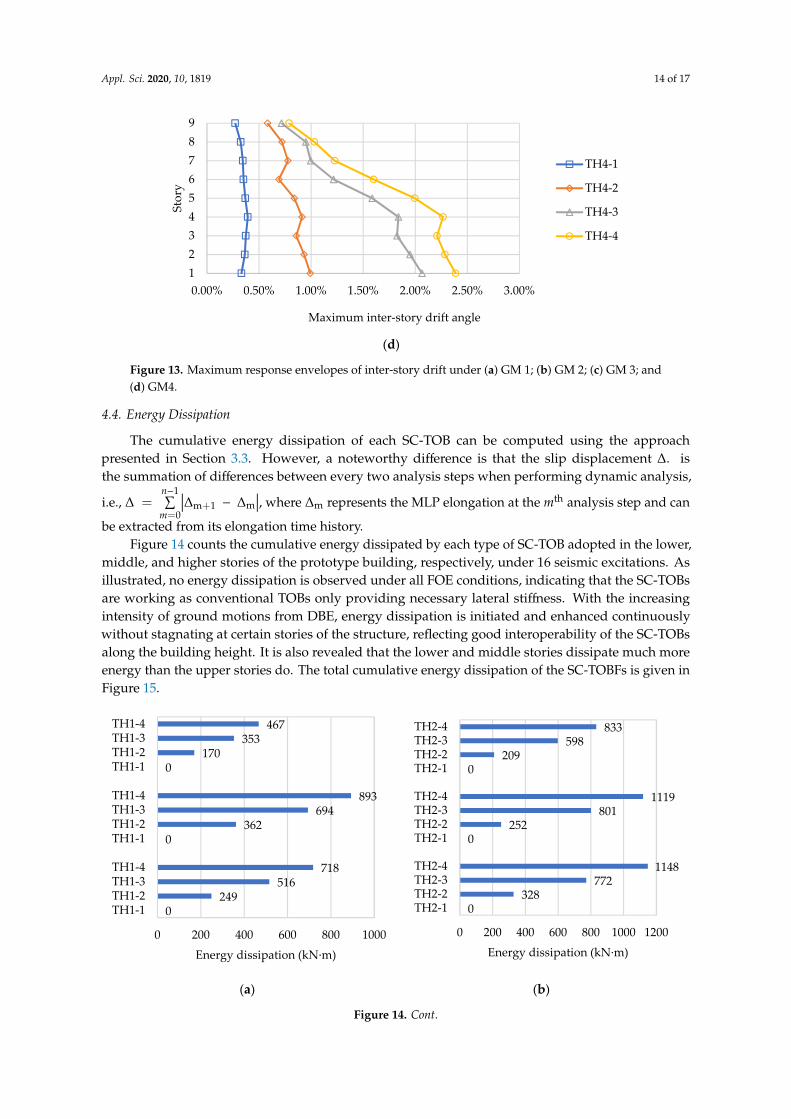
Figure 13. Maximum response envelopes of inter-story drift under (a) GM 1; (b) GM 2; (c) GM 3; and (d) GM4.
4.4. Energy Dissipation
The cumulative energy dissipation of each SC-TOB can be computed using the approach presented in Section 3.3. However, a noteworthy difference is that the slip displacement ∆ is the summation of differences between every two analysis steps when performing dynamic analysis, i.e., ∆ = ∑ |∆m − ∆m|, where ∆m represents the MLP elongation at the 𝑚th analysis step and can be extracted from its elongation time history.
Figure 14 counts the cumulative energy dissipated by each type of SC-TOB adopted in the lower, middle, and higher stories of the prototype building, respectively, under 16 seismic excitations. As illustrated, no energy dissipation is observed under all FOE conditions, indicating that the SC-TOBs are working as conventional TOBs only providing necessary lateral stiffness. With the increasing intensity of ground motions from DBE, energy dissipation is initiated and enhanced continuously without stagnating at certain stories of the structure, reflecting good interoperability of the SC-TOBs along the building height. It is also revealed that the lower and middle stories dissipate much more energy than the upper stories do. The total cumulative energy dissipation of the SC-TOBFs is given in Figure 15.
(a) (b)
123456789
0.00% 0.50% 1.00% 1.50% 2.00% 2.50% 3.00%
Stor
y
Maximum inter-story drift angle
TH4-1
TH4-2
TH4-3
TH4-4
0249
516718
0362
694893
0170
353467
0 200 400 600 800 1000
TH1-1TH1-2TH1-3TH1-4
TH1-1TH1-2TH1-3TH1-4
TH1-1TH1-2TH1-3TH1-4
Energy dissipation (kN·m)
0328
7721148
0252
8011119
0209
598833
0 200 400 600 800 1000 1200
TH2-1TH2-2TH2-3TH2-4
TH2-1TH2-2TH2-3TH2-4
TH2-1TH2-2TH2-3TH2-4
Energy dissipation (kN·m)
Figure 13. Maximum response envelopes of inter-story drift under (a) GM 1; (b) GM 2; (c) GM 3; and(d) GM4.
4.4. Energy Dissipation
The cumulative energy dissipation of each SC-TOB can be computed using the approachpresented in Section 3.3. However, a noteworthy difference is that the slip displacement ∆. isthe summation of differences between every two analysis steps when performing dynamic analysis,
i.e., ∆ =n−1∑m=0
∣∣∣∆m+1 − ∆m∣∣∣, where ∆m represents the MLP elongation at the mth analysis step and can
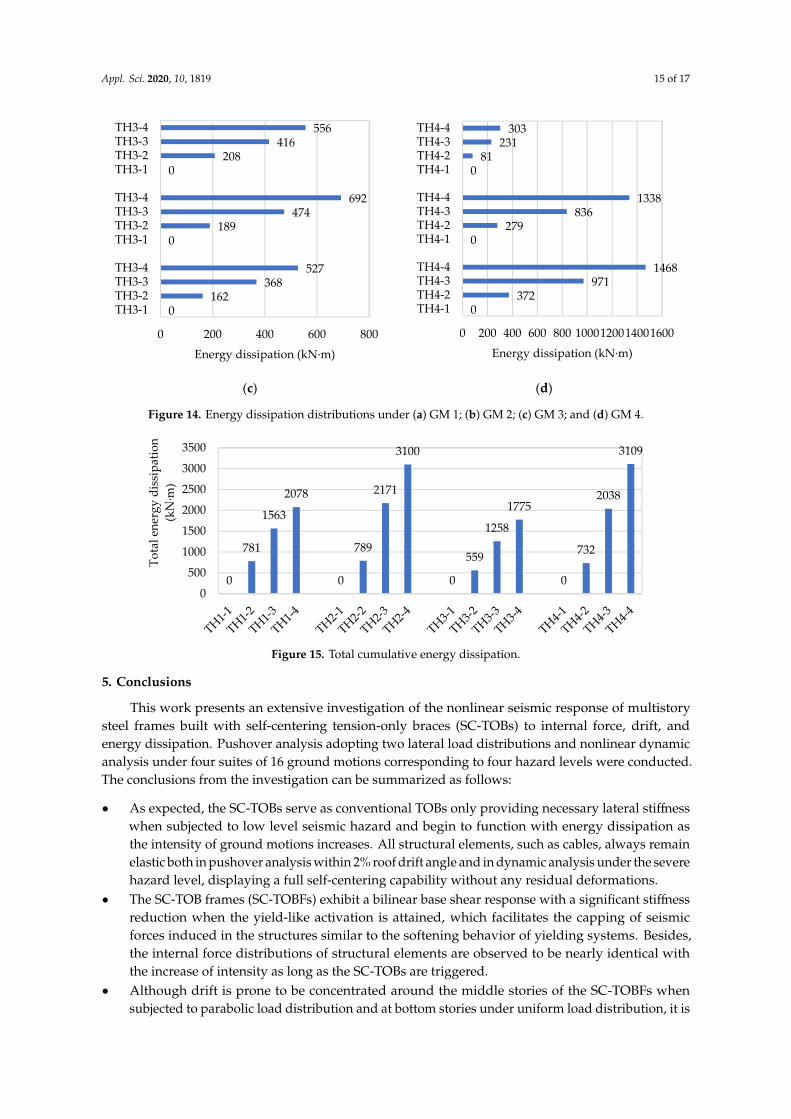
be extracted from its elongation time history.Figure 14 counts the cumulative energy dissipated by each type of SC-TOB adopted in the lower,
middle, and higher stories of the prototype building, respectively, under 16 seismic excitations. Asillustrated, no energy dissipation is observed under all FOE conditions, indicating that the SC-TOBsare working as conventional TOBs only providing necessary lateral stiffness. With the increasingintensity of ground motions from DBE, energy dissipation is initiated and enhanced continuouslywithout stagnating at certain stories of the structure, reflecting good interoperability of the SC-TOBsalong the building height. It is also revealed that the lower and middle stories dissipate much moreenergy than the upper stories do. The total cumulative energy dissipation of the SC-TOBFs is given inFigure 15.
Appl. Sci. 2020, 10, x FOR PEER REVIEW 14 of 17
(d)
Figure 13. Maximum response envelopes of inter-story drift under (a) GM 1; (b) GM 2; (c) GM 3; and (d) GM4.
4.4. Energy Dissipation
The cumulative energy dissipation of each SC-TOB can be computed using the approach presented in Section 3.3. However, a noteworthy difference is that the slip displacement ∆ is the summation of differences between every two analysis steps when performing dynamic analysis, i.e., ∆ = ∑ |∆m − ∆m|, where ∆m represents the MLP elongation at the 𝑚th analysis step and can be extracted from its elongation time history.
Figure 14 counts the cumulative energy dissipated by each type of SC-TOB adopted in the lower, middle, and higher stories of the prototype building, respectively, under 16 seismic excitations. As illustrated, no energy dissipation is observed under all FOE conditions, indicating that the SC-TOBs are working as conventional TOBs only providing necessary lateral stiffness. With the increasing intensity of ground motions from DBE, energy dissipation is initiated and enhanced continuously without stagnating at certain stories of the structure, reflecting good interoperability of the SC-TOBs along the building height. It is also revealed that the lower and middle stories dissipate much more energy than the upper stories do. The total cumulative energy dissipation of the SC-TOBFs is given in Figure 15.
(a) (b)
123456789
0.00% 0.50% 1.00% 1.50% 2.00% 2.50% 3.00%
Stor
y
Maximum inter-story drift angle
TH4-1
TH4-2
TH4-3
TH4-4
0249
516718
0362
694893
0170
353467
0 200 400 600 800 1000
TH1-1TH1-2TH1-3TH1-4
TH1-1TH1-2TH1-3TH1-4
TH1-1TH1-2TH1-3TH1-4
Energy dissipation (kN·m)
0328
7721148
0252
8011119
0209
598833
0 200 400 600 800 1000 1200
TH2-1TH2-2TH2-3TH2-4
TH2-1TH2-2TH2-3TH2-4
TH2-1TH2-2TH2-3TH2-4
Energy dissipation (kN·m)
Figure 14. Cont.
Appl. Sci. 2020, 10, 1819 15 of 17Appl. Sci. 2020, 10, x FOR PEER REVIEW 15 of 17
(c) (d)
Figure 14. Energy dissipation distributions under (a) GM 1; (b) GM 2; (c) GM 3; and (d) GM 4.
Figure 15. Total cumulative energy dissipation.
5. Conclusions
This work presents an extensive investigation of the nonlinear seismic response of multistory steel frames built with self-centering tension-only braces (SC-TOBs) to internal force, drift, and energy dissipation. Pushover analysis adopting two lateral load distributions and nonlinear dynamic analysis under four suites of 16 ground motions corresponding to four hazard levels were conducted. The conclusions from the investigation can be summarized as follows:
• As expected, the SC-TOBs serve as conventional TOBs only providing necessary lateral stiffness when subjected to low level seismic hazard and begin to function with energy dissipation as the intensity of ground motions increases. All structural elements, such as cables, always remain elastic both in pushover analysis within 2% roof drift angle and in dynamic analysis under the severe hazard level, displaying a full self-centering capability without any residual deformations.
• The SC-TOB frames (SC-TOBFs) exhibit a bilinear base shear response with a significant stiffness reduction when the yield-like activation is attained, which facilitates the capping of seismic forces induced in the structures similar to the softening behavior of yielding systems. Besides, the internal force distributions of structural elements are observed to be nearly identical with the increase of intensity as long as the SC-TOBs are triggered.
• Although drift is prone to be concentrated around the middle stories of the SC-TOBFs when subjected to parabolic load distribution and at bottom stories under uniform load distribution,
0162
368527
0189
474692
0208
416556
0 200 400 600 800
TH3-1TH3-2TH3-3TH3-4
TH3-1TH3-2TH3-3TH3-4
TH3-1TH3-2TH3-3TH3-4
Energy dissipation (kN·m)
0372
9711468
0279
8361338
081
231303
0 200 400 600 800 1000120014001600
TH4-1TH4-2TH4-3TH4-4
TH4-1TH4-2TH4-3TH4-4
TH4-1TH4-2TH4-3TH4-4
Energy dissipation (kN·m)
0
781
1563
2078
0
789
2171
3100
0
559
1258
1775
0
732
2038
3109
0
500
1000
1500
2000
2500
3000
3500
Tota
l ene
rgy
diss
ipat
ion
(kN
·m)
Figure 14. Energy dissipation distributions under (a) GM 1; (b) GM 2; (c) GM 3; and (d) GM 4.
Appl. Sci. 2020, 10, x FOR PEER REVIEW 15 of 17
(c) (d)
Figure 14. Energy dissipation distributions under (a) GM 1; (b) GM 2; (c) GM 3; and (d) GM 4.
Figure 15. Total cumulative energy dissipation.
5. Conclusions
This work presents an extensive investigation of the nonlinear seismic response of multistory steel frames built with self-centering tension-only braces (SC-TOBs) to internal force, drift, and energy dissipation. Pushover analysis adopting two lateral load distributions and nonlinear dynamic analysis under four suites of 16 ground motions corresponding to four hazard levels were conducted. The conclusions from the investigation can be summarized as follows:
• As expected, the SC-TOBs serve as conventional TOBs only providing necessary lateral stiffness when subjected to low level seismic hazard and begin to function with energy dissipation as the intensity of ground motions increases. All structural elements, such as cables, always remain elastic both in pushover analysis within 2% roof drift angle and in dynamic analysis under the severe hazard level, displaying a full self-centering capability without any residual deformations.
• The SC-TOB frames (SC-TOBFs) exhibit a bilinear base shear response with a significant stiffness reduction when the yield-like activation is attained, which facilitates the capping of seismic forces induced in the structures similar to the softening behavior of yielding systems. Besides, the internal force distributions of structural elements are observed to be nearly identical with the increase of intensity as long as the SC-TOBs are triggered.
• Although drift is prone to be concentrated around the middle stories of the SC-TOBFs when subjected to parabolic load distribution and at bottom stories under uniform load distribution,
0162
368527
0189
474692
0208
416556
0 200 400 600 800
TH3-1TH3-2TH3-3TH3-4
TH3-1TH3-2TH3-3TH3-4
TH3-1TH3-2TH3-3TH3-4
Energy dissipation (kN·m)
0372
9711468
0279
8361338
081
231303
0 200 400 600 800 1000120014001600
TH4-1TH4-2TH4-3TH4-4
TH4-1TH4-2TH4-3TH4-4
TH4-1TH4-2TH4-3TH4-4
Energy dissipation (kN·m)
0
781
1563
2078
0
789
2171
3100
0
559
1258
1775
0
732
2038
3109
0
500
1000
1500
2000
2500
3000
3500
Tota
l ene
rgy
diss
ipat
ion
(kN
·m)
Figure 15. Total cumulative energy dissipation.
5. Conclusions
This work presents an extensive investigation of the nonlinear seismic response of multistorysteel frames built with self-centering tension-only braces (SC-TOBs) to internal force, drift, andenergy dissipation. Pushover analysis adopting two lateral load distributions and nonlinear dynamicanalysis under four suites of 16 ground motions corresponding to four hazard levels were conducted.The conclusions from the investigation can be summarized as follows:
• As expected, the SC-TOBs serve as conventional TOBs only providing necessary lateral stiffnesswhen subjected to low level seismic hazard and begin to function with energy dissipation asthe intensity of ground motions increases. All structural elements, such as cables, always remainelastic both in pushover analysis within 2% roof drift angle and in dynamic analysis under the severehazard level, displaying a full self-centering capability without any residual deformations.
• The SC-TOB frames (SC-TOBFs) exhibit a bilinear base shear response with a significant stiffnessreduction when the yield-like activation is attained, which facilitates the capping of seismicforces induced in the structures similar to the softening behavior of yielding systems. Besides,the internal force distributions of structural elements are observed to be nearly identical withthe increase of intensity as long as the SC-TOBs are triggered.
• Although drift is prone to be concentrated around the middle stories of the SC-TOBFs whensubjected to parabolic load distribution and at bottom stories under uniform load distribution, it is
Appl. Sci. 2020, 10, 1819 16 of 17
reliably limited within the code-prescribed limit of 2.0% under maximum considered earthquakes,and the SC-TOBFs are confirmed to have full self-centering capacity even when the maximuminter-story drift angle reaches twice the limit. In addition, the drifts develop as the intensityincreases, but their distribution remains nearly unchanged.
• With the intensity getting higher, the energy dissipation of the SC-TOBFs continuously increaseswithout stagnating at certain stories of the building, reflecting good structural interoperability ofthe bracing members along the structure height. For the prototype building, the lower and middlestories generally dissipate more seismic energy than the upper stories, and almost no energy isdissipated in the upper stories under certain load conditions, suggesting that the SC-TOBs onthose stories could be replaced by conventional TOBs, thereby reducing costs while retaining fullythe self-centering capability.
Author Contributions: Conceptualization, P.C. and J.D.; Formal analysis, P.C. and W.T.; Funding acquisition, P.C.and D.C.; Writing—original draft, P.C. and W.T.; Writing—review & editing, J.D. and D.C. All authors have readand agreed to the published version of the manuscript.
Funding: This research was funded by the National Natural Science Foundation of China (Grants No. 51708482and No. 51578478), the China Postdoctoral Science Foundation (Grant No. 2017M621593), and the Six Talent PeaksProject in Jiangsu Province (Grant No. JZ-035).
Conflicts of Interest: The authors declare no conflict of interest.
References
1. Bruneau, M.; MacRae, G. Reconstructing Christchurch: A Seismic Shift in Building Structural Systems; The QuakeCentre, University of Canterbury: Christchurch, New Zealand, 2017; pp. 24–52.
2. McCormick, J.; Aburano, H.; Ikenaga, M.; Nakashima, M. Permissible residual deformation levels for buildingstructures considering both safety and human elements. In Proceedings of the 14th World Conference onEarthquake Engineering, Beijing, China, 12–17 October 2008.
3. Holden, T.; Restrepo, J.; Mander, J.B. Seismic performance of precast reinforced and prestressed concretewalls. J. Struct. Eng. 2003, 129, 286–296. [CrossRef]
4. Kovacs, M.A.; Wiebe, L. Controlled rocking CLT walls for buildings in regions of moderate seismicity: Designprocedure and numerical collapse assessment. J. Earthq. Eng. 2019, 23, 750–770. [CrossRef]
5. Eatherton, M.R.; Hajjar, J.F.; Deierlein, G.G.; Krawinkler, H.; Billington, S.; Ma, X. Controlled rocking ofsteel-framed buildings with replaceable energy-dissipating fuses. In Proceedings of the 14 World Conferenceon Earthquake Engineering, Beijing, China, 12–17 October 2008.
6. Bosco, M.; Marino, E.M.; Rossi, P.P. A design procedure for pin-supported rocking buckling-restrained bracedframes. Earthq. Eng. Struct. Dyn. 2018, 47, 2840–2863. [CrossRef]
7. Ricles, J.; Sause, R.; Garlock, M.; Zhao, C. Posttensioned seismic-resistant connections for steel frames.J. Struct. Eng. 2001, 127, 113–121. [CrossRef]
8. Bojórquez, E.; López-Barraza, A.; Reyes-Salazar, A.; Ruiz, S.E.; Ruiz-García, J.; Formisano, A.;López-Almansa, F.; Carrillo, J.; Bojórquez, J. Improving the structural reliability of steel frames usingposttensioned connections. Adv. Civ. Eng. 2019, 2019, 8912390. [CrossRef]
9. Garlock, M.E.M.; Li, J. Steel self-centering moment frames with collector beam floor diaphragms. J. Constr.Steel Res. 2008, 64, 526–538. [CrossRef]
10. Fang, C.; Yam, M.C.H.; Lam, A.C.C.; Xie, L.K. Cyclic performance of extended end-plate connectionsequipped with shape memory alloy bolts. J. Constr. Steel Res. 2014, 94, 122–136. [CrossRef]
11. Seo, J.; Kim, Y.C.; Hu, J.W. Pilot study for investigating the cyclic behavior of slit damper systems withrecentering shape memory alloy (SMA) bending bars used for seismic restrainers. Appl. Sci. 2015, 5, 187–208.[CrossRef]
12. Hu, J.W.; Noh, M.H.; Ahn, J.H. Experimental investigation on the behavior of bracing damper systems byutilizing metallic yielding and recentering material devices. Adv. Mater. Sci. Eng. 2018, 2018, 2813058.[CrossRef]
13. Christopoulos, C.; Tremblay, R.; Kim, H.J.; Lacerte, M. Self-centering energy dissipative bracing system forthe seismic resistance of structures: Development and validation. J. Struct. Eng. 2008, 134, 96–107. [CrossRef]
Appl. Sci. 2020, 10, 1819 17 of 17
14. Erochko, J.; Christopoulos, C.; Tremblay, R.; Kim, H.J. Shake table testing and numerical simulation ofa self-centering energy dissipative braced frame. Earthq. Eng. Struct. Dyn. 2013, 42, 1617–1635. [CrossRef]
15. Wiebe, L.; Christopoulos, C. Using bézier curves to model gradual stiffness transitions in nonlinear elements:Application to self-centering systems. Earthq. Eng. Struct. Dyn. 2011, 40, 1535–1552. [CrossRef]
16. Karavasilis, T.L.; Blakeborough, T.; Williams, M.S. Development of nonlinear analytical model and seismicanalyses of a steel frame with self-centering devices and viscoelastic dampers. Comput. Struct. 2011, 89,1232–1240. [CrossRef]
17. Chou, C.C.; Chung, P.T. Development of cross-anchored dual-core self-centering braces for seismic resistance.J. Constr. Steel Res. 2014, 101, 19–32. [CrossRef]
18. Chou, C.C.; Chen, Y.C.; Pham, D.H.; Truong, V.M. Steel braced frames with dual-core SCBs and sandwichedBRBs: Mechanics, modeling and seismic demands. Eng. Struct. 2014, 72, 26–40. [CrossRef]
19. Chou, C.C.; Chen, Y.C. Development of Steel Dual-Core Self-Centering Braces: Quasi-Static Cyclic Tests andFinite Element Analyses. Earthq. Spectra 2015, 31, 247–272. [CrossRef]
20. Chou, C.C.; Wu, T.H.; Beato, A.R.O.; Chung, P.T.; Chen, Y.C. Seismic design and tests of a full-scale one-storyone-bay steel frame with a dual-core self-centering brace. Eng. Struct. 2016, 111, 435–450. [CrossRef]
21. Kammula, V.; Erochko, J.; Kwon, O.S.; Christopoulos, C. Application of hybrid-simulation to fragilityassessment of the telescoping self-centering energy dissipative bracing system. Earthq. Eng. Struct. Dyn.2014, 43, 811–830. [CrossRef]
22. Erochko, J.; Christopoulos, C.; Tremblay, R. Design and testing of an enhanced-elongation telescopingself-centering energy-dissipative brace. J. Struct. Eng. 2015, 141, 04014163. [CrossRef]
23. Xu, L.H.; Fan, X.W.; Li, Z.X. Development and experimental verification of a pre-pressed spring self-centeringenergy dissipation brace. Eng. Struct. 2016, 127, 49–61. [CrossRef]
24. Xu, L.H.; Fan, X.W.; Li, Z.X. Hysteretic analysis model for pre-pressed spring self-centering energy dissipationbraces. J. Struct. Eng. 2018, 144, 04018073. [CrossRef]
25. Xu, L.H.; Yao, S.Q.; Sun, Y.S. Development and validation tests of an assembly self-centering energydissipation brace. Soil Dyn. Earthq. Eng. 2019, 116, 120–129. [CrossRef]
26. Qiu, C.X.; Zhu, S.Y. High-mode effects on seismic performance of multi-story self-centering braced steelframes. J. Constr. Steel Res. 2016, 119, 133–143. [CrossRef]
27. Papagiannopoulos, G.A. On the seismic behaviour of tension-only concentrically braced steel structure.Soil Dyn. Earthq. Eng. 2018, 115, 27–35. [CrossRef]
28. Mousavi, S.A.; Zahrai, S.M. Contribution of pre-slacked cable braces to dynamic stability of non-ductileframes; an analytical study. Eng. Struct. 2016, 117, 305–320. [CrossRef]
29. Chi, P.; Guo, T.; Peng, Y.; Cao, D.F.; Dong, J. Development of a self-centering tension-only brace for seismicprotection of frame structures. Steel Comp. Struct. 2018, 26, 573–582.
30. Chi, P.; Tian, W.L.; Guo, T.; Cao, D.F.; Dong, J. Parametric study on the seismic response of steel-framedbuildings with self-centering tension-only braces. Adv. Civ. Eng. 2019, 2019, 9204362. [CrossRef]
31. SAP2000. Structural Analysis Program, Version 17.3.0; Computers and Structures, Inc.: Berkeley, CA, USA,2015.
32. Fahnestock, L.A.; Ricles, J.M.; Sause, R. Experimental evaluation of a large-scalebuckling-restrained bracedframe. J. Struct. Eng. 2007, 133, 1205–1214. [CrossRef]
33. FEMA 450. NEHRP Recommended Provisions for Seismic Regulations for New Buildings and Other Structures: Part1-Provisions and Part 2-Commentary; FEMA: Washington, DC, USA, 2003.
34. GB 50011-2010. Code for Seismic Design of Buildings; Ministry of Housing and Urban-Rural Development ofChina: Beijing, China, 2010.
35. AISC 341-16. Seismic Provisions for Structural Steel Buildings; American Institute of Steel Construction:Chicago, IL, USA, 2016.
36. ASCE 7-10. Minimum Design Loads for Buildings and Other Structures; American Society of Civil Engineers:Reston, VA, USA, 2010.
© 2020 by the authors. Licensee MDPI, Basel, Switzerland. This article is an open accessarticle distributed under the terms and conditions of the Creative Commons Attribution(CC BY) license (http://creativecommons.org/licenses/by/4.0/).