effect of cross-frames on load distribution of steel bridges
TRANSCRIPT
infrastructures
Article
Effect of Cross-Frames on Load Distribution of SteelBridges with Fractured Girder
Mohammad Abedin * and Armin B. Mehrabi
Department of Civil and Environmental Engineering, Florida International University, Miami, FL 33174, USA;[email protected]* Correspondence: [email protected]
Received: 4 February 2020; Accepted: 1 April 2020; Published: 1 April 2020�����������������
Abstract: In steel girder bridges, fracture of one girder may occur without noticeable bridge profilechanges. It is critical to ensure that the bridge will have adequate capacity to prevent collapse untilthe next cycle of inspection discovers the damage. It is realized that once one of the bridge girdersis fractured, vertical loads need to be distributed through an alternative path to the intact girder(s).In this case, cross-frames can play an important role in transferring the loads and preventing fromsudden collapse. This paper investigates the impact of cross-frames on load distribution after afracture is occurred in one girder. Bridge configurations with different cross-frame spacing werestudied using finite element modeling and simulation of the bridge behavior with a fractured steelplate girder. Nonlinear and dynamic solution methods were used for these analyses. Results of thisinvestigation demonstrated the important role cross-frames can play in providing some reservedcapacity for the bridge with fractured girder to enhance the bridge redundancy. The contribution ofthe cross-frames and the behavior of the bridge after fracture in one girder however depends on theconfiguration of the bridge. A study of the variation of the effect of cross-frames with respect to thenumber of girders is also included in this paper.
Keywords: steel bridges; fracture; cross-frame; redundancy evaluation; load distribution; finiteelement analysis
1. Introduction
In steel girder bridges, fatigue cracking is one of the most important phenomena affecting thestructural performance and integrity [1]. In general, fatigue cracks are the result of out-of-planedistortion or other unanticipated secondary stresses at low fatigue resistance members. Development offatigue cracking may lead in time to a full depth fracture of one girder and cracks in the deck [2] withoutnoticeable bridge profile changes. It is critical to assure that the bridge will have adequate capacityto prevent collapse until the next cycle of inspection discovers the damage. The fracture can also bedetected through instrumentation at the onset of fracture or by periodic vibration measurements atinspection intervals or earlier [3] and different strategies can be used to repair and retrofit the damagedbridge [4,5]. It is realized that once one of the bridge girders is fractured, vertical dead and live loadsneed to be distributed through an alternative path to the intact girder(s) which could occur throughthe deck or girder cross-frames. In this case, cross-frames can play an important role in transferring theloads and preventing sudden collapse of the fractured girder. However, currently cross-frames arerequired to be designed only for preventing lateral torsional buckling of the bridge girders duringconstruction, transferring lateral loads such as wind and earthquake to the deck and from the deckto the supports for controlling torsional stresses, as well as large rotation due to loads applied to theoverhangs. As a result, when fracture occurs in one girder, they may not have enough stiffness andstrength and may be too far spaced to be able to transfer vertical loads to the intact girder(s).
Infrastructures 2020, 5, 32; doi:10.3390/infrastructures5040032 www.mdpi.com/journal/infrastructures
Infrastructures 2020, 5, 32 2 of 14
The impact of cross-frames on seismic response and lateral torsional buckling of steel girder bridgeshas been a concern among researchers [6–9]. Their investigation has had the main goal of studying theelastic and inelastic response of cross-frames during an extreme seismic event and developing newdesign approaches to have a plastic deformation in substructure and protecting foundation whereidentifying and repairing damages is difficult. The advantages of such approaches are that cross-frameswhich are considered as secondary members during the bridge normal operation, can be replaced afterextreme seismic events. However, cross-frames can increase the risk of distortion-induced fatiguecracking in the bridge girders during the bridge normal operation under the traffic loading [10]. Asa result, many investigations have been performed on the mitigation of distortion-induced fatigueproblem [11] and new construction techniques such as permanent metal deck forms are developed tominimize the number of intermediate cross-frames along the span of steel bridges [12]. Nevertheless,it is believed that cross-frames can play an important role as an alternative load path after the girderfracture due to fatigue and corrosion related defects [13]. Therefore, optimum spacing and stiffnessof braces could decrease the consequence of fracture and increase the bridge reserved capacity afterthe fracture.
Recent studies on the reserved capacity of bridges and redundancy evaluation have mainlyfocused on the steel I-girder and box-girder bridges with a partial or full-depth fracture of one ofthe girders [14–25]. The results of these studies demonstrated a high level of internal redundancyand secondary load paths in the bridge systems. Moreover, a study on the fracture critical bridgessummarized examples of steel bridges that survived even after a full-depth fracture in one of thegirders [26].
Limited studies have also been performed on the connection details of cross-frames [27] andthe effect of lateral bracing and buckling of main girders after a fracture. Four types of cross-frameconnection details, including the use of end-plate connection, connection plate and split-tee connectionwere experimentally investigated by Takahashi et al. [28]. Kozy and Tunstall [29] conducted stabilityanalysis on a steel girder bridge. His results showed that system or global buckling is the failuremode of non-composite girder systems without lateral cross-frame. Shi [30] numerically studied theeffective parameters on the stability and capacities of I-girder bridges. Parameters considered in thisstudy included flange width to thickness ratio, girder depths, web depth to thickness ratio, numberof stiffeners along the span and cross-frame spacing. The effect of lateral cross-frames in continuousspan plate-girder bridges with a full-depth fractured girder was considered in the investigations byPark et al. [15]. The test results showed that the ultimate capacity of damaged bridge with bracingwas about 1.2 times higher than the bridge without bracing. The numerical analysis indicated that thebottom chord of cross-frames plays an important role in transferring vertical loads from the fracturedgirder to the intact girder.
In the American Association of State Highway Transportation Officials (AASHTO) LRFD BridgeDesign Specifications [31], the arbitrary requirement for cross-frame at no more than 25 ft has beenreplaced by a requirement for rational analysis to prevent the development of fatigue cracking in thegirders at the connections of lateral bracing due to out-of-plane distortion. However, no guidance hasbeen provided for the requirements of such an analysis. Therefore, the cross-frame spacing is generallydetermined based on the stability bracing during construction and in many cases, typical sizes anddetails are used for cross-frames which can lead to either inadequate brace spacing and stiffness orbraces that are stiffer than necessary.
This paper investigates the impact of cross-frames on load distribution after a fracture is occurredin one girder. Since in this situation, the cross-frame members resist forces that are critical to the properperformance of the damaged bridge, they may need to be considered primary members. Therefore,forces in the bracing members need to be computed and considered in designing these membersfor preventing the bridge from sudden partial or total collapse. This study includes computationalanalysis using finite element models that are validated against existing laboratory test results toinvestigate the effect of cross-frames. A simple span, three I-girder bridge tested at the University of

Infrastructures 2020, 5, 32 3 of 14
Nebraska-Lincoln [32] was selected as a case study for the finite element (FE) analysis. This bridge forwhich elastic and ultimate load data are available from the tests was deemed to be a perfect candidatefor validation of the FE model. The effect of cross-frames with different spacing was investigated forthe bridge model with a full depth fracture of one of the exterior girders at the mid-span to simulatethe worst-case scenario. The bridge was loaded incrementally over the fractured girder as a function ofmultiples of the AASHTO Live load including the design truck and lane load, until the bridge collapsed.
2. Finite-Element Analysis and Overview of Study
Finite element analysis of bridges, both in intact and damaged conditions, offers a reliable methodfor simulating the behavior of bridges and a credible alternative to costly experiments [33–37]. However,even with this valuable numerical tool, elaborate modeling of a bridge and detailed analysis undervarious loading requires significant time and efforts. It should be recognized that it may not benecessary nor economic to model the bridge with every detail and variations. The more sophisticatedthe model is, the more is potential for divergence of the solution and unwanted errors. Finding theoptimum model requires experience and knowledge in implementing FE modeling [38] and requiresvalidation using existing detailed and reliable experimental results.
In this study, to investigate the effects of cross-frames on the behavior of bridge with fracture inone girder, a well performed and documented set of experimentation on a full-scale I-girder bridgespecimen tested at the University of Nebraska-Lincoln was chosen. For this bridge specimen, AbaqusStandard 6.14-2 [39], FE analysis program, was used to develop a detailed model. The model was thenvalidated with the help of available test results for this bridge.
This bridge had a simple span with a length of 21.3 m (70 ft) and width of 7.9 m (26 ft) and wouldcarry two lanes of traffic. Three welded steel plate girders was used for superstructure that was madecomposite with a 0.2 m (7
12 in.) deck made of reinforced concrete as shown in Figure 1. The spacing of
the girders was 3 m (10 ft) on center and the deck had a 0.9 m (3 ft) overhang. A typical NebraskaDepartment of Road (NDOR) concrete railing system with an open profile and using 0.3 × 0.3 m (11 ×11 in.) posts with a spacing of 2.4 m (8 ft) on center was used as the railing system. To investigate thecontribution of the cross-frames, a set of laboratory tests were carried out on this bridge. The loadingwas increased incrementally to cover both the elastic and ultimate plastic behavior of the bridge. Thesteel plate girders were kept intact before the test, that is, no fractured girder was used. Among the testperformed on this bridge, the test in which the bridge was loaded to failure (ultimate test) was selectedfor validation of the FE model. In this test, point loads representing footprint of HS20 Truck loadingwere incrementally increased until the failure. The failure reported for this bridge in the laboratorytesting was dominated by punching shear failure of the deck.
Infrastructures 2020, 5, 32 3 of 14
perfect candidate for validation of the FE model. The effect of cross-frames with different spacing
was investigated for the bridge model with a full depth fracture of one of the exterior girders at the
mid-span to simulate the worst-case scenario. The bridge was loaded incrementally over the
fractured girder as a function of multiples of the AASHTO Live load including the design truck and
lane load, until the bridge collapsed.
2. Finite-Element Analysis and Overview of Study
Finite element analysis of bridges, both in intact and damaged conditions, offers a reliable
method for simulating the behavior of bridges and a credible alternative to costly experiments [33–
37]. However, even with this valuable numerical tool, elaborate modeling of a bridge and detailed
analysis under various loading requires significant time and efforts. It should be recognized that it
may not be necessary nor economic to model the bridge with every detail and variations. The more
sophisticated the model is, the more is potential for divergence of the solution and unwanted errors.
Finding the optimum model requires experience and knowledge in implementing FE modeling [38]
and requires validation using existing detailed and reliable experimental results.
In this study, to investigate the effects of cross-frames on the behavior of bridge with fracture in
one girder, a well performed and documented set of experimentation on a full-scale I-girder bridge
specimen tested at the University of Nebraska-Lincoln was chosen. For this bridge specimen, Abaqus
Standard 6.14-2 [39], FE analysis program, was used to develop a detailed model. The model was
then validated with the help of available test results for this bridge.
This bridge had a simple span with a length of 21.3 m (70 ft) and width of 7.9 m (26 ft) and would
carry two lanes of traffic. Three welded steel plate girders was used for superstructure that was made
composite with a 0.2 m (7½ in.) deck made of reinforced concrete as shown in Figure 1. The spacing
of the girders was 3 m (10 ft) on center and the deck had a 0.9 m (3 ft) overhang. A typical Nebraska
Department of Road (NDOR) concrete railing system with an open profile and using 0.3 × 0.3 m (11
× 11 in.) posts with a spacing of 2.4 m (8 ft) on center was used as the railing system. To investigate
the contribution of the cross-frames, a set of laboratory tests were carried out on this bridge. The
loading was increased incrementally to cover both the elastic and ultimate plastic behavior of the
bridge. The steel plate girders were kept intact before the test, that is, no fractured girder was used.
Among the test performed on this bridge, the test in which the bridge was loaded to failure (ultimate
test) was selected for validation of the FE model. In this test, point loads representing footprint of
HS20 Truck loading were incrementally increased until the failure. The failure reported for this
bridge in the laboratory testing was dominated by punching shear failure of the deck.
Figure 1. University of Nebraska–Lincoln I-Girder Bridge (Dimensions are in mm).
After validation of the FE model, a full-depth fracture of one of the exterior girder at the middle
of span was implemented in the bridge model as shown in Figure 2. In order to create the maximum
bending and torsion over the fractured girder, only one lane of the bridge immediately above the
fractured girder was loaded incrementally until the failure in the terms of AASHTO Live loads
(HL93) to simulate eccentric loading caused by disruptions [40,41] or safety issues [42], that is a
Figure 1. University of Nebraska–Lincoln I-Girder Bridge (Dimensions are in mm).
After validation of the FE model, a full-depth fracture of one of the exterior girder at the middleof span was implemented in the bridge model as shown in Figure 2. In order to create the maximum

Infrastructures 2020, 5, 32 4 of 14
bending and torsion over the fractured girder, only one lane of the bridge immediately above thefractured girder was loaded incrementally until the failure in the terms of AASHTO Live loads (HL93)to simulate eccentric loading caused by disruptions [40,41] or safety issues [42], that is a combination ofdesign truck and lane load. Failure was defined by the plateau in load-displacement curve signaling lossof capacity to carry higher loads. Different cross-frame spacing (i.e., different number of cross-frameswithin the span), as shown in Figure 3, was used and the results were compared to investigate theeffect of cross-frame in load distribution, ultimate capacity and the bridge deflection.
Infrastructures 2020, 5, 32 4 of 14
combination of design truck and lane load. Failure was defined by the plateau in load-displacement
curve signaling loss of capacity to carry higher loads. Different cross-frame spacing (i.e., different
number of cross-frames within the span), as shown in Figure 3, was used and the results were
compared to investigate the effect of cross-frame in load distribution, ultimate capacity and the
bridge deflection.
Figure 2. Finite element (FE) model of the fractured bridge.
Figure 3. The bridge layout and cross-frame spacing.
3. Finite Element Model
Steel plates, cross-frames and reinforcement were modeled using multi-linear inelastic material
with isotropic hardening in both tension and compression. The modulus of elasticity (200,000 MPa)
and Poisson’s ratio (0.3) were used for defining the linear elastic behavior. The steel material used for
the girders was specified as A36 steel with yield strength of 276 MPa (average obtained from the
tensile testing (40 ksi)) and the concrete reinforcing rebar used in the concrete slab was specified as
Grade 60 with 414 MPa (60 ksi) yield strength. An effective damping ratio of 3% was assigned to the
steel and concrete materials for the dynamic analysis and a linear elasticity with damage plasticity
constitutive model [43] was used for the concrete elements. ACI 318–14 [44] was utilized for
calculating the initial modulus of elasticity in concrete materials with a Poisson ratio of 0.2. The
strength tests on concrete cylinder samples showed 41 MPa (6 ksi) for 221 days after casting which
coincides the time of ultimate load testing. This strength was used as the concrete compressive
strength.
According to the structural behavior of each component, various types of elements were used to
provide a realistic representation of the steel plate girder bridges. 8-node linear brick elements were
used for the concrete deck and railing with 2-node linear 3-D truss elements as the reinforcement
embedded into the concrete elements. Two elements were used through the deck thickness which
showed a good agreement with the experimental results. 4-node shell element (S4R) was used for
Figure 2. Finite element (FE) model of the fractured bridge.
Infrastructures 2020, 5, 32 4 of 14
combination of design truck and lane load. Failure was defined by the plateau in load-displacement
curve signaling loss of capacity to carry higher loads. Different cross-frame spacing (i.e., different
number of cross-frames within the span), as shown in Figure 3, was used and the results were
compared to investigate the effect of cross-frame in load distribution, ultimate capacity and the
bridge deflection.
Figure 2. Finite element (FE) model of the fractured bridge.
Figure 3. The bridge layout and cross-frame spacing.
3. Finite Element Model
Steel plates, cross-frames and reinforcement were modeled using multi-linear inelastic material
with isotropic hardening in both tension and compression. The modulus of elasticity (200,000 MPa)
and Poisson’s ratio (0.3) were used for defining the linear elastic behavior. The steel material used for
the girders was specified as A36 steel with yield strength of 276 MPa (average obtained from the
tensile testing (40 ksi)) and the concrete reinforcing rebar used in the concrete slab was specified as
Grade 60 with 414 MPa (60 ksi) yield strength. An effective damping ratio of 3% was assigned to the
steel and concrete materials for the dynamic analysis and a linear elasticity with damage plasticity
constitutive model [43] was used for the concrete elements. ACI 318–14 [44] was utilized for
calculating the initial modulus of elasticity in concrete materials with a Poisson ratio of 0.2. The
strength tests on concrete cylinder samples showed 41 MPa (6 ksi) for 221 days after casting which
coincides the time of ultimate load testing. This strength was used as the concrete compressive
strength.
According to the structural behavior of each component, various types of elements were used to
provide a realistic representation of the steel plate girder bridges. 8-node linear brick elements were
used for the concrete deck and railing with 2-node linear 3-D truss elements as the reinforcement
embedded into the concrete elements. Two elements were used through the deck thickness which
showed a good agreement with the experimental results. 4-node shell element (S4R) was used for
Figure 3. The bridge layout and cross-frame spacing.
3. Finite Element Model
Steel plates, cross-frames and reinforcement were modeled using multi-linear inelastic materialwith isotropic hardening in both tension and compression. The modulus of elasticity (200,000 MPa)and Poisson’s ratio (0.3) were used for defining the linear elastic behavior. The steel material used forthe girders was specified as A36 steel with yield strength of 276 MPa (average obtained from the tensiletesting (40 ksi)) and the concrete reinforcing rebar used in the concrete slab was specified as Grade 60with 414 MPa (60 ksi) yield strength. An effective damping ratio of 3% was assigned to the steel andconcrete materials for the dynamic analysis and a linear elasticity with damage plasticity constitutivemodel [43] was used for the concrete elements. ACI 318–14 [44] was utilized for calculating the initialmodulus of elasticity in concrete materials with a Poisson ratio of 0.2. The strength tests on concretecylinder samples showed 41 MPa (6 ksi) for 221 days after casting which coincides the time of ultimateload testing. This strength was used as the concrete compressive strength.
According to the structural behavior of each component, various types of elements were usedto provide a realistic representation of the steel plate girder bridges. 8-node linear brick elementswere used for the concrete deck and railing with 2-node linear 3-D truss elements as the reinforcementembedded into the concrete elements. Two elements were used through the deck thickness whichshowed a good agreement with the experimental results. 4-node shell element (S4R) was used for
Infrastructures 2020, 5, 32 5 of 14
modelling steel plate girders and stiffeners and all the brace members for diaphragms were modeledusing 2-node linear 3-D truss and beam elements. Refined mesh was used near the fracture at mid-span.
Experimental tests on fractured bridges show that when the loading is applied eccentrically overthe fractured girder only, torsional moment induced by the loading eccentricity may cause uplift of theintact girder over the supports [17]. Therefore, to consider the possibility of support uplift during theloading and considering contact interactions, contact surface was defined between the girders andsupports. In addition, connector elements were used to connect the cross-frames to the girders andsimulate the connection failure at the cross- frames. As a result, the section at the end of the bracingmembers can be treated as a fuse with an assigned failure criteria based on the load level that willproduce failure of the connection. In this study, this level of load was considered to be one half of themember tension capacity based on the typical connection details used in the experimental test (Thebolts connecting the cross-frame to the girders in the experimental test consisted of 4 high strengths,A325 bolts with 7/8-inch diameter).
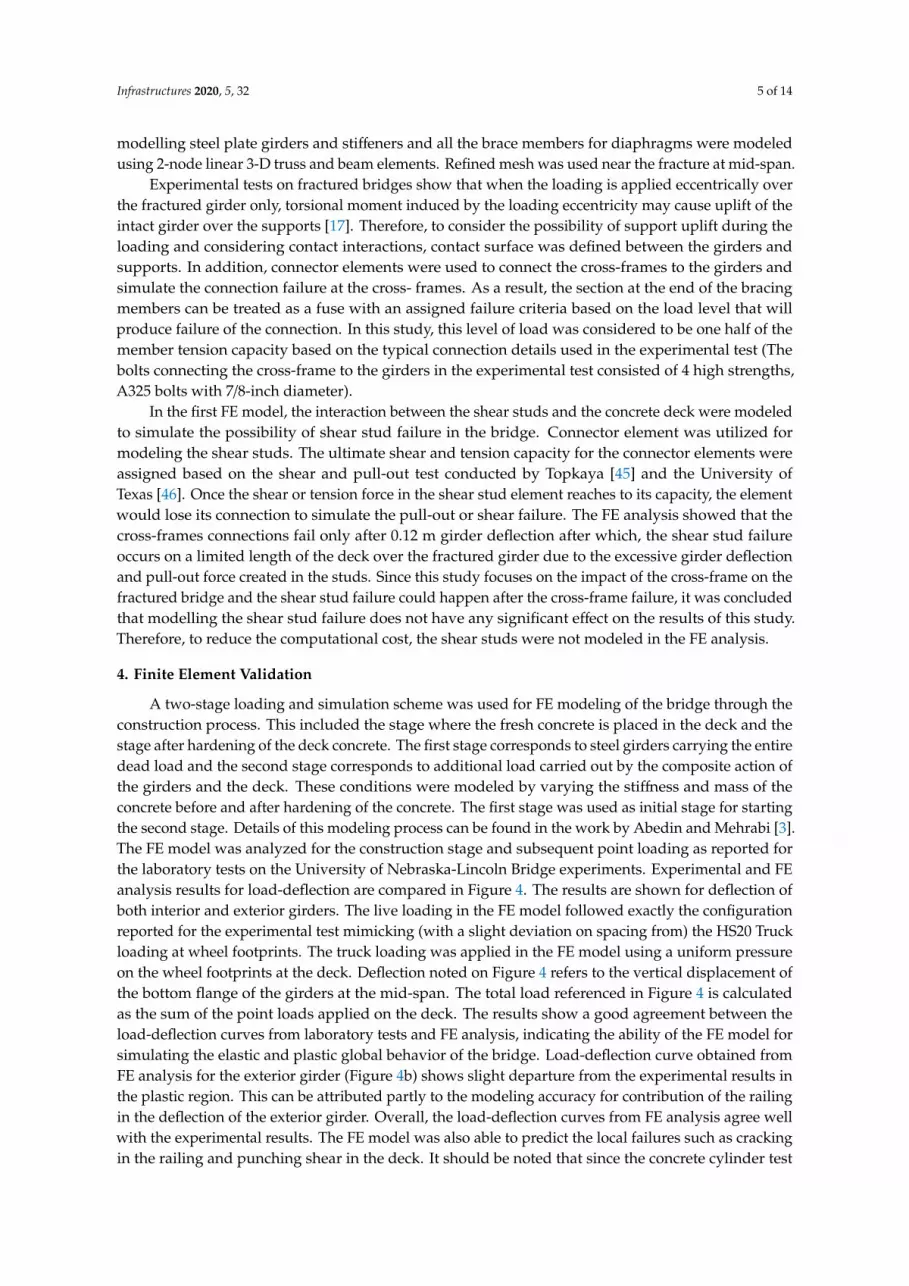
In the first FE model, the interaction between the shear studs and the concrete deck were modeledto simulate the possibility of shear stud failure in the bridge. Connector element was utilized formodeling the shear studs. The ultimate shear and tension capacity for the connector elements wereassigned based on the shear and pull-out test conducted by Topkaya [45] and the University ofTexas [46]. Once the shear or tension force in the shear stud element reaches to its capacity, the elementwould lose its connection to simulate the pull-out or shear failure. The FE analysis showed that thecross-frames connections fail only after 0.12 m girder deflection after which, the shear stud failureoccurs on a limited length of the deck over the fractured girder due to the excessive girder deflectionand pull-out force created in the studs. Since this study focuses on the impact of the cross-frame on thefractured bridge and the shear stud failure could happen after the cross-frame failure, it was concludedthat modelling the shear stud failure does not have any significant effect on the results of this study.Therefore, to reduce the computational cost, the shear studs were not modeled in the FE analysis.
4. Finite Element Validation
A two-stage loading and simulation scheme was used for FE modeling of the bridge through theconstruction process. This included the stage where the fresh concrete is placed in the deck and thestage after hardening of the deck concrete. The first stage corresponds to steel girders carrying the entiredead load and the second stage corresponds to additional load carried out by the composite action ofthe girders and the deck. These conditions were modeled by varying the stiffness and mass of theconcrete before and after hardening of the concrete. The first stage was used as initial stage for startingthe second stage. Details of this modeling process can be found in the work by Abedin and Mehrabi [3].The FE model was analyzed for the construction stage and subsequent point loading as reported forthe laboratory tests on the University of Nebraska-Lincoln Bridge experiments. Experimental and FEanalysis results for load-deflection are compared in Figure 4. The results are shown for deflection ofboth interior and exterior girders. The live loading in the FE model followed exactly the configurationreported for the experimental test mimicking (with a slight deviation on spacing from) the HS20 Truckloading at wheel footprints. The truck loading was applied in the FE model using a uniform pressureon the wheel footprints at the deck. Deflection noted on Figure 4 refers to the vertical displacement ofthe bottom flange of the girders at the mid-span. The total load referenced in Figure 4 is calculatedas the sum of the point loads applied on the deck. The results show a good agreement between theload-deflection curves from laboratory tests and FE analysis, indicating the ability of the FE model forsimulating the elastic and plastic global behavior of the bridge. Load-deflection curve obtained fromFE analysis for the exterior girder (Figure 4b) shows slight departure from the experimental results inthe plastic region. This can be attributed partly to the modeling accuracy for contribution of the railingin the deflection of the exterior girder. Overall, the load-deflection curves from FE analysis agree wellwith the experimental results. The FE model was also able to predict the local failures such as crackingin the railing and punching shear in the deck. It should be noted that since the concrete cylinder test

Infrastructures 2020, 5, 32 6 of 14
results for the experimental test varied from 39 MPa (5.66 ksi) to 45.3 MPa (6.57 ksi) in 221 days aftercasting (the time of ultimate load testing), for the FE analysis in this study, the average value of 41 MPa(6 ksi) was considered for the concrete compressive strength of the deck and railings. Because of theeffect of railing, variation of the concrete properties in the analysis from the actual properties can havelarger effect on deflection of the exterior girder than that of the interior girder.
Infrastructures 2020, 5, 32 6 of 14
deck. It should be noted that since the concrete cylinder test results for the experimental test varied
from 39 MPa (5.66 ksi) to 45.3 MPa (6.57 ksi) in 221 days after casting (the time of ultimate load
testing), for the FE analysis in this study, the average value of 41 MPa (6 ksi) was considered for the
concrete compressive strength of the deck and railings. Because of the effect of railing, variation of
the concrete properties in the analysis from the actual properties can have larger effect on deflection
of the exterior girder than that of the interior girder.
Figure 4. Finite element validation using load- deflection curves obtained from the test. (a) Interior
Girder and (b) Exterior Girder.
5. Results and Discussion
The goal of this study was to investigate the effect of cross-frames on load distribution, ultimate
capacity and the bridge deflection. A three I- girder bridge with a full-depth fracture of an exterior
girder under the dead load and an increasing live load in terms of multiple of HL93 loading was
modeled with different cross-frames spacing ranging from 1.8 m to 9 m (Figure 5). These cases
included five different spacing, a case with no cross-frame and a case with no intermediate cross-
frame as shown in Table 1. The cross-frames configuration and element sizes were modeled as shown
in Figure 1. The live load was applied over the fractured girder to simulate the worst-case scenario.
It is realized that small spacing for cross-frame be viewed to be uneconomic in practice but
nevertheless considered in this study for the sake of parametric evaluation.
Using FE analysis, the deflection at the mid-span of all the three girders under the dead load and
twice the HL93 loading were obtained for the bridges with different intermediate cross-frame spacing
and removing all the cross-frames including the end cross-frames (No Cross-Frame). The results
(Table 1) show that the deflection of the fractured girder reaches up to 80.9 mm at the mid-span when
there is no intermediate cross-frame. It also shows that this deflection can be decreased by 7.5% when
using intermediate cross-frame with 1.8 m spacing. Moreover, the cross-frames enable the bridge to
deflect more uniformly for all the girders by transferring the vertical loads from the fractured girder
to the intact girders. The results show that the deflection of the interior girder increases by 4.92% by
decreasing the cross-frame spacing that indicates the cross-frames transfer vertical loads from the
fractured girder to the interior girder.
To investigate the global behavior of the fractured bridge, load-deflection curves for different
cross-frame spacing layouts were obtained and are shown in Figure 6. In this figure, deflection refers
to vertical displacement of fractured girder at the mid-span and was obtained using finite element
method (FEM) and the live load refers to increasing load in terms of multiple of combination of lane
load and HS20 truck over the fractured girder (One lane loading). It can be concluded from the results
that decreasing the cross-frame spacing, increases the initial stiffness of the fractured bridge.
Experimental investigation by Kathol et al. [32] has demonstrated that the cross-frames have
negligible impact on the global behavior of the intact bridge, and they begin carrying vertical load
once a fracture occurs. The first plateau in the load-deflection curves corresponds to the failure of the
Figure 4. Finite element validation using load- deflection curves obtained from the test. (a) InteriorGirder and (b) Exterior Girder.
5. Results and Discussion
The goal of this study was to investigate the effect of cross-frames on load distribution, ultimatecapacity and the bridge deflection. A three I- girder bridge with a full-depth fracture of an exteriorgirder under the dead load and an increasing live load in terms of multiple of HL93 loading wasmodeled with different cross-frames spacing ranging from 1.8 m to 9 m (Figure 5). These cases includedfive different spacing, a case with no cross-frame and a case with no intermediate cross-frame as shownin Table 1. The cross-frames configuration and element sizes were modeled as shown in Figure 1. Thelive load was applied over the fractured girder to simulate the worst-case scenario. It is realized thatsmall spacing for cross-frame be viewed to be uneconomic in practice but nevertheless considered inthis study for the sake of parametric evaluation.
Table 1. Girder deflection at mid-span under the dead and 2 times HL93 loading.
Dead Load + Live Load (2 × HL93)
GirderIntermediate Cross-Frame Spacing (m) No
Cross-FrameNo Intermediate
Cross-frame1.8 3.6 5.4 7.2 9
Ext. Girder(Fractured)
Deflection (mm) 74.8 76.4 77.9 79.6 79.6 102.6 80.9
Ratio (%) 7.50 5.54 3.66 1.55 1.54 −26.82 -
Int. GirderDeflection (mm) 37.3 36.7 36.4 36.3 36 39.2 35.5
Ratio (%) −4.92 −3.26 −2.60 −2.29 −1.36 −10.38 -
Ext. GirderDeflection (mm) 16.3 16.8 17.2 17.4 17.7 13.6 18.2
Ratio (%) 10.10 7.31 5.32 4.23 2.60 25.19 -
Note: Ratio = Percentage of change (deflection to No Intermediate Cross-Frame deflection); Ext. = Exterior;Int. = Interior.

Infrastructures 2020, 5, 32 7 of 14
Infrastructures 2020, 5, 32 7 of 14
cross-frames close to the fracture. The results show that intermediate cross-frames used in this study
(WT4 × 9 top and bottom chords and L3 × 3 × 3/8 diagonals) can transfer vertical load as an alternative
load path to the intact girders for up to 3.6 times HL93 depending on the cross-frame spacing. This
level of loading corresponds to the failure of the cross-frame connections.
Table 1. Girder deflection at mid-span under the dead and 2 times HL93 loading.
Dead Load + Live Load (2 × HL93)
Girder
Intermediate Cross-Frame Spacing (m) No
Cross-
Frame
No
Intermediate
Cross-frame 1.8 3.6 5.4 7.2 9
Ext. Girder
(Fractured)
Deflection (mm) 74.8 76.4 77.9 79.6 79.6 102.6 80.9
Ratio (%) 7.50 5.54 3.66 1.55 1.54 −26.82 -
Int. Girder Deflection (mm) 37.3 36.7 36.4 36.3 36 39.2 35.5
Ratio (%) −4.92 −3.26 −2.60 −2.29 −1.36 −10.38 -
Ext. Girder Deflection (mm) 16.3 16.8 17.2 17.4 17.7 13.6 18.2
Ratio (%) 10.10 7.31 5.32 4.23 2.60 25.19 -
Note: Ratio = Percentage of change (deflection to No Intermediate Cross-Frame deflection); Ext. = Exterior; Int. =
Interior.
Figure 5. The position of HL93 loading over the fractured girder (Dimensions are in mm).
Axial forces in the bottom and top chords of the cross-frames between the fractured and interior
girders under dead load and one-time HL93 are shown in Table 2. The intermediate cross-frames are
numbered along the span for each case, for example, the bridge with 1.8 m cross-frame spacing has
10 intermediate cross-frames. The results indicate that axial forces in the end cross-frame are constant
in all the cases of different cross-frame spacing layouts. Moreover, the forces in the end cross-frames
are much higher than intermediate cross-frames, even higher than those for the cross-frames near the
fracture and under the truck loading. This can be attributed to torsional force developed in the bridge
after the fracture and eccentric loading. For example, in the bridge with 1.8 m intermediate cross-
frame spacing, axial force in the end cross-frame is 147.7 kN. However, the maximum force in the
intermediate cross-frames close to the fracture and under the truck loading is only 49.4 kN. The FE
analysis shows that the end cross-frames reach to their maximum connection capacity of 220 kN
under dead load and 1.8 times HL93 in all the cases before the intermediate cross-frames. The
comparison between the cross-frame axial forces indicates that cross-frames close to fracture and
truck loading have noticeable contribution in transferring the vertical loads from the fractured girder
to the interior girder and axial load in the cross-frames far from the fracture is negligible.
Figure 5. The position of HL93 loading over the fractured girder (Dimensions are in mm).
Using FE analysis, the deflection at the mid-span of all the three girders under the dead loadand twice the HL93 loading were obtained for the bridges with different intermediate cross-framespacing and removing all the cross-frames including the end cross-frames (No Cross-Frame). Theresults (Table 1) show that the deflection of the fractured girder reaches up to 80.9 mm at the mid-spanwhen there is no intermediate cross-frame. It also shows that this deflection can be decreased by 7.5%when using intermediate cross-frame with 1.8 m spacing. Moreover, the cross-frames enable the bridgeto deflect more uniformly for all the girders by transferring the vertical loads from the fractured girderto the intact girders. The results show that the deflection of the interior girder increases by 4.92% bydecreasing the cross-frame spacing that indicates the cross-frames transfer vertical loads from thefractured girder to the interior girder.
To investigate the global behavior of the fractured bridge, load-deflection curves for differentcross-frame spacing layouts were obtained and are shown in Figure 6. In this figure, deflection refers tovertical displacement of fractured girder at the mid-span and was obtained using finite element method(FEM) and the live load refers to increasing load in terms of multiple of combination of lane load andHS20 truck over the fractured girder (One lane loading). It can be concluded from the results thatdecreasing the cross-frame spacing, increases the initial stiffness of the fractured bridge. Experimentalinvestigation by Kathol et al. [32] has demonstrated that the cross-frames have negligible impact onthe global behavior of the intact bridge, and they begin carrying vertical load once a fracture occurs.The first plateau in the load-deflection curves corresponds to the failure of the cross-frames close tothe fracture. The results show that intermediate cross-frames used in this study (WT4 × 9 top andbottom chords and L3 × 3 × 3/8 diagonals) can transfer vertical load as an alternative load path to theintact girders for up to 3.6 times HL93 depending on the cross-frame spacing. This level of loadingcorresponds to the failure of the cross-frame connections.
Axial forces in the bottom and top chords of the cross-frames between the fractured and interiorgirders under dead load and one-time HL93 are shown in Table 2. The intermediate cross-frames arenumbered along the span for each case, for example, the bridge with 1.8 m cross-frame spacing has 10intermediate cross-frames. The results indicate that axial forces in the end cross-frame are constantin all the cases of different cross-frame spacing layouts. Moreover, the forces in the end cross-framesare much higher than intermediate cross-frames, even higher than those for the cross-frames nearthe fracture and under the truck loading. This can be attributed to torsional force developed in thebridge after the fracture and eccentric loading. For example, in the bridge with 1.8 m intermediate

Infrastructures 2020, 5, 32 8 of 14
cross-frame spacing, axial force in the end cross-frame is 147.7 kN. However, the maximum force in theintermediate cross-frames close to the fracture and under the truck loading is only 49.4 kN. The FEanalysis shows that the end cross-frames reach to their maximum connection capacity of 220 kN underdead load and 1.8 times HL93 in all the cases before the intermediate cross-frames. The comparisonbetween the cross-frame axial forces indicates that cross-frames close to fracture and truck loadinghave noticeable contribution in transferring the vertical loads from the fractured girder to the interiorgirder and axial load in the cross-frames far from the fracture is negligible.Infrastructures 2020, 5, 32 8 of 14
Figure 6. Load-deflection curve of the fractured girder at mid-span. (a) Different cross-frame layouts,
(b) Different cross-frame spacing.
Table 2. Axial force in the cross-frames between the fractured and interior girders under dead load
and one- time HL93 loading.
Spacing
(m) Chord
End
Cross-
Frame
Intermediate Cross-Frame No. End
Cross-
Frame 1 2 3 4 5 6 7 8 9 10
FA
xia
l F
orc
e in
th
e C
ross
-Fra
me
(kN
)
1.8 Top 147.3 9.3 8.0 0.4 1.8 5.8 10.2 2.2 1.3 2.7 26.3 138.8
Bottom 147.7 10.2 2.7 20.5 36.0 49.4 40.1 36.0 9.8 16.0 12.5 136.2
3.6 Top 146.9 20.5 3.6 8.5 7.1 2.2 25.4 - - - - 131.7
Bottom 146.9 9.3 12.9 83.2 85.4 2.2 32.0 - - - - 134.4
5.4 Top 143.7 9.8 8.9 10.2 9.8 - - - - - - 150.0
Bottom 149.1 5.8 61.0 60.5 0.4 - - - - - - 147.7
7.2 Top 155.3 9.8 9.8 - - - - - - - - 149.5
Bottom 156.2 69.9 55.2 - - - - - - - - 146.9
9 Top 155.8 8.0 8.0 - - - - - - - - 145.5
Bottom 151.3 44.9 40.9 - - - - - - - - 148.2
No-
Int.
Top 157.1 - - - - - - - - - - 147.7
Bottom 155.3 - - - - - - - - - - 150.4
Note: No-Int. = No Intermediate Cross-Frame.
Figure 7 shows the connector element force of the cross-frame close to the fracture in the bridge
with 1.8 m cross-frame spacing. The force in the section reaches 39.7 kN under the dead load once a
fracture occurs. This means the cross-frames contribute in carrying the dead load after the fracture
and the cross-frame force reaches to its maximum connection capacity of 220 kN under the live load
equal to 3.6 times HL93 loading. After the connection failure (local plateau in the load-deflection
curve) vertical loads redistribute to the remaining cross-frames and the bridge continues carrying
load until the global failure (plateau in the bridge load-deflection curve).
Analysis of the live load distribution factor (LDF) in Table 3 shows that the cross-frame spacing
has negligible effect on the live load distribution even after fracture occurred. This conclusion has
been confirmed for the intact bridge in the experimental investigation by Kathol et al. [32]. However,
due to fracture of the exterior girder and load eccentricity, torsional forces in the section create an
uplift force in the exterior intact girder. By decreasing the intermediate cross-frame spacing, the
torsional stiffness of the bridge section will increase and the bridge acts more integrated against the
rotation. As a result, the uplift force in the exterior intact girder will increase. The FE results show
that the uplift force in the bridge with 1.8 m cross-frame spacing is 25% more than the bridge with no
intermediate cross-frame. The intact exterior girder begins uplift at the support when the eccentric
live load reaches one time the HL93 design live load, that is, the live load uplift force equals the dead
load reaction with one-time full HL93 design live load on one lane.
Figure 6. Load-deflection curve of the fractured girder at mid-span. (a) Different cross-frame layouts,(b) Different cross-frame spacing.
Table 2. Axial force in the cross-frames between the fractured and interior girders under dead load andone- time HL93 loading.
Spacing (m) Chord EndCross-Frame
Intermediate Cross-Frame No. EndCross-Frame1 2 3 4 5 6 7 8 9 10
FAxi
alFo
rce
inth
eC
ross
-Fra
me
(kN
) 1.8Top 147.3 9.3 8.0 0.4 1.8 5.8 10.2 2.2 1.3 2.7 26.3 138.8
Bottom 147.7 10.2 2.7 20.5 36.0 49.4 40.1 36.0 9.8 16.0 12.5 136.2
3.6Top 146.9 20.5 3.6 8.5 7.1 2.2 25.4 - - - - 131.7
Bottom 146.9 9.3 12.9 83.2 85.4 2.2 32.0 - - - - 134.4
5.4Top 143.7 9.8 8.9 10.2 9.8 - - - - - - 150.0
Bottom 149.1 5.8 61.0 60.5 0.4 - - - - - - 147.7
7.2Top 155.3 9.8 9.8 - - - - - - - - 149.5
Bottom 156.2 69.9 55.2 - - - - - - - - 146.9
9Top 155.8 8.0 8.0 - - - - - - - - 145.5
Bottom 151.3 44.9 40.9 - - - - - - - - 148.2
No-Int.Top 157.1 - - - - - - - - - - 147.7
Bottom 155.3 - - - - - - - - - - 150.4
Note: No-Int. = No Intermediate Cross-Frame.
Figure 7 shows the connector element force of the cross-frame close to the fracture in the bridgewith 1.8 m cross-frame spacing. The force in the section reaches 39.7 kN under the dead load once afracture occurs. This means the cross-frames contribute in carrying the dead load after the fracture andthe cross-frame force reaches to its maximum connection capacity of 220 kN under the live load equalto 3.6 times HL93 loading. After the connection failure (local plateau in the load-deflection curve)vertical loads redistribute to the remaining cross-frames and the bridge continues carrying load untilthe global failure (plateau in the bridge load-deflection curve).

Infrastructures 2020, 5, 32 9 of 14Infrastructures 2020, 5, 32 9 of 14
Figure 7. The connector element axial force over the loading.
Table 3. Live load distribution under HL93 loading.
Live Load Distribution (HL93)
Girder Intermediate Cross-Frame Spacing (m) No
Cross-Frame
No Intermediate
Cross-frame 1.8 3.6 5.4 7.2 9
Ext. Girder
(Fractured) 0.94 0.94 0.94 0.94 0.94 0.92 0.96
Int. Girder 1.26 1.26 1.26 1.28 1.28 1.32 1.20
Ext. Girder −0.20 −0.20 −0.20 −0.18 −0.18 −0.24 −0.16
Note: Ext. = Exterior; Int. = Interior.
A very important conclusion drawn from the finite element analysis is that the end cross-frames
play an important role in the fractured scenario. In this situation, live and dead loads over the
fractured girder create additional torsional force in the bridge section that is transferred to the
support through intact girders and intermediate cross-frames and then to the bearing using the end
cross-frames. The results indicate that removing the end cross-frame, increases the girder deflection
by 26.8 % in the fractured bridge. As a result, these members need to be designed for carrying the
torsional forces created by the dead and live load after the fracture in order to prevent excessive
deflection of the girder after a fracture.
Several additional models were developed to investigate the effect of different cross-frame types
other than K-bracing used in this study including X-bracing in the fractured bridge. The results
indicate that different cross-frame type with the same cross-sections (WT4×9 top and bottom chords
and L3×3×3/8 diagonals) would not make significant differences in the girder deflection (Table 4). The
same conclusion was reached in the experimental test by Kathol et al. [32] on the intact bridge.
Table 4. Girder deflection at mid-span under the dead and 2 times HL93 loading for different cross-
frame types.
Cross-Frame Type
Dead Load + Live Load (2 × HL93)
Cross-Frame Spacing Exterior Girder
(fractured) Interior Girder Exterior Girder
K-Bracing 5.4 77.9 36.4 17.2
X-Bracing 5.4 77.6 36.2 17.1
No Cross-Frame 5.4 102.6 39.2 13.6
To investigate the impact of cross-frames after a fracture in bridges with different number of
longitudinal girders, additional models were developed representing twin I-girder bridges (Figure
8). Twin-girder bridges because of their configuration are classified as non-redundant structure
where fracture in one girder may cause the bridge to collapse. The bridge dimensions, properties and
loading were considered the same as the three I-girder bridge except the number of girders and the
corresponding width. Similar parametric analysis was conducted to compare the bridge behavior
with different cross-frame spacing in the twin I-girder bridges. Table 5 shows the girder deflection
Figure 7. The connector element axial force over the loading.
Analysis of the live load distribution factor (LDF) in Table 3 shows that the cross-frame spacinghas negligible effect on the live load distribution even after fracture occurred. This conclusion has beenconfirmed for the intact bridge in the experimental investigation by Kathol et al. [32]. However, due tofracture of the exterior girder and load eccentricity, torsional forces in the section create an uplift forcein the exterior intact girder. By decreasing the intermediate cross-frame spacing, the torsional stiffnessof the bridge section will increase and the bridge acts more integrated against the rotation. As a result,the uplift force in the exterior intact girder will increase. The FE results show that the uplift force in thebridge with 1.8 m cross-frame spacing is 25% more than the bridge with no intermediate cross-frame.The intact exterior girder begins uplift at the support when the eccentric live load reaches one time theHL93 design live load, that is, the live load uplift force equals the dead load reaction with one-time fullHL93 design live load on one lane.
Table 3. Live load distribution under HL93 loading.
Live Load Distribution (HL93)
Girder Intermediate Cross-Frame Spacing (m) NoCross-Frame
No IntermediateCross-frame1.8 3.6 5.4 7.2 9
Ext. Girder (Fractured) 0.94 0.94 0.94 0.94 0.94 0.92 0.96
Int. Girder 1.26 1.26 1.26 1.28 1.28 1.32 1.20
Ext. Girder −0.20 −0.20 −0.20 −0.18 −0.18 −0.24 −0.16
Note: Ext. = Exterior; Int. = Interior.
A very important conclusion drawn from the finite element analysis is that the end cross-framesplay an important role in the fractured scenario. In this situation, live and dead loads over the fracturedgirder create additional torsional force in the bridge section that is transferred to the support throughintact girders and intermediate cross-frames and then to the bearing using the end cross-frames. Theresults indicate that removing the end cross-frame, increases the girder deflection by 26.8 % in thefractured bridge. As a result, these members need to be designed for carrying the torsional forcescreated by the dead and live load after the fracture in order to prevent excessive deflection of the girderafter a fracture.
Several additional models were developed to investigate the effect of different cross-frame typesother than K-bracing used in this study including X-bracing in the fractured bridge. The resultsindicate that different cross-frame type with the same cross-sections (WT4×9 top and bottom chordsand L3×3×3/8 diagonals) would not make significant differences in the girder deflection (Table 4). Thesame conclusion was reached in the experimental test by Kathol et al. [32] on the intact bridge.

Infrastructures 2020, 5, 32 10 of 14
Table 4. Girder deflection at mid-span under the dead and 2 times HL93 loading for differentcross-frame types.
Cross-Frame TypeDead Load + Live Load (2 × HL93)
Cross-Frame Spacing Exterior Girder (fractured) Interior Girder Exterior Girder
K-Bracing 5.4 77.9 36.4 17.2
X-Bracing 5.4 77.6 36.2 17.1
No Cross-Frame 5.4 102.6 39.2 13.6
To investigate the impact of cross-frames after a fracture in bridges with different number oflongitudinal girders, additional models were developed representing twin I-girder bridges (Figure 8).Twin-girder bridges because of their configuration are classified as non-redundant structure wherefracture in one girder may cause the bridge to collapse. The bridge dimensions, properties andloading were considered the same as the three I-girder bridge except the number of girders and thecorresponding width. Similar parametric analysis was conducted to compare the bridge behaviorwith different cross-frame spacing in the twin I-girder bridges. Table 5 shows the girder deflection forthe twin I-girder bridge. The results show that the deflection of the fractured girder (Right Girder)reaches up to 220.4 mm at the mid-span under dead and two times HL93 design load when there isno cross-frame. By adding the end cross-frames (No intermediate cross-frame model) the fracturedgirder deflection decreases by 24.7% which shows the contribution of end cross-frames in the damagedbridge. Moreover, intermediate cross-frames can decrease the bridge deflection up to 9.5% when the1.8 m spacing is used.
Infrastructures 2020, 5, 32 10 of 14
for the twin I-girder bridge. The results show that the deflection of the fractured girder (Right Girder)
reaches up to 220.4 mm at the mid-span under dead and two times HL93 design load when there is
no cross-frame. By adding the end cross-frames (No intermediate cross-frame model) the fractured
girder deflection decreases by 24.7% which shows the contribution of end cross-frames in the
damaged bridge. Moreover, intermediate cross-frames can decrease the bridge deflection up to 9.5%
when the 1.8 m spacing is used.
A comparison between the girder deflection shows that the fractured girder deflection in the
twin I-girder bridge is more than twice that of the fractured girder in the three I-girder bridge in all
the cases under the same loading and cross-frame layout. However, deflection of the intact girder in
the twin I-girder bridge only increased by an average of 27% compared to the intact girders in the
three I-girder bridge. For example, in the twin I-girder bridge with 5.4 m cross-frame spacing, the
fractured and intact girder deflection are 163.8 mm and 46.9 mm, respectively. However, these
deflections in the three I-girder bridge is only 77.9 mm and 36.4 mm. The predominant reason is that
in the three I-girder bridges, after a fracture in one of the girders, the two remaining intact girders
with the cross-frames demonstrate a behavior similar to a box girder with a higher torsional stiffness
than two single girders without the cross-frames. This allows for a better distribution of the torsional
forces from the eccentric loading and less displacement than the case of two I-girder bridges. On the
other hand, in the two-girder bridges, eccentric loading pronounced after the fracture in one girder
causes excessive deflection in the fractured girder due to low torsional stiffness contribution from the
intact girder. Hence, the result confirms that the cross-frames can increase the torsional strength of
the bridge deck against eccentric loading.
Figure 8. Finite Element Model of the fractured twin I-girder bridge.
Table 5. Girder deflection of the twin I-girder bridge at mid-span under the dead and 2 times HL93
loading.
Girder
Dead Load + Live Load (2 × HL93)
Intermediate Cross-Frame Spacing (m) No
Cross-
Frame
No
Intermediate
Cross-frame 1.8 3.6 5.4 7.2 9
Right Girder
(Fractured)
Deflection (mm) 159.8 162.8 163.8 164.6 165.5 220.4 176.7
Ratio (%) 9.5 7.8 7.3 6.8 6.3 −24.7 -
Left Girder Deflection (mm) 47.0 47.4 46.9 45.7 46.2 48.7 44.6
Ratio (%) −5.4 −6.3 −5.1 −2.4 −3.6 −9.0 -
Note: Ratio = Percentage of change (deflection to No Intermediate Cross-Frame deflection); Ext. = Exterior; Int.
= Interior.
Analyzing the finite element results also indicates that in the three I-girder bridge, because of
the high torsional stiffness of the combination of the two intact girders with cross-frames, there is
negligible rotation about the interior girder and the concrete deck above the cross-frames carries some
of the vertical load in the transvers direction as a cantilever beam. On the other hand, in the twin I-
Figure 8. Finite Element Model of the fractured twin I-girder bridge.
Table 5. Girder deflection of the twin I-girder bridge at mid-span under the dead and 2 timesHL93 loading.
GirderDead Load + Live Load (2 × HL93)
Intermediate Cross-Frame Spacing (m) NoCross-Frame
No IntermediateCross-frame1.8 3.6 5.4 7.2 9
Right Girder(Fractured)
Deflection (mm) 159.8 162.8 163.8 164.6 165.5 220.4 176.7
Ratio (%) 9.5 7.8 7.3 6.8 6.3 −24.7 -
Left GirderDeflection (mm) 47.0 47.4 46.9 45.7 46.2 48.7 44.6
Ratio (%) −5.4 −6.3 −5.1 −2.4 −3.6 −9.0 -
Note: Ratio = Percentage of change (deflection to No Intermediate Cross-Frame deflection); Ext. = Exterior;Int. = Interior.
A comparison between the girder deflection shows that the fractured girder deflection in thetwin I-girder bridge is more than twice that of the fractured girder in the three I-girder bridge in all
Infrastructures 2020, 5, 32 11 of 14
the cases under the same loading and cross-frame layout. However, deflection of the intact girderin the twin I-girder bridge only increased by an average of 27% compared to the intact girders inthe three I-girder bridge. For example, in the twin I-girder bridge with 5.4 m cross-frame spacing,the fractured and intact girder deflection are 163.8 mm and 46.9 mm, respectively. However, thesedeflections in the three I-girder bridge is only 77.9 mm and 36.4 mm. The predominant reason is thatin the three I-girder bridges, after a fracture in one of the girders, the two remaining intact girders withthe cross-frames demonstrate a behavior similar to a box girder with a higher torsional stiffness thantwo single girders without the cross-frames. This allows for a better distribution of the torsional forcesfrom the eccentric loading and less displacement than the case of two I-girder bridges. On the otherhand, in the two-girder bridges, eccentric loading pronounced after the fracture in one girder causesexcessive deflection in the fractured girder due to low torsional stiffness contribution from the intactgirder. Hence, the result confirms that the cross-frames can increase the torsional strength of the bridgedeck against eccentric loading.
Analyzing the finite element results also indicates that in the three I-girder bridge, because ofthe high torsional stiffness of the combination of the two intact girders with cross-frames, there isnegligible rotation about the interior girder and the concrete deck above the cross-frames carriessome of the vertical load in the transvers direction as a cantilever beam. On the other hand, in thetwin I-girder bridge, concrete deck has less contribution as the second load path due to the rotationabout the fractured girder. As a result, the deflection of the twin I-girder bridge is more sensitive tothe cross-frame spacing compared to the three I-girder bridge bringing higher contribution by thecross-frames when compared to the three-girder bridge.
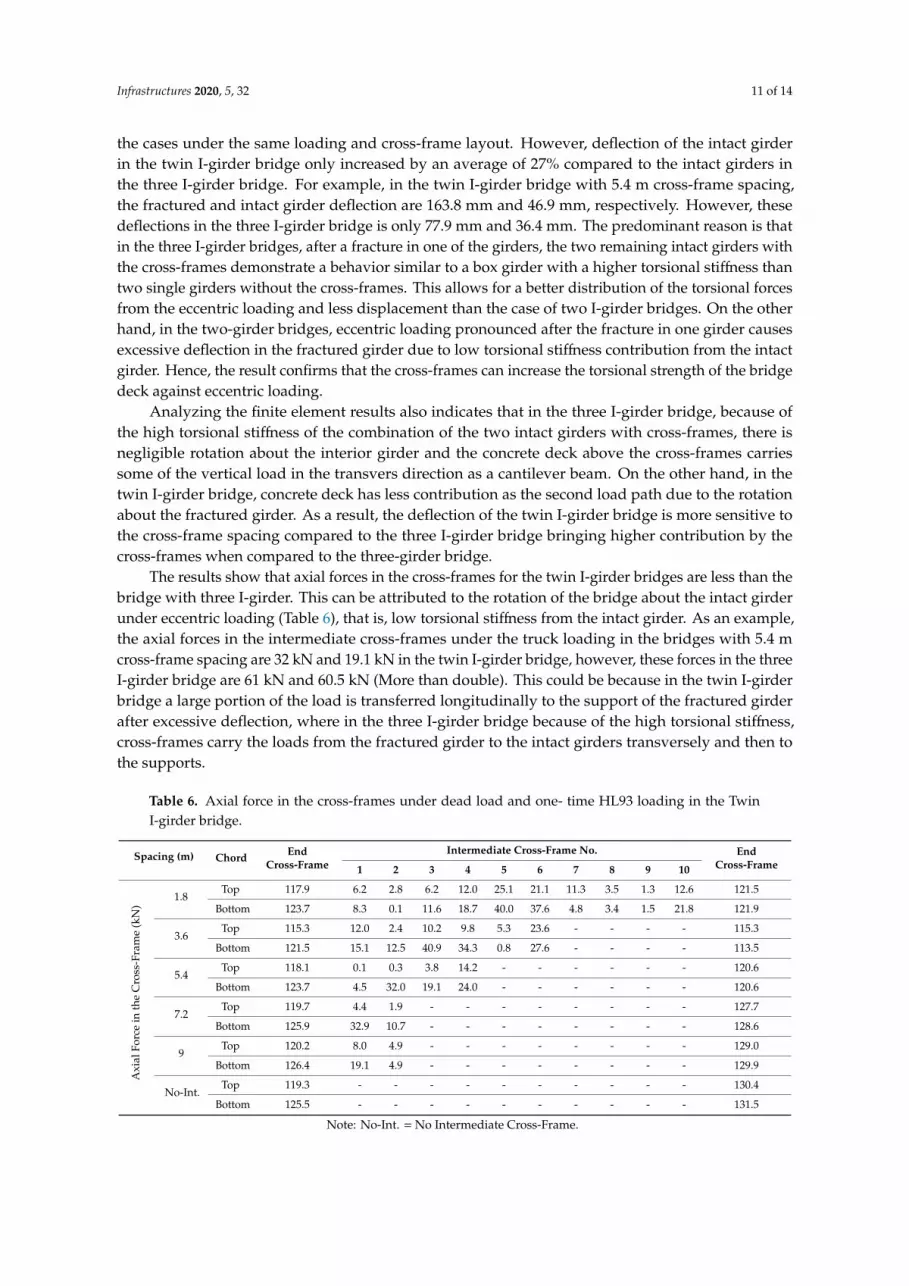
The results show that axial forces in the cross-frames for the twin I-girder bridges are less than thebridge with three I-girder. This can be attributed to the rotation of the bridge about the intact girderunder eccentric loading (Table 6), that is, low torsional stiffness from the intact girder. As an example,the axial forces in the intermediate cross-frames under the truck loading in the bridges with 5.4 mcross-frame spacing are 32 kN and 19.1 kN in the twin I-girder bridge, however, these forces in the threeI-girder bridge are 61 kN and 60.5 kN (More than double). This could be because in the twin I-girderbridge a large portion of the load is transferred longitudinally to the support of the fractured girderafter excessive deflection, where in the three I-girder bridge because of the high torsional stiffness,cross-frames carry the loads from the fractured girder to the intact girders transversely and then tothe supports.
Table 6. Axial force in the cross-frames under dead load and one- time HL93 loading in the TwinI-girder bridge.
Spacing (m) Chord EndCross-Frame
Intermediate Cross-Frame No. EndCross-Frame1 2 3 4 5 6 7 8 9 10
Axi
alFo
rce
inth
eC
ross
-Fra
me
(kN
)
1.8Top 117.9 6.2 2.8 6.2 12.0 25.1 21.1 11.3 3.5 1.3 12.6 121.5
Bottom 123.7 8.3 0.1 11.6 18.7 40.0 37.6 4.8 3.4 1.5 21.8 121.9
3.6Top 115.3 12.0 2.4 10.2 9.8 5.3 23.6 - - - - 115.3
Bottom 121.5 15.1 12.5 40.9 34.3 0.8 27.6 - - - - 113.5
5.4Top 118.1 0.1 0.3 3.8 14.2 - - - - - - 120.6
Bottom 123.7 4.5 32.0 19.1 24.0 - - - - - - 120.6
7.2Top 119.7 4.4 1.9 - - - - - - - - 127.7
Bottom 125.9 32.9 10.7 - - - - - - - - 128.6
9Top 120.2 8.0 4.9 - - - - - - - - 129.0
Bottom 126.4 19.1 4.9 - - - - - - - - 129.9
No-Int.Top 119.3 - - - - - - - - - - 130.4
Bottom 125.5 - - - - - - - - - - 131.5
Note: No-Int. = No Intermediate Cross-Frame.

Infrastructures 2020, 5, 32 12 of 14
6. Conclusions
A numerical investigation was carried out to study the effect of cross-frames on load distributionand global behavior of steel I-girder bridges when one of the girders is fractured. Detailed finiteelement models with different cross-frame spacing were developed and analyzed under dead load andincreasing HL93 live load eccentrically applied in one lane over the fractured girder. The followingconclusions and findings can be drawn from the results for the simple span multiple steel plate girderbridge investigated in this study:
• An adequate cross-frame spacing, and stiffness could decrease the bridge excessive deformationafter a sudden fracture e in one girder and has the potential to enhance the bridge redundancy.
• The cross-frames increase the bridge torsional stiffness after fracture of one girder and enable thebridge to deflect more uniformly by transferring the vertical loads from the fractured girder to theintact girders.
• The typical cross-frame used in this study has enough stiffness to be considered as an alternativeload path after a sudden fracture. This was verified for live loading of up to 3.6 times HL90loading for 1.8 m spacing of the cross-frames in the three I-girder bridge.
• In three I-girder bridges, after a fracture in one of the girders, two remaining intact girders withthe cross-frames between demonstrate behavior similar to a box girder with a higher torsionalstiffness than two single girders without the cross-frames. This allows for a better distributionof the torsional forces from the eccentric loading and less displacement than the case of twoI-girder bridges.
• In the twin I-girder bridge, fracture in one girder results in significantly larger displacements inthe fractured and intact girders compared to the three I-girder bridges. The effect of cross-frameshowever is more pronounced in twin I-girder bridges. The elements of the cross frames in thetwin I-girder bridge carry smaller forces than those in the three I-girder bridge because of largerrotation of the intact girder. A large portion of the loads for twin I-girder bridge after fractureof one girder seems to be transferred longitudinally to the support after excessive deflection,however, in the three I-girder bridge because of the high torsional stiffness cross-frames carry theloads from the fractured girder to the intact girders transversely and then to the supports.
• A very important conclusion is that the end cross-frames can play an important role in thefractured scenario and to be effective for the case of fractured girder, they will need to be designedfor carrying the torsional forces created by the dead and live loads after the fracture.
Author Contributions: Conceptualization, A.B.M. and M.A.; Methodology, A.B.M. and M.A.; Validation,M.A.; Formal Analysis, M.A.; Investigation, A.B.M. and M.A.; Resources, A.B.M. and M.A.; Data Curation,M.A; Writing—Original Draft Preparation, M.A.; Writing—Review and Editing, A.B.M.; Visualization, M.A.;Supervision, A.B.M. All authors have read and agreed to the published version of the manuscript.
Funding: This research received no external funding.
Acknowledgments: The authors greatly acknowledge the internal support by the Department of Civil andEnvironmental Engineering at Florida International University. The contents of this paper reflect the views of theauthors, who are responsible for the facts and the accuracy of the information presented herein.
Conflicts of Interest: The authors declare no conflict of interest.
References
1. Yu, J.; Ziehl, P.; Zrate, B.; Caicedo, J. Prediction of fatigue crack growth in steel bridge components usingacoustic emission. J. Constr. Steel Res. 2011, 67, 1254–1260. [CrossRef]
2. Garber, D.; Shahrokhinasab, E. Performance Comparison of In-Service, Full-Depth Precast Concrete Deck Panels toCast-in-Place Decks; Accelerated Bridge Construction University Transportation Center (ABC-UTC): Miami,FL, USA, 2019.
3. Abedin, M.; Mehrabi, A.B. Novel Approaches for Fracture Detection in Steel Girder Bridges. Infrastructures2019, 4, 42. [CrossRef]

Infrastructures 2020, 5, 32 13 of 14
4. Valikhani, A.; Azizinamini, A. Experimental Investigation of High Performing Protective Shell Used for RetrofittingBridge Elements; Accelerated Bridge Construction University Transportation Center (ABC-UTC): Miami, FL,USA, 2018.
5. Valikhani, A.; Jahromi, A.J.; Mantawy, I.M.; Azizinamini, A. Experimental evaluation of concrete-to-UHPCbond strength with correlation to surface roughness for repair application. Constr. Build. Mater. 2020, 238,117753. [CrossRef]
6. Carden, L.P.; Itani, A.M.; Buckle, I.G. Seismic Performance of Steel Girder Bridges with Ductile Cross FramesUsing Single Angle X Braces. J. Struct. Eng. 2006, 132, 329–337. [CrossRef]
7. Itani, A.M.; Bruneau, M.; Carden, L.; Buckle, I.G. Seismic Behavior of Steel Girder Bridge Superstructures. J.Bridg. Eng. 2004, 9, 243–249. [CrossRef]
8. Lindquist, W.; Ibrahim, A.; Tung, Y.; Motaleb, M.; Tobias, D.; Hindi, R. Distortion-Induced Fatigue Crackingin a Seismically Retrofitted Steel Bridge. J. Perform. Constr. Facil. 2016, 30, 04015068. [CrossRef]
9. Dolati, A.; Maleki, S. Ductile behavior of existing internal end diaphragms in steel tub girder bridges. J.Constr. Steel Res. 2019, 153, 356–371. [CrossRef]
10. Hassel, H.L.; Bennett, C.R.; Matamoros, A.B.; Rolfe, S.T. Parametric Analysis of Cross-Frame Layout onDistortion-Induced Fatigue in Skewed Steel Bridges. J. Bridg. Eng. 2013, 18, 601–611. [CrossRef]
11. Sharafbayani, M.; Linzell, D.G. Optimizing Horizontally Curved, Steel Bridge, Cross-Frame Arrangementsto Enhance Construction Performance. J. Bridg. Eng. 2014, 19, 04014021. [CrossRef]
12. Egilmez, O.O.; Helwig, T.A.; Herman, R. Buckling Behavior of Steel Bridge I-Girders Braced by PermanentMetal Deck Forms. J. Bridg. Eng. 2012, 17, 624–633. [CrossRef]
13. Idriss, R.L.; White, R.K. Secondary Load Paths in Bridge Systems. Ph.D. Thesis, New Mexico State University,Las Cruces, NM, USA, 1991.
14. Idriss, R.L.; White, K.R.; Woodward, C.B.; Jauregui, D.V. After-fracture redundancy of two-girder bridge:Testing I-40 bridges over Rio Grande. In Proceedings of the Fourth International Bridge EngineeringConference, San Francisco, CA, USA, 28–30 August 1995; pp. 316–326.
15. Park, Y.; Joe, W.; Park, J.; Hwang, M.; Choi, B.H. An experimental study on after-fracture redundancy ofcontinuous span two-girder bridges. Int. J. Steel Struct. 2012, 12, 1–13. [CrossRef]
16. Connor, R.J.; Martín, F.J.B.; Varma, A.; Lai, Z.; Korkmaz, C. Fracture-Critical System Analysis for Steel Bridges;Transportation Research Board: Washington, DC, USA, 2018; ISBN 0309390540.
17. Neuman, B.J. Evaluating the Redundancy of Steel Bridges: Full-Scale Destructive Testing of a FractureCritical Twin Box-Girder Steel Bridge. Ph.D. Thesis, University of Texas at Austin, Austin, TX, USA, 2009.
18. Irfaee, M.; Mahmoud, H. Mixed-Mode Fatigue and Fracture Assessment of a Steel Twin Box-Girder Bridge. J.Bridg. Eng. 2019, 24, 4019056. [CrossRef]
19. Hovell, C.G. Evaluation of Redundancy in Trapezoidal Box-Girder Bridges Using Finite Element Analysis.Ph.D. Thesis, University of Texas at Austin, Austin, TX, USA, 2007.
20. Samaras, V.A.; Sutton, J.P.; Williamson, E.B.; Frank, K.H. Simplified method for evaluating the redundancyof twin steel box-girder bridges. J. Bridg. Eng. 2012, 17, 470–480. [CrossRef]
21. Kim, J.; Williamson, E.B. Finite-element modeling of twin steel box-girder bridges for redundancy evaluation.J. Bridg. Eng. 2015, 20. [CrossRef]
22. Lin, W.; Yoda, T.; Kumagai, Y.; Saigyo, T. Numerical study on post-fracture redundancy of the two-girdersteel-concrete composite highway bridges. Int. J. Steel Struct. 2013, 13, 671–681. [CrossRef]
23. Lin, W.; Yoda, T.; Taniguchi, N.; Lam, H.; Nakabayashi, K. Post-Fracture redundancy evaluation of a twinbox-girder shinkansen bridge in Japan. In Proceedings of the IABSE Conference, Guangzhou 2016: Bridgesand Structures Sustainability - Seeking Intelligent Solutions - Report; International Association for Bridge andStructural Engineering: Guangzhou, China, 2016; Volume 106, pp. 675–682.
24. Lin, W.; Lam, H.; Yoda, T. Experimental Study on Steel–Concrete Composite Twin I-Girder Bridges. J. Bridg.Eng. 2020, 25. [CrossRef]
25. Pham, H.V. Evaluation of Redundancy of Twin Steel Box-Girder Bridges. Ph.D. Thesis, Florida InternationalUniversity, Miami, FL, USA, 2016.
26. Conner, R.J.; Dexter, R.J.; Mahmoud, H. Inspection and Management of Bridges with Fracture-critical Details: ASynthesis of Highway Practice; Transportation Research Board: Washington, DC, USA, 2005; Volume 354, ISBN0309097614.

Infrastructures 2020, 5, 32 14 of 14
27. Abedin, M.; Maleki, S.; Kiani, N.; Shahrokhinasab, E. Shear lag effects in angles welded at both legs. Adv.Civ. Eng. 2019, 2019. [CrossRef]
28. Takahashi, S.; Tachibana, Y.; Shimura, T.; Morishita, H.; Ito, H.; Miki, C. Structural details of connection ofdiaphragm for rationalized plate girder bridges. Doboku Gakkai Ronbunshu 1997, 1997, 107–118. [CrossRef]
29. Kozy, B.; Tunstall, S. Stability analysis and bracing for system buckling in twin I-girder bridges. Bridg. Struct.2007, 3, 149–163. [CrossRef]
30. Ma, H.; Shi, X. Parametric study on behaviour twin-I girder bridge systems with cross-beams. In Proceedingsof the Proc. 2016 Structural Congress (Structures 2016), Seoul: Korea Federation of Science and TechnologySocieties, Jeju Convention Visitors’ Bureau, and Korea Tourism Organization, Jeju Island, Korea, 28 August–1September 2016.
31. AASHTO. AASHTO LRFD Bridge Design Specifications, 8th ed.; American Association of State Highway andTransportation Officials: Washington, DC, USA, 2017.
32. Kathol, S.; Azizinamini, A.; Luedke, J. Strength Capacity of Steel Girder Bridges. Final Report; TransportationResearch Board: Washington, DC, USA, 1995.
33. Abedin, M.; Farhangdoust, S.; Mehrabi, A.B. Fracture detection in steel girder bridges using self-poweredwireless sensors. In Proceedings of the In Risk-Based Bridge Engineering: Proceedings of the 10th New York CityBridge Conference, August 26-27, 2019; CRC Press: New York City, NY, USA, 2019; p. 216.
34. Lonetti, P.; Pascuzzo, A. Vulnerability and failure analysis of hybrid cable-stayed suspension bridgessubjected to damage mechanisms. Eng. Fail. Anal. 2014, 45, 470–495. [CrossRef]
35. Lonetti, P.; Pascuzzo, A. A numerical study on the structural integrity of self-anchored cable-stayed suspensionbridges. Frat. ed Integrita Strutt. 2016, 10, 359–376. [CrossRef]
36. Greco, F.; Lonetti, P.; Pascuzzo, A. A moving mesh FE methodology for vehicle–bridge interaction modeling.Mech. Adv. Mater. Struct. 2018. [CrossRef]
37. Ghaffary, A.; Karami Mohammadi, R. Framework for virtual hybrid simulation of TADAS frames usingopensees and abaqus. J. Vib. Control 2018, 24, 2165–2179. [CrossRef]
38. Izadpanahi, E.; Moshtaghzadeh, M.; Radnezhad, H.R.; Mardanpour, P. Constructal approach to design ofwing cross-section for better flow of stresses. In Proceedings of the AIAA Scitech 2020 Forum, Orlando, FL,USA, 6–10 January 2020; p. 275.
39. Documentation, D.A. ABAQUS/CAE Doc; Simulia: Providence, RI, USA, 2016.40. Rahimi, E.; Shamshiripour, A.; Shabanpour, R.; Mohammadian, A.; Auld, J. Analysis of transit users’ waiting
tolerance in response to unplanned service disruptions. Transp. Res. Part D Transp. Environ. 2019. [CrossRef]41. Rahimi, E.; Shamshiripour, A.; Shabanpour, R.; Mohammadian, A.; Auld, J. Analysis of Transit Users’
Response Behavior in Case of Unplanned Service Disruptions. Transp. Res. Rec. 2020, 0361198120911921.[CrossRef]
42. Rahimi, E.; Shamshiripour, A.; Samimi, A.; Mohammadian, A. (Kouros) Investigating the injury severity ofsingle-vehicle truck crashes in a developing country. Accid. Anal. Prev. 2020, 137. [CrossRef]
43. Lubliner, J.; Oliver, J.; Oller, S.; Onate, E. A plastic-damage model for concrete. Int. J. Solids Struct. 1989, 25,299–326. [CrossRef]
44. ACI Committee 318. Building Code Requirements for Structural Concrete (ACI 318–14) and Commentary (ACI318R–14); American Concrete Institute: Hills, MI, USA, 2014; p. 519.
45. Topkaya, C.; Williamson, E.B.; Frank, K.H. Behavior of curved steel trapezoidal box-girders duringconstruction. Eng. Struct. 2004, 26, 721–733. [CrossRef]
46. Mouras, J.M.; Sutton, J.P.; Frank, K.H.; Williamson, E.B. The Tensile Capacity of Welded Shear Studs;Transportation Research Board: Washington, DC, USA, 2008; ISBN 9780874216561.
© 2020 by the authors. Licensee MDPI, Basel, Switzerland. This article is an open accessarticle distributed under the terms and conditions of the Creative Commons Attribution(CC BY) license (http://creativecommons.org/licenses/by/4.0/).