the effect of masonry infill on the seismic response of reinforced concrete frames
TRANSCRIPT

i
DEDICATION
To
My parents

ii
DECLARATION
It is hereby declared that except for the contents where specific reference have been
made to the work of others, the studies contained in this thesis is the result of
investigation carried out by the author. No part of this thesis has been submitted to any
other university or educational establishment for a degree, diploma or other qualification
(except for publication).
Signature of the candidate

iii
ACKNOWLEDGEMENT
First of all, I would like to remember the supreme, my creator almighty Allah who made
everything possible for me and for his never ending blessings.
I wish to express our deepest gratitude to our esteemed supervisor Dr. Md. Abdur Rouf,
Professor, Department of Civil Engineering, BUET for his careful supervision and guideline
throughout the whole time of working on this thesis.
I would like to thank our dear teacher Md. Ruhul Amin, assistant professor, Department
of Civil Engineering, BUET for his kind support and help. The idea of this thesis came from
his work on a topic similar to my work.
Finally, I would like to express my reverence to all the youtubers and uploaders on the internet providing valuable materials for free which made the learning process so much easier.

iv
ABSTRACT
Reinforced concrete (RC) frames such as bare frames, soft story frames and completely
infilled frames were considered for model in this study. Each frame was further
considered as 6, 9, 12 and 15 story buildings. Soft story and infilled frames were provided
with two types of masonry infill (Em = 1875 and 5625 N/mm2). Frames were subjected to
harmonic ground motions of peak ground acceleration 1, 2 and 3 m/s2. Each acceleration
was of 12 frequency levels starting from .25 to 3 Hz. The duration of the ground motions
was taken as 5s and damping of RC buildings was assumed to be 5%.
The study was nonlinear dynamic analysis of the models using ETABS 2013. Natural
frequency, interstory drift ratio and time passed before collapse were considered to
analyze the response of the RC frames. The UBC limitation on drift ratio for long period
(≥.7s) structures is .02. The structures were assumed to fail at this drift ratio.
After performing time history analysis, behaviors of the structures are compared. It was
found that when subjected to ground motion infilled frames perform best. Strength of
infill has effect on the response of frames under seismic loading and also on the natural
frequencies of the frames. Completely infilled frames with higher strength infill performed
better. Structures with higher number of story were found to sustain seismic loading for
longer duration before failure. The response of soft story and infilled frames (12 and 15
story buildings) were found to be close if weak infills are used. When subjected to ground
motions, frames were vulnerable to frequency level up to 1.5 Hz.

v
Contents
DEDICATION ....................................................................................................................................... i
DECLARATION ................................................................................................................................... ii
ACKNOWLEDGEMENT ...................................................................................................................... iii
ABSTRACT ......................................................................................................................................... iv
INTRODUCTION .................................................................................................................................1
1.1 General ....................................................................................................................................1
1.2 Objectives and scope of study ................................................................................................1
1.3 Methodology of thesis work ...................................................................................................1
1.4 Organization of the thesis .......................................................................................................2
LITERATURE REVIEW .........................................................................................................................3
2.1 Masonry infill in RC building ...................................................................................................3
2.2 Modeling of infill walls in RC buildings ...................................................................................5
2.2.1 Macro-Modeling of infill walls ......................................................................................6
2.2.1.1 Determination of Equivalent Strut Width ..............................................................7
2.2.2 Micro-Modeling of infill walls ................................................................................ 11
2.3 Concept of soft story in buildings ........................................................................................ 12
2.3.1 Definition of soft story in different codes ................................................................. 13
2.4 Interstory drift of frames ..................................................................................................... 14
2.4.1 Code provisions for interstory drift ........................................................................... 14
METHODOLOGY ............................................................................................................................. 16
3.1 Nonlinear dynamic analysis ................................................................................................. 16
3.2 Modal analysis ..................................................................................................................... 16
3.3 Time history analysis ............................................................................................................ 17
3.4 Building configuration .......................................................................................................... 19
3.5 Material properties .............................................................................................................. 22
3.5.1 Concrete and steel ..................................................................................................... 22
3.5.2 Mortar ........................................................................................................................ 22
3.5.3 Masonry ..................................................................................................................... 22
3.6 Properties of equivalent diagonal strut ............................................................................... 24
3.7 Loads on building ................................................................................................................. 25

vi
RESULTS AND DISCUSSIONS ........................................................................................................... 29
4.1 Natural Frequency of models compared with BNBC 1993 and BNBC 2010 ........................ 29
4.2 Comparison of natural frequency due to change in infill .................................................... 30
4.3 Maximum interstory drift ratio at different story levels ..................................................... 32
4.4 Comparison of maximum interstory drift ratio ................................................................... 57
4.4.1 Frames with weaker infill ........................................................................................... 57
4.4.2 Frames with stronger infill ......................................................................................... 61
4.5 Difference in interstory drift ratio due to change in infill .................................................... 65
4.6 Time history of drift ............................................................................................................. 69
4.6.1 Frames with weaker infill ........................................................................................... 69
4.6.2 Frames with stronger infill ......................................................................................... 99
4.7 Comparison of collapse time for different types of frames ............................................... 130
4.7.1 Bare frames .............................................................................................................. 130
4.7.2 Soft story frames ..................................................................................................... 131
4.7.3 Infilled frames .......................................................................................................... 133
CONCLUSIONS AND RECOMMENDATIONS .................................................................................. 135
5.1 Conclusions: ....................................................................................................................... 135
5.1.1 Natural frequency of frames: .................................................................................. 135
5.1.2 Interstory drift ratio of frames: ............................................................................... 135
5.1.3 Time of collapse for different frames: ..................................................................... 136
5.2 Recommendations for future work: .................................................................................. 136
REFERENCES ................................................................................................................................. 137

1
CHAPTER ONE
INTRODUCTION
1.1 General
Walls are created in buildings by infilling parts of the frame with stiff construction such as
bricks or concrete blocks. Unless adequately separated from the frame, the structural
interaction of the frame and infill panels must be allowed for in the design. This interaction
has a considerable effect on the overall seismic response of the structure and on the
response of the individual members.
The behavior of the infilled frame under seismic loading is very complex and complicated.
Since the behavior is nonlinear and closely related to the link between the frame and the
infill, it is very difficult to predict if by analytical methods unless the analytical models are
supported and revised by using the experimental data. Due to the complex behavior of
such composite structures, experimental as well as analytical research is of great
importance to determine the strength, stiffness and dynamic characteristics at each stage
of loading. It is widely recognized that nonlinear time history analysis constitutes the most
accurate way for simulating response of structures subjected to strong levels of seismic
excitation. This method is based on sound underlying principles and features the
capability of reproducing the intrinsic inelastic dynamic behavior of structures.
1.2 Objectives and scope of study This study will examine building structures with reinforced concrete frames having
masonry infill under dynamic base excitations as time history with the following specific
objectives:
To investigate various structural response for which typical frame structure
buildings (with different number of story) is most vulnerable to earthquake
excitation with particular frequency.
To determine and compare the response of different types of frames (bare
frame, soft story frame, infilled frame) under earthquake motion.
To investigate and compare the effects of masonry infill walls on RC frames
subjected harmonic ground motion.
1.3 Methodology of thesis work The proposed methodology consists of following steps:
Three types of buildings will be modeled for frames with full infill, frames without
any infill (bare frame) and frames with infill in upper stories and having a soft story
at the ground floor.

2
Masonry infill with 5 inch wall thickness will be modeled manually by macro-
modeling method using works of previous researchers.
Masonry infill having different properties will be selected for analysis of RC frame.
ETABS 2013 will be used for creating and nonlinear dynamic analysis of the models.
Time history analysis will be performed using Nonlinear Modal (FNA) load case.
Modal cases using Eigen vector will be used. Analysis will be performed for 5%
damping.
Analysis will be done for different earthquake frequencies, peak ground
accelerations and varying number of stories.
1.4 Organization of the thesis
Chapter 1 is a general introduction to the themes that will be dealt; the main topic is
described, the purposes of the work are set and a brief summary of the present job is
presented
Chapter 2 presents the review of previously published literature in the field of infilled
reinforced concrete frame structures. It also reviews the modeling of infill wall and
definition of soft story and interstory drift.
In chapter 3, the features of models used for time history analysis; after a short description
of finite element processes involved i.e. time history analysis, Modal analysis, the element
properties adopted in the model, the material properties assumed, the strut models used
in the analysis is explained.
In chapter 4, the results of analysis are given in detail that includes numerical evaluation
of dynamic response of nonlinear system when subjected to harmonic ground motions of
different amplitude and different frequencies. Behavior of buildings for different type of
infill walls has been observed.
Chapter 5 presents the conclusions of the thesis and the final considerations achieved,
giving some suggestions for further works on this topic.

3
CHAPTER TWO
LITERATURE REVIEW
2.1 Masonry infill in RC building P. G. Asteris and D. M. Cotsovos (2012) used finite element modeling to find out the effect
of infill walls on the structural response of RC frames. The results obtained from static
loading cases was that infill walls act as diagonal compression struts which undertakes
portion of the applied load thus offering relief to certain structural elements of the frame.
This action results in significant redistribution of the internal actions developing within
the structural elements of the frame by essentially redirecting the loads into other regions
of the structure. Although this redistribution of internal actions can result, on one hand,
in an increase of the overall stiffness and load carrying capacity of the frame, on the other
hand, it may cause stress concentrations in other regions of the structure never designed
to undertake the internal actions which develop due to the additional loads transferred
through the diagonal strut.
Observation of dynamic loading cases was that the two story infilled frame can be
essentially described by a one degree of freedom system instead of the two degree of
freedom system describing the response of the bare frame as the introduction of the infill
plane essentially cancels the degree of freedom associated with the displacement of the
floor level of the frame to which infill walls were introduced. More damages were
sustained by the structural elements of the story frame which had no infill wall.
Mohammad H. Jinya, V. R. Patel (2014) prepared sixteen models for static linear analysis
and dynamic analysis (time history). They compared the results of models i.e. without
strut and with strut of infill wall with 15% and 25 central outer opening. From the analysis
it was concluded that diagonal strut will change the seismic performance of RC building.
Axial force in column increased, story displacement and story drift are decreased and base
shear increased with higher stiffness of infill. If in the ground level at least periphery wall
is provided then soft story effect can be minimized. It was also concluded that increase in
the percentage of opening can lead to a decrease in lateral stiffness.
Hossein Mostafaei and Toshimi Kabeyasawa (2004) carried out nonlinear time history
analysis on Bam telephone center to find out effect of infill masonry walls on the seismic
response of reinforced concrete buildings subjected to the 2003 Bam earthquake strong
motion. A nonlinear analysis of the Bam telephone center-reinforced concrete building,
subjected to the horizontal components of the recorded strong motion, was carried out
to obtain an analytical explanation of the almost linear performance of the building during
the earthquake. An approach was developed to employ analytical models for masonry
infill walls with and without openings and applied in the analysis. A significant effect of
infill walls was observed on the structural response of the
building. It could be concluded that the Bam telephone center building without masonry
infill walls would suffer large nonlinear deformations and damage during the earthquake.
The maximum overall story drift ratio of .8% was obtained for the ground floor of the

4
building, which is less than a limit yielding drift ratio of 1%. Therefore, it may be concluded
that the linear responses observed correlate well with the analytical results. Drift ratios
for different damaged infill walls were obtained and compared to the observed responses.
In most cases the comparisons lead to a fairly acceptable agreement. Further studies
might be recommended for the analytical modeling of the infill walls with openings to
obtain a simplified equivalent approach.
C V R MURTY and Sudhir K JAIN (2000) presented some experimental results on cyclic test
of RC frames with masonry infill to evaluate the influence of masonry infill walls on seismic
performance of RC frame buildings. It was seen that the masonry infills contribute
significant lateral stiffness, strength, overall ductility and energy dissipation capacity. With
suitable arrangements to provide reinforcement in the masonry that is well anchored into
the frame columns, it should be possible to also improve the out-of-plane response of
such infills.
Adel Ziada, Mohamed Laid Samai, Abdelhadi Tekkouk (2015) conducted a numerical study
using the software computer package SAP 2000 to investigate the effects of masonry infill
on the seismic performance of RC framed buildings located in a moderate seismic risk area
in Algeria. For this purpose, a number of nonlinear static (pushover) analyses have been
performed on spatial bare structures, fully and partially infilled structures. The infills have
been modeled with two crossed diagonal struts able to represent the contribution under
compression of the panels subjected to dynamic loading along two main directions. The
conclusions from the study was that the distribution of the masonry infill walls throughout
the story has insignificant effect on seismic behavior of reinforced concrete buildings
provided that symmetric plan layout of a building and symmetric arrangement of the infill
walls are satisfied. The behavior of an infilled frame is dependent on the properties of
frame and infill; hence, the response of such frames should be based on overall frame to
infill composite action rather than on isolated bare frame
behavior. The collapse mechanisms of the three models of six stories clearly show that
the presence of the infills affect in negative way the ductility of the whole structure. The
presence of the infills reduces considerably the displacements at all stories compared with
the bare structure (246%). The fundamental period of infilled structures is in a good
agreement with the estimated value provided by RPA99 and EC8 (T=0.050H0.75).
Ahmed Sayed Ahmed Tawfik Essa, Mohamed Ragai Kotp Badr, Ashraf Hasan El-Zanaty
(2014) performed an experimental study for behavior and ductility of high strength
reinforced concrete frames with infill wall under the effect of cyclic loading. The
experimental program was conducted on four specimens (frames). The parameters are
studied change panel of frame from non-infill to infill, change thickness of infill wall and
change type of bricks. The dimension of frames is selected to represent half scale frames
and tested under cyclic loading. From the representation and the analysis of the obtained
results, the main conclusions are pointed out; the lateral load resistance for infilled frames
with infill wall (red bricks) thickness 12, 6 cm and cement bricks 12 cm, respectively was
greater than the bare frame by about 184%, 61% and 99%, respectively. The ductility

5
factor for infilled frames was less than the bare frame by about 57%, 51% and 46%,
respectively.
2.2 Modeling of infill walls in RC buildings P.G. Asteris (2008) in his paper Finite Element Micro-Modeling of infilled frames
presented a comprehensive review of modeling techniques of infill walls. The discussion
below is given from this paper.
To understand the approach and capabilities of each model it is convenient to classify the
models by macro- and micro- models. This classification is based on their complexity, the
details by which they model an infill wall, and the information they provide to the analyst
about the behavior of structure.
A basic characteristic of a macro- (or simplified) model is that they try to encompass the
overall (global) behavior of a structural element without modeling all the possible modes
of local failure. Micro- (or fundamental) models, on the other hand, model the behavior
of a structural element with great detail trying to encompass all the possible modes of
failure. The following sections constitute a brief review of the most representative macro-
and micro-models.
Fig: Masonry infill panels in framed structure

6
Fig: Change in the lateral load transfer mechanism owing to inclusion of masonry infill
walls
2.2.1 Macro-Modeling of infill walls Since the first attempts to model the response of the composite infilled frames structures,
experimental and conceptual observations have indicated that a diagonal strut with
appropriate geometrical and mechanical characteristics could possibly provide a solution
to the problem. In 1958, Polyakov (Polyakov 1960) suggested the possibility of considering
the effect of the infilling in each panel as equivalent to diagonal bracing and this
suggestion was later taken up by Holmes (Holmes 1961) who replaced the infill by an
equivalent pin-jointed diagonal strut made of the same material and having the same
thickness as the infill panel and a width equal to one third of the infill diagonal length
(Figure 1). The ‘one-third’ rule was suggested as being applicable irrespective of the
relative stiffnesses of the frame and the infill.
Stafford Smith (Smith 1966) and Stafford Smith and Carter (Smith and Carter 1969) related
the width of the equivalent diagonal strut to the infill/frame contact lengths using an
analytical equation which has been adapted from the equation of the length of contact of
a free beam on an elastic foundation subjected to a concentrated load (Hetenyi 1946).
Based on the frame/infill contact length, alternative proposals for the evaluation of the
equivalent strut width have been given by Mainstone (Mainstone 1971) and Kadir (Kadir
1974). Stafford Smith and Carter (Smith and Carter 1969), and Mainstone (Mainstone
1971) used the equivalent strut approach to simulate infill wall in steel frames and study
the behavior of infilled structures subjected to monotonic loading. They also developed
equations by which the properties of these struts, such as initial stiffness and ultimate
strength, were calculated. This approach proved to be the most popular over the years
because of the ease with which it can be applied.
In the last two decades it became clear that one single strut element is unable to model
the complex behavior of the infilled frames. As reported by many researchers (Reflak and
Faijfar 1991; Saneinejad and Hobbs 1995; Buonopane and White 1999), the bending
moments and shearing forces in the frame members cannot be replicated using a single

7
diagonal strut connecting the two loaded corners. More complex macro-models were
then proposed, but they were still usually based on a number of diagonal struts.
Chrysostomou (Chrysostomou 1991) had the objective of simulating the response of
infilled frames under earthquake loading by taking into account stiffness and strength
degradation of the infills. They proposed to model each infill panel by six compression-
only inclined struts. Three parallel struts are used in each diagonal direction and the
offdiagonal ones are positioned at critical locations along the frame members. At any
point during the analysis of the non-linear response only three of the six struts are active,
and the struts are switched to the opposite direction whenever their compressive force
reduces to zero. The advantage of this strut configuration over the single diagonal strut is
that it allows the modeling of the interaction between the infill and the surrounding
frame.
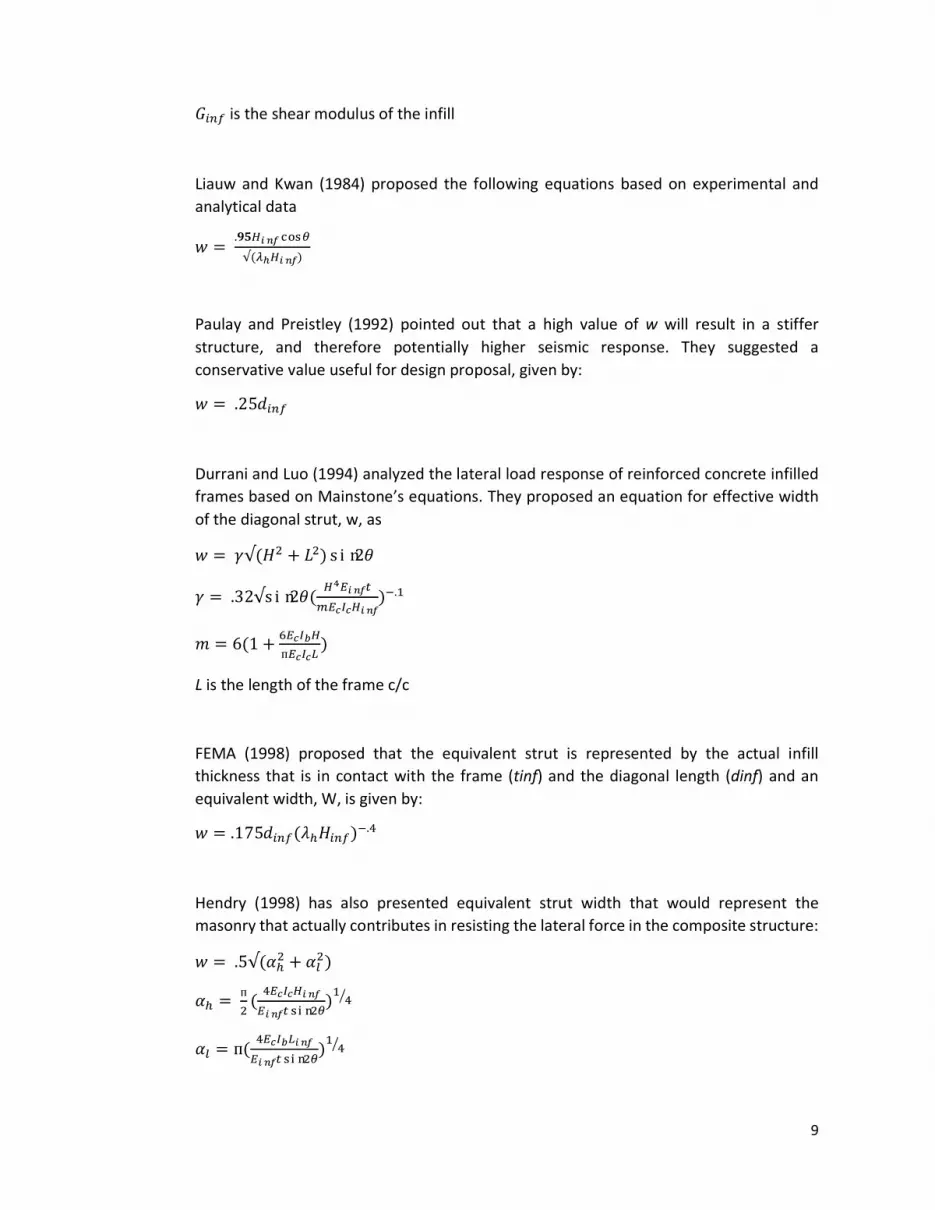
2.2.1.1 Determination of Equivalent Strut Width
Fig: Placement of Equivalent diagonal strut
K. H. Abdelkareem, F. K. Abdel Sayed, M. H. Ahmed, N. AL-Mekhlafy (2013) presented a
detail review of various researches to find out the width of the equivalent diagonal strut
(w) using a number of expressions.
Holmes (1961) states that the width of equivalent strut to be one third of the diagonal
length of infill, which resulted in the infill strength being independent of frame stiffness
� = �
����� Where ���� = diagonal length of infill
Later Stafford Smith and Carter (1969) proposed a theoretical relation for the width
of the diagonal strut based on the relative stiffness of infill and frame.

8
� = .58(�
�)�.���(�� ����).�������(�
�� ).���
�� = ∜(����������
���������)
t = thickness of the infill
���� = height the infill
���� = modulus of the infill
= the angle between diagonal of the infill and the horizontal
�� = modulus of elasticity of the column,
�� = the moment of inertia of the columns,
H = total frame height
�� is a dimensionless parameter (which takes into account the effect of relative stiffness
of the masonry panel to the frame).
Mainstone (1971) gave equivalent diagonal strut concept by performing tests on
model frames with brick infills. His approach estimates the infill contribution both to the
stiffness of the frame and to its ultimate strength.
� = .16����(�� ����)�.�
Mainstone and Weeks and Mainstone (1974), also based on experimental and
analytical data, proposed an empirical equation for the calculation of the equivalent strut
width:
� = .175����(������)�.�
Bazan and Meli (1980), on the basis of parametric finite-element studies for onebay,
one-story, infilled frames, produced an empirical expression to calculate the
equivalent width w for infilled frame:
� = (.35 + .22�)ℎ
� = ����
��������
� is a dimensionless parameter
Ac is the gross area of the column
����= (���� t) is the area of the infill panel in the horizontal plane and
9
���� is the shear modulus of the infill
Liauw and Kwan (1984) proposed the following equations based on experimental and
analytical data
� = .������ ����
√(�� ����)
Paulay and Preistley (1992) pointed out that a high value of w will result in a stiffer
structure, and therefore potentially higher seismic response. They suggested a
conservative value useful for design proposal, given by:
� = .25����
Durrani and Luo (1994) analyzed the lateral load response of reinforced concrete infilled
frames based on Mainstone’s equations. They proposed an equation for effective width
of the diagonal strut, w, as
� = �√(� � + ��)sin2�
� = .32√sin2�(�������
���������)�.�
� = 6(1 +������
����)
L is the length of the frame c/c
FEMA (1998) proposed that the equivalent strut is represented by the actual infill
thickness that is in contact with the frame (tinf) and the diagonal length (dinf) and an
equivalent width, W, is given by:
� = .175����(������)�.�
Hendry (1998) has also presented equivalent strut width that would represent the
masonry that actually contributes in resisting the lateral force in the composite structure:
� = .5√(��� + ��
�)
�� = п
�(
���������
����������)
���
�� = п(���������
����������)
���

10
�� , �� are contact length between wall and column and beam respectively at the time
of initial failure of wall
�� is the moment of inertia of the beam
���� is the length of the infill (clear distance between columns)
Al-Chaar 2002 proposed that the equivalent masonry strut is to be connected to the frame
members as depicted in Figure 5. The infill forces are assumed to be mainly resisted by
the columns, and the struts are placed accordingly. The strut should be pin-connected to
the column at a distance lcolumn from the face of the beam. This distance is defined by the
following equations
������� = �
����������
tan������� = �����
�
��� �������
����
Where the strut width (w) is calculated by using Mainstone and Weeks Equation without
any reduction factors:
� = .175����(������)�.�
Papia et al. 2008 developed an empirical equation for the effective width of the diagonal
strut as
� = �
�
�
�∗����
� = .249 − .016���� + .567υ����
� = .146 + .0073���� + .126υ����
�∗ = ���������
����(
�����
����� +
������
�������)
Z = 1 if ����
����= 1
Z = 1.125 if ����
����≥ 1.5
Where
Z is an empirical constant
λ* = stiffness parameter
υinf = poison ratio for the infill
Ec = Young’s modulus of the frame

11
Ac = cross sectional area of the column and
Ab = cross sectional area of the beam
2.2.2 Micro-Modeling of infill walls All models described in this section are based on the Finite Element Method, using three
different kinds of elements to represent the behavior of infilled frames subjected to lateral
loading. According to these models the frame is constituted by plane or beam element,
the infill by plane elements, and the interface behavior by interface elements or by one
dimensional joint elements.
Mallick and Severn (Mallick and Severn 1967), and Mallick and Garg (Mallick and Garg
1971) suggested the first finite element approach to analyze infilled frames, addressing
the problem of an appropriate representation of the interface conditions between frame
and infill. The infill panels were simulated by means of linear elastic rectangular finite
elements, with two degrees of freedom at each four nodes, and the frame was simulated
by beam element ignoring axial deformation. This was a consequence of the assumption
that the interaction forces between the frame and the infill along their interface consisted
only of normal forces. In this model, the slip between the frame and the infill was also
taken in account, considering frictional shear forces in the contact regions. Several single
story rectangular infilled frames under static loading were analyzed and the results were
in a good agreement with experimental results if the height to span ratio was not greater
than two.
Liauw and Kwan (Liauw and Kwan 1984) used three different types of elements to study
the behavior of infilled frames subjected to monotonic loading. The infill-frame interface
was modeled by simple bar type elements capable of simulating both separation and slip.
The infill panel was modeled by triangular plane stress elements. In tension, the material
was idealized as a linear elastic brittle material. Before cracking, the material was assumed
to be isotropic and after cracking was assumed to become anisotropic due to the presence
of the crack. It was assumed that for an open crack the Young’s modulus perpendicular to
the crack and the shear modulus parallel to the crack were zero. When the crack was
closed, the Young’s modulus was restored, and the shear force is assumed to be taken
over by friction. In compression, the panel was assumed to exhibit extensive nonlinearity
in the stress-strain relationship. Although the material was subjected to bi-axial stress, it
was assumed that the panel was under uniaxial stress based on experimental results,
which show that one of the principal stresses is much smaller than the other. Using an
iterative procedure with incremental displacement, several four-story one-bay model
frames infilled with micro-concrete were analyzed. Close agreement between
experimental and analytical results has been observed.
Dhanasekar and Page (Dhanasekar and Page 1986), using one-dimensional joint elements
to model the mortar joint between the infill and the frame, have shown that the behavior
of the composite frame not only depends on the relative stiffness of the frame and the
infill and the frame geometry, but is also critically influenced by the strength properties

12
of the masonry (in particular, the magnitude of the shear and tensile bond strengths
relative to the compressive strength).
A simpler and much quicker finite element technique (Axley and Bertero 1979) consist in
reducing by condensation, the stiffness of the infill to the boundary degrees of freedom.
It is assumed that the frame constrains the form (but not the degree) of deformation on
the infill. Separate stiffnesses are formed. A constraint relation is assumed between the
12 frame degrees of freedom (DOF) and the boundary degrees of freedom. Thus, a
congruent transformation of the separate systems to a composite approximate frame-
infill system (with only 12 DOF) is possible.
2.3 Concept of soft story in buildings L. Teresa Guevara-Perez (2012) analyzed the architectural reasons why ‘soft story’ and
‘weak story’ configurations are present in contemporary cities and explains in conceptual
terms their detrimental effects on building seismic response. The soft story irregularity,
refers to the existence of a building floor that presents a significantly lower stiffness than
the others, hence it is also called: flexible story. It is commonly generate unconscientiously
due to the elimination or reduction in number of rigid non-structural walls in one of the
floors of a building, or for not considering on the structural design and analysis, the
restriction to free deformation that enforces on the rest of the floors, the attachment of
rigid elements to structural components that were not originally taken into consideration.
Because of the effects produced by nonstructural components on the seismic
performance of the building, the term non-intentionally nonstructural has been assigned
to these components since the end of the 1980’s (Guevara, 1989). Table 12.3-2 in the
ASCE/SEI 7-10 document, (p. 83) defines soft story as irregularity type 1. If the soft story
effect is not foreseen on the structural design, irreversible damage will generally be
present on both the structural and nonstructural components of that floor. This may cause
the local collapse and in some cases even the total collapse of the building.
Concerning soft story, the National Information Service for Earthquake Engineering (2000)
states:
In shaking a building, an earthquake ground motion will search for every structural
weakness. This weaknesses are usually created by sharp changes in stiffness, strength
and/or ductility, and the effects of these weaknesses are accentuated by poor distribution
of reactive masses. Severe structural damage suffered by several modern building during
recent earthquakes illustrates the importance of avoiding sudden changes in lateral
stiffness and strength. A typical example of the detrimental effects that these
discontinuities can induce is seen in the case of buildings with a “soft story”. Inspections
of earthquake damage as well as the results of analytical studies have shown that
structural systems with a soft story can lead to serious problems during earthquake
ground shaking. [Numerous examples] illustrate such damage and therefore emphasize
the need for avoiding soft story by an even distribution of flexibility, strength and mass.

13
2.3.1 Definition of soft story in different codes
1. ASCE 07 – Minimum Design Loads for Buildings and other Structures, USA
(2002): soft story is one in which the lateral stiffness is less than 70% of that in
the story above or less than 80% of the average stiffness of the three story
above. An extreme soft story is one in which lateral stiffness is less than 60%
of that in the story above or less than 70% of the average stiffness of the three
story above. For example, building on stilts will fall under this category.
2. Specifications for Structures to be built in Disaster Area, Turkey (1998): the
case where stiffness irregularity factor in each of the two orthogonal
earthquake directions is greater than 1.5 is considered as soft story.
Stiffness irregularity factor is defined as ratio of the average story drift at any
story to average story drift at the story immediate above.
Ƞki = (∆i) / (∆i+1)
Story drift ∆I of any column or structural wall shall be determined by
∆i = di – di-1
Where di and di-1 represents the displacement obtained from the analysis at
the end of any column or structural wall at stories i and i-1.
3. Indonesian Earthquake Design Code, Indonesia (1983): the ratio of floor mass
to the stiffness of a particular story shall not differ by more than 50% of the
average for the structure.
4. Criteria for Earthquake Design of Structures, India (IS 1893:2002): soft story
when stiffness
�� < .7��� � Or
�� < .8{(��� �� ��� �� ��� �)
�}
5. General Structural Design and Design Loading for Buildings, New Zealand (NZS
4203:1992): a story where the ratio of the interstory deflection divided by the
product of the story shear and story height exceeds 1.4 times the
corresponding ratio for the story immediately above this level.
6. Bangladesh National Building Code, Bangladesh (BNBC 1993): soft story is one
in which the lateral stiffness is less than 70% of that in the story above or less
than 80% of the average stiffness of the three story above.

14
2.4 Interstory drift of frames Gary R. Searer and Sigmund A. Freeman (2004) presented a brief history of design drift
requirements, technical background for the requirements, and the reasoning behind the
changes, starting with the 1961 Uniform Building Code (UBC) through present day.
Emphasis was given to the discussion of minimum base shears for calculation of drift for
long-period structures.
Lateral deflection is the predicted movement of a structure under lateral loads; and story
drift is defined as the difference in lateral deflection between two adjacent stories. During
an earthquake, large lateral forces can be imposed on structures; both the 1997 UBC (the
basis of the 2001 California Building Code) and ASCE 7-02 (which is based on NEHRP)
require that the designer assess the effects of this deformation on both structural and
nonstructural elements. Lateral deflection and drift have three primary effects on a
structure; the movement can affect the structural elements (such as beams and columns);
the movements can affect non-structural elements (such as the windows and cladding);
and the movements can affect adjacent structures. Without proper consideration during
the design process, large deflections and drifts can have adverse effects on structural
elements, nonstructural elements, and adjacent structures.
2.4.1 Code provisions for interstory drift 1. Algeria: RPA (1989)
∆�= �� − ���� With �� = 0
�� = lateral displacement
∆≤ .0075����� ℎ���ℎ�
∆ = �����
2. Argentina: INPRES-CIRSOC 103 (1991)
� = Lateral displacement
∆�= �� − ���� With δ0 = 0
Limiting values
Group Non-structural elements attached are damaged
Non-structural elements attached are not
damaged
A0 .01 .01
A .011 .015
B .014 .019
3. Australia: AS11704 (1993)
δx – interstory drift = �� ���
��� – Lateral displacements at level i
= ��(�2п� )2
=(���
���� )(�
2п� )2

15
4. Europe: 1-1(Oct94); 1-2(Oct 94); 1-3(Feb95); part 2(Dec94); part 5(Oct t94); Euro
code 8
For buildings with non-structural elements ��
���≤ .004ℎ
When structural deformation is restricted ��
���≤ .006ℎ
��� = design resistance
5. India and Pakistan: IS1893 (1984) and PKS 395-Rev (1986)
∆max between two floors ≤.004hi
For height ≤ 40m (India)
6. Iran: ICRD (1988)
Lateral drift ∆ ≤ .005hi
Both lateral forces and torsional moments are coupled
7. Israel: IC-413 (1994)
For T ≤.7s ∆i lim = min ( ��
���,
��
��� )
T > .7s ∆i lim = min ( .����
���,
��
��� )
8. Japan: BLEO (1981)
∆ ≤ ��
��� or ∆ =
��
��� for non-structural elements for building not exceeding 60m height
∆ ≤ ��
��� for steel building ≤ 31m
9. Mexico: UNAM (1983) M III (1988)
∆ ≤ .006ℎ� (main structural elements)
∆ ≤ .012 (for partition)
10. USA: UBC-91 (1991) and SEAOC (1990)
For T <.7s ∆ ≤ .005hi
T ≥ .7s ∆ ≤ .004hi
In UBC 1997 it is stated that Story drifts shall be computed using the Maximum Inelastic
Response Displacement, ∆M. and calculated story drift using M shall not exceed 0.025
times the story height for structures having a fundamental period of less than 0.7 second.
For structures having a fundamental period of 0.7 second or greater, the calculated story
drift shall not exceed 0.020 times the story height with provision for exceptions.

16
CHAPTER THREE
METHODOLOGY
3.1 Nonlinear dynamic analysis Nonlinear dynamic analysis utilizes the combination of ground motion records with a
detailed structural model, therefore is capable of producing results with relatively low
uncertainty. In nonlinear dynamic analyses, the detailed structural model subjected to a
ground-motion record produces estimates of component deformations for each degree
of freedom in the model and the modal responses are combined using schemes such as
the square-root-sum-of-squares.
In non-linear dynamic analysis, the non-linear properties of the structure are considered as part of a time-domain analysis. This approach is the most rigorous, and is required by some building codes for buildings of unusual configuration or of special importance. However, the calculated response can be very sensitive to the characteristics of the individual ground motion used as seismic input; therefore, several analyses are required using different ground motion records to achieve a reliable estimation of the probabilistic distribution of structural response. Since the properties of the seismic response depend on the intensity, or severity, of the seismic shaking, a comprehensive assessment calls for numerous nonlinear dynamic analyses at various levels of intensity to represent different possible earthquake scenarios. This has led to the emergence of methods like the Incremental Dynamic Analysis.
3.2 Modal analysis A modal analysis calculates the frequency modes or natural frequencies of a given system,
but not necessarily its full-time history response to a given input. The natural frequency
of a system is dependent only on the stiffness of the structure and the mass which
participates with the structure (including self-weight). It is not dependent on the load
function.
It is useful to know the modal frequencies of a structure as it allows you to ensure that the frequency of any applied periodic loading will not coincide with a modal frequency and hence cause resonance, which leads to large oscillations.
The method is:
1. Find the natural modes (the shape adopted by a structure) and natural frequencies
2. Calculate the response of each mode 3. Optionally superpose the response of each mode to find the full modal response
to a given loading

17
Modal analysis, or the mode-superposition method, is a linear dynamic response procedure which evaluates and superimposes free-vibration mode shapes to characterize displacement patterns. Mode shapes describe the configurations into which a structure will naturally displace. Typically, lateral displacement patterns are of primary concern. Mode shapes of low-order mathematical expression tend to provide the greatest contribution to structural response. As orders increase, mode shapes contribute less, and are predicted less reliably. It is reasonable to truncate analysis when the number of mode shapes is sufficient.
A structure with N degrees of freedom will have N corresponding mode shapes. Each mode shape is an independent and normalized displacement pattern which may be amplified and superimposed to create a resultant displacement pattern, as shown in Figure below
Fig: resultant displacements and modal components
3.3 Time history analysis Time-history analysis provides for linear or nonlinear evaluation of dynamic structural
response under loading which may vary according to the specified time function. Dynamic
equilibrium equations, given by K u (t) + C d/dt u (t) + M d2/dt u (t) = r (t), are solved using
either modal or direct-integration methods. Initial conditions may be set by continuing
the structural state from the end of the previous analysis.
A full time history will give the response of a structure over time during and after the application of a load. To find the full time history of a structure's response, one must solve the structure's equation of motion.

18
Example
A simple single degree of freedom (a mass, M, on a spring of stiffness, k for example) has the following equation of motion:
Where is the acceleration (the double derivative of the displacement) and x is the displacement.
If the loading F (t) is a Heaviside step function (the sudden application of a constant load), the solution to the equation of motion is:
Where
and the fundamental natural frequency
.
The static deflection of a single degree of freedom system is:
so one can write, by combining the above formulae:
This gives the (theoretical) time history of the structure due to a load F (t), where the false assumption is made that there is no damping.

19
Although this is too simplistic to apply to a real structure, the Heaviside Step Function is a reasonable model for the application of many real loads, such as the sudden addition of a piece of furniture, or the removal of a prop to a newly cast concrete floor. However, in reality loads are never applied instantaneously - they build up over a period of time (this may be very short indeed). This time is called the rise time.
As the number of degrees of freedom of a structure increases it very quickly becomes too difficult to calculate the time history manually - real structures are analyzed using nonlinear finite element software.
Damping
Any real structure will dissipate energy (mainly through friction). This can be modelled by modifying the Dynamic Amplification Factor (DAF)
Where
3.4 Building configuration
Simple beam-column frames are analyzed. There are three types of frames.
Bare frame: no equivalent struts are provided at any story level of this type of
frame
Soft story frame: frames; at bottom story of which no equivalent struts are
provided, falls into this category
Infilled frame: equivalent struts are provided at all story levels of this type of
frame
Each type of frames are considered for total four story levels, namely, 6, 9, 12, 15 story
Details of the frames are given below
Story Column
(inch X inch) Beam
(inch X inch)
Column to column spacing
(ft)
Story height (ft)
Support condition at ground
level
6 9
12 15
12*12 15*15 18*18 21*21
12*20 20 10 fixed

20
Fig: 9 story building bare frame
Fig: 9 story building soft story frame

21
Fig: 9 story building infilled frame
Fig: extruded view of 6 story infilled frame

22
3.5 Material properties
3.5.1 Concrete and steel
Concrete
Weight = 150 lb/ft3
Modulus of elasticity Ec = 3600 ksi
Steel
Minimum yield stress Fy = 50 ksi
Minimum tensile strength Fu = 65ksi
Modulus of elasticity Es = 29000ksi
3.5.2 Mortar Specified compressive strength of Masonry ��
�
From BNBC 1993 part 6 chapter 4 section 4.3.2
Grade of Mortar
Mix proportion by volume Minimum compressive
strength at 28 days N/mm2
Cement Sand
M1
M2
M3
M4
M5
M6
1
3 4 5 6 7 8
10 7.5 5 3 2 1
In this case mortar compressive strength value 2.5 and 7.5 N/mm2 is used
3.5.3 Masonry Weight of masonry work
From BNBC 1993 part 6 chapter 2 table 6.2.2
Weight of brick masonry work excluding plaster
burnt clay, per 100 mm thickness 1.910 kN/m2
Modulus of elasticity for masonry
From BNBC 1993 1993 part 6 chapter 4 section 4.3.8
�� = 750��� ≤ 15000 N/mm2

23
Used value:
1. 750*2.5 = 1875 N/mm2
2. 750*7.5 = 5625 N/mm2
Allowable compressive stress, axial in masonry
From BNBC 1993 part 6 chapter 4 section 4.3.5
�� = ��
�
��1 − (
��
���)��
There is also relationship found experimentally between compressive strength of mortar
and masonry for a given strength brick units. This relationship is illustrated below:
Fig: Relationship between brick crushing strength and brickwork strength for various
mortar strength. Based on test results. (Design of masonry structures, A.W.Hendry,
B.P.Sinha, S.R.Davies)
Axial compressive strength in masonry unit
Using a brick compressive strength of 30 N/mm2
Compressive strength of Mortar N/mm2
BNBC 1993 N/mm2
From Chart N/mm2
2.5 7.5
.446 1.338
9 13
Values of axial compressive strength obtained using formula provided in BNBC 1993 are
used

24
3.6 Properties of equivalent diagonal strut
The relative infill-to-frame stiffness was calculated using the equation given by Stafford,
Smith and Carter (1969)
�� = ∜(����������
���������)
t = thickness of the infill
���� = height the infill
���� = modulus of the infill
= the angle between diagonal of the infill and the horizontal
�� = modulus of elasticity of the column,
�� = the moment of inertia of the columns,
H = total frame height
Using this expression the width of strut is determined using the expression given by
Mainstone (1971) which considers the relative infill-to-frame flexibility
� = .175����(������)�.�
For each type of frame (varying column size) and two modulus of elasticity of masonry Em
width of equivalent struts were calculated as given below:
Story Colum size
(inch X inch)
Width of strut (mm)
Em = 1875 N/mm2 Em = 5625 N/mm2
6 9
12 15
12*12 15*15 18*18 21*21
769.204 841.018 904.645 962.181
689.102 753.364 810.514 862.076
Compression limit of struts:
Axial strength is calculated using the formula given in BNBC 1993 for masonry work for
two types of mortar strength fm as given below:
Story Compression limit
(kN)
fm = .446 N/mm2 fm = 1.338 N/mm2
6 9
12 15
43.564 47.637
51.2339 54.5022
117.096 128.016 137.727 147.489

25
Tension limit of struts:
Tensile strength of the struts is taken as zero.
Release:
At two end of the struts releases are provided for moment about major axis (M3 release)
Weight of struts:
Struts are modeled as weightless members; their weights are considered in partition wall
load.
3.7 Loads on building
Self-weight of slab = �.�
���150 psf = 68.75
Partition wall = 80 psf
Floor finish = 30 psf
Seismic mass = 178.75 psf (excluding live load)
Seismic mass lumped at floor level (for an interior frame)
= 178.75 psf x (20 ft x 60 ft)
= 214500 lb
Uniformly distributed load at each story level = 52.173 kN/m (3.575 kip/ft)
Uniformly distributed load at roof level = 29.188 kN/m (2 kip/ft)
5% damping (typical for building) is used
Ground motion applied:
Frequencies considered: .25, .5, .75, 1, 1.25, 1.5, 1.75, 2, 2.25, 2.5, 2.75, 3 Hz
Peak Ground acceleration (PGA) considered: 1, 2, 3 m/s2
Earthquake strong motion duration: 5s
For PGA 1 m/s2 earthquake input signals are shown below:

26
Fig: Earthquake ground motion with frequency = .25Hz
Fig: Earthquake ground motion with frequency = .5Hz
Fig: Earthquake ground motion with frequency = .75Hz
Fig: Earthquake ground motion with frequency = 1Hz

27
Fig: Earthquake ground motion with frequency = 1.25Hz
Fig: Earthquake ground motion with frequency = 1.5Hz
Fig: Earthquake ground motion with frequency = 1.75Hz
Fig: Earthquake ground motion with frequency = 2Hz

28
Fig: Earthquake ground motion with frequency = 2.25Hz
Fig: Earthquake ground motion with frequency = 2.5Hz
Fig: Earthquake ground motion with frequency = 2.75Hz
Fig: Earthquake ground motion with frequency = 3Hz

29
CHAPTER FOUR
RESULTS AND DISCUSSIONS
4.1 Natural Frequency of models compared with BNBC 1993 and BNBC 2010
Natural frequency of the models are found out using modal analysis in ETABS 2013.
Infilled frames are found to have the natural frequencies closest to the values of
frequencies found using formula provided in BNBC 1993 and 2010.
Fig: Natural frequency vs. number of story for frames with infill Em = 1875 N/mm2
0
0.2
0.4
0.6
0.8
1
1.2
1.4
1.6
1.8
5 6 7 8 9 10 11 12 13 14 15 16
nat
ura
l fre
qu
ency
story no
bare frame
soft storey
infilled
BNBC1993
BNBC2010

30
Fig: Natural frequency vs. number of story for frames with infill Em = 5625 N/mm2
4.2 Comparison of natural frequency due to change in infill
Fig: natural frequency for different story frames with compared with BNBC
0
0.2
0.4
0.6
0.8
1
1.2
1.4
1.6
1.8
5 6 7 8 9 10 11 12 13 14 15 16
nat
ura
l fre
qu
ency
story no
bare frame
soft storey
infilled
BNBC1993
BNBC2010
0
0.2
0.4
0.6
0.8
1
1.2
1.4
1.6
1.8
6 9 12 15
nat
ura
l fre
qu
ency
(H
z)
story no
soft story frame
infill moe 1875 N/mm^2 infill moe 5625 N/mm^2 BNBC 1993 BNBC2010

31
Fig: natural frequency for different story frames with compared with BNBC
0
0.2
0.4
0.6
0.8
1
1.2
1.4
1.6
1.8
6 9 12 15
infilled frame
infill moe 1875 N/mm^2 infill moe 5625 N/mm^2 BNBC 1993 BNBC2010

32
4.3 Maximum interstory drift ratio at different story levels
Interstory drift ratios at every story is found after time history analysis. Then maximum
interstory drift ratio at each story level in the 5 second time history is also found out for
every ground motion. Story levels are then plotted against this ratios.
It can be observed that at higher frequency level the shapes of the curves become highly
irregular. But at lower frequency levels (up to 1Hz) the drift ratio at one story are smaller
than the drift ratio at the underlying stories.
For soft story frames, the soft story effect can be easily observed in the graphs.
In the following graphs drift ratios are shown for peak ground acceleration (PGA) 1 m/s2
only. The drift ratios corresponding to PGA 2 and 3 1 m/s2 can be found by simply
multiplying these drift ratios by 2 and 3 respectively.
Six story buildings:
Fig: maximum interstory drift ratio at different levels; for frames with infill Em = 1875
N/mm2 (left) and 5625 N/mm2 (right) at Freq.25Hz PGA 1m/s2
0
1
2
3
4
5
6
7
0 0.005 0.01 0.015
sto
ry le
vel
drift ratio
bare frame soft story frame
infilled frame
0
1
2
3
4
5
6
7
0 0.005 0.01 0.015
sto
ry le
vel
drift ratio
bare frame soft story frame
infilled frame

33
Fig: maximum interstory drift ratio at different levels; for frames with infill Em = 1875
N/mm2 (left) and 5625 N/mm2 (right) at Freq.5Hz PGA 1m/s2
Fig: maximum interstory drift ratio at different levels; for frames with infill Em = 1875
N/mm2 (left) and 5625 N/mm2 (right) at Freq.75Hz PGA 1m/s2
0
1
2
3
4
5
6
7
0 0.01 0.02 0.03 0.04 0.05
sto
ry le
vel
drift ratio
bare frame soft story frame
infilled frame
0
1
2
3
4
5
6
7
0 0.01 0.02 0.03 0.04 0.05
sto
ry le
vel
drift ratio
bare frame soft story frame
infilled frame
0
1
2
3
4
5
6
7
0 0.01 0.02 0.03 0.04 0.05
sto
ry le
vel
drift ratio
bare frame soft story frame
infilled frame
0
1
2
3
4
5
6
7
0 0.01 0.02 0.03 0.04
sto
ry le
vel
drift ratio
bare frame soft story frame
infilled frame

34
Fig: maximum interstory drift ratio at different levels; for frames with infill Em = 1875
N/mm2 (left) and 5625 N/mm2 (right) at Freq1Hz PGA 1m/s2
Fig: maximum interstory drift ratio at different levels; for frames with infill Em = 1875
N/mm2 (left) and 5625 N/mm2 (right) at Freq1.25Hz PGA 1m/s2
0
1
2
3
4
5
6
7
0 0.01 0.02 0.03
sto
ry le
vel
drift ratio
bare frame soft story frame
infilled frame
0
1
2
3
4
5
6
7
0 0.01 0.02 0.03 0.04 0.05
sto
ry le
vel
drift ratio
bare frame soft story frame
infilled frame
0
1
2
3
4
5
6
7
0 0.005 0.01 0.015
sto
ry le
vel
drift ratio
bare frame soft story frame
infilled frame
0
1
2
3
4
5
6
7
0 0.005 0.01 0.015 0.02
sto
ry le
vel
drift ratio
bare frame soft story frame
infilled frame

35
Fig: maximum interstory drift ratio at different levels; for frames with infill Em = 1875
N/mm2 (left) and 5625 N/mm2 (right) at Freq1.5Hz PGA 1m/s2
Fig: maximum interstory drift ratio at different levels; for frames with infill Em = 1875
N/mm2 (left) and 5625 N/mm2 (right) at Freq1.75Hz PGA 1m/s2
0
1
2
3
4
5
6
7
0 0.005 0.01
sto
ry le
vel
drift ratio
bare frame soft story frame
infilled frame
0
1
2
3
4
5
6
7
0 0.005 0.01 0.015
sto
ry le
vel
drift ratio
bare frame soft story frame
infilled frame
0
1
2
3
4
5
6
7
0 0.002 0.004 0.006 0.008
sto
ry le
vel
drift ratio
bare frame soft story frame
infilled frame
0
1
2
3
4
5
6
7
0 0.002 0.004 0.006 0.008
sto
ry le
vel
drift ratio
bare frame soft story frame
infilled frame

36
Fig: maximum interstory drift ratio at different levels; for frames with infill Em = 1875
N/mm2 (left) and 5625 N/mm2 (right) at Freq2Hz PGA 1m/s2
Fig: maximum interstory drift ratio at different levels; for frames with infill Em = 1875
N/mm2 (left) and 5625 N/mm2 (right) at Freq2.25Hz PGA 1m/s2
0
1
2
3
4
5
6
7
0 0.002 0.004 0.006
sto
ry le
vel
drift ratio
bare frame soft story frame
infilled frame
0
1
2
3
4
5
6
7
0 0.001 0.002 0.003 0.004 0.005
sto
ry le
vel
drift ratio
bare frame soft story frame
infilled frame
0
1
2
3
4
5
6
7
0 0.001 0.002 0.003 0.004
sto
ry le
vel
drift ratio
bare frame soft story frame
infilled frame
0
1
2
3
4
5
6
7
0 0.001 0.002 0.003 0.004
sto
ry le
vel
drift ratio
bare frame soft story frame
infilled frame

37
Fig: maximum interstory drift ratio at different levels; for frames with infill Em = 1875
N/mm2 (left) and 5625 N/mm2 (right) at Freq2.5Hz PGA 1m/s2
Fig: maximum interstory drift ratio at different levels; for frames with infill Em = 1875
N/mm2 (left) and 5625 N/mm2 (right) at Freq2.75Hz PGA 1m/s2
0
1
2
3
4
5
6
7
0 0.001 0.002 0.003 0.004
sto
ry le
vel
drift ratio
bare frame soft story frame
infilled frame
0
1
2
3
4
5
6
7
0 0.001 0.002 0.003 0.004
sto
ry le
vel
drift ratio
bare frame soft story frame
infilled frame
0
1
2
3
4
5
6
7
0 0.002 0.004 0.006
sto
ry le
vel
drift ratio
bare frame soft story frame
infilled frame
0
1
2
3
4
5
6
7
0 0.001 0.002 0.003 0.004 0.005
sto
ry le
vel
drift ratio
bare frame soft story frame
infilled frame

38
Fig: maximum interstory drift ratio at different levels; for frames with infill Em = 1875
N/mm2 (left) and 5625 N/mm2 (right) at Freq3Hz PGA 1m/s2
Nine story buildings:
Fig: maximum interstory drift ratio at different levels; for frames with infill moe 1875
N/mm2 (left) and 5625 N/mm2 (right) at Freq.25Hz PGA 1m/s2
0
1
2
3
4
5
6
7
0 0.001 0.002 0.003 0.004
sto
ry le
vel
drift ratio
bare frame soft story frame
infilled frame
0
1
2
3
4
5
6
7
0 0.001 0.002 0.003
sto
ry le
vel
drift ratio
bare frame soft story frame
infilled frame
0
1
2
3
4
5
6
7
8
9
10
0 0.005 0.01 0.015 0.02
sto
ry le
vel
drift ratio
bare frame soft story frame
infilled frame
0
1
2
3
4
5
6
7
8
9
10
0 0.005 0.01 0.015 0.02
sto
ry le
vel
drift ratio
bare frame soft story frame
infilled frame

39
Fig: maximum interstory drift ratio at different levels; for frames with infill Em = 1875
N/mm2 (left) and 5625 N/mm2 (right) at Freq.5Hz PGA 1m/s2
Fig: maximum interstory drift ratio at different levels; for frames with infill moe 1875
N/mm2 (left) and 5625 N/mm2 (right) at Freq.75Hz PGA 1m/s2
0
1
2
3
4
5
6
7
8
9
10
0 0.01 0.02 0.03 0.04
sto
ry le
vel
drift ratio
bare frame soft story frame
infilled frame
0
1
2
3
4
5
6
7
8
9
10
0 0.01 0.02 0.03 0.04
sto
ry le
vel
drift ratio
bare frame soft story frame
infilled frame
0
1
2
3
4
5
6
7
8
9
10
0 0.01 0.02 0.03 0.04
sto
ry le
vel
drift ratio
bare frame soft story frame
infilled frame
0
1
2
3
4
5
6
7
8
9
10
0 0.01 0.02 0.03
sto
ry le
vel
drift ratio
bare frame soft story frame
infilled frame

40
Fig: maximum interstory drift ratio at different levels; for frames with infill Em = 1875
N/mm2 (left) and 5625 N/mm2 (right) at Freq1Hz PGA 1m/s2
Fig: maximum interstory drift ratio at different levels; for frames with infill Em = 1875
N/mm2 (left) and 5625 N/mm2 (right) at Freq1.25Hz PGA 1m/s2
0
1
2
3
4
5
6
7
8
9
10
0 0.005 0.01 0.015
sto
ry le
vel
drift ratio
bare frame soft story frame
infilled frame
0
1
2
3
4
5
6
7
8
9
10
0 0.01 0.02 0.03
sto
ry le
vel
drift ratio
bare frame soft story frame
infilled frame
0
1
2
3
4
5
6
7
8
9
10
0 0.002 0.004 0.006 0.008
sto
ry le
vel
drift ratio
bare frame soft story frame
infilled frame
0
1
2
3
4
5
6
7
8
9
10
0 0.005 0.01 0.015
sto
ry le
vel
drift ratio
bare frame soft story frame
infilled frame

41
Fig: maximum interstory drift ratio at different levels; for frames with infill Em = 1875
N/mm2 (left) and 5625 N/mm2 (right) at Freq1.5Hz PGA 1m/s2
Fig: maximum interstory drift ratio at different levels; for frames with infill Em = 1875
N/mm2 (left) and 5625 N/mm2 (right) at Freq1.75Hz PGA 1m/s2
0
1
2
3
4
5
6
7
8
9
10
0 0.002 0.004 0.006 0.008
sto
ry le
vel
drift ratio
bare frame soft story frame
infilled frame
0
1
2
3
4
5
6
7
8
9
10
0 0.002 0.004 0.006 0.008
sto
ry le
vel
drift ratio
bare frame soft story frame
infilled frame
0
1
2
3
4
5
6
7
8
9
10
0 0.001 0.002 0.003 0.004
sto
ry le
vel
drift ratio
bare frame soft story frame
infilled frame
0
1
2
3
4
5
6
7
8
9
10
0 0.001 0.002 0.003 0.004
sto
ry le
vel
drift ratio
bare frame soft story frame
infillde frame

42
Fig: maximum interstory drift ratio at different levels; for frames with infill Em = 1875
N/mm2 (left) and 5625 N/mm2 (right) at Freq2Hz PGA 1m/s2
Fig: maximum interstory drift ratio at different levels; for frames with infill Em = 1875
N/mm2 (left) and 5625 N/mm2 (right) at Freq2.25Hz PGA 1m/s2
0
1
2
3
4
5
6
7
8
9
10
0 0.001 0.002 0.003 0.004
sto
ry le
vel
drift ratio
bare frame soft story frame
infilled frame
0
1
2
3
4
5
6
7
8
9
10
0 0.001 0.002 0.003 0.004
sto
ry le
vel
drift ratio
bare frame soft story frame
infilled frame
0
1
2
3
4
5
6
7
8
9
10
0 0.001 0.002 0.003 0.004 0.005
sto
ry le
vel
drift ratio
bare frame soft story frame
infilled frame
0
1
2
3
4
5
6
7
8
9
10
0 0.001 0.002 0.003 0.004
sto
ry le
vel
drift ratio
bare frame soft story frame
infilled frame

43
Fig: maximum interstory drift ratio at different levels; for frames with infill Em = 1875
N/mm2 (left) and 5625 N/mm2 (right) at Freq2.5Hz PGA 1m/s2
Fig: maximum interstory drift ratio at different levels; for frames with infill Em = 1875
N/mm2 (left) and 5625 N/mm2 (right) at Freq2.75Hz PGA 1m/s2
0
1
2
3
4
5
6
7
8
9
10
0 0.001 0.002 0.003 0.004
sto
ry le
vel
drift ratio
bare frame soft story frame
infilled frame
0
1
2
3
4
5
6
7
8
9
10
0 0.001 0.002 0.003 0.004
sto
ry le
vel
drift ratio
bare frame soft story frame
infilled frame
0
1
2
3
4
5
6
7
8
9
10
0 0.0005 0.001 0.0015 0.002 0.0025
sto
ry le
vel
drift ratio
bare frame soft story frame
infilled frame
0
1
2
3
4
5
6
7
8
9
10
0 0.001 0.002 0.003 0.004
sto
ry le
vel
drift ratio
bare frame soft story frame
infilled frame

44
Fig: maximum interstory drift ratio at different levels; for frames with infill Em = 1875
N/mm2 (left) and 5625 N/mm2 (right) at Freq3Hz PGA 1m/s2
Twelve story buildings:
Fig: maximum interstory drift ratio at different levels; for frames with infill Em = 1875
N/mm2 (left) and 5625 N/mm2 (right) at Freq.25Hz PGA 1m/s2
0
1
2
3
4
5
6
7
8
9
10
0 0.0005 0.001 0.0015 0.002
sto
ry le
vel
drift ratio
bare frame soft story frame
infilled frame
0
1
2
3
4
5
6
7
8
9
10
0 0.001 0.002 0.003 0.004
sto
ry le
vel
drift ratio
bare frame soft story frame
infilled frame
0
2
4
6
8
10
12
0 0.005 0.01 0.015 0.02 0.025
sto
ry le
vel
drift ratio
bare frame soft story frame
infilled frame
0
2
4
6
8
10
12
14
0 0.005 0.01 0.015 0.02 0.025
sto
ry le
vel
drift ratio
bare frame soft story frame
infilled frame

45
Fig: maximum interstory drift ratio at different levels; for frames with infill Em = 1875
N/mm2 (left) and 5625 N/mm2 (right) at Freq.5Hz PGA 1m/s2
Fig: maximum interstory drift ratio at different levels; for frames with infill Em = 1875
N/mm2 (left) and 5625 N/mm2 (right) at Freq.75Hz PGA 1m/s2
0
2
4
6
8
10
12
0 0.005 0.01 0.015 0.02 0.025
sto
ry le
vel
drift ratio
bare frame soft story frame
infilled frame
0
2
4
6
8
10
12
14
0 0.005 0.01 0.015 0.02 0.025
sto
ry le
vel
drift ratio
bare frame soft story frame
infilled frame
0
2
4
6
8
10
12
0 0.005 0.01 0.015
sto
ry le
vel
drift ratio
bare frame soft story frame
infilled frame
0
2
4
6
8
10
12
14
0 0.01 0.02 0.03
sto
ry le
vel
drift ratio
bare frame soft story frame
infilled frame

46
Fig: maximum interstory drift ratio at different levels; for frames with infill Em = 1875
N/mm2 (left) and 5625 N/mm2 (right) at Freq1Hz PGA 1m/s2
Fig: maximum interstory drift ratio at different levels; for frames with infill Em = 1875
N/mm2 (left) and 5625 N/mm2 (right) at Freq1.25Hz PGA 1m/s2
0
2
4
6
8
10
12
14
0 0.002 0.004 0.006 0.008
sto
ry le
vel
drift ratio
bare frame soft story frame
infilled frame
0
2
4
6
8
10
12
14
0 0.005 0.01 0.015
sto
ry le
vel
drift ratio
bare frame soft story frame
infilled frame
0
2
4
6
8
10
12
14
0 0.005 0.01
sto
ry le
vel
drift ratio
bare frame soft story frame
infilled frame
0
2
4
6
8
10
12
14
0 0.002 0.004 0.006 0.008 0.01
sto
ry le
vel
drift ratio
bare frame soft story frame
infilled frame

47
Fig: maximum interstory drift ratio at different levels; for frames with infill Em = 1875
N/mm2 (left) and 5625 N/mm2 (right) at Freq1.5Hz PGA 1m/s2
Fig: maximum interstory drift ratio at different levels; for frames with infill Em = 1875
N/mm2 (left) and 5625 N/mm2 (right) at Freq1.75Hz PGA 1m/s2
0
2
4
6
8
10
12
14
0 0.001 0.002 0.003 0.004 0.005
sto
ry le
vel
drift ratio
bare frame soft story frame
infilled frame
0
2
4
6
8
10
12
14
0 0.002 0.004 0.006
sto
ry le
vel
drift ratio
bare frame soft story frame
infilled frame
0
2
4
6
8
10
12
14
0 0.001 0.002 0.003 0.004 0.005
sto
ry le
vel
drift ratio
bare frame soft story frame
infilled frame
0
2
4
6
8
10
12
14
0 0.001 0.002 0.003 0.004
sto
ry le
vel
drift ratio
bare frame soft story frame
infilled frame

48
Fig: maximum interstory drift ratio at different levels; for frames with infill Em = 1875
N/mm2 (left) and 5625 N/mm2 (right) at Freq2Hz PGA 1m/s2
Fig: maximum interstory drift ratio at different levels; for frames with infill Em = 1875
N/mm2 (left) and 5625 N/mm2 (right) at Freq2.25Hz PGA 1m/s2
0
2
4
6
8
10
12
14
0 0.001 0.002 0.003 0.004
sto
ry le
vel
drift ratio
bare frame soft story frame
infilled frame
0
2
4
6
8
10
12
14
0 0.001 0.002 0.003 0.004
sto
ry le
vel
drift ratio
bare frame soft story frame
infilled frame
0
2
4
6
8
10
12
14
0 0.001 0.002 0.003 0.004
sto
ry le
vel
drift ratio
bare frame soft story frame
infilled frame
0
2
4
6
8
10
12
14
0 0.001 0.002 0.003 0.004 0.005
sto
ry le
vel
drift ratio
bare frame soft story frame
infilled frame

49
Fig: maximum interstory drift ratio at different levels; for frames with infill Em = 1875
N/mm2 (left) and 5625 N/mm2 (right) at Freq2.5Hz PGA 1m/s2
Fig: maximum interstory drift ratio at different levels; for frames with infill Em = 1875
N/mm2 (left) and 5625 N/mm2 (right) at Freq2.75Hz PGA 1m/s2
0
2
4
6
8
10
12
14
0 0.0005 0.001 0.0015 0.002 0.0025
sto
ry le
vel
drift ratio
bare frame soft story frame
infilled frame
0
2
4
6
8
10
12
14
0 0.001 0.002 0.003 0.004
sto
ry le
vel
drift ratio
bare frame soft story frame
infilled frame
0
2
4
6
8
10
12
14
0 0.0005 0.001 0.0015 0.002 0.0025
sto
ry le
vel
drift ratio
bare frame soft story frame
infilled frame
0
2
4
6
8
10
12
14
0 0.0005 0.001 0.0015 0.002 0.0025
sto
ry le
vel
drift ratio
bare frame soft story frame
infilled frame

50
Fig: maximum interstory drift ratio at different levels; for frames with infill Em = 1875
N/mm2 (left) and 5625 N/mm2 (right) at Freq3Hz PGA 1m/s2
Fifteen story buildings:
Fig: maximum interstory drift ratio at different levels; for frames with infill Em = 1875
N/mm2 (left) and 5625 N/mm2 (right) at Freq.25Hz PGA 1m/s2
0
2
4
6
8
10
12
14
0 0.0005 0.001 0.0015 0.002 0.0025
sto
ry le
vel
drift ratio
bare frame soft story frame
infilled frame
0
2
4
6
8
10
12
14
0 0.001 0.002 0.003
sto
ry le
vel
drift ratio
bare frame soft story frame
infilled frame
0
2
4
6
8
10
12
14
16
0 0.01 0.02 0.03
sto
ry le
vel
drift ratio
bare frame soft story frame
infilled frame
0
2
4
6
8
10
12
14
16
0 0.01 0.02 0.03
sto
ry le
vel
drift ratio
bare frame soft story frame
infilled frame

51
Fig: maximum interstory drift ratio at different levels; for frames with infill Em = 1875
N/mm2 (left) and 5625 N/mm2 (right) at Freq.5Hz PGA 1m/s2
Fig: maximum interstory drift ratio at different levels; for frames with infill Em = 1875
N/mm2 (left) and 5625 N/mm2 (right) at Freq.75Hz PGA 1m/s2
0
2
4
6
8
10
12
14
16
0 0.005 0.01 0.015 0.02 0.025
sto
ry le
vel
drift ratio
bare frame soft story frame
infilled frame
0
2
4
6
8
10
12
14
16
0 0.005 0.01 0.015 0.02
sto
ry le
vel
drift ratio
bare frame soft story frame
infilled frame
0
2
4
6
8
10
12
14
16
0 0.002 0.004 0.006 0.008
sto
ry le
vel
drift ratio
bare frame soft story frame
infilled frame
0
2
4
6
8
10
12
14
16
0 0.005 0.01 0.015
sto
ry le
vel
drift ratio
bare frame soft story frame
infilled frame

52
Fig: maximum interstory drift ratio at different levels; for frames with infill Em = 1875
N/mm2 (left) and 5625 N/mm2 (right) at Freq1Hz PGA 1m/s2
Fig: maximum interstory drift ratio at different levels; for frames with infill Em = 1875
N/mm2 (left) and 5625 N/mm2 (right) at Freq1.25Hz PGA 1m/s2
0
2
4
6
8
10
12
14
16
0 0.002 0.004 0.006 0.008 0.01
sto
ry le
vel
drift ratio
bare frame soft story frame
infilled frame
0
2
4
6
8
10
12
14
16
0 0.005 0.01 0.015
sto
ry le
vel
drift ratio
bare frame soft story frame
infilled frame
0
2
4
6
8
10
12
14
16
0 0.001 0.002 0.003 0.004 0.005
sto
ry le
vel
drift ratio
bare frame soft story frame
infilled frame
0
2
4
6
8
10
12
14
16
0 0.001 0.002 0.003 0.004 0.005
sto
ry le
vel
drift ratio
bare frame soft story frame
infilled frame

53
Fig: maximum interstory drift ratio at different levels; for frames with infill Em = 1875
N/mm2 (left) and 5625 N/mm2 (right) at Freq1.5Hz PGA 1m/s2
Fig: maximum interstory drift ratio at different levels; for frames with infill Em = 1875
N/mm2 (left) and 5625 N/mm2 (right) at Freq1.75Hz PGA 1m/s2
0
2
4
6
8
10
12
14
16
0 0.001 0.002 0.003 0.004 0.005
sto
ry le
vel
drift ratio
bare frame soft story frame
infilled frame
0
2
4
6
8
10
12
14
16
0 0.001 0.002 0.003 0.004
sto
ry le
vel
drift ratio
bare frame soft story frame
infilled frame
0
2
4
6
8
10
12
14
16
0 0.001 0.002 0.003 0.004 0.005
sto
ry le
vel
drift ratio
bare frame soft story frame
infilled frame
0
2
4
6
8
10
12
14
16
0 0.001 0.002 0.003 0.004 0.005
sto
ry le
vel
drift ratio
bare frame soft story frame
infilled frame

54
Fig: maximum interstory drift ratio at different levels; for frames with infill Em = 1875
N/mm2 (left) and 5625 N/mm2 (right) at Freq2Hz PGA 1m/s2
Fig: maximum interstory drift ratio at different levels; for frames with infill Em = 1875
N/mm2 (left) and 5625 N/mm2 (right) at Freq2.25Hz PGA 1m/s2
0
2
4
6
8
10
12
14
16
0 0.001 0.002 0.003 0.004
sto
ry le
vel
drift ratio
bare frame soft story frame
infilled frame
0
2
4
6
8
10
12
14
16
0 0.001 0.002 0.003 0.004 0.005
sto
ry le
vel
drift ratio
bare frame soft story frame
infilled frame
0
2
4
6
8
10
12
14
16
0 0.0005 0.001 0.0015 0.002 0.0025
sto
ry le
vel
drift ratio
bare frame soft story frame
infilled frame
0
2
4
6
8
10
12
14
16
0 0.001 0.002 0.003
sto
ry le
vel
drift ratio
bare frame soft story frame
infilled frame

55
Fig: maximum interstory drift ratio at different levels; for frames with infill Em = 1875
N/mm2 (left) and 5625 N/mm2 (right) at Freq2.5Hz PGA 1m/s2
Fig: maximum interstory drift ratio at different levels; for frames with infill Em = 1875
N/mm2 (left) and 5625 N/mm2 (right) at Freq2.75Hz PGA 1m/s2
0
2
4
6
8
10
12
14
16
0 0.0005 0.001 0.0015 0.002 0.0025
sto
ry le
vel
drift ratio
bare frame soft story frame
infilled frame
0
2
4
6
8
10
12
14
16
0 0.001 0.002 0.003
sto
ry le
vel
drift ratio
bare frame soft story frame
infilled frame
0
2
4
6
8
10
12
14
16
0 0.0005 0.001 0.0015 0.002 0.0025
sto
ry le
vel
drift ratio
bare frame soft story frame
infilled frame
0
2
4
6
8
10
12
14
16
0 0.0005 0.001 0.0015 0.002 0.0025
sto
ry le
vel
drift ratio
bare frame soft story frame
infilled frame

56
Fig: maximum interstory drift ratio at different levels; for frames with infill Em = 1875
N/mm2 (left) and 5625 N/mm2 (right) at Freq3Hz PGA 1m/s2
0
2
4
6
8
10
12
14
16
0 0.0005 0.001 0.0015
sto
ry le
vel
drift ratio
bare frame soft story frame
infilled frame
0
2
4
6
8
10
12
14
16
0 0.0005 0.001 0.0015
sto
ry le
vel
drift ratio
bare frame soft story frame
infilled frame

57
4.4 Comparison of maximum interstory drift ratio Maximum interstory drift ratio of a frame (considering all story levels) are taken from
graphs of section 4.3 and plotted against frequency and frequency ratio.
4.4.1 Frames with weaker infill
(Modulus of elasticity of infill Em = 1875 N/mm2)
Six story buildings:
Fig: drift ratio vs. frequency for PGA 1 m/s2 (six story building)
Fig: drift ratio vs. frequency ratio for PGA 1 m/s2 (six story building)
0
0.005
0.01
0.015
0.02
0.025
0.03
0.035
0.04
0.045
0 0.5 1 1.5 2 2.5 3 3.5
Max
imu
m D
rift
Rat
io
Input Frequency (Hz)
Bare Frame
soft story frame
Infilled Frame
0
0.005
0.01
0.015
0.02
0.025
0.03
0.035
0.04
0.045
0 1 2 3 4 5 6
Max
imu
m D
rift
Rat
io
Frequency Ratio
Bare Frame
Soft Story Frame
Infilled Frame

58
Nine story buildings:
Fig: drift ratio vs. frequency for PGA 1 m/s2 (nine story building)
Fig: drift ratio vs. frequency ratio for PGA 1 m/s2 (nine story building)
0
0.005
0.01
0.015
0.02
0.025
0.03
0.035
0.04
0 0.5 1 1.5 2 2.5 3 3.5
Max
imu
m D
rift
rat
io
Input Frequency (Hz)
Bare Frame
Soft Story Frame
Infilled Frame
0
0.005
0.01
0.015
0.02
0.025
0.03
0.035
0.04
0 1 2 3 4 5 6 7
Max
imu
m D
rift
Rat
io
Frequency Ratio
Bare Frame
Soft Story Frame
Infilled Frame

59
Twelve story buildings:
Fig: drift ratio vs. frequency for PGA 1 m/s2 (twelve story building)
Fig: drift ratio vs. frequency ratio for PGA 1 m/s2 (twelve story building)
0
0.005
0.01
0.015
0.02
0.025
0 0.5 1 1.5 2 2.5 3 3.5
Max
imu
m D
rift
Rat
io
Input Frequency (Hz)
Bare Frame
Soft Story Frame
Infilled Frame
0
0.005
0.01
0.015
0.02
0.025
0 1 2 3 4 5 6 7 8 9
Max
imu
m D
rift
Rat
io
Frequency Ratio
Bare Frame
Soft Story Frame
Infilled Frame

60
Fifteen story buildings:
Fig: drift ratio vs. frequency for PGA 1 m/s2 (fifteen story building)
Fig: drift ratio vs. frequency ratio for PGA 1 m/s2 (fifteen story building)
0
0.005
0.01
0.015
0.02
0.025
0.03
0 0.5 1 1.5 2 2.5 3 3.5
Max
imu
m D
rift
Rat
io
Input Frequency (Hz)
Bare Frame
Soft Story Frame
Infilled Frame
0
0.005
0.01
0.015
0.02
0.025
0.03
0 1 2 3 4 5 6 7 8 9 10
Max
imu
m D
rift
Rat
io
Frequency Ratio
Bare Frame
Soft story Frame
Infilled Frame

61
4.4.2 Frames with stronger infill (Modulus of elasticity of infill Em = 5625 N/mm2)
Six story buildings:
Fig: drift ratio vs. frequency for PGA 1 m/s2 (six story building)
Fig: drift ratio vs. frequency ratio for PGA 1 m/s2 (six story building)
0
0.005
0.01
0.015
0.02
0.025
0.03
0.035
0.04
0.045
0.05
0 0.5 1 1.5 2 2.5 3 3.5
Max
imu
m D
rift
Rat
io
Input Frequency (Hz)
Bare Frame
soft story frame
Infilled Frame
0
0.005
0.01
0.015
0.02
0.025
0.03
0.035
0.04
0.045
0.05
0 1 2 3 4 5 6
Max
imu
m D
rift
Rat
io
Frequency Ratio
Bare Frame
Soft Story Frame
Infilled Frame

62
Nine story buildings:
Fig: drift ratio vs. frequency for PGA 1 m/s2 (nine story building)
Fig: drift ratio vs. frequency ratio for PGA 1 m/s2 (nine story building)
0
0.005
0.01
0.015
0.02
0.025
0.03
0.035
0.04
0 0.5 1 1.5 2 2.5 3 3.5
Max
imu
m D
rift
rat
io
Input Frequency (Hz)
Bare Frame
Soft Story Frame
Infilled Frame
0
0.005
0.01
0.015
0.02
0.025
0.03
0.035
0.04
0 1 2 3 4 5 6 7
Max
imu
m D
rift
Rat
io
Frequency Ratio
Bare Frame
Soft Story Frame
Infilled Frame

63
Twelve story buildings:
Fig: drift ratio vs. frequency for PGA 1 m/s2 (twelve story building)
Fig: drift ratio vs. frequency ratio for PGA 1 m/s2 (twelve story building)
0
0.005
0.01
0.015
0.02
0.025
0.03
0 0.5 1 1.5 2 2.5 3 3.5
Max
imu
m D
rift
Rat
io
Input Frequency (Hz)
Bare Frame
Soft Story Frame
Infilled Frame
0
0.005
0.01
0.015
0.02
0.025
0.03
0 1 2 3 4 5 6 7 8 9
Max
imu
m D
rift
Rat
io
Frequency Ratio
Bare Frame
Soft Story Frame
Infilled Frame

64
Fifteen story buildings:
Fig: drift ratio vs. frequency for PGA 1 m/s2 (fifteen story building)
Fig: drift ratio vs. frequency ratio for PGA 1 m/s2 (fifteen story building)
0
0.005
0.01
0.015
0.02
0.025
0.03
0 0.5 1 1.5 2 2.5 3 3.5
Max
imu
m D
rift
Rat
io
Input Frequency (Hz)
Bare Frame
Soft Story Frame
Infilled Frame
0
0.005
0.01
0.015
0.02
0.025
0.03
0 1 2 3 4 5 6 7 8 9 10
Max
imu
m D
rift
Rat
io
Frequency Ratio
Bare Frame
Soft story Frame
Infilled Frame

65
4.5 Difference in interstory drift ratio due to change in infill Maximum interstory drift ratios during the earthquake motion (5 second) are plotted for
soft story and infilled frames. It can be observed that after frequency level 1.5 Hz drift
ratio decrease rapidly for frames with both weaker and stronger infill.
Six story buildings:
Fig: maximum interstory drift ratio vs. input frequency for frames with difference infill
properties (Em = 1875 and 5625 N/mm2); six story buildings
Fig: maximum interstory drift ratio vs. input frequency for frames with difference infill
properties (Em = 1875 and 5625 N/mm2); six story buildings
0
0.005
0.01
0.015
0.02
0.025
0.03
0.035
0.04
0.045
0.05
0.25 0.5 0.75 1 1.25 1.5 1.75 2 2.25 2.5 2.75 3
dri
ft r
atio
Input frequency (Hz)
soft story frame
infill moe 1875 N/mm^2 infill moe 5625 N/mm^2
0
0.002
0.004
0.006
0.008
0.01
0.012
0.014
0.25 0.5 0.75 1 1.25 1.5 1.75 2 2.25 2.5 2.75 3
dri
ft r
atio
Input frequency (Hz)
infilled frame
infill moe 1875 N/mm^2 infill moe 5625 N/mm^2

66
Nine story buildings:
Fig: maximum interstory drift ratio vs. input frequency for frames with difference infill
properties (Em = 1875 and 5625 N/mm2); nine story buildings
Fig: maximum interstory drift ratio vs. input frequency for frames with difference infill
properties (Em = 1875 and 5625 N/mm2); nine story buildings
0
0.005
0.01
0.015
0.02
0.025
0.03
0.035
0.25 0.5 0.75 1 1.25 1.5 1.75 2 2.25 2.5 2.75 3
dri
ft r
atio
Input frequency (Hz)
soft story frame
infill moe 1875 N/mm^2 infill moe 5625 N/mm^2
0
0.002
0.004
0.006
0.008
0.01
0.012
0.014
0.016
0.018
0.25 0.5 0.75 1 1.25 1.5 1.75 2 2.25 2.5 2.75 3
dri
ft r
atio
Input frequency (Hz)
infilled frame
infill moe 1875 N/mm^2 infill moe 5625 N/mm^2

67
Twelve story buildings:
Fig: maximum interstory drift ratio vs. input frequency for frames with difference infill
properties (Em = 1875 and 5625 N/mm2); twelve story buildings
Fig: maximum interstory drift ratio vs. input frequency for frames with difference infill
properties (Em = 1875 and 5625 N/mm2); twelve story buildings
0
0.005
0.01
0.015
0.02
0.025
0.03
0.25 0.5 0.75 1 1.25 1.5 1.75 2 2.25 2.5 2.75 3
dri
ft r
atio
Input frequency (Hz)
soft story frame
infill moe 1875 N/mm^2 infill moe 5625 N/mm^2
0
0.002
0.004
0.006
0.008
0.01
0.012
0.014
0.25 0.5 0.75 1 1.25 1.5 1.75 2 2.25 2.5 2.75 3
dri
ft r
atio
Input frequency (Hz)
infilled frame
infill moe 1875 N/mm^2 infill moe 5625 N/mm^2

68
Fifteen story buildings:
Fig: maximum interstory drift ratio vs. input frequency for frames with difference infill
properties (Em = 1875 and 5625 N/mm2); fifteen story buildings
Fig: maximum interstory drift ratio vs. input frequency for frames with difference infill
properties (Em = 1875 and 5625 N/mm2); fifteen story buildings
0
0.005
0.01
0.015
0.02
0.025
0.25 0.5 0.75 1 1.25 1.5 1.75 2 2.25 2.5 2.75 3
dri
ft r
atio
Input frequency (Hz)
soft story frame
infill moe 1875 N/mm^2 infill moe 5625 N/mm^2
0
0.002
0.004
0.006
0.008
0.01
0.012
0.014
0.016
0.018
0.02
0.25 0.5 0.75 1 1.25 1.5 1.75 2 2.25 2.5 2.75 3
dri
ft r
atio
Input frequency (Hz)
infilled frame
infill moe 1875 N/mm^2 infill moe 5625 N/mm^2

69
4.6 Time history of drift Interstory drift ratio vs. time is plotted below usig the data obtained from time history
analysis. The response pattern does not follow any regular shape (as in elastic analysis).
The shapes are same for a frequency level in any peak ground acceleration.
4.6.1 Frames with weaker infill Modulus of elastic of infill Em = 1875 N/mm2
Six story buildings bare frames:
Fig: drift ratio vs. time for 6 story building bare frame at frequency .5 Hz PGA 1 m/s2
Fig: drift ratio vs. time for 6 story building bare frame at frequency 1.5 Hz PGA 2 m/s2
-0.05
-0.04
-0.03
-0.02
-0.01
0
0.01
0.02
0.03
0.04
0.05
0 1 2 3 4 5
story 1 story 2 story 3 story 4 story 5 story 6
-0.02
-0.015
-0.01
-0.005
0
0.005
0.01
0.015
0 1 2 3 4 5
Dri
ft r
atio
Time (S)
Story 1 Story 2 Story 3 Story 4 Story 5 Story 6

70
Fig: drift ratio vs. time for 6 story building bare frame at frequency .25 Hz PGA 2 m/s2
Fig: drift ratio vs. time for 6 story building bare frame at frequency .5 Hz PGA 2 m/s2
Fig: drift ratio vs. time for 6 story building bare frame at frequency .75 Hz PGA 2 m/s2
-0.04
-0.03
-0.02
-0.01
0
0.01
0.02
0.03
0 1 2 3 4 5
story 1 story 2 story 3 story 4 story 5 story 6
-0.12
-0.09
-0.06
-0.03
0
0.03
0.06
0.09
0 1 2 3 4 5
story 1 story 2 story 3 story 4 story 5 story 6
-0.05
-0.04
-0.03
-0.02
-0.01
0
0.01
0.02
0.03
0.04
0 1 2 3 4 5
story 1 story 2 story 3 story 4 story 5 story 6

71
Fig: drift ratio vs. time for 6 story building bare frame at frequency .25 Hz PGA 3 m/s2
Fig: drift ratio vs. time for 6 story building bare frame at frequency .5 Hz PGA 3 m/s2
Fig: drift ratio vs. time for 6 story building bare frame at frequency .75 Hz PGA 3 m/s2
-0.05
-0.04
-0.03
-0.02
-0.01
0
0.01
0.02
0.03
0.04
0 1 2 3 4 5
story 1 story 2 story 3 story 4 story 5 story 6
-0.16
-0.12
-0.08
-0.04
0
0.04
0.08
0.12
0.16
0 1 2 3 4 5
story 1 story 2 story 3 story 4 story 5 story 6
-0.08
-0.06
-0.04
-0.02
0
0.02
0.04
0.06
0 0.5 1 1.5 2 2.5 3 3.5 4 4.5 5
story 1 story 2 story 3 story 4 story 5 story 6

72
Fig: drift ratio vs. time for 6 story building bare frame at frequency 1 Hz PGA 3 m/s2
Fig: drift ratio vs. time for 6 story building bare frame at frequency 1.25 Hz PGA 3 m/s2
Fig: drift ratio vs. time for 6 story building bare frame at frequency 1.5 Hz PGA 3 m/s2
-0.03
-0.02
-0.01
0
0.01
0.02
0.03
0 1 2 3 4 5
story 1 story 2 story 3 story 4 story 5 story 6
-0.02
-0.015
-0.01
-0.005
0
0.005
0.01
0.015
0.02
0 0.5 1 1.5 2 2.5 3 3.5 4 4.5 5
story 1 story 2 story 3 story 4 story 5 story 6
-0.025
-0.02
-0.015
-0.01
-0.005
0
0.005
0.01
0.015
0.02
0.025
0 1 2 3 4 5
story 1 story 2 story 3 story 4 story 5 story 6

73
Fig: drift ratio vs. time for 6 story building bare frame at frequency 1.75 Hz PGA 3 m/s2
Six story buildings soft story frames:
Fig: drift ratio vs. time for 6 story building soft story frame at frequency .5 Hz PGA 1 m/s2
-0.025
-0.02
-0.015
-0.01
-0.005
0
0.005
0.01
0.015
0.02
0.025
0 1 2 3 4 5
story 1 story 2 story 3 story 4 story 5 story 6
-0.015
-0.01
-0.005
0
0.005
0.01
0.015
0 1 2 3 4 5
story 1 story 2 story 3 story 4 story 5 story 6

74
Fig: drift ratio vs. time for 6 story building soft story frame at frequency .75 Hz PGA 1
m/s2
Fig: drift ratio vs. time for 6 story building soft story frame at frequency 1 Hz PGA m/s2
-0.03
-0.02
-0.01
0
0.01
0.02
0.03
0.04
0 1 2 3 4 5
story 1 story 2 story 3 story 4 story 5 story 6
-0.06
-0.04
-0.02
0
0.02
0.04
0.06
0 1 2 3 4 5
story 1 story 2 story 3 story 4 story 5 story 6

75
Fig: drift ratio vs. time for 6 story building soft story frame at frequency .5 Hz PGA 2 m/s2
Fig: drift ratio vs. time for 6 story building soft story frame at frequency .75 Hz PGA 2
m/s2
-0.03
-0.02
-0.01
0
0.01
0.02
0.03
0 1 2 3 4 5
story 1 story 2 story 3 story 4 story 5 story 6
-0.06
-0.04
-0.02
0
0.02
0.04
0.06
0.08
0 1 2 3 4 5
story 1 story 2 story 3 story 4 story 5 story 6

76
Fig: drift ratio vs. time for 6 story building soft story frame at frequency 1 Hz PGA 2 m/s2
Fig: drift ratio vs. time for 6 story building soft story frame at frequency 1.25 Hz PGA 2
m/s2
-0.12
-0.09
-0.06
-0.03
0
0.03
0.06
0.09
0.12
0 1 2 3 4 5
story 1 story 2 story 3 story 4 story 5 story 6
-0.04
-0.03
-0.02
-0.01
0
0.01
0.02
0.03
0.04
0 1 2 3 4 5
story 1 story 2 story 3 story 4 story 5 story 6

77
Fig: drift ratio vs. time for 6 story building soft story frame at frequency 1.5 Hz PGA 2
m/s2
Fig: drift ratio vs. time for 6 story building soft story frame at frequency .25 Hz PGA 3
m/s2
-0.02
-0.015
-0.01
-0.005
0
0.005
0.01
0.015
0.02
0.025
0 1 2 3 4 5
story 1 story 2 story 3 story 4 story 5 story 6
-0.04
-0.03
-0.02
-0.01
0
0.01
0.02
0.03
0 1 2 3 4 5
story 1 story 2 story 3 story 4 story 5 story 6

78
Fig: drift ratio vs. time for 6 story building soft story frame at frequency .5 Hz PGA 3 m/s2
Fig: drift ratio vs. time for 6 story building soft story frame at frequency .75 Hz PGA 3
m/s2
-0.05
-0.04
-0.03
-0.02
-0.01
0
0.01
0.02
0.03
0.04
0.05
0 1 2 3 4 5
story 1 story 2 story 3 story 4 story 5 story 6
-0.1
-0.08
-0.06
-0.04
-0.02
0
0.02
0.04
0.06
0.08
0.1
0 1 2 3 4 5
story 1 story 2 story 3 story 4 story 5 story 6

79
Fig: drift ratio vs. time for 6 story building soft story frame at frequency 1 Hz PGA 3 m/s2
Fig: drift ratio vs. time for 6 story building soft story frame at frequency 1.25 Hz PGA 3
m/s2
-0.16
-0.12
-0.08
-0.04
0
0.04
0.08
0.12
0.16
0 1 2 3 4 5
story 1 story 2 story 3 story 4 story 5 story 6
-0.06
-0.04
-0.02
0
0.02
0.04
0.06
0 1 2 3 4 5
story 1 story 2 story 3 story 4 story 5 story 6

80
Fig: drift ratio vs. time for 6 story building soft story frame at frequency 1.5 Hz PGA 3
m/s2
Fig: drift ratio vs. time for 6 story building soft story frame at frequency 1.75 Hz PGA 3
m/s2
-0.03
-0.02
-0.01
0
0.01
0.02
0.03
0.04
0 1 2 3 4 5
story 1 story 2 story 3 story 4 story 5 story 6
-0.03
-0.02
-0.01
0
0.01
0.02
0.03
0 1 2 3 4 5
story 1 story 2 story 3 story 4 story 5 story 6

81
Six story buildings infilled frames:
Fig: drift ratio vs. time for 6 story building infilled frame at frequency 1 Hz PGA 2 m/s2
Fig: drift ratio vs. time for 6 story building infilled frame at frequency 1.25 Hz PGA 2 m/s2
Fig: drift ratio vs. time for 6 story building infilled frame at frequency 1 Hz PGA 3 m/s2
-0.03
-0.02
-0.01
0
0.01
0.02
0.03
0 1 2 3 4 5
story 1 story 2 story 3 story 4 story 5 story 6
-0.03
-0.02
-0.01
0
0.01
0.02
0.03
0 1 2 3 4 5
story 1 story 2 story 3 story 4 story 5 story 6
-0.04
-0.03
-0.02
-0.01
0
0.01
0.02
0.03
0.04
0 1 2 3 4 5
story 1 story 2 story 3 story 4 story 5 story 6

82
Fig: drift ratio vs. time for 6 story building infilled frame at frequency 1.25 Hz PGA 3 m/s2
Nine story building bare frames:
Fig: drift ratio vs. time for 9 story building bare frame at frequency .5 Hz PGA 1 m/s2
-0.045
-0.03
-0.015
0
0.015
0.03
0.045
0 1 2 3 4 5
story 1 story 2 story 3 story 4 story 5 story 6
-0.04
-0.02
0
0.02
0.04
0 1 2 3 4 5
story 1 story 2 story 3 story 4 story 5
story 6 story 7 story 8 story 9

83
Fig: drift ratio vs. time for 9 story building bare frame at frequency .25 Hz PGA 2 m/s2
Fig: drift ratio vs. time for 9 story building bare frame at frequency .5 Hz PGA 2 m/s2
-0.04
-0.03
-0.02
-0.01
0
0.01
0.02
0.03
0.04
0 1 2 3 4 5
story 1 story 2 story 3 story 4 story 5
story 6 story 7 story 8 story 9
-0.08
-0.06
-0.04
-0.02
0
0.02
0.04
0.06
0.08
0 1 2 3 4 5
story 1 story 2 story 3 story 4 story 5
story 6 story 7 story 8 story 9

84
Fig: drift ratio vs. time for 9 story building bare frame at frequency .75 Hz PGA 2 m/s2
Fig: drift ratio vs. time for 9 story building bare frame at frequency .25 Hz PGA 3 m/s2
-0.02
-0.015
-0.01
-0.005
0
0.005
0.01
0.015
0.02
0.025
0 1 2 3 4 5
story 1 story 2 story 3 story 4 story 5
story 6 story 7 story 8 story 9
-0.06
-0.04
-0.02
0
0.02
0.04
0.06
0 1 2 3 4 5
story 1 story 2 story 3 story 4 story 5
story 6 story 7 story 8 story 9

85
Fig: drift ratio vs. time for 9 story building bare frame at frequency .5 Hz PGA 3 m/s2
Fig: drift ratio vs. time for 9 story building bare frame at frequency .75 Hz PGA 3 m/s2
-0.12
-0.09
-0.06
-0.03
0
0.03
0.06
0.09
0.12
0 1 2 3 4 5
story 1 story 2 story 3 story 4 story 5
story 6 story 7 story 8 story 9
-0.03
-0.02
-0.01
0
0.01
0.02
0.03
0.04
0 1 2 3 4 5
story 1 story 2 story 3 story 4 story 5
story 6 story 7 story 8 story 9

86
Fig: drift ratio vs. time for 9 story building bare frame at frequency 1.25 Hz PGA 3 m/s2
Fig: drift ratio vs. time for 9 story building bare frame at frequency 1.5 Hz PGA 3 m/s2
-0.03
-0.02
-0.01
0
0.01
0.02
0.03
0 1 2 3 4 5
story 1 story 2 story 3 story 4 story 5
story 6 story 7 story 8 story 9
-0.025
-0.02
-0.015
-0.01
-0.005
0
0.005
0.01
0.015
0.02
0.025
0 0.5 1 1.5 2 2.5 3 3.5 4 4.5 5
story 1 story 2 story 3 story 4 story 5
story 6 story 7 story 8 story 9

87
Nine story buildings soft story frames:
Fig: drift ratio vs. time for 9 story building soft story frame at frequency .75 Hz PGA 1
m/s2
Fig: drift ratio vs. time for 9 story building soft story frame at frequency .5 Hz PGA 2 m/s2
-0.04
-0.03
-0.02
-0.01
0
0.01
0.02
0.03
0.04
0 1 2 3 4 5
story 1 story 2 story 3 story 4 story 5
story 6 story 7 story 8 story 9
-0.04
-0.03
-0.02
-0.01
0
0.01
0.02
0.03
0.04
0 1 2 3 4 5
story 1 story 2 story 3 story 4 story 5
story 6 story 7 story 8 story 9

88
Fig: drift ratio vs. time for 9 story building soft story frame at frequency .75 Hz PGA 2
m/s2
Fig: drift ratio vs. time for 9 story building soft story frame at frequency 1 Hz PGA 2 m/s2
-0.08
-0.06
-0.04
-0.02
0
0.02
0.04
0.06
0.08
0 1 2 3 4 5
story 1 story 2 story 3 story 4 story 5
story 6 story 7 story 8 story 9
-0.025
-0.02
-0.015
-0.01
-0.005
0
0.005
0.01
0.015
0.02
0.025
0 1 2 3 4 5
story 1 story 2 story 3 story 4 story 5
story 6 story 7 story 8 story 9

89
Fig: drift ratio vs. time for 9 story building soft story frame at frequency .25 Hz PGA 3
m/s2
Fig: drift ratio vs. time for 9 story building soft story frame at frequency .5 Hz PGA 3 m/s2
-0.03
-0.02
-0.01
0
0.01
0.02
0.03
0 1 2 3 4 5
story 1 story 2 story 3 story 4 story 5
story 6 story 7 story 8 story 9
-0.05
-0.04
-0.03
-0.02
-0.01
0
0.01
0.02
0.03
0.04
0.05
0 1 2 3 4 5
story 1 story 2 story 3 story 4 story 5
story 6 story 7 story 8 story 9

90
Fig: drift ratio vs. time for 9 story building soft story frame at frequency .75 Hz PGA 3
m/s2
Fig: drift ratio vs. time for 9 story building soft story frame at frequency 1 Hz PGA 3 m/s2
-0.12
-0.09
-0.06
-0.03
0
0.03
0.06
0.09
0.12
0 1 2 3 4 5
story 1 story 2 story 3 story 4 story 5
story 6 story 7 story 8 story 9
-0.04
-0.03
-0.02
-0.01
0
0.01
0.02
0.03
0.04
0 1 2 3 4 5
story 1 story 2 story 3 story 4 story 5
story 6 story 7 story 8 story 9

91
Nine story buildings infilled frames:
Fig: drift ratio vs. time for 9 story building infilled frame at frequency .75 Hz PGA 2 m/s2
Fig: drift ratio vs. time for 9 story building infilled frame at frequency .75 Hz PGA 3 m/s2
-0.04
-0.03
-0.02
-0.01
0
0.01
0.02
0.03
0.04
0 1 2 3 4 5
story 1 story 2 story 3 story 4 story 5
story 6 story 7 story 8 story 9
-0.06
-0.04
-0.02
0
0.02
0.04
0.06
0 1 2 3 4 5
story 1 story 2 story 3 story 4 story 5
story 6 story 7 story 8 story 9

92
Fig: drift ratio vs. time for 9 story building infilled frame at frequency 1 Hz PGA 3 m/s2
Fifteen story buildings bare frames:
Fig: drift ratio vs. time for 15 story building bare frame at frequency .25 Hz PGA 1 m/s2
-0.03
-0.02
-0.01
0
0.01
0.02
0.03
0 1 2 3 4 5
story 3 story 4 story 5 story 6 story 7 story 8 story 9
-0.04
-0.03
-0.02
-0.01
0
0.01
0.02
0.03
0 1 2 3 4 5
story 1 story 2 story 3 story 4 story 5
story 6 story 7 story 8 story 9 story 10
story 11 story 12 story 13 story 14 story 15
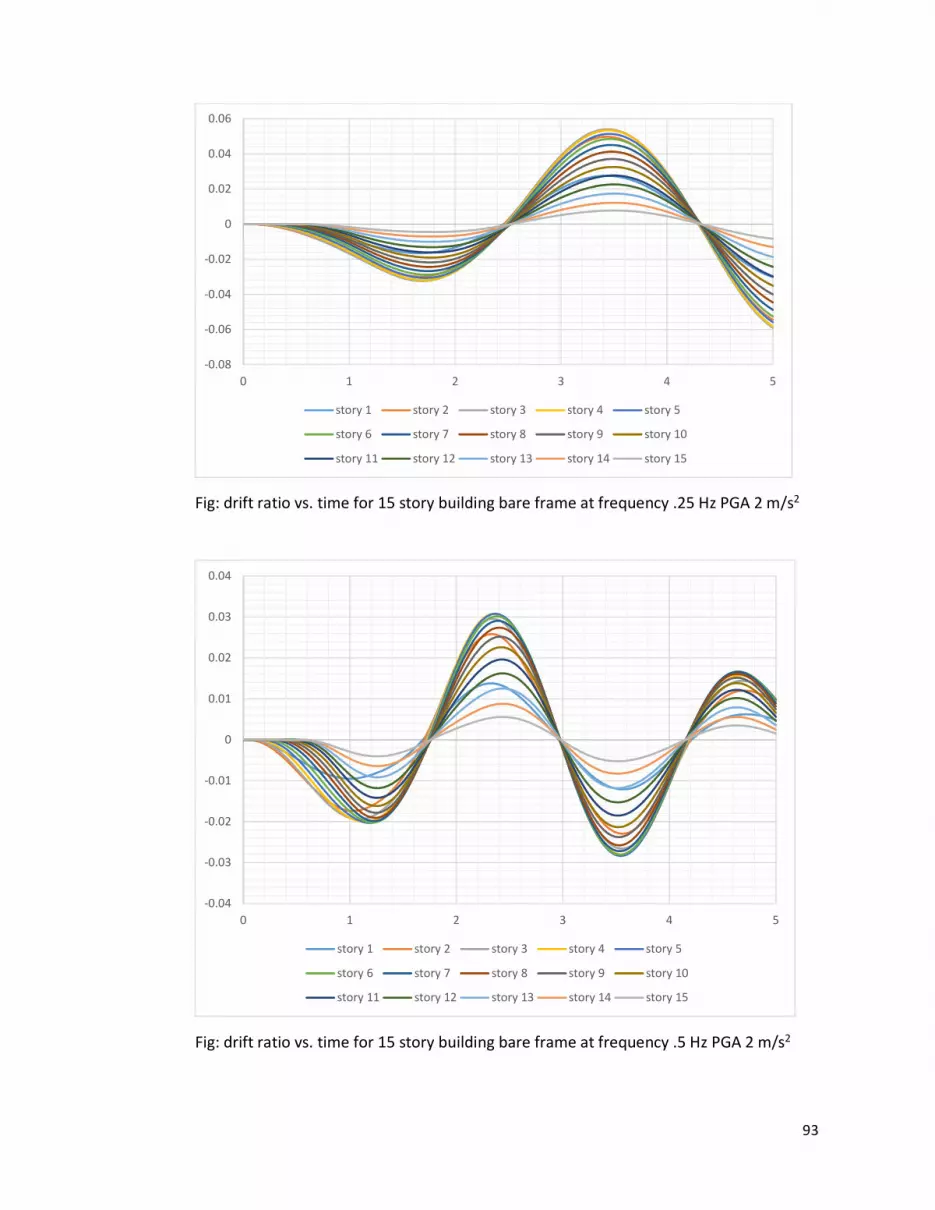
93
Fig: drift ratio vs. time for 15 story building bare frame at frequency .25 Hz PGA 2 m/s2
Fig: drift ratio vs. time for 15 story building bare frame at frequency .5 Hz PGA 2 m/s2
-0.08
-0.06
-0.04
-0.02
0
0.02
0.04
0.06
0 1 2 3 4 5
story 1 story 2 story 3 story 4 story 5
story 6 story 7 story 8 story 9 story 10
story 11 story 12 story 13 story 14 story 15
-0.04
-0.03
-0.02
-0.01
0
0.01
0.02
0.03
0.04
0 1 2 3 4 5
story 1 story 2 story 3 story 4 story 5
story 6 story 7 story 8 story 9 story 10
story 11 story 12 story 13 story 14 story 15

94
Fig: drift ratio vs. time for 15 story building bare frame at frequency .25 Hz PGA 3 m/s2
Fig: drift ratio vs. time for 15 story building bare frame at frequency .5 Hz PGA 3 m/s2
-0.1
-0.08
-0.06
-0.04
-0.02
0
0.02
0.04
0.06
0.08
0.1
0 1 2 3 4 5
story 1 story 2 story 3 story 4 story 5
story 6 story 7 story 8 story 9 story 10
story 11 story 12 story 13 story 14 story 15
-0.05
-0.04
-0.03
-0.02
-0.01
0
0.01
0.02
0.03
0.04
0.05
0.06
0 1 2 3 4 5
story 1 story 2 story 3 story 4 story 5
story 6 story 7 story 8 story 9 story 10
story 11 story 12 story 13 story 14 story 15

95
Fig: drift ratio vs. time for 15 story building bare frame at frequency 1 Hz PGA 3 m/s2
Fifteen story buildings soft story frames:
Fig: drift ratio vs. time for 15 story building soft story frame at frequency .5 Hz PGA 1
m/s2
-0.04
-0.03
-0.02
-0.01
0
0.01
0.02
0.03
0.04
0 1 2 3 4 5
story 1 story 2 story 3 story 4 story 5
story 6 story 7 story 8 story 9 story 10
story 11 story 12 story 13 story 14 story 15
-0.025
-0.02
-0.015
-0.01
-0.005
0
0.005
0.01
0.015
0.02
0.025
0 1 2 3 4 5
story 1 story 2 story 3 story 4 story 5
story 6 story 7 story 8 story 9 story 10
story 11 story 12 story 13 story 14 story 15

96
Fig: drift ratio vs. time for 15 story building soft story frame at frequency .5 Hz PGA 2
m/s2
Fig: drift ratio vs. time for 15 story building soft story frame at frequency .25 Hz PGA 3
m/s2
-0.05
-0.04
-0.03
-0.02
-0.01
0
0.01
0.02
0.03
0.04
0.05
0 1 2 3 4 5
story 1 story 2 story 3 story 4 story 5
story 6 story 7 story 8 story 9 story 10
story 11 story 12 story 13 story 14 story 15
-0.025
-0.02
-0.015
-0.01
-0.005
0
0.005
0.01
0.015
0.02
0.025
0 1 2 3 4 5
story 1 story 2 story 3 story 4 story 5
story 6 story 7 story 8 story 9 story 10
story 11 story 12 story 13 story 14 story 15

97
Fig: drift ratio vs. time for 15 story building soft story frame at frequency .5 Hz PGA 3
m/s2
Fifteen story buildings infilled frames:
-0.08
-0.06
-0.04
-0.02
0
0.02
0.04
0.06
0.08
0 1 2 3 4 5
story 2 story 3 story 4 story 5 story 6
story 7 story 8 story 9 story 10 story 11
story 12 story 13 story 14 story 15
-0.05
-0.04
-0.03
-0.02
-0.01
0
0.01
0.02
0.03
0.04
0 1 2 3 4 5
story 1 story 2 story 3 story 4 story 5
story 6 story 7 story 8 story 9 story 10
story 11 story 12 story 13 story 14 story 15

98
Fig: drift ratio vs. time for 15 story building infilled frame at frequency .5 Hz PGA 2 m/s2
Fig: drift ratio vs. time for 15 story building infilled frame at frequency .5 Hz PGA 3 m/s2
Fig: drift ratio vs. time for 15 story building infilled frame at frequency .75 Hz PGA 3 m/s2
-0.08
-0.06
-0.04
-0.02
0
0.02
0.04
0.06
0 1 2 3 4 5
story 1 story 2 story 3 story 4 story 5
story 6 story 7 story 8 story 9 story 10
story 11 story 12 story 13 story 14 story 15
-0.025
-0.02
-0.015
-0.01
-0.005
0
0.005
0.01
0.015
0.02
0.025
0 1 2 3 4 5
story 1 story 2 story 3 story 4 story 5
story 6 story 7 story 8 story 9 story 10
story 11 story 12 story 13 story 14 story 15

99
4.6.2 Frames with stronger infill Modulus of elasticity Em = 5625 N/mm2
Six story building bare frame:
Fig: drift ratio vs. time for 6 story building bare frame at frequency .5 Hz PGA 1 m/s2
Fig: drift ratio vs. time for 6 story building bare frame at frequency .25 Hz PGA 2 m/s2
-0.05
-0.04
-0.03
-0.02
-0.01
0
0.01
0.02
0.03
0.04
0.05
0 1 2 3 4 5
story 1 story 2 story 3 story 4 story 5 story 6
-0.04
-0.03
-0.02
-0.01
0
0.01
0.02
0.03
0 1 2 3 4 5
story 1 story 2 story 3 story 4 story 5 story 6

100
Fig: drift ratio vs. time for 6 story building bare frame at frequency .5 Hz PGA 2 m/s2
Fig: drift ratio vs. time for 6 story building bare frame at frequency .75 Hz PGA 2 m/s2
Fig: drift ratio vs. time for 6 story building bare frame at frequency .25 Hz PGA 3 m/s2
-0.12
-0.09
-0.06
-0.03
0
0.03
0.06
0.09
0 1 2 3 4 5
story 1 story 2 story 3 story 4 story 5 story 6
-0.045
-0.03
-0.015
0
0.015
0.03
0.045
0 1 2 3 4 5
story 1 story 2 story 3 story 4 story 5 story 6
-0.05
-0.04
-0.03
-0.02
-0.01
0
0.01
0.02
0.03
0.04
0 1 2 3 4 5
story 1 story 2 story 3 story 4 story 5 story 6

101
Fig: drift ratio vs. time for 6 story building bare frame at frequency .5 Hz PGA 3 m/s2
Fig: drift ratio vs. time for 6 story building bare frame at frequency .75 Hz PGA 3 m/s2
Fig: drift ratio vs. time for 6 story building bare frame at frequency 1 Hz PGA 3 m/s2
-0.16
-0.12
-0.08
-0.04
0
0.04
0.08
0.12
0.16
0 1 2 3 4 5
story 1 story 2 story 3 story 4 story 5 story 6
-0.08
-0.06
-0.04
-0.02
0
0.02
0.04
0.06
0 1 2 3 4 5
story 1 story 2 story 3 story 4 story 5 story 6
-0.03
-0.02
-0.01
0
0.01
0.02
0.03
0 1 2 3 4 5
story 1 story 2 story 3 story 4 story 5 story 6

102
Fig: drift ratio vs. time for 6 story building bare frame at frequency 1.5 Hz PGA 3 m/s2
Fig: drift ratio vs. time for 6 story building bare frame at frequency 1.75 Hz PGA 3 m/s2
-0.03
-0.02
-0.01
0
0.01
0.02
0.03
0 1 2 3 4 5
story 1 story 2 story 3 story 4 story 5 story 6
-0.03
-0.02
-0.01
0
0.01
0.02
0.03
0 1 2 3 4 5
story 1 story 2 story 3 story 4 story 5 story 6

103
Six story buildings soft story frames:
Fig: drift ratio vs. time for 6 story building soft story frame at frequency .75 Hz PGA 1
m/s2
Fig: drift ratio vs. time for 6 story building soft story frame at frequency 1 Hz PGA 1 m/s2
-0.05
-0.04
-0.03
-0.02
-0.01
0
0.01
0.02
0.03
0.04
0.05
0 1 2 3 4 5
story 1 story 2 story 3 story 4 story 5 story 6
-0.03
-0.02
-0.01
0
0.01
0.02
0.03
0 1 2 3 4 5
story 1 story 2 story 3 story 4 story 5 story 6

104
Fig: drift ratio vs. time for 6 story building soft story frame at frequency .5 Hz PGA 2 m/s2
Fig: drift ratio vs. time for 6 story building soft story frame at frequency .75 Hz PGA 2
m/s2
-0.04
-0.03
-0.02
-0.01
0
0.01
0.02
0.03
0.04
0 1 2 3 4 5
story 1 story 2 story 3 story 4 story 5 story 6
-0.1
-0.08
-0.06
-0.04
-0.02
0
0.02
0.04
0.06
0.08
0.1
0 1 2 3 4 5
story 1 story 2 story 3 story 4 story 5 story 6

105
Fig: drift ratio vs. time for 6 story building soft story frame at frequency 1 Hz PGA 2 m/s2
Fig: drift ratio vs. time for 6 story building soft story frame at frequency 1.25 Hz PGA 2
m/s2
-0.06
-0.04
-0.02
0
0.02
0.04
0.06
0 1 2 3 4 5
story 1 story 2 story 3 story 4 story 5 story 6
-0.03
-0.02
-0.01
0
0.01
0.02
0.03
0 1 2 3 4 5
story 1 story 2 story 3 story 4 story 5 story 6

106
Fig: drift ratio vs. time for 6 story building soft story frame at frequency .25 Hz PGA 3
m/s2
Fig: drift ratio vs. time for 6 story building soft story frame at frequency .5 Hz PGA 3 m/s2
-0.04
-0.03
-0.02
-0.01
0
0.01
0.02
0.03
0 1 2 3 4 5
story 1 story 2 story 3 story 4 story 5 story 6
-0.05
-0.04
-0.03
-0.02
-0.01
0
0.01
0.02
0.03
0.04
0.05
0.06
0 1 2 3 4 5
story 1 story 2 story 3 story 4 story 5 story 6

107
Fig: drift ratio vs. time for 6 story building soft story frame at frequency .75 Hz PGA 3
m/s2
Fig: drift ratio vs. time for 6 story building soft story frame at frequency 1 Hz PGA 3 m/s2
Fig: drift ratio vs. time for 6 story building soft story frame at frequency 1.25 Hz PGA 3
m/s2
-0.15
-0.1
-0.05
0
0.05
0.1
0.15
0 1 2 3 4 5
story 1 story 2 story 3 story 4 story 5 story 6
-0.1
-0.08
-0.06
-0.04
-0.02
0
0.02
0.04
0.06
0.08
0.1
0 1 2 3 4 5
story 1 story 2 story 3 story 4 story 5 story 6
-0.04
-0.03
-0.02
-0.01
0
0.01
0.02
0.03
0.04
0 1 2 3 4 5
story 1 story 2 story 3 story 4 story 5 story 6

108
Fig: drift ratio vs. time for 6 story building soft story frame at frequency 1.5 Hz PGA 3
m/s2
Six story building infilled frame:
Fig: drift ratio vs. time for 6 story building infilled frame at frequency 1.5 Hz PGA 3 m/s2
-0.025
-0.02
-0.015
-0.01
-0.005
0
0.005
0.01
0.015
0.02
0.025
0 1 2 3 4 5
story 1 story 2 story 3 story 4 story 5 story 6
-0.025
-0.02
-0.015
-0.01
-0.005
0
0.005
0.01
0.015
0.02
0.025
0 1 2 3 4 5
story 1 story 2 story 3 story 4 story 5 story 6

109
Nine story buildings bare frames:
Fig: drift ratio vs. time for 9 story building bare frame at frequency .5 Hz PGA 1 m/s2
Fig: drift ratio vs. time for 9 story building bare frame at frequency .25 Hz PGA 2 m/s2
-0.04
-0.03
-0.02
-0.01
0
0.01
0.02
0.03
0.04
0 1 2 3 4 5
story 1 story 2 story 3 story 4 story 5
story 6 story 7 story 8 story 9
-0.04
-0.03
-0.02
-0.01
0
0.01
0.02
0.03
0.04
0 1 2 3 4 5
story 1 story 2 story 3 story 4 story 5
story 6 story 7 story 8 story 9

110
Fig: drift ratio vs. time for 9 story building bare frame at frequency .5 Hz PGA 2 m/s2
Fig: drift ratio vs. time for 9 story building bare frame at frequency .75 Hz PGA 2 m/s2
Fig: drift ratio vs. time for 9 story building bare frame at frequency .25 Hz PGA 3 m/s2
-0.08
-0.06
-0.04
-0.02
0
0.02
0.04
0.06
0.08
0 1 2 3 4 5
story 1 story 2 story 3 story 4 story 5
story 6 story 7 story 8 story 9
-0.02
-0.01
0
0.01
0.02
0.03
0 1 2 3 4 5
story 1 story 2 story 3 story 4 story 5
story 6 story 7 story 8 story 9
-0.06
-0.04
-0.02
0
0.02
0.04
0.06
0 1 2 3 4 5
story 1 story 2 story 3 story 4 story 5
story 6 story 7 story 8 story 9

111
Fig: drift ratio vs. time for 9 story building bare frame at frequency .5 Hz PGA 3 m/s2
Fig: drift ratio vs. time for 9 story building bare frame at frequency .75 Hz PGA 3 m/s2
-0.12
-0.09
-0.06
-0.03
0
0.03
0.06
0.09
0.12
0 1 2 3 4 5
story 1 story 2 story 3 story 4 story 5
story 6 story 7 story 8 story 9
-0.03
-0.02
-0.01
0
0.01
0.02
0.03
0.04
0 1 2 3 4 5
story 1 story 2 story 3 story 4 story 5
story 6 story 7 story 8 story 9

112
Fig: drift ratio vs. time for 9 story building bare frame at frequency 1.5 Hz PGA 3 m/s2
Nine story buildings soft story frames:
Fig: drift ratio vs. time for 9 story building soft story frame at frequency .75 Hz PGA 1
m/s2
-0.03
-0.02
-0.01
0
0.01
0.02
0.03
0 1 2 3 4 5
story 1 story 2 story 3 story 4 story 5
story 6 story 7 story 8 story 9
-0.03
-0.02
-0.01
0
0.01
0.02
0.03
0 1 2 3 4 5
story 1 story 2 story 3 story 4 story 5
story 6 story 7 story 8 story 9

113
Fig: drift ratio vs. time for 9 story building soft story frame at frequency 1 Hz PGA 1 m/s2
Fig: drift ratio vs. time for 9 story building soft story frame at frequency .5 Hz PGA 2 m/s2
-0.03
-0.02
-0.01
0
0.01
0.02
0.03
0 1 2 3 4 5
story 1 story 2 story 3 story 4 story 5
story 6 story 7 story 8 story 9
-0.02
-0.015
-0.01
-0.005
0
0.005
0.01
0.015
0.02
0.025
0 1 2 3 4 5
story 1 story 2 story 3 story 4 story 5
story 6 story 7 story 8 story 9

114
Fig: drift ratio vs. time for 9 story building soft story frame at frequency .75 Hz PGA 2
m/s2
Fig: drift ratio vs. time for 9 story building soft story frame at frequency 1 Hz PGA 2 m/s2
-0.06
-0.04
-0.02
0
0.02
0.04
0.06
0 1 2 3 4 5
story 1 story 2 story 3 story 4 story 5
story 6 story 7 story 8 story 9
-0.06
-0.04
-0.02
0
0.02
0.04
0.06
0 1 2 3 4 5
story 1 story 2 story 3 story 4 story 5
story 6 story 7 story 8 story 9

115
Fig: drift ratio vs. time for 9 story building soft story frame at frequency .5 Hz PGA 3 m/s2
Fig: drift ratio vs. time for 9 story building soft story frame at frequency .75 Hz PGA 3
m/s2
-0.03
-0.02
-0.01
0
0.01
0.02
0.03
0.04
0 1 2 3 4 5
story 1 story 2 story 3 story 4 story 5
story 6 story 7 story 8 story 9
-0.08
-0.06
-0.04
-0.02
0
0.02
0.04
0.06
0.08
0 1 2 3 4 5
story 1 story 2 story 3 story 4 story 5
story 6 story 7 story 8 story 9

116
Fig: drift ratio vs. time for 9 story building soft story frame at frequency 1 Hz PGA 3 m/s2
Fig: drift ratio vs. time for 9 story building soft story frame at frequency 1.25 Hz PGA 3
m/s2
-0.08
-0.06
-0.04
-0.02
0
0.02
0.04
0.06
0.08
0 1 2 3 4 5
story 1 story 2 story 3 story 4 story 5
story 6 story 7 story 8 story 9
-0.04
-0.03
-0.02
-0.01
0
0.01
0.02
0.03
0.04
0 1 2 3 4 5
story 1 story 2 story 3 story 4 story 5
story 6 story 7 story 8 story 9

117
Nine story building infilled frame:
Fig: drift ratio vs. time for 9 story building soft story frame at frequency 1.25 Hz PGA 3
m/s2
Twelve story building bare frame:
Fig: drift ratio vs. time for 12 story building bare frame at frequency .25 Hz PGA 1 m/s2
-0.03
-0.02
-0.01
0
0.01
0.02
0.03
0 1 2 3 4 5
story 1 story 2 story 3 story 4 story 5
story 6 story 7 story 8 story 9
-0.03
-0.02
-0.01
0
0.01
0.02
0.03
0 1 2 3 4 5
story 1 story 2 story 3 story 4 story 5 story 6
story 7 story 8 story 9 story 10 story 11 story 12

118
Fig: drift ratio vs. time for 12 story building bare frame at frequency .5 Hz PGA 1 m/s2
Fig: drift ratio vs. time for 12 story building bare frame at frequency .25 Hz PGA 2 m/s2
-0.03
-0.02
-0.01
0
0.01
0.02
0.03
0 1 2 3 4 5
story 1 story 2 story 3 story 4 story 5 story 6
story 7 story 8 story 9 story 10 story 11 story 12
-0.05
-0.04
-0.03
-0.02
-0.01
0
0.01
0.02
0.03
0.04
0.05
0 1 2 3 4 5
story 1 story 2 story 3 story 4 story 5 story 6
story 7 story 8 story 9 story 10 story 11 story 12

119
Fig: drift ratio vs. time for 12 story building bare frame at frequency .5 Hz PGA 2 m/s2
Fig: drift ratio vs. time for 12 story building bare frame at frequency .25 Hz PGA 3 m/s2
-0.06
-0.04
-0.02
0
0.02
0.04
0.06
0 1 2 3 4 5
story 1 story 2 story 3 story 4 story 5 story 6
story 7 story 8 story 9 story 10 story 11 story 12
-0.08
-0.06
-0.04
-0.02
0
0.02
0.04
0.06
0.08
0 1 2 3 4 5
story 1 story 2 story 3 story 4 story 5 story 6
story 7 story 8 story 9 story 10 story 11 story 12

120
Fig: drift ratio vs. time for 12 story building bare frame at frequency .5 Hz PGA 3 m/s2
Fig: drift ratio vs. time for 12 story building bare frame at frequency .75 Hz PGA 3 m/s2
-0.08
-0.06
-0.04
-0.02
0
0.02
0.04
0.06
0.08
0 1 2 3 4 5
story 1 story 2 story 3 story 4 story 5 story 6
story 7 story 8 story 9 story 10 story 11 story 12
-0.03
-0.02
-0.01
0
0.01
0.02
0.03
0 1 2 3 4 5
story 1 story 2 story 3 story 4 story 5 story 6
story 7 story 8 story 9 story 10 story 11 story 12

121
Fig: drift ratio vs. time for 12 story building bare frame at frequency 1.25 Hz PGA 3 m/s2
Twelve story buildings soft story frames:
Fig: drift ratio vs. time for 12 story building soft story frame at frequency .75 Hz PGA 1
m/s2
-0.03
-0.02
-0.01
0
0.01
0.02
0.03
0 1 2 3 4 5
story 1 story 2 story 3 story 4 story 5 story 6
story 7 story 8 story 9 story 10 story 11 story 12
-0.03
-0.02
-0.01
0
0.01
0.02
0.03
0 1 2 3 4 5
story 1 story 2 story 3 story 4 story 5 story 6
story 7 story 8 story 9 story 10 story 11 story 12

122
Fig: drift ratio vs. time for 12 story building soft story frame at frequency .75 Hz PGA 2
m/s2
Fig: drift ratio vs. time for 12 story building soft story frame at frequency .5 Hz PGA 3
m/s2
-0.06
-0.04
-0.02
0
0.02
0.04
0.06
0 1 2 3 4 5
story 1 story 2 story 3 story 4 story 5 story 6
story 7 story 8 story 9 story 10 story 11 story 12
-0.03
-0.02
-0.01
0
0.01
0.02
0.03
0.04
0 1 2 3 4 5
story 1 story 2 story 3 story 4 story 5 story 6
story 7 story 8 story 9 story 10 story 11 story 12

123
Fig: drift ratio vs. time for 12 story building soft story frame at frequency .75 Hz PGA 3
m/s2
Fig: drift ratio vs. time for 12 story building soft story frame at frequency 1 Hz PGA 3
m/s2
-0.1
-0.08
-0.06
-0.04
-0.02
0
0.02
0.04
0.06
0.08
0 1 2 3 4 5
story 1 story 2 story 3 story 4 story 5 story 6
story 7 story 8 story 9 story 10 story 11 story 12
-0.03
-0.02
-0.01
0
0.01
0.02
0.03
0 1 2 3 4 5
story 1 story 2 story 3 story 4 story 5 story 6
story 7 story 8 story 9 story 10 story 11 story 12

124
Twelve story buildings infilled frames:
Fig: drift ratio vs. time for 12 story building soft story frame at frequency .75 Hz PGA 3
m/s2
Fifteen story buildings bare frames:
Fig: drift ratio vs. time for 15 story building bare frame at frequency .25 Hz PGA 1 m/s2
-0.03
-0.02
-0.01
0
0.01
0.02
0.03
0 1 2 3 4 5
story 1 story 2 story 3 story 4 story 5 story 6
story 7 story 8 story 9 story 10 story 11 story 12
-0.04
-0.03
-0.02
-0.01
0
0.01
0.02
0.03
0 1 2 3 4 5
story 1 story 2 story 3 story 4 story 5
story 6 story 7 story 8 story 9 story 10
story 11 story 12 story 13 story 14 story 15

125
Fig: drift ratio vs. time for 15 story building bare frame at frequency .25 Hz PGA 2 m/s2
Fig: drift ratio vs. time for 15 story building bare frame at frequency .5 Hz PGA 2 m/s2
-0.08
-0.06
-0.04
-0.02
0
0.02
0.04
0.06
0 1 2 3 4 5
story 1 story 2 story 3 story 4 story 5
story 6 story 7 story 8 story 9 story 10
story 11 story 12 story 13 story 14 story 15
-0.04
-0.03
-0.02
-0.01
0
0.01
0.02
0.03
0.04
0 1 2 3 4 5
story 1 story 2 story 3 story 4 story 5
story 6 story 7 story 8 story 9 story 10
story 11 story 12 story 13 story 14 story 15

126
Fig: drift ratio vs. time for 15 story building bare frame at frequency .25 Hz PGA 3 m/s2
Fig: drift ratio vs. time for 15 story building bare frame at frequency .5 Hz PGA 3 m/s2
-0.1
-0.08
-0.06
-0.04
-0.02
0
0.02
0.04
0.06
0.08
0.1
0 1 2 3 4 5
story 1 story 2 story 3 story 4 story 5
story 6 story 7 story 8 story 9 story 10
story 11 story 12 story 13 story 14 story 15
-0.05
-0.04
-0.03
-0.02
-0.01
0
0.01
0.02
0.03
0.04
0.05
0.06
0 1 2 3 4 5
story 1 story 2 story 3 story 4 story 5
story 6 story 7 story 8 story 9 story 10
story 11 story 12 story 13 story 14 story 15

127
Fig: drift ratio vs. time for 15 story building bare frame at frequency 1 Hz PGA 3 m/s2
Fifteen story buildings soft story frames:
Fig: drift ratio vs. time for 15 story building soft story frame at frequency .75 Hz PGA 2
m/s2
-0.045
-0.03
-0.015
0
0.015
0.03
0.045
0 1 2 3 4 5
story 1 story 2 story 3 story 4 story 5
story 6 story 7 story 8 story 9 story 10
story 11 story 12 story 13 story 14 story 15
-0.03
-0.02
-0.01
0
0.01
0.02
0.03
0 1 2 3 4 5
story 1 story 2 story 3 story 4 story 5
story 6 story 7 story 8 story 9 story 10
story 11 story 12 story 13 story 14 story 15

128
Fig: drift ratio vs. time for 15 story building soft story frame at frequency .5 Hz PGA 3
m/s2
Fig: drift ratio vs. time for 15 story building soft story frame at frequency .75 Hz PGA 3
m/s2
-0.045
-0.03
-0.015
0
0.015
0.03
0.045
0 1 2 3 4 5
story 1 story 2 story 3 story 4 story 5
story 6 story 7 story 8 story 9 story 10
story 11 story 12 story 13 story 14 story 15
-0.045
-0.03
-0.015
0
0.015
0.03
0.045
0 1 2 3 4 5
story 1 story 2 story 3 story 4 story 5
story 6 story 7 story 8 story 9 story 10
story 11 story 12 story 13 story 14 story 15

129
Fifteen story buildings infilled frames:
Fig: drift ratio vs. time for 15 story building infilled frame at frequency .75 Hz PGA 2 m/s2
Fig: drift ratio vs. time for 15 story building infilled frame at frequency .75 Hz PGA 3 m/s2
-0.03
-0.02
-0.01
0
0.01
0.02
0.03
0 1 2 3 4 5
story 1 story 2 story 3 story 4 story 5
story 6 story 7 story 8 story 9 story 10
story 11 story 12 story 13 story 14 story 15
-0.045
-0.03
-0.015
0
0.015
0.03
0.045
0 1 2 3 4 5
story 1 story 2 story 3 story 4 story 5
story 6 story 7 story 8 story 9 story 10
story 11 story 12 story 13 story 14 story 15

130
4.7 Comparison of collapse time for different types of frames UBC limitation on maximum drift ratio is .02 for long period (≥ .7s) structures. From time
history of drift ratio graph (preceding sections; 4.6.1 and 4.6.2) the time taken to reach
this limitation is found out. This times are plotted against input frequency for all peak
ground accelerations levels. All buildings did not reach the drift ratio limitation of .02.
4.7.1 Bare frames
Fig: Collapse time vs. frequency for bare frame at PGA 1 m/s2
Fig: Collapse time vs. frequency for bare frame at PGA 2 m/s2
0
0.5
1
1.5
2
2.5
3
3.5
0 0.5 1 1.5 2
tim
e (s
)
Input frequency (Hz)
6 story 9 story 12 story 15 story
0
0.5
1
1.5
2
2.5
3
0 0.5 1 1.5 2
tim
e (s
)
Input frequency (Hz)
6 story 9 story 12 story 15 story

131
Fig: Collapse time vs. frequency for bare frame at PGA 3 m/s2
4.7.2 Soft story frames
Fig: Collapse time vs. frequency for soft story frame at PGA 1 m/s2
0
0.5
1
1.5
2
2.5
3
0 0.5 1 1.5 2
tim
e (s
)
Input frequency (Hz)
6 story 9 story 12 story 15 story
0
1
2
3
4
5
6
0 0.5 1 1.5 2
Tim
e (s
)
frequency (Hz)
6story infill moe 1875 N/mm^2 6story infill moe 5625 N/mm^2
9story infill moe 1875 N/mm^2 9story infill moe 5625 N/mm^2
12story infill moe 1875 N/mm^2 12story infill moe 5625 N/mm^2
15story infill moe 1875 N/mm^2 15story infill moe 5625 N/mm^2

132
Fig: Collapse time vs. frequency for soft story frame at PGA 2 m/s2
Fig: Collapse time vs. frequency for soft story frame at PGA 3 m/s2
0
0.5
1
1.5
2
2.5
3
0 0.5 1 1.5 2
Tim
e (s
)
frequency (Hz)
6story infill moe 1875 N/mm^2 6story infill moe 5625 N/mm^2
9story infill moe 1875 N/mm^2 9story infill moe 5625 N/mm^2
12story infill moe 1875 N/mm^2 12story infill moe 5625 N/mm^2
15story infill moe 1875 N/mm^2 15story infill moe 5625 N/mm^2
0
0.5
1
1.5
2
2.5
3
3.5
4
0 0.5 1 1.5 2
Tim
e (s
)
frequency (Hz)
6story infill moe 1875 N/mm^2 6story infill moe 5625 N/mm^2
9story infill moe 1875 N/mm^2 9story infill moe 5625 N/mm^2
12story infill moe 1875 N/mm^2 12story infill moe 5625 N/mm^2
15story infill moe 1875 N/mm^2 15story infill moe 5625 N/mm^2

133
4.7.3 Infilled frames
Fig: Collapse time vs. frequency for infilled frame at PGA 1 m/s2
Fig: Collapse time vs. frequency for infilled frame at PGA 2 m/s2
2.3
2.35
2.4
2.45
2.5
2.55
2.6
2.65
2.7
0 0.5 1 1.5 2
Tim
e (s
)
frequency (Hz)
6story infill moe 1875 N/mm^2 6story infill moe 5625 N/mm^2
9story infill moe 1875 N/mm^2 9story infill moe 5625 N/mm^2
12story infill moe 1875 N/mm^2 12story infill moe 5625 N/mm^2
15story infill moe 1875 N/mm^2 15story infill moe 5625 N/mm^2
0
0.5
1
1.5
2
2.5
3
3.5
4
4.5
0 0.5 1 1.5 2
Tim
e (s
)
frequency (Hz)
6story infill moe 1875 N/mm^2 6story infill moe 5625 N/mm^2
9story infill moe 1875 N/mm^2 9story infill moe 5625 N/mm^2
12story infill moe 1875 N/mm^2 12story infill moe 5625 N/mm^2
15story infill moe 1875 N/mm^2 15story infill moe 5625 N/mm^2

134
Fig: Collapse time vs. frequency for infilled frame at PGA 3 m/s2
0
0.5
1
1.5
2
2.5
3
3.5
4
0 0.5 1 1.5 2
Tim
e (s
)
frequency (Hz)
6story infill moe 1875 N/mm^2 6story infill moe 5625 N/mm^2
9story infill moe 1875 N/mm^2 9story infill moe 5625 N/mm^2
12story infill moe 1875 N/mm^2 12story infill moe 5625 N/mm^2
15story infill moe 1875 N/mm^2 15story infill moe 5625 N/mm^2

135
CHAPTER FIVE
CONCLUSIONS AND RECOMMENDATIONS
5.1 Conclusions:
5.1.1 Natural frequency of frames:
1. The natural frequency found by the formula provided in BNBC 1993 and
2010 is almost the same for 6 and 9 story buildings but there is small
difference for 12 and 15 story buildings.
2. In case of bare frames, natural frequency obtained by modal analysis are
much less than those obtained by formula provided in BNBC 1993 and
2010. The natural frequency decreases gradually as height of frame
increases.
3. For frames with weaker infill (Em = 1875 N/mm2) the natural frequencies
are closer to values obtained from formula provided in BNBC 1993 and
2010. But the difference is prominent. As the height increases, the natural
frequencies for both soft story and infilled frame are very close.
4. For frames with stronger infill (Em = 5625 N/mm2), natural frequencies
obtained for infilled frame is almost the same as values found from the
formula provided in BNBC 1993 and 2010. In case of soft story frame, as
height increases, the values approaches rapidly to the natural frequencies
obtained from BNBC 1993 and 2010.
5.1.2 Interstory drift ratio of frames:
1. In all cases infilled frames achieves the least interstory drift ratio.
2. For all frames, the UBC specified limitation on interstory drift ratio is
obtained at frequency level 1.5 Hz or lesser. One six story building bare
frame reached this value on frequency level 1.75 Hz on PGA 1m/s2.
3. For all frames maximum drift ratio is obtained at frequency ratio 1 as
expected.
4. For infilled frames buildings up to 12 story with weaker infill and at
frequency level .25, .5, .75 Hz the maximum interstory drift ratio is always
greater than buildings with stronger infill.
5. For 15 story buildings with weaker infill (both soft story and infilled frame)
maximum drift ratios are very close but in cases with stronger infill soft
story frames were subjected to greater interstory drift ratio.
6. Maximum interstory drift ratio of bare frame is always greater than soft
story and infilled frame with respect to frequency ratio.

136
7. From the drift ratio vs. time and story no vs. drift ratio graphs the soft story
effect can be easily observed. The drift ratio at level 1 is much larger than
drift ratios at other levels. But in case of 15 story buildings with weaker
infills the difference in drift ratio between level 1 and other levels is not
prominent.
5.1.3 Time of collapse for different frames:
1. The time of collapse increases with story height for a frame with certain
type of infill for a given frequency in case of all peak ground acceleration
level.
2. Frames with weaker infill collapses faster than frames with stronger infill.
3. Maximum time of collapse for a bare frame, soft story frame and infilled
frame is 3.155s for a 12 story building, 4.81s for a 15 story building and
4.04s for a 15 story building respectively.
4. Minimum time of collapse for a bare frame, soft story frame and infilled
frame is .49s for a 6 story building, .34s for a soft story building and 1.235s
for a 6 story building respectively.
5.2 Recommendations for future work:
1. Only plane frame is considered in this study. A more rigorous three-dimensional
study considering out-of-plane strength and stiffness of masonry can be carried
out.
2. This study was carried out for harmonic loads only. Arrangements should be made
to input more general and realistic time series or amplitude spectra of seismic
behavior.
3. Only three types of frames are studied. As soft story can occur in any floor, other
frames having different infill orientation in the upper story can be investigated.
4. Column base is assumed to be fixed at bottom. In reality it is surrounded by soil,
so, more work can be done considering soil-foundation-structure interaction.
5. Presence of openings within the infill due to doors and windows can be
incorporated.

137
REFERENCES
Adel Ziada, Mohamed Laid Samai, Abdelhadi Tekkouk The Effect of Masonry Infill Walls on the Seismic Response of Reinforced Concrete Frames ISBN 978-93-84422-22-6 Proceedings of 2015 International Conference on Innovations in Civil and Structural Engineering (ICICSE'15) Istanbul (Turkey), June 3-4, 2015 pp. 264-271 C V R MURTY and Sudhir K JAIN beneficial influence of masonry infill walls on seismic performance of RC frame buildings Gary R. Searer and Sigmund A. Freeman Design Drift Requirements for Long-Period Structures 13th World Conference on Earthquake Engineering Vancouver, B.C., Canada August 1-6, 2004 Paper No. 3292 Hossain Mohammad Muyeed-Ul-Azam and Khan Mahmud Amanat Effect of Infill as a Structural Component on the Column Design of Multi-Storied Building Hossein Mostafaei and Toshimi Kabeyasawa Effect of Infill Masonry Walls on the Seismic Response of Reinforced Concrete Buildings Subjected to the Bam Earthquake Strong Motion: A Case Study of Bam Telephone Center Bull. Earthq. Res. Inst. Univ. Tokyo vol. 79 (2004) pp.133-156 L. Teresa Guevara-Perez “Soft Story” and “Weak Story” in Earthquake Resistant Design: A Multidisciplinary Approach 15WCEE lisboa 2012 M.Y.H. Bangash Earthquake resistant buildings, springer Mohammad H. Jinya1, V. R. Patel Analysis of RC Frame with and without Masonry Infill Wall With Different Stiffness With Outer Central Opening IJRET: International Journal of Research in Engineering and Technology eISSN: 2319-1163 | pISSN: 2321-7308 N. AL-Mekhlafy et al., Equivalent strut width for modeling R.C. infilled frames, pp. 851 – 866 P.G. Asteris and D.M. Cotsovos Numerical Investigation of the Effect of Infill Walls on the Structural Response of RC Frames The Open Construction and Building Technology Journal, 2012, 6, (Suppl 1-M11) 164-181 P.G. Asteris Finite Element Micro-Modeling of Infilled Frames electronic journal of structural engineering (8) 2008 Sinan Akkar; Ufuk Yazgan; and Polat Gülkan Drift Estimates in Frame Buildings Subjected to Near-Fault Ground Motions 1014 / JOURNAL OF STRUCTURAL ENGINEERING © ASCE / JULY 2005