harnessing hydropower: literature review
TRANSCRIPT

HARNESSING
HYDROPOWER:
Literature Review
D. Lumbroso, A. Hurford, J. Winpenny and S. Wade
August 2014

This report has been produced for Evidence on Demand with the assistance of the UK Department for International Development (DFID) contracted through the Climate, Environment, Infrastructure and Livelihoods Professional Evidence and Applied Knowledge Services (CEIL PEAKS) programme, jointly managed by DAI (which incorporates HTSPE Limited) and IMC Worldwide Limited. The views expressed in the report are entirely those of the author and do not necessarily represent DFID’s own views or policies, or those of Evidence on Demand. Comments and discussion on items related to content and opinion should be addressed to the author, via [email protected] Your feedback helps us ensure the quality and usefulness of all knowledge products. Please email [email protected] and let us know whether or not you have found this material useful; in what ways it has helped build your knowledge base and informed your work; or how it could be improved.
DOI:http://dx.doi.org/10.12774/eod_cr.august2014.lumbrosoetal1
First published November 2014 © CROWN COPYRIGHT

i
Contents
Executive Summary ...................................................................................................vi
Glossary of terms .......................................................................................................ix
SECTION 1 ................................................................................................................ 1
Introduction ................................................................................................................ 1
1.1 Objectives ............................................................................................................ 1
1.2 Background to renewable sources of energy ....................................................... 2
1.3 Background to hydropower schemes ................................................................... 3
1.3.1 The principles of hydropower ............................................................................ 3
1.3.2 Types of hydropower plants .............................................................................. 4
1.3.3 Construction, operation and maintenance costs of hydropower schemes ......... 5
1.4 International hydropower potential ....................................................................... 7
1.5 Background to the impacts of climate change on hydropower ............................. 8
1.6 Background to the status of hydropower in DFID’s priority countries ................... 9
1.7 The water – energy – food security nexus .......................................................... 12
1.7.1 Background ..................................................................................................... 12
1.7.2 Guiding principles of the water – energy – food security nexus ...................... 12
SECTION 2 .............................................................................................................. 14
Measures of hydropower performance ..................................................................... 14
2.1 Introduction ........................................................................................................ 14
2.2 Power generation ............................................................................................... 14
2.3 Economic impacts .............................................................................................. 19
2.4 Social and environmental impacts ...................................................................... 20
2.4.1 Introduction ..................................................................................................... 20
2.4.2 Social impacts ................................................................................................. 21
2.4.3 Environmental impacts .................................................................................... 22
2.5 Water use ........................................................................................................... 25
2.6 Greenhouse gas emissions ................................................................................ 26
SECTION 3 .............................................................................................................. 29
Factors affecting hydropower performance .............................................................. 29
3.1 Introduction ........................................................................................................ 29
3.2 Funding mechanisms ......................................................................................... 29
3.2.1 Public and private: Concepts and definitions ................................................... 29
3.2.2 Ownership ....................................................................................................... 30

ii
3.2.3 Finance ........................................................................................................... 30
3.2.4 The nature and extent of private sector involvement in hydropower projects .. 30
3.2.5 Reasons for publicly funding hydropower projects .......................................... 31
3.2.6 The performance of publically and privately funded hydropower projects ....... 31
3.2.7 Trends in the funding and development of hydropower projects ..................... 32
3.3 Physical and environmental factors .................................................................... 34
3.3.1 Hydrology ........................................................................................................ 34
3.3.2 Sedimentation ................................................................................................. 36
3.3.3 Climate variability ............................................................................................ 38
3.4 Climate change .................................................................................................. 39
3.5 Availability of hydrological data .......................................................................... 45
3.6 Operation and maintenance ............................................................................... 46
3.7 Multi-purpose and single purpose schemes ....................................................... 47
SECTION 4 .............................................................................................................. 48
Enhancing the performance of hydropower .............................................................. 48
4.1 Introduction ........................................................................................................ 48
4.2 Strengthening and improving the planning process at a catchment level ........... 48
4.3 Rehabilitation of existing hydropower infrastructure ........................................... 49
4.4 Enhancing the operation of existing hydropower infrastructure .......................... 50
4.4.1 The use of flow forecasting to increase electricity generation ......................... 50
4.4.2 Mitigating social and environmental impacts ................................................... 50
4.5 Sediment management ...................................................................................... 51
4.6 Recent innovations in hydropower technology ................................................... 53
4.6.1 Introduction ..................................................................................................... 53
4.6.2 Variable-speed turbines .................................................................................. 53
4.6.3 Fish-friendly turbines ....................................................................................... 54
4.6.4 Improvements in materials .............................................................................. 54
4.6.5 Tunnelling technology ..................................................................................... 54
4.6.6 Use of small scale hydropower........................................................................ 54
4.7 Utilisation of greenhouse gas emissions from hydropower reservoirs ................ 55
4.8 Improved stakeholder engagement and local benefit sharing ............................ 55
SECTION 5 .............................................................................................................. 57
Hydropower and the water - energy - food security nexus ....................................... 57
5.1 Introduction ........................................................................................................ 57
5.2 A comparison of hydropower with other power generation technologies ............ 59
iii
5.2.1 Introduction ..................................................................................................... 59
5.2.2 Levelised costs of power generation ............................................................... 60
5.2.3 Water use ........................................................................................................ 61
5.2.4 Greenhouse gas emissions ............................................................................. 63
5.2.5 The challenges of comparing different power generation technologies ........... 64
5.3 Trade off analysis techniques used to assess the position of hydropower in the water – energy – food nexus .................................................................................... 64
5.3.1 Introduction ..................................................................................................... 64
5.3.2 Background to some trade off techniques ....................................................... 65
SECTION 6 .............................................................................................................. 69
Criteria used for the selection of the case studies .................................................... 69
SECTION 7 .............................................................................................................. 71
Conclusions and research gaps ............................................................................... 71
7.1 Conclusions ........................................................................................................ 71
7.2 Research gaps ................................................................................................... 73
References ............................................................................................................... 76
List of Boxes Box 1 The impacts of the 1991-1992 drought on hydropower generation in Zambia and Zimbabwe ........................................................................................................................... 17 Box 2 Shortfall in predicted power generation at Victoria hydropower scheme in Sri Lanka 19 Box 3 Social impacts of Nangbeto hydropower scheme, Togo ............................................ 22 Box 4 Contrasting environmental impacts of two large hydropower projects ....................... 23 Box 5 Southern African Power Pool’s (SAPP) environmental and social impact assessment guidelines for hydropower projects ...................................................................................... 24 Box 6 International Hydropower Association’s (IHA) hydropower sustainability assessment protocol ............................................................................................................................... 24 Box 7 The impacts of the Aswan Dam in Egypt on the geomorphology of the River Nile downstream ........................................................................................................................ 38 Box 8 The impacts of rehabilitation on power generation for the Trushuli-Devighat hydropower scheme in Nepal .............................................................................................. 50 Box 9 Use of payment for ecosystems services to reduce sedimentation in hydropower dams ........................................................................................................................................... 53 List of Figures Figure 1 Estimated renewable energy share of global final energy consumption in 2012 ...... 3 Figure 2 Estimated renewable energy share of global electricity production at the end of 2013 ...................................................................................................................................... 3 Figure 3 Diagram illustrating the difference between storage and run of river hydropower schemes ............................................................................................................................... 5 Figure 4 Diagram showing the terms typically used to describe the available storage of a dam ....................................................................................................................................... 6 Figure 5 Diagram illustrating the principles of a pumped storage hydropower scheme.......... 6 Figure 6 The global consumption of hydroelectricity since 1965 ............................................ 8

iv
Figure 7 Example of the change in flow as a result of a river catchment’s response to climate change .................................................................................................................................. 9 Figure 8 8: The water – energy – food nexus ...................................................................... 13 Figure 9 Project averages for actual versus planned hydropower generation ...................... 15 Figure 10 Actual versus planned hydropower generation years from the start of commercial operations ........................................................................................................................... 16 Figure 11 Tarbela and Kariba Dams ................................................................................... 16 Figure 12 Actual and forecast installed capacity and power generation for Kariba and Tarbela ............................................................................................................................... 17 Figure 13 Number of kWh generated per MW of installed capacity for large hydropower schemes in India between 1993 and 2012 .......................................................................... 18 Figure 14 Overview of the environmental impacts of hydropower schemes ........................ 22 Figure 15 Summary of life cycle greenhouse gas emissions from hydropower .................... 27 Figure 16 Examples of Impacts of future changes in precipitation and temperature on changes in river flows in the Zambezi River catchment ....................................................... 34 Figure 17 Impacts of two future change scenario on monthly flows at the Batoka Gorge hydropower site on the Zambezi ......................................................................................... 35 Figure 18 Impacts of two future change scenario on predicted mean monthly power generation at the Batoka Gorge hydropower site on the Zambezi ...................................... 36 Figure 19 Estimated global sediment loads ......................................................................... 37 Figure 20 Flow chart of climate change effects on hydropower performance ...................... 40 Figure 21 The effect of climate change on different aspects of hydropower performance ... 41 Figure 22 Application of a simple framework to assess the impacts of climate change on hydropower performance in the Mekong River catchment ................................................... 42 Figure 23 Variation of the net present value of proposed Batoka Gorge hydropower project on the Zambezi with changes to key project parameter and climate change ....................... 44 Figure 24 Potential impacts of climate change on hydropower in the Democratic Republic of the Congo and Mozambique ............................................................................................... 44 Figure 25 The vicious circle of the impacts of climate change reducing electricity production in countries reliant on hydropower....................................................................................... 45 Figure 26 Number of operational rainfall stations in the Zambezi River catchment upstream of Tete in Mozambique ........................................................................................................ 46 Figure 27 Illustration of the impacts of an upgrade versus a life extension on energy production of a hydropower scheme ................................................................................... 49 Figure 28 Sediment management techniques for hydropower schemes ............................. 51 Figure 29 A framework for assessing hydropower performance in the context of the water – energy – food nexus ........................................................................................................... 58 Figure 30 An example of some of the key linkages between hydropower performance, water resources, energy and food systems ................................................................................... 58 Figure 31 Schematic diagram of electricity supply and demand options .............................. 60 Figure 32 Global levelised costs of power generation for the first quarter of 2013 for a range of power generation techniques .......................................................................................... 61 Figure 33 The green and blue water footprint in relation to the water balance of a catchment area .................................................................................................................................... 62 Figure 34 Energy use for irrigated agriculture based on studies carried out in various countries ............................................................................................................................. 63 Figure 35 Life cycle greenhouse gas emissions from hydropower schemes compared with other forms of electricity generation systems ...................................................................... 64 List of Tables Table 1 Classification of hydropower schemes...................................................................... 5 Table 2 World hydropower in operation, under construction and planned ............................. 7 Table 3 The status of hydropower in DFID’s priority countries ............................................. 11

v
Table 4 Environmental and social impacts of different types of hydropower scheme .......... 21 Table 5 Blue water footprint for selected hydropower schemes in DFID priority countries ... 26 Table 6Restrictions on hydropower projects under the Kyoto Protocol Clean Development Mechanism (CDM) .............................................................................................................. 28 Table 7 Trends in the development of hydropower projects ................................................ 33 Table 8 The impact of droughts on hydropower generation in East Africa ........................... 39 Table 9 Cost of installing additional generating capacity as a result of droughts affecting hydropower generation in East Africa .................................................................................. 39 Table 10 Blue water footprint for the production of electricity from various sources of energy ........................................................................................................................................... 62 Table 11 The conceptual framework for the TWO analysis ................................................. 67 Table 12 Examples of variables used to assess the trade-offs between hydropower, irrigated agriculture, municipal water supply and the environment .................................................... 67 Table 13 Background to the hydropower schemes operating in each of the selected case study country ...................................................................................................................... 70

vi
Executive Summary
The Harnessing Hydropower study aims to provide an analysis of the historical performance of hydropower in selected countries and an assessment of the risks and opportunities related to future climate change in the context of water, energy and food security. The target audience for this work is Department for International Development (DFID) staff together with other development professionals, and government officials who are interested in the performance and development of the hydropower sector in low income countries and the trade-offs between water, energy and food security in the context of climate change. The objective of this literature review is to detail how the factors that affect the performance of hydropower schemes may be influenced by climate change and interactions with the complex built, natural and social systems providing water, energy and food security. It describes the importance of identifying trade-offs and synergies when deciding how to balance investments in water, energy and food security, commonly referred to as the water - energy - food security nexus. The literature review also outlines the criteria used to select the three case studies, one in Africa and two in South Asia that were carried out as part of this study. There are a variety of measures that can be used to evaluate the performance of hydropower schemes. These can generally be classified under the following headings: Power generation measures; Economic measures; Social impacts; Environmental impacts; Water use; and Greenhouse gas emissions. The performance of hydropower schemes in low income countries was briefly reviewed using these measures. This review also considers the main issues that affect hydropower performance including: Funding mechanisms and the role that public and private finance plays; Availability of data; Physical and environmental factors; Climate change; Operation and maintenance; and Type of hydropower scheme. Methods of the performance of existing and greenfield hydropower schemes are discussed in the context of making these schemes more resilient to climate change. This review explores different approaches available to assess hydropower performance in the broader context of water – energy – food security. Even just within the energy sector there are a number of challenges when comparing the performance indicators of different power generation technologies. There is often disagreement between different organisations with respect to the water footprint, greenhouse gas emissions and costs per unit of power of different power generation technologies. Assessing the position of hydropower within the energy sector is challenging; hence assessing the position of hydropower within the water – energy – food nexus adds two additional dimensions of complexity. There are, however, some trade off techniques that can be used to assist planners to maximise the benefits of hydropower schemes to other sectors without significantly compromising their performance. The following have been concluded from this literature review: 1. Hydropower will play an increasingly important part in supplying electricity in
low income countries in Africa and Asia over the next 30 years 2. Existing hydropower schemes should be “re-operated”, improved and
rehabilitated before investing in new infrastructure - The largest enhancements in the performance of existing hydropower will be where the key components such as

vii
turbines have deteriorated and can be replaced, or operations can be changed (i.e. “re-operated”) to benefit ecosystem services, irrigable agriculture and water supply without significantly compromising power generation.
3. New hydropower schemes need to be assessed within the context of comprehensive catchment-wide planning
4. There is a paucity of suitable hydrological data with which to plan new hydropower schemes in many low income counties - Hydropower schemes based on limited and unreliable hydrological data have the potential to underperform and not to attain the benefits the infrastructure is designed to generate. In recent years there has been a significant decline in the number of hydro-meteorological stations in many low income countries.
5. Emphasis should be placed on investing in hydropower schemes that maximise flexibility and adaptive management.
6. Climate change scenarios should be incorporated into the planning and design of new hydropower schemes - There is evidence to suggest that the effects of climate change are not being considered when new hydropower schemes are being planned. More work is required to assess the impacts of climate change uncertainty on proposed hydropower schemes in low income countries relative to other variables (e.g. capital costs, operation and maintenance costs, internal rates of return).
7. Evaluations of proposed new hydropower schemes should include an assessment of their water footprint and greenhouse gas emissions - There is evidence to suggest that in tropical and sub-tropical countries these are larger than previously anticipated. There is a need to estimate these accurately when the performance of new and existing hydropower schemes are evaluated.
8. Technological innovations can improve environmental performance and reduce operational costs of hydropower schemes - Recent research into: variable-speed turbines; fish-friendly turbines; new sediment management techniques; more efficient tunnelling methods; use of models to assess and optimise the trade-offs between energy, irrigation and water supply needs as part of integrated river basin management can improve environmental performance and reduce operational costs of schemes.
9. Environmental and social issues will continue to play a significant part in the development of new hydropower opportunities.
10. Improvements are required in the understanding of the water – energy – food nexus and the place of hydropower within it.
11. Investments in new hydropower schemes should ensure that they increase climate resilience.
12. Regional pools of sustainable power should be diversified to reduce the dependency on energy sources that can be affected by climate change such as hydropower - Creating a diverse energy supply is critical for climate change adaptation in water stressed regions. Frameworks such as the on developed by the Southern African Power Pool (SAPP) provides a means for diversifying power production and reducing dependency on energy sources that can be affected by climate change, which in some cases will include hydropower.
The following need further research and are areas where there are evidence gaps: 1. Trade-off assessments - Although there have been a number of researchers
carrying trade-off assessments that allow the position of hydropower to be assessed within the water – energy – food nexus there is still a need for more research and guidance in this area.
2. Estimation of greenhouse gases from hydropower scheme reservoirs - Hydropower is often cited as a green form of energy; however, recent research indicates that for hydropower schemes with large reservoirs located in “hot” countries emit significant quantities of greenhouse gases. Further research is required in

viii
tropical and sub-tropical low income countries to have a more accurate picture of emissions from hydropower schemes.
3. Minimisation and utilisation of greenhouse gases generated by hydropower scheme reservoirs to generate power – It may be possible to extract methane from the water in reservoirs and burn it as a source of energy; however, further work is needed to assess the technical and financial feasibility of these methods.
4. Consumptive use of different power generation techniques and water foot printing tools for power production techniques – There are limited, accurate data on consumptive water use in the energy sector for different power generation techniques, compared to the data for the actual water withdrawn from the aquatic environment. A widely accepted water footprinting tool is required to allow hydropower to be compared to other power generation techniques in terms of water consumption and with water use in other sectors.
5. Impacts of hydropower on ecosystem services including their cumulative effects - There is still insufficient knowledge on the impacts of hydropower schemes on ecosystem services. There is also a need to improve the assessment of environmental risks associated with cumulative impacts, resulting from cascades of storage dams.
6. Role and impacts of small-scale hydropower schemes in low income countries - More work is required to accurately assess the role and impacts (both positive and negative) of small scale hydropower schemes (i.e. <10 MW) in low income countries.
7. Financing of small-scale hydropower schemes in low income countries - There is a need to carry out more research into sustainable financing and business models that are required to facilitate the development of off-grid small hydropower in low income countries.
8. Private sector participation in the development and operation of new hydropower schemes - There is need to carry out more research into how the private sector can effectively participate in hydropower scheme development and operation.
ix
Glossary of terms
Base load - The base load is the minimum level of demand on an electrical supply system over 24 hours. Base load power sources are those plants that can generate dependable power to consistently meet demand. They are the foundation of a sound electricity supply system. Blue water – This is the fresh surface and groundwater (i.e. the water in freshwater lakes, rivers and aquifers). Blue water footprint – Volume of surface and groundwater consumed as a result of the production of a good or service. Build–Operate–Transfer (BOT) or Build–Own–Operate–Transfer (BOOT) is a form of project financing, wherein a private entity receives a concession from the private or public sector to finance, design, construct, and operate a facility stated in the concession contract. This enables the project proponent to recover its investment, operating and maintenance expenses in the project. At the end of a defined period, the ownership of the project transfers to the concession granting body. Cavitation - The rapid formation and collapse of pockets of air in flowing water in regions of very low pressure. It is a frequent cause of structural damage to hydropower turbines. Climate change – The long-term continuous change, (increase or decrease), in average weather conditions or the range of weather. Climate variability – The way climate fluctuates yearly above or below a long-term average value. Dam - A barrier constructed to store or divert water for different purposes, including electricity production. Typically made of earth, rock, or concrete. Dead storage - The portion of a reservoir’s storage capacity that is equal to the volume of water below the level of the lowest outlet (i.e. the minimum supply level). This water cannot be accessed under normal operating conditions. Design-Build-Operate (DBO) - This is a project where the public sector owns and finances the construction of new assets. The private sector designs, builds and operates the assets to meet certain agreed outputs. Economic Internal Rate of Return (EIRR) - This is the discount rate often used in project planning that makes the net present value of all cash flows from a particular project equal to zero. Generally speaking, the higher a project's internal rate of return, the more desirable it is to undertake. Ecosystem services – The benefits provided by ecosystems to people, or to other parts of the natural environment. Efficiency - A percentage obtained by dividing the actual power or energy by the theoretical power or energy. It represents how well a hydropower plant converts the energy of flowing water into electrical energy. Electrical energy - Power delivered over a period of time; commonly measured in kilowatt-hours (kWh) or megawatt-hours (MWh). Electric power - Rate of electric energy delivery; also a measure of a power plant’s generating capacity or installed capacity; the basic measures are the kilowatt (kW) and megawatt (MW). Flow - Volume of water passing a point in a given amount of time, expressed in cubic metres per second (m3/s). Flow duration curve – This is a graphical representation of the percentage of time that a flow of any given magnitude has been equalled or exceeded. Full supply level - The normal maximum operating water level of a reservoir when not affected by floods. Generator - An arrangement of magnets rotating inside a coil of wire to produce electricity.

x
Generating capacity - A power plant’s ability to produce a specific amount of electricity at a specific moment in time; measured in kilowatts or megawatts, also known as “installed capacity”. Generation - The process of converting different forms of energy, thermal, mechanical, chemical, or nuclear, into electricity. Gigawatt (GW) - A measure of electric power; the equivalent of 1,000 megawatts or 1 million kilowatts. Gigawatt-hours (GWh) - A measure of electric energy; the equivalent of 1,000 megawatt-hours or 1 million kilowatt-hours. Global Climate Models (GCMs) are a class of computer-driven models used to understand the climate and for projecting climate change. Greenfield hydropower scheme - These are projects that are constructed at previously undeveloped sites. Green water – The precipitation on land that does not run off or recharge the groundwater but is stored in the soil or temporarily stays on top of the soil or vegetation. Green water footprint – This is the volume of rainwater consumed during the production process. This is particularly relevant for agricultural and forestry products (products based on crops or wood), where it refers to the total rainwater evapotranspiration (from fields and plantations) plus the water incorporated into the harvested crop or wood. Grid - A network of transmission lines for the distribution of electrical energy. Grids can be built at a range of scales from local (‘mini-grids’) to international or continental. Higher voltage lines are used for transmission over longer distances. Head - The vertical change in elevation, expressed in metres, between the head water level and the tailwater level. Headwater level - The water level above the powerhouse. Hydropower - The process of generating electricity by capturing the potential energy of falling water through the use of a water wheel (turbine) to turn magnets inside a generator that create electrical current that can be distributed to users by transmission lines. Installed capacity - The amount of power that can be generated at a given moment by a power plant. In this case of hydropower plants this depends on the number of turbines installed and their generating capacity. This is usually measured in kilowatts (kW) or megawatts (MW). Actual generation is usually measured in kilowatt-hours or megawatt-hours. Intake - The entrance to a turbine unit at a hydropower plant. Kilowatt (kW) - A measure of electrical power; the equivalent of 1,000 watts. Kilowatt-hour (kWh) - A measure of electrical energy; the equivalent of 1,000 watt-hours (e.g. if you burn ten 100-watt light bulbs for one hour, they will use one kilowatt-hour of electricity). Load - The total amount of electricity required to meet customer demand on a specific power system (grid) at any moment. Load shedding - An intentionally engineered electrical power shutdown whereby electricity delivery is stopped for a certain period of time to all or parts of the distribution system. Megawatt (MW) - A measure of bulk power; the equivalent of 1,000 kilowatts or 1 million watts; the unit is generally used to describe the output capacity of a generator. Megawatt-hour (MWh) - A measure of electric energy; the equivalent of 1,000 kilowatt-hours or 1 million watt-hours. Megawatt-hours are determined by a hydropower plant’s installed capacity and how long the plant is running (e.g. a 1,000-megawatt power plant running at full power for one hour produces 1,000 megawatt-hours (MWh) of electricity; and if that plant runs all day, it produces 24,000 MWh). Minimum supply level - The lowest water level to which a storage reservoir can be drawn down (0% full) with existing outlet infrastructure; typically equal to the level of the lowest outlet, the lower limit of the live storage capacity. Net Present Value (NPV) - The difference between the present value of the future returns from an investment and the future streams of costs, including the initial investment. Present

xi
value of the expected cash flows is computed by discounting them at the required rate of return. Opportunity cost - The cost of an alternative that must be forgone in order to pursue a certain action or investment. Peak load - This is the maximum electrical power demand within a defined time frame. Penstock - A closed conduit or pipe for conducting water to the powerhouse. Power - This is the current delivered at a given voltage which is measured in watts or kilowatts. Powerhouse - The physical structure of an electric generating facility. Renewable energy - Energy derived from naturally occurring sources that are continually replenished within human timescales. Examples of renewable energy are wind, solar, tidal and hydropower. Run of river hydropower scheme – A hydropower plant that has either no storage at all, or a limited amount of storage, is referred to as pondage. Spill - The release of water from a dam or hydropower project without passing it through the powerhouse. Typically a situation to be avoided as water “spilled” is lost potential power generation revenue. Spillway - The structure or portion of a larger structure that is used to release excess water over or around a dam. Stationarity - A stationary time series (e.g. river flow series) is one whose statistical properties (e.g. the mean and variance) are all constant over time. Most statistical forecasting methods are based on the assumption that the time series can be rendered approximately stationary. Tailrace - The channel, tunnel or pipe that carries water away from a dam or hydropower plant. Tailwater level - The water level downstream of the powerhouse or dam. Terawatt (TW) - A measure of electric power, the equivalent of 1,000 GW or 1 billion kW; the unit is generally used to describe generating capacity at national or international levels. Terawatt-hour (TWh) - A measure of electric energy; the equivalent of 1,000 GWh or 1 billion kWh. Total storage capacity - The entire volume of water contained by a reservoir at the full supply level. This is equal to the sum of the live storage capacity and the dead storage capacity. Transformer - An electromagnetic device for changing alternating current (AC) electricity to higher or lower voltages. Transmission - The process of moving electric power from a generation facility to domestic and industrial users. Turbine - A mechanical device that converts the energy of a moving stream of water, steam or gas into mechanical energy. Water footprint - The water footprint is an indicator of freshwater use that looks at both direct and indirect water use of a consumer or producer.


1
SECTION 1 Introduction
1.1 Objectives
The Harnessing Hydropower study aims to provide an analysis of the historical performance of hydropower in selected countries and an assessment of the risks and opportunities related to future climate change in the context of water, energy and food security. This review is aimed at Department for International Development (DFID) staff together with other development professionals, government staff and interested stakeholders who are engaged in countries with plans to increase hydropower production and aiming to achieve energy, water and food security within the context of climate change. This review has been written so that the reader does not need to be an expert in the field of hydropower or the trade-offs between water, energy and food security to be able understand the pertinent issues. Increased economic growth, primarily in emerging markets, is strengthening the demand for water, energy and food. Global energy consumption relative to 2011 is projected to increase by nearly 35% by 2035 (IEA, 2013a), with emerging economies such as China, India, and Brazil doubling their energy consumption in the next 40 years. By 2050, Africa’s electricity generation is projected to be seven times as high as it is today. In Asia electricity generation will more than triple by 2050 (Rodriguez, 2013). Hydropower has increasingly been seen by international funding agencies as a solution to meet increasing energy demands from a renewable, low-carbon source. Approximately two-thirds of economically viable hydropower potential is yet to be tapped and 90% of this potential is in developing countries (UN, 2004). Global hydropower generation capacity has been increasing steadily over the last 30 years, and the past few years have shown an increased growth rate (Hamududu and Killingtveit, 2012). However, hydropower is one of the energy sources most likely to be affected by climate change and climate variability because the amount of electricity generated is directly related to water quantity and its timing (Harrison and Whittington, 2001). The recent Intergovernmental Panel on Climate Change (IPCC) Fifth Assessment Report highlighted potential impacts on hydropower owing to a reduction in water availability in most dry sub-tropical regions (IPCC, 2014). The objective of this literature review is to detail how the factors that influence the performance of hydropower schemes may be affected by future climate change and interactions with the complex built, natural and social systems providing water, energy and food security. It describes the importance of identifying trade-offs and synergies when deciding how to balance investments in water, energy and food security, commonly referred to as the water - energy - food security nexus. The literature review also outlines the criteria used to select the three case studies, one in Africa and two in South Asia that were carried out as part of this study. This literature review has been structured as follows:
Chapter 1 provides background to renewable sources of energy, hydropower schemes, hydropower potential and the ‘nexus’ between water, energy and food security

2
Chapter 2 details the way in which performance of hydropower schemes can be measured
Chapter 3 outlines the main factors that affect the performance of hydropower
Chapter 4 provides an overview of how the performance of hydropower schemes can be enhanced
Chapter 5 gives an overview of hydropower’s role with respect to the water - energy - food security nexus
Chapter 6 outlines the criteria used to select the case studies in Africa and South Asia
Chapter 7 provides conclusions and current research gaps
Chapter 8 details the references that were consulted in the compilation of this review
1.2 Background to renewable sources of energy
In 2012 renewable energy sources accounted for approximately 19% of the world’s total energy consumption (REN21, 2014), as shown in Figure 1. Of this total, traditional biomass1, which currently is used primarily for cooking and heating in remote and rural areas of developing countries, accounted for about 9%, and modern renewables increased their share to approximately 10%. Hydropower is a renewable source of energy. In 2012 hydropower provided 3.8% of the world’s energy consumption (REN21, 2014). In terms of the world’s electricity supply hydropower accounts for approximately 16%, as shown in Figure 2 (REN21, 2014). In the past decade international funding agencies such as the World Bank have started to increase their lending for hydropower schemes (World Bank, 2009) from the low levels recorded in the late 1990s and early 2000s. This has been driven by demand from developing countries and hydropower’s multi-dimensional role in poverty alleviation and sustainable development (World Bank, 2009). Hydropower also offers a hedge against volatile energy prices and risks associated with the imported supply of electricity (World Bank, 2009). In the past five years policy support and investment in renewable energy have continued to focus primarily on the electricity sector (REN21, 2014). Consequently, renewables have accounted for a growing share of electricity generation capacity added globally each year.
1 Wood fuels, agricultural by-products and dung burned for cooking and heating purposes.

3
Figure 1 Estimated renewable energy share of global final energy consumption in 2012
Note: Traditional biomass refers to solid biomass that is combusted in inefficient, and usually
polluting, open fires, stoves, or furnaces to provide heat energy for cooking, comfort, and small-scale agricultural and industrial processing, typically in rural areas of developing countries. It may or may not be harvested in a sustainable manner.
(Source: Adapted from REN21, 2014)
Figure 2 Estimated renewable energy share of global electricity production at the end of 2013
(Source: Adapted from REN21, 2014)
1.3 Background to hydropower schemes
1.3.1 The principles of hydropower
Hydroelectricity is generated by water falling under the force of gravity that turns the blades of a turbine, which is connected to a generator. Electricity generated by the spinning turbine passes through a transformer and out to transmission lines supplying domestic and industrial demands. The principle and the technique for generating electricity from hydropower is the same regardless of the size of the project, and plants can be tailor-made to fit a community,

4
country or an export market. The amount of power that can be generated is dictated by the following:
The vertical height of water above the turbines, often referred to as the hydraulic head
The rate of flow through the turbines Hydropower is an efficient form of energy generation. Typically the efficiency of a modern day hydropower plant in converting potential energy to electrical energy is about 90% (USBR, 2005).
1.3.2 Types of hydropower plants
There are three main types of hydropower plants:
Storage
Run of river
Pumped storage These are described below. Storage schemes have a dam that impounds water in a reservoir that feeds the turbine and generator. Examples of such schemes include Kariba Dam on the Zambezi River in southern Africa and Tarbela Dam in Pakistan. Storage schemes generally have higher environmental and social costs than pumped storage or run of river schemes because more land is inundated and the natural flow regime is disrupted (Ledec and Quintero, 2003; Lindström and Granit, 2012 and many others). A diagram of a typical scheme is shown in Figure 3. Turbines can be located at the base of the dam or some distance downstream, served by penstocks or tunnels that convey the water to them and increase the effective head above the turbine. Generally storage schemes are used to supplement the base load and balance the peak loads. Figure 4 illustrates the terms related to the volume of storage dams utilised for hydropower, water supply and irrigation schemes that are used in this report. Run of river hydropower plants have either no storage at all, or a limited amount of storage, referred to as pondage. A plant without pondage has no storage and is subject to variability in river flows whilst a plant with pondage can regulate water flow to some extent. Most hydropower projects in Nepal and Malawi are run of river. Run of river plants alter the flow regime of a river to a lesser degree than storage schemes. They are generally considered to have a lower environmental impact than hydropower schemes that utilise large reservoirs (Lindström and Granit, 2012). Run of river plants are generally only appropriate for rivers with a sufficiently high minimum dry weather flow or those regulated by a much larger dam and reservoir upstream. They are generally used to supplement the base load. Figure 3 shows the difference between a typical storage and run of river hydropower scheme. Pumped storage hydropower plants are designed solely to store energy to provide power during peak loads (i.e. to balance peak loads). Figure 5 shows a diagram illustrating the main principles of a pumped storage scheme. Pumped storage facilities offer the flexibility to supplement other electricity supplies at very short notice. This form of hydropower is of increasing importance because it can balance load differences on power grids more effectively than technologies that typically supply base load such as conventional thermal energy or nuclear power generation (Levine, 2003). During off-peak hours, such as between

5
midnight and 6 am, excess electricity produced by conventional power plants is used to pump water from lower- to higher-level reservoirs. During periods of highest demand, the water is released from the upper reservoir through turbines to generate electricity. This has the additional benefit of using electricity to pump uphill when it is lower cost and generate when it is higher cost, generating revenue through the cost differential. The combined use of pumped storage facilities with other types of electricity generation creates large cost savings through more efficient utilisation of base load plants.
1.3.3 Construction, operation and maintenance costs of hydropower schemes
Construction costs for new hydropower projects in Organisation for Economic Co-operation and Development (OECD) countries are usually less than US$2 million/MW for large scale schemes (> 300 MW), and US$2 to US$4 million/MW for small- and medium-scale schemes (<300 MW) (IEA, 2010). A typical classification of hydropower schemes is provided in Table 1. It is important to note that the initial investment needs for particular projects must be studied individually owing to the unique nature of each hydropower project.
Category Output (MW) Storage Power use Investment costs (US$ million/MW)
Small < 10 Run of river Base load 2 to 4 Medium 10 to 100 Run of river Base load 2 to 3 Medium 100 to 300 Dam and
reservoir Base load and peak
2 to 3
Large >300 Dam and reservoir
Base load and peak
<2
Note: There are numerous different ways in which countries classify “large”, “medium” and “small” hydropower schemes
(Source: IEA, 2014)
Table 1 Classification of hydropower schemes
Figure 3 Diagram illustrating the difference between storage and run of river hydropower schemes

6
Figure 4 Diagram showing the terms typically used to describe the available storage of a dam
Figure 5 Diagram illustrating the principles of a pumped storage hydropower scheme
The generation costs of electricity from new hydropower plants vary widely, though they often fall into a range of US$50 to 100/MWh (IEA, 2010). It should be noted that generation costs per MWh will be determined by the amount of electricity produced annually and that some hydropower plants are deliberately operated for peak load demands and back-up for sudden fluctuations in demand. This increases both the marginal generation costs and the value of the electricity produced (IEA, 2010). As most of the generation cost is associated with the depreciation of fixed assets, the generation cost decreases if the projected plant lifetime is extended. Many hydropower plants built 50 to 100 years ago are fully amortised2 and still operate efficiently today (IEA, 2010). Operation and maintenance costs have been estimated at between US$5 to 20/MWh for new medium to large hydropower plants, and approximately twice as much for small hydropower plants (IEA, 2010).
2 A loan is said to be fully amortised when payments, which apply to both the capital costs and
interest, leave the loan balance at zero at the end of the loan term.

7
1.4 International hydropower potential
While development of the entire world’s remaining hydropower potential could not hope to meet future world demand for electricity, it is clear that it is the resource with the greatest capability to provide renewable energy to the parts of the world which at present have the greatest need (Bartle, 2002). When hydropower is implemented as part of a multipurpose water resources development scheme, it can offer a number of other benefits, which no other source of energy can compete with (e.g. irrigation, water supply, navigation improvements and recreation facilities) (Bartle, 2002). The use of hydropower and its potential for expansion varies between countries. The five countries with the greatest potential for hydropower expansion are China, USA, Russia, Brazil and Canada (REN21, 2014). Europe, America, and Asia have a sizable share of hydropower capacities. The installed capacity for Europe and Northern America, though large, has not increased much over the past 30 years, whilst during the same period the installed hydropower capacity in Southern/Central America and Asia/Oceania has increased by around 50% (Hamududu and Killingtveit, 2012). Between 2009 and 2010 the global use of hydropower increased by around 5.3% reaching 3,427 TWh by the end of 2010 (Lucky, 2012). The world’s total consumption of hydropower increased each year between 2003 and 2010. It also increased by at least 3.5% annually during five of the seven years between 2003 and 2010 (Lucky, 2012). A total of US$40 to US$45 billion was invested in large hydropower projects worldwide in 2010 (Lucky, 2012). Figure 6 shows the global increase in the consumption of hydropower since 1965. Table 2 shows regional hydropower characteristics in terms of hydropower in operation, total potential, under-construction, planned and countries with more than 50% of their total electricity demand supplied by hydropower.
Region Hydropower in operation
(MW)
Percentage of total
potential hydropower
(%)
Hydropower under
construction (MW)
Hydropower planned
(MW)
Number of countries
with 50% of electricity
supply
Africa 23,482 9.3 5,222 76,600 23 Asia 401,626 17.8 125,736 141,300 9 Europe 179,152 53.9 3,028 11,400 8 North and Central America
169,105 34.3 7,798 17,400 6
South America 139,424 26.3 19,555 57,300 11 Australasia/ Oceania
13,370 20.1 67 1,500 4
(Source: Hamududu and Killingtveit, 2012)
Table 2 World hydropower in operation, under construction and planned

8
Figure 6 The global consumption of hydroelectricity since 1965
(Source: Adapted from Lucky, 2012)
1.5 Background to the impacts of climate change on hydropower
Hydropower generation is one of the energy sources most likely to be affected by climate change and climate variability because the amount of electricity generated is directly related to water quantity and its timing. However, the impacts of climate change though temperature and rainfall pattern changes upon hydrological cycles are complex and poorly understood in most developing countries (Harrison and Whittington, 2001). The potential impact of climate change on water resources has been postulated since the 1980s. Although Global Climate Models (GCMs) can be used to predict runoff directly, their coarse scale means that this information is only useful for the most general studies (Harrison et al., 2004; Kumar et al., 2011). As a result, many studies have been carried out on individual catchments, showing that river basins display a range of sensitivities to climate change. Figure 7 shows the response of a typical river catchment to variations in precipitation and temperature. It can be seen that increased temperature results in non-linear variations in river flows owing to changes in precipitation.

9
Figure 7 Example of the change in flow as a result of a river catchment’s response to climate change
Perc
en
tag
e c
han
ge in
flo
w
Percentage change in precipitation
2ºC temperature rise 3ºC temperature rise
100
80
60
40
20
-100
-80
-60
-40
-20-20 -10 10 20
(Source: Adapted from Harrison and Whittington, 2001)
For example, one GCM scenario shows that hydropower production on the Indus River would fall by 22% (Harrison et al., 2004). Another study qualitatively examined the effects of reduced hydropower output on sub-Saharan Africa and central Europe. However, to date, many studies have failed to quantify the impacts in terms of the investment performance of hydropower plants and the trade-offs between energy, food and water security (Harrison et al., 2004; World Bank, 2009).
1.6 Background to the status of hydropower in DFID’s priority countries
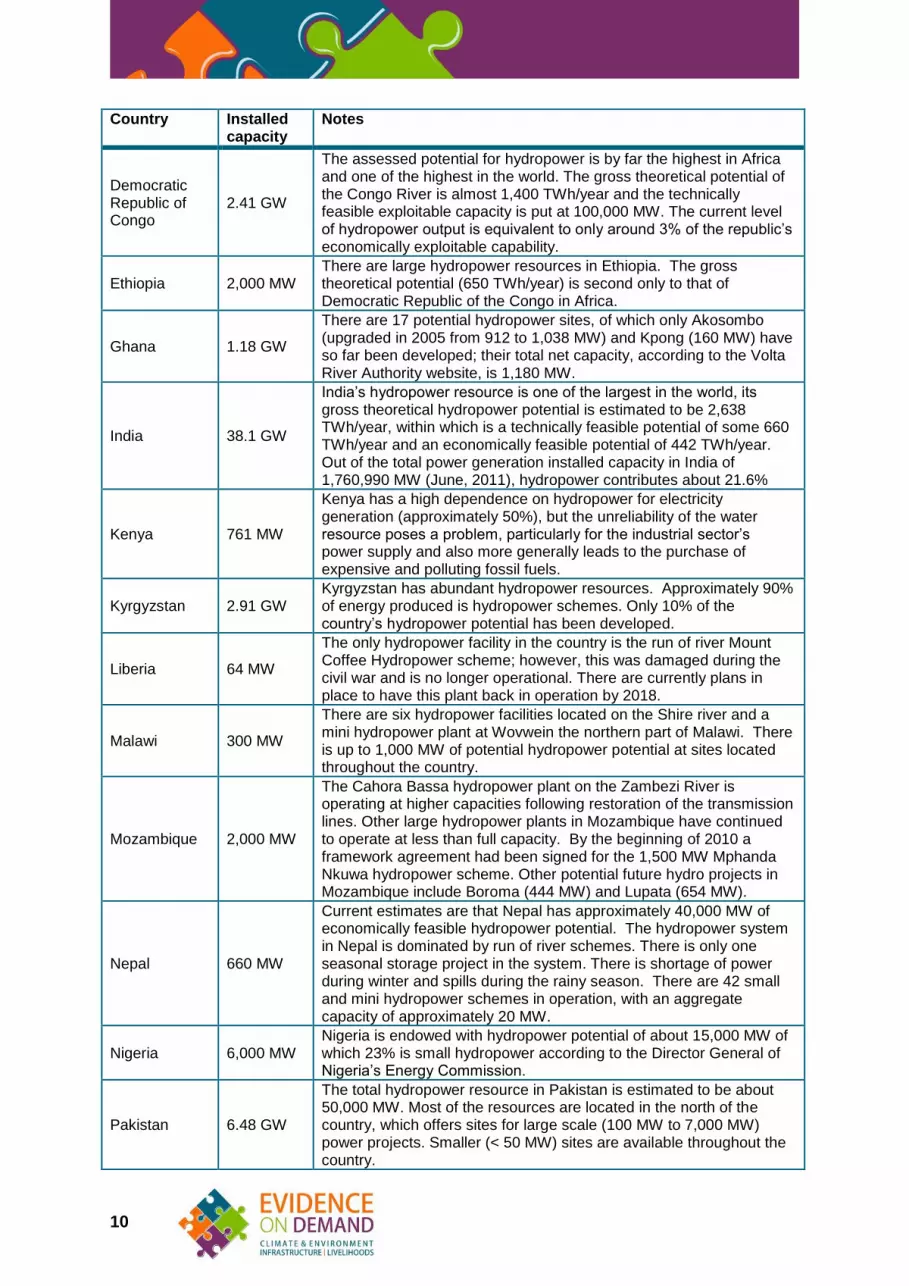
There are 27 DFID priority countries. Table 3 gives an overview of the status of hydropower in each of these countries. In many of these countries there is significant potential for the development of hydropower resources over the next 30 years. Country Installed
capacity Notes
Afghanistan 400 MW In 2009 hydropower provided around 39% of Afghanistan’s electricity. The theoretical hydropower potential has been estimated at 25 GW; only a small percentage of this has been exploited.
Bangladesh 230 MW There is an estimated 755 MW of undeveloped hydropower potential in Bangladesh.
Burma 1.54 GW
The country is well endowed with hydropower resources. Its technically feasible potential is given by the Hydropower & Dams World Atlas as 39,720 MW. At an assumed annual capacity factor of 0.40, this level would imply an annual output capability of almost 140 TWh; actual output in 2011 was only 3.9 TWh. There thus appears to be ample scope for substantial development of hydropower in the long term.
10
Country Installed capacity
Notes
Democratic Republic of Congo
2.41 GW
The assessed potential for hydropower is by far the highest in Africa and one of the highest in the world. The gross theoretical potential of the Congo River is almost 1,400 TWh/year and the technically feasible exploitable capacity is put at 100,000 MW. The current level of hydropower output is equivalent to only around 3% of the republic’s economically exploitable capability.
Ethiopia 2,000 MW There are large hydropower resources in Ethiopia. The gross theoretical potential (650 TWh/year) is second only to that of Democratic Republic of the Congo in Africa.
Ghana 1.18 GW
There are 17 potential hydropower sites, of which only Akosombo (upgraded in 2005 from 912 to 1,038 MW) and Kpong (160 MW) have so far been developed; their total net capacity, according to the Volta River Authority website, is 1,180 MW.
India 38.1 GW
India’s hydropower resource is one of the largest in the world, its gross theoretical hydropower potential is estimated to be 2,638 TWh/year, within which is a technically feasible potential of some 660 TWh/year and an economically feasible potential of 442 TWh/year. Out of the total power generation installed capacity in India of 1,760,990 MW (June, 2011), hydropower contributes about 21.6%
Kenya 761 MW
Kenya has a high dependence on hydropower for electricity generation (approximately 50%), but the unreliability of the water resource poses a problem, particularly for the industrial sector’s power supply and also more generally leads to the purchase of expensive and polluting fossil fuels.
Kyrgyzstan 2.91 GW Kyrgyzstan has abundant hydropower resources. Approximately 90% of energy produced is hydropower schemes. Only 10% of the country’s hydropower potential has been developed.
Liberia 64 MW
The only hydropower facility in the country is the run of river Mount Coffee Hydropower scheme; however, this was damaged during the civil war and is no longer operational. There are currently plans in place to have this plant back in operation by 2018.
Malawi 300 MW
There are six hydropower facilities located on the Shire river and a mini hydropower plant at Wovwein the northern part of Malawi. There is up to 1,000 MW of potential hydropower potential at sites located throughout the country.
Mozambique 2,000 MW
The Cahora Bassa hydropower plant on the Zambezi River is operating at higher capacities following restoration of the transmission lines. Other large hydropower plants in Mozambique have continued to operate at less than full capacity. By the beginning of 2010 a framework agreement had been signed for the 1,500 MW Mphanda Nkuwa hydropower scheme. Other potential future hydro projects in Mozambique include Boroma (444 MW) and Lupata (654 MW).
Nepal 660 MW
Current estimates are that Nepal has approximately 40,000 MW of economically feasible hydropower potential. The hydropower system in Nepal is dominated by run of river schemes. There is only one seasonal storage project in the system. There is shortage of power during winter and spills during the rainy season. There are 42 small and mini hydropower schemes in operation, with an aggregate capacity of approximately 20 MW.
Nigeria 6,000 MW Nigeria is endowed with hydropower potential of about 15,000 MW of which 23% is small hydropower according to the Director General of Nigeria’s Energy Commission.
Pakistan 6.48 GW
The total hydropower resource in Pakistan is estimated to be about 50,000 MW. Most of the resources are located in the north of the country, which offers sites for large scale (100 MW to 7,000 MW) power projects. Smaller (< 50 MW) sites are available throughout the country.

11
Country Installed capacity
Notes
Palestinian Territories
0 MW There are no significant hydropower schemes in the Palestinian Territories owing to the arid nature of the region.
Rwanda 55 MW The total hydropower capacity currently under construction is 44 MW. The total new identified and feasible hydropower capacity is 232 MW.
Sierra Leone 50 MW Sierra Leone’s hydropower potential remains virtually untapped with only 3% of a total estimated capacity from large rivers of 1,500 MW currently being used.
Somalia 5 MW Owing to the current political situation there are no known policies regarding renewable energy or hydropower in Somalia.
South Africa 661 MW
The current emphasis in South Africa is on the development of pumped-storage facilities. Two large plants Ingula (1,332 MW) and Lima (1,500 MW) are under construction, and further projects are being studied. There are 6,000 to 8,000 potential sites in South Africa suitable for small hydropower (<100 MW).
South Sudan 8 MW
South Sudan has limited installed hydropower capacity. A 42 MW scheme on the White Nile is currently under construction. There is considerable hydropower potential in South Sudan. Ten potential sites for hydropower on the Nile and its tributaries have been identified and these could potentially provide 2,000 MWh of power per day.
Sudan 1,593 MW The economically feasible potential is some 19 TWh/year.
Tajikistan 5.5 GW
The terrain and climate are highly favourable to the development of hydropower. Apart from the Russian Federation, Tajikistan has the highest potential hydropower generation of any of the former Soviet Union republics. Its economically feasible potential is estimated to be 263.5 TWh/year, of which only about 6% has been harnessed so far. Hydropower provides about 95% of Tajikistan’s electricity generation.
Tanzania 561 MW
The largest hydropower complexes are the Mtera and Kidatu Dams and they are situated on the Great Ruaha River. The Mtera Dam is the most important reservoir in the power system providing over-year storage capability. It also regulates the outflows to maintain the water level for the downstream Kidatu hydropower plant
Uganda 340 MW Uganda’s hydropower potential has been estimated at 3,000 MW only a small percentage of this has been utilised.
Yemen 0 MW Owing to the arid nature of the country hydropower is not a viable form of energy.
Zambia 1.73 GW
Zambia’s two major hydropower plants are being refurbished and upgraded: the 900 MW Kafue Gorge (Upper) station by 90 MW and Kariba North Bank (presently 600 MW) by 120 MW. Economic and technical feasibility studies are being conducted on the Kafue Gorge Lower IPP project (750 MW) and a 210 MW scheme at Kalungwishi. Further rehabilitation and new-build projects are being developed or studied, including the 120 MW Itezhi Tezhi scheme on the Kafue river and the 1,800 MW Batoka Gorge bi-national project with Zimbabwe.
Zimbabwe 754 MW
The total hydropower potential is 12,750 MW; with the hydropower potential on Zambezi River being about 7,200 MW. Of this potential 120 MW can be developed as mini-hydropower plants on existing dams and rivers.
Note: It is important to note that various publications have different figures for the installed capacity and the potential undeveloped hydropower potential for the same country. For consistency the figures in Table 3 have been taken from the same source.
(Source: World Energy Council, 2014)
Table 3 The status of hydropower in DFID’s priority countries

12
1.7 The water – energy – food security nexus
1.7.1 Background
Water, energy, and food are linked through numerous interactive pathways affected by a changing climate (IPCC, 2014). The strength of these linkages vary immensely among countries, regions, and production systems. The production of hydropower requires significant amounts of water. Water requirements for energy currently ranges from a few percent in most developing countries to more than 50% of freshwater withdrawals in some developed countries (IPCC, 2014). Future water requirements will depend on growth in demand for electricity, the portfolio of generation technologies, and water management options. There is robust evidence to suggest that future water availability for energy production will change owing to climate change (IPCC, 2014). The consideration of the inter-linkages between energy, food, water, land use, and climate change has implications for security of supplies of energy, food, and water; adaptation and mitigation pathways; air pollution reduction; and health and economic impacts. This nexus is increasingly recognised as critical to effective climate-resilient-pathway decision-making, although tools to support local- and regional-scale assessments and decision-support remain very limited (IPCC, 2014).
1.7.2 Guiding principles of the water – energy – food security nexus
In the past, the water, energy and food sectors were often planned and managed in isolation. Population growth and resource depletion has led to the interdependencies between these sectors becoming more relevant. A nexus approach is required because it can support the transition to a green economy, which aims at resource use efficiency and greater policy coherence (SEI, 2011). There is much work to do in order to achieve water, energy and food security for all the world’s people. In hotspot regions such as South Asia and sub-Saharan Africa, large portions of the population remain marginalised and deprived of their human rights and development opportunities (SEI, 2011). To date water, energy and food security have been mainly constrained by unequal access; however, humanity is now also approaching limits of global resource availability (SEI, 2011). The following guiding principles are central to the nexus approach:
Investing to sustain ecosystem services
Creating more with less
Accelerating access, integrating the poorest Figure 8 shows the water - energy - food nexus. According to Jägerskog et al. (2013) “The Water – Energy – Food nexus can be assessed using methodologies in a continuum, running from qualitative approaches at the start of the continuum, to more data driven and quantitative modelling approaches further along it. A range of factors can determine which approach is chosen, including the goal of the analysis, the level of capacity and trust between competing stakeholders at different scales, sectoral integration, access to data, and capacity for analysis.” (Jägerskog et al. 2013).

13
Figure 8 8: The water – energy – food nexus
(Source: Adapted from SEI, 2011)

14
SECTION 2 Measures of hydropower performance
2.1 Introduction
There are a variety of measures that can be used to evaluate the performance of hydropower schemes. A number of authors and organisations including: World Commission on Dams (WCD) (2000a); March et al. (2008), Krahenbuhl (2008), United States Department of Energy (2011), Vovk-Korže et al. (2008); Jha et al. (2007) and many others have proposed ways in which the performance of hydropower schemes can be measured or assessed. The measures can generally be classified under the following headings:
Power generation
Economic
Social impacts
Environmental impacts
Water use
Greenhouse gas emissions These measures are discussed in the Sections below. The benefits of large scale water storage designed for hydropower purposes were evaluated by World Commission on Dams (WCD) against the targets used by their proponents to justify investment including power generation, irrigation services and environmental protection (WCD, 2000a). It is important to note that hydropower schemes utilising large reservoirs can also have strategic benefits for drought and flood prevention. The WCD report is widely acknowledged as a significant contribution to the debate on dams, not only on the benefits and costs of large dams, but more generally to the current rethinking of development decision-making in a world deeply affected by rapid global change (UNEP, 2014).
2.2 Power generation
Power generation is one variable against which the performance of hydropower schemes can be measured. However, there have been few studies that have looked at hydropower schemes worldwide with respect to their power generation performance. In 2000 the World Commission on Dams (WCD) considered the power generation performance of 63 large hydropower dams worldwide (WCD, 2000a). The variance in performance with respect to power generation across the schemes was high, as shown in Figure 9. On average, almost 50% of the sample exceeded the set targets for power generation, with about 15% exceeding targets by a significant amount. Figure 9 also shows that around 20% of the schemes in the sample achieved less than 75% of the planned power targets and that over 50% of the projects in the sample fall short of their power production targets (WCD, 2000a). Thus the average performance in the sample is sustained by a few over-performers and should not mask the variance in performance that is weighted towards shortfalls in power delivery (WCD, 2000a).

15
Most of the hydropower plants that provided benefits beyond expectations had installed extra generation capacity after commissioning (Lindström and Granit, 2012). Approximately 25% of the hydropower dams with higher outputs than expected had installed more than 100% of the capacity they had planned for in respective feasibility studies (WCD, 2000; Lindström and Granit, 2012). This demonstrates that it is possible to make some hydropower schemes more effective over time. The WCD compared the actual to planned power generated by 63 hydropower projects worldwide and plotted this against the number of years after the start of the commercial operation of the scheme. This is shown in Figure 10. The WCD found that that the mean power generation in the first year of commercial operation was 80% of the targeted value for large hydropower dams (WCD, 2000a). In years two to five of operation the average percentage realisation of targets rose to near 100%; however, this improvement in the average for any time period masks considerable variation in the subsample with half or more of projects still falling short of predicted power generation, as shown in Figure 10 (WCD, 2000a). Delays in the construction phase of projects, in reservoir filling (e.g. because rainfall was lower than average) and in installing and bringing turbines on-line often explain shortfalls in performance of power generation (WCD, 2000). For example, Tarbela Dam in Pakistan experienced major structural damage in commissioning trials that led to a two year loss of power generation (WCD, 2000a).
Figure 9 Project averages for actual versus planned hydropower generation
(Source: Adapted from WCD, 2000a)
The variation in power production over time within a single project shown in Figure 10 was investigated by the World Commission on Dams via additional case studies (WCD, 2000b). Normal variations in weather and river flows dictate that virtually all hydropower projects will have year-to-year fluctuations in output. Two of these case studies were Kariba Dam on the

16
Zambezi on the Zambia-Zimbabwe border and Tarbela Dam in Pakistan, shown in Figure 11.
Figure 10 Actual versus planned hydropower generation years from the start of commercial operations
(Source: Adapted from WCD, 2000a)
Figure 11 Tarbela and Kariba Dams
View a Tarbela Dam, Pakistan View b Kariba Dam, Zambia-Zimbabwe
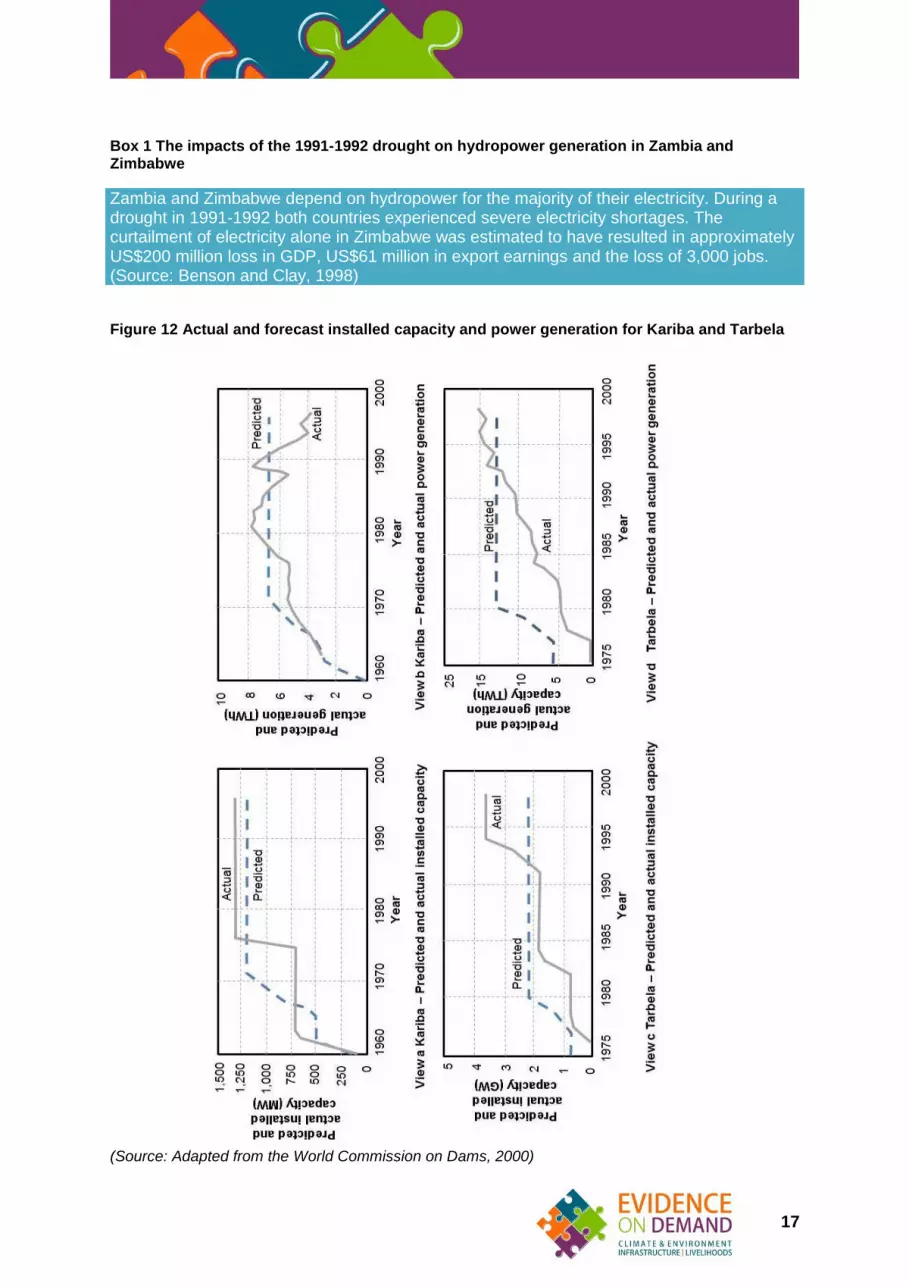
Figure 12 shows the actual and forecast installed capacity and power generation for these two hydropower schemes. In both cases actual installed capacity has exceeded the predicted installed capacity, mainly as a result of additional capacity being installed after the schemes were completed. The effect of drought years can be easily seen in the large swings in annual power generation from Kariba, particularly over the last two decades. More details of the impacts of drought on hydropower generation in Zambia and Zimbabwe are given in Box 1.
17
Box 1 The impacts of the 1991-1992 drought on hydropower generation in Zambia and Zimbabwe
Zambia and Zimbabwe depend on hydropower for the majority of their electricity. During a drought in 1991-1992 both countries experienced severe electricity shortages. The curtailment of electricity alone in Zimbabwe was estimated to have resulted in approximately US$200 million loss in GDP, US$61 million in export earnings and the loss of 3,000 jobs. (Source: Benson and Clay, 1998)
Figure 12 Actual and forecast installed capacity and power generation for Kariba and Tarbela
(Source: Adapted from the World Commission on Dams, 2000)
18
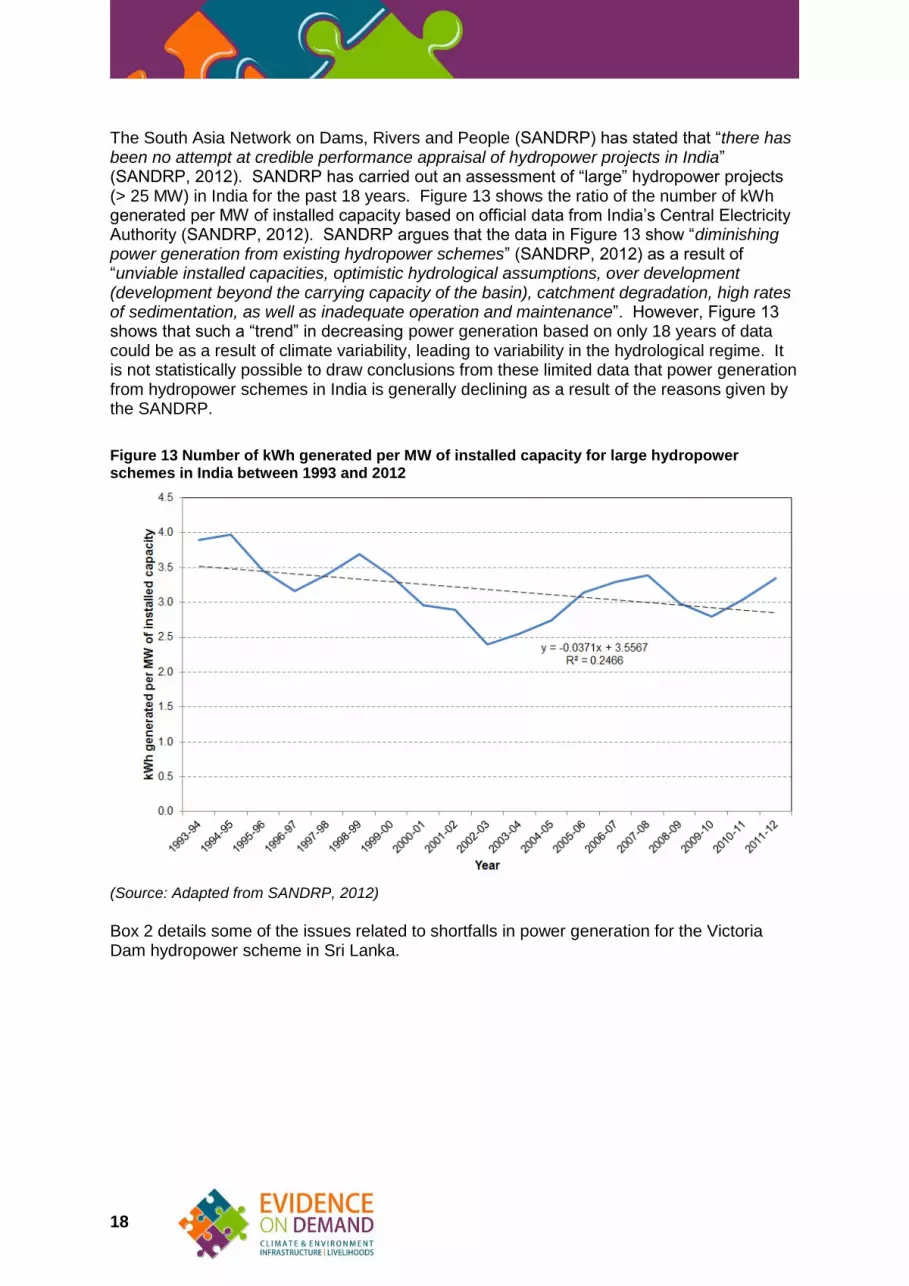
The South Asia Network on Dams, Rivers and People (SANDRP) has stated that “there has been no attempt at credible performance appraisal of hydropower projects in India” (SANDRP, 2012). SANDRP has carried out an assessment of “large” hydropower projects (> 25 MW) in India for the past 18 years. Figure 13 shows the ratio of the number of kWh generated per MW of installed capacity based on official data from India’s Central Electricity Authority (SANDRP, 2012). SANDRP argues that the data in Figure 13 show “diminishing power generation from existing hydropower schemes” (SANDRP, 2012) as a result of “unviable installed capacities, optimistic hydrological assumptions, over development (development beyond the carrying capacity of the basin), catchment degradation, high rates of sedimentation, as well as inadequate operation and maintenance”. However, Figure 13 shows that such a “trend” in decreasing power generation based on only 18 years of data could be as a result of climate variability, leading to variability in the hydrological regime. It is not statistically possible to draw conclusions from these limited data that power generation from hydropower schemes in India is generally declining as a result of the reasons given by the SANDRP.
Figure 13 Number of kWh generated per MW of installed capacity for large hydropower schemes in India between 1993 and 2012
(Source: Adapted from SANDRP, 2012)
Box 2 details some of the issues related to shortfalls in power generation for the Victoria Dam hydropower scheme in Sri Lanka.

19
Box 2 Shortfall in predicted power generation at Victoria hydropower scheme in Sri Lanka
The Victoria dam in Sri Lanka had a predicted energy generation of 970 GWh/year; however, in reality it only produces an average of 670 GWh, a shortfall of over 30%. Higher than expected upstream irrigation abstractions and lower than predicted natural stream flows were the causes in this case. An evaluation of the scheme by the British Government in 1986 concluded that the power output from the scheme depends on how the river systems are managed, and on how other power plants and the irrigation schemes are operated. The trade-offs are particularly complex. The evaluation also stated that “the re-estimated rate of return is 8% about 4% less than that at appraisal, mainly because power output is now expected to be less than forecast in 1978 and the prospects for irrigation benefits are poor”. (Source: World Commission on Dams, 2000; ODA, 1986)
2.3 Economic impacts
Economic performance of a hydropower project can be measured via an economic appraisal that takes into account the costs and benefits, denominated in monetary terms of the scheme. The Economic Internal Rate of Return (EIRR) is often used to assess the performance of planned and constructed hydropower schemes (World Bank, 2009; WCD, 2000). The EIRR is the discount rate that makes the net present value of all cash flows from a particular project equal to zero. Generally speaking, the higher a project's internal rate of return, the more desirable it is to undertake the project. Hydropower dams appear to meet pre-determined economic targets more than irrigation dams based on the knowledge base compiled by the World Commission on Dams (WCD). Almost 50% of the projects within the knowledge base exceeded targets (Lindström and Granit, 2012). Forbes recently reported that the world average EIRR for hydropower was 7% to 8%; however, in China they are generally 15% (Forbes, 2011). There are also cases where outputs are lower than expected, with 5% of examined hydropower dams in the WCD knowledge base falling well below expected outcomes. The reasons for lower than expected results differ. In general, the time for hydropower dams to reach expected outcomes are shorter than with irrigation dams, averaging 80% of the expected capacity reached within the first year of operation (Lindström and Granit, 2012).. This subsequently increases in years two-to-five to come close to 100% realisation of expected targets (Lindström and Granit, 2012). Similar to irrigation dams many problems related to poor performance can be traced to the planning phases of hydropower projects. Errors or changes at early development stages show clear linkages to greater delays in reaching expected power generation targets in early years of operation (WCD, 2000a). This might include delays in filling up reservoirs, postponements of components in construction phases, design changes or an inability to get turbines up and running according to the initial planning. There are also natural circumstances that can cause power delivery of large hydropower dams to be more variable and less reliable once operational. Changes in weather conditions, precipitation and hydrological patterns might yield considerable differences in annual energy outputs owing to low river flows. In many cases, large variations in power production can be traced to drought seasons in specific regions. Land use changes in catchments upstream can increase erosion, leading to siltation that reduces storage capacity and the storage potential of the reservoir (Lindström and Granit, 2012). Regarding profitability of hydropower dams, conclusions can be drawn from a variety of case studies performed by the WCD. Even if a number of projects fall short of predicted targets

20
very few projects can be considered economically unprofitable (WCD, 2000a). The number of projects falling slightly short of planned profitability is matched by a number of projects that outperform their original estimates of profitability, with specific projects reaching respectable Economic Internal Rate of Return (EIRR) values even after decades in operations (WCD, 2000a). The Kariba dam located on the border between Zambia and Zimbabwe on the Zambezi river basin, which boasts an EIRR value of 14.5%, is a prime example (Lindström and Granit, 2012). Multi-purpose structures, arrangements and layouts are, by definition, more complex than single use designs. Combining different uses, such as hydropower and flood control, requires that alternative reservoir functions are balanced and maintained in an optimal way to maximise benefits from multi-purpose schemes. The WCD concludes that the impacts of conflicting water use arising between different operational uses of multi-purpose dams are underestimated. Ecosystem services and socio-economic development schemes will usually be considered during project design even in a single purpose scheme example (Lindström and Granit, 2012). It is important to note that in many developing countries and especially Africa, sources of electricity are often selected using “least cost” criteria and analysis (Hankins, 2009). This aims at identifying the least cost project option for supplying sufficient power to meet the forecast demand. Least cost analysis involves comparing the costs of various mutually exclusive, technically feasible project options and selecting the one with the lowest costs (EDReC, 1997) Whilst least cost criteria have the short-term advantages in procuring energy sources for the lowest amounts of money, narrow financial considerations when selecting power sources are not necessarily healthy for the long-term (Hankins, 2009). Hankins states that the strict adherence to “least-cost” power planning has a number of drawbacks including:
Least-cost power sources often have environmental problems that are not considered in the least-cost accounting e.g. coal-fired power plants emit large quantities of carbon dioxide and cause increased reliance on fossil fuels
Mega-projects, such as large hydropower schemes or large thermal power stations, that deliver power centrally have the disadvantage of not decentralizing power distribution to parts of the country that need investment. The costs of transmission and distribution lines from the central locations to remote areas are high and this can result in many areas remaining unelectrified
Least-cost planning ignores new sources of energy that will become more important in the future, such as solar and wind power
Least cost planning does not encourage diversification of power sources (Hankins, 2009)
2.4 Social and environmental impacts
2.4.1 Introduction
The costs and benefits of hydropower development have not been evenly or equitably distributed among societies and this is one of the biggest challenges for the sustainability of hydropower (WCD, 2000a). At the same time as extensive benefits have been realised by the introduction of hydropower, a significant amount of damage has been done to environmental and social systems through the process of building and operating the dams associated with hydropower facilities (WCD, 2000a). This has most often resulted from

21
inadequacies in the planning process at the pre-feasibility and feasibility stages, ignoring or undervaluing the affected resources. Issues of social and environmental degradation and under-performance are intertwined owing to the complexity of social and environmental systems and the reactions of both people and nature to disturbances (Egré and Milewski, 2002). The non-market valuation of ecosystem goods and services has presented a challenging problem (Sagoff, 2008 and 2011; Abson and Termansen, 2011) meaning their loss or degradation has often been excluded or marginalised in economic cost-benefit analysis (Salzman, 1997). An overview of the social and environmental impacts of different types of hydropower schemes is given in Table 4. Type of hydropower scheme
Overview of the environmental and social impacts
All
Barrier for fish migration and navigation, as well as sediment transport Physical modification of riverbed and shorelines Resettlement of people Loss of livelihoods
Run of river Unchanged river flow when powerhouse in dam toe; when located further downstream reduced flow between intake and powerhouse
Storage
Alteration of natural and human environment by impoundment, resulting in impacts on ecosystems and biodiversity and communities Modification of volume and seasonal patterns of river flow, changes in water temperature and quality, land use change-related greenhouse gas emissions
Multi-purpose As for reservoir hydropower schemes Possible water use conflicts Driver for regional development
Pumped storage
Impacts confined to a small area; often operated outside the river basin as a separate system that only exchanges the water from a nearby river from time to time
(Source: Adapted from IEA, 2000; Egré and Milewski, 2002)
Table 4 Environmental and social impacts of different types of hydropower scheme
2.4.2 Social impacts
The performance of hydropower schemes, in terms of social impacts can be measured by the following:
Size of the involuntary population displacement and how, if this has to take place, the effects can be ameliorated
The number of affected people and vulnerable groups especially with respect to groups that might be considered vulnerable with respect to the degree to which they are marginalised or impoverished and their capacity and means to cope with change
Public health
Cultural heritage
Sharing development benefits On a relative scale some of the above social impacts can create an additional burden in a small country even when the number of people affected is relatively low (Cernea, 1997). Box 3 illustrates the importance of monitoring and following up hydropower projects where social impacts have apparently been dealt with successfully.

22
Box 3 Social impacts of Nangbeto hydropower scheme, Togo
The reservoir of the Nangbeto hydropower scheme in Togo that was completed in 1987 displaced 10,600 people, of which 3,000 lost their houses but little of their land. The other 7,600 had to be moved to resettlement zones 30 to 55 km from their former homes. These zones were in sparsely populated areas. The resettlement was initially seen as successful. However, since 1987, migration and natural growth have caused overpopulation, which curtailed the former system of extensive agriculture based on rotation among landholdings of the land area farmed in any single year. Without sufficient incomes to afford fertilizers, improved seeds, and other inputs to maintain soil fertility, settlers often got trapped in a spiral of declining yields and incomes. This demonstrates that even apparently successful resettlement requires monitoring and follow-up. (World Bank, 2000)
2.4.3 Environmental impacts
The main environmental impacts of hydropower schemes are summarised in Figure 14. With respect to new dams the most effective environmental mitigation measure is good site selection, to minimise the potential impacts in the first place (NHA, 2010). In general, the most environmentally benign hydropower dam sites are on upper tributaries, while the most problematic ones are on the large rivers further downstream of the headwaters (Ledec and Quintero, 2003).
Figure 14 Overview of the environmental impacts of hydropower schemes
(Source: Adapted from Vovk-Korže et al., 2008)
Ledec and Quintero (2003) presents a number of quantitative, easily calculated indicators that are especially useful for hydropower scheme site selection from an environmental point
23
of view. The indicators have a high predictive value for likely adverse environmental impacts. The information is normally easy to obtain from basic dam planning data, often without the need for a separate environmental study (Ledec and Quintero, 2003). These indicators are summarised below:
Reservoir surface area – The area flooded by the reservoir is a strong proxy variable for many environmental impacts (Goodland, 1997). A useful measure of environmental costs relative to economic benefits is the ratio of inundated hectares per Megawatt (ha/MW) of electricity. The global average for large hydropower dams constructed is about 60 ha/MW (Ledec and Quintero, 2003)
Water retention time in reservoir – Mean water retention time during normal operation (the shorter, the better) is very useful in estimating the extent to which reservoirs will have long-term water quality problems
Flooded biomass in terms of tonnes per hectare
Length of river impounded
Length of river left dry – This is the length of river left dry (i.e. with less than 50% of dry season mean flow) below the dam as the result of diverting water
Number of undammed, downstream tributaries – The more large, undammed tributaries downstream of the dam site, the better, in terms of limiting environmental damage
Likelihood of reservoir stratification – This occurs when the lake’s upper zone is thermally divided from the deeper zone and the latter becomes stagnant and lacking in dissolved oxygen, making it unsuitable for most aquatic life (Ledec and Quintero, 2003)
Useful reservoir life – This is the expected number of years before a reservoir’s dead storage is completely filled and sediment commences to fill the live storage
Extent of access roads through forests
Area of critical natural habitats affected
Fish species diversity and endemism – Fish species diversity is the number of species known from the project area, including the dam and reservoir site, as well as the downstream zone of dam. Fish species endemism is the number of native species located only in the project area, or the river system where the project is located, and nowhere else on earth (Ledec and Quintero, 2003)
The above indicators can also be used retrospectively to rapidly evaluate the environmental impacts of an existing hydropower scheme. Box 4 provides an illustration of two large hydropower projects that have contrasting environmental impacts.
Box 4 Contrasting environmental impacts of two large hydropower projects
The 500 MW Pehuenche hydropower scheme in Chile flooded only about 400 ha of land, with minimal damage to forest or wildlife resources, and has had no water quality problems. The Brokopondo Dam in Suriname inundated about 160,000 ha of biologically valuable tropical rainforest and has had serious water quality and aquatic weed problems, while providing relatively little electric generating capacity (i.e. around 30 MW). (Source: Ledec and Quintero, 2003)
Box 5 gives background to the Southern African Power Pool’s (SAPP) environmental and social impact assessment guidelines for hydropower projects which appear to be being widely used in Southern Africa in the planning of new hydropower schemes (Moremoholo, 2011).

24
Box 5 Southern African Power Pool’s (SAPP) environmental and social impact assessment guidelines for hydropower projects
The Southern African Power Pool (SAPP), is the first formal international power pool in Africa. It was created with the primary aim of providing reliable and economical electricity supply to the consumers of each of the SAPP members, consistent with the reasonable utilisation of natural resources and the effect on the environment. It covers 12 of the 14 members of the Southern African Development Community (SADC), (it does not cover Mauritius and the Seychelles). SAPP has produced guidance for the carrying out and assessing the performance of Environmental Impact Assessments (EIA) and Social Impact Assessments (SIA) for hydropower schemes. These cover: identification and mitigation for impacts during: siting; resettlement; construction; operation and maintenance; and decommissioning. The SAPP guidelines appear to be being used in the planning of new hydropower schemes in southern Africa (see Moremoholo, 2011). SAPP has reported that the environmental and social impact caused by hydropower schemes in southern Africa are:
Excessive and emergency release of waters
Material delivery, storage and handling
Traffic
Emissions
Waste in all forms
Leaks and spillages
Unsuitable compensation procedures
Lack of communication (SAPP, 2007; Moremoholo, 2011)
Box 6 provides background to the International Hydropower Association’s (IHA) hydropower sustainability assessment protocol. This was launched fairly recently (2011) and at present does not appear to be being widely used to assess hydropower schemes in low income countries.
Box 6 International Hydropower Association’s (IHA) hydropower sustainability assessment protocol
The International Hydropower Association’s (IHA’s) Hydropower Sustainability Assessment Protocol is an enhanced sustainability assessment tool used to measure and guide performance in the hydropower sector. The protocol:
is a framework for assessing the sustainability of hydropower projects
distils hydropower sustainability into more than 20 clearly-defined topic
provides a consistent, globally-applicable methodology
is governed by a multi-stakeholder council
is regulated by a charter and terms and conditions of use The protocol was the result of the Hydropower Sustainability Assessment Forum, a multi-stakeholder body with representatives from social and environmental Non-Governmental Organisations (i.e. Oxfam, The Nature Conservancy, Transparency International, WWF); governments (i.e. China, Germany, Iceland, Norway, Zambia); commercial and development banks (i.e. Equator Principles Financial Institutions Group, The World Bank); and the

25
hydropower sector, represented by IHA. The protocol was officially launched in June 2011 and is governed by a multi-stakeholder council, reflecting the broad stakeholder groups contained in the forum, and made up of a governance committee, chambers and a management entity. There are four assessment tools: Early stage; Preparation, Implementation, and Operation which are designed to be stand-alone assessments applied at particular stages of the project life cycle of a hydropower scheme covering a complete range of technical, environmental, social and economic issues. Protocol assessments in the public domain are provided on the IHA’s website. However, to date there are only eight available and none of these are for hydropower schemes in low income counties. (IHA, 2010; IHA, 2012)
There has been some criticism levelled at the IHA hydropower sustainability assessment protocol. The main one is that unlike the World Commission on Dams the IHA protocol does not define any clear minimum standards that dam developers must comply with or rights that must be respected (Lawrence, 2009). Further issues are summarised below:
A catchment-wide approach to decision-making on water and energy projects is not required (i.e. the protocol works on a site or project level)
There is no need to provide access to information and legal support for stakeholders
There is no obligation to include a clear compliance framework, which is subject to independent review, that includes both sanctions and incentives with necessary costs built into the project budget
Many of the principles of the IHA protocol are not measurable (Source: Lawrence, 2009)
2.5 Water use
A water footprint of a product or service is a comprehensive measure of freshwater consumption that connects consumptive water use to a certain place, time, and type of water resource (Dourte and Fraisse, 2012). A water footprint accounts separately for three types of freshwater consumption:
Green water use, which is consumption from rainfall
Blue water use, which is consumption from groundwater or surface water
Grey water use, which is the water required to reduce pollutant concentrations to acceptable levels
(Mekonnen and Hoekstra, 2012; Dourte and Fraisse, 2012).
The water footprint of hydropower schemes refers only to the blue water footprint and is defined as the amount of water used to produce a given unit of electricity. Mekonnen and Hoekstra (2012) carried out research to assess the blue water footprint of hydropower schemes, (i.e. the water evaporated from manmade reservoirs), for 35 selected sites worldwide. The aggregated blue water footprint of the selected hydropower plants was 90 Gm3/year, which is equivalent to 10% of the blue water footprint of global crop production in the year 2000 (Mekonnen and Hoekstra, 2012). The total blue water footprint of

26
hydropower generation in the world is considerably larger if one considers the fact that Mekonnen and Hoekstra’s study covered only 8% of the global installed hydropower capacity (Mekonnen and Hoekstra, 2012). The water footprint for hydropower schemes in some low income countries is given in Table 5. Scheme Reservoir
area (ha) Installed capacity (MW)
Evaporation (mm/year)
Water footprint (m3/MWh)
Theoretical energy
production
Actual energy production
Akosombo-Kpong, Ghana
850,200 1180 2,185 1,796 3,046
Cahora Bassa, Mozambique
266,000 2075 3,059 446 670
Itezhi Tezhi, Zambia
37,000 600 2,572 181 340
Kariba Zambia-Zimbabwe
510,000 1320 2,860 1,260 2,279
Kiambere, Kenya 2,500 150 2,356 45 65
Kulekhani, Nepal 2,000 60 1,574 60 169
(Source: Adapted from Mekonnen and Hoekstra, 2012)
Table 5 Blue water footprint for selected hydropower schemes in DFID priority countries
This research highlights the following that should be taken into account during the planning stage of hydropower schemes:
Assessing the water footprint is an additional consideration when evaluating the environmental, social and economic sustainability of a proposed hydropower scheme (Demeke et al., 2013). Assessing the water footprint of new schemes would allow them to be more easily compared with other power generation options, as well as other competing water uses
The water footprint of hydropower schemes should be studied in the context of the river catchment in which this water footprint occurs, because competition over water and possible alternative uses of water (e.g. irrigation, water supply) differ per catchment
2.6 Greenhouse gas emissions
Hydropower is often cited as a green form of energy; however, some researchers believe that “the clean, green image of dams may have been seriously overstated” (Giles, 2006). In 1993 Rudd et al. were amongst the first researchers to postulate that hydropower schemes that utilise large reservoirs release significant amounts of greenhouse gases, especially in their early years of operation following the impoundment of the reservoir (Rudd et al., 1993). Lima et al. (2008) estimated reservoirs in the tropics could be contributing an additional 30% to existing estimates of global methane emissions. Greenhouse gases can be generated by decay of standing and inflowing biomass and stratification of the water body (St Louis et al., 2000; Giles, 2006; Fearnside, 2002 and 2004). They are emitted from the surface, by bubbling up from the sediments or through sudden pressure changes during turbine operations or other releases (St Louis et al., 2000; Giles, 2006; Fearnside, 2002 and 2004). Raadal et al. (2011) carried out a review of the life cycle greenhouse gas emissions from the generation of wind and hydropower (Raadal et al., 2011). Their review considered 38 hydropower schemes, the results of which in terms of greenhouse gas emissions per

27
kilowatt hour are shown in Figure 15. It is important to note that many of the hydropower schemes that Raadal et al. reviewed are located in temperate zones such as North America and Europe. Researchers tend to concur that hydropower schemes located in the tropics emit more greenhouse gases than those found in cooler parts of the world (Mendoça et al., 2012). There is still a great deal of uncertainty related to greenhouse gas emissions over the entire life cycle of large hydropower schemes and this is an area where more research on the greenhouse emissions of hydropower schemes located in Africa and Asia is needed. For example, there has been significant debate over greenhouse gas emissions from hydropower schemes in Brazil. Annual greenhouse gas emissions from the Tucuruí hydropower scheme located in the Brazilian Amazon, which has an installed capacity of 8,370 MW and a reservoir surface area of 2,850 km2, have been argued to be larger than the greenhouse emissions from São Paulo, which is Brazil’s largest city (Fearnside, 2002). Other researchers contested this finding and considered the greenhouse gas emissions to be largely overestimated (Rosa et al., 2004). This led to a debate between two groups with contrasting opinions (Fearnside, 2004; Rosa et al., 2004; Cullenward and Victor, 2006; Fearnside, 2006; Giles, 2006; Maeck et al., 2013).
Figure 15 Summary of life cycle greenhouse gas emissions from hydropower
(Source: Raadal et al., 2011)
Although the researchers disagree on the amount of greenhouse gases emitted from large hydropower storage schemes in relation to other energy sources, they do agree that greenhouse gas emissions from tropical reservoirs can be significant. There also appears to be agreement that greenhouse emissions are correlated to reservoir age and latitude, with the highest emission rates from the tropical Amazon region (Barros et al., 2011). Thus future emissions will be highly dependent on the geographic location of new hydropower reservoirs (Barros et al., 2011). As part of the Kyoto Protocol a Clean Development Mechanism (CDM) was initiated. This is a project-based mechanism that allows industrialised countries to generate emission

28
reduction credits through projects in developing countries (Mäkinen and Khan, 2010). Hydropower is the most popular type of CDM project (Talberg and Nielson, 2009). An overarching requirement of the CDM is that project activities must help host countries to achieve sustainable development and contribute to the overall objective of the United Nations Framework Convention on Climate Change (UNFCCC) of reducing greenhouse gas concentrations in the atmosphere. One of the main conditions of CDM funding is the principle of ‘additionality’, meaning it should not be available to projects which are profitable investments in their own right. CDM funding should only be used to support investment in low carbon technologies such as hydropower where this is not a profitable proposal. This is notoriously difficult to assess however, and leads to much of the CDM’s reserves being consumed by large already profitable schemes (Pittock, 2010). Pittock (2010) also reports that CDM grant conditions conflict with the Convention on Biological Diversity and Ramsar Convention on Wetlands, allowing negative environmental impacts to be inadvertently promoted (Pittock, 2010). In February 2006, the CDM Executive Board ruled that hydropower projects in the large-scale category must satisfy certain “power density” conditions in order to be eligible as CDM project activities (Mäkinen and Khan, 2010). The power density is defined as the installed generation capacity divided by surface area of the hydropower reservoir. Table 6 summarises the power density thresholds put in place as a precautionary measure whilst clarification of the magnitude of reservoir greenhouse emissions is established. Power density of hydropower scheme (W/m
2)
Eligibility to use approved methodologies under CDM rules
<4 Excluded from using currently approved methodologies
4 to 10 Allowed to use approved methodologies but project emissions must be included at 90g CO2 equivalent per kWh
>10 Allowed to use approved methodologies and project emissions can be neglected
(Source: Mäkinen and Khan, 2010)
Table 6Restrictions on hydropower projects under the Kyoto Protocol Clean Development Mechanism (CDM)
It is important to note that since 2011 global carbon markets have shrunk in value by 60%. This has affected the UN’s “flexible mechanisms”, including the Clean Development Mechanism (CDM) (Redd-Monitor, 2014). The UN flexible mechanisms now account for 1% of the value of the world’s carbon markets and investment in new CDM projects has ground to a halt (Redd-Monitor, 2014).
29
SECTION 3 Factors affecting hydropower performance
3.1 Introduction
There are a number of ways in which the performance of hydropower performance can be affected. This chapter covers the main issues that impact performance including:
Funding mechanisms and the role that public and private finance plays
Availability of data
Physical and environmental factors including: hydrology; sedimentation; climate variability
Climate change
Operation and maintenance
Type of scheme i.e. single purpose versus multi-purpose schemes
3.2 Funding mechanisms
3.2.1 Public and private: Concepts and definitions
For clarity, a distinction should be made between ownership and finance, different kinds of finance, and different sources of equity. In practice, there is increasing overlap between public and private involvement and the growth in the number of hybrid projects involving private finance and operation within a publicly owned structure (as in Independent Power Projects (IPPs), Build Own Operate Transfer (BOOTs) and other forms of concession contract). One leading specialist has even proposed a refocusing of the topic to be on “private financing of public projects” (Head, 2000) owing to problems with the satisfactory allocation of risks to private partners, and the benefits of a sizeable public stake in these projects. IPPs and BOOTs are defined below.
Independent Power Projects (IPPs) – These are “privately financed greenfield3 generation, supported by non-recourse4 or limited recourse loans, with long-term power purchase agreements with the state utility or another off-taker” (Gratwick and Eberhard, 2008)
Build Own Operate Transfer (BOOT) – This is a concession contract in which the sponsor is responsible for building and financing the infrastructure, operating it through the concession period, receiving payment from the client (typically under a “take or pay” deal with the offtaker) and eventually transferring ownership of the asset back to the client at the end of the concession period.
3 Usually taken to mean new, stand-alone capacity, rather than creation of distribution systems.
4 In which the lender only has the right to repayment from the cash flow of the project (or
Special Purpose Vehicle) rather than from the balance sheet of the sponsoring company or agency.
30
3.2.2 Ownership
Most large hydropower schemes, especially those incorporating large storage dams, are owned by host governments and their public agencies. However, under privately financed initiatives such as IPPs and BOOTs, the physical assets created by the project start off in the ownership of the contractor, before eventually passing to the public client at the end of the concession period.
3.2.3 Finance
Owing to the risk involved hydropower projects tend to have a relatively high equity element in their financing structures. This was true in 20% to 40% of the cases reviewed by Head (2000). This equity may be provided by host governments, International Financing Institutions (IFIs), or private companies (including contractors). The rest is debt finance, typically involving loans from public IFIs such as the Asian Development Bank (ADB), African Development Bank (AfDB), Inter-American Development Bank (IADB) and the European Investment Bank (EIB), often involving commercial banks through syndicated operations (“A and B Loans”, in which B loans from commercial banks enjoy the same repayment status as the IFI loans themselves). For completeness, commercial finance is a more accurate description of loans than the term “private”, since much lending in this sector is from international public agencies, and state-owned and controlled banks, as well as private plcs5. The same is true of equity and bonds, which can be held by both private and public agencies. The key point is that commercial finance, i.e. loans, bonds and equity, is offered for commercial motives, on market or near-market terms, and has to be repaid. The most comprehensive database of private involvement in infrastructure is maintained by the Public-Private Infrastructure Advisory Facility (PPIAF), hosted by the World Bank (see www.ppiaf.org). All projects with significant private “participation” are included, spanning a range of interventions such as management contracts as well as equity investment and concessions. “Participation” implies exposure to performance and other risks of the project.
3.2.4 The nature and extent of private sector involvement in hydropower projects
Within the power sector, hydropower has tended to have minority appeal to private generators, typically accounting for 5% or less of new private power projects, compared with 90% or more of privately financed projects that are fossil-fuelled (Head, 2004). Private financial involvement in hydropower projects has always been on a smaller scale than publicly sponsored and financed schemes. For large hydropower projects in 2012, 15,509 MW of projects with private participation reached financial closure in developing countries, with total project costs of US$21.15 billion. For small hydropower projects, the corresponding figures were 1,113 MW to a value of US$1.25 billion. In both cases, Brazil accounted for most of the activity (PPIAF, 2013). Within hydropower, public and private sponsors gravitate to different modes of supply. The bulk of private schemes are run-of-river projects, smaller and less risky in terms of investment than large projects involving stored water. Typical of this is one of the latest private hydropower projects in Pakistan, from the Hub Power Company, an 84 MW run of river , low head, project starting in March 2013 (PPIAF, 2013). Of the 10 hydropower projects with private participation analysed by Head (2000), six are run of river schemes, the
5 Some of which themselves have sizeable government equity holdings.

31
remainder involving storage. Three of the projects are of the IPP variety. The largest project, a storage scheme, has 1,455 MW capacity.
3.2.5 Reasons for publicly funding hydropower projects
Large hydropower projects involving big dams and reservoirs tend to have a heavy public ownership, management and financing element, for various reasons:
High pre-investment costs, followed by heavy up-front capital costs which are “sunk” once incurred, which makes commercial financing difficult, unless public equity and guarantees form part of the package.
Their multi-purpose nature. The stored water has a role in flood control and drought mitigation, which are public goods as well as use for irrigation and municipal supply, typically cross-subsidised from power sales. These features make for a large public interest in all aspects of hydro projects.
Allocation of risks. Attempts by public sector clients to allocate risks to their private partners have not always been successful, except at excessive insurance, financing and other mitigation costs. This has sometimes led to renegotiation of contracts, resulting in risks being “repatriated” by the public sector and increasing public control over the project
(Head, 2000;Head, 2004; Brown et al., 2009)
3.2.6 The performance of publically and privately funded hydropower projects
The literature review found no studies offering a direct meaningful comparison between the performance of publicly and privately sponsored hydropower projects. Such a comparison would be bedevilled by problems of comparing like with like. The barriers to making a meaningful comparison include:
Private sponsors gravitate towards smaller, less risky, run of river projects, leaving larger projects involving storage predominantly under public ownership, management and financing.
Each major dam project has unique features and factors which make comparisons difficult, and weakens the credibility of any lessons drawn. The larger the project, the more “unique” it is likely to be.
Public regulators invariably take a close interest in private operators, and have a major influence on the performance of the project (e.g. through tariff controls, environmental restrictions, overriding operational protocols at times of drought or flooding). South Africa’s power problems in recent years is a result of government indecision and policy reverses, which have discouraged private entry into a sector still dominated by the parastatal ESKOM (World Bank, 2010).
For major storage schemes the allocation of risks between the different parties can have a big influence on performance (Head, 2000).
The World Commission on Dams (WCD) analysed the performance of major dams, based on eight detailed case studies, wholly in the public sector, and literature searches of other cases. It should be noted that this report contains no acknowledgement of private finance or operation in major dam construction and operation. The WCD found that large dams demonstrated a tendency towards schedule delays and cost overruns (WCD, 2000a). This has knock-on effects in terms of undermining the financial viability of dams or efforts to recover costs through tariffs. The average cost overrun of 81 large dam projects which the WCD scrutinised was 56%. Of the total sample, one quarter of the dams achieved less than planned capital cost targets whilst almost three quarters had cost overruns (WCD, 2000a).

32
It may be significant that multi-purpose, rather than single purpose, dams showed particularly high variability in achieving their performance targets. The average cost overrun was 63% for the 45 multi-purpose projects, three times that of the single-purpose hydropower dams in the sample. The category of single purpose dams most prone to overrun was water supply dams, the average for which was twice that of single purpose irrigation or hydropower dams. WCD’s conclusion was that single purpose hydropower dams performed well in terms of cost overruns (WCD, 2000a). Cost overruns can be ascribed to the following:
Poor cost estimates
Technical problems arising during construction (e.g. geotechnical conditions at a site often cannot be determined exactly until construction is underway)
Poor implementation by suppliers and contractors
Changes in external (economic and regulatory) conditions, including poor prediction of inflation, amongst other factors.
However, the WCD also reviewed 23 completed large dam projects undertaken by the Asian Development Bank, the majority of which had actually experienced cost under-runs (WCD, 2000a). The most cited study is that of 70 World Bank financed hydropower projects commissioned between 1965 and 1986 where costs on completion were on average 27% higher than estimated at appraisal. This compares with average cost overruns of 6% for a sample of 64 thermal power projects and 11% overrun for a sample of 2000 development project of all types (Bacon et.al. 1996). The WCD case study dams displayed a range of results in achieving project schedules. Stage 1 of Kariba Dam and hydropower scheme in southern Africa came in on schedule, whereas Tarbela Dam in Pakistan took two extra years to finish and the Aslantas hydropower scheme in Turkey took an additional four years (WCD, 2000b). Financing difficulties led to a nine year delay in the case of Tucurui hydropower complex in Brazil. A study of World Bank- financed hydropower projects reports a 28% delay on average (but no different from that recorded in the same study for thermal power projects) (Bacon, et. al. 1996). A former Senior Water Adviser to the World Bank has pointed out that in recent years the World Bank’s only two “flagship engagements” in large hydropower projects (Nam Theun 2 in Laos and Bujugali in Uganda) each took well over a decade between start of preparation and construction, owing, amongst other reasons, to a protracted series of internal reviews to ensure they met the World Bank’s various safeguard policies (Briscoe, 2011). The situation has changed, to the extent that developing countries now have other options than the World Bank. China and other emerging market financiers can offer dam construction on much shorter construction schedules, with “lighter” conditionality, and with financing packages on terms intermediate between commercial and concessionary loans (Foster, et. al. 2008).
3.2.7 Trends in the funding and development of hydropower projects
As stated above, with few exceptions, the development, ownership and operation of hydropower projects in the past has been the responsibility of governments and national utilities. In industrialised countries such projects were financed from internal sources or balance sheet borrowings; in developing countries concessional capital from multilateral and bilateral agencies was used (Oud, 2002).

33
Oud states that the increasing role of the private sector the development of infrastructure leads to:
Emphasis on financial project efficiency, resulting in reduced availability of time and funds for planning, investigation and construction work, and also an emphasis on cost-cutting operation and maintenance procedures
Externalization of the indirect costs associated with the project to the maximum extent possible
Levying of water (or power) tariffs which guarantee an attractive financial internal rate of return on the investment, these rates typically being higher than those projects financed conventionally in the past from grants and concessional loans
Off-loading of as much risk as possible onto other parties, particularly onto the Government
(Oud, 2002)
Oud summarised the trends in the development of hydropower in Table 7. Old approach New approach
A hydropower project is a technical scheme to provide basic technical infrastructure to improve the supply of power
A hydropower project is part of a bundle of technical, environmental and social measures to: Cover electricity needs in an efficient and sustainable manner Improve the welfare of people in the region, particularly those directly affected by the project Improve environmental protection
Planning is governments’ responsibility, often assisted by international development agencies
Planning involves many partners and stakeholders including: Governments People affected Non-Governmental Organisations Private sector developers Financing institutions
Least-cost planning procedure Identify the least-cost project to cover power needs Carry out unavoidable social and environmental impact mitigation at minimum cost Carry out detailed studies
Multi-criteria planning procedure Projects must be part of sectoral development plan and or comply with the rules and criteria of a strong national or regional licensing or regulatory body Projects must be sustainable Rigorous study of project alternatives including the no project option Prepare a comprehensive comparison matrix showing the advantages and disadvantages of each alternative from technical, environmental, social, economic, financial, risk and political perspectives Reach consensus amongst stakeholders about overall best alternative to be developed (“broad public acceptance” instead of “least cost”) Carry out detailed studies
(Source: Oud, 2002)
Table 7 Trends in the development of hydropower projects

34
3.3 Physical and environmental factors
3.3.1 Hydrology
The performance of hydropower schemes is directly linked to the hydrological regime of the catchment in which they are located. Understanding the future hydrological characteristics of catchments is becoming ever more difficult because as a result of climate change it is no longer valid to assume that the future runoff will have the same statistical characteristics as past runoff (i.e. stationarity cannot be assumed into the future). Harrison et al. (2003) looked at the effects of climate change on runoff and hydropower performance for the 1,600 MW Batoka Gorge project that is proposed for the Zambezi River, upstream of Lake Kariba and 54 km downstream of Victoria Falls on the Zambia-Zimbabwe border. The project would comprise a 181 m high dam. It would have a catchment of some 508,000 km2 (Zambezi River Authority, 2005). Figure 16 shows the forecast change in annual runoff from the Upper Zambezi as temperature and precipitation levels are altered under future climate change (Harrison et al., 2003). Harrison et al. found that their results were in agreement with the general conclusions drawn by Arnell (1996) which are that under climate change:
Changes in runoff tend to be greater than the precipitation change causing them
Runoff is more sensitive to changes in precipitation than changes in temperature.
Figure 16 Examples of Impacts of future changes in precipitation and temperature on changes in river flows in the Zambezi River catchment
(Source: Adapted from Harrison et al., 2003)
The work carried out by Harrison et al. (2003) shows that the annual changes in runoff hid differences between changes in high flows (January to July) and low flows (August to December) (Harrison et al., 2003). For example, in the rainy season there was found to be an approximately 40% rise in high flows but only a 16% rise in low flows. The larger increase in rainy season flows was caused by the inability of already wet soils to absorb more water (Harrison et al., 2003). Figure 17 shows the changes in flows predicted by Harrison et al. at the Batoka Gorge site on the Zambezi in southern Africa under two climate change scenarios.

35
Such changes in flow directly affect the potential amount of power that can be generated. In the case of the Batoka Gorge hydropower site Harrison et al (2003). The study found that although volumetrically greater changes in output occurred during the high flow period, changing climate impacts proportionately more on low flows (Harrison et al., 2003). Under the wet scenario (an increase in precipitation of 20%) power production was found to be raised by 7% and 18% for high and low flow periods, respectively, while under the dry scenario (a decrease in rainfall of 20%) monthly power output decreased by 23% and 30% on the same basis (Harrison et al., 2003). These changes are shown in Figure 18.
Figure 17 Impacts of two future change scenario on monthly flows at the Batoka Gorge hydropower site on the Zambezi
(Source: Adapted from Harrison et al., 2003)
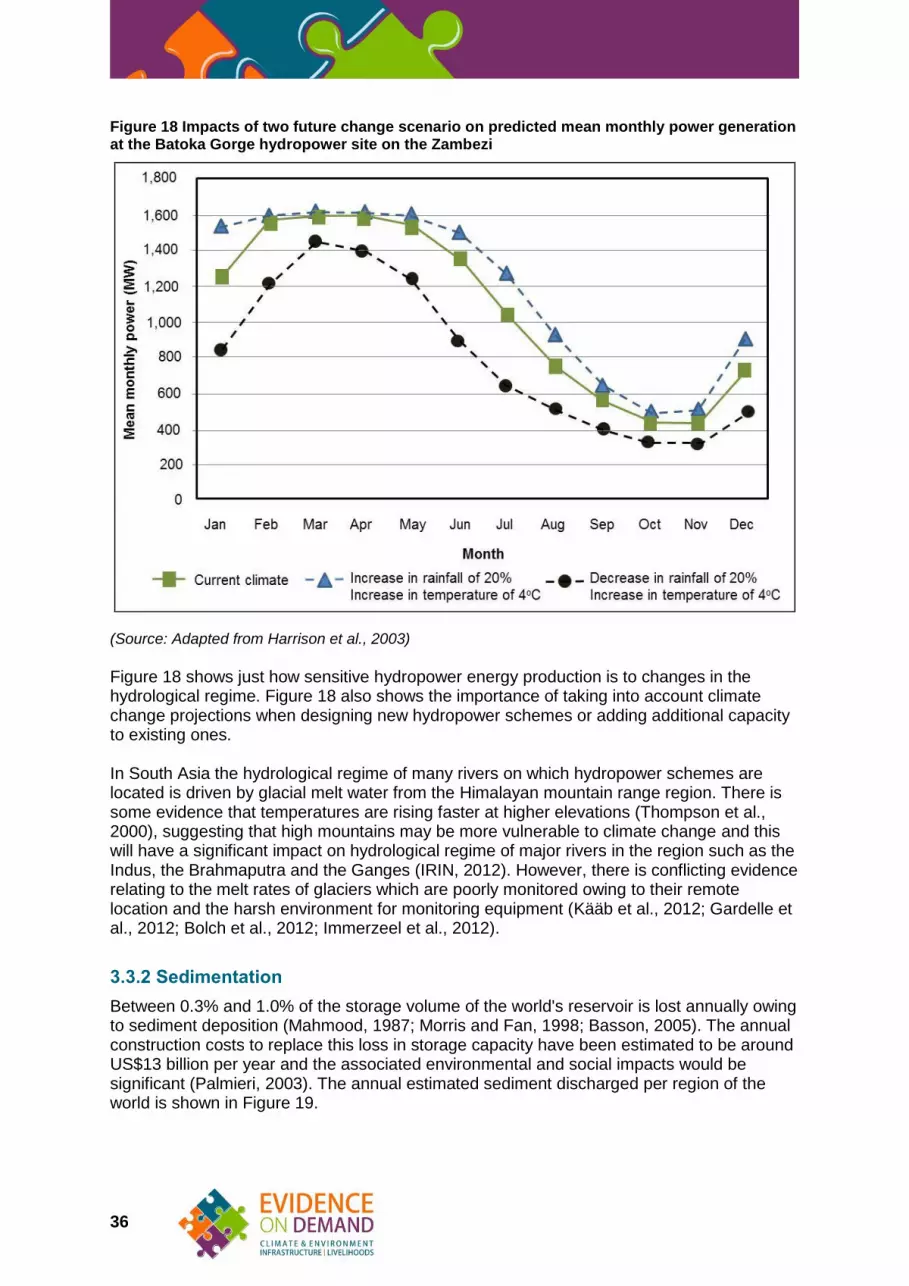
36
Figure 18 Impacts of two future change scenario on predicted mean monthly power generation at the Batoka Gorge hydropower site on the Zambezi
(Source: Adapted from Harrison et al., 2003)
Figure 18 shows just how sensitive hydropower energy production is to changes in the hydrological regime. Figure 18 also shows the importance of taking into account climate change projections when designing new hydropower schemes or adding additional capacity to existing ones. In South Asia the hydrological regime of many rivers on which hydropower schemes are located is driven by glacial melt water from the Himalayan mountain range region. There is some evidence that temperatures are rising faster at higher elevations (Thompson et al., 2000), suggesting that high mountains may be more vulnerable to climate change and this will have a significant impact on hydrological regime of major rivers in the region such as the Indus, the Brahmaputra and the Ganges (IRIN, 2012). However, there is conflicting evidence relating to the melt rates of glaciers which are poorly monitored owing to their remote location and the harsh environment for monitoring equipment (Kääb et al., 2012; Gardelle et al., 2012; Bolch et al., 2012; Immerzeel et al., 2012).
3.3.2 Sedimentation
Between 0.3% and 1.0% of the storage volume of the world's reservoir is lost annually owing to sediment deposition (Mahmood, 1987; Morris and Fan, 1998; Basson, 2005). The annual construction costs to replace this loss in storage capacity have been estimated to be around US$13 billion per year and the associated environmental and social impacts would be significant (Palmieri, 2003). The annual estimated sediment discharged per region of the world is shown in Figure 19.

37
Figure 19 Estimated global sediment loads
(Source: Adapted from Solanki and Sem, 2010 based on data collected in 2004)
The sedimentation of hydropower dams has effect on power generation by:
Blocking power intakes
Abrasion of turbines During the 1997 19th Congress of the International Commission on Large Dams (ICOLD), the Sedimentation Committee (Basson, 2002) passed a resolution encouraging all member countries to the following measures:
Develop methods for the prediction of the surface erosion rate based on rainfall and soil properties.
Develop computer models for the simulation and prediction of reservoir sedimentation processes
Alam (2013) describes fundamental problems with the way sediment is accounted for in the planning for dam design and maintenance. The sediment load data are often very approximate because:
There are large variations in sediment loads occur from day-to-day
The bed load which constitutes a considerable proportion of the sediment and the largest particle sizes is hard to measure accurately
This often results in an underestimation of the rate of sedimentation rate (Alam, 2013). In 2000 the World Commission on Dams (WCD) reported that a survey of dams older than 25 years showed that 10% of the projects had lost 50% or more of their live storage volume owing to the deposition of sediment (WCD, 2000a). The Tarbela Dam in Pakistan has experienced capacity reduction of 30% over the 40 years since it was commissioned (Roca, 2012) and plans are being made for upstream reservoirs simply to intercept sediment which will require substantial investment.
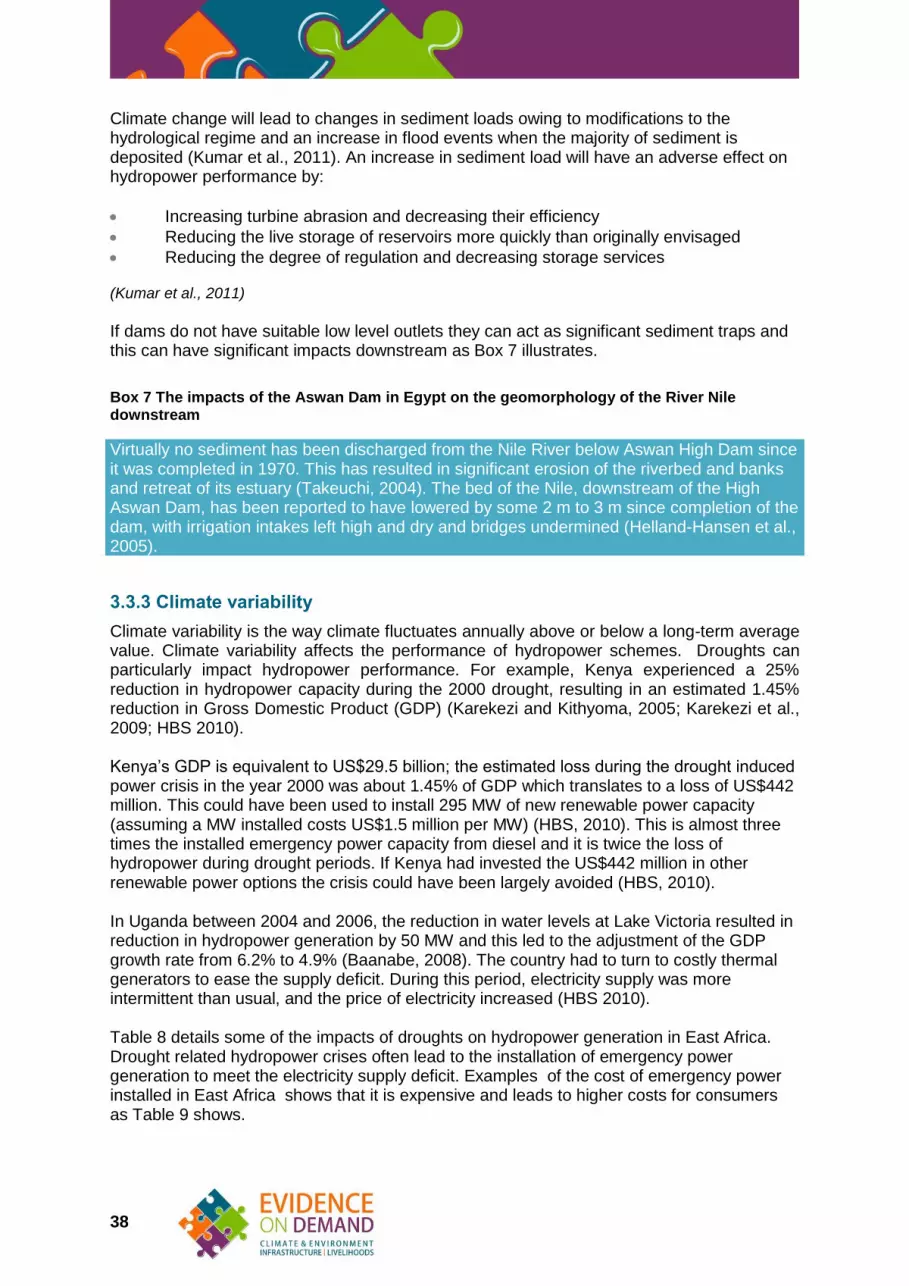
38
Climate change will lead to changes in sediment loads owing to modifications to the hydrological regime and an increase in flood events when the majority of sediment is deposited (Kumar et al., 2011). An increase in sediment load will have an adverse effect on hydropower performance by:
Increasing turbine abrasion and decreasing their efficiency
Reducing the live storage of reservoirs more quickly than originally envisaged
Reducing the degree of regulation and decreasing storage services (Kumar et al., 2011)
If dams do not have suitable low level outlets they can act as significant sediment traps and this can have significant impacts downstream as Box 7 illustrates.
Box 7 The impacts of the Aswan Dam in Egypt on the geomorphology of the River Nile downstream
Virtually no sediment has been discharged from the Nile River below Aswan High Dam since it was completed in 1970. This has resulted in significant erosion of the riverbed and banks and retreat of its estuary (Takeuchi, 2004). The bed of the Nile, downstream of the High Aswan Dam, has been reported to have lowered by some 2 m to 3 m since completion of the dam, with irrigation intakes left high and dry and bridges undermined (Helland-Hansen et al., 2005).
3.3.3 Climate variability
Climate variability is the way climate fluctuates annually above or below a long-term average value. Climate variability affects the performance of hydropower schemes. Droughts can particularly impact hydropower performance. For example, Kenya experienced a 25% reduction in hydropower capacity during the 2000 drought, resulting in an estimated 1.45% reduction in Gross Domestic Product (GDP) (Karekezi and Kithyoma, 2005; Karekezi et al., 2009; HBS 2010). Kenya’s GDP is equivalent to US$29.5 billion; the estimated loss during the drought induced power crisis in the year 2000 was about 1.45% of GDP which translates to a loss of US$442 million. This could have been used to install 295 MW of new renewable power capacity (assuming a MW installed costs US$1.5 million per MW) (HBS, 2010). This is almost three times the installed emergency power capacity from diesel and it is twice the loss of hydropower during drought periods. If Kenya had invested the US$442 million in other renewable power options the crisis could have been largely avoided (HBS, 2010). In Uganda between 2004 and 2006, the reduction in water levels at Lake Victoria resulted in reduction in hydropower generation by 50 MW and this led to the adjustment of the GDP growth rate from 6.2% to 4.9% (Baanabe, 2008). The country had to turn to costly thermal generators to ease the supply deficit. During this period, electricity supply was more intermittent than usual, and the price of electricity increased (HBS 2010). Table 8 details some of the impacts of droughts on hydropower generation in East Africa. Drought related hydropower crises often lead to the installation of emergency power generation to meet the electricity supply deficit. Examples of the cost of emergency power installed in East Africa shows that it is expensive and leads to higher costs for consumers as Table 9 shows.

39
Country Period of
drought Consequences
Ethiopia 2006 to 2008
More than six months of power cuts were experienced owing to low water levels in hydropower dams. Blackouts were scheduled once a week; however, as the drought continued customers lost power for 15 hours two days a week.
Uganda 2004 to 2005
Reduction in water levels in Lake Victoria resulted in a reduction in hydropower generation by 50 MW
Kenya 1998 to 2001
A serious drought reduced hydropower generation by 25% in 2000. Expensive fuel-based generation methods had to be used. Power rationing was introduced between 1999 and 2001.
Malawi 1997 to 1998
Engineering operations were affected by a drought. The amount of hydropower was 6% less than in years of normal rain.
Mauritius 1999 A drought led to a 70% drop in the normal annual production of hydropower.
Tanzania 1997 The Mtera dam reached its lowest water level resulting in a 17% fall in hydropower generation. Use was made of thermal generation to meet the shortfall, as well as power rationing.
(Source: Karekezi and Kithyoma, 2008)
Table 8 The impact of droughts on hydropower generation in East Africa
Country Date Contract
duration (years)
Energy capacity (MW)
Percentage of total installed
capacity
Estimated cost as a percentage of GDP
Rwanda 2005 2 15 48% 1.84%
Uganda 2006 2 100 42% 3.29%
Tanzania 2006 2 180 20% 0.96%
Kenya 2006 1 100 8% 1.45%
(Source: Everhard et al., 2008)
Table 9 Cost of installing additional generating capacity as a result of droughts affecting hydropower generation in East Africa
3.4 Climate change
Numerous studies have indicated that hydropower economics are sensitive to changes in precipitation and runoff (Alavian et al. 2009; Gjermundsen and Jenssen 2001; Mimikou and Baltas 1997; Harrison and Whitington 2001, 2003). Climate change will affect two important climatic variables that affect hydropower performance, these are:
Precipitation
Temperature Figure 20 shows the ways in which changes in precipitation and temperature, will affect hydropower performance.

40
Figure 20 Flow chart of climate change effects on hydropower performance
Most hydropower projects are designed on the basis of recent climate history (typically a 30 to 50 year historical time series of flow data) and the assumption that future hydrological patterns (average annual flows and their variability) will follow historical patterns, this is known in statistics as stationarity (WCD, 2000a; WMO, 2008; March et al., 2008). This notion that hydrological patterns will remain “stationary” (unchanged) in the future, however, is no longer valid (Milly et al. 2008). Under future climate scenarios, a hydropower station designed and operated based on the past century’s record of flows is unlikely to deliver the expected services over its lifetime (IPCC, 2011). It may be over-designed relative to expected future water balances and droughts, as well as under-designed relative to the probability of extreme inflow events in the future. In Africa, the electricity supply in a several countries (e.g. Ethiopia, Malawi, Zimbabwe, Zambia) is largely based on hydropower. However, there are few studies available that examine the impacts of climate change on hydropower resource potential in Africa (Kumar et al., 2011). The median of 12 climate model projections point to a reduction in hydropower resource potential with the exception of East Africa (Hamududu and Killingtveit, 2010). In major hydropower-generating Asian countries such as China, India and Tajikistan future reductions in runoff, owing to climate change, have been could potentially significant reduce hydropower output (Kumar et al., 2011). An increased probability of landslides and glacial lake outburst floods (GLOFs), and impacts of increased variability, are of particular concern to Himalayan countries (Agrawala et al., 2003). The possibility of accommodating increased intensity of seasonal precipitation by increasing storage capacities may become particularly important (Iimi, 2007). To understand how climate change will affect hydropower generation it is necessary to consider the ways in which characteristics of hydropower schemes affect their vulnerability to climate change. Blackshear et al. created a framework that shows the relative changes in generation capacity owing to climate change. This is shown in Figure 21. They used this framework as a simple screening tool (Blackshear et al., 2011). Blackshear et al. looked at
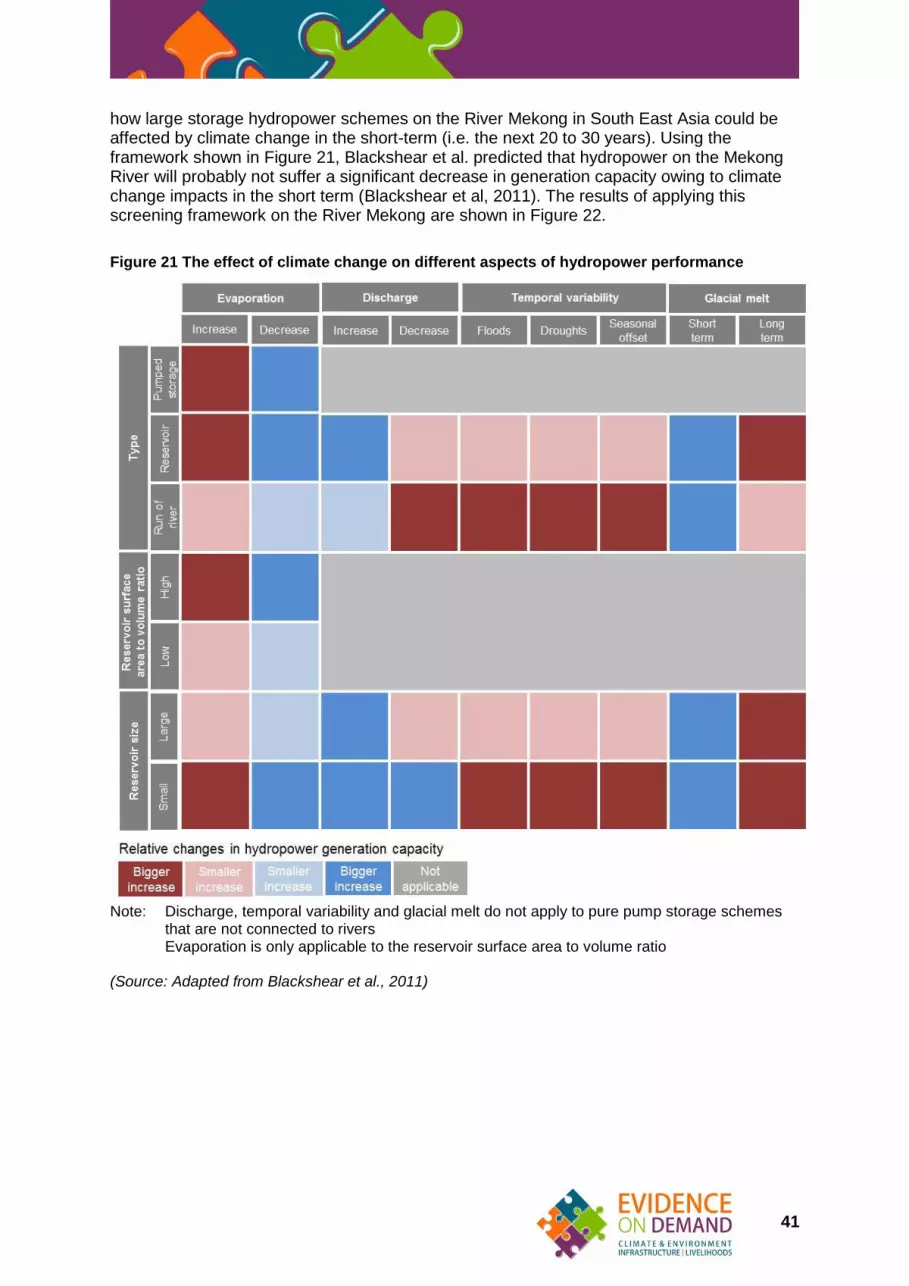
41
how large storage hydropower schemes on the River Mekong in South East Asia could be affected by climate change in the short-term (i.e. the next 20 to 30 years). Using the framework shown in Figure 21, Blackshear et al. predicted that hydropower on the Mekong River will probably not suffer a significant decrease in generation capacity owing to climate change impacts in the short term (Blackshear et al, 2011). The results of applying this screening framework on the River Mekong are shown in Figure 22.
Figure 21 The effect of climate change on different aspects of hydropower performance
Note: Discharge, temporal variability and glacial melt do not apply to pure pump storage schemes
that are not connected to rivers Evaporation is only applicable to the reservoir surface area to volume ratio (Source: Adapted from Blackshear et al., 2011)

42
Figure 22 Application of a simple framework to assess the impacts of climate change on hydropower performance in the Mekong River catchment
(Source: Adapted from Blackshear et al., 2011)
Although a simple framework such as the one developed by Blackshear et al. (2011) may be of use as a simple screening tool to provide an overview of climate change impacts, such is the sensitivity of hydropower performance to climate change that a more detailed analysis of climate change impacts should be undertaken even at a pre-feasibility level study. However, this often does not take place. A recent scoping study conducted for the World Bank by Vattenfall Power Consultant (Rydgren et al. 2007), for example, noted: “Most hydropower/reservoir operators do not see climate change as a particularly serious threat. The existing hydrological variability is more of a concern, and the financially relevant planning horizons are short enough that with variability being much larger than predicted changes, the latter do not seem decisive for planning” (Rydgren et al. 2007). Harrison et al. looked to set the impact of climate change on the net present value (NPV) of the proposed Batoka Gorge hydropower project on the Zambezi river in southern Africa in context with other key project parameters (Harrison et al., 2003). Hydropower projects involving dams, are prone to cost and programme overruns (WCD, 2000a). In addition to extending the period where there is no revenue associated with scheme, in the intervening period the price of electricity may change or the generating station may default on an electricity supply contract (Harrison et al., 2003). Harrison et al. selected important project

43
parameters including changes in precipitation to test the sensitivity of the NPV of the Batoka Gorge hydropower project to these. These parameters included:
Civil engineering costs because they represent the main capital cost and inaccurate estimates of these having a significant impact on project returns
Construction period, which affects the amount of loan interest capitalised
Electricity tariffs
Discount rates
Changes in rainfall under climate change (Harrison et al., 2003)
Each parameter was changed, in turn, by ±20% from its original value and the change in NPV calculated (Harrison et al., 2003). Harrison et al. found that the Net Present Value (NPV) of the proposed Batoka Gorge hydropower scheme is most sensitive to changes in discount rate with increases reducing the present worth of future sales income. The next most sensitive variable was found to be the electricity tariff, followed by the civil engineering costs and length of the construction period (Harrison et al., 2003). This is shown in Figure 23. Decreases in the tariff price or increased construction cost and construction programme reduced the financial performance. However, the sensitivity to changes in precipitation as the result of climate change was found to be of a similar magnitude to both the discount rate and tariff (Harrison, 2003) as shown in Figure 23. Harrison et al. conclude that this adds credibility to the view that funding agencies should take into account the effects of “this uncontrollable risk factor” i.e. climate change (Harrison et al., 2003). Mukheibir confirms that “limited information exists on the impact of climate change on the viability of the hydropower schemes” (Mukheibir, 2007). Mukheibir used the results of two regional climate models to make a qualitative assessment of the impacts of the possible impacts of climate change in the Democratic Republic of the Congo and Mozambique. The results are shown in Figure 24. However, Mukheibir concludes that “specific studies are required to ascertain the magnitude of the impacts. The consideration of specific adaptation interventions at design and operation stages will need to be based on the projections from regional climate models” (Mukheibir, 2007).

44
Figure 23 Variation of the net present value of proposed Batoka Gorge hydropower project on the Zambezi with changes to key project parameter and climate change
(Source: Adapted from Harrison et al., 2003)
Figure 24 Potential impacts of climate change on hydropower in the Democratic Republic of the Congo and Mozambique
(Source: Adapted from Mukheibir, 2007)
Figure 25 shows the trap that many low income countries are stuck in when it comes to responding to what appears to be climate change induced drought that affects the hydropower power sector. To conclude making decisions on how to operate existing and design new hydropower schemes are becoming increasingly uncertain as a result of climate

45
change. There is a need to have global climate change projections downscaled to an appropriate scale and incorporate climate change uncertainty in the design of new hydropower schemes to make sure that they are resilient to future changes.
Figure 25 The vicious circle of the impacts of climate change reducing electricity production in countries reliant on hydropower
(Source: Adapted from HBS, 2010)
3.5 Availability of hydrological data
Knowledge of the hydrological regime of a region is a vital prerequisite for all work in hydrology including for hydropower schemes. Data availability can be considered from two separate points of view:
Technical: This is related to the actual capability of national hydrological services and other bodies to collect, archive and manage data and information which meet their needs, as well as those of other users;
Policy: this is related to the willingness of the data owners to make the data available to other users (Abrate, 1999)
While it is widely accepted that such data and information are required for several purposes, a decline has been identified in the systems responsible for the collection of water resources information during the last two decades (Abrate, 1999). This is illustrated by the decline in operational rainfall stations in the Zambezi River catchment upstream of Tete in Mozambique (an area of some 1 million km2) shown in Figure 26. Estimates of the hydrological yield of catchments can be greatly improved through coordinated collection of
46
hydrological and meteorological data and dissemination of those data to developers (Haney and Plummer, 2008).
Figure 26 Number of operational rainfall stations in the Zambezi River catchment upstream of Tete in Mozambique
(Source: Adapted from Kling et al., 2014)
3.6 Operation and maintenance
Operation and maintenance costs are relatively low for hydropower plants compared to other forms of power generation (IRENA, 2012). An average value for operation and maintenance costs of 2.0% to 2.5% is considered the norm for large-scale hydropower projects (IPCC, 2011; Branche, 2011). However, many low income countries struggle to meet standard maintenance schedules through lack of resources which then leads to loss of performance (see Ministry of Energy Sierra Leone, 2012; IRENA, 2012). Required operation and maintenance varies widely, according to the scheme’s location, capacity factor, generation strategy, whether the station is manned or unmanned, whether it is a storage or run of river scheme, the annual production, the number of starts and stops, as well as numerous other factors. A review of North American experience showed that a typical level of annual operations and maintenance spending on a 100 MW hydropower station would be US$2.1 million. This could be reduced to US$1.2 million in “best practice” cases (Goldberg and Lier, 2011). A separate study suggests that, based on North American evidence, operation and maintenance costs increase over time (WCD, 2000a). Underfunded and neglected operation and maintenance reduces power output and shortens the life of the plant (IPCC, 2011). In systems with adequate spare capacity “outages” of plant components can be planned, for their inspection and, if necessary, repair and replacement. However, it is more common for systems in low income countries to have little capacity to spare for this routine rehabilitation, in which case a plant is operated until it breaks down, forcing costly outages (IRENA, 2012). Another dimension is that equipment from OECD countries tends to be more expensive than equipment imported from China and India (IRENA, 2011). The quality, energy yield and the operation and maintenance costs of equipment may also vary significantly. Given some of the capacity and skills gaps in the operations and maintenance areas, there is an important
47
trade-off to be made (IRENA, 2011). More work is required to assess these trade-offs and establish their effect on enhancing the improvements of hydropower schemes.
3.7 Multi-purpose and single purpose schemes
Whether a hydropower scheme is designed to be multi- or single purpose will have an impact on its performance. Compared to single purpose schemes, multipurpose hydropower projects can have an enabling role by providing drinking water supply, irrigation, flood control and navigation services. Multipurpose schemes can enhance a country’s ability to adapt to climate change induced hydrological variability (World Bank, 2009). However, compared to single purpose schemes, multiple use hydropower schemes may increase the potential for conflicts and reduce energy production in times of low water levels (Kumar et al., 2011). Many large catchments are shared by several nations, hence regional and international cooperation is crucial to reach consensus on dam and river management. An independent review by the South Asia Water Initiative (SAWI) in 2012 confirmed that the complex long-term water resources challenges in South Asia can only be addressed through regional, trans-boundary action driven by a shared understanding of potential benefits (SAWI, 2013). Harmonious and economically optimal operation of multipurpose schemes may involve trade-offs between the various uses, including hydropower generation (Kumar et al., 2011).

48
SECTION 4 Enhancing the performance of hydropower
4.1 Introduction
There are numerous ways in which the performance of existing and greenfield hydropower schemes can be enhanced including:
Strengthening and improving the planning process
Rehabilitation of existing hydropower infrastructure
Enhancing the operation of existing hydropower infrastructure
Management of sediment
Use of recent innovations in hydropower technology
Improvements in stakeholder engagement
Utilisation of greenhouse gas emissions from hydropower reservoirs
4.2 Strengthening and improving the planning process at a catchment level
Planning for hydropower development has traditionally been oriented toward individual projects. However, this approach does not always allow hydropower to address multiple needs and requirements. Addressed early in the planning process, hydropower infrastructure offers multiple opportunities for local development such as investments in roads, social infrastructure, communications, and skill building in large projects can be leveraged to support local or regional economic development or to anchor growth poles across economic zones (World Bank, 2009). There is evidence that adopting a “holistic” approach to hydropower planning at the basin level can yield important benefits. A recent study of two river catchments in the states of Himachal Pradesh and Uttarakhand in northern India came to the following conclusion: “Planning for hydropower development needs to evolve from a project-based engineering approach to a more holistic one, an approach incorporating river basin planning and integrating potential social and environmental issues across multiple projects and the entire river basin. Such a framework would help to optimise the benefits and minimise the costs” (Haney and Plummer, 2008). These two catchments in India have ambitious plans for developing a number of hydropower sites, including some earmarked for private developers. However, many of these are likely to be new and untested for the challenges facing them (Haney and Plummer, 2008). A project-by-project approach will not take sufficient account of the system-wide aspects of multiple hydropower projects along the same river. The performance of the projects is likely to be enhanced by the use of catchment-wide modelling, coordinated operational protocols, and catchment and environmental protection. Likewise for the anticipation of risks from fluctuations in flow and cumulative flooding. Planning can be strengthened by supporting governments in understanding the strategic value of hydropower through integrated cross-sectoral planning, identification of strategic storage sites, improvement of hydrological data and analysis, and mainstreaming

49
hydropower into climate-change programmes. A significant increase in funds and technical assistance for prefeasibility studies is recommended to develop “pipelines of quality projects” (Haney and Plummer, 2008).
4.3 Rehabilitation of existing hydropower infrastructure
In 2011 Lier and Goldberg completed a study looking at the rehabilitation of existing hydropower infrastructure for the World Bank. Lier and Golberg looked at two investment scenarios with respect to the rehabilitation of hydropower schemes:
“Life extension” to the existing facilities to restore their initial performances. This usually includes the replacement of equipment on a “like for like” basis where there is minimum effort to enhance the overall output of the scheme
“Upgrade” of the scheme (e.g. efficiency, output) which yields greater output but at increased costs which is justified by the additional revenue over the service life of the equipment (Lier and Goldberg, 2011)
The impact of these two investment scenarios on energy production are shown in Figure 27.
Figure 27 Illustration of the impacts of an upgrade versus a life extension on energy production of a hydropower scheme
(Source: Adapted from Lier and Goldberg, 2011)
Lier and Goldberg developed a screening tool to assess the economic rehabilitation of hydropower schemes in Africa and Central America. In Africa, a total of 73 plants were indicated to have economic rehabilitation potential. Of these 25 are plants with a capacity of less than 50 MW but more than 10 MW, 35 plants between 51 and 250 MW and 13 plants of greater than 250 MW (Lier and Goldberg, 2011). Within the next decade, it has been estimated that about 16,500 MW of hydropower generation capacity will need to be rehabilitated in Africa (Lier and Goldberg, 2011). Lier and Goldberg state that “there is no real dichotomy between true greenfield hydropower projects and hydropower rehabilitation operations in terms of providing renewable energy to power systems. When major new sources of renewable energy are needed in areas where good dam or run-of-river sites are available, greenfield developments of various

50
configurations must be considered. Rehabilitation is first about retaining and preserving what is already functioning, and then about possible incremental increases in capacity at existing sites, hopefully at reasonable cost and with minimal delay” (Lier and Goldberg, 2011). Box 8 provides a summary of the effects of rehabilitation for a hydropower scheme in Nepal.
Box 8 The impacts of rehabilitation on power generation for the Trushuli-Devighat hydropower scheme in Nepal
In Nepal, modifications to the intake, provision of an extra de-sander, dredging the forebay and refurbishing the generators/turbines and power house control systems at the Trushuli-Devighat hydropower station in 1995 improved average annual power generation by 46% from 194 to 284 GWh a year. (World Commission on Dams, 2000)
4.4 Enhancing the operation of existing hydropower infrastructure
This section provides a brief overview of how the operation of existing hydropower plants can be improved.
4.4.1 The use of flow forecasting to increase electricity generation
The amount of electricity generated by a storage-based hydropower scheme can be increased at a given plant by optimising the way in which the reservoir is operated. Improved forecasts of flows combined with optimization models can also help to improve operation and water use, increasing the energy output from existing power plants significantly (Kumar et al., 2011) Flow forecasting has been widely used to manage reservoir storage levels effectively and avoid spills; however, it requires a good network of monitoring stations which is often lacking in low income countries. New methods related to large-scale climatic systems can help to forecast seasonal flows using global datasets. There are many examples in the literature of rainfall and flow/flood forecasting that are used to improve the performance of multi-purpose and hydropower reservoirs (see Westphal et al., 2003, Mao et al., 2000, Lima and Lall, 2010, Connelly et al., 1999, Boucher et al., 2012, French et al., 1992, Palmer and Anderson, 1994). Most commonly in relation to dams, flood forecasts are used to manage storage in the reservoir so that incoming floods do not cause the dam spillway to be used unless unavoidable. Flow forecasting can also be based on long-range weather forecasts and systems such as the El Nino Southern Oscillation (ENSO) and the Indian Ocean Dipole (IOD) with a view to managing water resources (UNESCO-IHE, 2011). Even knowing whether it is likely to be a particularly wet or dry season can help to enhance hydropower operation. Methods have been developed for forecasting flows one, three and six months ahead into the Cahora Bassa hydropower reservoir in Mozambique (Jensen, 2013; Kling et al., 2014). Sankarasubramanian et al. (2009) suggest the use of probabilistic climate forecasts based on large scale weather systems could improve the performance of hydropower schemes in the semi-arid region of north-east Brazil which has been subjected to regular droughts.
4.4.2 Mitigating social and environmental impacts
The social and environmental impacts of hydropower schemes can be ameliorated by changing the way in which the scheme has been traditionally operated (Konrad et al., 2012, Richter and Thomas, 2007, Watts et al., 2010). This is known as “re-operation”. The re-
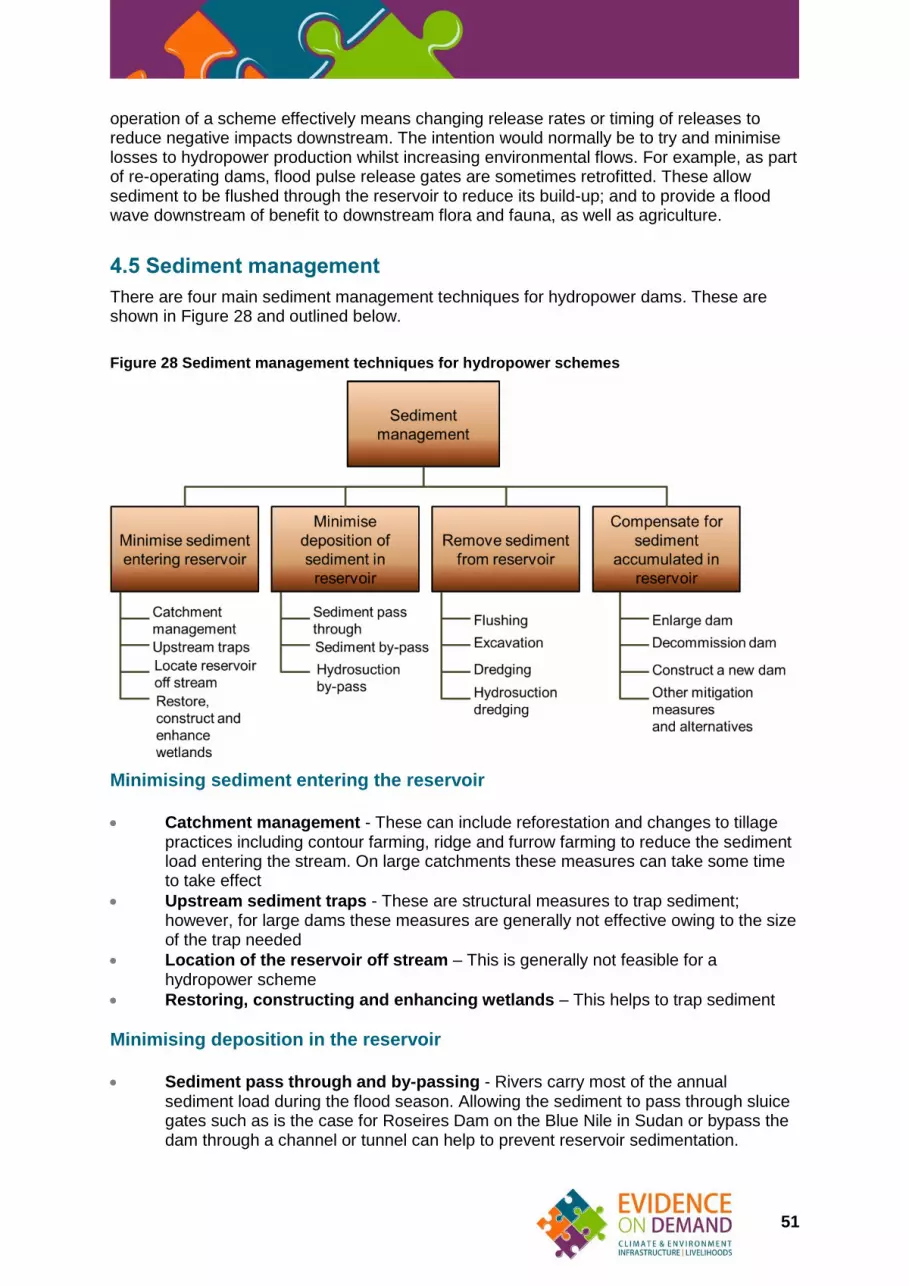
51
operation of a scheme effectively means changing release rates or timing of releases to reduce negative impacts downstream. The intention would normally be to try and minimise losses to hydropower production whilst increasing environmental flows. For example, as part of re-operating dams, flood pulse release gates are sometimes retrofitted. These allow sediment to be flushed through the reservoir to reduce its build-up; and to provide a flood wave downstream of benefit to downstream flora and fauna, as well as agriculture.
4.5 Sediment management
There are four main sediment management techniques for hydropower dams. These are shown in Figure 28 and outlined below.
Figure 28 Sediment management techniques for hydropower schemes
Minimising sediment entering the reservoir Catchment management - These can include reforestation and changes to tillage
practices including contour farming, ridge and furrow farming to reduce the sediment load entering the stream. On large catchments these measures can take some time to take effect
Upstream sediment traps - These are structural measures to trap sediment; however, for large dams these measures are generally not effective owing to the size of the trap needed
Location of the reservoir off stream – This is generally not feasible for a hydropower scheme
Restoring, constructing and enhancing wetlands – This helps to trap sediment
Minimising deposition in the reservoir Sediment pass through and by-passing - Rivers carry most of the annual
sediment load during the flood season. Allowing the sediment to pass through sluice gates such as is the case for Roseires Dam on the Blue Nile in Sudan or bypass the dam through a channel or tunnel can help to prevent reservoir sedimentation.

52
Hydrosuction by-pass - This allows the sediment to by-pass the reservoirs using the hydraulic head represented by the difference between the water levels upstream and downstream from the dam. This requires a permanent inlet station upstream of the reservoir to collect the sediment into a pipe. The sediment/water mixture is transported through the pipeline and past the dam, where it is returned to downstream receiving waters
Removing sediment from the reservoir Schneider and Zenz (2013) describe sediment flushing and dredging as the most common methods of regaining storage lost to sediment in reservoirs worldwide. These are detailed below:
Flushing - This is the operation whereby previously accumulated sediment is removed via accelerated flows that can be achieved by drawing down the reservoir. However, this can have negative ecological impacts downstream (Schneider and Zenz, 2013)
Dredging and excavation - There are various forms of dredging that can be carried out. However, for large hydropower schemes, such as Tarbela Dam in Pakistan, these are often found not to be economically feasible (Rashid et al., 2014)
Compensate for sediment accumulated in the reservoir This can include:
Raising the dam
Abandoning the dam and constructing a new one
Reconstruction of the dam wall to include low-level sluices
Changes to the operation of the dam Box 9 details an example where payment levels for ecosystem services to reduce sedimentation for a hydropower scheme in Cambodia have been evaluated.

53
Box 9 Use of payment for ecosystems services to reduce sedimentation in hydropower dams
The conservation of forest cover can reduce soil erosion and contribute to extending the economic life span of a hydropower facility. The cost of forest conservation can be viewed as an investment in hydropower and be financed via a payment for ecosystem services scheme. Arias et al. applied a modelling framework to estimate payments for forest conservation consisting of:
Land-use change projection
Catchment erosion modelling
Reservoir sedimentation estimation
Power generation loss calculation
Payment for ecosystems services scheme design The framework was applied to a proposed hydropower dam, Pursat 1, in Cambodia. The estimated net present value of forest conservation was US$4.7 million when using average annual climate values over 100 years, or US$6.4 million when considering droughts every eight years. This can be remunerated with annual payments of US$4.26/ha or US$5.78/ha respectively, covering forest protection costs estimated at US$ 0.9/ha/year. The application of this type of payment for ecosystem services represents one to minimise sedimentation of hydropower schemes in catchments susceptible to erosion. (Arias et al., 2011)
4.6 Recent innovations in hydropower technology
4.6.1 Introduction
The potential exists to increase the energy generated by existing hydropower schemes by retrofitting them with new equipment with improved efficiency and an increased capacity. Most of the existing hydropower equipment in operation today will need to be modernised during the next 30 years meaning that there is an opportunity to improve efficiency and achieve higher power and energy output (UNWWAP, 2006) whilst at the same time enhancing their performance with respect to the environment (Kumar et al., 2011). The structural elements of a large hydropower project, tend to form up to 70% of the initial investment costs and often have a projected life of up to 100 years or more (UNWWAP, 2006; Kumar et al., 2011). However, the refurbishment or replacement of key equipment such as turbines can be an attractive option after 30 years of operation (Kumar et al., 2011). A brief description of innovations in hydropower technology that can improve new and existing schemes’ performances are detailed below.
4.6.2 Variable-speed turbines
Usually, hydropower turbines are optimised for a fixed operating point defined by speed, head and discharge. At fixed-speed operation, any head or discharge deviation involves some decrease in efficiency (Kumar et al., 2011). The application of variable-speed generation in hydropower plants offers a number of advantages, based on the greater flexibility of the turbine operation in situations where the flow or the head are substantially different from their nominal values (Kumar et al., 2011). In addition to improved efficiency, the abrasion from silt in the water can also be reduced. Substantial increases in production in comparison to a fixed-speed plant have been found in simulation studies (Terens and Schafer, 1993; Fraile et al., 2006).
54
4.6.3 Fish-friendly turbines
Fish-friendly turbines are an emerging technology that provides a safe approach for fish passing though low-head hydraulic turbines by minimizing the risk of injury or death (Cada, 2001). While conventional hydropower turbine technologies focus solely on generating electricity, a fish-friendly turbine brings about benefits for both power generation and protection of fish species. Alden Research Laboratory in the USA has already carried out physical model tests for turbines using live fish. The fish mortality rate for these types of turbine is very low. The slower rotating turbine has just three blades, improving fish survival without a loss of generation (Hydroworld, 2010).
4.6.4 Improvements in materials
Corrosion, cavitation damages and abrasion are major wearing effects on hydropower equipment. Improvements in material can help to extend lifespan, examples include:
Penstocks made of fibreglass
Better corrosion protection systems for hydro-mechanical equipment
Better understanding of electrochemical corrosion leading to a suitable material combination
Trash rack systems with plastic slide rails (Kumar et al., 2011)
Erosive wear of hydropower turbines is a complex phenomenon, depending on different parameters such as particle size, density and hardness, concentration, velocity of water and base material properties. The efficiency of the turbine decreases with the increase in the erosive wear (Kumar et al., 2011). Various recently developed coating are currently available that can improve a turbine’s life (see Cateni and Magri, 2008).
4.6.5 Tunnelling technology
Recently, new equipment to drill small tunnels (i.e. 0.7 m to 1.3 m in diameter) based on oil-drilling technology has been developed and tested (Kumar et al., 2011). This means that in the future directional drilling6 of ‘penstocks’ for small hydropower directly from the power station up to intakes, up to 1 km or more from the power station could be constructed (Jensen, 2009). This could help to lower costs and reduce the environmental and visual impacts from above-ground penstocks for small hydropower, and open up more sites for small hydropower (Kumar et al., 2011).
4.6.6 Use of small scale hydropower
Comprehensive and accurate information regarding global small hydropower potential and development has not been available to date (Liu et al, 2013). A UNIDO report in 2013 entitled “World small hydropower development report7” concluded that “small hydropower is a suitable renewable energy technology in the context of rural electrification efforts, energy diversification, industrial development and exploration of existing infrastructure. Rural electrification has significantly improved in China and in India thanks to small hydropower. At the national-level, small hydropower programmes in developing regions and at regional level in western Africa, have reflected the importance given by some governments to small
6 Directional drilling is defined as the practice of controlling the direction and deviation of a
wellbore to a predetermined underground target or location. 7 Within the World Small Hydropower Development Report 2013 small hydropower is defined
as plants with a capacity of up to 10 MW.

55
hydropower as an energy solution for rural electrification and productive use” (Lui et al., 2013). However, more work needs to be done to assess the costs and environmental impacts of small hydropower schemes on poor communities in low income countries.
4.7 Utilisation of greenhouse gas emissions from hydropower reservoirs
As detailed in Section 2.6 over the past decade many researchers have shown that reservoirs located in the tropics may release appreciable quantities of greenhouse gases in the form of methane to the atmosphere. Ramos et al. have recently explored the use of low cost, innovative mitigation and recovery strategies not only to reduce these emissions but also allow the methane released to be used as a renewable energy source (Ramos et al., 2009). Ramos et al have shown that although more research is needed such techniques appear to be both technically and economically feasible (Ramos et al., 2009). The technology involves piping gas-rich water up from the depths of the reservoir and allowing the gas to be released in a controlled manner, capturing it for energy generation. Lima et al. (2008) carried out research showing that globally 93 to 107 million tonnes of methane could be available in this way for use as a renewable energy source. From a political perspective it would also allow large hydropower schemes located in tropical regions to fulfil the Kyoto Protocol Clean Development Mechanism.
4.8 Improved stakeholder engagement and local benefit sharing
Stakeholder involvement is now widely accepted as a pre-requisite for successful water resources planning and development (Reed and Kasprzyk, 2009) although its effective implementation is by no means a simple task (Swallow et al., 2006, Carr et al., 2012, Hauck and Youkhana, 2010, Taddei, 2011). According to Dore and Lebel (2010) risk assessment should be a political process, rather than a purely technical one as the technical simplifications and engineering assumptions which are often necessary provide lee-way for vested interests and bias. Stakeholder engagement has been shown to usually occur in the middle stages of hydropower projects, rather than throughout (Petkova et al., 2002). Such projects cannot be ‘stakeholder led’, and it is unlikely that they involve comprehensive options assessment. For the local communities to reap the benefits of hydropower schemes it is important that there is local benefit sharing. Local benefit sharing in hydropower projects can be defined as the systematic efforts by project proponents to sustainably benefit local communities affected by hydropower investments (Wang, 2012). Stakeholder engagement is essential in initiating and designing benefit sharing programmes. Monetary benefit sharing and non-monetary mechanisms are commonly used in benefit sharing in hydropower projects. Monetary benefit sharing means sharing part of the monetary flows generated by the operation of the hydropower projects with local communities (e.g. preferential electricity tariffs, community development fund, revenue sharing). Non-monetary local benefits can include improved infrastructure, support for health and education programmes, improved access to fisheries and forests, and legal title to land (Wang, 2012). A well-designed benefit sharing programme should have:
Clear objectives
Carefully define the target population
Include benefit sharing mechanisms
Identify responsible agencies, as well as implementation arrangements (Wang, 2012)

56
The World Bank has recently produced a guide for local benefit sharing on hydropower projects (see Wang, 2012). Improved stakeholder engagement and a well-designed local benefit sharing programme can help to maintain performance levels and revenue flows from hydropower assets in the long term, as well as ensuring local communities become long-term partners in sustainable management of hydropower assets (Wang, 2012).

57
SECTION 5 Hydropower and the water - energy - food
security nexus
5.1 Introduction
Water, energy and food supply systems are inter-connected and benefits from hydropower schemes normally trade-off against benefits for different sectors (e.g. domestic water supply, industrial water supply, irrigation, groups of people, different parts of the environment (e.g. aquatic and terrestrial). Interactions between the systems (e.g. built and natural) providing water, energy and food have recently come under increasing scrutiny owing to the recognition of their ability to impact on each other and especially in a world with increasing competition for resources. Increasing populations increase demands for water, energy and food. Water and wastewater treatment and distribution require large amounts of energy. Food and energy production require large amounts of water. Food production at an industrial scale requires large energy inputs and with the advent of biofuels, food and energy crops can compete for the same land, and water. Globally, additional factors include changing dietary patterns towards greater protein consumption in emerging economies such as Brazil, India and China, widespread environmental degradation, biodiversity loss and climate change. Meat production requires far more water per kilogramme than crops, for example (Lindström and Granit, 2013). It is difficult to assess the trade of involved especially from the perspective of how and where international funding agencies should invest to benefit the urban and rural poor. For example, in hydropower schemes that use large storage reservoirs the water that is passed through turbines has an “opportunity cost” depending on the season and timing, and in some cases could disrupt or prevent other users by farmers or cities. The trade-offs that have to be made are further complicated by the climate change and the uncertainties that it introduces. The central message of the DFID topic guide on “Adaptation: Decision making under uncertainty” (see Ranger, 2013) is that accounting for the changing and uncertain climate need not be complicated and should not paralyse action. This chapter reviews the relatively limited amount of work with respect to hydropower that has been carried out in relation to its place in the water – energy – food security nexus and methods via which co-benefits and trade-offs can be assessed. There are different approaches available to explore hydropower performance in the broader context of water – energy – food security. A large number of research studies make use of detailed quantitative hydrological, water resource, crop production and economic modelling at the catchment scale. However, the timescales of this study and the data available means that this study has been based on literature and previous modelling studies, where possible using these to illustrate the sensitivity of hydropower production to future climate change scenarios or the potential economic implications. The framework adopted for this study for assessing hydropower performance within the water – food – energy nexus is shown in Figure 29. Figure 30 shows an example of some of
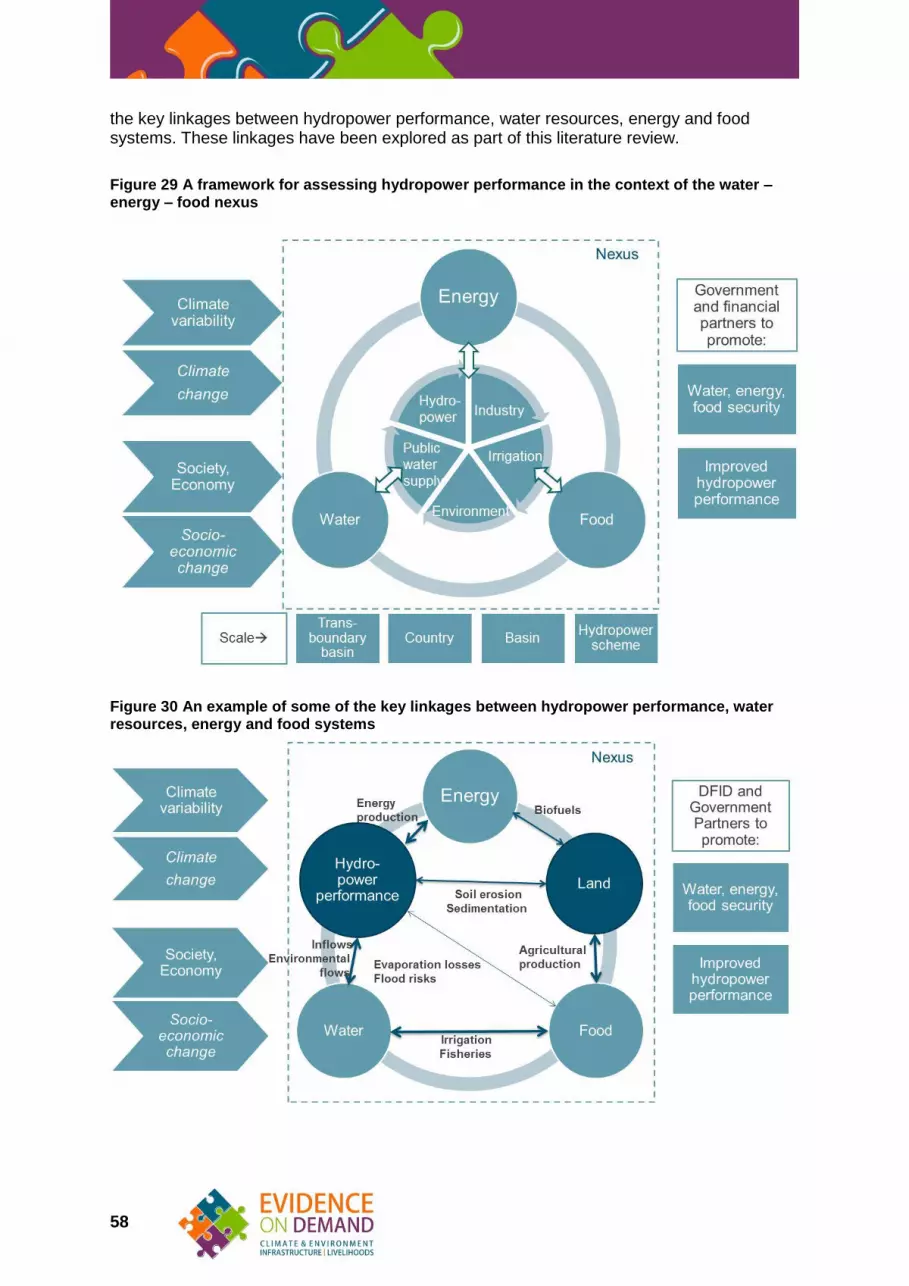
58
the key linkages between hydropower performance, water resources, energy and food systems. These linkages have been explored as part of this literature review.
Figure 29 A framework for assessing hydropower performance in the context of the water – energy – food nexus
Figure 30 An example of some of the key linkages between hydropower performance, water resources, energy and food systems

59
5.2 A comparison of hydropower with other power generation technologies
5.2.1 Introduction
Figure 31 shows a simple representation of present day electricity supply and demand options. There are three general ways to improve the delivery of electricity services:
Demand-side management options that are generally related to reducing demand
Supply-side efficiency measures, concerned with how efficiently electricity is generated by the supplier and transmitted and distributed to users
New supply options that either replace existing generation options or supply incremental growth in demand beyond what can be achieved by options in the first two categories (WCD, 2000a)
Hydropower is just one of many ways in which the electricity demand can be met. In terms of electricity supply the following choices need to be made between:
Type of power generation (e.g. thermal, hydropower, wind)
Extending the existing main grid, setting up isolated networks or setting up home systems
Implementing demand management measures such as load shedding and supply-sided measures (i.e. increasing power generation)
It is currently challenging to compare hydropower with other methods of power generation just within the energy sector because of the limited information available on technical issues such as:
kWh of power generated per US$ of investment
Greenhouse gas emissions over the cycle of the scheme
Water use per kWh of power generated
Capital, as well operation and maintenance costs
Number of beneficiaries
Social and environmental impacts The above should be relatively “simple” to measure; however, this is often not the case and there is often a lack of consensus on the figures for the above subjects. This is without the further complication that in many countries the regulatory environment has changed several times in the past 30 years This often makes private investors cautious, especially where the initial fiscal and licensing regime turns out to have been too generous to the licensees and results in changes in policies and regulations that disadvantage the original investors. Development of the hydropower sector according to the generation plan of the Southern African Power Pool (NEXANT 2007), for example, will require an investment of US$10.7 billion over an estimated 15 year period. However, researchers such as Hankins argues that a comparable investment in energy efficiency and renewable technologies including biomass, solar, wind, and small-scale hydropower, would aggressively expand decentralised (on- and off-grid), clean energy access and markets in Africa (Hankins, 2009).

60
Figure 31 Schematic diagram of electricity supply and demand options
(Source: Adapted from WCD, 2000a)
This section focuses on the following “technical” variables and the challenges of comparing hydropower schemes with other electricity generation methods:
Levelised costs of power generation
Water use
Greenhouse gas
5.2.2 Levelised costs of power generation
Figure 32 shows the global levelised costs of power generation for the first quarter of 2013. The general levelised cost of power generation is the average cost of power from a new generating plant over its entire lifetime of service (Eschenbach, 2014). The use of levelised costs allows a comparison of various sources of power production to be compared on an equal footing an even basis (Eschenbach, 2014). The World Bank states that capital costs for hydropower are high compared with alternative energy options, and the financial risk of over-design is significant (World Bank 2010). However, Figure 32 indicates that the global levelised costs of hydropower generation compare well with other forms of energy, apart from new gas and coal fired power stations.
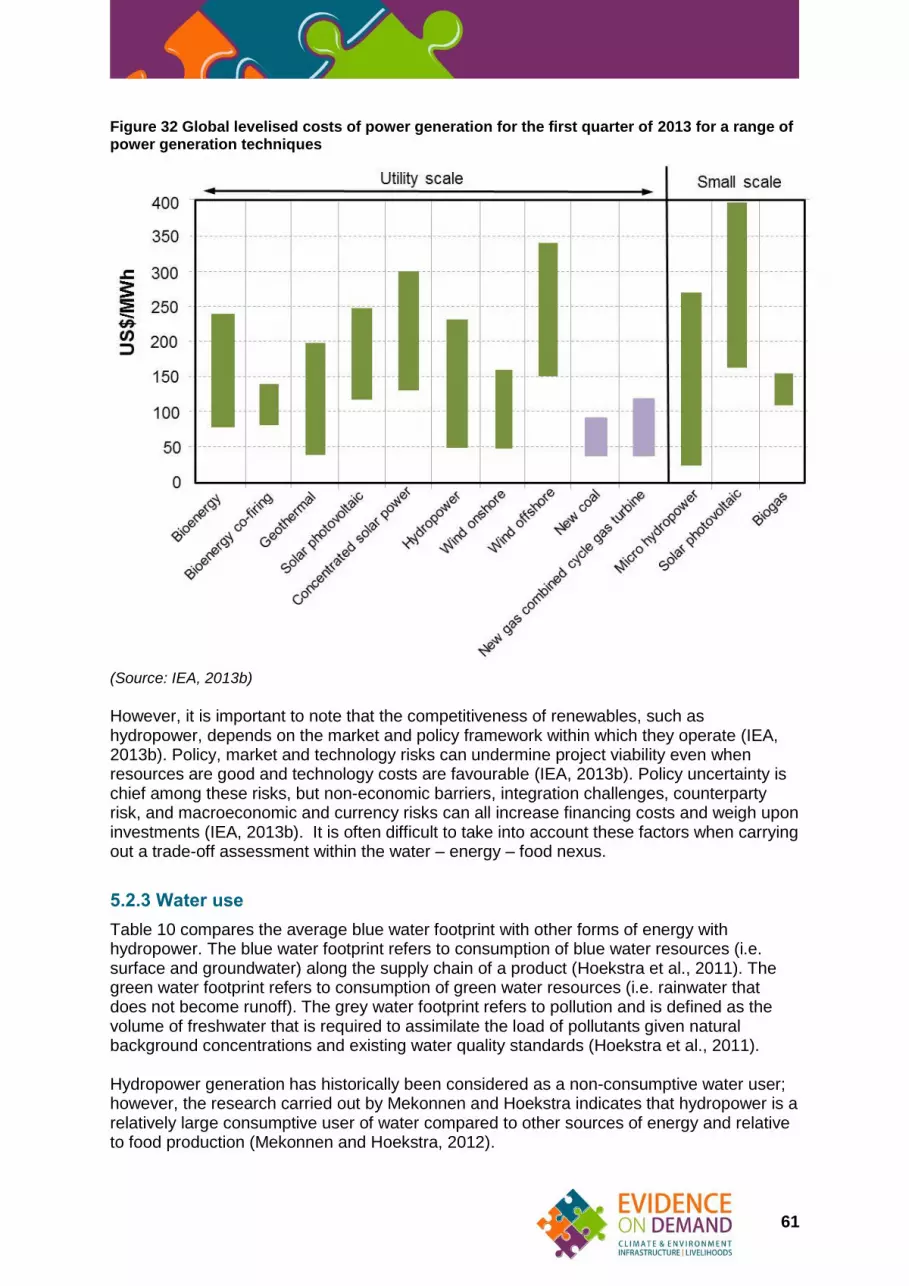
61
Figure 32 Global levelised costs of power generation for the first quarter of 2013 for a range of power generation techniques
(Source: IEA, 2013b)
However, it is important to note that the competitiveness of renewables, such as hydropower, depends on the market and policy framework within which they operate (IEA, 2013b). Policy, market and technology risks can undermine project viability even when resources are good and technology costs are favourable (IEA, 2013b). Policy uncertainty is chief among these risks, but non-economic barriers, integration challenges, counterparty risk, and macroeconomic and currency risks can all increase financing costs and weigh upon investments (IEA, 2013b). It is often difficult to take into account these factors when carrying out a trade-off assessment within the water – energy – food nexus.
5.2.3 Water use
Table 10 compares the average blue water footprint with other forms of energy with hydropower. The blue water footprint refers to consumption of blue water resources (i.e. surface and groundwater) along the supply chain of a product (Hoekstra et al., 2011). The green water footprint refers to consumption of green water resources (i.e. rainwater that does not become runoff). The grey water footprint refers to pollution and is defined as the volume of freshwater that is required to assimilate the load of pollutants given natural background concentrations and existing water quality standards (Hoekstra et al., 2011). Hydropower generation has historically been considered as a non-consumptive water user; however, the research carried out by Mekonnen and Hoekstra indicates that hydropower is a relatively large consumptive user of water compared to other sources of energy and relative to food production (Mekonnen and Hoekstra, 2012).

62
Solar Wind Bio-electricity Hydropower Gas Coal Nuclear
Blue water footprint (m
3/MWh)
~0 ~0 0 to 150 245 ~4 ~4 ~4
Note: The water footprint of the hydropower schemes studied by Mekonnen and Hoekstra varied from 1 m
3/MWh for San Carlos in Colombia to approximately 3,000 m
3/MWh for Akosombo-
Kpong in Ghana. The value for hydropower of 245 m
3/MWh represents an average for 35 studied sites
worldwide. The blue water footprint of bio-electricity is dependent on the crop. (Source: Adapted from Gerbens-Leenes et al., 2008; Mekonnen and Hoekstra, 2012; Raadal et al., 2011; Rodriguez et al., 2013)
Table 10 Blue water footprint for the production of electricity from various sources of energy
The blue water footprint of hydropower schemes will vary significantly depending on a variety of factors (e.g. reservoir volume to surface area ratio, climate). The blue water footprint of hydropower schemes rarely appears to be assessed at the planning stage of schemes. An estimation of this blue footprint would allow straightforward comparisons to be made with the green-blue green footprint of irrigated agricultural water and the blue water footprint of industries. A conceptual model for estimating the green and blue water footprints of different users of water in relation to the water balance of a river catchment is shown in Figure 33.
Figure 33 The green and blue water footprint in relation to the water balance of a catchment area
(Source: Hoekstra et al., 2011)
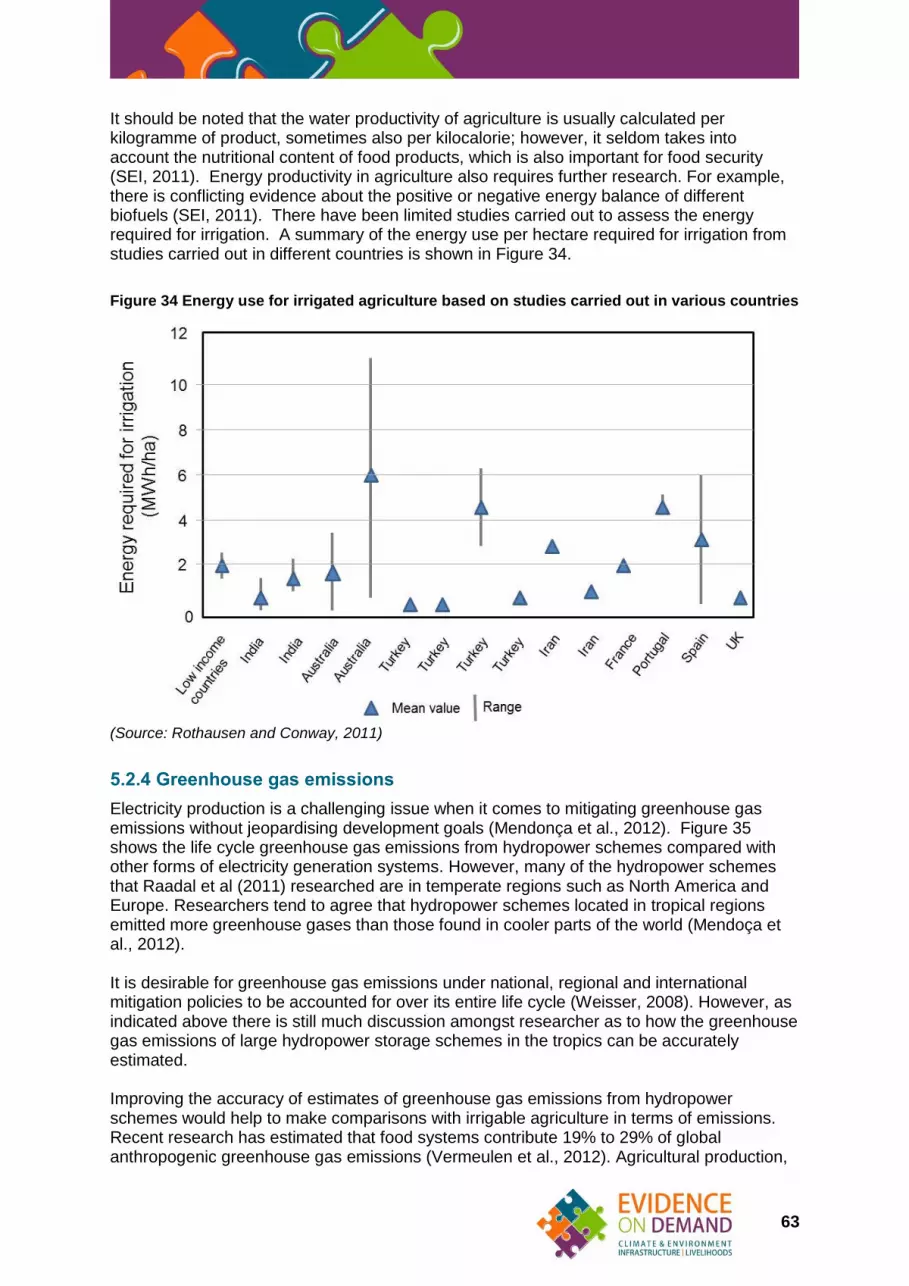
63
It should be noted that the water productivity of agriculture is usually calculated per kilogramme of product, sometimes also per kilocalorie; however, it seldom takes into account the nutritional content of food products, which is also important for food security (SEI, 2011). Energy productivity in agriculture also requires further research. For example, there is conflicting evidence about the positive or negative energy balance of different biofuels (SEI, 2011). There have been limited studies carried out to assess the energy required for irrigation. A summary of the energy use per hectare required for irrigation from studies carried out in different countries is shown in Figure 34.
Figure 34 Energy use for irrigated agriculture based on studies carried out in various countries
(Source: Rothausen and Conway, 2011)
5.2.4 Greenhouse gas emissions
Electricity production is a challenging issue when it comes to mitigating greenhouse gas emissions without jeopardising development goals (Mendonça et al., 2012). Figure 35 shows the life cycle greenhouse gas emissions from hydropower schemes compared with other forms of electricity generation systems. However, many of the hydropower schemes that Raadal et al (2011) researched are in temperate regions such as North America and Europe. Researchers tend to agree that hydropower schemes located in tropical regions emitted more greenhouse gases than those found in cooler parts of the world (Mendoça et al., 2012). It is desirable for greenhouse gas emissions under national, regional and international mitigation policies to be accounted for over its entire life cycle (Weisser, 2008). However, as indicated above there is still much discussion amongst researcher as to how the greenhouse gas emissions of large hydropower storage schemes in the tropics can be accurately estimated. Improving the accuracy of estimates of greenhouse gas emissions from hydropower schemes would help to make comparisons with irrigable agriculture in terms of emissions. Recent research has estimated that food systems contribute 19% to 29% of global anthropogenic greenhouse gas emissions (Vermeulen et al., 2012). Agricultural production,

64
including indirect emissions associated with land-cover change, has been estimated to contribute 80% to 86% of total food system emissions, with significant regional variation (Vermeulen et al., 2012).
5.2.5 The challenges of comparing different power generation technologies
The above sections show that even just within the energy sector international funding agencies and investors face a number of challenges when comparing the performance indicators of different power generation technologies. There is often disagreement between different organisations with respect to the water footprint, greenhouse gas emissions and costs per unit of power of different power generation technologies. Assessing the position of hydropower within the energy sector is challenging, hence assessing the position of hydropower within the water – energy – food nexus adds two more dimensions of complexity. Methods by which hydropower can be assessed within these additional dimensions are briefly discussed below.
Figure 35 Life cycle greenhouse gas emissions from hydropower schemes compared with other forms of electricity generation systems
(Source: Raadal et al., 2011)
5.3 Trade off analysis techniques used to assess the position of hydropower in the water – energy – food nexus
5.3.1 Introduction
The water – food – energy security nexus can be assessed using methodologies in a continuum, running from qualitative approaches at the start of the continuum, to more data driven and quantitative modelling. A range of factors can determine which approach is chosen, including:
The goal of the analysis
The level of capacity and trust between competing stakeholders at different scales
Sectoral integration

65
Access to data
Capacity for analysis (Jägerskog et al., 2013)
If common issues and barriers to cooperation are jointly identified, this can help to build collaboration and trust between multiple countries in a macro-region or between sectors (Jägerskog et al., 2013).
5.3.2 Background to some trade off techniques
There are some tools under development which aim to identify win-win opportunities where all parties can gain from explicitly sharing the available resources. In the case of transboundary catchments water resources are rarely sustainably, efficiently or equitably utilised, even though water is critical to economic growth and particularly in developing countries (Phillips et al., 2008). Phillips et al. (2008) have produced a methodology for analysing the opportunities for increasing benefits in transboundary water resources management, noting it would also be applicable in non-transboundary contexts. The focus is on developing ‘win-win solutions’, where each party benefits more by cooperating than by acting in isolation. The conceptual framework of the Transboundary Waters Opportunity (TWO) analysis consists of a matrix of four key development opportunities and two main categories of water source for realising the opportunities (Phillips et al., 2008). This is shown in Table 11. The framework facilitates context-specific analysis and can be adapted where necessary by adding opportunities and water sources. Example opportunities are wastewater re-use and optimal siting of multipurpose dams. The methodology is intended to be applied in a range of contexts, including:
Formal negotiations or training in relation to identifying ‘win-win’ development opportunities
Identifying promising opportunities for detailed investigation through either political negotiation or strategic analysis of options and trade-offs
As a scenario tool to illustrate future options
Identifying investment opportunities for public and private financiers (Phillips et al., 2008)
Phillips et al. postulate the following wide range of uses for the TWO analysis framework:
Strategic-level planning taking into account various riparian perspectives
Supporting decision-making by the donor community on increasing benefits from water use
Determining major infrastructural requirements based on the preferred allocation of resources
Providing chronological investment sequence information to all sources of finance (Phillips et al., 2008)
Such a framework could be used to analyse the use of hydropower within the water – energy – food nexus.

66
Factors:
Development Categories: Sources
New water More efficient use of water
Other sources in basins that are not closed
Hydropower and power trading
New water can be created by the siting of dams where evaporative losses are minimised. The interplay to Green and Blue Water dynamics should be addressed.
The siting of dams in transboundary basins influences the geographical pattern of water availability. This has a profound impact on the net benefits arising from a transboundary watercourse.
Power trade provides the opportunity to optimise complex power-supply alternatives allowing for a mix of sources of fuel, including hydropower, fossil fuels, nuclear, and renewable energy such as sun and wind. It reduces costs and provides for transparency in all transactions for the consumers.
Primary production
Desalinated sources of water are generally not suitable for agricultural use, due to cost and quality-related constraints. However, there is great scope for the re-use of treated wastewaters in many developing countries. Inter-basin transfers are also likely to become much more common in the future
The key method of relevance to increasing the efficiency of water use for primary production involves closer attention to the Green Water-Blue Water interface. The output of the agricultural sector can be greatly enhanced in many transboundary basins, if this is taken into account.
Many opportunities exist for increasing the production of biomass by optimising land and water use. This provides opportunities to produce bioenergy to meet the growing demand for energy at the global level and scaling up e.g. aquaculture to meet growing food demands.
Urban growth and industrial development
The much higher economic returns from water in the industrial and services sectors (compared to the agricultural sector) provide a route to enhanced economic growth for many developing countries. However, societal effects must be addressed.
Where inter-sectoral allocations occur and move water from agriculture to the sectors with higher economic returns, it is most important that the resource is used efficiently, maximising the economic returns per unit volume.
To ensure reliable supplies of water for growing urban and industrial needs, water should be managed and stored so that losses are minimised. Water can be stored underground through recharge of aquifers for both water supply and to protect coastal aquifers from salt water intrusion.
Environment and ecosystem services
Enhanced attention to the upstream Green Water-Blue Water interface can improve or guarantee aquatic ecosystem services in downstream stretches of shared watercourses. Benefits from this can be transferred upstream, as in the ‘Green Credit’ proposals.
All forms of more efficient water use will alter river flow dynamics, and this offers potential for optimising returns from ecosystem services. Fisheries and tourism are especially important generators of income in such scenarios.
In basins that are not closed ecosystems such as wetlands that have been degraded can be restored by allocating water to restore their capacity to generate ecosystem services. This provides benefits such as water purification and increased biodiversity.
Others (every basin is unique and other opportunities
Many urban areas are found along coastlines. Desalination of seawater provides, where economically feasible, a
Recurrent droughts are a major obstacle for farmers relying on rain fed agriculture to receive a return on their
Floods destroy physical infrastructure and social and economic systems in many basins globally. Flood protection and early warning

67
Factors: Development
Categories: Sources
New water More efficient use of water
Other sources in basins that are not closed
may exist) new water source for high value use. The use of desalinated water may reduce the pressure to abstract water for e.g. urban areas in water stressed basins.
investment. By improving the natural storage capacity through improved Green/Blue Water management and groundwater storage a basin system can be less vulnerable to the impacts of drought.
systems may be important strategies to increase the resilience of basins providing downstream benefits. Storage infrastructure or restoring watersheds are tools to consider.
(Source: Phillips et al., 2008)
Table 11 The conceptual framework for the TWO analysis
In recent years a number of modelling techniques have been developed to carry our multi-objective trade-off analysis. Examples of some of the variables, which are generally benefits, that can be traded off in such models are shown in Table 12. Such models allow both quantitative and qualitative benefits to be traded off against one another. Trade-off variable Objective
Hydropower revenue in US$
Hydropower revenue is maximised dependent on hydraulic head levels in the associated reservoir or pondage, flow rate through the turbines and timing of releases as bulk energy prices vary though the year.
Irrigated agriculture revenue in US$
Agricultural revenue is maximised dependent on minimising crop water deficits during growing seasons. This is dependent on the crop type.
Deficit in municipal water supply in m
3 of
water
The deficit in the volume of water supplied to the urban areas was minimised.
Firm energy from hydropower in GWh
A firm energy objective is to maximise the electrical output in GWh at 90% reliability.
Difference between the regulated and natural flow duration curve in % difference
Deviation from the natural flow duration curve. This variable is used as a proxy for ecosystem services. The objective is to minimise this variable.
Difference in the natural and regulated hydrograph flood flows in m
3/s
Deviation from the natural flood hydrograph. This variable is used as a proxy for ecosystem services. The objective is to minimise this variable.
(Source: Adapted from Hurford and Harou, 2014)
Table 12 Examples of variables used to assess the trade-offs between hydropower, irrigated agriculture, municipal water supply and the environment
Hurford and Harou (2014) applied this approach to assess changes in operation of hydropower dams in the Tana River in Kenya on the basis of optimal trade-offs between energy generation, food production and environmental protection (Hurford and Harou, 2014). The ability to quantify trade-offs between monetary and non-monetary benefits and involve stakeholders in developing measures of system performance which represent their interests makes this a useful tool for stakeholder engagement in both the planning and operating phases of hydropower development. The best available trade-offs are displayed graphically, offering decision makers and other stakeholders the opportunity to intuitively understand the implications of different management decisions. This can help make balanced and equitable

68
decisions on water management for multiple purposes and has important implications for current concerns about managing systems to promote water, energy and food security. The proposed approach is being applied in Kenya’s Tana Basin and Ghana’s Volta Basin through a project led by IUCN (IUCN, 2014). These types of approach represent an advanced form of cost benefit analysis in which costs can be monetary, non-monetary or expressed as sacrifice of other benefits. Benefits likewise can be monetary or non-monetary, potentially addressing long running challenges with valuation of non-market ecosystem services (Brown et al., 2009; Sagoff, 2011; Steele, 2009; Paton and Bryant, 2012; Abson and Termansen, 2011; Sagoff, 2008; Räsänen et al., 2013).

69
SECTION 6 Criteria used for the selection of the case
studies
One of the objectives of the harnessing hydropower study was to carry out three case studies: one from Africa and two from Asia. Carrying out case studies helped contribute directly to the understanding of sector specific issues in the selected countries and also to identify cross-cutting issues and trends to be aware of when discussing possible developments in other countries. Having undertaken a high level review of the information and data available on which to base selection criteria, the following were developed as the high level and pragmatic selection criteria:
Usefulness in providing insight into a range of issues affecting hydropower performance
Practicality of carrying out case study country visits and engagement with a range of stakeholders
Sensitivity of the issues surrounding hydropower which might affect access to data access and willingness of people to discuss the issues
Data issues around openness or availability which might affect ability to undertake quantitative analysis
A more extensive list of indicators was also used to support these selection criteria, some examples of which were:
Installed hydropower capacity
Proportion of national electricity generated by hydropower
Proportion of population with access to grid electricity
‘Feasible’ hydropower capacity
Hydrological issues
Baseline and 2050 climate change water stress On this basis, Nepal, India and Malawi were selected as case study countries. This selection provides an insight into a broad range of issues around hydropower performance owing to the diversity of contexts and conditions represented. Table 13 details the key features of these countries. The selected countries have a diverse range of political contexts. They are all democracies, but at various stages of development, with India being the most well-established. This affects the power structures for decision making in relation to large infrastructure such as hydropower dams. Both India and Nepal rely heavily on the Himalayan mountains for water resources; however, they do have contrasting political systems, states of development and energy sectors. The choice of these countries also allowed some of the transboundary issues in the region to be explored. Currently Nepal and Malawi have almost entirely run of river hydropower schemes; however, plans are in place for storage schemes which present new and different challenges and opportunities. India has a legacy of storage schemes, but has moved towards constructing run of river schemes to limit environmental and social impacts. Nepal and India and grappling with the issue of sharing their transboundary water resources.

70
Case study countries
Nepal India Malawi
Political systems (1900 to present)
Democratic federal republic since 2008, previously constitutional monarchy
Democracy since 1951, previously British colonial rule until independence in 1947
Democracy since 1994, formerly single party republic after British colonial rule
Climate Altitude dependent: Tropical (low altitude) to arctic (high altitude)
Diverse: alpine; humid, tropical; arid and semi-arid
Tropical (mostly), Temperate (northern highlands)
Topography related to current hydropower potential
Middle Hills (800 m to 4,000 m)
Himalayan mountains Shire Highlands downstream of Lake Malawi
Types of hydropower
Almost entirely run of river Storage (older schemes) and run of river
Run of river
Water sources utilised for hydropower
Glaciers, seasonal snowfall and rainfall
Glaciers, seasonal snowfall and rainfall
Rainfall, Lake Malawi
Downstream countries
India, Bangladesh Bangladesh, Pakistan Zambia
Importance of transboundary issues
High High Low
Issues addressed in the case study
Background to Nepal’s power sector Impacts of climate change on hydropower generation Grid and off grid hydropower performance Role of privately owned hydropower projects Use of micro-hydropower
Focused on Himachal Pradesh state in northern India owing to it having a high proportion of India’s total hydropower potential Challenges of large- and small-scale hydropower development Impacts of climate change on hydropower generation Influence of India hydropower policy on the Himachal Pradesh state
Focused on Shire River schemes Operational issues specific to Malawi that affect hydropower performance such as weed growth Impacts of climate change on hydropower generation
Table 13 Background to the hydropower schemes operating in each of the selected case study country

71
SECTION 7 Conclusions and research gaps
7.1 Conclusions
The following can be concluded from the literature review. Hydropower will play an increasingly important part in supplying electricity in low income countries in Africa and Asia over the next 30 years Storage hydropower schemes can usually be operated flexibly providing a rapid response to changes in demand. In an integrated system, reservoir and pumped storage hydropower can be used to reduce the frequency of start-ups and shutdowns of thermal plants; to maintain a balance between supply and demand under changing patterns thereof. Existing hydropower schemes should be “re-operated”, improved and rehabilitated before investing in new infrastructure Generally, existing hydropower schemes should be rehabilitated, refurbished or upgraded before new facilities are constructed. Adding new or more efficient turbines generally has a much lower social and environmental impact than building new schemes. It is important to note that hydropower is a mature technology hence even very old hydropower equipment is only likely to be 5% to 15% less efficient than the most modern plant (Lier and Goldberg, 2011). Hence the largest increase in hydropower performance will be in cases where the equipment has deteriorated (e.g. to such a degree that there are significant efficiency gains simply by replacing it with traditional designs and solutions (see the case of the Trushuli-Devighat hydropower scheme in Nepal detailed in Box 8)). New hydropower schemes need to be assessed within the context of comprehensive catchment-wide planning New hydropower schemes should be considered in the context of the whole catchment taking into account how climate change will influence flows, and how future river flows must meet competing demands made for energy, the environment, and water supply for domestic, agriculture and industrial uses. Community- and ecosystem-based adaptation approaches that integrate the use of biodiversity and ecosystem services into an overall strategy aimed at empowering people to adapt to climate change must be central to any comprehensive planning efforts with respect to new hydropower dam developments (Beilfuss, 2012). There is a paucity of suitable hydrological data with which to plan new hydropower schemes in many low income counties Hydropower schemes based on limited and unreliable hydrological data have the potential to underperform and not to attain the benefits the infrastructure is designed to generate. Generally, in the past two decades hydro-meteorological networks in low income countries have deteriorated. Emphasis should be placed on investing in hydropower schemes that maximise flexibility and adaptive management Climate change accentuates the risks related to the development of new hydropower schemes because stationarity in future river flow series can no longer be assumed. This
72
means that a premium should be placed on hydropower schemes that maximise flexibility and operations that embrace adaptive management. Climate change scenarios should be incorporated into the planning and design of new hydropower schemes Iimi (2007), Rydgren (2007) and Pottinger (2009) all claim that climate change impacts are rarely explicitly considered when planning hydropower projects. There is strong evidence to suggest that the possible effects of climate change are not being taken into account when new hydropower schemes are being planned (see Iimi, 2007; Pottinger, 2009; and Beilfuss, 2012). Climatic uncertainty as the result of climate change should be incorporated into hydropower design, as a matter of course to help to avoid over- or under-designed infrastructure and financial risk, and to improve the resilience of this long-lived infrastructure. There is some limited work that suggests that planned investment for hydropower in Africa is in regions that are unlikely to experience the worst effects of climate change and hence are fairly low risk in terms of being non-performing or not meeting internal returns targets, but there are also other studies that contradict these findings. More work is required to assess the impacts of climate change uncertainty on proposed hydropower schemes in low income countries relative to other variables (e.g. capital costs, operation and maintenance costs, internal rates of return). Evaluations of proposed new hydropower schemes should include an assessment of their water footprint and greenhouse gas emissions It would appear that the water footprint and greenhouse gas emissions have in many cases in the past not been estimated at all when hydropower schemes have been evaluated by international funding agencies. There is a growing body of evidence to suggest that in “hot” countries that these are larger than previously anticipated. Hence there is a need to evaluate these when new hydropower schemes are planned and the performance of existing ones are assessed. Technological innovations can improve environmental performance and reduce operational costs of hydropower schemes Although hydropower technologies are mature, recent research into the following areas will help to improve the efficiency and lessen the impacts of future hydropower schemes: variable-speed turbines; fish-friendly turbines; new sediment management techniques; more efficient tunnelling methods; use of models to assess and optimise the trade-offs between energy, irrigation and water supply needs as part of integrated river basin management. Environmental and social issues will continue to play a significant part in the development of new hydropower opportunities The social and environmental impacts of hydropower schemes vary depending on the project’s type, size and local conditions. Experience gained over the past 80 years, together with recently developed sustainability guidelines and criteria, and innovative planning approaches based on stakeholder engagement and technical innovations should be used to help to improve the sustainability performance of future projects. This is not always the case. The benefits of large hydropower schemes often do not reach the poorest communities Although hydropower has been a tool for economic development worldwide, in many low income countries the electricity produced has failed to reach the rural poor for a variety of reasons including a lack of distribution infrastructure (see Collier, 2006; Hankins, 2009; Imhof and Lanza, 2010). The benefits of supplying a small amount of electricity are generally greatest for the people currently without access to electricity, usually including the rural poor (Collier, 2006).

73
Improvements are required in the understanding of the water – energy – food nexus and the place of hydropower within it There is no harmonised ‘nexus database’ or analytical framework that can be used for monitoring or trade-off analyses (SEI, 2011). Hence the effects of increasing energy or water scarcity on food and water or energy security, as well as potential synergies between land, water and energy management, are not well understood (SEI, 2011). One question that needs to be addressed is to what extent can the higher availability of one resource sustainably reduce scarcity of another, and how might this work at different spatial scales. Investments in new hydropower schemes should ensure that they increase climate resilience Investments in new hydropower schemes should aim to enhance climate resilience by helping poor and vulnerable communities prepare for, withstand, and recover from the negative effects of climate change. However, there have been some cases where large hydropower dams can decrease, rather than enhance, climate resilience, especially for the rural poor, by increasing evaporative water loss, prioritising power generation over water supply and changing the hydrological regime which supports food production. For example, in 1992 Gammelsrod estimated that the impact of modified seasonal flows caused by hydropower schemes on the Zambezi River in southern Africa on shrimp fisheries in the estuary was US$10 million dollars per year (Gammelsrod, 1992). Regional pools of sustainable power should be diversified to reduce the dependency on energy sources that can be affected by climate change Creating a diverse energy supply is critical for climate change adaptation in water stressed regions (Beilfuss, 2012). Frameworks such as the one developed by the Southern African Power Pool (SAPP) provides a means for diversifying power production and reducing dependency on energy sources that can be affected by climate change, which in some cases will include hydropower. In practice, however, SAPP has emphasised large-scale coal and hydropower development to feed the regional grid, without serious consideration of climate change impacts and risks (Cole et al., 2013; Beilfuss, 2012). SAPP could play a key leadership role in adapting the regional power grid to the realities of climate variability and water scarcity through promotion of decentralised energy technologies, energy efficiency standards, demand-side management, and feed-in tariffs to support renewable technologies (Beilfuss, 2012).
7.2 Research gaps
There are a number of research and knowledge gaps related to the performance of hydropower and its place within the water – food – energy security nexus. These are briefly detailed below. Trade-off assessments Although there have been a number of researchers carrying trade-off assessments that allow the position of hydropower to be assessed within the water – energy – food nexus there is still a need for more research and guidance in this area. For example, should international funding agencies invest US$80 billion in the proposed Grand Inga hydropower project on the River Congo in the Democratic Republic of the Congo (DRC) that will generate 40,000 MW (International Rivers, 2014) or would it be more sustainable and advantageous to use these funds to put in place small-scale, off-grid, power generation (e.g. wind, solar, small-scale hydropower) that are more likely to directly benefit the 94% of the DRC’s population that do not have access to electricity? Such questions remain difficult to answer and more research is required to allow funding agencies and other investors to make more transparent and robust decisions based on trade-off assessments.

74
Estimation of greenhouse gases from hydropower scheme reservoirs Hydropower is often cited as a green form of energy with “low” greenhouse gas emissions; however, recent research indicates that for hydropower schemes with large reservoirs located in tropical and semi-tropical regions, the greenhouse gas emissions in grammes equivalent of CO2/kWh may similar to other “dirty” energy sources such as coal fired power stations. There is disagreement amongst researchers concerning the quantities of greenhouse emitted by reservoirs. Although the Kyoto Clean Development Mechanism now recognises that for reservoirs with large surface areas per kWh of energy generated there are greenhouse gases emitted, further research is required in tropical and sub-tropical low income countries to enable a more accurate picture of emissions from hydropower schemes to be put in place. Minimisation and utilisation of greenhouse gases generated by hydropower scheme reservoirs to generate power Methane could be extracted from the water in reservoirs and burnt as a renewable source of energy. There is some limited research describing the potential for extracting methane from reservoirs to be used as a renewable energy source (Ramos et al., 2009), based on earlier work by Kling et al. (2005). However, further work is needed to investigate methods to minimise the emissions from hydropower schemes including understanding the processes via which these gases are generated. Consumptive use of different power generation techniques and water foot printing tools for power production techniques There are limited data on consumptive water use in the energy sector for different power generation techniques (e.g. hydropower, thermal, nuclear), compared to the data for the actual water withdrawn from the aquatic environment (e.g. surface or ground waters). Existing data on the consumptive use of different power generation techniques are often not consistently traced throughout the full lifecycle. In order to compare the water use of different power generation techniques a widely accepted water footprinting tool is required. Uniformly applicable water footprint frameworks do not yet exist that allow the comparison of water use efficiency for different forms of energy or food production (SEI, 2011). Such water footprint frameworks would have to consistently integrate water productivity with water scarcity and opportunity costs in any particular location (SEI, 2011). There is still a need to have transparent methods to assess the water footprints of hydropower schemes in relation to the amount of power that they generate. Impacts of hydropower on ecosystem services including their cumulative effects There is still insufficient knowledge on the impacts of hydropower schemes on ecosystem services including the relationships between river flows, the state of aquatic ecosystems and terrestrial flora and fauna. There is also a need to improve the assessment of environmental risks associated with cumulative impacts, resulting from development of cascades of storage dams for hydropower schemes. There are suggestions that there is a need for a publicly available clearinghouse to store existing data on environmental impacts and environmental mitigation measures for hydropower schemes covering areas such as: the passage of fish; environmental flow releases; and water quality. This would require clear criteria for inclusion of data and information (e.g. recent, peer-reviewed journal papers and credible web sites). These data could help to reduce the cost of mitigation decisions and support comprehensive reviews of environmental issues. This is a role that could possibly be fulfilled by the International Hydropower Association’s Hydropower Sustainability Assessment Protocol and web site.
75
For example, for hydropower schemes that utilise reservoirs formed by a dam there is a need to carry out more research in order to separate the environmental impacts of the dam from the impacts of hydropower operation itself. Role and impacts of small-scale hydropower schemes in low income countries It is widely reported that small scale hydropower is “environmentally friendly”. However, more work is needed to accurately assess the environmental impacts caused by small hydropower so that such schemes can be compared with other forms of electricity generation (e.g. large scale hydropower, thermal, wind, solar) on the scale of the impacts per kW of power generated (Abbasi, 2011). It is possible that the impacts of the widespread use of small scale hydropower may be no less numerous or less serious, per kW generated, than those from hydropower produced from large storage dams (Abbasi, 2011). No accurate statistics on the potential for small scale hydropower are available for Africa. Their rates of development are commonly thought to be lower than for large-scale hydropower (Klunne, 2013). Currently, grid connected small hydropower is mostly constructed and operated by either national utilities or Independent Power Projects (Klunne, 2013). To increase the deployment of small hydropower, as well as, isolated networks and off-grid electrification different implementation models will be required. This is an area that requires further research. Financing of small-scale hydropower schemes in low income countries Small hydropower projects (<10 MW) are often less profitable and thus more difficult to finance than larger schemes. Several of the cost components involved in developing hydropower do not change proportionally with the project’s size. However, small scale-hydropower can have a number of environmental and social advantage. There is a need to carry out more research into sustainable financing and business models that are required to facilitate the development of off-grid small hydropower in the low income countries. Private sector participation in the development and operation of new hydropower schemes There is need to carry out more research into how the private sector can effectively participate in hydropower scheme development and operation. Research is needed into how to devise an appropriate “enabling environment” (i.e. providing enough inducements without creating excessive rewards), how to compensate private partners for the provision of “public goods”, as well as methods to allocate the “correct” proportion of the risks to private sector partners.

76
References
Abbasi, T. (2011) ‘Small hydro and the environmental implications of its extensive utilization,’ Renewable and Sustainable Energy Reviews 15, p2134-2143. Abrate, T. (1999) ‘Water availability and data availability, WMO policy and activity’, in Enne, G., Peter, G. & Pottier, D. (2001) Desertification convention: Data and information requirements for interdisciplinary research. Proceedings of the international workshop held in Alghero, Italy, 9 to 11 October 1999. Luxembourg: Office for Official Publications of the European Communities. Abson, D. & Termansen, M. (2011) ‘Valuing ecosystem services in terms of ecological risks and returns’, Conservation Biology, 25, p250-258. Available at: http://onlinelibrary.wiley.com/doi/10.1111/j.1523-1739.2010.01623.x/abstract Agrawala, S., Raksakulthai, V., van Aalst, M., Larsen, P., Smith, J. & Reynolds, J. (2003) Development and climate change in Nepal: Focus on water resources and hydropower. Paris: Environment Directorate, Development Co-Operation Directorate of Nepal, Organisation for Economic Co-operation and Development. Available at: http://www.oecd.org/env/cc/19742202.pdf Alam, S. (2013) Sediment data collection over a long-term period: essential for better sediment management at hydro projects. Addis Ababa: The International Journal on Hydropower and Dams. Alavian, V., Qaddumi, H., Dickson, E., Diez, S., Danilenko, A., Hirji, R., Puz, G., Pizarro, C., Jacobsen, M. & Blankespoor, B. (2009) Water and climate change: Understanding the risks and making climate-smart investment decisions. Final report. Washington, D. C.: World Bank. Arias, M., Cochrane, T., Lawrence, K., Killeen, T. & Farrell, T. (2011) ‘Paying the forest for electricity: A modelling framework to market forest conservation as payment for ecosystem services benefiting hydropower generation,’ Environmental Conservation, Volume 38, Issue 4. Available at: http://dx.doi.org/10.1017/S0376892911000464 Arnell, N. (1996) Global warming, river flows and water resources. Chichester, UK: Wiley. Bacon, R., Besant-Jones, J. & Heirarian, J. (1996) Estimating construction costs and schedules: experience with power generation projects in developing countries. Technical Paper 325. Washington, D. C.: World Bank. Baanabe, J. (2008) Large scale hydropower, renewable energy adaptation and climate change and energy security in the East and Horn of Africa. HBF. Bartle, A. (2002) ‘Hydropower potential and development activities’, Energy Policy 30, p1231-1239. Barros, N., Cole, J., Tranvik, L., Prairie, Y., Bastviken, D., Huszar, V., del Giorgio, P. & Roland, F. (2011) Carbon emission from hydroelectric reservoirs linked to reservoir age and

77
latitude, Nature Geoscience 4, p593-596. Available at: http://www.nature.com/ngeo/journal/v4/n9/full/ngeo1211.html?WT.ec_id=NGEO-201109 Basson, G. (2005) Hydropower dams and fluvial morphological impacts – An African perspective. Stellenbosch. Available at: http://www.un.org/esa/sustdev/sdissues/energy/op/hydro_basson_paper.pdf Basson, G. (2002) Mathematical modelling of sediment transport and deposition in reservoirs: Guidelines and case studies. International Commission on Large Dams Sedimentation Committee. Beilfuss, R. (2012) A risky climate for southern African Hydro: Assessing hydrological risks and consequences for Zambezi River basin dams. International Rivers. Available at: http://www.internationalrivers.org/files/attached-files/zambezi_climate_report_final.pdf Benson, C. & Clay, E. (1998) The impact of drought on sub-Saharan African Economies: A preliminary examination, Volumes 23-401. Washington D. C.: World Bank. Blackshear, T., Crocker, T., Drucker, E., Filoon, J., Knelman, J. & Skiles, M. (2011) Hydropower vulnerability and climate change: A framework for modeling the future of global hydroelectric resources. Middlebury College. Available at: http://www.middlebury.edu/media/view/352071/original/ Bolch, T., Kulkarni, A., Kääb, A., Huggel, C., Paul, F., Cogley, J., Frey, H., Kargel, J., Fujita, K., Scheel, M., Bajracharya, S. & Stoffel, M. (2012) ‘The state and fate of Himalayan glaciers’, Science, 336, p310-314. Bosshard, P. (2010) ‘The dam industry, the World Commission on Dams and the HSAF process’, Water Alternatives, 3, p58-70. Boucher, M., Tremblay, D., Delorme, L., Perreault, L. & Anctil, F. (2012) ‘Hydro-economic assessment of hydrological forecasting systems’, Journal of Hydrology, 416, p133-144. Branche, E. (2011) Hydropower: the strongest performer in the CDM process, reflecting high quality of hydro in comparison to other renewable energy sources. EDF, Paris. Briscoe, J. (2011) Making water reform happen. Water policy: Reflections from a practitioner. Paris: OECD Global Forum on Environment: Making water reform happen. Briscoe, J. (2010) ‘Viewpoint - Overreach and response: The politics of the WCD and its aftermath’, Water Alternatives, 3, p399-415. Brown, P., Tullos, D., Tilt, B., Magee, D. & Wolf, A. (2009) ‘Modeling the costs and benefits of dam construction from a multidisciplinary perspective’, Journal of Environmental Management, 90, p303-311. Cada, G. (2001) ‘The development of advanced hydroelectric turbines to improve fish passage survival’, Fisheries, 26(9), p14-23. Carr, G., Bloeschl, G. & Loucks, D. (2012) ‘Evaluating participation in water resource management: A review’, Water Resources Research, 48. Cateni, A. & Magri, L. (2008) Optimization of hydropower plants performance: Importance of rehabilitation and maintenance in particular for the runner profiles. Milan: 7th International Conference on Hydraulic Efficiency Measurements.

78
Cernea, M. (1997) Hydropower dams and social impacts: A sociological perspective. Paper No. 16. Social Assessment Series. Washington, D. C.: World Bank. Cole, M., Elliott, R. & Strobl, E. (2013) Climate change, hydro-dependency and the African dam boom. Department of Economics Discussion Paper 14-03. University of Birmingham. Collier, U. (2006) Meeting Africa’s energy needs: The costs and benefits of hydropower. Oxfam/WWF/Wateraid. Available at: http://awsassets.panda.org/downloads/africahydropowerreport2006.pdf Connelly, B., Braatz, D., Halquist, J , Deweese, M., Larson, L. & Ingram, J. (1999) ‘Advanced hydrologic prediction system’, Journal of Geophysical Research-Atmospheres, 104, p19655-19660. Cullenward, D. & Victor, D. (2006) ‘The dam debate and its discontents’, Climatic Change, Vol.75, No.1-2, p81-86. Demeke, T., Marence, M. & Mynett, A. (2013) Evaporation from reservoirs and the hydropower water footprint. Addis Ababa: The International Journal on Hydropower and Dams. Dore, J. & Lebel, L. (2010) ‘Gaining public acceptance: A critical strategic priority of the World Commission on Dams’, Water Alternatives, 3, p124-141. Dourte, D. & Fraisse, C. (2012) What is a water footprint?: An overview and applications in agriculture. University of Florida. Available at: http://edis.ifas.ufl.edu/ae484 Eberhard, A. & Gratwick, K. (2009) IPPs in Sub-Saharan Africa: determinants of success. Cape Town. Available at: http://siteresources.worldbank.org/AFRICAEXT/Resources/258643-1271798012256/Africa_IPP.pdf Egré, D., & Milewski, J. (2002) ‘The diversity of hydropower projects’, Energy Policy, 30(14), p1225-1230. Economics and Development Resource Centre (EDReC). (1997) Guidelines for the economic development of projects. London. Eschenbach, W. ‘The levelized cost of electric generation’, Watts Up With That, 16th February 2014. Available at: http://wattsupwiththat.com/2014/02/16/the-levelized-cost-of-electric-generation/ Fearnside, P. (2006) ‘Greenhouse gas emissions from hydroelectric dams: Reply to Rosa et al’, Climatic Change, Vol.75, No.1-2, p103-109. Fearnside, P. (2004) ‘Greenhouse gas emissions from hydroelectric dams: Controversies provide a springboard for rethinking a supposedly 'clean' energy source – An editorial comment’, Climatic Change, Vol.66, No.1-2, p1-8. Fearnside, P. (2002) ‘Greenhouse gas emissions from a hydroelectric reservoir (Brazil's Tucurui Dam) and the energy policy implications’, Water Air and Soil Pollution, Vol.133, No.1-4, p69-96.
79
Forbes. (2011) 2011 China investment guide: The world's best hydro returns [accessed 25th June 2014]. Available at: http://www.forbes.com/sites/russellflannery/2011/02/08/2011-china-investment-guide-the-worlds-best-hydro-returns/ Foster, V., Butterfield, W., Chen, C. & Pushak, N. (2008) Building bridges: China’s growing role as infrastructure financier for Africa. World Bank/PPIAF. Fraile, A., Moreno, I.. Diaz, J., Ayza, J. & Fraile-Mora, J. (2006) Speed optimization module of a hydraulic Francis turbine based on artificial neural networks. Application to the dynamic analysis and control of an adjustable speed hydro plant. Vancouver: International Joint Conference on Neural Networks. French, M., Krajewski, W. & Cuykendall, R. (1992) ‘Rainfall forecasting in space and time using a neural network’, Journal of Hydrology, 137, p1-31. Gammelsrod, T. (1992) ‘Variation in shrimp abundance on the Sofala Bank, Mozambique, and its relation to the Zambezi river runoff’, Estuarine, Coastal and Shelf Science. Vol. 35, p91-103. Gardelle, J., Berthier, E. & Arnaud, Y. (2012) ‘Slight mass gain of Karakoram glaciers in the early twenty-first century’, Nature Geoscience, 5, p322-325. Gerbens-Leenes, P., Hoekstra, A. & Van der Meer, T. (2008) ‘The water footprint of energy from biomass: A quantitative assessment and consequences of an increasing share of bio-energy in energy supply’, Ecological Economics, 68, p1052-1060. Giles, J. (2006) ‘Methane quashes green credentials of hydropower’, Nature 444, p524-525. Goldberg, J. & Lier, O. (2011) Rehabilitation of hydropower - An introduction to economic and technical issues. Water paper. Washington, D. C.: World Bank. Goodland, R. (1997) Environmental sustainability in the hydro industry: Desegregation of the debates. Gland: IUCN. Gjermundsen, T. and Jenssen, L. (2001). Economic risk and sensitivity analyzes for hydropower projects. Pages 23-28 in Hydropower in the New Millennium: Proceedings of the 4th International Conference on Hydropower Development. Bergen, Norway, 20 June 2001. Gratwick, K. & Eberhard, A. (2008) ‘Demise of the standard model for power sector reform and the emergence of hybrid power markets’, Energy Policy, Volume 36, Issue 10, pp3948-3960. Hauck, J. & Youkhana, E. (2010) ‘Claims and realities of community-based water resources management: a case study of rural fisheries in Ghana’, Natural Resources in Ghana: Management, Policy and Economics, p143-163. Hamududu, B. & Killingtveit, Å. (2012) ‘Assessing climate change impacts on global hydropower’, Energies 2012, 5, p305-322. Available at: http://www.mdpi.com/1996-1073/5/2/305 Haney, M. & Plummer, J. (2008) Taking a holistic approach to planning and developing hydropower: Lessons from two river basin case studies in India. Gridlines Note no. 41. World Bank.

80
Hankins, M. (2009). A renewable energy plan for Mozambique. Maputo, Mozambique: Justiça Ambiental/International Rivers. Available at: http://www.internationalrivers.org/files/attached-files/clean_energy_for_mz_30_9_09.pdf Harrison, G. & Whittington, H. (2001) Impact of climatic change on hydropower investment. 4th International Conference on Hydropower Development. Harrison, G., Whittington, H. & Gundry, S. (2004) Climate change impacts on hydroelectric power. Edinburgh. Available at: http://www.see.ed.ac.uk/~gph/publications/GPH-Upec98.pdf Harrison, G., Whittington, H. & Wallace, R. (2003) ‘Climate change impacts on financial risk in hydropower projects’, IEEE Transactions on Power Systems, 18, 4, p1324-1330. Head, C. (2004) Lessons from the hydropower sector. London: UNEP. Head, C. (2000) Financing of private hydropower projects. World Bank Discussion Paper 420. Washington, D. C. Helland-Hansen, E., Holtedahl, T. & Lye, O. (2005) Environmental effects update. Trondheim: NTNU, Department of Hydraulic and Environmental Engineering. Hoekstra, A., Chapagain, A., Aldaya, M. & Mekonnen, M. (2011) The water footprint assessment manual: Setting the global standard. London: Earthscan. Hurford, A.P. & Harou, J.J. (2014) ‘Balancing ecosystem services with energy and food security – Assessing trade-offs from reservoir operation and irrigation investments in Kenya’s Tana Basin’, Hydrology and Earth System Sciences, 18, 3259–3277, 2014, doi:10.5194/hess-18-3259-2014. Available at: http://www.hydrol-earth-syst-sci.net/18/3259/2014/hess-18-3259-2014.pdf [Accessed 28 August 2014] Hydroworld (2010). Fish-friendly hydro turbine [accessed 25th June 2014]. Available at: http://www.hydroworld.com/articles/hr/print/volume-29/issue-7/articles/fish-friendly-hydro-turbine.html Iimi, A. (2007) Estimating global climate change impacts on hydropower projects: Applications in India, Sri Lanka and Vietnam. World Bank Policy Research Working Paper No. 4344. Washington, D. C. Immerzeel, W., van Beek, L., Konz, M., Shrestha, A. & Bierkens, M. (2012) ‘Hydrological response to climate change in a glacierized catchment in the Himalayas’, Climatic Change, 110, p721-736. Available at: http://link.springer.com/article/10.1007%2Fs10584-011-0143-4 Imhof, A. & Lanza, G. (2010) ‘Greenwashing hydropower’, World Watch Magazine, Volume 23, No. 1. Integrated Regional Information Networks (IRIN). (2012) Climate change: Himalayan glaciers melting more rapidly [accessed 25th June 2014]. Available at: http://www.irinnews.org/fr/report/95917/climate-change-himalayan-glaciers-melting-more-rapidly Intergovernmental Panel on Climate Change (IPCC). (2014) Fifth Assessment Report Climate change 2014: Impacts, adaptation and vulnerability. Geneva. Available at: http://www.ipcc.ch/report/ar5/wg2/
81
IPCC. (2011) Special report renewable energy sources and climate change mitigation. Working Group III-Mitigation of Climate Change, IPCC. International Energy Agency (IEA) (2000). Hydropower and the environment: Present context and guidelines for future action. Volume II: Main report. Implementing agreement for hydropower technologies and programmes, Annex III. International Energy Agency, Paris, France, pp172 pp. International Energy Agency (IEA). (2014) IEA implementing agreement for hydropower technologies and programmes. Available at: http://www.ieahydro.org/Technical_Information_%3E_IEA_Hydropower_Agreement_Technical_Reports.html IEA. (2013a) 2013 - Key world energy statistics. France. Available at: http://www.iea.org/publications/freepublications/publication/KeyWorld2013.pdf IEA. (2013b) Renewable energy medium term market report: Executive summary: Market trends and predictions to 2018. France. Available at: http://www.iea.org/textbase/npsum/mtrenew2013sum.pdf International Energy Agency (IEA) (2010). Renewable energy essentials: Hydropower. France. Available at: http://www.iea.org/publications/freepublications/publication/name-3930-en.html International Hydropower Association (IHA). (2012) Hydropower sustainability assessment protocol home page [accessed 25th June 2014]. Available at: http://www.hydrosustainability.org/ IHA. (2010) Hydropower sustainability assessment. Sutton. Available at: http://www.hydrosustainability.org/IHAHydro4Life/media/PDFs/Protocol/hydropower-sustainability-assessment-protocol_web.pdf International Renewable Energy Agency (IRENA). (2012) Renewable energy technologies: cost analysis series. Volume 1: Power sector issue 3/5. Hydropower. Abu Dhabi. Available at: http://www.irena.org/DocumentDownloads/Publications/RE_Technologies_Cost_Analysis-HYDROPOWER.pdf IRENA. (2011) Prospects for the African power sector: Scenarios and strategies for Africa project. Abu Dhabi. Available at: http://www.irena.org/DocumentDownloads/Publications/Prospects_for_the_African_PowerSector.pdf International Rivers. (2014) Grand Inga hydroelectric project: An overview [accessed 25th June 2014]. Available at: http://www.internationalrivers.org/resources/grand-inga-hydroelectric-project-an-overview-3356 Jägerskog, A., Clausen, T., Lexén, K. & Holmgren, T. (eds.) (2013) Cooperation for a Water Wise World – Partnerships for Sustainable Development. Report Nr. 32. Stockholm: SIWI. Jensen, T. (2009) ‘Building small hydro in Norway’, Hydro Review, 16(4), p20-27. Jessen, G. (2013) A method to forecast Cahora Bassa reservoir inflow. Addis Ababa: The International Journal on Hydropower and Dams.

82
Jha, D., Yorino, N. & Zoka, Y. (2007) A modified DEA model for benchmarking of hydropower plants. Power Tech, IEEE Lausanne. Available at: http://ieeexplore.ieee.org/xpl/login.jsp?tp=&arnumber=4538516&url=http%3A%2F%2Fieeexplore.ieee.org%2Fxpls%2Fabs_all.jsp%3Farnumber%3D4538516 Kääb, A., Berthier, E., Nuth, C., Gardelle, J. & Arnaud, Y. (2012) ‘Contrasting patterns of early twenty-first-century glacier mass change in the Himalayas’, Nature, 488, p495-498. Available at: http://www.nature.com/nature/journal/v488/n7412/full/nature11324.html Karekezi, S. & Kithyoma, W. (2005) Sustainable energy in Africa: Cogeneration and geothermal in the East and Horn of Africa – Status and Prospects. Nairobi. Karekezi, S., Kimani, J., Onguru, O. & Kithy oma, W. (2009) Large scale hydropower, renewable energy adaptation and climate change: Climate change and energy security in East and Horn of Africa. Nairobi. Available at: http://ke.boell.org/2012/08/19/energy-security-and-adaptation-climate-change-east-africa-and-horn-africa-large-scale Kling, G., Evans, W., Tanyileke, G., Kusakabe, M., Ohba, T., Yoshida, Y. & Hell, J. (2005) ‘Degassing Lakes Nyos and Monoun: Defusing certain disaster’, Proceedings of the National Academy of Sciences of the United States of America, 102, p14185-14190. Available at: http://www.ncbi.nlm.nih.gov/pmc/articles/PMC1242283/ Kling, H. Stanzel, P. & Preishuber, M. (2014) ‘Impact modelling of water resources development and climate scenarios on Zambezi River discharge’, Journal of Hydrology: Regional Studies, Volume 1, p17-43. Available at: http://www.sciencedirect.com/science/article/pii/S2214581814000032 Klunne, W. (2013) ‘Small hydropower in Southern Africa – an overview of five countries in the region’, Journal of Energy in Southern Africa, Vol 24 No 3. Konrad, C., Warner, A. & Higgins, J. (2012) ‘Evaluating dam re-operation for freshwater conservation’, River Research And Applications, 28, p777-792. Krahenbuhl, C. ‘Improving hydro plant performance’, HydroWorld, 1st August 2008. Available at: http://www.hydroworld.com/articles/hr/print/volume-26/issue-4/feature-articles/improving-hydro-plant-performance.html
Kumar, A., Schei, T., Ahenkorah, A., Caceres Rodriguez, R., Devernay, J-M. Freitas, M., Hall, D., Killingtveit, Å. & Liu, Z. (2011) ‘Hydropower’, in Edenhofer, O., Pichs-Madruga, R., Sokona, Y., Seyboth, K., Matschoss, P., Kadner, S., Zwickel, T., Eickemeier, P., Hansen, G., Schlömer, S. & von Stechow, C. (eds.) (2011) IPCC Special Report on Renewable Energy Sources and Climate Change Mitigation. Cambridge University Press. Lawrence, S. ‘A critique of the IHA’s draft hydropower sustainability assessment protocol’, International Rivers, 20th October 2009. Available at: http://www.internationalrivers.org/resources/a-critique-of-the-iha%E2%80%99s-draft-hydropower-sustainability-assessment-protocol-3946 Ledec, G. & Quintero, J. (2003) Good dams and bad dams: Environmental criteria for site selection of hydroelectric projects. Latin America and Caribbean Region Sustainable Development Working Paper. World Bank.
83
Levine, G. (2003) Pumped hydroelectric energy storage and spatial diversity of wind resources as methods of improving utilization of renewable energy sources. Michigan: Michigan Technological University. Lima, C. & Lall, U. (2010) ‘Climate informed monthly streamflow forecasts for the Brazilian hydropower network using a periodic ridge regression model’, Journal of Hydrology, 380, p438-449. Lima, I., Ramos, F., Bambace, l. & Rosa, R. (2008) ‘Methane emissions from large dams as renewable energy resources: A Developing nation perspective’, Mitigation and Adaptation Strategies for Global Change, 13, p193-206. Lindström, A. & Granit, J. (2012) Large-scale water storage in the water, energy and food nexus perspectives on benefits, risks and best practices. Paper 21. Stockholm: SIWI. Available at: http://www.siwi.org/documents/Resources/Papers/Water_Storage_Paper_21.pdf Liu, H., Masera, D. & Esser, L. (eds.) (2013) World small hydropower development report 2013. United Nations Industrial Development Organization/International Center on Small Hydro Power. Lucky, M. ‘Global hydropower installed capacity and use increase’, World Watch Institute, 17th January 2012. Available at: http://vitalsigns.worldwatch.org/vs-trend/global-hydropower-installed-capacity-and-use-increase Maeck, A., DelSontro, T., McGinnis, D., Fischer, H., Flury, S., Schmidt, M., Fietzek, P. & Lorke, A. (2013) ‘Sediment trapping by dams creates methane emission hot spots’, Environmental Science and Technology, 47 (15), p8130-8137. Available at: http://pubs.acs.org/doi/abs/10.1021/es4003907 Mahmood, K. (1987) Reservoir sedimentation: Impact, extent, and mitigation. World Bank. Mao, Q., Mueller, S. & Juang, H. (2000) ‘Quantitative precipitation forecasting for the Tennessee and Cumberland River watersheds using the NCEP regional spectral model’, Weather and Forecasting, 15, p29-45. March, P., Almquist, C. & Wolf, P. (2008) “Best practice” guidelines for hydro performance processes. Tennessee. Available at: http://www.wolffwareltd.com/downloads/WP%20XIV%20Hydro%20Performance%20Best%20Practices.pdf Mäkinen, K. & Khan, S. (2010) ‘Policy considerations for greenhouse gas emissions from freshwater reservoirs’, Water Alternatives, 3, p91-105. Mekonnen, M. & Hoekstra, A. (2012) ‘The blue water footprint of electricity from hydropower’, Hydrology and Earth System Sciences, 16, p179-187. Mendoça, R., Barros, N., Vidal, L., Pacheco, F., Kosten, S. & Roland, F. (2012) Greenhouse gas emissions from hydroelectric reservoirs: What knowledge do we have and what is lacking? Shanghai: INTEC. Available at: http://cdn.intechopen.com/pdfs/32342/InTech-Greenhouse_gas_emissions_from_hydroelectric_reservoirs_what_knowledge_do_we_have_and_what_is_lacking_.pdf Milly, P., Betancourt, J., Falkenmark, M., Hirsch, R. & Zbigniew, W. (2008) ‘Climate change – Stationarity is dead: whither water management?’, Science 319, p573-574.

84
Ministry of Energy Sierra Leone. (2012) Expression of interest to participate in the scaling Up renewable energy in low income countries program [accessed 25th June 2014]. Available at: https://www.climateinvestmentfunds.org/cif/sites/climateinvestmentfunds.org/files/Sierra%20Leone_EOI.pdf. Mimikou, M. & Baltas, E. (1997) ‘Climate change impacts on the reliability of hydroelectric energy production’, Hydrological Science Journal 42(5), p661-678. Moremoholo, M. (2011) Southern African Power Pool (SAPP) assessment of sustainability hydropower projects within SAPP. SAPP. Available at: http://www.h4sd.info/getattachment/Documents-and-links/Session-3_Matseliso-Moremoholo.pdf.aspx Mukheibir, P. (2007) ‘Possible climate change impacts on large hydroelectricity schemes in Southern Africa’, Journal of Energy in Southern Africa, Vol 18 No 1. National Hydropower Association (NHA). (2010) Environmental mitigation technology for hydropower: Summary report on a summit meeting convened by Oak Ridge National Laboratory, the National Hydropower Association, and the Hydropower Research Foundation. Washington, D. C. Oud, E. (2002) ‘The evolving context for hydropower development’, Energy Policy 30, p1215-1223. Overseas Development Administration8 (ODA). (1986). EvSum392 Victoria project: Sri Lanka. London/Colombo. Available at: https://www.gov.uk/government/uploads/system/uploads/attachment_data/file/67900/ev392s.pdf Palmer, T. & Anderson, D. (1994) ‘The prospects for seasonal forecasting - A review paper’, Quarterly Journal of the Royal Meteorological Society, 120, p755-793. Palmieri, A. (2003) Social and economic aspects of reservoir conservation. Kyoto: World Water Forum. Paton, J. & Bryant, G. (2012) ‘Valuing pollution: Problems of price in the commodification of nature’, Economic and Labour Relations Review, 23, p87-106. Petkova, E., Maurer, C., Henninger, N., Coyle, J., Hoff, G. & Irwin, F. (2002) Closing the gap: Information, participation, and justice in decision-making for the environment. WRI. Phillips, D., Allan, J., Claassen, M., Granit, J., Jägerskog, A., Kistin, E., Patrick, M. & Turton, A. (2008) The TWO analysis: Introducing a methodology for the transboundary waters opportunity analysis. Report Number 23. Stockholm International Water Institute. Pittock, J. (2010) ‘Viewpoint - Better management of hydropower in an era of climate change’, Water Alternatives, 3, p444-452. Pottinger, L. (2009) ‘Africa: The wrong climate for big dams’, World Rivers Review.
8 The Overseas Development Administration was the preceding British Government
Department to the Department for International Development (DFID).
85
Public-Private Infrastructure Advisory Facility (PPIAF). (2013) Public-Private Infrastructure Advisory Facility (PPIAF) web site [accessed 25 June 2014]. Available at: http://www.ppiaf.org/ Raadal, H., Gagnon, L., Modahla, I. & Hanssena, O. (2011) ‘Life cycle greenhouse gas (GHG) emissions from the generation of wind and hydropower’, Renewable and Sustainable Energy Reviews 15, p3417-3422. Ramos, F., Bambace, L., Lima, I., Rosa, R., Mazzi, E. & Fearnside, P. (2009) ‘Methane stocks in tropical hydropower reservoirs as a potential energy source’, Climatic Change 93, p1-13. Ranger, N. (2013) Topic guide: Adaptation: Decision making under uncertainty. London. Available at: http://dx.doi.org/10.12774/eod_tg02.june2013.ranger Räsänen, T., Joffre, O., Someth, P. & Matti, K. (2013) Trade-offs between hydropower and irrigation development and their cumulative hydrological impacts. Hanoi: International Centre for Environmental Management. Rashid, M., Shakir, A. & Khan, N. (2014) ‘Evaluation of sediment management options and minimum operation levels for Tarbela. Reservoir, Pakistan’, Arabian Journal for Science and Engineering, Volume 39, Issue 4, p2655-2668. Redd-Monitor. (2014) Global carbon markets have shrunk in value by 60% since 2011 [accessed 25th June 2014]. Available at: http://www.redd-monitor.org/2014/01/09/global-carbon-markets-have-shrunk-in-value-by-60-since-2011/ Reed, P. & Kasprzyk, J. (2009) ‘Water resources management: The myth, the wicked, and the future’, Journal of Water Resources Planning and Management. Renewable Energy Policy Network for 21st century (REN21). (2014) Renewables 2014 Global Status Report [accessed 25th June 2014]. Available at: http://www.ren21.net/REN21Activities/GlobalStatusReport.aspx Richter, B. & Thomas, G. (2007) ‘Restoring environmental flows by modifying dam operations’, Ecology and Society, 12. Roca, M. (2012) Tarbela Dam in Pakistan. Case study of reservoir sedimentation. International Association for Hydro-Environment Engineering and Research (IAHR). Rodriguez, D. (2013). Quantifying the trade-offs of the water-energy nexus. Stockholm: World Water Week 2013. Rodriguez, D., Delgado, A., DelaQuil, P. & Sohns, A. (2013) Thirsty energy. Water papers June 2013, World Bank. Rosa, L., Dos Santos, M., Matvienko, B., Dos Santos, E. & Sikar, E. (2004) ‘Greenhouse gas emissions from hydroelectric reservoirs in tropical regions’, Climatic Change, Vol.66. No.1-2, p9-21. Rothausen, S. & Conway, D. (2011) ‘Greenhouse-gas emissions from energy use in the water sector’, Nature Climate Change 1, p210-219. Available at: http://www.nature.com/nclimate/journal/v1/n4/full/nclimate1147.html

86
Rudd, J., Harris, R., Kelly, C. & Hecky, R. (1993) ‘Are hydroelectric reservoirs significant sources of greenhouse gases?’, Ambio 22, p246-248. Rydgren, R., Graham, P., Basson, M. & Wisaeus, D. (2007) Addressing climate-driven increased hydrological variability in environmental assessments for hydropower projects: A scoping study. World Bank. Available at: http://documents.worldbank.org/curated/en/2007/07/16556996/addressing-climate-change-driven-increased-hydrological-variability-environmental-assessments-hydropower-projects-scoping-study Sagoff, M. (2011) ‘The quantification and valuation of ecosystem services’, Ecological Economics, 70, p497-502. Available at: http://www.researchgate.net/publication/222113734_The_quantification_and_valuation_of_ecosystem_services Sagoff, M. (2008) ‘On the economic value of ecosystem services’, Environmental Values, 17, p239-257. Available at: http://www.ingentaconnect.com/content/whp/ev/2008/00000017/00000002/art00009?token=0052124cd67e2a46762c6b795d7e766a70503a3e457c673f7b2f267738703375686f496b8071e2763c Salzman, J. (1997) Valuing ecosystem services [accessed 25th June 2014]. Available at: http://scholarship.law.duke.edu/faculty_scholarship/1526/ Samadi Boroujeni, H. (2012) Sediment management in a hydropower dam: Case study – Dez dam project. Iran: Shahrekord University. Available at: http://cdn.intechopen.com/pdfs/31395.pdf Sankarasubramanian, A., Lall, U., Souza, F. & Sharma, A. (2009) ‘Improved water allocation utilizing probabilistic climate forecasts: Short-term water contracts in a risk management framework’, Water Resources Research, 45. Schneider, J. & Zenz, G. (2013) Venting of turbidity currents for minimizing reservoir sedimentation. Addis Ababa: The International Journal on Hydropower and Dams. Steele, S. (2009) ‘Expanding the solution set: Organizational economics and agri-environmental policy’, Ecological Economics, 69, p398-405. Available at: http://www.deepdyve.com/lp/elsevier/expanding-the-solution-set-organizational-economics-and-agri-k5RXetDZ2g South Asia Water Initiative (SAWI). (2013) Background to the South Asia Water Initiative (SAWI) [accessed 25th June 2014]. Available at: https://www.southasiawaterinitiative.org/ South Asia Network on Dams, Rivers and People (SANDRP). (2012) Diminishing returns from large hydro. Delhi. Available at: http://sandrp.in/HEP_Performance/Diminishing_Returns_from_Large_Hydro_Nov_2012.pdf Southern African Power Pool (SAPP). (2007) Guidelines for environmental and social impact assessment for hydroelectric projects in the SAPP Region Part 1 Appendices H-S. Harare. Available at: http://www.sapp.co.zw/docs/Appdix%20Pt%201%20H%20%20S%20WSC.pdf St Louis, V., Kelly, C., Duchemin, E., Rudd, J. & Rosenberg, D. (2000) ‘Reservoir surfaces as sources of greenhouse gases to the atmosphere: A global estimate’, Bioscience, 50, p766-775.

87
Heinrich Böll Stiftung (HBS). (2010) Energy security and adaptation to climate change in East Africa and the Horn of Africa: Large scale hydropower vs. decentralized renewables. Nairobi. Available at: http://ke.boell.org/2012/08/19/energy-security-and-adaptation-climate-change-east-africa-and-horn-africa-large-scale Stockholm Environment Institute (SEI). (2011) Understanding the Nexus: Background paper for the Bonn2011 Nexus Conference. Bonn: Water, Energy and Food Security Nexus Solutions for the Green Economy. Available at: http://www.water-energy-food.org/documents/understanding_the_nexus.pdf Swallow, B., Johnson, N., Meinzen-Dick, R. & Knox, A. (2006) ‘The challenges of inclusive cross-scale collective action in watersheds’, Water International, 31, p361-375. Taddei, R. (2011) ‘Watered-down democratization: Modernization versus social participation in water management in north-east Brazil’, Agriculture and Human Values, 28, p109-121. Takeuchi, K. (2004) Importance of sediment research in global water systems. Yichang: Ninth International Symposium on River Sedimentation. Talberg, A. & Nielson, L. (2009) The Kyoto Protocol’s Clean Development Mechanism – Background note. Canberra. Available at: http://www.aph.gov.au/binaries/library/pubs/bn/2008-09/kyotoprotocol_cdm.pdf Terens, L. & Schafer, R. (1993) Variable speed in hydropower generation utilizing static frequency converters. Nashville: International Conference on Hydropower. United Nations (UN). (2004) Beijing declaration on hydropower and sustainable development. Beijing. Available at: http://www.un.org/esa/sustdev/sdissues/energy/hydropower_sd_beijingdeclaration.pdf UNESCO-IHE. (2011) Available continental scale hydrological models and their suitability for Africa. DEWFORA.
United Nations Environment Programme (UNEP). (2014) Dams and development project [accessed 25th June 2014]. Available at: http://www.unep.org/dams/WCD/ United Nations World Water Assessment Programme (UNWWAP). (2006) Water – A shared responsibility. United Nations World Water Development Report 2, World Water Assessment Programme. UNESCO. United States Bureau of Reclamation (USBR). (2005) Hydroelectric power. USA. Available at: http://www.usbr.gov/power/edu/pamphlet.pdf United States Department of Energy. (2011) Performance assessment manual: Hydropower advancement manual. Doylestown. Available at: http://hydropower.ornl.gov/HAP/PAMR1_0.pdf Vermeulen, S., Campbell, B. & Ingram, J. (2012) ‘Climate change and food systems’, Annual Review of Environment and Resources, Vol. 37, p195 -222. Vovk-Korže, A., Korže, D., Goltara, A., Conte, G., Toniutti, N. & Smolar-Žvanut, N. (2008) Review of best practices/guidelines for compensation measures for hydropower generation facilities. CH2OICE. Available at: www.ch2oice.eu/download/public/CH2OICE_D2-2.pdf

88
Wang, C. (2012) A guide for local benefit sharing in hydropower projects. World Bank. Washington, DC. Available at: https://openknowledge.worldbank.org/handle/10986/18366 Watts, R., Ryder, D., Allan, C. & Commens, S. (2010) ‘Using river-scale experiments to inform variable releases from large dams: A case study of emergent adaptive management’, Marine and Freshwater Research, 61, p786-797. Weisser, D. (2008) A guide to life-cycle greenhouse gas emissions from electric supply technologies. Vienna. Available at: http://www.iaea.org/OurWork/ST/NE/Pess/assets/GHG_manuscript_pre-print_versionDanielWeisser.pdf Westphal, K., Vogel, R., Kirshen, P. & Chapra, S. (2003) ‘Decision support system for adaptive water supply management’, Journal of Water Resources Planning and Management, 129, p165-177. World Bank. (2010) Africa Infrastructure Country Diagnostics (AICD) [accessed 25th June 2014]. Available at: http://web.worldbank.org/WBSITE/EXTERNAL/TOPICS/EXTINFORMATIONANDCOMMUNICATIONANDTECHNOLOGIES/0,,contentMDK:21525984~pagePK:210058~piPK:210062~theSitePK:282823~isCURL:Y,00.html World Bank. (2009) Directions in hydropower: Washington, D. C. Available at: http://siteresources.worldbank.org/INTWAT/Resources/Directions_in_Hydropower_FINAL.pdf World Bank. (2000) Involuntary resettlement: The large dam experience. Précis Number 194. Washington, D. C. World Conservation Union (IUCN). (2014) WISE-UP to climate [accessed 25th June 2014]. Available at: http://www.iucn.org/about/work/programmes/water/wp_our_work/wise_up_to_climate/ World Commission on Dams (WCD). (2000a) Dams and development: A new framework. London/Sterling: Earthscan Publications. WCD. (2000b) Kariba Dam Zambia and Zimbabwe case study. Cape Town. Available at: http://bscw-app1.let.ethz.ch/pub/bscw.cgi/d11576911/World_Commission_on_Dams_2000_Case_Study_Kariba_Dam_Final_Report_Annexes.pdf World Energy Council. (2014) World energy resources [accessed 25th June 2014]. Available at: http://www.worldenergy.org/data/resources/ World Meteorological Organization (WMO). (2008) Manual on low flow estimation and prediction. Operational hydrology report number 50. WMO-No. 129. Koblenz. Available at: http://www.wmo.int/pages/prog/hwrp/publications/low-flow_estimation_prediction/WMO%201029%20en.pdf Zambezi River Authority. (2005) Batoka Gorge hydroelectricity scheme project. Windhoek: SAPP. Available at: http://www.sapp.co.zw/documents/Batoka%20Hydro%20project.pdf