sustainability assessment of micro hydropower projects
TRANSCRIPT

PAN AFRICAN INSTITUTE OF WATER AND ENERGY SCIENCES (PAUWES)
Tlemcen 13000, Algeria
THESIS FOR MASTER OF SCIENCE IN ENERGY ENGINEERING
Sustainability Assessment of Micro Hydropower
Projects: Kenyan Case Study
Author: Lilies Kathumbi 5/25/2016
Supervised By: Prof. Bandari Ramchandra

i
DECLARATION
Declaration by the Candidate
This thesis is my original work and has not been presented for a degree in any other University.
No part of this thesis may be reproduced without the prior written permission of the author
and/or Pan African University.
Lilies Kathumbi ………………………………… Date: …………………………………..
Declaration by Supervisors
This thesis has been submitted for examination with our approval as University Supervisors.
Name of Supervisor ……………………………… Date: ……………………………….
(Name of University, Place, Country)
Name of Supervisor ……………………………… Date: ……………………………….
(Name of University, Place, Country)

ii
ABSTRACT This thesis assesses the sustainability of community-based micro hydropower projects in remote
villages of Kenya. Currently, these projects are very attractive for rural electrification and private
industries. The study reviews the Kenyan energy situation and energy indicators commonly used
worldwide for assessing projects and systems sustainability. A suitable model for assessing
sustainability of the micro hydropower projects was developed in accordance to International
Hydropower Association guidelines.
The model was based on five main dimensions: economic, social, environmental, market
analysis and technical. From these dimensions, the study developed 23 sub-dimensions and 60
indicators for assessing hydropower sustainability. Data was collected via interviews using open
emended questionnaires, group discussions and observation. The sustainability results of
community micro hydropower projects were then compared to those of private/industrial
hydropower plants as well as that of a solar home system.
The research findings revealed that the Kenyan micro hydropower plants were within sustainable
level with an average score of 3.12. Compared to solar PV home system, Micro hydropower was
more sustainable. This was attributable to the reliability and affordability of micro hydropower
whose Levelized Cost of Electricity (LCOE) was found to be an average of 0.12 USD/kWh.
Micro hydropower projects were of great significance to the communities in that they lead to;
improved standards of living, improved the community’s energy independent, increased study
hours for students, and enhanced harmony among the community members. The main challenge
that faced this research was lack of documentation for community projects’ finances and
operations.

iii
ACKNOWLEDGEMENT AND DEDICATION
I offer my gratitude to Prof. Bandari Ramchandra for inspiring and guiding me though my
research, and providing insightful comments and feedbacks. Special thanks to Mr. Elly Opiyo
and Mr. Geoffrey Makanga who accompanied me to my study sites for my data collection and
for their support and feedback. I thank Prof. Brian Rotich and my brother Walter for guiding me
in my writing and challenging my report.
This research would not have been an accomplishment without the help of PAUWES
professional staff who helped by preparing me in advance for my research writing. Thanks to all
interviewees who warmly offered to spare their time off their busy schedule to answer my
questionnaires and discuss with me on matters of their hydropower plants. Thank you to my
PAUWES pioneer class for providing your support, discussion, and sharing your experience on
thesis issues encountered.
I dedicate this work to my mum Mrs. Kathumbi for her moral support and compassionate
inspiration throughout my graduate program.

iv
Contents DECLARATION ............................................................................................................................. i
ABSTRACT .................................................................................................................................... ii
ACKNOWLEDGEMENT AND DEDICATION .......................................................................... iii
LIST OF FIGURES ...................................................................................................................... vii
ABBREEVIATIONS ................................................................................................................... viii
CHAPTER ONE ............................................................................................................................. 1
1.0 INTRODUCTION .................................................................................................................... 1
1.1 Kenyan Energy Status ........................................................................................................... 2
1.1.1 Renewable resources potential ....................................................................................... 6
1.1.2 Electrification in Kenya ................................................................................................. 8
1.1.3 Recommendations for sustainability in energy use sectors ......................................... 13
1.2 Hydropower Technology .................................................................................................... 18
1.2.1 Classification of hydropower plants ............................................................................ 20
1.2.2 Components of hydropower plant and its operation .................................................... 22
1.2.3 Kenyan hydropower technology S-Curve .................................................................... 24
1.2.4 Future of hydropower .................................................................................................. 26
1.3 Micro Hydropower (MHP) in Kenya .................................................................................. 27
1.4 Problem Statement .............................................................................................................. 33
1.5 Research Questions ............................................................................................................. 34
1.6 Objectives ........................................................................................................................... 34
1.7 Hypothesis........................................................................................................................... 35
1.8 Scope of study ..................................................................................................................... 35
1.9 Need for sustainability in hydropower projects in Kenya .................................................. 36
CHAPTER TWO .......................................................................................................................... 40
2.0 LITERATURE REVIEW ....................................................................................................... 40
2.1 Sustainability Indicators Models......................................................................................... 42
2.1.1 Energy Indicators for Sustainable development (EISD) Model .................................. 42
2.1.2 UK Energy sector indicators model ............................................................................. 44
2.1.3 Sustainable energy indicators for renewable energy systems ...................................... 45
2.1.4 Sustainable energy policy indicators ........................................................................... 46

v
2.1.5 Sustainability in hydropower development ................................................................. 47
2.1.6 Sustainability indicators of power production systems ............................................... 48
2.2 Related research .................................................................................................................. 49
CHAPTER THREE ...................................................................................................................... 52
3.0 METHODOLOGY ................................................................................................................. 52
3.1 Proposed framework ........................................................................................................... 54
3.2 Proposed sustainability indicators....................................................................................... 58
3.3 Scoring and weighting ........................................................................................................ 60
CHAPTER FOUR ......................................................................................................................... 63
4.0 RESULTS AND DATA ANALYSIS ..................................................................................... 63
4.1 MHP projects information and status ................................................................................. 64
4.2 Financial Data analysis ....................................................................................................... 69
4.3 Co2 analysis ......................................................................................................................... 72
4.4 MHP Sustainability score and ranking ............................................................................... 73
CHAPTER FIVE .......................................................................................................................... 75
5.0 DISCUSSION ......................................................................................................................... 75
5.1 Sustainability level of MHP in Kenya ................................................................................ 75
5.2 Significance of MHP to rural communities ........................................................................ 79
5.3 Challenges facing community MHP projects ..................................................................... 81
5.4 Conclusion .......................................................................................................................... 84
5.5 Recommendations ............................................................................................................... 85
Bibliography ................................................................................................................................. 86
APPENDIX ................................................................................................................................... 93

vi
LIST OF TABLES
Table 1: Small hydropower classification in Kenya ..................................................................... 28
Table 2: Small hydropower plants in Kenya ................................................................................. 32
Table 3: Micro hydropower SWOT analysis ................................................................................ 38
Table 4: IAEA energy indicators model ....................................................................................... 43
Table 5: U.K energy sector indicators model ............................................................................... 44
Table 6: Sustainable energy policy indicators model ................................................................... 46
Table 7: Sustainability indicators model (India) ........................................................................... 47
Table 8: Sustainability indicators of a power production system ................................................. 48
Table 9: International Hydropower Association indicators model ............................................... 53
Table 10: Proposed Indicator Model............................................................................................. 55
Table 11: Proposed sustainability indicators ................................................................................ 58
Table 12: Score and weighting ..................................................................................................... 61
Table 13: Study sites ..................................................................................................................... 63
Table 14: Financial analysis sheet ................................................................................................ 70
Table 15: Solar Home System cost analysis ................................................................................. 71
Table 16: Sustainability evaluation and ranking ........................................................................... 74

vii
LIST OF FIGURES
Figure 1: Primary energy share in Kenya ....................................................................................... 3
Figure 2: Installed capacities and their electricity generation ........................................................ 4
Figure 3: Kenya population, energy consumption and GDP trend ................................................. 5
Figure 4: Electrification rates and trend in Kenya .......................................................................... 9
Figure 5: Sectors of priority for sustainability .............................................................................. 14
Figure 6: Large hydropower plant sites in Kenya ......................................................................... 19
Figure 7: Components of hydropower plant ................................................................................. 22
Figure 8: Kenyan large hydropower technology S-curve ............................................................. 24
Figure 9: Small hydropower technology S-curve ......................................................................... 25
Figure 10: Run of river diagram ................................................................................................... 29
Figure 11: Small hydropower potential regions in Kenya ............................................................ 31
Figure 12: Kaproret MHP plant .................................................................................................... 64
Figure 13: Portable solar PV panel ............................................................................................... 72
Figure 14: Kigwathi MHP plant intake ......................................................................................... 81

viii
ABBREEVIATIONS
CO2 Carbon Dioxide
EISD Energy Indicators for Sustainable Development
GDP Gross Domestic Product
GHG Green House Gasses
GWh Gigawatt hour
IAEA International Atomic Energy Agency
IHA International Hydropower Association
KENGEN Kenya Electricity Generating Company
KgCO2 Kilograms of Carbon Dioxide
KSH Kenyan Shillings
KVA Kilovolt Amperes
KW Kilowatt
KWh Kilowatt hour
LCPD Least Cost Development Plan
LCOE Levelized Cost of Electricity
LED Light Emitting Diode
NGOs Non-Governmental Organizations
MEPS Minimum Energy Performance Standards
MHP Micro Hydropower
MW Megawatts
O&M Operation and Maintenance
PV Photovoltaic
RES Renewable Energy Systems
R&D Research and Development

ix
SHP Small Hydropower
SHS Solar Home System
tCO2 Tonnes of Carbon Dioxide
UNDP United Nation Development Programme
UNIDO United Nation Industrial Development Organization
USD US Dollar

1
CHAPTER ONE
1.0 INTRODUCTION
Renewable energy resources provide affordable and reliable energy to developing countries.
Hydropower is one of the most significant sources of renewable and sustainable energy today.
For development of hydro power projects, sustainability assessment is relevant through the
project’s feasibility assessment, implementation up to the operation phase. A conclusive
sustainability assessment not only conveys legal and economic gains, but also improves the
performance of the project in terms of time and social and environmental integration. Emphasis
on sustainability has led to global regulatory changes that make it mandatory for projects to show
their sustainability.
Hydropower is among the renewable energy resources that contribute to sustainable development
by providing cost effective energy access especially to developing countries. Additionally,
hydropower helps to mitigate environmental pollution by reducing emission of Green House
Gases (GHG) and harmful air pollutants. Hydropower delivers 91.4% of the world’s renewable
electricity supply and offsets the need for 4.4 million barrels of oil-equivalent each day (World
Commission on Dams, 2000).
Despite the high potential of the continents water resources, Africa has not fully exploited
hydropower. Only 7% of Africa’s hydropower potential has been realized which accounts for 80
TWh/y of the estimated potential of 1,143 TWh/y (Taylor & Andrew, n.d).

2
1.1 Kenyan Energy Status
Approximately 70% of Kenyans have no access to electricity. Most of those people live in rural
areas. More than three quarters of the population lives in rural areas and relies on biomass as the
major source of energy and agriculture as the main source of income. The national grid has not
effectively penetrated the rural areas because they are too far from the grid. Most villages lack
access to modern energy services such as lighting. Only 6.7 % of the rural population has access
to electricity (World Bank Group, 2016(a)).
Energy is a major driving force in economic development. Most developing countries, including
Kenya, rely on renewable energy as a major source of primary energy consumption. Sub-Saharan
Africa has abundant renewable energy resources but poor energy supply systems. This makes
reliability and affordability a critical factor in the energy sector (International Energy Agency ,
2014). According to the Africa energy outlook 2014 report, sub-Saharan Africa accounts for
13% of the world’s population and only 4% of the global energy demand. However, there has
been rapid economic growth since 2000 and energy use has risen by 45%.
Kenya relies heavily on renewable energy for electricity generation – it is among the most
sustainable countries in the world. Renewable energy contributes 80% to the national electricity
grid (Kiplagat, Wanga, & Li, 2011). Wood fuel is the capital source of energy in the country; it is
mainly used for cooking and heating. The share of renewables in primary energy demanded by
the population is high mainly because most people in rural areas depend on wood fuel. Figure 1
below shows energy share from various resources.

3
(Omenda, Simiyu, & Muchemi, 2014)
Figure 1: Primary energy share in Kenya
Wood fuel and other biomass products contribute about 68% of demanded primary energy mix,
followed by petroleum at 22%, electricity 9% and others such as coal account for 1% (Omenda,
Simiyu, & Muchemi, 2014). Petroleum oil is imported and mainly consumed by the transport
sector while gas is used for cooking in the cities. Solar energy is traditionally used for drying
agricultural products such as fish in rural areas. Omenda et al (2014) noted that coal is mainly
used in cement production.
Grid electricity is the primary source of modern energy and energy services in the country. The
country had a total installed capacity of 2244.05 MW in 2014, with total generation of 13, 657
GWh/year from a generation mix of hydropower, geothermal, thermal, wind, and cogeneration in
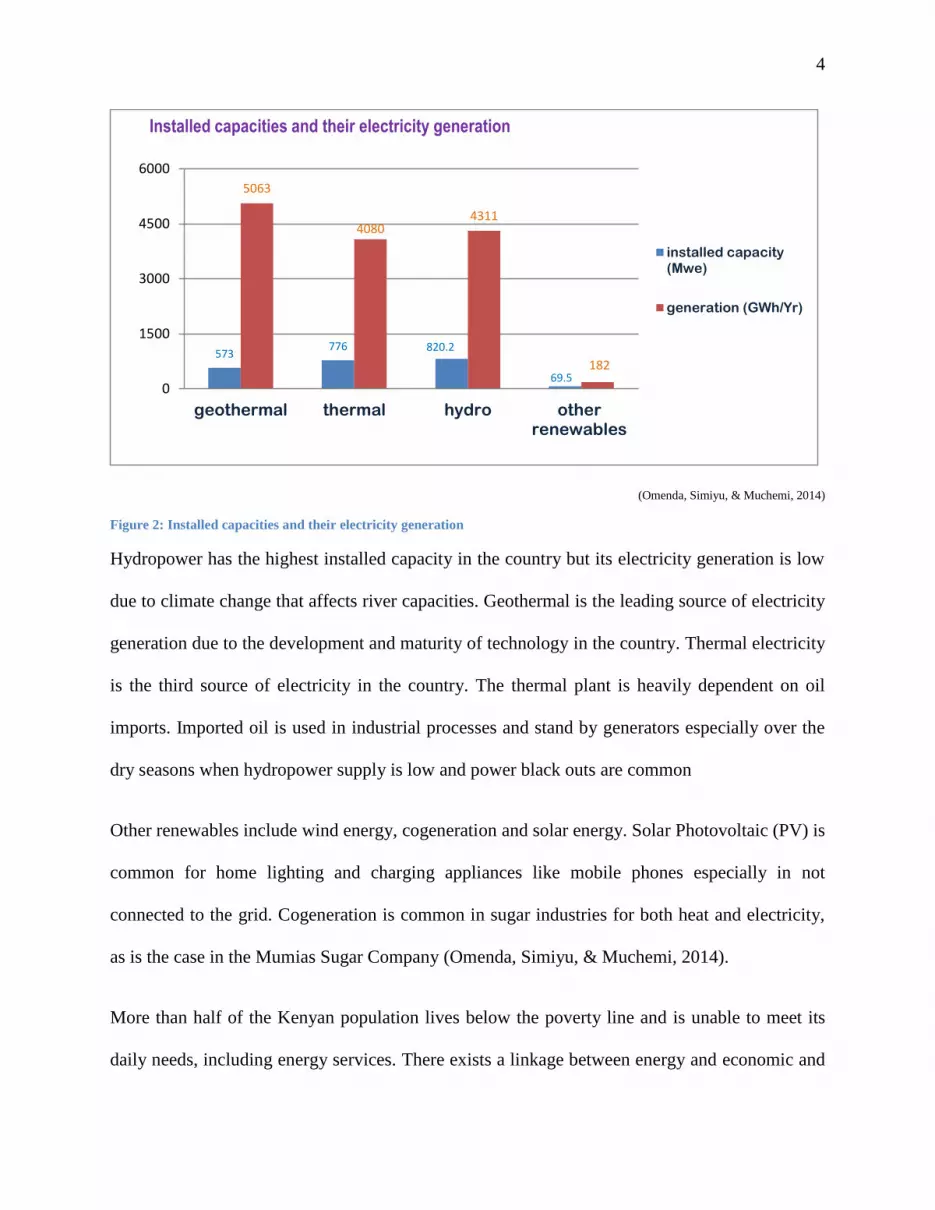
sugar industries (Omenda, Simiyu, & Muchemi, 2014). The installed capacity of each technology
and the generation is shown by the figure 2 below.
68%
22%
9%
1%
Demanded primary energy share in Kenya
Biomass (wood)
petroleum (oil & gas)
electricity
others
4
(Omenda, Simiyu, & Muchemi, 2014)
Figure 2: Installed capacities and their electricity generation
Hydropower has the highest installed capacity in the country but its electricity generation is low
due to climate change that affects river capacities. Geothermal is the leading source of electricity
generation due to the development and maturity of technology in the country. Thermal electricity
is the third source of electricity in the country. The thermal plant is heavily dependent on oil
imports. Imported oil is used in industrial processes and stand by generators especially over the
dry seasons when hydropower supply is low and power black outs are common
Other renewables include wind energy, cogeneration and solar energy. Solar Photovoltaic (PV) is
common for home lighting and charging appliances like mobile phones especially in not
connected to the grid. Cogeneration is common in sugar industries for both heat and electricity,
as is the case in the Mumias Sugar Company (Omenda, Simiyu, & Muchemi, 2014).
More than half of the Kenyan population lives below the poverty line and is unable to meet its
daily needs, including energy services. There exists a linkage between energy and economic and
573 776 820.2
69.5
5063
4080 4311
182
0
1500
3000
4500
6000
geothermal thermal hydro otherrenewables
Installed capacities and their electricity generation
installed capacity(Mwe)
generation (GWh/Yr)

5
economic growth (UNDP, 2004). According to the UNDP report, the economic growth can be
measured in terms of; social status, health issues, women standards of living, poverty
eradication, environmental protection and security. Increase in energy consumption is an
indication of growth in the economy of a country, which leads to improved living standards.
Figure 3 below shows the relationship between population growth, energy consumption and
GDP growth in Kenya from 1980 to 2014.
(U.S Energy Information administration, 2014)
Figure 3: Kenyan; population, energy consumption and GDP trend
Data on population, energy consumption and CO2 emission was obtained from the U.S Energy
Informationl administration (2014).
Both energy consumption and Gross Domestic Product (GDP) have had rapid growth from 2000
to 2007 when there was a political crisis that disrupted the economy and energy supply of the
country. The GDP grew to 6.1% in 2006, new economic development program towards Kenta
vision 2030 aims to accelerate GDP growth by 10% per annum for the next 25 years (G.O.K,
2007). It is evident that economic growth increases with increase in energy consumption, thus
0
40
80
120
160
200
240
19
80
19
82
19
84
19
86
19
88
19
90
19
92
19
94
19
96
19
98
20
00
20
02
20
04
20
06
20
08
20
10
20
12
20
14
kenya: population, energy consumption and GDP trend 1980-2014
Population (millions)
Energy consumption (trillionBtu)
GDP (Billion USD)

6
explaining the linkage between the two aspects. However, for most developing countries energy
consumption does not necessarily indicate economic growth since most of the energy is in
traditional biomass form (African Development Bank, 2015).
Development in the energy sector in Kenya is mainly geared towards sustainability.
Sustainability is the ability to meet current demands without compromising the ability of future
generations to meet their own demands.
Sustainable electricity generation not only boosts social and economic development but also
environmental and global climate change management. For these reasons, sustainably is very
important to the achievement of millennium development goals. Generation of electricity from
renewable energy resources such as hydropower is currently the best practice for minimizing the
effects of current environmental degradation and climate change (Kaunda, Cuthbert, & Torbjorn,
2012).
1.1.1 Renewable resources potential
Kenya has abundant renewable energy resources: solar, geothermal, hydro energy, wind energy,
and biomass.
a) Wind energy
The country has a potential to produce and add over 1000 MW of wind power to the national
grid but the installed capacity is only 5.1 MW. The wind speeds in areas of high potential such as
Ng’ong, Turkana, Marsabit, Laisamis and Samburu range from 8 m/s to 14 m/s ( Energy
Regulatory Commission, 2012). Challenges facing the wind sector include lack of reliable data
on wind potential and the high investment costs of the technology. Areas with high potential are
also located far from the national grid and are sparsely populated.

7
b) Solar energy
Solar potential in Kenya is huge with most of the country receiving a daily insolation of 4-6
kWh/m2 ( Energy Regulatory Commission, 2012). Most of this energy is used as solar drying,
water heating, and solar Photovoltaic (PV) for telecommunication, cathodic protection of
pipelines, lighting and water pumping (Republic of Kenya, 2011).
c) Hydropower
The country has high hydropower potential, current hydropower installed capacity is 820.2 MW
(Omenda, Simiyu, & Muchemi, 2014). The small hydropower installed capacity is 30 MW (with
only 15 MW supplied to the grid). Small hydropower is unexploited with its potential estimated
at 3000 MW. The main challenge facing large hydropower plants in Kenya is climate change
especially in dry seasons when there is low water lever in rivers. This has greatly affected power
generation leading to power rationing and over dependence on thermal plants over the dry
seasons.
d) Biomass
Biomass is the single most commonly utilized primary source of energy in Kenya. Solid biomass
attributes to 70% of final countries energy demand and accounts for about 90% of rural energy
needs ( Energy Regulatory Commission, 2012). Biomass in is mainly used as wood fuel for
cooking and heating in traditional form in rural areas. Besides the national wide campaigns on
use of improved cooking stoves to save wood fuel, the uptake has been slow due to capacity
constraints (Republic of Kenya, 2011).

8
e) Geothermal energy
Geothermal is the fastest growing electricity generation technology in Kenya in the last decade.
The countries potential is estimated to be 7,000 to 10,000 MW within the Rift-valley province.
The total installed capacity by 2014 was 573 MW (Omenda, Simiyu, & Muchemi, 2014).
Renewable energy technologies provide the most suitable and sustainable means for small grids
and off-grid region where grid connection does not exist due to geographic limitations. In many
developing counties including Kenya, these micro grids have been effective for community
based electricity access, institutions and private companies’ power generation such as tea
processing companies.
There is great potential to harness the renewable energy and improve energy access in the
country by investing in current technologies and R&D. The country’s renewable energy
resources are still under exploited only; 30% of hydropower, 4% geothermal and small
proportions of wind and solar energy has been harnessed (Kiplagat, Wanga, & Li, 2011)
1.1.2 Electrification in Kenya
The number of people without access to electricity in developing countries is increasing due to
lack of sufficient energy for the growing population despite the enhancement of rural
electrification programs. 80% of the world’s population in developing countries lives in rural
areas and consume only 20% of the global commercial energy (European Small Hydropower
Assocciation, 2006).
For economic development, Sub-Saharan Africa countries have to invest in energy sector for
affordable and reliable modern energy services. Most of these countries: 30 out of 48 are prone

9
to daily power outages which cost between 1% - 5% GDP in Kenya, Tanzania and Senegal
whereas in Uganda it is more than 5% (International Renewable Energy Agency, 2011).
Kenya has experienced rapid economic development since 2007. This has been mainly
attributed to the national development plan, Kenya Vision 2030 and facilitated by Energy Act of
2006 that created Rural Electrification Authority (REA). REA is an independent body formed to
stimulate electrification of rural areas in the country through extensions, stand-alone systems and
isolated mini-grids. The agency is to accelerate the electrification by renewable energies only so
as to promote sustainability.
In areas where diesel generator plants exist, hybrid generation with renewable energy was to be
implemented. By 2013, REA had 90% of public facilities electrified; these include secondary
schools, markets and health centers. By year 2014, 30% of Kenyans households had access to
electricity (Economic Consulting Associates, 2014). The trend of electrification rates is shown
by the figure 4 below;
(Economic Consulting Associates, 2014)
Figure 4: Electrification rates and trend in Kenya
10.90% 14.50%
23%
30%
0.0%
5.0%
10.0%
15.0%
20.0%
25.0%
30.0%
35.0%
1990 2000 2010 2014
electricity accessibility trend in kenya
% population withaccess toelectricity
10
From figure 4 above, there has been rapid increase in electricity accessibility since 2006, when
rural electrification was emphasized by governmental policies. This was made possible by
extending the national grid to rural areas. The country is currently on its path to industrialization
and increase in electricity demand is an indicator of developing progress. Private investors as
well as Non-Governmental institutions have also set up mini-grid to supply electricity to isolated
remote areas, for example Tungu-Kabiri and Somorio micro hydro projects.
Electrification rates in Kenya are still low since majority of the population still lack access.
Electricity is currently expensive for the poor majority; the cost per kWh being approximately
0.2 USD. Most communities even though connected to the grid majority of the habitants cannot
afford for its installation and monthly consumption bill hence live without modern energy
services. Community based energy projects are thus the cheaper way for energy access to such
remote communities. Organizations such as United Nation Industrial Development Organization
(UNIDO) have set up many community hydropower projects like Tungu-Kabiri and Somorio.
These projects were among the plants visited during the study; these projects are of great help to
the poor communities.
Kenyan economic development policies are focused to the countries development plan; Kenya
Vision 2030. It’s a social, economic and political plan which covers the period 2008 to 2030.
The plan highly reorganizes development in the energy sector as the main driving factor towards
economic development. The National plan targets 65% electrification by the year 2020 and
100% by the year 2030 (Republic of Kenya, 2011).
11
The main challenges facing the country in exploitation of natural resources for energy generation
are mainly; lack of financing, poor participation of private sector and lack of data on energy
pricing as well as market awareness.
The main policies in place for; affordable, reliable, cost effective energy services and
accessibility towards the Vision 2030 are:
i. Energy Act 2006: through this Act, REA was implemented to accelerate electricity
accessibility in the country,
ii. Feed in Tariff policy 2008: enacted to mainly attract investment in; small hydro, solar,
wind and biomass energy development. It has special rates ranging from USD
0.06/kWh to USD 0.12/kWh.
iii. Least Cost Development Plan (LCDP): focuses on; Load forecast, generation planning
and transmission planning to meet an electric power supply target of 3000 MW by
2018.
The main market structure and institution framework in place to enact policies on modern energy
access through renewable resource exploitation in Kenya are as discussed below (Republic of
Kenya, 2011);
Ministry of Energy (MoE); mandated by both the policy and law for overall coordination
of energy sector. It is responsible for formulating and articulation of policies to provide
enabling environment for all operators and stakeholders in the energy sector.
Energy Regulatory Commission (ERC); serves as the sole regulatory body for the
Kenyan energy sector.
12
Kenya Electricity Generating Company (KenGen); the public utility responsible for
electricity generation.
Kenya Electricity Transmission Company (KETRACO); responsible electricity
transmission.
Kenya Power and Lighting Company (KPLC); public utility responsible for electricity
distribution.
Geothermal Development Company (GDC): it is the central authority dealing in
geothermal power development. The central responsibility is exploration of drilling to
realize steam fields.
IPPs: they are becoming significant players in the electricity sector following new energy
policy.
Kenya Renewable Energy Association (KEREA) is also a body that is influencing uptake
of renewable energy especially solar energy for off-grid use in Arid and Semi-Arid Areas
(ASAL).
Policy makers, Non-Governmental Organizations (NGOs) and private developers can play a
major role in increasing accessibility of modern energy in rural areas. It is mostly assumed
that the areas are too far from the national grid and expensive to extend the grid to rempte
areas. However, mini-grids and stand alone off-grid energy system would be the best solution
to supply modern energy to 70% of rural dwellers in developing countries (Kenneth Lee, et
al., 2015).

13
1.1.3 Recommendations for sustainability in energy use sectors
Energy sector is essential for the development of the Sub-Saharan Africa. In order to ensure
energy sustainability in Kenya, there is need to work on energy efficiency so as to ensure optimal
use of energy resources. Energy efficiency curbs growth of energy demand, mitigates pollution
and reduces oil imports. According to New Policies Scenario, energy efficiency account for 70%
reduction in global energy demand projection for 2035 and saves 68% of cumulative CO2
emissions (IEA, 2012).
According to World energy outlook 2012 report, attaining energy efficiency will be a least cost
way of addressing challenges in the energy sector such as; energy security, economic, and
environmental concerns.
Assessment of sustainability and continuous monitoring of performance in various sectors in a
country is recommended to improve overall sustainability of energy systems and energy use.
The priority areas that require consideration to ensure sustainability in developing countries are
shown in figure 5 below as an all-round phenomenon.
(IEA, 2012)
cross -sectoral
Buildings
Appliances and
equipments
Lighting
Transport
industries and energy utilities

14
Figure 5: Sectors of priority for sustainability
Several recommendations have been set as guidelines on the above priority areas. They include
policies that would increase energy efficiency in a cost-effective way through establishment of
market signals for action, increase the rate of introduction of new technology, enforce use of
appliances, lighting, and building codes that adhere to the Minimum Energy Performance
Standards (MEPS).
Globally, implementation of the recommendations would result in saving as much as 7.6
gigatones of CO2/year by 2030 a figure that is about 1.5 times the value of CO2 emission from
the US. According to efficient world scenario, energy demanded will reduce by 2,350 Mtoe in
2035 of which 85% is a result of efficient energy measures by the end user (IEA, 2012).
i. Cross-sectoral
Sustainability cuts across all sectors since they are all linked in development, one sector cannot
develop at the expense of other sectors. The recommended for cross-sector efficiency check
include;
a) Energy efficiency data collection and indicators to aid in development and assessment of
energy efficiency strategies and policies,
b) Strategies and action plans based on analysis of energy use, markets, technologies, and
efficiency opportunities. There is need for the government to perform regular updates of the
strategies and action plans to ensure improvement in energy efficiency throughout the
domestic economy.
Best practice strategies and action plans should:
- Identify and minimize or overcome barriers to cost-effective efficiency investment.
15
- Assess opportunities and prioritize in sectors or/and end use areas with the largest cost-
effective improvements.
- Have clear objectives and timelines and have evaluation
- Ensure coherence with economic strategies and plans as well as energy, and
environment/climate.
- Consider events taking place in other countries.
NB: there should be continuous coordination and integration of new and emerging technologies.
c) Competitive energy markets that are guided by periodically reviewed regulations and
subsidies. It will ensure retail energy prices take into account full costs of energy supply and
delivery (including environmental costs).
d) Private investment in energy efficiency. The government should facilitate through capacity
building, standardizing measurement and verification protocols, and research. It can be
achieved via:
- Knowledge generation and dissemination through networks or energy advisory service.
- Education and training programs across all sectors on energy efficiency.
- Develop measures and verification protocols for consistency, overcoming uncertainties, and
stimulate more participation by the private sector.
- Public-private partnerships
e) Monitoring, enforcement, and evaluation of policies and measures. Done through using
results of a program or policy to inform decision. Baseline assessment and periodic review
and reporting. A transparent process should identify non-compliance and an associated
penalty applied.

16
ii. Buildings
In order to ensure energy efficiency in buildings;
- There should be mandatory building energy codes that meet MEPS.
- The aim should be net-zero energy consumption with specified targets included in policy
formulation
- Improve energy efficiency of existing buildings especially during renovation. Measures
included energy audits, rating and certification schemes
- Introduce energy labels or certificates to notify owners, buyers and renters.
- Establish policies that will ensure overall improvement of energy performance of all
buildings especially on critical components such as HVAC (heating, ventilating and cooling)
systems.
iii. Appliances and Equipment
Appliances in homes and offices consume more energy especially if they are not used effectively
for the right purposes or wrongly rated appliances are used. The recommendations advocated for
mandatory labeling of appliances and equipment and allocation of resources to monitor
compliance. There should be regular update of test standards and measurement protocols to
determine their usage and energy consumption. To attract more investors the government is
urged to use incentives to transform market policies on new technologies. Old appliances
consume more energy, replacing with newer ones that consume less would be cheaper at long
run.

17
iv. Lighting
Most modern energy services in rural areas are mainly used for lighting. Lighting consumes most
energy in institutions and offices. Proper building design to utilized natural lighting is highly
recommended to save on energy.
The recommendations are to;
- Phase-out inefficient lighting products and systems
- Require and promote use of improved lighting systems
- New building codes to factor in use of natural light
v. Transport
Kenyan transport sector is highly dependent on imported fossil fuel which is a challenge to the
national economy. Introducing energy efficiency measures to conserve energy in this sector is a
great challenge. These measures can be achieved through;
- Mandatory vehicle fuel efficiency standards that are periodically strengthened
- Develop policies to improve performance of; air conditioning, lighting, and other
components that affect efficiency,
- Strengthen incentives that encourage buying of efficient vehicles,
- Improving driving school curriculum to include eco-driving ,
- Improve efficiency in the transport system especially in urban areas,
vi. Industry and energy utilities
All industry should undertake energy management strategies and implementations for energy
sustainability. Policies in Kenya require conformity to ISO 50001 standards on energy
management which emphasis on energy efficiency and energy audits. Industries can optimize on
energy use through using high-efficiency industrial equipment and systems.

18
With regards to small and medium enterprises, the government should develop policies that
ensure promotion of energy efficiency. There should be high-quality and relevant information to
allow for international and local comparison. In addition, there is need to put in place
complementary financial policies that will promote investment in energy-efficiency in industries.
The government can strengthen energy utilities through policies and regulations that ensure they
remain supportive on cost-effective, end-use energy efficiency. For instance, the government can
utilize energy tariffs as a funding mechanism for energy efficiency. Developing countries are
focusing more on exploiting renewable energy resources which are sustainable and contribute
greatly to economic development. However, development of renewable technology is highly
hindered by financing leaving majority of the population relying on biomass as the major source
of energy.
1.2 Hydropower Technology
Hydropower is currently the most mature, reliable and cost effective renewable energy
technology. Hydropower is amongst the technologies that provide the lowest cost of electricity
generation. The Levelized Cost of Electricity (LCOE) of large hydropower plants at best site
being as low as USD 0.02/kWh while that of small hydropower projects has an average of USD
0.05/kWh (IRENA , 2015(b)). Hydropower is most attractive power generation technique due to
its ability to meet fluctuating load demand, its ease to start or shut down, low GHG emission and
long life span.
In a hydropower plants, the kinetic energy in water current is converted to mechanical energy by
a turbine. The turbine is coupled to a generator which in turn converts the mechanical energy to

19
electrical energy. It is a very old technology that was used in the early stages for milling and
gridding grains by water mills.
While hydropower technology offers significant economic and social advantages, its
sustainability has stirred criticism especially when analyzed on environmental aspect. However
this depends on policy and regulations of a given country. Large hydropower development is still
attractive worldwide. In Africa large hydropower development is evident by the ongoing
construction of the Grand Ethiopian Renaissance dam (6,000 MW) and the proposed Grand Inga
Dam of Congo (39,000 MW). These large hydropower projects are economical for regional
energy access and infrastructure development as well as regional cooperation in Africa.
Most of the large hydropower plants in Kenya are located in central region along river Tana
while small and micro are in mountainous locations such as Mt. Kenya and Kericho. Figure 6
below show main hydropower plants and their locations:
(Source: Droogers, et al., 2006)
Figure 6: Large hydropower plant sites in Kenya

20
As shown on the map in figure 6, large hydropower plants in Kenya are concentrated along river
(Tana) and form cascades known as the Seven Forks. All these large hydropower plants supply
electricity to the national grid. Overdependence on the same river makes reliability of electricity
vulnerable especially during the dry seasons that greatly affect river Tana.
In areas where the resource is abundant, large hydro technology provides additional services to
electricity generation such as: irrigation, flood control, water distribution, navigation, recreation
and water storage.
Global wide, many countries (about 160 countries) rely mainly on hydropower for electricity
generation. In 2011 hydropower global share of installed capacity was 19.4% accounting for
15.8% of global electricity generation (IRENA, 2015).
Kenya hydropower generation is a mature technology in having both large and small-scale
hydropower. The first large hydropower was developed 1968 with an installed capacity of 72
MW. Up to the year 2013 hydropower was the main electricity generating technology with total
installed capacity of 745 MW. Subsequently generation by hydropower has declined over years
due to water level variations in dry seasons.
1.2.1 Classification of hydropower plants
Hydropower plants are generally defined as large hydropower or Small Hydropower (SHP)
depending on their installed capacities. However, they can be further classified in several ways
depending on their; mode of operation, capacities, head, turbine characteristics, load
characteristics and interconnection as discussed below;
a) Mode of operation

21
o Run off river plants; are made by diverting water from a river course, they may be with or
without pondage. They are highly susceptible to variations in river changes.
o Impoundment plants; have a dam constructed across a river forming a reservoir for water
storage. They are mainly large hydropower plants.
o Pumped hydropower plants; water from reservoir is utilized for electricity demand during
peak demand, during off peak the water is pumped back to the reservoir using the excess
power.
b) According to head
o Low head plants: up to 10M
o Medium head plants: between 10-100M
o High head plants: above 100M
c) According to turbine characteristics
o Low specific speed: 10-60
o Medium specific speed: 60-300
o High specific speed: 300-1000
a) According to load characteristics
o Base load plant; operates continuously and generates power throughout the year
o Peak load plant; only generates power during peak hours
b) According to interconnection
o Isolated plant; power station operates independently, either an isolated grid for a
community or industrial purpose.
o Interconnected plant; the power station is connected to the national grid.

22
1.2.2 Components of hydropower plant and its operation
The main components of hydropower plants are as shown in figure 7 below:
(Alternative Energy, 2006)
Figure 7: Components of hydropower plant
The dam is an impounding structure that creates a reservoir behind it for water storage. It creates
a head and ensures continuous water flow for steady power supply. A penstock is a water
conduct system from the fore intake in the dam to the turbine nozzles. The turbine is the wheel
that transforms kinetic energy of water to mechanical energy; it is connected to a generator for
electricity generation. Both, the turbine and the generator are housed in the powerhouse.
Generated electricity is then transmitted for distribution by the transmission lines. The outflow
(tailrace) allows water to flow back to the river course.
The power generated is directly related to the available head and the water flow rate. However,
not all energy in the water is converted to electricity; this is due to mechanical losses of the
turbine and the generator. The hydraulic power generated is computed as below (equation 1):
(Equation 1)
Where:

23
P = Hydraulic power (kW)
ρ = water density (Kg/m3)
ɡ = acceleration due to gravity (9.81 m/s2)
Q = flow rate (m3/s
)
H = effective head (m)
η = overall efficiency of the hydropower plant (for estimation it is taken as 0.85)
Electrical energy generated by a hydropower plant can be computed from the power generated as
shown by equation 2 below:
(Equation 2)
Where;
E = energy generated (kWh)
P = hydraulic power (W)
ΔT= time period (hours)
Hydropower has many advantages; first it is a stock resource and a cost effective technology,
water is always available and after running the turbines it is utilized downstream. Secondly it is a
mature technology that is easy to learn and its running cost is very low in comparison to nuclear
and thermal plants. The technology has advanced high efficiency generators that have boosted
the efficiency of the system.
On the other hand, hydropower has several setbacks. The technology requires high capital
investment and the gestation period of large hydro is long, commissioning to completion of a
project takes 10-15 years. Large plants are usually far from the load centers necessitating long
transmission lines that constitute huge losses. Currently large hydropower plants especially in
Kenya and Tanzania are highly affected by climate change that has great variation in river

24
waters. The plants do not generate to their full capacities all year round and most countries are
turning to smaller hydropower plants for generation.
1.2.3 Kenyan hydropower technology S-Curve
Plotting performance of a technology against investment or efforts invested in it yields an S-
curve. The S-curve can also be plotted on efforts (performance) or investment against time to
give an idea of the technology advancement with time. It shows a technology trend and reviews
if the technology or a product is in its emergence, growth or maturity stage for decision making
to either; change, improve or abandon it.
Figure 8 below presents the Kenyan large hydropower technology s-curve as a computation of
investment (installed capacities) against time over the years as well as planned installation for the
year 2018.
(Wikipedia, 2016)
Figure 8: Kenyan large hydropower technology S-curve
72 93
40
165 106
225
60 90
72
165 205
370
476
701 761
851
0
100
200
300
400
500
600
700
800
900
1968 1974 1981 1988 1991 1999 2007 2018
Kenya large hydropower technology s-curve
installed capacity(MW)
cummulative capacity(MW)

25
The figure above represents the Kenyan large hydropower technology s-curve. Large
hydropower technology began in 1960’s and gained rapid growth in 1980’s. The technology
reached maturity in 1999 after which development of large hydropower declined. This may be
attributed to climate change that adversely affected hydropower in East Africa mainly Kenya and
Tanzania. Hydropower development then shifted to small scale hydropower to effectively
harness available energy.
In comparison, the Small Hydropower (SHP) technology s-curve is currently in its growth stage
with majority of the projects being in feasibility study phase. Many of the proposed projects are
owned by Kenya Tea Development Authority (KTDA) which has five SHP projects with a total
installed capacity of 10.9MW under construction and expected to be completed by end 2016
(Ingram, 2015).
Figure 9 below represents the SHP s-curve of investment (installed capacities) against time:
(Wikipedia, 2016)
Figure 9: Small hydropower technology S-curve
380 400 320 400
18 1.2 1.9
936 1009
0
500
1000
1500
2000
2500
3000
3500
4000
1930 1955 1987 1997 2000 2001 2007 1009 2016
SHP technology s-curve
installed capacities (kW)
cummulative capacities (kW)

26
From the above trend, small hydropower technology is in its growth stage and does not show and
sign of maturity. The technology was in emergence stage until 2007 when it started to grow. The
sharp gradient after 2007 indicates that the growth is in the early stages hence the technology can
attract more investors for resource exploitation. This implies that there is need to evaluate the
sustainability of these projects to have deeper understanding of their benefits to communities as
well as economically to investors.
1.2.4 Future of hydropower
The future of hydropower is attractive with advancement in technology. Research and
development is mainly directed in; hydrology, providing fish passage response, turbine
modifications, water resource management, dam safety, monitoring tool and development.
Currently major technology developments are emphasizing in areas as discussed below (U. S
Department of interior, 2005).
Uprating existing hydroelectric generator and turbine units as a cost effective means of
generating additional power,
Developing small power plants (low head and run-off hydro plants),
Peaking with hydropower; best suited where demand vary along the day or over seasons.
This is due to almost immediate start up or stop time.
Pumped storage; stores power in form of water when there is a low peak demand. Over
the peak demand, the water is utilized to generate electricity.
Hybrid with other plants, intermittent resources like solar and wind energy can be tied to
hydroelectric plant to improve their reliability and reduce demand on hydropower.

27
Development of run off river and low head hydropower plants (less than 65 Ft head);
high head plants provide higher power, however their development is limited by suitable
site selection. Low head dams can be constructed to generated power near the centers
where it is needed hence reducing transmission costs.
Pumped hydro is the most economic power storage available in the globe today. Mini
hydropower plants have gained popularity for rural electrification in remote areas by micro- grid
systems especially in Africa.
1.3 Micro Hydropower (MHP) in Kenya
Small scale hydropower is amongst the oldest environmentally sustainable energy technology.
Micro hydropower is classified under Small hydropower and it is very currently very attractive in
Kenyan for rural electricity access. Amongst all renewable energy technologies, SHP has the
highest density resource and holds the first place in renewable electricity generation in the world
(Surekha, Sinha, & Inamdar, 2005). Kenya being a tropical country has a huge potential for
MHP generation, the estimated capacities for SHP potential is about 3,000MW.
In this research SHP has been used to refer to power plants of less than 10 MW installed
capacity. MHP are those of up to 100kW and are commonly used to produce electricity for farms
and villages (U.S Department of Energy, nd).
SHP plants can be classified as; Pico, micro, mini, and small hydropower plant depending on
their capacities. MHP and SHP have been used interchangeably in this study since the former fall
under SHP category.
In Kenya the classification of SHP is as shown on table 1 below.

28
Table 1: small hydropower classification in Kenya
SHP Category Capacity (kW)
Pico <5
Micro 5-100
Mini 100-1000
Small 1000-10000
(Muriithi, 2006)
Development of community based MHP in Kenya began in 2000 with the first plant at Tungu-
Kibiri which was implemented for rural electrification. It is a projected funded by Practical
Action Group and is run by the community. Since then, MHP has gained popularity with many
people in a community forming a group to construct a shared plant. MHP electricity generation
and distribution is mainly through an isolated or mini-grid within the remote communities.
Mini-grids are small-scale electricity generation and distribution to a limited number of
households or industry through an isolated grid. Currently mini-grids play a minor role in energy
supply and electrification in Kenya. However, they are now gaining attraction for rural
electrification and they are being promoted on the basis that they offer cost efficient, reliable and
sustainable energy supply. The country has tremendous progress in installation of mini-grid;
solar, wind small and micro hydropower projects. These projects play a major role in
electrification, irrigation as well as addressing challenges in; technology, policies and
institutional frameworks.
Micro hydro technology does not require a dam to harness the hydro resource thus it has minimal
environmental impact. This fact has rendered the technology attractive to investors and national
development on the bases of sustainability. The technology is currently popular in developing
countries for electrification in remote areas. In developed countries MHP is commonly used to
supply electricity to homes, farms and ranches (U.S Department of energy, 2004).

29
The main advantages linked to MHP are listed below (Nasir, 2013);
High efficiency (70-90%),
High capacity factor (more than 50%)
Slow rate of change;
Little vary in output on a daily bases: easily predictable;
Quick start up or stop time and ability to make adjustments in the plant
Micro power plants are basically run off river power plants as shown in figure 10 below;
(British Hydropower Association, 2005)
Figure 10: Run of river diagram
The water from a river is diverted from the course through an intake at the weir. In high head
installations, the water is then conducted to a forebay by a small channel known as a leat. The
forebay slows the water for suspended particles to settle, it is also fitted with a trash rack to filter
solid particles. A pressure pipe ―the penstock‖ conveys the water from the forebay to the turbine.

30
The water runs the turbine that is coupled to a generator, the water then returns back to the river
course through the tail race.
This technology is simple, mature and cost effective on; operation, maintenance and the plants
can be constructed using locally available materials. The major drawback in this technology is
that runoff river plants are highly affected by seasonal variability of river flow. Hence, making it
difficult to balance load and power output throughout the year (World Bank Group, 2006). This
however can be eliminated by forming a hybrid plant with solar PV to reduce demand on
hydropower over dry seasons.
Kenya has many rivers and streams in mountainous regions that make development of MHP
highly feasible. SHP technology has lately gained popularity to harness the hydro energy in the
country. The country’s Small scale hydro potential is estimated at 3,000MW, of which less than
30MW have been exploited and only 15MW is supply the grid (Energy Regulatory Commission,
2014). Most of the SHP plants are private schemes owned by; local communities, missionary
groups or Kenya Tea Development Authority (KTDA).
KTDA has been successful in implementation of SHP projects of less than 10MW. The
association has established that there is a correlation between tea plantation sites and hydropower
potential in the country. 80% of the association’s tea factories (72) were surveyed and found to
be within 3KM to 5KM of a potential hydropower site (Ingram, 2015). According to the Ingrams
article in 2015, the association had proposed construction of 16 SHP plants with a total capacity
of 23.33MW with feasibility study being done by Ministry of Energy in 14 other sites. This
indicates an increasing demand in SHP in Kenya.
31
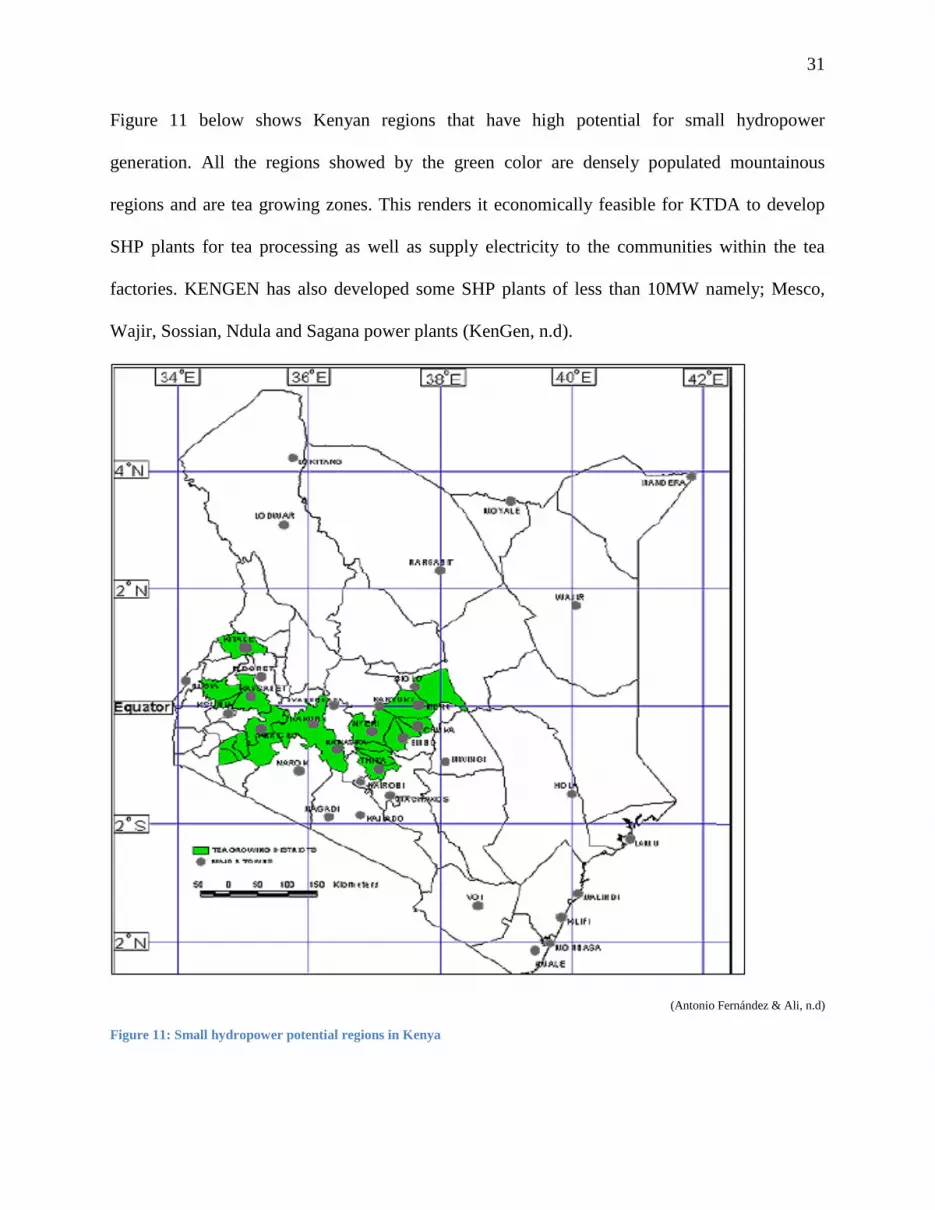
Figure 11 below shows Kenyan regions that have high potential for small hydropower
generation. All the regions showed by the green color are densely populated mountainous
regions and are tea growing zones. This renders it economically feasible for KTDA to develop
SHP plants for tea processing as well as supply electricity to the communities within the tea
factories. KENGEN has also developed some SHP plants of less than 10MW namely; Mesco,
Wajir, Sossian, Ndula and Sagana power plants (KenGen, n.d).
(Antonio Fernández & Ali, n.d)
Figure 11: Small hydropower potential regions in Kenya

32
The major SHP operating schemes found in the regions shown above (Figure 11) are listed on
table 2 below including their location, installed capacities and year of commissioning.
Table 2: Small hydropower plants in Kenya
Plant Ownership Location Installed capacity (kW) Year installed
Mesco KenGen Maragua 380 1930
Sosian KenGen Soaian 400 1955
Tenwek Missionary Hospital Bomet 320 1987
Imenti Tea Factory KTDA Imenti 900 2009
Diguna Missionary Diguna 400 1997
Tungu Kabiru Community River Tungu 18 2000
Mujwa Missionary Mujwa 7
Thima Community Mukengeria 2 2001
Kathamba Community Kathamba 1.2 2001
Somorio Community Somorio 1.5 2007
Mitunguru Community Igoji 36 2009
(UNIDO, 2013)
SHP plants are expected to be the fastest growing small scale renewable energy technology in
developing countries due to its abundance scope and proximity to rural population and habitants.
The technology has great advantage to remote areas ranging from; electric power, improving the
standards of living, enhancing education, public health facilities and employment.
Efforts in energy technologies are mainly focused in generation of affordable and reliable energy
services for development and better standards of living. However, current energy harnessing
techniques cannot be sustained if the technologies were to remain constant and supply more
energy to satisfy increasing demand (Kucukali & Kemal, 2009).
Micro hydro has improved over time with low cost turbine designs, electronic load controllers,
low cost penstocks by utilizing plastic (Department for International Development, 2000). Most
of the projects implemented have help communities in terms of infrastructure development such

33
as roads to school, enhanced livelihood of the habitants, health services, trade and improved
agricultural sector.
1.4 Problem Statement
Electricity generation in developing countries of Africa is highly unreliable and characterized by
acute power shortages and national grid connecting a small percentage of the population.
Sustainability assessment of existing SHP projects has not been critically put into consideration
resulting to inefficiency and poor performance in their later stages of the plants life cycle. Most
of the countries have a total generated capacity of less than 1000MW against increasing
electricity high demands (Kaunda, Cuthbert, & Torbjorn, 2012). The major weakness
encountered by most micro-hydro schemes in developing countries is very low load factor, often
less than 25%.
Kerosene lamps are majorly used for lighting in areas without access to electricity. The main
demand for electricity in rural communities is lighting which accounts for about two hours in the
morning and three to four hours at night. The overall load on the generator only reach its design
capacity over this period. The demand for power for the rest of 18 hours a day is very small.
Utilization requires improvement to balance energy demand during peak and low peak as well as
to accommodate increasing energy needs for efficient utilization of generated power.
In Kenya, micro hydropower has been commonly used in the past decade to generate electricity
in communities for domestic, hospitals and other small scale services. However, these projects
have experienced major problems due to lack of future demand projections leading to conflict
with current increase in electricity demands. Secondly, most of the projects are now viewed to be
of little use because the national grid has currently reached some rural region. Thirdly, some

34
projects collapsed and abandoned due to lack of efficient maintenance and thus the community
perceives them to be ineffective.
This research assesses the sustainability of micro hydropower plant projects installed for rural
electrification using a set of energy indicators for sustainable development. Assessment was
done by conducting case studies of several micro hydropower projects in different regions of
Kenya. In the research the performance of the plant was assessed as well as the economic, social
and environmental impacts of the project to the region.
1.5 Research Questions
1. What are the main challenges to sustainability of community-based micro hydropower
projects?
2. How does the sustainability of private hydropower plants compare to that of community-
owned plants?
3. Is hydropower more sustainable than other renewable technologies available for
electricity access in remote areas?
1.6 Objectives
i. To develop a suitable model of energy indicators for assessing sustainability of micro
hydropower projects in Kenya.
ii. To assess and rank sustainability of Kenyan community micro hydropower projects in
comparison to private hydropower projects.

35
iii. To compare the sustainability results of micro hydropower plant to those of other
available renewable energy technologies for rural electricity access: Solar Home System
(SHS).
1.7 Hypothesis
Micro hydropower projects provide the most sustainable renewable energy technology for
electricity access to remote communities when properly maintained.
1.8 Scope of study
This research investigates sustainability of community micro hydropower projects in Kenya
based on open ended interviews. The study first reviews the Kenyan energy situation and the
renewable energy potential with main focus in hydropower technology on sustainability concept.
The literature review includes study analysis of major sustainability assessment models that have
been developed by various organizations and individual authors. In the methodology, a suitable
sustainability model for assessing community based energy systems was developed. The model
was then applied assess the sustainability MHP projects and a SHS.
The areas of study included eight hydropower sites, six of which are community based MHP
projects, and two private owned hydropower plants. The selection of the sites was on location
bases so as to cover each potential region of the country. MHP plants are mainly concentrated in
the central province, eastern province and some parts of the Riftvalley province in Kenya. The
study was focused on these three regions with a pilot study on Tngu-Kabiri MHP project. One
PV solar home system was also evaluated to help compare the results of sustainability to those of
MHP projects.

36
1.9 Need for sustainability in hydropower projects in Kenya
Kenyan energy sector is characterized by heavy petroleum import and overdependence in
biomass (wood fuel). In 2008 alone, oil import accounted for 55% of the country’s foreign
exchange from imports (Kiplagat, Wanga, & Li, 2011). Currently there is tremendous land
degradation due to pressure on forest and stock vegetation in quest for wood fuel. There is huge
potential to develop and harness energy from available renewable resources in a sustainable way
to save on import cost as well as the environment. This will involve participation of private
sector as well as the government and communities to work together towards a sustainable future.
Sustainable growth for economic development requires combination of reliable energy input
from all available resources. These resource harnessing systems should maintain a balanced
ecosystem during exploitation and energy use. The development trend for SHP in Kenya shows
that the technology is in its growth stage hence there is essential need to ascertain that the
systems are sustainable. This will save the environment and also the cost of generating energy by
considering expectations for new energy options as well as existing plants.
Large hydropower generation in Kenya contribute to 30% of electricity demanded. The
hydropower plants are concentrated on the eastern part of the country which is far away from the
load centers. The transmission lines are long and huge losses are incurred in T&D of electricity.
Such plants are further criticized on sustainability basis due their advance environmental and
social impacts such as:
- Resettlement and migration of affected population
- Building of large dams to create reservoirs
- Disrupting cultural activities of habitants such as fishing
- Deposition of silt in rivers
37
- Emission of GHG from the reservoirs
- Disruption of hydrology down the river
Currently Kenyan large hydropower plants are highly susceptible to seasonal variation of water
levels in rivers and reduction in reservoir capacities due to siltation. Most of the plants have their
capacities reduced by more than half in dry seasons leaving most part of the country in darkness
(Kiplagat, Wanga, & Li, 2011). For sustainability this calls for improvement of the technology to
maximize energy harnessing and environmental goals to help curb climate change. Large
hydropower is still economically viable for African countries. However, sustainability to balance
ecosystem and social factors has to be carefully put into consideration. This will require policies
and regulation for exploitation of resources to avoid conflicting with international laws.
Development of SHP has gained acceptance on sustainability basis, the plants are considered to
be sustainable ecologically, environmentally and economically. However, this does not mean
that there are no efforts required to monitor their sustainability. There is need for their
continuous evaluation and monitoring in all the phases of: potential assessment for new hydro
options, assessment of new plant and assessment of performance of existing plant (International
Hydropower Association, 2006). Sustainability assessment helps to review whether the plant is
functioning without compromising the comfort of the society and the environment. The results
may establish if there is need to chance or upgrade the existing technology to match
sustainability requirements.
According to the best practice for sustainable development of micro hydropower in developing
countries, 2000 report, promoters of these types of projects only justify the success based on
social justice, quality of life to marginalized people and to the environment. The report indicates

38
that there is lack of documented information on; capital and operation costs or cash flow returns
on the investments that could be reliable for potential investors and financial institutions. These
facts reveal micro hydropower projects to lack or have limited sustainability especially those
implemented for community development.
Kenya SHP development is in the growth stage, most micro hydropower projects have sprout up
within the last decade. This brings the need to assess their sustainability to ensure proposed, new
and existing plants conform to sustainability goals to maximize utilization as well as to cater for
future needs. The main challenge facing existing SHP in Kenya is the abandonment of the
project when the grid electricity finally reaches the location. Secondly there have been conflicts
within the community causing some people to leave the project. Lastly some projects have failed
due to lack of proper maintenance and the community lender them non-performing due to lack of
proper knowledge. Continuous sustainability assessment of these projects would help eradicate
these problems. The management can be advised on areas to adjust for smooth running of the
project as per installation expectations.
The need for continuous evaluation of performance and assessment of MHP projects
sustainability can be presented as a SWOT analysis as shown in the figure below.
Table 3: Micro hydropower SWOT analysis
Strength
- Mature technology
- Cost effective; capital cost, O&M costs
- Environmental friendly
- Long lifespan
- Favorable financial support: NGO funding
Opportunities
- Enormous potential
- Attractive for rural electrification
- Favorable for; Micro-grid, smart-grid
- Favorable Kenyan policies for MHP development
Energy Act 2006 and feed in tariff 2008)
Weakness
- Under exploited resource (only 30%)
- Low conversion efficiencies 50%
- Low load factor; Majorly used for lighting
- Lack of preservation and conservation measures
- Lack of documentation; performance, economic analysis,
data.
Threats
- Abandonment due to arrival of national grid
- Poor monitoring, maintenance and repair by community
leading to project failure
- Communal conflicts
- Increasing demand due to increasing needs and
population

39
From the above SWOT analysis, it is evident that there is need for sustainability assessment and
intervention mainly in; social, economic and technical dimensions for the community projects to
function smoothly. Sustainability assessment is a necessity in all stages of a project, feasibility,
implementation, operation and monitoring. Sustainability is a tool for all the stakeholders
involved not only to management since these are community based projects and the local
inhabitants have a great role in the project. They need to understand how the project runs and
what is expected of them for smooth performance.

40
CHAPTER TWO
2.0 LITERATURE REVIEW
Energy is the central factor for achievement of sustainable development. Current patterns of
energy generation, transmission, distribution and utilization are unsustainable (UNDP, 2004).
Renewable Energy Systems (RES) have low environmental pollution and are considered as a
criterion to mitigate climate change. RES are sustainable compared to conventional energy
systems in terms of environmental consideration as well as their ability to be decentralized for
rural energy supply.
According to the UNDP 2004 report, to supply reliable and affordable modern energy services to
a third of the global population that lacks electricity access, new measures have to be enacted.
The measures should address; energy efficiency, use of renewable energy, regional and
international cooperation, and use of appropriate technology in various locations. These
measures guide nation’s development towards sustainable energy supply however the challenge
lies in assessing the sustainability of the systems.
Indicators for sustainable development were recognized by Earth Summit, 1992. Countries were
urged to develop indicators to help them evaluate their development towards sustainability.
Sustainability was thereafter given great relevance in subsequent summits mainly; the ninth
session of the Commission on Sustainable Development (CSD-9) and the World Summit on
Sustainable Development (WSSD) in 2002. Since 1999 International Atomic Energy Agency
(IAEA) developed energy indicators for sustainable development. In 2002, IAEA was
recognized as the initiative official partnership of WSSD. Many countries and organizations have

41
adopted these indicators or developed their own based on the IAEA indicators to assess their
progress.
Energy indicators are not just statistics, they provide deeper understanding of an existing
relationship between the; environment, ecology and economy that may not be evident in simple
terms (Ivan & Lucille, 2006). Indicators provide a clear picture of a whole system and its
linkage with other aspects. They help policy and decision makers to evaluate the system and its
implications over a period of time to ascertain if it is worth to undertake or reject it.
In this paper sustainability is the ability of a hydropower plant to maintain its designed operation
and provide projected services and benefits throughout its life span.
For a technology to be sustainable it should fulfill the following objectives of sustainable energy
development (Surekha, Sinha, & Inamdar, 2005).
Contribute to economic growth of the region by enhancing trade and creating
employment;
Be cost effective on basis of: fuel cost reduction, cost of technology development,
transmission cost and cost of capacity building;
Ensure security of energy supply for current and future needs;
Have maximum efficiency of utilization and focus on renewable energy;
Promote energy conservation at generation and by end user;
Maintain local ecosystem quality and minimize greenhouse emissions and other
pollutants;
Be acceptable to the community, enhance unity and improve the population’s standard of
living.

42
2.1 Sustainability Indicators Models
Over the years since sustainable development became a global goal every sector of development
is now driven towards implementing sustainable system. Sustainability currently directs future
investments, policy development, funds allocation and private sector participation. In energy
sector and systems it is now a norm to use sustainable indicators to assess the impacts of each
stage of the supply chain cycles either on; environment, social, technical and economic aspect.
Several models on how to assess sustainability of various systems have emerged based on
different organizations, institutions, authors and countries. However, no given set of energy
indicators can be taken as definite and final. The models are based on development of
sustainable, affordable and reliable energy services based on given sets of dimensions.
This chapter reviewed the available models of Energy Indicators for Sustainable Development
(EISD) highlighting their dimensions, strengths and drawbacks. Finally a model was developed
with suitable indicators for assessing sustainability of micro hydropower plants.
2.1.1 Energy Indicators for Sustainable development (EISD) Model
This model was developed by International Atomic Energy Agency (IAEA) and adapted by the
world summit on sustainable development in 2002 as a guide for sustainable assessment.
According to this model for an energy system to achieve sustainability, continuous monitoring of
impacts towards development is compulsory. It is of great help in evaluating whether the system
is contributing towards sustainable development or it should be adjusted. Energy indicators were
thus developed as guidelines for addressing issues within three major dimensions of sustainable
development (IAEA, 2005). These energy indicators guide policy makers on key issues such as:

43
i. Know countries current status concerning energy and economic sustainability: what
needs to be improved and how,
ii. Understand the implications of selected energy, environmental and economic choices,
policies and plans and their contributions towards sustainable development,
iii. Know the methods for measuring effects of energy use on human health, society, soil and
water,
iv. Determine whether current energy use is sustainable or not.
IAEA provides 30 EISD based on three pillar dimension (economic, social and environmental)
and classified into seven themes and 19 sub-themes. Each indicator was derived from the sub-
theme and it expressed aspect of energy production and use. The themes and sub-themes as
shown on table 4 below:
Table 4: IAEA energy indicators model
Dimension Theme Sub-themes
Social Equity Affordability
accessibility
disparities
Health Safety
Economic Energy use and
production patterns
Overall use
overall productivity
supply efficiency
production
end use
fuel mix
prices
Security Imports
strategic fuel stocks
Environmental Atmosphere Climate change
air quality
Water Water quality
Soil Soil quality
Forests
solid waste generation and management (IAEA, 2005)

44
The main advantage of the energy indicators provided by IAEA is that they are suitable for
assessing energy systems and tracking their progress towards national or institutional goals. They
are suitable for policymakers and help them to determine if current energy systems are
sustainable or there is need to change the technology. The main setback of these indicators is that
they are complex, difficult to interpret and do not provide concise general overview of a system
behavior (Angelis & Arampatzis, n.d).
2.1.2 UK Energy sector indicators model
This model was developed by United Kingdom statistics authority to evaluate energy use, and
supply, emissions, fuel prices, fuel poverty and competition. The indicators model was based on
four dimensions from which eleven sub-groups are formed. These indicators help to develop
statistics that; meet identified user needs, are well explained and accessible and objective for
public interest (UK/DECC, 2014). The categories and sub-groups are as indicated in the table 5
below:
Table 5: U.K energy sector indicators model
Dimension Sub-group
Economic indicators Energy in the economy; investment and productivity
Reliable supply of energy Resources
Energy intensity
Capacity utilization
International comparisons of energy productivity and use
Energy prices and competition Fuel prices( industrial, and oil & petroleum
Competition in energy market
Fuel prices (domestic)
Environmental objectives Conversion efficiencies
Energy use indicators
Energy and the environment
(UK/DECC, 2014)

45
The main advantage of this model is that it clearly gives a wide range of data required to provide
a snapshot of the energy sector/system under investigation. Data for the energy system can be
easily computed to give statistics based on the indicators. However, this can be a great challenge
in nations that have inadequate data of energy systems. Full potential of most developing
countries is an estimate and lack of data especially in Africa limits application of the model. The
model also lacked clear indicators to show relationship between the energy systems and the
society and how poverty eradication can be assessed by the model.
2.1.3 Sustainable energy indicators for renewable energy systems
This model was developed by Annette Evans, Vladimir Strezov and Tim J. Evans in 2008 for
assessing sustainability of renewable energy systems. The model used a range of indicators that
the authors found to be important for evaluating energy generation technologies. It used six
dimensions based on how; environmental, human social and economic aspects are impacted by
the choice of production method (Annette, Vladimir, & Tim, 2008).
This model’s indicators for sustainability assessment are listed below;
o Price of electricity generation unit
o Greenhouse gas emission
o Efficiency of energy transformation
o Land use requirement
o Water consumption
o Social impacts; acceptability of technology, human risk and consequences

46
The authors used the indicators on each renewable energy technology assigning the indicators
equal importance. From the evaluation, wind power was the most sustainable followed by
hydropower, solar PV and then Geothermal.
The model was simple and suitable for assessing and ranking different technologies as well as
different projects of the same technology. However, the model was mainly focused on energy
generation and did not constitute energy use, end use or supply efficiencies which are key factors
in an energy cycle.
2.1.4 Sustainable energy policy indicators
This framework model was developed to propose clear and operational indicators for policy
makers, analysts and citizens to assess sustainability (Konstantinos, Haris, Argyris, & John,
2007). According to the authors, for a given model to be suitable it should fulfill following
objectives;
o Appropriateness; realistic description, transparency, simplicity and ability of comparison,
o Completeness; technical and scientific adequacy, international acknowledgement,
o Flexibility; ease of calculation, existence of right quality data, ability of mapping changes
and ease of connecting with other models.
The framework provides three main dimensions using the above set of objectives as the section
criteria for the indicators. The three dimensions are; security of energy supply, competitive
energy market and environmental protection. These dimensions and the indicators are grouped as
shown on table 6 below;
Table 6: sustainable energy policy indicators model
Security of energy supply Dependence on imports
Competitive energy market Energy intensity

47
Dependence on imports of solid fuels
Dependence on imports of oil
Dependence on imports of natural gas
Differentiation of primary fuel
Differentiation of fuel of electrical energy production
Differentiation of energy fuel
Strategic oil supply
Efficiency of energy conversion
Efficiency of electrical energy production
Transformation of energy sector
Level of competition
Per capital energy consumption
Per capita electrical energy consumption
Environmental protection Percentage of renewable energy source in primary energy production Percentage of renewable energy source in primary electrical energy production
Intensity of Co2 emitted
Application of Kyoto protocol
(Konstantinos, Haris, Argyris, & John, 2007)
The model presented variables that were easy to measure and weigh especially when comparing
projects in different regions. It however did not provide detailed criteria to evaluate the economic
value of the systems such as the cost of energy and the social benefits generated by the system.
2.1.5 Sustainability in hydropower development
This model was developed to evaluate to assess the sustainability of three hydropower projects in
a case study in China. The authors; Jian, Zuo, Zhiyu, Goerge, and Chen applied the protocol
developed by the International Hydropower Association as a guide to assess the social, economic
and environmental impacts of hydropower in China.
The sustainability indicators criteria used in the framework is sown on table 7 below;
Table 7: Sustainability indicators model (India)
Social
Reduce poverty and enhance quality of life
Equitable distribution of benefits of project
Effectiveness and ongoing compensatory and benefits
Public health
Impact of displacement on individual and community
Community acceptance
Protection of cultural heritage
Economical
Capital cost and recurrent costs
Savings on GHG emission and improved air quality
Payback period
Environmental
Air and water quality
Waste management
Sediment and transport emission
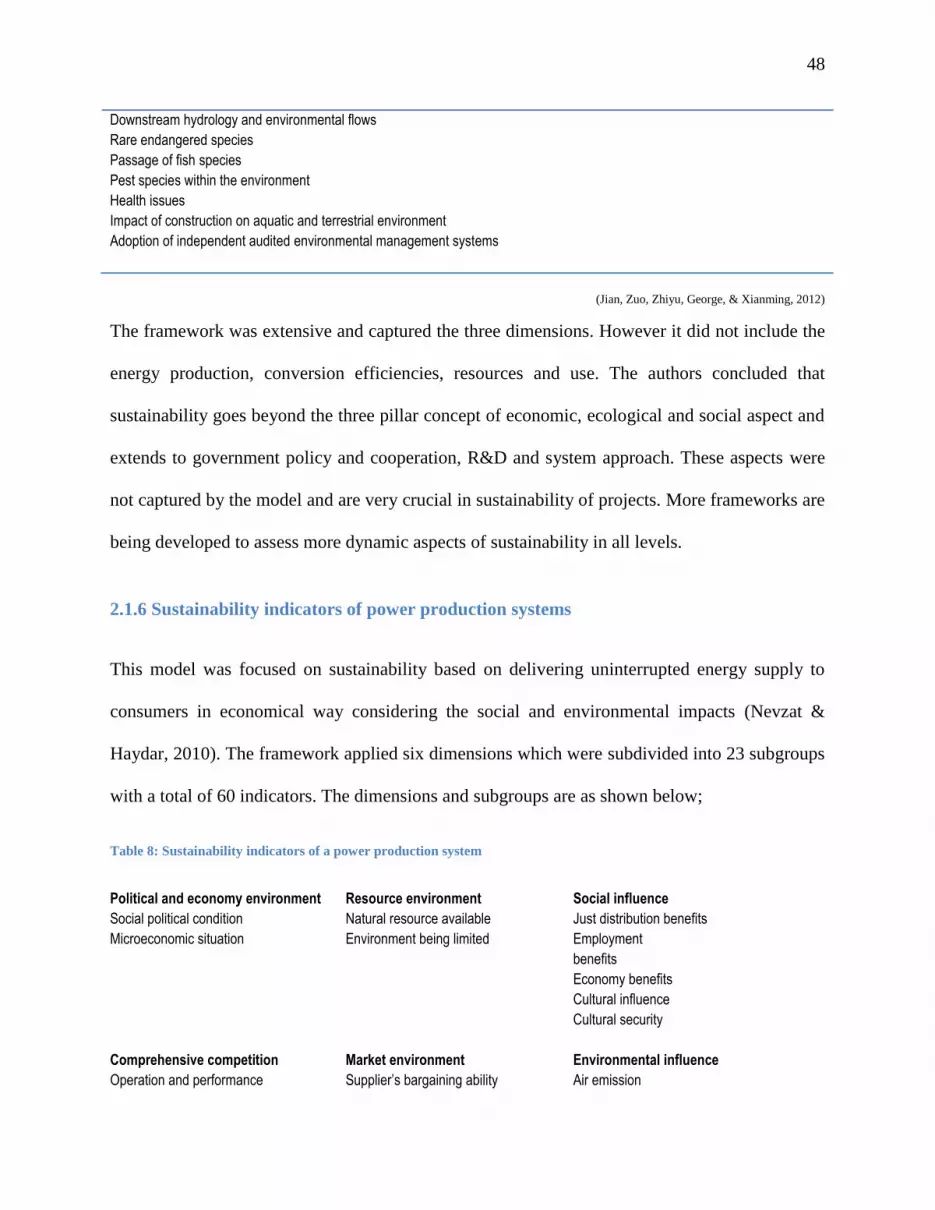
48
Downstream hydrology and environmental flows
Rare endangered species
Passage of fish species
Pest species within the environment
Health issues
Impact of construction on aquatic and terrestrial environment
Adoption of independent audited environmental management systems
(Jian, Zuo, Zhiyu, George, & Xianming, 2012)
The framework was extensive and captured the three dimensions. However it did not include the
energy production, conversion efficiencies, resources and use. The authors concluded that
sustainability goes beyond the three pillar concept of economic, ecological and social aspect and
extends to government policy and cooperation, R&D and system approach. These aspects were
not captured by the model and are very crucial in sustainability of projects. More frameworks are
being developed to assess more dynamic aspects of sustainability in all levels.
2.1.6 Sustainability indicators of power production systems
This model was focused on sustainability based on delivering uninterrupted energy supply to
consumers in economical way considering the social and environmental impacts (Nevzat &
Haydar, 2010). The framework applied six dimensions which were subdivided into 23 subgroups
with a total of 60 indicators. The dimensions and subgroups are as shown below;
Table 8: Sustainability indicators of a power production system
Political and economy environment
Social political condition
Microeconomic situation
Resource environment
Natural resource available
Environment being limited
Social influence
Just distribution benefits
Employment
benefits
Economy benefits
Cultural influence
Cultural security
Comprehensive competition
Operation and performance
Market environment
Supplier’s bargaining ability
Environmental influence
Air emission

49
Technical level
Human resource
Technical innovation
management
Buyer’s bargaining ability
Competition from industries
Threats from substitutes
Solid waste
Water pollution
Noise pollution
Ecological impact
(Nevzat & Haydar, 2010)
The model was exclusive and captured all the dimensions from; political, economic, technical,
environmental, and social to market. It was business oriented and suitable for assessing profit
gain from a given energy system and hence its contribution towards economic development.
However, the model did not account for follow-up on energy use by the end user which is
essential for a community set up.
2.2 Related research
Various researches have been done worldwide to evaluate sustainability of hydropower projects.
Many authors have examined such projects based on their models to highlight the projects
benefits as well as their shortcoming.
Dwarika Adhikari, 2011 assessed the sustainability of micro hydropower plants in Nepal where
such projects are economical for rural energy access. In his research he adapted the International
Hydropower Association (IHA) guidelines for hydropower sustainability assessment. In his
findings, the hydropower assessment scored 3.61, which indicated that the plants were at a
sustainable level however, good governance and political backing would help improve the
sustainability score. His research provided an insight of how to evaluate sustainability using IHA
guidelines.
In 2009, Shradha Upadhuyay evaluated the effectiveness of micro hydropower projects in Nepal.
In his research he developed a model of 20 indicators that were used to evaluate and compare
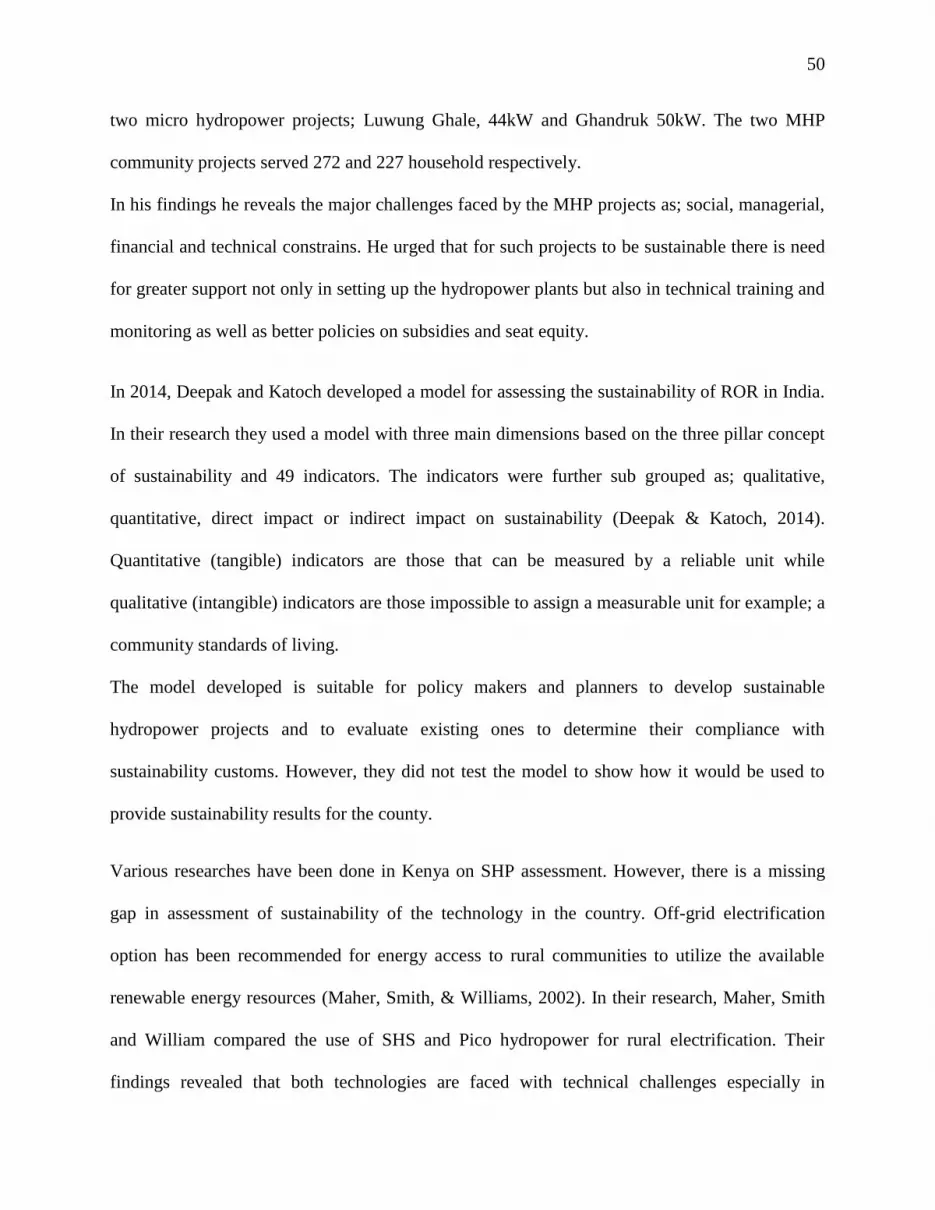
50
two micro hydropower projects; Luwung Ghale, 44kW and Ghandruk 50kW. The two MHP
community projects served 272 and 227 household respectively.
In his findings he reveals the major challenges faced by the MHP projects as; social, managerial,
financial and technical constrains. He urged that for such projects to be sustainable there is need
for greater support not only in setting up the hydropower plants but also in technical training and
monitoring as well as better policies on subsidies and seat equity.
In 2014, Deepak and Katoch developed a model for assessing the sustainability of ROR in India.
In their research they used a model with three main dimensions based on the three pillar concept
of sustainability and 49 indicators. The indicators were further sub grouped as; qualitative,
quantitative, direct impact or indirect impact on sustainability (Deepak & Katoch, 2014).
Quantitative (tangible) indicators are those that can be measured by a reliable unit while
qualitative (intangible) indicators are those impossible to assign a measurable unit for example; a
community standards of living.
The model developed is suitable for policy makers and planners to develop sustainable
hydropower projects and to evaluate existing ones to determine their compliance with
sustainability customs. However, they did not test the model to show how it would be used to
provide sustainability results for the county.
Various researches have been done in Kenya on SHP assessment. However, there is a missing
gap in assessment of sustainability of the technology in the country. Off-grid electrification
option has been recommended for energy access to rural communities to utilize the available
renewable energy resources (Maher, Smith, & Williams, 2002). In their research, Maher, Smith
and William compared the use of SHS and Pico hydropower for rural electrification. Their
findings revealed that both technologies are faced with technical challenges especially in

51
installation and choice of appropriate design. Use of Pico hydropower was preferred to use of
SHS mainly on economic analysis and due to cloud cover in mountainous regions. This research
revealed the point of weakness in design of these two technologies and the best way to
implement them.

52
CHAPTER THREE
3.0 METHODOLOGY
In sustainability, assessment is the act of evaluating and rating an analysis of; needs, system and
impacts. This is however faced with many challenges mainly because sustainability itself cannot
be a direct measure and the approaches used differ from one institution to another. This chapter
assesses the sustainability of community based micro hydropower projects implemented for
electricity access. The sustainability evaluation is mainly based on the effectiveness of the power
plant to generate reliable and affordable energy and energy services for improved social
standards and environmental protection.
This study adopted descriptive research methodology in that quantifiable data was collected
using closed ended questionnaires. It reviewed and measured the strength of selected micro
hydropower projects to understand the trend and progress of such technologies. The research is
of great help to organizations that mainly fund such community based project since it provides
insightful information on progress and significance of the projects to rural communities.
The research aimed at evaluating the sustainability of micro power plants using a sustainability
indicators framework developed by selecting and combining most suitable indicators from
different authors. The model developed was mainly guided by the three pillar concept of
sustainability and some measurable indicators that evaluate the performance of the energy
system. The results of the micro hydropower projects sustainability were then compared to those
of solar home system used for rural energy access.

53
Various approaches were applied in the evaluation. The main approach that was taken in this
research was the three pillar concept of sustainability that assessed the projects based on;
ecological, social and economic criteria. The concept applied both quantitative (tangible) and
qualitative (non-tangible) analysis. The quantitative indicators are measurable by a reliable unit,
for example power plant capacity or energy generated. On the other hand qualitative indicators
are impossible to define or measure by a reliable unit for example, living standard of a
community and visual impact (Deepak & Katoch, 2014).
The IHA provided a set of guidelines for assessing sustainability of new energy supply options,
new and existing hydro projects in regards to economic, social and environmental aspects
(International Hydropower Association, 2006). The three dimensions were sub grouped into 20
aspects that are used to assess and rank sustainability of hydropower projects. The aspects for
assessing a new hydro project are presented on the table below:
Table 9: International Hydropower Association indicators model
No. aspect No. aspect
A1 Political risk and regulatory approval A11 safety
A2 Economic viability A12 cultural heritage
A3 Additional benefits A13 Environmental impact assessment and management
planning
A4 Planned operational efficiency and
reliability
A14 Threshold and cumulative social and environmental
impacts
A5 Project management plan A15 Construction and associated infrastructure impacts
A6 Site selection and design optimization A16 Land management and rehabilitation
A7 Community and stakeholders consultation
and supply
A17 aquatic biodiversity
A8 Social impact assessment and
management plan
A18 Environmental flows and impact management
A9 Predicted severity of social and economic
impact on directly affected stakeholders
A19 Reservoir and downstream sedimentation and erosion risk
A10 Enhancement of public health and
minimization of public health risks
A20 Water quality
(International Hydropower Association, 2006)

54
This guide helps individuals/members to assess sustainability by ranking performance against
criteria developed by IHA. The assessment relies on objective evidence score portrayed by
hydropower system against each of these 20 aspects as recommended by IHA.
3.1 Proposed framework
The model applied for assessment in this research consisted of five main dimensions namely;
economic, social, environmental, market and technical. The dimensions were then sub grouped
to form 23 main sub-dimensions from which 66 indicators were developed to assess the
sustainability of the energy projects. The aim of developing the model was to come up with a
framework that could be used to assess hydropower plants and at the same time applicable for
comparison with solar home system or any other renewable energy technology.
It was a combination of suitable dimensions and sub dimensions from international models and
individual author’s models to develop a framework that was easy to apply and understand. The
framework is presented on the table 10 below;
55
Table 10: Proposed Indicator Model
The model was presented as an umbrella for indicators used to access sustainability of an energy
system. The framework was developed from a combination of dimensions and sub-dimensions
from models previously discussed in chapter two of this research since no single model was
suitable for the assessment on its own. The selection of the indicators was guided by the
suitability for community based projects evaluation in remote areas and the projected energy
accessibility and use. The main aim of the choice of dimensions and the indicators was to
develop a model that was focused on all essential factors of sustainable energy generation
systems for renewable energy exploitation following IHA guidelines. Therefore, the model can
be used to evaluate other energy systems such as; solar, wind, geothermal and bioenergy
technologies for comparison.
SUSTAINABILITY INDICATOR MODEL FOR A
SUSTAINABLE ENERGY PROJECT
Technical
-Demonstrated technical success
-capacity utilization
-Operation and performance
-Technology transfer; capacity building
Environmental
-Intensity of co2 emitted
-Ecosystem integration and land use requirements
-Impact of construction on aquatic and terrestrial environment
-Waste generation
Market analysis
-Competitive advantage over other technologies
-Transformation of community and energy sector
Economic
-Availability of the resource
-Cost of generated electricity
-Project lifespan
-Additional benefits (microeconomic environment)
-Policies and regulatory approval
Social
-Affordability
-Accessibility
-Social impact; acceptability
-Poverty reduction; enhancement of quality of life
-Energy use and user conservation

56
Economic dimension;
This dimension assessed the development progress of the community as a result of the project
implementation. For continuous economic development was the key indicator of sustainability.
In this research the monetary benefits generated by the project were evaluated by calculating
returns on electricity and other business developed by the energy project.
the project financial analysis were evaluated using deterministic approach that relies on data
collected on the market and discounted cash flow rates (Cunha & Paula, 2014). The analysis
were used to determine the Levelized Cost of Electricity (LCOE), payback period and cost
benefit ratio of the micro hydropower project using MS. Excel sheet.
Social dimension
This dimension assessed the community wellbeing as a result of how the habitants benefit from
access to modern energy services provided by the hydropower project. This dimension is not
measurable and hence it is reliant on the population view point and can be biased. It looked into
community quality of life transformation, acceptability of the project, equity of energy services
and the affordability of the services. For sustainability the society has to feel connected to the
energy projects and the project to run smoothly by upholding the cultural heritage of
communities and without any conflicts.
Livelihood approach analysis was used to determine the effects of electricity on the community’s
households and living standards. The approach relied on the community diversification
improvement base on asset acquisition. For example; buying television set, entrepreneurship
enhancement (like hair styling), employment creation and development of infrastructures.

57
Impact on education was also be used to assess the social development of the region; it reviewed
how much the project had enhanced education standards of the students. Contribution of the
project to gender equality was also assessed on the basis of how the girl child livelihood was
enhanced by electricity access.
Environmental dimensions
This dimension was based on ability of the energy generating system and utilization to uphold
the environmental without or with minimal pollution. Is assessed the co-existence of the system
with the ecosystem and mainly on; GHG emission, the impact of construction on habitants and
organisms, and waste generation and disposal. The environmental dimension was very crucial to
sustainability since it is the factor that regards renewables more sustainable compared to fossil
fuels on the basis of CO2 emissions.
A sustainable hydropower energy system has to enhance the ecosystem by conserving the Fiona
and fauna and avoids tempering with the hydrology flow of the river downstream.
Technical Dimension
The indicators of this dimension evaluated the technical ability of the energy system to supply
reliable energy to the community as demanded. It is a measurable entity that assesses the plant
load factor, capacity factor, efficiency and electricity generated annually. Data of the river flow,
electricity generation, utilization and demand was essential for performance evaluation. This
enabled the management to know whether the plant is functioning as it was supposed or there
were some diagnostic problems that needed attention. The ability of the community to run the
project without external intervention was also evaluated. For a hydropower, poor technical
performance could be an indication of poor maintenance since the plants have long lifespan.

58
Market analysis
This dimension unlike the others assessed the sustainability of the project in respect to external
factors. It evaluated the competitive ability of the power production system to perform better
than other technologies available in the community. It also compared the level that the project
had elevated the community compared to the neighborhood that lacks such energy facilities. The
dimension looked into threat from other technology substitutes and how the energy project
integrated with other development programs within and outside the community. It is essential to
derive ways in which community based projects remain relevant and competitive especially
when the national grid reaches the remote areas in future. Some hydropower projects have been
faced with rejection when grid connection reach the community while some still perform better
even in presence of national grid.
3.2 Proposed sustainability indicators
The indicators developed to assess the sub-dimensions were developed based on a criterion to
ease assessment of energy systems in a rural setting. They are simple to apply and comprehend
for individuals or groups that intend to curry out sustainability studies in community based
projects. The indicators used to assess the sub-dimensions for sustainability are shown below
(Table 11).
Table 11: Proposed sustainability indicators
Economic Dimension
Sub dimension Indicator Score
Availability of the
resource
A1 Availability of the resource throughout the year (output not affected during dry
seasons)
A2 Appropriate head and design for generated electricity
A3 Plant installed capacity to generated capacity ratio
Cost of generated
electricity
A4 Capital cost and recurrent ( O&M) costs Vs. gross revenue
A5 Levelized cost of electricity (LCOE)
A6 Cost/benefit ratio
A7 Planned monitoring of project economic performance

59
A8 payback period
Ability to serve
Projected life
A9 Frequency of main components breakdown
A10 Upgrade expected within its life cycle
A11 Lifespan of major components (turbines, generators and penstock)
Additional benefits A12 Business opportunities created by the project: monthly income generated
A13 Job creation (direct and indirect employment opportunities)
A14 Additional amenities (roads, hospitals, schools)
A15 Enhancement and improvement in agriculture sector
Policies and regulatory
approval
A16 Certification of project by regulation authorities
A17 Project compatibility with laid social, environmental and energy policies 30%
Social Dimension
Sub-dimension Indicator Score
Affordability A18 Percentage of project members able to buy electricity from the project
A19 Ability of the members to pay for the monthly billing
Accessibility A20 Ease of transmitting the micro-grid to the project members
A21 Ability to extend the micro-grid to new entrants to the community
Acceptability A22 Conservation of historic and indigenous heritage values
A23 The communities will to pay for electricity consumed
A24 Stakeholders consultation, support and involvement in project activities
A25 Existence of complains and conflicts about the project by the community
Poverty reduction (
enhancement of quality
of life)
A26 Community livelihood improvement (assets: TV, radios, phones, hotels)
A27 Significant increase in public health, water quality and education
A28 Gender balance enhancement (improvement of women/girls’ life)
Energy use and user
conservation
A29 Flexibility of electricity use other than lighting
A30 Awareness of community on energy saving and conservation methods
A31 Energy saved and equity in use of energy saving bulbs and appliances 30%
Technical Dimension
Sub-dimension Indicator Score
Demonstrated technical
success
A32 Demonstrates good design of the systems: intake, penstock, powerhouse
A33 Efficiency of the machinery: turbine and generators
A34 Minimization of losses by networking assets (transmission and distribution)
Capacity utilization A35 Satisfies the energy demanded by the community (load curve)
A36 Plants capacity factor
A37 Plants utilization factor (usefulness of installed capacity)
Operation and
performance
A38 Reliability of the generated electricity (number of breakdowns in a month/year)
A39 Availability of planned maintenance program and duration of shutdown
A40 Mechanism for load control during peak and off peak demand
A41 Safety mechanism for the plant; control panel, emergency shutdown, spillways,
flood controls
Technology transfer
and capacity building
A42 Ability of the community to run the plant without external personnel intervention
A43 Planned training for plant operators
A44 Evidence of replication of project to neighboring villages
Safety issues A45 Planned compensation/mitigation program for stakeholders (flooding, accidents)
A46 Planned safety programs in consistent with national standards for; project,
personnel and assets
25%
Environmental Dimension
Sub- Dimension Indicator score
CO2 emitted A47 Total CO2 emitted annually

60
A48 Cost of CO2 credit foregone in place of fossil fuel use
Ecosystem integration
and land use
A49 Minimization of land interference by the area required for project construction
A50 Meets protection and conservation requirements to curb; soil erosion, protect river
A51 Support from community of planned environmental strategies
Impact of construction
on aquatic and
terrestrial environment
A52 Minimization of disruptions of existing features (roads, river course, displacement of
people
A53 Minimization of impact to specific values such as threated species and introduction
of pest species
Waste generation and
resource conservation
A54 Release of toxics into the river
A55 Water resource monitoring and management plan for conservation strategies 10%
Market Analysis Dimension
Sub-Dimension Indicator score
Competitive advantage
over other technologies
A56 Cost of project electricity compared to grid electricity, PV home system and biogas
powered home
A57 Availability of a cheaper electricity generating technology
A58 Cost spent by a household on lighting compared to that spent by household using
kerosene for lighting
Transformation of the
energy sector
A59 Enhanced conservation of other energy resources; biomass
A60 Enhanced developments in the community in comparison to a village without
electricity access
5%
3.3 Scoring and weighting
The rating system used in this research was an adoption of the IHA sustainability score rating.
Scoring is necessary to rate both new and existing hydropower energy systems to support
sustainability score against sustainability indicators (International Hydropower Association,
2006).
Table 12 below shows the scoring and rating scheme for the sustainability indicators that was
used in this project.

61
Table 12: Score and weighting
Score performance description
5 Strong At or very near international practice standards
Meets or exceeds objectives and measurable targets
4 very good High standard performance
Meets most objectives and measurable targets including all critical ones
3 satisfactory Essentially meets requirements of sustainable guidelines
Some non-critical gaps in meeting objectives and measurable targets
2 Less than satisfactory Gaps in meeting requirements of sustainability guidelines
Gaps in meeting objectives and measurable targets
1 poor Poor performance
Major gaps in meeting objectives and measurable targets
0 Very poor Very poor performance, failure to address fundamental issues
Fails to meet objectives and measurable targets
(International Hydropower Association, 2006)
All indicators were of equal weight and were ranked according to their descriptive performance.
For an entity that was not applicable or has no negative effect/impact in the sense that it was
compatible to the project, then it scored the full mark (5). According to IHA assessed
hydropower plants are regarded as sustainable if they score 3 or more.
The assessment was carried out by evaluating each sustainability indicator and assigning it a
score. The scoring was done by the community members as well as hydropower experts and the
results compared so as to minimize level of biasness. The community assessment was through
interviews in regard to their view and benefits from the energy system. The same sustainability
indicators were then applied to a PV solar home system. The scores were computed and the
results compared to those of the hydropower projects.
The rating of sustainability dimensions was based on a priority focus on a rural project setting.
Both economic and social dimensions were highly rated at 30% since they are very critical for
community based development projects. The projects were expected to be economically viable
and to benefit the community economically while at the same time they should be acceptable.

62
The environmental dimension was not very critical to renewable based energy systems especially
MHP which are considered to be ecofriendly. Hence, the low rating of 10% since the dimension
did not have advance impacts on the environment.
The technical dimension had a high rate of 25% since it was very essential for monitoring
performance of the project plant. Many projects have failed due to poor technical assessment
especially on maintenance. For the project to run throughout its forecasted lifespan, technical
monitoring was of essence. The market analysis dimension was a platform to check the
performance of the project against competitive supplementary energy sources. It is important to
evaluate how the technology is performing for investors as well as stakeholders. However, the
dimension did not have crucial impact to the project directly hence the low rating of 5%.

63
CHAPTER FOUR
4.0 RESULTS AND DATA ANALYSIS
This chapter provides an analysis of the sites visited during the study and the findings of the
research. A brief description of each site is provided to review the status of the plant with respect
to sustainability point of view. The MHP plants that were evaluated in this research are shown in
the table below.
Table 13: Study sites
No
.
Project
Name
Location Ownership capacity
(kW)
Household
served
Year
commissioned
1 Tungu-
Kabiri
Meru- South Community 18 Business
center
2000*
2 Ngerechi Muranga Community 5 30 2007
3 Ndiara C Muranga Community 11 70 2009
4 Kiangima Kirinyaga Community 20 24 2006
5 Kigwathi Nyeri Community 2.5 10 2009
6 Somorio Bomet 1.5 15 2007
7 Diguna Nairobi missionary 14 Workshop
8 Kaproret Kericho Finlay tea 120 Tea factory 1952
All the MHP plants were fully operational apart from Tungu-Kabiri that developed a mechanical
breakdown of the generator in 2007 and has never been repaired since then. The MHP plants fall
under the class of medium head since they have a head of above 10M but less than 50M. Such
medium head hydropower schemes have their efficiency ranging between 60% to 80% (British
Hydropower Association, 2005).

64
4.1 MHP projects information and status
Figure 12: Kaproret MHP plant
All the existing community MHP projects were mainly used for lighting and charging low
voltage appliances like; mobile phones, torched, electric lamps and computers. The projects were
wholly managed and maintained by the community. Members of the projects regarded to them as
a success since they no longer used kerosene lamps at night amongst other indirect benefits
rendered by the projects. The findings and highlights of each project are discussed below in
consideration to:
- Good design,
- Purpose,
- Technology transfer,
- Repairs and maintenance,
- Future projections for the project,
Tungu-Kabiri MHP project
This is an 18 kW project in Meru- South district. It was funded by UNIDO and Practical action
and commissioned as a pilot project for rural electrification in 2000. The project was to be

65
implemented in two phases; first phase was to supply electricity to a business center and provide
a water pumping scheme to supply water to the community. This project enabled opening of
various businesses such as battery charging, welding, hair dressing, cinema room, and water
kiosk. This phase was very successful and the project greatly influenced technology transfer of
MHP technology within the country especially in Kirinyaga County.
The first stage was completed and operational in 2000 up to 2007 when the generator broke
down due to mechanical problem and has never been repaired since then. The second phase was
to connect the micro grid to the community household. However, this phase was never
implemented and the community is still hopeful that the funding organization will still follow up
with its implementation.
Ngerechi Self-help MHP project
This project was commissioned in 2006 and was wholly funded by the project members. It is a 5
kW MHP project in Muranga serving 30 household, with a monthly flat rate tariff of 200 KSH.
Originally the project was planned to serve 60 households but most of the members could not
afford the transmission cost to their homes. The electricity generated was wholly used for
lighting; members are limited to using energy saving bulbs of between 5W to 10W. The project
is of great benefit to the community and the members regard to it as a successful story. However
the design of the intake and the penstock was not good leading to head loss hence low power
output.
Due to the significance of the project and the good maintenance, Safaricom Kenya LTD agreed
to help upgrade the project by installing a 10kW MHP project for the community. This new
project was under construction with modern design and was to be commissioned later this year.

66
With the upgraded project, the community members will be able to open some businesses and
also use the electricity to boost agriculture and fishing by storing the produce.
Ndiara MHP project
This community project was commissioned in 2009 with an installed capacity of 10kW and
generates 11 kVA. It connected to 70 household and was wholly funded by the project members.
The monthly billing was a flat rate per household of 100 KSH. The original number of members
was 150 but most could not afford the transmission cost while others left the project due to
conflicts and arrival of the national grid in the region. The main conflicts arose from power
outages in some sections of the community due to lack of enough power to serve all the project
members. Secondly, there was evident of poor maintenance of the machines leading to frequent
breakdown of the systems.
Kiangima MHP project
This is a 20 kW MHP project in Kirinyaga county that was commissioned in 2006 along river
Rutui with a head of 11M. The project was originally started by 150 members, however only 24
members are now connected to the micro grid which was a third of the total grid design. The
connected members used the electricity for lighting, ironing as well as shredding animal feeds
and pay a monthly flat rate bill of 200 KSH. The rest of the members will get connected once
they cater for their transmission costs.
The project was a success with good design and well maintained by the active members. This
project has attracted transfer of the technology to the nearby village in Kiangurwe where
construction of a 20 kW MHP project was under construction and expected to be operational
later this year.

67
Kigwathi PHP project
This project was commissioned in 2009 with an installed capacity of 2.5 kW and connected to 10
household. There were no monthly billing to the members but they are expected to contribute for
maintenance and repairs in case of a breakdown. The original number of project members was
27; most of them could not afford the transmission cost to their homes even after contributing for
the capital cost of the project. The electricity generated was used for lighting and charging low
voltage appliances such as mobile phones, radios and TV sets. The plant was well maintained
and the members were very satisfied with the project. However, the intake and the penstock were
poorly designed.
Somorio (Iria Maina) PHP project
This is a 1.5 kW project along river Itare in Bomet County funded by UNIDO and commissioned
in 2007. The micro grid was connected to 15 household with a monthly flat rate billing of 200
KSH. The electricity generated was mainly for lighting and charging low voltage appliances. The
project was successful due to the commitment of the members and the proper maintenance. The
high potential of the resource (river Itare) and the significance of this project have attracted the
funding organization to upgrade the project by installing a 200 kW plant. The new plant was
almost completed and was expected to be commissioned later in the year. In addition to lighting,
the new plant will provide a water pumping scheme and also sell the extra generated electricity
to the national grid and enable development of the community.
Private MHP projects
Diguna MHP project
This is a 14 kW MHP missionary project in Ongata Rongai – Nairobi County. The project
supplied electricity to the technical school for the orphans. It was commissioned in 1962 and the

68
systems upgraded in 2013. Electricity generated was used in the kitchen, offices and the
workshops to run the machines as well as pumping water to the institution. The technical
workshop machinery consumed a lot of electricity and the MHP enabled the institute to save on
electricity cost from the national grid. The electricity Generated by the MHP was not sufficient
for the institute consumption; some of the electricity was supplied by the national grid. The
projects future projection is to upgrade the MHP plant for more electricity generation to cater for
all the institute’s energy demands.
Most of missionary hydropower projects had this technology transfer from this project due to its
significance to the institute. The project was well maintained. However, the site was prone to
floods during the rain seasons which hinder electricity generation.
Kaproret MHP project
This is a private 120 kW projected owned by Finlay, a tea processing and packaging company.
The plant was commissioned in 1952 and has two turbine of 60 kW each. It is an old system
utilizing a flywheel for energy storage. The electricity generated was used for tea processing in
the companies factory. The plant was well maintained with planned maintenance carried out
weekly, every Monday when tea processing was not done in the factory.
This project showed significance cost cutting on grid electricity consumption and the company
installed two more hydropower plants of 800 kW and 1100 kW in the region. The three
hydropower plants supplied half of the factories electricity demand saving the company
approximately 40,000 USD on monthly basis (based on current industrial tariff of 0.15
USD/kWh). The company future projection is to eliminate use of wood fuel in steam engines by
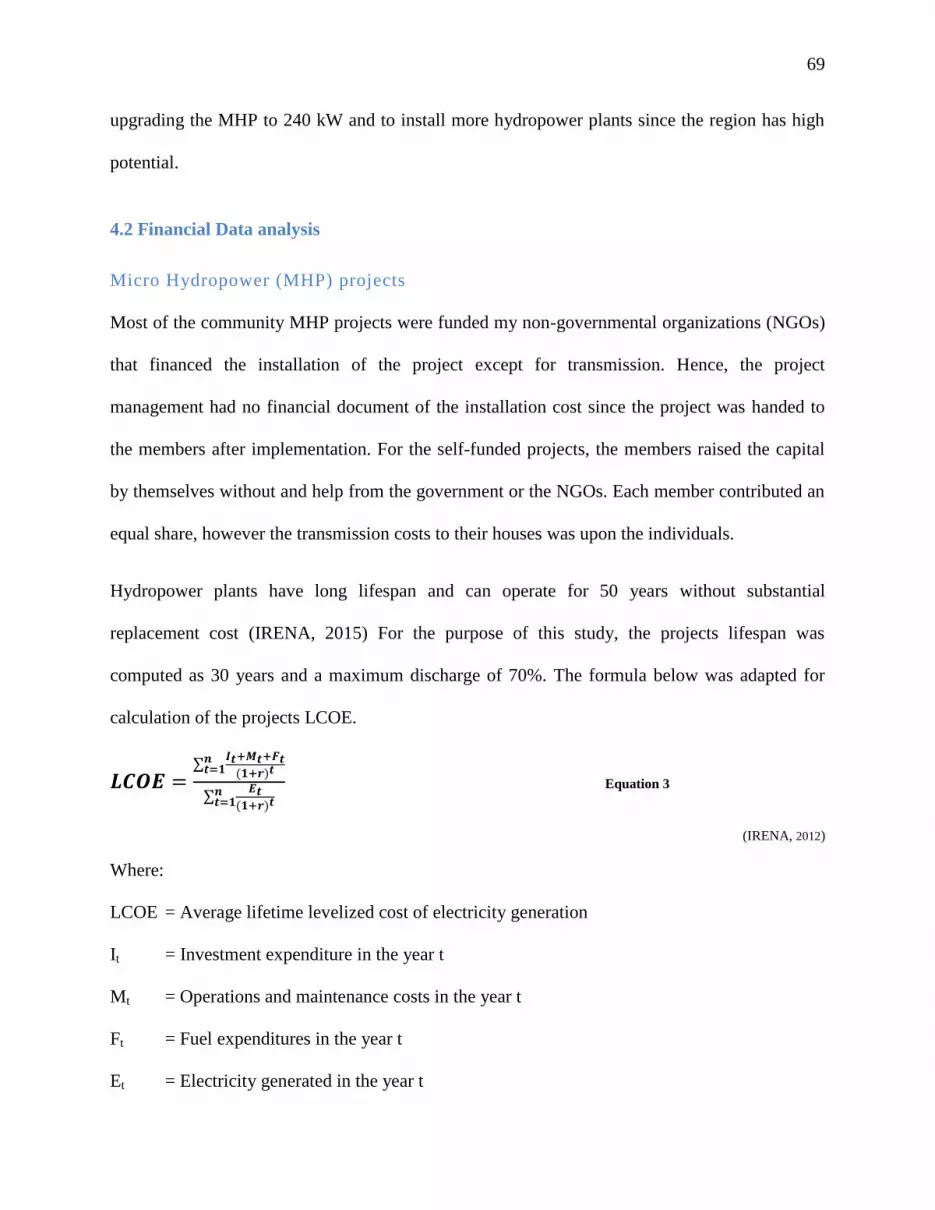
69
upgrading the MHP to 240 kW and to install more hydropower plants since the region has high
potential.
4.2 Financial Data analysis
Micro Hydropower (MHP) projects
Most of the community MHP projects were funded my non-governmental organizations (NGOs)
that financed the installation of the project except for transmission. Hence, the project
management had no financial document of the installation cost since the project was handed to
the members after implementation. For the self-funded projects, the members raised the capital
by themselves without and help from the government or the NGOs. Each member contributed an
equal share, however the transmission costs to their houses was upon the individuals.
Hydropower plants have long lifespan and can operate for 50 years without substantial
replacement cost (IRENA, 2015) For the purpose of this study, the projects lifespan was
computed as 30 years and a maximum discharge of 70%. The formula below was adapted for
calculation of the projects LCOE.
∑
∑
Equation 3
(IRENA, 2012)
Where:
LCOE = Average lifetime levelized cost of electricity generation
It = Investment expenditure in the year t
Mt = Operations and maintenance costs in the year t
Ft = Fuel expenditures in the year t
Et = Electricity generated in the year t

70
r = Discount rates
n = Economic life of the system
The MHP project had no fuel consumption expenses; hence Ft was not taken into account in this
research. The results of financial and LCOE analysis of the community MHP projects are
presented on table 14 below.
Table 14: Financial analysis sheet
MHP project name Kiangima Ndiara C Ngerechi Kigwathi Somorio
Installed capacity 20kW 10kW 5kW 2.5kW 1.5kW
Investment cost 4556000.00 3628000.00 2568000.00 765000.00 836000.00
Payback period (years) 19.9 20.4 28.8 16.0 15.3
Cost/Watt (KSH/W) 227.80 392.80 513.60 306.00 557.33
Monthly O&M costs 1440.00 1500.00 1400.00 1000.00 2400.00
LCOE (KSH/kWh) 2.99 10.56 13.51 7.36 20.25
(USD/kWh) 0.03 0.11 0.14 0.08 0.21
From the cost analysis presented on table 14, the projects were found to have a low LCOE with
an average cost of 0.12 USD/kWh. The LCOE values were within the range provided by IRENA
of 0.02USD/kWh to 0.1 USD/kWh for small plants and about 0.27 USD/kWh for pico-hydro
systems in developing countries (IRENA, 2012). The cost per watt range for SHP is 3.4 USD/W
to 10 USD/W (IRENA, 2015).
The community MHP projects had very low LCOE because the cost greatly depend on the
components cost, labor and materials. Some components like land were donated by the
community free of charge. The project members also provided labor for the project set up like
digging the channels and construction of powerhouse and the tunnels; this contributed to sweat
equity which is not paid in the country. Project members also provided posts for the transmission
lines. The O&M costs were also very low (0.95% of initial cost) as compared to value of 1-2% of
investment which was used to compute costs by the IRENA report.
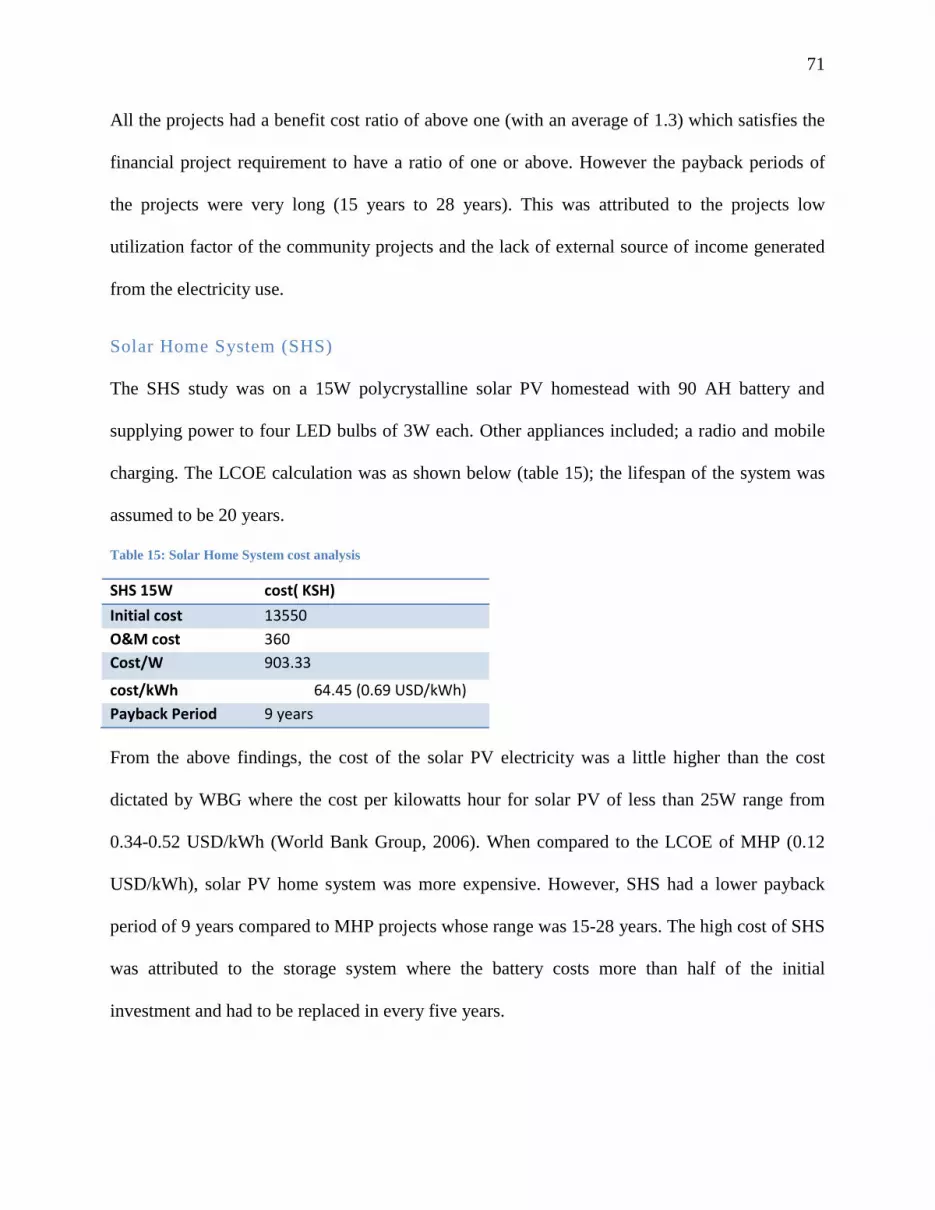
71
All the projects had a benefit cost ratio of above one (with an average of 1.3) which satisfies the
financial project requirement to have a ratio of one or above. However the payback periods of
the projects were very long (15 years to 28 years). This was attributed to the projects low
utilization factor of the community projects and the lack of external source of income generated
from the electricity use.
Solar Home System (SHS)
The SHS study was on a 15W polycrystalline solar PV homestead with 90 AH battery and
supplying power to four LED bulbs of 3W each. Other appliances included; a radio and mobile
charging. The LCOE calculation was as shown below (table 15); the lifespan of the system was
assumed to be 20 years.
Table 15: Solar Home System cost analysis
SHS 15W cost( KSH)
Initial cost 13550
O&M cost 360
Cost/W 903.33
cost/kWh 64.45 (0.69 USD/kWh)
Payback Period 9 years
From the above findings, the cost of the solar PV electricity was a little higher than the cost
dictated by WBG where the cost per kilowatts hour for solar PV of less than 25W range from
0.34-0.52 USD/kWh (World Bank Group, 2006). When compared to the LCOE of MHP (0.12
USD/kWh), solar PV home system was more expensive. However, SHS had a lower payback
period of 9 years compared to MHP projects whose range was 15-28 years. The high cost of SHS
was attributed to the storage system where the battery costs more than half of the initial
investment and had to be replaced in every five years.

72
Figure 13: Portable solar PV panel
Solar PV was however very economical for Arid and semi-Arid regions of the country where the
potential is high and the national grid was not accessible. The technology was attractive due to
availability of wide range of sizes and application. Communities without appropriate rooftops for
the installation could use portable solar PV panels which were capable of charging lamps and
mobile phones. Such communities can be energy dependent, they use wood fuel for cooking and
heating and they do without use of kerosene lamps.
4.3 Co2 analysis
In this section, CO2 reduction was analyzed as the amount foregone by eliminating use of
kerosene wick lamp. Most of the project members used Light Emitting Diode (LED) bulbs of
very low voltage (5v- 8v) for lighting. They no longer used kerosene lamps hence saving on
household expenditure where a household in Africa is estimated to spend 10-25% of monthly
budget on kerosene (n.d, 2013).
A liter of kerosene used in a kerosene wick lamp produces 2.56 kg of CO2 (WorldPress, 2016).
In this research, before the installation of the MHP plant a homestead used an average of 5 liters
of kerosene in a month which accounts for 12.8 KgCO2/Month. Therefore a plant like Ngerechi

73
which had 30 members saved 4.608tCO2/year. The negative effects of kerosene lamps were
several ranging from; CO2 emission, black carbon emission as well as health issues such as lung
diseases. MHP plants had completely eliminated use of the kerosene lamps by providing clean
light to the community.
4.4 MHP Sustainability score and ranking
The projects were ranked based on their score against each indicator of sustainable development.
Scoring was based on the interviews carried out, group discussion with members and observation
of the projects’ status. The collected data was then compiled using excel sheet for ease of
computation and ranking the projects sustainability level. The results are presented on table 16
below.
It is evident that some projects were more sustainable compared to others; all the MHP projects
were expected to operate for their entire lifespan (50 years for MHP and 20 years for SHS).
Private/industrial plants scored higher compared to community projects. Most of the MHP
projects were more sustainable in comparison to SHS. The results, findings and issues on
sustainability are discussed in details in the next chapter.

74
Table 16: Sustainability evaluation scores
No. Indicator
Hydro project evaluation Scores
Tungu-Kabiri
Ngerechi Ndiara Kiangima Kigwathi Somorio Diguna Kaproret SHS Economic dimension
1 Availability of the resource 4 4 4 4 3 5 4 4 3
3 Cost of generated electricity 4 4 4 4 4 4 4 4 3
4 Ability to serve projected lifespan 2 3 2 3 3 4 4 4 3
5 Benefits to cost ration 3 4 3 4 4 4 4 4 3
6 Additional benefits (microeconomic environment) 4 1 1 2 2 1 3 2 1
7 Policies and regulatory approval 3 3 3 3 3 3 3 3 3
Percentage financial score (30%) 20 19 17 20 19 21 22 21 16
social dimension
8 Affordability 4 4 4 4 5 4 4 4 3
9 Accessibility 2 3 2 2 3 3 4 4 4
10 Social impact; acceptability 4 5 2 4 5 4 4 3 4
11 Poverty reduction; enhancement of quality of life 4 3 3 3 3 3 3 3 3
12 Energy use and user conservation 2 2 2 2 2 2 3 4 2
Percentage social score (30%) 19.2 20.4 15.6 18 21.6 19.2 21.6 21.6 19.2
technical dimension
13 Demonstrated technical success 3 3 3 4 3 4 4 4 4
14 Capacity utilization 4 2 2 3 2 2 4 4 3
15 Operation and performance 1 4 2 3 3 4 3 4 4
16 Technology transfer; capacity building 3 2 1 1 1 2 2 2 1
17 Safety issues 2 2 2 2 2 2 3 3 3
Percentage technical score (25%) 13 13 10 13 11 14 16 17 15
environmental dimension
18 Intensity of C02 emitted 5 5 5 5 5 5 5 5 5
19 ecosystem integration and land use requirements 4 5 5 4 4 4 4 4 4
20 Impact of construction on aquatic and terrestrial environment 4 4 4 4 4 4 4 4 4
21 Waste generation 5 5 5 5 5 5 5 5 5
Percentage environmental score (10%) 9 9.5 9.5 9 9 9 9 9 9
market analysis dimension
22 Comparison with other market energy prices 4 4 4 4 4 4 4 4 3
23 Transformation of community and energy sector 2 1 1 1 1 1 2 2 1
Percentage market score (5%) 3 2.5 2.5 2.5 2.5 2.5 3 3 2
percentage score 64.2 64.4 54.6 62.5 63.1 65.7 71.6 71.6 60.7
Aggregate score 3.21 3.22 2.73 3.13 3.16 3.29 3.58 3.58 3.04
sustainability ranking 5 4 9 7 6 3 1 1 8

75
CHAPTER FIVE
5.0 DISCUSSION
This chapter discusses the sustainability of the case study MHP projects as well as the SHS. It
reveals their strengths and the missing gaps in these projects and shows how the Kenyan MHP
sustainability findings collate to previous research findings.
5.1 Sustainability level of MHP in Kenya
Figure 14: Somorio project turbines
Rural electrification utilizing MHP for micro grids is a recent technology in Kenya which started
in 2006 after policies to enable electricity generation of private/communal projects. The
community MHP projects were of significance to the community due to the benefits generated
from the projects as highlighted in this chapter. Most of these plants were materials were locally
available owing major costs to turbine and generator set as well as transmission to the
households. This rendered the technology economically viable. However, on sustainability
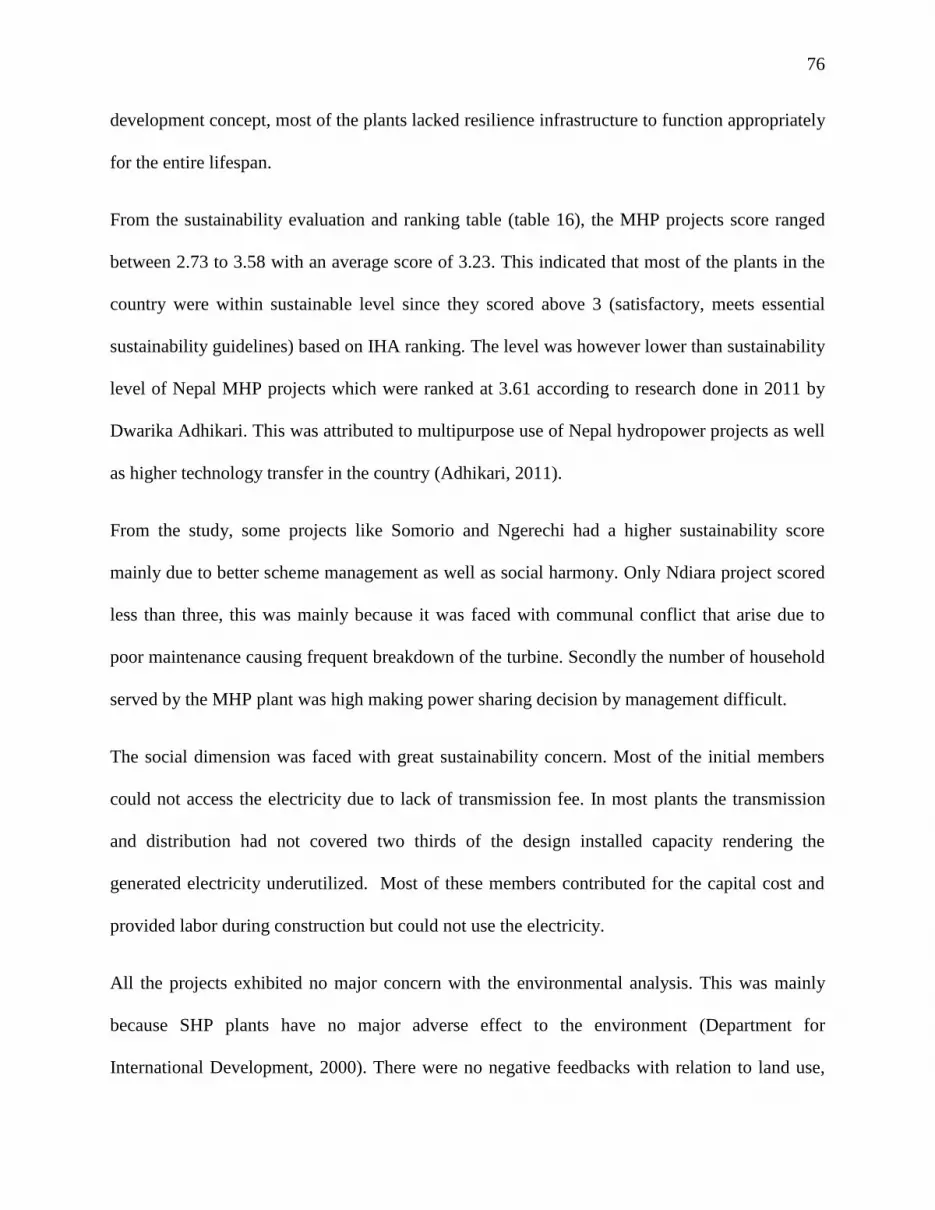
76
development concept, most of the plants lacked resilience infrastructure to function appropriately
for the entire lifespan.
From the sustainability evaluation and ranking table (table 16), the MHP projects score ranged
between 2.73 to 3.58 with an average score of 3.23. This indicated that most of the plants in the
country were within sustainable level since they scored above 3 (satisfactory, meets essential
sustainability guidelines) based on IHA ranking. The level was however lower than sustainability
level of Nepal MHP projects which were ranked at 3.61 according to research done in 2011 by
Dwarika Adhikari. This was attributed to multipurpose use of Nepal hydropower projects as well
as higher technology transfer in the country (Adhikari, 2011).
From the study, some projects like Somorio and Ngerechi had a higher sustainability score
mainly due to better scheme management as well as social harmony. Only Ndiara project scored
less than three, this was mainly because it was faced with communal conflict that arise due to
poor maintenance causing frequent breakdown of the turbine. Secondly the number of household
served by the MHP plant was high making power sharing decision by management difficult.
The social dimension was faced with great sustainability concern. Most of the initial members
could not access the electricity due to lack of transmission fee. In most plants the transmission
and distribution had not covered two thirds of the design installed capacity rendering the
generated electricity underutilized. Most of these members contributed for the capital cost and
provided labor during construction but could not use the electricity.
All the projects exhibited no major concern with the environmental analysis. This was mainly
because SHP plants have no major adverse effect to the environment (Department for
International Development, 2000). There were no negative feedbacks with relation to land use,
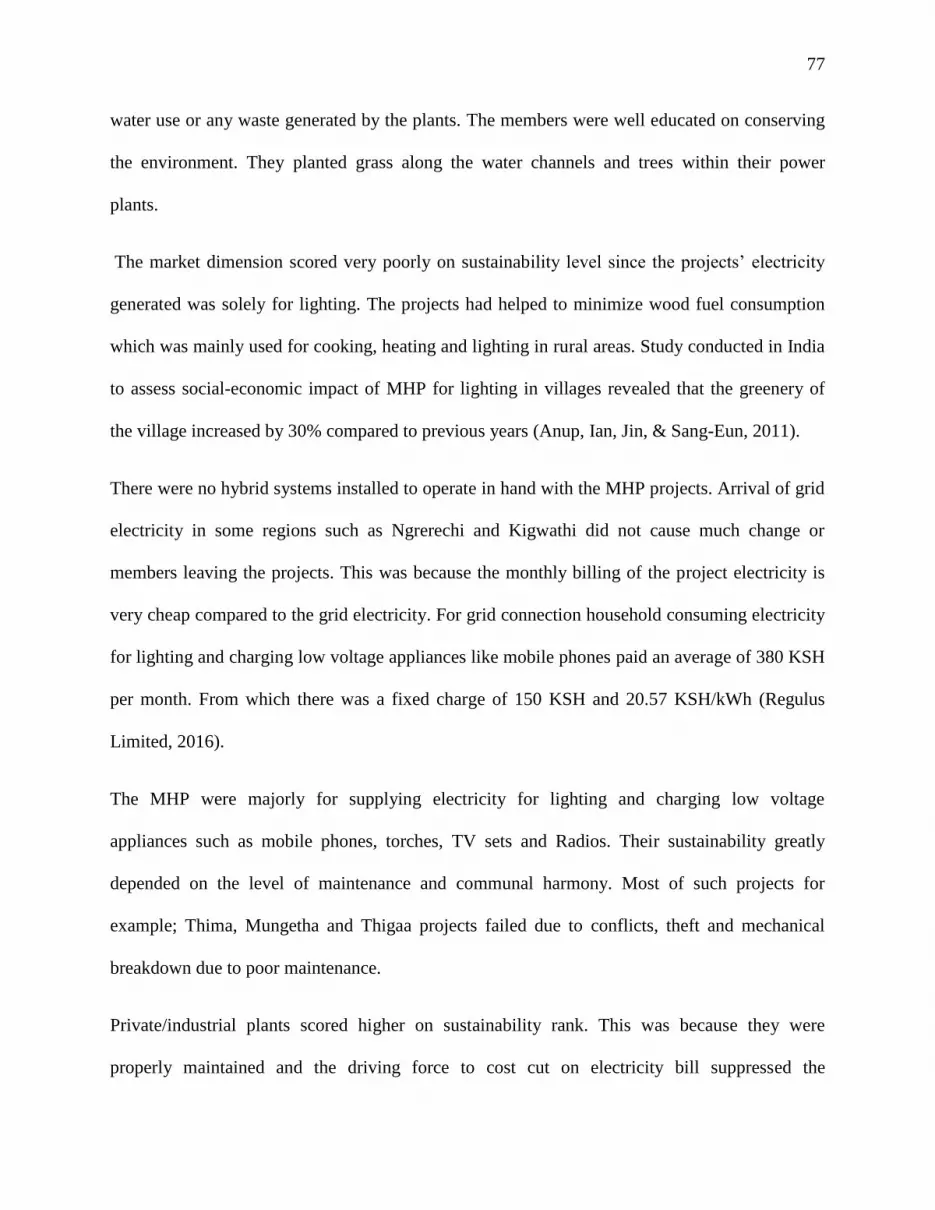
77
water use or any waste generated by the plants. The members were well educated on conserving
the environment. They planted grass along the water channels and trees within their power
plants.
The market dimension scored very poorly on sustainability level since the projects’ electricity
generated was solely for lighting. The projects had helped to minimize wood fuel consumption
which was mainly used for cooking, heating and lighting in rural areas. Study conducted in India
to assess social-economic impact of MHP for lighting in villages revealed that the greenery of
the village increased by 30% compared to previous years (Anup, Ian, Jin, & Sang-Eun, 2011).
There were no hybrid systems installed to operate in hand with the MHP projects. Arrival of grid
electricity in some regions such as Ngrerechi and Kigwathi did not cause much change or
members leaving the projects. This was because the monthly billing of the project electricity is
very cheap compared to the grid electricity. For grid connection household consuming electricity
for lighting and charging low voltage appliances like mobile phones paid an average of 380 KSH
per month. From which there was a fixed charge of 150 KSH and 20.57 KSH/kWh (Regulus
Limited, 2016).
The MHP were majorly for supplying electricity for lighting and charging low voltage
appliances such as mobile phones, torches, TV sets and Radios. Their sustainability greatly
depended on the level of maintenance and communal harmony. Most of such projects for
example; Thima, Mungetha and Thigaa projects failed due to conflicts, theft and mechanical
breakdown due to poor maintenance.
Private/industrial plants scored higher on sustainability rank. This was because they were
properly maintained and the driving force to cost cut on electricity bill suppressed the

78
communities drive to provide electricity for lighting. Secondly they had appropriate system
design and sizing of; intake, penstock and machinery enabling proper utilization of hydro
resource. The companies also have proper documentation and accountability of the project unlike
the community projects.
MHP projects were found to be more sustainable compared to solar PV home system. This was
mainly on the reliability of the electricity generated and the cost of generation. Electricity from
MHP was available throughout the year at affordable cost whereas for a solar PV home, the
battery had to be replaced after every five years. The solar PV system provided dim light and
could not charge some appliances during cloudy days of the year. Lack of proper guidance on
design and sizing of the solar PV system posed a great challenge to users; the system functioned
very well only during the sunny seasons. This perception has made many people in resource
potential areas to quit the technology on allegations of failure.
On the other hand, Solar PV home system had fewer losses since it did not require transmission.
The system was also independent of the members hence no conflicts in the community. The
technology was economic for arid and semi-arid areas where the population is sparse and
installing a grid would be expensive. The user was very satisfied with the system; the only
complains reported were poor performance on the cloudy day and the short lifespan of the
battery.
The sustainability level of the MHP projects in Kenya can be greatly improved by various
measures. First there is need for carrying out a conclusive feasibility study before
implementation of the project. The study revealed that most of the projects did not have a
conclusive financial budget covering on transmission of generated electricity. For this reason,

79
only few members could afford the transmission cost to their homes when the project was
completed.
Secondly projects should adopt appropriate designs to avoid losses such as transmission losses
and head loss. Most projects had poor transmission wire and the posts were not treated requiring
them to change them within two years of operation while on the other hand treated posts can last
more than 15 years. Third, the management needs to open up some small business opportunities
to improve on multipurpose use of generated electricity. This will generate income for the
projects as well as improve the plants load factor.
5.2 Significance of MHP to rural communities
The benefits generated by MHP projects to the community that made them attractive for rural
electrification are highlighted below.
i. Affordable access to electricity; the projects had a low LCOE and a high benefit to cost
ratio as shown in the previous chapter’s the financial analysis. The affordability of the
electricity was evident by the monthly billing as some members paid about 2USD while
some plants like Kigwathi did not charge any monthly fee to members. Before the
implementation of the project, most members used kerosene lambs spending about 5litres
a month at a total cost of about 4.5 USD.
ii. Security; members of the community felt safe when they light their homesteads at night,
most of them especially in central province reported a decrease in domestic theft cases
during the night.

80
iii. Health benefits; use of kerosene lamps had severe damage to lungs and some children
complained of eye infections when using the lamps for their studies. Accessibility to
electricity has eliminated this vice by providing clean energy to homesteads.
iv. Educational benefit; students were able to comfortably work on their homework in the
evening in the comfort of clean light.
v. Comfort and improved standard of living; members had bought TV sets and could charge
their appliances in the comfort of their homes. They were able to watch news and were
aware of what is happening and new developments.
vi. Harmony in the society; the plants have strengthened the members by uniting them to
contribute to the wellbeing of the project. They often met to discuss project issues. When
there was a breakdown they contributed for maintenance and repairs. The members also
offered security to their plant and guarded the transmission lines.
vii. Green development mechanism; some plants like Ngerechi and Somorio had attracted
NGOs that offered to fund for installation of bigger units due to the significance of the
project in the region and availability of the resource. The new plants will help in
development of the region since they are business/industry focused.
viii. Business and trade; some projects like Kigwathi supplied electricity to the tea selling
center. They were able to sell their tea late in the evening and supplied electricity to the
center office.
ix. Benefit to farming; projects with bigger capacities such as Kiangima enabled the
members to use the electricity for shredding and milling animal feedstock. The members
did not have to go to the town center and pay for those services.

81
Most of the benefits delivered by the MHP to the community were indirect benefits. The
projects have also help women and girls since they could comfortably cook late in the evening
and wake up early in the morning to prepare breakfast comfortably. The communities were
energy dependent and had owned the project since they had greatly contributed to project’s
wellbeing. Members were very positive to the success of the project and they felt honored to be
associated with the project.
5.3 Challenges facing community MHP projects
Figure 15: Kigwathi MHP plant intake
Despite the significance of these projects to the community, there were various challenges that
face them thus threatening their sustainability. According to Practical Action report of 2011,
most challenges faced by micro hydropower are part of a large picture on policies and budgetary
allocations. The report lists the main challenges as; lack of clear policies on renewables,
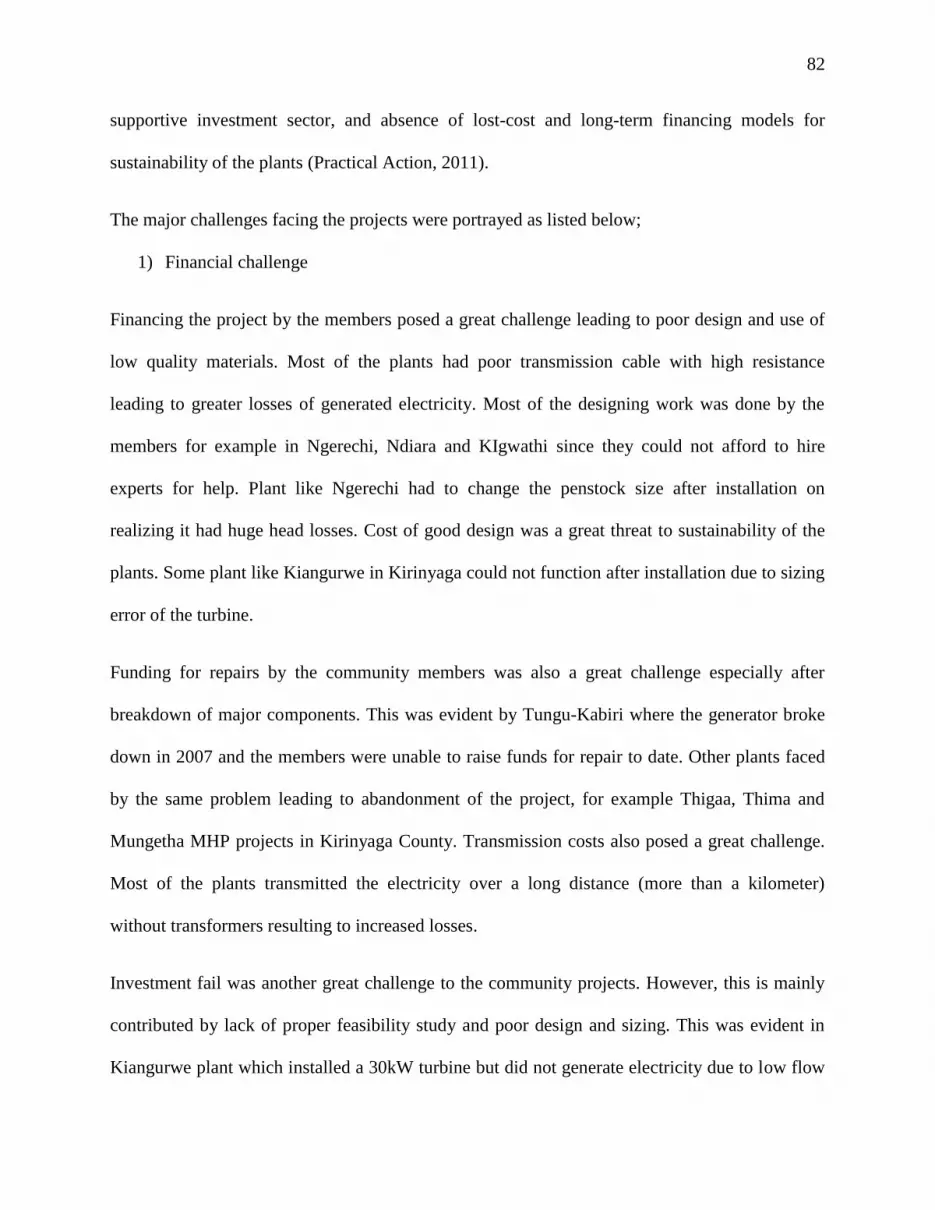
82
supportive investment sector, and absence of lost-cost and long-term financing models for
sustainability of the plants (Practical Action, 2011).
The major challenges facing the projects were portrayed as listed below;
1) Financial challenge
Financing the project by the members posed a great challenge leading to poor design and use of
low quality materials. Most of the plants had poor transmission cable with high resistance
leading to greater losses of generated electricity. Most of the designing work was done by the
members for example in Ngerechi, Ndiara and KIgwathi since they could not afford to hire
experts for help. Plant like Ngerechi had to change the penstock size after installation on
realizing it had huge head losses. Cost of good design was a great threat to sustainability of the
plants. Some plant like Kiangurwe in Kirinyaga could not function after installation due to sizing
error of the turbine.
Funding for repairs by the community members was also a great challenge especially after
breakdown of major components. This was evident by Tungu-Kabiri where the generator broke
down in 2007 and the members were unable to raise funds for repair to date. Other plants faced
by the same problem leading to abandonment of the project, for example Thigaa, Thima and
Mungetha MHP projects in Kirinyaga County. Transmission costs also posed a great challenge.
Most of the plants transmitted the electricity over a long distance (more than a kilometer)
without transformers resulting to increased losses.
Investment fail was another great challenge to the community projects. However, this is mainly
contributed by lack of proper feasibility study and poor design and sizing. This was evident in
Kiangurwe plant which installed a 30kW turbine but did not generate electricity due to low flow

83
rate that was available. The members were advised to install a smaller turbine of 20kW and
redesign the penstock. The project commissioning is expected later this year.
2) Managerial Challenges
All the plants lacked documentation of the projects’; finances, operation, monitoring and
maintenance records. There were no laid down long term plans for the projects except for those
that NGOs have intervened to upgrade the project. The decision makers of the project had not set
up commerce/industries to make use of generated electricity during the day leading to low
utilization of the resource available.
3) Social Challenges
These are conflicts that arise among the project members. Most of such conflicts were reported
where some members fail to pay for the consumed electricity especially in Ndiara project. Such
members were forced to leave the project and the transmission to their homestead is
disconnected. Secondly, when the electricity generated is not enough for all the members,
rationing in some sections create conflicts as most of the members lack knowledge on operation
of the plant. Some members also complained of dim light especially in plants that have large
number of household connected.
4) Technical challenges
The main technical challenge was lack of proper guidance on appropriate design for resilient
plants. Most of the plants suffered great head losses and transmission losses due to the poor
material selection. Secondly all the community projects lacked planned and preventive
maintenance schedules. They mainly concentrated on routine maintenance; clearing the track

84
rash and corrective maintenance in case there was a breakdown of components. This posed a
great challenge since the communities had no funds set aside for major repairs which were the
main cause of project abandonment.
Third, projects lack transformers and mechanisms for regulating generated electricity resulting to
poor methods like use of electric resistor coils as energy dumpers. This posed a safety hazard for
the power house as well as great loss of generated energy.
The projects were mainly for providing lighting creating a low utilization factor of the plant; this
can be improved by providing other services such as water pumping.
5.4 Conclusion
This study found that Micro hydropower provides sustainable electricity for rural communities
that are far from the national grid. This technology is currently very attractive for reliable and
affordable electricity where the resource is available. It is a cost effective technology with the
LCOE as low as 0.12 USD/kW since most components were locally available and sweat equity
was provided by the community. Electricity generated by the plants had numerous benefits to the
community such as; improved standards of living, cohesion among community members,
improved security in the society, education benefits where children had increased hours for their
studies and boost in trade and agriculture. Women had more time for their household duties and
could start income generating businesses such as hair dressing.
The projects have reduced CO2 emission by eliminating use of kerosene lamps. A household that
was initially using five litres of kerosene in a month was found to save 12.8 KgCO2/Month. The
ability of the MHP project to supply clean energy had attracted private organizations such as
Safaricom Kenya limited that offered to fund for upgrade of projects like Ngerechi project.

85
Kenyan MHP projects were revealed to be within sustainable level (3.16 score) and offered
affordable electricity access to remote communities making them energy dependence. However,
there was need to improve their sustainability by improvement of their design, proper
maintenance and repairs and training of operators. With proper maintenance these plants can
sustainably serve the communities for 50 years without substantial replacement costs (IRENA,
2015).
The main challenge facing the MHP projects in Kenya was lack of local capacity in designing
and developing the plants. Feasibility studies were not carried out by specialized personnel to
produce detailed design and costing of the system which lead to failure of most projects after
implementation.
5.5 Recommendations
There is need for government involvement in the implementation of these community based
MHP project, not only in policy making but also guidance in implementation and providing
funds, subsidies and grants. Most of the plants lack financial support ending up with poor design
and transmission systems.
Technical challenges such as low load factor should be addressed by starting up
commercial/industries to utilize the generated electricity during the day such as; computer
schools, water pumping schemes or workshops. These industries will enable the projects to
generate income.
Capacity building in form of training operators and management team should be affected for
smooth operation of the plant components, proper documentation of plant records and long-term
planning of the project.

86
Bibliography
Adhikari D. (2011). Sustainability Analysis of Hydropower In Nepal. Metropolia.
African Development Bank. (2015). Renewable Energy in Africa: Tanzania country profile. Côte
d’Ivoire: African Development Bank Group.
Alternative Energy. (2006). Alernative energy news and infirmation about renewable energy.
Retrieved May 22, 2016, from AENews : http://www.alternative-energy-
news.info/technology/hydro/
Angelis, A., & Aramphatiz G. (n.d). Enrgy indicators for sustainable development. 24th
European Conference on Operational Research. Lisbon.
Annette E., Vladmir S., & Tim J. (2008). Assessment of sustainability indicators for renewable
energy technologies. Science Direct.
Antonio Fernández A., & Ali, A. (n.d). Kenya Tea Development Agency: small hydropower
development. Rizzo Associates Inc.
Anup, G., Ian. B., Jip. H., & Sang E. O. (2011, September 8). Socio-economic impacts of a
micro-hydropower plant on rural livelihood. Academic Journals, 3964-3972.
British Hydropower Association. (2005). Aguide to UK mini-hydro development. n.d: British
Hydropower Association.
Cunha, J., & Paula F. (2014). A risk analysis of small-hydro power (SHP) plants investments.
International Journal of Sustainable Energy Planning and Management.

87
Deepak, K., & Katoch S. (2014). Sustainability indicators for run of the river (RoR) hydropower
projects in hydro rich regions of India. Renewable and Sustainable Energy Reviews.
Department for International Development. (2000). Best practices for sustainable development of
micro hydro power in developing countries. UK: The Department for International
Development, and World Bank.
Economic Consulting Associates. (2014). Project study design on renewable energy development
for off-grid power supply in rural regions of Kenya. London: Economic Consulting
Associates.
Energy Regulatory Commission. (2012). Renewable Energy Porta. Retrieved March 31, 2016,
from Renewable Energy Porta: http://renewableenergy.go.ke/index.php/content/32
Energy Regulatory Commission. (2014). Renewable Energy Sources. Retrieved December 6,
2015, from Energy Regulatory Commission website:
http://www.erc.go.ke/index.php?option=com_fsf&view=faq&catid=2&Itemid=649
European Small Hydropower Assocciation. (2006). Small hydropower fro developing countries.
Belgium: ESHA.
G.O.K. (2007). Kenya Vision 2030. Nairobi: Republic of Kenya.
IAEA. (2005). Energy indicators for sustainable development: Guidelines and methodology.
Vienna: Austria: International Atomic Energy Agency.
IEA. (2012). World energy outlook 2012. france: International energy agency.

88
Ingram E. (2015, August 21). Hydroworld.com. Retrieved May 11, 2016, from Hydroworld web
site: http://www.hydroworld.com/articles/2015/08/kenya-tea-agency-breaks-ground-on-
lower-nyamindi-small-hydro-project.html
Insah I., & Subhes C. (2015). Sustainable Energy Development Index: Amulti-dimensional
indicator for measuring sustainable energy development. Science Direct.
International Energy Agency . (2014). Africa Energy Outlook: A focus on energy prospects in
sub-sahara Africa. Paris- France: IEA.
International Hydropower Association. (2006). Sustainability Assessment :Sustainability
Guidelines. n.d: IHA.
International Renewable Energy Agency. (2011). Prospect for Africa power sector: Scenarios
and strategies for Africa projects. Abu Dhabi: IRENA.
IRENA . (2015(b)). Renewable power generation cost in 2014. International Renewable Energy
Agency.
IRENA. (2012). Renewable Enegry Technologies: Cost analysis series. Bonn: International
Renewable Energy Agency.
IRENA. (2015). Hydropower Technology Brief. n.d: IRENA.
Ivan, V., & Lucille L. (2006). Energy indicators for sustainable development. Science Direct.
Jian L., Zuo J., Zhiyu S., George Z., & Xianming C. (2012). Sustainability inhydropower
development — A case study. Science Direct.

89
Kaunda C. S., Cuthbert Z., & Torbjorn K. (2012). Potential of Small-Scale Hydropower for
Electricity Generation in Sub-Saharan Africa. International Scholarly Research Network.
KenGen. (n.d). KenGen. Retrieved may 5, 2016, from Hydro Power Stations:
http://www.kengen.co.ke/?=content/hydro-power-stations
Kenneth Lee, Erick B., Carson C., Meyo F., Edward M. et al. (2015). Electrification for
―UnderGrid‖ households inRuralKenya. Science Direct.
Kiplagat J., Wanga R., & Li T. (2011). Renewable energy in Kenya: Resource potential and
status of exploitation. Science Direct.
Konstantinos D., Haris D., Argyis G., & John P. (2007). Sustainable energy policy indicators:
Review and recommendations. Science Direct.
Kucukali S., & Kemal B. (2009). Assessment of small hydropower (SHP) developmentin
Turkey: Laws,regulationsandEUpolicyperspective. Science Direct.
Maher P., Smith N., & William A. (2002). Assessment of pico hydro as an option for off-grid
electrification in Kenya. Science Direct.
Muriithi, J. (2006). Developing Small Hydropower Infrastructure in Kenya. the 2nd Small
Hydropower For Today Conference IN-SHP. Hangzhou, China: Ministry of Energy-
Kenya.
n.d. (2013). Black Carbon Emissions from Kerosene Lamps: Potential for a new CCAC
Initiative. n.d.

90
Nasir B.A. (2013). Design of micro hydro plectric Ppower station. International Journal of
Engineering and Advanced Technology, 39.
Nevzat O., & Haydar Bayar. (2010). The sustainability indicators of power production systems.
science direct.
Omenda P., Simiyu S. & Muchemi G. (2014). Geothermal Country Update Report for Kenya:
2014.
Practical Action. (2011). Micro hydropower in rural Africa. n.d: Practical Action.
Regulus Limited. (2016). Electricity cost in Kenya. Retrieved july 26, 2016, from Tarrif
structure: Regulus web: http://stima.regulusweb.com
Republic of Kenya. (2011). Scalling up renewable energy program (SREP): investment plan for
Kenya. n.d: Goverment of Kenya.
Surekha D., Sinha A.K., & Inamdar S.S. (2005). Assessment of small hydropower potential
using remote sensing data for sustainable development in India.
Taylor, Richard, & Andrew S. (n.d). Sustainability Hydropower: guidelines, good practice and
certification. Advancing sustainable Hydropower . Stockholm: International Hydropower
Association.
U. S Department of interior. (2005). Hydroelectric power. U. S department of interior.
U.S Department of energy. (2004). Hydropower: Setting a course for our energy future.
Washington DC: U.S department of energy.
91
U.S Department of Energy. (nd). Types of hydropower plants. Retrieved April 25, 2016, from
Energy Efficiency & Renewable Energy: http://energy.gov/eere/water/types-hydropower-
plants
U.S Energy Information administration. (2014, april). U.S Energy Informationl administration.
Retrieved april 15, 2016, from international energy statistics:
http://www.eia.gov/cfapps/ipdbproject/IEDIndex3.cfm
UK/DECC. (2014). UK energy indicators 2014. London: department of energy and climate
change.
UNDP. (2004). World energy assessment: Overview update 2004. New York: UNDP.
UNIDO. (2013). World small hydropower development report: 2013 Kenya. United Nations
Industrial Development Organization (UNIDO) and International Center.
US EPA. (2011). inventory fo U.S greenhouse gas emission and sinks: 1990-2009. Washigton
DC: U.S Environmental Protection Agency.
Wikipedia. (2016, April 12). List of power stations in Kenya. Retrieved May 2, 2016, from List
of power stations in Kenya:
https://en.wikipedia.org/wiki/List_of_power_stations_in_Kenya
World Bank Group. (2006). Technical and Economic Assessment of Off-Grid, Mini-Grid and
Grid Electrification Technologies. Washington, D.C.: World Bank Group.
World Bank Group. (2016a). Access to electricity, rural (% of rural population). Retrieved June
4, 2016, from world bank data site:
http://data.worldbank.org/indicator/EG.ELC.ACCS.RU.ZS

92
World Bank Group. (2016). The World Nank. Retrieved April 16, 2016, from Country Overview:
http://www.worldbank.org/en/country/kenya/overview
World Commission on Dams. (2000). Dams and development: A new framework for decision-
making. London: Earthscan Publications LTD.
WorldPress. (2016). Aviation and climate change. Retrieved August 1, 2016, from aviation and
climate change: http://www.waronerror.info

93
APPENDIX
THESIS QUSTIONNAIRE:
SUSTAINABILITY ASSESSMENT OF MICRO HYDROPOWER IN KENYA
(USER QUESTIONNAIRE)
Micro Hydropower Project Name:…………………………………Location:…..……………..
This questionnaire consists of open ended questions; give your view and a brief explanation.
Kindly assign a score for each question according to score and weighting indicated below:
5= Excellent 4= Very good 3= satisfactory 2= less than satisfactory 1= poor 0=very poor
Number of people in your homestead: Number of bulbs:
Monthly electricity consumption Other Appliances:
Monthly electricity cost:
What are your electricity uses:
Is the electricity reliable (how often are outages experienced):
In what ways do you save/conserve electricity:
How has your quality of life improved since you gained access to electricity:
How has electricity improved market and trade in your community:
Is there any business this project has enabled you to run/open: how much does it generate per month
What tangible benefits has electricity generation added to your family other than lighting
Are you satisfied with the management:
Can the community run the project without outside intervention:
What is your involvement in the project: do you attend meeting
Has you land or drinking water been affected effects due to the project construction:
Are there any conflicts within this project:

94
What other technology of electricity generation are available (are they cheaper):
Which other energy resource do you use; is it cheaper
Are there people willing to get connected but cannot afford to pay for the electricity
In your own view, how has health improved due to electricity access:
In your own view, how has education improved due to electricity access:
Has the project helped girls/women in daily life:
How much do you spend on electricity (for those using electricity for lighting alone):
Before the project, how much kerosene (litres) did you use in a month, how much was its cost:
How has your farming been improved by the project:
Has the project affected your cultural practises in any way:
In what way are you involved in water management and river conservation:
Did the project require any land to be volunteered or bought from the community, how much:
Has the project construction caused any inconveniences; load block ,river course change or conflicts:
Has the project affected the behaviour of other organisms, such as pests (mosquitos), birds, insects and fish:
NAME:
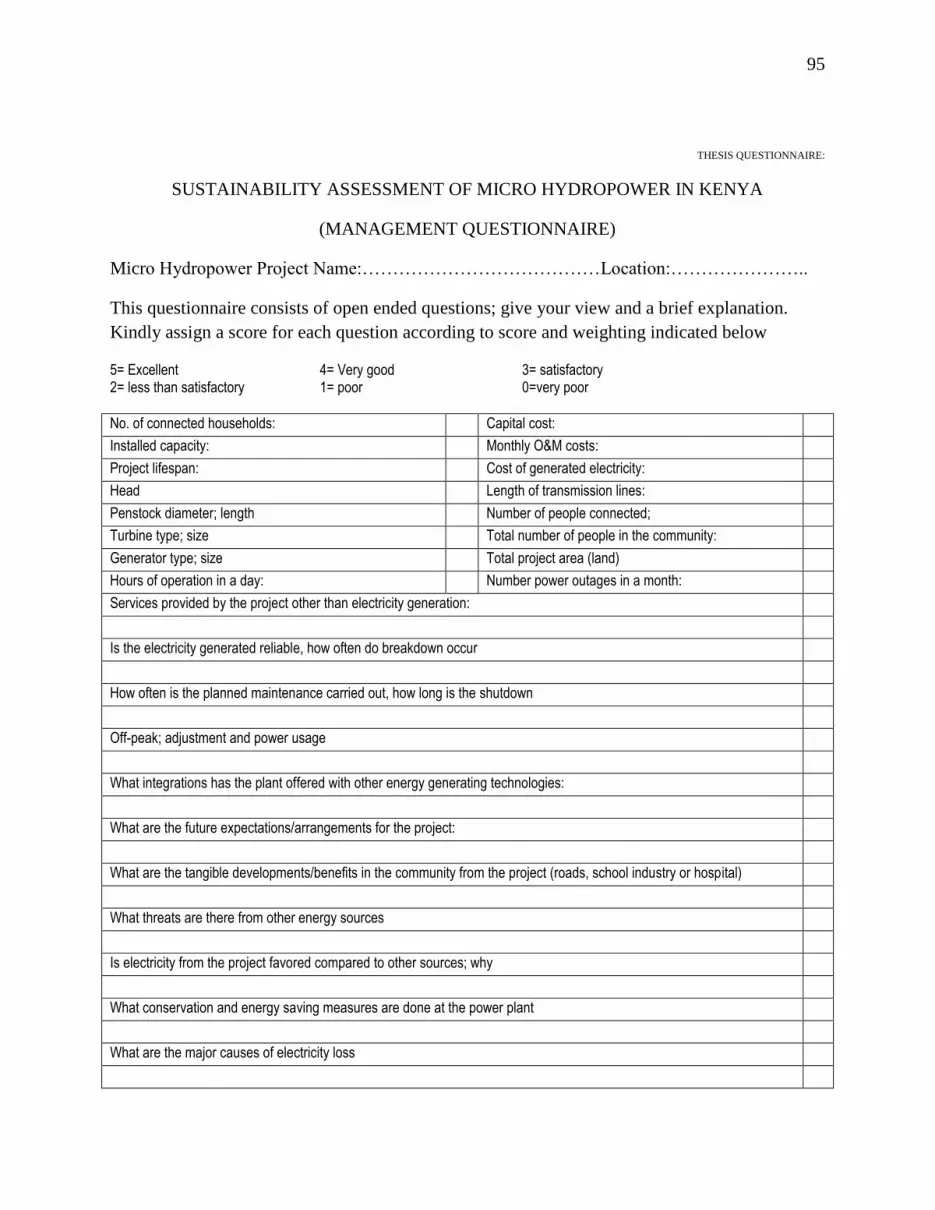
95
THESIS QUESTIONNAIRE:
SUSTAINABILITY ASSESSMENT OF MICRO HYDROPOWER IN KENYA
(MANAGEMENT QUESTIONNAIRE)
Micro Hydropower Project Name:…………………………………Location:…………………..
This questionnaire consists of open ended questions; give your view and a brief explanation.
Kindly assign a score for each question according to score and weighting indicated below
5= Excellent 4= Very good 3= satisfactory 2= less than satisfactory 1= poor 0=very poor
No. of connected households: Capital cost:
Installed capacity: Monthly O&M costs:
Project lifespan: Cost of generated electricity:
Head Length of transmission lines:
Penstock diameter; length Number of people connected;
Turbine type; size Total number of people in the community:
Generator type; size Total project area (land)
Hours of operation in a day: Number power outages in a month:
Services provided by the project other than electricity generation:
Is the electricity generated reliable, how often do breakdown occur
How often is the planned maintenance carried out, how long is the shutdown
Off-peak; adjustment and power usage
What integrations has the plant offered with other energy generating technologies:
What are the future expectations/arrangements for the project:
What are the tangible developments/benefits in the community from the project (roads, school industry or hospital)
What threats are there from other energy sources
Is electricity from the project favored compared to other sources; why
What conservation and energy saving measures are done at the power plant
What are the major causes of electricity loss

96
What regulations are there for this project, are they adhered to:
What certification is required for this plat by the Kenyan law, do you have the certificates
How often do authorities from the law visit the plant
How many jobs has the project created
Are there planned safety programs for the project , who is in charge of them
Has the project caused any injuries or damage to the community, how are they compensated
Is there any village around that has implemented or seeking advice on how to construct a plant like this one
Has the project helped to minimize over dependent on wood fuel, how
What measures are in place to conserve the water and the river banks
What type of waste is generated at the power plant, how is it disposed
Plant’s load curve:
Name:
Position: