ten mile river hydropower feasibility study
TRANSCRIPT

TEN MILE RIVER HYDROPOWER FEASIBILITY STUDY
FINAL
Prepared for:
The City of East Providence Rhode Island 145 Taunton Avenue East Providence, RI 02914
Prepared by:
The Essex Partnership, LLC 27 Vaughan Avenue Newport, RI 02840
May 2011

City of East Providence Ten Mile River Hydropower FS May 2011
TEN MILE RIVER HYDROPOWER FEASIBILITY STUDY
Table of Contents
Executive Summary ...................................................................................................................... 1 Introduction ................................................................................................................................... 2 Study Sites...................................................................................................................................... 3
Turner Reservoir Dam ................................................................................................................. 3 Hunt’s Mill Dam .......................................................................................................................... 4 Omega Pond Dam ........................................................................................................................ 4
Preliminary Dam Inspection ........................................................................................................ 5 Hydrologic Analysis ...................................................................................................................... 6 Project Configurations & Site Hydraulics .................................................................................. 8
Hunt’s Mill Options ................................................................................................................... 10 Existing Unit .......................................................................................................................... 10 Hunt’s Mill Repowering......................................................................................................... 10 Hunt’s Mill Restoration .......................................................................................................... 11
Environmental Resources & Regulatory Analysis................................................................... 14 Environmental Inventory ........................................................................................................... 14 Wetlands / Floodplains .............................................................................................................. 17 Rare, Threatened & Endangered Species .................................................................................. 18 Cultural / Historic Resources ..................................................................................................... 18 Recreational Resources .............................................................................................................. 18 Regulatory Analysis .................................................................................................................. 19
Preliminary Energy Modeling & Generation Potential .......................................................... 22 Energy Modeling ....................................................................................................................... 22 Determining Installed Capacity ................................................................................................. 24 Energy Estimates ....................................................................................................................... 25 Equipment Selection .................................................................................................................. 26
Double Regulated Bulb Turbines ........................................................................................... 26 Vertical Kaplan and Francis Turbines .................................................................................... 27
Electrical Interconnection .......................................................................................................... 29 Cost Estimates ............................................................................................................................. 30 Economic Analysis ...................................................................................................................... 33 Summary of Findings ................................................................................................................. 37

City of East Providence Ten Mile River Hydropower FS May 2011
Attachments
Appendix A – Preliminary Dam Inspection Report Appendix B – Hydrologic & Hydraulic Data Appendix C – Preliminary Project Configurations Appendix D – Natural Resource Data & Initial Agency Meeting Notes Appendix E – Economic Analysis (energy modeling, cost estimates, proformas)

City of East Providence Ten Mile River Hydropower Feasibility Study May 2011
1
Executive Summary The Essex Partnership was retained by the City of East Providence (City) to evaluate the feasibility of hydropower development at its three existing dams on the Ten Mile River in Rhode Island (Turner Reservoir, Hunt’s Mill and Omega Pond). Results of the study indicate that redevelopment of the historic Hunt’s Mill Dam-Powerhouse hydropower alignment (Alternative E) using new equipment would be the most attractive alternative. Restoring hydropower at Hunt’s Mill would also be consistent with the City’s long-term plans for the site as a “green technology” education and learning center. Development of hydropower at the Turner Reservoir Dam may be viable pending resolution of the spillway adequacy issue. Development at the Omega Pond site does not appear economic due to very low head conditions. Depending upon minimum flow requirements, redevelopment of the Hunts Mill site could produce between 500 and 1,200 megawatt hours (MWH) of energy per year on average at an estimated cost ranging from $3.3 million to $4.0 million. Assuming a “middle of the road” solution to the minimum flow issue, the project would yield a 5% cash-on-cash internal rate of return (IRR). Financing the project with low cost, long-term debt increases the IRR to 6% and produces over $350,000 of net present value benefits (NPV) over a 20-year study period. Additional agency consultations and analyses that balance equipment selection with refined environmental and civil requirements would be needed to firm-up these findings.
Development of the Turner Reservoir Dam is overshadowed by potential dam safety issues. Available information suggests the spillway capacity of the dam may be inadequate. Additional study would be required to resolve this issue. Remedial measures, if required, could easily exceed the benefits of hydro development. Absent the spillway issue, developing the hydro potential of the Turner Reservoir Dam would yield IRR’s ranging from -1% to 8% over the 20-year study period. Based on preliminary visual inspections, all three dams appear to be in good overall condition. With the exception of the spillway capacity issue at Turner Reservoir Dam, there are no apparent issues that would technically preclude hydropower development. With proper care and maintenance, the dams can reasonably be expected to continue to perform as intended for many years. Electrical interconnection at each of the sites would require less than one mile of upgraded (3-phase, 15-kv) service. At 15 kv, the projects are not likely to overload the circuit or require additional system upgrades.

City of East Providence Ten Mile River Hydropower Feasibility Study May 2011
2
Introduction The City of East Providence (City) owns and maintains three existing dams on the Ten Mile River in Rhode Island; Turner Reservoir Dam, Hunt’s Mill Dam and Omega Pond Dam. With funding assistance from the Rhode Island Economic Development Commission (RIEDC) and the American Recovery and Reinvestment Act (ARRA) the City commissioned a study to evaluate the technical and economic feasibility of developing hydropower at its existing three dams. The feasibility study (FS) included the following:
1. Preliminary Dam Inspections; 2. Hydrology and Hydraulic Analysis; 3. Preliminary Project Configurations; 4. Environmental Resources and Regulatory Analysis; 5. Energy Modeling and Generation Potential; 6. Cost Estimates; and 7. Economic Analysis.
Six alternative project configurations were evaluated reflecting various development scenarios involving the three dam sites. All six alternatives explored power generation to be used exclusively for municipal facilities. For alternatives that entailed diverting water from the river to a location further downstream (to capture additional head), three different instream flow scenarios were modeled to evaluate the range of regulatory requirements that could be imposed. Three options were also evaluated specific to the Hunt’s Mill site to reflect potential scenarios for reusing the existing powerhouse and generating equipment. Screening-level energy models and discounted cash flow analyses were developed for each alternative and instream flow scenario to identify the most economically attractive development options. A levered cash flow analysis was also performed on the most attractive options to determine the impact of low cost, long-term financing on economic performance. The economic findings and financial modeling presented in this report are preliminary and will likely change based on additional site specific information and more detailed analyses.

City of East Providence Ten Mile River Hydropower Feasibility Study May 2011
3
Study Sites Turner Reservoir, Hunt’s Mill, and Omega Pond dams are all located in the lower reach of the Ten Mile River in East Providence, Rhode Island (Figure 1). The Ten Mile River watershed drains an area of approximately 52 square miles, including parts of Rhode Island and Massachusetts, before discharging to the Seekonk River.
Figure 1: Project Locus Map. Study sites are marked with red stars. The City is currently working with several project partners to install fish passage at each of the dams. The hydropower feasibility study includes consideration of the operational requirements for fish passage, both upstream and downstream, as part of the analysis of hydropower potential.
Turner Reservoir Dam The James V. Turner Reservoir Dam is the most upstream dam of the sites studied. The dam is classified by the State as an intermediate size structure with high hazard potential. Built in 1934, the 550 foot-long dam consists of two sections of earthen embankments and a 200 foot long

City of East Providence Ten Mile River Hydropower Feasibility Study May 2011
4
concrete overflow spillway. A 25 foot-long concrete low level outlet abuts the right end of the spillway. The structure contains two 54-inch diameter conduits and an abandoned 66-inch diameter penstock intake. The penstock is reportedly buried under ground and runs approximately 2,400 feet along the right river bank toward the Hunt’s Mill Dam downstream. The penstock was historically used for water supply however records on file at the Rhode Island Department of Environmental Management (RIDEM) indicate that this use was abandoned in 1970 due to water quality concerns. The drainage area at the dam is 48 square miles. The impoundment has a maximum reservoir storage and surface area of 3,100 acre-feet and 390 acres, respectively. Current use of the impoundment is primarily for recreation. Efforts to restore upstream fish passage on the river will expand its use to provide spawning and rearing habitat for anadromous fishes (river herring and shad). The dam and entire reservoir shoreline are owned by the City.
Hunt’s Mill Dam
The Hunt’s Mill Dam is located on the Ten Mile River approximately 2,300 feet downstream of the Turner Reservoir Dam (Figure 1). The 175 foot-long dam consists of an overflow spillway at an abandoned headrace entrance. The appurtenant facilities, all abandoned, include a penstock, headrace, pumphouse, and a tailrace. The dam with impoundment storage of 140 acre-feet and surface area of 0.4 acres is classified by the State as a small size structure with low hazard potential. The dam was used for hydropower generation and public water supply from the 1930s to 1970. A denil fish ladder is currently being installed at the right (west) side of the dam. The former intake, headrace, concrete conduit and stilling well have been removed to accommodate the fish ladder. Prior to installation of the fish ladder the headrace downstream of the entrance closure wall had a short, open flume transitioning into an underground steel penstock which leads to the pumphouse. The pumphouse contains a 144 kW vertical Francis hydro-generating unit, presently retired. The historic hydro station discharged to a now abandoned 900-foot long tailrace channel which created a 1,200 foot-long river bypass reach.
Omega Pond Dam The Omega Pond Dam is located at the confluence of the Ten Mile and Seekonk Rivers. The 200 foot-long, 18 foot-high dam consists of an overflow spillway and abutment walls. The 112 foot-long, 15 foot-high spillway is a concrete gravity structure with downstream stone facing. The dam impoundment has a storage capacity of 280 acre-feet and a surface area of 33 acres. The impoundment is used for recreation and water supply by several adjacent industries. Downstream of Omega Dam the Ten Mile River discharges into the Seekonk River which is a tidal estuary. Consequently, tailwater levels are tidally influenced. The dam is classified by the State as a small size structure with low hazard potential. The existing structure was built in 1918 downstream of an original timbercrib dam erected in 1883. Similar to the Turner and Hunt’s Mill Dams, the Omega Pond Dam is scheduled for installation of a denil fish ladder at the right (north) side of the dam utilizing a portion of the existing spillway.

City of East Providence Ten Mile River Hydropower Feasibility Study May 2011
5
Preliminary Dam Inspection The Essex Partnership, with assistance from MBP Consulting (MBP), conducted visual inspections of the study dams in October 2010. Results of these inspections indicate that the dams are no longer being used for their originally intended uses. There are some signs of deterioration; however, with routine maintenance typical for water retaining structures, these dams could be expected to exist well into the future. There were no observed conditions that would preclude hydropower development. A complete copy of the Preliminary Inspection report is provided as Appendix A. Suggested measures related to operation, maintenance and repair of the dams include removal of brush and trees from water retaining structures, and re-pointing of joints and voids in masonry components. Additional recommendations include repair of deteriorated spillways and retaining walls and in some cases, restoration of inoperable low-level outlets. If developed for hydropower, jurisdiction for dam safety would transfer from RIDEM to the Federal Energy Regulatory Commission (FERC). FERC typically has more stringent safety criteria than State dam safety offices. Consideration of potential exposure of this jurisdictional transfer is important in evaluating overall project feasibility. The Hunt’s Mill and Omega Pond dams, are classified by RIDEM as low hazard structures, and thus would be strong candidates for an exemption from the requirements outlined in the Federal Power Act (FPA) Part 12 (concerning dam safety – administered by FERC). The Turner Reservoir Dam, with an existing RIDEM high hazard classification, would likely be subject to compliance with Part 12 if it were to be developed for hydropower. Phase I (US Army Corps 1978) and Phase II (New England Engineering 1982) dam inspection reports of the Turner Reservoir Dam indicate that the existing spillway appears undersized (i.e., not able to adequately pass extreme flood flows). The Phase II analysis of the spillway’s hydraulic capacity (New England Engineering 1982) included several potential structural measures to address this concern. Phase II cost estimates to implement these measures ranged from $700,000 to $3.5mm (escalated 2.5%/yr. from 1982- 2010 dollars), depending on the alternative. A more current and detailed analysis would be needed to determine the likely nature and cost of remedial measures needed, if any, to meet FERC Part 12 safety criteria. Before expending significant funds on hydropower development activities, it would be prudent to perform additional, site-specific hydrologic and stability analyses for the Turner Reservoir Dam. A preliminary estimate of $180,000 for additional engineering studies has been included in the cost estimates for alternatives involving the Turner Reservoir Dam. These studies and analyses could be done in conjunction with licensing efforts.

City of East Providence Ten Mile River Hydropower Feasibility Study May 2011
6
Hydrologic Analysis The first step in evaluating a site’s hydro potential is to collect sufficient data to characterize the magnitude and variability of river flows. In the United States this is typically accomplished using average daily flow data recorded by a USGS gauge on the river being studied. If the river is ungaged or the period of record is too short (typically 30 years or more of record are required) then one or more surrogate gauges may be used. The existing gauge on the Ten Mile River (USGS 01109403 TEN MILE R., PAWTUCKET AVE. AT E. PROVIDENCE, RI) was established in 1986. Because this gage represents a limited, 24 year period of record, additional data were obtained from the Woonasquatucket River (USGS 01114500 WOONASQUATUCKET R. AT CENTERDALE, RI) which has a 69 year period of record. Data from both gages were pro-rated to reflect the same hypothetical 50 square mile drainage area and compared to determine if the data from the Ten Mile River were representative of longer-term regional trends. The two data sets compare well (see Figure 2), suggesting that the Ten Mile River gage data set is representative of long-term hydrologic conditions. For purposes of this feasibility study flow data from the USGS gauge on the Ten Mile River were used.
-
100
200
300
400
500
600
1% 11% 21% 31% 41% 51% 61% 71% 81% 91%
Rive
r Fl
ow C
FS
% of Time Exceeded
Ten Mile & Woonasquatucket RiversAnnual Flow Duration Curve
10 - Mile R.
Woon. R.
Figure 2: Annual flow exceedance curves (Ten Mile & Woonasquatucket Rivers).

City of East Providence Ten Mile River Hydropower Feasibility Study May 2011
7
Referring to Figure 2, above, some initial approximations can be made regarding the hydraulic capacity (or turbine size) for hydropower development. Although the graph is a simple plot of river flows (Y-axis) verses % of time the flow is exceeded (X-axis) it provides a good overall picture of the relationship between the magnitude of river flows and their variability over an average flow year. For example, the 25% exceedance flow is approximately 132 cfs. This means that the river will have a flow of 132 cfs or higher 2,190 hours in an average year (25% of 8,760 hours/year). Installing a hydro turbine(s) with this hydraulic capacity would utilize river flows up 132 cfs. Flows in excess of 132 cfs would be spilled over the dam – without generating any power. Increasing the hydraulic capacity to 500 cfs would allow the turbine to utilize river flows that occur 99% of the time. The remaining one percent of the time (87.6 hours/yr.) the river would exceed 500 cfs and the additional flows would be spilled. Installing a larger turbine, however, may not necessarily optimize the hydro potential of the site. Depending upon the type of turbine used, the minimum operating point ranges from 10% to 20% of the hydraulic capacity (maximum operating point). Francis turbines, such as the existing unit at Hunt’s Mill, typically have a minimum operating point around 20% of hydraulic capacity. For the 500 cfs turbine mentioned above, this means the minimum operating point would be approximately 100 cfs. Referring to Figure 2 above, all of the river flows below 100 cfs would not be utilized for energy production. Other factors to consider when configuring a project and selecting an installed capacity are seasonal operating restrictions to provide adequate protection of environmental resource (i.e., fish passage, water quality and instream flow concerns). As described in the Environmental Inventory section, Rhode Island has a standard instream flow requirement to protect instream resources. On an average monthly basis the minimum stream flow requirement at the three study sites would be approximately 70 cfs. If the project configuration involved a bypass reach – the first 70 cfs of river flows would have to be released at the dam – and would not be available for generation. Referring once again to Figure 2, this would have the effect of moving the X-axis up 70 cfs, which would make the flow duration curve much steeper. To address these factors in our energy calculations, monthly flow exceedence relationships were developed. Using these data the energy model was run on a monthly basis to capture the seasonal variations in environmental flow requirements (fish passage and instream flows).

City of East Providence Ten Mile River Hydropower Feasibility Study May 2011
8
Project Configurations & Site Hydraulics Six different physical project configurations were evaluated for the feasibility study. Each configuration represents a different combination of turbine intake and tailrace to depict a unique head characteristic. Figure 3 presents a simple line diagram of the study area and the physical project configuration alternatives evaluated. The gross hydraulic head developed under each of these configurations is tabulated in the table on the following page. In general, more head will provide more power. However, alternatives that entail water diversions and penstocks (i.e. Alternatives B, C, and E shown in Figure 3) would involve environmental and economic trade-offs that need to be considered as part of the evaluation. Additional detail on the configurations and specific trade-offs is provided in subsequent sections of this report. In order to determine the hydraulic head at each site, field measurements were taken of water surface elevations upstream and downstream of each dam were taken during the preliminary dam inspections. The field measurements were taken using an assumed local datum at each dam to determine hydraulic head. This survey approach however, using a local datum at each dam, is not applicable for determining head between adjacent dams.
Figure 3: Schematic of configurations evaluated.

City of East Providence Ten Mile River Hydropower Feasibility Study May 2011
9
To address this data gap, we reviewed Corps fish passage plans and reports, the 1980 Hydro Feasibility Study (Maguire), and the FEMA FIS flood profiles to obtain elevations along the river between Turners and Hunt’s Mill. Ultimately the FIS profiles were used to estimate available head due to various inconsistencies in some of the reported elevation data (i.e., the Corps reported tailwater elevations at Turner below headwater elevations at Hunt’s Mill). The estimated tailwater elevations result in calculated hydraulic head values which closely agree with previous assessments of hydraulic head between the two sites (Maguire 1980), as well as the cumulative head generated between alternatives A and E. Gross hydraulic head values for each of the project configurations evaluated as part of this FS are tabulated below.
Alt. Description of Project Configuration Gross Head
A Turner Reservoir Dam • Intake & discharge at spillway; no bypass1
14.5 reach
B
Turner - Hunt's Mill Dam • Intake at Turner Res. with discharge at toe of Hunt’s Mill
spillway • Develops head between two sites • Creates 2,300 ft. long bypass reach
22
C Turner - Hunt's Mill Powerhouse • Intake at Turner Res. with discharge through historic Hunt’s
Mill tailrace • Develops the maximum head between two sites • Creates 3,500 ft. long bypass
38
D Hunt's Mill Dam • Intake & discharge at spillway; no bypass reach
8.5
E Hunt's Mill Dam – Hunt’s Mill Powerhouse • Intake at spillway, discharge through historic tailrace • Redevelops historic head • Creates 1,200 foot long bypass reach • Restores/upgrades existing historic turbine and tailrace
23.5
F Omega Pond Dam • Intake & discharge at spillway; no bypass reach • Actual head fluctuates through tidal action
8
A simple linear relationship was used to develop corresponding headwater and tailwater elevations for flows on the Ten Mile ranging from 0 to 1,000 CFS. Since tailwater elevation tends to rise faster than the headwater elevation we made the conservative assumption that gross head (headwater elevation – tailwater elevation) decreased by 1.5-feet over this range of river flows. 1 A bypass reach is used to describe a section of a river that is subjected to diversion of all or part of the natural flows to accommodate other uses. Since reductions in the flows in the bypass reach can be detrimental to the riparian ecosystem health detailed studies are typically required the impacts and develop mitigation measures.

City of East Providence Ten Mile River Hydropower Feasibility Study May 2011
10
Hunt’s Mill Options In addition to configuration D, tabulated above, we explored three additional options for redeveloping the Hunts Mill site:
1. Hunt’s Mill New - install all new modern equipment, either in the existing powerhouse or in a new powerhouse adjacent to the existing powerhouse building;
2. Hunt’s Mill Repowered - upgrade the existing unit with modern equipment (see detailed description below);
3. Hunt’s Mill Restored – restore the existing turbine and generator to their original, as-new operating condition.
Options #1 and 2 above were modeled for water withdrawn from Hunt’s Mill Dam (Alternative E - historic hydropower alignment) and for water withdrawn from Turner Reservoir (Alternative C alignment). Option #3 listed above was modeled only for water withdrawn from the Hunt’s Mill Dam because published reports indicate that the existing equipment was designed for 23.5-ft. of hydraulic head. It is difficult to predict how or if the original unit would operate under the significantly larger head (38-ft.) that would be associated with withdrawals from Turner Reservoir.
Existing Unit
The existing Hunt’s Mill unit is a 1924 vertical Francis turbine manufactured by the James Leffel Company. The turbine is installed in a vertical cylindrical steel pressure case and discharges into a vertical steel draft cone. Relevant photographs from our October 13, 2010 site visit are presented on the following pages. In general, the equipment is inoperable and would require a significant amount of work to return to reliable operation. The runner (waterwheel, or rotating part of the turbine) and draft cone were not accessible during our site visit. A more detailed inspection would be required to better ascertain the condition of the equipment and develop a firm scope of work for restoration. Although hydro equipment manufactured during the 1920’s tended to be robust, performance typically falls way short of current technology. Modern designs typically offer a broader operating range, substantially higher efficiencies and increased output. Given the age and apparent amount of work that would be required to restore the existing Leffel unit, installation of a new, modern designed turbine (Repowering) is likely to provide the most beneficial reuse of existing infrastructure. Hunt’s Mill Repowering
Repowering typically involves selecting an existing turbine design that best fits the setting and existing water passages at the site. For purposes of developing performance parameters and preparing cost estimates, we assumed the following scope of work for repowering:

City of East Providence Ten Mile River Hydropower Feasibility Study May 2011
11
1. Remove the existing turbine (wicket gate assembly and runner); 2. Repair and paint the steel pressure case and draft cone; 3. Rework the turbine/generator shaft, machine the couplings and line bore and install fitted
new coupling bolts; 4. Install a new Wicket gate assembly (stay vanes, headcover and wicket gates); 5. Install a new, modern design runner; 6. Replace the existing governor with a new, solid state gate actuator; 7. Rewind the existing generator; 8. Install new electrical controls and switchgear.
Hunt’s Mill Restoration
We also developed preliminary cost estimates for restoring the unit to its original, as-new operating condition. While this would not be an optimal alternative from an energy production perspective, it represents an historic preservation case if that were to become the primary objective of the project. As mentioned above, a more thorough inspection would be required to ascertain the scope of work required to refurbish the unit. For purposes of this FS we assumed the following work would be required:
1. Remove the existing turbine (wicket gate assembly and runner); 2. Repair and paint the steel pressure case and draft cone; 3. Rework the turbine/generator shaft, machine the couplings and line bore and install fitted
new coupling bolts; 4. Rework the wicket gate assembly and install new stay vanes, headcover and wicket gates
identical to the existing equipment; 5. Obtain the original runner design from Leffel or make a pattern of the existing runner
blades and fabricate a new runner identical to the existing; 6. Rewind the existing generator; 7. Replace the existing governor with a new, solid state gate actuator. Restoring the
existing governor may be cost prohibitive but it could be cleaned and left in place for educational and display purposes.
8. Install new electrical controls and switchgear. For personnel safety and protection of the equipment we do not recommend restoring the original controls and switchgear. However, the existing electrical gear could be cleaned and left in place for educational and display purposes.

City of East Providence Ten Mile River Hydropower Feasibility Study May 2011
12
Figure 4. Existing Hunt’s Mill Generator and Governor
Figure 5. Steel penstock and Vertical Pressure Case
City of East Providence Ten Mile River Hydropower Feasibility Study May 2011
13
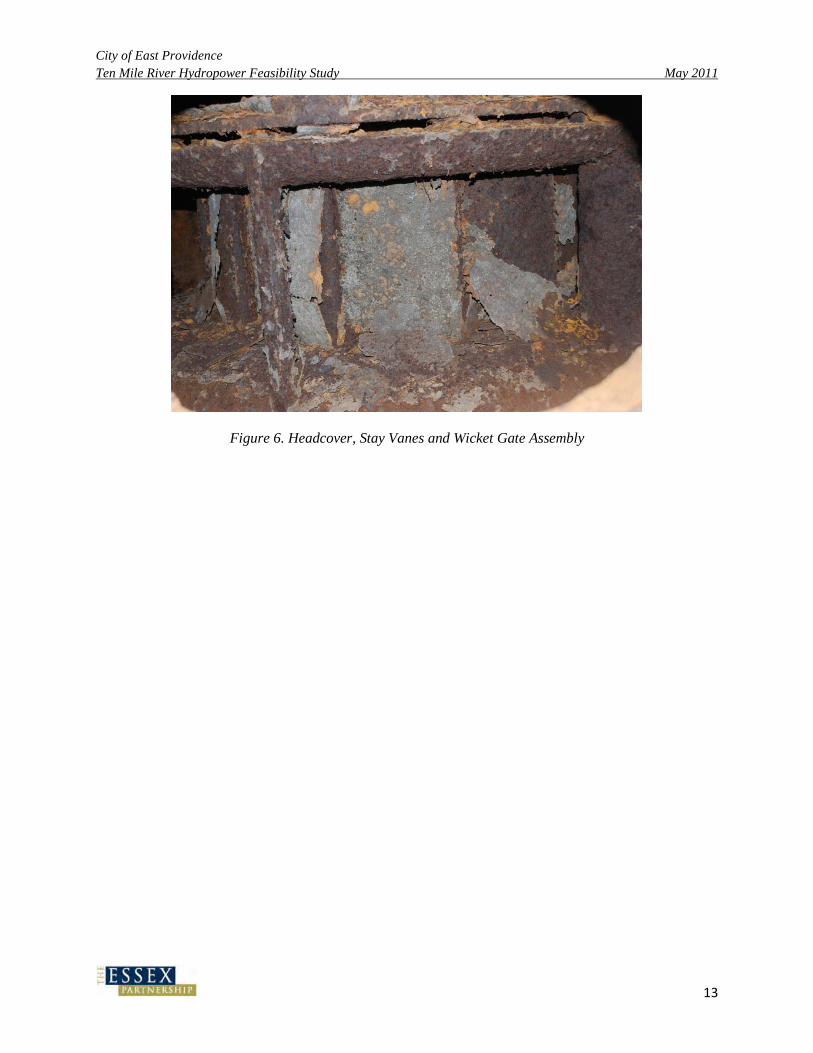
Figure 6. Headcover, Stay Vanes and Wicket Gate Assembly

City of East Providence Ten Mile River Hydropower Feasibility Study May 2011
14
Environmental Resources & Regulatory Analysis Hydropower projects are typically licensed and permitted in a manner conditioned to avoid, minimize, and reduce adverse environmental impacts. To that end many modern hydropower developments are configured to allow for eventual certification by the Low Impact Hydropower Institute (LIHI). LIHI certification evaluates candidate projects against ten criteria reflecting sensitive environmental resources. In many states LIHI certification is a requirement to participate in Renewable Energy Certificate (REC) markets and therefore provides an economic incentive. Typical issues include, but are not limited to; stream flows, water quality, fish passage and protection, cultural and historic resources, recreation, and consistency with watershed management goals. Additional detail on the LIHI certification program is available at http://www.lowimpacthydro.org. In recognition of the LIHI criteria, this study includes project configurations designed to avoid and minimize adverse impacts to sensitive resources. Examples of these provisions include; utilization of existing dams and impoundments, flow allowances for fish passage, turbine discharges sited to eliminate bypass channels or provisions for instream flows, and turbine selection to address biological and architectural considerations. The scope of this FS also includes evaluation of several project configurations (B, C, and E) that may not be considered strong candidates for LIHI certification due to significant bypass reaches. In these cases, operational adjustments were made to anticipate regulatory conditions on project operations for protection of environmental resources. Additional protection, mitigation and enhancement (PM&E) measures would likely be identified and incorporated on a site specific basis during regulatory processing. The following sections provide additional detail on the environmental resources present in the study area as well as a discussion of the regulatory requirements and relative level of risk and complexity associated with each configuration evaluated.
Environmental Inventory Several sources of information were reviewed to gain a better understanding of existing environmental resources in the study area. These sources included, but were not limited to; RIDEM fisheries data, water quality monitoring data, fish passage plans and permitting materials, and Rhode Island and Massachusetts Geographic Information Systems. The figure below was compiled using publically available GIS-based data from RI and MA; it illustrates the location of regulated and/or sensitive resources in relation to the study sites. More detailed resource mapping is provided in Appendix D. Based on observations made during site visits, GIS-based natural resource mapping, preliminary discussions with regulators and experience with similar projects, there are several environmental resource areas that would need to be addressed during the development of hydropower at the site. A copy of the meeting notes from initial discussions with regulators is provided in Appendix D. The following sections provide additional detail on these resources, potential implications for project development, and possible resolution and/or mitigation strategies.

City of East Providence Ten Mile River Hydropower Feasibility Study May 2011
15
Aquatic Resources Diverting portions of river flows for hydropower generation can potentially have adverse impacts on the aquatic environment. Any variation in river flows and water surface elevations associated with project operations would need to be evaluated to determine the extent and severity of any environmental impacts. There are several standard approaches for protecting aquatic resources. Operation of the project in a “run-of-river” mode (i.e., inflows equal outflows) without storage or ponding is generally considered the least disruptive operational mode and is a requirement for LIHI certification. Rhode Island has developed a standard approach for protecting instream resources from proposed diversions and withdrawals known as the Rhode Island Modified Base Flow Methodology (RI ABF) (Richardson 2005). This method prescribes minimum flow requirements to approximate natural flow conditions and is intended to provide stream flows adequate to protect aquatic resources. The standards are based on the size of the drainage area at the location
Figure 7: Environmental Resources Inventory Map of the Study Area. More detailed mapping is provided in Appendix D.

City of East Providence Ten Mile River Hydropower Feasibility Study May 2011
16
of the proposed impact and vary by season (monthly intervals). Alternatives B, C, and E would discharge flows used for generation downstream of the intake points (creating a bypass reach) these alternatives would likely be subject to an instream flow requirement. Alternatives A, D, and F would discharge at the base of the spillway (and would not bypass the river). We have assumed that they would not be subject to an instream flow requirement (aside from provisions to maintain fishway operations). In today’s regulatory climate, almost any project with a bypass reach will be subject to an instream flow requirement to protect aquatic resources. These requirements reduce the volume of water available to the turbine thereby reducing generation potential (see Energy Modeling). Site specific studies can be used to propose modified instream flow requirements as an alternative to accepting the standard, desk-top instream flow settings. Based on our experiences the trade-off in upfront study costs and back end generation gains is often justified (see Energy Modeling). Fisheries The Ten Mile River in the study area is classified as a Class B warm water fishery by the RIDEM. According to RIDEM and Corps fish survey data the following species occur in the river and impoundments within the study area (Appendix D).
Warm Water Fish Assemblage of the Ten Mile River Yellow perch Pumpkin seed Redfin pickerel Yellow bullhead Largemouth bass Golden shiner Bluegill American eel White perch Black crappie White sucker White catfish
Standard conditions for the licensing and permitting of hydropower projects typically include provisions for providing safe passage for migratory and resident fishes occurring in the vicinity of a project. There are currently efforts underway at each dam to install upstream fish passage for migratory populations of blueback herring (Alosa aestivalis), alewife (Alosa pseudoharengus) and American shad (Alosa sapidissima) as well as American eel (Anguilla rostrata). Additional information on the Ten Mile River fish passage restoration program can be found on the Corps’ project website http://www.nae.usace.army.mil/projects/ri/tenmile/10mile.htm). Downstream passage for most fish species will be accomplished via notches in the project spillways (outmigrant notch). Downstream passage/protection for adult eels usually focuses on conditions near the project intake and can include restrictions to intake approach velocities, bar rack angles or spacing, and reduced operation during migration periods to avoid impacts associated with impingement on the racks and injury and mortality due to turbine passage. From a hydropower perspective, development at dams with existing provisions for fish passage presents a double edged sword. As a positive, a potential project does not have to bear the capital expense of designing and installing passage facilities. The drawback is that the fish passage

City of East Providence Ten Mile River Hydropower Feasibility Study May 2011
17
facilities may not have been designed to be compatible with hydropower and can constrain design options. Regardless of the design focus, a hydropower project with fish passage requirements needs to consider operational practices that facilitate passage. These provisions include; providing adequate flows to the ladder and outmigrant notch to ensure proper functionality (fish ladder flows) as well as provisions for flows near the fish ladder entrance to ensure that migrating fish can locate and use the facility (attraction flows). These flow requirements are seasonal, corresponding to key biological requirements (bioperiods), and result in a reduction in flows available for generation. Provisions for eel and fish passage/protection have been included as part of the energy modeling and economic analysis conducted for this study. Water Quality The Turner Reservoir is on Rhode Island’s list of impaired waters due to lead, copper, phosphorous, coliform bacteria and dissolved oxygen levels. Assessments of water quality in the study area completed by the Corps indicate that water quality is generally acceptable to support aquatic life. The RIDEM is currently in the process of developing a Total Maximum Daily Load (TMDL) model for the river focused primarily on metals and nutrient pollution. A water quality monitoring program has been in place on the river since 2007 to support development of the TMDL. Preliminary review of water quality data provided by RIDEM support the assessment that the Turner Reservoir and Omega Pond experience seasonal dissolved oxygen impairments. RIDEM summaries of the water quality monitoring program for 2007 and 2009 are provided in Appendix D. As water flows over a dam’s spillway it is aerated. Routing flows through a hydroelectric turbine resulting in less flow over the spillway can reduce aeration and impact dissolved oxygen levels in the water, particularly if dissolved oxygen levels are already low. Provisions for instream flows (discussed above) can help to minimize and/or mitigate for such impacts. It is common for regulators to request a commitment from project operators to have no impact on baseline (pre-project) water quality conditions. Since water quality is already a concern in the study area, it is very likely that potential water quality impacts will be raised as an issue during licensing and permitting efforts. We have included provisions for environmental studies (including water quality modeling) in our cost estimates to address such issues. Possible resolution strategies can include: provisions for instream flows (over the dam) to maintain water quality, real-time water quality monitoring and operational adjustments, and/or provisions for aeration of flows through the turbine. The history of water quality issues at the Turner Reservoir is expected to require additional analysis and consultations. Wetlands / Floodplains Wetland resources in the vicinity of the project are generally confined to the river channel and associated floodplains (RIDEM and wetland data available through RIGIS). Turner Reservoir

City of East Providence Ten Mile River Hydropower Feasibility Study May 2011
18
and Omega Pond have wetland complexes consisting of emergent, scrub-shrub and forested wetland types which occur along the impoundment shorelines. Operating the project in a run-of-river mode will avoid impacts to upstream wetlands associated with water level fluctuations in the headpond. Alternatives which include installation of a penstock from the Turner to Hunt’s Mill sites would likely include some impacts to wetlands along the penstock alignment as well as floodplain wetlands located between Turner Reservoir and Hunt’s Mill (see Appendix D). Alternatives that would restore the historic Hunt’s Mill tailrace would include some excavation of vegetated wetland resources that have become established in the tailrace channel following project retirement. The hydraulic capacity of the Turner Reservoir spillway is currently limited. Development which further reduces this capacity would be expected to trigger some concerns and possibly require mitigation of lost flood conveyance or storage functions. Costs and provisions for wetland and flood impact assessments as well as an allowance for some mitigation measures that may be required for development activities have been included in the cost estimates and economic analyses where appropriate. Rare, Threatened & Endangered Species The Rhode Island Natural Heritage and Endangered Species Program (NHESP) recognize a small area on the northwest shore of the Turner Reservoir impoundment as a known occurrence for a rare species (Appendix D). Considering the location of the occurrence in relation to the potential project and the nature of run-of-river hydropower projects, it is unlikely that normal project operations would impact this resource. Depending on specific ecological requirements of the rare species, it is possible that avoidance and mitigation measures associated with potential impacts from construction related activities may be required. Cultural / Historic Resources Considering the industrial history of the Ten Mile River watershed and the project sites there may be potential impacts to cultural and/or historic resources from project development. Coordination with the State Historic Preservation Office (SHPO) and Native American tribal nations is a requirement during project licensing and permitting proceedings. Depending on the identification and determination of resource significance there is potential for both direct and indirect impacts from project related activities. Mitigation options are varied and depend on the specific situation and resource. Potential outcomes can include archival documentation of significant resources and/or interpretive signage and displays. Recreational Resources FERC licensing/exemption may require making accommodations for recreational use of project lands. Provisions for public access can be negotiated with local and state agencies charged with providing recreational facilities in the area. Previous and on-going efforts by the City to enhance recreational opportunities may be used to (at least partially) address this issue. We have included

City of East Providence Ten Mile River Hydropower Feasibility Study May 2011
19
provisions in the economic analysis for additional assessments and consultations in relation to recreational resources during project licensing and permitting. Regulatory Analysis Taking environmental impacts into account during the preliminary planning stages of hydropower development can help to avoid a contentious regulatory proceeding. Since a portion of the Turner Reservoir is in, or abuts the State of Massachusetts we assume that some coordination and approvals with regulators in that State would be required to develop hydropower at that site. The following regulatory approvals are anticipated for hydropower development on the Ten Mile River:
• Federal: o Federal Energy Regulatory Commission (FERC)
Federal Power Act (FPA) Part 1 - license or exemption from licensing o Corps Dredge and Fill Permit – Clean Water Act Section 404 o Coastal Zone Management Act – Consistency Review (Omega Pond only)
• State of Rhode Island: o Wetlands Permit – insignificant alteration or permit to alter o Water Quality Certificate (WQC) – Clean Water Act Section 401 o Historic Preservation – Section 106
• State of Massachusetts (Turner Reservoir Only): o Wetlands Protection Act – Order of Conditions o Natural Heritage and Endangered Species Program – Review
Typically hydropower projects take 3-5 years to license and permit. A significant portion of this time is dictated by statutory requirements for both public and agency review and comment of the proposed project associated with FERC processing. Low impact design and operating protocols as well as early outreach and coordination with regulators and other stakeholders can reduce the time and complexity of the process. Projects with more contentious resource concerns can take longer than 5 years and require significant time and capital to complete. Since each of the projects is currently owned by the City, we would recommend pursuing an exemption from FERC licensing. This provision allows entities with all the ownership rights to develop operate and maintain small hydropower projects to obtain approval in perpetuity (does not require re-licensing). In order to obtain an exemption, a project must meet three key eligibility criteria; the applicant must own all the real property interest to develop and operate the project, the applicant must be installing new capacity, and the total installed capacity must be 5MW or less. On paper there is an outside chance that redevelopment of the Hunt’s Mill site could be relieved of some of the FERC processing burden due to its historic use for hydropower if it is found to be outside of FERC’s jurisdiction. According to FERC guidelines (unless a project has a valid pre-1920 federal permit), non-federal hydroelectric projects are jurisdictional if:

City of East Providence Ten Mile River Hydropower Feasibility Study May 2011
20
1. The project is located on navigable waters of the United States. 2. The project occupies public lands or reservations of the United States. 3. The project utilizes surplus water or waterpower from a federal dam. 4. The project is located on a body of water over which Congress has Commerce Clause
jurisdiction, project construction occurred on or after August 26, 1935, and the project affects the interests of interstate or foreign commerce.
Because the Ten Mile is a navigable river and generation from Hunt’s Mill would feed into the existing interstate transmission system it is unlikely that the project would be found non-jurisdictional (fails tests #1 and #4). However a request for a jurisdictional determination is fairly simple and straight forward with no penalties related to the decision. As a practical matter however, even with a non-jurisdictional ruling the environmental review would involve the same resource agencies and the process would be similar to an exemption application. Each of the project configurations evaluated in this FS has a unique combination of regulatory risk and complexity depending on the specific development requirements and nexus with sensitive resources. The following table summarizes the key drivers of relative regulatory risks and complexity associated with each of the evaluated configurations. For the purpose of this analysis, “risk” is a qualitative measure of the likelihood of receiving a FERC license/exemption with favorable conditions. A “low” risk reflects a relatively high probability of receiving a license or exemption as designed. A “medium” risk implies that there is a greater than 50% chance of having to do extra studies and receiving a license/exemption with conditions that adversely affect project economics. A “high” risk implies the likelihood of having to do additional environmental studies and potentially receiving onerous license conditions or costly remediation requirements (i.e., Turner Reservoir Dam and FERC safety criteria). Complexity here relates to the regulatory process and the degree of difficulty (typically measured in time and money) associated with obtaining the license/exemption. Similar to “risk”, a “low” complexity implies a relatively straightforward regulatory process. A “medium” complexity implies that there will likely be extra consultations required and possibly more time and costs than a simple project. A “high” complexity implies that the process will likely involve numerous stakeholders and be protracted.

City of East Providence Ten Mile River Hydropower Feasibility Study May 2011
21
ID Summary of Key Regulatory Drivers Risk Complexity
A
Turner Reservoir Dam • No bypass reach • Significant water quality (D.O.) issues • Dam safety (FERC)
High Medium
B
Turner – Hunt's Mill Dam • Creates 2,300 ft. long bypass reach and associated
instream flow concerns • Turner Res. Fish ladder attraction flow issues • Dam safety (FERC) • Significant water quality (D.O.) issues • Wetland impacts from penstock construction and
modified bypass reach flows
High High
C
Turner - Hunt's Mill Powerhouse • Creates 3,500 ft. long bypass and associated
instream flow concerns • Turner Res & Hunt’s Mill fish ladders attraction
flow issues • Dam safety (FERC) • Significant water quality (D.O.) issues • Wetland impacts from penstock construction and
modified bypass reach flows
High High
D
Hunt's Mill Dam • No bypass reach • Potential water quality (D.O.) concerns
Low Low
E
Hunt's Mill Dam – Hunt’s Mill Powerhouse • Creates 1,200 foot long bypass reach and
associated instream flow concerns • Hunt’s Mill fish ladder attraction flow issues • Potential water quality (D.O.) concerns • Wetland impacts from tailrace restoration
Medium Medium
F
Omega Pond Dam • No bypass reach • Potential water quality (D.O.) concerns
Low Low

City of East Providence Ten Mile River Hydropower Feasibility Study May 2011
22
Preliminary Energy Modeling & Generation Potential The following section briefly describes the energy model developed for estimating generation potential and how the model was used to begin the process of optimizing the development of the various configurations outlined above.
Energy Modeling A monthly flow duration model was developed to estimate installed capacity and energy production for the various alternatives at each site. Major components of the model include: hydrology (river flows); site hydraulic characteristics (head); equipment performance; and potential license mandated operating conditions to protect environmental resources.
Hydrology data were developed as described in the Hydrologic Analysis section. Other physical site characteristics including information on the hydraulic head at each site are described in the Project Configurations & Site Hydraulics section.
For equipment performance characteristics, the proprietary turbine design software “TRBNPRO” was used to develop equipment configurations, sizes and performance characteristics. Typically axial flow (propeller) turbines are best suited for the range of heads at the three sites (6-ft. to 36-ft). Given the wide range of flows on the Ten Mile, a double regulated axial flow turbine (Kaplan) will provide much higher efficiency than a fixed-blade turbine over the entire operating range Therefore, for all cases involving new equipment, we assumed double regulated axial flow turbines would be used.
For the Hunt’s Mill site (Alternatives C and E) we modeled two special cases using the existing vertical Francis turbine arrangement. As previously described, one scenario involves designing and installing a new runner to increase efficiency and output. The other scenario replicates the existing turbine design. Based on our experience refurbishing hydro units we developed preliminary work scopes which included installing a new Francis turbine assembly (runner, headcover and wickets gates) in the existing water passages (cylindrical pressure case and conical draft tube). Using TRBNPRO we developed a modern design Francis runner to fit the following parameters of the existing Hunt’s Mill configuration:
Speed 225 RPM Runner Diameter Approximately 1 meter Runner Setting 13-ft above tailwater Gross Head 23.5 feet

City of East Providence Ten Mile River Hydropower Feasibility Study May 2011
23
Typical efficiency curves for Kaplan and (modern design) Francis units are shown in the graph below. For all alternatives modeled we assumed an overall generator efficiency of 95% for the conversion of mechanical power to electrical power.
Figure 8. Francis and Double Regulated Kaplan Efficiency Curves
Various license conditions typically associated with hydro projects affect operation of the project and hence, energy production. Specific license conditions for the Ten Mile River would likely include seasonally adjusted minimum flows to maintain aquatic habitat conditions in the bypass reach, minimum flows over the dam for aeration and dissolved oxygen, fishery flows for upstream passage (attraction water and fish ladder flows) and fishery flows for downstream passage. Based on the results of our preliminary regulatory review we developed a range of anticipated license conditions for the three sites and incorporated them into the energy model. In most cases this resulted in a reduction in the amount of flow available for energy production (see Energy Estimates section).
Using the above information we calculated the gross energy production on a monthly basis and then totaled the results to develop annual estimates for each alternative. Gross generation was reduced by 5% for planned and unplanned outages and by an additional 1% for station service consumption to develop estimates of net energy production.
0.0%
10.0%
20.0%
30.0%
40.0%
50.0%
60.0%
70.0%
80.0%
90.0%
100.0%
14 45 73 104 134 165 195 226 257
Turb
ine
Effic
ienc
y %
Turbine Flow CFS
Turbine Efficiency Comparison
Kaplan Turbine Eff (%) Francis Turbine Eff (%)

City of East Providence Ten Mile River Hydropower Feasibility Study May 2011
24
Determining Installed Capacity Results from the energy model were used to make a preliminary determination of the optimal installed hydraulic capacity at each site. Curves were developed for each site that plot annual energy production in megawatt hours (MWH) as a function of installed hydraulic capacity (flow to the turbine in cubic feet per second [cfs]), as shown below for Alternative A.
Figure 9. Annual energy production as a function of turbine hydraulic capacity for Alternative A These curves were used in conjunction with other model outputs, particularly the calculated capacity factor2
for each installed capacity. Smaller turbines (designed to operate in the lower range of the flow exceedance curve – see Figure2) would run frequently, but would generate a relatively small amount of energy leaving a significant portion of the site’s energy potential undeveloped.
Referring to Figure 9, incrementally increasing the turbine size from ‘zero’ provides a “one for one” gain in energy production along the steep part of the curve. Absent any limiting license conditions, the costs associated with installing larger equipment are offset by the additional energy production and associated revenues. For hydraulic capacities greater than 60 cfs the curve begins to flatten out; indicating that incremental increases in equipment size (to capture the additional hydraulic capacity) result in smaller incremental gains in energy production. Beyond
2Capacity Factor is the amount of energy a unit or plant actually produces over a specific time period divided by the amount of energy the unit would have produced if it operated 100% of the time. For example a 1MW project (1,000 kW) producing 4,380 MWH of energy a year would have an annual Capacity Factor of 50% (4,380 MWH/(1 MW x 8,760 hours)). Capacity Factor is frequently used in the power industry as a measure of a plant (or individual unit’s) utilization. For the 50% Capacity Factor example above, the plant would be used 50% of the year and ‘sit’ idle 50% of the time.
0
100
200
300
400
500
600
700
800
0 60 121 182 244 305 366 425 486
Ann
ual E
nerg
y Pr
oduc
tion
(MW
H)
Turbine Hydraulic Capacity (cfs)
Energy Production vs Turbine Hydraulic Capacity

City of East Providence Ten Mile River Hydropower Feasibility Study May 2011
25
305 cfs the curve is nearly horizontal. Increasing the installed capacity from 305 cfs to 486 cfs (62%) produces only a 50 MWH increase (7%) in energy production. For conventional hydroelectric projects in the Northeast United States the optimal installed capacity is usually in the transition area between the steep and flat portions of the curve. Our experience with hydroelectric projects in the Northeast also suggests that a Capacity Factor in the range of 40% appears to be the limiting value for successful development (in other words, installing capacity that sits idle 60% or more of the time typically is not economic). Applying these two criteria to Alternative A suggests an installed capacity in the range of 115 cfs would be optimal for Turner.
Energy Estimates
Using the approach described above, installed capacities were selected, and preliminary energy production estimates generated for each project configuration. For configurations that involve bypass reaches (i.e. Alternatives B, C, and E), three different installed capacities were selected reflecting three different potential instream flow requirements. Annual energy production estimates for each site configuration are shown in the table below.
Table 1, Preliminary Annual Energy Production Estimates
Annual Energy Potential (MWH)
Site Head (FT)
RI ABF Instream
Flows
1/2 RI ABF Instream
Flows
No Instream
Flows Turner
A 14.5 720 same same
B 22.0 460 630 1,050
C 38.0 830 1,140 1,890 Hunt’s
D 8.5 400 same same
E 23.5 520 720 1,180 Omega
F 8.0 380 same same Energy production estimates range from 380 to 1,890 MWH depending on the site and the instream flow scenario. Estimates for Alternatives A, D, and F are the same for each Instream Flow scenario because these alternatives involve releasing water directly below the dam and therefore will not require instream flow releases. It is possible that the regulatory agencies may require some flow be released over the spillway (not run through the turbine) to maintain dissolved oxygen levels in the river, or for aesthetic purposes.

City of East Providence Ten Mile River Hydropower Feasibility Study May 2011
26
For those alternatives with bypass reaches (B, C, and E) assumptions regarding instream flows have a significant impact on energy production (see table above). This impact is shown graphically in Figure 10 below, which illustrates the difference in power production potential with and without the RI ABF.
Figure 10: Comparison of installed capacity and annual energy production (using Alternative C as an example).
While it is not realistic to assume a development with no instream flow requirement, the analysis provides a basis for comparison and illustrates the potential up-side that could be achieved by conducting site-specific studies to establish a site-based compliance standard. The analysis also underscores the value of working with the State to develop site-specific instream flows that very likely would be less than the standard desk-top approach. The existing RI ABF is extremely conservative and in some cases reflects a requirement of more water in the river than currently occurs under natural, unregulated conditions. The energy estimates shown in Table 1 with the assumption of “half instream flows” reflect a “middle of the road” approximation of what may be possible if site-specific studies were conducted to determine a resource specific instream flow requirement. Equipment Selection
For each alternative we evaluated new turbine equipment as well as options for repowering or restoring the existing turbine and generator equipment at Hunt’s Mill (as described below).
0
500
1,000
1,500
2,000
2,500
0 60 121 182 244 305 366
Ann
ual E
nerg
y Pr
oduc
tion
(MW
H)
Turbine Hydraulic Capacity (cfs)
Instream Flow Requirements Impact on Energy Production
Energy w/standard instream flows Energy w/o standrad instream flows

City of East Providence Ten Mile River Hydropower Feasibility Study May 2011
27
Figure 11. Schematic of a typical bulb turbine installation.
Double Regulated Bulb Turbines For those alternatives that would involve installation of a new powerhouse located at an existing dam (Alternatives A, B, D, and F), we assumed horizontal, double regulated Kaplan turbines in a bulb configuration (commonly referred to as Bulb Turbines). Benefits of this equipment option include; potential for eliminating a bypass reach and associated turbine flow restrictions, high energy conversion efficiency (~92%) and the ability to operate efficiently over a broader range of flow conditions. Drawbacks associated with these units compared to simpler equipment such as Siphon turbines include higher equipment costs and typically more civil construction requirements. Based on our recent experience with similar low head projects in Rhode Island, Bulb turbines tend to be more economic than other simpler options. The additional energy production achieved by the more efficient bulb turbines helps offset other fixed development costs such as licensing. A typical cross section of a bulb unit installation is shown below.
Depending on the site, and assumed instream flow scenario (which affects the assumed hydraulic design capacity); we selected different turbine runner diameters to optimize the utilization of the units given the site characteristics and available flow for generation.
Vertical Kaplan and Francis Turbines – Hunt’s Mill Three equipment alternatives were considered for the Hunts Mill site:
1. New double regulated vertical Kaplan turbine; 2. Repowered Francis turbine, and; 3. Restored Francis turbine.

City of East Providence Ten Mile River Hydropower Feasibility Study May 2011
28
New development assumes installation of a new, state-of-the-art double regulated vertical Kaplan turbine and associated generator set. This is the same basic technology as the bulb turbine. The major differences being the turbine axis is vertical and the generator is located outside and above the water passages. The new Kaplan unit represents the greatest energy production at the site because of the efficiency benefits associated with technology modern design, double-regulated turbine. The repowered Francis alternative costs less than the new Kaplan alternative and produces almost as much energy. A typical cross section of a vertical Francis unit installation is shown below.
The Repowered case assumes that the existing turbine would be replaced with a modern Francis runner as described in more detail in the Hunt’s Refurbishment section of this report. Under this alternative, the energy production potential of the site would be higher than the existing nameplate due to the efficiency benefits of the modern design runner. Under the Restored case, we assumed that the existing unit at Hunt’s Mill would be restored to its original, ‘as-new’ operating condition. Under this alternative the installed capacity would be approximately the same as the unit’s existing generator nameplate rating (approximately 150 kw) and the unit would produce approximately 450 MWH per year of energy. To verify the accuracy of our energy model, we calibrated the model input to reflect a headloss condition and equipment efficiency reflective of the existing configuration and equipment (3-ft maximum headloss and a peak efficiency of 80%) and calculated the installed kW capacity. Our modeled estimates were very close to the nameplate rating on the existing generator (147 vs. 144 kW). This tended to confirm the calibration of our preliminary energy model. We did not run a Restored case for Alternative C (water delivered from Turner Reservoir to Hunt’s Mill) because published reports indicate that the existing equipment was designed for 23.5-ft. of hydraulic head. It is difficult to predict how or if the original unit would operate under a significantly larger head (38-ft.).
Figure 12. Schematic of a typical Francis turbine installation.

City of East Providence Ten Mile River Hydropower Feasibility Study May 2011
29
Electrical Interconnection All of the hydro development options studied will require interconnection to the National Grid distribution system (the grid). Based on our preliminary electrical analysis each generating unit will require a 3-phase 15 kv class distribution line. The connection to National Grid will require a sectionalizing switch at the point of interconnection, three single phase pole mounted step-down transformers, and a 15 kv fused disconnecting switch. Each generator will also require its own set of service switchgear including a main disconnecting switch, generator breaker and branch circuit breakers. Existing service at the Turner and Hunt’s Mills sites is currently single phase (220v/110v). Interconnection of hydroelectric generators would require approximately .33 and .52 miles (respectively), of upgraded (3-phase, 15-kv) service. Interconnection at the Omega Pond site could be accomplished through the installation of approximately two new utility poles to a nearby (0.05 miles) 3-phase service associated with a Narragansett Bay Commission (NBC) sewage pumping station. At 15 kv, the projects would add approximately 8 amps to the existing distribution lines and are not likely to overload the circuit or require additional upgrades. Conceptual alignments for the interconnections are included in the Preliminary Project Configurations provided in Appendix C. Tabulated below are preliminary costs estimates to complete the interconnections at each site. These estimates are included in the economic analysis provided in subsequent sections.
Item / Description Turner Res. Hunt’s Mill Omega Pond
13.8 kv Overhead Distribution Line $33,000 $52,000 $5,000
13.8 kv Sectionalizers $10,000 $10,000 $10,000
13.8 kv Pole-Mounted Transformers $30,000 $30,000 $30,000
13.8 kv Fused Disconnecting Switch $10,000 $10,000 $10,000
Service Switchgear $20,000 $20,000 $20,000
TOTAL $103,000 $122,000 $75,000

City of East Providence Ten Mile River Hydropower Feasibility Study May 2011
30
Cost Estimates Estimates for each of the alternatives were developed to reflect initial investment requirements. The cost estimates include the following specific items; civil/construction, dam repairs, licensing and permitting, equipment and controls, electrical interconnection, routine operations & maintenance and maintenance overhauls. The cost estimates also include provisions for Owner’s administrative costs, legal review and counsel, as well as engineering design. A 20% contingency was added to all cost estimates cover unknowns and reflects our confidence level in the numbers at this phase of the analysis. The table below summarizes the total estimated capital costs for each alternative evaluated. Ranges are provided for alternatives involving flow diversions (Alternatives B, C, and E) that reflect different environmental flow requirements and associated equipment sizing. Note that smaller environmental restrictions equate to more water available for generation and thus larger installed turbines which are more expensive, but produce more energy. Alternatives with diversions also require penstocks, which can add significantly to the cost of development. All numbers below are rounded to the nearest tenth for capacity and the nearest $100,000 for cost for the purposes of comparing between alternatives.
Alternative Installed Capacity (kW)
Installed Cost ($1,000’s)
A 210 3,600 B 160 - 290 4,600 - 5,700 C 290 - 530 5,000 – 6,100 D 100 3,400 E 180 - 340 3,300 – 4,000 F 100 3,300
The civil structural costs for each alternative were derived from our recent experience at similar projects. Powerhouse civil costs for each specific alternative were calculated based on the equipment and water passage size requirements. All of the alternatives considered include an allowance for an automated trashrake at the project intake. Cost estimates for dam repairs were developed based on the results of the preliminary dam inspection. These estimates reflect costs to bring the dams up to current standards as well as any engineering studies or investigations necessary to determine remediation requirements. Provisions for on-going dam maintenance were not included as they were considered to be required whether the hydro projects are pursued or not. Costs estimates for potential dam safety remediation were not included in the economic analysis because the likelihood and exact nature of the remedial measures that may be required by FERC, if any, will depend on the findings of more detailed analysis. Requirements for water passages (penstock sizes) to deliver water to the turbines were determined by establishing an acceptable design head loss. Since head loss is a function of velocity squared, increasing the size of water passages results in lower headlosses. For this study we sized penstock diameters based on an acceptable maximum water passage velocity of 8 feet

City of East Providence Ten Mile River Hydropower Feasibility Study May 2011
31
per second (fps). Prices for the various penstock sizes were derived from vendor quotes received within the last two years for similar projects. Equipment cost estimates are based on our experience at similar recently completed projects. Allowances were made for auxiliary electrical and auxiliary mechanical equipment. Cost for turbine/generator packages were developed using vendors quotes received within the past two years. The quotes were adjusted to fit alternative specific equipment size and configuration. Itemized cost estimates for interconnection were developed for each site. The estimates take into account the length of the interconnecting power line, recent equipment quotes from vendors and our recent experience interconnecting projects with National Grid. Regulatory processing cost estimates include FERC licensing as well as other non-FERC permits (i.e., Water Quality Certificate, Wetlands, etc.). Alternatives with higher complexity and/or risk were adjusted to reflect efforts to address resource concerns such as instream flows, water quality concerns, or wetland impacts. A summary of regulatory costs by alternative is tabulated below.
Alts. Key Regulatory Drivers Consultations (yrs.)
Studies (yrs.)
Regulatory Costs
($1,000's)
A, D, F • No bypass reach; • No stream flow concerns, and; • No wetland concerns.
2 0.5 $288
B, E
• Creation of bypass reach; • Wetland impacts, and; • Assumes acceptance of State
instream flow standard.
2 2 $400
C
• Longest bypass reach; • Highest wetland impacts, and; • Assumes acceptance of State
instream flow standard.
3 2 $450
B, E
• Creation of bypass reach; • Wetland impacts, • Assumes completion of site
specific studies to modify instream flow standard.
3 2.5 $488
C
• Longest bypass reach; • More Wetland Impacts, and; • Assumes completion of site
specific studies to modify instream flow standard.
3 3 $525

City of East Providence Ten Mile River Hydropower Feasibility Study May 2011
32
For alternatives that do not entail bypass reaches and penstocks (A, D, and F), we assumed minimal studies and 2 years of agency/stakeholder consultations for a total licensing and permitting cost of $288,000. For alternatives that involve bypass reaches and wetland impacts, we assumed greater study and consultation costs resulting in a total estimated licensing and permitting cost of $400,000 to $488,000, depending on whether the standard RI ABF is accepted or site-specific instream flow studies are assumed. For Alternative C, that involves a longer bypass reach and penstock, including greater potential wetland impacts, we assumed further increases in study and consultation costs resulting in a total estimated licensing and permitting cost of $450,000 to $525,000 for the standard RI ABF and site-specific instream flow cases respectively. All cost estimates were developed based on the assumption that sites would be developed individually. Pursuing multiple sites as part of a portfolio development would likely result in economy of scale benefits. Detailed cost estimates for each alternative are provided in Appendix E, including details on the powerhouse, water passage and equipment cost estimate calculations.

City of East Providence Ten Mile River Hydropower Feasibility Study May 2011
33
Economic Analysis A discounted cash flow analysis was used to evaluate the economic performance of the projects over a 20 year study period. A residual value was added to the last year of the study to incorporate the long-term, intrinsic value of the project. The model reflects a cash-on-cash, pre- tax position. As a result, the predicted performance tends to be conservative. A leveraged analysis was also performed to illustrate the effect of financing the project. Key assumptions used in the models are listed below. Detailed descriptions of the preliminary cost estimates, expected revenues, and modeled development scenarios are provided in Appendix E.
# Input Model Assumption
1 O&M 1.5¢/KWH
2 Property Taxes $0 Assumes exemption due to municipal development
3 Major maintenance3 $50k in years 5 & 15, $125k in years 10 & 20
4 Renewable Energy Rate4 $125/MWH
5 Renewable Energy Certificates $25/MWH
6 State Grants 5 % of Initial Investment
7 Federal Incentives 15% of Initial Investment
8 Interest Rate (leveraged proformas only)
2% Assumes low cost financing is available to the City
9 Residual Value Net cash flow last year of study divided by the growth rate
10 Initial Investment Contingency 20% of total development costs
11 Discount Rate 5%
12 Escalation Rate 2.5%/ yr. Applies to all recurring revenues and costs (O&M, insurance, energy rate, etc.)
13 Study Period 20 years Full proformas were prepared for each alternative (Appendix E). The proformas include cost estimates for development (construction, equipment, licensing & permitting, etc.), estimates of energy production and associated revenues, and operations and maintenance costs. Based on discussions with resource agency staff and our experience with other hydropower developments, we identified environmental concerns and developed operational scenarios to reflect likely requirements for environmental protection, mitigation and enhancement measures (PM&E). 3 Major maintenance costs were levelized over the 20 year study period. 4 This energy rate represents the potential value of energy under a “net-meter” type arrangement. Current Rhode Island law does not allow for net-metering of hydropower projects. Efforts are underway to modify the renewable energy contracting laws in the State. The rate used in our analysis assumes the availability of net-metering or other comparable contracting mechanism for monatizing the value of distributed renewable energy generation.
City of East Providence Ten Mile River Hydropower Feasibility Study May 2011
34
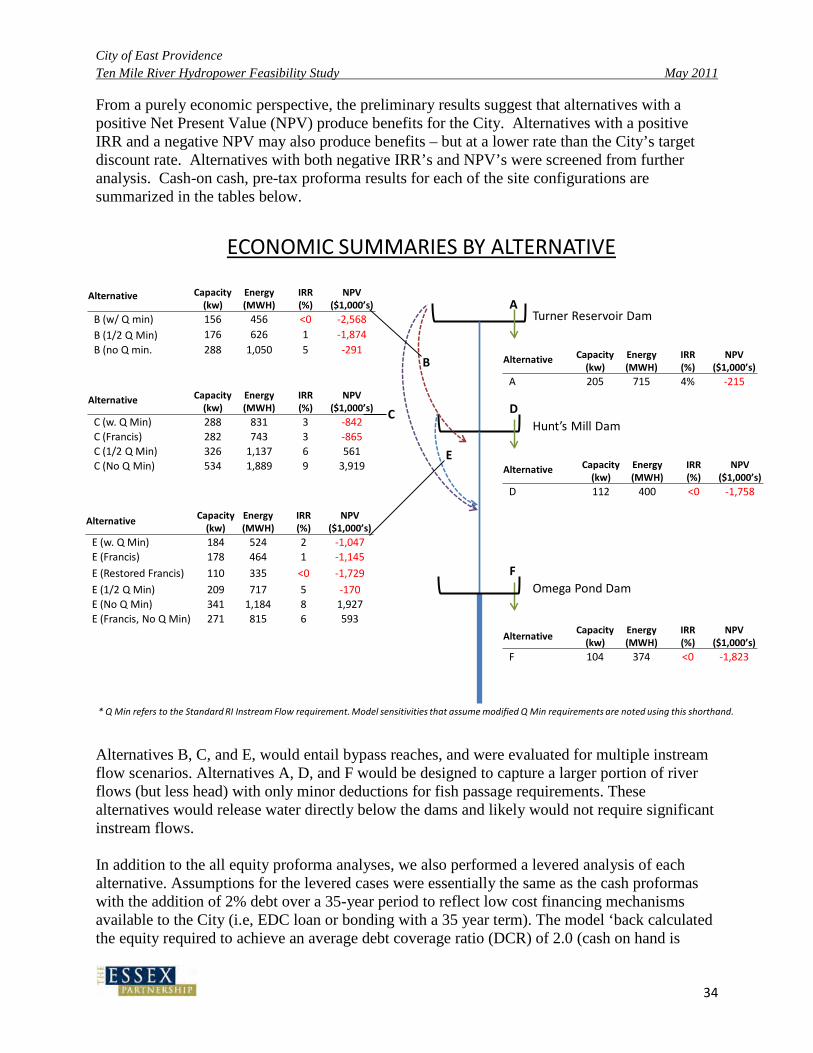
From a purely economic perspective, the preliminary results suggest that alternatives with a positive Net Present Value (NPV) produce benefits for the City. Alternatives with a positive IRR and a negative NPV may also produce benefits – but at a lower rate than the City’s target discount rate. Alternatives with both negative IRR’s and NPV’s were screened from further analysis. Cash-on cash, pre-tax proforma results for each of the site configurations are summarized in the tables below.
Alternatives B, C, and E, would entail bypass reaches, and were evaluated for multiple instream flow scenarios. Alternatives A, D, and F would be designed to capture a larger portion of river flows (but less head) with only minor deductions for fish passage requirements. These alternatives would release water directly below the dams and likely would not require significant instream flows. In addition to the all equity proforma analyses, we also performed a levered analysis of each alternative. Assumptions for the levered cases were essentially the same as the cash proformas with the addition of 2% debt over a 35-year period to reflect low cost financing mechanisms available to the City (i.e, EDC loan or bonding with a 35 year term). The model ‘back calculated the equity required to achieve an average debt coverage ratio (DCR) of 2.0 (cash on hand is
Turner Reservoir Dam
Hunt’s Mill Dam
Omega Pond Dam
A
B
C D
E
F
ECONOMIC SUMMARIES BY ALTERNATIVE
* Q Min refers to the Standard RI Instream Flow requirement. Model sensitivities that assume modified Q Min requirements are noted using this shorthand.
Alternative Capacity(kw)
Energy(MWH)
IRR(%)
NPV($1,000’s)
A 205 715 4% -215
Alternative Capacity(kw)
Energy(MWH)
IRR(%)
NPV($1,000’s)
B (w/ Q min) 156 456 <0 -2,568B (1/2 Q Min) 176 626 1 -1,874B (no Q min. 288 1,050 5 -291
Alternative Capacity(kw)
Energy(MWH)
IRR(%)
NPV($1,000’s)
C (w. Q Min) 288 831 3 -842C (Francis) 282 743 3 -865C (1/2 Q Min) 326 1,137 6 561C (No Q Min) 534 1,889 9 3,919 Alternative Capacity
(kw)Energy(MWH)
IRR(%)
NPV($1,000’s)
D 112 400 <0 -1,758
Alternative Capacity(kw)
Energy(MWH)
IRR(%)
NPV($1,000’s)
E (w. Q Min) 184 524 2 -1,047E (Francis) 178 464 1 -1,145E (Restored Francis) 110 335 <0 -1,729E (1/2 Q Min) 209 717 5 -170E (No Q Min) 341 1,184 8 1,927E (Francis, No Q Min) 271 815 6 593
AlternativeCapacity
(kw)Energy(MWH)
IRR(%)
NPV($1,000’s)
F 104 374 <0 -1,823

City of East Providence Ten Mile River Hydropower Feasibility Study May 2011
35
equal to 2x the annual debt service obligation). Results of the most economically attractive alternatives are summarized below. Additional sensitivity results are provided in Appendix E. Debt Levered After-Tax Economic Summary (Alternatives C & E assume ½ RI ABF)
No Alternative Project IRR (%)
Cumulative NPV
($1,000s)
Discounted Payback Period (yrs.)
A Turner Reservoir Dam 6 319 19
C Turner – Hunt’s Mill Powerhouse (1/2 RI ABF) 8 1,528 19
E Hunt’s Mill Dam – Hunt’s Mill Powerhouse (1/2 RI ABF) 6 367 19
Alternative A entails constructing a turbine at the Turner Reservoir Dam to develop approximately 14-feet of head. This configuration reduces environmental impacts – allowing the project to capture a large percentage of river flows. On an all-equity basis, this alternative yields a 4% IRR. Financing the project with long-term debt increases the IRR to 6% and produces over $300,000 of NPV benefits. Alternative C involves diverting water from Turner Reservoir to the historic Hunt’s Mill powerhouse to develop the greatest amount of head (38 feet). Under the RI Modified Base Flow scenario the configuration is not economic because instream flow requirements significantly reduce the amount of flow available to the turbine for generation. Under the “half min flow” scenario however, the alternative becomes more attractive (due to the availability of more flow for generation) yielding an all equity IRR of 6%. Leveraging this alternative increases the IRR to 8% and produces over $1.5 million of NPV benefits. Under the “no min flow” scenario, the value of Alternative C increases even further providing an all equity IRR of 9% and approximately $3.9 million of NPV benefits. This indicates the significant upside potential of conducting site-specific studies and agency consultations to refine instream flow requirements. Development of Alternatives A and C must be weighed against the regulatory risk associated the spillway adequacy issue at the Turner Reservoir Dam. The cost of remedial measures could easily exceed the benefits from hydro development. These risks would have to be better understood before proceeding with hydro development at Turner Reservoir. Alternative E, would utilize the historic hydropower alignment diverts water from the Hunt’s Mill Dam to the old Hunt’s Mill powerhouse. Under the “half min flow” scenario, an all equity project would yield a 5% IRR. Financing the project increases the IRR to 6% and produces over $350,000 of NPV benefits. The “no min flow” scenario would yield an 8% IRR and nearly $2 million of NPV benefits for an all-equity project. As with Alternative C, there is significant upside potential if the instream flow requirements can be reduced through agency consultations and site specific study.

City of East Providence Ten Mile River Hydropower Feasibility Study May 2011
36
Development at Omega Pond Dam (Alternative F) does not appear economic, largely because of low average head (8 feet). Of the options evaluated for the Hunt’s Mill powerhouse site, redeveloping the existing powerhouse with a new, modern designed Francis turbine appears to hold the most promise. A significant upside to this configuration is the potential reuse of existing civil features and infrastructure. A more detailed optimization analysis of this alternative would refine and balance generating equipment options with potential instream flow requirements.

City of East Providence Ten Mile River Hydropower Feasibility Study May 2011
37
Summary of Findings Key findings from the feasibility study are summarized below. Findings regarding economic viability reflect an all-equity analysis with no consideration of possible tax treatments or financial leveraging. This approach tends to be conservative. Where there was uncertainty, we also tended to make conservative assumptions to help avoid surprises. Dam Conditions and Suitability for Hydro Development
• The existing dams appear to be in good overall condition. With proper care and maintenance customary to the hydro industry, all three dams can reasonably be expected to last a long time (i.e., equal to or greater than life of the hydro project).
• Published reports indicate that the hydraulic capacity of the Turner Reservoir Dam spillway may be inadequate. This issue represents an area of significant uncertainty relative to hydropower licensing.
Electrical Interconnections • Interconnection of hydroelectric generators at each of the sites would require less than
one mile of upgraded (3-phase, 15-kv) service. • At 15 kv, the projects would add approximately 8 amps to the existing distribution lines
and are not likely to overload the circuit or require any significant upgrades. Development Integral with Dam (Alternatives A, D, and F)
• Development of configurations involving less than 10-ft of head does not appear economic given the river’s flow characteristics. Only Turner Reservoir Dam exhibits enough head to produce sufficient generation to offset threshold development costs, as shown in the table below.
Dam Alt. Head IRR Turner Reservoir Dam A 14.5-ft 4% Hunt’s Mill Dam D 8.5 <0 Omega Pond Dam F 8.0 <0
• Additional analyses that look more specifically at load proximity and refined equipment selection for the Omega Pond Dam could affect these preliminary results and may be warranted.
Development Involving River Bypasses (Alternatives B, C, and E)
• None of the alternatives involving a river bypass reach are attractive with full RI ABF requirements.
• With half of the RI ABF, two Alternatives, C & E appear potentially attractive. • With no minimum flow, Alternatives C & E become very attractive. These results
suggest that conducting site specific instream flow and water quality studies would be warranted to establish a minimum flow less than the RI ABF standard. Preliminary discussions with regulators indicate that alternative instream flow regimes could be negotiated based on site specific analysis.

City of East Providence Ten Mile River Hydropower Feasibility Study May 2011
38
• Alternative C (Turner to Hunt’s Mill powerhouse) appears slightly more attractive than Alternative E (historic Hunt’s mill alignment), but has over twice the bypass reach and wetland impact as well as significant risk associated with the Turner Reservoir spillway adequacy.
• A reasonable strategy would be to proceed with Alternative E as the preferred least risk option while the spillway adequacy issue at Turner Reservoir is investigated.
Re-Development of Hunt’s Mill
• Repowering the existing hydropower unit at Hunt’s Mill with a modern design Francis runner appears slightly more attractive than constructing a new powerhouse with a new Kaplan unit. This approach takes advantage of existing infrastructure, avoids the cost of powerhouse construction, and reflects lower overall equipment cost.
• Restoring hydropower at Hunt’s Mill is consistent with the City’s long-term plans for the site as a “green technology” education and learning center.
• A logical next step would be to conduct an optimization analysis to further refine and balance equipment options with respect to reuse of existing infrastructure and instream flow requirements.
Next Steps (Phase II)
• Confirm redevelopment of the Hunt’s Mill (Alternative E) as the preferred option. • Evaluate the spillway adequacy issue at the Turner Reservoir Dam. If the issue cannot be
resolved with further study and costly remedial measures would be required, hydro development may not be feasible.
• Explore options for pre-development funding assistance with the Rhode Island Economic Development Corporation, the Rhode Island Foundation, and others.
• Prepare and file a preliminary permit application with FERC to secure priority status for the Hunt’s Mill and Turner Reservoir sites. This would be relatively short money to preserve the City’s options and avoid potentially costly legal proceedings in the event of competing applications.
• In parallel, file a request for a formal determination of FERC has jurisdiction at the formerly powered Hunt’s Mill site.
• Investigate the remaining waterpower infrastructure associated with Alternative E to support redevelopment.
• Initiate formal consultations with regulatory agencies and other stakeholders to identify/confirm natural and cultural resource concerns. Work collaboratively to identify, develop and implement appropriate strategies to address these concerns.
• Optimize Alternative E (i.e., configuration and equipment) to make the best use of existing infrastructure. Optimization analysis would help to control development costs, maximize energy production and provide adequate protection of environmental resources.
• Refine cost estimates, energy model and economic analysis based on the results of the optimization study.
APPENDIX A
Preliminary Dam Inspection Report

Hydropower Feasibility Study City of East Providence, Rhode Island
PRELIMINARY INSPECTION OF
TURNER, HUNT’S MILL, & OMEGA DAMS
DRAFT
The Essex Partnership LLC Newport, Rhode Island
November 2010

Hydropower Feasibility Study City of East Providence, Rhode Island
Preliminary Inspection of
Turner, Hunt’s Mill, and Omega Dams
Prepared for:
The Essex Partnership LLC Newport, Rhode Island
Prepared by:
MBP Consulting Portland, Maine
DRAFT
November 2010

PRELIMINARY INSPECTION OF TURNER, HUNT’S MILL AND OMEGA DAMS
ii
TABLE OF CONTENTS Section Page
1.0 Summary ..................................................................................................................................1 2.0 Introduction ...............................................................................................................................2 3.0 Dam Description .......................................................................................................................3
3.1 Turner Reservoir Dam .....................................................................................................3 3.2 Hunt’s Mill Dam .............................................................................................................4 3.3 Omega Pond Dam ...........................................................................................................5
4.0 Inspection .................................................................................................................................6 4.1 Turner Reservoir Dam .....................................................................................................6 4.2 Hunt’s Mill Dam .............................................................................................................8 4.3 Omega Pond Dam ...........................................................................................................9
5.0 Conclusions and Discussions .................................................................................................10 5.1 Turner Reservoir Dam ...................................................................................................10 5.2 Hunt’s Mill Dam ...........................................................................................................11 5.3 Omega Pond Dam .........................................................................................................12
6.0 Recommendations ..................................................................................................................13 6.1 Turner Reservoir Dam ...................................................................................................13 6.2 Hunt’s Mill Dam ...........................................................................................................13 6.3 Omega Pond Dam .........................................................................................................14
7.0 Opinion of Probable Cost of Remedial Measures ...................................................................15 7.1 Turner Reservoir Dam ...................................................................................................15 7.2 Hunt’s Mill Dam ...........................................................................................................15 7.3 Omega Pond Dam .........................................................................................................15
8.0 Comparison of RIDEM and FERC Dam Safety Regulations .................................................16 9.0 References ...............................................................................................................................17 Appendices
Appendix A: Inspection Photographs ....................................................................................18

1.0 SUMMARY A preliminary inspection of Turner Reservoir, Hunt’s Mill, and Omega Pond dams, all located on the Ten Mile River, Rhode Island, was performed on October 13, 2010. The purpose of the inspection was to evaluate their condition in relation to potential hydropower development and public safety. The inspection was conducted by MBP Consulting (MBP), Portland, Maine acting as a subcontractor to The Essex Partnership LLC (Essex), Newport, Rhode Island. The inspected dams are small to intermediate size, run-of-river structures. Two dams, Hunt’s Mill and Omega Pond, are classified by the State of Rhode Island (State) as low hazard potential facilities1 and Turner Dam is rated as high hazard potential structure2
.
Visual inspection of the dams was performed with the spillways in an overflow condition, except the Turner Dam which was in non-overflow condition. Flow over the spillways limited the assessment of the Hunt’s Mill and Omega Pond facilities. The preliminary results indicate that all inspected dams are structurally sound and in fair condition. There were no apparent conditions that would preclude them from hydropower development. No adverse conditions were observed that require immediate remedial actions. The Turner Reservoir Dam is classified by the State as a high hazard potential structure and would therefore be subject to compliance with Part 12 of the Federal Power Act (Dam safety) if it was to be redeveloped for hydropower under a Federal Energy Regulatory Commission (FERC) license. More detailed analyses and studies would have to be performed to determine if additional remedial measures would be required to meet FERC safety criteria. The Hunt’s Mill and Omega Pond Dams are classified as low hazard structures by the State. Based on the inspection findings, major recommendations related to public safety include restoration of the manholes to monitor condition of the drainage system of the left embankment of the Turner Reservoir Dam and repair of the leaking headrace entrance closure wall and deteriorated upstream wall of the Hunt’s Mill Dam. Typical recommendations related to operation and maintenance of the inspected dams include; brush and tree removal, repair of deteriorated concrete surfaces, and repointing of stone masonry structures. It is also recommended that the Hunt’s Mill and Omega Pond Dams be inspected during a low flow period to observe the exposed water retaining structures for signs of deterioration, seepage, undermining, and structural distress. This inspection should be supplemented by an underwater and/or bathymetric survey of the submerged areas of dams, as required. Installation of fish passage facilities is currently underway of planned for each dam. This work will require dewatering portions of the project areas and presents an opportunity for more detailed inspection. and survey prior to and during construction work. Following the above-water and underwater inspection findings, additional remedial measures should be developed, as necessary. 1 Failure of dams with low hazard potential classification can result in no probable loss of human life and low economic and /or environmental losses (Reference 1). 2 Failure of dams with high hazard potential classification can probably result in loss of human life (Reference 1).

PRELIMINARY INSPECTION OF TURNER, HUNT’S MILL AND OMEGA DAMS
2
This report includes an opinion of probable cost for recommended remedial measures (Section 7) and comparison of dam safety regulations adopted by the Rhode Island Department of Environmental Management (RIDEM) and FERC (Section 8). 2.0 INTRODUCTION A visual inspection of Turner Reservoir, Hunt’s Mill, and Omega Pond dams, all located on the Ten Mile River, a tributary of the Seekonk River, in the City of East Providence, Providence County, Rhode Island was conducted by MBP on October 13, 2010. The purpose of the inspection was to identify existing or potential deficiencies in water retaining structures which could adversely impact their operation, integrity, and public safety and/or complicate the development of hydropower. The inspection was performed as a part of a hydropower feasibility study undertaken by Essex and the City of East Providence (City), RI, the owner and operator of the dams. As part of this assessment MBP also reviewed available documentation on each dam, including previous dam inspection reports, photographic records, engineering assessments and drawings, and fish passage restoration plans. Interviews with the representatives from the City were conducted to gain additional information on each site and understand current operations and maintenance practices.

PRELIMINARY INSPECTION OF TURNER, HUNT’S MILL AND OMEGA DAMS
3
3.0 DAM DESCRIPTIONS 3.1 Turner Reservoir Dam The James V. Turner Reservoir Dam (State No. 407, National No. RI01002), is the most upstream dam of the inspected projects. The 1,550 foot-long dam consists of a left3
embankment, spillway, low level outlet, and right (west) dike (References 2, 4-10). The dam supports an impoundment with a maximum reservoir storage and surface area of 3,100 acre-feet and 390 acres, respectively. Historically the impoundment was used for public water supply. According to State records use of the reservoir as a water supply source was abandoned circa 1970 due to water quality concerns. The impoundment is currently served to provide recreational opportunities. Efforts to restore upstream fish passage on the river will expand its use to provide spawning and rearing habitat for anadromous fishes (river herring and shad). The dam is classified by the State as an intermediate size structure with high hazard potential.
The left earthen embankment spans the original river streambed, and is 525 feet long, 22 feet above the original streambed grade and 15 feet wide at the top. Upstream and downstream slopes are 3H:1V (horizontal to vertical) and 4H:1V, respectively. The top of the embankment is at el, 51.04
. The upstream slope is armored with 3 foot-thick riprap and the top and downstream slope are grassed. Embankment seepage control is provided by a corewall and drainage blanket installed in 1984. According to engineering drawings there is a concrete corewall with the top el. 48± is 3 feet below the top of the embankment and contains a steel sheet pile cutoff at the base extending to underlying bedrock. A 6-inch diameter perforated drain runs along the concrete corewall footing and discharges through an outlet in the downstream end of the left concrete retaining wall. A manhole on the top of the embankment provides access to the drain pipe. A 300 foot-long, 1 foot-thick gravel drainage blanket is located at the toe of the embankment and extends from the left abutment toward the spillway. The blanket contains two 6-inch diameter seepage collection pipes with the outlets in stone gabion walls at the toe of the blanket. There is a 16-inch diameter storm drain within the embankment discharging in the middle of the left retaining wall. Manholes at the toe of the embankment provide access to the blanket and stormwater drains.
The concrete overflow spillway is 200 feet long with a rounded crest at elevation 46.0 and a maximum freeboard of 5 feet. The toe of the spillway is protected with a 30-35 foot-wide concrete stilling basin and a 50 foot-wide stone apron located immediately downstream of the stilling basin. The left concrete retaining wall between the spillway and left embankment extends about 100 feet downstream. The spillway is likely founded on sedimentary type bedrock. The 25 foot-long concrete low level outlet abuts the right end of the spillway. The structure contains two 54-inch diameter conduits and a 66-inch diameter penstock intake. The invert of the conduits and intake are at el. 29.5 and el. 32.25, respectively. The penstock is buried into the 3 The terms “left” and “right” refer to an orientation looking in the downstream direction. 4 All elevations in the report taken from the previous inspection reports, unless otherwise noted, are in feet and refer to the National Geodetic Vertical Datum (NGVD).

PRELIMINARY INSPECTION OF TURNER, HUNT’S MILL AND OMEGA DAMS
4
ground and runs approximately 2,400 feet along the right river bank toward the Hunt’s Mill Dam downstream. In the past, the penstock was used for water supply and was abandoned in 1970. A brick gatehouse on the top of the outlet structure contains three manual operators to adjust the position of slide gates for the conduits and penstock. The right concrete retaining wall, curved in plan, extends about 100 feet downstream from the outlet structure. The right earthen dike is 750 feet long, 6 feet high, and 15 feet wide at the top which is at el. 51.0. The 3H:1V upstream slope of the dike is covered with riprap. The dike top and 2H:1V downstream slope are grass protected. The reservoir banks also include a west berm and east earthen dikes 1 and 2 to contain the impoundment during high water. The east dikes are 2 feet high, 15 feet wide at the top, and 550 feet long (dike 1) and 350 feet long (dike 2). These features were not observed as part of the inspection. The dam drainage area is 48 square miles. For a high hazard structure the project spillway design flood (SDF) is equal to one half of the probable maximum flood (½PMF). Phase II analysis (Citation__) calculated the ½ PMF outflow to be 16,828 cubic feet per second (cfs) resulting in overtopping of the earthen dam structures by 1.2 feet under current condition and by 1.65 feet with the proposed fishway (References 6, 10). The combined hydraulic capacity of the existing spillway and outlet works is 9,316 cfs or 55 percent of the ½ PMF. The existing spillway capacity with both outlet gates closed or inoperable is 8,750 cfs or 52 percent of the ½ PMF. Installation of the fishway will reduce the spillway and low level outlet capacity to 9,022 cfs or 54 percent of the ½ PMF. The dam was built in 1934 and repaired in 1984-1990. The rehabilitation activities included installation of a drainage blanket at the toe of the left embankment (1984), resurfacing of the spillway, outlet works, and retaining walls (1989), placement of stone riprap on the upstream slope of the right dike and stone gabions at the toe of the right retaining wall to control scour (1990). Construction of a denil fish ladder on the left side of the spillway, designed by the US Army Corps of Engineers (USACE), is scheduled for the fall of 2010. The dam was previously inspected by the USACE in 1981, New England Engineering in 1982, RIDEM in 1989, 1999, 2001, 2004 and 2007, City in 2004, and Pare Corporation in 2007. The most recent inspection reports (2007) found the dam to be in good to fair condition. 3.2 Hunt’s Mill Dam The Hunt’s Mill Dam (State No. 405, National No. RI02601), is located on the Ten Mile River approximately2,600 feet downstream of the Turner Reservoir Dam. The 175 foot-long dam consists of an overflow spillway and a closure wall at an abandoned headrace entrance. The appurtenant facilities, all abandoned, include a penstock, headrace, pumphouse, and a 100 foot-long tailrace (References 2, 11-14). There is also a pond retaining wall upstream of the intake closure wall at the City’s park area. The dam with impoundment storage of 140 acre-feet and surface area of 0.4 acres is classified by the State as a small size structure with low hazard

PRELIMINARY INSPECTION OF TURNER, HUNT’S MILL AND OMEGA DAMS
5
potential. The dam was used for hydropower generation and public water supply from the 1930s to 1970. The Hunt’s Mill Dam is currently used for recreation. The curved stone masonry spillway is 125 feet long, 10 feet high and is founded on bedrock. A 36” diameter concrete conduit penetrates the spillway near the right end, continues a short distance downstream and terminates in a rounded concrete stilling well. The headrace entrance was sealed with a steel sheet pile and concrete wall. The headrace downstream of the entrance closure wall has a short, open flume transitioning into an underground steel penstock which leads to the pumphouse. The pumphouse contains a 144 kW vertical Francis hydro-generating unit, presently retired. The 100 foot-long tailrace re-joins the river downstream of the pumphouse. According to the National Inventory of Dams (NID) inventory, the dam was built in 1928 (Reference 11), however, hydropower generation is reported to have existed at the site since 1893 (Reference 14). There are no construction or inspection records of the dam. There is a photographic record of the dam taken by the City during the March 31, 2010 flood. The photos indicate that the dam was completely submerged during the flood with the pond level at the top of the upstream retaining wall. Fish passage designed by the USACE, New England District is currently being installed at the right side of the dam will remove the concrete conduit and stilling well and utilize the abandoned headrace. 3.3 Omega Pond Dam The Omega Pond Dam (State No. 406, National No. RI01001), is located at the confluence of the Ten Mile and Seekonk Rivers. The 200 foot-long, 18 foot-high dam consists of an overflow spillway and abutment walls. The dam impoundment has storage of 280 acre-feet and surface area of 33 acres and is used for recreation and supply water by several adjacent industries. The dam is classified by the State as a small size structure with low hazard potential. The 112 foot-long, 15 foot-high spillway is a concrete gravity structure with downstream stone facing. The stone facing was built of nine stair-stepped granite courses, each 20 inches high (Reference 16). The spillway crest and base are at el. 9.90 and el. -5.4±, respectively (Reference 17). The spillway crest is 4 feet wide and inclined upward in the downstream direction. The 15 foot-wide spillway base is supported with four rows of wooden piles installed across the streambed. Foundation seepage control is provided with two rows of 6 inch-thick, 24 foot-deep wooden splined pile sheeting located at the heel and toe of the structure. The spillway toe is protected with a 70± foot-wide concrete apron with wooden planking on the top and supported with wooden foundation piles. Massive, stone-mortared walls with the top at el. 14.8 feet (NGVD) or 4.9 feet above the spillway crest form both spillway abutments. The abutment walls support a steel truss railroad bridge located immediately downstream of the dam. The original drawings (Reference 16) indicate that the abutments contain concrete core walls, similar in construction to the spillway, extending 42 feet into earthen railroad embankments. The existing dam was built in 1918 downstream of an original timbercrib dam erected in 1883. There are no construction or inspection records of the previous dam. Similar to the Turner and

PRELIMINARY INSPECTION OF TURNER, HUNT’S MILL AND OMEGA DAMS
6
Hunt’s Mill Dams, the Omega Pond Dam is scheduled for installation of a fishway to restore anadromous fish runs in the river. The fish passage designed by the USACE, New England District will be installed at the right side of the dam utilizing a portion of the existing spillway. The fishway drawings contain the project elevations surveyed by the USACE in 2009 and include plans of the existing and original dams. 4.0 INSPECTION Prior to site visits, available data including the RIDEM and NID records, aerial maps, historic photographs, previous inspection reports, studies for proposed hydropower developments and fishway installation at the dams, and other pertinent information were reviewed. The inspection briefly started with Hunt’s Mill Dam, proceeded to the Turner Dam, then Omega Dam, and ended at the Hunt’s Mill Dam. The inspection included visual observation of the dams from both abutments for signs of misalignment, movement, settlement, sinkholes, cracking, leakage or seepage, excessive deterioration, erosion, scouring, and vegetation growth. Pond water level control equipment, such as gates, were observed for serviceability and access. A digital photo record was made at each dam site to document findings and for later reference (Appendix A). Where available, observations were compared with the findings from previous inspections. The inspection was performed by Myron Petrovsky, P.E. of MBP assisted by Fred Szufnarowski, P.E. and Jon Petrillo of Essex. Senior Planner for the City, Mr. Patrick Hanner was present at the beginning of the inspection. The inspection was conducted on October 13, 2010. The weather was clear with ambient temperature in the mid-60s° F. The following are inspection findings for each dam arranged in upstream to downstream order. 4.1 Turner Reservoir Dam During the time of the inspection, the reservoir was lowering with the one outlet gate half-open and the other outlet gate closed in preparation for construction of a fish passage at left end of the spillway. The reservoir level at the beginning of the inspection was 2.3 feet below the spillway crest. The tailwater level was measured 2.7 feet below the top of the downstream section of the left retaining wall. Left Embankment. The inspection was conducted with silt fences installed along the top and toe of the embankment for scheduled construction of a fish passage at the spillway this fall. The embankment top will serve as an access route to the construction area. The upstream slope of the embankment covered with dumped, 3 to 4-foot size blasted stone riprap was in stable condition (Photo 5). The slope showed no signs of sloughing or excessive erosion. The riprap at some areas of the slope was displaced exposing bedding, more notably at the spillway area. Some woody vegetation was growing through open spaces in riprap. The top and downstream slope covered with manicured grass, were solid with no areas of significant

PRELIMINARY INSPECTION OF TURNER, HUNT’S MILL AND OMEGA DAMS
7
erosion, cracking, wetness, seepage, or animal activities observed. The drainage blanket installed at the toe of the embankment was firm, with no soft spots noted. The drainage blanket discharged through two, 6-inch diameter seepage collection pipe outlets stone gabion walls at the toe (Photo 6). The gabion walls appeared stable with the pipe outlets discharging no flow. The area downstream of the drainage blanket was covered with a large body of stagnant water which is reported to be the location of the original stream. The toe of the embankment and a portion of the drainage blanket were overgrown with trees and woody brush not allowing a thorough inspection (Photos 2, 5, 6). The vegetation’s root systems may penetrate the blanket and reduce its hydraulic efficiency. The foundation drain collecting seepage at the base of the concrete corewall appeared to be functioning with moderate discharge observed exiting the semi-submerged pipe outlet in the left retaining wall. The seepage flow was clear, with no signs of soil migration. Some small pieces of bacterial greenish sludge were coming out of the pipe. The manholes installed on the top of the embankment and drainage blanket to the monitor condition of the underground collection drains were not accessible for observation. Spillway. The spillway with the exposed crest and downstream face appeared to be true to the original alignment (Photos 1, 2). No signs of movement, sagging, or deterioration of the structure, which was rehabilitated in 1989, were observed. The downstream face was dry including vertical expansion joints separating the spillway monoliths. The spillway toe was submerged and the stilling basin and riprap revetment were not visible through the water. No pressure boils indicating excessive seepage at the base were observed at the toe area. A pile of stone was accumulated in the stilling basin floor near the left retaining wall at a distance of approximately 20 feet from the spillway (Photos 2, 3). This stone accumulation, not noted in the previous inspection reports, could be the result of riprap displacement during the record flood of March 31, 2010. The spillway approach and discharge channels were clear from debris. The approach channel at the area near the left training wall appeared to be partially silted with the top of sediment measured 5-7 feet below the spillway crest. Retaining Walls. Both the left and right concrete retaining walls, resurfaced in 1989, appeared stable and solid (Photos 1-3). The left wall showed some signs of deterioration with two areas of minor spalling on the top (Photo 3). The channel face of the wall contained a near horizontal crack, approximately 4 feet above tailwater, covered with efflorescence (Photo 2). The crack and vertical construction joints, observed from the right bank of the discharge channel, were dry. The area at the downstream end of the wall was densely vegetated impeding the inspection (Photo 2). The right retaining wall contained a few small areas on the top with deteriorated concrete at vertical construction joints and a sub-horizontal crack with efflorescence at the downstream end (Photo 1). The wall appeared to be sound. The top of stone gabion walls installed over the spillway channel floor in 1990 to control scour from low level outlet discharges at the retaining wall base were visible. The assessment of the gabion walls as an erosion protection measure was difficult due to submergence. Low Level Outlets. The outlet works, repaired in 1989, were observed from the left embankment and right dike and appeared sound, stable, and operable (Photo 1). No significant cracking, deterioration, or signs of movement were found. A random cracking observed on the upstream

PRELIMINARY INSPECTION OF TURNER, HUNT’S MILL AND OMEGA DAMS
8
face of the structure appeared superficial. The juncture of the outlet with the right dike was tight, with no signs of depression or erosion at the interface between two structures. The outlet conduits, which were half-exposed on the downstream side, appeared sound. The brick gatehouse walls and floor observed from the outside and inside were intact and free of structural cracks. The manual gate operators were reportedly in serviceable condition (Photo 4). Although not a structural concern, the plywood flooring of the gatehouse appeared to be nearing the end of its useful life and if left in its current state may pose a safety hazard. Right Dike. The right earthen dike extending between the outlet works and right dam abutment was stable and in sound condition (Photos 1, 7). The shallow structure was covered with manicured grass on the top and downstream slope and heavy riprap on the upstream slope. The dike was true to the design alignment and showed no signs of sinkholes, cracking, wetness, or active seepage. The slope riprap refilled in 1989 was stable with some missing or displaced stones at the area near the outlet structure. Woody brush was growing in gaps between some riprap stones. The toe of the dike was sparsely vegetated with large trees and a manicured grass understory. 4.2 Hunt’s Mill Dam Spillway. During the time of the inspection, the pond level estimated at an existing staff gage was 3.9 feet below the top of the upstream retaining wall. The spillway was discharging a few inches of flow impeding a thorough inspection of the structure and other project facilities. The curved stone masonry spillway appeared to be true to the original alignment (Photos 8, 9). No visible signs of movement or deterioration of the structure were observed through moving water. The pattern of the flow over the spillway crest was relatively uniform indicating that the crest was intact and contained no large gaps created by missing stone blocks. The spillway approach channel was generally unobstructed to the flow. The left abutment overgrown with dense vegetation (Photo 8) was inaccessible for evaluation. The toe of the spillway in immediate proximity was covered with discharging flow. Approximately 30-50 feet downstream of the spillway, the streambed exposed highly irregular rock outcrops with a massive rock island rising to nearly the level of the spillway crest and then dropping about 10-15 feet to the streambed. This rock island may reduce the spillway capacity by early submergence during high water. Conduit and Chamber. The right side of the spillway contained a 36” diameter steel conduit penetrating through the structure (Photo 9), then connected to a reinforced concrete pipe (Photo 10) leading to a concrete chamber (Photo 11). The steel conduit was rusty and corrosion pitted but appeared sound. This conduit has reportedly been removed after the inspection as part of the fish passage construction project. A section of the concrete pipe attached to the steel penstock was severely deteriorated exposing steel reinforcing. The 12 inch-thick concrete chamber, about 8-10 feet in diameter, was deteriorated with friable, laminated concrete observed on the upper part of the structure. The conduit outlet at the chamber floor was moderately leaking. The riverside chamber wall contained a 2 foot-deep waste weir with wooden planks for releasing excess water (Photo 11). The conduit between the spillway and the chamber was supported with concrete pedestals which were not accessible for the inspection.

PRELIMINARY INSPECTION OF TURNER, HUNT’S MILL AND OMEGA DAMS
9
Headrace. The abandoned headrace consisted of an open flume and underground steel penstock leading to the pumphouse. The entrance to the headrace from the pond was plugged with PZ-steel sheet piles and sealed with a concrete wall on the downstream side. The composite closure wall appeared stable and in fair condition. The steel piling was well interlocked, with no apparent gaps and signs of movement or buckling (Photos 12, 13). The concrete wall was generally free of major cracks and deterioration, however, the left side of the concrete wall was leaking at the juncture with the riverside headrace wall (Photo 13). The headrace walls of brick and stone masonry construction covered with concrete showed signs of deterioration resulting in spalling and missing concrete cover in some areas (Photo 14). The floor of the headrace was vegetated with brush and covered with debris impeding the inspection (Photo 13). The underground section of the headrace (penstock) was inaccessible and not inspected. The mortared-stone pumphouse containing an original turbine-generation unit was in excellent condition. Pond Retaining Wall. The wall on the right side of the pond extends upstream from the headrace entrance encompassing a portion of the pond adjacent to the City park (Photo 15). The wall of mortared rubble was covered with concrete. The concrete cover on about two thirds of the wall length was deteriorated to a depth of 2 inches exposing steel reinforcing on the top (Photos 15, 16). The end of the wall, overgrown with dense vegetation, was disintegrated exposing original masonry. 4.3 Omega Pond Dam Spillway. During the time of the inspection, the spillway was discharging a 1-2 inch-deep flow impeding a thorough visual inspection (Photos 17, 19). The maximum spillway freeboard measured at the right retaining wall was 5 feet conforming to the original drawings. The spillway alignment between the abutment walls was straight and true to the design intent. The cascading flow pattern was smooth and uniform suggesting no presence of areas with significant erosion or damage on the crest and downstream face (Photo 17). The discharge channel containing a concrete apron covered with timber planking was inundated with shallow water. The apron flow surface was relatively even, with no major disturbances which could be the result of deep scour. Abutment Walls. The spillway abutment walls supporting the downstream steel truss railroad bridge appeared stable and plumb (Photos 17, 19, 21). No signs of wall instability or seepage were observed. The cut stone blocks forming the walls were intact and in place, except the right wall where a stone block was likely missing at the bottom of the steps (Photo 21). The top of the left wall covered with concrete experienced surficial erosion (Photo 18). Both walls contained a number of open masonry joints with missing mortar (Photos 17, 21). Concrete corewalls at each abutment as indicated on the project drawings, were not observed. However, the areas with assumed corewall location were heavily vegetated obstructing the inspection (Photos 17, 19). The earthen railway embankments forming the dam abutments were stable and watertight.

PRELIMINARY INSPECTION OF TURNER, HUNT’S MILL AND OMEGA DAMS
10
5.0 CONCLUSIONS AND DISCUSSIONS Based on review of project information and field observations made during the October 13, 2010 site visits, the inspected Turner, Hunt’s Mill, and Omega dams appear to be structurally sound, safe, operational, and well suited for hydropower development. There are no major structural, maintenance or operational deficiencies in the dam projects requiring immediate remedial actions. The dams appeared true to the original alignment as shown in the project drawings and were in reasonable condition. All dams were able to withstand the record, March 31, 2010 flood without noticeable change in condition. The toe of the spillways was not inspected for scour, erosion, undermining, and seepage due to submergence. During construction of fish passage facilities, the City may take advantage of a rare opportunity to inspect, survey, and evaluate the condition of the coffer-dammed and dewatered portions of the dams which are usually submerged. 5.1 Turner Reservoir Dam
• The high hazard potential dam observed with the reservoir lowered and no water flowing over the spillway appeared true to the original alignment and stable. The project was in process of preparations for installation of fish passage facilities at the left end of the spillway.
• The exposed spillway, resurfaced in 1989, was in sound condition, with no signs of erosion, cracking, or seepage. Stone piles accumulated at the left area of the spillway stilling basin, not observed in the previous inspections, could be the result of spillway operation during the record March 31, 2010 flood.
• According to the hydrologic studies conducted in 1981 and 1982 (References 5, 6), the existing spillway is undersized and cannot pass the ½ PMF, the project spillway design flood (SDF), resulting in overtopping and failure of the earthern embankment dam by erosion. High hazard dams under the FERC jurisdiction would be required to conduct a hydrologic/hydraulic study to determine the Inflow Design Flood (IDF) involving dam break analysis and incremental inundation assessment of the impacted downstream areas. The resulting IDF may be equal to the PMF or be a fraction of the PMF.
• The concrete retaining walls supporting the left embankment and right dike were rehabilitated in 1989. The walls experienced relatively minor deterioration in the form isolated spalling and random cracking. No seepage through or around the walls was observed. The downstream areas of the walls were heavily vegetated obstructing the inspection.
• The low level outlet concrete substructure and brick superstructure (gatehouse) were in good order, with no significant signs of deterioration (excepting the interior flooring). The outlets, gates, and operators were in serviceable condition. The penstock intake gate located in the gatehouse was closed long ago (circa 1970), abandoned, and its operability is unknown.

PRELIMINARY INSPECTION OF TURNER, HUNT’S MILL AND OMEGA DAMS
11
• The left embankment (aka an embankment dam) was stable and well maintained. The
upstream slope riprap placed in 1990 was displaced at the area near spillway and showed signs of opportunistic vegetative colonization. The downstream face and toe appeared sound with no evidence of seepage. The corewall foundation drain was functioning, discharging a moderate flow. Both drainage blanket pipe outlets appeared to be dry which could be the result of the embankment watertightness or reduction in drainage effectiveness due to internal siltation or/and plugging with vegetation roots. The toe of the embankment was densely covered with trees and brush. The manholes installed to monitor and maintain drainage systems of the embankment were inaccessible for the inspection (overgrown??). The top of the embankment containing the manhole(s) will be used as an access route during construction of the fishway.
• The right dike was stable, well maintained and in sound condition.
• The reservoir perimeter west berm and dikes 1 and 2 were not observed during this inspection.
5.2 Hunt’s Mill Dam
• The low hazard potential dam observed with the spillway discharging flow over the crest appeared in good alignment and stable. The left spillway abutment was densely overgrown and not inspected.
• The 3 to 4-foot diameter steel/concrete conduit penetrating through the right end of the spillway and connected to the concrete chamber downstream was significantly deteriorated exposing steel reinforcing in its concrete section. The conduit was not visible on the pond side through a shallow depth of water. The pipe leakage at the chamber outlet was minimal. The chamber concrete was in poor to fair condition.
• The steel sheet pile/concrete wall plugging an entrance to the abandoned headrace from the pond was stable and in fair condition. The wall was moderately leaking at the downstream corner with the left headrace wall. The open headrace flume walls, overlaid with concrete, were deteriorated at several areas and appeared stable. The flume floor was covered with debris and vegetated. The underground penstock was inaccessible. The stone masonry pumphouse containing a retired hydro-generating unit was in excellent condition.
• The upstream concrete/masonry wall located along the right shoreline of the pond and adjacent to the headrace entrance was deteriorated significantly. The wall is not a critical project structure, however, failure of the wall could result in the bank erosion and undermining of the City’s park security fence.
• The site is scheduled for installation of a fish passage at the right dam abutment. According to available drawings (Reference 12), the construction will involve removal of the concrete conduit and chamber, and lowering of the headrace entrance closure wall.

PRELIMINARY INSPECTION OF TURNER, HUNT’S MILL AND OMEGA DAMS
12
• The dam is not equipped with a low level outlet for maintenance or repairs. The City
may consider installation of outlet works at the location of the abandoned conduit or headrace closure wall during construction of fish passage.
5.3 Omega Pond Dam
• The low hazard potential dam, observed with a 1 to 2-inch deep flow over the spillway, appeared well aligned and conformed to the original plans.
• Based on the observed flow pattern, the spillway crest, downstream face, and apron had not experienced significant deterioration due to the continuous impact of the flowing water.
• The spillway abutment walls made of granite ashlar stone were intact and stable with
some masonry joints open due to missing mortar.
• The earthen railway embankments abutting the dam were stable and watertight. The dam abutments were overgrown with dense vegetation impeding the inspection. The concrete corewalls extending from the dam into the embankments, as indicated on the original drawings, were not found.
• The dam is scheduled for installation of fish passage facilities at the left end of the spillway. The fishway will occupy about 31 feet of the spillway length (Reference 17) which will likely reduce the hydraulic capacity of the spillway.
• The project does not have a low level outlet to draw the pond level down for maintenance and repair of the dam. The City may consider installation of a new outlet works at the dam during construction of the fish passage facility.

PRELIMINARY INSPECTION OF TURNER, HUNT’S MILL AND OMEGA DAMS
13
6.0 RECOMMENDATIONS There are no major safety or maintenance/operation concerns with the inspected dams requiring immediate attention or implementation of remedial measures. The following recommendations are proposed to verify the inspection findings, and improve a long-term reliability, operational readiness, and safety of the City’s dams. Implementation of the proposed recommendations will also aid the City to comply with the FERC safety regulations if the dam sites are otherwise feasible for development of hydroelectric power. 6.1 Turner Reservoir Dam
1. Conduct, under direction of a professional engineer, a visual inspection and survey of the dewatered dam construction area prior to and during installation of the fish passage. Perform an underwater and/or bathymetric survey of the remaining submerged areas at the toe of the spillway and outlet works during a low flow period. Based on the above-water and underwater inspection findings, develop remedial measures for the dam, as necessary.
2. Repair the areas of the left and right concrete retaining walls with surface concrete deterioration.
3. Repair the inaccessible manholes of the left embankment and evaluate the internal condition of drains and drainage blanket. Protect the manholes from traffic during construction of the fish passage.
4. Monitor water level and flow in the left embankment manholes quarterly coupled with recording the reservoir level to ensure proper function and identify changes in flow rates and/or water clarity.
5. Monitor the seepage flow at the foundation drain outlet in the left retaining wall quarterly for change in condition combined with recording the reservoir level to ensure proper function and identify changes in flow rates and/or water clarity.
6. Replace riprap in the areas of the upstream slope of the left embankment and right dike with displaced or missing riprap.
7. Cut and remove vegetation from the toe of the left embankment and downstream areas of the left and right retaining walls and inspect the cleared areas of the structures. Include vegetation control at the dam into a project maintenance plan.
8. Inspect the west berm and dikes 1 and 2 located in the reservoir perimeter and assess their condition.
6.2 Hunt’s Mill Dam

PRELIMINARY INSPECTION OF TURNER, HUNT’S MILL AND OMEGA DAMS
14
1. Conduct a visual inspection and survey of the dewatered dam construction area prior to and during installation of a proposed fish passage. Perform an underwater and/or bathymetric survey of the remaining submerged areas of the of the spillway during a low flow period. Based on the above-water and underwater inspection findings, develop remedial measures for the dam, as necessary.
2. Repair the leaking area of the closure wall at the headrace entrance.
3. Repair deteriorated concrete on the interior surfaces of the open flume headrace walls.
4. Repair the deteriorated upstream concrete/masonry wall located along the right shoreline of the pond and adjacent to the headrace entrance.
5. Inspect the abandoned underground steel penstock of the headrace and evaluate condition.
6. Cut and remove trees and brush from the left spillway abutment. Inspect the cleared area and evaluate condition.
6.3 Omega Pond Dam
1. Conduct a visual inspection and survey of the dewatered dam construction area prior to and during installation of a proposed fish passage. Perform an underwater and/or bathymetric survey of the remaining submerged areas of the spillway and apron during a low flow period. Based on the above-water and underwater inspection findings, develop remedial measures for the dam, as necessary.
2. Repoint open joints in the masonry work of the right and left abutment retaining walls of the dam.
3. Cut and remove brush and trees from the upstream areas at the left and right abutment retaining walls. Inspect the cleared abutment areas and assess condition.

PRELIMINARY INSPECTION OF TURNER, HUNT’S MILL AND OMEGA DAMS
15
7.0 OPINION OF CONSTRUCTION COST OF REMEDIAL MEASURES
An opinion of remedial cost for each dam was developed based on the available project data, inspection findings, recommendations, and our experience with similar repair projects. The remedial measures considered include items which are related directly to dam safety. Operation and maintenance (O&M) items, such as brush and tree removal, masonry repointing, grass mowing, riprap replacement, or repair of deteriorated concrete surfaces were considered to be O&M items and were not included in the cost estimate. 7.1 Turner Reservoir Dam
• Inspect by a professional engineer the dewatered areas of the dam prior to and during construction of the fish passage. $5K-$10K
• Conduct the underwater/bathymetric survey of the submerged areas of the spillway and outlet works. $5K-$10K
• Repair the inaccessible manholes of the left embankment. $10K-$15K Total $20K-$30K
7.2 Hunt’s Mill Dam
• Conduct the underwater/bathymetric survey of the submerged areas of the spillway. $5K-$10K
• Repair the leaking headrace entrance closure wall. $5K-$10K • Repair the deteriorated upstream concrete/masonry wall. $10K-$20K
Total $20K-$40K 7.3 Omega Pond Dam
• Conduct the underwater/bathymetric survey of the submerged areas of the spillway and spillway apron. $5K-$10K Total $5K-$10K

PRELIMINARY INSPECTION OF TURNER, HUNT’S MILL AND OMEGA DAMS
16
8.0 COMPARISON OF RIDEM AND FERC DAM SAFETY REGULATIONS A brief comparison was made between the RIDEM and FERC dam safety regulations based on RIDEM Rules and Regulations for Dam Safety (December 2007) and FERC Engineering Guidelines for Evaluation of Hydropower Projects (2003) and Operating Manual for Inspection of Projects and Supervision of Licenses for Water Power Projects. Hazard Classification. Both agencies use high, significant, and low hazard potential classification for dams based on the guidelines developed by the USACE for the National Program for the Inspection of Non-Federal Dams in 1976 and FEMA in 1998. The dam hazard potential rating in the State is established based on dam size (small, intermediate, high) and evaluation of downstream population and major infrastructure at risk. The FERC approach to dam hazard is based on hydrologic analysis of the watershed and incremental impact of downstream flooding with no-failure and failure of the dam. Spillway Design Flood (SDF). There are apparently no State regulations for the SDF to be used for different dam hazard ratings. The states usually accept the USACE criteria for selection of the SDF based on a hazard potential classification and dam size. With the existing dam size and hazard rating, the SDF for the Turner Dam is the PMF and is the 50 to 100-year flood for the Hunt’s Mill and Omega dams. FERC requires that the inflow design flood (IDF) for dams with significant or high hazard category (Turner Dam) to be determined. The IDF for the project is defined as the flood when combined with a dam failure will cause no significant incremental impact to downstream areas. The IDF could be equal to the full PMF or a fraction of the PMF. There are no FERC hydrologic/hydraulic requirements for low hazard dams (Hunt’s Mill and Omega dams). Stability Analysis. There are no State regulations for stability of dams. FERC requires that dams with high and significant hazard potential classification be analyzed for stability. For the Turner Dam, major water retaining structures such as a spillway, outlet works, left embankment, and right dike, should evaluated for stability. No stability analysis would be for required by FERC for Hunt’s Mill and Omega dams. Emergency Action Plan (EAP). The State has apparently no EAP regulations. FERC requires that EAP’s be developed for dams with high and significant hazard potential rating. Inspection Frequency. The State requires that high hazard dams to be inspected every 2 years and significant and low hazard dams every 5 years. FERC mandates that dams with high and significant hazard potential be inspected by a FERC approved independent consultant every 5 years and all dams by a FERC engineer annually.
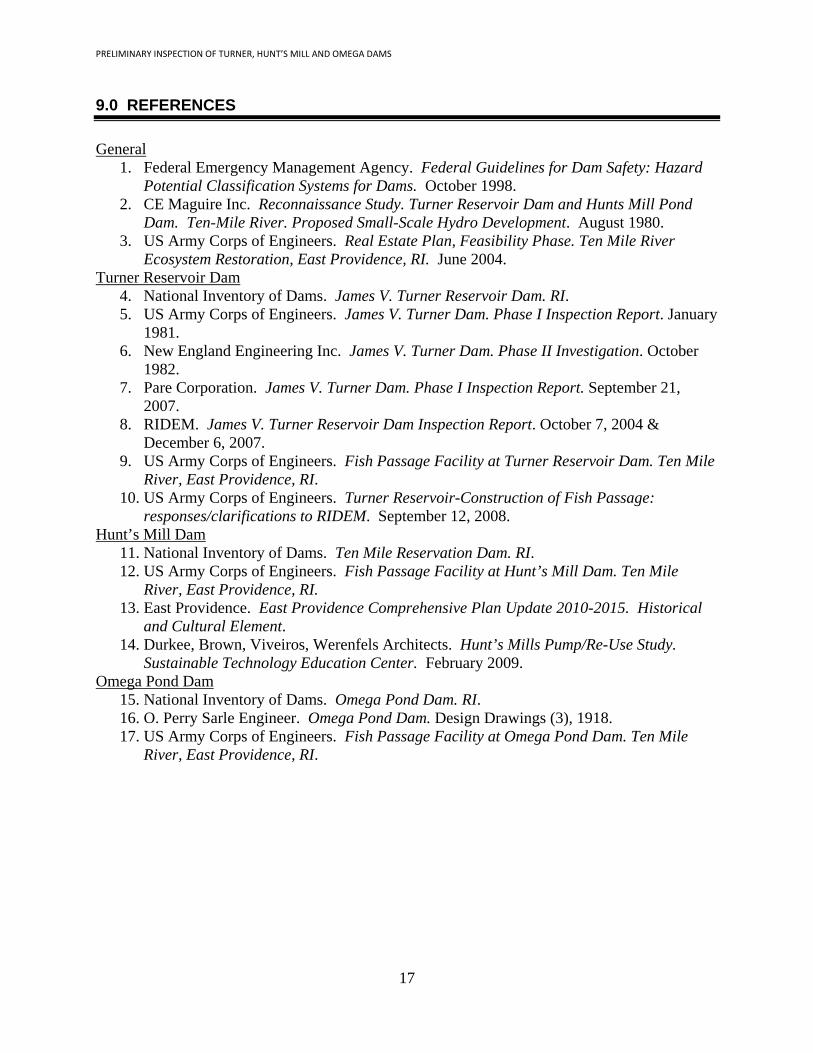
PRELIMINARY INSPECTION OF TURNER, HUNT’S MILL AND OMEGA DAMS
17
9.0 REFERENCES General
1. Federal Emergency Management Agency. Federal Guidelines for Dam Safety: Hazard Potential Classification Systems for Dams. October 1998.
2. CE Maguire Inc. Reconnaissance Study. Turner Reservoir Dam and Hunts Mill Pond Dam. Ten-Mile River. Proposed Small-Scale Hydro Development. August 1980.
3. US Army Corps of Engineers. Real Estate Plan, Feasibility Phase. Ten Mile River Ecosystem Restoration, East Providence, RI. June 2004.
Turner Reservoir Dam 4. National Inventory of Dams. James V. Turner Reservoir Dam. RI. 5. US Army Corps of Engineers. James V. Turner Dam. Phase I Inspection Report. January
1981. 6. New England Engineering Inc. James V. Turner Dam. Phase II Investigation. October
1982. 7. Pare Corporation. James V. Turner Dam. Phase I Inspection Report. September 21,
2007. 8. RIDEM. James V. Turner Reservoir Dam Inspection Report. October 7, 2004 &
December 6, 2007. 9. US Army Corps of Engineers. Fish Passage Facility at Turner Reservoir Dam. Ten Mile
River, East Providence, RI. 10. US Army Corps of Engineers. Turner Reservoir-Construction of Fish Passage:
responses/clarifications to RIDEM. September 12, 2008. Hunt’s Mill Dam
11. National Inventory of Dams. Ten Mile Reservation Dam. RI. 12. US Army Corps of Engineers. Fish Passage Facility at Hunt’s Mill Dam. Ten Mile
River, East Providence, RI. 13. East Providence. East Providence Comprehensive Plan Update 2010-2015. Historical
and Cultural Element. 14. Durkee, Brown, Viveiros, Werenfels Architects. Hunt’s Mills Pump/Re-Use Study.
Sustainable Technology Education Center. February 2009. Omega Pond Dam
15. National Inventory of Dams. Omega Pond Dam. RI. 16. O. Perry Sarle Engineer. Omega Pond Dam. Design Drawings (3), 1918. 17. US Army Corps of Engineers. Fish Passage Facility at Omega Pond Dam. Ten Mile
River, East Providence, RI.

PRELIMINARY INSPECTION OF TURNER, HUNT’S MILL AND OMEGA DAMS
18
Appendix A
Inspection Photographs

Photo 1. Turner Reservoir Dam. Spillway, outlet works, right retaining wall, and right dike from left embankment. Photo 2. Turner Reservoir Dam. Spillway, left retaining wall, and left embankment from right river bank. Note horizontal crack in left retaining wall (red arrow), stone pile in tailwater (blue arrow), and vegetation at left embankment toe. Photo 3. Turner Reservoir Dam. Left retaining wall. Note areas with concrete deterioration (red arrows) and pile of stone in tailwater (blue arrow).

Photo 4. Turner Reservoir Dam. Low level outlet gatehouse with two floor gate operators. Photo 5. Turner Reservoir Dam. Left embankment from spillway. Photo 6. Turner Reservoir Dam. Stone gabion wall with drain pipe outlet (arrow) at toe of left embankment.

Photo 7. Turner Reservoir Dam. Right dike looking toward gatehouse. Note upstream slope area with missing riprap (arrow). Photo 8. Hunt’s Mill Dam. Spillway from right abutment.
Photo 9. Hunt’s Mill Dam. Abandoned power penstock at spillway toe.

Photo 10. Hunt’s Mill Dam. Deteriorated concrete section of abandoned penstock (arrow). Photo 11. Hunt’s Mill Dam. Concrete chamber interior with upstream penstock inlet on bottom and waste weir with wooden planks in riverside wall (arrow). Note concrete wall deterioration. Photo 12. Hunt’s Mill Dam. Upstream view of abandoned headrace entrance closure wall (arrow).

Photo 13. Hunt’s Mill Dam. Downstream view of abandoned headrace closure wall leaking at left corner (arrow). Photo 14. Hunt’s Mill Dam. Concrete deterioration of riverside headrace open flume wall. Note stone masonry exposed due to missing concrete cover (arrow). Photo 15. Hunt’s Mill Dam. Retaining wall upstream of headrace entrance closure wall.

Photo 16. Hunt’s Mill Dam. Deteriorated concrete with exposed reinforcement on top of upstream retaining wall (arrow).
Photo 17. Omega Pond Dam. Spillway and left abutment. Photo 18. Omega Pond Dam. Deteriorated concrete on top of left masonry abutment.

Photo 19. Omega Pond Dam. Spillway and right abutment. Photo 20. Omega Pond Dam. Top of right dam masonry abutment from railway bridge.
Photo 21. Omega Pond Dam. Right dam abutment from left abutment wall. Note open masonry joints , missing stone step at bottom (arrow) and vegetation.

APPENDIX B
Hydrologic and Hydraulic Data
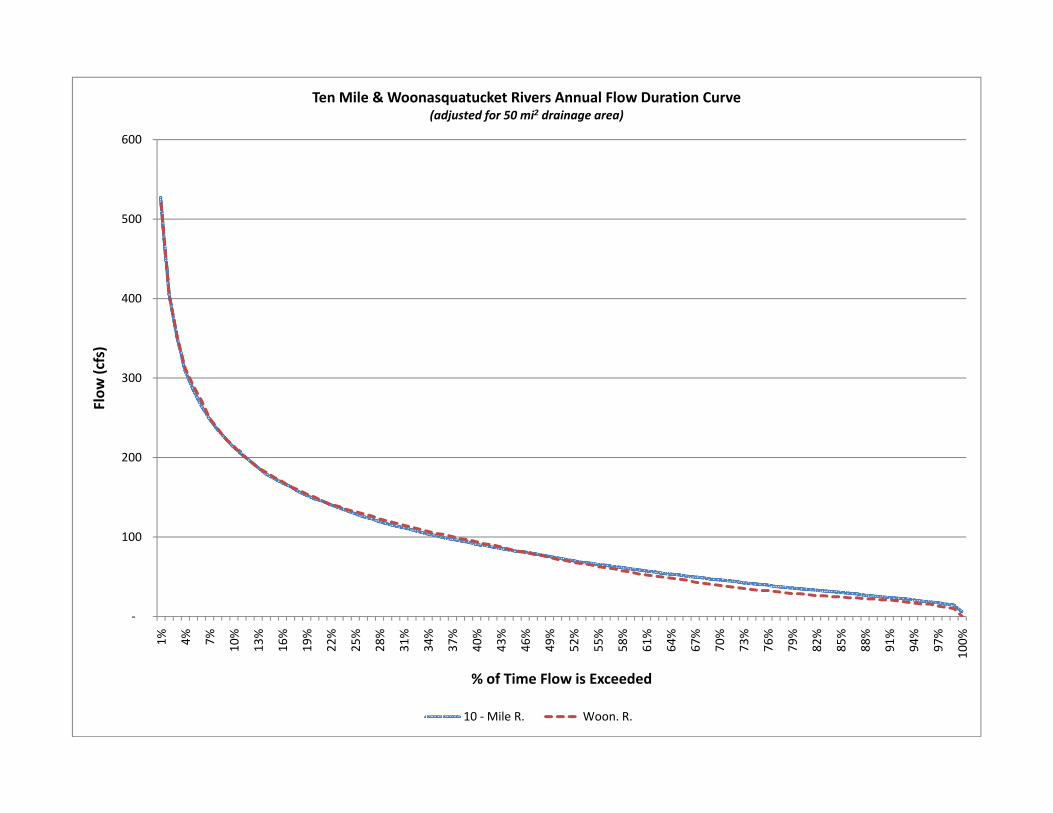
600
Ten Mile & Woonasquatucket Rivers Annual Flow Duration Curve(adjusted for 50 mi2 drainage area)
500
400
s)
300
Flow
(cfs
100
200
‐
1% 4% 7% 0% 3% 6% 9% 2% 5% 8% 1% 4% 7% 0% 3% 6% 9% 2% 5% 8% 1% 4% 7% 0% 3% 6% 9% 2% 5% 8% 1% 4% 7% 0%1 4 7 10 13 16 19 22 25 28 31 34 37 40 43 46 49 52 55 58 61 64 67 70 73 76 79 82 85 88 91 94 97 100
% of Time Flow is Exceeded
10 ‐Mile R. Woon. R.

Privileged and Confidential Ten Mile River Hydro
Phase I Feasibility StudyHydraulics
ID SiteBM
BM Notes
HW TWGross Head(rounded)
D.A.(SqMi) Notes
A Turners Reservoir Dam 52.6 1,4 47.6 33.1 14.5 48Pond was drawndown for fishpassage construction (10/13/10), HW
assumes pond elev. @ spillway crest.
B Turner ‐ Hunt's Mill see notes 1,4 47.6 25.6 22.0 48Alt. develops head between 2 sites. Creates ~2.3k' bypass reach. Assumes new unit at Hunt's spillway.
C Turner ‐ Hunt's Mill 2 see notes 3,4 47.6 10.6 38.0 48Alt. develops head between 2 sites. Creates ~3.5 k' bypass reach. Repowers existing unit and restores 66" penstock and tailrace.
D Hunt's Mill Dam 38.0 1,4 34.0 25.6 8.5 49Assumes discharge to upper pool area d/s of spillway to minmize instream flow concerns.
E Hunt's Mill Dam 2 38.0 1,3,4 34.0 10.6 23.5 49Assumes: intake at Hunt's Mill spillway, restore existing turbine & tailrace. Creates ~ 1.2k' bypass.
F Omega Pond Dam 14.8 1,2,4 10.1 1.9 8.0 50Tailwater is tidally influenced (see notes below). GH range; crest elevation (9.9' NAVD 88) +/‐ 1/2 tidal range (2.085' )= 7.8‐12'
BM Note References:1. Elevation control from ACOE fishway plans (NAVD 88)2. TW is tidally influenced:a. Tidal range from NOAA Tidal Observation Station @ Providence (Sta. # 8454000) due to consistency in vertical datum w/ fishpassage plans.http://tidesandcurrents.noaa.gov/data_menu.shtml?stn=8454000 Providence, RI&type=Historic+Tide+Datab. Mean tidal range @ station is 4.17'.c. TW elev. recorded corresponds to ‐1.77 (NAVD 88) @ 15:00 on 10/13/10
3. Hunt's Mill Tailrace TW elevations derived from FIS floodprofile; expressed in NGVD 29. Approximate NGVD 29 tailrace elevation of 12' converted to NAVD 88. To determine conversion factor ‐ NGVD 29 elevation of Turner Spillway = 49', NAVD 88 elevation of Turner Spillway = 47.6; conversion of NGVD to NAVD by subtracting difference [1.4'] from the NGVD elevation. Calculated tailrace elevation at Hunt's Mill is approximately 10' NAVD 88 (NGVD 29 elevation of 12 ‐ 1.4 = 10.6' NAVD 88).
4. Several inconsistencies in available information were noted during site hydraulic analysis. For example, Corps noted tailwater elevations at Turner Reservoir below headwater elevations at Hunt's Mill located downstream. To compensate for these inconsistencies FEMA FIS floodprofiles were used to estimate the available gross head at options which developed head between Turner and Hunt's Mill. These data were provided in NGVD 29 and were subject to the conversion factor described above to maintain consistent vertical control datums.
E Prov_Energy_1‐07‐2011.xlsx For Planning Purposes Only

APPENDIX C
Preliminary Project Configurations

Turner Reservoir DamA
Hunt’s Mill DamMile River
B
C DHunt s Mill Dam
Ten M
E
FOmega Pond Dam
nk River
Seekon

A Turner’s Reservoir Dam

B Turner – Hunt’s Mill

C Turner – Hunt’s Mill 2

D Hunt’s Mill Dam

D Hunt’s Mill 2

E Omega Pond Dam

APPENDIX D
Natural Resource Mapping
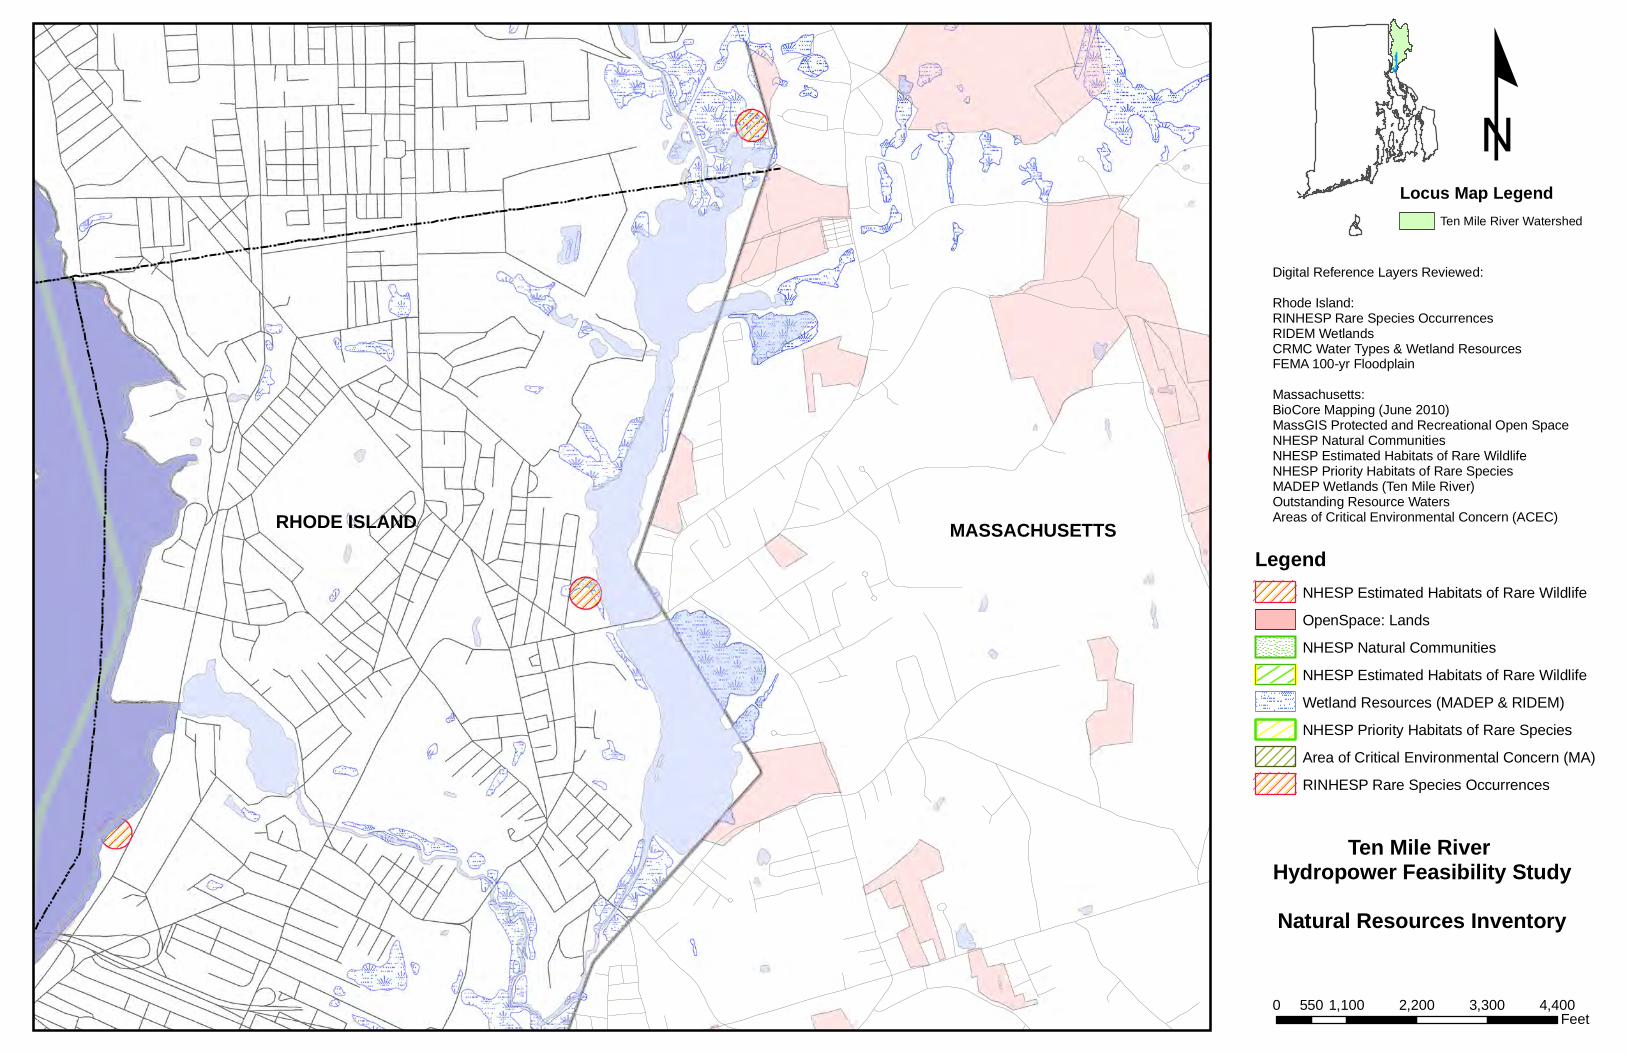
Ten Mile River Hydropower Feasibility StudyNatural Resources Inventory
0 1,100 2,200 3,300 4,400550Feet
Locus Map LegendTen Mile River Watershed
LegendNHESP Estimated Habitats of Rare Wildlife OpenSpace: LandsNHESP Natural CommunitiesNHESP Estimated Habitats of Rare Wildlife Wetland Resources (MADEP & RIDEM)NHESP Priority Habitats of Rare SpeciesArea of Critical Environmental Concern (MA)RINHESP Rare Species Occurrences
Digital Reference Layers Reviewed:Rhode Island:RINHESP Rare Species OccurrencesRIDEM WetlandsCRMC Water Types & Wetland ResourcesFEMA 100-yr FloodplainMassachusetts:BioCore Mapping (June 2010)MassGIS Protected and Recreational Open SpaceNHESP Natural CommunitiesNHESP Estimated Habitats of Rare WildlifeNHESP Priority Habitats of Rare SpeciesMADEP Wetlands (Ten Mile River)Outstanding Resource WatersAreas of Critical Environmental Concern (ACEC)RHODE ISLAND MASSACHUSETTS
º

Seekonk River (L) and Ten Mile River (R)
Ten Mile River Hydropower Feasibility StudyNatural Resources Inventory
0 390 780 1,170 1,560195Feet
Locus Map LegendTen Mile River Watershed
LegendNHESP Estimated Habitats of Rare Wildlife OpenSpace: LandsNHESP Natural CommunitiesNHESP Estimated Habitats of Rare Wildlife Wetland Resources (MADEP & RIDEM)NHESP Priority Habitats of Rare SpeciesArea of Critical Environmental Concern (MA)RINHESP Rare Species Occurrences
Digital Reference Layers Reviewed:Rhode Island:RINHESP Rare Species OccurrencesRIDEM WetlandsCRMC Water Types & Wetland ResourcesFEMA 100-yr FloodplainMassachusetts:BioCore Mapping (June 2010)MassGIS Protected and Recreational Open SpaceNHESP Natural CommunitiesNHESP Estimated Habitats of Rare WildlifeNHESP Priority Habitats of Rare SpeciesMADEP Wetlands (Ten Mile River)Outstanding Resource WatersAreas of Critical Environmental Concern (ACEC)
RHODE ISLAND
MASSACHUSETTS
º
Wetland Complex in Potential Bypass Area
Turner Reservoir Dam Spillway
Hunt's Mill Dam
Hunt's MillHistoric Tailrace
Wetland Complex in Potential Bypass Area

Seekonk River (L) and Ten Mile River (R)
Ten Mile River Hydropower Feasibility StudyNatural Resources Inventory
0 320 640 960 1,280160Feet
Locus Map LegendTen Mile River Watershed
LegendNHESP Estimated Habitats of Rare Wildlife OpenSpace: LandsNHESP Natural CommunitiesNHESP Estimated Habitats of Rare Wildlife Wetland Resources (MADEP & RIDEM)NHESP Priority Habitats of Rare SpeciesArea of Critical Environmental Concern (MA)RINHESP Rare Species Occurrences
Digital Reference Layers Reviewed:Rhode Island:RINHESP Rare Species OccurrencesRIDEM WetlandsCRMC Water Types & Wetland ResourcesFEMA 100-yr FloodplainMassachusetts:BioCore Mapping (June 2010)MassGIS Protected and Recreational Open SpaceNHESP Natural CommunitiesNHESP Estimated Habitats of Rare WildlifeNHESP Priority Habitats of Rare SpeciesMADEP Wetlands (Ten Mile River)Outstanding Resource WatersAreas of Critical Environmental Concern (ACEC)
º
Omega Dam
RINHESPRare Spp. Occurrence
Owner of Partial Existing Water Rights
Navig
ation
Chan
nel

RIDEM WATER QUALITY & FISHERIES DATA

TURNER RESERVOIR-OMEGA POND- 2007 CONTINUOUS DISSOLVED OXYGEN MEASUREMENTS Continuous measurements of dissolved oxygen, temperature, depth, specific conductance, and chlorophyll were collected in Central Pond and the Turner Reservoir from July 30 through Nov 7, 2007. These data were collected using YSI 6-series sondes, deployed at ‘surface’ and ‘depth’ locations in Turner Reservoir and a single ‘surface’ station in Central Pond. Deployments occurred in what was estimated to be the deepest part of each impoundment. The approximate locations of both sondes are shown in Figure 1. In Turner Reservoir, a ‘surface’ sonde was deployed approximately 0.6-0.9 meters below the surface and a ‘depth’ sonde was deployed approximately 0.9 meters off the bottom. In Central Pond, the single ‘surface’ sonde was located approximately 0.6-0.9 meters below the surface. Total water column depths were approximately 3.5-4.0 meters in the Turner Reservoir and 1.8 meters in Central Pond. Sondes were secured at fixed vertical depths to nylon marine line which in turn was attached to a 20 lb-anchor. Buoy systems were used to maintain the sondes in a vertical position for the duration of deployment. Sondes were changed every two to three weeks. Independent measurements of the measured parameters were made with an YSI-85 handheld monitor. Chlorophyll samples were collected at the time the sondes were changed and were analyzed by the URI Watershed Watch Laboratory in Kingston, RI. Figure 1. Approximate Location of 2007 Sonde Deployments.

All data underwent QA-QC by URI GSO staff in 2007. The data collected was found to be of good quality with the exception that sensor/sonde failure produced periods of missing data as listed below: Central Pond- 9/10/2007-11/07/2007 Turner Reservoir (surface) - 9/10/2007-10/23/2007 Turner Reservoir (depth) – 8/16/2007-10/23/2007 The station results were provided by GSO staff based upon the available data and are as follows using Rhode Island’s freshwater warm water fish habitat criteria for dissolved oxygen (Table 1. 8.D: http://www.dem.ri.gov/pubs/regs/regs/water/h20q09.pdf) Central Pond- no violations Lower Turner Reservoir (surface water station)- 4 violations to the daily average (<60% saturation) 95 violations of the instantaneous values (<5 mg/L) using hourly data Lower Turner Reservoir (bottom water column station)- 2 violations of the 7 day mean (<6 mg/L for a 7 day period) 8 violations of the daily average (<60% saturation) 217 violations of the instantaneous values (<5 mg/L) using hourly data During the monitoring period a widespread cyanobacteria bloom affected both Central Pond and Turner Reservoir. The bloom appeared in early July and lasted until mid-November. Photographs are provided below. The first image is of Central Pond, the second is of Turner Reservoir. Given the conditions during the survey (see below), hypoxic bottom waters and wide diel swings in surface saturation would not be unexpected and are seen in the data.


TURNER RESERVOIR-OMEGA POND- 2009 CONTINUOUS DISSOLVED OXYGEN MEASUREMENTS Continuous measurements of dissolved oxygen, temperature, depth, specific conductance, and chlorophyll were collected in Turner Reservoir and Omega Pond from June through Sept 2009. These data were collected using YSI 6-series sondes, deployed at ‘surface’ and ‘depth’ locations in the water column in what was estimated to be the deepest part of each impoundment. The approximate locations of both sondes are shown in Figure 1. At each location, a ‘surface’ sonde was deployed approximately 0.6-0.9 meters below the surface and a ‘depth’ sonde was deployed approximately 0.9 meters off the bottom. Total water column depths were approximately 3.5-4.0 meters in the Turner Reservoir and 3.5 meters in Omega Pond. Sondes were secured at fixed vertical depths to nylon marine line which in turn was attached to a 20 lb-anchor. Buoy systems were used to maintain the sondes in a vertical position for the duration of deployment. Sondes were changed every two to three weeks. Independent measurements of the measured parameters were made with an YSI-85 handheld monitor. Chlorophyll samples were collected for analysis by the URI Watershed Watch Laboratory in Kingston, RI. Figure 1. Approximate Location of YSI Sonde deployments.

The 2009 data have undergone QA-QC by DEM staff and have been flagged and/or edited where necessary. In general, the data reveal occasional hypoxic conditions at the surface and near anoxic conditions in the bottom waters. The hydrogen sulfide released from sulfur fixing bacteria in the sediments is believed to have affected the bottom sensors’ accuracy in measuring dissolved oxygen conditions in the Turner Reservoir with measurements indicating more severe hypoxia/anoxia than possibly exist – thus these data have been flagged and edited from the dataset. Vertical profiling data obtained with a YSI-85 handheld monitor frequently showed weak to moderate thermal stratification accompanied by near-anoxic conditions in the bottom 0.5 to 1.0 meters of both impoundments. Examination of precipitation and discharge data in conjunction with dissolved oxygen levels obtained from YSI 6-series sondes showed that moderate rainfall events and associated increases in flow flushed out the near-anoxic bottom water in both impoundments and mixed the water column such that dissolved oxygen levels became similar at surface and depth. After these types of events, the impoundments again showed thermal stratification and associated decreases in bottom water dissolved oxygen levels. The continuous dissolved oxygen data obtained in 2007 from the Turner Reservoir show similar near-anoxic conditions in the bottom waters of the Turner Reservoir, adding credibility to the 2009 ‘near-bottom’ datasets. Rhode Island’s freshwater warm water fish habitat criteria for dissolved oxygen are given in Table 1. 8.D of the States’ Water Quality Regulations: http://www.dem.ri.gov/pubs/regs/regs/water/h20q09.pdf) Both Turner Reservoir and Omega Pond are listed on the State’s 2010 303(d) List of Impaired Waters for dissolved oxygen, based on the 2007 and 2009 datasets.


Initial Agency Coordination
Meeting Notes

27 Vaughan Ave. Newport, RI 02840
(401) 619 - 4872
MEETING NOTES Revised 2/28/11
MEETING DATE: February 15, 2011
SUBJECT: Ten Mile River Hydropower Feasibility Study: Preliminary Agency Coordination Meeting
LOCATION: Hunt’s Mill and Turner Reservoir Dams (Part I) East Providence City Hall (Part II)
PARTICIPANTS: Name Organization Contact Info:
Patrick Hanner East Providence – Sr. Planner / Project Mgr.
[email protected] 401-435-7533
Jeanne Boyle (Part II only)
East Providence – Director of Planning
[email protected] 401- 435-7531
Alisa Richardson, PE Rhode Island Dept. of Environmental Management (DEM) – Water Resources
[email protected] 401-222-3961 ext. 7232
Terry Walsh DEM – Water Resources [email protected] 401-222-3961 ext. 7243
Neal Personeus DEM – Water Resources [email protected]
401-222-4700 ext. 7610
Bruce DiGennaro The Essex Partnership (EP) [email protected]
401-619-4872
Jonathan Petrillo EP [email protected]
203-623-4637 The meeting was held to discuss preliminary results of a hydropower feasibility study at three dams on the Ten Mile River. Discussion focused on the State’s instream flow requirements and other potential resource concerns in the context of hydropower development. A summary of the discussions follows. Copy of background materials provided to participants ahead of the meeting are provided as an attachment.
I. Site Visits – Meeting participants conducted brief walking tours of the Hunt’s Mill and Turner Reservoir dams. EP provided an overview of the hydropower alternatives considered at each site and the anticipated resource protection concerns. PH provided a summary of on-going fish passage restoration efforts at each site as well as a synopsis of the City’s longer-term goals for redevelopment of the Hunt’s Mill property as a “green technology” education center. The site historically supported hydropower operations – redevelopment of hydropower would complement the City’s future re-use plans and provide a modern context for the historic use. River flows during the site visit were approximately 150 cfs representing the 22 % annual exceedance flow.

2/15/11 Meeting Notes Revised 2/28/11 2
II. Discussion – A more detailed review of the preliminary FS results and associated
resource concerns was conducted at City Hall. Jeanne Boyle (Director of Planning) joined the group at this point. The following sections provide a brief summary of the items discussed – additional background information was provided to participants ahead of the meeting.
a. Drivers of Hydropower – EP discussed the relationship between resource
protection requirements and associated operating conditions on hydropower feasibility. EP evaluated several alternative project configurations for the Omega Pond, Hunt’s Mill and Turner Reservoir dams. The analysis included provisions for providing anticipated resource protection, mitigation and enhancement (PM&E) measures, such as; RI ABF instream flows, fish passage (ladder, attraction, and downstream passage), wetland mitigation, recreation, etc. Since stream flows provide the “fuel” for hydropower generation reductions in the flow available for generation significantly impact the economics of alternatives that would be subject to instream flow requirements (i.e., include bypass reaches).
b. RI Aquatic Base Flow Methodology (RIABF) - AR provided an overview of the State’s standard instream flow policy, including the formulation of State standards. The RI ABF is intended to provide a starting point for applicants interested in projects with water diversion components. DEM understands that each situation has a unique set of variables; modifications to the RI ABF to accommodate specific resource rand/or project requirements would be entertained. The burden of proof for an alternative instream flow standard falls on the applicant. Applicants have not historically pursued alternative instream flow criteria. Several potential site specific approaches were identified; IFIM, MesoHABsim, low flow connectivity analysis; additional methods would also be considered. EP has used the Demonstration Flow Assessment (DFA) methodology in the past with good results. This method engages the applicant as well as agency personnel in assessing habitat types under various flow conditions and determining appropriate and protective instream flows. DEM does not appear to have a favored analytical methodology for determining site specific requirements.
c. Additional concerns – The group discussed other potential concerns with respect to hydropower redevelopment, these concerns are summarized below:
i. Water Quality – All water quality pollutants are subject to the State anti-
degradation policy. The 10-Mile R is on the State 303(d) list of impaired waters. Particular concerns for the study reach include; Cu, Pb, and

2/15/11 Meeting Notes Revised 2/28/11 3
benthic macroinvertebrates1
. In the past, DEM has allowed applicants to develop monitoring and mitigation protocols to address WQ concerns following demonstration of project operations. Although not included on the State’s 303(d) list dissolved oxygen levels would also be of concern. Regulatory thresholds for DO are typically tied to existing (baseline) conditions. A development at Hunt’s Mill would likely utilize WQ conditions at the inlet to Omega Pond as the point of project reference.
ii. Fish Passage – Considering the on-going efforts to restore fish passage to the 10-Mile any hydropower development would need to consider maintaining the effectiveness of fish passage measures. EP included several assumptions for monthly fish passage (attraction, ladder, downstream passage flow, etc.) as part of the analysis. Additional discussion with fish passage partners and stakeholders to review the assumptions and identify concerns is warranted.
Subsequent to the meeting we learned that there is a possibility that hydropower development at sites where funding assistance for fish passage restoration was received from federal partners could require a refund of federal grant monies. This potential requirement should be explored with RIDEM (Jay McGinn) and other fish passage stakeholders.
iii. Wetland Impacts – Alternatives at the Turner Reservoir and Hunt’s Mill
sites could include impacts to existing wetland resources. Examples include:
1. Connectivity of the wetland complex downstream of Turner with the stream channel.
2. Restoration of the historic tailrace at Hunt’s Mill would convert an existing scrub-shrub wetland to open water. Implications of this cover type transition would need to be discussed and evaluated in more detail with the DEM-Wetlands division.
iv. Regulatory Processing – High level discussion of potential approaches to
streamline State permitting process for small (i.e., micro – nano) hydropower projects. Several other States (i.e., Colorado) have MOU’s in place with FERC to achieve this end. In the case of Colorado the State performed an initial screening of sites that could be developed with minimal environmental impacts. Hydropower opportunities in Rhode Island are limited – a potential approach for RI would be to provide preliminary terms and conditions early on. EP offered to facilitate a
1 This listing indicates that sampling results of the benthos did not correlate to the expected results. The details of the incongruity were not discussed.

2/15/11 Meeting Notes Revised 2/28/11 4
discussion between DEM and FERC on overall coordination of hydropower licensing and permitting.

APPENDIX E
Economic Analysis

Energy Modeling Results

Privileged and Confidential Ten Mile River HydroPhase I Feasibility Study
Energy
ID Site
D.A.(SqMi)
Gross Head(ft)
Hyd.Cap(cfs)
Installed Capacity(kw)
Net Annual Energy(MWH)
Capacity Factor
RunnerDia
Meters
PenstkDiaFt.
Equipment Configuration
A Turners Reservoir Dam 48 14.5 213 205 715 40% 1.25 5.82 Horz TubeB Turner - Hunt's Mill 48 22 114 156 456 33% 0.90 4.26 Horz TubeC Turner - Hunt's Mill 2 48 38 114 288 831 33% 0.90 4.26 Vert Kaplan
C-2 Turner - Hunt's Mill 2 (Repowered Franci 48 38 114 282 743 30% 0.92 4.26 Vert FrancisD Hunt's Mill Dam 53 8.5 213 112 400 40% 1.25 5.82 Horz TubeE Hunt's Mill Dam 2 53 23.5 114 184 524 33% 0.90 4.26 Horz Tube
E-2 Hunt's Mill Dam 2 (Repowered Francis) 53 23.5 114 178 464 30% 0.90 4.26 Vert FrancisE-3 Hunt's Mill Dam 2 (Restored Francis) 53 23.5 84 110 335 35% 0.81 3.66 Vert FrancisF Omega Pond Dam 56 8 213 104 374 40% 1.25 5.82 Horz Tube
ID Site
D.A.(SqMi)
Gross Head(ft)
Hyd.Cap(cfs)
Installed Capacity(kw)
Net Annual Energy(MWH)
Capacity Factor
RunnerDia
Meters
PenstkDiaFt.
Equipment Configuration
B Turner - Hunt's Mill 48 22 130 176 626 41% 0.95 4.55 Horz TubeC Turner - Hunt's Mill 2 48 38 130 326 1,137 40% 0.95 4.55 Vert Kaplan
Results w/ Instream Flows
Results w. 1/2 Instream Flows
For Planning Purposes Only E Prov Proforma_1-7-11.xlsx
C Turner Hunt s Mill 2 48 38 130 326 1,137 40% 0.95 4.55 Vert KaplanE Hunt's Mill Dam 2 53 23.5 130 209 717 39% 0.95 4.55 Horz Tube
ID Site
D.A.(SqMi)
Gross Head(ft)
Hyd.Cap(cfs)
Installed Capacity(kw)
Net Annual Energy(MWH)
Capacity Factor
RunnerDia
Meters
PenstkDiaFt.
Equipment Configuration
B Turner - Hunt's Mill 48 22 213 288 1,050 42% 1.25 5.82 Horz TubeC Turner - Hunt's Mill 2 48 38 213 534 1,889 40% 1.25 5.82 Vert KaplanE Hunt's Mill Dam 2 53 23.5 213 341 1,184 40% 1.25 5.82 Horz Tube
E-2 Hunt's Mill 2 (Repowered Francis) 53 23.5 174 271 815 38% 1.12 5.21 Vert Francis
Results w. No Instream Flows
For Planning Purposes Only E Prov Proforma_1-7-11.xlsx

Privileged and Confidential Ten Mile River Hydro
Phase I Feasibility StudyEnergy ADF Kaplan
A D FHead for Installed capacity (FT) 14.5 8.5 8.0
% Exceedance
Max TurbineFlow(CFS)
Net Energy (MWH)
Head (FT)
Net Capacity Factor (%)
InstalledCapacity(kW)
InstalledCapacity(kW)
InstalledCapacity(kW)
739 5 6 8.0 8.5 10 11 12 13 14 14.5 16 15 15 9 8100% 6 14 18 25 27 30 34 38 41 45 49 52 93% 6 3 395% 19 44 55 78 84 95 106 118 129 140 152 163 91% 19 11 1090% 25 55 70 98 105 120 134 148 163 177 191 206 89% 24 14 1385% 30 66 83 117 126 143 160 177 194 211 228 245 87% 30 17 1580% 35 75 94 132 142 161 180 199 218 237 257 276 85% 34 19 1875% 41 84 106 149 160 181 203 224 246 267 289 310 83% 40 22 2170% 46 93 117 165 176 200 224 248 271 295 319 343 81% 45 25 2365% 53 103 129 182 195 221 247 273 300 326 352 378 78% 51 28 2660% 59 112 141 198 212 240 269 297 325 354 382 411 76% 58 32 3055% 67 123 154 217 232 263 294 325 356 387 418 450 73% 66 36 3450% 76 133 167 234 251 284 318 351 385 418 452 485 70% 74 41 3845% 84 143 178 250 268 303 339 375 410 446 482 517 67% 82 45 4240% 94 153 191 267 286 324 362 401 439 477 515 553 64% 92 51 4735% 102 160 200 280 300 340 380 419 459 499 539 579 62% 99 55 5130% 114 170 212 296 317 359 401 443 485 527 569 611 59% 111 61 5725% 130 181 225 314 337 381 426 470 515 559 604 648 55% 126 69 6520% 149 192 239 333 357 404 451 498 545 592 639 686 51% 143 79 7315% 174 204 254 354 379 429 479 529 579 629 679 729 46% 168 92 8610% 213 216 269 374 400 453 505 558 610 663 715 768 40% 205 112 1045% 286 232 288 401 429 485 542 598 654 711 767 823 32% 271 147 1361% 527 243 303 422 452 512 572 632 691 751 811 870 19% 484 254 235
1 2 3 4 5 6 7 8 9 10 11 12 15 17
Alternative
MWH vs Hyd Cap (cfs) MWH vs Installed Cap (kW)
E Prov_Energy_1‐07‐2011.xlsx For Planning Purposes Only
0
100
200
300
400
500
600
700
800
900
0 60 121 182 244 305 366 425 486
Ann
ual Ene
rgy Prod
uction
(MWH)
Hydraulic Capacity (cfs)
MWH vs Hyd. Cap (cfs)
0
100
200
300
400
500
600
700
800
900
0 60 121 182 244 305 366 425
Ann
ual Ene
rgy Prod
uction
(MWH)
Installed Capacity (kw)
MWH vs Installed Cap (kW)
E Prov_Energy_1‐07‐2011.xlsx For Planning Purposes Only

Privileged and Confidential Ten Mile River Hydro
Phase I Feasibility StudyEnergy B Kaplan Full
Head for Installed capacity (FT) 22.0
% Exceedance
Max TurbineFlow(CFS)
Net Energy (MWH)
Head (FT)
Net Capacity Factor (%)
InstalledCapacity(kW)
1,173 22 24 26 28 30 32 34 36.6 38 40 42 22 22100% 6 40 44 48 53 57 61 65 71 74 78 82 55% 895% 19 118 131 144 156 169 181 194 210 219 231 244 51% 2790% 25 148 164 180 195 211 227 242 263 274 289 305 50% 3485% 30 176 195 213 232 251 269 288 312 325 343 362 48% 4280% 35 198 219 240 261 282 303 324 351 365 386 407 47% 4875% 41 224 247 271 294 318 341 365 395 412 435 459 46% 5570% 46 247 273 299 325 351 377 403 437 455 481 507 45% 6365% 53 274 302 331 360 388 417 446 483 503 532 560 44% 7260% 59 298 329 360 391 422 454 485 525 547 578 609 42% 8155% 67 328 362 396 430 464 498 532 577 601 635 669 40% 9350% 76 355 391 428 465 502 539 576 623 649 686 723 39% 10345% 84 380 419 458 498 537 576 616 667 694 734 773 38% 11440% 94 407 449 491 533 575 617 659 714 743 785 828 36% 12835% 102 428 472 517 561 605 649 693 751 782 826 870 35% 13930% 114 456 503 549 596 643 690 737 798 831 878 925 33% 15625% 130 486 536 586 636 686 735 785 850 885 935 985 31% 17620% 149 520 573 626 679 732 786 839 908 945 998 1,052 29% 20115% 174 561 618 675 733 790 847 905 979 1,019 1,076 1,134 27% 23510% 213 611 673 735 797 859 922 984 1,065 1,108 1,170 1,233 24% 2875% 286 674 743 811 879 947 1,016 1,084 1,173 1,221 1,289 1,357 20% 3801% 527 772 850 928 1,006 1,083 1,161 1,239 1,340 1,394 1,472 1,550 13% 689
1 2 3 4 5 6 7 8 9 10 11 12 15 17
E Prov_Energy_1‐07‐2011.xlsx For Planning Purposes Only
0
100
200
300
400
500
600
700
800
900
0 60 121 182 244 305 366 425 486
Ann
ual Ene
rgy Prod
uction
(MWH)
Hydraulic Capacity (cfs)
MWH vs Hyd. Cap (cfs)
0
100
200
300
400
500
600
700
800
900
0 121 244 366 486 609
Ann
ual Ene
rgy Prod
uction
(MWH)
Installed Capacity (kw)
MWH vs Installed Cap (kW)
E Prov_Energy_1‐07‐2011.xlsx For Planning Purposes Only

Privileged and Confidential Ten Mile River Hydro
Phase I Feasibility StudyEnergy B Kaplan Half
Head for Installed capacity (FT) 22.0
% Exceedance
Max TurbineFlow(CFS)
Net Energy (MWH)
Head (FT)
Net Capacity Factor (%)
InstalledCapacity(kW)
1,468 22 24 26 28 30 32 34 36.6 38 40 42 22 22100% 6 52 57 63 68 74 79 85 92 96 101 107 71% 895% 19 154 170 187 203 219 235 252 273 284 300 317 66% 2790% 25 192 213 233 253 274 294 314 340 355 375 395 64% 3485% 30 229 253 277 301 325 349 373 405 421 445 470 63% 4280% 35 258 285 312 339 366 393 420 456 475 502 529 61% 4875% 41 291 321 352 382 412 443 473 513 534 565 595 60% 5570% 46 321 355 388 422 455 489 523 566 590 623 657 58% 6365% 53 355 392 430 467 504 541 578 626 652 689 726 56% 7260% 59 388 428 469 509 549 590 630 683 711 752 792 55% 8155% 67 426 470 515 559 603 647 692 749 780 825 869 53% 9250% 76 461 509 557 604 652 700 748 810 843 891 939 51% 10445% 84 492 543 594 645 696 747 798 864 899 950 1,001 49% 11440% 94 528 582 637 691 745 800 854 925 963 1,017 1,072 47% 12935% 102 554 611 668 725 782 839 896 970 1,010 1,067 1,124 45% 13930% 114 589 649 709 770 830 890 951 1,029 1,071 1,132 1,192 43% 15625% 130 626 690 754 818 882 946 1,010 1,093 1,137 1,201 1,265 41% 17620% 149 667 734 802 870 938 1,006 1,074 1,162 1,209 1,277 1,345 38% 20215% 174 716 789 861 934 1,006 1,079 1,151 1,246 1,297 1,369 1,442 35% 23510% 213 772 850 928 1,006 1,083 1,161 1,239 1,341 1,395 1,473 1,551 31% 2885% 286 846 932 1,017 1,102 1,187 1,272 1,357 1,468 1,527 1,612 1,697 25% 3831% 527 951 1,046 1,141 1,235 1,330 1,425 1,520 1,643 1,709 1,804 1,899 16% 689
1 2 3 4 5 6 7 8 9 10 11 12 15 17
E Prov_Energy_1‐07‐2011.xlsx For Planning Purposes Only
0
100
200
300
400
500
600
700
800
900
1,000
0 60 121 182 244 305 366 425 486
Ann
ual Ene
rgy Prod
uction
(MWH)
Hydraulic Capacity (cfs)
MWH vs Hyd. Cap (cfs)
0
100
200
300
400
500
600
700
800
900
1,000
0 121 244 366 486 609
Ann
ual Ene
rgy Prod
uction
(MWH)
Installed Capacity (kw)
MWH vs Installed Cap (kW)
E Prov_Energy_1‐07‐2011.xlsx For Planning Purposes Only
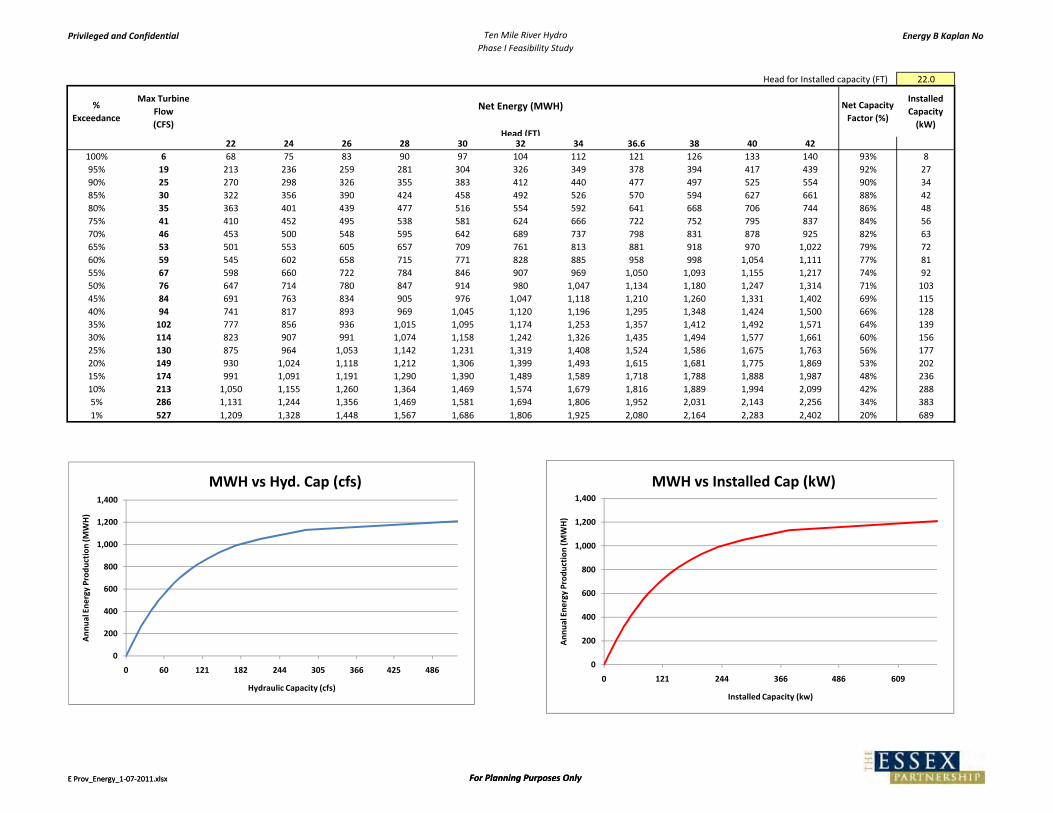
Privileged and Confidential Ten Mile River Hydro
Phase I Feasibility StudyEnergy B Kaplan No
Head for Installed capacity (FT) 22.0
% Exceedance
Max TurbineFlow(CFS)
Net Energy (MWH)
Head (FT)
Net Capacity Factor (%)
InstalledCapacity(kW)
1,952 22 24 26 28 30 32 34 36.6 38 40 42 22 22100% 6 68 75 83 90 97 104 112 121 126 133 140 93% 895% 19 213 236 259 281 304 326 349 378 394 417 439 92% 2790% 25 270 298 326 355 383 412 440 477 497 525 554 90% 3485% 30 322 356 390 424 458 492 526 570 594 627 661 88% 4280% 35 363 401 439 477 516 554 592 641 668 706 744 86% 4875% 41 410 452 495 538 581 624 666 722 752 795 837 84% 5670% 46 453 500 548 595 642 689 737 798 831 878 925 82% 6365% 53 501 553 605 657 709 761 813 881 918 970 1,022 79% 7260% 59 545 602 658 715 771 828 885 958 998 1,054 1,111 77% 8155% 67 598 660 722 784 846 907 969 1,050 1,093 1,155 1,217 74% 9250% 76 647 714 780 847 914 980 1,047 1,134 1,180 1,247 1,314 71% 10345% 84 691 763 834 905 976 1,047 1,118 1,210 1,260 1,331 1,402 69% 11540% 94 741 817 893 969 1,045 1,120 1,196 1,295 1,348 1,424 1,500 66% 12835% 102 777 856 936 1,015 1,095 1,174 1,253 1,357 1,412 1,492 1,571 64% 13930% 114 823 907 991 1,074 1,158 1,242 1,326 1,435 1,494 1,577 1,661 60% 15625% 130 875 964 1,053 1,142 1,231 1,319 1,408 1,524 1,586 1,675 1,763 56% 17720% 149 930 1,024 1,118 1,212 1,306 1,399 1,493 1,615 1,681 1,775 1,869 53% 20215% 174 991 1,091 1,191 1,290 1,390 1,489 1,589 1,718 1,788 1,888 1,987 48% 23610% 213 1,050 1,155 1,260 1,364 1,469 1,574 1,679 1,816 1,889 1,994 2,099 42% 2885% 286 1,131 1,244 1,356 1,469 1,581 1,694 1,806 1,952 2,031 2,143 2,256 34% 3831% 527 1,209 1,328 1,448 1,567 1,686 1,806 1,925 2,080 2,164 2,283 2,402 20% 689
1 2 3 4 5 6 7 8 9 10 11 12 15 17
E Prov_Energy_1‐07‐2011.xlsx For Planning Purposes Only
0
200
400
600
800
1,000
1,200
1,400
0 60 121 182 244 305 366 425 486
Ann
ual Ene
rgy Prod
uction
(MWH)
Hydraulic Capacity (cfs)
MWH vs Hyd. Cap (cfs)
0
200
400
600
800
1,000
1,200
1,400
0 121 244 366 486 609
Ann
ual Ene
rgy Prod
uction
(MWH)
Installed Capacity (kw)
MWH vs Installed Cap (kW)
E Prov_Energy_1‐07‐2011.xlsx For Planning Purposes Only

Privileged and Confidential Ten Mile River Hydro
Phase I Feasibility StudyEnergy C Kaplan Full
Head for Installed capacity (FT) 38.0
% Exceedance
Max TurbineFlow(CFS)
Net Energy (MWH)
Head (FT)
Net Capacity Factor (%)
InstalledCapacity(kW)
1,173 22 24 26 28 30 32 34 36.6 38 40 42 38 38100% 6 40 44 48 53 57 61 65 71 74 78 82 55% 1595% 19 118 131 144 156 169 181 194 210 219 231 244 51% 4990% 25 148 164 180 195 211 227 242 263 274 289 305 50% 6385% 30 176 195 213 232 251 269 288 312 325 343 362 48% 7780% 35 198 219 240 261 282 303 324 351 365 386 407 47% 8875% 41 224 247 271 294 318 341 365 395 412 435 459 46% 10270% 46 247 273 299 325 351 377 403 437 455 481 507 44% 11765% 53 274 302 331 360 388 417 446 483 503 532 560 43% 13260% 59 298 329 360 391 422 454 485 525 547 578 609 42% 14955% 67 328 362 396 430 464 498 532 577 601 635 669 40% 17150% 76 355 391 428 465 502 539 576 623 649 686 723 39% 19045% 84 380 419 458 498 537 576 616 667 694 734 773 38% 21140% 94 407 449 491 533 575 617 659 714 743 785 828 36% 23735% 102 428 472 517 561 605 649 693 751 782 826 870 35% 25730% 114 456 503 549 596 643 690 737 798 831 878 925 33% 28825% 130 486 536 586 636 686 735 785 850 885 935 985 31% 32620% 149 520 573 626 679 732 786 839 908 945 998 1,052 29% 37315% 174 561 618 675 733 790 847 905 979 1,019 1,076 1,134 27% 43710% 213 611 673 735 797 859 922 984 1,065 1,108 1,170 1,233 24% 5335% 286 674 743 811 879 947 1,016 1,084 1,173 1,221 1,289 1,357 20% 7101% 527 772 850 928 1,006 1,083 1,161 1,239 1,340 1,394 1,472 1,550 12% 1,297
1 2 3 4 5 6 7 8 9 10 11 12 15 17
E Prov_Energy_1‐07‐2011.xlsx For Planning Purposes Only
0
200
400
600
800
1,000
1,200
1,400
1,600
0 60 121 182 244 305 366 425 486
Ann
ual Ene
rgy Prod
uction
(MWH)
Hydraulic Capacity (cfs)
MWH vs Hyd. Cap (cfs)
0
200
400
600
800
1,000
1,200
1,400
1,600
0 121 244 366 486 609 731 851 974 1,096 1,216
Ann
ual Ene
rgy Prod
uction
(MWH)
Installed Capacity (kw)
MWH vs Installed Cap (kW)
E Prov_Energy_1‐07‐2011.xlsx For Planning Purposes Only

Privileged and Confidential Ten Mile River Hydro
Phase I Feasibility StudyEnergy C Kaplan Half
Head for Installed capacity (FT) 38.0
% Exceedance
Max TurbineFlow(CFS)
Net Energy (MWH)
Head (FT)
Net Capacity Factor (%)
InstalledCapacity(kW)
1,468 22 24 26 28 30 32 34 36.6 38 40 42 38 38100% 6 52 57 63 68 74 79 85 92 96 101 107 71% 1595% 19 154 170 187 203 219 235 252 273 284 300 317 66% 4990% 25 192 213 233 253 274 294 314 340 355 375 395 64% 6385% 30 229 253 277 301 325 349 373 405 421 445 470 63% 7780% 35 258 285 312 339 366 393 420 456 475 502 529 61% 8975% 41 291 321 352 382 412 443 473 513 534 565 595 60% 10270% 46 321 355 388 422 455 489 523 566 590 623 657 58% 11665% 53 355 392 430 467 504 541 578 626 652 689 726 56% 13260% 59 388 428 469 509 549 590 630 683 711 752 792 55% 14955% 67 426 470 515 559 603 647 692 749 780 825 869 52% 17050% 76 461 509 557 604 652 700 748 810 843 891 939 50% 19245% 84 492 543 594 645 696 747 798 864 899 950 1,001 49% 21140% 94 528 582 637 691 745 800 854 925 963 1,017 1,072 46% 23835% 102 554 611 668 725 782 839 896 970 1,010 1,067 1,124 45% 25730% 114 589 649 709 770 830 890 951 1,029 1,071 1,132 1,192 43% 28825% 130 626 690 754 818 882 946 1,010 1,093 1,137 1,201 1,265 40% 32620% 149 667 734 802 870 938 1,006 1,074 1,162 1,209 1,277 1,345 37% 37515% 174 716 789 861 934 1,006 1,079 1,151 1,246 1,297 1,369 1,442 34% 43710% 213 772 850 928 1,006 1,083 1,161 1,239 1,341 1,395 1,473 1,551 30% 5345% 286 846 932 1,017 1,102 1,187 1,272 1,357 1,468 1,527 1,612 1,697 24% 7131% 527 951 1,046 1,141 1,235 1,330 1,425 1,520 1,643 1,709 1,804 1,899 15% 1,297
1 2 3 4 5 6 7 8 9 10 11 12 15 17
E Prov_Energy_1‐07‐2011.xlsx For Planning Purposes Only
0
200
400
600
800
1,000
1,200
1,400
1,600
1,800
0 60 121 182 244 305 366 425 486
Ann
ual Ene
rgy Prod
uction
(MWH)
Hydraulic Capacity (cfs)
MWH vs Hyd. Cap (cfs)
0
200
400
600
800
1,000
1,200
1,400
1,600
1,800
0 121 244 366 486 609 731 851 974 1,096 1,216
Ann
ual Ene
rgy Prod
uction
(MWH)
Installed Capacity (kw)
MWH vs Installed Cap (kW)
E Prov_Energy_1‐07‐2011.xlsx For Planning Purposes Only

Privileged and Confidential Ten Mile River Hydro
Phase I Feasibility StudyEnergy C Kaplan No
Head for Installed capacity (FT) 38.0
% Exceedance
Max TurbineFlow(CFS)
Net Energy (MWH)
Head (FT)
Net Capacity Factor (%)
InstalledCapacity(kW)
1,952 22 24 26 28 30 32 34 36.6 38 40 42 38 38100% 6 68 75 83 90 97 104 112 121 126 133 140 94% 1595% 19 213 236 259 281 304 326 349 378 394 417 439 92% 4990% 25 270 298 326 355 383 412 440 477 497 525 554 90% 6385% 30 322 356 390 424 458 492 526 570 594 627 661 88% 7780% 35 363 401 439 477 516 554 592 641 668 706 744 86% 8975% 41 410 452 495 538 581 624 666 722 752 795 837 84% 10270% 46 453 500 548 595 642 689 737 798 831 878 925 82% 11665% 53 501 553 605 657 709 761 813 881 918 970 1,022 79% 13360% 59 545 602 658 715 771 828 885 958 998 1,054 1,111 76% 14955% 67 598 660 722 784 846 907 969 1,050 1,093 1,155 1,217 74% 17050% 76 647 714 780 847 914 980 1,047 1,134 1,180 1,247 1,314 71% 19145% 84 691 763 834 905 976 1,047 1,118 1,210 1,260 1,331 1,402 68% 21240% 94 741 817 893 969 1,045 1,120 1,196 1,295 1,348 1,424 1,500 65% 23735% 102 777 856 936 1,015 1,095 1,174 1,253 1,357 1,412 1,492 1,571 63% 25730% 114 823 907 991 1,074 1,158 1,242 1,326 1,435 1,494 1,577 1,661 59% 28825% 130 875 964 1,053 1,142 1,231 1,319 1,408 1,524 1,586 1,675 1,763 55% 32720% 149 930 1,024 1,118 1,212 1,306 1,399 1,493 1,615 1,681 1,775 1,869 51% 37315% 174 991 1,091 1,191 1,290 1,390 1,489 1,589 1,718 1,788 1,888 1,987 47% 43810% 213 1,050 1,155 1,260 1,364 1,469 1,574 1,679 1,816 1,889 1,994 2,099 40% 5345% 286 1,131 1,244 1,356 1,469 1,581 1,694 1,806 1,952 2,031 2,143 2,256 33% 7131% 527 1,209 1,328 1,448 1,567 1,686 1,806 1,925 2,080 2,164 2,283 2,402 19% 1,297
1 2 3 4 5 6 7 8 9 10 11 12 15 17
E Prov_Energy_1‐07‐2011.xlsx For Planning Purposes Only
0
500
1,000
1,500
2,000
2,500
0 60 121 182 244 305 366 425 486
Ann
ual Ene
rgy Prod
uction
(MWH)
Hydraulic Capacity (cfs)
MWH vs Hyd. Cap (cfs)
0
500
1,000
1,500
2,000
2,500
0 121 244 366 486 609 731 851 974 1,096 1,216
Ann
ual Ene
rgy Prod
uction
(MWH)
Installed Capacity (kw)
MWH vs Installed Cap (kW)
E Prov_Energy_1‐07‐2011.xlsx For Planning Purposes Only

Privileged and Confidential Ten Mile River Hydro
Phase I Feasibility StudyEnergy C Francis (repowered)
Head for Installed capacity (FT) 38.0
% Exceedance
Max TurbineFlow(CFS)
Net Energy (MWH)
Head (FT)
Net Capacity Factor (%)
InstalledCapacity(kW)
902 22 24 26.2 28 30 32 34 36.6 38 40 42 38 38100% 6 38 42 47 51 55 59 64 69 72 76 81 55% 1595% 19 111 124 137 149 161 173 186 202 211 223 236 50% 4890% 25 139 155 172 186 202 217 233 253 264 279 295 49% 6285% 30 165 184 204 220 239 257 276 300 312 331 349 47% 7580% 35 185 206 229 247 268 288 309 336 350 371 391 46% 8775% 41 208 231 257 277 300 324 347 377 393 416 439 45% 10070% 46 228 253 281 304 329 354 380 412 430 455 481 43% 11565% 53 251 279 310 335 363 390 418 454 474 502 529 42% 13060% 59 273 303 336 363 393 423 453 492 513 543 573 40% 14655% 67 296 328 364 393 426 459 491 533 556 589 621 38% 16850% 76 320 355 393 425 460 495 530 576 600 635 670 37% 18745% 84 339 376 417 450 487 524 561 609 635 672 709 35% 20740% 94 356 395 438 473 512 551 590 640 667 706 745 33% 23235% 102 376 417 462 498 539 580 621 674 703 744 785 32% 25330% 114 398 441 488 527 570 613 656 712 743 786 829 30% 28225% 130 412 457 506 546 591 636 681 739 770 815 860 27% 32020% 149 435 483 534 577 624 671 718 779 812 859 907 25% 36615% 174 453 502 556 601 650 699 748 812 846 895 944 23% 42810% 213 482 534 591 638 690 742 794 862 899 951 1,003 20% 5225% 286 505 559 619 668 723 777 831 902 940 995 1,049 15% 6971% 527 515 570 631 682 737 793 848 920 959 1,015 1,070 9% 1,272
1 2 3 4 5 6 7 8 9 10 11 12 15 17
E Prov_Energy_1‐07‐2011.xlsx For Planning Purposes Only
0
200
400
600
800
1,000
1,200
0 60 121 182 244 305 366 425 486
Ann
ual Ene
rgy Prod
uction
(MWH)
Hydraulic Capacity (cfs)
MWH vs Hyd. Cap (cfs)
0
200
400
600
800
1,000
1,200
0 121 244 366 486 609 731 851 974 1,096 1,216
Ann
ual Ene
rgy Prod
uction
(MWH)
Installed Capacity (kw)
MWH vs Installed Cap (kW)
E Prov_Energy_1‐07‐2011.xlsx For Planning Purposes Only

Privileged and Confidential Ten Mile River Hydro
Phase I Feasibility StudyEnergy E Kaplan Full
Head for Installed capacity (FT) 23.5
% Exceedance
Max TurbineFlow(CFS)
Net Energy (MWH)
Head (FT)
Net Capacity Factor (%)
InstalledCapacity(kW)
856 22 23.5 26.0 28 30 32 34 36 38 40 42 24 24100% 6 44 47 52 57 61 65 69 74 78 82 86 55% 1095% 19 130 139 155 168 180 193 205 218 230 243 255 51% 3190% 25 163 174 194 210 225 241 257 272 288 304 319 49% 4085% 30 193 207 230 249 267 286 304 323 341 360 379 48% 4980% 35 217 233 259 280 300 321 342 363 384 405 426 47% 5775% 41 244 262 291 315 338 362 385 409 432 456 479 46% 6670% 46 269 289 321 347 373 399 425 451 477 503 529 44% 7565% 53 298 319 355 384 412 441 470 498 527 556 584 43% 8560% 59 324 347 386 417 448 479 510 542 573 604 635 42% 9555% 67 355 381 423 458 492 526 560 594 628 662 696 40% 10950% 76 383 411 457 494 531 568 604 641 678 715 752 39% 12245% 84 410 439 488 528 567 607 646 685 725 764 803 37% 13540% 94 438 470 522 565 607 649 691 733 775 817 859 35% 15135% 102 461 494 549 593 637 682 726 770 814 859 903 34% 16530% 114 489 524 583 630 677 724 770 817 864 911 958 33% 18425% 130 520 558 620 670 720 770 820 870 919 969 1,019 31% 20920% 149 555 595 661 715 768 821 874 927 981 1,034 1,087 29% 23815% 174 598 640 712 769 827 884 941 998 1,056 1,113 1,170 26% 27910% 213 649 695 773 835 898 960 1,022 1,084 1,146 1,209 1,271 23% 3405% 286 713 764 849 917 986 1,054 1,122 1,191 1,259 1,327 1,396 19% 4511% 527 809 867 965 1,042 1,120 1,198 1,276 1,353 1,431 1,509 1,587 12% 821
1 2 3 4 5 6 7 8 9 10 11 12 15 17
E Prov_Energy_1‐07‐2011.xlsx For Planning Purposes Only
0
100
200
300
400
500
600
700
800
900
1,000
0 60 121 182 244 305 366 425 486
Ann
ual Ene
rgy Prod
uction
(MWH)
Hydraulic Capacity (cfs)
MWH vs Hyd. Cap (cfs)
0
100
200
300
400
500
600
700
800
900
1,000
0 121 244 366 486 609 731
Ann
ual Ene
rgy Prod
uction
(MWH)
Installed Capacity (kw)
MWH vs Installed Cap (kW)
E Prov_Energy_1‐07‐2011.xlsx For Planning Purposes Only

Privileged and Confidential Ten Mile River Hydro
Phase I Feasibility StudyEnergy E Kaplan Half
Head for Installed capacity (FT) 23.5
% Exceedance
Max TurbineFlow(CFS)
Net Energy (MWH)
Head (FT)
Net Capacity Factor (%)
InstalledCapacity(kW)
1,070 22 23.5 26.0 28 30 32 34 36 38 40 42 24 24100% 6 57 61 68 73 79 84 90 95 101 106 112 71% 1095% 19 169 181 202 218 234 250 267 283 299 315 332 66% 3190% 25 211 226 251 272 292 312 333 353 373 393 414 64% 4185% 30 250 268 299 323 347 371 395 419 443 467 491 62% 4980% 35 282 302 336 363 390 417 444 471 499 526 553 61% 5775% 41 317 340 378 408 439 469 500 530 561 591 622 59% 6670% 46 350 375 417 451 484 518 551 585 618 652 686 57% 7465% 53 387 414 461 498 535 572 609 646 683 721 758 56% 8560% 59 421 452 502 542 583 623 664 704 745 785 825 54% 9555% 67 462 495 550 595 639 683 727 772 816 860 904 52% 10950% 76 499 534 594 642 690 737 785 833 881 929 976 50% 12345% 84 531 569 633 684 735 786 836 887 938 989 1,040 48% 13540% 94 568 609 677 731 786 840 895 949 1,003 1,058 1,112 46% 15235% 102 595 638 709 766 823 880 937 994 1,051 1,108 1,165 44% 16530% 114 631 676 752 812 872 933 993 1,053 1,114 1,174 1,234 42% 18425% 130 669 717 797 861 925 989 1,053 1,117 1,181 1,245 1,309 39% 20920% 149 710 761 846 914 982 1,050 1,117 1,185 1,253 1,321 1,389 36% 23915% 174 760 815 906 978 1,051 1,123 1,196 1,268 1,341 1,413 1,486 33% 27910% 213 817 875 972 1,050 1,128 1,206 1,284 1,362 1,440 1,518 1,596 29% 3415% 286 892 956 1,062 1,147 1,232 1,317 1,402 1,487 1,573 1,658 1,743 24% 4541% 527 992 1,063 1,182 1,276 1,371 1,466 1,561 1,655 1,750 1,845 1,940 15% 821
1 2 3 4 5 6 7 8 9 10 11 12 15 17
E Prov_Energy_1‐07‐2011.xlsx For Planning Purposes Only
0
200
400
600
800
1,000
1,200
0 60 121 182 244 305 366 425 486
Ann
ual Ene
rgy Prod
uction
(MWH)
Hydraulic Capacity (cfs)
MWH vs Hyd. Cap (cfs)
0
200
400
600
800
1,000
1,200
0 121 244 366 486 609 731
Ann
ual Ene
rgy Prod
uction
(MWH)
Installed Capacity (kw)
MWH vs Installed Cap (kW)
E Prov_Energy_1‐07‐2011.xlsx For Planning Purposes Only

Privileged and Confidential Ten Mile River Hydro
Phase I Feasibility StudyEnergy E Kaplan No
Head for Installed capacity (FT) 23.5
% Exceedance
Max TurbineFlow(CFS)
Net Energy (MWH)
Head (FT)
Net Capacity Factor (%)
InstalledCapacity(kW)
1,422 22 23.5 26.0 28 30 32 34 36 38 40 42 24 24100% 6 75 81 90 97 104 111 119 126 133 140 148 93% 1095% 19 235 252 280 303 325 348 370 393 416 438 461 92% 3190% 25 296 317 353 381 410 438 467 495 524 552 580 90% 4085% 30 353 379 421 455 489 523 557 591 624 658 692 88% 4980% 35 397 426 473 511 549 587 626 664 702 740 778 86% 5775% 41 447 479 532 575 618 661 704 746 789 832 875 83% 6670% 46 493 529 588 635 682 730 777 824 871 918 966 81% 7565% 53 544 583 649 701 753 805 857 909 961 1,013 1,065 78% 8560% 59 591 634 704 761 818 874 931 987 1,044 1,100 1,157 76% 9655% 67 647 694 771 833 895 956 1,018 1,080 1,142 1,204 1,266 73% 10950% 76 698 749 832 899 965 1,032 1,099 1,165 1,232 1,299 1,365 70% 12245% 84 745 798 887 958 1,029 1,101 1,172 1,243 1,314 1,385 1,456 67% 13640% 94 796 853 948 1,024 1,100 1,176 1,252 1,328 1,404 1,480 1,555 64% 15235% 102 833 893 992 1,072 1,151 1,230 1,310 1,389 1,469 1,548 1,627 62% 16530% 114 880 943 1,048 1,132 1,216 1,300 1,383 1,467 1,551 1,635 1,719 58% 18425% 130 933 1,000 1,111 1,200 1,289 1,378 1,466 1,555 1,644 1,733 1,822 55% 20920% 149 988 1,058 1,176 1,270 1,364 1,458 1,551 1,645 1,739 1,833 1,927 51% 23815% 174 1,049 1,124 1,248 1,348 1,448 1,547 1,647 1,746 1,846 1,946 2,045 46% 28010% 213 1,106 1,184 1,316 1,420 1,525 1,630 1,735 1,840 1,945 2,050 2,155 40% 3415% 286 1,186 1,270 1,411 1,523 1,635 1,748 1,860 1,973 2,085 2,198 2,310 32% 4541% 527 1,256 1,346 1,495 1,614 1,733 1,853 1,972 2,091 2,211 2,330 2,449 19% 821
1 2 3 4 5 6 7 8 9 10 11 12 15 17
E Prov_Energy_1‐07‐2011.xlsx For Planning Purposes Only
0
200
400
600
800
1,000
1,200
1,400
1,600
0 60 121 182 244 305 366 425 486
Ann
ual Ene
rgy Prod
uction
(MWH)
Hydraulic Capacity (cfs)
MWH vs Hyd. Cap (cfs)
0
200
400
600
800
1,000
1,200
1,400
1,600
0 121 244 366 486 609 731
Ann
ual Ene
rgy Prod
uction
(MWH)
Installed Capacity (kw)
MWH vs Installed Cap (kW)
E Prov_Energy_1‐07‐2011.xlsx For Planning Purposes Only

Privileged and Confidential Ten Mile River Hydro
Phase I Feasibility StudyEnergy E Francis (repowered)
Head for Installed capacity (FT) 23.5
% Exceedance
Max TurbineFlow(CFS)
Net Energy (MWH)
Head (FT)
Net Capacity Factor (%)
InstalledCapacity(kW)
941 22 23.5 26.2 28 30 32 34 36.6 38 40 42 24 24100% 6 42 45 51 55 59 64 68 73 76 81 85 54% 1095% 19 123 133 149 161 173 185 198 214 223 235 248 50% 3090% 25 154 166 187 201 216 232 247 268 279 294 310 48% 3985% 30 182 196 221 238 256 274 293 317 330 348 366 47% 4880% 35 204 220 248 266 287 307 328 355 369 390 410 46% 5575% 41 229 247 278 299 322 345 368 398 414 437 460 44% 6370% 46 251 270 304 327 352 377 403 435 453 478 504 42% 7365% 53 276 297 335 360 387 415 443 479 499 526 554 41% 8260% 59 299 322 362 389 420 450 480 519 540 570 600 40% 9255% 67 324 349 392 422 454 487 519 562 584 617 650 37% 10650% 76 349 376 423 455 490 525 560 605 630 665 700 36% 11845% 84 370 398 448 481 518 555 592 640 666 703 740 35% 13140% 94 388 418 470 505 544 583 622 672 700 739 778 33% 14635% 102 409 440 495 532 572 613 654 707 736 777 818 31% 15930% 114 432 464 522 561 604 647 690 746 777 820 863 30% 17825% 130 447 481 541 581 626 671 716 774 805 850 895 27% 20220% 149 471 507 570 613 660 707 754 815 848 895 943 25% 23015% 174 490 527 594 638 687 736 785 849 883 932 981 22% 27010% 213 520 560 630 677 729 781 833 901 937 989 1,042 19% 3285% 286 543 584 658 707 761 815 870 941 979 1,033 1,088 15% 4361% 527 551 593 668 718 774 829 885 957 996 1,051 1,107 9% 792
1 2 3 4 5 6 7 8 9 10 11 12 15 17
E Prov_Energy_1‐07‐2011.xlsx For Planning Purposes Only
0
100
200
300
400
500
600
700
0 60 121 182 244 305 366 425 486
Ann
ual Ene
rgy Prod
uction
(MWH)
Hydraulic Capacity (cfs)
MWH vs Hyd. Cap (cfs)
0
100
200
300
400
500
600
700
0 121 244 366 486 609 731
Ann
ual Ene
rgy Prod
uction
(MWH)
Installed Capacity (kw)
MWH vs Installed Cap (kW)
E Prov_Energy_1‐07‐2011.xlsx For Planning Purposes Only

Privileged and Confidential Ten Mile River Hydro
Phase I Feasibility StudyEnergy E Repowered Francis No
Head for Installed capacity (FT) 23.5
% Exceedance
Max TurbineFlow(CFS)
Net Energy (MWH)
Head (FT)
Net Capacity Factor (%)
InstalledCapacity(kW)
1,452 22 23.5 26.2 28 30 32 34 36.6 38 40 42 24 24100% 6 72 78 88 94 102 109 116 126 131 138 146 93% 1095% 19 226 243 274 295 317 340 363 393 409 431 454 91% 3090% 25 285 306 345 371 399 428 456 494 514 542 571 90% 3985% 30 339 365 410 441 475 509 543 587 611 645 679 87% 4880% 35 380 408 459 494 532 570 608 657 684 722 760 85% 5575% 41 424 456 513 552 594 637 679 734 764 806 849 82% 6470% 46 465 500 563 605 651 698 744 805 837 884 930 79% 7265% 53 510 548 617 663 714 765 816 882 917 968 1,019 76% 8360% 59 552 593 667 716 771 826 881 953 991 1,046 1,101 73% 9355% 67 597 642 722 776 835 895 954 1,032 1,073 1,133 1,192 70% 10550% 76 634 682 767 824 887 950 1,013 1,095 1,139 1,203 1,266 66% 11845% 84 672 722 812 872 939 1,006 1,072 1,159 1,206 1,273 1,340 63% 13140% 94 705 758 853 916 986 1,056 1,126 1,217 1,266 1,336 1,406 59% 14735% 102 730 784 882 948 1,020 1,093 1,165 1,259 1,310 1,382 1,455 56% 15930% 114 758 815 916 984 1,059 1,134 1,210 1,307 1,360 1,435 1,510 52% 17825% 130 791 850 955 1,026 1,104 1,183 1,261 1,363 1,418 1,496 1,574 48% 20220% 149 818 878 987 1,060 1,141 1,222 1,303 1,408 1,464 1,545 1,626 43% 23215% 174 845 908 1,021 1,096 1,179 1,263 1,346 1,455 1,513 1,597 1,680 38% 27110% 213 857 920 1,034 1,110 1,195 1,280 1,364 1,474 1,533 1,618 1,702 32% 3295% 286 843 906 1,018 1,093 1,177 1,260 1,343 1,452 1,510 1,594 1,677 24% 4391% 527 742 797 897 964 1,038 1,112 1,186 1,282 1,334 1,408 1,482 11% 792
1 2 3 4 5 6 7 8 9 10 11 12 15 17
E Prov_Energy_1‐07‐2011.xlsx For Planning Purposes Only
0
100
200
300
400
500
600
700
800
900
1,000
0 60 121 182 244 305 366 425 486
Ann
ual Ene
rgy Prod
uction
(MWH)
Hydraulic Capacity (cfs)
MWH vs Hyd. Cap (cfs)
0
100
200
300
400
500
600
700
800
900
1,000
0 121 244 366 486 609 731
Ann
ual Ene
rgy Prod
uction
(MWH)
Installed Capacity (kw)
MWH vs Installed Cap (kW)
E Prov_Energy_1‐07‐2011.xlsx For Planning Purposes Only

Privileged and Confidential Ten Mile River Hydro
Phase I Feasibility StudyEnergy E Francis (restored)
Head for Installed capacity (FT) 23.5
% Exceedance
Max TurbineFlow(CFS)
Net Energy (MWH)
Head (FT)
Net Capacity Factor (%)
InstalledCapacity(kW)
554 22 23.5 26.2 28 30 32 34 36 38 40 42 24 24100% 6 36 38 43 46 50 53 57 61 64 68 71 54% 895% 19 104 112 126 135 146 156 167 177 188 198 209 50% 2690% 25 130 140 157 169 182 195 208 221 235 248 261 48% 3385% 30 154 165 186 200 216 231 247 262 278 293 308 47% 4080% 35 172 185 209 224 242 259 276 294 311 328 346 46% 4675% 41 193 208 234 251 271 290 310 329 349 368 387 44% 5370% 46 211 227 256 275 296 318 339 360 382 403 424 42% 6165% 53 233 250 282 303 326 350 373 396 420 443 467 41% 6960% 59 252 271 305 328 353 379 404 429 455 480 505 40% 7855% 67 273 293 330 355 383 410 437 465 492 520 547 37% 8950% 76 294 316 356 383 412 442 471 501 530 560 589 36% 9945% 84 311 335 377 405 436 467 499 530 561 592 623 35% 11040% 94 327 352 396 425 458 491 524 556 589 622 655 33% 12335% 102 344 370 417 448 482 517 551 585 620 654 689 31% 13430% 114 363 391 440 472 509 545 581 618 654 690 727 30% 15025% 130 377 405 456 490 527 565 603 640 678 716 753 27% 17020% 149 397 427 480 516 556 595 635 675 714 754 794 25% 19415% 174 413 444 500 537 578 620 661 702 744 785 826 22% 22710% 213 438 471 530 570 614 658 702 745 789 833 877 19% 2775% 286 458 492 554 595 641 687 733 778 824 870 916 15% 3671% 527 464 499 563 605 651 698 745 792 839 885 932 9% 667
1 2 3 4 5 6 7 8 9 10 11 12 15 17
E Prov_Energy_1‐07‐2011.xlsx For Planning Purposes Only
0
100
200
300
400
500
600
0 60 121 182 244 305 366 425 486
Ann
ual Ene
rgy Prod
uction
(MWH)
Hydraulic Capacity (cfs)
MWH vs Hyd. Cap (cfs)
0
100
200
300
400
500
600
0 121 244 366 486 609
Ann
ual Ene
rgy Prod
uction
(MWH)
Installed Capacity (kw)
MWH vs Installed Cap (kW)
E Prov_Energy_1‐07‐2011.xlsx For Planning Purposes Only

Privileged and Confidential Ten Mile River Hydro
Phase I Feasibility StudyEfficiency
1 2 3 4 5
NetHead(FT)
TurbineDischarge(% Q Max)
TurbineDischarge(CFS)
KaplanTurbineEff (%)
FrancisTurbineEff (%)
TurbineOutput(KW)
14.0 0.050 14 45.2% 5.8% 814.0 0.075 21 59.0% 14.2% 1514.0 0.100 29 72.7% 22.7% 2514.0 0.150 43 80.9% 35.9% 4114.0 0.200 57 85.4% 47.6% 5814.0 0.250 72 87.7% 55.8% 7414.0 0.300 86 89.1% 63.0% 9114.0 0.350 100 90.1% 69.0% 10714.0 0.400 114 90.9% 74.2% 12314.0 0.450 129 91.6% 78.7% 14014.0 0.500 143 92.2% 82.5% 15614.0 0.550 157 92.6% 85.6% 17314.0 0.600 172 92.7% 88.1% 18914.0 0.623 178 92.8% 89.0% 19614.0 0.650 186 92.8% 89.9% 20514.0 0.700 200 92.6% 91.2% 22014.0 0.750 215 92.3% 92.0% 23514.0 0.800 229 91.9% 92.5% 24914.0 0.833 238 91.6% 92.8% 25914.0 0.850 243 91.5% 92.6% 26414.0 0.900 257 90.9% 92.3% 27814.0 0.950 272 90.3% 91.6% 29114.0 0.950 272 90.3% 91.6% 29114.0 0.956 274 90.3% 91.5% 29314.0 1.000 286 89.7% 90.6% 304
E Prov_Energy_1‐07‐2011.xlsx For Planning Purposes Only

Cost Estimates

Privileged and Confidential Ten Mile River HydroPhase I Feasibility Study
Penstock Costs
SourceLength(FT)
Diameter(FT)
Cost(FOB)
2010 Cost Cost/FT
DB Cotton, Apr 2009 300 6 125,000 128,125 427Val, July 2011 300 7 144,000 144,000 480DB Cotton, Apr 2009 1,500 8 520,000 533,000 355DB Cotton, Apr 2009 300 10 185,000 189,625 632Val, July 2010 300 12 204,000 204,000 680
Cost/FT EqDB Cotton, Apr 2009 300 6 125,000 128,125 427 423Val, July 2011 300 7 144,000 144,000 480 486DB Cotton, Apr 2009 300 10 185,000 189,625 632 628Val, July 2010 300 12 204,000 204,000 680 682
Dia (FT)Material$/FT
LengthFT
MaterialTranspandInstall
Total2010 Costs
3.7 246 1 246 123 $3694.3 296 1 296 148 $4454.7 328 1 328 164 $4924.6 317 1 317 158 $4755.8 409 1 409 205 $6145.2 367 1 367 184 $5517.0 486 1 486 243 $7308 0 542 1 542 271 $813
Values for Formula
Values for East Providence
8.0 542 1 542 271 $813
y = ‐4.07486x2 + 116.44774x ‐ 128.96893
0
100
200
300
400
500
600
700
800
6 7 8 9 10 11 12
Cost/FT
Dia (FT)
E Prov Proforma_1-7-11.xlsx For Planning Purposes Only
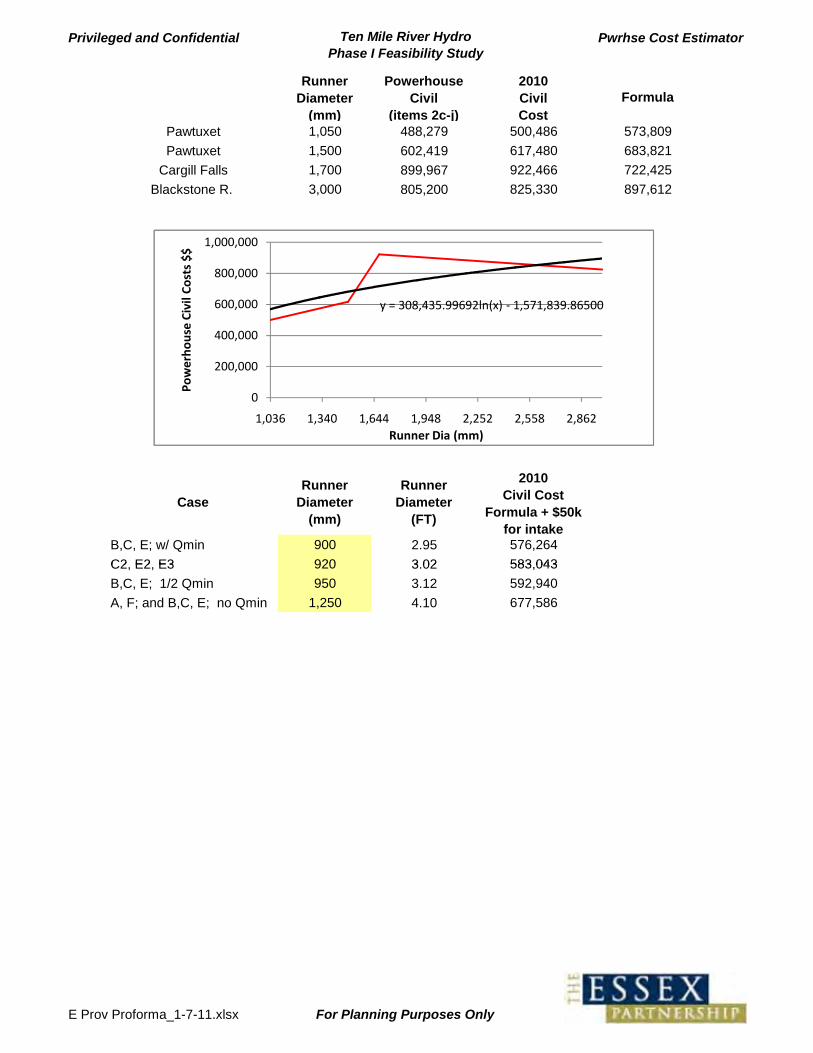
Privileged and Confidential Ten Mile River HydroPhase I Feasibility Study
Pwrhse Cost Estimator
Runner Diameter
(mm)
Powerhouse Civil
(items 2c-j)
2010CivilCost
Formula
Pawtuxet 1,050 488,279 500,486 573,809Pawtuxet 1,500 602,419 617,480 683,821
Cargill Falls 1,700 899,967 922,466 722,425Blackstone R. 3,000 805,200 825,330 897,612
CaseRunner
Diameter(mm)
Runner Diameter
(FT)
2010Civil Cost
Formula + $50k for intake
B,C, E; w/ Qmin 900 2.95 576,264C2 E2 E3 920 3 02 583 043
y = 308,435.99692ln(x) ‐ 1,571,839.86500
0
200,000
400,000
600,000
800,000
1,000,000
1,036 1,340 1,644 1,948 2,252 2,558 2,862
Powerho
use Civil C
osts $$
Runner Dia (mm)
C2, E2, E3 920 3.02 583,043B,C, E; 1/2 Qmin 950 3.12 592,940A, F; and B,C, E; no Qmin 1,250 4.10 677,586
y = 308,435.99692ln(x) ‐ 1,571,839.86500
0
200,000
400,000
600,000
800,000
1,000,000
1,036 1,340 1,644 1,948 2,252 2,558 2,862
Powerho
use Civil C
osts $$
Runner Dia (mm)
E Prov Proforma_1-7-11.xlsx For Planning Purposes Only

Privileged and Confidential Ten Mile River Hydro Phase I Feasibility Study
TG Costs
No Description 2009 2010
1 Mavel 0.85M Bulb, Dbl Reg 3502 Mavel 1.29M Vert Kapl 4503 Mavel 1.05M Bulb, Dbl Reg 4904 Mavel 1.8M Vert Kapl 1,1255 Mavel 0.85M Vert Kapl 400 650 mm 0.000351856 Mavel 1.29 Bulb, Dbl Reg 900 bb 607 Mavel 1.8 Bulb, Dbl Reg 1,140 b= 293
m= 0.471Dia Price Eq
Dbl Reg Bulbs (esc 2009 by 2.5%) 850 359 693 3141,050 502 787 4481,290 900 900 6461,500 999 999 8521,800 1,140 1,140 1,2003,000 3,167 1,705 3,227
1,9002,533
Cost CalculatorInput Diameter Bulb 1,250 702 2010 Price ($1,000's)
Runner Diameter (mm) Cost810 406 405,667 900 455 455,227 920 467 467,010 950 485 485,210 950 485 485,210 1250 702 701,858
y = 0.00035x2 ‐ 0.04784x + 214.78276
0
500
1,000
1,500
2,000
2,500
3,000
3,500
822 1,128 1,431 1,736 2,040 2,344 2,648 2,954
2010 Price ($1,000's)2010 Price ($1,000's) Poly. (2010 Price ($1,000's))
E Prov Proforma_1-7-11.xlsx For Planning Purposes Only

Privileged and Confidential Ten Mile River HydroPhase I Feasibility Study
Regulatory Costs
Alternatives Key Regulatory DriversConsultations
(yrs)Studies
(yrs)Costs
($1,000's)
A, D, F Minimal Env. Impacts (bypass, stream flows & wetlands) 2 0.5 $288
B, E Bypass, Wetland Impacts, Standard ABF 2 2 $400
C Longer Bypass, More Wetland Impacts, Standard ABF 3 2 $450
B, E Bypass, Wetland Impacts, Modified ABF 3 2.5 $488
C Longer Bypass, More Wetland Impacts, Modified ABF 3 3 $525
Licensing & Permitting Summary
E Prov Proforma_1-7-11.xlsx For Planning Purposes Only

Privileged and Confidential Ten Mile River HydroPhase I Feasibility Study
Interconnect Costs
Qty Units Unit Price Total Price Qty Units Unit Price Total Price Qty Units Unit Price Total Price1 13.8 kV Overhead Distribution Line 0.33 mi. $100,000 $33,000 0.52 mi. $100,000 $52,000 0.15 mi. $100,000 $15,0002 13.8 kv Sectionalizers 1 ea $10,000 $10,000 1 ea $10,000 $10,000 1 ea $10,000 $10,0003 13.8 kV Pole-Mounted Distribution Transformers 3 ea $10,000 $30,000 3 ea $10,000 $30,000 3 ea $10,000 $30,0004 3-Phase Fused Disconnecting Switch 1 ea $10,000 $10,000 1 ea $10,000 $10,000 1 ea $10,000 $10,0005 Service Switchgear
- Main disconnecting switch-Branch circuit breakers
1 ea $20,000 $20,000 1 ea $20,000 $20,000 1 ea $20,000 $20,000
Total $103,000 $122,000 $85,000
ITEM / DESCRIPTIONINTERCONNECTION TO NATIONAL GRID
Turner Reservoir (Single Circuit) Hunt's Mill (Single Circuit) Omega Pond (Single Circuit)
E Prov Proforma_1-7-11.xlsx For Planning Purposes Only

Phase I Dam Repairs Ten Mile River HydroPhase I Feasibility Study
For Planning Purposes Only
Dam Repair CostsGeneral
Maintenance Costs
TOTAL ($1,000's)
Omega 10,000 10,000 20Hunt's Mill 40,000 10,000 50Turner Reservoir 210,000 10,000 220
General Maintenance costs are catch-up allowances
Repair estimates from Phase I Inspection Rpt (MBP Consulting, 11/10); Turner includes $180k for FERC studies
E Prov Proforma_3-7-2011.xlsx

Costs A Ten Mile River HydroPhase I Feasibility Study
For Planning Purposes Only
No. Item Unit Qty RateAmount
($1,000's)Comments
1 General
a Mob/Demob 1 25,000 25 Allowanceb Site Prep 1 10,000 10 Allowancec Clear & Grub acre 0.5 8,000 4 Allowanced E&S Control ft. 100 10 1 Allowancee Dam Repairs 1 220,000 220 From Phase I Dam Repair Costs (MBP Consulting 2010)f Subtotal, General 260
2 Powerhouse/Intake
a Coffer dam, Pond 100 Allowanceb Cofferdam, Tailrace 10 Allowancec Powerhouse Civil 1 677,586 678 Includes: intake, powerhouse, tailrace and trashrakek Sluice gate 1 20,000 20l Misc. metals 1 5,000 5 Allowance
m HVAC 1 10,000 10 Allowancen Auxilliary Mechanical 1 10,000 10 Allowanceo Lighting, auxilliary electrical 1 5,000 5 Allowancep Other 0 0q Subtotal, Powerhouse 838
3 Equipment
a Turbine, generator, & governor 1 701,858 702 Runner 1.25m, estimated costs developed from recent projectsb Shipping Handling & Installation 1 163,372 163 20% of equipment costsc Switchgear 1 20,000 20 Fostiak Engineering (2010)d Instrumentation & Controls 1 50,000 50 Allowance, includes license min flow compliancee Station Service, MCC 1 20,000 20 Allowancef Protection 1 25,000 25 Allowanceg Subtotal, Equipment 980
8 PM&E Measures
a Water Quality 1 20,000 20 Allowanceb D/S fish passage 0 20,000 0 Assumes installed by othersc Min flow verification 0 5,000 0 Included in Instrumentation & Controlsd Wetlands acre 0.5 60,000 30 Allowancee Recreation 1 20,000 20 Allowancef Cultural 1 7,500 8 Allowanceg Subtotal, PM&E 78
9 Licensing & Permitting
a Consultations year 2 50,000 100 Allowanceb Studies year 0.5 75,000 38 Allowancec Draft FERC Application 1 50,000 50 Allowanced Final FERC Application 1 25,000 25 Allowancee Legal review 1 25,000 25 Allowancef Non-FERC Permits 1 50,000 50 Allowance: WQC, Wetlands, S. 106, S. 404, CZM, etc.g Subtotal, Lic. & Permitting 288
E Prov Proforma_3-7-2011.xlsx

Costs A Ten Mile River HydroPhase I Feasibility Study
For Planning Purposes Only
No. Item Unit Qty RateAmount
($1,000's)Comments
10 Land & Land Rights
a Flowage rights 1 5,000 5 Allowanceb Project works, land in fee 1 0c Interconnection R.O.W. 1 5,000 5 Allowanced Legal 1 10,000 10 Allowancee Other 0f Subtotal, Land 20
11 Interconnection
a Clear & Grub acre 0.5 8,000 4 Allowanceb New Line 1 33,000 33 Fostiak Eng. (2010)c Metering 1 10,000 10 Allowancec Switchyard 1 50,000 50 Includes: sectionalizers, transformers, disconnect switch.
From Interconnection Costs (Fostiak Eng. 2010)d Consultations 1 20,000 20 Allowancef Subtotal, Interconnection 117
12 Indirect Costs
a A/E 1 206,385 206 8% of Direct Costsb Construction Management 1 25,000 25 Allowancec Testing 1 20,000 20 geo-tech, concreted FERC submittals 1 35,000 35 Design Report, Status Reportse Owner's Admin & Overhead 1 100,000 100 Allowancef Other 0g Subtotal, Indirects 386
Totals
1 General 2602 Powerhouse/Intake 8383 Equipment 9808 PM&E Measures 789 Licensing & Permitting 28810 Land & Land Rights 2011 Interconnection 117
Subtotal, Directs 2,580
12 Indirect Costs 386Subtotal 2,966
13 Contingency $2,966,201 20% 593
Grand Total 3,559
E Prov Proforma_3-7-2011.xlsx

Costs B Ten Mile River HydroPhase I Feasibility Study
For Planning Purposes Only
No. Item Unit Qty RateAmount
($1,000's)Comments
1 General
a Mob/Demob 1 25,000 25 Allowanceb Site Prep 1 10,000 10 Allowancec Clear & Grub acre 4 8,000 32 Allowance, includes penstock alignmentd E&S Control ft. 2000 10 20 Allowance, includes penstock alignmente Dam Repairs 1 270,000 270 From Phase I Dam Repair Costs (MBP Consulting 2010)f Subtotal, General 357
2 Powerhouse/Intake
a Coffer dam, Pond 100 Allowanceb Cofferdam, Tailrace 10 Allowancec Powerhouse Civil 1 576,264 576 Includes: intake, powerhouse, tailrace and trashrake
k Penstock ft. 2000 445 889 4.3' diameter penstock. Includes: materials, shipping & installation
l Misc. metals 1 5,000 5 Allowancem HVAC 1 10,000 10 Allowancen Auxilliary Mechanical 1 10,000 10 Allowanceo Lighting, auxilliary electrical 1 5,000 5 Allowancep cy 0q Subtotal, Powerhouse/Intake 1,606
3 Equipment
a Turbine, generator, & governor 1 455,227 455 900mm runner, estimated costs developed from recent projectsb Shipping Handling & Installation 1 114,045 114 20% of equipment costsc Switchgear 1 20,000 20 Fostiak Eng. (2010)d Instrumentation & Controls 1 50,000 50 Allowance, includes license min flow verificatione Station Service, MCC 1 20,000 20 Allowancef Protection 1 25,000 25 Allowanceg Subtotal, Equipment 684
8 PM&E Measures
a Water Quality 1 40,000 40 Allowance for monitoringb D/S fish passage 0 20,000 0 Assumes installed by othersc Min flow verification 0 5,000 0 Included in Instrumentation & Controlsd Wetlands acre 1.5 60,000 90 Allowance for impacts from penstock alignmente Recreation 1 20,000 20 Allowancef Cultural 1 7,500 8 Allowanceg Subtotal, PM&E 158
9 Licensing & Permitting
a Consultations year 2 50,000 100 Allowanceb Studies year 2 75,000 150 Alowance; assumes acceptance of standard instream flow settingsc Draft FERC Application 1 50,000 50 Allowanced Final FERC Application 1 25,000 25 Allowancee Legal review 1 25,000 25 Allowancef Non-FERC Permits 1 50,000 50 Allowance: WQC, Wetlands, S. 106, S. 404, CZM, etc.g Subtotal, Lic. & Permitting 400
E Prov Proforma_3-7-2011.xlsx

Costs B Ten Mile River HydroPhase I Feasibility Study
For Planning Purposes Only
No. Item Unit Qty RateAmount
($1,000's)Comments
10 Land & Land Rights
a Flowage rights 1 5,000 5 Allowanceb Project works, land in fee 1 20,000 20 Allowance for penstock alignmentc Interconnection R.O.W. 1 5,000 5 Allowanced Legal 1 10,000 10 Allowancee Other 0f Subtotal, Land 40
11 Interconnection
a Clear & Grub acre 1 6,200 6 Allowanceb New Line 1 52,000 52 Fostiak Eng. (2010)c Metering 1 10,000 10 Allowance
c Switchyard 1 50,000 50 Includes: sectionalizers, transformers, disconnect switch.From Interconnection Costs (Fostiak Eng. 2010)
d Consultations 1 20,000 20 Allowancef Subtotal, Interconnection 138
12 Indirect Costs
a A/E 1 270,598 271 8% of Direct Costsb Construction Management 1 25,000 25 Allowancec Testing 1 20,000 20 geo-tech, concreted FERC submittals 1 35,000 35 Design Report, Status Reportse Owner's Admin & Overhead 1 100,000 100 Allowancef Other 0g Subtotal, Indirects 451
Totals
1 General 3572 Powerhouse/Intake 1,6063 Equipment 6848 PM&E Measures 1589 Licensing & Permitting 40010 Land & Land Rights 4011 Interconnection 138
Subtotal, Directs 3,382
12 Indirect Costs 451Subtotal 3,833
13 Contingency $3,833,070 20% 767
Grand Total 4,600
E Prov Proforma_3-7-2011.xlsx

Costs B (1-2 min flow) Ten Mile River HydroPhase I Feasibility Study
For Planning Purposes Only
No. Item Unit Qty RateAmount
($1,000's)Comments
1 General
a Mob/Demob 1 25,000 25 Allowanceb Site Prep 1 10,000 10 Allowancec Clear & Grub acre 4 8,000 32 Allowance, includes penstock alignmentd E&S Control ft. 2000 10 20 Allowance, includes penstock alignmente Dam Repairs 1 270,000 270 From Phase I Dam Repair Costs (MBP Consulting 2010)f Subtotal, General 357
2 Powerhouse/Intake
a Coffer dam, Pond 100 Allowanceb Cofferdam, Tailrace 10 Allowancec Powerhouse Civil 1 592,940 593 Includes: intake, powerhouse, tailrace and trashrake
k Penstock ft. 2000 475 950 Assumes 4.6' diameter penstock. Includes: materials, shipping & installation
l Misc. metals 1 5,000 5 Allowancem HVAC 1 10,000 10 Allowancen Auxilliary Mechanical 1 10,000 10 Allowanceo Lighting, auxilliary electrical 1 5,000 5 Allowancep Other 0q Subtotal, Powerhouse/Intake 1,682
3 Equipment
a Turbine, generator, & governor 1 485,210 485 Runner 950mm, Estimated costs developed from recent projectsb Shipping Handling & Installation 1 120,042 120 20% of equipment costsc Switchgear 1 20,000 20 Fostiak Eng. (2010)d Instrumentation & Controls 1 50,000 50 Allowance, includes license min flow verificatione Station Service, MCC 1 20,000 20 Allowancef Protection 1 25,000 25 Allowanceg Subtotal, Equipment 720
8 PM&E Measures
a Water Quality 1 40,000 40 Allowance for monitoringb D/S fish passage 0 20,000 0 Assumes installed by othersc Min flow verification 0 5,000 0 Included in Instrumentation & Controlsd Wetlands acre 1.5 60,000 90 Allowance for impacts from penstock alignmente Recreation 1 20,000 20 Allowancef Cultural 1 7,500 8 Allowanceg Subtotal, PM&E 158
9 Licensing & Permitting
a Consultations year 3 50,000 150 Allowanceb Studies year 2.5 75,000 188 Alowance; assumes instream flow studiesc Draft FERC Application 1 50,000 50 Allowanced Final FERC Application 1 25,000 25 Allowancee Legal review 1 25,000 25 Allowancef Non-FERC Permits 1 50,000 50 Allowance: WQC, Wetlands, S. 106, S. 404, CZM, etc.g Subtotal, Lic. & Permitting 488
E Prov Proforma_3-7-2011.xlsx
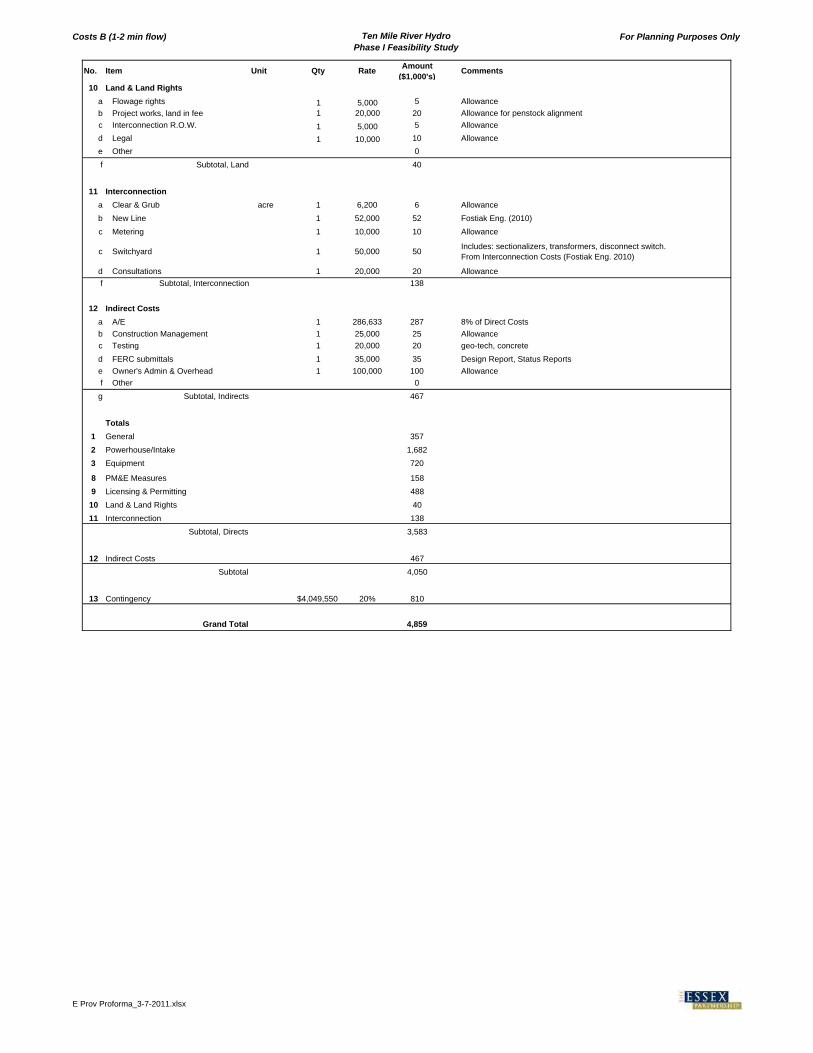
Costs B (1-2 min flow) Ten Mile River HydroPhase I Feasibility Study
For Planning Purposes Only
No. Item Unit Qty RateAmount
($1,000's)Comments
10 Land & Land Rights
a Flowage rights 1 5,000 5 Allowanceb Project works, land in fee 1 20,000 20 Allowance for penstock alignmentc Interconnection R.O.W. 1 5,000 5 Allowanced Legal 1 10,000 10 Allowancee Other 0f Subtotal, Land 40
11 Interconnection
a Clear & Grub acre 1 6,200 6 Allowanceb New Line 1 52,000 52 Fostiak Eng. (2010)c Metering 1 10,000 10 Allowance
c Switchyard 1 50,000 50 Includes: sectionalizers, transformers, disconnect switch.From Interconnection Costs (Fostiak Eng. 2010)
d Consultations 1 20,000 20 Allowancef Subtotal, Interconnection 138
12 Indirect Costs
a A/E 1 286,633 287 8% of Direct Costsb Construction Management 1 25,000 25 Allowancec Testing 1 20,000 20 geo-tech, concreted FERC submittals 1 35,000 35 Design Report, Status Reportse Owner's Admin & Overhead 1 100,000 100 Allowancef Other 0g Subtotal, Indirects 467
Totals
1 General 3572 Powerhouse/Intake 1,6823 Equipment 7208 PM&E Measures 1589 Licensing & Permitting 48810 Land & Land Rights 4011 Interconnection 138
Subtotal, Directs 3,583
12 Indirect Costs 467Subtotal 4,050
13 Contingency $4,049,550 20% 810
Grand Total 4,859
E Prov Proforma_3-7-2011.xlsx

Costs B (no min flow) Ten Mile River HydroPhase I Feasibility Study
For Planning Purposes Only
No. Item Unit Qty RateAmount
($1,000's)Comments
1 General
a Mob/Demob 1 25,000 25 Allowanceb Site Prep 1 10,000 10 Allowancec Clear & Grub acre 4 8,000 32 Allowance, includes penstock alignmentd E&S Control ft. 2000 10 20 Allowance, includes penstock alignmente Dam Repairs 1 270,000 270 From Phase I Dam Repair Costs (MBP Consulting 2010)f Subtotal, General 357
2 Powerhouse/Intake
a Coffer dam, Pond 100 Allowanceb Cofferdam, Tailrace 10 Allowancec Powerhouse Civil 1 677,586 678 Includes: intake, powerhouse, tailrace and trashrake
k Penstock ft. 2000 614 1,228 5.8' diameter penstock. Includes: material, transporation and installation
l Misc. metals 1 5,000 5 Allowancem HVAC 1 10,000 10 Allowancen Auxilliary Mechanical 1 10,000 10 Allowanceo Lighting, auxilliary electrical 1 5,000 5 Allowancep Other 0q Subtotal, Powerhouse/Intake 2,046
3 Equipment
a Turbine, generator, & governor 1 701,858 702 Runner 1.25m, estimated costs developed from recent projectsb Shipping Handling & Installation 1 163,372 163 20% of equipment costsc Switchgear 1 20,000 20 Fostiak Eng. (2010)d Instrumentation & Controls 1 50,000 50 Allowance, includes license min flow verificatione Station Service, MCC 1 20,000 20 Allowancef Protection 1 25,000 25 Allowanceg Subtotal, Equipment 980
8 PM&E Measures
a Water Quality 1 40,000 40 Allowance for monitoringb D/S fish passage 0 20,000 0 Assumes installed by othersc Min flow verification 0 5,000 0 Included in Instrumentation & Controlsd Wetlands acre 1.5 60,000 90 Allowance for impacts from penstock alignmente Recreation 1 20,000 20 Allowancef Cultural 1 7,500 8 Allowanceg Subtotal, PM&E 158
9 Licensing & Permitting
a Consultations year 3 50,000 150 Allowanceb Studies year 2.5 75,000 188 Alowance; assumes instream flow studiesc Draft FERC Application 1 50,000 50 Allowanced Final FERC Application 1 25,000 25 Allowancee Legal review 1 25,000 25 Allowancef Non-FERC Permits 1 50,000 50 Allowance: WQC, Wetlands, S. 106, S. 404, CZM, etc.g Subtotal, Lic. & Permitting 488
E Prov Proforma_3-7-2011.xlsx

Costs B (no min flow) Ten Mile River HydroPhase I Feasibility Study
For Planning Purposes Only
No. Item Unit Qty RateAmount
($1,000's)Comments
10 Land & Land Rights
a Flowage rights 1 5,000 5 Allowanceb Project works, land in fee 1 20,000 20 Allowance for penstock alignmentc Interconnection R.O.W. 1 5,000 5 Allowanced Legal 1 10,000 10 Allowancee Other 0f Subtotal, Land 40
11 Interconnection
a Clear & Grub acre 1 6,200 6 Allowanceb New Line 1 52,000 52 Fostiak Eng. (2010)c Metering 1 10,000 10 Allowance
c Switchyard 1 50,000 50 Includes: sectionalizers, transformers, disconnect switch.From Interconnection Costs (Fostiak Eng. 2010)
d Consultations 1 20,000 20 Allowancef Subtotal, Interconnection 138
12 Indirect Costs
a A/E 1 336,485 336 8% of Direct Costsb Construction Management 1 25,000 25 Allowancec Testing 1 20,000 20 geo-tech, concreted FERC submittals 1 35,000 35 Design Report, Status Reportse Owner's Admin & Overhead 1 100,000 100 Allowancef Other 0g Subtotal, Indirects 516
Totals
1 General 3572 Powerhouse/Intake 2,0463 Equipment 9808 PM&E Measures 1589 Licensing & Permitting 488
10 Land & Land Rights 4011 Interconnection 138
Subtotal, Directs 4,206
12 Indirect Costs 516Subtotal 4,723
13 Contingency $4,722,549 20% 945
Grand Total 5,667
E Prov Proforma_3-7-2011.xlsx

Costs C Ten Mile River HydroPhase I Feasibility Study
For Planning Purposes Only
No. Item Unit Qty RateAmount
($1,000's)Comments
1 General
a Mob/Demob 1 25,000 25 Allowanceb Site Prep 1 10,000 10 Allowancec Clear & Grub acre 4 8,000 32 Allowance, includes penstock alignmentd E&S Control ft. 2000 10 20 Allowance, includes penstock alignmente Dam Repairs 1 270,000 270 Phase I Dam Repair Cost (MBP Consulting)f Subtotal, General 357
2 Powerhouse/Intake
a Coffer dam, Pond 100 Allowanceb Cofferdam, Tailrace 10 Allowancec Powerhouse Civil 1 576,264 576 Includes: intake, powerhouse, tailrace and trashrake
k Penstock ft. 2300 445 1,023 4.3' diameter penstock. Includes: materials, shipping & installation
l Misc. metals 1 5,000 5 Allowancem HVAC 1 10,000 10 Allowancen Auxilliary Mechanical 1 10,000 10 Allowanceo Lighting, auxilliary electrical 1 5,000 5 Allowancep Other 0q Subtotal, Powerhouse/Intake 1,739
3 Equipment
a Turbine, generator, & governor 1 455,227 455 900mm runner, estimated costs developed from recent projectsb Shipping Handling & Installation 1 114,045 114 20% of equipment costsc Switchgear 1 20,000 20 Fostiak Eng. (2010)d Instrumentation & Controls 1 50,000 50 Allowance, includes license min flow verificatione Station Service, MCC 1 20,000 20 Allowancef Protection 1 25,000 25 Allowanceg Subtotal, Equipment 684
8 PM&E Measures
a Water Quality 1 40,000 40 Allowance for monitoringb D/S fish passage 0 20,000 0 Assumes installed by othersc Min flow verification 0 5,000 0 Included in Instrumentation & Controlsd Wetlands acre 3 60,000 180 Allowance for impacts from penstock and tailrace alignmente Recreation 1 20,000 20 Allowancef Cultural 1 7,500 8 Allowanceg Subtotal, PM&E 248
9 Licensing & Permitting
a Consultations year 3 50,000 150 Allowanceb Studies year 2 75,000 150 Alowance; assumes acceptance of standard instream flow settingsc Draft FERC Application 1 50,000 50 Allowanced Final FERC Application 1 25,000 25 Allowancee Legal review 1 25,000 25 Allowancef Non-FERC Permits 1 50,000 50 Allowance: WQC, Wetlands, S. 106, S. 404, CZM, etc.g Subtotal, Lic. & Permitting 450
E Prov Proforma_3-7-2011.xlsx

Costs C Ten Mile River HydroPhase I Feasibility Study
For Planning Purposes Only
No. Item Unit Qty RateAmount
($1,000's)Comments
10 Land & Land Rights
a Flowage rights 1 5,000 5 Allowanceb Project works, land in fee 1 20,000 20 Allowance for penstock alignmentc Interconnection R.O.W. 1 5,000 5 Allowanced Legal 1 10,000 10 Allowancee Other 0f Subtotal, Land 40
11 Interconnection
a Clear & Grub acre 1 6,200 6 Allowanceb New Line 1 52,000 52 Fostiak Eng. (2010)c Metering 1 10,000 10 Allowance
c Switchyard 1 50,000 50 Includes: sectionalizers, transformers, disconnect switch.From Interconnection Costs (Fostiak Eng. 2010)
d Consultations 1 20,000 20 Allowancef Subtotal, Interconnection 138
12 Indirect Costs
a A/E 1 292,469 292 8% of Direct Costsb Construction Management 1 25,000 25 Allowancec Testing 1 20,000 20 geo-tech, concreted FERC submittals 1 35,000 35 Design Report, Status Reportse Owner's Admin & Overhead 1 100,000 100 Allowancef Other 0g Subtotal, Indirects 472
Totals
1 General 3572 Powerhouse/Intake 1,7393 Equipment 6848 PM&E Measures 2489 Licensing & Permitting 45010 Land & Land Rights 4011 Interconnection 138
Subtotal, Directs 3,656
12 Indirect Costs 472Subtotal 4,128
13 Contingency $4,128,326 20% 826
Grand Total 4,954
E Prov Proforma_3-7-2011.xlsx

Costs C (1-2 min flow) Ten Mile River HydroPhase I Feasibility Study
For Planning Purposes Only
No. Item Unit Qty RateAmount
($1,000's)Comments
1 General
a Mob/Demob 1 25,000 25 Allowanceb Site Prep 1 10,000 10 Allowancec Clear & Grub acre 4 8,000 32 Allowance, includes penstock alignmentd E&S Control ft. 2000 10 20 Allowance, includes penstock alignmente Dam Repairs 1 270,000 270 Phase I Dam Repair Cost (MBP Consulting)f Subtotal, General 357
2 Powerhouse/Intake
a Coffer dam, Pond 100 Allowanceb Cofferdam, Tailrace 10 Allowancec Powerhouse Civil 1 592,940 593 Includes: intake, powerhouse, tailrace and trashrake
k Penstock ft. 2300 475 1,092 Assumes 4.6' diameter penstock. Includes: materials, shipping & installation
l Misc. metals 1 5,000 5 Allowancem HVAC 1 10,000 10 Allowancen Auxilliary Mechanical 1 10,000 10 Allowanceo Lighting, auxilliary electrical 1 5,000 5 Allowancep Other 0q Subtotal, Powerhouse/Intake 1,825
3 Equipment
a Turbine, generator, & governor 1 485,210 485 950mm, Costs developed from recent projectsb Shipping Handling & Installation 1 120,042 120 20% of equipment costsc Switchgear 1 20,000 20 Fostiak Eng. (2010)d Instrumentation & Controls 1 50,000 50 Allowance, includes license min flow verificatione Station Service, MCC 1 20,000 20 Allowancef Protection 1 25,000 25 Allowanceg Subtotal, Equipment 720
8 PM&E Measures
a Water Quality 1 40,000 40 Allowance for monitoringb D/S fish passage 0 20,000 0 Assumes installed by othersc Min flow verification 0 5,000 0 Included in Instrumentation & Controlsd Wetlands acre 3 60,000 180 Allowance for impacts from penstock and tailrace alignmente Recreation 1 20,000 20 Allowancef Cultural 1 7,500 8 Allowanceg Subtotal, PM&E 248
9 Licensing & Permitting
a Consultations year 3 50,000 150 Allowanceb Studies year 3 75,000 225 Alowance; assumes instream flow studiesc Draft FERC Application 1 50,000 50 Allowanced Final FERC Application 1 25,000 25 Allowancee Legal review 1 25,000 25 Allowancef Non-FERC Permits 1 50,000 50 Allowance: WQC, Wetlands, S. 106, S. 404, CZM, etc.g Subtotal, Lic. & Permitting 525
E Prov Proforma_3-7-2011.xlsx

Costs C (1-2 min flow) Ten Mile River HydroPhase I Feasibility Study
For Planning Purposes Only
No. Item Unit Qty RateAmount
($1,000's)Comments
10 Land & Land Rights
a Flowage rights 1 5,000 5 Allowanceb Project works, land in fee 1 20,000 20 Allowance for penstock alignmentc Interconnection R.O.W. 1 5,000 5 Allowanced Legal 1 10,000 10 Allowancee Other 0f Subtotal, Land 40
11 Interconnection
a Clear & Grub acre 1 6,200 6 Allowanceb New Line 1 52,000 52 Fostiak Eng. (2010)c Metering 1 10,000 10 Allowance
c Switchyard 1 50,000 50 Includes: sectionalizers, transformers, disconnect switch.From Interconnection Costs (Fostiak Eng. 2010)
d Consultations 1 20,000 20 Allowancef Subtotal, Interconnection 138
12 Indirect Costs
a A/E 1 308,228 308 8% of Direct Costsb Construction Management 1 25,000 25 Allowancec Testing 1 20,000 20 geo-tech, concreted FERC submittals 1 35,000 35 Design Report, Status Reportse Owner's Admin & Overhead 1 100,000 100 Allowancef Other 0g Subtotal, Indirects 488
Totals
1 General 3572 Powerhouse/Intake 1,8253 Equipment 7208 PM&E Measures 2489 Licensing & Permitting 52510 Land & Land Rights 4011 Interconnection 138
Subtotal, Directs 3,853
12 Indirect Costs 488Subtotal 4,341
13 Contingency $4,341,074 20% 868
Grand Total 5,209
E Prov Proforma_3-7-2011.xlsx

Costs C (no min flow) Ten Mile River HydroPhase I Feasibility Study
For Planning Purposes Only
No. Item Unit Qty RateAmount
($1,000's)Comments
1 General
a Mob/Demob 1 25,000 25 Allowanceb Site Prep 1 10,000 10 Allowancec Clear & Grub acre 4 8,000 32 Allowance, includes penstock alignmentd E&S Control ft. 2000 10 20 Allowance, includes penstock alignmente Dam Repairs 1 270,000 270 Phase I Dam Repair Cost (MBP Consulting)f Subtotal, General 357
2 Powerhouse/Intake
a Coffer dam, Pond 100 Allowanceb Cofferdam, Tailrace 10 Allowancec Powerhouse Civil 1 677,586 678 Includes: intake, powerhouse, tailrace and trashrake
k Penstock ft. 2300 614 1,412 5.8' diameter penstock. Includes: material, transporation and installation
l Misc. metals 1 5,000 5 Allowancem HVAC 1 10,000 10 Allowancen Auxilliary Mechanical 1 10,000 10 Allowanceo Lighting, auxilliary electrical 1 5,000 5 Allowancep Other 0q Subtotal, Powerhouse/Intake 2,230
3 Equipment
a Turbine, generator, & governor 1 701,858 702 Runner 1.25m, estimated costs developed from recent projectsb Shipping Handling & Installation 1 163,372 163 20% of equipment costsc Switchgear 1 20,000 20 Fostiak Eng. (2010)d Instrumentation & Controls 1 50,000 50 Allowance, includes license min flow verificatione Station Service, MCC 1 20,000 20 Allowancef Protection 1 25,000 25 Allowanceg Subtotal, Equipment 980
8 PM&E Measures
a Water Quality 1 40,000 40 Allowance for monitoringb D/S fish passage 0 20,000 0 Assumes installed by othersc Min flow verification 0 5,000 0 Included in Instrumentation & Controlsd Wetlands acre 3 60,000 180 Allowance for impacts from penstock and tailrace alignmente Recreation 1 20,000 20 Allowancef Cultural 1 7,500 8 Allowanceg Subtotal, PM&E 248
9 Licensing & Permitting
a Consultations year 3 50,000 150 Allowanceb Studies year 3 75,000 225 Alowance; assumes instream flow studiesc Draft FERC Application 1 50,000 50 Allowanced Final FERC Application 1 25,000 25 Allowancee Legal review 1 25,000 25 Allowancef Non-FERC Permits 1 50,000 50 Allowance: WQC, Wetlands, S. 106, S. 404, CZM, etc.g Subtotal, Lic. & Permitting 525
E Prov Proforma_3-7-2011.xlsx

Costs C (no min flow) Ten Mile River HydroPhase I Feasibility Study
For Planning Purposes Only
No. Item Unit Qty RateAmount
($1,000's)Comments
10 Land & Land Rights
a Flowage rights 1 5,000 5 Allowanceb Project works, land in fee 1 20,000 20 Allowance for penstock alignmentc Interconnection R.O.W. 1 5,000 5 Allowanced Legal 1 10,000 10 Allowancee Other 0f Subtotal, Land 40
11 Interconnection
a Clear & Grub acre 1 6,200 6 Allowanceb New Line 1 52,000 52 Fostiak Eng. (2010)c Metering 1 10,000 10 Allowance
c Switchyard 1 50,000 50 Includes: sectionalizers, transformers, disconnect switch.From Interconnection Costs (Fostiak Eng. 2010)
d Consultations 1 20,000 20 Allowancef Subtotal, Interconnection 138
12 Indirect Costs
a A/E 1 361,422 361 8% of Direct Costsb Construction Management 1 25,000 25 Allowancec Testing 1 20,000 20 geo-tech, concreted FERC submittals 1 35,000 35 Design Report, Status Reportse Owner's Admin & Overhead 1 100,000 100 Allowancef Other 0g Subtotal, Indirects 541
Totals
1 General 3572 Powerhouse/Intake 2,2303 Equipment 9808 PM&E Measures 2489 Licensing & Permitting 52510 Land & Land Rights 4011 Interconnection 138
Subtotal, Directs 4,518
12 Indirect Costs 541Subtotal 5,059
13 Contingency $5,059,193 20% 1,012
Grand Total 6,071
E Prov Proforma_3-7-2011.xlsx

Costs C - Francis Refurb Ten Mile River HydroPhase I Feasibility Study
For Planning Purposes Only
No. Item Unit Qty RateAmount
($1,000's)Comments
1 General
a Mob/Demob 1 25,000 25 Allowanceb Site Prep 1 10,000 10 Allowancec Clear & Grub acre 4 8,000 32 Allowance, includes penstock alignmentd E&S Control ft. 2000 10 20 Allowance, includes penstock alignmente Dam Repairs 1 270,000 270 Phase I Dam Repair Cost (MBP Consulting)f Subtotal, General 357
2 Powerhouse/Intake
a Coffer dam, Pond 100 Allowanceb Cofferdam, Tailrace 10 Allowancec Powerhouse Civil 1 100,000 100 Includes: intake, trashracks & powerhouse repairsk Penstock ft. 2300 445 1,023 4.3' diameter penstock. Includes: material, shipping & installationl Misc. metals 1 5,000 5 Allowance
m HVAC 1 10,000 10 Allowancen Auxilliary Mechanical 1 10,000 10 Allowanceo Lighting, auxilliary electrical 1 5,000 5 Allowancep Trashrake 1 150,000 150q Subtotal, Powerhouse/Intake 1,413
3 Equipment
a Turbine, generator, & governor 1 400,000 400 Allowanceb Shipping Handling & Installation 1 103,000 103 20% of equipment costsc Switchgear 1 20,000 20 Fostiak Eng. (2010)d Instrumentation & Controls 1 50,000 50 Allowance, includes license min flow verificatione Station Service, MCC 1 20,000 20 Allowancef Protection 1 25,000 25 Allowance
g Subtotal, Equipment 618
8 PM&E Measures
a Water Quality 1 40,000 40 Allowance for monitoringb D/S fish passage 0 20,000 0 Assumes installed by othersc Min flow verification 0 5,000 0 Included in Instrumentation & Controlsd Wetlands acre 3 60,000 180 Allowance for impacts from penstock and tailrace alignmente Recreation 1 20,000 20 Allowancef Cultural 1 7,500 8 Allowance
g Subtotal, PM&E 248
9 Licensing & Permitting
a Consultations year 3 50,000 150 Allowanceb Studies year 2 75,000 150 Alowance; assumes acceptance of standard instream flow settingsc Draft FERC Application 1 50,000 50 Allowanced Final FERC Application 1 25,000 25 Allowancee Legal review 1 25,000 25 Allowancef Non-FERC Permits 1 50,000 50 Allowance: WQC, Wetlands, S. 106, S. 404, CZM, etc.
g Subtotal, Lic. & Permitting 450
E Prov Proforma_3-7-2011.xlsx
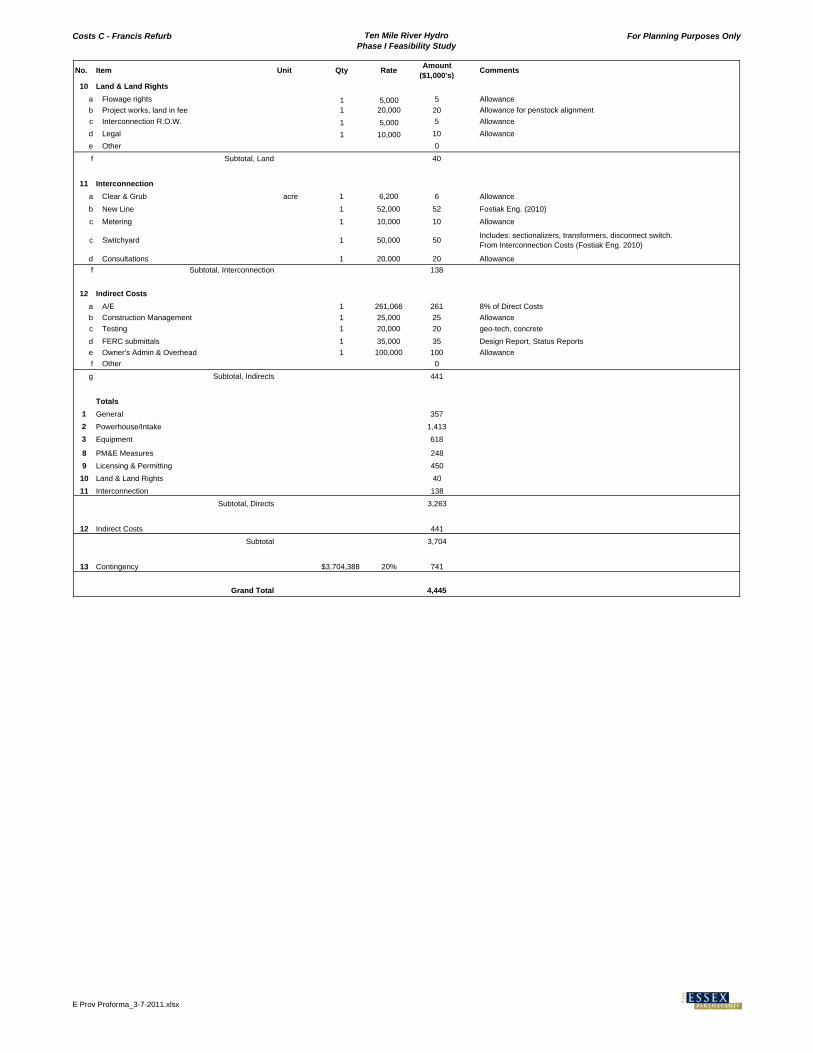
Costs C - Francis Refurb Ten Mile River HydroPhase I Feasibility Study
For Planning Purposes Only
No. Item Unit Qty RateAmount
($1,000's)Comments
10 Land & Land Rights
a Flowage rights 1 5,000 5 Allowanceb Project works, land in fee 1 20,000 20 Allowance for penstock alignmentc Interconnection R.O.W. 1 5,000 5 Allowanced Legal 1 10,000 10 Allowancee Other 0f Subtotal, Land 40
11 Interconnection
a Clear & Grub acre 1 6,200 6 Allowanceb New Line 1 52,000 52 Fostiak Eng. (2010)c Metering 1 10,000 10 Allowance
c Switchyard 1 50,000 50 Includes: sectionalizers, transformers, disconnect switch.From Interconnection Costs (Fostiak Eng. 2010)
d Consultations 1 20,000 20 Allowancef Subtotal, Interconnection 138
12 Indirect Costs
a A/E 1 261,066 261 8% of Direct Costsb Construction Management 1 25,000 25 Allowancec Testing 1 20,000 20 geo-tech, concreted FERC submittals 1 35,000 35 Design Report, Status Reportse Owner's Admin & Overhead 1 100,000 100 Allowancef Other 0
g Subtotal, Indirects 441
Totals
1 General 3572 Powerhouse/Intake 1,4133 Equipment 6188 PM&E Measures 2489 Licensing & Permitting 450
10 Land & Land Rights 4011 Interconnection 138
Subtotal, Directs 3,263
12 Indirect Costs 441Subtotal 3,704
13 Contingency $3,704,388 20% 741
Grand Total 4,445
E Prov Proforma_3-7-2011.xlsx

Costs D Ten Mile River HydroPhase I Feasibility Study
For Planning Purposes Only
No. Item Unit Qty RateAmount
($1,000's)Comments
1 General
a Mob/Demob 1 25,000 25 Allowanceb Site Prep 1 10,000 10 Allowancec Clear & Grub acre 0.5 8,000 4 Allowanced E&S Control ft. 100 10 1 Allowancee Dam Repairs 1 50,000 50 Phase I Dam Repair Cost Est. (MBP Consulting 2010)f Subtotal, General 90
2 Powerhouse/Intake
a Coffer dam, Pond 100 Allowanceb Cofferdam, Tailrace 10 Allowancec Powerhouse Civil 1 677,586 678 Includes: intake, powerhouse, tailrace and trashrakek Sluice gate 1 20,000 20l Misc. metals 1 5,000 5 Allowance
m HVAC 1 10,000 10 Allowancen Auxilliary Mechanical 1 10,000 10 Allowanceo Lighting, auxilliary electrical 1 5,000 5 Allowancep Other 0q Subtotal, Powerhouse/Intake 838
3 Equipment
a Turbine, generator, & governor 1 701,858 702 Runner 1.25m, estimated costs developed from recent projectsb Shipping Handling & Installation 1 163,372 163 20% of equipment costsc Switchgear 1 20,000 20 Fostiak Eng. (2010)d Instrumentation & Controls 1 50,000 50 Allowance, includes license min flow verificatione Station Service, MCC 1 20,000 20 Allowancef Protection 1 25,000 25 Allowanceg Subtotal, Equipment 980
8 PM&E Measures
a Water Quality 1 20,000 20 Allowanceb D/S fish passage 0 20,000 0 Assumes installed by othersc Min flow verification 0 5,000 0 Included in Instrumentation & Controlsd Wetlands acre 0.5 60,000 30 Allowancee Recreation 1 20,000 20 Allowancef Cultural 1 7,500 8 Allowanceg Subtotal, PM&E 78
9 Licensing & Permitting
a Consultations year 2 50,000 100 Allowanceb Studies year 0.5 75,000 38 Allowancec Draft FERC Application 1 50,000 50 Allowanced Final FERC Application 1 25,000 25 Allowancee Legal review 1 25,000 25 Allowancef Non-FERC Permits 1 50,000 50 Allowance: WQC, Wetlands, S. 106, S. 404, CZM, etc.g Subtotal, Lic. & Permitting 288
E Prov Proforma_3-7-2011.xlsx

Costs D Ten Mile River HydroPhase I Feasibility Study
For Planning Purposes Only
No. Item Unit Qty RateAmount
($1,000's)Comments
10 Land & Land Rights
a Flowage rights 1 5,000 5 Allowanceb Project works, land in fee 1 0c Interconnection R.O.W. 1 5,000 5 Allowanced Legal 1 10,000 10 Allowancee Other 0f Subtotal, Land 20
11 Interconnection
a Clear & Grub acre 0.5 8,000 4 Allowanceb New Line 1 52,000 52 Fostiak Eng. (2010)c Metering 1 10,000 10 Allowancec Switchyard 1 50,000 50 Includes: sectionalizers, transformers, disconnect switch.
From Interconnection Costs (Fostiak Eng. 2010)d Consultations 1 20,000 20 Allowancef Subtotal, Interconnection 136
12 Indirect Costs
a A/E 1 194,305 194 8% of Direct Costsb Construction Management 1 25,000 25 Allowancec Testing 1 20,000 20 geo-tech, concreted FERC submittals 1 35,000 35 Design Report, Status Reportse Owner's Admin & Overhead 1 100,000 100 Allowancef Other 0g Subtotal, Indirects 374
Totals
1 General 902 Powerhouse/Intake 8383 Equipment 9808 PM&E Measures 789 Licensing & Permitting 28810 Land & Land Rights 2011 Interconnection 136
Subtotal, Directs 2,429
12 Indirect Costs 374Subtotal 2,803
13 Contingency $2,803,121 20% 561
Grand Total 3,364
E Prov Proforma_3-7-2011.xlsx

Costs E Ten Mile River HydroPhase I Feasibility Study
For Planning Purposes Only
No. Item Unit Qty RateAmount
($1,000's)Comments
1 General
a Mob/Demob 1 25,000 25 Allowanceb Site Prep 1 10,000 10 Allowancec Clear & Grub acre 4 6,200 25 Allowance, includes penstock alignmentd E&S Control ft. 2000 10 20 Allowance, includes penstock alignmente Dam Repairs 1 50,000 50 Phase I Dam Repair Cost (MBP Consulting)f Subtotal, General 130
2 Powerhouse/Intake
a Coffer dam, Pond 100 Allowanceb Cofferdam, Tailrace 10 Allowancec Powerhouse Civil 1 576,264 576 Includes: intake, powerhouse, tailrace and trashrake
k Penstock ft. 300 445 133 4.3' diameter penstock. Includes: materials, shipping & installation
l Misc. metals 1 5,000 5 Allowancem HVAC 1 10,000 10 Allowancen Auxilliary Mechanical 1 10,000 10 Allowanceo Lighting, auxilliary electrical 1 5,000 5 Allowancep ea 0q Subtotal, Powerhouse/Intake 850
3 Equipment
a Turbine, generator, & governor 1 455,227 455 900 mm runner, Estimated costs developed from recent projectsb Shipping Handling & Installation 1 114,045 114 20% of equipment costsc Switchgear 1 20,000 20 Fostiak Eng. (2010)d Instrumentation & Controls 1 50,000 50 Allowance, includes license min flow verificatione Station Service, MCC 1 20,000 20 Allowancef Protection 1 25,000 25 Allowanceg Subtotal, Equipment 684
8 PM&E Measures
a Water Quality 1 40,000 40 Allowance for monitoringb D/S fish passage 0 20,000 0 Assumes installed by othersc Min flow verification 0 5,000 0 Included in Instrumentation & Controlsd Wetlands acre 1.5 60,000 90 Allowance for impacts from tailracee Recreation 1 20,000 20 Allowancef Cultural 1 7,500 8 Allowanceg Subtotal, PM&E 158
9 Licensing & Permitting
a Consultations year 2 50,000 100 Allowanceb Studies year 2 75,000 150 Alowance; assumes acceptance of standard instream flow settingsc Draft FERC Application 1 50,000 50 Allowanced Final FERC Application 1 25,000 25 Allowancee Legal review 1 25,000 25 Allowancef Non-FERC Permits 1 50,000 50 Allowance: WQC, Wetlands, S. 106, S. 404, CZM, etc.g Subtotal, Lic. & Permitting 400
E Prov Proforma_3-7-2011.xlsx

Costs E Ten Mile River HydroPhase I Feasibility Study
For Planning Purposes Only
No. Item Unit Qty RateAmount
($1,000's)Comments
10 Land & Land Rights
a Flowage rights 1 5,000 5 Allowanceb Project works, land in fee 1 20,000 20 Allowance for penstock alignmentc Interconnection R.O.W. 1 5,000 5 Allowanced Legal 1 10,000 10 Allowancee Other 0f Subtotal, Land 40
11 Interconnection
a Clear & Grub acre 1 6,200 6 Allowanceb New Line 1 52,000 52 Fostiak Eng. (2010)c Metering 1 10,000 10 Allowance
c Switchyard 1 50,000 50 Fostiak Eng. (2010)
d Consultations 1 20,000 20 Allowancef Subtotal, Interconnection 138
12 Indirect Costs
a A/E 1 191,954 192 8% of Direct Costsb Construction Management 1 25,000 25 Allowancec Testing 1 20,000 20 geo-tech, concreted FERC submittals 1 35,000 35 Design Report, Status Reportse Owner's Admin & Overhead 1 100,000 100 Allowancef Other 0g Subtotal, Indirects 372
Totals
1 General 1302 Powerhouse/Intake 8503 Equipment 6848 PM&E Measures 1589 Licensing & Permitting 40010 Land & Land Rights 4011 Interconnection 138
Subtotal, Directs 2,399
12 Indirect Costs 372Subtotal 2,771
13 Contingency $2,771,375 20% 554
Grand Total 3,326
E Prov Proforma_3-7-2011.xlsx

Costs E (1-2 min flow) Ten Mile River HydroPhase I Feasibility Study
For Planning Purposes Only
No. Item Unit Qty RateAmount
($1,000's)Comments
1 General
a Mob/Demob 1 25,000 25 Allowanceb Site Prep 1 10,000 10 Allowancec Clear & Grub acre 4 6,200 25 Allowance, includes penstock alignmentd E&S Control ft. 2000 10 20 Allowance, includes penstock alignmente Dam Repairs 1 50,000 50 Phase I Dam Repair Cost (MBP Consulting)f Subtotal, General 130
2 Powerhouse/Intake
a Coffer dam, Pond 100 Allowanceb Cofferdam, Tailrace 10 Allowancec Powerhouse Civil 1 592,940 593 Includes: intake, powerhouse, tailrace and trashrake
k Penstock ft. 300 475 142 Assumes 4.6' diameter penstock. Includes: materials, shipping & installation
l Misc. metals 1 5,000 5 Allowancem HVAC 1 10,000 10 Allowancen Auxilliary Mechanical 1 10,000 10 Allowanceo Lighting, auxilliary electrical 1 5,000 5 Allowancep Other 0q Subtotal, Powerhouse/Intake 875
3 Equipment
a Turbine, generator, & governor 1 485,210 485 950mm runner, estimated costs developed from recent projectsb Shipping Handling & Installation 1 120,042 120 20% of equipment costsc Switchgear 1 20,000 20 Fostiak Eng. (2010)d Instrumentation & Controls 1 50,000 50 Allowance, includes license min flow verificatione Station Service, MCC 1 20,000 20 Allowancef Protection 1 25,000 25 Allowanceg Subtotal, Equipment 720
8 PM&E Measures
a Water Quality 1 40,000 40 Allowance for monitoringb D/S fish passage 0 20,000 0 Assumes installed by othersc Min flow verification 0 5,000 0 Included in Instrumentation & Controlsd Wetlands acre 1.5 60,000 90 Allowance for impacts from tailrace alignmente Recreation 1 20,000 20 Allowancef Cultural 1 7,500 8 Allowanceg Subtotal, PM&E 158
9 Licensing & Permitting
a Consultations year 3 50,000 150 Allowanceb Studies year 2.5 75,000 188 Alowance; assumes instream flow studiesc Draft FERC Application 1 50,000 50 Allowanced Final FERC Application 1 25,000 25 Allowancee Legal review 1 25,000 25 Allowancef Non-FERC Permits 1 50,000 50 Allowance: WQC, Wetlands, S. 106, S. 404, CZM, etc.g Subtotal, Lic. & Permitting 488
E Prov Proforma_3-7-2011.xlsx

Costs E (1-2 min flow) Ten Mile River HydroPhase I Feasibility Study
For Planning Purposes Only
No. Item Unit Qty RateAmount
($1,000's)Comments
10 Land & Land Rights
a Flowage rights 1 5,000 5 Allowanceb Project works, land in fee 1 20,000 20 Allowance for penstock alignmentc Interconnection R.O.W. 1 5,000 5 Allowanced Legal 1 10,000 10 Allowancee Other 0f Subtotal, Land 40
11 Interconnection
a Clear & Grub acre 1 6,200 6 Allowanceb New Line 1 52,000 52 Fostiak Eng. (2010)c Metering 1 10,000 10 Allowance
c Switchyard 1 50,000 50 Fostiak Eng. (2010)
d Consultations 1 20,000 20 Allowancef Subtotal, Interconnection 138
12 Indirect Costs
a A/E 1 203,890 204 8% of Direct Costsb Construction Management 1 25,000 25 Allowancec Testing 1 20,000 20 geo-tech, concreted FERC submittals 1 35,000 35 Design Report, Status Reportse Owner's Admin & Overhead 1 100,000 100 Allowancef Other 0g Subtotal, Indirects 384
Totals
1 General 1302 Powerhouse/Intake 8753 Equipment 7208 PM&E Measures 1589 Licensing & Permitting 48810 Land & Land Rights 4011 Interconnection 138
Subtotal, Directs 2,549
12 Indirect Costs 384Subtotal 2,933
13 Contingency $2,932,510 20% 587
Grand Total 3,519
E Prov Proforma_3-7-2011.xlsx

Costs E (no min flow) Ten Mile River HydroPhase I Feasibility Study
For Planning Purposes Only
No. Item Unit Qty RateAmount
($1,000's)Comments
1 General
a Mob/Demob 1 25,000 25 Allowanceb Site Prep 1 10,000 10 Allowancec Clear & Grub acre 4 6,200 25 Allowance, includes penstock alignmentd E&S Control ft. 2000 10 20 Allowance, includes penstock alignmente Dam Repairs 1 50,000 50 Phase I Dam Repair Cost (MBP Consulting)f Subtotal, General 130
2 Powerhouse/Intake
a Coffer dam, Pond 100 Allowanceb Cofferdam, Tailrace 10 Allowancec Powerhouse Civil 1 677,586 678 Includes: intake, powerhouse, tailrace and trashrake
k Penstock ft. 300 614 184 5.8' diameter penstock. Includes: material, transporation and installation
l Misc. metals 1 5,000 5 Allowancem HVAC 1 10,000 10 Allowancen Auxilliary Mechanical 1 10,000 10 Allowanceo Lighting, auxilliary electrical 1 5,000 5 Allowancep Other ea 0q Subtotal, Powerhouse/Intake 1,002
3 Equipment
a Turbine, generator, & governor 1 701,858 702 Runner 1.25m, estimated costs developed from recent projectsb Shipping Handling & Installation 1 163,372 163 20% of equipment costsc Switchgear 1 20,000 20 Fostiak Eng. (2010)d Instrumentation & Controls 1 50,000 50 Allowance, includes license min flow verificatione Station Service, MCC 1 20,000 20 Allowancef Protection 1 25,000 25 Allowanceg Subtotal, Equipment 980
8 PM&E Measures
a Water Quality 1 40,000 40 Allowance for monitoringb D/S fish passage 0 20,000 0 Assumes installed by othersc Min flow verification 0 5,000 0 Included in Instrumentation & Controlsd Wetlands acre 1.5 60,000 90 Allowance for impacts from tailrace alignmente Recreation 1 20,000 20 Allowancef Cultural 1 7,500 8 Allowanceg Subtotal, PM&E 158
9 Licensing & Permitting
a Consultations year 3 50,000 150 Allowanceb Studies year 2.5 75,000 188 Alowance; assumes instream flow studiesc Draft FERC Application 1 50,000 50 Allowanced Final FERC Application 1 25,000 25 Allowancee Legal review 1 25,000 25 Allowancef Non-FERC Permits 1 50,000 50 Allowance: WQC, Wetlands, S. 106, S. 404, CZM, etc.g Subtotal, Lic. & Permitting 488
E Prov Proforma_3-7-2011.xlsx

Costs E (no min flow) Ten Mile River HydroPhase I Feasibility Study
For Planning Purposes Only
No. Item Unit Qty RateAmount
($1,000's)Comments
10 Land & Land Rights
a Flowage rights 1 5,000 5 Allowanceb Project works, land in fee 1 20,000 20 Allowance for penstock alignmentc Interconnection R.O.W. 1 5,000 5 Allowanced Legal 1 10,000 10 Allowancee Other 0f Subtotal, Land 40
11 Interconnection
a Clear & Grub acre 1 6,200 6 Allowanceb New Line 1 52,000 52 Fostiak Eng. (2010)c Metering 1 10,000 10 Allowance
c Switchyard 1 50,000 50 Fostiak Eng. (2010)
d Consultations 1 20,000 20 Allowancef Subtotal, Interconnection 138
12 Indirect Costs
a A/E 1 234,802 235 8% of Direct Costsb Construction Management 1 25,000 25 Allowancec Testing 1 20,000 20 geo-tech, concreted FERC submittals 1 35,000 35 Design Report, Status Reportse Owner's Admin & Overhead 1 100,000 100 Allowancef Other 0g Subtotal, Indirects 415
Totals
1 General 1302 Powerhouse/Intake 1,0023 Equipment 9808 PM&E Measures 1589 Licensing & Permitting 48810 Land & Land Rights 4011 Interconnection 138
Subtotal, Directs 2,935
12 Indirect Costs 415Subtotal 3,350
13 Contingency $3,349,825 20% 670
Grand Total 4,020
E Prov Proforma_3-7-2011.xlsx

Costs E - Francis Repowered Ten Mile River HydroPhase I Feasibility Study
For Planning Purposes Only
No. Item Unit Qty RateAmount
($1,000's)Comments
1 General
a Mob/Demob 1 25,000 25 Allowanceb Site Prep 1 10,000 10 Allowancec Clear & Grub acre 4 6,200 25 Allowance, includes penstock alignmentd E&S Control ft. 2000 10 20 Allowance, includes penstock alignmente Dam Repairs 1 220,000 220 Phase I Dam Repair Cost (MBP Consulting)f Subtotal, General 300
2 Powerhouse/Intake
a Coffer dam, Pond 100 Allowanceb Tailrace (cofferdam and excavation) 25 Allowancec Powerhouse Civil 1 100,000 100 Allowance for intake, trashracks and powerhouse repairs
k Penstock ft. 300 445 133 Assumes 4.3' diameter penstock. Includes: materials, shipping & installation
l Misc. metals 1 5,000 5 Allowancem HVAC 1 10,000 10 Allowancen Auxilliary Mechanical 1 10,000 10 Allowanceo Lighting, auxilliary electrical 1 5,000 5 Allowancep Trash Rake ea 1 150,000 150 Allowanceq Subtotal, Powerhouse 538
3 Equipment
a Turbine, generator, & governor 1 400,000 400 Allowanceb Shipping Handling & Installation 1 103,000 103 20% of equipment costsc Switchgear 1 20,000 20 Fostiak Eng. (2010)d Instrumentation & Controls 1 50,000 50 Allowancee Station Service, MCC 1 20,000 20 Allowancef Protection 1 25,000 25 Allowanceg Subtotal, Equipment 618
8 PM&E Measures
a Water Quality 1 40,000 40 Allowance for monitoringb D/S fish passage 0 20,000 0 Assumes installed by othersc Min flow verification 1 5,000 5 Allowanced Wetlands acre 1.5 60,000 90 Allowance for impacts from tailrace alignmente Recreation 1 25,000 25 Allowancef Cultural 1 7,500 8 Allowanceg Subtotal, PM&E 168
9 Licensing & Permitting
a Consultations year 2 50,000 100 Allowanceb Studies year 2 75,000 150 Alowance; assumes acceptance of standard instream flow settingsc Draft FERC Application 1 50,000 50 Allowanced Final FERC Application 1 25,000 25 Allowancee Legal review 1 25,000 25 Allowancef Non-FERC Permits 1 50,000 50 Allowance: WQC, Wetlands, S. 106, S. 404, CZM, etc.g Subtotal, Lic. & Permitting 400
E Prov Proforma_3-7-2011.xlsx

Costs E - Francis Repowered Ten Mile River HydroPhase I Feasibility Study
For Planning Purposes Only
No. Item Unit Qty RateAmount
($1,000's)Comments
10 Land & Land Rights
a Flowage rights 1 5,000 5 Allowanceb Project works, land in fee 1 20,000 20 Allowance for penstock alignmentc Interconnection R.O.W. 1 5,000 5 Allowanced Legal 1 10,000 10 Allowancee Other 0f Subtotal, Land 40
11 Interconnection
a Clear & Grub acre 1 6,200 6 Allowanceb New Line 1 52,000 52 Fostiak Eng. (2010)c Metering 1 10,000 10 Allowance
c Switchyard 1 50,000 50 Includes: sectionalizers, transformers, disconnect switch.From Interconnection Costs (Fostiak Eng. 2010)
d Consultations 1 20,000 20 Allowancef Subtotal, Interconnection 138
12 Indirect Costs
a A/E 1 176,151 176 8% of Direct Costsb Construction Management 1 25,000 25 Allowancec Testing 1 20,000 20 geo-tech, concreted FERC submittals 1 35,000 35 Design Report, Status Reportse Owner's Admin & Overhead 1 100,000 100 Allowancef Other 0g Subtotal, Indirects 356
Totals
1 General 3002 Powerhouse/Intake 5383 Equipment 6188 PM&E Measures 1689 Licensing & Permitting 40010 Land & Land Rights 4011 Interconnection 138
Subtotal, Directs 2,202
12 Indirect Costs 356Subtotal 2,558
13 Contingency $2,558,036 20% 512
Grand Total 3,070
E Prov Proforma_3-7-2011.xlsx

CostsE-FrancisRepow-no min flow Ten Mile River HydroPhase I Feasibility Study
For Planning Purposes Only
No. Item Unit Qty RateAmount
($1,000's)Comments
1 General
a Mob/Demob 1 25,000 25 Allowanceb Site Prep 1 10,000 10 Allowancec Clear & Grub acre 4 6,200 25 Allowance, includes penstock alignmentd E&S Control ft. 2000 10 20 Allowance, includes penstock alignmente Dam Repairs 1 220,000 220 Phase I Dam Repair Cost (MBP Consulting)f Subtotal, General 300
2 Powerhouse/Intake
a Coffer dam, Pond 100 Allowanceb Tailrace (cofferdam and excavation) 25 Allowancec Powerhouse Civil 1 100,000 100 Allowance for intake, trashracks and powerhouse repairs
k Penstock ft. 300 551 165 Assumes 5.21' diameter penstock. Includes: materials, shipping & installation
l Misc. metals 1 5,000 5 Allowancem HVAC 1 10,000 10 Allowancen Auxilliary Mechanical 1 10,000 10 Allowanceo Lighting, auxilliary electrical 1 5,000 5 Allowancep Trash Rake ea 1 150,000 150 Allowanceq Subtotal, Powerhouse 570
3 Equipment
a Turbine, generator, & governor 1 475,000 475 Allowance for repowering 1.12m diameter Francis runnerb Shipping Handling & Installation 1 118,000 118 20% of equipment costsc Switchgear 1 20,000 20 Fostiak Eng. (2010)d Instrumentation & Controls 1 50,000 50 Allowancee Station Service, MCC 1 20,000 20 Allowancef Protection 1 25,000 25 Allowanceg Subtotal, Equipment 708
8 PM&E Measures
a Water Quality 1 40,000 40 Allowance for monitoringb D/S fish passage 0 20,000 0 Assumes installed by othersc Min flow verification 1 5,000 5 Allowanced Wetlands acre 1.5 60,000 90 Allowance for impacts from tailrace alignmente Recreation 1 25,000 25 Allowancef Cultural 1 7,500 8 Allowanceg Subtotal, PM&E 168
9 Licensing & Permitting
a Consultations year 2 50,000 100 Allowanceb Studies year 2 75,000 150 Alowance; assumes acceptance of standard instream flow settingsc Draft FERC Application 1 50,000 50 Allowanced Final FERC Application 1 25,000 25 Allowancee Legal review 1 25,000 25 Allowancef Non-FERC Permits 1 50,000 50 Allowance: WQC, Wetlands, S. 106, S. 404, CZM, etc.g Subtotal, Lic. & Permitting 400
E Prov Proforma_3-7-2011.xlsx

CostsE-FrancisRepow-no min flow Ten Mile River HydroPhase I Feasibility Study
For Planning Purposes Only
No. Item Unit Qty RateAmount
($1,000's)Comments
10 Land & Land Rights
a Flowage rights 1 5,000 5 Allowanceb Project works, land in fee 1 20,000 20 Allowance for penstock alignmentc Interconnection R.O.W. 1 5,000 5 Allowanced Legal 1 10,000 10 Allowancee Other 0f Subtotal, Land 40
11 Interconnection
a Clear & Grub acre 1 6,200 6 Allowanceb New Line 1 52,000 52 Fostiak Eng. (2010)c Metering 1 10,000 10 Allowance
c Switchyard 1 50,000 50 Includes: sectionalizers, transformers, disconnect switch.From Interconnection Costs (Fostiak Eng. 2010)
d Consultations 1 20,000 20 Allowancef Subtotal, Interconnection 138
12 Indirect Costs
a A/E 1 185,904 186 8% of Direct Costsb Construction Management 1 25,000 25 Allowancec Testing 1 20,000 20 geo-tech, concreted FERC submittals 1 35,000 35 Design Report, Status Reportse Owner's Admin & Overhead 1 100,000 100 Allowancef Other 0g Subtotal, Indirects 366
Totals
1 General 3002 Powerhouse/Intake 5703 Equipment 7088 PM&E Measures 1689 Licensing & Permitting 40010 Land & Land Rights 4011 Interconnection 138
Subtotal, Directs 2,324
12 Indirect Costs 366Subtotal 2,690
13 Contingency $2,689,704 20% 538
Grand Total 3,228
E Prov Proforma_3-7-2011.xlsx

Costs E - Francis Restored Ten Mile River HydroPhase I Feasibility Study
For Planning Purposes Only
No. Item Unit Qty RateAmount
($1,000's)Comments
1 General
a Mob/Demob 1 25,000 25 Allowanceb Site Prep 1 10,000 10 Allowancec Clear & Grub acre 4 6,200 25 Allowance, includes penstock alignmentd E&S Control ft. 2000 10 20 Allowance, includes penstock alignmente Dam Repairs 1 220,000 220 Phase I Dam Repair Cost (MBP Consulting)f Subtotal, General 300
2 Powerhouse/Intake
a Coffer dam, Pond 100 Allowanceb Cofferdam, Tailrace 10 Allowancec Powerhouse Civil 1 100,000 100 Allowance for intake, trashracks and powerhouse repairs
k Penstock ft. 300 369 111 Assumes 3.7' diameter penstock. Includes: materials, shipping & installation
l Misc. metals 1 5,000 5 Allowancem HVAC 1 10,000 10 Allowancen Auxilliary Mechanical 1 10,000 10 Allowanceo Lighting, auxilliary electrical 1 5,000 5 Allowancep TrashRake ea 1 150,000 150 Allowanceq Subtotal, Powerhouse 501
3 Equipment
a Turbine, generator, & governor 1 350,000 350 Estimated costs for restoration of 0.81 m diameter Francis runnerb Shipping Handling & Installation 1 93,000 93 20% of equipment costsc Switchgear 1 20,000 20 Fostiak Eng. (2010)d Instrumentation & Controls 1 50,000 50 Allowancee Station Service, MCC 1 20,000 20 Allowancef Protection 1 25,000 25 Allowanceg Subtotal, Equipment 558
8 PM&E Measures
a Water Quality 1 40,000 40 Allowance for monitoringb D/S fish passage 0 20,000 0 Assumes installed by othersc Min flow verification 1 5,000 5 Allowanced Wetlands acre 1.5 60,000 90 Allowance for impacts from tailrace restoratione Recreation 1 20,000 20 Allowancef Cultural 1 7,500 8 Allowanceg Subtotal, PM&E 163
E Prov Proforma_3-7-2011.xlsx

Costs E - Francis Restored Ten Mile River HydroPhase I Feasibility Study
For Planning Purposes Only
No. Item Unit Qty RateAmount
($1,000's)Comments
9 Licensing & Permitting
a Consultations year 2 50,000 100 Allowanceb Studies year 2 75,000 150 Alowance; assumes acceptance of standard instream flow settingsc Draft FERC Application 1 50,000 50 Allowanced Final FERC Application 1 25,000 25 Allowancee Legal review 1 25,000 25 Allowancef Non-FERC Permits 1 50,000 50 Allowance: WQC, Wetlands, S. 106, S. 404, CZM, etc.g Subtotal, Lic. & Permitting 400
10 Land & Land Rights
a Flowage rights 1 5,000 5 Allowanceb Project works, land in fee 1 20,000 20 Allowance for penstock alignmentc Interconnection R.O.W. 1 5,000 5 Allowanced Legal 1 10,000 10 Allowancee Other 0f Subtotal, Land 40
11 Interconnection
a Clear & Grub acre 1 6,200 6 Allowanceb New Line 1 52,000 52 Fostiak Eng. (2010)c Metering 1 10,000 10 Allowance
c Switchyard 1 50,000 50 Fostiak Eng. (2010)
d Consultations 1 20,000 20 Allowancef Subtotal, Interconnection 138
12 Indirect Costs
a A/E 1 167,940 168 8% of Direct Costsb Construction Management 1 25,000 25 Allowancec Testing 1 20,000 20 geo-tech, concreted FERC submittals 1 35,000 35 Design Report, Status Reportse Owner's Admin & Overhead 1 100,000 100 Allowancef Other 0g Subtotal, Indirects 348
Totals
1 General 3002 Powerhouse/Intake 5013 Equipment 5588 PM&E Measures 1639 Licensing & Permitting 40010 Land & Land Rights 4011 Interconnection 138
Subtotal, Directs 2,099
12 Indirect Costs 348Subtotal 2,447
13 Contingency $2,447,186 20% 489
Grand Total 2,937
E Prov Proforma_3-7-2011.xlsx

Costs F Ten Mile River HydroPhase I Feasibility Study
For Planning Purposes Only
No. Item Unit Qty RateAmount
($1,000's)Comments
1 General
a Mob/Demob 1 25,000 25 Allowanceb Site Prep 1 10,000 10 Allowancec Clear & Grub acre 0.5 8,000 4 Allowanced E&S Control ft. 100 10 1 Allowancee Dam Repairs 1 20,000 20 From Phase I Dam Repair Costs (MBP Consulting 2010)f Subtotal, General 60
2 Powerhouse/Intake
a Coffer dam, Pond 100 Allowanceb Cofferdam, Tailrace 10 Allowancec Powerhouse Civil 1 677,586 678 Includes: intake, powerhouse, tailrace and trashrakek Sluice gate 1 20,000 20l Misc. metals 1 5,000 5 Allowance
m HVAC 1 10,000 10 Allowancen Auxilliary Mechanical 1 10,000 10 Allowanceo Lighting, auxilliary electrical 1 5,000 5 Allowancep Other 0q Subtotal, Powerhouse/Intake 838
3 Equipment
a Turbine, generator, & governor 1 701,858 702 Runner 1.25m, estimated costs developed from recent projectsb Shipping Handling & Installation 1 163,372 163 20% of equipment costsc Switchgear 1 20,000 20 From Interconnection Costs (Fostiak Eng. 2010)d Instrumentation & Controls 1 50,000 50 Allowance, includes license min flow verificatione Station Service, MCC 1 20,000 20 Allowancef Protection 1 25,000 25 Allowanceg Subtotal, Equipment 980
8 PM&E Measures
a Water Quality 1 20,000 20 Allowanceb D/S fish passage 0 20,000 0 Assumes installed by othersc Min flow verification 0 5,000 0 Included in Instrumentation & Controlsd Wetlands acre 0.5 60,000 30 Allowancee Recreation 1 20,000 20 Allowancef Cultural 1 7,500 8 Allowanceg Subtotal, PM&E 78
9 Licensing & Permitting
a Consultations year 2 50,000 100 Allowanceb Studies year 0.5 75,000 38 Allowancec Draft FERC Application 1 50,000 50 Allowanced Final FERC Application 1 25,000 25 Allowancee Legal review 1 25,000 25 Allowancef Non-FERC Permits 1 50,000 50 Allowance for: WQC, Wetlands, S. 106, S. 404, CZM, etc.g Subtotal, Lic. & Permitting 288
E Prov Proforma_3-7-2011.xlsx

Costs F Ten Mile River HydroPhase I Feasibility Study
For Planning Purposes Only
No. Item Unit Qty RateAmount
($1,000's)Comments
10 Land & Land Rights
a Flowage rights 1 5,000 5 Allowanceb Project works, land in fee 1 0c Interconnection R.O.W. 1 5,000 5 Allowanced Legal 1 10,000 10 Allowancee Other 0f Subtotal, Land 20
11 Interconnection
a Clear & Grub acre 0.5 8,000 4 Allowanceb New Line 1 15,000 15 From Interconnection Costs (Fostiak Eng. 2010)c Metering 1 10,000 10 Allowancec Switchyard 1 50,000 50 Includes: sectionalizers, transformers, disconnect switch.
From Interconnection Costs (Fostiak Eng. 2010)d Consultations 1 20,000 20 Allowancef Subtotal, Interconnection 99
12 Indirect Costs
a A/E 1 188,945 189 8% of Direct Costsb Construction Management 1 25,000 25 Allowancec Testing 1 20,000 20 geo-tech, concreted FERC submittals 1 35,000 35 Design Report, Status Reportse Owner's Admin & Overhead 1 100,000 100 Allowancef Other 0g Subtotal, Indirects 369
Totals
1 General 602 Powerhouse/Intake 8383 Equipment 9808 PM&E Measures 789 Licensing & Permitting 28810 Land & Land Rights 2011 Interconnection 99
Subtotal, Directs 2,362
12 Indirect Costs 369Subtotal 2,731
13 Contingency $2,730,761 20% 546
Grand Total 3,277
E Prov Proforma_3-7-2011.xlsx

Pre‐tax, Cash on Cash Economic Summary

Privileged Confidential Ten Mile River Hydro Feasibility StudyPhase 1
Proforma Summary - Cash
ID Project / Description
A Turner ReservoirB Turner - Hunt's MillC Turner - Hunt's Mill 2 C-2 w/ repowered unitD Hunt's MillE Hunt's Mill 2 E-2 w/ repowered unit E-3 w/ restored unitF Omega Pond
Escalation Rate 2.5% Discount Rate 5%REC's ($//MWH) $25 Term (Yrs) 20
AltInstalled
Cost ($1,000's)
InstalledCapacity
(kW)
Installed Costs($/kw)
Energy (MWH)
RI Grants
Fed GrantEnergy
Rate$/MWH
IRR(%)
NPV($1,000s)
A 3,559 205 17,405 715 5% 15% $125 4% (215)B 4,600 156 29,558 456 5% 15% $125 -2% (2,568)C 4,954 288 17,222 831 5% 15% $125 3% (842)
C-2 4,445 282 15,749 743 5% 15% $125 3% (865)D 3,364 112 30,128 400 5% 15% $125 -1% (1,758)E 3,326 184 18,066 524 5% 15% $125 2% (1,047)
E-2 3,070 178 17,240 464 5% 15% $125 1% (1,145)E-3 2,937 110 26,688 335 5% 15% $125 #NUM! (1,729)F 3,277 104 31,536 374 5% 15% $125 -2% (1,823)
AltInstalled
Cost ($1,000's)
InstalledCapacity
(kW)
Installed Costs($/kw)
Energy (MWH)
RI Grants
Fed GrantEnergy
Rate$/MWH
IRRNPV
($1,000s)
B 4,859 176 27,567 626 5% 15% $125 1% (1,874)C 5,209 326 15,959 1,137 5% 15% $125 6% 561E 3,519 209 16,866 717 5% 15% $125 5% (170)
AltInstalled
Cost ($1,000's)
InstalledCapacity
(kW)
Installed Costs($/kw)
Energy (MWH)
RI Grants
Fed GrantEnergy
Rate$/MWH
IRRNPV
($1,000s)
B 5,667 288 19,698 1,050 5% 15% $125 5% (291)C 6,071 534 11,376 1,889 5% 15% $125 9% 3,919E 4,020 341 11,797 1,184 5% 15% $125 8% 1,927
E-2 3,228 271 11,926 815 5% 15% $125 6% 593
Notes:
1 RI (State) Grants: defined % of Direct Costs2 Fed Grant: Assumes extension of Investment Tax Credit (ITC) & assocaited muni. benefit of partnership with outside tax investor3 Energy Rate: assumes pricing for distributed renewable energy4 IRR: Internal Rate of Return5 NPV (Net Present Value): values given represent NPV at end of study period6 Estimates based on 20 year study period.7 REC (Renewable Energy Certificate): additional commodity value for energy derived from qualified renewable sources
All Alts
Results With Instream Flows
Results with 1/2 Instream Flows
Results with No Instream Flows
Denotes cells for user input
For Planning Purposes Only E Prov Proforma_3-7-2011.xlsx

Debt Levered Economic Summary
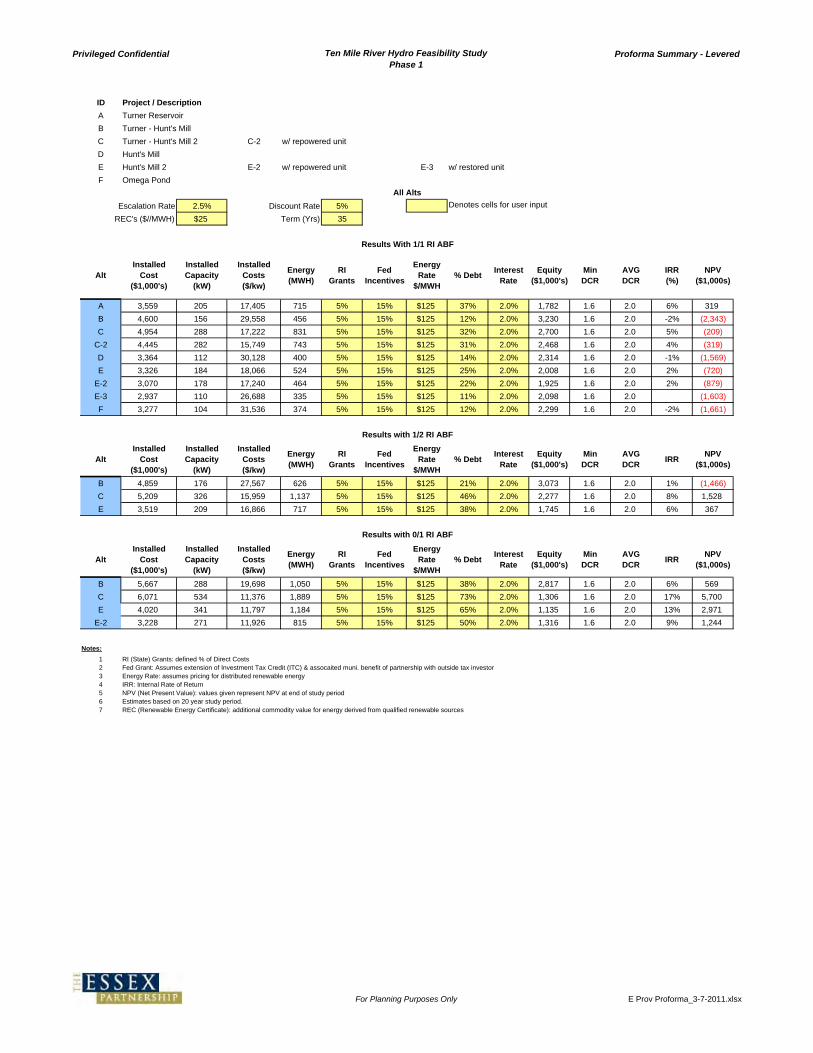
Privileged Confidential Ten Mile River Hydro Feasibility StudyPhase 1
Proforma Summary - Levered
ID Project / Description
A Turner ReservoirB Turner - Hunt's MillC Turner - Hunt's Mill 2 C-2 w/ repowered unitD Hunt's MillE Hunt's Mill 2 E-2 w/ repowered unit E-3 w/ restored unitF Omega Pond
Escalation Rate 2.5% Discount Rate 5% Denotes cells for user inputREC's ($//MWH) $25 Term (Yrs) 35
AltInstalled
Cost ($1,000's)
InstalledCapacity
(kW)
Installed Costs($/kw)
Energy (MWH)
RI Grants
Fed Incentives
EnergyRate
$/MWH% Debt
InterestRate
Equity($1,000's)
MinDCR
AVGDCR
IRR(%)
NPV($1,000s)
A 3,559 205 17,405 715 5% 15% $125 37% 2.0% 1,782 1.6 2.0 6% 319B 4,600 156 29,558 456 5% 15% $125 12% 2.0% 3,230 1.6 2.0 -2% (2,343)C 4,954 288 17,222 831 5% 15% $125 32% 2.0% 2,700 1.6 2.0 5% (209)
C-2 4,445 282 15,749 743 5% 15% $125 31% 2.0% 2,468 1.6 2.0 4% (319)D 3,364 112 30,128 400 5% 15% $125 14% 2.0% 2,314 1.6 2.0 -1% (1,569)E 3,326 184 18,066 524 5% 15% $125 25% 2.0% 2,008 1.6 2.0 2% (720)
E-2 3,070 178 17,240 464 5% 15% $125 22% 2.0% 1,925 1.6 2.0 2% (879)E-3 2,937 110 26,688 335 5% 15% $125 11% 2.0% 2,098 1.6 2.0 #NUM! (1,603)F 3,277 104 31,536 374 5% 15% $125 12% 2.0% 2,299 1.6 2.0 -2% (1,661)
AltInstalled
Cost ($1,000's)
InstalledCapacity
(kW)
Installed Costs($/kw)
Energy (MWH)
RI Grants
Fed Incentives
EnergyRate
$/MWH% Debt
InterestRate
Equity($1,000's)
MinDCR
AVGDCR
IRRNPV
($1,000s)
B 4,859 176 27,567 626 5% 15% $125 21% 2.0% 3,073 1.6 2.0 1% (1,466)C 5,209 326 15,959 1,137 5% 15% $125 46% 2.0% 2,277 1.6 2.0 8% 1,528E 3,519 209 16,866 717 5% 15% $125 38% 2.0% 1,745 1.6 2.0 6% 367
AltInstalled
Cost ($1,000's)
InstalledCapacity
(kW)
Installed Costs($/kw)
Energy (MWH)
RI Grants
Fed Incentives
EnergyRate
$/MWH% Debt
InterestRate
Equity($1,000's)
MinDCR
AVGDCR
IRRNPV
($1,000s)
B 5,667 288 19,698 1,050 5% 15% $125 38% 2.0% 2,817 1.6 2.0 6% 569C 6,071 534 11,376 1,889 5% 15% $125 73% 2.0% 1,306 1.6 2.0 17% 5,700E 4,020 341 11,797 1,184 5% 15% $125 65% 2.0% 1,135 1.6 2.0 13% 2,971
E-2 3,228 271 11,926 815 5% 15% $125 50% 2.0% 1,316 1.6 2.0 9% 1,244
Notes:
1 RI (State) Grants: defined % of Direct Costs2 Fed Grant: Assumes extension of Investment Tax Credit (ITC) & assocaited muni. benefit of partnership with outside tax investor3 Energy Rate: assumes pricing for distributed renewable energy4 IRR: Internal Rate of Return5 NPV (Net Present Value): values given represent NPV at end of study period6 Estimates based on 20 year study period.7 REC (Renewable Energy Certificate): additional commodity value for energy derived from qualified renewable sources
All Alts
Results With 1/1 RI ABF
Results with 1/2 RI ABF
Results with 0/1 RI ABF
For Planning Purposes Only E Prov Proforma_3-7-2011.xlsx

Proformas

Privileged and Confidential Ten Mile River Feasibility StudyPhase 1
Proforma A
No.Item/
Study Year0 1 2 3 4 5 6 7 8 9 10 11 12 13 14 15 16 17 18 19 20
1 Costs ($1,000's)a Initial Investment 3,559b O&M 11 11 12 12 12 12 13 13 13 14 14 14 15 15 16 16 16 17 17 18c Major Maintenance 23 23 24 24 25 25 26 27 27 28 29 30 30 31 32 33 33 34 35 36 37d Insurance 9 9 10 10 10 10 11 11 11 11 12 12 12 13 13 13 14 14 14 15e Payment in lieu of Property Taxes 0 0 0 0 0 0 0 0 0 0 0 0 0 0 0 0 0 0 0 0fg Subtotal, Costs 3,559 43 44 45 47 48 49 50 51 53 54 55 57 58 60 61 63 64 66 67 69
2 Revenues ($1,000's)a State Grants 178b Federal Grants 534c Energy 92 94 96 99 101 104 106 109 112 114 117 120 123 126 130 133 136 139 143 147d Recs 18 19 19 20 20 21 21 22 22 23 23 24 25 25 26 27 27 28 29 29e Avoided Distributionf Capacity/Demand 0 0 0 0 0 0 0 0 0 0 0 0 0 0 0 0 0 0 0 0g Residual Value 4,273h Subtotal, Revenues 712 110 113 116 118 121 124 128 131 134 137 141 144 148 152 155 159 163 167 172 4,449
3 Cashflows ($1,000's)a Nominal Dollars (2,848) 67 68 70 72 74 76 77 79 81 83 86 88 90 92 94 97 99 102 104 4,379b NPV (2,848) 64 62 61 59 58 56 55 54 52 51 50 49 48 47 45 44 43 42 41 1,651c Cum NPV (2,848) (2,784) (2,722) (2,661) (2,602) (2,544) (2,488) (2,433) (2,379) (2,326) (2,275) (2,225) (2,176) (2,129) (2,082) (2,037) (1,992) (1,949) (1,907) (1,866) (215)
4 Levered Cashflow ($1,000's)a Investment Cost 2,848b Equity 1,782c Net Operating Income 67 68 70 72 74 76 77 79 81 83 86 88 90 92 94 97 99 102 104 4,379d Debt Service (43) (43) (43) (43) (43) (43) (43) (43) (43) (43) (43) (43) (43) (43) (43) (43) (43) (43) (43) (43)e Debt Coverage Ratio 1.6 1.6 1.6 1.7 1.7 1.8 1.8 1.9 1.9 2.0 2.0 2.1 2.1 2.2 2.2 2.3 2.3 2.4 2.4 2.4f Cash after debt service 24 26 28 29 31 33 35 37 39 41 43 45 47 50 52 54 57 59 62 4,337g Interest Payment (21) (21) (20) (20) (20) (19) (19) (18) (18) (17) (17) (16) (16) (15) (14) (14) (13) (13) (12) (12)h Taxable Income 3 5 7 9 12 14 16 19 21 24 26 29 32 34 37 40 43 46 49 4,325i Income taxj After Tax Cash (1,782) 24 26 28 29 31 33 35 37 39 41 43 45 47 50 52 54 57 59 62 4,337k NPV (1,782) 23 23 24 24 24 25 25 25 25 25 25 25 25 25 25 25 25 25 24 1,635l Cum NPV (1,782) (1,759) (1,736) (1,712) (1,688) (1,664) (1,639) (1,614) (1,589) (1,564) (1,539) (1,514) (1,489) (1,464) (1,439) (1,414) (1,389) (1,364) (1,340) (1,316) 319
Proforma Inputs Esc. Rate 2.5% Disc. Rate 5.0% MWH 715 Max KW 205 State Grants 178 Fed Grants 534
Energy Rate 125 $/MWH Avg. Power KW Rec Rate 25 $/MWH Demand 0 $/KW-mos O&M 0.015 c/kWh Prop Tax 0.0%Proforma Results
Pre-Tax, Cash on Cash PreTax, Cash on Cash IRR 4.5% Cum NPV (215) Discounted Pay Back 20Debt Levered, After-Tax Debt Levered, After Tax IRR 6.0% Cum NPV 319 Discounted Pay Back 19
Assumptions1 O&M: 1.5¢/KWH escalated at defined rate (see summary sheet)2 Major maintenance: $50k in years 5 & 15, $125k in years 10 & 20 Denotes cell input linked to Summary Tab3 Payment in Lieu of Property taxes: 1.5% of initial investment, escalated Denotes cell input linked to Individual Cost Tabs4 Insurance: 0.25% of initial investment, escalated Denotes summary results5 Residual Value: calculated growth rate of year 19 revenues (only if positive cashflows)6 Average Debt Coverage Ratio (DCR) set to 2.0 for all levered cases.
For Planning Purposes Only E Prov Proforma_3-7-2011.xlsx
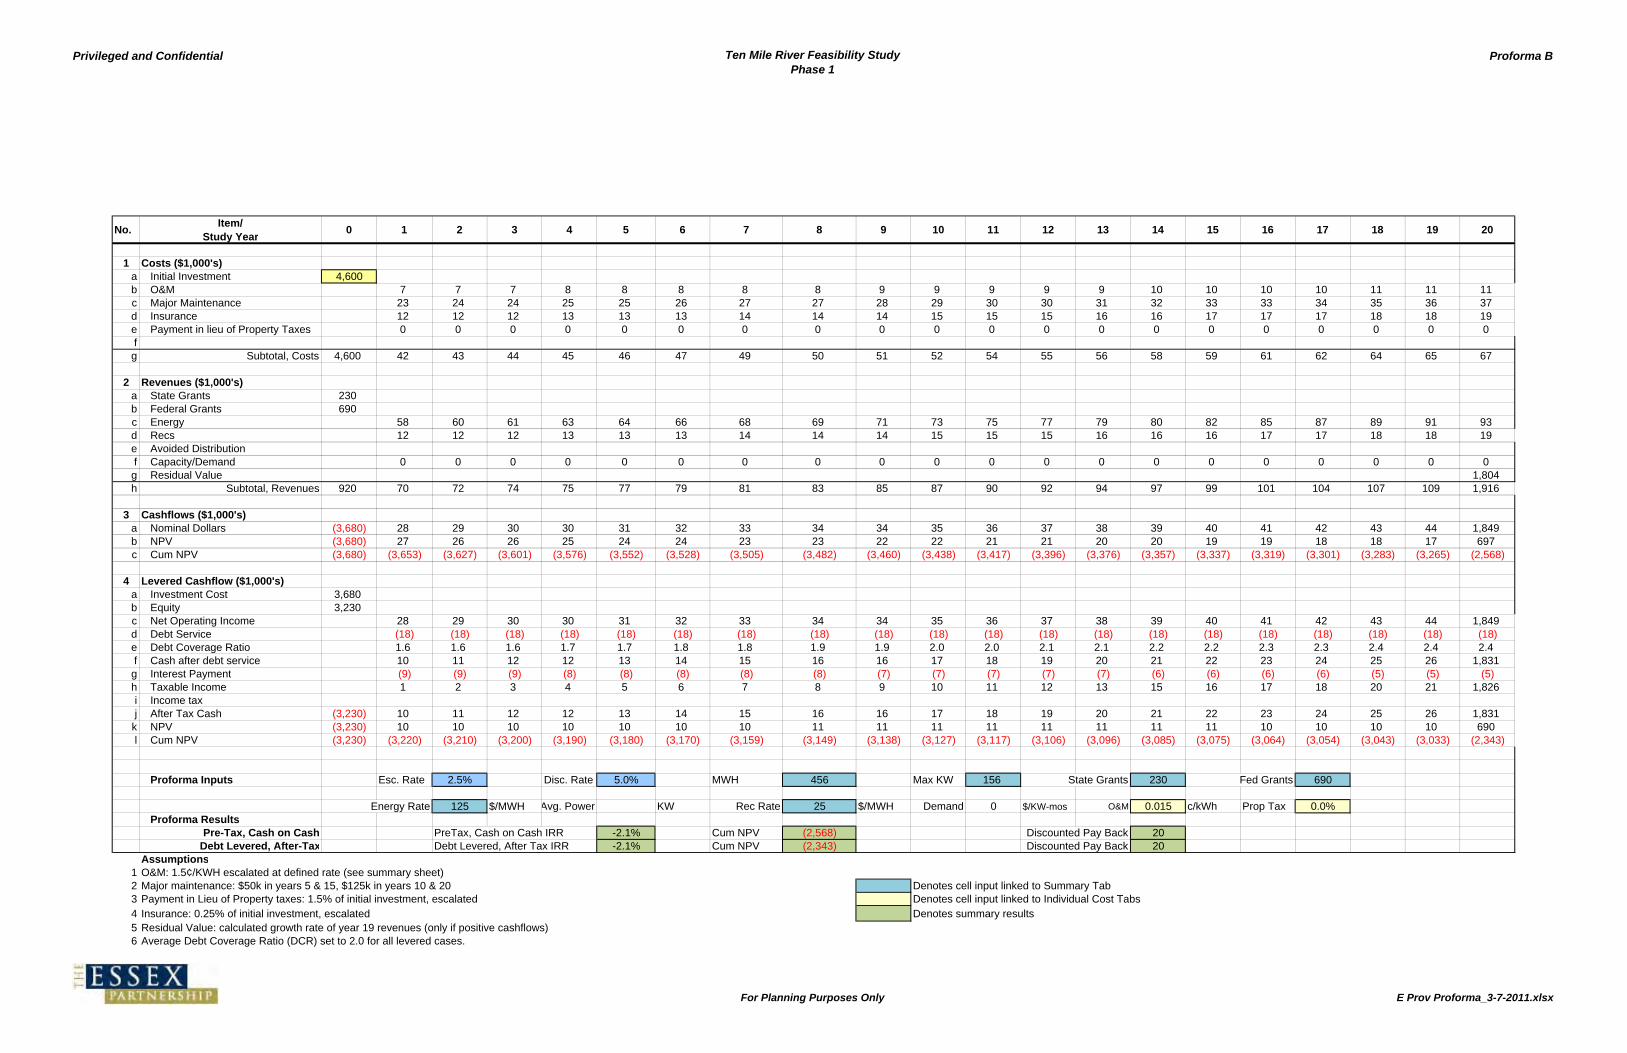
Privileged and Confidential Ten Mile River Feasibility StudyPhase 1
Proforma B
No.Item/
Study Year0 1 2 3 4 5 6 7 8 9 10 11 12 13 14 15 16 17 18 19 20
1 Costs ($1,000's)a Initial Investment 4,600b O&M 7 7 7 8 8 8 8 8 9 9 9 9 9 10 10 10 10 11 11 11c Major Maintenance 23 23 24 24 25 25 26 27 27 28 29 30 30 31 32 33 33 34 35 36 37d Insurance 12 12 12 13 13 13 14 14 14 15 15 15 16 16 17 17 17 18 18 19e Payment in lieu of Property Taxes 0 0 0 0 0 0 0 0 0 0 0 0 0 0 0 0 0 0 0 0fg Subtotal, Costs 4,600 42 43 44 45 46 47 49 50 51 52 54 55 56 58 59 61 62 64 65 67
2 Revenues ($1,000's)a State Grants 230b Federal Grants 690c Energy 58 60 61 63 64 66 68 69 71 73 75 77 79 80 82 85 87 89 91 93d Recs 12 12 12 13 13 13 14 14 14 15 15 15 16 16 16 17 17 18 18 19e Avoided Distributionf Capacity/Demand 0 0 0 0 0 0 0 0 0 0 0 0 0 0 0 0 0 0 0 0g Residual Value 1,804h Subtotal, Revenues 920 70 72 74 75 77 79 81 83 85 87 90 92 94 97 99 101 104 107 109 1,916
3 Cashflows ($1,000's)a Nominal Dollars (3,680) 28 29 30 30 31 32 33 34 34 35 36 37 38 39 40 41 42 43 44 1,849b NPV (3,680) 27 26 26 25 24 24 23 23 22 22 21 21 20 20 19 19 18 18 17 697c Cum NPV (3,680) (3,653) (3,627) (3,601) (3,576) (3,552) (3,528) (3,505) (3,482) (3,460) (3,438) (3,417) (3,396) (3,376) (3,357) (3,337) (3,319) (3,301) (3,283) (3,265) (2,568)
4 Levered Cashflow ($1,000's)a Investment Cost 3,680b Equity 3,230c Net Operating Income 28 29 30 30 31 32 33 34 34 35 36 37 38 39 40 41 42 43 44 1,849d Debt Service (18) (18) (18) (18) (18) (18) (18) (18) (18) (18) (18) (18) (18) (18) (18) (18) (18) (18) (18) (18)e Debt Coverage Ratio 1.6 1.6 1.6 1.7 1.7 1.8 1.8 1.9 1.9 2.0 2.0 2.1 2.1 2.2 2.2 2.3 2.3 2.4 2.4 2.4f Cash after debt service 10 11 12 12 13 14 15 16 16 17 18 19 20 21 22 23 24 25 26 1,831g Interest Payment (9) (9) (9) (8) (8) (8) (8) (8) (7) (7) (7) (7) (7) (6) (6) (6) (6) (5) (5) (5)h Taxable Income 1 2 3 4 5 6 7 8 9 10 11 12 13 15 16 17 18 20 21 1,826i Income taxj After Tax Cash (3,230) 10 11 12 12 13 14 15 16 16 17 18 19 20 21 22 23 24 25 26 1,831
k NPV (3,230) 10 10 10 10 10 10 10 11 11 11 11 11 11 11 11 10 10 10 10 690l Cum NPV (3,230) (3,220) (3,210) (3,200) (3,190) (3,180) (3,170) (3,159) (3,149) (3,138) (3,127) (3,117) (3,106) (3,096) (3,085) (3,075) (3,064) (3,054) (3,043) (3,033) (2,343)
Proforma Inputs Esc. Rate 2.5% Disc. Rate 5.0% MWH 456 Max KW 156 State Grants 230 Fed Grants 690
Energy Rate 125 $/MWH Avg. Power KW Rec Rate 25 $/MWH Demand 0 $/KW-mos O&M 0.015 c/kWh Prop Tax 0.0%Proforma Results
Pre-Tax, Cash on Cash PreTax, Cash on Cash IRR -2.1% Cum NPV (2,568) Discounted Pay Back 20Debt Levered, After-Tax Debt Levered, After Tax IRR -2.1% Cum NPV (2,343) Discounted Pay Back 20
Assumptions1 O&M: 1.5¢/KWH escalated at defined rate (see summary sheet)2 Major maintenance: $50k in years 5 & 15, $125k in years 10 & 20 Denotes cell input linked to Summary Tab3 Payment in Lieu of Property taxes: 1.5% of initial investment, escalated Denotes cell input linked to Individual Cost Tabs4 Insurance: 0.25% of initial investment, escalated Denotes summary results5 Residual Value: calculated growth rate of year 19 revenues (only if positive cashflows)6 Average Debt Coverage Ratio (DCR) set to 2.0 for all levered cases.
For Planning Purposes Only E Prov Proforma_3-7-2011.xlsx

Privileged and Confidential Ten Mile River Feasibility StudyPhase 1
Proforma B no
No.Item/
Study Year0 1 2 3 4 5 6 7 8 9 10 11 12 13 14 15 16 17 18 19 20
1 Costs ($1,000's)a Initial Investment 5,667b O&M 16 17 17 17 18 18 19 19 20 20 21 21 22 22 23 23 24 25 25 26c Major Maintenance 23 23 24 24 25 25 26 27 27 28 29 30 30 31 32 33 33 34 35 36 37d Insurance 15 15 15 16 16 16 17 17 18 18 19 19 20 20 21 21 22 22 23 23e Payment in lieu of Property Taxes 0 0 0 0 0 0 0 0 0 0 0 0 0 0 0 0 0 0 0 0fg Subtotal, Costs 5,667 54 55 56 58 59 61 62 64 65 67 69 70 72 74 76 78 80 82 84 86
2 Revenues ($1,000's)a State Grants 283b Federal Grants 850c Energy 135 138 141 145 148 152 156 160 164 168 172 176 181 185 190 195 200 205 210 215d Recs 27 28 28 29 30 30 31 32 33 34 34 35 36 37 38 39 40 41 42 43e Avoided Distributionf Capacity/Demand 0 0 0 0 0 0 0 0 0 0 0 0 0 0 0 0 0 0 0 0g Residual Value 6,886h Subtotal, Revenues 1,133 161 165 170 174 178 183 187 192 197 202 207 212 217 222 228 234 240 246 252 7,144
3 Cashflows ($1,000's)a Nominal Dollars (4,534) 108 110 113 116 119 122 125 128 131 134 138 141 145 148 152 156 160 164 168 7,058b NPV (4,534) 103 100 98 95 93 91 89 87 85 83 81 79 77 75 73 71 70 68 66 2,660c Cum NPV (4,534) (4,431) (4,331) (4,233) (4,138) (4,045) (3,954) (3,865) (3,778) (3,694) (3,611) (3,531) (3,452) (3,375) (3,300) (3,227) (3,156) (3,086) (3,018) (2,951) (291)
4 Levered Cashflow ($1,000's)a Investment Cost 4,534b Equity 2,817c Net Operating Income 108 110 113 116 119 122 125 128 131 134 138 141 145 148 152 156 160 164 168 7,058d Debt Service (69) (69) (69) (69) (69) (69) (69) (69) (69) (69) (69) (69) (69) (69) (69) (69) (69) (69) (69) (69)e Debt Coverage Ratio 1.6 1.6 1.6 1.7 1.7 1.8 1.8 1.9 1.9 2.0 2.0 2.1 2.1 2.2 2.2 2.3 2.3 2.4 2.4 2.4f Cash after debt service 39 42 44 47 50 53 56 59 63 66 69 73 76 80 83 87 91 95 99 6,989g Interest Payment (34) (34) (33) (32) (31) (31) (30) (29) (28) (28) (27) (26) (25) (24) (23) (22) (22) (21) (20) (19)h Taxable Income 5 8 12 15 19 22 26 30 34 38 42 47 51 56 60 65 70 75 80 6,971i Income taxj After Tax Cash (2,817) 39 42 44 47 50 53 56 59 63 66 69 73 76 80 83 87 91 95 99 6,989
k NPV (2,817) 37 38 38 39 39 40 40 40 40 40 40 40 40 40 40 40 40 40 39 2,634l Cum NPV (2,817) (2,780) (2,742) (2,704) (2,665) (2,626) (2,586) (2,546) (2,506) (2,465) (2,425) (2,385) (2,344) (2,304) (2,263) (2,223) (2,183) (2,144) (2,104) (2,065) 569
Proforma Inputs Esc. Rate 2.5% Disc. Rate 5.0% MWH 1,050 Max KW 288 State Grants 283 Fed Grants 850
Energy Rate 125 $/MWH Avg. Power KW Rec Rate 25 $/MWH Demand 0 $/KW-mos O&M 0.015 c/kWh Prop Tax 0.0%Proforma Results
Pre-Tax, Cash on Cash PreTax, Cash on Cash IRR 4.6% Cum NPV (291) Discounted Pay Back 20Debt Levered, After-Tax Debt Levered, After Tax IRR 6.1% Cum NPV 569 Discounted Pay Back 19
Assumptions1 O&M: 1.5¢/KWH escalated at defined rate (see summary sheet)2 Major maintenance: $50k in years 5 & 15, $125k in years 10 & 20 Denotes cell input linked to Summary Tab3 Payment in Lieu of Property taxes: 1.5% of initial investment, escalated Denotes cell input linked to Individual Cost Tabs4 Insurance: 0.25% of initial investment, escalated Denotes summary results5 Residual Value: calculated growth rate of year 19 revenues (only if positive cashflows)6 Average Debt Coverage Ratio (DCR) set to 2.0 for all levered cases.
For Planning Purposes Only E Prov Proforma_3-7-2011.xlsx

Privileged and Confidential Ten Mile River Feasibility StudyPhase 1
Proforma B (1-2 min flow)
No.Item/
Study Year0 1 2 3 4 5 6 7 8 9 10 11 12 13 14 15 16 17 18 19 20
1 Costs ($1,000's)a Initial Investment 4,859b O&M 10 10 10 10 11 11 11 11 12 12 12 13 13 13 14 14 14 15 15 15c Major Maintenance 23 23 24 24 25 25 26 27 27 28 29 30 30 31 32 33 33 34 35 36 37d Insurance 12 13 13 13 14 14 14 15 15 16 16 16 17 17 18 18 18 19 19 20e Payment in lieu of Property Taxes 0 0 0 0 0 0 0 0 0 0 0 0 0 0 0 0 0 0 0 0fg Subtotal, Costs 4,859 45 46 47 49 50 51 52 54 55 56 58 59 61 62 64 65 67 69 70 72
2 Revenues ($1,000's)a State Grants 243b Federal Grants 729c Energy 80 82 84 86 89 91 93 95 98 100 103 105 108 111 113 116 119 122 125 128d Recs 16 16 17 17 18 18 19 19 20 20 21 21 22 22 23 23 24 24 25 26e Avoided Distributionf Capacity/Demand 0 0 0 0 0 0 0 0 0 0 0 0 0 0 0 0 0 0 0 0g Residual Value 3,268h Subtotal, Revenues 972 96 99 101 104 106 109 112 114 117 120 123 126 129 133 136 139 143 146 150 3,422
3 Cashflows ($1,000's)a Nominal Dollars (3,888) 51 52 54 55 56 58 59 61 62 64 65 67 69 70 72 74 76 78 80 3,349b NPV (3,888) 49 48 46 45 44 43 42 41 40 39 38 37 36 36 35 34 33 32 32 1,262c Cum NPV (3,888) (3,839) (3,791) (3,745) (3,700) (3,656) (3,612) (3,570) (3,529) (3,489) (3,450) (3,412) (3,374) (3,338) (3,302) (3,268) (3,234) (3,201) (3,168) (3,137) (1,874)
4 Levered Cashflow ($1,000's)a Investment Cost 3,888b Equity 3,073c Net Operating Income 51 52 54 55 56 58 59 61 62 64 65 67 69 70 72 74 76 78 80 3,349d Debt Service (33) (33) (33) (33) (33) (33) (33) (33) (33) (33) (33) (33) (33) (33) (33) (33) (33) (33) (33) (33)e Debt Coverage Ratio 1.6 1.6 1.6 1.7 1.7 1.8 1.8 1.9 1.9 2.0 2.0 2.1 2.1 2.2 2.2 2.3 2.3 2.4 2.4 2.4f Cash after debt service 19 20 21 22 24 25 27 28 30 31 33 34 36 38 40 41 43 45 47 3,317g Interest Payment (16) (16) (16) (15) (15) (15) (14) (14) (13) (13) (13) (12) (12) (12) (11) (11) (10) (10) (9) (9)h Taxable Income 2 4 5 7 9 11 12 14 16 18 20 22 24 26 29 31 33 35 38 3,308i Income taxj After Tax Cash (3,073) 19 20 21 22 24 25 27 28 30 31 33 34 36 38 40 41 43 45 47 3,317
k NPV (3,073) 18 18 18 18 19 19 19 19 19 19 19 19 19 19 19 19 19 19 19 1,250l Cum NPV (3,073) (3,055) (3,037) (3,019) (3,001) (2,982) (2,963) (2,944) (2,925) (2,906) (2,887) (2,868) (2,849) (2,829) (2,810) (2,791) (2,772) (2,753) (2,735) (2,716) (1,466)
Proforma Inputs Esc. Rate 2.5% Disc. Rate 5.0% MWH 626 Max KW 176 State Grants 243 Fed Grants 729
Energy Rate 125 $/MWH Avg. Power KW Rec Rate 25 $/MWH Demand 0 $/KW-mos O&M 0.015 c/kWh Prop Tax 0.0%Proforma Results
Pre-Tax, Cash on Cash PreTax, Cash on Cash IRR 0.9% Cum NPV (1,874) Discounted Pay Back 20Debt Levered, After-Tax Debt Levered, After Tax IRR 1.3% Cum NPV (1,466) Discounted Pay Back 20
Assumptions1 O&M: 1.5¢/KWH escalated at defined rate (see summary sheet)2 Major maintenance: $50k in years 5 & 15, $125k in years 10 & 20 Denotes cell input linked to Summary Tab3 Payment in Lieu of Property taxes: 1.5% of initial investment, escalated Denotes cell input linked to Individual Cost Tabs4 Insurance: 0.25% of initial investment, escalated Denotes summary results5 Residual Value: calculated growth rate of year 19 revenues (only if positive cashflows)6 Average Debt Coverage Ratio (DCR) set to 2.0 for all levered cases.
For Planning Purposes Only E Prov Proforma_3-7-2011.xlsx

Privileged and Confidential Ten Mile River Feasibility StudyPhase 1
Proforma C
No.Item/
Study Year0 1 2 3 4 5 6 7 8 9 10 11 12 13 14 15 16 17 18 19 20
1 Costs ($1,000's)a Initial Investment 4,954b O&M 13 13 13 14 14 14 15 15 16 16 16 17 17 18 18 19 19 19 20 20c Major Maintenance 23 23 24 24 25 25 26 27 27 28 29 30 30 31 32 33 33 34 35 36 37d Insurance 13 13 13 14 14 14 15 15 15 16 16 17 17 17 18 18 19 19 20 20e Payment in lieu of Property Taxes 0 0 0 0 0 0 0 0 0 0 0 0 0 0 0 0 0 0 0 0fg Subtotal, Costs 4,954 49 50 51 52 54 55 56 58 59 61 62 64 65 67 69 70 72 74 76 78
2 Revenues ($1,000's)a State Grants 248b Federal Grants 743c Energy 106 109 112 115 118 120 123 127 130 133 136 140 143 147 150 154 158 162 166 170d Recs 21 22 22 23 24 24 25 25 26 27 27 28 29 29 30 31 32 32 33 34e Avoided Distributionf Capacity/Demand 0 0 0 0 0 0 0 0 0 0 0 0 0 0 0 0 0 0 0 0g Residual Value 5,066h Subtotal, Revenues 991 128 131 134 138 141 145 148 152 156 160 164 168 172 176 181 185 190 194 199 5,270
3 Cashflows ($1,000's)a Nominal Dollars (3,963) 79 81 83 85 87 90 92 94 97 99 101 104 107 109 112 115 118 121 124 5,192b NPV (3,963) 75 74 72 70 69 67 65 64 62 61 59 58 56 55 54 53 51 50 49 1,957c Cum NPV (3,963) (3,888) (3,814) (3,742) (3,672) (3,604) (3,537) (3,471) (3,408) (3,345) (3,285) (3,225) (3,167) (3,111) (3,056) (3,002) (2,949) (2,898) (2,848) (2,799) (842)
4 Levered Cashflow ($1,000's)a Investment Cost 3,963b Equity 2,700c Net Operating Income 79 81 83 85 87 90 92 94 97 99 101 104 107 109 112 115 118 121 124 5,192d Debt Service (51) (51) (51) (51) (51) (51) (51) (51) (51) (51) (51) (51) (51) (51) (51) (51) (51) (51) (51) (51)e Debt Coverage Ratio 1.6 1.6 1.6 1.7 1.7 1.8 1.8 1.9 1.9 2.0 2.0 2.1 2.1 2.2 2.2 2.3 2.3 2.4 2.4 2.4f Cash after debt service 29 31 33 35 37 39 41 44 46 48 51 53 56 59 61 64 67 70 73 5,142g Interest Payment (25) (25) (24) (24) (23) (23) (22) (21) (21) (20) (20) (19) (18) (18) (17) (17) (16) (15) (14) (14)h Taxable Income 3 6 8 11 14 16 19 22 25 28 31 34 38 41 44 48 51 55 59 5,128i Income taxj After Tax Cash (2,700) 29 31 33 35 37 39 41 44 46 48 51 53 56 59 61 64 67 70 73 5,142
k NPV (2,700) 27 28 28 29 29 29 29 30 30 30 30 30 30 30 30 29 29 29 29 1,938l Cum NPV (2,700) (2,673) (2,645) (2,617) (2,588) (2,559) (2,530) (2,501) (2,471) (2,442) (2,412) (2,382) (2,352) (2,323) (2,293) (2,264) (2,234) (2,205) (2,176) (2,147) (209)
Proforma Inputs Esc. Rate 2.5% Disc. Rate 5.0% MWH 831 Max KW 288 State Grants 248 Fed Grants 743
Energy Rate 125 $/MWH Avg. Power KW Rec Rate 25 $/MWH Demand 0 $/KW-mos O&M 0.015 c/kWh Prop Tax 0.0%Proforma Results
Pre-Tax, Cash on Cash PreTax, Cash on Cash IRR 3.5% Cum NPV (842) Discounted Pay Back 20Debt Levered, After-Tax Debt Levered, After Tax IRR 4.5% Cum NPV (209) Discounted Pay Back 20
Assumptions1 O&M: 1.5¢/KWH escalated at defined rate (see summary sheet)2 Major maintenance: $50k in years 5 & 15, $125k in years 10 & 20 Denotes cell input linked to Summary Tab3 Payment in Lieu of Property taxes: 1.5% of initial investment, escalated Denotes cell input linked to Individual Cost Tabs4 Insurance: 0.25% of initial investment, escalated Denotes summary results5 Residual Value: calculated growth rate of year 19 revenues (only if positive cashflows)6 Average Debt Coverage Ratio (DCR) set to 2.0 for all levered cases.
For Planning Purposes Only E Prov Proforma_3-7-2011.xlsx
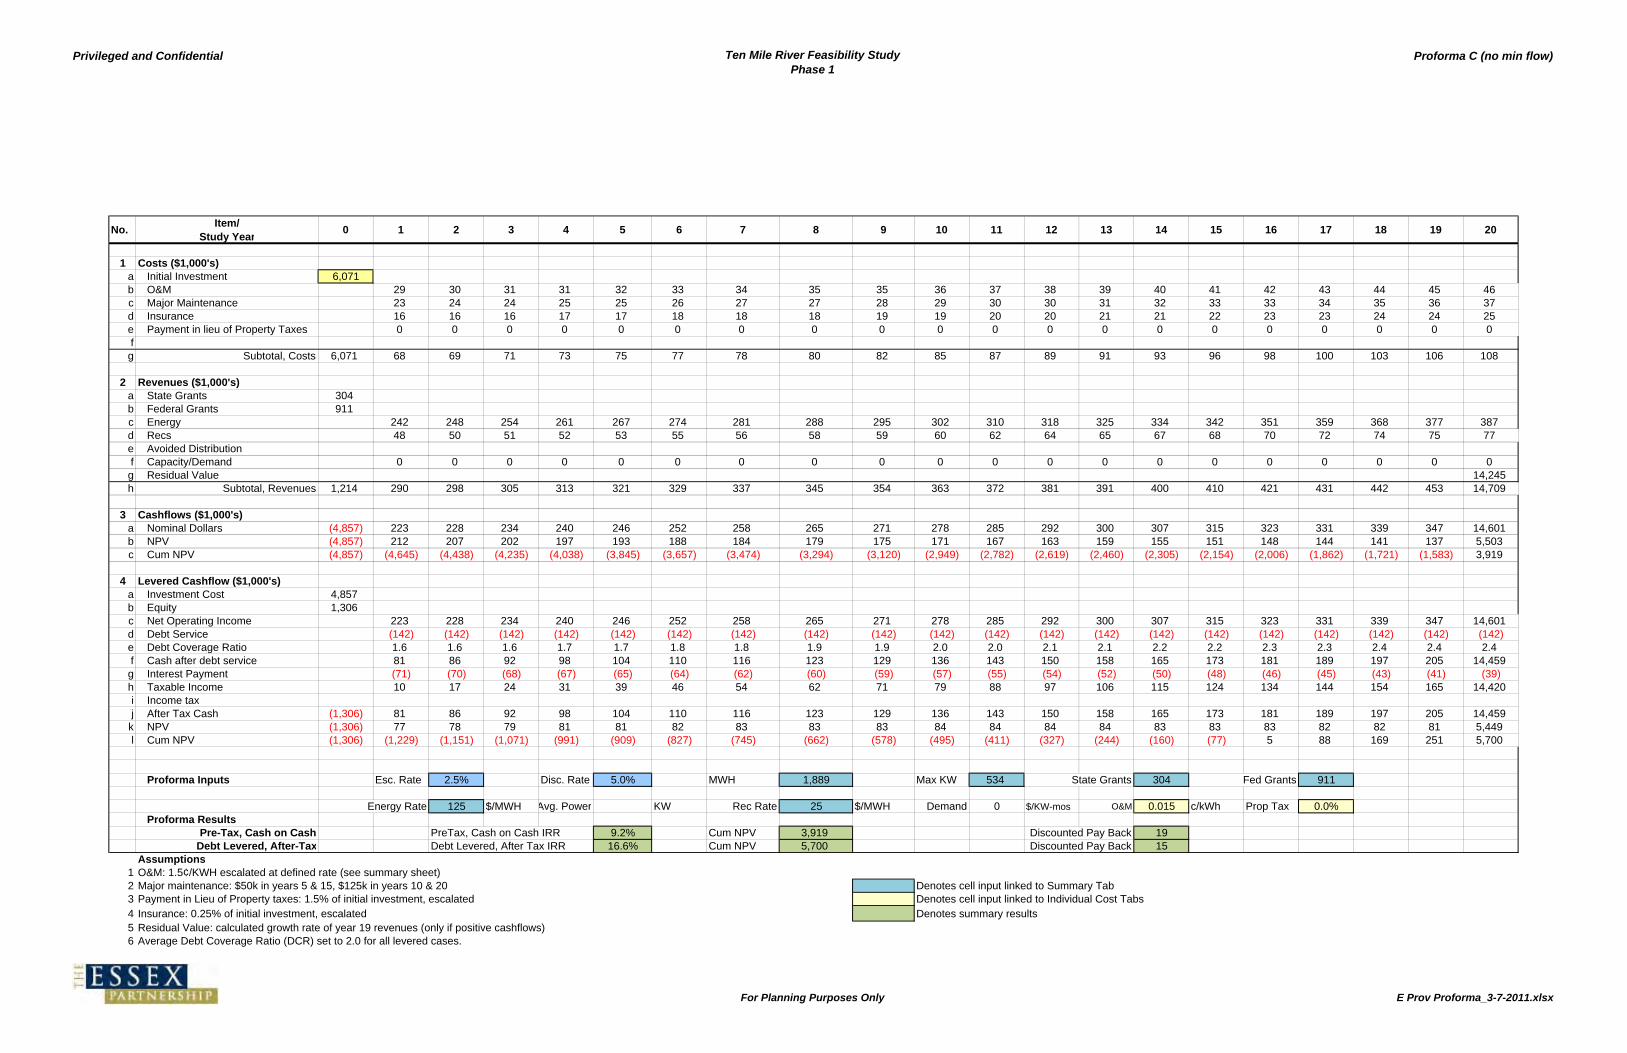
Privileged and Confidential Ten Mile River Feasibility StudyPhase 1
Proforma C (no min flow)
No.Item/
Study Year0 1 2 3 4 5 6 7 8 9 10 11 12 13 14 15 16 17 18 19 20
1 Costs ($1,000's)a Initial Investment 6,071b O&M 29 30 31 31 32 33 34 35 35 36 37 38 39 40 41 42 43 44 45 46c Major Maintenance 23 23 24 24 25 25 26 27 27 28 29 30 30 31 32 33 33 34 35 36 37d Insurance 16 16 16 17 17 18 18 18 19 19 20 20 21 21 22 23 23 24 24 25e Payment in lieu of Property Taxes 0 0 0 0 0 0 0 0 0 0 0 0 0 0 0 0 0 0 0 0fg Subtotal, Costs 6,071 68 69 71 73 75 77 78 80 82 85 87 89 91 93 96 98 100 103 106 108
2 Revenues ($1,000's)a State Grants 304b Federal Grants 911c Energy 242 248 254 261 267 274 281 288 295 302 310 318 325 334 342 351 359 368 377 387d Recs 48 50 51 52 53 55 56 58 59 60 62 64 65 67 68 70 72 74 75 77e Avoided Distributionf Capacity/Demand 0 0 0 0 0 0 0 0 0 0 0 0 0 0 0 0 0 0 0 0g Residual Value 14,245h Subtotal, Revenues 1,214 290 298 305 313 321 329 337 345 354 363 372 381 391 400 410 421 431 442 453 14,709
3 Cashflows ($1,000's)a Nominal Dollars (4,857) 223 228 234 240 246 252 258 265 271 278 285 292 300 307 315 323 331 339 347 14,601b NPV (4,857) 212 207 202 197 193 188 184 179 175 171 167 163 159 155 151 148 144 141 137 5,503c Cum NPV (4,857) (4,645) (4,438) (4,235) (4,038) (3,845) (3,657) (3,474) (3,294) (3,120) (2,949) (2,782) (2,619) (2,460) (2,305) (2,154) (2,006) (1,862) (1,721) (1,583) 3,919
4 Levered Cashflow ($1,000's)a Investment Cost 4,857b Equity 1,306c Net Operating Income 223 228 234 240 246 252 258 265 271 278 285 292 300 307 315 323 331 339 347 14,601d Debt Service (142) (142) (142) (142) (142) (142) (142) (142) (142) (142) (142) (142) (142) (142) (142) (142) (142) (142) (142) (142)e Debt Coverage Ratio 1.6 1.6 1.6 1.7 1.7 1.8 1.8 1.9 1.9 2.0 2.0 2.1 2.1 2.2 2.2 2.3 2.3 2.4 2.4 2.4f Cash after debt service 81 86 92 98 104 110 116 123 129 136 143 150 158 165 173 181 189 197 205 14,459g Interest Payment (71) (70) (68) (67) (65) (64) (62) (60) (59) (57) (55) (54) (52) (50) (48) (46) (45) (43) (41) (39)h Taxable Income 10 17 24 31 39 46 54 62 71 79 88 97 106 115 124 134 144 154 165 14,420i Income taxj After Tax Cash (1,306) 81 86 92 98 104 110 116 123 129 136 143 150 158 165 173 181 189 197 205 14,459
k NPV (1,306) 77 78 79 81 81 82 83 83 83 84 84 84 84 83 83 83 82 82 81 5,449l Cum NPV (1,306) (1,229) (1,151) (1,071) (991) (909) (827) (745) (662) (578) (495) (411) (327) (244) (160) (77) 5 88 169 251 5,700
Proforma Inputs Esc. Rate 2.5% Disc. Rate 5.0% MWH 1,889 Max KW 534 State Grants 304 Fed Grants 911
Energy Rate 125 $/MWH Avg. Power KW Rec Rate 25 $/MWH Demand 0 $/KW-mos O&M 0.015 c/kWh Prop Tax 0.0%Proforma Results
Pre-Tax, Cash on Cash PreTax, Cash on Cash IRR 9.2% Cum NPV 3,919 Discounted Pay Back 19Debt Levered, After-Tax Debt Levered, After Tax IRR 16.6% Cum NPV 5,700 Discounted Pay Back 15
Assumptions1 O&M: 1.5¢/KWH escalated at defined rate (see summary sheet)2 Major maintenance: $50k in years 5 & 15, $125k in years 10 & 20 Denotes cell input linked to Summary Tab3 Payment in Lieu of Property taxes: 1.5% of initial investment, escalated Denotes cell input linked to Individual Cost Tabs4 Insurance: 0.25% of initial investment, escalated Denotes summary results5 Residual Value: calculated growth rate of year 19 revenues (only if positive cashflows)6 Average Debt Coverage Ratio (DCR) set to 2.0 for all levered cases.
For Planning Purposes Only E Prov Proforma_3-7-2011.xlsx

Privileged and Confidential Ten Mile River Feasibility StudyPhase 1
Proforma C (1-2 min flow)
No.Item/
Study Year0 1 2 3 4 5 6 7 8 9 10 11 12 13 14 15 16 17 18 19 20
1 Costs ($1,000's)a Initial Investment 5,209b O&M 17 18 18 19 19 20 20 21 21 22 22 23 24 24 25 25 26 27 27 28c Major Maintenance 23 23 24 24 25 25 26 27 27 28 29 30 30 31 32 33 33 34 35 36 37d Insurance 13 14 14 14 15 15 15 16 16 17 17 18 18 18 19 19 20 20 21 21e Payment in lieu of Property Taxes 0 0 0 0 0 0 0 0 0 0 0 0 0 0 0 0 0 0 0 0fg Subtotal, Costs 5,209 54 55 57 58 59 61 63 64 66 67 69 71 72 74 76 78 80 82 84 86
2 Revenues ($1,000's)a State Grants 260b Federal Grants 743c Energy 146 149 153 157 161 165 169 173 178 182 187 191 196 201 206 211 216 222 227 233d Recs 29 30 31 31 32 33 34 35 36 36 37 38 39 40 41 42 43 44 45 47e Avoided Distributionf Capacity/Demand 0 0 0 0 0 0 0 0 0 0 0 0 0 0 0 0 0 0 0 0g Residual Value 7,737h Subtotal, Revenues 1,004 175 179 184 188 193 198 203 208 213 218 224 229 235 241 247 253 260 266 273 8,016
3 Cashflows ($1,000's)a Nominal Dollars (4,206) 121 124 127 130 134 137 140 144 147 151 155 159 163 167 171 175 180 184 189 7,930b NPV (4,206) 115 112 110 107 105 102 100 97 95 93 91 88 86 84 82 80 78 76 75 2,989c Cum NPV (4,206) (4,091) (3,978) (3,868) (3,761) (3,656) (3,554) (3,455) (3,357) (3,262) (3,169) (3,079) (2,990) (2,904) (2,820) (2,738) (2,657) (2,579) (2,503) (2,428) 561
4 Levered Cashflow ($1,000's)a Investment Cost 4,206b Equity 2,277c Net Operating Income 121 124 127 130 134 137 140 144 147 151 155 159 163 167 171 175 180 184 189 7,930d Debt Service (77) (77) (77) (77) (77) (77) (77) (77) (77) (77) (77) (77) (77) (77) (77) (77) (77) (77) (77) (77)e Debt Coverage Ratio 1.6 1.6 1.6 1.7 1.7 1.8 1.8 1.9 1.9 2.0 2.0 2.1 2.1 2.2 2.2 2.3 2.3 2.4 2.4 2.4f Cash after debt service 44 47 50 53 56 60 63 67 70 74 78 82 86 90 94 98 102 107 112 7,853g Interest Payment (39) (38) (37) (36) (35) (35) (34) (33) (32) (31) (30) (29) (28) (27) (26) (25) (24) (23) (22) (21)h Taxable Income 5 9 13 17 21 25 29 34 38 43 48 52 57 62 68 73 78 84 90 7,832i Income taxj After Tax Cash (2,277) 44 47 50 53 56 60 63 67 70 74 78 82 86 90 94 98 102 107 112 7,853
k NPV (2,277) 42 43 43 44 44 45 45 45 45 45 45 45 45 45 45 45 45 44 44 2,960l Cum NPV (2,277) (2,235) (2,193) (2,150) (2,106) (2,062) (2,017) (1,972) (1,927) (1,882) (1,837) (1,791) (1,746) (1,700) (1,655) (1,610) (1,565) (1,520) (1,476) (1,432) 1,528
Proforma Inputs Esc. Rate 2.5% Disc. Rate 5.0% MWH 1,137 Max KW 326 State Grants 260 Fed Grants 743
Energy Rate 125 $/MWH Avg. Power KW Rec Rate 25 $/MWH Demand 0 $/KW-mos O&M 0.015 c/kWh Prop Tax 0.0%Proforma Results
Pre-Tax, Cash on Cash PreTax, Cash on Cash IRR 5.8% Cum NPV 561 Discounted Pay Back 19Debt Levered, After-Tax Debt Levered, After Tax IRR 8.1% Cum NPV 1,528 Discounted Pay Back 19
Assumptions1 O&M: 1.5¢/KWH escalated at defined rate (see summary sheet)2 Major maintenance: $50k in years 5 & 15, $125k in years 10 & 20 Denotes cell input linked to Summary Tab3 Payment in Lieu of Property taxes: 1.5% of initial investment, escalated Denotes cell input linked to Individual Cost Tabs4 Insurance: 0.25% of initial investment, escalated Denotes summary results5 Residual Value: calculated growth rate of year 19 revenues (only if positive cashflows)6 Average Debt Coverage Ratio (DCR) set to 2.0 for all levered cases.
For Planning Purposes Only E Prov Proforma_3-7-2011.xlsx

Privileged and Confidential Ten Mile River Feasibility StudyPhase 1
Proforma C-2
No.Item/
Study Year0 1 2 3 4 5 6 7 8 9 10 11 12 13 14 15 16 17 18 19 20
1 Costs ($1,000's)a Initial Investment 4,445b O&M 11 12 12 12 13 13 13 14 14 14 15 15 15 16 16 17 17 17 18 18c Major Maintenance 23 23 24 24 25 25 26 27 27 28 29 30 30 31 32 33 33 34 35 36 37d Insurance 11 12 12 12 13 13 13 14 14 14 15 15 15 16 16 16 17 17 18 18e Payment in lieu of Property Taxes 0 0 0 0 0 0 0 0 0 0 0 0 0 0 0 0 0 0 0 0fg Subtotal, Costs 4,445 46 47 48 49 51 52 53 55 56 57 59 60 62 63 65 66 68 70 72 73
2 Revenues ($1,000's)a State Grants 222b Federal Grants 667c Energy 95 98 100 102 105 108 110 113 116 119 122 125 128 131 134 138 141 145 148 152d Recs 19 20 20 20 21 22 22 23 23 24 24 25 26 26 27 28 28 29 30 30e Avoided Distributionf Capacity/Demand 0 0 0 0 0 0 0 0 0 0 0 0 0 0 0 0 0 0 0 0g Residual Value 4,367h Subtotal, Revenues 889 114 117 120 123 126 129 132 136 139 143 146 150 154 157 161 165 169 174 178 4,550
3 Cashflows ($1,000's)a Nominal Dollars (3,556) 68 70 72 74 75 77 79 81 83 85 87 90 92 94 97 99 101 104 107 4,477b NPV (3,556) 65 63 62 61 59 58 56 55 54 52 51 50 49 48 46 45 44 43 42 1,687c Cum NPV (3,556) (3,491) (3,428) (3,366) (3,305) (3,246) (3,188) (3,132) (3,077) (3,024) (2,971) (2,920) (2,870) (2,821) (2,774) (2,728) (2,682) (2,638) (2,595) (2,553) (865)
4 Levered Cashflow ($1,000's)a Investment Cost 3,556b Equity 2,468c Net Operating Income 68 70 72 74 75 77 79 81 83 85 87 90 92 94 97 99 101 104 107 4,477d Debt Service (44) (44) (44) (44) (44) (44) (44) (44) (44) (44) (44) (44) (44) (44) (44) (44) (44) (44) (44) (44)e Debt Coverage Ratio 1.6 1.6 1.6 1.7 1.7 1.8 1.8 1.9 1.9 2.0 2.0 2.1 2.1 2.2 2.2 2.3 2.3 2.4 2.4 2.4f Cash after debt service 25 26 28 30 32 34 36 38 40 42 44 46 48 51 53 55 58 60 63 4,433g Interest Payment (22) (21) (21) (20) (20) (20) (19) (19) (18) (18) (17) (16) (16) (15) (15) (14) (14) (13) (12) (12)h Taxable Income 3 5 7 10 12 14 17 19 22 24 27 30 32 35 38 41 44 47 51 4,421i Income taxj After Tax Cash (2,468) 25 26 28 30 32 34 36 38 40 42 44 46 48 51 53 55 58 60 63 4,433
k NPV (2,468) 24 24 24 25 25 25 25 25 26 26 26 26 26 26 25 25 25 25 25 1,671l Cum NPV (2,468) (2,444) (2,420) (2,396) (2,371) (2,346) (2,321) (2,295) (2,270) (2,244) (2,219) (2,193) (2,167) (2,142) (2,116) (2,091) (2,065) (2,040) (2,015) (1,990) (319)
Proforma Inputs Esc. Rate 2.5% Disc. Rate 5.0% MWH 743 Max KW 282 State Grants 222 Fed Grants 667
Energy Rate 125 $/MWH Avg. Power KW Rec Rate 25 $/MWH Demand 0 $/KW-mos O&M 0.015 c/kWh Prop Tax 0.0%Proforma Results
Pre-Tax, Cash on Cash PreTax, Cash on Cash IRR 3.2% Cum NPV (865) Discounted Pay Back 20Debt Levered, After-Tax Debt Levered, After Tax IRR 4.2% Cum NPV (319) Discounted Pay Back 20
Assumptions1 O&M: 1.5¢/KWH escalated at defined rate (see summary sheet)2 Major maintenance: $50k in years 5 & 15, $125k in years 10 & 20 Denotes cell input linked to Summary Tab3 Payment in Lieu of Property taxes: 1.5% of initial investment, escalated Denotes cell input linked to Individual Cost Tabs4 Insurance: 0.25% of initial investment, escalated Denotes summary results5 Residual Value: calculated growth rate of year 19 revenues (only if positive cashflows)6 Average Debt Coverage Ratio (DCR) set to 2.0 for all levered cases.
For Planning Purposes Only E Prov Proforma_3-7-2011.xlsx
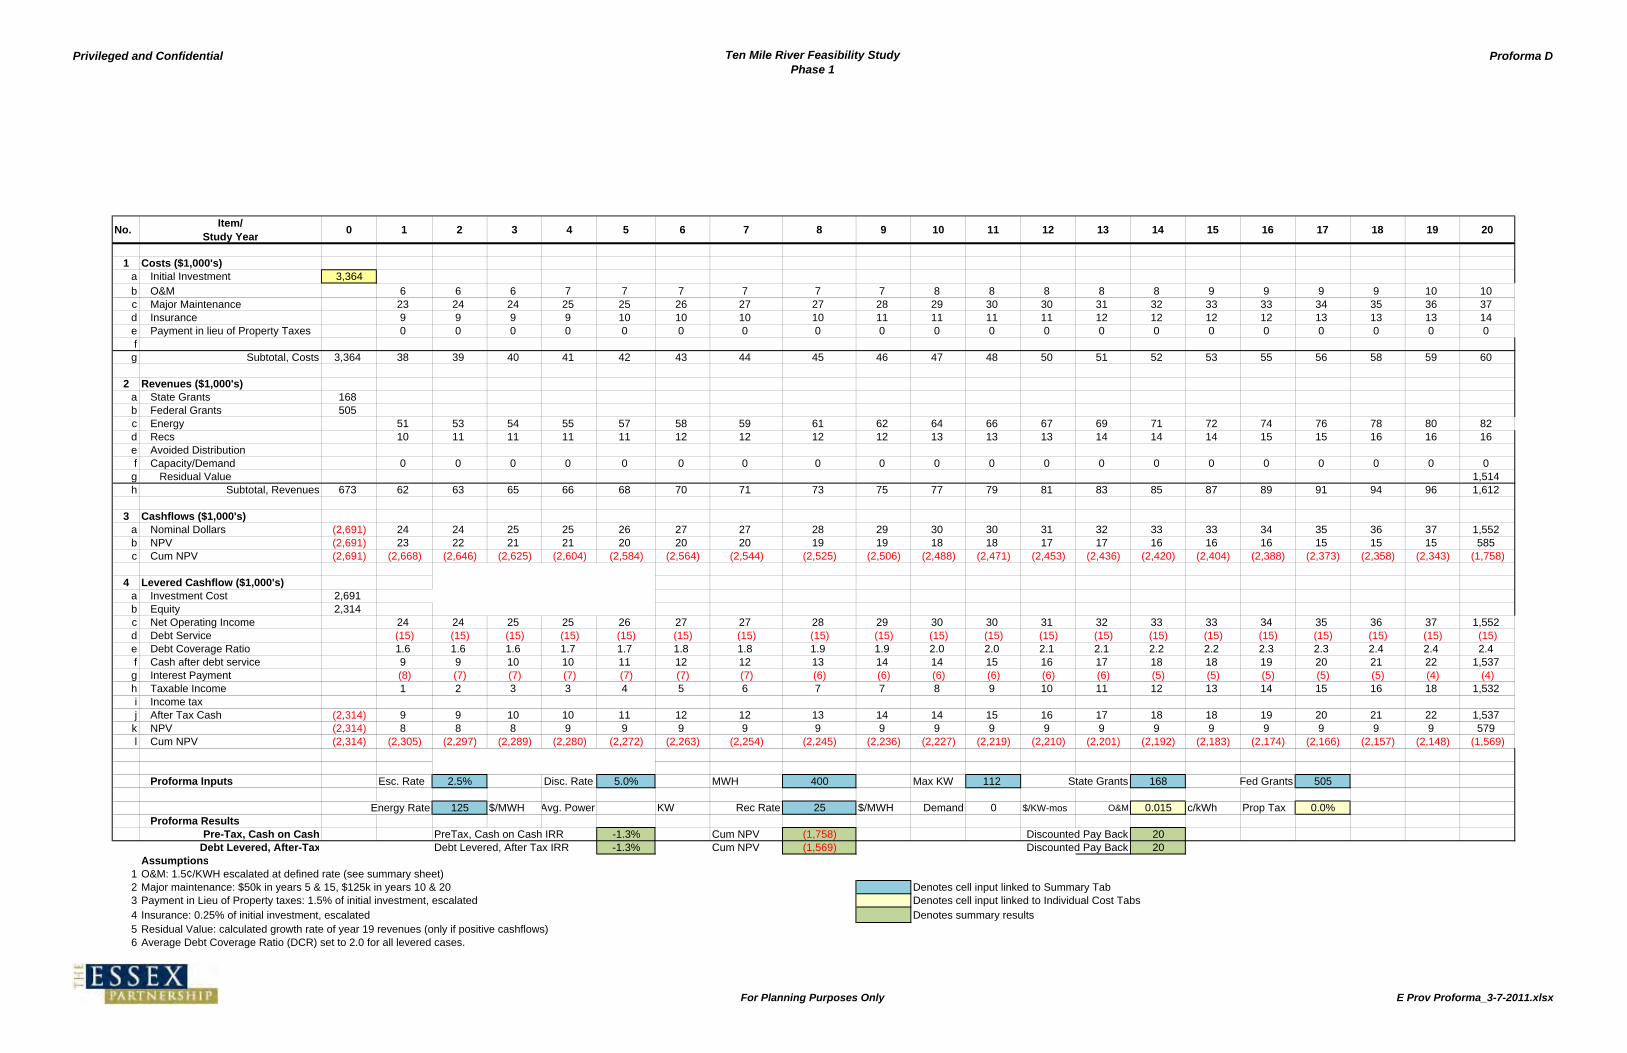
Privileged and Confidential Ten Mile River Feasibility StudyPhase 1
Proforma D
No.Item/
Study Year0 1 2 3 4 5 6 7 8 9 10 11 12 13 14 15 16 17 18 19 20
1 Costs ($1,000's)a Initial Investment 3,364b O&M 6 6 6 7 7 7 7 7 7 8 8 8 8 8 9 9 9 9 10 10c Major Maintenance 23 23 24 24 25 25 26 27 27 28 29 30 30 31 32 33 33 34 35 36 37d Insurance 9 9 9 9 10 10 10 10 11 11 11 11 12 12 12 12 13 13 13 14e Payment in lieu of Property Taxes 0 0 0 0 0 0 0 0 0 0 0 0 0 0 0 0 0 0 0 0fg Subtotal, Costs 3,364 38 39 40 41 42 43 44 45 46 47 48 50 51 52 53 55 56 58 59 60
2 Revenues ($1,000's)a State Grants 168b Federal Grants 505c Energy 51 53 54 55 57 58 59 61 62 64 66 67 69 71 72 74 76 78 80 82d Recs 10 11 11 11 11 12 12 12 12 13 13 13 14 14 14 15 15 16 16 16e Avoided Distributionf Capacity/Demand 0 0 0 0 0 0 0 0 0 0 0 0 0 0 0 0 0 0 0 0g Residual Value 1,514h Subtotal, Revenues 673 62 63 65 66 68 70 71 73 75 77 79 81 83 85 87 89 91 94 96 1,612
3 Cashflows ($1,000's)a Nominal Dollars (2,691) 24 24 25 25 26 27 27 28 29 30 30 31 32 33 33 34 35 36 37 1,552b NPV (2,691) 23 22 21 21 20 20 20 19 19 18 18 17 17 16 16 16 15 15 15 585c Cum NPV (2,691) (2,668) (2,646) (2,625) (2,604) (2,584) (2,564) (2,544) (2,525) (2,506) (2,488) (2,471) (2,453) (2,436) (2,420) (2,404) (2,388) (2,373) (2,358) (2,343) (1,758)
4 Levered Cashflow ($1,000's)a Investment Cost 2,691b Equity 2,314c Net Operating Income 24 24 25 25 26 27 27 28 29 30 30 31 32 33 33 34 35 36 37 1,552d Debt Service (15) (15) (15) (15) (15) (15) (15) (15) (15) (15) (15) (15) (15) (15) (15) (15) (15) (15) (15) (15)e Debt Coverage Ratio 1.6 1.6 1.6 1.7 1.7 1.8 1.8 1.9 1.9 2.0 2.0 2.1 2.1 2.2 2.2 2.3 2.3 2.4 2.4 2.4f Cash after debt service 9 9 10 10 11 12 12 13 14 14 15 16 17 18 18 19 20 21 22 1,537g Interest Payment (8) (7) (7) (7) (7) (7) (7) (6) (6) (6) (6) (6) (6) (5) (5) (5) (5) (5) (4) (4)h Taxable Income 1 2 3 3 4 5 6 7 7 8 9 10 11 12 13 14 15 16 18 1,532i Income taxj After Tax Cash (2,314) 9 9 10 10 11 12 12 13 14 14 15 16 17 18 18 19 20 21 22 1,537
k NPV (2,314) 8 8 8 9 9 9 9 9 9 9 9 9 9 9 9 9 9 9 9 579l Cum NPV (2,314) (2,305) (2,297) (2,289) (2,280) (2,272) (2,263) (2,254) (2,245) (2,236) (2,227) (2,219) (2,210) (2,201) (2,192) (2,183) (2,174) (2,166) (2,157) (2,148) (1,569)
Proforma Inputs Esc. Rate 2.5% Disc. Rate 5.0% MWH 400 Max KW 112 State Grants 168 Fed Grants 505
Energy Rate 125 $/MWH Avg. Power KW Rec Rate 25 $/MWH Demand 0 $/KW-mos O&M 0.015 c/kWh Prop Tax 0.0%Proforma Results
Pre-Tax, Cash on Cash PreTax, Cash on Cash IRR -1.3% Cum NPV (1,758) Discounted Pay Back 20Debt Levered, After-Tax Debt Levered, After Tax IRR -1.3% Cum NPV (1,569) Discounted Pay Back 20
Assumptions1 O&M: 1.5¢/KWH escalated at defined rate (see summary sheet)2 Major maintenance: $50k in years 5 & 15, $125k in years 10 & 20 Denotes cell input linked to Summary Tab3 Payment in Lieu of Property taxes: 1.5% of initial investment, escalated Denotes cell input linked to Individual Cost Tabs4 Insurance: 0.25% of initial investment, escalated Denotes summary results5 Residual Value: calculated growth rate of year 19 revenues (only if positive cashflows)6 Average Debt Coverage Ratio (DCR) set to 2.0 for all levered cases.
For Planning Purposes Only E Prov Proforma_3-7-2011.xlsx

Privileged and Confidential Ten Mile River Feasibility StudyPhase 1
Proforma E
No.Item/
Study Year0 1 2 3 4 5 6 7 8 9 10 11 12 13 14 15 16 17 18 19 20
1 Costs ($1,000's)a Initial Investment 3,326b O&M 8 8 8 9 9 9 9 10 10 10 10 11 11 11 11 12 12 12 13 13c Major Maintenance 23 23 24 24 25 25 26 27 27 28 29 30 30 31 32 33 33 34 35 36 37d Insurance 9 9 9 9 9 10 10 10 10 11 11 11 11 12 12 12 13 13 13 14e Payment in lieu of Property Taxes 0 0 0 0 0 0 0 0 0 0 0 0 0 0 0 0 0 0 0 0fg Subtotal, Costs 3,326 40 41 42 43 44 45 46 47 48 50 51 52 53 55 56 57 59 60 62 63
2 Revenues ($1,000's)a State Grants 166b Federal Grants 499c Energy 67 69 71 72 74 76 78 80 82 84 86 88 90 93 95 97 100 102 105 107d Recs 13 14 14 14 15 15 16 16 16 17 17 18 18 19 19 19 20 20 21 21e Avoided Distributionf Capacity/Demand 0 0 0 0 0 0 0 0 0 0 0 0 0 0 0 0 0 0 0 0g Residual Value 2,618h Subtotal, Revenues 665 81 83 85 87 89 91 93 96 98 101 103 106 108 111 114 117 120 123 126 2,747
3 Cashflows ($1,000's)a Nominal Dollars (2,661) 41 42 43 44 45 46 47 49 50 51 52 54 55 56 58 59 61 62 64 2,684b NPV (2,661) 39 38 37 36 35 35 34 33 32 31 31 30 29 29 28 27 27 26 25 1,012c Cum NPV (2,661) (2,622) (2,583) (2,546) (2,510) (2,475) (2,440) (2,406) (2,373) (2,341) (2,310) (2,279) (2,249) (2,220) (2,191) (2,164) (2,136) (2,110) (2,084) (2,059) (1,047)
4 Levered Cashflow ($1,000's)a Investment Cost 2,661b Equity 2,008c Net Operating Income 41 42 43 44 45 46 47 49 50 51 52 54 55 56 58 59 61 62 64 2,684d Debt Service (26) (26) (26) (26) (26) (26) (26) (26) (26) (26) (26) (26) (26) (26) (26) (26) (26) (26) (26) (26)e Debt Coverage Ratio 1.6 1.6 1.6 1.7 1.7 1.8 1.8 1.9 1.9 2.0 2.0 2.1 2.1 2.2 2.2 2.3 2.3 2.4 2.4 2.4f Cash after debt service 15 16 17 18 19 20 21 23 24 25 26 28 29 30 32 33 35 36 38 2,658g Interest Payment (13) (13) (13) (12) (12) (12) (11) (11) (11) (11) (10) (10) (10) (9) (9) (9) (8) (8) (7) (7)h Taxable Income 2 3 4 6 7 9 10 11 13 15 16 18 19 21 23 25 26 28 30 2,651i Income taxj After Tax Cash (2,008) 15 16 17 18 19 20 21 23 24 25 26 28 29 30 32 33 35 36 38 2,658
k NPV (2,008) 14 14 15 15 15 15 15 15 15 15 15 15 15 15 15 15 15 15 15 1,002l Cum NPV (2,008) (1,994) (1,979) (1,965) (1,950) (1,935) (1,920) (1,905) (1,889) (1,874) (1,859) (1,843) (1,828) (1,813) (1,797) (1,782) (1,767) (1,752) (1,737) (1,722) (720)
Proforma Inputs Esc. Rate 2.5% Disc. Rate 5.0% MWH 524 Max KW 184 State Grants 166 Fed Grants 499
Energy Rate 125 $/MWH Avg. Power KW Rec Rate 25 $/MWH Demand 0 $/KW-mos O&M 0.015 c/kWh Prop Tax 0.0%Proforma Results
Pre-Tax, Cash on Cash PreTax, Cash on Cash IRR 1.9% Cum NPV (1,047) Discounted Pay Back 20Debt Levered, After-Tax Debt Levered, After Tax IRR 2.4% Cum NPV (720) Discounted Pay Back 20
Assumptions1 O&M: 1.5¢/KWH escalated at defined rate (see summary sheet)2 Major maintenance: $50k in years 5 & 15, $125k in years 10 & 20 Denotes cell input linked to Summary Tab3 Payment in Lieu of Property taxes: 1.5% of initial investment, escalated Denotes cell input linked to Individual Cost Tabs4 Insurance: 0.25% of initial investment, escalated Denotes summary results5 Residual Value: calculated growth rate of year 19 revenues (only if positive cashflows)6 Average Debt Coverage Ratio (DCR) set to 2.0 for all levered cases.
For Planning Purposes Only E Prov Proforma_3-7-2011.xlsx

Privileged and Confidential Ten Mile River Feasibility StudyPhase 1
Proforma E (no min flow)
No.Item/
Study Year0 1 2 3 4 5 6 7 8 9 10 11 12 13 14 15 16 17 18 19 20
1 Costs ($1,000's)a Initial Investment 4,020b O&M 18 19 19 20 20 21 21 22 22 23 23 24 24 25 26 26 27 28 28 29c Major Maintenance 23 23 24 24 25 25 26 27 27 28 29 30 30 31 32 33 33 34 35 36 37d Insurance 10 11 11 11 11 12 12 12 13 13 13 14 14 14 15 15 15 16 16 16e Payment in lieu of Property Taxes 0 0 0 0 0 0 0 0 0 0 0 0 0 0 0 0 0 0 0 0fg Subtotal, Costs 4,020 52 53 54 56 57 58 60 61 63 64 66 68 69 71 73 75 77 78 80 82
2 Revenues ($1,000's)a State Grants 201b Federal Grants 603c Energy 152 156 159 163 168 172 176 180 185 190 194 199 204 209 214 220 225 231 237 243d Recs 30 31 32 33 34 34 35 36 37 38 39 40 41 42 43 44 45 46 47 49e Avoided Distributionf Capacity/Demand 0 0 0 0 0 0 0 0 0 0 0 0 0 0 0 0 0 0 0 0g Residual Value 8,347h Subtotal, Revenues 804 182 187 191 196 201 206 211 216 222 227 233 239 245 251 257 264 270 277 284 8,639
3 Cashflows ($1,000's)a Nominal Dollars (3,216) 131 134 137 141 144 148 151 155 159 163 167 171 176 180 184 189 194 199 204 8,556b NPV (3,216) 124 121 118 116 113 110 108 105 103 100 98 95 93 91 89 87 85 83 81 3,225c Cum NPV (3,216) (3,092) (2,970) (2,852) (2,736) (2,623) (2,513) (2,405) (2,300) (2,198) (2,098) (2,000) (1,905) (1,812) (1,721) (1,632) (1,545) (1,461) (1,378) (1,298) 1,927
4 Levered Cashflow ($1,000's)a Investment Cost 3,216b Equity 1,135c Net Operating Income 131 134 137 141 144 148 151 155 159 163 167 171 176 180 184 189 194 199 204 8,556d Debt Service (83) (83) (83) (83) (83) (83) (83) (83) (83) (83) (83) (83) (83) (83) (83) (83) (83) (83) (83) (83)e Debt Coverage Ratio 1.6 1.6 1.6 1.7 1.7 1.8 1.8 1.9 1.9 2.0 2.0 2.1 2.1 2.2 2.2 2.3 2.3 2.4 2.4 2.4f Cash after debt service 47 51 54 57 61 64 68 72 76 80 84 88 92 97 101 106 111 115 120 8,473g Interest Payment (42) (41) (40) (39) (38) (37) (36) (35) (34) (33) (33) (31) (30) (29) (28) (27) (26) (25) (24) (23)h Taxable Income 6 10 14 18 23 27 32 37 41 46 51 57 62 67 73 79 84 90 97 8,450i Income taxj After Tax Cash (1,135) 47 51 54 57 61 64 68 72 76 80 84 88 92 97 101 106 111 115 120 8,473k NPV (1,135) 45 46 47 47 48 48 48 49 49 49 49 49 49 49 49 48 48 48 48 3,193l Cum NPV (1,135) (1,090) (1,044) (998) (950) (903) (855) (806) (757) (709) (660) (611) (562) (513) (464) (415) (367) (318) (270) (223) 2,971
Proforma Inputs Esc. Rate 2.5% Disc. Rate 5.0% MWH 1,184 Max KW 341 State Grants 201 Fed Grants 603
Energy Rate 125 $/MWH Avg. Power KW Rec Rate 25 $/MWH Demand 0 $/KW-mos O&M 0.015 c/kWh Prop Tax 0.0%Proforma Results
Pre-Tax, Cash on Cash PreTax, Cash on Cash IRR 8.3% Cum NPV 1,927 Discounted Pay Back 19Debt Levered, After-Tax Debt Levered, After Tax IRR 13.5% Cum NPV 2,971 Discounted Pay Back 19
Assumptions1 O&M: 1.5¢/KWH escalated at defined rate (see summary sheet)2 Major maintenance: $50k in years 5 & 15, $125k in years 10 & 20 Denotes cell input linked to Summary Tab3 Payment in Lieu of Property taxes: 1.5% of initial investment, escalated Denotes cell input linked to Individual Cost Tabs4 Insurance: 0.25% of initial investment, escalated Denotes summary results5 Residual Value: calculated growth rate of year 19 revenues (only if positive cashflows)
For Planning Purposes Only E Prov Proforma_3-7-2011.xlsx

Privileged and Confidential Ten Mile River Feasibility StudyPhase 1
Proforma E (1-2 min flow)
No.Item/
Study Year0 1 2 3 4 5 6 7 8 9 10 11 12 13 14 15 16 17 18 19 20
1 Costs ($1,000's)a Initial Investment 3,519b O&M 11 11 12 12 12 12 13 13 13 14 14 14 15 15 16 16 16 17 17 18c Major Maintenance 23 23 24 24 25 25 26 27 27 28 29 30 30 31 32 33 33 34 35 36 37d Insurance 9 9 9 10 10 10 10 11 11 11 12 12 12 12 13 13 13 14 14 14e Payment in lieu of Property Taxes 0 0 0 0 0 0 0 0 0 0 0 0 0 0 0 0 0 0 0 0fg Subtotal, Costs 3,519 43 44 45 46 48 49 50 51 53 54 55 57 58 59 61 62 64 66 67 69
2 Revenues ($1,000's)a State Grants 176b Federal Grants 528c Energy 92 94 97 99 101 104 107 109 112 115 118 121 124 127 130 133 136 140 143 147d Recs 18 19 19 20 20 21 21 22 22 23 24 24 25 25 26 27 27 28 29 29e Avoided Distributionf Capacity/Demand 0 0 0 0 0 0 0 0 0 0 0 0 0 0 0 0 0 0 0 0g Residual Value 4,294h Subtotal, Revenues 704 110 113 116 119 122 125 128 131 134 138 141 145 148 152 156 160 164 168 172 4,470
3 Cashflows ($1,000's)a Nominal Dollars (2,815) 67 69 71 72 74 76 78 80 82 84 86 88 90 93 95 97 100 102 105 4,401b NPV (2,815) 64 62 61 59 58 57 55 54 53 51 50 49 48 47 46 45 43 42 41 1,659c Cum NPV (2,815) (2,751) (2,689) (2,628) (2,568) (2,510) (2,454) (2,398) (2,344) (2,292) (2,240) (2,190) (2,141) (2,093) (2,046) (2,000) (1,956) (1,912) (1,870) (1,829) (170)
4 Levered Cashflow ($1,000's)a Investment Cost 2,815b Equity 1,745c Net Operating Income 67 69 71 72 74 76 78 80 82 84 86 88 90 93 95 97 100 102 105 4,401d Debt Service (43) (43) (43) (43) (43) (43) (43) (43) (43) (43) (43) (43) (43) (43) (43) (43) (43) (43) (43) (43)e Debt Coverage Ratio 1.6 1.6 1.6 1.7 1.7 1.8 1.8 1.9 1.9 2.0 2.0 2.1 2.1 2.2 2.2 2.3 2.3 2.4 2.4 2.4f Cash after debt service 24 26 28 29 31 33 35 37 39 41 43 45 47 50 52 54 57 59 62 4,358g Interest Payment (21) (21) (21) (20) (20) (19) (19) (18) (18) (17) (17) (16) (16) (15) (15) (14) (13) (13) (12) (12)h Taxable Income 3 5 7 9 12 14 16 19 21 24 26 29 32 35 37 40 43 47 50 4,347i Income taxj After Tax Cash (1,745) 24 26 28 29 31 33 35 37 39 41 43 45 47 50 52 54 57 59 62 4,358
k NPV (1,745) 23 24 24 24 25 25 25 25 25 25 25 25 25 25 25 25 25 25 24 1,643l Cum NPV (1,745) (1,722) (1,698) (1,674) (1,650) (1,625) (1,601) (1,576) (1,551) (1,526) (1,500) (1,475) (1,450) (1,425) (1,400) (1,375) (1,350) (1,325) (1,300) (1,276) 367
Proforma Inputs Esc. Rate 2.5% Disc. Rate 5.0% MWH 717 Max KW 209 State Grants 176 Fed Grants 528
Energy Rate 125 $/MWH Avg. Power KW Rec Rate 25 $/MWH Demand 0 $/KW-mos O&M 0.015 c/kWh Prop Tax 0.0%Proforma Results
Pre-Tax, Cash on Cash PreTax, Cash on Cash IRR 4.6% Cum NPV (170) Discounted Pay Back 20Debt Levered, After-Tax Debt Levered, After Tax IRR 6.1% Cum NPV 367 Discounted Pay Back 19
Assumptions1 O&M: 1.5¢/KWH escalated at defined rate (see summary sheet)2 Major maintenance: $50k in years 5 & 15, $125k in years 10 & 20 Denotes cell input linked to Summary Tab3 Payment in Lieu of Property taxes: 1.5% of initial investment, escalated Denotes summary results4 Insurance: 0.25% of initial investment, escalated6 Average Debt Coverage Ratio (DCR) set to 2.0 for all levered cases.
For Planning Purposes Only E Prov Proforma_3-7-2011.xlsx

Privileged and Confidential Ten Mile River Feasibility StudyPhase 1
Proforma E-2
No.Item/
Study Year0 1 2 3 4 5 6 7 8 9 10 11 12 13 14 15 16 17 18 19 20
1 Costs ($1,000's)a Initial Investment 3,070b O&M 7 7 7 8 8 8 8 8 9 9 9 9 10 10 10 10 11 11 11 11c Major Maintenance 23 23 24 24 25 25 26 27 27 28 29 30 30 31 32 33 33 34 35 36 37d Insurance 8 8 8 8 9 9 9 9 10 10 10 10 11 11 11 11 12 12 12 13e Payment in lieu of Property Taxes 0 0 0 0 0 0 0 0 0 0 0 0 0 0 0 0 0 0 0 0fg Subtotal, Costs 3,070 38 39 40 41 42 43 44 45 46 48 49 50 51 52 54 55 57 58 59 61
2 Revenues ($1,000's)a State Grants 153b Federal Grants 460c Energy 59 61 62 64 66 67 69 71 72 74 76 78 80 82 84 86 88 90 93 95d Recs 12 12 12 13 13 13 14 14 14 15 15 16 16 16 17 17 18 18 19 19e Avoided Distributionf Capacity/Demand 0 0 0 0 0 0 0 0 0 0 0 0 0 0 0 0 0 0 0 0g Residual Value 2,127h Subtotal, Revenues 614 71 73 75 77 79 81 83 85 87 89 91 94 96 98 101 103 106 109 111 2,241
3 Cashflows ($1,000's)a Nominal Dollars (2,456) 33 34 35 36 37 38 39 40 41 42 43 44 45 46 47 48 49 51 52 2,181b NPV (2,456) 32 31 30 29 29 28 27 27 26 26 25 24 24 23 23 22 22 21 21 822c Cum NPV (2,456) (2,424) (2,393) (2,363) (2,333) (2,305) (2,277) (2,249) (2,222) (2,196) (2,171) (2,146) (2,122) (2,098) (2,075) (2,052) (2,030) (2,008) (1,987) (1,967) (1,145)
4 Levered Cashflow ($1,000's)a Investment Cost 2,456b Equity 1,925c Net Operating Income 33 34 35 36 37 38 39 40 41 42 43 44 45 46 47 48 49 51 52 2,181d Debt Service (21) (21) (21) (21) (21) (21) (21) (21) (21) (21) (21) (21) (21) (21) (21) (21) (21) (21) (21) (21)e Debt Coverage Ratio 1.6 1.6 1.6 1.7 1.7 1.8 1.8 1.9 1.9 2.0 2.0 2.1 2.1 2.2 2.2 2.3 2.3 2.4 2.4 2.4f Cash after debt service 12 13 14 15 16 16 17 18 19 20 21 22 24 25 26 27 28 29 31 2,159g Interest Payment (11) (10) (10) (10) (10) (10) (9) (9) (9) (9) (8) (8) (8) (7) (7) (7) (7) (6) (6) (6)h Taxable Income 1 2 4 5 6 7 8 9 11 12 13 14 16 17 19 20 22 23 25 2,154i Income taxj After Tax Cash (1,925) 12 13 14 15 16 16 17 18 19 20 21 22 24 25 26 27 28 29 31 2,159
k NPV (1,925) 11 12 12 12 12 12 12 12 12 12 12 12 12 12 12 12 12 12 12 814l Cum NPV (1,925) (1,914) (1,902) (1,890) (1,878) (1,866) (1,854) (1,842) (1,829) (1,817) (1,804) (1,792) (1,779) (1,767) (1,754) (1,742) (1,730) (1,717) (1,705) (1,693) (879)
Proforma Inputs Esc. Rate 2.5% Disc. Rate 5.0% MWH 464 Max KW 178 State Grants 153 Fed Grants 460
Energy Rate 125 $/MWH Avg. Power KW Rec Rate 25 $/MWH Demand 0 $/KW-mos O&M 0.015 c/kWh Prop Tax 0.0%Proforma Results
Pre-Tax, Cash on Cash PreTax, Cash on Cash IRR 1.1% Cum NPV (1,145) Discounted Pay Back 20Debt Levered, After-Tax Debt Levered, After Tax IRR 1.5% Cum NPV (879) Discounted Pay Back 20
Assumptions1 O&M: 1.5¢/KWH escalated at defined rate (see summary sheet)2 Major maintenance: $50k in years 5 & 15, $125k in years 10 & 20 Denotes cell input linked to Summary Tab3 Payment in Lieu of Property taxes: 1.5% of initial investment, escalated Denotes cell input linked to Individual Cost Tabs4 Insurance: 0.25% of initial investment, escalated Denotes summary results5 Residual Value: calculated growth rate of year 19 revenues (only if positive cashflows)6 Average Debt Coverage Ratio (DCR) set to 2.0 for all levered cases.
For Planning Purposes Only E Prov Proforma_3-7-2011.xlsx

Privileged and Confidential Ten Mile River Feasibility StudyPhase 1
Proforma E-2 (no min flow)
No.Item/
Study Year0 1 2 3 4 5 6 7 8 9 10 11 12 13 14 15 16 17 18 19 20
1 Costs ($1,000's)a Initial Investment 3,228b O&M 13 13 13 13 14 14 15 15 15 16 16 16 17 17 18 18 19 19 20 20c Major Maintenance 23 23 24 24 25 25 26 27 27 28 29 30 30 31 32 33 33 34 35 36 37d Insurance 8 8 9 9 9 9 10 10 10 10 11 11 11 11 12 12 12 13 13 13e Payment in lieu of Property Taxes 0 0 0 0 0 0 0 0 0 0 0 0 0 0 0 0 0 0 0 0fg Subtotal, Costs 3,228 44 45 46 47 48 50 51 52 53 55 56 58 59 60 62 64 65 67 68 70
2 Revenues ($1,000's)a State Grants 153b Federal Grants 460c Energy 104 107 110 112 115 118 121 124 127 130 134 137 140 144 147 151 155 159 163 167d Recs 21 21 22 22 23 24 24 25 25 26 27 27 28 29 29 30 31 32 33 33e Avoided Distributionf Capacity/Demand 0 0 0 0 0 0 0 0 0 0 0 0 0 0 0 0 0 0 0 0g Residual Value 5,205h Subtotal, Revenues 614 125 128 132 135 138 142 145 149 153 156 160 164 168 173 177 181 186 191 195 5,405
3 Cashflows ($1,000's)a Nominal Dollars (2,614) 81 83 86 88 90 92 94 97 99 102 104 107 109 112 115 118 121 124 127 5,335b NPV (2,614) 78 76 74 72 70 69 67 65 64 62 61 59 58 57 55 54 53 51 50 2,011c Cum NPV (2,614) (2,536) (2,461) (2,387) (2,315) (2,244) (2,175) (2,108) (2,043) (1,979) (1,917) (1,856) (1,796) (1,738) (1,681) (1,626) (1,572) (1,519) (1,468) (1,418) 593
4 Levered Cashflow ($1,000's)a Investment Cost 2,614b Equity 1,316c Net Operating Income 81 83 86 88 90 92 94 97 99 102 104 107 109 112 115 118 121 124 127 5,335d Debt Service (52) (52) (52) (52) (52) (52) (52) (52) (52) (52) (52) (52) (52) (52) (52) (52) (52) (52) (52) (52)e Debt Coverage Ratio 1.6 1.6 1.6 1.7 1.7 1.8 1.8 1.9 1.9 2.0 2.0 2.1 2.1 2.2 2.2 2.3 2.3 2.4 2.4 2.4f Cash after debt service 29 32 34 36 38 40 42 45 47 50 52 55 58 60 63 66 69 72 75 5,283g Interest Payment (26) (25) (25) (24) (24) (23) (23) (22) (22) (21) (20) (20) (19) (18) (18) (17) (16) (16) (15) (14)h Taxable Income 4 6 9 11 14 17 20 23 26 29 32 35 39 42 45 49 53 56 60 5,269i Income taxj After Tax Cash (1,316) 29 32 34 36 38 40 42 45 47 50 52 55 58 60 63 66 69 72 75 5,283
k NPV (1,316) 28 29 29 29 30 30 30 30 30 31 31 31 31 30 30 30 30 30 30 1,991l Cum NPV (1,316) (1,288) (1,259) (1,230) (1,201) (1,171) (1,141) (1,111) (1,081) (1,050) (1,020) (989) (958) (928) (897) (867) (837) (807) (777) (747) 1,244
Proforma Inputs Esc. Rate 2.5% Disc. Rate 5.0% MWH 815 Max KW 271 State Grants 153 Fed Grants 460
Energy Rate 125 $/MWH Avg. Power KW Rec Rate 25 $/MWH Demand 0 $/KW-mos O&M 0.015 c/kWh Prop Tax 0.0%Proforma Results
Pre-Tax, Cash on Cash PreTax, Cash on Cash IRR 6.4% Cum NPV 593 Discounted Pay Back 19Debt Levered, After-Tax Debt Levered, After Tax IRR 9.1% Cum NPV 1,244 Discounted Pay Back 19
Assumptions1 O&M: 1.5¢/KWH escalated at defined rate (see summary sheet)2 Major maintenance: $50k in years 5 & 15, $125k in years 10 & 20 Denotes cell input linked to Summary Tab3 Payment in Lieu of Property taxes: 1.5% of initial investment, escalated Denotes cell input linked to Individual Cost Tabs4 Insurance: 0.25% of initial investment, escalated Denotes summary results5 Residual Value: calculated growth rate of year 19 revenues (only if positive cashflows)6 Average Debt Coverage Ratio (DCR) set to 2.0 for all levered cases.
For Planning Purposes Only E Prov Proforma_3-7-2011.xlsx

Privileged and Confidential Ten Mile River Feasibility StudyPhase 1
Proforma E-3
No.Item/
Study Year0 1 2 3 4 5 6 7 8 9 10 11 12 13 14 15 16 17 18 19 20
1 Costs ($1,000's)a Initial Investment 2,937b O&M 5 5 5 6 6 6 6 6 6 6 7 7 7 7 7 7 8 8 8 8c Major Maintenance 23 23 24 24 25 25 26 27 27 28 29 30 30 31 32 33 33 34 35 36 37d Insurance 8 8 8 8 8 9 9 9 9 9 10 10 10 10 11 11 11 11 12 12e Payment in lieu of Property Taxes 0 0 0 0 0 0 0 0 0 0 0 0 0 0 0 0 0 0 0 0fg Subtotal, Costs 2,937 36 37 38 38 39 40 41 42 44 45 46 47 48 49 50 52 53 54 56 57
2 Revenues ($1,000's)a State Grants 147b Federal Grants 440c Energy 43 44 45 46 47 49 50 51 52 54 55 56 58 59 61 62 64 65 67 69d Recs 9 9 9 9 9 10 10 10 10 11 11 11 12 12 12 12 13 13 13 14e Avoided Distributionf Capacity/Demand 0 0 0 0 0 0 0 0 0 0 0 0 0 0 0 0 0 0 0 0g Residual Value 1,007h Subtotal, Revenues 587 51 53 54 55 57 58 60 61 63 64 66 68 69 71 73 75 76 78 80 1,089
3 Cashflows ($1,000's)a Nominal Dollars (2,349) 16 16 17 17 17 18 18 19 19 20 20 21 21 22 22 23 23 24 25 1,032b NPV (2,349) 15 15 14 14 14 13 13 13 12 12 12 12 11 11 11 10 10 10 10 389c Cum NPV (2,349) (2,334) (2,320) (2,305) (2,291) (2,278) (2,265) (2,252) (2,239) (2,226) (2,214) (2,203) (2,191) (2,180) (2,169) (2,158) (2,148) (2,138) (2,128) (2,118) (1,729)
4 Levered Cashflow ($1,000's)a Investment Cost 2,349b Equity 2,098c Net Operating Income 16 16 17 17 17 18 18 19 19 20 20 21 21 22 22 23 23 24 25 1,032d Debt Service (10) (10) (10) (10) (10) (10) (10) (10) (10) (10) (10) (10) (10) (10) (10) (10) (10) (10) (10) (10)e Debt Coverage Ratio 1.6 1.6 1.6 1.7 1.7 1.8 1.8 1.9 1.9 2.0 2.0 2.1 2.1 2.2 2.2 2.3 2.3 2.4 2.4 2.4f Cash after debt service 6 6 7 7 7 8 8 9 9 10 10 11 11 12 12 13 13 14 15 1,022g Interest Payment (5) (5) (5) (5) (5) (4) (4) (4) (4) (4) (4) (4) (4) (4) (3) (3) (3) (3) (3) (3)h Taxable Income 1 1 2 2 3 3 4 4 5 6 6 7 7 8 9 9 10 11 12 1,019i Income taxj After Tax Cash (2,098) 6 6 7 7 7 8 8 9 9 10 10 11 11 12 12 13 13 14 15 1,022
k NPV (2,098) 5 6 6 6 6 6 6 6 6 6 6 6 6 6 6 6 6 6 6 385l Cum NPV (2,098) (2,093) (2,087) (2,082) (2,076) (2,070) (2,064) (2,059) (2,053) (2,047) (2,041) (2,035) (2,029) (2,023) (2,017) (2,011) (2,006) (2,000) (1,994) (1,988) (1,603)
Proforma Inputs Esc. Rate 2.5% Disc. Rate 5.0% MWH 335 Max KW 110 State Grants 147 Fed Grants 440
Energy Rate 125 $/MWH Avg. Power KW Rec Rate 25 $/MWH Demand 0 $/KW-mos O&M 0.015 c/kWh Prop Tax 0.0%Proforma Results
Pre-Tax, Cash on Cash PreTax, Cash on Cash IRR #NUM! Cum NPV (1,729) Discounted Pay Back 20Debt Levered, After-Tax Debt Levered, After Tax IRR #NUM! Cum NPV (1,603) Discounted Pay Back 20
Assumptions1 O&M: 1.5¢/KWH escalated at defined rate (see summary sheet)2 Major maintenance: $50k in years 5 & 15, $125k in years 10 & 20 Denotes cell input linked to Summary Tab3 Payment in Lieu of Property taxes: 1.5% of initial investment, escalated Denotes cell input linked to Individual Cost Tabs4 Insurance: 0.25% of initial investment, escalated Denotes summary results5 Residual Value: calculated growth rate of year 19 revenues (only if positive cashflows)6 Average Debt Coverage Ratio (DCR) set to 2.0 for all levered cases.
For Planning Purposes Only E Prov Proforma_3-7-2011.xlsx

Privileged and Confidential Ten Mile River Feasibility StudyPhase 1
Proforma F
No.Item/
Study Year0 1 2 3 4 5 6 7 8 9 10 11 12 13 14 15 16 17 18 19 20
1 Costs ($1,000's)a Initial Investment 3,277b O&M 6 6 6 6 6 7 7 7 7 7 7 8 8 8 8 8 9 9 9 9c Major Maintenance 23 23 24 24 25 25 26 27 27 28 29 30 30 31 32 33 33 34 35 36 37d Insurance 8 9 9 9 9 10 10 10 10 10 11 11 11 12 12 12 12 13 13 13e Payment in lieu of Property Taxes 0 0 0 0 0 0 0 0 0 0 0 0 0 0 0 0 0 0 0 0fg Subtotal, Costs 3,277 37 38 39 40 41 42 43 44 45 46 48 49 50 51 53 54 55 57 58 59
2 Revenues ($1,000's)a State Grants 164b Federal Grants 492c Energy 48 49 50 52 53 54 56 57 58 60 61 63 64 66 68 69 71 73 75 77d Recs 10 10 10 10 11 11 11 11 12 12 12 13 13 13 14 14 14 15 15 15e Avoided Distributionf Capacity/Demandg Residual Value 1,295h Subtotal, Revenues 655 57 59 60 62 63 65 67 68 70 72 74 75 77 79 81 83 85 87 90 1,387
3 Cashflows ($1,000's)a Nominal Dollars (2,622) 20 21 21 22 22 23 23 24 25 25 26 27 27 28 29 29 30 31 32 1,328b NPV (2,622) 19 19 18 18 18 17 17 16 16 16 15 15 14 14 14 13 13 13 13 500c Cum NPV (2,622) (2,602) (2,583) (2,565) (2,547) (2,530) (2,512) (2,496) (2,479) (2,464) (2,448) (2,433) (2,418) (2,404) (2,389) (2,376) (2,362) (2,349) (2,336) (2,324) (1,823)
4 Levered Cashflow ($1,000's)a Investment Cost 2,622b Equity 2,299c Net Operating Income 20 21 21 22 22 23 23 24 25 25 26 27 27 28 29 29 30 31 32 1,328d Debt Service (13) (13) (13) (13) (13) (13) (13) (13) (13) (13) (13) (13) (13) (13) (13) (13) (13) (13) (13) (13)e Debt Coverage Ratio 1.6 1.6 1.6 1.7 1.7 1.8 1.8 1.9 1.9 2.0 2.0 2.1 2.1 2.2 2.2 2.3 2.3 2.4 2.4 2.4f Cash after debt service 7 8 8 9 9 10 11 11 12 12 13 14 14 15 16 16 17 18 19 1,315g Interest Payment (6) (6) (6) (6) (6) (6) (6) (5) (5) (5) (5) (5) (5) (5) (4) (4) (4) (4) (4) (4)h Taxable Income 1 2 2 3 4 4 5 6 6 7 8 9 10 10 11 12 13 14 15 1,311i Income taxj After Tax Cash (2,299) 7 8 8 9 9 10 11 11 12 12 13 14 14 15 16 16 17 18 19 1,315
k NPV (2,299) 7 7 7 7 7 7 8 8 8 8 8 8 8 8 8 8 7 7 7 496l Cum NPV (2,299) (2,292) (2,284) (2,277) (2,270) (2,263) (2,255) (2,248) (2,240) (2,232) (2,225) (2,217) (2,210) (2,202) (2,194) (2,187) (2,179) (2,172) (2,164) (2,157) (1,661)
Proforma Inputs Esc. Rate 2.5% Disc. Rate 5.0% MWH 374 Max KW 104 State Grants 164 Fed Grants 492
Energy Rate 125 $/MWH Avg. Power KW Rec Rate 25 $/MWH Demand 0 $/KW-mos O&M 0.015 c/kWh Prop Tax 0.0%Proforma Results
Pre-Tax, Cash on Cash PreTax, Cash on Cash IRR -2.1% Cum NPV (1,823) Discounted Pay Back 20Debt Levered, After-Tax Debt Levered, After Tax IRR -2.1% Cum NPV (1,661) Discounted Pay Back 20
Assumptions1 O&M: 1.5¢/KWH escalated at defined rate (see summary sheet)2 Major maintenance: $50k in years 5 & 15, $125k in years 10 & 20 Denotes cell input linked to Summary Tab3 Payment in Lieu of Property taxes: 1.5% of initial investment, escalated Denotes cell input linked to Individual Cost Tabs4 Insurance: 0.25% of initial investment, escalated Denotes summary results5 Residual Value: calculated growth rate of year 19 revenues (only if positive cashflows)6 Average Debt Coverage Ratio (DCR) set to 2.0 for all levered cases.
For Planning Purposes Only E Prov Proforma_3-7-2011.xlsx