a comparison of dipterans from ten created and ten natural wetlands
TRANSCRIPT

WETLANDS, Vol. 16, No. 4, December 1996, pp. 416--428 © 1996, The Society of Wetland Scientists
A COMPARISON OF DIPTERANS FROM TEN CREATED AND TEN NATURAL WETLANDS
William J. Streever ~, Ken M. Pottier 2, and Thomas L. Crisman 3 Department of Biological Sciences
Universitn, o f Newcastle Callaghan, New South Wales, 2308 Australia
2 Department o f Statistics University o f Florida
Gainesville, FL 32611 USA
3 Department o f Environmental Engineering Sciences Universi~" o f Florida
Gainesville, FL 32611 USA
Abstract: This study compares densities of common larval dipterans collected from areas dominated by Pontederia cordata in t0 natural and 10 created freshwater herbaceous wetlands in central Florida. At each wetland, 7 core samples were collected from each of 5 stations during summer 1993. In addition, stem densities, vegetation areal coverage, pH, dissolved oxygen, water temperature, water depth, conductivity, sediment quality, and leaf litter were measured at 3 locations near each of the 5 stations in each wetland. Of the 57 dipteran taxa collected, 20 occurred with sufficient abundance to justify statistical comparison. Despite a large sampling effort, there were no significant differences in densilies of 20 commonly occurring taxa found in created and natural wetlands after considering the effect of multiple univariate tests. Compar- ison of environmental variables showed significant differences in stem densities for vegetation other than P, cordata, pH, conductivity, and sediment quality. Canonical correspondence analysis, used to relate environ- mental and biological variables, suggests that pH, conductivity, and sediment quality are only weakly related to dipteran community structure. Despite differences in environmental conditions, there is no convincing evidence of differences in natural and created wetland dipteran communities.
Key Words: created wetlands, diptera, Florida, herbaceous wetlands
INTRODUCTION
One approach to a better understanding of the ability of created wetlands to replace the structure and func- tions of natural wetlands uses comparisons of natural and created systems. Comparative work includes both routine monitoring required by mitigation permits and more extensive studies by university and government scientists (Quammen 1986). Although many compar- isons focus on plant communities (Kentula et al, 1993), a need for investigations of additional aspects of wetland ecosystems has been widely recognized (Ewel 1987, Erwin 1990. Zedter and Langis 1991, Streever and Crisman 1993a, Streever and Crisman 1993b, Zedler 1993). Monitoring programs required by government permits sometimes call for collection of water quality and invertebrate population data, while more extensive studies have examined fish (Streever and Crisman 1993a), infauna (Streever and
Crisman 1993b, Sacco et aL 1994), benthic macroin- vertebrates (Florida Department of Environmental Pro- tection 1994), nutrient cycling (Langis et al. 1991, Zedler and Langis 1991, Duncan and Groffman 1994), and wildlife habitat suitability (Zedler 1993).
Both monitoring programs and extensive studies suffer from several problems. In many monitoring pro- grams, a small number of samples from a single cre- ated wetland and a single natural "reference" or "con- trol" wetland are compared through qualitative as- sessment, graphical representation, and application of indices of similarity and diversity. This approach ig- nores variability among different wetlands and does not fully ccmsider variability within individual wet- lands. For studies in which sampling is limited to a single created wetland or a single natural wetland, con- clusions regarding the ability of created wetlands to mimic natural wetlands suffer from pseudoreplication (Hurlbert 1984). Even when multiple created and nat-
416

Streever et al., NATURAL AND CREATED WETLAND DIPTERANS 417
ural wetlands are sampled, inadequate sampling effort within or among wetlands coupled with high variabil- ity among samples may lead to low statistical power (Peterman I990, Streever and Portier 1994).
Researchers comparing biological communities of created and natural wetlands must choose some char- acteristic for comparison. Biological communities may differ because of differential biotic and abiotic condi- tions (Hutchinson 1957) or because of poor initial re- cruitment of species into created wetlands (Godwin 1923, McClanahan 1983, S t reever and Cr isman 1993a), If a comparison is undertaken simply to de- termine the degree to which certain characteristics in created wetlands mimic natural wetlands, the cause of any differences may be irrelevant. However, when some characteristic of the created wetlands is chosen to act as an indicator of functional similarity to natural systems, differences caused by poor initial recruitment may be misleading.
Our choice of dipteran larvae as the community characteristic to be sampled was based on the belief that these insects readily colonize newly created hab- itats if conditions are suitable (Nursall 1952, Driver 1977, Danell and Sjoberg 1982). Differences in dip- teran communities of created and natural wetlands, if they exist, may reflect functional differences instead of poor initial recruitment. Also, dipteran larvae are known to provide important forage for birds and other vertebrates (Whitman 1976, Danell and Sjoberg 1982, Maher and Carpenter 1984, Krapu and Reinecke 1992, Batzer et al. 1993) and to play a role in the develop- ment of physical and chemical properties of wetland soils (Fisher 1982).
In this study, we compare larval dipteran densities from natural and created freshwater wetlands in central Florida's phosphate mining region. Our design pro- vides 1) representative sampling within stands of P o n - teder ia corda ta in individual wetlands, 2) replication of created and natural wetlands, 3) a sampling effort capable of providing reasonable statistical power, and 4) a comparison based on an insect order that may reflect functional similarity between created and nat- ural wetlands. Because of the large number of samples required to adequately compare natural and created wetlands at a single point in time, we did not look at interseasonal or intraseasonal differences. Stem den- sities, areal cover by vegetation, water temperature, water depth, pH, conductivity, dissolved oxygen, sed- iment quality, and leaf litter were measured to supple- ment comparisons of dipteran densities.
METHODS Study Area
Central Florida's phosphate mining industry (lati- tude 28°N, longitude 82°W) has been active since the
discovery of phosphate pebbles in the Peace River in 1881 (Florida Phosphate Council 1991). In addition to mining, the region supports cattle ranching, citrus farming, and vegetable farming. A cool winter dry sea- son and a warm summer wet season characterize the climate (Chen and Gerber 1990). A mosaic of rivers, lakes, and wetlands along with upland pine, hardwood, and palmetto scrub communities characterizes pre- mining land cover. To extract phosphate, miners re- move 3 to 20 m of sand and clay overburden, leading to dramatic changes in substrate structure, water tables, drainage patterns, and biological communities. Phos- phate mining in Florida has destroyed about 5,400 ha of natural wetlands, with subsequent construction or planned construction of an equivalent area of created wetlands at over 130 sites (Florida Phosphate Council 1991, 1994).
Following completion of mining operations, areas intended for wetland creation are contoured to provide appropriate topography. Contoured lands are usually capped with surface sediments, or overburden, col- lected and stockpiled before mining. In addition, sites are usually "mucked" or "mulched" with substrate collected from nearby natural wetlands slated for de- struction by mining. Planting and natural seed recruit- ment supplement seed banks provided by mucking. Mechanical and chemical control of undesirable plm~t species and remedial planting of desired wetland plant species is sometimes necessary. Success criteria tbr individual wetland creation projects are formulated by state regulators and industry representatives and typi- cally include specilic hydrologic requirements, stipu- lations for areal cover by desirable wetland plant spe- cies, and some level of botanical similarity to a nearby reference wetland (Erwin 1990).
To compare dipteran densities in wetlands created by the phosphate industry to dipteran densities in near- by natural wetlands, 10 created and 10 nalural wet- lands were sampled (Figure 1). All wetlands included in this study are classified as palustrine, emergent, per- sistent, semi-permanently flooded wetlands (Cowardin et at. 1979). Because dipteran communities differ among plant communities (Streever et aL t995), only sites with patches of the common plant species P. cor- data were sampled. Created wetlands were chosen in part because of accessibility. Natural wetlands were chosen in part on the basis of proximity to created wetlands and in part on the basis of accessibility. The greatest distance between any two study sites was ap- proximately 33 kin. Created wetlands were named af- ter the year of completion of construction, defined as the year during which the system was flooded or dur- ing which the last known major alteration to the sys- tem, such as replanting, occurred. Thus, the wetland named 1982 was created in 1982. When two created

418 WETLANDS, Volume 16, No. 4, 1996
ii
t~
1989b
II
i~b L99~ 1990b N5 N7 N2
I'/6
1~5~9t S
Figure I. Locations of 10 natural and 10 created freshwater herbaceous wetlands. Labels for created wetlands indicate the year of construction, while natural wetlands are labeled N1 through N10.
wetlands shared a date of construction, dates were ar- bitrarily appended with the letter a or b, as in "1989a" and "1989b." Natural wetlands were arbitrarily named N1 through NI0 , Sizes of created wetlands varied f rom about 1 to 80 ha, while sizes of natural wetlands varied from about 1 to 50 ha. Land-use surrounding both created and natural wetlands included cattle ranching, vegetable farming, roads, and conservation easements supporting hardwood forests. Created wet- lands were sometimes adjacent to land in the early stages of post-mining recovery, whereas natural wet- lands were sometimes adjacent to land undergoing preparation for mining.
Field Methods
At each of the 10 created and 10 natural wetlands, 5 stations were randomly chosen from areas with P. cordata. Seven samples were collected within 10 m of each station, yielding 700 samples. When patches of P. cordata were interspersed with other plants or open water, samples were intentionally collected f rom with- in the patches of P. cordata. A priori power analysis of pilot data (Streever and Portier 1994) and an esti- mate of the number of samples required to adequately represent individual wetlands (Streever and Bloom 1993.) dictated the number of samples. One wetland was sampled per day from 26 July to 14 August 1993, with created and natural wetlands sampled on alternate days. To collect each sample, a 5-cm-diameter core
tube was pushed 20-25 cm into the sediment. Material f rom the core tube was washed through a #30 sieve (595-~tm openings) and preserved in 80% ethanol stained with rose bengal. Although some dipterans, es- pecially early instars, may pass through #30 sieves, smaller mesh sizes clogged with sediment and pre- vented even minimal sieving of material before sort- ing. All animals were handpicked from the preserved samples. After picking, leaf litter and sediment from each sample were examined for animals that may have been overlooked. I f animals were found during the fol- low-up examination, samples were repicked.
All dipteran larvae were mounted on slides for iden- tification to the lowest practicable taxonomic level us- ing keys provided by Webb and Brigham (1982), Bree~ land and Loyless (1983), Cranston et al. (1983), Fitt- kau and Roback (1983), Pinder and Reiss (1983), Byers (1984), Coffman and Ferrington (1984), New- son (1984), Teskey (1984), and Epler (1992). Chiro- nomidae, Chaoboridae, and Culicidae were usually identified to genus, while identification levels for other families depended on available taxonomic information and the degree to which features described in keys matched specimens. Morphologically similar speci- mens not named in available keys were assigned ar- bitrary names, such as " 'Unknown chironomid 1" and "Tipulid t . " Two mosquito genera, Mansonia and Co- quitlettidia, were too similar for consistent separation at the genus level, so all specimens were identified as

Streever et al., N A T U R A L AND CREATED W E T L A N D DIPTERANS 419
Mansonia spp. Specimens that were badly damaged during processing were not identified.
At each station, stem densities and estimated percent areal cover for each plant taxon were measured at 3 ran- domly chosen locations within patches of P. cordata. Similarly, measurements of temperature, pH, conductiv- ity, dissolved oxygen, water depth, sediment quality, and leaf litter were taken at 3 randomly chosen locations within patches of P. cordata around each station. Veg- etation, physical, and chemical measurements are re- ferred to as measurements of environmental variables. The decision to take 3 measurements at each station was based on time constraints. Stern densities were measured by counting the number of living stems within a 0.5 m 2 quadrat, and percent areal cover within each quadrat was visually estimated. Because of their growth habit, only percent areal cover estimates were collected for Lemna spp., Utricularia spp., and Salvinia minima. Vegetation was identified following Dressier et at. ( 1991 ). Temper- ature, pH, dissolved oxygen, and specific conductance were measured with meters. Water depth was measured with a meter stick. Sediment quality was ranked, with sand or clay sediments lacking organic material given a value of 0, sediments consisting of some organic material mixed with sand and clay given a value of 1, and sedi- ments consisting almost entirely of organic material giv- en a value of 2. Leaf litter was also qualitatively ranked, with 0 assigned to areas without leaf litter, 1 assigned to areas of thin and sporadic leaf litter, and 2 assigned to areas with leaf litter completely covering underlying sub- strate.
Statistical Methods
Analysis involved both univariate and multivariate methods. Univariate analyses included comparisons of 1) densities of commonly occurring dipteran taxa from created and natural wetlands and 2) environmental variables, including stem densities and percent areal cover for vegetation and measurements of chemical and physical variables from created and natural wet- lands. Commonly occurring dipteran and plant taxa were defined as those that occurred in at least 5% of the samples, Dipteran and plant taxa occurring in few- er than 5% of the samples were pooled into a single group and ca]led "'other Diptera" and "'other plants," respectively. The decision to limit analysis to com- monly occurring taxa was based on concerns regarding the ability of our sampling method to represent un- common taxa (Clifford and Stephenson 1975, Boesch 1977). The transformation y = (x) ~ + (x + 1)% rec- ommended for data containing counts of 0 (Freeman and Tukey 1959), was applied to dipteran and stem density data, and the transformation y = arcsin[(x/ 100)~], r e c o m m e n d e d for p e r c e n t a g e values (Zar
1984), was applied to vegetation areal coverage esti- mates. For each univariate test, the null hypothesis un- der consideration was that no difference existed be- tween created and natural wetlands.
Assumptions of parametric analyses were assessed by plotting residual values against predicted values and residual values against the main effect, wetland type. Only four of the dipteran taxa density data sets met assumptions allowing parametric analysis. All oth- er dipteran density data sets were pooled for each wet- land, then comparisons of created and natural wetlands were performed using the nonparametric Wilcoxon rank sum test ISAS Institute Inc. 1985). All trans- formed vegetation data and the chemical and physical data, except qualitative assessments for sediment and leaf litter, met the assumptions for parametric analysis. Sediment and leaf litter qualitative values were aver- aged for individual wetlands, and comparisons of nat- ural and created wetlands were made using the Wil- coxon rank sum test.
For data meeting the assumptions required for para- metric analysis, a nested ANOVA design was used. Nested designs are appropriate when sources of vari- ability are hierarchically related (Green 1979). A four- part hierarchy was present: 1) wetland type, either cre- ated or natural, was placed at the top of the hierarchy, 2) individual wetlands of each type were nested below wetland type, 3) stations within each wetland were nest- ed below individual wetlands, and 4) samples from each station were nested below stations. An',dyses were per- formed using the Mixed Procedure (SAS Institute Inc. 1992), which is intended to analyze data with variances from both fixed and random effects. The wetland type was considered a fixed effect while individual wetlands, stations, and samples were considered random effects (Zar 1984, Bennington and Thayne 1994),
Canonical correspondence analysis, a direct gradient ordination method, was used to relate measurements of environmental variables to dipteran density (Ter Braak 1986, 1988). To limit the effect of outliers, the analysis used transformed dipteran densities, stem den- sities, and areal coverage estimates for vegetation. For each wetland, data from individual samples and sta- tions were averaged, providing a single data point for each variable in each of the natural and created wet- lands. In canonical correspondence analysis, ordina- tion axes based on taxonomic composit ion are restrict- ed to linear combinations of environmental variables, thus allowing interpretation of dipteran communi ty composit ion on the basis of environmental variables.
RESULTS Diptera
Fifty-seven dipteran taxa were represented in the samples, but only 19 taxa occurred in greater than 5%

420 W E T L A N D S , V o l u m e 16, No. 4, 1996
Table 1. Dipteran taxonomic composition in 10 created and 10 natural freshwater herbaceous wetlands.
Taxon
Number of Sites with at Least
Mean Number One of Individuals Occurrence
m-2 Crea- Natu- Created Natural ted rat
Wet- Wet- Wet- Wet- lands lands lands lands
Chironomidae Larsia 2136.1 3749.9 Monopetopia 877.4 873.1 Polypedilum 774.1 1628.3 Chironomus 343.4 139,7 Glyptotendipes 240.1 10.2 Tanytarsus 164.4 90.2 Labrundinia 106.2 52.4 Natarsia 96.0 141.2 Goeldichironomus 88.8 8.7 Lauterborniella 74.2 0 Ablabesmyia 58.2 80.0 Dicrotendipes 45.1 33.5 Tanytarsini A Roback 40.7 14.6 Kiefferufus 34.9 133.9 Tanypus 32.0 5.8 Pseudochironomus 30.6 4.4 Brillia 29.1 0 Unknown chironomid 2 23.3 0 Zavretietla 17,5 30.6 Paratanytarsus 17.5 1.5 Fittkauimyia 11.6 23.3 Parachironomus 10.2 1.5 Paratendipes 8.7 29.1 Clinotanypus 7.3 0 Nimbocera 4.4 0 Pseudosmittia 2.9 0 Paramerina 2.9 4.4 Cladotanyrarsus 1.5 0 Djalmabatista 1.5 0 Guttipelopia 0 23.3 Procladius 0 5.8 Unknown chironomid 1 0 4.4 A cricotopus 0 2.9 Cfadopelma 0 1.5
Ceratapagonidae Ceratopogoninae 1655.9 2278.7 Dasyhelea 922.6 211.0 Forcipomyia 46.6 109.1 Atrichopogon 1.5 0
Tipulidae Tipulid 2 74.2 33.5 Tipulid 5 23.3 20.4 Tipulid 3 18.9 7.3 Tipulid 4 11.6 27.7
10 8 9 9
10 10 9 7 7 4 9 7 6 4 8 7 7 4 1 0 6 8 2 4 5 4 6 6 5 3 6 1 I 0 1 0 6 6 1 1 2 5 3 1 2 4 2 0 3 0 t 0 2 2 1 0 1 0 0 1 0 1 0 2 0 2 0 1
10 10 10 8 8 9 1 0
5 3 7 5 4 4 3 7
Table 1, Continued.
Taxon
Number of Sites with at Least
Mean Number One of Individuals Occurrence
m-2 Crea- Natu- Created Natural ted ral
Wet- Wet- Wet- Wet- lands lands lands lands
Tipulid l 5.8 5.8 3 2 Tipulid 6 1.5 5,8 1 2
Culicidae Urotaenia 97,5 82.9 9 6 Mansonia 80.0 10 i .9 6 7 Culex 65.5 27.7 6 5 Anopheles 0 1.5 0 1
Chaoboridae CorethreIla 21.8 42.2 3 6 Chaoborus 1.5 4.4 1 2
Stratiomyidae 53.8 27.7 7 7 Ephydridae 34.9 7.3 6 2 Tabanidae 14.6 52.4 5 9 Muscidae 2,9 4.4 2 2 Empididae 1.5 0 1 0 Psychodidae 1.5 0 I 0 Syrphidae 1.5 4.4 1 2
o f the s a mp le s (Table 1). Pol_vpedilum spp. and the sub fami ly C e r a t o p o g o n i n a e c o m p r i s e d ove r 53% o f all d ip te rans co l l ec t ed in this s tudy, and they rep resen ted the only t axa found in all 20 o f the wet lands sampled . S ix t axa were en t i re ly absent f rom the c rea ted we t l and samples , and 1 1 t axa were ent i re ly absent f rom the natural we t l and samples . I f the ef fec t o f pe r fo rming mul t ip le un iva r ia te tests is not cons idered , mean den- s i t ies o f Glyptotendipes spp. and Dasyhelea spp. were s ign i f ican t ly h igher in c rea ted we t l ands than in natural wet lands , and mean dens i t ies o f Taban idae were sig- n i f icant ly h igher in natural we t l ands (F igure 2). No s igni f icant d i f fe rences were found for o ther taxa. Ex- amina t ion o f mean va lues sugges t s ne i ther t rends to- ward d i f fe rences that cou ld not be de tec ted or t rends re la ted to c rea ted we t l and age.
P1 ants
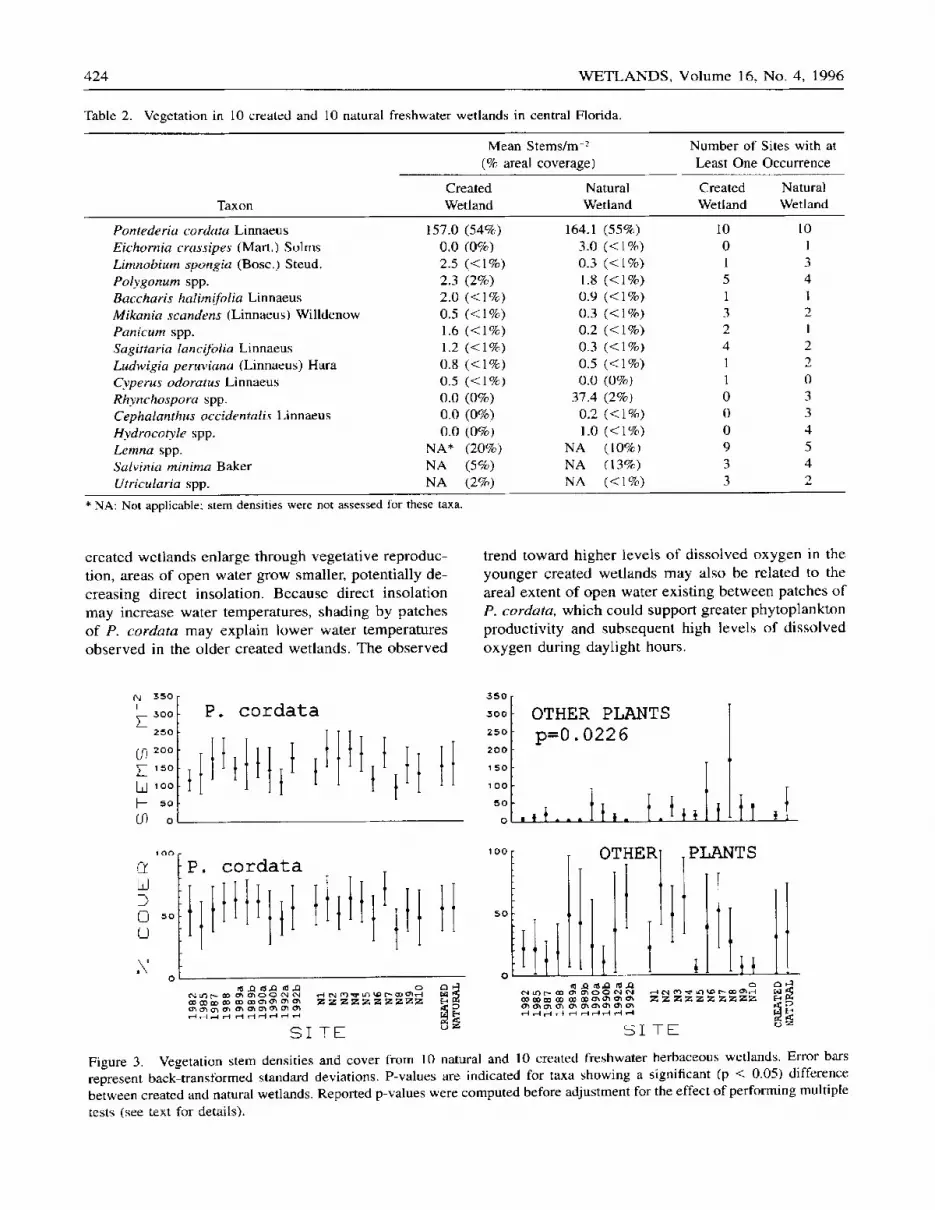
A l t h o u g h all s amples were co l lec ted f rom areas d o m i n a t e d by P. cordata, other p lan t taxa were fre- quent ly encoun te red wi thin quadra t s (Table 2). Mean s tem dens i t ies and areal cove rages o f P. cordata var ied c o n s i d e r a b l y bo th wi th in and be tw e e n wet lands , but mean va lues f rom crea ted we t l ands were r emarkab ly

Streever et al., N A T U R A L AND C R EATED W E T L A N D DIPTERANS 421
similar to those from natural wetlands (Figure 3). There were no significant differences in either mean P. cordata stem densities or areal coverage estimates. Plant taxa other than P. cordata generally occurred in low mean stem densities and areal coverages, with no- table exceptions existing for Lemna spp., Satvinia spp., and Rhynchospora spp. Both Lemna spp. and Salvinia spp. are small, floating aquatic plants that frequently grow beneath emergent vegetation. The high mean stem density in the natural wetlands was caused by high counts for Rhynchospora spp., an emergent sedge, in a single wetland, N8. The growth habit of Rhynchospora spp. inflates its importance when only stem densities are considered. A statistically significant difference was present for stem densities of plants oth- er than P. cordata but not for their areal coverages (Figure 3). If stem densities for Rhynchospora spp, are excluded from the analysis no significant difference is present. It is important to note that these results were not intended to represent the entire plant communit ies found in the wetlands. The intent of vegetation sam- pling was to establish the degree of similarity of the physical habitat provided for dipterans within patches of P. cordata.
Chemical and Physical Conditions
Chemical and physical data collected within patches of P. cordata show significant differences in pH, con- ductivity, and sediment quality between created and natural wetlands, while no significant differences are p resen t for t empera tu re , d i s so lved oxygen , wa te r depth, and leaf litter (Figure 4). Means and standard deviations of leaf litter estimates suggest that differ- ences may be present at some level below the detection limit of the Wilcoxon rank sum test. However, this trend is driven primarily by the two youngest created wetlands, each about 1.5 years old, in which leaf litter was essentially absent. Some trends among the created wetlands may be related to age. Temperature and dis- solved oxygen generally appear lower in older created wetlands, while organic content of sediments is gen- erally higher in older created wetlands.
Canonical Correspondence Analysis
Canonical correspondence analysis was used to detect relationships between measurements of environmental variables and dipteran densities. In canonical correspon- dence analysis, ordination axes based on dipteran density are limited to linear combinalions of environmental data (Ter Braak 1986). The first ordination axis accounted for 20.4% of the total variance, while the second ordination axis accounted for 16% of the total variance. No addi- tional axis accounted for more than 10% of the remain-
ing variance. Figure 5 represents these results as a biplot, in which the relative lengths and directions of the vectors for environmental variables indicate the strength of cor- relations between the environmental variables and the dipteran densities. Based on these vectors, stem densities and vegetation areal coverage, water temperature, and leaf litter have the strongest relationships to dipteran community structure.
DISCUSSION
Because density differences were found in only 3 of the 20 dipteran taxa (Glyptotendipes spp., Dasyhelea spp., and Tabanidae), the effect of performing multiple univariate tests on Type I error rates should be con- sidered. In Type I errors, the null hypothesis of no difference between created and natural wetlands is in- correctly rejected. Adjustments to Type I error rates that account for the effect of performing 20 tests (Marks 1990) yield p-values of 0.51, 0.18, and 0.13 for Glyptotendipes spp., Dasyhelea spp., and Tabani- dae, respectively, indicating that differences between created and natural wetlands are not significant.
After accounting for the effect of multiple tests, probabilities of Type I errors for sediment quality, con- ductivity, and pH are 0.002, 0.03, and 0.003, respec- tively; thus, differences are convincing. Lower levels of organic material found in qualitative assessments of created wetland sediments may be related to the short time during which organic soils have been developing in these systems. Because decomposit ion of organic material releases CO2, lower pH values would be ex- pected in natural systems with well-developed organic soils (Wetzel 1983). A well-developed organic sub- strate may isolate surface water from underlying sand and rock, leading to decreased dissolution of minerals and lower conductivity, in addition, uplands surround- ing created wetlands usually consist of previously mined lands with disturbed soils, so runoff entering created wetlands may be carrying large quantities of dissolved material that would increase conductivity (Kiefer 1991). If differences are related to develop- ment of organic material in created wetlands, pH and conductivity should approach values more typical of natural systems with the passage of time. Although a trend toward increased organic content with site age is apparent (Figure 4), there is no corresponding trend toward a decrease in pH and conductivity. The re- sponse of pH and conductivity may be delayed or site- specific attributes may override age-related develop- ment of organic soils.
Additional age-related trends in chemical and phys- ical parameters include apparent decreases in temper- ature and dissolved oxygen with age of created wet- lands (Figure 4). As patches of P. cordata in older

422 W E T L A N D S , Vo lume 16, No. 4, 1996
6 0 0
5 0 0
400
3 0 0
200
100
0
ABLAB E SMY IA
1 6 0 0 0
1 2 0 0 0
8 0 0 0
4 0 0 0
O
CERATOPOGONINAE
tt
I
E
(/)
<E
D H
H
Q E H
3 0 0 0
2 5 0 0
2 0 0 0
1 5 0 0
1000
5O0
0
7 0 0 0
6000
5 0 0 0
4 0 0 0
3 0 0 0
2 0 0 0
rOOO
0
3 5 0 0
3 0 0 0
2 5 0 0
2 0 0 0
1 5 0 0
1 0 0 0
5 0 0
.{.
CHIRONOMUS
DASYHELEA p=0.0101
GLYPTOTENDIPES p=0.0355
. . . . ~ . ~ . ~ , , . . . ~ ~,
2 5 0
2.00
1 5 0
1 0 0
5 0
0
CORETHRELLA
.500
4 0 0
3 0 0
2 0 0
100
0
DICROTENDI PES
I, {{
SO0
500
400
300
200
100
0 : : I ., {
GOELDI CH I RONOMUS
1 5 0 0
1 2 5 0
1 0 0 0
7 5 0
5 0 0
2 ~ 0
0
KIEFERULUS
LABRUNDINIA 7 0 0 I
6 0 0
5 0 0
4 0 0
3 0 0
2 0 0
100
0
SITE u SITE
Figure 2. Dipteran densities from 10 natural and 10 created freshwater herbaceous wetlands. Error bars represent back- transformed standard deviations. P-values are indicated for taxa showing a significant (p < 0.05) difference between created and natural wetlands. Reported p-values were computed belore adjustment for the effect of performing multiple tests; following adjustment for the effect of performing multiple tests, no differences were statistically significant (see text for details).

Streever e t al., NATURAL AND CREATED W E T L A N D DIPTERANS 423
2 0 0 0 0
~ 6 0 0 0
1 2 0 0 0
8 0 0 0
4 0 0 0
0
7 0 0
LARS IA ~ ° °
500
400
MANSONIA
(N I
E
7 0 0 0
6000
50~0
4 0 0 0
3OOO
2000
1 0 0 0
0
MONOPELOPIA ~ 4 0 0
~ 2 0 0
1 0 0 0
8 0 0
6 0 0
4 0 0
2 0 0
0
NATARS IA
. . . i . , _ ~
U) __J
N D
N H
12000
i o 0 0 0
~ 0 0 0
6 0 0 0
4 0 0 0
2 0 0 0
0
200
150
100
50
POLYPEDILUM
TABAN I DAE p=0. 0073
; : c ~ c
5 0 0
, 4 0 0
3 0 0
2 0 0
100
O
1 2 0 0
1 0 0 0
8 0 0
6 0 0
4 0 0
2 0 0
0
STRATIOMYI DAF.
I | : I : : • • Im s
iP a
TANYTARSUS
700
5 0 0
500
4ooi 3 0 0 i
2 0 0
1 0 0
0
UROTAENIA
J @ = : . =
SI TE u
5 0 0 0
4 0 0 0
3 0 0 0
2 0 0 0
1 0 0 0
0
OTHER DIPTERA
SI TE
Figure 2. Continued.
424 W E T L A N D S , Volume 16, No. 4, 1996
Table 2. Vegetation in 10 created and 10 natural freshwater wetlands in central Florida.
Mean Stems/m : (% areal coverage)
Number of Sites with at Least One Occurrence
Created Natural Created Natural Taxon Wetland Wetland Wetland Wetland
Pontederia cordata Linnaeus Eichornia crassipes (Mart,) Solms Limnobium spongia (Bosc.) Steud. Polygonum spp. Baccharis halim!folia Linnaeus Mikania scandens (Linnaeus) Willdenow Panicum spp. Sagittaria lancifotia Linnaeus Ludwigia peruviana (Linnaeus) Hara Cyperus odoratus Linnaeus Rhynchospora spp. Cephatanthus occidentalis Linnaeus Hydroco~'le spp. Lemna spp. Salvinia minima Baker Utricutaria spp.
157.0 (54%) 164.1 (55%) 10 10 0,0 (0%) 3.0 (<1%) 0 I 2.5 (<1%) 0.3 (<1%) 1 3 2.3 (2%) 1.8 (< 1%) 5 4 2.1) (<1%) 0.9 (<1%) 1 I 0.5 (<1%) 0.3 (<1%) 3 2 1.6 (<1%) 0.2 (<1%) 2 I 1.2 (<1%) 0.3 (<1%I 4 2 ll.8 (<1%) 0.5 (<1%) 1 2 0.5 (<1%) 0.0 (0%} 1 0 0.0 (0%) 37.4 (2%} 0 3 0.0 (0%) 0.2 ( < i % ) 0 3 II.0 (0%) 1.0 (<1%) 0 4
NA* (20%) NA (10%) 9 5 NA (5%) NA (13%) 3 4 NA (2%) NA (< 1%) 3 2
* NA: Not applicable; stem densities were not assessed for these taxa.
created wet lands enlarge through vegetat ive reproduc- tion, areas of open water grow smaller, potent ia l ly de- creasing direct insolat ion. Because direct insolat ion may increase water temperatures, shading by patches of P. cordata may explain lower water temperatures observed in the older created wetlands. The observed
trend toward higher levels of dissolved oxygen in the younger created wet lands may also be related to the areal extent of open water exist ing be tween patches of P. cordata, which could support greater phytoplankton product ivi ty and subsequent high levels of d issolved oxygen dur ing dayl ight hours.
64 ~50 I 7- 300
250
200
y- 1 5 0
LI~ 1 0 0
I-- ~o O~ o
P. cordata 350
300
250
200
~50
100
5O
OTHER PLANTS p=0.0226
I.I),I ,t l O O
W
Q so 0
.X'
P. cordata tI t)tttt tt 1 0 0
5 0
S I T E
OTHER PLANTS
r..i r 4 r - t v~t , -4
S I T E
Figure 3. Vegetation stem densities and cover from l0 natural and 10 created freshwater herbaceous wetlands, Error bars represent back transtormed standard deviations, P-values are indicated for taxa showing a significant (p < 0.05) difference between created and natural wetlands. Reported p-values were computed before adjustment for the effect of performing multiple tests (see text for details).

Streever et al., N A T U R A L A N D C R E A T E D W E T L A N D D I P T E R A N S 425
2~
27
2 6
0 ~ ' 4 i
t
8 . 0
7 , 5
T . O
. ~-0:
5.0
tt
' : t O O
t t p=O. 0005 03 . o o
~ 0 0
t { ,oo o
p=O. 0043
• il ½ s • II !
D
©
,---4
\
E
8
?
5
.4
0
A
E U
V
N LJ n
7O
8 O
4O
2 0
~ 0
0
t
z . s " 4 2 . s
f ttl t t tt t 4~ 2° p=O 0003 . . . . . . . " <E
"t tl " t l" "" ~-- o . o : = ; ; = ~ o .o
E L ] r'~ r"l r..I r '1 .,.~ ,.4 .,-~ r ' l v-4 ,r-4 r"t ~ " ~,-I ,...4 v-I ,..I .~..4 r ~ ~'4 ~-'l
03 SITE o~ SITE o
Figure 4. Measurements of chemical and physical variables from 10 natural and 10 created freshwater herbaceous wetlands. Sediment quality was ranked, with sand or clay sediments lacking organic material given a value of 0, sediments consisting of some organic material mixed with sand and clay given a value of 1, and sediments consisting almost entirely of organic material given a value of 2. Leaf litter was also qualitatively ranked, with 0 assigned to areas without leaf litter, 1 assigned to areas of thin and sporadic leaf litter, and 2 assigned to areas with leaf litter completely covering underlying substrate. P-values axe indicated for variables showing a significant (p < 0.05) difference between created and natural wetlands. Reported p-values were computed before adjustment for the effect of performing multiple tests (see text for details).
The absence o f a trend toward increased litter ac- cumulation corresponding to increased wetland age is surprising. One possible explanation is that leaf litter accumulation rapidly stabilizes fo l lowing one or two seasons o f growth, after which site-specific conditions determine the degree o f litter accumulation. This would explain the low levels o f litter found in 1992a
and 1992b and the absence o f pattern among the eight older created wetlands. Possible site-specific condi- tions that could control litter accumulation include productivity levels, decompos i t ion rates, extent o f her- bivory, and occurrence o f fire.
Because biotic communit ies are generally thought to be structured to some extent by their abiotic envi-

426 WETLANDS, Volume 16, No. 4, 1996
1989b \
I ~ AXIS I i 1990b ~ N8
1988 -'~ OTI-IER STEMs \. 1990a
1987 ~ ~ 1992 1985 N9
N10 ~'%
Figure 5. Canonical correspondence analysis biplot, in which ordination axes based on dipteran densities are limited to linear combinations of environmental data. The strength of the relationship between environmental variables and the ordination based on dipteran densities is indicated by the relative length of environmental vectors.
ronment, the absence of differences between dipterans found in created and natural wetlands requires some explanation. Canonical correspondence analysis was used to relate patterns based on dipteran densities to measured environrnental variables (Figure 5). The low variance explained by the first two axes of the canon- ical correspondence analysis (20.4% and 16.0%, re- spectively) suggests that the environmental variables measured in this study played only a limited role in structuring dipteran communities. Microhabitat differ- ences within individual wetlands and stochastic events may play more of a role than measured environmental differences in structuring dipteran communities. Fur- thermore, the environmental variables most strongly related to taxonomic composit ion are generally those that were not significantly different for the natural and created wetlands. Relatively long vectors in Figure 5 represent leaf litter, P. cordata stem counts, P. cordata percent cover, percent cover by vegetation other than P. cordata, and temperature, none of which were sig- nificantly different in natural and created wetlands. O f the four environmental variables that were significant-
ly different in natural and created wetlands, only the stem counts for vegetation other than P. cordata ("oth- er s tems" in Figure 5) seem to have a reasonably strong relationship to dipteran densities.
Because conditions such as pH, DO, conductivity. and temperature within an individual wetland can vary dramatically over a short time, dipterans inhabiting these habitats must have wide tolerance limits to these conditions. Reported environmental tolerances for var- ious dipteran taxa supporl this view (Fittkau and Ro- back 1983, Pinder and Reiss 1983, Epler 1992). Be- cause congeneric species may have different tolerances for environmental conditions (Hushes 1966, Scudder 1983, Waterhouse and Farrell 1985, Hall and Ice 1987), species-level identification may have detected differences in dipteran densities between created and natural wetlands. However, consistently reliable spe- cies-level identification of large numbers of dipteran larvae is problematic, and some species are entirely undescribed as larvae (Epler 1992). Furthermore, tol- erance ranges of individuals and populations within a

Streever et al., N A T U R A L A N D C R EATED W E T L A N D DIPTERANS 427
single species may vary, just as tolerances vary within a genus,
No convincing differences in dipteran densities were found within stands of P. cordata in created and nat- ural freshwater herbaceous wetlands in central Flori- da's phosphate mining district. Consistent differences in dipteran communi ty structure, had they occurred, may have indicated shortcomings in the ability of cre- ated wetlands to mimic natural wetlands. However, ab- sence of consistent differences does not indicate com- plete functional similarity, Clear differences exist in chemical and physical conditions of created and nat- ural wetlands, even within similar plant communities. These results suggest that created wetlands may mimic some of the structure and function of natural wetlands despite obvious differences in physical and chemical conditions. Wetland biota that are tolerant of a wide range of conditions may live in created wetlands that are not duplicates of natural systems. In a comparison of six created and six natural North Carolina salt marshes, Sacco et al. (1994) found clear differences in soil organic content but only limited differences in in- faunal communities. Like dipterans and infauna, many higher taxa associated with wetlands may express a wide niche breadth. For example, river otters appear to use many types of wetlands without preference for any one type (Newman and Griffin I994), and least terns may abandon established nesting sites in natural wetlands to colonize recently constructed sewage la- goons (Alleng and Whyte-Alleng 1993).
We recommend that researchers continue to compare wetlands to identify structural and functional disparities between created and natural wetlands. Future research should assess partial functional equivalence, allowing for high similarity between some characteristics, yet identi- fying clear differences for others. In addition, studies should be designed to compare emergent properties, such as ecosystem resilience and resistance. Further compar- isons of dipteran communities in the freshwater herba- ceous wetlands of central Florida's phosphate mining district may be of limited usefulness unless specific rea- sons exist for suspecting differences.
A C K N O W L E D G M E N T S
This paper comprises part of W. J. Streever's Ph.D. dissertation work at the University of Florida's De- partment of Environmental Engineering Sciences. We thank Dr. G. Ronnie Best for the many hours of dis- cussion and guidance that he provided throughout this study. Phosphate mining c o m p a n y represen ta t ives John Kiefer, Selwyn Presnell, Doreen Donavan, and Rosemarie Garcia provided site tours and facilitated access to private property. Christine Keenan and An- drea Leslie provided assistance with field work. Fi-
nancial support for this work came from a National Science Foundation Graduate Research Fellowship to W. J. Streever and from a grant awarded by the Florida Institute for Phosphate Research. Mark Clark and two anonymous reviewers provided valuable comments re- garding an early draft of this paper.
L ITERATURE CITED
Alleng. G.E and C.A.M. Whyte-Atleng. 1993. Survey of least tern nesting sites on the south coast of Jamaica. Colonial Waterbirds 16:190 I93.
Batzer, D.E, M. McGee, V.H. Resh, and R.R. Smith. 1993. Char- acteristics of invertebrates consumed by mallards and prey re- sponses to wetland flooding schedules. Wetlands 13:41-49.
Bennington, C.C. and W.V. Thayne. 1994. Use and misuse of mixed model analysis of variance in ecological studies. Ecological Ap- plications 75:717-722.
Boesch, D.E 1977. Application of numerical classification in eco- logical investigations of water pollution. U,S, Environmental Pro- tection Agency. Corvallis, OR, USA. EPA-600/3-77-033.
Breeland, S.G. and TM. Loyless. 1983. Illustrated Keys to the Mos- quitoes of Florida, Adult Females and Fourth Stage Larvae. Office of Entomology, Florida Department of Health and Rehabilitative Services, Jacksonville, FL, USA,
Byers, G.W. 1984. Tipulidae. p. 491-514. In R.W. Merritt and K.W. Cummins (eds.J An Introduction to the Aquatic Insects of North America, Kendall/Hunt Publishing Company, Dubuque, IA, USA.
Chen, E. and J.E Gerber. 1990. Climate. p. 11-34. In R.L. Myers and J.J. Ewef (eds.l Ecosystems of Florida. University of Central Florida Press, Orlando, FL, USA.
Clifford, H.T. and W. Stephenson. 1975. An Introduction to Nu merical Classification. Academic Press, New York, NY, USA.
Coffrnan, W.R and L.C. Ferrington, Jr. 1984. Chironomidae. p. 551- 652, In R.W, Merritt and K.W. Cummins (eds.) An Introduction to the Aquatic Insects of North America. Kendall/Hunt Publishing Company, Dubuque, IA, USA.
Cowardin, L.M., V. Carter, EC. Golet, and E.T. LaRoe. 1979. Clas- sification of wetland and deepwater habitats of the United States. U.S. Fish and Wildlife Service, Washington, DC, USA. FWS/ OBS-79/3 t.
Cranston, ES., D.R. Oliver, and O,A. Saether. 1983. The larvae of Orthocladiinae (Diptera: Chtronomidae) of the Holarctic region-- Keys and diagnoses, p. 149 292. In T. Wiederholm (ed,t Chiro- nomidae of the Holarctic Region, Keys and Diagnoses, Part 1- Larvae. Entomologica Scandinavica Supplement 19.
Danell, K. and K. Sjoberg. 1982. Successional patterns of plants, invertebrates and ducks in a man-made lake. Journal of Applied Ecology 19:395-409,
Dressier, R.L., D.W. Hall, K.D. Perkins, and N.H. Williams. 1991. Identification Manual for Wetland Plant Species of Florida. Uni- versity of Florida, Gainesville, FL, USA.
Driver, E.A. 1977. Chironomid communities in small prairie ponds: some characteristics and controls. Freshwater Biology 7:121-133.
Duncan, C.E and RM. Gmffm~m. 1994. Comparing microbial pa rameters in natural and constructed wetlands, Journal of Environ mental Quality 23:298-305.
Epler, J.H. 1992. Identification Manual for the Larval Chironomidae (Diptera) of Florida. Florida Department of Environmental Reg ulation, Tallahassee, FL, USA.
Erwin, K .L 1990. Wetland evaluation for restoration and creation. p. 429-449. In J.A. Kusler and M.E. Kentula (eds.). Wetland Cre- ation and Restoration, The Slatus of the Science. Island Press. Washington, DC~ USA.
Ewel, J,J. 1987. Restoration is the ultimate test of ecological theory. p. 31-33. In W.R. Jordan III, M.E. Gilpin, and J.D. Aber (eds.) Restoration Ecology, a Synthetic Approach to Ecological Re- search_ Cambridge University Press, Cambridge, UK.
Fisher, J.B. 1982, Effects of macrobenthos on the chemical diagen- esis of freshwater sediments, p. 177-220. In PL. McCall and

4 2 8 W E T L A N D S , V o l u m e 16, N o , 4 , 1 9 9 6
M.J.S, Tevesz (eds.) Animal-Sediment Relations. P lenum Press, New York, NY, USA.
Fittkau, E,J, and S,S. Roback. 1983. The larvae of Tanypodinae (Diptera: Chironomidae) of the Holaretie r eg ion - -Keys and di- agnoses, p. 33-112 In T, Wiederholm (ed.) Chironomidae of the Holarctic Region, Keys and Diagnoses, Part I Larvae, Entomo- logica Scandinavica Supplement 19.
Florida Department of Environmental Protection. 1994. The Bio- logical Success of Created Marshes in Central Florida. Florida Department of Environmental Protection, Tallahassee, FL, USA.
Florida Phosphate Counc i l 1991. 1991 Florida Phosphate Council Wetland Restoration Report. Florida Phosphate Council, Tallahas- see, FL, USA.
Florida Phosphate Council. 1994. Phosphate Facts. Florida Phos- phate Council , Tallahassee, FL, USA.
Freeman, M.F. and J.W. Tukey. 1959. Transformations related to the angular and the square root. Annals of Mathematical Statistics 21: 607-611.
Godwin, H. 1923. Dispersal of pond floras. Journal of Ecology l I: 160-164.
Green, R,H. 1979. Sampling design and statistical methods for envi- ronmental biologists. John W'fley and Sons, New York. NY, USA.
Hall, R.J. and EE Ice, 1987. Evidence o f acidification effects on ,stream insect communi t ies in central Ontario between 1937 and 1985. Canadian Journal o f Fisheries and Aquatic Sciences 44: 1652-1657.
Hurlbert, S.H. 1984. Pseudoreplication and the design o f ecological field experiments. Ecological Monographs 54:187-211.
Hushes, D.A. 1966. Mountain streams of the Barberton area, east ern Transvaal. Par~ lI, The effect of "~,egetational shading and di- rect i l lumination on the distribution of stream fauna. Hydrobiol- ogia 27:439-459.
Hutchinson, G.E. 1957. Concluding remarks. Cold Spring Harbor Sympos ium for Quantitative Biology. 22:415 427.
Kentula, M.E., R.P. Brooks, S.E, Gwin, C.C, Holland, A.D. Sher- man, and J.C. Sifneos, 1993. An Approach to Improving Deci- sion Making in Wetland Restoration and Creation. CRC Press Inc., Boca Raton, FL, USA.
Kiefer, J.H. 1991. Chemical Functions and Water Quality in Marsh- es Reclaimed on Phosphate Mined Lands in central Florida. Mas- ters Thesis. University of Florida, Galnesville, FL, USA.
Krapu, G.L. and K.J. Reinecke, 1992. Foraging ecology and nutri- tion, p. 1-29. b~ B.D.J. Batt, A.D. Alton, M,G. Anderson, C,D, Ankney, D.H. Johnson, J.A. Kadlec, and G.L. Krapu (eds.) Ecol- ogy and Management of Breeding Waterfowl. University of Min- nesota Press, Minneapolis, Minnesota, USA,
Langis, R., M. Zalejko, and J.B. Zedler. 1991. Nitrogen assessments in a created and natural salt marsh of San Diego Bay. Ecological Applications 1:40-51.
Maher, M. and S.M, Carpenter. 1984. Bemhic studies of waterfowl breeding habitat in south-wcstern New South Wales. II. Chiron- omid populations. Australian Journal of Marine and Freshwater Research 35:97-110.
Marks, R.G. 1990. Analyzing Research Data. Robert E. Krieger Publishing Company, Malabar, FL, USA_
McClanahan, q2 1983. A preliminary analysis t)f the effects of dis- tance and density of a seed source on the fate of natural succession in phosphate mined lands, p. 149-156. In interaction o f Wetlands with the Phosphate Industry. Florida Institute of Phosphate Re- search, Barrow, FL. USA,
Newman, D.G. and C.R. Griffin. 1994. Wetland use by river otters in Massachusetts . Journal of Wildlife Management 58:18-23.
Newson, H.D. 1984. Culicidae. p. 515-533. In R.W. Merritt and K.W. Cummins (eds.) An Introduction to the Aquatic Insects of North America. Kendall/Hunt Publishing Company, Dubuque, IA, USA.
Nursall, J.R. 1952. The early development of a bottom fauna in a new power neservoir in the rocky mountains of Alberta. Canadian Journal of Zoology 30:387-409.
Peterman, R.M. 1990. Statistical power analysis can improve fish- eries research and management . Can',~dian Journal o f Fisheries and Aquatic Sciences 47:2-15.
Finder, L.C.V. and E Reiss. 1983. The larvae o f Chironominae (Diptera: Chironomidae) of the Holarctic r eg ion - -Ke y s and di- agnoses, p. 293-436. In T. Wiederholm (ed.) Chironomidac of the Holarctic Region, Keys and Diagnoses, Part I-Larw~e. Entomo- logica Scandinavica Supplement 19.
Quammen, M.L. 1986. Measur ing the success of wetlands minga- tion. National Wetlands Newsletter 8:6-8.
Sacco, J.N., E.D. Seneca, and T.R. Wentworth. 1994. InlhunaI com- munity development of artilicially established salt marshes in North Carolina. Estuaries 17:489-500.
SAS Institute Inc. 1985, SAS ~ User 's Guide: Statistics, Version 5 Edition. Sos Institute Inc., Cary, NC, USA.
SAS Institute lne. 1992. SAS ® Technical Report P-229, SAS STAT ~ Software: Changes and Enhancements , Release 6.07. SAS Institute Inc., Cary, NC, USA.
Scudder, G.G.E. 1983. A review of factors governing the distribu- tion o f two closely related corixids in the saline lakes of British Columbia. Hydrobiologia 105:143-154.
Streever, W.J. and S,A. Bloom. 1993. The self-similarity curve: a new method of determining the sampling effort required to char- acterize communit ies , Journal of Freshwater Ecology 8:401-~403.
Streever, W.J. and T.L Crisman, 1993a. A comparison of fish pop- ulations from natural and created freshwater marshes in central Florida, Journal of Freshwater Ecology 8:149-153,
Streever, W.L and T.L. Crisman, 1993b. A preliminary comparison of meiobenthic cladoceran assemblages in natural and created web lands in central Florida. Wetlands t3 :229-336.
Streever, W,J,, D.L. Evans, C.M. Keenan, and T.L. Crisman. 1995, Chironomidae (Diptera) and vegetation in a created wetland and implications for sampling. Wetlands 15:285-289,
Streever, W J, and K.M Pottier. 1994. A computer program to assist with sampling design in the comparison of natural and created wetlands. Wetlands 14:199-205.
Ter Braak, CJ .E. 1986. Canonical correspondence analysis: A new eigenveetor technique of multivariate direct gradient analysis. Ecology 67:1167-1179.
Ter Brook, CJ .E . 1988. C A N O C O - - a FORTRAN Program for Ca- nonical Communi ty Ordination, Microcomputer Power, Ithaca, New York, NY. USA.
Teskey, H.J. 1984. Part one, Larvae of aquatic Diptera. p, 448 -466 In R.W. Merritt and K.W, C u m m i n s (eds.) An Introduction to the Aquatic Insects of North America. Kendall /Hunt Publishing Com- pany, Dubuque, IA, USA.
Waterhouse, J.C. and M.P Funell . 1985. Identifying pollution re- lated changes in chironomid communit ies as a function of taxo- nomic rank. Canadian Journal of Fisheries and Aquatic Sciences 42:406-413.
Webb, D.W. and W.U. Brigham. 1982. Aquatic Diptera. p. I t . l - !1.111. In A.R. Brigham, W.U. Brigham, and A. Gnilka (eds.) Aquatic Insects and Oligochaetes of North and South Carolina. Midwest Aquatic Enterprises, IL, USA.
Wetzel, R.G. 1983, Limnology. Saunders College Publishing, New York` NY, USA.
Whitman, W.R. 1976, hnpoundments for waterfowl. Canadian Wildlife Service. Occasional Papers 22:1-22.
Zar, J.H. 1984. Biostatistical Analysis. Prentice Hall, Inc., Engle- wood Cliffs, NJ, USA.
Zedler, J.B. 1993, Canopy architecture of natural and planted cordg- rass marshes: Selecting habitat evaluation criteria. Ecological Ap- plications 3:123-138.
Zedler, J.B. and R. Langis. 1991. Comparison of created and natural salt marshes of San Diego Bay. Restoration and Management Notes 9:21 25.
Manuscript received 15 August 1995~ revision received t2 February 1996; accepted 19 April 1996.