exploration and exploitation in product and process innovation in the chemical industry
TRANSCRIPT

Exploration and exploitation inproduct and process innovationin the chemical industry
Manuel Bauer1 and Jens Leker2
1Institute of Business Administration at the Department of Chemistry and Pharmacy, University ofMünster, Leonardo-Campus 1, DE-48149 Münster, Germany. [email protected] of Business Administration at the Department of Chemistry and Pharmacy, University ofMünster, Leonardo-Campus 1, DE-48149 Münster, Germany. [email protected]
Achieving a well-balanced innovation portfolio is an often advocated goal for R&D man-agers, but guidelines how to achieve this are scarce in the innovation and managementliterature. In this study, we investigate the effects that balancing R&D budget allocationbetween exploratory and exploitative innovation activities has on new product performance.Furthermore, we distinguish between product and process exploratory and exploitativeinnovation activities offering a new and highly relevant contingency perspective on therequirement to balance exploratory and exploitative innovation activities within a portfolio.In doing so, we integrate these two important dimensions of innovative activity in aframework that can help senior managers to decide how to allocate scarce R&D resourceswithin an innovation portfolio to maximize returns. Based on a unique data set of objective,internal financial accounting data from strategic business units in the chemical industry, wefound not only that new product performance is enhanced through the simultaneous pursuitof exploratory and exploitative innovation activities (i.e., they are complementary) whichholds true for product and process innovation alike. But we are also able to show that inprocess innovation, exploration requires more funding to achieve maximal performancewhen compared to product innovation. An imbalance of exploration and exploitation hasless severe consequences than in product innovation efforts. Our study design that is basedon firm-internal R&D budget data allows R&D managers to directly compare their budgetallocation practice with our findings that are derived from a wide range of business units inone of the main process industries. Furthermore, our results have important implicationsfor the practice of R&D budget allocation, since they highlight how product and processinnovation efforts differ with respect to their impact of the exploration–exploitation balanceon new product performance relationship.
1. Introduction
Developing new products and introducing themin the market, which is defined as innovative
activity (Schumpeter, 1934) is a key source oforganizational growth (Penrose, 1959). To achievethis, companies have to allocate scarce resources in
a prudent manner to its innovation activities. Thiscore task of innovation portfolio management(Cooper et al., 1999), however, appears to be a dif-ficult challenge because return from innovationactivities is often hard to predict, and opportunitiesfor resource allocation typically exceed the availablebudget. Therefore, useful categories are required to
bs_bs_banner
196 R&D Management 43, 3, 2013. © 2013 The Authors. R&D Management © 2013 John Wiley & Sons Ltd
disaggregate the complexity of the decision how toallocate scarce R&D budget to achieve themaximum output (Loch and Kavadias, 2002; Chaoand Kavadias, 2008).
In the process industries, product and processinnovation are two important categories of innovativeactivity for strategic innovation portfolio manage-ment (Linn, 1984; Lager, 2002b; Lim et al., 2006). Intheir industry life cycle theory, Utterback and Aber-nathy (1975; Abernathy and Utterback, 1978) haveshown that fostering product relative to process inno-vation is contingent on which stage (i.e., uncoordi-nated, segmental or systemic) the firm is in. Inessence, the more mature (or systemic) a company’sindustry is, the better investments in process innova-tion payoff.
More recently, research on the simultaneous execu-tion of product and process innovation has stressedthe complementary nature of both types of innova-tions with respect to the success of new productdevelopment efforts (Pisano and Wheelwright, 1995;Pisano, 1997; Martinez-Ros, 2000; Damanpour andGopalakrishnan, 2001; Reichstein and Salter, 2006).Therefore, it is crucial to understand how allocat-ing R&D budget to each of the two influences inno-vation performance. Specifically, the degree to whicha company conducts exploratory or exploitativeresearch and development for product and processinnovations is expected to be of particular relevance.Engaging in exploitation at the expense of explora-tion may lead to inferior performance and vice versa(Levinthal and March, 1993). For instance, thechemical giant DuPont experienced an incomedecrease of 40% over the course of five years whilelosing more than a quarter of stock market valuewithin the same period, because it ‘simply divertedtoo many resources to projects aimed at boostingproductivity in existing businesses rather than devel-oping new projects’ (Barrett, 2003). ‘Throughoutmuch of the 1990s, two-thirds of [DuPont’s] R&Dbudget went to improve productivity at existing units.Only about one-third was spent on new products. Thatwas a short-term move to get earnings up’, saysJoseph P. Glas, [former] vice-president for life sci-ences research. ‘It was a big mistake’ (Barrett, 2003).As a reaction and to counteract the negative economictrend, DuPont’s new CEO started to reallocate thefirm’s research budget targeting to spend about65% on new products. On the other extreme, SinclairResearch Ltd, a British consumer electronicscompany, continuously explored totally new fields ofactivity after it released Britain’s best-selling per-sonal computer in the 80s. Consequently, after aseries of innovation failures, the company got intofinancial troubles and had to sell its main assets to a
competitor. Following the technological innovationliterature of exploration and exploitation (Tushmanand Smith, 2002; He and Wong, 2004), firms need toachieve a balance between explorative and exploita-tive innovation activities to achieve superior perform-ance. However, the empirical evidence for theconcept remains ‘limited and mixed’ (Raisch andBirkinshaw, 2008).
By distinguishing between product and processinnovation, we try to gain a more fine-grained under-standing of the relationship between exploration/exploitation and innovation performance. Therefore,we investigate the question: Does a balance betweenexploratory and exploitative innovation activitieslead to superior performance for each type of inno-vative activity, i.e., product and process innovation?And, are there differences between product andprocess innovation with respect to the influence thatbalancing exploration and exploitation has on inno-vation performance?
We investigate these questions on the basis of aunique data set that consists of objective R&D budgetdata from 69 strategic business units (SBUs) in thechemical industry. By using these data, we get asclose as academic research can get to address man-agers practical concerns since we use the same infor-mation base than practitioners do, i.e., internalfinancial accounting data (instead of survey data). Wefound that balancing exploration and exploitationhad a positive impact on new product performancefor both, product and process innovation. Further-more, process innovation requires a higher share ofR&D budget allocated to explorative innovationactivities to achieve maximal new product perform-ance, but it is less sensitive to imbalance compared toproduct innovation.
This paper is organized as follows: In section 2,we provide a brief literature review focusing on theresults of studies that investigated the complemen-tary nature of product and process innovation andthe impact of balancing exploration and exploitationon innovation performance. Based on this, wederive our hypotheses. In section 3, we describe ourdatabase and explain our methodology. In section 4,we present our results. In section 5, we discuss ourfindings, derive conclusions, and highlight theirtheoretical and managerial implications and pointout the limitations of this research as well as oppor-tunities for further research.
2. Theory and hypotheses
In most companies, R&D budget is a scarce resourcesince the volume of investment opportunities typi-
Exploration and exploitation in product & process innovation
© 2013 The AuthorsR&D Management © 2013 John Wiley & Sons Ltd
R&D Management 43, 3, 2013 197

cally exceeds the available budget. Therefore, inno-vations managers usually have to make trade-offs andalign their allocation decisions with the company’soverall strategy. Prudent and foresightful allocationdecision making with respect to scarce resources isa source of competitive advantage (Eisenhardt andMartin, 2000). Following this logic, innovation port-folio management (Cooper et al., 1999) is a criticaltask to gain and/or defend a company’s competitiveadvantage.
However, allocation decisions are difficult tomake due to combinatorial complexity to decidebetween several potential options and the difficult-to-predict nature of the outcome of innovations(Loch and Kavadias, 2002). In order to simplify thistask, literature on innovation portfolio managementhas proposed to disaggregate the overall R&Dbudget into smaller and more focused budgets (Chao& Kavadias, 2008 and literature therein). Thisrequires the definition of meaningful categories thatsupport the overall and innovation strategy of thecompany.
For process industries, Lager (2002b) has demon-strated that product and process innovation are twoimportant categories for the ‘top management, and inparticular by the director of R&D or production, inmaking strategic decisions for the future, or at leastin the development of the company’s annual budget’(Lager, 2002b, p. 106). But product and processinnovation are still rather general categories whichspan a broad range of different forms of innovationactivity, from minor modifications of single productattributes or production processes to the developmentof entirely new product lines or production systems.To get a better understanding of how product andprocess innovations need to be managed to unfoldtheir full potential for creating successful innova-tions, further disaggregation is required.
Leonard-Barton (1992) distinguished betweencore capabilities and rigidities in her case studyanalysis of product and process development projectswhich goes in line with March’s (1991) notion ofexploration and exploitation. The exploration–exploitation concept has attracted significant atten-tion since then (Raisch and Birkinshaw, 2008) and isconsidered to be an important distinction for themanagement of innovation (Tushman and Smith,2002). Therefore, we use the categories of productand process innovation and exploration and exploita-tion to derive two independent dimensions for deci-sion making in innovation portfolio management.Figure 1 schematically shows how these categoriescan be arranged in a matrix for R&D budget alloca-tion decision making. In the following, we derivewhy and how the chosen categories can provide stra-
tegic guidance in the task of innovation portfoliomanagement in the process industries.
2.1. How process R&D contributes to newproduct performance
Product and process R&D are widely recognized asimportant antecedents for innovation outcomes(Utterback and Abernathy, 1975), although they aredifficult to distinguish (Simonetti et al., 1995).Several attempts have been made to reach a clear cutdefinition that guarantees an unmistakable distinction(Edquist et al., 2001; OECD, 2005; Saha, 2007;Kurkkio et al., 2011). In this study, we followEdquist’s distinction between product and processinnovation: ‘Product innovations are new – or better– products (or product varieties) being produced andsold; it is a question of what is produced’. In contrast,Edquist states ‘[t]echnological process innovationsare new goods that are used in the process of produc-tion. These goods are what most people think of asinvestment goods, although they can also be interme-diate goods’ (Edquist et al., 2001, p. 15). This defi-nition of technological process innovation explicitlyexcludes organizational process innovations. Essen-tial to this definition is that the introduction of a newinvestment good in the production process changesthe way how the company produces its own products.Therefore, it is a question of how to produce. Fur-thermore, it is important to clarify the processinnovator’s perspective. A new investment good isconsidered as process innovation if used by the focalfirm to achieve a significant improvement in its pro-duction process; the same good can – but not neces-sarily has to – be a product innovation from theperspective of the producer who supplies this good tothe focal firm. This means, when discussing processinnovations, we adopt the focal firm’s perspectivethat is changing the way how it produces its productsby introducing a new investment good.
Typ
e of
inno
vati
on a
ctiv
ity
Product R&D
Process R&D
Exploitation Exploration
B0
A0
B1
A1
New productperformance
Form of pursuit
Figure 1. Framework for strategic decision making in innovationportfolio funding.
Manuel Bauer and Jens Leker
198 R&D Management 43, 3, 2013 © 2013 The AuthorsR&D Management © 2013 John Wiley & Sons Ltd
The necessity to allocate resources to productinnovation activities in order to develop new productsthat are successful in the market has already beendoubtlessly demonstrated (Montoya-Weiss and Cala-tone, 1994; Brown and Eisenhardt, 1995). The neces-sity to fund process innovation activities to achievehigh new product performance is less straightforwardand requires some explanation why and how processinnovation influences the performance of new prod-ucts, since process R&D work is mainly regarded tobe pursued for the sake of cost reduction or efficiencyincrease (Lager, 2002a), especially in chemical com-panies (Sinclair et al., 2000). Process R&D relates tonew product performance in several distinct ways(Frishammar et al., 2012). Process R&D can directlyaffect revenues by using efficiency gains to lowerprices and increase production volumes to capturemarket share (Lim et al., 2006; Kurkkio et al., 2011),which is practiced primarily in commodity segmentsof process industries (Ghemawat, 1984; Lieberman,1984; Henderson and Cool, 2003). Beside suchefficiency-related effects, process R&D contributesto new product performance also through improvedproduct quality by increasing the reliability of pro-duction processes leading to a more constant productquality and therewith improved customer satisfac-tion. (Gopalakrishnan et al., 1999; Frishammar et al.,2012). For instance, the global market dominance ofthe German chemical company Merck KGaA in thefield of liquid crystals is mainly due to its unmetproduct purity resulting from its innovation of aunique production process. The same holds true inthe case of the Wacker Chemie AG. Their knowledgeabout high-purity production processes from theirsilicon wafers subsidiary can be transferred to theirpolysilicon business (the primary material in photovoltaic panels) where Wacker competes successfullyagainst low-cost competitors based on their produc-tion purity competence. Pisano (1997; Pisano andWheelwright, 1995) in his case studies in the phar-maceutical industry highlights the direct linkbetween process innovation and its impact on theperformance of new products. He shows how processinnovation can reduce the time-to-market period andfacilitates the production ramp-up process which isof immense importance in highly competitivemarkets with significant first mover advantages, likethe originator pharmaceutical industry. Such marketsalso exist in the chemical industry, for example, inthe crop protection segment where sales under patentprotection is key for value creation (Achilladeliset al., 1987). Pisano’s examples provide insightsabout how product and process innovation activitiesare interlinked and mutually reinforcing. This com-plementarity effect (Milgrom and Roberts, 1995;
Ennen and Richter, 2010) has been empirically testedby several authors (Kraft, 1990; Martinez-Ros, 2000;Reichstein and Salter, 2006). Especially in thechemical industry, process and product innovationare closely connected (Hutcheson et al., 1995; Cesa-roni et al., 2004). For instance, the large chemicalsmanufacturer BASF pursues for some product lines astrategy that heavily relies on the complementarynature of product and process R&D. Following a socalled ‘last man standing’ philosophy, they enter new(to the company) product market segments in theirEuropean home market that are maturing and/or areunder increasing pressure from Asian low-cost com-petitors. They capture the market through aggressivecost reduction via economies of scale to achieve costcompetitiveness. In order to succeed with this strat-egy, BASF has to invest heavily in process researchto quickly move down the learning curve and achievean above-industry average productivity performance(since competition is mainly based on price). Fur-thermore, this requires in-depth production technol-ogy knowledge, since production equipment in thecommodity chemical industry is very capital inten-sive, and a mistake, for example, in technologychoice can threaten chemical companies’ survival(Linn, 1984). Therefore, the ‘learning-before-doing’concept (Pisano, 1994), which emphasizes the role ofprocess R&D in mature industries, is particularlyapplicable in the chemical industry. The argumentalso holds for the specialty chemicals sector. Launch-ing complex new compounds is most often associ-ated with changes in the production process, whichagain requires process innovation activities toachieve new product performance through quick pro-duction scale up or achievement of constant andhigh-product quality. In summary, even though itsimpact on new product performance is often over-looked, process innovation has important influenceon the success of new products and their performancein the marketplace, particularly for companies fromthe process industries (Barnett and Clark, 1996).
2.2. The balance of exploration andexploitation
In his landmark article, March (1991) describesexploitation and exploration as two different formsof learning activities between which firms have tobalance their attention and resources. He considersactivities such as ‘refinement, efficiency, selection,and implementation’ as exploitative, and activitiessuch as ‘search, variation, risk taking, experimenta-tion, and discovery’ as explorative. March argues thatcompanies ‘that engage in exploration to the exclu-sion of exploitation are likely to find that they suffer
Exploration and exploitation in product & process innovation
© 2013 The AuthorsR&D Management © 2013 John Wiley & Sons Ltd
R&D Management 43, 3, 2013 199

the costs of experimentation without gaining many ofits benefits. They exhibit too many undeveloped newideas and too little distinctive competence. Con-versely, systems that engage in exploitation to theexclusion of exploration are likely to find themselvestrapped in suboptimal stable equilibria. As a result,maintaining an appropriate balance between explora-tion and exploitation is a primary factor in systemsurvival and prosperity’ (March, 1991, p. 71).
Since March’s (1991) article, a vast body of litera-ture has addressed the question how exploration andexploitation can be balanced within an organization(e.g., Gibson and Birkinshaw, 2004; Gupta et al.,2006; Simsek et al., 2009). However, the fundamen-tal premise for pursuing a balance between ex-ploration and exploitation within a firm, i.e., doesbalancing really lead to superior performance, hasnot yet been doubtlessly established (Raisch and Bir-kinshaw, 2008). He and Wong (2004) were the firstto empirically test what has become known as the‘ambidexterity premise’, and they found support forit. Other studies found rather mixed results, reachingfrom contingent and curvilinear relationships to noand even opposing effects (Simsek et al., 2009 andliterature cited therein).
We focus on the field of technological innovationto investigate the effect that balancing explorationand exploitation has on new product performance inchemical companies. Therefore, we follow Tushmanand Smith’s (2002) and Danneels’ (2002) definitionof exploration and exploitation who distinguishbetween market and technology innovations, whilewe focus on the latter to define explorations andexploitation. Danneels (2002) puts the degree towhich a company relies on its existing stock ofknowledge vs requires new knowledge to develop aninnovation at the center stage of his distinctionbetween exploration and exploitation. We follow thisline of thinking, but to gain a more fine-grainedunderstanding of the effect that exploration–exploitation balancing has within the technologicalinnovation field, we investigate its impact on newproduct performance separately for the two above-mentioned innovation types, i.e., product and processR&D (see Figure 1).
Exploitation in product R&D refers to a firm’sability to improve and refine key attributes of prod-ucts already existing in a company’s product portfo-lio. For instance, the development of a water-based(= organic solvent-free) plastic additive (mainly toserve existent customer needs) is considered to bean exploitative product innovation if the companyalready produced and marketed organic solvent-based plastic additives (Benner and Tushman,2002).
Exploration in product R&D refers to a firm’sability to create products (or product lines) that areentirely new to the company’s product portfolio andare targeted either to serve new customers or newapplications at existent customers, both requiring asignificant amount of search, variation, risk taking,experimentation, and discovery (March, 1991). Forinstance, developing biodegradable polymers [likepoly-lactic acid (PLA)] as an established oil-basedpolymer producer would be an exploratory productinnovation effort.
Exploitation in process R&D refers to a firm’sability to introduce new investment (or intermediate)goods (Edquist et al., 2001) into an existing produc-tion process. For instance, replacing a low-pressurethrough a high-pressure vessel (due to R&D’s dis-covery that pressure increase over-proportionallyincreases production yield) and subsequent adapta-tion of the respective production process is consid-ered to be an exploitative process innovation.
Exploration in process R&D refers to a firm’sability to create and subsequently adopt an entirelynew production process which is new or radicallychanged compared to the company’s existent produc-tion process. For instance, the production of hydro-carbon liquids (that may have previously beenproduced through conventional oil refining) throughthe Fischer–Tropsch process is considered to be anexplorative process innovation. Based on these defi-nitions, we derive our hypotheses regarding theimpact of balancing exploration and exploitation foreach type of innovation activity on new product per-formance (see Figure 1).
Evidence from the literature on microeconomicsand management in the chemical industry points atthe positive impact that balancing exploration andexploitation in technological innovation has on newproduct performance. In his analysis of R&D’s rolein the transformation of the Dutch chemical companyDSM, Van Rooij (2008) highlights R&D’s dualobjective to explore and to exploit. He concludes that‘companies need to keep their research focused onareas that are related to the markets in which theyoperate and the technologies they use. At the sametime, they must find ways to accommodate an organi-zation that formulates visions and generates ideasthat might be removed from current interests, thatmight be long-term and that might fail, but at thesame time hold promise of profit and success’ (vanRooij, 2008, p. 48).
Furthermore, Achilladelis et al. (1990) demon-strate the superior market success of explorativeinnovations over exploitative ones in the chemicalindustry but highlight that these explorations lead toa stream of rather incremental innovations that con-
Manuel Bauer and Jens Leker
200 R&D Management 43, 3, 2013 © 2013 The AuthorsR&D Management © 2013 John Wiley & Sons Ltd
tribute to chemical companies’ new product successthrough their continued stream of revenues withinwhat they call a ‘corporate technological tradition’.They also observed this enhancement effect ofexplorative innovation on exploitation for both,product and process innovations.
Finally, Maine (2008) demonstrates how thechemical company Evonik counterbalances its overlyexploitation-oriented in-house R&D with radicalinnovation through establishing an internal corporateventuring organization. While these studies impres-sively demonstrate the need for chemical companiesto balance explorative and exploitative innovationactivities, none of these studies disaggregated theinnovation task to investigate potential differencesbetween product and process innovation activitiesand the effect that balancing exploration and exploi-tation has on new product performance.
Following the above literature, we argue that com-panies that allocate R&D resources simultaneouslytoward the pursuit of exploitative and explorativeinnovation activities achieve a higher product inno-vation performance than those that pursue only onekind of innovation activity. Furthermore, given thatR&D portfolio managers have a limited budget,which they can allocate toward explorative orexploitative innovation activities, we claim that anoptimal spending balance exists between the twokinds of innovation activity, at which firms pursueboth activities at the same time in order to achievemaximum returns from new product innovation. Inother words, we expect an inverse U-shaped relation-ship between the share of R&D budget devoted toexploratory innovation and the new product perform-ance. This hypothesis is expected to hold true forboth types of innovative activities, product, andprocess innovation.
3. Data and methodology
We selected the chemical industry as subject for ourinvestigation, since it has been demonstrated inseveral studies that the chemical industry is among themost active with respect to R&D activities of bothtypes, process and product R&D (Lager, 2002b;Reichstein and Salter, 2006). Furthermore, the chemi-cal industry is of significant economic relevance sinceit supplies to virtually all other industries.
The investigation level of our study is the SBU. Wechose the SBU as a unit of investigation because theSBU’s top management is typically responsible forstrategic portfolio funding decisions. Therefore, ourfindings may be of particular interest for them. Weused time-lagged cross-sectional objective data from
an existing data set that was derived in collaborationwith an international consulting company. We con-ducted a detailed innovation survey where the topmanagement of 51 of the largest chemical companiesheadquartered in Europe were asked to participate inthe study. We intentionally did not include pharma-ceutical nor oil and gas companies, since their chemi-cal business units are most often to some extentinterrelated with those companies’ main businessesthat are outside of the chemical industry. Out of the51 pure chemical companies that we approached, 20agreed to participate. However, only 15 of them wereable to deliver the full set of data which results in anoverall response rate of 29%. The final set of SBUsconsists of 70 SBUs. One SBU was excluded fromthe analysis since the SBU reported inconsistencyissues with respect to their internal data collectionprocess. The data were collected between 2004 and2006. Data from the five previous full years werecollected and averaged for each independent variableto minimize one-year special influences.
All measures (except segment dummy) are derivedfrom internal financial accounting data that wererequested via e-mail survey form the controlling divi-sions of the respective SBUs. After previous meet-ings, the corporate senior management sent out thesurvey e-mails and forwarded the filled-in surveys tous. This procedure ensured a virtually 100% responserate within the participating companies. A maximumof data consistency was strived to achieve through theuse of precisely specified data input sheets.
3.1. Measures
3.1.1. Dependent variableNew product performance as the dependent variablewas approximated by the annual share of SBU salesgenerated from products launched within the last fiveyears (relative to total sales), which is a widelyaccepted measure for new product performance. Weused the data from the most recent year that respond-ents provided in the survey to ensure a time lagbetween dependent and independent data to ensurewe account for causality. The average time to marketacross all kinds of innovations and companies is 3.2years. Since we collected data over a five-yearperiod, we are able to account for a maximum timelag of four years which allows us to account fairlywell for a time-lagged causality effect.
3.1.2. Independent variablesWe used the share of the annual R&D expenditureaveraged over the first four years that were reported inthe survey for the above defined activities i.e.,explorative process R&D (= 1-exploitative process
Exploration and exploitation in product & process innovation
© 2013 The AuthorsR&D Management © 2013 John Wiley & Sons Ltd
R&D Management 43, 3, 2013 201
R&D), and explorative product R&D (= 1-exploitative product R&D) relative to the total R&Dbudget of the SBU that has been allocated to therespective innovation type. Explorative process R&Dwas described in the survey as ‘new or radicallyimproved processes, introduced over last 5 years’,while exploitative process R&D was described as‘incrementally improved processes, introduced overlast 5 years’. Explorative product R&D was describedin the survey as ‘products or product lines, new to thecompany introduced to the market over last 5 years’.Exploitative product R&D was described as ‘substan-tially improved or incrementally new products,introduced to the market over last 5 years’. The defi-nition of product innovation was ‘Product-relatedinnovations refer to new products, applications,formulations/compounds, and services introducedinto the market over last 5 years’. The definition ofprocess innovation was ‘Process innovations refer tonew and improved technological production proc-esses that have been put to use over last 5 years’. Thereis a substantial debate in academic literature about thedifficulty to distinguish product from process innova-tion activities (Simonetti et al., 1995; Saha, 2007).However, when we pilot tested our data collectionsurvey with senior R&D managers, we experiencedonly little to no clarification need with respect to ourdefinitions of and distinction between product andprocess innovations. We cannot rule out that someuncertainty about the inter-respondent reliability ofour product vs process measures remain. Neverthe-less, we believe that – while acknowledging thegeneral lack of a reliable measure – this fact may haveprevented scholars to conduct firm-level process vsproduct innovation-related research which lead to arelative paucity in this important research field(Reichstein and Salter, 2006).
3.1.3. Control variablesWe included six control variables. SBU size wasmeasured by the average annual sales of the respectiveSBU. It was used since several economists stressedcompany size’s influence on the relative importanceof product vs process innovation (Utterback andAber-nathy, 1975; Klepper, 1997; Damanpour and Aravind,2006); R&D intensity was measured by the overallR&D expenditures relative to SBU sales. It has fre-quently been cited as an influential determinant forproduct as well as process innovation (Montoya-Weiss and Calatone, 1994; Martinez-Ros, 2000;Baldwin et al., 2002); profitability was measured bySBUs’ EBITDA margin. It has also been found toinfluence product and process innovation activities(Kraft, 1990); the product lifetime was measured as
the average time in years that a product is sold on themarket (from market launch to phase out from themarket). This variable controls for the change rate ofproducts in the market and assess how quickly cus-tomer preferences change or a product is substituted.Therefore, it is a control variable for the environmen-tal dynamism that a company faces, which is known asan important factor influencing the degree to whichcompanies engage in exploration vs exploitation(Eisenhardt and Martin, 2000; Jansen et al., 2006);external expenditures for R&D were measured by theshare of total R&D budget allocated to external tech-nology sourcing. It has been reported to influenceproduct, process, and innovativeness of innovationactivities (Kessler et al., 2000; Reichstein and Salter,2006; Rothaermel and Alexandre, 2009). Addition-ally, a dummy variable was created to distinguishbetween commodity and specialty chemical SBUssince they are expected to differ with respect to theirinnovation activities (Linn, 1984).
3.2. Analytical procedures
To estimate our hypotheses, we used ordinary leastsquare regression and applied t- and F-tests fortesting significance levels. In order to apply reliablestandard errors, we correct for heteroscedasticityusing a Huber–White sandwich estimator (White,1980; Hayes and Cai, 2007). In order to assess theimpact of our explanatory variables at a practicallymeaningful value range, we mean-centered allexplanatory variables before entering them into themodels. Furthermore, we followed the standard esti-mation procedure described in the literature for inter-action models of such kind (Carte and Russell, 2003;Echambadi and Hess, 2007; for comprehensive treat-ment, see also: West and Aiken, 1991; Cohen et al.,2003; Turrisi and Jaccard, 2003), including theassessment of a linear relationship, and F-tests tominimize the chance of model misspecification. Inaddition, and following Brambor et al.’s (2006) rec-ommendation of good practice in the assessment ofhigher order interaction models, we calculate thefirst-order derivative of our explanatory variables.For our study, the same holds true as for Haagedornand Wang who noted that ‘our estimation model is anonlinear model with interactive terms; [therefore]an explanatory variable’s model coefficient cannot beused to infer the true nature of the relationshipbetween an explanatory variable and the dependentvariable, and hence the focus of our analysis is onthe value of an explanatory variable’s marginaleffect’ (Hagedoorn and Wang, 2012, p. 1078). Wefollow the same procedure described elsewhere(Brambor et al., 2006; Hagedoorn and Wang, 2012)
Manuel Bauer and Jens Leker
202 R&D Management 43, 3, 2013 © 2013 The AuthorsR&D Management © 2013 John Wiley & Sons Ltd
and calculate confidence intervals at the 90% confi-dence level around the simple slope of the firstderivative equation of the explanatory variables (i.e.,share of exploration in product and process R&D) inorder to estimate the threshold value of R&D budgetshare that should be allocated toward exploratoryR&D for both kinds of innovation activity. With thisprocedure, we can at least provide a rough guidanceto R&D managers, how much exploratory R&Deffort they should have in their portfolios.
4. Results
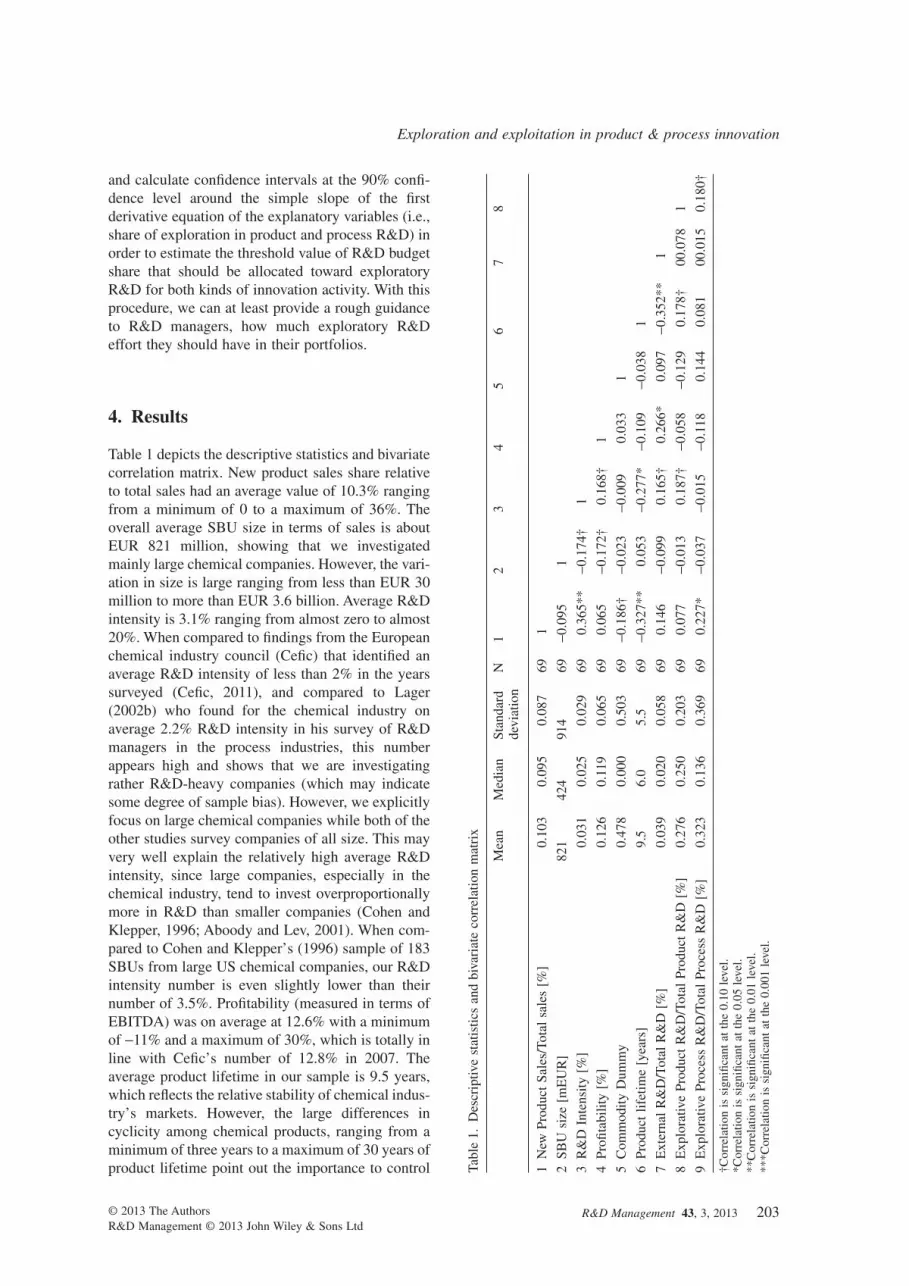
Table 1 depicts the descriptive statistics and bivariatecorrelation matrix. New product sales share relativeto total sales had an average value of 10.3% rangingfrom a minimum of 0 to a maximum of 36%. Theoverall average SBU size in terms of sales is aboutEUR 821 million, showing that we investigatedmainly large chemical companies. However, the vari-ation in size is large ranging from less than EUR 30million to more than EUR 3.6 billion. Average R&Dintensity is 3.1% ranging from almost zero to almost20%. When compared to findings from the Europeanchemical industry council (Cefic) that identified anaverage R&D intensity of less than 2% in the yearssurveyed (Cefic, 2011), and compared to Lager(2002b) who found for the chemical industry onaverage 2.2% R&D intensity in his survey of R&Dmanagers in the process industries, this numberappears high and shows that we are investigatingrather R&D-heavy companies (which may indicatesome degree of sample bias). However, we explicitlyfocus on large chemical companies while both of theother studies survey companies of all size. This mayvery well explain the relatively high average R&Dintensity, since large companies, especially in thechemical industry, tend to invest overproportionallymore in R&D than smaller companies (Cohen andKlepper, 1996; Aboody and Lev, 2001). When com-pared to Cohen and Klepper’s (1996) sample of 183SBUs from large US chemical companies, our R&Dintensity number is even slightly lower than theirnumber of 3.5%. Profitability (measured in terms ofEBITDA) was on average at 12.6% with a minimumof -11% and a maximum of 30%, which is totally inline with Cefic’s number of 12.8% in 2007. Theaverage product lifetime in our sample is 9.5 years,which reflects the relative stability of chemical indus-try’s markets. However, the large differences incyclicity among chemical products, ranging from aminimum of three years to a maximum of 30 years ofproduct lifetime point out the importance to control Ta
ble
1.D
escr
iptiv
est
atis
tics
and
biva
riat
eco
rrel
atio
nm
atri
x
Mea
nM
edia
nSt
anda
rdde
viat
ion
N1
23
45
67
8
1N
ewPr
oduc
tSa
les/
Tota
lsa
les
[%]
0.10
30.
095
0.08
769
1
2SB
Usi
ze[m
EU
R]
821
424
914
69-0
.095
1
3R
&D
Inte
nsity
[%]
0.03
10.
025
0.02
969
0.36
5**
-0.1
74†
1
4Pr
ofita
bilit
y[%
]0.
126
0.11
90.
065
690.
065
-0.1
72†
0.16
8†1
5C
omm
odity
Dum
my
0.47
80.
000
0.50
369
-0.1
86†
-0.0
23-0
.009
0.03
31
6Pr
oduc
tlif
etim
e[y
ears
]9.
56.
05.
569
-0.3
27**
0.05
3-0
.277
*-0
.109
-0.0
381
7E
xter
nal
R&
D/T
otal
R&
D[%
]0.
039
0.02
00.
058
690.
146
-0.0
990.
165†
0.26
6*0.
097
-0.3
52**
1
8E
xplo
rativ
ePr
oduc
tR
&D
/Tot
alPr
oduc
tR
&D
[%]
0.27
60.
250
0.20
369
0.07
7-0
.013
0.18
7†-0
.058
-0.1
290.
178†
00.0
781
9E
xplo
rativ
ePr
oces
sR
&D
/Tot
alPr
oces
sR
&D
[%]
0.32
30.
136
0.36
969
0.22
7*-0
.037
-0.0
15-0
.118
0.14
40.
081
00.0
150.
180†
†Cor
rela
tion
issi
gnifi
cant
atth
e0.
10le
vel.
*Cor
rela
tion
issi
gnifi
cant
atth
e0.
05le
vel.
**C
orre
latio
nis
sign
ifica
ntat
the
0.01
leve
l.**
*Cor
rela
tion
issi
gnifi
cant
atth
e0.
001
leve
l.
Exploration and exploitation in product & process innovation
© 2013 The AuthorsR&D Management © 2013 John Wiley & Sons Ltd
R&D Management 43, 3, 2013 203
for this variable. Finally, the share of external R&Daverage value is almost 4% ranging from 0 to 31%.1
These data show that the variation among theinvestigated SBUs is quite substantial.
Table 1 gives an overview about the descriptivestatistics of the variables used and their bivariatecorrelations. An interesting observation is the signifi-cant positive correlation between process explorationand new product sales share, which is also observedin other studies (Reichstein and Salter, 2006).However, we expect a nonlinear relationship to bemore accurate when controlled for other influencingfactors, according to our hypotheses.
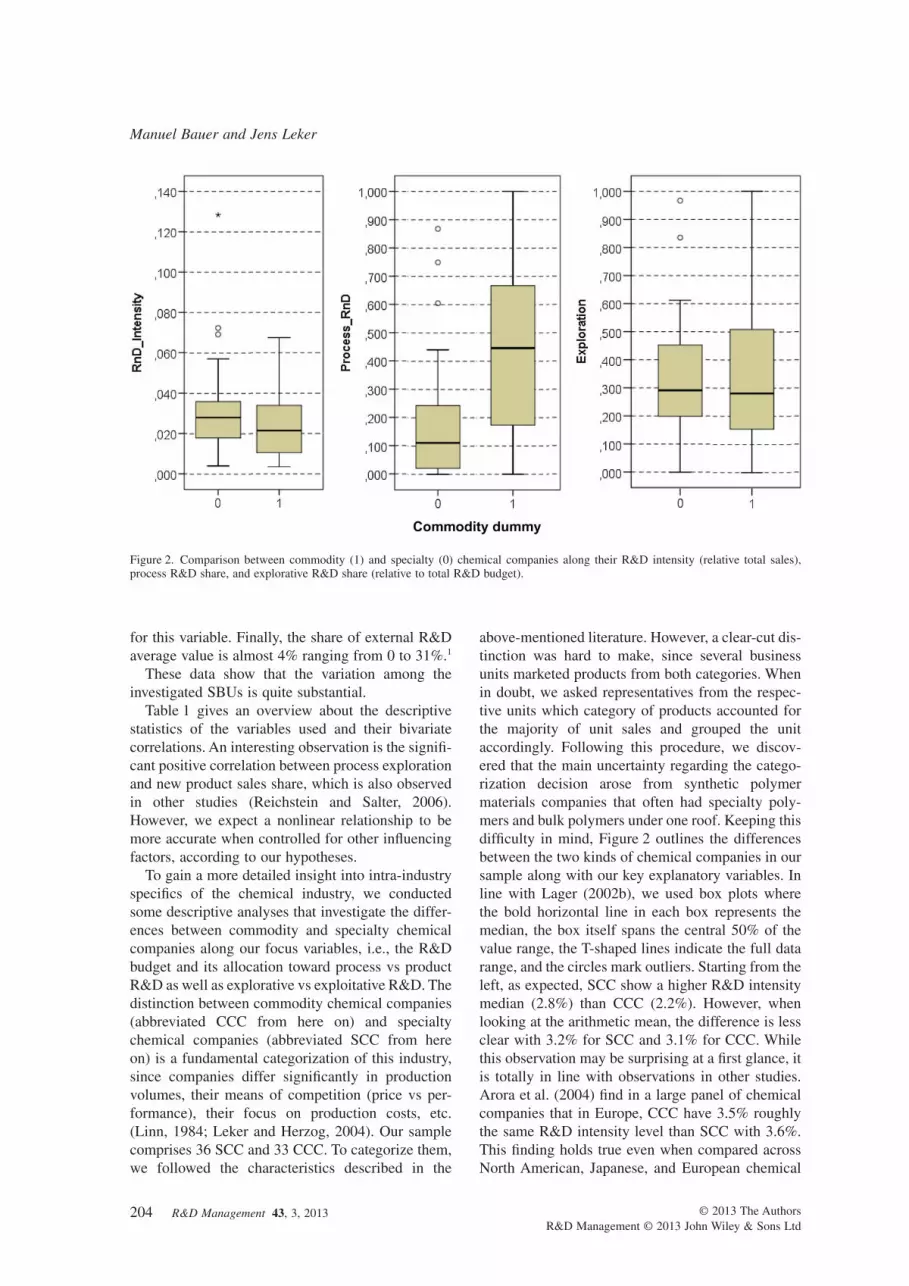
To gain a more detailed insight into intra-industryspecifics of the chemical industry, we conductedsome descriptive analyses that investigate the differ-ences between commodity and specialty chemicalcompanies along our focus variables, i.e., the R&Dbudget and its allocation toward process vs productR&D as well as explorative vs exploitative R&D. Thedistinction between commodity chemical companies(abbreviated CCC from here on) and specialtychemical companies (abbreviated SCC from hereon) is a fundamental categorization of this industry,since companies differ significantly in productionvolumes, their means of competition (price vs per-formance), their focus on production costs, etc.(Linn, 1984; Leker and Herzog, 2004). Our samplecomprises 36 SCC and 33 CCC. To categorize them,we followed the characteristics described in the
above-mentioned literature. However, a clear-cut dis-tinction was hard to make, since several businessunits marketed products from both categories. Whenin doubt, we asked representatives from the respec-tive units which category of products accounted forthe majority of unit sales and grouped the unitaccordingly. Following this procedure, we discov-ered that the main uncertainty regarding the catego-rization decision arose from synthetic polymermaterials companies that often had specialty poly-mers and bulk polymers under one roof. Keeping thisdifficulty in mind, Figure 2 outlines the differencesbetween the two kinds of chemical companies in oursample along with our key explanatory variables. Inline with Lager (2002b), we used box plots wherethe bold horizontal line in each box represents themedian, the box itself spans the central 50% of thevalue range, the T-shaped lines indicate the full datarange, and the circles mark outliers. Starting from theleft, as expected, SCC show a higher R&D intensitymedian (2.8%) than CCC (2.2%). However, whenlooking at the arithmetic mean, the difference is lessclear with 3.2% for SCC and 3.1% for CCC. Whilethis observation may be surprising at a first glance, itis totally in line with observations in other studies.Arora et al. (2004) find in a large panel of chemicalcompanies that in Europe, CCC have 3.5% roughlythe same R&D intensity level than SCC with 3.6%.This finding holds true even when compared acrossNorth American, Japanese, and European chemical
Figure 2. Comparison between commodity (1) and specialty (0) chemical companies along their R&D intensity (relative total sales),process R&D share, and explorative R&D share (relative to total R&D budget).
Manuel Bauer and Jens Leker
204 R&D Management 43, 3, 2013 © 2013 The AuthorsR&D Management © 2013 John Wiley & Sons Ltd
companies. The reason why these observations seemto be counterintuitive is that most people only thinkabout R&D’s purpose for new product development.While in commodities hardly any new attributes canbe added products, R&D intensity is often expectedto be low; however, price-based competition and sub-sequent focus on cost reduction are the drivers forprocess-oriented R&D intensity in the commoditiessegment. Since process innovation often requiresinvestment in new production equipment which isvery expensive especially in the commodity chemicalindustry (Henderson and Cool, 2003), in contrast itshould rather be surprising that CCC do not show ahigher R&D intensity level than SCC (which actuallyis the case in Arora et al.’s (2004) sample for allregions except Europe).
Due to the same reasons, the share of the totalR&D budget that is allocated to process R&D issignificantly higher in the case of CCC (mean: 47%,median: 45%) than in the case of SCC (mean: 18%,median: 11%), as can be seen in the middle graphicof Figure 2. The overall average share of processR&D is with 32% (median: 21%) slightly higher inour sample than in Lager’s (2002b) investigation(mean 27.8%; median: 27.5).
Finally, the share of R&D budget devoted toexploratory innovation is approximately the same forCCC (mean: 34%; median: 28%) and SCC (mean:33%; median: 29%). These data are very much inline with Mansfield’s (1981) findings that chemicalcompanies spend 33% of their R&D investmentson ‘projects aimed at entirely new products orprocesses’.
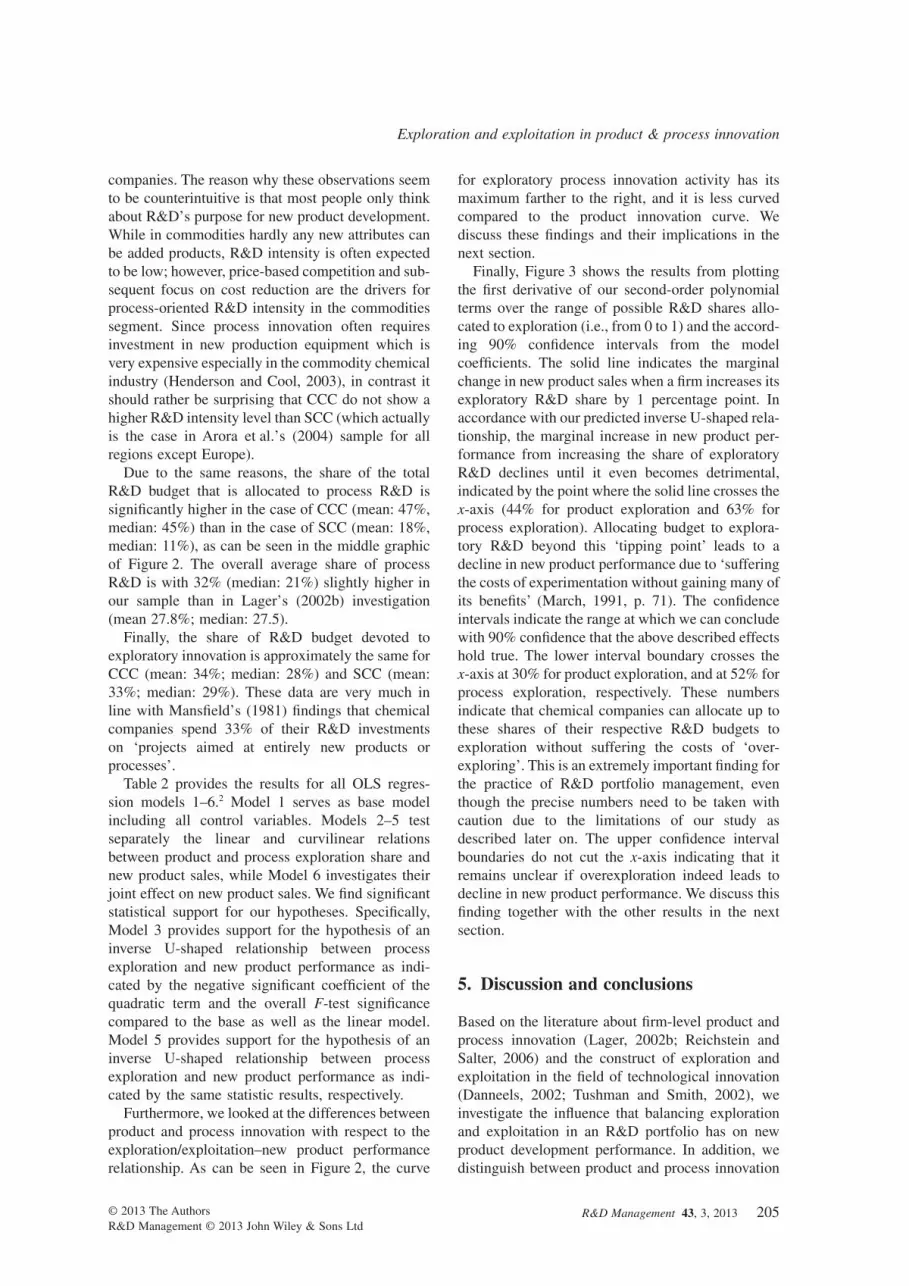
Table 2 provides the results for all OLS regres-sion models 1–6.2 Model 1 serves as base modelincluding all control variables. Models 2–5 testseparately the linear and curvilinear relationsbetween product and process exploration share andnew product sales, while Model 6 investigates theirjoint effect on new product sales. We find significantstatistical support for our hypotheses. Specifically,Model 3 provides support for the hypothesis of aninverse U-shaped relationship between processexploration and new product performance as indi-cated by the negative significant coefficient of thequadratic term and the overall F-test significancecompared to the base as well as the linear model.Model 5 provides support for the hypothesis of aninverse U-shaped relationship between processexploration and new product performance as indi-cated by the same statistic results, respectively.
Furthermore, we looked at the differences betweenproduct and process innovation with respect to theexploration/exploitation–new product performancerelationship. As can be seen in Figure 2, the curve
for exploratory process innovation activity has itsmaximum farther to the right, and it is less curvedcompared to the product innovation curve. Wediscuss these findings and their implications in thenext section.
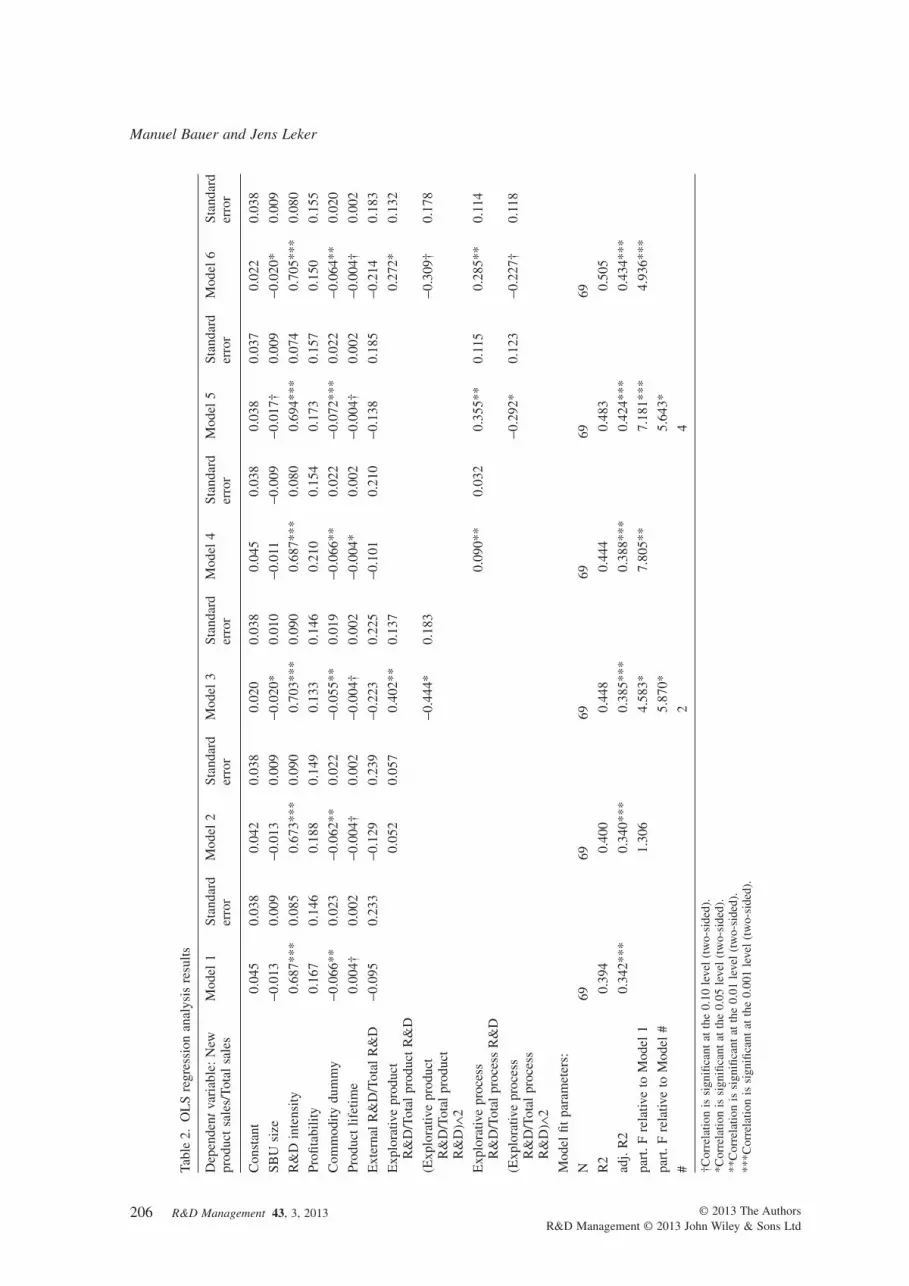
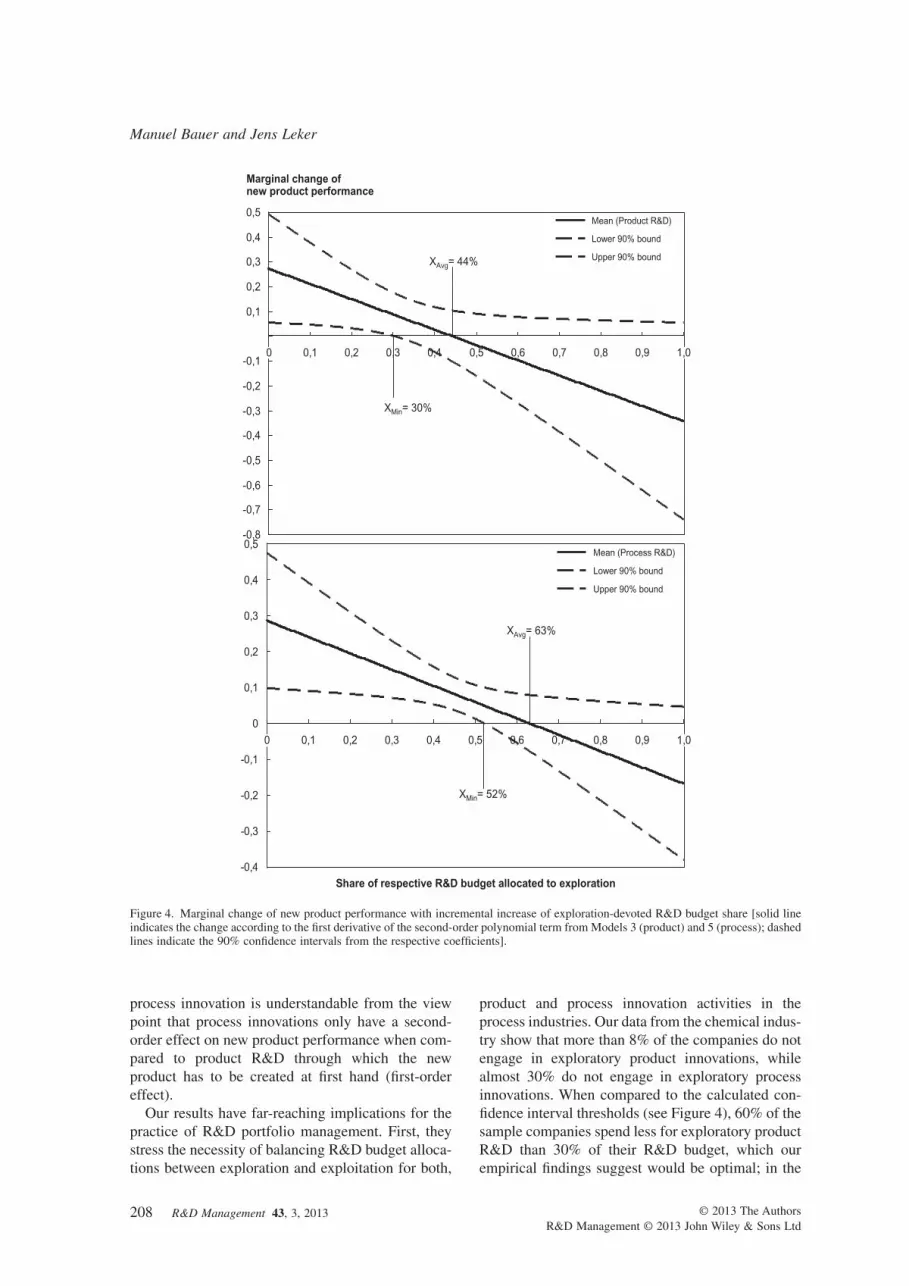
Finally, Figure 3 shows the results from plottingthe first derivative of our second-order polynomialterms over the range of possible R&D shares allo-cated to exploration (i.e., from 0 to 1) and the accord-ing 90% confidence intervals from the modelcoefficients. The solid line indicates the marginalchange in new product sales when a firm increases itsexploratory R&D share by 1 percentage point. Inaccordance with our predicted inverse U-shaped rela-tionship, the marginal increase in new product per-formance from increasing the share of exploratoryR&D declines until it even becomes detrimental,indicated by the point where the solid line crosses thex-axis (44% for product exploration and 63% forprocess exploration). Allocating budget to explora-tory R&D beyond this ‘tipping point’ leads to adecline in new product performance due to ‘sufferingthe costs of experimentation without gaining many ofits benefits’ (March, 1991, p. 71). The confidenceintervals indicate the range at which we can concludewith 90% confidence that the above described effectshold true. The lower interval boundary crosses thex-axis at 30% for product exploration, and at 52% forprocess exploration, respectively. These numbersindicate that chemical companies can allocate up tothese shares of their respective R&D budgets toexploration without suffering the costs of ‘over-exploring’. This is an extremely important finding forthe practice of R&D portfolio management, eventhough the precise numbers need to be taken withcaution due to the limitations of our study asdescribed later on. The upper confidence intervalboundaries do not cut the x-axis indicating that itremains unclear if overexploration indeed leads todecline in new product performance. We discuss thisfinding together with the other results in the nextsection.
5. Discussion and conclusions
Based on the literature about firm-level product andprocess innovation (Lager, 2002b; Reichstein andSalter, 2006) and the construct of exploration andexploitation in the field of technological innovation(Danneels, 2002; Tushman and Smith, 2002), weinvestigate the influence that balancing explorationand exploitation in an R&D portfolio has on newproduct development performance. In addition, wedistinguish between product and process innovation
Exploration and exploitation in product & process innovation
© 2013 The AuthorsR&D Management © 2013 John Wiley & Sons Ltd
R&D Management 43, 3, 2013 205
Tabl
e2.
OL
Sre
gres
sion
anal
ysis
resu
lts
Dep
ende
ntva
riab
le:
New
prod
uct
sale
s/To
tal
sale
sM
odel
1St
anda
rder
ror
Mod
el2
Stan
dard
erro
rM
odel
3St
anda
rder
ror
Mod
el4
Stan
dard
erro
rM
odel
5St
anda
rder
ror
Mod
el6
Stan
dard
erro
r
Con
stan
t0.
045
0.03
80.
042
0.03
80.
020
0.03
80.
045
0.03
80.
038
0.03
70.
022
0.03
8
SBU
size
-0.0
130.
009
-0.0
130.
009
-0.0
20*
0.01
0-0
.011
-0.0
09-0
.017
†0.
009
-0.0
20*
0.00
9
R&
Din
tens
ity0.
687*
**0.
085
0.67
3***
0.09
00.
703*
**0.
090
0.68
7***
0.08
00.
694*
**0.
074
0.70
5***
0.08
0
Profi
tabi
lity
0.16
70.
146
0.18
80.
149
0.13
30.
146
0.21
00.
154
0.17
30.
157
0.15
00.
155
Com
mod
itydu
mm
y-0
.066
**0.
023
-0.0
62**
0.02
2-0
.055
**0.
019
-0.0
66**
0.02
2-0
.072
***
0.02
2-0
.064
**0.
020
Prod
uct
lifet
ime
0.00
4†0.
002
-0.0
04†
0.00
2-0
.004
†0.
002
-0.0
04*
0.00
2-0
.004
†0.
002
-0.0
04†
0.00
2
Ext
erna
lR
&D
/Tot
alR
&D
-0.0
950.
233
-0.1
290.
239
-0.2
230.
225
-0.1
010.
210
-0.1
380.
185
-0.2
140.
183
Exp
lora
tive
prod
uct
R&
D/T
otal
prod
uct
R&
D0.
052
0.05
70.
402*
*0.
137
0.27
2*0.
132
(Exp
lora
tive
prod
uct
R&
D/T
otal
prod
uct
R&
D)∧
2
-0.4
44*
0.18
3-0
.309
†0.
178
Exp
lora
tive
proc
ess
R&
D/T
otal
proc
ess
R&
D0.
090*
*0.
032
0.35
5**
0.11
50.
285*
*0.
114
(Exp
lora
tive
proc
ess
R&
D/T
otal
proc
ess
R&
D)∧
2
-0.2
92*
0.12
3-0
.227
†0.
118
Mod
elfit
para
met
ers:
N69
6969
6969
69
R2
0.39
40.
400
0.44
80.
444
0.48
30.
505
adj.
R2
0.34
2***
0.34
0***
0.38
5***
0.38
8***
0.42
4***
0.43
4***
part
.Fre
lativ
eto
Mod
el1
1.30
64.
583*
7.80
5**
7.18
1***
4.93
6***
part
.Fre
lativ
eto
Mod
el#
5.87
0*5.
643*
#2
4
†Cor
rela
tion
issi
gnifi
cant
atth
e0.
10le
vel
(tw
o-si
ded)
.*C
orre
latio
nis
sign
ifica
ntat
the
0.05
leve
l(t
wo-
side
d).
**C
orre
latio
nis
sign
ifica
ntat
the
0.01
leve
l(t
wo-
side
d).
***C
orre
latio
nis
sign
ifica
ntat
the
0.00
1le
vel
(tw
o-si
ded)
.
Manuel Bauer and Jens Leker
206 R&D Management 43, 3, 2013 © 2013 The AuthorsR&D Management © 2013 John Wiley & Sons Ltd

activities to get a more detailed insight into theexploration/exploitation–performance relationship.Our hypothesis is that an inverse U-shaped relation-ship exists between the degree to which a companyfunds exploratory R&D activities and its new productperformance. We expected this relationship to holdtrue for both types on innovative activity. We foundstrong support for our hypotheses when testing themwith objective internal financial accounting data from69 SBUs of large chemical companies. Our findingsprovide a more granular insight into the ‘mechanism’of the exploration/exploitation–performance rela-tionship compared to studies that investigated theso-called ambidexterity premise on higher organiza-tional levels (He and Wong, 2004; Lubatkin et al.,2006; Belderbos et al., 2010).
Furthermore, our study design allows for a directcomparison between product and process innova-tions’ relationship of the exploration–exploitationbalance with new product performance. Therefore,we are able to shed some light into the black box ofthe exploration/exploitation–performance relation-ship since the exploration/exploitation tension existson several dimensions, but – as to the best of ourknowledge – no study has disaggregated this tensioninto the dimensions of product and process innova-tions before. We find that for process innovations,more R&D budget needs to be allocated towardexploratory innovation activities in order to achievemaximum new product performance compared toproduct innovations. Furthermore, a potential imbal-ance between process exploration and exploitationhas a less severe effect on new product performance
than in the case of product innovation (as can be seenfrom the less bent curve in Figure 2). Our data are inline with the industry life cycle (ILC) theory (Utter-back and Abernathy, 1975) showing that companiesin the commodity chemicals sector that is perceivedto be in a rather systemic stage (at least in large parts;see Linn, 1984) spend significantly more on processR&D compared to the less systemic specialty chemi-cal industry (see Figure 2). However, the almostequal level of exploration in both industry segmentsis counterintuitive to ILC theory, which predicts anemphasis on innovation exploitation (Abernathy andUtterback, 1978) instead of exploration in systemicindustries. By applying an investment lens, however,it becomes clear that exploratory process innovation,i.e., the creation and/or establishment of new, capitalintensive production equipment, requires relativelymore funding than incremental process innovationbecause of the capital intensive nature of the requiredinvestment goods. This shifts the optimum fundingratio between exploration and exploitation towardprocess exploration – even in the rather mature com-modity chemicals industry. Therefore, we add anR&D portfolio investment perspective to this theory.Furthermore, this investment perspective alsoexplains the difference between product and processinnovation with respect to the optimum exploration–exploitation ratio. The capital intensity of processexploration exceeds that of product exploration (i.e.,the creation of entirely new products) since therequired investment goods are incomparably morecostly. Finally, the less severe impact of imbalancebetween exploration and exploitation in case of
0 0,1 0,2 0,3 0,4 0,5 0,6 0,7 0,8 0,9 1,0
0,01
0,03
0,05
0,07
0,09
0,06
0,04
0,02
0,10
0,08
Process R&D
Product R&D
XMax= 44%
XMax= 63%
New
pro
du
ct p
erfo
rman
ce (
ind
exed
)
Share of respective R&D budget allocated to exploration
Figure 3. Impact of balancing exploration/exploitation on New Product Performance by innovation type.
Exploration and exploitation in product & process innovation
© 2013 The AuthorsR&D Management © 2013 John Wiley & Sons Ltd
R&D Management 43, 3, 2013 207
process innovation is understandable from the viewpoint that process innovations only have a second-order effect on new product performance when com-pared to product R&D through which the newproduct has to be created at first hand (first-ordereffect).
Our results have far-reaching implications for thepractice of R&D portfolio management. First, theystress the necessity of balancing R&D budget alloca-tions between exploration and exploitation for both,
product and process innovation activities in theprocess industries. Our data from the chemical indus-try show that more than 8% of the companies do notengage in exploratory product innovations, whilealmost 30% do not engage in exploratory processinnovations. When compared to the calculated con-fidence interval thresholds (see Figure 4), 60% of thesample companies spend less for exploratory productR&D than 30% of their R&D budget, which ourempirical findings suggest would be optimal; in the
0 0,1 0,2 0,3 0,4 0,5 0,6 0,7 0,8 0,9 1,0
0,5
0,4
0,3
0,2
0,1
-0,1
-0,2
-0,3
-0,4
-0,5
-0,6
-0,7
-0,8
XMin= 30%
XAvg= 44% Upper 90% bound
Lower 90% bound
Mean (Product R&D)
Marginal change ofnew product performance
-0,4
-0,3
-0,2
-0,1
0
0,1
0,2
0,3
0,4
0,5
0 0,1 0,2 0,3 0,4 0,5 0,6 0,7 0,8 0,9 1,0
XMin= 52%
XAvg= 63%
Upper 90% bound
Lower 90% bound
Mean (Process R&D)
Share of respective R&D budget allocated to exploration
Figure 4. Marginal change of new product performance with incremental increase of exploration-devoted R&D budget share [solid lineindicates the change according to the first derivative of the second-order polynomial term from Models 3 (product) and 5 (process); dashedlines indicate the 90% confidence intervals from the respective coefficients].
Manuel Bauer and Jens Leker
208 R&D Management 43, 3, 2013 © 2013 The AuthorsR&D Management © 2013 John Wiley & Sons Ltd

case of exploratory process R&D, the share of com-panies spending less than the empirically derived52% (see Figure 4) is even higher (77%). Obviously,senior R&D portfolio managers in chemical compa-nies underestimate the importance of exploratoryprocess innovations for revenue creation with newproducts. Second, R&D managers can use our resultsto directly compare their R&D budget allocationpractice with our findings since we used the samedata than senior R&D managers do for portfoliomanagement, i.e., financial R&D budget data. Thisunique study design may provide managers of diver-sified innovation portfolios with some guidelines onhow to shift scarce R&D budget between exploratoryand exploitative R&D activities. Our data imply thatmanagers in the chemical industry allocate onaverage only one third of the process R&D budgettoward exploratory R&D activities, while for productinnovations only one forth is allocated towardexploratory R&D activities (see Table 1). Bothfigures are significantly below the optimum numberswhich we found in our study (see Figure 4). Third,our results indicate that balancing exploration andexploitation does not follow uniformly the same rulesacross different innovation activity dimensions asimplicitly assumed in extant literature. Instead, R&Dmanagers have to balance exploration and exploita-tion differently between product and process innova-tion activities. For process innovations, they shouldallocate a relatively higher share of their processR&D budget toward exploratory R&D compared toproduct innovations in order to achieve the maximumnew product sales; and they should devote highermanagerial attention to the product innovationdomain in order to find the right exploration–exploitation balance since in this case, a potentialimbalance has a more negative effect on new productsales than in the process innovation domain.
A limitation of our study is that we do not inves-tigate the effect that balancing exploration andexploitation has on the return on investment of therespective innovation activities, i.e., product andprocess innovation. This is due to the fact that returndata for process innovations are very difficult toassess. Another limitation is that we do not test thevertical relationship in Figure 1, which correspondsto testing the combined effect of product and processinnovation on innovation performance, separated forexploratory and exploitative innovation activities.Such a study would extend He and Wong’s (2004)investigation of exploratory and exploitative innova-tion strategies to the more granular level of the R&Dorganization. A third limitation is the rather smallsample size that does not allow us to determine ifoverspending on exploration has in fact a negative
effect on new product performance. Even though14% of our sample observations in the productdomain and 29% in the process domain spend moreon exploration than the tipping point in the curvilin-ear relationship would suggest to be optimal (seeFigure 3), this is not sufficient for clarifying withreasonable confidence if new product performancewill indeed decline when companies overspend onexploration (see the equivocality of the upper confi-dence interval boundary in Figure 4).
Beside these limitations, we believe that our studyresults contribute important new insights to theconcept of exploration and exploitation as well as tothe managerial praxis of innovation portfolio man-agement. Even though product and process innova-tions are widely regarded as important categoriesof innovative activity, no other study investigatedthe exploration–exploitation relationship with newproduct performance separately for product andprocess innovations so far. Our managerial contribu-tion provides practitioners of the chemical, and morebroadly of the process industries, with uniqueinsights into the relationship between R&D budgetallocation and new product performance. Further-more, the use of real internal financial accountingdata for this study allows managers to compare theircurrent R&D budget allocation practice with theresults of this study, which might offer helpfulinsights for their future practice.
Acknowledgement
The first author thanks the Hanns-Seidel-Foundationand the BMBF for generous financial support. Bothauthors are grateful for helpful comments from JohanFrishammar and Thomas Lager as well as from twoanonymous reviewers on earlier versions of thispaper.
References
Abernathy, W.J. and Utterback, J.M. (1978) Patterns ofindustrial innovation. Technology Review, June/July,40–47.
Aboody, D. and Lev, B. (2001) R&D Productivity in theChemical Industry. Washington, DC: The Council ofChemical Research.
Achilladelis, B., Schwarzkopf, A., and Cines, M. (1987) Astudy of innovation in the pesticide industry: analysis ofthe innovation record of an industrial sector. ResearchPolicy, 16, 175–217.
Achilladelis, B., Schwarzkopf, A., and Cines, M. (1990)The dynamics of technological innovation: the case ofthe chemical industry. Research Policy, 19, 1–34.
Exploration and exploitation in product & process innovation
© 2013 The AuthorsR&D Management © 2013 John Wiley & Sons Ltd
R&D Management 43, 3, 2013 209
Arora, A., Ceccagnoli, M., and Da Rin, M. (2004) Corpo-rate restructuring and R&D: a panel data analysis for thechemical industry. In: Cesaroni, F., Gambardella, A.,and Garcia-Fontes, W.A. (eds), R&D, Innovation andCompetitiveness in the European Chemical Industry.Boston: Springer. pp. 69–90.
Baldwin, J., Hanel, P., and Sabourin, D. (2002) Determi-nants of innovative activity in Canadian manufacturingfirms. In: Kleinknecht, A. and Mohnen, P. (eds), Inno-vation and Firm Performance. London: Palgrave. pp.86–111.
Barnett, B.D. and Clark, K.B. (1996) Technologicalnewness: an empirical study in the process industries.Journal of Engineering and Technology Management –JET-M, 13, 3–4, 263–282.
Barrett, A. (2003) DuPont tries to unclog a pipeline.Bloomberg Businessweek Magazine. http://www.businessweek.com/stories/2003-01-26/dupont-tries-to-unclog-a-pipeline, posted on January 26, 2003.
Belderbos, R., Faems, D., Leten, B., and Van Looy, B.(2010) Technological activities and their impact on thefinancial performance of the firm: exploitation andexploration within and between firms. The Journal ofProduct Innovation Management, 27, 869–882.
Benner, M.J. and Tushman, M. (2002) Process manage-ment and technological innovation: a longitudinal studyof the photography and paint industries. AdministrativeScience Quarterly, 47, 4, 676–706.
Brambor, T., Clark, W.R., and Golder, M. (2006) Under-standing interaction models: improving empirical analy-ses. Political Analysis, 14, 1, 63–82.
Brown, S.L. and Eisenhardt, K.M. (1995) Product devel-opment: past research, present findings, and futuredirections. Academy of Management Review, 20, 343–378.
Carte, T.A. and Russell, C.J. (2003) In pursuit of modera-tion: nine common errors and their solutions. MIS Quar-terly, 27, 3, 479–501.
Cefic – The European Chemical Industry Council. (2011)Facts and figures 2011 – the European chemical industryin a worldwide perspective, report, Brussels.
Cesaroni, F., Gambardella, A., and Garcia-Fontes, W.(2004) R&D, Innovation and Competitiveness in theEuropean Chemical Industry. Boston: Springer.
Chao, R.O. and Kavadias, S. (2008) A theoretical frame-work for managing the new product developmentportfolio: when and how to use strategic buckets. Man-agement Science, 54, 907–921.
Cohen, J., Cohen, P., West, S.G., and Aiken, L.S.(2003) Applied Multiple Regression/CorrelationAnalysis for the Behavioral Sciences. Hillsdale, NJ:Erlbaum.
Cohen, W.M. and Klepper, S. (1996) Firm size and thenature of innovation within industries: the case ofprocess and product R&D. The Review of Economicsand Statistics, 78, 2, 232–243.
Cohen, W.M. and Levinthal, D.A. (1989) Innovation andlearning: two faces of R&D. Economic Journal, 99,569–596.
Cohen, W.M. and Levinthal, D.A. (1990) Absorptivecapacity: a new perspective on learning and innovation.Administrative Science Quarterly, 35, 128–152.
Cooper, R.G., Edgett, S.J., and Kleinschmidt, E.J. (1999)New product portfolio management: practices and per-formance. The Journal of Product Innovation Manage-ment, 16, 333–351.
Damanpour, F. and Aravind, D. (2006) Product and processinnovations: a review of organizational and environmen-tal determinants. In: Hage, J. and Meeus, M. (eds), Inno-vation, Science, and Industrial Change – A ResearchHandbook. Oxford: Oxford University Press.
Damanpour, F. and Gopalakrishnan, S. (2001) The dynam-ics of the adoption of product and process innovations inorganizations. Journal of Management Studies, 38,45–66.
Danneels, E. (2002) The dynamics of product innovationand firm competences. Strategic Management Journal,23, 12, 1095–1121.
Echambadi, R. and Hess, J.D. (2007) Mean-centering doesnot alleviate collinearity problems in moderated multipleregression models. Marketing Science, 26, 3, 438–445.
Edquist, C., Hommen, L., and McKelvey, M. (2001) Inno-vation and Employment: Process versus Product Inno-vation. Northampton: Edward Elgar Publishing, Inc.
Eisenhardt, K.M. and Martin, J.A. (2000) Dynamic capa-bilities: what are they? Strategic Management Journal,21, 1105–1121.
Ennen, E. and Richter, A. (2010) The whole is more thanthe sum of its parts- or is it? A review of the empiricalliterature on complementarities in organizations.Journal of Management, 36, 207–233.
Frishammar, J., Kurkkio, M., Abrahamsson, L., and Lich-tenthaler, U. (2012) Antecedents and consequences offirms’ process innovation capability: a literature reviewand a conceptual framework. Engineering Management,IEEE Transactions on, 99, 1–11.
Ghemawat, P. (1984) Capacity expansion in the titaniumdioxide industry. The Journal of Industrial Economics,33, 2, 145–163.
Gibson, C.B. and Birkinshaw, J. (2004) The antecedents,consequences, and mediating role of organizationalambidexterity. Academy of Management Journal, 47,209–226.
Gopalakrishnan, S., Bierly, P., and Kessler, E.H. (1999) Areexamination of product and process innovations usinga knowledge-based view. Journal of High TechnologyManagement, 10, 147–166.
Gupta, A.K., Smith, K.G., and Shalley, C.E. (2006)The interplay between exploration and exploitation.Academy of Management Journal, 49, 693–706.
Hagedoorn, J. and Wang, N. (2012) Is there complementa-rity or substitutability between internal and externalR&D strategies? Research Policy, 41, 6, 1072–1083.
Hayes, A.F. and Cai, L. (2007) Using heteroskedasticity-consistent standard error estimators in OLS regression:an introduction and software implementation. BehaviorResearch Methods, 39, 709–722.
Manuel Bauer and Jens Leker
210 R&D Management 43, 3, 2013 © 2013 The AuthorsR&D Management © 2013 John Wiley & Sons Ltd
He, Z.-L. and Wong, P.-K. (2004) Exploration vs. exploi-tation: an empirical test of the ambidexterity hypothesis.Organization Science, 15, 481–494.
Henderson, J. and Cool, K. (2003) Learning to time capac-ity expansions: an empirical analysis of the worldwidepetrochemical industry, 1975–95. Strategic Manage-ment Journal, 24, 5, 393–413.
Hutcheson, P., Pearson, A.W., and Ball, D.F. (1995) Inno-vation in process plant: a case study of ethylene. TheJournal of Product Innovation Management, 12, 415–430.
Jansen, J.J.P., Van Den Bosch, F.A.J., and Volberda, H.W.(2006) Exploratory innovation, exploitative innovation,and performance: effects of organizational antecedentsand environmental moderators. Management Science,52, 11, 1661–1674.
Kessler, E.H., Bierly, P.E., and Gopalakrishnan, S. (2000)Internal vs. external learning in new product develop-ment: effects on speed costs and competitive advantage.R&D Management, 30, 213–223.
Klepper, S. (1997) Industry life cycles. Industrial and Cor-porate Change, 6, 145–182.
Kraft, K. (1990) Are product and process innovations inde-pendent of each other? Applied Economics, 22, 1029–1038.
Kurkkio, M., Frishammar, J., and Lichtenthaler, U. (2011)Where process development begins: a multiple casestudy of front end activities in process firms. Technova-tion, 31, 490–504.
Lager, T. (2002a) A structural analysis of process develop-ment in process industry: a new classification system forstrategic project selection and portfolio balancing. R&DManagement, 32, 87–95.
Lager, T. (2002b) Product and process development inten-sity in process industry: a conceptual and empiricalanalysis of the allocation of company resources for thedevelopment of process technology. InternationalJournal of Innovation Management, 6, 105–130.
Leker, J. and Herzog, P. (2004) Marketing in der che-mischen Industrie. In: Backhaus, K. and Voeth, M.(eds), Handbuch Industriegütermarketing. Wiesbaden:Gabler.pp. 1171–1193.
Leonard-Barton, D. (1992) Core capabilities and corerigidities: a paradox in managing new product develop-ment. Strategic Management Journal, 13, 111–125.
Levinthal, D.A. and March, J.G. (1993) The myopia oflearning. Strategic Management Journal, 14, 95–112.
Lieberman, M.B. (1984) The learning curve and pricing inthe chemical processing industries. The Rand Journal ofEconomics, 15, 2, 213–228.
Lim, L.P.L., Garnsey, E., and Gregory, M. (2006) Productand process innovation in biopharmaceuticals: a new per-spective on development. R&D Management, 36, 27–36.
Linn, R.A. (1984) Product development in the chemicalindustry: a description of a maturing business. The Journalof Product Innovation Management, 1, 116–128.
Loch, C.H. and Kavadias, S. (2002) Dynamic portfolioselection of NPD programs using marginal returns.Management Science, 48, 1227–1241.
Lubatkin, M.H., Simsek, Z., and Ling, Y. (2006) Ambidex-terity and performance in small-to medium-sized firms:the pivotal role of top management team behavioral inte-gration. Journal of Management, 32, 646–672.
Maine, E. (2008) Radical innovation through internal cor-porate venturing: Degussa’s commercialization of nano-materials. R&D Management, 38, 4, 359–371.
Mansfield, E. (1981) Composition of R and D expendi-tures: relationship to size of firm, concentration, andinnovative output. The Review of Economics and Statis-tics, 63, 4, 610–615.
March, J.G. (1991) Exploration and exploitation in organi-zational learning. Organization Science, 2, 71–87.
Martinez-Ros, E. (2000) Explaining the decisions to carryout product and process innovations: the Spanish case.Journal of High Technology Management Research, 10,223–242.
Milgrom, P. and Roberts, J. (1995) Complementarities andfit strategy, structure, and organizational change inmanufacturing. Journal of Accounting and Economics,19, 179–208.
Montoya-Weiss, M.M. and Calatone, R. (1994) Determi-nants of new product performance: a review andmeta-analysis. The Journal of Product Innovation Man-agement, 11, 397–417.
OECD. (2005) Oslo Manual Guidelines for Collecting andInterpreting Innovation Data (Measurement of Scientificand Technological Activities, 3rd edn. Paris: OECD.
Penrose, E. (1959) The Theory of the Growth of the Firm.Oxford Scholarship Online Monographs.
Pisano, G.P. (1994) Knowledge, integration, and thelocus of learning: an empirical analysis of processdevelopment. Strategic Management Journal, 15,85–100.
Pisano, G.P. (1997) The Development Factory: Unlockingthe Potential of Process Innovation, The DevelopmentFactory: Unlocking the Potential of Process Innovation.Boston, MA: Harvard Business School Press.
Pisano, G.P. and Wheelwright, S.C. (1995) The new logicof high-tech R&D. Harvard Business Review, 73,93–105.
Raisch, S. and Birkinshaw, J. (2008) Organizational ambi-dexterity: antecedents, outcomes, and moderators.Journal of Management, 34, 375–409.
Reichstein, T. and Salter, A. (2006) Investigating thesources of process innovation among UK manufacturingfirms. Industrial and Corporate Change, 15, 653–682.
Rothaermel, F.T. and Alexandre, M.T. (2009) Ambidexter-ity in technology sourcing: the moderating role ofabsorptive capacity. Organization Science, 20, 759–780.
Saha, S. (2007) Consumer preferences and product andprocess R&D. The RAND Journal of Economics, 38,250–268.
Schumpeter, J.A. (1934) Theory of Economic Develop-ment. New Brunswick: Transaction Publishers.
Simonetti, R., Archibugi, D., and Evangelista, R. (1995)Product and process innovations: how are they defined?How are they quantified? Scientometrics, 32, 77–89.
Exploration and exploitation in product & process innovation
© 2013 The AuthorsR&D Management © 2013 John Wiley & Sons Ltd
R&D Management 43, 3, 2013 211

Simsek, Z., Heavey, C., and Veiga, J.F. (2009) A typologyfor aligning organizational ambidexterity’s conceptuali-zations, antecedents, and outcomes. Journal of Manage-ment Studies, 46, 864–894.
Sinclair, G., Klepper, S., and Cohen, W. (2000) What’sexperience got to do with it? Sources of cost reductionin a large specialty chemicals producer. ManagementScience, 46, 1, 28–45.
Turrisi, R. and Jaccard, J. (2003) Interaction Effects inMultiple Regression. Incorporated: Sage Publications.
Tushman, M.L. and Smith, W.K. (2002) Organizationaltechnology. In: Baum, J. (ed.), Companion to Organiza-tion. Malden, MA: Blackwell.pp. 386–414.
Utterback, J.M. and Abernathy, W.J. (1975) A dynamicmodel of process and product innovation. Omega: TheInternational Journal of Management Science, 3, 639–656.
Van Rooij, A. (2008) How R&D helped transform DSM.Research Technology Management, 51, 1, 43–48.
West, S.G. and Aiken, L.S. (1991) Multiple Regression:Testing and Interpreting Interactions. Incorporated:Sage Publications.
White, H. (1980) A heteroskedasticity-consistent covari-ance matrix estimator and a direct test for heteroskedas-ticity. Econometrica, 48, 4, 817–838.
Notes
1. The absorptive capacity literature stream (Cohen and Lev-inthal, 1989, 1990) highlights external knowledge sourc-ing as an important source for innovation performancewhen combined with appropriate internal R&D efforts.
2. Due to the rather low number of observations, we alsoconducted a bootstrapping analysis for all models,which confirmed all results as presented here; boot-strapped results are available from the first author uponrequest.
Jens Leker is Full Professor and Director of theInstitute of Business Administration at the Depart-ment of Chemistry and Pharmacy, University ofMünster, Germany. His research interests are themanagement of innovation in R&D-heavy industrieslike the chemical and pharmaceutical industry as wellas corporate accounting. He is the Editor-in-Chief ofthe Journal of Business Chemistry and has publishedin several peer-reviewed journals including Interna-tional Journal of Innovation Management, R&DManagement, Scandinavian Journal of Management,Schmalenbach Business Review (sbr), TechnologicalForecasting & Social Change, Zeitschrift fürBetriebswirtschaft (ZFB).
Manuel Bauer is a PhD candidate at the Instituteof Business Administration in the Department ofChemistry and Pharmacy, University of Münster,Germany. He graduated in Chemistry from the Uni-versity of Würzburg and collected professional expe-rience at an international consultancy firm as well asin the chemical industry. His research focus is onstrategic innovation portfolio management in thechemical industry.
Manuel Bauer and Jens Leker
212 R&D Management 43, 3, 2013 © 2013 The AuthorsR&D Management © 2013 John Wiley & Sons Ltd