lessons from 238 companies: senior management, exploitation, exploration, and corporate...
TRANSCRIPT

LESSONS FROM 238 COMPANIES: SENIOR MANAGEMENT,EXPLOITATION, EXPLORATION, AND CORPORATE
ENTREPRENEURSHIP PERFORMANCE
Heidi Bertels, Stevens Institute of Technology, USPeter Koen, Stevens Institute of Technology, US
Elko Kleinschmidt, McMaster University, Canada
ABSTRACT
We develop and empirically test an explanatory model consisting oforganizational resources, corporate entrepreneurship routines and predevelopment performance based on data obtained from 238 business units in large companies. We found a significant relationship between “long term organizational resources” vision and climate, and “short term organizational resources” strategy and resource commitment. Further, our results confirm the relatedness of opportunity recognition and performance, but do notsupport evidence for the importance of a business plan. We also provide an empirical test of the importance of other predevelopment routines which are less well-studied and present our model for exploitative versus explorative projects.
INTRODUCTION
New business creations in large corporations have the potential to change organizations and provide sustained profitability (Block & MacMillan, 1993; Chesbrough, 2000). Despitethe importance of new business creation, relatively little attention has been given to the process by which new businesses are created. This study focuses on the entrepreneurial routines that constitute the process of business creation, their antecedents (organizational resources) and consequences (performance). Given the importance of the early stages of the process to overall innovation performance (Bacon, Beckman, Mowery,& Wilson, 1994), we focus on the predevelopment portion of new business creation, which precedes development and commercialization (e.g. Moenaert, De Meyer, Souder, & Deschoolmeester, 1995). Opportunity recognition, opportunity

evaluation and refinement and framing (Zahra, 1991) are all parts of predevelopment.
The area of opportunity recognition has received considerablescholarly attention (Busenitz, 1996; P. S. Christensen & Peterson,1990; Zietsma, 1999). Relatively less attention has been focused on the stages in the process subsequent to opportunity recognition. In this paper we will broaden the set of entrepreneurial routines under consideration including stages following opportunity recognition, for example idea generation andconcept definition (Koen et al., 2001). We also observe that the relationship between corporate entrepreneurship and business strategy is rarely discussed in the academic literature and when it is, it is confusing. For example, while corporations are strongly advised to be strategic in the corporate entrepreneurshippractices on the one hand, it is simultaneously suggested that strategy and corporate entrepreneurship can exist as independent phenomena (Covin & Miles, 2007). Given these seemingly irreconcilable recommendations, we empirically investigate the relationship between business strategy and corporate entrepreneurship. Further, we observe that research on organizational resources (such as vision, climate, strategy and resources) and the entrepreneurial process have developed in parallel and are not integrated. It is not clear how organizational resources are related to corporate entrepreneurshiproutines and how their combined effect influences predevelopment performance. Therefore we have paid attention in this research project to develop an integrative model which includes both organizational resources and elements of the entrepreneurial process. Moreover, we distinguish between exploitative and explorative entrepreneurship and develop separate models for each.Exploitative behavior focuses on cost reductions and repositionings, improvements and revisions to existing products and/or additions to existing product lines while explorative behavior refers to new product lines for existing or new markets with existing or new technologies and new-to-the-world projects. Exploration and exploitation are both important competencies for the organization but require different learning behavior (March, 1991), hence they may relate differently to organizational resources and predevelopment performance.
This paper contributes to the extant literature in multiple ways. First, we examine the importance of the entrepreneurial process and pay attention to routines beyond opportunity recognition. Our study allows us to examine the importance of ideageneration and concept definition relative to opportunity recognition. Second, we research the relationship between businessstrategy and corporate entrepreneurship routines in predevelopmentby empirically investigating if and how they are connected. Thirdly, our research integrates the seemingly disparate streams of research which seem to isolate organizational resources (i.e. vision, climate, strategy and organizational resources) from corporate entrepreneurship routines in predevelopment (opportunityrecognition, idea generation and concept definition). We provide aconceptual integration of these two themes followed by an empirical test of the proposed explanatory mechanisms. Finally, weexamine the relative importance of predevelopment routines in bothexploitation and exploration projects. Given the importance for organizations to be competent in both exploration and exploitation(March, 1991; Tushman & O'Reilly, 1996) and the suggestion of a number of researchers (e.g. Gaglio & Katz, 2001; Shepherd & DeTienne, 2005) that opportunity recognition is different for exploitative and explorative projects, we provide an empirical test under both situations.
THEORY
In this paper, we focus on the predevelopment stage where themajority of the corporate entrepreneurship routines occur (including opportunity recognition, opportunity evaluation and refinement and framing (Zahra, 1991)). The predevelopment stage typically concludes with a detailed specification which determinesthe key requirements to meet both customer and manufacturing constraints. In the next stage the company will build the necessary capabilities to be able to produce the product reliably in large quantities. And in the final stage the product will be commercialized. We define three principal routines occurring in the predevelopment: opportunity recognition, idea generation and concept development. Kirzner (1997) defined an opportunity as an “imprecisely-defined market need or underemployed resources or capabilities.” For our purpose, we more specifically define opportunity as “a business or technology gap that a corporate entrepreneur realizes, by design or accident, that exists between

the current situation and an envisioned future in order to capturecompetitive advantage by responding to a threat, solving a problemor ameliorating a difficulty. We define an idea as the most embryonic form of a new product or service. It often entails a high level view of the envisioned solution needed to solve the problem identified by the opportunity. And finally we define a concept as having a well-defined form including both a written and visual description, which includes its primary features and customer benefits combined with a broad understanding of the technology needed. The last stage can be equated with the completion of a business plan. We prefer the use of the term concept because a completed concept, with written and pictorial descriptions, allows the new product or service to enter the routine part of the development process. We believe that these more precise definitions help to overcome the potential confusion between opportunity recognition where the corporate entrepreneur identifies an unmet customer need and idea generation where specific ideas which potentially respond to the opportunity are generated.
Predevelopment routines are nested in the corporate organizational resources as corporate routines or capabilities andare influenced by firm factors such as vision, climate, strategy and resource commitment. The underlying premise for this view rests on the resource based view (RBV) (Wernerfelt, 1984) of the firm indicating that such resources controlled by the firms are heterogeneous and relatively immobile and that building such advantages takes time and has to be dynamically adjusted over time(Pettus, 2001; Smith, Collins, & Clark, 2005). One can think of organizational resources as determinant of the efficiency with which a firm uses its inputs (i.e. vision, climate, strategy and resource commitment) and converts them into whatever output is desired (Adner & Helfat, 2003; Dutta, Narasimhan, & Rajiv, 2005) via its routines/capabilities (Eisenhardt & Martin, 2000; Teece, Pisano, & Shuen, 1997). The basic premise is that organizational resources increase the efficiency and effectiveness of firms(Barney, 1991). Thus, a firm’s organizational resources becomes valuable if they allow the firm to “exploit opportunities or neutralize threats” in the firm’s environment (Barney, 1991; Russo& Fouts, 1997). Overall we posit that the organizational resourcesmay be divided on a hierarchical basis into those which require a longer term respective (i.e. vision and climate) from those which

are relatively easy to change on a yearly or bi-yearly basis (i.e.strategy and resource commitment). The basic underlying model structure is that the impact of background resources is fully mediated via the predevelopment routines/capabilities which directly impact outcome.
“Organizational capabilities” are processes that are embedded in firms; they are ways of organizing and getting things done. They are identifiable, specific routines (Eisenhardt & Martin, 2000) as well as patterns of current practices and learning, including routines for planning, controlling, coordinating, task completion, and information gathering and processing, which are viable across multiple products and/or markets (Pringle & Kroll, 1997; Teece, Pisano, & Shuen, 1997). Forthe performance of an activity to constitute a “capability”, it must have reached some threshold level of practiced or routine activity and at a minimum must work in a reliable manner (Helfat &Peteraf, 2003). “Organizational resources”, on the other hand, areseen less as being productive in themselves, and more as working through a firm’s ability to assemble, integrate and manage them via organizational capabilities (Eisenhardt & Martin, 2000).
In order to further frame the study we used Miles and Covin’s(2002) schema where they divide corporate entrepreneurship routines into four segments depending on whether the focus of the entrepreneurship routines are internal or external to the corporation and whether the investments are made through the corporations existing operating budget or draws on indirect investment. Our study is focused on internal corporate entrepreneurship routines where investments are made through the corporations existing operating budget.
A MODEL FOR PREDEVELOPMENT
Figures 1 and 2 present our mediated models of corporate entrepreneurship for exploitation and exploration, respectively. In line with our previous discussions, and the underlying RBV of the firm, we divide each of the corporate entrepreneurship models into three broad elements: (1) organizational resources; (2) predevelopment routines/capabilities and (3) predevelopment performance. Organizational resources are further divided into those which are deeply rooted in the organization and difficult to

change (i.e. vision and climate) from those that are more easily changed (i.e. strategy and resources). Both models are the same, expect for the predevelopment routines. The predevelopment routines for exploitation are focused on understanding and leveraging the businesses current market space. In contrast predevelopment exploration routines are focused on growing the existing business into entirely new opportunities and new businessmodels.
Organizational Resources – Long Term Perspective
Vision. Popular and academic work indicates the importance of vision at an organizational level (Brown & Eisenhardt, 1995; Hamel & Prahalad, 1989). There has been much less scholarship and few empirical studies looking at the importance of visioning to the innovation process. Kuratko, Ireland, & Hornsby (2001: 61) assert that the most important factors determining innovation performance are the“…firm’s ability to establish a vision and for top management to support it.” However, there have been no empirical studies in the nascent literature evaluating the importance of the organization’s vision to the predevelopment innovation efforts. We believe that being successful in predevelopment requires a vision of a desired future state. Predevelopment, as opposed to the development part of the innovation process, is much more chaotic. New insights continuously emerge, but these new insights need tobe guided by a clear vision of the future state of the company.
Hypotheses 1a: Business units with a clear predevelopment vision are associated with more effective predevelopment strategy.Hypotheses 1b. Business units with a clear predevelopment vision spend more predevelopment resources.
In a similar way climate is antecedent to strategy and resource commitment. Climate is defined as the recurring patterns of behavior, attitudes, and feelings that characterize life in the organization (Ekvall, 1987). Although climate is perceived by individuals within the workplace, it exists independently of these perceptions and is viewed as an attribute of the organization (Ekvall,

1987). Climate may be thought of as both normative and stable and embodies the deeper and more enduring values, norms, and beliefs within the organization (Ekvall, 1996; Schneider, Brief, & Guzzo, 1996) and as such is difficult tochange. The overall strategy set by a business unit is determined by the organizational norms and background experiences (Hambrick & Mason, 1984). Likewise the climate will determine how the organizational resources will be expended (Calantone, Cavusgil, Schmidt, & Shin, 2004). Thus,similar to vision, we hypothesize climate to affect predevelopment strategy and resource commitment.
Hypothesis 2a. Business units with a favorable innovation climate are associated with a more effective predevelopment strategy.Hypotheses 2b. Business units with a favorable innovation climate spend more predevelopment resources.
Organization Resources – Short Term Perspective
Strategy. According to RBV, the resource endowment of the firm is the principal source of its strategic options and its ultimate performance. Of particular importance are the “strategic resources”—that is, those intangible elements of the resource set such as the firm’s management experience, know-how and behavioral approach (Barney & Zajac, 1994). The positive correlation between innovation outcome and a well-defined innovation strategy is well-established in the literature. Brown & Eisenhardt (1995: 370) concluded that successful projects are the result of meshing together firm competencies and strategies. This is supported by McEvily & Chakravarthy (2002) who state that firms which have a strategy of consistently introducing new products are better able to sustain both minor and major performance advantages.
Hypothesis 3a (3b and 3c). Business units with a defined predevelopment strategy are associated with higher levels of opportunity recognition (idea generation and concept definition) in exploitation.Hypotheses 4a (4b, 4c, 4d and 4e). Business units with a defined predevelopment strategy are associated with higher levels of opportunity recognition (customer inspired idea generation. technology inspired idea generation, improved idea selection and concept experimentation) in exploration.
Resource Commitment. Resource commitment is essential for

successful new product development (Brown & Eisenhardt, 1995; Dougherty & Hardy, 1996). This support is needed to for fast and productive product development (Brown & Eisenhardt, 1995; Katz & Allen, 1985; Zirger & Maidique, 1990). Studies of correlates of innovation performance indicate that success is associated with programs which are supported with sufficient resources (see meta-analysis: Henard & Szymanski, 2001). The resource system feeding the innovation process, including predevelopment routines, should not rely on the availability of slack resources (extra padding, orlooseness in normal practice; Dougherty & Hardy (1996) and Singh(1986)), rather, funds should be deliberately allocated.
Hypothesis 5a (5b and 5c). Business units with a higher resource commitment are associated with higher levels of opportunity recognition (idea generation and concept definition) in exploitation.Hypotheses 6a (6b, 6c, 6d and 6e). Business units with a higher resource commitment are associated with higher levels of opportunity recognition (customer inspired idea generation, technology inspired idea generation, improved idea selection and concept experimentation) in exploration.
Predevelopment Routines/Capabilities
Opportunity Recognition. For exploitation projects the market opportunity is well understood by the company since it is based onits current customer using current technology built on the company’s existing strengths and value chain. Opportunity recognition for exploitation, therefore, requires collecting the proper information from primarily existing customers/markets with a formally established process. It further requires analysis of the collected data and translation of customer/market requirementsinto new ideas, primarily for product improvements (Frank, Gertz, & Porter, 1996). For opportunity projects, the customer may or maynot be able to articulate his needs (Von Hippel, Thomke, & Sonnack, 1999), however, he or she may be able to recognize an opportunity’s value once it is presented to them. Market potentialfor exploration projects is extremely difficult to assess. Exploration projects typically fulfill needs in markets at the fringes of the existing and may be disruptive to existing businessmodels and/or technologies (Christensen & Raynor, 2003). Leifer etal. (2000) and Lynn, Morone, & Paulson (1996) both indicate that there are too many unknowns to accurately understand customer needs and that a process of market learning is needed.

Hypothesis 7a: A formal and consistently applied opportunity recognition process for exploitation projects is associated with higher levels of predevelopment performance.Hypothesis 8a: An understanding of the current, emerging and disruptive marketsand businesses (i.e exploration opportunity recognition) for exploration projects is associated with higher levels of predevelopment performance.
Idea Genesis. Ideas begin as simple concepts which embody the features and benefits that can satisfy the perceived opportunities. The idea may be developed by an individual or a team. In addition the best ideas often morph and improve when theyare built upon by multiple people within the organization. Thus for exploitation projects it is important to be able to manage theidea generation process. The approach should permit time for reflection and further development through organizational dialogueand debates (Henry, 1991; McAdam & McClelland, 2002; Titus, 2000).In contrast the ideas for exploration projects are much more amorphous and require understanding of unarticulated needs. Often the ideas will be developed based on extensive observations of thecustomer in his or her environment. Alternatively, the new idea can come from assessing new or emering technologies which providesentirely new features and benefits to the market. Further the ideaselection process becomes more difficult to accomplish since many of the ideas are incomplete and are based on assumptions.
Hypothesis 7b: A formal and consistently applied idea generation process for exploitation projects is associated with higher levels of predevelopment performanceHypothesis 8b: An idea genesis process for exploration projects which makes use ofobserving the customer in his or her own environment is associated with higher levels of predevelopment performanceHypothesis 8c An idea genesis process for exploration projects which integrates new or emerging technology is associated with higher levels of predevelopment performanceHypothesis 8d. An idea selection process for exploration projects which evaluates the overall reward/risk of the different projects is associated with higher levels of predevelopment performance
Concept Definition. The concept definition defines the scope of the project, the target market, the product concept itself (what will the project be and do), the benefits to be delivered, the

positioning strategy and the product specifications. Cooper and Kleinschmidt (e.g. Cooper & Kleinschmidt, 1997) have established in numerous studies the importance of a sharp and early product - and project definition to performance in exploitation projects. A solid concept definition is one of the key differences between winning and losing at new products (see for example Cooper (2001),Montoya-Weiss & Calantone (1994)).
Hypothesis 7c: A formal concept definition process for exploitation projects is associated with higher levels of predevelopment performance.
In contrast, exploration projects’ concept definition should be based on more exploratory and adaptive processes where the developers can learn through experimentation which concepts have the greatest likelihood of success with a multitude of ideas, and to identify undesirable features. The results of these experimentations lead to the definition of the concept. Experimentation has been identified as fundamental to the learningprocess in areas of exporative new product development (Lynn, Morone, & Paulson, 1996). March (1991) also advocates that exploration and adaptation is critical to managing environmental uncertainties.
Hypothesis 8e: A concept definition process which embraces experimentation is associated with higher levels of predevelopment performance.
METHOD
Procedures and Sample
Data have been collected from respondents representing 244 business units. The overall response rate was 75%. Respondents hadextensive involvement in and an appropriate knowledge level about the business unit’s corporate entrepreneurship programs. The average number of years (1) with the business was 12.5 years (minimum 1 year), (2) in product development including predevelopment routines was 13.5 (minimum is 1 year). Thus, bias was minimized for retrospective data (Miller, Cardinal, & Glick, 1997) by 1) surveying managers who actually participated in corporate entrepreneurship routines, 2) limiting the recall frame to a three-year period (see stability of retrospective reports;(Huber & Power, 1985); and 3) ensuring confidentiality to all

respondents. The median respondent business unit reported $1.05 billion in annual sales revenue and 4.0% in annual R&D investment.
Measures
All variables were measured on a 7-point scale ranging from 1to 7, except for the control variables (size and R&D intensity). Aperceived measure of performance was used because it permits comparisons across firms, based on managerial assessments within their own industry. The validity of this approach is supported by work that has shown perceived measures to be highly correlated with object performance (Song & Parry, 1997). Use of self-report data is a common practice in management research and has led to the so-called “common method variance” problem. There are several explanations why method variance should not substantially affect our results. First, self-report data are most problematic for topics that generate strong sentiments, such as attitudes (Cote & Buckley, 1987). New product performance is a much less emotionallyladen subject and hence less likely to be distorted by self-reports. Second, social desirability bias often leads to compressed ranges in responses (Podsakoff & Organ, 1986), which was not evident in our sample. Third, Lukas and Ferrell (2000) andPodsakoff and Organ (1986) found that managers rely on their own self-reports and provide reliable and objective data. Consequently, we would not expect our results to be contaminated by common method variance problems. To evaluate the threat of common method variance, we used Harman’s one-factor test (Harman, 1967; Podsakoff & Organ, 1986). Harman’s one-factor test gave us confidence that common method variance would not be problematic for exploitation (first factor accounted for 31.73%; total variance accounted for by all factors: 75.91 %) and exploration (first factor accounted for 30.59%; total variance accounted for by all factors: 69.51%).
Analysis
Because of significant skewness and kurtosis in the control variables, we performed a logarithmic transformation on these variables. We looked for univariate outliers by means of standard deviations. They were all within acceptable range. We encountered six multivariate outliers by means of Mahalanobis distance and deleted them, retaining 238 cases. We also decided to delete those
cases that had missing data for R&D intensity (29 cases) since missing data was found to be systematic for this construct. This resulted in a final sample of 209 cases in which no variable had more than 5 % missing data. The results reported below are based on the 209 cases only. We have summarized the values for internal consistency (coefficient alpha), principal component analysis and the items for all constructs in table 1.
Table 2a (2b) presents the correlation matrix and descriptivestatistics of the measures for exploitation (exploration). The correlations among the resources and the dependent variable differsomewhat because we deployed listwise deletion resulting in slightly different samples. As expected, there was some correlation among the predictors. However, the small to moderate magnitude (there are no correlations greater than 0.55) of the observed correlations suggests that these variables have a good deal of variance not held in common and therefore are not simply redundant measures.
Measurement Model
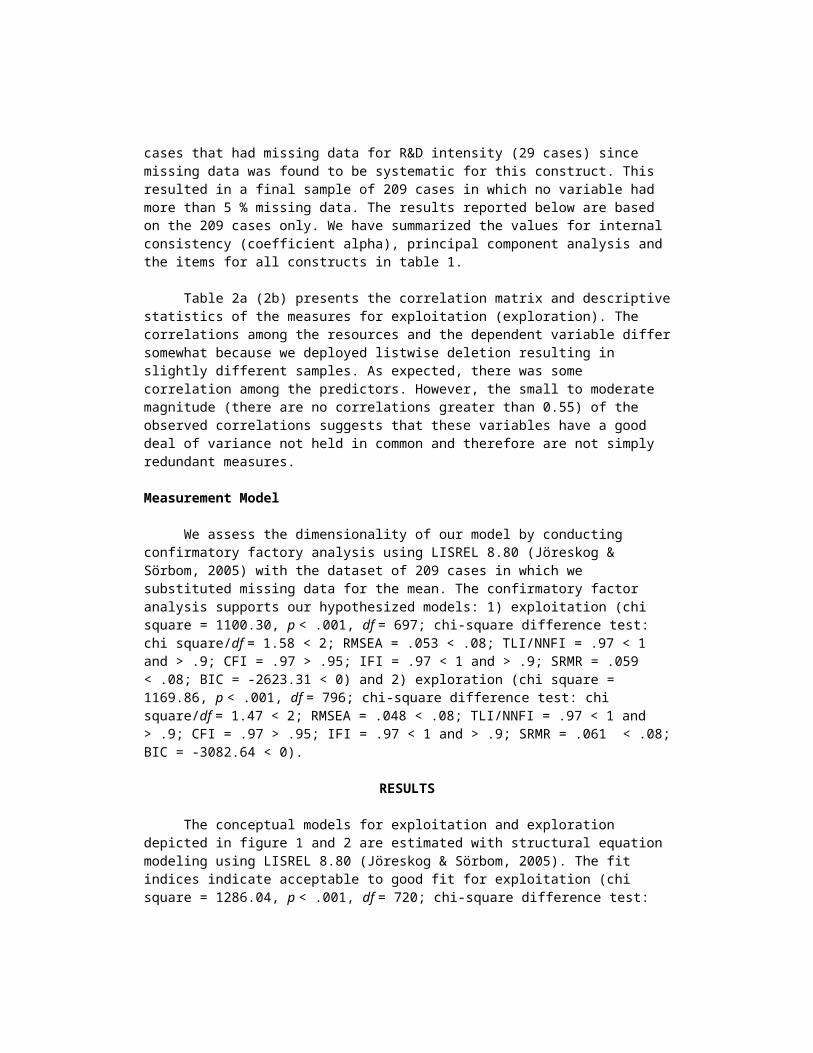
We assess the dimensionality of our model by conducting confirmatory factory analysis using LISREL 8.80 (Jöreskog & Sörbom, 2005) with the dataset of 209 cases in which we substituted missing data for the mean. The confirmatory factor analysis supports our hypothesized models: 1) exploitation (chi square = 1100.30, p < .001, df = 697; chi-square difference test: chi square/df = 1.58 < 2; RMSEA = .053 < .08; TLI/NNFI = .97 < 1 and > .9; CFI = .97 > .95; IFI = .97 < 1 and > .9; SRMR = .059 < .08; BIC = -2623.31 < 0) and 2) exploration (chi square = 1169.86, p < .001, df = 796; chi-square difference test: chi square/df = 1.47 < 2; RMSEA = .048 < .08; TLI/NNFI = .97 < 1 and > .9; CFI = .97 > .95; IFI = .97 < 1 and > .9; SRMR = .061 < .08;BIC = -3082.64 < 0).
RESULTS
The conceptual models for exploitation and exploration depicted in figure 1 and 2 are estimated with structural equation modeling using LISREL 8.80 (Jöreskog & Sörbom, 2005). The fit indices indicate acceptable to good fit for exploitation (chi square = 1286.04, p < .001, df = 720; chi-square difference test:

chi square/df = 1.786 < 2; RMSEA = .061 < .08; TLI/NNFI = .96 < 1 and > .9; CFI = .96 > .95; IFI = .96 < 1 and > .9; SRMR = .089 > .08 but < 0.10; BIC = -2560.44 < 0) and good fit for exploration(chi square = 1283.79, p < .001, df = 834; chi-square difference test: chi square/df = 1.539 < 2; RMSEA = .051 < .08; TLI/NNFI = .96< 1 and > .9; CFI = .96 > .95; IFI = .96 < 1 and > .9; SRMR = .078< .08; BIC = -3171.72 < 0).
The results in figure 1 and figure 2 indicate that vision hasa highly significant, direct impact on strategy (γ = .49 (exploitation); γ = .50 (exploration), p < .01) and resources (γ =.35 (exploitation); γ = .35 (exploration), p < .01), supporting hypotheses 1a and 1b. Climate is found to be marginally related tostrategy (γ = .16 (exploitation), γ = .15 (exploration), p < .10) and significantly related to resources (γ = .19 (exploitation), γ = .17 (exploration), providing weak support for H2a and support for H2b. We also find support for hypotheses 3 and 4, with strategy significantly impacting all exploitation and exploration corporate entrepreneurship routines. Please refer to figure 1 and 2 for individual estimation coefficients. Similarly, we find support for hypotheses 5 and 6. As figures 1 and 2 show, corporateentrepreneurship resources are significantly related to all exploitation and exploration corporate entrepreneurship routines. For exploitation, opportunity recognition (β = .55, p < .01) and idea generation (β = .16, p < .05) are found to be significantly related to predevelopment performance, supporting hypothesis 7a and 7b. We find weak support for hypothesis 7c (β = .13, p < .10).For exploration, opportunity recognition (β = .23, p < .01), technology idea generation (β = .40, p < .01) and idea selection (β = .19, p < .05) are found to be significantly related to predevelopment performance. We find marginal support for the relationship between customer idea generation (β = .12, p < .10) and concept experimentation (β = .12, p < .10) and predevelopment performance.
DISCUSSION
We modeled the antecedents and consequences of predevelopmentroutines in the corporate entrepreneurship process. The model for exploitation (figure 1) explained 48% of the variance while the

model for exploration (figure 2) explained 56% of the variance. Both models confirmed a strong relationship between the ingrained organizational resources of vision and climate and the more fungible ones of strategy and resources. In addition, our study showed a strong relationship between the organizational resources and all of the routines – whether they were exploitative or explorative and some interesting results with regard to the importance of predevelopment routines relative to each other.
The overall importance of vision and strategy to predevelopment performance is subject to contention. On the one side, the popular notion indicates that innovative ideas occur to individuals (Nonaka & Takeuchi, 1995) – not organizations; hence vision and strategy may be too confining and are relatively independent of innovative ideas raising from the bottom-up. Similarly, Pinchot (1985), in a popular book on corporate entrepreneurship, stresses the importance of the individual in establishing the right initiatives and Burgelman (1983: 241) suggests in his study of internal corporate venturing that the “…autonomous strategic initiatives of individuals at the operationallevel of the organization…” are critical for “…initiatives that fall outside the current concept of corporate strategy.” In contrast, Khurana and Rosenthal (1997, 1998) hypothesized the importance of a strong linkage between organizational resources and predevelopment routines based on case studies. In line with these studies our results provide confirmatory evidence that organizational resources make a significant difference to all of the routines in predevelopment.
In contrast, the effect of climate on strategy was not supported (H2a). We hypothesized that a firm’s strategy would be aligned with the climate. We could find only one article (Burton, Lauridsen, & Obel, 2004) in the nascent literature which investigated the relationship between strategy and climate in a study of small companies in Europe. This study found that the correlation between climate and strategy was higher in companies that follow an exploration strategy. However, our strategy construct was not specific to either exploitation or exploration efforts. We would expect that having a supportive climate is more important for exploration efforts which may not be aligned with a company’s current strategy. Our model supports this contention with climate being strongly correlated with resources (H2b). In

other words, our corporate entrepreneurship model indicates that having a risk taking climate is antecedent to obtaining resources – independent of whether the project is aligned with strategy.
One of the purposes of our research was to examine the relative importance of all of the predevelopment routines – including opportunity recognition. Both of the hypotheses (H7a andH8a) examining the effects of opportunity recognition on predevelopment performance were confirmed which provides further empirical evidence of the importance of this area of study. In contrast the effects of concept definition (H7c) and concept experimentation (H8e) on predevelopment performance were not confirmed. Our constructs for concept definition and experimentation attempt to measure completion of a business plan. The importance of business planning has received considerable attention in the entrepreneurship literature where several authorshave argued that writing a business plan will enhance firm performance (Lumpkin, Shrader, & Hills, 1998), whereas others haveargued that the relationship between business plans and performance is open to doubt (Bhide, 2000; Delmar & Shane, 2004). Our results empirically support the latter conclusion. We found strong correlations (Table 2) between concept definition and concept experimentation and predevelopment performance. However this same strong correlation was absent in our model indicating that there was no unique variance between these variables and predevelopment performance.
CONTACT: Heidi Bertels; [email protected]; (T):201-216-5560; (F):201.221.7788; 1 Castle Point on Hudson, Hoboken, NJ 07030
REFERENCESAdner, & Helfat. (2003). Corporate effects and dynamic managerial
capabilities. Strategic Management Journal, 24(10), 1011-1025.Bacon, Beckman, Mowery, & Wilson. (1994). Managing product
definition in high-technology industries: A pilot study. California Management Review, 36(3), 32-56.
Barney. (1991). Firm resources and sustained competitive advantage. Journal of Management, 17(1), 99.
Barney, & Zajac. (1994). Competitive organizational behavior: Toward an organizationally-based theory of competitive advantage. Strategic Management Journal, 15(8), 5-9.
Bhide. (2000). The origin and evolution of new businesses. New York, NY: Oxford University Press.
Block, & MacMillan. (1993). Corporate venturing: Creating new businesses within the firm. Boston, MA: Harvard Business School Press.
Brown, & Eisenhardt. (1995). Product development: Past research, present findings, and future directions. Academy of Management Review, 20(2), 343-378.
Burgelman. (1983). Corporate entrepreneurship and strategic management: Insights from a process study. Management Science, 29(12), 1349-1364.
Burton, Lauridsen, & Obel. (2004). The impact of organizational climate and strategic fit on firm performance. Human Resource Management, 43(1), 67-82.
Busenitz. (1996). Research on entrepreneurial alertness: Sampling,measurement, and theoretical issues. Journal of Small Business Management, 34(3), 35-44.
Calantone, Cavusgil, Schmidt, & Shin. (2004). Internationalizationand dynamics of product adaptation: An empirical investigation.Journal of Product Innovation Management, 22(2), 185-198.
Chesbrough. (2000). Designing corporate ventures in the shadow of private venture capital. California Management Review, 42(3), 31-49.
Christensen, & Peterson. (1990). Opportunity identification: Mapping the sources of new venture ideas. In N. E. Churchill, W. D. Bygrave, J. A. Hornaday, D. F. Muzyka, K. H. Vesper & W. E. J. Wetzel (Eds.), Frontiers of entrepreneurship research (pp. 567-581). Wellesley, MA: Babson College.
Christensen, & Raynor. (2003). The innovator's solution. Boston, MA: Harvard Business School Press.
Cooper. (2001). Winning at new products: Accelerating the process from idea to launch (third edition ed.). Cambridge, MA: Perseus publishing.
Cooper, & Kleinschmidt. (1997). New products: What separates winners from losers? Journal of Product Innovation Management, 14, 169-184.
Cote, & Buckley. (1987). Estimating trait, method, and error variance: Generalizing across 70 construct validation studies. Journal of Marketing Research, 24, 315-318.
Covin, & Miles. (2007). Strategic use of corporate venturing. Entrepreneurship: Theory & Practice, 21(2), 183-207.
Delmar, & Shane. (2004). Legitimating first: Organizing activitiesand the survival of new ventures. Journal of Business Venturing, 19(3),385-410.

Dougherty, & Hardy. (1996). Sustained product innovation in large,mature organizations: Overcoming innovation-to. Academy of Management Journal, 39(5), 1120.
Dutta, Narasimhan, & Rajiv. (2005). Conceptualizing and measuring capabilities: Methodology and empirical application. Strategic Management Journal, 26(3), 277-285.
Eisenhardt, & Martin. (2000). Dynamic capabilities: What are they?Strategic Management Journal, 21(10-11), 1105-1121.
Ekvall. (1987). The climate metaphor in organization theory. In B.Bass & P. Drenth (Eds.), Advances in organizational psychology (pp. 177-190). Beverly Hills, CA: Sage.
Ekvall. (1996). Organizational climate for creativity and innovation. European Journal of Work and Organizational Psychology, 5(1), 105-123.
Frank, Gertz, & Porter. (1996). Leadership for growth. Strategy & Leadership, 24(5), 6-11.
Gaglio, & Katz. (2001). The psychological basis of opportunity identification: Entrepreneurial alertness. Small Business Economics,16(2), 95-111.
Hambrick, & Mason. (1984). Upper echelon: The organization as a reflection of its top managers. Academy of Management Review, 9, 193-206.
Hamel, & Prahalad. (1989). Strategic intent. Harvard Business Review, 67(3), 63-76.
Harman. (1967). Modern factor analysis. Chicago: University of Chicago Press.
Helfat, & Peteraf. (2003). The dynamic resource-based view: Capability lifecycles. Strategic Management Journal, 24(10), 997-1010.
Henard, & Szymanski. (2001). Why some new product are more successful than others. Journal of Marketing Research, 33(August), 362-375.
Henry. (1991). Innovation Executive Speeches, 5(9), 7-11.Huber, & Power. (1985). Retrospective reports of strategic-level
managers: Guidelines for increasing their accuracy. Strategic Management Journal, 6(2), 171-180.
Jöreskog, & Sörbom. (2005). Lisrel 8.72: Scientific Software International, Inc.
Katz, & Allen. (1985). Project performance and the locus of influence in the r&d matrix. Academy of Management Journal, 28(1), 67-87.

Khurana, & Rosenthal. (1997). Integrating the fuzzy front end of new product development. Sloan Management Review, 38(2), 103-120.
Khurana, & Rosenthal. (1998). Towards holistic "Front ends" In newproduct development. Journal of Product Innovation Management, 15(1), 57-75.
Kirzner. (1997). Entrepreneurial discovery and the competitive market process: An austrian approach. Journal of Economic Literature, 35(1), 60-85.
Koen, Ajamian, Burkart, Clamen, Davidson, D'Amore, et al. (2001). Providing clarity and a common language to the "Fuzzy front end". Research Technology Management, 44(2), 46-55.
Kuratko, Ireland, & Hornsby. (2001). Improving firm performance through entrepreneurial actions: Acordia's corporate entrepreneurship strategy. Academy of Management Executive, 15(4), 60-71.
Leifer, McDermot, O'Connor, Peters, Rice, & Veryzer. (2000). Radical innovation: How mature companies outsmart upstart. Boston, MA: Harvard Business School Press.
Lumpkin, Shrader, & Hills. (1998). Does formal business planning enhance the performance of new ventures? Frontiers of EntrepreneurshipResearch.
Lynn, Morone, & Paulson. (1996). Marketing and discontinuous innovation: The probe and learn process. California Management Review, 38(3), 8-37.
March. (1991). Exploration and exploitation in organizational learning. Organization Science, 2(1), 71-87.
McAdam, & McClelland. (2002). Individual and team-based idea generation within innovation management: Organizational and research agendas. European Journal of Innovation Management, 5(2), 86-97.
McEvily, & Chakravarthy. (2002). The persistence of knowledge-based advantage: An empirical test for product performance and technological knowledge. Strategic Management Journal, 23(4), 285.
Miles, & Covin. (2002). Exploring the practice of corporate venturing: Some common forms and their organizational implications. Entrepreneurship: Theory & Practice, 26(3), 21-40.
Miller, Cardinal, & Glick. (1997). Retrospective reports in organizational research: A reexamination of recent evidence. Academy of Management Journal, 40(189-204).
Moenaert, De Meyer, Souder, & Deschoolmeester. (1995). R&d/marketing communication during the fuzzy front-end. IEEE Transactions on Engineering Management, 42(3), 243-258.

Montoya-Weiss, & Calantone. (1994). Determinants of new product performance: A review and meta-analysis. Journal of Product InnovationManagement, 11(5), 397-417.
Nonaka, & Takeuchi. (1995). The knowledge creating company. Oxford: Oxford University Press.
Pettus. (2001). The resource-based view as a developmental growth process: Evidence from the deregulated trucking industry. Academy of Management Journal, 44(4), 878-896.
Pinchot. (1985). Intrapreneurship. New York, NY: Harper and Row.Podsakoff, & Organ. (1986). Self-reports in organizational
research: Problems and prospects. Journal of Management, 12(4), 531-544.
Pringle, & Kroll. (1997). Why trafalgar was won before it was fought: Lessons from resource-based theory. Academy of ManagementExecutive, 11(4), 73-89.
Russo, & Fouts. (1997). A resource-based perspective on corporate environmental performance and profitability. Academy of Management Journal, 40(3), 534.
Schneider, Brief, & Guzzo. (1996). Creating a climate and culture for sustainable organizational change. Organizational Dynamics, 24(4), 7-19.
Shepherd, & DeTienne. (2005). Prior knowledge, potential financialreward, and opportunity identification. Entrepreneurship: Theory & Practice, 29(1), 91-112.
Singh. (1986). Performance, slack, and risk taking in organizational decision making. Academy of Management Journal, 29(3), 562-565.
Smith, Collins, & Clark. (2005). Existing knowledge, knowledge creation capability, and the rate of new product introduction in high-technology firms. Academy of Management Journal, 48(2), 346-357.
Song, & Parry. (1997). The determinants of japanese new product successes. Journal of Marketing Research, 34(February), 64-76.
Teece, Pisano, & Shuen. (1997). Dynamic capabilities and strategicmanagement. Strategic Management Journal, 18, 509-533.
Titus. (2000). Marketing and the creative problem-solving process.Journal of Marketing Education, 22(3), 225-236.
Tushman, & O'Reilly. (1996). Ambidextrous organizations: Managing evolutionary and revolutionary change. California Management Review, 38(4), 8-30.
Von Hippel, Thomke, & Sonnack. (1999). Creating breakthroughs at 3m. Harvard Business Review, September-October, 47-57.

Wernerfelt. (1984). A resource based view of the firm. Strategic Management Journal, 5, 171-180.
Zahra. (1991). Predictors and financial outcomes of corporate entrepreneurship: An exploratory study. Journal of Business Venturing, 6, 258-282.
Zietsma. (1999). Opportunity knocks—or does it hide? An examination of the role of opportunity recognition in entrepreneurship. In Frontiers of entrepreneurship research (pp. 242-256). Wellesley, MA: Babson College.
Zirger, & Maidique. (1990). A model of new product development: Anempirical test. Management Science, 36(7), 867-883.

Figure 1: Exploitation
Figure 2: Exploration

Alpha Eigenvalue Single Factor
Variance Accounted
Range Factor Loadings
Predevelopment performance
0.835 3.316 55.272 .618 - .832
Vision 0.898 2.491 83.031 .908 - .922
Strategy 0.746 2.286 57.151 .697 - .780
Climate 0.897 4.674 58.429 .698 - .791
Resources 0.873 3.687 61.455 .665 - .850
Opportunity Analysis
0.849 3.121 62.423 .717 - .819
Idea Generation 0.903 2.518 83.944 .878 - .929
Concept Definition
0.822 2.224 74.14 .840 - .893
Opportunity Analysis
0.768 2.053 68.42 .779 - .899
Ethnography 0.863 2.357 78.555 .838 - .924
Technology 0.761 2.05 68.332 .660 - .901
Idea Selection 0.807 1.683 84.139 .917 - .917
Concept Exp. 0.88 2.42 80.667 .875 - .919
Our organization has (1) a systematic method for capturing and sharing ideas, (2) a company wide system for recording ideas, (3) a company wide system for providing feedback for ideas received
Table 1: Coefficient Alpha, Principal Com ponent Analysis, and Constructs
(1) M ost people in our organization trust each other, are open and honest, and count on each other for personal support, (2) most people in our organization take the time to consider and test new ideas and ways of doing things, (3) most people in our organization have fun doing work. There is a great deal of good-natured joking and laughter, (4) most people in our organization do not set traps for each other and engage in territory struggles, gossip, and slander, (5) new ideas are received in an attentive and professional way by supervisors, peers, and others, (6) most people in our organization discuss and consider opposing opinions and a diversity of viewpoints, (7) people in our organization feel as though they can go out on a limb and be first to put an idea forward; they tolerate uncertainty and ambiguity, (8) we actively encourage people to champion new ideasOur organization has sufficient resources available for (1) opportunity identification and analysis, (2) idea generation and enrichment, (3) idea selection, (4) concept definition, (5) boundary spanning activities, (6)working on non-official projects
a First value corresponds to Exploitation M odel; Second value corresponds to Exploration M odel
(1) Concepts are conceived by experimenting with a multitude of ideas, (2) concept experimentations are used to eliminate undesirable features, (3) concept experimentations are used to combine traditional and new technologies
(1) The feasibility of manufacturing of concept is understood, (2) the feasibility of technical requirements is understood, (3) the feasibility of economics is understoodOur organization assesses the external environment as it impacts our business for exploration projects by reviewing (1) economic/demographic trends, (2) new business models, (3) consumer or cultural trendsThe following methods are used to identify/obtain new ideas: (1) observing our customers in their own environment, (2) observing potential customers in their own environment, (3) understanding the unarticulated reasons why the customers are making product choices.The following methods are used to identify/obtain new ideas: (1) R&D activities in our organization, (2) assessing emerging new technologies, (3) assessing technology driven inventionsOur organization has (1) an idea review board (or similar organization) that plays a key role in idea selection, (2) a comprehensive method of evaluation for idea selection.
(1) Our organization performs a thorough external environment analysis, (2) our organization’s external review approach is a formal, documented process, (3) our organization performs thorough analysis of the market potential, (4) opportunity analysis process is consistently applied to all exploitation projects, (5) a formal process is used to screen and select opportunity areas for exploitation projects
Construct
Our organization (1) is satisfied that our predevelopment generates sustainable competitive advantage, (2) strategically manages and leverages our intellectual property, (3) uses tools and methods to anticipate the next wave of innovation, (4) is satisfied that our predevelopment delivers our strategic objectives, (5) our organization’s predevelopment portfolio has an excellent balance across new product lines, new technology platforms, and new to the world products – long-term vs. short-term, high vs. low risk, and across markets and technologies, (6) our organization’s predevelopment portfolio mix is actively managed to ensure our strategy is delivered
(1) Our organization’s predevelopment vision statements are stable over time for markets, (2) our organization’s predevelopment vision statements are stable over time for technology, (3) our organization’s vision statements are stable for predevelopment projects
Our organizations predevelopment efforts are within the defined arenas of strategic thrust: (1) for new product areas, (2) for new markets, (3) for new technologies, (4) for disruptive businesses

Table 2a: Descriptive Statistics and Simple Correlationsa for Exploitation Variables mean s.d. 1 2 3 4 5 6 7 8 9 10
1 sizeb 20731
58002
2 R&D spendingc 10.07
17.57
-0.205**
3 Vision 4.20 1.35 0.094 0.048
4 Climate 4.78 1.06 -0.088 0.007
0.425***
5 Strategy 4.37 1.18 0.133 0.111
0.459***
0.286***
6 Resources 3.61 1.19 0.116 0.097
0.474***
0.359***
0.401***
7 Opportunity 4.20 1.25 0.294***
-0.037
0.357***
0.369***
0.400***
0.53***
8 Idea 3.49 1.61 0.021-0.038
0.320***
0.283***
0.282***
0.393***
0.353***
9 Concept Definition 4.91 1.14 -0.012
-0.103
0.293***
0.455***
0.253***
0.381***
0.546***
0.308***
10
Predevelopment Perf. 3.88 1.09 0.115 0.09
70.554***
0.434***
0.579***
0.570***
0.526***
0.407***
0.401***
Skewness (skewness/standard error of skewness)
5.14 (30.05)
4.00(23.76)
-0.18 (-1.09)
-0.58 (-3.47)
-0.17 (-1.01)
0.06 (0.35)
-0.30 (-1.78)
0.27 (1.60)
-0.55 (-3.23)
0.13 (0.76)
Kurtosis (Kurtosis/standard error of kurtosis)
29.45 (86.48)
18.77 (56.04)
-0.28 (-0.84)
0.53 (1.57)
-0.38 (-1.14)
-0.78 (-2.32)
-0.44 (-1.30)
-0.98(-2.92)
-0.09 (-0.28)
-0.45 (-1.34)
TABLE 2b: Descriptive Statistics and Simple Correlationsa for Exploration Variables mean s.d. 1 2 3 4 5 6 7 8 9 10 11 12
1 sizeb 20731
58002
2 R&D spendingc 10.07
17.57
-.196**
3 Vision 4.20 1.35 0.086 0.06

1
4 Climate 4.78 1.06 -0.085 0.003
0.416***
5 Strategy 4.37 1.18 0.131 0.119
0.448***
0.294***
6 Resources 3.61 1.19 0.110 0.108
0.471***
0.358***
0.396***
7 Opportunity 4.33 1.23 0.156* 0.031
0.362***
0.280***
0.421***
0.483***
8 Ethnography 4.12 1.41 0.054 0.138
0.258***
0.295***
0.358***
0.349***
0.454***
9 Technology 4.68 1.18 0.165* 0.083
0.360***
0.292***
0.409***
0.420***
0.409***
0.258***
10 Idea Selection 4.16 1.56 0.151* 0.06
50.326***
0.185**
0.352***
0.362***
0.395***
0.244***
0.275***
11 Concept Exp. 4.45 1.30 0.081
-0.610
0.338***
0.389***
0.351***
0.451***
0.436***
0.391***
0.470***
0.305***
12
Predevelopment Perf. 3.88 1.09 0.117 0.09
60.554***
0.435***
0.580***
0.572***
0.472***
0.366***
0.539***
0.383***
0.436***
Skewness (skewness/standard error of skewness)
5.14 (30.05)
4.00(23.76)
-0.18 (-1.09)
-0.58(-3.47)
-0.17 (-1.01)
0.06 (0.35)
-0.57 (-3.40)
-0.24 (-1.43)
-0.39 (-2.29)
-0.23 (-1.38)
-0.43 (-2.52)
0.13(0.76)
Kurtosis (Kurtosis/standard error of kurtosis)
29.45 (86.48)
18.77 (56.04)
-0.28 (-0.84)
0.53 (1.57)
-0.38 (-1.14)
-0.78 (-2.32)
0.04 (0.12)
-0.89 (-2.66)
-0.21 (-0.62)
-0.83 (-2.47)
-0.40 (-1.18)
-0.45(-1.34)
a Listwise deletion, n = 200 (exploitation), n = 201 (exploration)b Size measured as number of employees, correlations reported for ln (size)c R&D spending measured as proportion of sales, correlations reported for ln (R&D spending)d Skewness and Kurtosis after logarithmic transformation are -0.02 (0.12) respectively -0.40 (-1.16)e Skewness and Kurtosis of R&D spending after logarithmic transformation are -0.08 (-0.48) respectively 0.09 (0.28)* p ≤ .05, ** p ≤ .01, *** p ≤ .001