kevin christensen's senior thesis
TRANSCRIPT

Archaeology and Remote Sensing:Monitoring, Analyzing & Discovery Made Easier
Kevin ChristensenAnthropology 4980: Senior Seminar in Anthropology
December 1, 2015

P a g e | 1
Introduction
Archaeology is an old discipline. The field dates back to 1748 with uncovering of
Pompeii which was covered in ash by the eruption of Mount Vesuvius 79 AD. It can be traced
even farther back to the excavation of Herculaneum in 1738 and even before this there was
Stonehenge and other megalithic monuments in England that were explored through
archaeology. In these cases archaeology revealed information that was previously unknown.
The field of remote sensing is more recent by comparison because the first aerial photographs
came from a balloon in 1858. The practical uses of aerial photography became relevant in World
War One when these photographs would reveal positions of trenches, troops, and emplacements.
Remote sensing started out as a defined data gathering technique but evolved to become a very
sophisticated field that is employed by dozens if not hundreds of other fields, including
archaeology. I know analyzing remote sensing data takes specialized skills and knowledge, the
field of remote sensing should be used by archaeologists in the Americas because it gives the
ability to monitor, analyze, and discover archaeological sites from a distance, and it aids in
overall efficiency involving new knowledge.
LandSat 7 and Alaska
In Alaska it is known that some wild animals will seek relief from summer temperatures
and insects through occupying alpine ice patches. Remote sensing grants archaeologists the
ability to note where these ice patches are because of the satellite technology like Landsat 7
which is free to the public of the United States. Aerial photography also aids in detecting these
ice patches. Andrews, MacKay, and Andrew note about these three imageries: “In short, the
results of the imagery analysis indicated that the high alpine areas adjacent to the continental

P a g e | 2
divide contained abundant late-lying snow and ice and provided some evidence that caribou used
these features” (2012 p. 8). The presence of caribou and other medium sized game animals
suggest that prehistoric hunters might have ambushed them at these locations. Some of these ice
patches do not significantly move over the course of time and are considered to be permanent.
Permanent ice patches were the primary targets. Four out of ten permanent ice patches produced
artifacts and faunal remains. (2012 p. 8 Andrews, MacKay, and Andrew).
Andrews, MacKay, and Andrew make note of the human artifacts: “Artifacts collected
from ice patch archaeological sites in the Selwyn Mountains represent elements of three pre-
contact weapons systems: throwing-dart(atlatl) technology, bow-and-arrow technology, and
snare technology” (2012 p. 9). The throwing-dart technology found is estimated to date
between 2157-2699 BP from radiocarbon dating. The five artifacts that characterize bow and
arrow technology date to between 0-904 BP; the snares artifacts date to between 970-390 BP.
Faunal remains were also collected with over 250 specimens from 18 ice patches of which four
were permanent. The majority of these specimens were caribou and birds. The underlying point
is that remote sensing gave archaeologists locations of good excavation areas.
Landsat 7 is a satellite with good remote sensing capabilities. Landsat 7 is the seventh
satellite of the Landsat program. According to USGS.gov, “Four decades of imagery provides a
unique resource for those who work in agriculture, geology, forestry, regional planning,
education, mapping, and global change research. Landsat images are also invaluable for
emergency response and disaster relief” (USGS.gov). It makes a good remote sensor because it
provides panchromatic (black and white) imagery with 15m spatial resolution, for free. Landsat
7 also contains a thermal IR channel with a 60m spatial resolution. I have found no case studies
surrounding archaeology and the thermal band. The spectral resolution consists of 7 bands with
P a g e | 3
a majority having 30m spatial resolution and a panchromatic band, which has better resolution.
This satellite has a temporal period of 16 days and a multispectral band (capable of colorized
composite photo) averaging 30 meters per pixel on any given image. This means that it returns
to any given area on earth every 16 days. Thus, Landsat photographs all terrain on earth every
16 days.
Landsat 7 is useful to archaeologists because it does not require extensive analysis to get
useful information out if it. The satellite offers decent resolution for free. When large areas of
land such as ice patches are being sought, Landsat 7 is good because it offers archive data as well
as present data. Landsat 7 archive data was the primary source of permanent ice patches in the
case study by Andres, MacKay, and Andrew. This means that cloud cover can be overcome
through archive data that is 16 days old; Landsat imagery is archived for at least 10 years back in
time so that permanent features on the landscape can be verified. This imagery is good when the
analysis is done over a large clear area of terrain such as arctic areas, grassland areas, and above
tree lines on mountains. However, Landsat imagery cannot penetrate forest canopy which is also
known as overhead vegetation. Another limitation of Landsat imagery is that the spatial
resolution of the images is horrible when compared to very high resolution imagery satellites. In
Landsat images each pixel on the digitized image is at 30 meters by 30 meters whereas a very
high resolution satellite like WorldView-3 can have each pixel on a digitized image at “30
centimeters by 30 centimeters”. (Satellite Imaging Corporation Unknown).
LiDAR and Mesoamerica
LiDAR (Light Detection and Ranging) works from multiple remote sensing platforms
such as airplanes, in-situ tripods, and satellites. LiDAR uses light from the ultraviolet, visible or

P a g e | 4
near infrared spectrums to image objects. These wavelengths that are chosen by humans though
computers are varied according to the chosen target. LiDAR can be aimed at a multitude of
objects which includes rocks, rain, chemicals, individual molecules, clouds, and non-metallic
objects. The fields that use LiDAR the most are meteorology and other atmospheric researching
fields.
Unlike Landsat 7 imagery, LiDAR is a remote sensing technology that is capable of
penetrating overhead vegetation. This technology is very useful when it comes to jungle
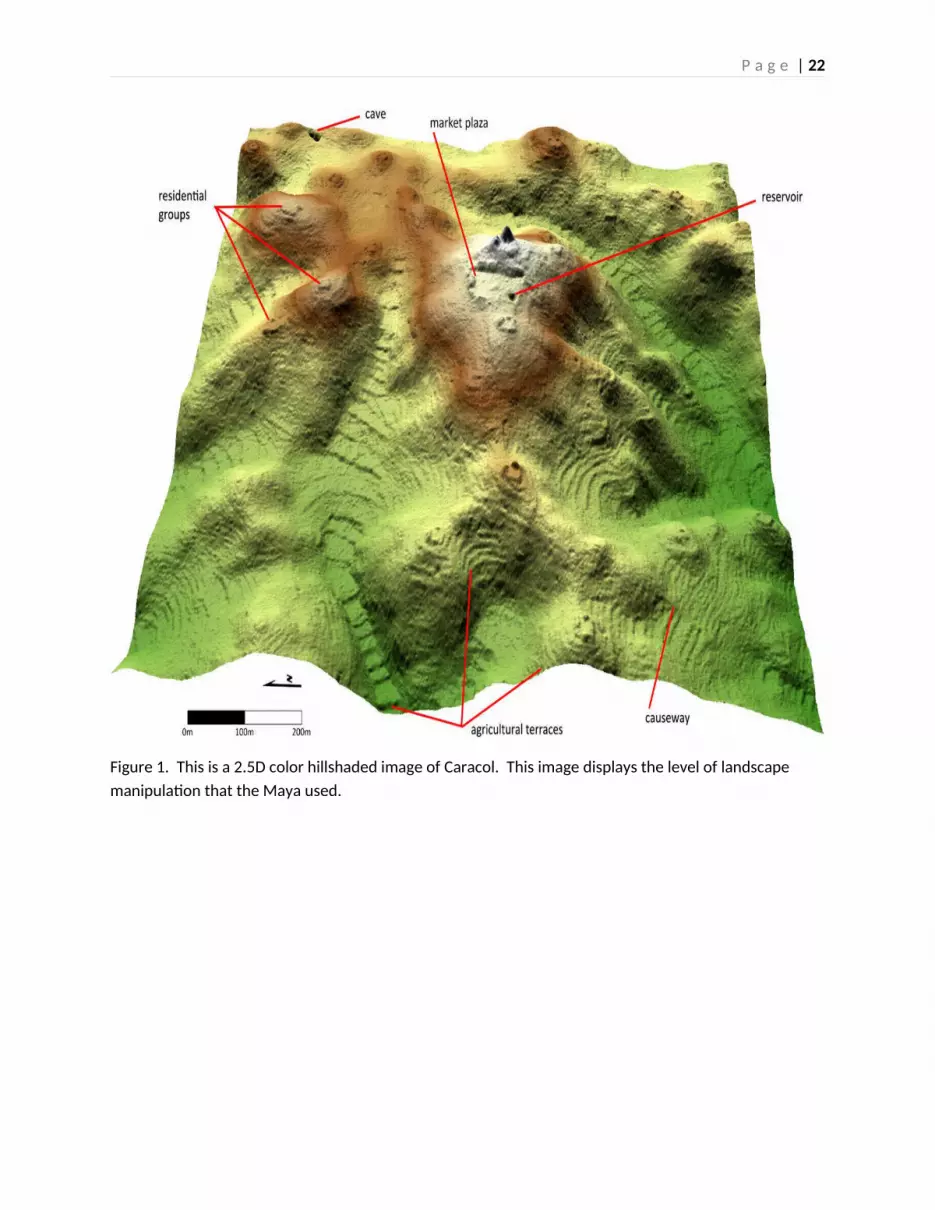
landscapes like those in Mesoamerica. Chase et al. (2012) note about the usefulness of LiDAR
in Mesoamerica, “LiDAR effectively allows the archaeologist to understand the ancient use of
space, serving as a counterbalance to interpretations derived solely from small survey samples or
nonarchaeological sources.” (2012 p. 12919). In their case study about the city of Caracol,
LiDAR demonstrated the ability to conduct a large scale land survey with immense detail and
put it into multiple hillshaded images. A hillshaded image is typically a 3D model of the surface,
which includes the sun’s relative position taken into account for the shading of the image. The
features discovered and labeled in the 2.5D hillshaded image of Caracol in Mesoamerica
included residential groupings, a reservoir, a causeway, and agricultural terraces (Figure 1).
This means that LiDAR can aid archaeologists when there is a site in difficult terrain like
a jungle or forest in which there is overhead vegetation. Surveying in the field in the jungle or
forest is not easy because of the slope of the terrain, density of vegetation, and soil composition;
it is just plain hard to do. These three factors would limit a non-exclusive survey in extreme
while an exclusive survey would still be limited and would be the only practical in-situ and on-
site option for these types of terrain. A non-exclusive survey is a survey that includes complete
coverage of the landscape. An exclusive survey is one in which parts of the landscape are
P a g e | 5
omitted because they are not likely to contain sites. I know that because of this, when there is an
archaeological site explored and a survey of the surrounding areas is required, a LiDAR scan and
analysis of the site would be useful to save archaeologists’ resources. This LiDAR scan would
be able to ascertain notable archaeological features about the surrounding area such as looted
burial chambers, extinct constructions like walls that are no longer present, linear features like
causeways or roads, and agricultural fields. This is one example of how LiDAR remote sensing
can aid archaeological science.
Synthetic Aperture Radar
Synthetic Aperture Radar (SAR) is different than LiDAR. SAR uses radio waves where
LiDAR uses light. However, the basic concept of analyzing how a generated wave bounces off
an object is similar. The backscattering amplitude and the phase are the two components
required when making an SAR based image. Chen, Lasaponara, and Masini (2015) note three
primary factors involving SAR variability when generating an image: “the parameters that have a
key role in the interactions between radar energy and target are: surface roughness; radar viewing
and surface geometry relationship; and moisture content and electrical properties of the target”
(2015 p. 3). Because of the penetration of vegetation, SAR is equally useful in jungle and forests
where there is thick overhead vegetation. It is also useful in the desert because the wavelength
can be modified to penetrate the sand and detect any buried remains. The longer the wavelength
sent down by SAR, the deeper the penetration.
SAR is a remote sensing technology that can help archaeology just like LiDAR. SAR has
two practical applications as noted by Chen, Lasaponara, and Masini: “new-heritage detection
and discovery; existing-heritage monitoring and diagnosis, taking advantage of the merits of

P a g e | 6
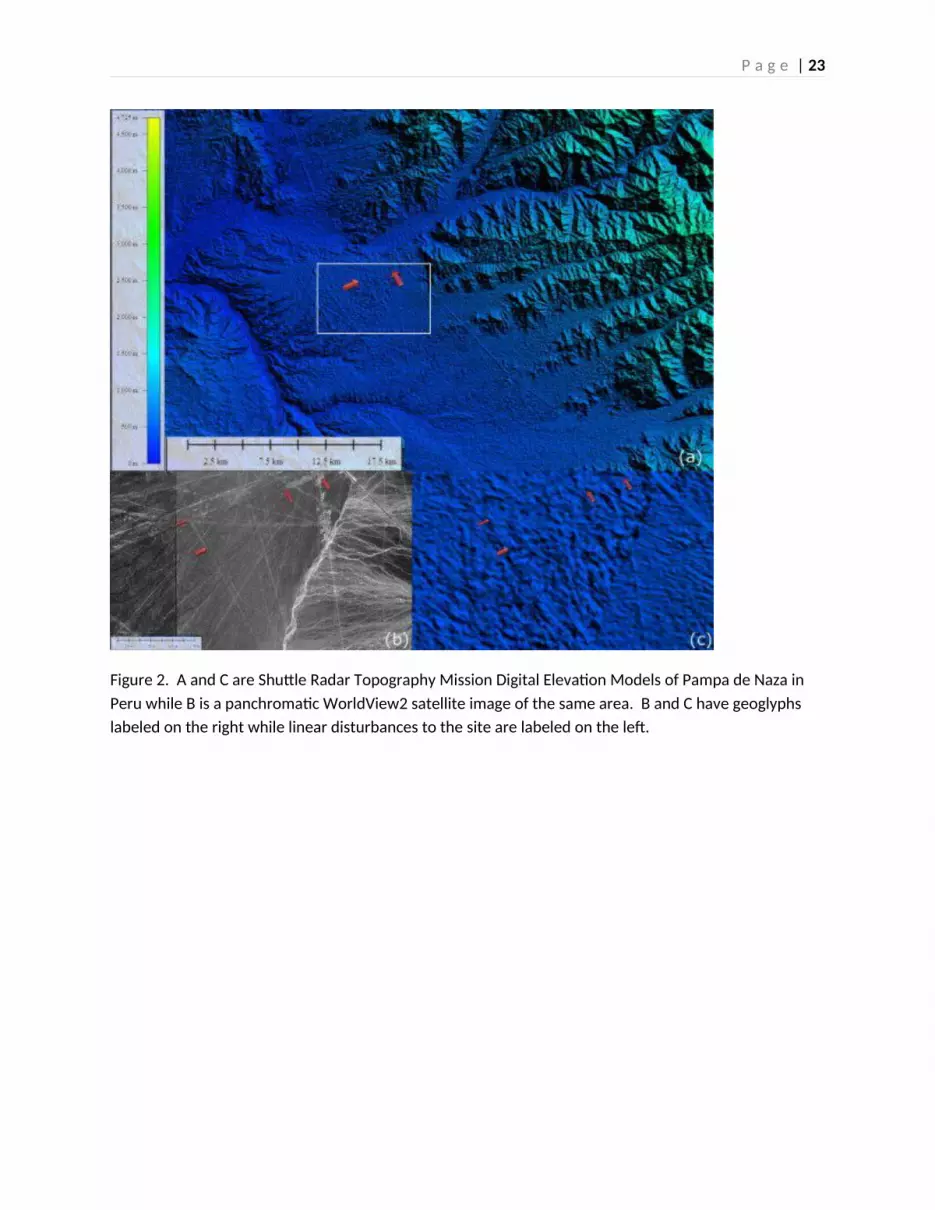
SAR remote sensing in terms of penetration, polarization, and interferometry” (2015 p. 6). By
using interferometry, airborne SAR can monitor the unauthorized traffic around World Heritage
sites like Pampa de Nazca in Peru which is famous for geoglyphs. (Figure 2). Interferometry
remote sensing techniques involve combining two or more radar images over the same landscape
to detect variations between the two. So SAR imagery can be combined in order to produce an
accurate Digital Elevation Model map of a landscape. This map can be used by archaeologists to
narrow down potential survey points in the area or to monitor World Heritage sites like the one
in Peru. Also, a DEM can produce routes to a unmapped site and therefore aid in getting
archaeologists on site.
History of the National Aeronautics and Space Administration’s (NASA) Remote Sensing
and Archaeology
NASA was founded in 1958 to be a key player in the space race between America and
Russia. Marco Giardino notes: “Among the first archaeological applications of NASA imagery
were the identification of ancient Hohokom canal systems by Yehuda Kedar (UC Santa Barbara,
Geography Department)” (2011 p. 2004). This imagery was taken using a multiband
experiment flown on Apollo 11 in 1969. This was also the spaceflight that landed the first
humans on the moon. NASA started launching the Skylab missions in 1973 which added over
35,000 images of Earth to the archives of Earth photographs. Skylab was not used widely for
archaeological research but its images were useful in identifying linear features. In 1972, NASA
launched the first satellite of the Landsat program. It was known as the Earth Resources
Technology Satellites program at the time but was later renamed to Landsat. The Landsat
program has been widely used by archaeologists since the late 1970’s because of its multispectral
scanner imagery. (Figure 3).

P a g e | 7
Normalized Difference Vegetation Index (NDVI) is possible with a red band and a near
infrared band. A NDVI can indicate vegetation density and health. This can indicate previous
human activity. In a multispectral NDVI, a long line of brown in a green field could have been
an agricultural terrace, road, or edge of a village.
Landsat Satellites 1-3 had spectral bands 4, 5, 6, and 7 which are green, red, near infrared
and near infrared respectively. The two near infrared bands were set to detect at the different
spectral wavelengths of 0.7-0.8 nm and 0.8-1.1 nm. The most recent satellite, Landsat 8, has 11
bands. These bands include blue, green, and red; blue, green, and red are required to create true
color composite images and maps. I know that the original Landsat Satellites could not create
true color composite images because it lacked the red, green, and blue spectral bands. Landsat 8
also has a panchromatic (black and white) band along with multiple infrared bands like the
original Landsat. Once again, all Landsat imagery is available free of charge through the United
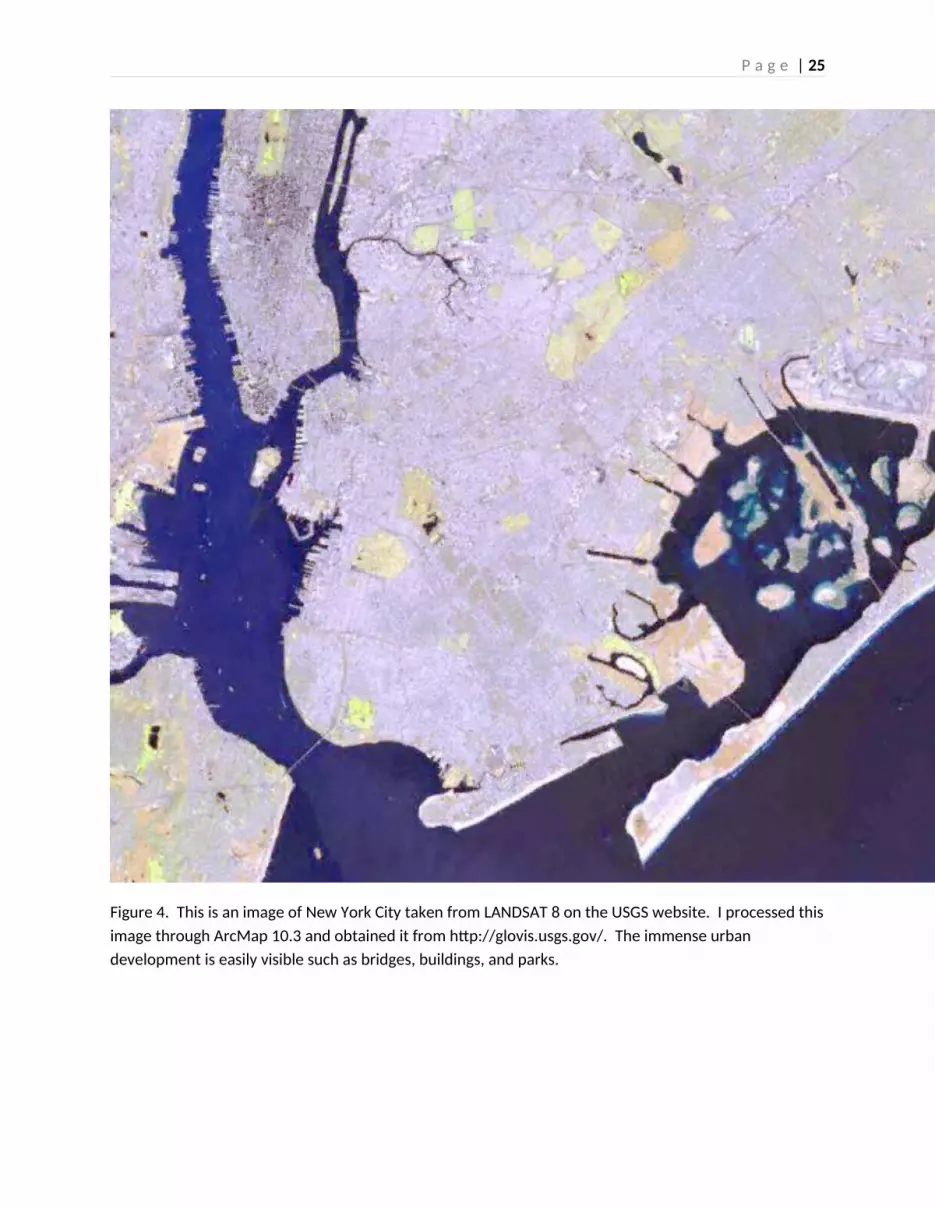
States Geological Survey website. The imagery can be processed through a GIS like ArcMap
and displayed as a map. (Figure 4). Then these maps can point out archaeological features like
extinct agricultural fields through NDVI or shipwrecks near shores through seeing gaps in coral
reefs.
The first applications of NASA imagery into remote sensing consisted of site
identification in the 1970’s. In the 1980’s, NASA’s remote sensing imagery went beyond site
identification and became more complex with respect to archaeology; NASA did testing of
predictive models of site distribution. Giardino notes about NASA imagery and predictive
modeling, “They found that these modern land use classes were correlated with edaphic factors
known to influence prehistoric settlement choices.” The underlying predictive settlement model
created was proven to be over 90% accurate in predicting site locations in areas that have not
P a g e | 8
been surveyed otherwise. Also in the 1980’s NASA deployed four sub-orbital airborne sensors
based out of the Stennis Space Center: the Thematic Mapper Simulator (TMS); the Thermal
Infrared Multispectral Scanner (TIMS); the Calibrated Airborne Multispectral Scanner; the
Airborne Terrestrial Applications Sensor (ATLAS). These four were used extensively until the
early 2000’s, at which point the spatial resolution of the imagery was considered poor when it
came to detecting small targets. This is because the launches of very high resolution satellites
started with IKONOS in September of 1999 and continues to this day with satellites like
WorldView-3; IKONOS has 0.8 meter panchromatic spatial resolution and WorldView-3 has
~31 cm, about the length of a ruler, panchromatic imagery. But these satellites are not owned by
NASA and the imagery costs money. However, NASA used airborne LiDAR and various forms
of satellite imagery to analyze Caracol in Mesoamerica which is described in detail above.
IKONOS and Mayan Archaeology
The Maya Civilization was centered in the jungles of Central America and IKONOS is
great for detecting some features of theirs, but it totally misses others. IKONOS was the first
satellite to publish 1 meter panchromatic and 4 meter multispectral imagery to the public.
According to Garrison et al. (2008): “Out of the three evaluations of the San Bartolo settlement
signature there was one scene with a weak signature (El Zotz), one scene with no signature
(Ceibal), and one with a false positive (Sierra del Lacadon)” (2008 p. 2774). These three sites
had poor spectral signatures or misleading ones. This case study was conducted by Garrison and
his collogues because of the success of the San Bartolo Project; however, in only using IKONOS
very high resolution imagery, this case study did not have equal success. Wiseman and El-Baz
(2007) note in their book:

P a g e | 9
The San Bartolo project combines high-resolution airborne and satellite imagery, advanced remote sensing analyses, large-scale regional survey, intensive and extensive excavation of residential and non-residential features, exploration of the paleo-environment, resource management, and site planning through the use of geographic information systems (GIS) (2007 p. 141).
IKONOS is better suited to find linear features rather than entire settlements because it does not
have the capacity to penetrate overhead vegetation and other interference such as clouds.
Very High Resolution (VHR) imagery is not useful to archaeologists to analyze jungle
settlements. What VHR excels at is identifying linear features. VHR imagery of Mesoamerica
can aid in finding roads, canals, and walls but all of these must be visible from above with no
interference from cloud cover, vegetation, or snow.
QuickBird VHR Imagery and Features
Lasaponara and Masini (2006) note two primary conclusions about VHR imagery and
archaeology:
The use of data fusion and edge-detection procedures improves the identification of spatial anomalies expected in the presence of buried archaeological structures…The integration of results obtained from panchromatic and image fusion products (in the current case the NIR channel) provides valuable information for a detailed physical and geometrical characterization of the archaeological site, as required prior to any excavation work (2006 p. 3613).
The QuickBird Satellite has slightly better panchromatic and spatial resolution when compared
to IKONOS. The panchromatic resolution is 0.61 meters and the multispectral is 2.44 meters.
QuickBird can be used to detect the anomalies that are expected in the presence of buried
structures because it has a better NIR band. This band is more sensitive to the variance in

P a g e | 10
vegetation growth, which is generally indicative of buried structures, pits, and ditches. The
QuickBird results were from images that were analyzed through an edge detection algorithm
applied in a geographic information system. This can aid in efficiency because if the location of
linear features can be narrowed down through remote sensing then it would decrease the amount
of time required in the field looking for linear features. Another way this can aid in efficiency is
QuickBird’s ability to see specific terrain types with very high resolution. The average
archaeological dig site is very small and is sometimes in a small outcropping of different terrain
such as an arroyo. QuickBird’s resolution can detect these small outcroppings.
One example of this occurring was through the use of QuickBird imagery in analyzing a
25 km2 area roughly 4 km south of San Bartolo, Guatemala. Thomas Garrison (2010) notes:
“The contrast in vegetation types, particularly between lowland and upland vegetation classes, is
much clearer in the QuickBird data than in the IKONOS scene because the former had been
collected at the peak of the dry season.” (Figure 5) (2010 p. 218). The QuickBird data image
was modified through an affine transformation-define. The data image was also resampled
through the nearest neighbor method, which preserves the digital number value of each pixel and
generated a spatial resolution of 11.2m. Then the image was classified to uplands and lowlands.
This was the final image product, with 40 notable sites, that was used for any further analysis
(Figure 6). Garrison then would look closely at the image blocks themselves to see if there was
any correlation between linear agricultural features and the lowlands and uplands land
classifications. There was a correlation, and the Mayan people used the upland terrain. Garrison
records, “According to the lowlands/uplands classification 63.6% of the intersite area, or
15.9km2, is upland terrain that could have been inhabited by the ancient Maya.” (p. 225). The
total square area of the sample was 25km2.

P a g e | 11
The actual amount of inhabitants throughout time is unknown factually but can be
theorized. It is theorized by Garrison that based on the amount of Late Classic period structures
and the number of inhabitants per structure that there were 485 people per km2. Late Classic
(AD600-850) structures are best represented by surface remains in this sample area. In addition
to the surface structures there was a test pitting program/survey in order to analyze the Early
Classic (AD250-600) and Late Preclassic (400BC-AD250). In Thomas Garrison’s (2010) case
study a total of 56 test pits (1m x 1m) were excavated with at least one unit in each survey square
and, “ceramic pot-sherds are the main source of chronological data in Maya archaeology” (p.
227). There were only seven Early Classic sherds recovered and they represent 0.2% of all
sherds excavated. This number indicated the site surveyed was abandoned during this
timeframe. The Late Preclassic contained 572 sherds. The 572 sherds are corrected to 220
sherds due to the length of the Late Preclassic vs the Late Classic; the Late Preclassic is 2.6 times
longer than the Late Classic. These 220 then represent 20.8% of the total 1057 sherds. Garrison
(2010) then notes, “Calculating 20.8% of the Late Classic modified structure count of 1542
structures (1542 x 0.207= 321) gives a total of 321 structures.” (2010 p. 227). The structure
density was 20 structures per square kilometer and is known because 321 buildings over 15.9
km2 = 20. Garrison (2010) finally notes after explaining this that “population for this time period
is 1605 people” in the 25 km2 (2010 p. 227).
I think that there is great potential in using QuickBird satellite imagery to aid
archaeological survey and reconstruct ancient Maya populations. There is a lot of analysis that
needs to be done in order to do this correctly. The cost difference of the satellite imagery
compared to sending out in-situ survey teams is enormous. QuickBird images cost between $16
and $47 USD per sq. kilometer with a minimum order of 25 km2. Combine this with a couple
P a g e | 12
work weeks of analysis then the cost will still be well under $3,000 USD. Archaeological survey
teams in the jungle would cost at least $10,000 USD and these teams would not have found a
good uniform sample considering it would have been a random nonexclusive survey with all
areas receiving the same level of survey intensity. But the QuickBird imagery did not allow for a
classification of microenvironments which is possible with field surveys; highlands and lowlands
dichotomy had to be used instead of multiple microenvironments.
Potential Negative Aspects on Remote Sensing for Archaeology
I feel one negative aspect of using remote sensing for archaeology is the extensive
analysis required to make data viable. In the QuickBird case study by Garrison, the image had to
be resampled and corrected through affine transformation; these two are different analyses.
Affine transformation is a linear mapping method that preserves points, straight lines, and planes
while correcting for geometric distortions that can occur because of camera angles. The nearest
neighbor resampling method used is the most common technique for resampling map data. It
works by calculating the unknown values of the output map data by using the values of the
nearest cells in the input map data. In other words it fills in the gaps in the data map while
leaving the input data map relatively untouched. These two are types of analysis that must occur
in order for the QuickBird image to be viable for archaeological analysis. Once the image
became viable then it still had to be analyzed further through Iterative Self-Organizing Data
Analysis Technique (ISODATA) classifications. According to Memarsadeghi (2006) using the
ISODATA clustering algorithm,
(2006) there are four parts to ISODATA: 1) Cluster centers are randomly placed and pixels are assigned based on the shortest distance to center method; 2) The standard deviation within each cluster and the distance between cluster centers is calculated; 3) A second iteration is performed with the new cluster centers; and 4) Further iterations are
P a g e | 13
performed until certain conditions are met (International Journal of Computational Geometry and Applications).
Out of the seven output classes produced, class eight showed the best results (Figure 7). In this
the archaeological blocks selected for survey displayed the relationship involving habitation
features between the uplands and lowlands (Figure 8).
So there was analysis completed to see where the agricultural features of the Mayan
people are. This is a lot of analysis and it is not done easily in one day, although it is possible
with proper computing power and knowledge of remote sensing, archaeology, and the local
environment; however, it is very unlikely that this processing up to the class-eight image could
be done in one day. There is also the complete lack of tangible field data that is absent in an
analysis like this. With the absence of current field data then it is necessary to use archival field
data which is typically available, but in using this there must be further research done. If
archival data is used in conjunction with current imagery then the analysis gets even more
complex because archaeological sites change over time, especially in high traffic areas like San
Bartolo. The case study done by Garrison did not use any current field data until ground sample
survey teams were sent in to these 40 known archaeological sites for test pit excavations.
However, overall the remote sensing done beforehand did in fact reduce the amount of fieldwork
necessary to produce population estimates that are on par with other Maya rural areas.
GeoEye-1 and Monitoring Looting in Peru
One aspect of remote sensing and archaeology does not require extensive analysis. Two
raw raster image files can be compared to each other to examine differences notable to the naked
eye. A raster graphics image is a dot matrix data structure representing a generally rectangular
grid of pixels, or points of color, viewable via a monitor or other means like paper. In Cafetal

P a g e | 14
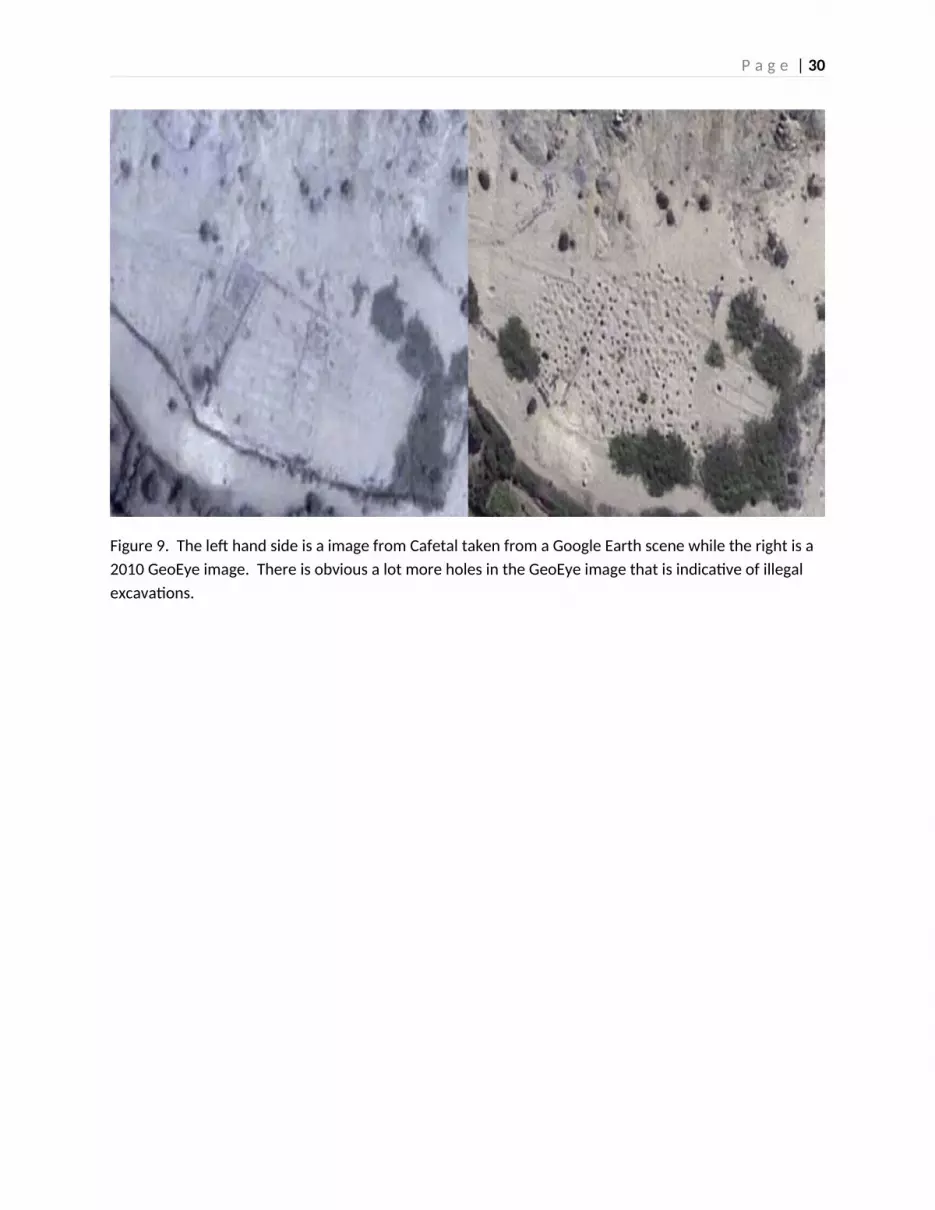
Peru, GeoEye-1 imagery is compared to Google Earth imagery to ascertain differences in the
landscape. Lasaponara et al. (2013) notes, “On the left hand side of the image there is a Google
Earth scene, on the right hand side an RGB of GeoEye-1 imagery is showed.” (Figure 9) (2013 p.
222). There is the plain and clear aspect that over seven years the site was looted for artifacts.
There is a need for the application of remote sensing in areas like Cafetal, Peru because there are
distinct political and military boundaries in protecting archeological sites in second-world and
third world countries; not all countries have large government services that protect these natural
and delicate archeological sites. Yet almost all countries are part of the United Nations
Educational, Scientific and Cultural Organization (UNESCO) and would like to protect these
sites listed on the world heritage list. GeoEye-1 can help Peru and other countries’ governments
track where the plundering of antiquities occurs and cut back on the illicit trade. GeoEye-1 can
also get detailed information about the damages that have occurred through its remote sensing
capabilities so the data can be useful to the government when mitigation strategies are created.
For example, Peru’s government wants to stop the export of illegal artifacts and obtains data
from GeoEye-1 on where the artifacts come from and, therefore, can stop looting at its source.
Also, the knowledge of where the artifacts come from dictates what types of artifacts are being
trafficked. So the governments can monitor markets and borders for these types of artifacts.
The remote monitoring of looting is one aspect of archaeology using remote sensing that
does not require a predictive model. Some of the predictive models do not always pan out how
the analyzer would like because those are tested through ground truthing. Ground truthing is
actually going to the suspected sites to confirm them, and to undertake on the ground research
necessary to estimate the dates they were occupied and the activities that took place there. One
of the good aspects of remote sensing fails when it comes to true archaeology because remote

P a g e | 15
sensing models cannot always be ground truthed. In my mind true archaeology is fieldwork but I
know for a fact that these sites in Peru are too dangerous to send in ground teams that would look
for exactness in the damages seen in the compare and contrast images. I also know that it is
impossible for an old school archaeologist to call remote sensing models the core of archaeology
because it does not contribute real knowledge of material culture.
The Ethics of Remote Sensing in Archaeology and Knowledge vs Discovery
There is easy access to remote sensing data applications such as Google Earth or Landsat
raster files but with this easy access there is the ethical concern that those being viewed lack a
voice. According to Myers (2010), “Google Earth’s coverage is apparently democratic: it will
show high-resolution images of the street you live on and a secret prison camp complex equally.”
(2010 p. 462). Although some nations have requested that Google Earth remove some of the
sensitive high-resolution imagery, Google refuses to do so. In doing so Google offers a free
access to military, private, and other lands. Through this distant access in remote sensing, the
archaeologist might develop an inhuman distance from the subject of study such as a graveyard,
shipwreck, or kill site. In other words, the archaeologist will become detached from the true core
of archaeology which in my opinion is fieldwork. Fieldwork is the best way to gain new
knowledge about the past and present material culture of humans. Remote sensing models are
wonderful for new discoveries but they are not true archaeological knowledge. They will never
form the core of new knowledge in archaeology as long as fieldwork is conducted because
fieldwork gives knowledge. Knowledge like the number of animals butchered at a site, when
people where actually there butchering, or what historical people were actually doing the
butchering. Knowledge like this can only be determined from fieldwork and digging up artifacts
like bone, charcoal, pottery, lithics, and other “garbage” that is left behind.
P a g e | 16
Remote sensing does breach one of the codes of ethics set fourth by the American
Archaeological Society. It breaches the second principle of accountability. According to
saa.org, “Accountability: Responsible archaeological research, including all levels of
professional activity, requires an acknowledgement of public accountability and a commitment
to make every reasonable effort, in good faith, to consult actively with affected groups, with the
goal of establishing a working relationship that can be beneficial to all parties involved” (Society
for American Archaeology). Remote sensing does not try to consult actively with affected
groups. Remote sensing takes information from a distance and is very impersonal to the images
or other data it creates.
Passive Geophysical Remote Sensing Methods
Heimmer and De Vore (1995) note that “passive geophysical methods are primarily
related to measurements of naturally occurring local or planetary fields created by earth related
processes. One of the most useful passive measurements to be incorporated in archeological
assessments is magnetometer surveying.” (1995 p. 7). Magnetic surveying is a useful remote
sensing technique because it detects anomalies within the earth’s natural magnetic field. The
detectable changes in the natural magnetic field are indicative of objects, metallic rocks, or soil
disruption caused by humans such as fires. Heimmer and De Vore (1995) make the mention,
“Where local variations in magnetic materials occur, perturbations or anomalies of less than one
to 5000 gamma may be observable.” (1995 p. 12). Instruments in 1995 were able to measure the
intensity of a total magnetic field to a 0.1 gamma precision. (Heimmer and De Vore p. 13).
There are a few limitations to this remote sensing technique. The first is surrounding
recent cultural activities. i.e. any sort of nearby electrical power , water pipes, automobiles, or
P a g e | 17
subsurface trash will interfere with the magnetic survey, and these would need to be within 30
feet to cause disruption. Another limitation is concerning the geological conditions of a survey-
able site. Igneous and metamorphic rocks contain high levels of magnetic materials and any soil
produced by them, such as Hawaiian soil, would also have this high level of magnetism. The last
restriction on magnetic surveying is solar activity. Daytime changes in solar activity can
produce 100 gamma changes through a day’s surveying and solar magnetic storms can disrupt
surveying for days which results in useless data. (Heimmer and De Vore 1995).
Active Geophysical Remote Sensing Methods
Where passive geophysical methods detect variations within the natural fields of the
earth, active geophysical methods artificially produce an electrical, electromagnetic, or acoustic
signal that is transmitted into the ground. This signal is then modified in the ground and it
produces a return signal that is measured again at the surface.
Ground Penetrating Radar (GPR) is an active remote sensing method. It can be used
effectively on the surface to detect objects of interest in the soil below. Heimmer and De Vore
(1995) note, “Its operation is based on introduction of a relatively low frequency electromagnetic
signal, generally in the 80-1000 megaHertz range, into the ground via a surface contact
transmitting antenna. As this signal passes through the earth it may encounter subsurface
materials of varying electrical impedances or properties.” (1995 p. 41). This remote sensing
technology can map soil layers, depth of bedrock, cavities, voids, rock fractures, ice thicknesses,
and other underground water. In mapping these features, it makes archaeologists lives easier if
there is an excavation planned. The excavation team would be able to avoid undesirable features
or plan ahead of time for them. If there was no excavation planned then the underground
P a g e | 18
features around a site could still be mapped and recorded through GPR, thus enabling effective
monitoring of the site through remote sensing technologies.
GPR has limitations to it like any remote sensing technology. There are a lot of variable
factors that influence GPR. Some of these include subsurface electrical properties like
conductivity, water saturation levels, chemical levels, and operating conditions. High conductive
materials are the greatest limiting factor affecting the usefulness of ground penetrating radar.
This is because these materials, like clay, result in an enormous loss of signal velocity and/or
signal strength. So the signal the receiver is looking for is very weak or lost.
GPR has proven success in aiding archeologists in Alaska just like SAR. Wolff and
Urban (2013) note about their successful use of GPR, “GPR revealed a complex dendritic
morphology of the Old Whaling beach ridge’s subsurface.” (2013 p. 19888). GPR gave insight
into the past drainage and cryogenic processes of the Old Whaling beach they were studying. In
using GPR results, some of the artifacts found through three test excavations included fire-
cracked rock and debitage but no others. So GPR did aid Alaskan archaeologists in monitoring
and excavating a known archaeological site.
Metal detectors are an active geophysical method as well; these sensors can lead to
decisive conclusions about archaeology. Metal detectors signal whenever there is a metallic
object below it and are useful in historic surveys. De Vore records that there are three types of
metal detectors: “coil head, two box, and magnetic”. (1995 p. 48) The sensitivity of the two box
is very poor but the depth is about three feet. The coil system has a depth range of two feet with
a much better adjustable sensitivity. The magnetic sensor is only used for detecting iron and De
Vore notes that it has “depths of eight feet”. (1995 p. 48) The sensors above are only useful for

P a g e | 19
detecting objects within a few feet of the surface. Additionally, smaller objects will produce the
same signal as larger objects. The cost is noted by De Vore, “Basic instrumentation having
archeological possibilities can be purchased for $250 to $2,000. More sophisticated high
resolution equipment, such as utilized in ordnance detection, will cost approximately $17,000.
Rental of metal detectors are possible at a rate of $10 per day.” (1995 p. 50). I know most
archaeologists are not looking for landmines or other ordnance so these prices are within reason.
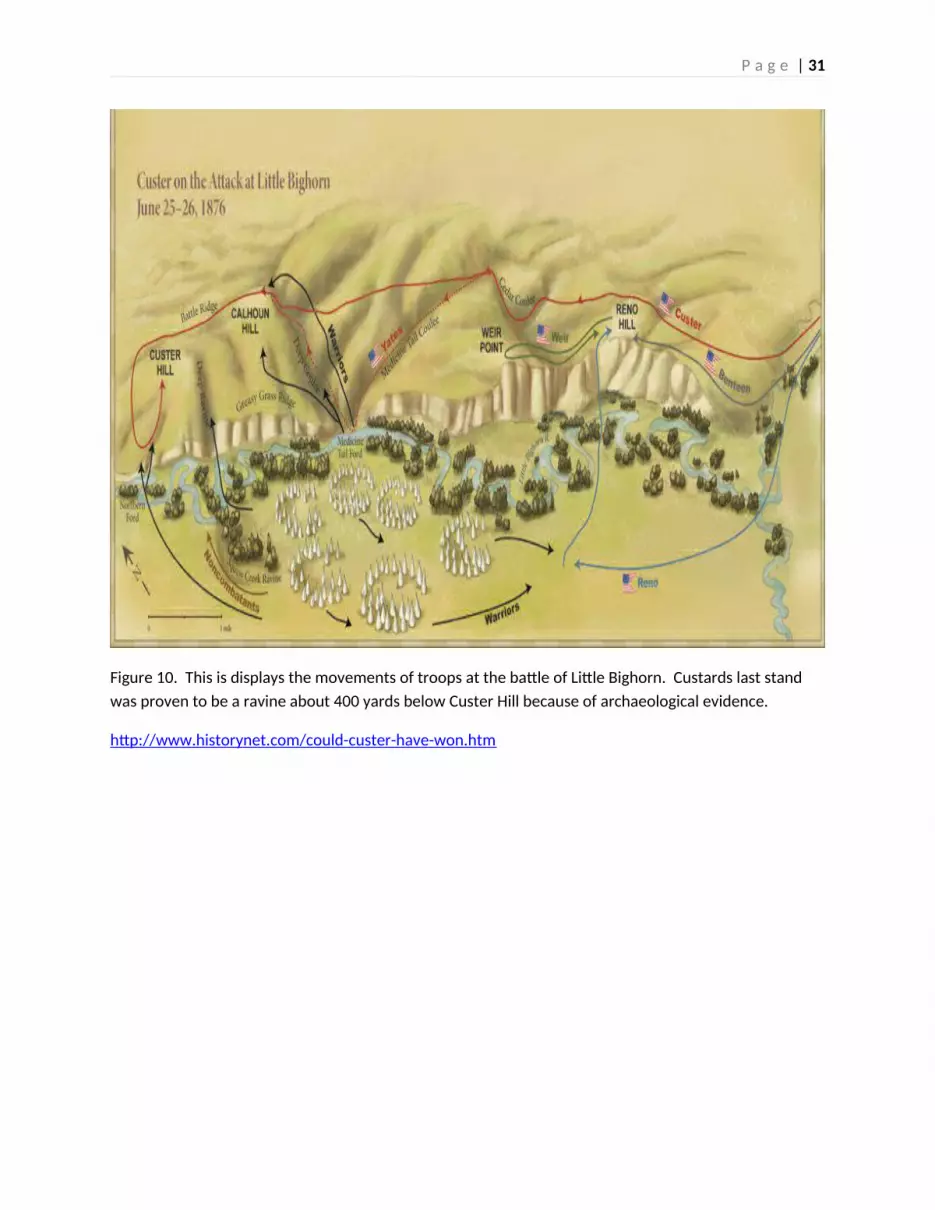
In this last case study I mention metal detectors, these were used to pinpoint Lieutenant
Colonel Custer’s last stand at the Battle of the Little Bighorn. The United States (Unknown
date) notes:
By combining crime lab methods with the archeological constructs of spatial patterning and individual artifact analysis, they have been able to discover evidence for the movement of individual firearms over the field of battle, verify cavalry positions, and define previously unknown Indian fighting area…When their detectors ‘beeped’, they marked the area with a pinflag. (nps.gov).
In this three part archaeological study, the metal detectors were the first part. Volunteers walked
the battlefield spaced out five meters apart. The second part consisted of a recovery crew that
would unearth the object found and leave it in place. The third part was the survey crew which
would make detailed notes about the artifact such as depth, declination of the piece, and angle
and distance in relation to other surrounding artifacts. Artifacts were collected after these three
steps. The United States notes, “Bone was the major class of artifact found in the excavations”.
(nps.gov).
Metal detectors saved time and improved efficiency. Without them this study about
Custer’s soldiers would have never happened and there would have been no excavations. Keep
in mind that metal detectors only made discoveries like almost all of the remote sensing

P a g e | 20
technologies mentioned in this paper. The knowledge was gained through traditional
archeological excavations of these areas marked by metal detectors. The metal detectors enabled
discoveries of bullets and shell casings. Excavations of the bullets and shell casings led to the
knowledge and confirmation on how the battle played out and to where Custer and his soldiers
actually died. (Figure 10).
Conclusion
Next time you want to do an archaeological survey, you should consider doing a
predictive model using one of the methods above. These methods all have their pros and cons.
They all have been proven to be useful in one way or another. The methods of remote sensing
can be helpful to archaeological efficiency, monitoring, and discovery as long as the analysis is
done properly. The core of archaeology will always be knowledge about material culture.
Analyzing remote sensing data is not an easy task but predictive models and digital imagery such
as maps can help the field of archaeology as a whole. It can be envisioned that remote sensing
will never be the core of archaeology but it can enhance that core through discovery. Remote
sensing models can narrow down the list of potential archaeological sites in a region; therefore, it
can improve efficiency. Keep in mind that ground truthing these remote sensing models does not
always generate with great results. Satellite images can simply be compared and discovery of
looting can occur without ever being at a site because of true color composite photos. This
simple comparison is very effective monitoring of large archaeological sites. Some satellites are
very high resolution satellites. These are effective in their way because they can give
unbelievably precise data for analysis. However, they have limitations like any other and cannot
penetrate overhead interference just like Landsat satellites. In this situation LIDAR or SAR can

P a g e | 21
do what another cannot. Remote sensing is versatile and where one method fails archaeology
another will help it succeed in making discoveries that lead to knowledge.
P a g e | 22
Figure 1. This is a 2.5D color hillshaded image of Caracol. This image displays the level of landscape manipulation that the Maya used.
P a g e | 23
Figure 2. A and C are Shuttle Radar Topography Mission Digital Elevation Models of Pampa de Naza in Peru while B is a panchromatic WorldView2 satellite image of the same area. B and C have geoglyphs labeled on the right while linear disturbances to the site are labeled on the left.

P a g e | 24
Figure 3. This is an image of New York City taken from the LANDSAT 3 MSS imager. I processed this image through ArcMap 10.3 and obtained it from http://glovis.usgs.gov/. There are definite linear features seen in this image such as roads and bridges.
P a g e | 25
Figure 4. This is an image of New York City taken from LANDSAT 8 on the USGS website. I processed this image through ArcMap 10.3 and obtained it from http://glovis.usgs.gov/. The immense urban development is easily visible such as bridges, buildings, and parks.

P a g e | 26
Figure 5. These two are red band images from IKONOS (top) and QuickBird (Bottom). These are taken over an intersite area.

P a g e | 27
Figure 6. This is the final processed image from QuickBird with all 40 archaeological survey blocks highlighted as squares.

P a g e | 28
Figure 7. This is the 8-class ISODATA scene of the processed QuickBird image with highlands and lowlands labeled.

P a g e | 29
Figure 8. One of the 40 archaeological blocks with linear agricultural features highlighted.
P a g e | 30
Figure 9. The left hand side is a image from Cafetal taken from a Google Earth scene while the right is a 2010 GeoEye image. There is obvious a lot more holes in the GeoEye image that is indicative of illegal excavations.
P a g e | 31
Figure 10. This is displays the movements of troops at the battle of Little Bighorn. Custards last stand was proven to be a ravine about 400 yards below Custer Hill because of archaeological evidence.
http://www.historynet.com/could-custer-have-won.htm

P a g e | 32
Works Cited.
Andrews, T. D., G. MacKay, and L. Andrew. 2012. "Archaeological Investigations of Alpine Ice Patches in the Selwyn Mountains, Northwest Territories, Canada." Arctic 65 (SUPPL. 1): 1-21. www.scopus.com.
Chase, A. F., D. Z. Chase, C. T. Fisher, S. J. Leisz, and J. F. Weishampel. 2012. "Geospatial Revolution and Remote Sensing LiDAR in Mesoamerican Archaeology." Proceedings of the National Academy of Sciences of the United States of America 109 (32): 12916-12921. doi:10.1073/pnas.1205198109. www.scopus.com.
Chen, F., R. Lasaponara, and N. Masini. 2015. "An Overview of Satellite Synthetic Aperture Radar Remote Sensing in Archaeology: From Site Detection to Monitoring." Journal of Cultural Heritage. doi:10.1016/j.culher.2015.05.003. www.scopus.com.
Garrison, T. G. 2010. "Remote Sensing Ancient Maya Rural Populations using QuickBird Satellite Imagery." International Journal of Remote Sensing 31 (1): 213-231. doi:10.1080/01431160902882629. www.scopus.com.
Garrison, T. G., S. D. Houston, C. Golden, T. Inomata, Z. Nelson, and J. Munson. 2008. "Evaluating the use of IKONOS Satellite Imagery in Lowland Maya Settlement Archaeology." Journal of Archaeological Science 35 (10): 2770-2777. doi:10.1016/j.jas.2008.05.003. www.scopus.com.
Giardino, M. J. 2011. "A History of NASA Remote Sensing Contributions to Archaeology." Journal of Archaeological Science 38 (9): 2003-2009. doi:10.1016/j.jas.2010.09.017. www.scopus.com.
James, Wiseman, and Farouk El-Baz, eds. Interdisciplinary Contributions to Archaeology: Remote Sensing in Archaeology. Springer Science & Business Media, 2007. Print.
Keeney, J. and R. Hickey. 2015. "Using Satellite Image Analysis for Locating Prehistoric Archaeological Sites in Alaska's Central Brooks Range." Journal of Archaeological Science: Reports 3: 80-89. doi:10.1016/j.jasrep.2015.05.022. www.scopus.com.
Landsat Project Description. USGS., n.d. Web. 10 Oct. 2015. Retrieved from http://landsat7.usgs.gov//about_project_descriptions.php
Lasaponara, R., G. Leucci, N. Masini, and R. Persico. 2014. "Investigating Archaeological Looting using Satellite Images and GEORADAR: The Experience in Lambayeque in North Peru." Journal of Archaeological Science 42 (1): 216-230. doi:10.1016/j.jas.2013.10.032. www.scopus.com.
Lasaponara, R. and N. Masini. 2006. "On the Potential of QuickBird Data for Archaeological Prospection." International Journal of Remote Sensing 27 (16): 3607-3614. doi:10.1080/01431160500333983. www.scopus.com.
P a g e | 33
Memarsadeghi, N., D. M. Mount, N. S. Netanyahu, and J. Le Moigne. 2007. "A Fast Implementation of the Isodata Clustering Algorithm." International Journal of Computational Geometry and Applications 17 (1): 71-103. doi:10.1142/S0218195907002252. www.scopus.com.
Myers, A. 2010. "Camp Delta, Google Earth and the Ethics of Remote Sensing in Archaeology." World Archaeology 42 (3): 455-467. doi:10.1080/00438243.2010.498640. www.scopus.com.
Heimmer, Don H., and Steven L. De Vore. Near-Surface, High Resolution Geophysical Methods for Cultural Resource Management and Archeological Investigations. Denver: National Park Service, 1995. Print.
Society for American Archaeology. "Principles of Archaeological Ethics." Principles of Archaeological Ethics. Society for American Archaeology, n.d. Web. Access data: 02 Dec. 2015. http://www.saa.org/AbouttheSociety/PrinciplesofArchaeologicalEthics/tabid/203/Default.aspx
Unknown Author. "Satellite Imaging Corporation." WorldView-3 Satellite Imagery and Satellite Sensor Specifications. Satellite Imaging Corporation, n.d. Web. Access date: 05 Nov. 2015. Retrieved from http://www.satimagingcorp.com/satellite-sensors/worldview-3/
United States. National Park Service. "Archeology at The Battle of the Little Bighorn." National Parks Service. U.S. Department of the Interior, n.d. Web. 06 Nov. 2015. Retrieved from http://www.nps.gov/mwac/libi/methods.html
Wolff, C. B. and T. M. Urban. 2013. "Geophysical Analysis at the Old Whaling Site, Cape Krusenstern, Alaska, Reveals the Possible Impact of Permafrost Loss on Archaeological Interpretation." Polar Research 32 (SUPPL.). doi:10.3402/polar.v32i0.19888. www.scopus.com.