kevin wan utap anyi - core
TRANSCRIPT
i
Kevin Wan Utap Anyi
________________________________
Topic Maps : A Bibliometric Study
Master thesis International Master in Digital Library Learning
2012
brought to you by COREView metadata, citation and similar papers at core.ac.uk
provided by Open Digital Archive at Oslo and Akershus University College
ii
Abstract
Topic Maps is an international standard (ISO/IEC 13250) to describe and encode knowledge
structures and associating them with relevant information resources. This thesis seeks to investigate
what has been written about Topic Maps from year 2000 to 2011, as well as finding out the research
and publication trend in Topic Maps. This study was based on quantitative methodology, which was
bibliometric analysis. The data was collected from Scopus and Web of Knowledge databases. Search
keywords used are “topic map”, “topic maps” and “ISO/IEC 13250”. A total of 356 publications (265
conference papers, 91 journal articles) from 2001 to 2011 taken into data analysis. The findings
revealed that Topic Maps researchers had a preference to present their findings in conference rather
than in journal. The authorship pattern was more towards coauthorship. Most researchers were
coauthored locally, as international collaboration was very low. Computer science and library and
information science related journals were the favourite publishing venue. Majority of the
conferences were computer science and education related. The focus of the topic maps was on data
integration and interoperability (2001-2004), information theory (2005 – 2008), knowledge and
intelligent based system (2009 – 2011). Also, there were five themes identified, namely content
management, repository, ontology, information architecture, retrieval and navigation, and semantic
web. The future research areas will possibly be collaborative e-learning system, knowledge
visualization system, visualization construction, semantic metadata creation from a relational
database, knowledge navigation and retrieval improvement, intelligent topic map, distributed
knowledge management based on extended topic maps, knowledge service system, knowledge
representation modeling, and multi granularity and multi-level knowledge.
Keywords: topic maps, bibliometric
Master thesis International Master in Digital Library Learning
2012
iii
Acknowledgements
Here I would like to express my gratitude towards Erasmus Mundus for giving me the golden
opportunity to further my postgraduate study in the elite digital library programme. I give thanks to
Father God for His blessing and covering. I am indeed blessed to have supportive family, wonderful
DILL classmates, cute friends, brilliant thesis supervisor, resourceful DILL teachers and dedicated
programme administrators. You all have, directly or indirectly, shaped who I am today. Euphoria.
iv
Table of Contents
Abstract ................................................................................................................................................ ii
Acknowledgements ..............................................................................................................................iii
List of Figures ....................................................................................................................................... vii
List of Tables ....................................................................................................................................... viii
CHAPTER 1 : Introduction ..................................................................................................................... 1
1.1. Introduction ............................................................................................................................... 1
1.2. Motivation ................................................................................................................................. 1
1.3. Statement of Problem ................................................................................................................ 2
1.4. Aims and Objectives ................................................................................................................... 3
1.5. Research Questions.................................................................................................................... 3
1.6. Limitation and Scope.................................................................................................................. 3
1.7. Outline of Thesis ........................................................................................................................ 4
CHAPTER 2 : Literature Review ............................................................................................................. 5
2.1. Introduction ............................................................................................................................... 5
2.2. Topic Maps ................................................................................................................................. 5
2.2.1. Topic Maps Concept ............................................................................................................ 6
2.2.2. Building Topic Maps ............................................................................................................ 7
2.3. Topic Maps Application .............................................................................................................. 8
2.3.1. Knowledge Management .................................................................................................. 10
2.3.2. Digital Library .................................................................................................................... 10
2.3.3. Visualization and Navigation ............................................................................................. 11
2.3.4. Integration ........................................................................................................................ 12
2.3.5. Semantic Indexing ............................................................................................................. 12
2.3.6. E-learning .......................................................................................................................... 12
v
2.3.7. Content management ....................................................................................................... 13
CHAPTER 3 : Methodology .................................................................................................................. 14
3.1. Introduction ............................................................................................................................. 14
3.2. Bibliometric .............................................................................................................................. 14
3.2.1. Distribution of publication ................................................................................................ 15
3.2.2. Authorship ........................................................................................................................ 16
3.2.3. Country ............................................................................................................................. 16
3.2.4. Hosting journal and conference proceedings .................................................................... 17
3.2.5. Citation analysis ................................................................................................................ 17
3.2.6. Content analysis ................................................................................................................ 18
3.3. Data Collection Techniques ...................................................................................................... 19
3.3.1. Data source ....................................................................................................................... 19
3.3.2. Search Strategy ................................................................................................................. 20
3.4. Data analysis ............................................................................................................................ 22
CHAPTER 4 : Data Analysis .................................................................................................................. 24
4.1. Introduction ............................................................................................................................. 24
4.2. Question 1: How publications are placed in time? ................................................................... 24
4.2.1. Distribution of publication per year .................................................................................. 24
4.2.2. Distribution of publication cumulative per year................................................................ 25
4.2.3. Distribution of publication type per year .......................................................................... 25
4.2.4. Regression analysis (trendline).......................................................................................... 27
4.3. Question 2: How publications are concentrated to specific authors, journals, conference
proceedings, and country ............................................................................................................... 28
4.3.1. Top productive author ...................................................................................................... 28
4.3.2. Single authored and collaborative publication per year ................................................... 30
4.3.3. Distribution number of publication per number of author ............................................... 30
4.3.4. Top journal title published ................................................................................................ 32
4.3.5. Distribution of journal subject category ............................................................................ 33

vi
4.3.6. Top conference title published ......................................................................................... 36
4.3.7. Distribution of conference subject category .................................................................... 38
4.3.8. Distribution of publication by country .............................................................................. 41
4.4. Question 3: Which Topic Maps publications are the most cited? ............................................ 45
4.4.1. Top cited publications and references .............................................................................. 45
4.4.2. Top Cited journals ............................................................................................................. 47
4.5. Question 4: What has been studied about Topic Maps? ......................................................... 48
4.5.1. Title word count ................................................................................................................ 48
4.5.2. Author’s keyword count .................................................................................................... 49
4.5.3. Index keyword count......................................................................................................... 51
4.5.4. Summary based on title words, author’s keywords and index keywords ......................... 53
4.5.5. Bibliometric mapping of title and abstract using co-word analysis ................................... 54
4.6. Question 5: What are the future research areas? .................................................................... 56
CHAPTER 5 : Discussion and Conclusion ............................................................................................. 57
5.1. Conclusion ................................................................................................................................ 57
5.2. Discussion ................................................................................................................................ 60
References .......................................................................................................................................... 65
Appendixes ......................................................................................................................................... 68
vii
List of Figures
Figure 4. 1 Distribution of publication per year .................................................................................. 24
Figure 4. 2 Distribution of publication cumulative per year ................................................................ 25
Figure 4. 3 Distribution of publication type per year .......................................................................... 27
Figure 4. 4 Regression analysis of publication..................................................................................... 27
Figure 4. 5 Trend of Articles Productivity in 1985-2007 ...................................................................... 30
Figure 4. 6 Distribution number of publication per number of author ............................................... 31
Figure 4. 7 Distribution number of publication per number of author based on publication type ..... 32
Figure 4. 8 Publishing journal subject area ......................................................................................... 34
Figure 4. 9 Conference subject area ................................................................................................... 39
Figure 4. 10 Country distribution of publication based on total articles ............................................. 43
Figure 4. 11 Country distribution of publication based on single country articles .............................. 44
Figure 4. 12 Country distribution of publication based on internationally collaborative articles ....... 44
Figure 4. 13 Bibliometric mapping of title and abstract (density view) ............................................... 55
viii
List of Tables
Table 4. 1 Top productive author ........................................................................................................ 29
Table 4. 2 Top journal title published ................................................................................................. 33
Table 4. 3 Distribution of publishing journal per year ......................................................................... 34
Table 4. 4 Topic Maps related articles in LIS journals.......................................................................... 35
Table 4. 5 Topic Maps related articles in medical journals ................................................................. 36
Table 4. 6 Top conference title published ........................................................................................... 38
Table 4. 7 Distribution of conference subject per year ....................................................................... 40
Table 4. 8 Distribution of publication by country ................................................................................ 41
Table 4. 9 Top cited publications ........................................................................................................ 45
Table 4. 10 Top cited references ......................................................................................................... 46
Table 4. 11 Top cited journals ............................................................................................................. 47
Table 4. 12 Title word count by year ................................................................................................... 49
Table 4. 13 Author’s keyword count by year ...................................................................................... 51
Table 4. 14 Index keyword count by year ........................................................................................... 53
Table 4. 15 Density of Terms (Themes identified)............................................................................... 54
Table 4. 16 Top title, author and index keywords in year 2009 - 2011 ............................................... 56
Table 4. 17 Possible future research areas ......................................................................................... 56
1
CHAPTER 1: INTRODUCTION
1.1. Introduction
This introductory chapter outlines the rational for this thesis. It introduces the thesis with the
motivation of the research, statement of problem, aims and objectives and finally research
questions. The motivation is the curiosity of knowing the research topics of Topic Maps. This leads to
the statement of the problem. The statement of problem describes how this thesis would benefit
and be a guide for future research on Topic Maps. Lastly, aims and objectives, also research question
present the importance of the study.
In this thesis, the phrase “Topic Maps” as a capitalized proper noun is used referring to the name of
ISO/IEC 13250. Whereas, “topic map” a common noun of the singular form of “topic maps” is
referring to set of topics and associations.
1.2. Motivation
My interest in Topic Maps originated from the course Digital Documents in Masters in Digital Library
Learning programme which held in University College of Oslo and Akershus. Before the course, I have
not been exposed to knowledge representation tool such as Topic Maps. Seeing the basic
functionality of Topic Maps in the field of library and information science, I began to express interest
to discover the research and publication of Topic Maps in various domains.
Topic Maps is designed and developed to handle the construction of indexes, glossaries, thesauri,
and tables of contents (Park & Hunting, 2002). Topic map has been existed way back 20 years ago
since 1991. The Davenport Group started the work of topic maps, due to customer pressure, where
they insisted the vendors to improve subject term consistency in their document system and
published books. The major problem mentioned was how to provide master indexes for the
documentation system. In other words, it was the back-of-book indexes. Initially, the problem was
solved with SOFABED (Standard Open Formal Architecture for Browsable Electronic Documentary).
However, in 1992, a new group HyTime was established. It provided SGML (Standard Generalized
Markup Language) with multimedia and hyperlinking features. HyTime elaborated SOFABED model
into HyTM (HyTime Topic Maps). Then, it was taken to another paradigm to the Web as XTM (XML
Topic Maps) by Steven Newcomb. Eventually, Topic Maps specification was published as ISO/IEC
13250:2000 (Park & Hunting, 2002).
2
As mentioned that Topic Maps was developed to handle indexes; nevertheless, it has been applied
beyond other domain, such as Information architecture and web publishing and to enabling more
structured and semantic information retrieval on the web (Estrada, 2009). In other words, Topic
Maps provides a basis for the Semantic Web. When mentioning about Semantic Web, there is
another similar technology that provides the foundation for Semantic Web, and the technology is
RDF (Resource Description Framework). RDF is a model developed by World Wide Web Consortium
(W3C). RDF is a technology representing Information about resources in WWW, and W3C is leading
the Semantic Web aiming to make the current web from unstructured documents into a “web of
data” using RDF (Presutti, Garshol, Vitali, & Gessa, 2005). Topic Maps and RDF were developed in
parallel during the late 1990’s each by separate institutions, but in term of their purpose, they
appeared to be different. Topic Maps for human reading, and RDF for machine processing. However,
research has it that both turned out to have many similarities. Obviously, the RDF seems to be the
leading champion in Semantic Web as compared to Topic Maps because of RDF was developed
within W3C, which is more incline and favourable to the web as compared to ISO. Major academic
experts in knowledge representation field pointed out the weakness of conceptual or formal
foundation as a critical flaw of TM (KTweb, 2003). Despite this, various institutions are still currently
making research about Topic Maps. This indicated that Topic Maps provides an open field for various
research subjects. I believe many research groups are curious about literature review of Topic Maps.
Therefore, I studied about scientific literatures written on Topic Maps, which appears in journals and
conference proceedings. There is a literature review study on Topic Maps by Estrada (2009).
However, it was more confined to the library and information science. Hence, this thesis is not
merely a literature review, but it uses bibliometric methods to discover focus of the research on
Topic Maps.
1.3. Statement of Problem
The research problem for this thesis is to study what have been written about Topic Maps in
scientific journals and conference proceedings during the time frame of 2000 – 2011. This time frame
was selected because Topic Maps was published in ISO standard in 2000. Therefore, it is interesting
to find out the research and publication trend in Topic Maps as there is no study conducted on this
matter. This can be a guide and understanding for future research on Topic Maps. Also, it could help
to stimulate and benefit the research about Topic Maps in the future.
3
1.4. Aims and Objectives
This thesis seeks to investigate what has been written about Topic Maps during the period from year
2000 – 2011. In other word, this research aims to find out any open field for various research
subjects. Below are the specific objectives of this study:
To identify the publication trend of Topic Maps whether the publication is concentrated on
certain years.
To study the directions and focuses of Topic Maps research.
To identify researchers, journals, conference proceedings and countries which have been
concentrated on Topic Maps research.
To discover future research area of Topic Maps.
1.5. Research Questions
Research questions are formulated from the statement of the problem presented earlier. Lukkari
(2011) carried out bibliometric study on Working Capital Management divided the research
questions into three groups, which are external, internal and future research areas. Therefore, the
research questions in this thesis are grouped into three categories, which are external and internal
attributes of publications and future research areas.
External attributes of the publications
1. How publications are placed in time?
2. How publications are concentrated to specific researchers, journals, conference proceedings,
and country?
Internal attributions of the publications
3. Which publications about Topic Maps are the most cited?
4. What has been studied about Topic Maps?
Future
5. What are the future research areas?
1.6. Limitation and Scope
The following limitation and scope was applied to this study:
Only peer-reviewed journal articles and conference papers were covered.
Literatures from year 2000 onwards were taken into consideration.
4
1.7. Outline of Thesis
There are five chapters in this thesis.
Chapter One of this thesis provides a rationale for the research project by providing some
background information, motivation of doing such research, and discussion of research problem. The
research questions are stated together with the aims and objectives as well as limitation and scope.
Chapter Two reviews on the literature which informed of this thesis. It defines the studied topic
Topic Maps and presents different findings and perspectives to TM from recent scientific literature.
Chapter Three outlines the methodology used in this thesis and provides justification for that choice.
Data source, data collection and analysis, are examined.
Chapter Four consists of data analysis. Analysis of the literature and a discussion of the findings in
relation to the literature discussed in Chapter Two.
Chapter Five presents conclusion and discussion about the findings of this study and offer
suggestions for further research.
5
CHAPTER 2 : LITERATURE REVIEW
2.1. Introduction
This chapter aims to review the literatures which are related to Topic Maps. Literatures on Topic
Maps will be reviewed on a general level and its usage, application and functionality.
2.2. Topic Maps
Topic Maps is an international standard (ISO/IEC 13250) to describe and encode knowledge
structures and to associate them with relevant information resources (Pepper, 2000, 2002). It is an
advanced technique of indexing, linking and addressing knowledge representation (Garshol & Moore,
2008). Topic Maps started from the merging of electronic indexes where it solves the information
management problems involved in creating, maintaining and processing indexes for complex
documentation (Garshol, 2004; Pepper, 1999, 2000). Topic mapping is found traditionally in back-of-
book indexes, glossaries and thesauri (Pepper, 2002). Therefore, it is very close to subject-based
classification technique(Pepper, 2000). Topic maps are subject-centric (Pepper, 2002). Through its
emphasis on the centrality of subjects, rather than documents or applications, it presents a new way
of using computers to manage information and knowledge, dubbed subject-centric computing
(Pepper & Moore, 2010).
Topic Maps is published as ISO/IEC 13250 in 2000 (Garshol, 2002). This standard is known as HyTM
(short for HyTime Topic Maps), which defines the basic model with SGML-based syntax. When HyTM
was established, there were three known issues with the syntax. The issues were (1) HyTM is not an
XML syntax, (2) it is not a complete Document Type Definition (DTD), and (3) it did not use URIs for
external references (Biezunski, Newcomb, & Bryan, 2006). With these issues, it was clear that
something more web-optimized was needed. Therefore, TopicMaps.Org was formed in ad-hoc to
create a new XML and URIs based topic map syntax (Biezunski et al., 2006; Garshol, 2002). Then in
2001, XML Topic Maps (XTM) 1.0 specification was published and accepted into the second edition of
ISO 13250. XTM become the main topic map syntax in many topic map tools; HyTM syntax, on the
other hand, is rarely used (Garshol, 2002). This had brought TopicMaps.Org and the ISO topic map
committee came into an agreement on a division of labour, where ISO would focus on core standards
development, meanwhile TopicMaps.Org would focus on the user community issues. Later ISO
approved two new standards, namely, TMQL (Topic Map Query Language) and TMCL (Topic Map
6
Constraint Language), and the topic map data model was being reformulated was being reformulated
(Pepper & Garshol, 2002). TMQL is a query language for topic maps. It helps and simplifies
information extraction (Biezunski et al., 2006). The creation of the query language provides a possible
approach to interoperability between any two technologies, in other words, integration at the query
level (Garshol, 2003). As for TMCL, it is a schema or constraint language for topic maps. Schemas can
be written to give constrains what is allowed to say in the topic maps (Biezunski et al., 2006), so that
it can ensure greater consistency and more predictable results for both users and applications
(Pepper & Moore, 2010). As for TopicMaps.Org, they became a member section of OASIS1 and
decided to start promoting the published subjects concept (Garshol, 2002).
Topic maps is organized around topics, and each topic is used to represent some real-world thing
(Garshol & Moore, 2008; Pepper, 2000). In other words, the central of topic maps are topics which
represent about the things the topic maps is. The basic concept of topic map is topics, associations
and occurrences. Topic is subjects of discourse; association is relationship between the subjects; and
occurrence, is connection between the subjects and information resources (Garshol, 2002).
Pepper (1999, 2000) mentioned that topic maps enabled to encompass all navigation aids and
retrieval, such as multi-document indexes, glossaries, cross reference and thesauri. Then in 2002,
Pepper & Garshol (2002) said that a Topic Map is functionally equivalent to these navigation aids and
retrieval. However, the selling point always brought up in Topic Maps has been placed at the
centrality of Topic Maps, which is the concept of the subject, is being applied. It focuses more on
how to name and how to identify subject. According to Grønmo (2003), there are not any other
knowledge representation puts this much focus on these two as much as Topic Maps. Pepper (2002),
who compared RDF and Topic Maps, mentioned that the prominent knowledge representation RDF is
focused on resources where information resources are attached with metadata structure, whereas,
Topic Maps focus on the “aboutness” of information in a subject, by applying proper naming and
identifying subject.
2.2.1. Topic Maps Concept
A topic map is essentially an SGML or XML documents used for representing topics, occurrences of
topics, and associations between topics. The key concepts are the topic (and topic type), the topic
occurrence (and occurrence role), and the topic association (and association type) (Pepper, 1999,
1 OASIS (Organization for the Advancement of Structured Information Standards) is a not-for-profit consortium that drives the development, convergence and adoption of open standards for the global information society.
7
2007). To be easily remembered the key concept, acronym “TAO” is the short for Topics, Association
and Occurrences. Other concepts like scope, public subject and facets, are an extension of topic map
model which provide more expressions (Pepper & Moore, 2001; Pepper, 2000).
Topic
A topic can be any “thing”, such as, a person, an entity, a concept, regardless of its existence and
characteristics (Pepper, 1999, 2000).
Occurrences
A topic may be related to one or more information resources, and vice versa. These resources are
called occurrences of the topic. Occurrences perform the similar function like the page numbers in a
back-of-book index (Garshol, 2004; Pepper, 2000). The resources for occurrences are either: resource
reference (a URI - Uniform resource identifier) or resource data (expressing a piece of information
about a subject) (Pepper & Moore, 2001).
Association
An association defines as a relationship between one or more topics. The topics are members of that
association (Pepper & Moore, 2001) and they has corresponding association role played in that
association (Pepper, 1999).
2.2.2. Building Topic Maps
Topic Maps is represented in many ways, in files, inside databases, as internal data structures in
running programs, and in the human mind. All these different ways have the similar representation
of abstract structure, in the form of a data model (Garshol & Moore, 2008).
There are several different approaches to build Topic Maps. There are three main approaches to
build Topic Maps (Garshol, 2002):
Manually by humans authoring the topic maps. The advantage is producing high quality and
rich topic maps. Disadvantage will be the expensive cost of human labour.
Automatically generate Topic Maps from existing source data which is well-structured and
has clearly defined semantics and metadata (Pepper & Garshol, 2002). However,
8
unstructured source data can be made structured via various natural-language processing
tools (Garshol, 2002; Pepper & Garshol, 2002). Nevertheless, the task is more complex
because rarely the output result is usable without any quality assurance done by a human
(Pepper & Garshol, 2002).
100% automatically produce the Topic Maps from structured source data like XML, RDBMS,
LDAP servers and more specialized applications. This is because data originating from
relational databases is marked up using SGML or XML, along with metadata which is rich and
consistent (Pepper & Garshol, 2002). It defines interchange syntaxes based on SGML or XML
(Pepper, 1999). Topic Maps Engine appears in every topic map application. It is equivalent to
an RDBMS database engine. It functions to import and export XTM, store update, and query
topic maps. Any storage and updates will be taken care by the engine (Garshol, 2002).
Other than the above approaches, the creation of Topic Maps could be based on these three types:
System Topic Map, Semantic Topic Map, and User-Defined Topic Map (Ahmed, 2000):
System Topic Map: It combines several similar type of repositories into a virtual repository
with seamless browsing. It acts as an application that could talk and merge the output of
multiple system topic map engines
Semantic Topic Map: The meaning from the content of the repository is extracted and be
used to generate semantic topic map. It represents the connections of that meaning as a
Topic Map.
User defined Topic Map: It gives users to create their own perspectives on a set of data.
Eventually, it can be applied in 3 areas, namely, Individual workspaces, shared workspaces
and knowledge management.
2.3. Topic Maps Application
Ever since Topic Maps has become ISO standard, it is used in a variety of fields and purposes. Topic
Maps have several classic functions: Classifying and organizing, querying (adding semantic precision),
navigating (semantically and multiview point), filtering and segmentizing (capturing context),
visualizing and merging (ISO/IEC JTC1/SC34/WG3, 2008). Garshol (2004) explained that Topic Maps
facilitates many tools such as programming APIs (Application programming interface), query
languages, schema languages, portal integration, graphic vizualization, content management,natural
language querying, workflow and so on.
9
Topic Maps have been used for many different purposes in industry, public sector, and academia
(ISO/IEC JTC1/SC34/WG3, 2008). In Europe, public sector used Topic Maps in pharmaceuticals,
automobiles, publishing and more (Newcomb & Biezunski, 2003). Estrada (2009) mentioned there
was a widespread of Topic Maps usage in Germany and Norway where there were numerous large
and small scale projects using Topic Maps.
The application of Topic Maps includes the following:
Semantic indexing (ISO/IEC JTC1/SC34/WG3, 2008), such as Metadata management (Garshol,
2007);
Semantic portals (Garshol, 2007);
Knowledge management (ISO/IEC JTC1/SC34/WG3, 2008; Pepper & Moore, 2010); Extension
of knowledge management involves areas like Businesss process management, Product
configuration, Business rules management, IT asset management, Manufacturing asset
management, and Intelligence gathering and analysis (ISO/IEC JTC1/SC34/WG3, 2008;
Garshol, 2007).
Specialized knowledge based systems (Pepper & Moore, 2010; Wrightson, 2001a);
E-learning(ISO/IEC JTC1/SC34/WG3, 2008; Pepper & Moore, 2010; Garshol, 2007);
Enterprise information integration (Pepper & Moore, 2010; Wrightson, 2001a; ISO/IEC
JTC1/SC34/WG3, 2008 ; Garshol, 2007);
Digital library (Pepper & Moore, 2010; Wrightson, 2001a);
Business process information flows and modelling (Garshol, 2007 ; Pepper & Moore, 2010;
Wrightson, 2001a).
Content management system (Pepper & Moore, 2010; Wrightson, 2001a), for example,
document management systems and technical documentation systems;
Information system (Pepper & Moore, 2010; Wrightson, 2001a), for example, Enterprise
Resource Management systems, Product data systems (engineering data, CAD/CAM);
Websites, portals (Pepper & Moore, 2010), catalogues, site indexes (Garshol, 2002),
intranets, extranets, existing portal resources (Pepper & Moore, 2010; Wrightson, 2001a),
and web publishing (Pepper & Moore, 2010; Wrightson, 2001a).
10
2.3.1. Knowledge Management
Topic maps is an enabling technology for knowledge management (Pepper, 2000). Since topic maps
is known for representing knowledge about the things it describes, it is used as knowledge
management tools (Garshol, 2002) where complex knowledge structures are encoded and linked
them to related information assets. In an organization, the corporate memory (roles, products,
procedures) is the knowledge structure and they are linked to different documentation using Topic
Maps (Pepper, 2000) and Topic Maps has the capability to capture and manage human knowledge
expressed by employees. This knowledge is eventually to be shared and reused across departments,
organizations and systems. This is possible because of the merging of information is based on
international standard possessed by Topic Maps (ISO/IEC JTC1/SC34/WG3, 2008; Pepper & Moore,
2010). Topic maps is expanded to other areas of Knowledge management such as Business process
management, Product configuration, Business rules management, IT asset management,
Manufacturing asset management, and Intelligence gathering and analysis (ISO/IEC JTC1/SC34/WG3,
2008).
Topic Maps are seen as a Knowledge Representation tool (Wrightson, 2001b). It integrates
knowledge representation and inference tools, such as case based reasoning and expert systems
(Wrightson, 2001a). The characteristics of Topic Maps for knowledge representation are (Wrightson,
2001b):
An associative network between resources could be established. Each resource represents
concept.
Resources are being organized in a knowledge space where topics are linked to the resources
in a structured way.
A unifying conceptual framework is used for interrelating different sets of information
resources.
2.3.2. Digital Library
Topic Maps has progressed into digital libraries. Digital library fundamentally is digital content that is
organized along with bibliographic principles. Traditional digital libraries are governed and organized
by bibliographic principles, however, Topic Maps is seen to be useful to attuned to the needs of
digital information and also supporting bibliographic principles and practices, making the digital
11
library semantic in a way (Pepper & Moore, 2010). The New Zealand Electronic Text Centre2 used
Topic Maps for managing digital content on documentary heritage materials. Estrada (2009)
mentioned that one significant application of Topic Maps to digital libraries is in facilitatinsg the
navigation of TEI (Text Encoding Initiative) encoded full-text collections.
2.3.3. Visualization and Navigation
Visualization is a technique for the enhancement of the users’ perception of the structure in large
information spaces and for a location to provide navigation facilities (Le Grand & De Paris, 2000).
Data visualization techniques are gradually becoming prominent. Hence, Topic Maps graphic user
interface is becoming easier to be built for data visualization purpose (Ahmed, 2000). There are
several Topic Maps engines provide visualization of Topic Maps. One example is provided by Ontopia
Navigator (Le Grand & De Paris, 2000).
Topic Maps adapted a few visualization techniques. Topic Maps can be seen as network of topics.
Graphs and trees are seen to be suitable in the representation of global structure of the Topic Maps
(Le Grand & De Paris, 2000). Graph visualization displays the Topic Maps as a set of interconnected
nodes (Ahmed, 2000). However, the downside of this is the representation may become cluttered
rapidly as the number of topics and associations increases. Therefore, it is not suitable for topic maps
containing millions of topics and associations (Le Grand & De Paris, 2000).
Topic Maps has been represented as maps. It is to enhance navigation in complex information
systems, especially for website. It illustrates the relative importance of each web page according to
the size of the corresponding zone on the map. The zone sizes are used to represent topics and
associations instead of web pages. Self-organizing map (SOM) algorithm of Kohenen is used to
organize automatically the documents into a two-dimensional grid so that related documents can
appear in the same zone or close to each other (Le Grand & De Paris, 2000).
Topic Maps is used as a visual data mining tool in virtual worlds and multidimensional
representation. With the visualization in 3-dimensional, users could interactively explore data and in
a faster pace to discover some meaningful patterns, trends and relationship in data mining (Le Grand
& De Paris, 2000).
2 http://www.nzetc.org/
12
2.3.4. Integration
Topic Maps provides a meta-model for integrating information and enabling subject-based merging
(Pepper & Moore, 2010). Information from different sources can be combined and they are
integrated into a single complete topic maps (Garshol, 2004). Information is usually dispersed in
several systems. To fasten and easy merging or integration of information, topic maps acts as a
middleware for transferring data between systems (Pepper & Moore, 2010). Costly migration,
integration and re-engineering of existing content will be avoided when applying topic maps (ISO/IEC
JTC1/SC34/WG3, 2008; Pepper & Moore, 2010).
Integration can be done via mappings technique. Topic maps has two approaches to applying
mappings between models: Static mappings and Dynamic mappings. Static mapping are about
conversions or exports: the step is straightforward as a set of data in the source model is brought to
produce a complete mapping in the target model, whether in serialized or in persistent storage.
Dynamic mappings are complicated. An API is needed where data from the source model are made
dynamically to be stored in the target model. Each updates to the source data is instantly reflected
through the mapping interface (L. M Garshol, 2001).
2.3.5. Semantic Indexing
The volume of information is exploding and overloading at an exponential rate, the same goes to the
search engine results. However, Topic Maps is used for semantic indexing. Semantic indexing is a
technique useful for searching and organizing large data collections, particularly unstructured data.
Therefore, Topic Maps provides subject-based organization, associative model (intuitive navigation)
and structured queries (add power to full-text search) (ISO/IEC JTC1/SC34/WG3, 2008). Instead of
returning documents, a Topic Maps based system can return the topics that best match and extra
information. This feature provides a starting point for going into the topic map and browsing around
to find the answer to the specific question (Garshol, 2004). The semantic indexing applies to
taxonomy management, metadata management and semantic portals (ISO/IEC JTC1/SC34/WG3,
2008).
2.3.6. E-learning
The core of e-learning is knowledge. This is somehow related to knowledge management where
knowledge is also largely involved (ISO/IEC JTC1/SC34/WG3, 2008). Topic maps is related in e-
13
learning because of its strengths as a content management technology (Pepper & Moore, 2010). In
the learning environment, Topic Maps is a model that captures knowledge acquisition, which is what
the student has learned. It structures e-learning systems, organizes school and university curricula
and enables the merging of Topic Maps built for such resources (ISO/IEC JTC1/SC34/WG3, 2008). In
Norway, school students are encouraged to create their topic maps to record what they have
learned. The National School Curriculum has its definitive expression in topic map (Pepper & Moore,
2010).
2.3.7. Content management
Topic Maps is used to organize content in content management systems. Traditional content
management only has simple folder hierarchies and property value metadata. However, Topic Maps
driven content management could integrate information from diverse sources, in a way could
function like an expert system (Garshol, 2002). Topic Maps model with metadata representation and
cross-linked structure of content, could increase findability and easy browsing in a system’s content
(Garshol, 2002, 2007; Ahmed, 2000). Other than that, integration of separate content management
system could be done by Integrated Topic Management System (ITMS). Topic Maps takes the process
of merging information from disparate sources and also with content management system content.
Eventually, information can be integrated easily and reuse again (Garshol, 2007).
14
CHAPTER 3 : METHODOLOGY
3.1. Introduction
This study is quantitative methodology. Quantitative methodology was selected because bibliometric
analysis was applied to this research. Bibliometrics were firstly introduced by Pritchard. It was the
usage of mathematical, in particularly, statistical methods to books and other media of
communication (Sun, Wang, & Ho, 2012). Citation and content analysis are found to be the
commonly used bibliometric methods. Bibliometrics have wide applications in various areas to
elevate research performance or assess the research trends by investigating the publication
characteristics, such as sources, authorship, geographical origins, subject and citations. Bibliometric
methods have been used to measure scientific progress in many disciplines of science and
engineering and are a common research instrument for systematic analysis. The concept of
“evaluative bibliometrics” was first proposed, and many scientists have tried to evaluate the research
trend in the publication outputs of countries, research institutions, journals and subject category,
citation analysis and the peak year citation per publication (Fu, Ho, Sui, & Li, 2010; Rosas, Kagan,
Schouten, Slack, & Trochim, 2011).
3.2. Bibliometric
Bibliometrics was established as the result of bibliographies statistical studies (Egghe & Rousseau,
1990). The term “Bibliometrics” was first proposed by Alan Pritchard. It is to update scientific
bibliographies. He analyzed literatures in order to discover the patterns of authorship, and the
historical development of subject fields, publication and use (Sun et al., 2012). In a simple way,
bibliometrics is a study of relationship of numbers and patterns in bibliographic data and use
(Kumara, Prakasan, Mohan, Kademani, & Kumar, 2009). The basic definition of bibliometrics then
means both statistical and mathematical methods applied to books and other materials, for example
journals (Egghe & Rousseau, 1990). Bibliographic studies include relationships among a number of
papers, growth of literature and patterns of library and database usage. In today’s context,
bibliometrics is a technique for production measurement and the dissemination of different schools
of human and scientific knowledge (Archambault & Gagné, 2004). Microsoft Encarta (2006) defines
bibliometrics studies as information scientists analyse many and various phenomena that affect any
aspect of information (Kumara et al., 2009). The evaluation of scientific work is among the key driving
forces behind scientific advancements (Rosas et al., 2011).
15
The purpose of using bibliometric could be a common research instrument for systematic analysis (Fu
et al., 2010; Mao, Wang, & Ho, 2010) to analyze certain quality of a research and performance of a
knowledge field (Lundberg, 2006), by giving a comprehensive picture of the scientific production of a
field, regardless of subjectivity in peer review and expert judgments (Chen & Guan, 2011).
Bibliometric has become a tool for monitor research evaluation and management such as research
funding allocation, academic promotion and recruitment (Chen & Guan, 2011; Della Mea, 2011;
Kumara et al., 2009). In addition, bibliometric forecasts important emerging research hot topics in
technological domains (Chen & Guan, 2011).
3.2.1. Distribution of publication
The study of publication output in a field can be a reliable indicator of research work’s status in that
field (Kumara et al., 2009). Analysis of the number of publications is the most basic bibliometric
indicators. The study was done by Della Mea (2011) showed that the distribution of papers in time by
year and it gave a variation of result about research. Li, Zhang, Wang, & Ho (2009) mentioned that
the gradual increases in the number of outputs revealed stable growth and communication in
research. Nevertheless, (Thornley, McLoughlin, Johnson, & Smeaton, 2011) argued that it is difficult
to get comprehensive and accurate data on publication numbers and even more difficult to get such
data on how often these publications have been cited. This could be a disadvantage and limitation of
bibliometric study.
Fu et al. (2010) conducted a study on bibliometric analysis of solid waste research to evaluate the
current trends, and the authors analyzed the publication document type aspect. Document types are
taken into consideration because in most bibliometric studies only certain document types are
included, and each different document types convey relevant scientific information (Rehn &
Kronman, 2008).
Also, Fu et al. (2010) had done an exponential model to describe the relationship between the annual
number of articles and the year published. This regression analysis method could estimate the
growth rate for annual articles and the trendline. Trendline is most reliable if suitable trendline is
applied, such as linear, logarithmic, polynomial, power, or exponential.
16
3.2.2. Authorship
The study of authorship pattern in publication is an attractive part of bibliometric study. The
counting of the number of the contributing author offers some indication to the degree of
collaboration between authors, at least two people by engaging their efforts in mind and body. This
is particularly common in the field of sciences as compare to humanities (Pradhan, Panda, &
Chandrakar, 2011).
Kumara et al. (2009) who analyzed physics and engineering literatures by identifying prolific authors
in the field. Most productive author with the number of publications more than 5 were observed.
Identifying prolific contributor could tell who is the key player in certain research field.
Della Mea (2011) studied the coauthorship and collaboration trend of Telepathology literatures. This
was to find out the involvement of coauthors in dissemination activity. The analysis of coauthorship
patterns is frequently used in bibliometric study as a mean for understanding collaboration (Rosas et
al., 2011).
Moppett & Hardman (2011) screened out authors with identical names and initials by checking the
author’s institutional and departmental affiliation. Furthermore, checking the first author and
reconfirm with the second author technique was used. Rehn & Kronman (2008) mentioned that
misspellings of author’s name may lead to incorrect number of citations and publications. However,
this type of error is common and negligible.
3.2.3. Country
From the analysis of the author’s affiliation, the country of the author could be identified provided
the address is available. Ugolini et al. (2010) used the first author’s country to identify the country of
origin of the article. Nevertheless, there will be a misleading for a study that based on the first author
country affiliation only because it will dilute the weight of international collaborative studies.
This could be overcame with the criteria made by Fu et al. (2010); Sun et al. (2012). The contribution
of different countries were determined by the location of the affiliation of at least one author of the
published papers. Those articles that were coauthored by researchers from more than one country
were assigned as “Internationally collaborative publication”. This is to show the pattern of
international collaboration to reveal information on the intensity and breadth of collaboration

17
between researchers of different countries (Chuang, Chuang, Ho, & Ho, 2011). “Independent
publication” was assigned to articles written by the researchers from the same country. “First author
publication” was assigned to article by the only first author’s country affiliation. “Publication of the
country of corresponding author” was assigned to articles where corresponding author’s country
affiliation is identified. Finding out internationally collaborative articles could suggest whether a
community of research is more internationally connected or not (Liu, Zhang, & Hong, 2011). Della
Mea (2011) reminded about the limitation of identifying the country of affiliation due to some papers
did not report affiliation and did not have country address.
3.2.4. Hosting journal and conference proceedings
An analysis of hosting journal and conference title can provide a perspective of the publication
pattern in a certain field (Franceschet, 2010; Rehn & Kronman, 2008). Della Mea (2011) indicated
that by examining the hosting journal for the articles, the result could show that the subjects focus of
a disciplinary area. There is also a debate concerning the role of conferences in computer science
field where computer scientist publish more in conference proceedings than in journals. However,
the impact of publishing in a journal is higher than the impact of conference papers (Franceschet,
2010). Within the discipline of Computer Science, one of the main issues has been proper recognition
of the importance of conferences versus journal publications, where journal publications are easily
evaluated through impact factors and the like, whereas the impact of publications in conferences is
less easily measured (Thornley et al., 2011). Therefore, identifying the type of journals and
conference proceedings could measure the impact of Topic Maps.
3.2.5. Citation analysis
Citations in papers are used to establish linkages with other papers. Citation is used widely in
bibliometric study as a study reference to and from documents (Jan, 2009). The citation analysis of
bibliographic records with a reference list could supply two main aspects of bibliometric study.
Firstly, the possibility to find publications in the same area by identifying the literatures that cite
(refer to) or are cited by the literatures in the bibliographic records. Secondly, is the assessment of
bibliometric quality. In other words, it is reasonable to assume that most citations are a positive sign
that citing author finds something useful in the material he cites (Rehn & Kronman, 2008).
18
Chen & Guan (2011) used citation analysis to detect influential publications which act as intellectual
turning points of nanobiopharm-research evolution during the given 18-year period. During the last
16 years, Li et al. (2009) identified the most cited papers in their study. These most cited papers were
able to recognize the research hotspot.
3.2.6. Content analysis
Content analysis of publications can be statistically based on keywords and title words. Keywords and
title words of publications convey the thought contents of the papers precisely and to identify the
direction of knowledge will grow (Kumara et al., 2009). Fu et al. (2010) mentioned that keywords
show research emphasis. Statistical analysis of keywords can be used to identify directions in science,
and has proved to be valuable in investigating the development of science and programmes. The
high title words and keywords frequency shows what are all the aspect that have been studied
(Kumara et al., 2009). The content analysis could be divided into title words analysis, author’s
keywords analysis, index keywords analysis, title and abstract analysis, and co-words mapping
analysis.
Title words analysis is feasible for content analysis as the title of an article calls for much deliberation
from authors and can provide valuable information of the whole paper to readers, helping them to
find the information (Fu et al., 2010; Sun et al., 2012). The title of an article includes reasonably
details of the articles’ subject that the author would like to communicate most to the readers (Li et
al., 2009; Mao et al., 2010). However, the downside of this analysis is when the title is segmented
into single words, it breaks the integrity of phrase in title (Mao et al., 2010).
Author keywords analysis could offer the information of research trend that is concerned by
researchers. Authors assign keywords that reveal the internal structure of an author’s reasoning.
(Sun et al., 2012). Therefore, they provide a reasonably detailed picture of the article’s theme (Fu et
al., 2010). The downside of this analysis is the lack of standardization among keywords assigned by
authors, for example, spelling variations, abbreviations and synonymous terms (Li et al., 2009).
However, different from title word analysis, in author keywords analysis, the intact words were
preserved that the authors want to convey (Mao et al., 2010).
Index keywords are database supplied extra search terms picked up from articles' titles cited by
authors in their footnotes and bibliographies (Mao et al., 2010) and is usually more concerned about
19
novel research directions than the mature direction in the field (Li et al., 2009). Index keyword
analysis could explain the article’s content with greater understanding and variety (Fu et al., 2010), in
other words, it could provide a reasonably comprehensive overview of research trends (Liu et al.,
2011).
Chen & Guan (2011) looked into content analysis in another direction where co-word analysis
mapping was involved. Co-word analysis is a bibliometric technique to find out research topics based
on the keyword usage pattern in publications, such as keywords or term extracted from title, abstract
or document’s body, which has been largely and successfully used for dynamic evolution of science.
It is a content analysis technique where mapping is carried out effectively to associate the strength
between keywords in text data. Science mapping, on the other hand, is for building bibliometric
maps that explain the way of scientific domains, specific disciplines or research fields are structured
conceptually, intellectually and socially (Cobo, Lopez Herrera, Herrera-Viedma, & Herrera, 2011). The
title and abstract word analysis could be added for mapping and to make inferences of the scientific
literature or to identify the subjective focus and emphasis specified by authors (Sun et al., 2012).
There are several softwares capable of mapping. They are Bibexcel, CiteSpace II, CoPalRed, IN-SPIRE,
Leydesdorff’s Software, Network Workbench Tool, Sci2 Tool, VantagePoint, and VOSViewer.
VOSViewer is selected for this study because it can be used to construct and visualize bibliometric
maps of any kind of co-occurence data. Also, it is based on mapping technique that constructs a
similarity matrix from a co-occurrence matrix using association strength (Cobo et al., 2011).
3.3. Data Collection Techniques
3.3.1. Data source
The data was collected from two scientific databases, namely Scopus and Web of Knowledge. Web of
Knowledge and Scopus were selected because of both are scientific databases where scientific
publications were indexed there. As Web of Knowledge and Scopus are competitors, hence both
might have distinct records. Therefore, both databases were selected for data collection. Both
databases have the bibliographic export functionality which saves a lot of time and less manual work
could be avoided.
20
3.3.2. Search Strategy
Keyword or term is essential for retrieving relevant records for this study. Therefore, below were the
keywords or terms which had been used in Web of Knowledge and Scopus for retrieving records for
data analysis.
Search keywords/terms used: “Topic Map”, “Topic Maps”, “ISO/IEC 13250”.
Collected data
Using the keywords/terms for search strategy, below were the results retrieved:
1. ISI Web of Knowledge database : 91 records
2. Scopus : 385 records
Data Cleaning:
Initial data cleaning was done in Microsoft Excel. Data cleaning was based on the research purpose
and questions. Data cleaning involved duplications, document types, publication year, and relevant
topic.
Duplication:
Both databases records were merged into single Microsoft Excel spreadsheet. Each duplication of
same records was removed. Same records here mean records with matching title and author.
Document types:
Scopus and Web of Knowledge indicated each bibliographic record with document types. Besides
duplications, conference review, editorial, note, review, short survey, book review, and news item
were removed. This is because the focus of this study is to find out what research or study had been
done on Topic Maps.
Relevant topic:
After checking each title and abstract of the record, it was found 10 records which were not related
to Topic Maps. Subject related to geography maps and RDF.
Publication year:
Records from publication year 2000-2011 were considered. Topic maps became ISO standard since
2000. Publications in 2012 were not included because the data in this study was collected in March
2012 and it was still early for 2012.
21
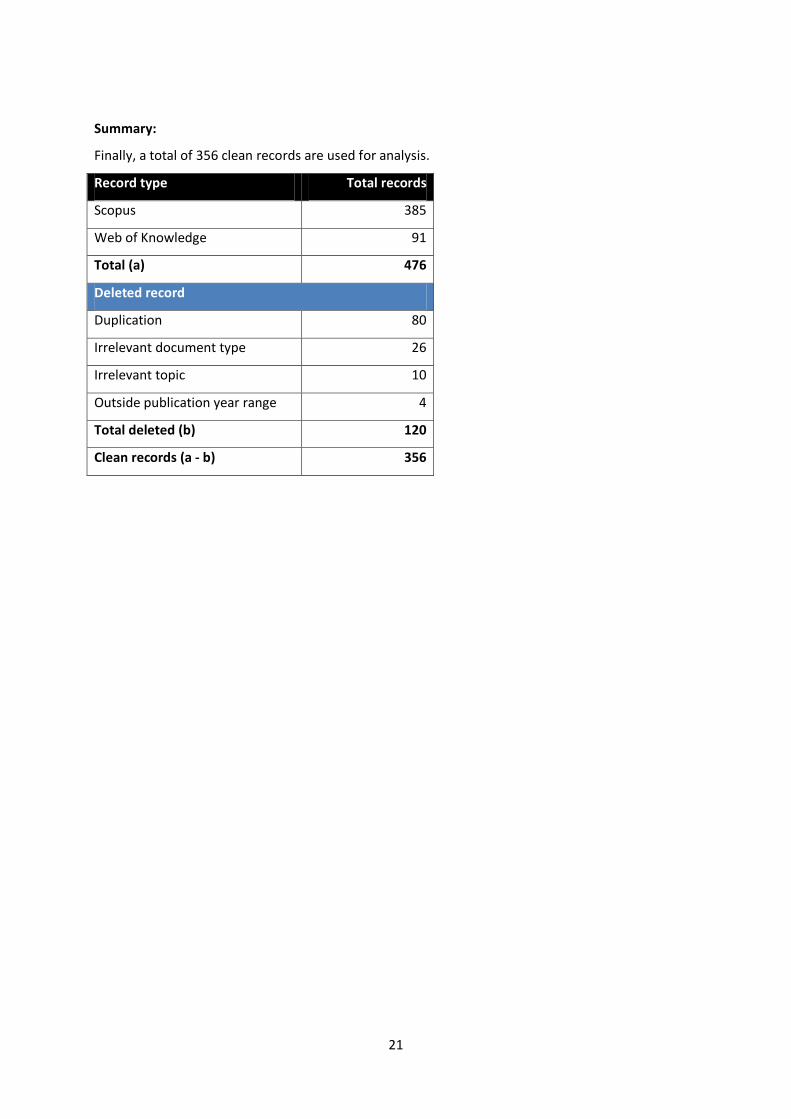
Summary:
Finally, a total of 356 clean records are used for analysis.
Record type Total records
Scopus 385
Web of Knowledge 91
Total (a) 476
Deleted record
Duplication 80
Irrelevant document type 26
Irrelevant topic 10
Outside publication year range 4
Total deleted (b) 120
Clean records (a - b) 356
22
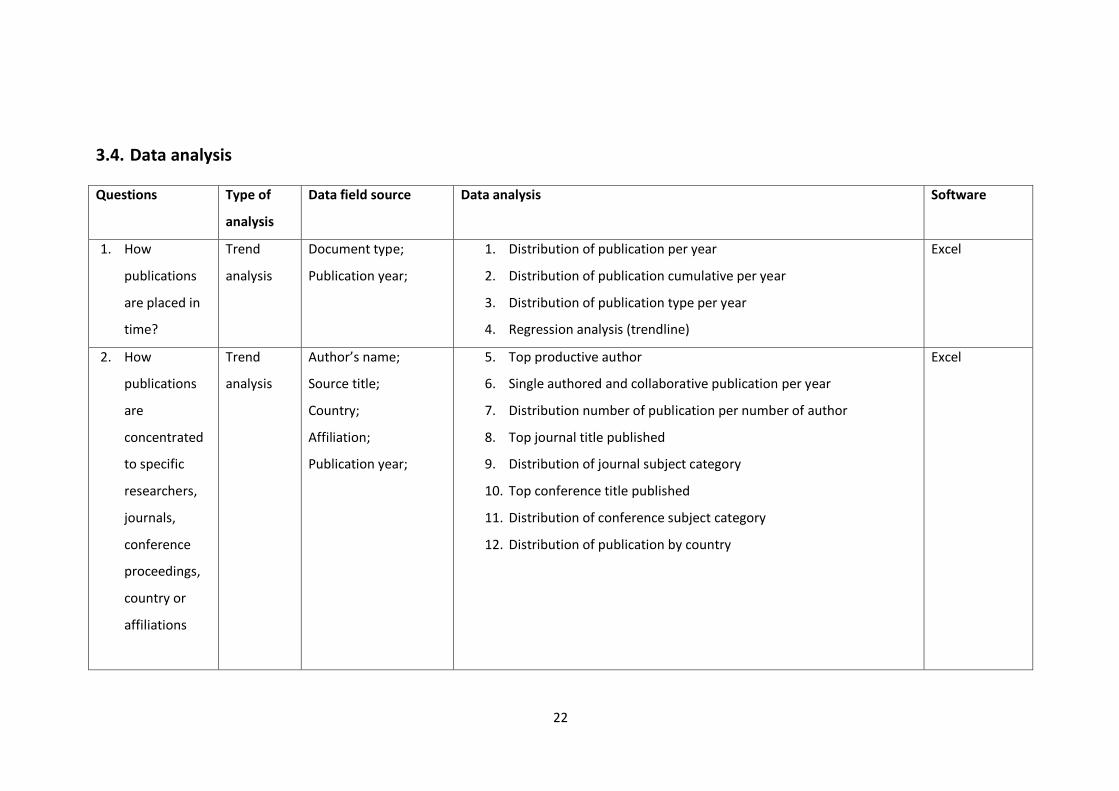
3.4. Data analysis
Questions Type of
analysis
Data field source Data analysis Software
1. How
publications
are placed in
time?
Trend
analysis
Document type;
Publication year;
1. Distribution of publication per year
2. Distribution of publication cumulative per year
3. Distribution of publication type per year
4. Regression analysis (trendline)
Excel
2. How
publications
are
concentrated
to specific
researchers,
journals,
conference
proceedings,
country or
affiliations
Trend
analysis
Author’s name;
Source title;
Country;
Affiliation;
Publication year;
5. Top productive author
6. Single authored and collaborative publication per year
7. Distribution number of publication per number of author
8. Top journal title published
9. Distribution of journal subject category
10. Top conference title published
11. Distribution of conference subject category
12. Distribution of publication by country
Excel
23
3. Which
publications
about Topic
Maps are the
most cited?
Citation
analysis
Cited by;
References;
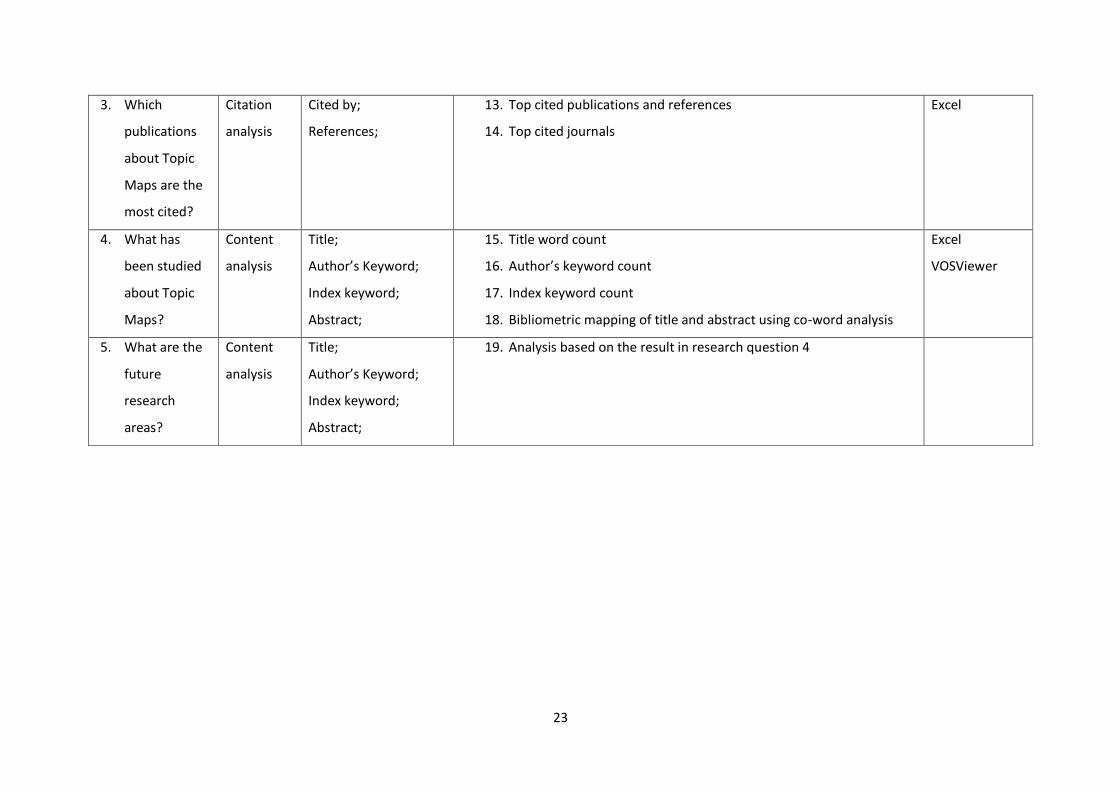
13. Top cited publications and references
14. Top cited journals
Excel
4. What has
been studied
about Topic
Maps?
Content
analysis
Title;
Author’s Keyword;
Index keyword;
Abstract;
15. Title word count
16. Author’s keyword count
17. Index keyword count
18. Bibliometric mapping of title and abstract using co-word analysis
Excel
VOSViewer
5. What are the
future
research
areas?
Content
analysis
Title;
Author’s Keyword;
Index keyword;
Abstract;
19. Analysis based on the result in research question 4
24
CHAPTER 4: DATA ANALYSIS
4.1. Introduction
This chapter presents the bibliometric analysis of data obtained which was the 356 publications from
year 2000 – 2011. The data analysis is divided into 5 sections and each section will report based on
the research questions of this study:
1. How publications are placed in time?
2. How publications are concentrated to specific researchers, journals, conference proceedings,
and country?
3. Which publications about Topic Maps are the most cited?
4. What has been studied about Topic Maps?
5. What are the future research areas?
4.2. Question 1: How publications are placed in time?
4.2.1. Distribution of publication per year
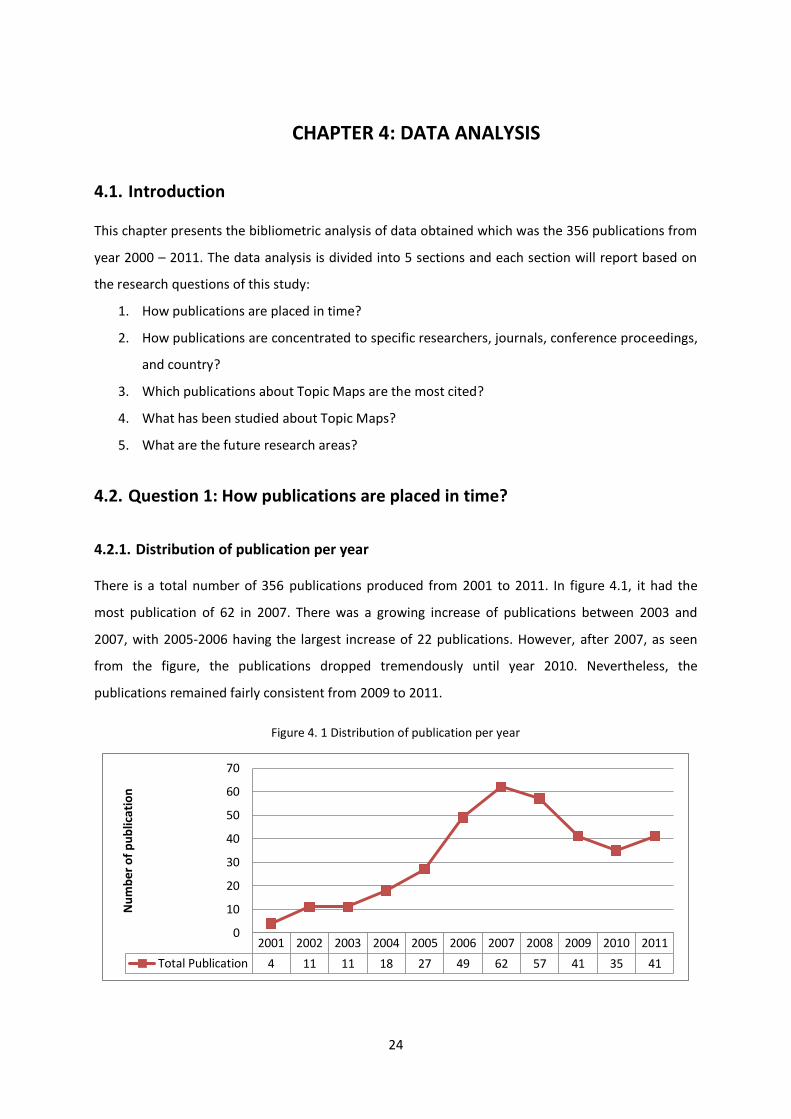
There is a total number of 356 publications produced from 2001 to 2011. In figure 4.1, it had the
most publication of 62 in 2007. There was a growing increase of publications between 2003 and
2007, with 2005-2006 having the largest increase of 22 publications. However, after 2007, as seen
from the figure, the publications dropped tremendously until year 2010. Nevertheless, the
publications remained fairly consistent from 2009 to 2011.
Figure 4. 1 Distribution of publication per year
2001 2002 2003 2004 2005 2006 2007 2008 2009 2010 2011
Total Publication 4 11 11 18 27 49 62 57 41 35 41
0
10
20
30
40
50
60
70
Nu
mb
er o
f p
ub
lica
tio
n
25
4.2.2. Distribution of publication cumulative per year
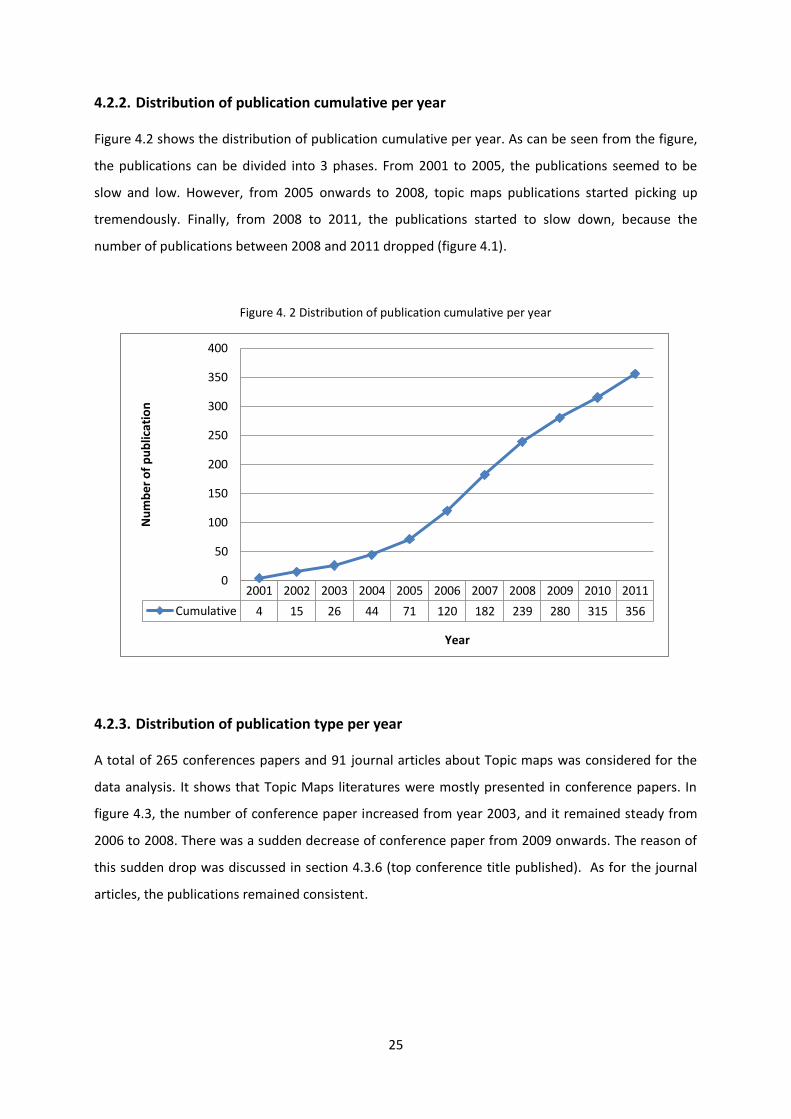
Figure 4.2 shows the distribution of publication cumulative per year. As can be seen from the figure,
the publications can be divided into 3 phases. From 2001 to 2005, the publications seemed to be
slow and low. However, from 2005 onwards to 2008, topic maps publications started picking up
tremendously. Finally, from 2008 to 2011, the publications started to slow down, because the
number of publications between 2008 and 2011 dropped (figure 4.1).
Figure 4. 2 Distribution of publication cumulative per year
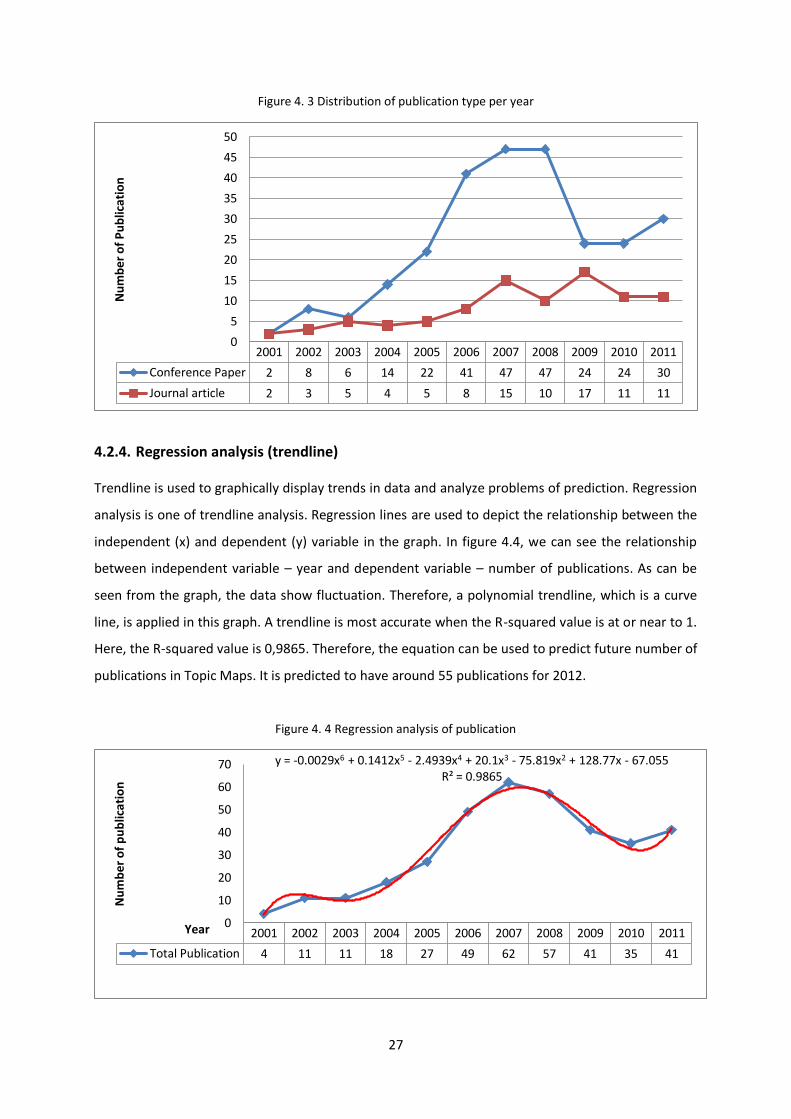
4.2.3. Distribution of publication type per year
A total of 265 conferences papers and 91 journal articles about Topic maps was considered for the
data analysis. It shows that Topic Maps literatures were mostly presented in conference papers. In
figure 4.3, the number of conference paper increased from year 2003, and it remained steady from
2006 to 2008. There was a sudden decrease of conference paper from 2009 onwards. The reason of
this sudden drop was discussed in section 4.3.6 (top conference title published). As for the journal
articles, the publications remained consistent.
2001 2002 2003 2004 2005 2006 2007 2008 2009 2010 2011
Cumulative 4 15 26 44 71 120 182 239 280 315 356
0
50
100
150
200
250
300
350
400
Nu
mb
er o
f p
ub
lica
tio
n
Year
26
Conference proceedings and journals are two different venues for researchers to publish their
research findings. According to Thornley et al. (2011), within the discipline of computer science
subject, publication in conferences have a more proper recognition of importance rather than in a
journal, in other words, conferences are used as the main publication venue in computer science
field (Fortnow, 2009). This is because conference publication has been the dominant publication
venue in computing research since early 1980s (Vardi, 2009). Fosmire (2001) mentioned the
conference proceedings serve as a medium for rapid dissemination of information and transmit idea
for research, and it is particularly common and make sense for young discipline (Fortnow, 2009).
Conferences are preferred due to the opportunity to describe the research before peers at a public
presentation (Patterson, Snyder, & Ullman, 1999). According to Vardi (2009), some expectation that
conference papers will be followed up by journal papers, but in reality, only a small portion of
conference papers are followed up by journal papers.
Franceschet (2010) discussed the role of conferences in the subject of computer science, the author
strongly believed researchers should be publishing in a journal to achieve impact instead of in
conference proceeding because the effort of the researchers will be rewarded with a higher impact.
Fortnow (2009) promoted that it is “time for computer science to grow up” and to establish the
maturity of the field by publishing papers properly and adapting to the appropriate conference and
journal model that has worked well for all other academic fields. Topic Maps researchers should take
their publication venue into consideration in order to bring Topic Maps into more impactful and
significant level. This is important so that Topic Maps researchers will not be “driving on the wrong
side of the publication road”, said Vardi (2009).
Comparing the number of journal articles and conference papers, it shows that conference papers
had a higher number of papers than journals articles. According to Huang (2008), a high number of
conference papers reveal a technology is in the initial stage, which is not reaching the technology
maturity yet. On the other hands, if the number of journal articles is higher than conference papers,
it means that the technology is reaching maturity. From the result, it shows Topic Maps has not
reached the maturity stage because the number of journal articles was still low.
27
Figure 4. 3 Distribution of publication type per year
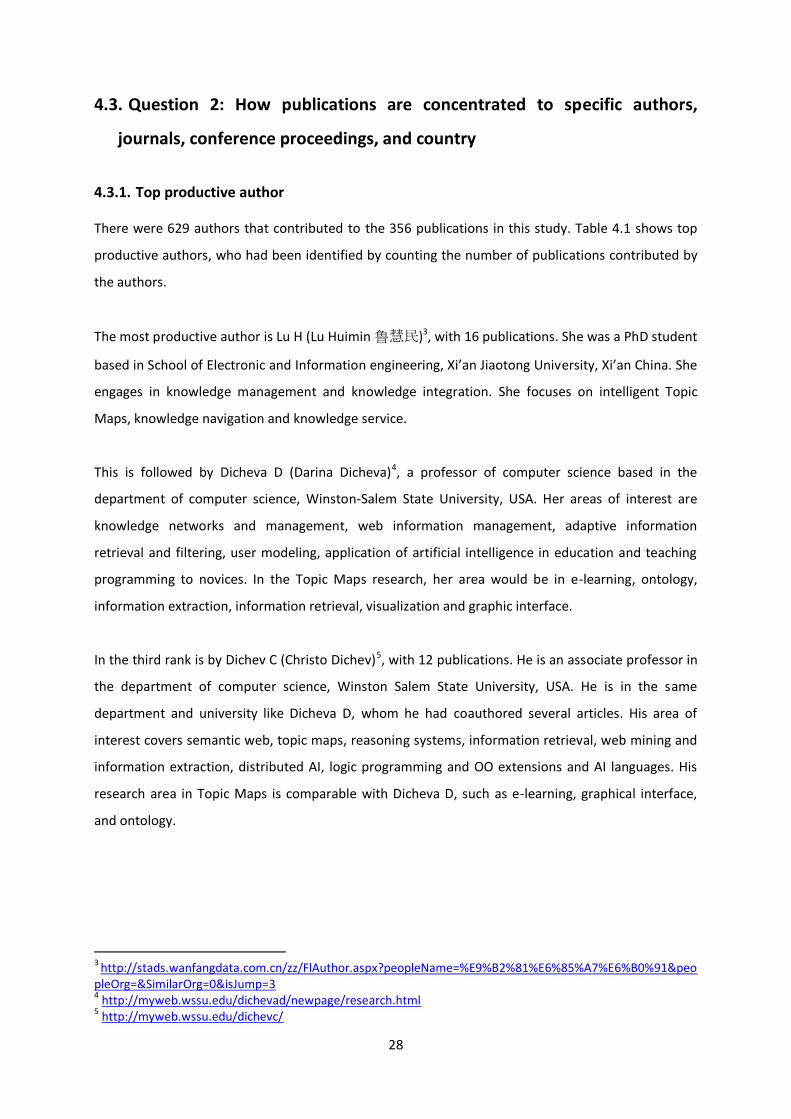
4.2.4. Regression analysis (trendline)
Trendline is used to graphically display trends in data and analyze problems of prediction. Regression
analysis is one of trendline analysis. Regression lines are used to depict the relationship between the
independent (x) and dependent (y) variable in the graph. In figure 4.4, we can see the relationship
between independent variable – year and dependent variable – number of publications. As can be
seen from the graph, the data show fluctuation. Therefore, a polynomial trendline, which is a curve
line, is applied in this graph. A trendline is most accurate when the R-squared value is at or near to 1.
Here, the R-squared value is 0,9865. Therefore, the equation can be used to predict future number of
publications in Topic Maps. It is predicted to have around 55 publications for 2012.
Figure 4. 4 Regression analysis of publication
2001 2002 2003 2004 2005 2006 2007 2008 2009 2010 2011
Conference Paper 2 8 6 14 22 41 47 47 24 24 30
Journal article 2 3 5 4 5 8 15 10 17 11 11
0
5
10
15
20
25
30
35
40
45
50
Nu
mb
er o
f P
ub
lica
tio
n
2001 2002 2003 2004 2005 2006 2007 2008 2009 2010 2011
Total Publication 4 11 11 18 27 49 62 57 41 35 41
y = -0.0029x6 + 0.1412x5 - 2.4939x4 + 20.1x3 - 75.819x2 + 128.77x - 67.055 R² = 0.9865
0
10
20
30
40
50
60
70
Nu
mb
er o
f p
ub
lica
tio
n
Year
28
4.3. Question 2: How publications are concentrated to specific authors,
journals, conference proceedings, and country
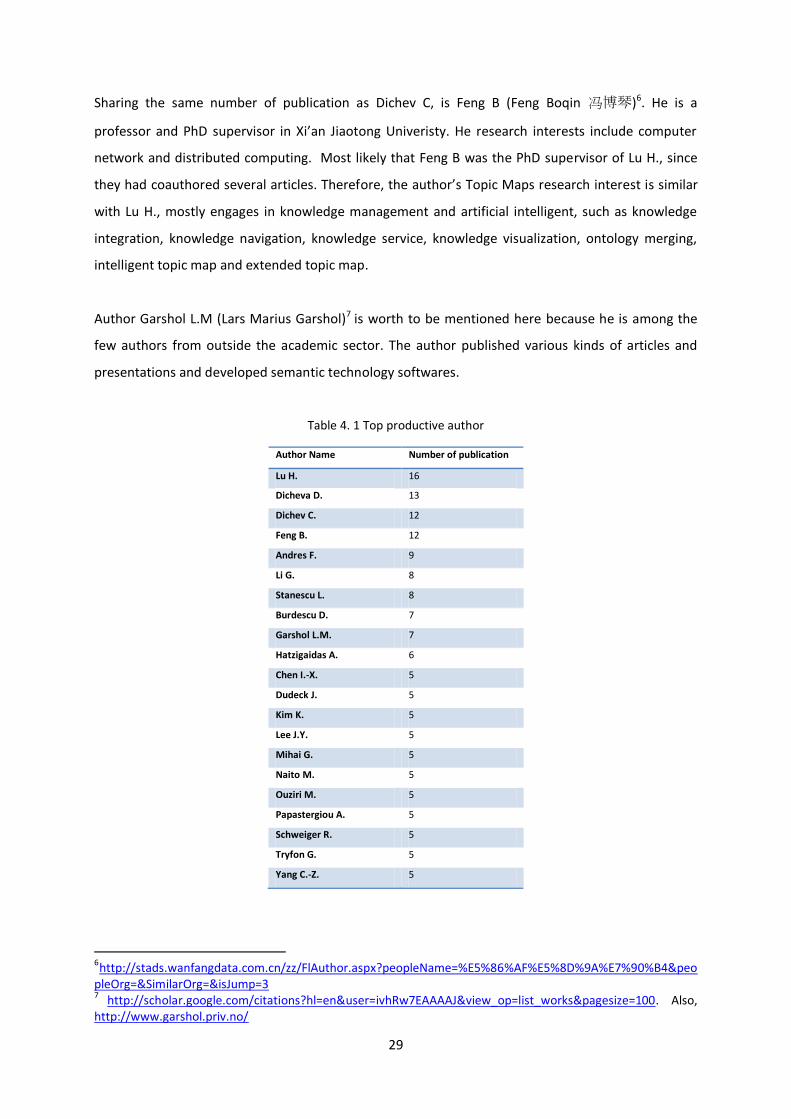
4.3.1. Top productive author
There were 629 authors that contributed to the 356 publications in this study. Table 4.1 shows top
productive authors, who had been identified by counting the number of publications contributed by
the authors.
The most productive author is Lu H (Lu Huimin 鲁慧民)3, with 16 publications. She was a PhD student
based in School of Electronic and Information engineering, Xi’an Jiaotong University, Xi’an China. She
engages in knowledge management and knowledge integration. She focuses on intelligent Topic
Maps, knowledge navigation and knowledge service.
This is followed by Dicheva D (Darina Dicheva)4, a professor of computer science based in the
department of computer science, Winston-Salem State University, USA. Her areas of interest are
knowledge networks and management, web information management, adaptive information
retrieval and filtering, user modeling, application of artificial intelligence in education and teaching
programming to novices. In the Topic Maps research, her area would be in e-learning, ontology,
information extraction, information retrieval, visualization and graphic interface.
In the third rank is by Dichev C (Christo Dichev)5, with 12 publications. He is an associate professor in
the department of computer science, Winston Salem State University, USA. He is in the same
department and university like Dicheva D, whom he had coauthored several articles. His area of
interest covers semantic web, topic maps, reasoning systems, information retrieval, web mining and
information extraction, distributed AI, logic programming and OO extensions and AI languages. His
research area in Topic Maps is comparable with Dicheva D, such as e-learning, graphical interface,
and ontology.
3 http://stads.wanfangdata.com.cn/zz/FlAuthor.aspx?peopleName=%E9%B2%81%E6%85%A7%E6%B0%91&peopleOrg=&SimilarOrg=0&isJump=3 4 http://myweb.wssu.edu/dichevad/newpage/research.html 5 http://myweb.wssu.edu/dichevc/
29
Sharing the same number of publication as Dichev C, is Feng B (Feng Boqin 冯博琴)6. He is a
professor and PhD supervisor in Xi’an Jiaotong Univeristy. He research interests include computer
network and distributed computing. Most likely that Feng B was the PhD supervisor of Lu H., since
they had coauthored several articles. Therefore, the author’s Topic Maps research interest is similar
with Lu H., mostly engages in knowledge management and artificial intelligent, such as knowledge
integration, knowledge navigation, knowledge service, knowledge visualization, ontology merging,
intelligent topic map and extended topic map.
Author Garshol L.M (Lars Marius Garshol)7 is worth to be mentioned here because he is among the
few authors from outside the academic sector. The author published various kinds of articles and
presentations and developed semantic technology softwares.
Table 4. 1 Top productive author
Author Name Number of publication
Lu H. 16
Dicheva D. 13
Dichev C. 12
Feng B. 12
Andres F. 9
Li G. 8
Stanescu L. 8
Burdescu D. 7
Garshol L.M. 7
Hatzigaidas A. 6
Chen I.-X. 5
Dudeck J. 5
Kim K. 5
Lee J.Y. 5
Mihai G. 5
Naito M. 5
Ouziri M. 5
Papastergiou A. 5
Schweiger R. 5
Tryfon G. 5
Yang C.-Z. 5
6http://stads.wanfangdata.com.cn/zz/FlAuthor.aspx?peopleName=%E5%86%AF%E5%8D%9A%E7%90%B4&peopleOrg=&SimilarOrg=&isJump=3 7 http://scholar.google.com/citations?hl=en&user=ivhRw7EAAAAJ&view_op=list_works&pagesize=100. Also, http://www.garshol.priv.no/
30
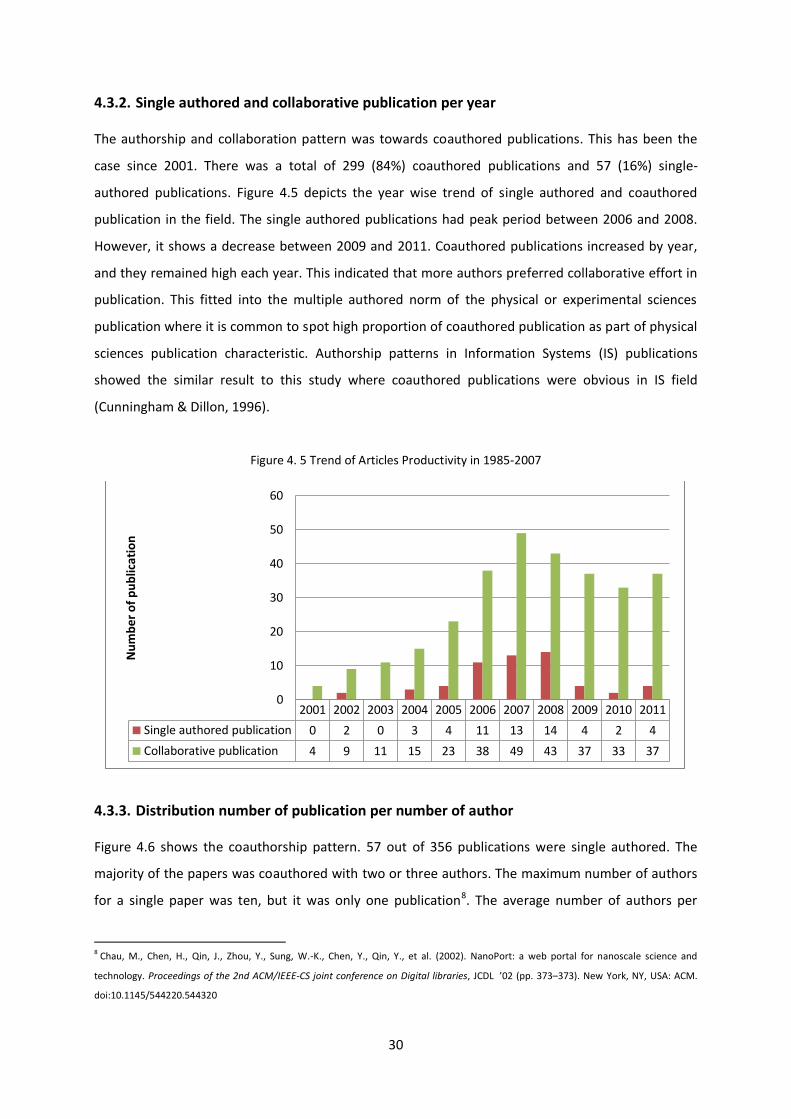
4.3.2. Single authored and collaborative publication per year
The authorship and collaboration pattern was towards coauthored publications. This has been the
case since 2001. There was a total of 299 (84%) coauthored publications and 57 (16%) single-
authored publications. Figure 4.5 depicts the year wise trend of single authored and coauthored
publication in the field. The single authored publications had peak period between 2006 and 2008.
However, it shows a decrease between 2009 and 2011. Coauthored publications increased by year,
and they remained high each year. This indicated that more authors preferred collaborative effort in
publication. This fitted into the multiple authored norm of the physical or experimental sciences
publication where it is common to spot high proportion of coauthored publication as part of physical
sciences publication characteristic. Authorship patterns in Information Systems (IS) publications
showed the similar result to this study where coauthored publications were obvious in IS field
(Cunningham & Dillon, 1996).
Figure 4. 5 Trend of Articles Productivity in 1985-2007
4.3.3. Distribution number of publication per number of author
Figure 4.6 shows the coauthorship pattern. 57 out of 356 publications were single authored. The
majority of the papers was coauthored with two or three authors. The maximum number of authors
for a single paper was ten, but it was only one publication8. The average number of authors per
8 Chau, M., Chen, H., Qin, J., Zhou, Y., Sung, W.-K., Chen, Y., Qin, Y., et al. (2002). NanoPort: a web portal for nanoscale science and
technology. Proceedings of the 2nd ACM/IEEE-CS joint conference on Digital libraries, JCDL ’02 (pp. 373–373). New York, NY, USA: ACM.
doi:10.1145/544220.544320
2001 2002 2003 2004 2005 2006 2007 2008 2009 2010 2011
Single authored publication 0 2 0 3 4 11 13 14 4 2 4
Collaborative publication 4 9 11 15 23 38 49 43 37 33 37
0
10
20
30
40
50
60
Nu
mb
er o
f p
ub
lica
tio
n
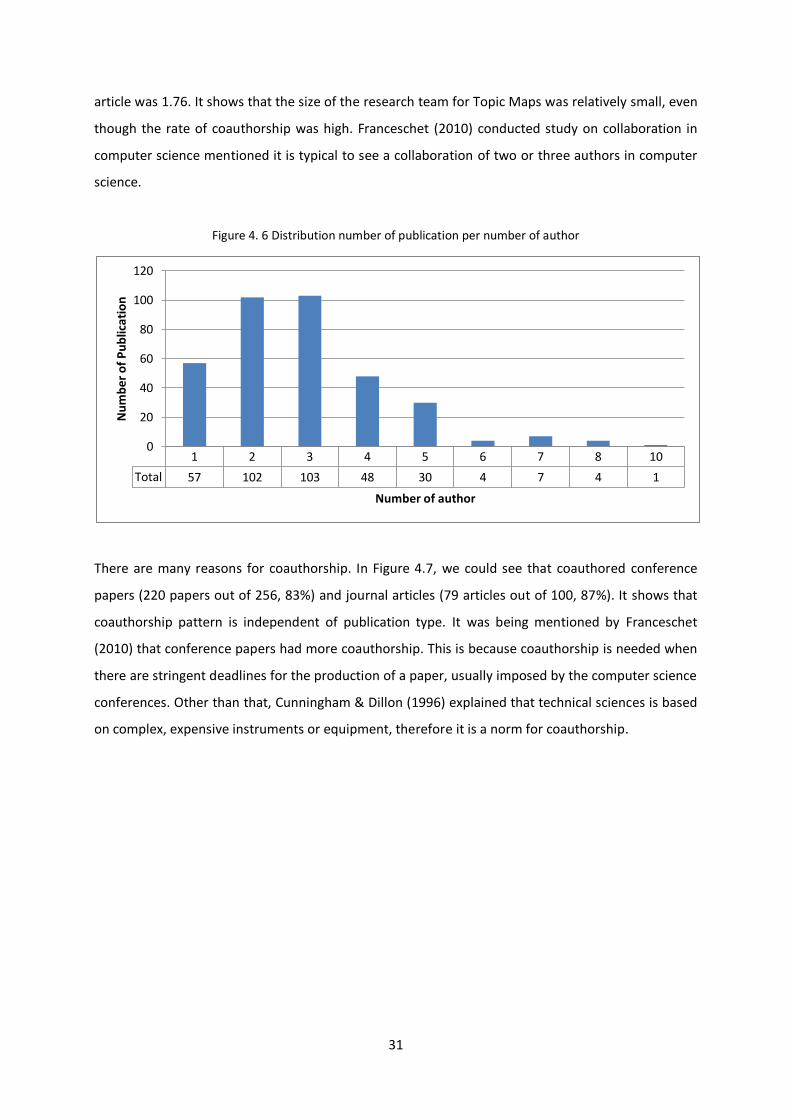
31
article was 1.76. It shows that the size of the research team for Topic Maps was relatively small, even
though the rate of coauthorship was high. Franceschet (2010) conducted study on collaboration in
computer science mentioned it is typical to see a collaboration of two or three authors in computer
science.
Figure 4. 6 Distribution number of publication per number of author
There are many reasons for coauthorship. In Figure 4.7, we could see that coauthored conference
papers (220 papers out of 256, 83%) and journal articles (79 articles out of 100, 87%). It shows that
coauthorship pattern is independent of publication type. It was being mentioned by Franceschet
(2010) that conference papers had more coauthorship. This is because coauthorship is needed when
there are stringent deadlines for the production of a paper, usually imposed by the computer science
conferences. Other than that, Cunningham & Dillon (1996) explained that technical sciences is based
on complex, expensive instruments or equipment, therefore it is a norm for coauthorship.
1 2 3 4 5 6 7 8 10
Total 57 102 103 48 30 4 7 4 1
0
20
40
60
80
100
120
Nu
mb
er o
f P
ub
lica
tio
n
Number of author
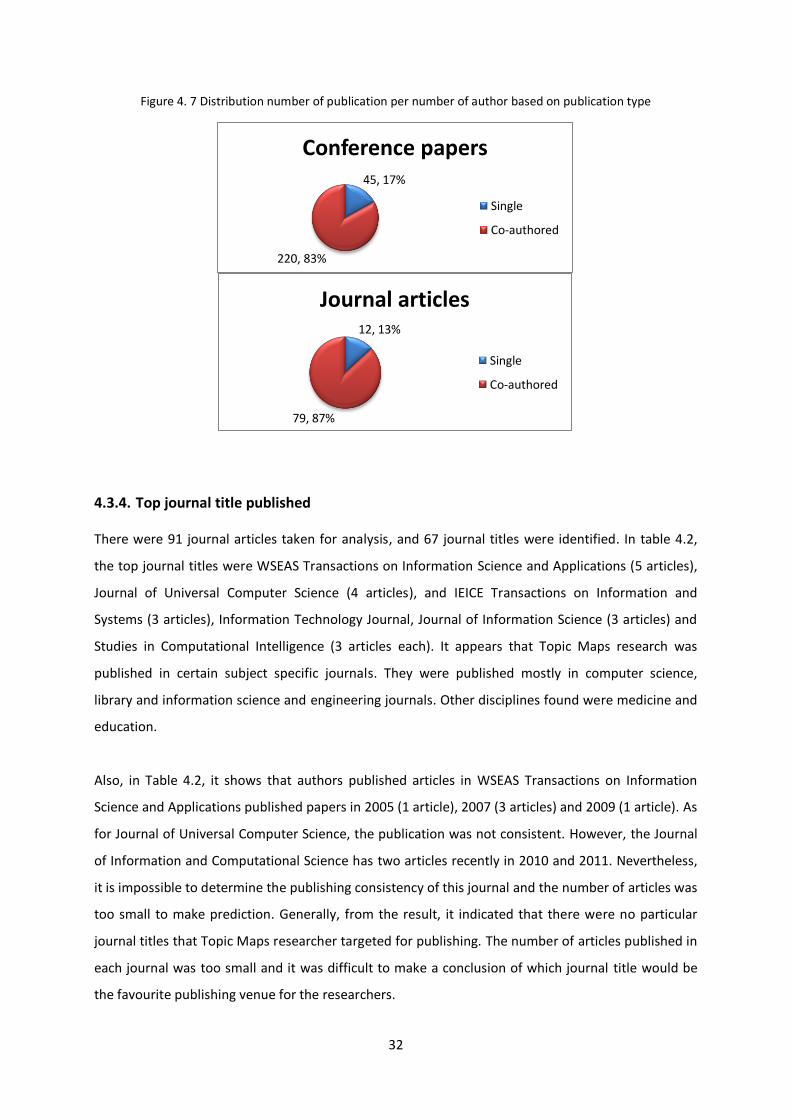
32
Figure 4. 7 Distribution number of publication per number of author based on publication type
4.3.4. Top journal title published
There were 91 journal articles taken for analysis, and 67 journal titles were identified. In table 4.2,
the top journal titles were WSEAS Transactions on Information Science and Applications (5 articles),
Journal of Universal Computer Science (4 articles), and IEICE Transactions on Information and
Systems (3 articles), Information Technology Journal, Journal of Information Science (3 articles) and
Studies in Computational Intelligence (3 articles each). It appears that Topic Maps research was
published in certain subject specific journals. They were published mostly in computer science,
library and information science and engineering journals. Other disciplines found were medicine and
education.
Also, in Table 4.2, it shows that authors published articles in WSEAS Transactions on Information
Science and Applications published papers in 2005 (1 article), 2007 (3 articles) and 2009 (1 article). As
for Journal of Universal Computer Science, the publication was not consistent. However, the Journal
of Information and Computational Science has two articles recently in 2010 and 2011. Nevertheless,
it is impossible to determine the publishing consistency of this journal and the number of articles was
too small to make prediction. Generally, from the result, it indicated that there were no particular
journal titles that Topic Maps researcher targeted for publishing. The number of articles published in
each journal was too small and it was difficult to make a conclusion of which journal title would be
the favourite publishing venue for the researchers.
45, 17%
220, 83%
Conference papers
Single
Co-authored
12, 13%
79, 87%
Journal articles
Single
Co-authored
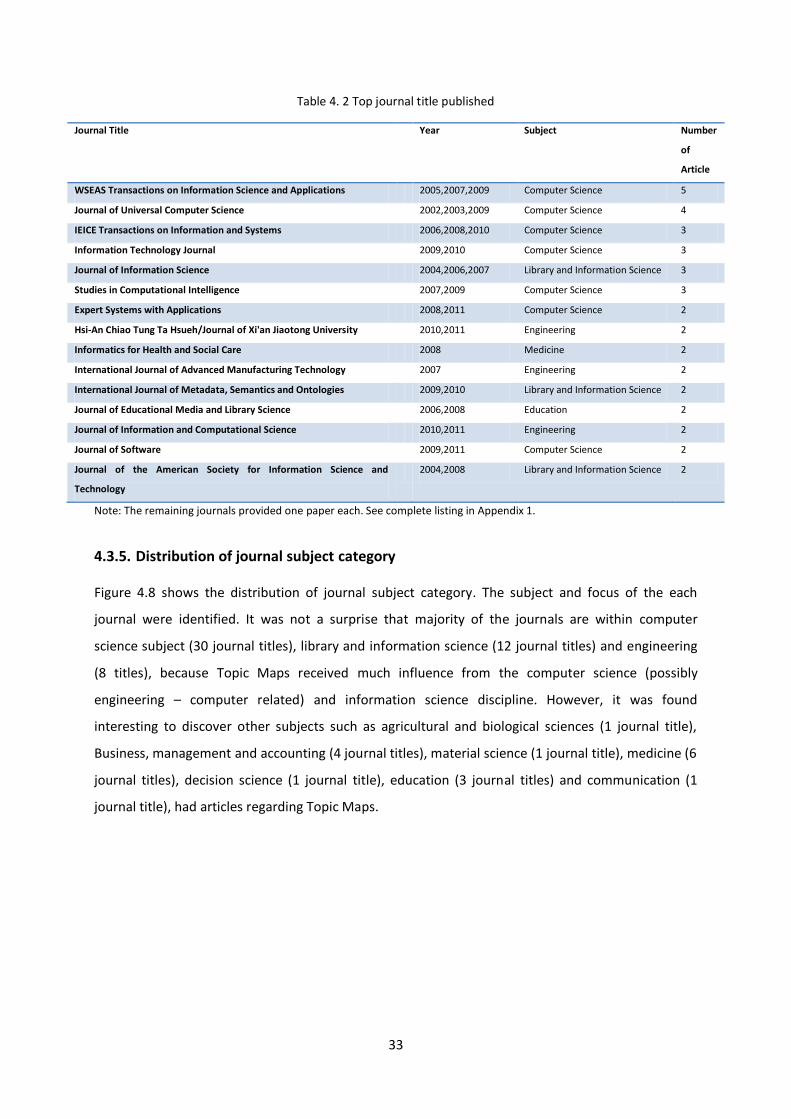
33
Table 4. 2 Top journal title published
Journal Title Year Subject Number
of
Article
WSEAS Transactions on Information Science and Applications 2005,2007,2009 Computer Science 5
Journal of Universal Computer Science 2002,2003,2009 Computer Science 4
IEICE Transactions on Information and Systems 2006,2008,2010 Computer Science 3
Information Technology Journal 2009,2010 Computer Science 3
Journal of Information Science 2004,2006,2007 Library and Information Science 3
Studies in Computational Intelligence 2007,2009 Computer Science 3
Expert Systems with Applications 2008,2011 Computer Science 2
Hsi-An Chiao Tung Ta Hsueh/Journal of Xi'an Jiaotong University 2010,2011 Engineering 2
Informatics for Health and Social Care 2008 Medicine 2
International Journal of Advanced Manufacturing Technology 2007 Engineering 2
International Journal of Metadata, Semantics and Ontologies 2009,2010 Library and Information Science 2
Journal of Educational Media and Library Science 2006,2008 Education 2
Journal of Information and Computational Science 2010,2011 Engineering 2
Journal of Software 2009,2011 Computer Science 2
Journal of the American Society for Information Science and
Technology
2004,2008 Library and Information Science 2
Note: The remaining journals provided one paper each. See complete listing in Appendix 1.
4.3.5. Distribution of journal subject category
Figure 4.8 shows the distribution of journal subject category. The subject and focus of the each
journal were identified. It was not a surprise that majority of the journals are within computer
science subject (30 journal titles), library and information science (12 journal titles) and engineering
(8 titles), because Topic Maps received much influence from the computer science (possibly
engineering – computer related) and information science discipline. However, it was found
interesting to discover other subjects such as agricultural and biological sciences (1 journal title),
Business, management and accounting (4 journal titles), material science (1 journal title), medicine (6
journal titles), decision science (1 journal title), education (3 journal titles) and communication (1
journal title), had articles regarding Topic Maps.
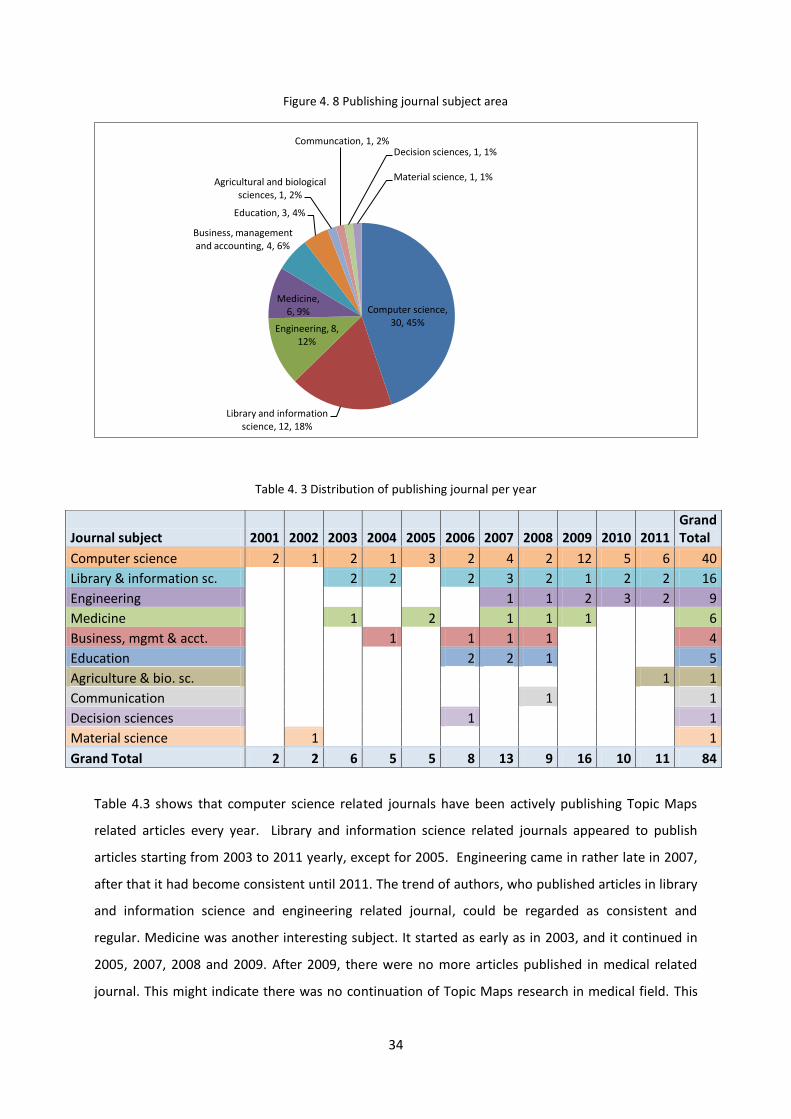
34
Figure 4. 8 Publishing journal subject area
Table 4. 3 Distribution of publishing journal per year
Journal subject 2001 2002 2003 2004 2005 2006 2007 2008 2009 2010 2011 Grand Total
Computer science 2 1 2 1 3 2 4 2 12 5 6 40
Library & information sc.
2 2
2 3 2 1 2 2 16
Engineering
1 1 2 3 2 9
Medicine
1
2
1 1 1
6
Business, mgmt & acct.
1
1 1 1
4
Education
2 2 1
5
Agriculture & bio. sc.
1 1
Communication
1
1
Decision sciences
1
1
Material science
1
1
Grand Total 2 2 6 5 5 8 13 9 16 10 11 84
Table 4.3 shows that computer science related journals have been actively publishing Topic Maps
related articles every year. Library and information science related journals appeared to publish
articles starting from 2003 to 2011 yearly, except for 2005. Engineering came in rather late in 2007,
after that it had become consistent until 2011. The trend of authors, who published articles in library
and information science and engineering related journal, could be regarded as consistent and
regular. Medicine was another interesting subject. It started as early as in 2003, and it continued in
2005, 2007, 2008 and 2009. After 2009, there were no more articles published in medical related
journal. This might indicate there was no continuation of Topic Maps research in medical field. This
Computer science, 30, 45%
Library and information science, 12, 18%
Engineering, 8, 12%
Medicine, 6, 9%
Business, management and accounting, 4, 6%
Education, 3, 4%
Agricultural and biological sciences, 1, 2%
Communcation, 1, 2% Decision sciences, 1, 1%
Material science, 1, 1%
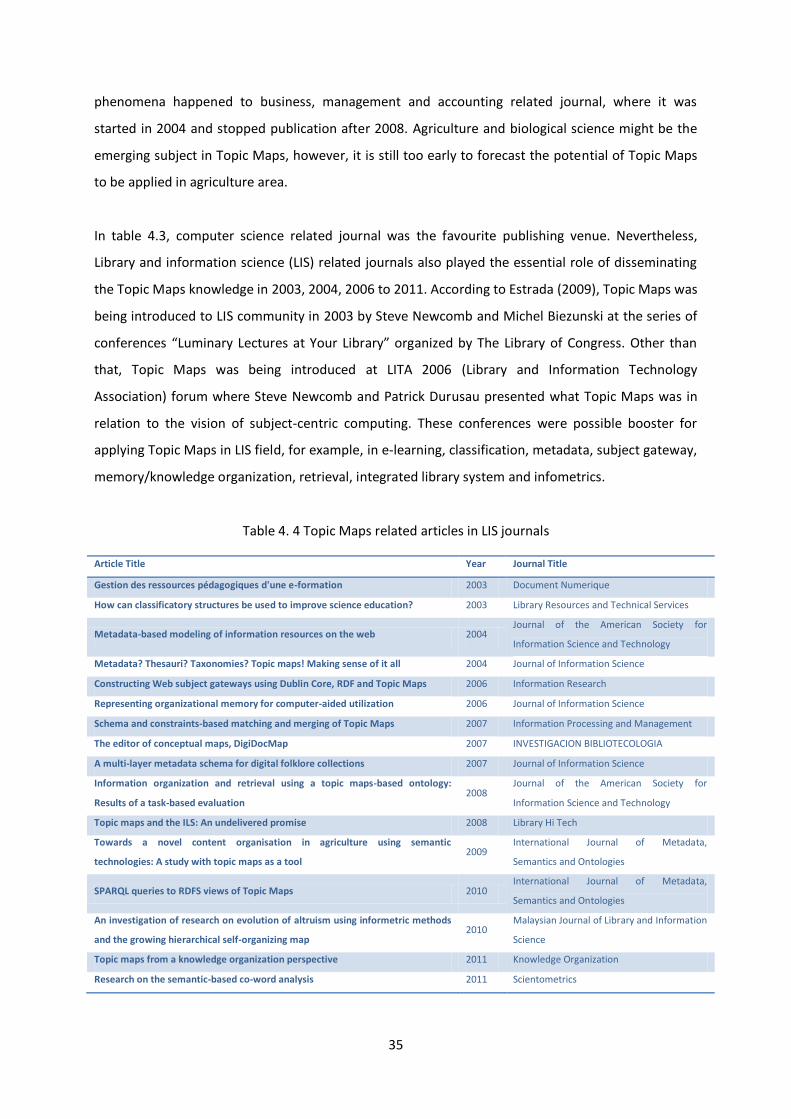
35
phenomena happened to business, management and accounting related journal, where it was
started in 2004 and stopped publication after 2008. Agriculture and biological science might be the
emerging subject in Topic Maps, however, it is still too early to forecast the potential of Topic Maps
to be applied in agriculture area.
In table 4.3, computer science related journal was the favourite publishing venue. Nevertheless,
Library and information science (LIS) related journals also played the essential role of disseminating
the Topic Maps knowledge in 2003, 2004, 2006 to 2011. According to Estrada (2009), Topic Maps was
being introduced to LIS community in 2003 by Steve Newcomb and Michel Biezunski at the series of
conferences “Luminary Lectures at Your Library” organized by The Library of Congress. Other than
that, Topic Maps was being introduced at LITA 2006 (Library and Information Technology
Association) forum where Steve Newcomb and Patrick Durusau presented what Topic Maps was in
relation to the vision of subject-centric computing. These conferences were possible booster for
applying Topic Maps in LIS field, for example, in e-learning, classification, metadata, subject gateway,
memory/knowledge organization, retrieval, integrated library system and infometrics.
Table 4. 4 Topic Maps related articles in LIS journals
Article Title Year Journal Title
Gestion des ressources pédagogiques d'une e-formation 2003 Document Numerique
How can classificatory structures be used to improve science education? 2003 Library Resources and Technical Services
Metadata-based modeling of information resources on the web 2004 Journal of the American Society for
Information Science and Technology
Metadata? Thesauri? Taxonomies? Topic maps! Making sense of it all 2004 Journal of Information Science
Constructing Web subject gateways using Dublin Core, RDF and Topic Maps 2006 Information Research
Representing organizational memory for computer-aided utilization 2006 Journal of Information Science
Schema and constraints-based matching and merging of Topic Maps 2007 Information Processing and Management
The editor of conceptual maps, DigiDocMap 2007 INVESTIGACION BIBLIOTECOLOGIA
A multi-layer metadata schema for digital folklore collections 2007 Journal of Information Science
Information organization and retrieval using a topic maps-based ontology:
Results of a task-based evaluation 2008
Journal of the American Society for
Information Science and Technology
Topic maps and the ILS: An undelivered promise 2008 Library Hi Tech
Towards a novel content organisation in agriculture using semantic
technologies: A study with topic maps as a tool 2009
International Journal of Metadata,
Semantics and Ontologies
SPARQL queries to RDFS views of Topic Maps 2010 International Journal of Metadata,
Semantics and Ontologies
An investigation of research on evolution of altruism using informetric methods
and the growing hierarchical self-organizing map 2010
Malaysian Journal of Library and Information
Science
Topic maps from a knowledge organization perspective 2011 Knowledge Organization
Research on the semantic-based co-word analysis 2011 Scientometrics
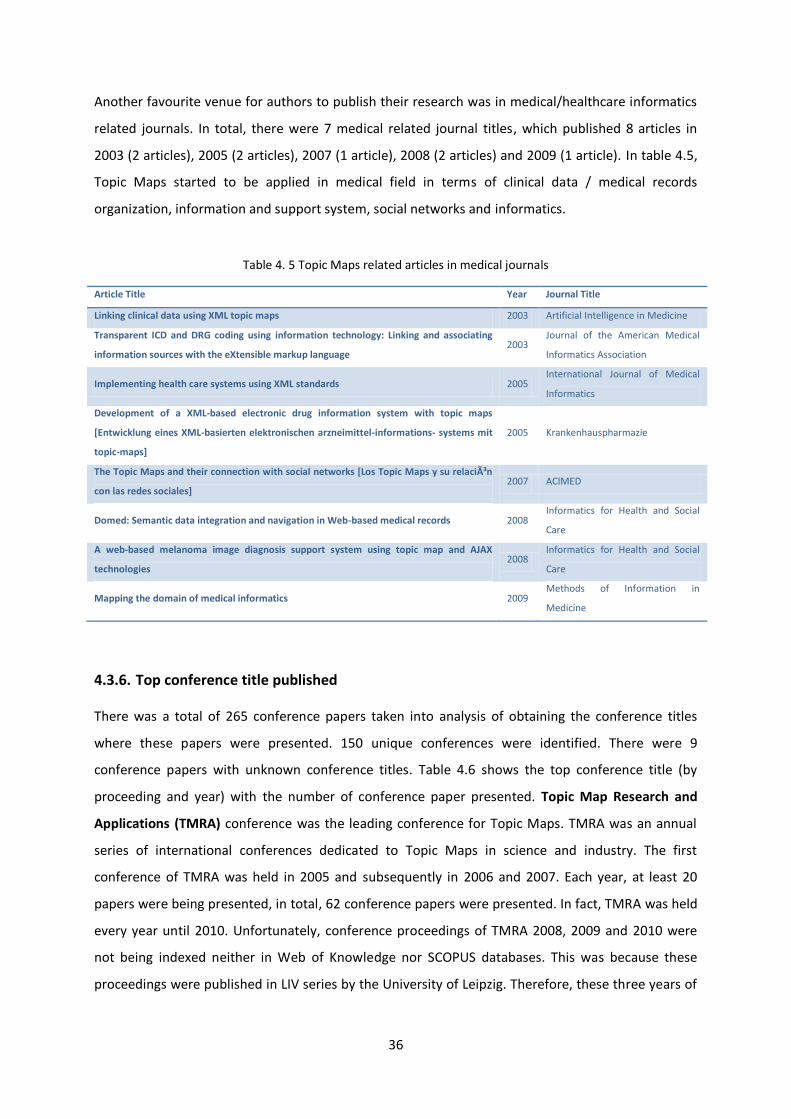
36
Another favourite venue for authors to publish their research was in medical/healthcare informatics
related journals. In total, there were 7 medical related journal titles, which published 8 articles in
2003 (2 articles), 2005 (2 articles), 2007 (1 article), 2008 (2 articles) and 2009 (1 article). In table 4.5,
Topic Maps started to be applied in medical field in terms of clinical data / medical records
organization, information and support system, social networks and informatics.
Table 4. 5 Topic Maps related articles in medical journals
Article Title Year Journal Title
Linking clinical data using XML topic maps 2003 Artificial Intelligence in Medicine
Transparent ICD and DRG coding using information technology: Linking and associating
information sources with the eXtensible markup language 2003
Journal of the American Medical
Informatics Association
Implementing health care systems using XML standards 2005 International Journal of Medical
Informatics
Development of a XML-based electronic drug information system with topic maps
[Entwicklung eines XML-basierten elektronischen arzneimittel-informations- systems mit
topic-maps]
2005 Krankenhauspharmazie
The Topic Maps and their connection with social networks [Los Topic Maps y su relación
con las redes sociales] 2007 ACIMED
Domed: Semantic data integration and navigation in Web-based medical records 2008 Informatics for Health and Social
Care
A web-based melanoma image diagnosis support system using topic map and AJAX
technologies 2008
Informatics for Health and Social
Care
Mapping the domain of medical informatics 2009 Methods of Information in
Medicine
4.3.6. Top conference title published
There was a total of 265 conference papers taken into analysis of obtaining the conference titles
where these papers were presented. 150 unique conferences were identified. There were 9
conference papers with unknown conference titles. Table 4.6 shows the top conference title (by
proceeding and year) with the number of conference paper presented. Topic Map Research and
Applications (TMRA) conference was the leading conference for Topic Maps. TMRA was an annual
series of international conferences dedicated to Topic Maps in science and industry. The first
conference of TMRA was held in 2005 and subsequently in 2006 and 2007. Each year, at least 20
papers were being presented, in total, 62 conference papers were presented. In fact, TMRA was held
every year until 2010. Unfortunately, conference proceedings of TMRA 2008, 2009 and 2010 were
not being indexed neither in Web of Knowledge nor SCOPUS databases. This was because these
proceedings were published in LIV series by the University of Leipzig. Therefore, these three years of
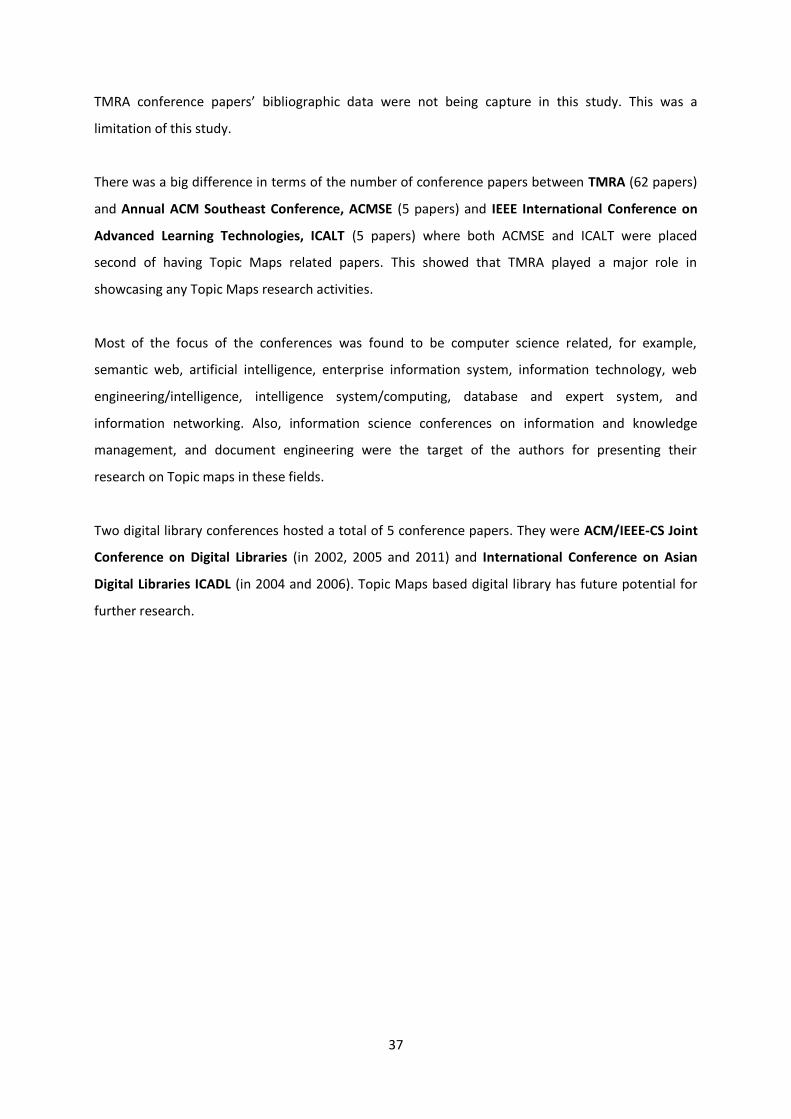
37
TMRA conference papers’ bibliographic data were not being capture in this study. This was a
limitation of this study.
There was a big difference in terms of the number of conference papers between TMRA (62 papers)
and Annual ACM Southeast Conference, ACMSE (5 papers) and IEEE International Conference on
Advanced Learning Technologies, ICALT (5 papers) where both ACMSE and ICALT were placed
second of having Topic Maps related papers. This showed that TMRA played a major role in
showcasing any Topic Maps research activities.
Most of the focus of the conferences was found to be computer science related, for example,
semantic web, artificial intelligence, enterprise information system, information technology, web
engineering/intelligence, intelligence system/computing, database and expert system, and
information networking. Also, information science conferences on information and knowledge
management, and document engineering were the target of the authors for presenting their
research on Topic maps in these fields.
Two digital library conferences hosted a total of 5 conference papers. They were ACM/IEEE-CS Joint
Conference on Digital Libraries (in 2002, 2005 and 2011) and International Conference on Asian
Digital Libraries ICADL (in 2004 and 2006). Topic Maps based digital library has future potential for
further research.
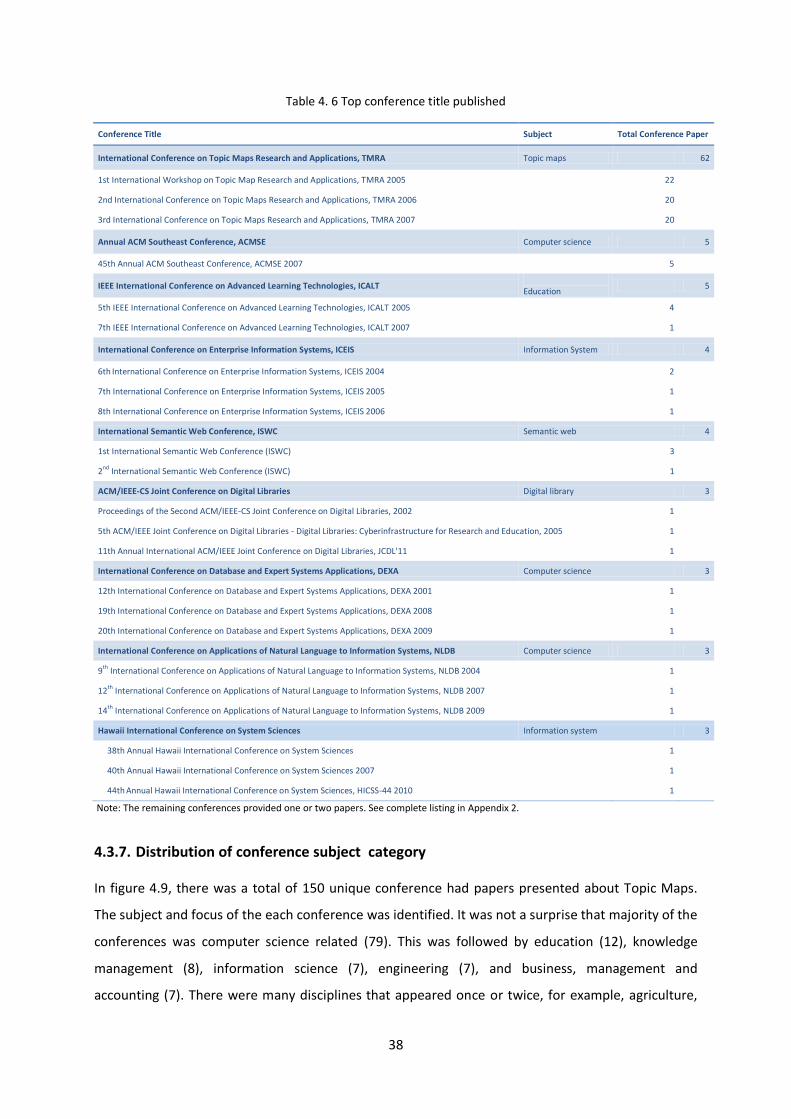
38
Table 4. 6 Top conference title published
Conference Title Subject Total Conference Paper
International Conference on Topic Maps Research and Applications, TMRA Topic maps 62
1st International Workshop on Topic Map Research and Applications, TMRA 2005 22
2nd International Conference on Topic Maps Research and Applications, TMRA 2006 20
3rd International Conference on Topic Maps Research and Applications, TMRA 2007 20
Annual ACM Southeast Conference, ACMSE Computer science 5
45th Annual ACM Southeast Conference, ACMSE 2007 5
IEEE International Conference on Advanced Learning Technologies, ICALT Education
5
5th IEEE International Conference on Advanced Learning Technologies, ICALT 2005 4
7th IEEE International Conference on Advanced Learning Technologies, ICALT 2007 1
International Conference on Enterprise Information Systems, ICEIS Information System 4
6th International Conference on Enterprise Information Systems, ICEIS 2004 2
7th International Conference on Enterprise Information Systems, ICEIS 2005 1
8th International Conference on Enterprise Information Systems, ICEIS 2006 1
International Semantic Web Conference, ISWC Semantic web 4
1st International Semantic Web Conference (ISWC) 3 2
nd International Semantic Web Conference (ISWC) 1
ACM/IEEE-CS Joint Conference on Digital Libraries Digital library 3
Proceedings of the Second ACM/IEEE-CS Joint Conference on Digital Libraries, 2002 1
5th ACM/IEEE Joint Conference on Digital Libraries - Digital Libraries: Cyberinfrastructure for Research and Education, 2005 1
11th Annual International ACM/IEEE Joint Conference on Digital Libraries, JCDL'11 1
International Conference on Database and Expert Systems Applications, DEXA Computer science 3
12th International Conference on Database and Expert Systems Applications, DEXA 2001 1
19th International Conference on Database and Expert Systems Applications, DEXA 2008 1
20th International Conference on Database and Expert Systems Applications, DEXA 2009 1
International Conference on Applications of Natural Language to Information Systems, NLDB Computer science 3
9th
International Conference on Applications of Natural Language to Information Systems, NLDB 2004 1 12
th International Conference on Applications of Natural Language to Information Systems, NLDB 2007 1
14th
International Conference on Applications of Natural Language to Information Systems, NLDB 2009 1 Hawaii International Conference on System Sciences Information system 3
38th Annual Hawaii International Conference on System Sciences 1 40th Annual Hawaii International Conference on System Sciences 2007 1 44th
Annual Hawaii International Conference on System Sciences, HICSS-44 2010 1
Note: The remaining conferences provided one or two papers. See complete listing in Appendix 2.
4.3.7. Distribution of conference subject category
In figure 4.9, there was a total of 150 unique conference had papers presented about Topic Maps.
The subject and focus of the each conference was identified. It was not a surprise that majority of the
conferences was computer science related (79). This was followed by education (12), knowledge
management (8), information science (7), engineering (7), and business, management and
accounting (7). There were many disciplines that appeared once or twice, for example, agriculture,
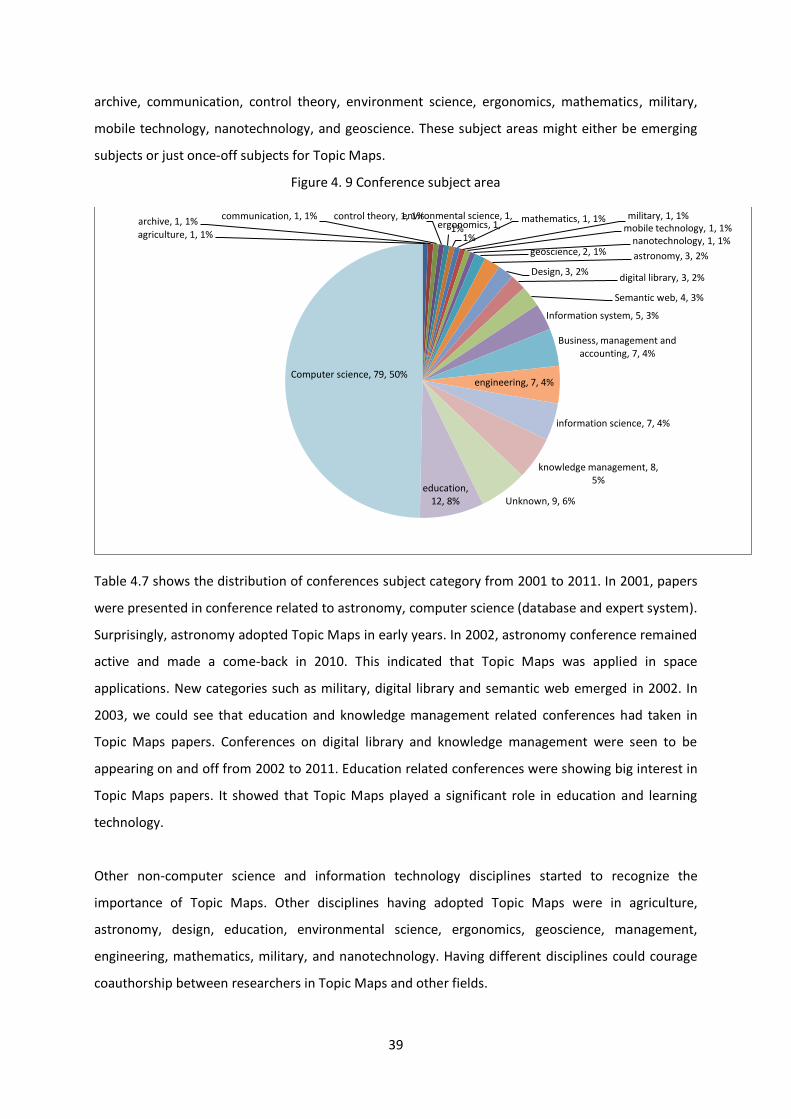
39
archive, communication, control theory, environment science, ergonomics, mathematics, military,
mobile technology, nanotechnology, and geoscience. These subject areas might either be emerging
subjects or just once-off subjects for Topic Maps.
Figure 4. 9 Conference subject area
Table 4.7 shows the distribution of conferences subject category from 2001 to 2011. In 2001, papers
were presented in conference related to astronomy, computer science (database and expert system).
Surprisingly, astronomy adopted Topic Maps in early years. In 2002, astronomy conference remained
active and made a come-back in 2010. This indicated that Topic Maps was applied in space
applications. New categories such as military, digital library and semantic web emerged in 2002. In
2003, we could see that education and knowledge management related conferences had taken in
Topic Maps papers. Conferences on digital library and knowledge management were seen to be
appearing on and off from 2002 to 2011. Education related conferences were showing big interest in
Topic Maps papers. It showed that Topic Maps played a significant role in education and learning
technology.
Other non-computer science and information technology disciplines started to recognize the
importance of Topic Maps. Other disciplines having adopted Topic Maps were in agriculture,
astronomy, design, education, environmental science, ergonomics, geoscience, management,
engineering, mathematics, military, and nanotechnology. Having different disciplines could courage
coauthorship between researchers in Topic Maps and other fields.
agriculture, 1, 1% archive, 1, 1%
communication, 1, 1% control theory, 1, 1% environmental science, 1, 1% ergonomics, 1,
1%
mathematics, 1, 1% military, 1, 1% mobile technology, 1, 1%
nanotechnology, 1, 1% geoscience, 2, 1% astronomy, 3, 2%
Design, 3, 2% digital library, 3, 2%
Semantic web, 4, 3%
Information system, 5, 3%
Business, management and accounting, 7, 4%
engineering, 7, 4%
information science, 7, 4%
knowledge management, 8, 5%
Unknown, 9, 6% education,
12, 8%
Computer science, 79, 50%
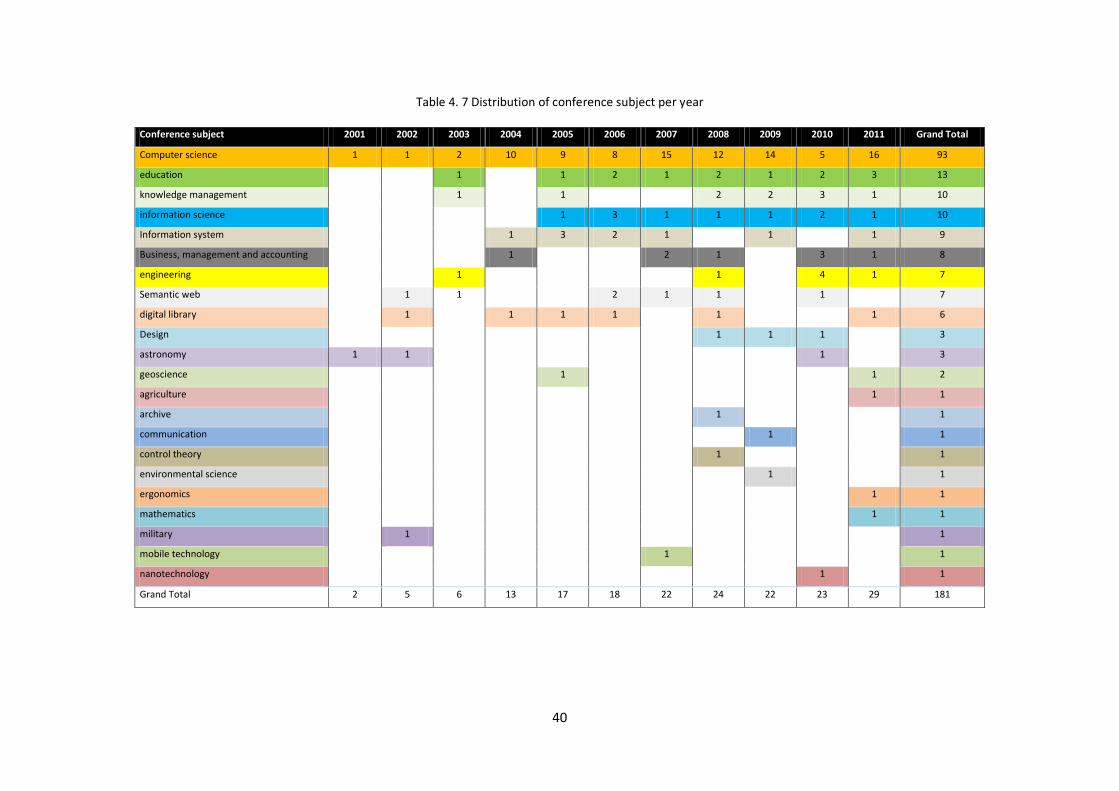
40
Table 4. 7 Distribution of conference subject per year
Conference subject 2001 2002 2003 2004 2005 2006 2007 2008 2009 2010 2011 Grand Total
Computer science 1 1 2 10 9 8 15 12 14 5 16 93
education
1
1 2 1 2 1 2 3 13
knowledge management
1
1
2 2 3 1 10
information science
1 3 1 1 1 2 1 10
Information system
1 3 2 1
1
1 9
Business, management and accounting 1 2 1 3 1 8
engineering 1 1 4 1 7
Semantic web
1 1
2 1 1
1
7
digital library
1
1 1 1
1
1 6
Design
1 1 1
3
astronomy 1 1
1
3
geoscience
1
1 2
agriculture
1 1
archive
1
1
communication
1
1
control theory
1
1
environmental science
1
1
ergonomics
1 1
mathematics
1 1
military
1
1
mobile technology
1
1
nanotechnology
1
1
Grand Total 2 5 6 13 17 18 22 24 22 23 29 181
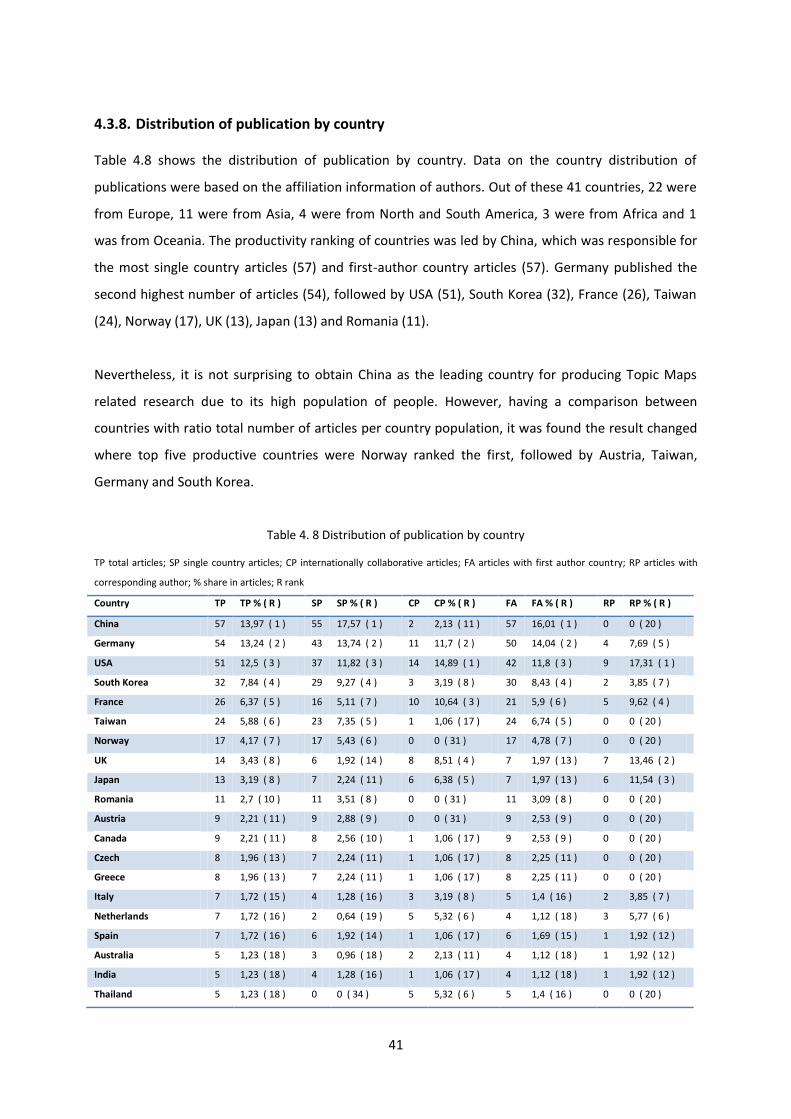
41
4.3.8. Distribution of publication by country
Table 4.8 shows the distribution of publication by country. Data on the country distribution of
publications were based on the affiliation information of authors. Out of these 41 countries, 22 were
from Europe, 11 were from Asia, 4 were from North and South America, 3 were from Africa and 1
was from Oceania. The productivity ranking of countries was led by China, which was responsible for
the most single country articles (57) and first-author country articles (57). Germany published the
second highest number of articles (54), followed by USA (51), South Korea (32), France (26), Taiwan
(24), Norway (17), UK (13), Japan (13) and Romania (11).
Nevertheless, it is not surprising to obtain China as the leading country for producing Topic Maps
related research due to its high population of people. However, having a comparison between
countries with ratio total number of articles per country population, it was found the result changed
where top five productive countries were Norway ranked the first, followed by Austria, Taiwan,
Germany and South Korea.
Table 4. 8 Distribution of publication by country
TP total articles; SP single country articles; CP internationally collaborative articles; FA articles with first author country; RP articles with
corresponding author; % share in articles; R rank
Country TP TP % ( R ) SP SP % ( R ) CP CP % ( R ) FA FA % ( R ) RP RP % ( R )
China 57 13,97 ( 1 ) 55 17,57 ( 1 ) 2 2,13 ( 11 ) 57 16,01 ( 1 ) 0 0 ( 20 )
Germany 54 13,24 ( 2 ) 43 13,74 ( 2 ) 11 11,7 ( 2 ) 50 14,04 ( 2 ) 4 7,69 ( 5 )
USA 51 12,5 ( 3 ) 37 11,82 ( 3 ) 14 14,89 ( 1 ) 42 11,8 ( 3 ) 9 17,31 ( 1 )
South Korea 32 7,84 ( 4 ) 29 9,27 ( 4 ) 3 3,19 ( 8 ) 30 8,43 ( 4 ) 2 3,85 ( 7 )
France 26 6,37 ( 5 ) 16 5,11 ( 7 ) 10 10,64 ( 3 ) 21 5,9 ( 6 ) 5 9,62 ( 4 )
Taiwan 24 5,88 ( 6 ) 23 7,35 ( 5 ) 1 1,06 ( 17 ) 24 6,74 ( 5 ) 0 0 ( 20 )
Norway 17 4,17 ( 7 ) 17 5,43 ( 6 ) 0 0 ( 31 ) 17 4,78 ( 7 ) 0 0 ( 20 )
UK 14 3,43 ( 8 ) 6 1,92 ( 14 ) 8 8,51 ( 4 ) 7 1,97 ( 13 ) 7 13,46 ( 2 )
Japan 13 3,19 ( 8 ) 7 2,24 ( 11 ) 6 6,38 ( 5 ) 7 1,97 ( 13 ) 6 11,54 ( 3 )
Romania 11 2,7 ( 10 ) 11 3,51 ( 8 ) 0 0 ( 31 ) 11 3,09 ( 8 ) 0 0 ( 20 )
Austria 9 2,21 ( 11 ) 9 2,88 ( 9 ) 0 0 ( 31 ) 9 2,53 ( 9 ) 0 0 ( 20 )
Canada 9 2,21 ( 11 ) 8 2,56 ( 10 ) 1 1,06 ( 17 ) 9 2,53 ( 9 ) 0 0 ( 20 )
Czech 8 1,96 ( 13 ) 7 2,24 ( 11 ) 1 1,06 ( 17 ) 8 2,25 ( 11 ) 0 0 ( 20 )
Greece 8 1,96 ( 13 ) 7 2,24 ( 11 ) 1 1,06 ( 17 ) 8 2,25 ( 11 ) 0 0 ( 20 )
Italy 7 1,72 ( 15 ) 4 1,28 ( 16 ) 3 3,19 ( 8 ) 5 1,4 ( 16 ) 2 3,85 ( 7 )
Netherlands 7 1,72 ( 16 ) 2 0,64 ( 19 ) 5 5,32 ( 6 ) 4 1,12 ( 18 ) 3 5,77 ( 6 )
Spain 7 1,72 ( 16 ) 6 1,92 ( 14 ) 1 1,06 ( 17 ) 6 1,69 ( 15 ) 1 1,92 ( 12 )
Australia 5 1,23 ( 18 ) 3 0,96 ( 18 ) 2 2,13 ( 11 ) 4 1,12 ( 18 ) 1 1,92 ( 12 )
India 5 1,23 ( 18 ) 4 1,28 ( 16 ) 1 1,06 ( 17 ) 4 1,12 ( 18 ) 1 1,92 ( 12 )
Thailand 5 1,23 ( 18 ) 0 0 ( 34 ) 5 5,32 ( 6 ) 5 1,4 ( 16 ) 0 0 ( 20 )
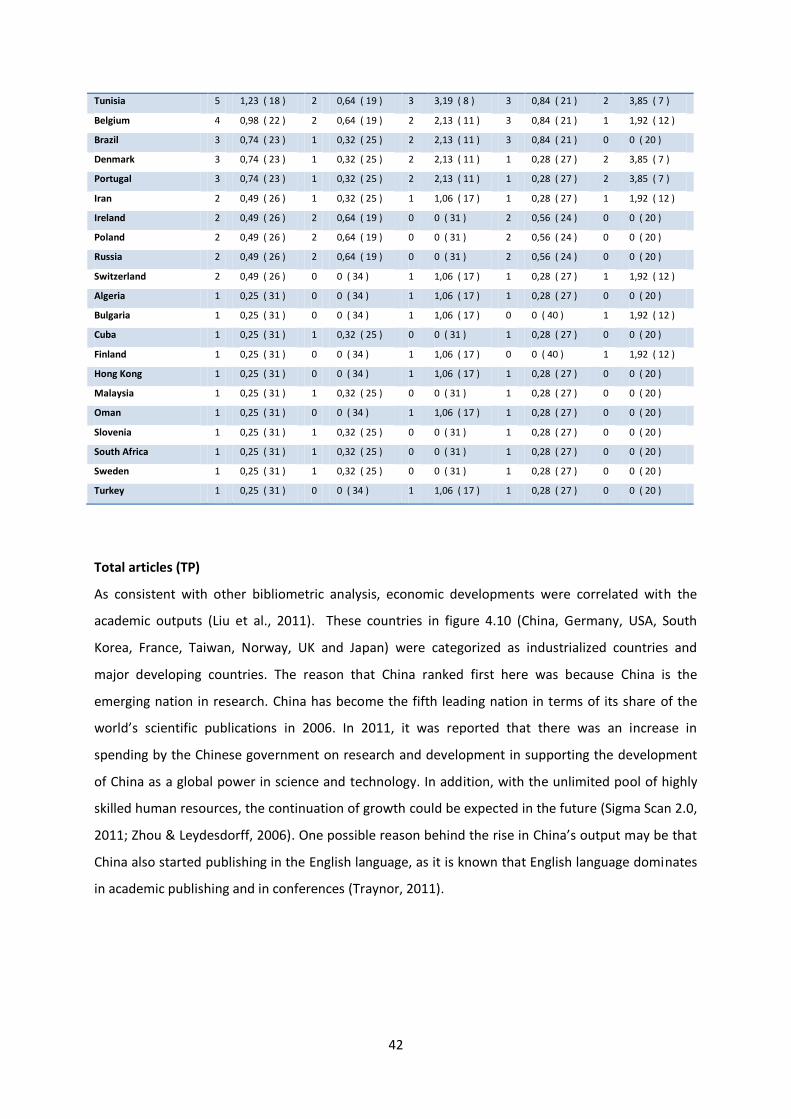
42
Tunisia 5 1,23 ( 18 ) 2 0,64 ( 19 ) 3 3,19 ( 8 ) 3 0,84 ( 21 ) 2 3,85 ( 7 )
Belgium 4 0,98 ( 22 ) 2 0,64 ( 19 ) 2 2,13 ( 11 ) 3 0,84 ( 21 ) 1 1,92 ( 12 )
Brazil 3 0,74 ( 23 ) 1 0,32 ( 25 ) 2 2,13 ( 11 ) 3 0,84 ( 21 ) 0 0 ( 20 )
Denmark 3 0,74 ( 23 ) 1 0,32 ( 25 ) 2 2,13 ( 11 ) 1 0,28 ( 27 ) 2 3,85 ( 7 )
Portugal 3 0,74 ( 23 ) 1 0,32 ( 25 ) 2 2,13 ( 11 ) 1 0,28 ( 27 ) 2 3,85 ( 7 )
Iran 2 0,49 ( 26 ) 1 0,32 ( 25 ) 1 1,06 ( 17 ) 1 0,28 ( 27 ) 1 1,92 ( 12 )
Ireland 2 0,49 ( 26 ) 2 0,64 ( 19 ) 0 0 ( 31 ) 2 0,56 ( 24 ) 0 0 ( 20 )
Poland 2 0,49 ( 26 ) 2 0,64 ( 19 ) 0 0 ( 31 ) 2 0,56 ( 24 ) 0 0 ( 20 )
Russia 2 0,49 ( 26 ) 2 0,64 ( 19 ) 0 0 ( 31 ) 2 0,56 ( 24 ) 0 0 ( 20 )
Switzerland 2 0,49 ( 26 ) 0 0 ( 34 ) 1 1,06 ( 17 ) 1 0,28 ( 27 ) 1 1,92 ( 12 )
Algeria 1 0,25 ( 31 ) 0 0 ( 34 ) 1 1,06 ( 17 ) 1 0,28 ( 27 ) 0 0 ( 20 )
Bulgaria 1 0,25 ( 31 ) 0 0 ( 34 ) 1 1,06 ( 17 ) 0 0 ( 40 ) 1 1,92 ( 12 )
Cuba 1 0,25 ( 31 ) 1 0,32 ( 25 ) 0 0 ( 31 ) 1 0,28 ( 27 ) 0 0 ( 20 )
Finland 1 0,25 ( 31 ) 0 0 ( 34 ) 1 1,06 ( 17 ) 0 0 ( 40 ) 1 1,92 ( 12 )
Hong Kong 1 0,25 ( 31 ) 0 0 ( 34 ) 1 1,06 ( 17 ) 1 0,28 ( 27 ) 0 0 ( 20 )
Malaysia 1 0,25 ( 31 ) 1 0,32 ( 25 ) 0 0 ( 31 ) 1 0,28 ( 27 ) 0 0 ( 20 )
Oman 1 0,25 ( 31 ) 0 0 ( 34 ) 1 1,06 ( 17 ) 1 0,28 ( 27 ) 0 0 ( 20 )
Slovenia 1 0,25 ( 31 ) 1 0,32 ( 25 ) 0 0 ( 31 ) 1 0,28 ( 27 ) 0 0 ( 20 )
South Africa 1 0,25 ( 31 ) 1 0,32 ( 25 ) 0 0 ( 31 ) 1 0,28 ( 27 ) 0 0 ( 20 )
Sweden 1 0,25 ( 31 ) 1 0,32 ( 25 ) 0 0 ( 31 ) 1 0,28 ( 27 ) 0 0 ( 20 )
Turkey 1 0,25 ( 31 ) 0 0 ( 34 ) 1 1,06 ( 17 ) 1 0,28 ( 27 ) 0 0 ( 20 )
Total articles (TP)
As consistent with other bibliometric analysis, economic developments were correlated with the
academic outputs (Liu et al., 2011). These countries in figure 4.10 (China, Germany, USA, South
Korea, France, Taiwan, Norway, UK and Japan) were categorized as industrialized countries and
major developing countries. The reason that China ranked first here was because China is the
emerging nation in research. China has become the fifth leading nation in terms of its share of the
world’s scientific publications in 2006. In 2011, it was reported that there was an increase in
spending by the Chinese government on research and development in supporting the development
of China as a global power in science and technology. In addition, with the unlimited pool of highly
skilled human resources, the continuation of growth could be expected in the future (Sigma Scan 2.0,
2011; Zhou & Leydesdorff, 2006). One possible reason behind the rise in China’s output may be that
China also started publishing in the English language, as it is known that English language dominates
in academic publishing and in conferences (Traynor, 2011).
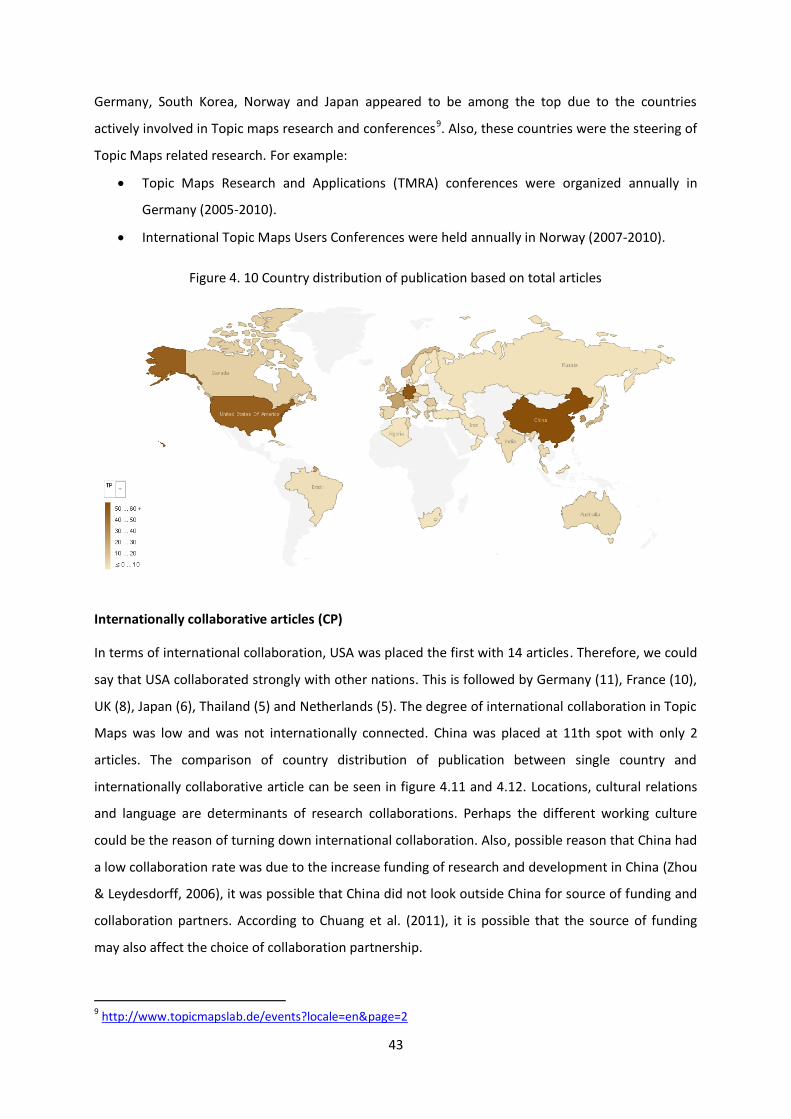
43
Germany, South Korea, Norway and Japan appeared to be among the top due to the countries
actively involved in Topic maps research and conferences9. Also, these countries were the steering of
Topic Maps related research. For example:
Topic Maps Research and Applications (TMRA) conferences were organized annually in
Germany (2005-2010).
International Topic Maps Users Conferences were held annually in Norway (2007-2010).
Figure 4. 10 Country distribution of publication based on total articles
Internationally collaborative articles (CP)
In terms of international collaboration, USA was placed the first with 14 articles. Therefore, we could
say that USA collaborated strongly with other nations. This is followed by Germany (11), France (10),
UK (8), Japan (6), Thailand (5) and Netherlands (5). The degree of international collaboration in Topic
Maps was low and was not internationally connected. China was placed at 11th spot with only 2
articles. The comparison of country distribution of publication between single country and
internationally collaborative article can be seen in figure 4.11 and 4.12. Locations, cultural relations
and language are determinants of research collaborations. Perhaps the different working culture
could be the reason of turning down international collaboration. Also, possible reason that China had
a low collaboration rate was due to the increase funding of research and development in China (Zhou
& Leydesdorff, 2006), it was possible that China did not look outside China for source of funding and
collaboration partners. According to Chuang et al. (2011), it is possible that the source of funding
may also affect the choice of collaboration partnership.
9 http://www.topicmapslab.de/events?locale=en&page=2
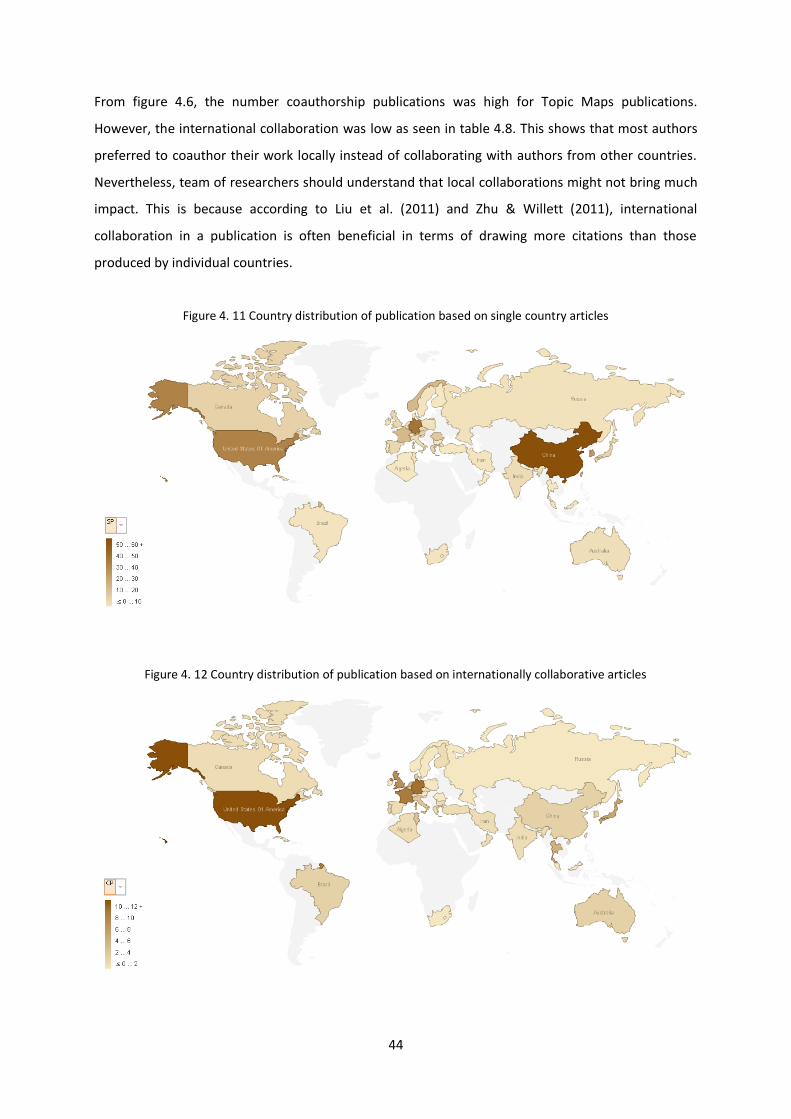
44
From figure 4.6, the number coauthorship publications was high for Topic Maps publications.
However, the international collaboration was low as seen in table 4.8. This shows that most authors
preferred to coauthor their work locally instead of collaborating with authors from other countries.
Nevertheless, team of researchers should understand that local collaborations might not bring much
impact. This is because according to Liu et al. (2011) and Zhu & Willett (2011), international
collaboration in a publication is often beneficial in terms of drawing more citations than those
produced by individual countries.
Figure 4. 11 Country distribution of publication based on single country articles
Figure 4. 12 Country distribution of publication based on internationally collaborative articles

45
4.4. Question 3: Which Topic Maps publications are the most cited?
4.4.1. Top cited publications and references
Out of these 356 publications in our study, 11 publications were highly cited with more than 10 times
(Table 4.9). From the title list, it showed that Topic Maps had spread some impact on disciplines such
as biomedical, healthcare and education.
Top productive authors in table 4.1 did not appear in the top cited publications list in table 4.9,
except Dicheva, D and Dichev, C. This could mean that these two authors were purely active in
producing Topic Maps related works.
Table 4. 9 Top cited publications
Authors Title Year Cited by
De Bruijn B., Martin J. Getting to the (c)ore of knowledge: Mining biomedical literature 2002 42
Dicheva D., Dichev C. TM4L: Creating and browsing educational topic maps 2006 35
Garshol L.M. Metadata? Thesauri? Taxonomies? Topic maps! Making sense of it all 2004 33
Sintek M., Decker S. TRIPLE - A query, inference, and transformation language for the Semantic Web
2002 33
Chau M., Huang Z., Qin J., Zhou Y., Chen H.
Building a scientific knowledge web portal: The NanoPort experience 2006 22
Kim J.-M., Shin H., Kim H.-J. Schema and constraints-based matching and merging of Topic Maps 2007 17
Schweiger R., Hoelzer S., Rudolf D., Rieger J., Dudeck J.
Linking clinical data using XML topic maps 2003 15
Dicheva D., Dichev C. Authoring educational topic maps: Can we make it easier? 2005 15
Dicheva D., Dichev C., Wang D. Visualizing topic maps for e-Learning 2005 14
Liu D.-R., Ke C.-K., Lee J.-Y., Lee C.-F.
Knowledge maps for composite e-services: A mining-based system platform coupling with recommendations
2008 10
Amati G., Carpineto C., Romano G. Query difficulty, robustness, and selective application of query expansion 2004 10
The 356 publications’ references were analysed for citation analysis. There was a total of 5749
references. Table 4.10 shows the top most cited references by these 356 publications. There was a
mixture of website, standard, article, conference paper, journal article and book. These references
could be possibly the main/classic references for future researchers who want to carry out topic
maps research. Most of the references were concerning about Topic Maps standards, such as “Topic
Maps Data Model”, “ISO/IEC 13250:2000 Topic Maps: Information Technology Document Description
and Processing Languages”, “Guide to the topic map standards”, “Topic Map Constraint Language
(TMCL) Requirements and Use Cases”, and “Topic maps reference model”. Prominent authors could
be seen here as well. Authors such as Pepper, S., Moore, G., Garshol, L.M., Biezunski, M., Bryan, M.,
Newcomb, S., Ahmed, K., and Barta, R. were important authors for early development of Topic Maps.
This table shows that standard documents were cited mostly by Topic Maps researchers in order to
obtain basic concept of topic maps. There were three titles where RDF could be found. This might be
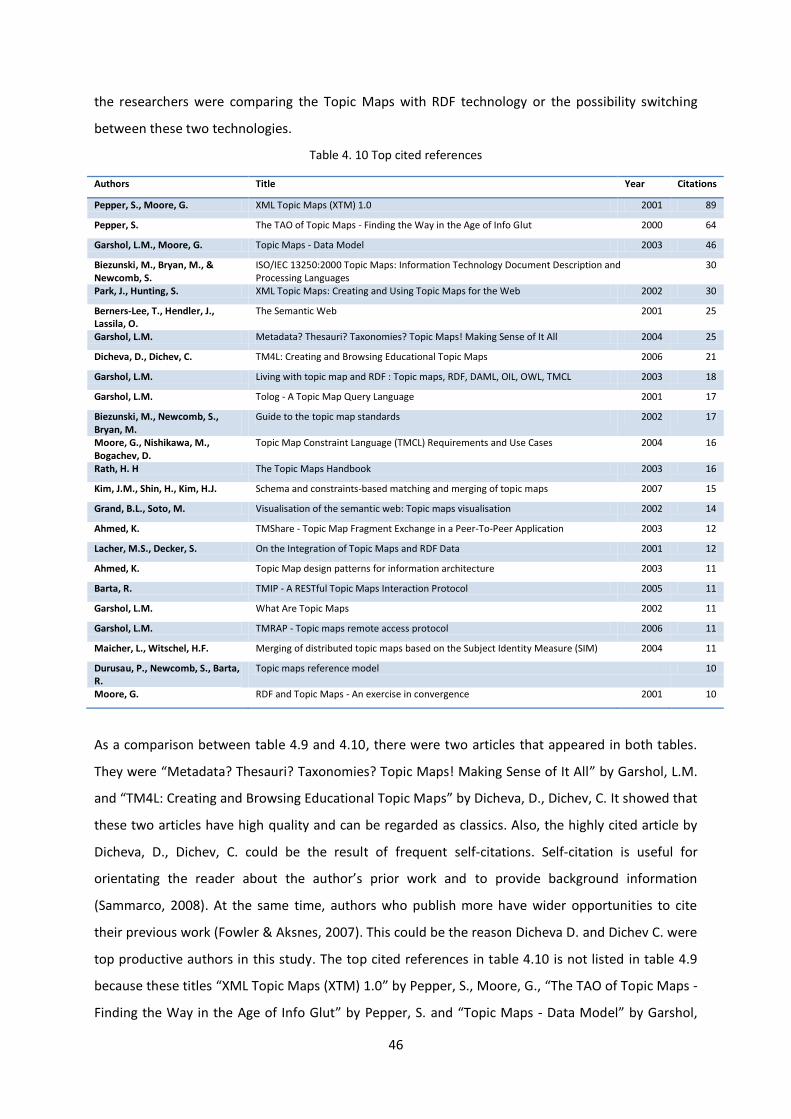
46
the researchers were comparing the Topic Maps with RDF technology or the possibility switching
between these two technologies.
Table 4. 10 Top cited references
Authors Title Year Citations
Pepper, S., Moore, G. XML Topic Maps (XTM) 1.0 2001 89
Pepper, S. The TAO of Topic Maps - Finding the Way in the Age of Info Glut 2000 64
Garshol, L.M., Moore, G. Topic Maps - Data Model 2003 46
Biezunski, M., Bryan, M., & Newcomb, S.
ISO/IEC 13250:2000 Topic Maps: Information Technology Document Description and Processing Languages
30
Park, J., Hunting, S. XML Topic Maps: Creating and Using Topic Maps for the Web 2002 30
Berners-Lee, T., Hendler, J., Lassila, O.
The Semantic Web 2001 25
Garshol, L.M. Metadata? Thesauri? Taxonomies? Topic Maps! Making Sense of It All 2004 25
Dicheva, D., Dichev, C. TM4L: Creating and Browsing Educational Topic Maps 2006 21
Garshol, L.M. Living with topic map and RDF : Topic maps, RDF, DAML, OIL, OWL, TMCL 2003 18
Garshol, L.M. Tolog - A Topic Map Query Language 2001 17
Biezunski, M., Newcomb, S., Bryan, M.
Guide to the topic map standards 2002 17
Moore, G., Nishikawa, M., Bogachev, D.
Topic Map Constraint Language (TMCL) Requirements and Use Cases 2004 16
Rath, H. H The Topic Maps Handbook 2003 16
Kim, J.M., Shin, H., Kim, H.J. Schema and constraints-based matching and merging of topic maps 2007 15
Grand, B.L., Soto, M. Visualisation of the semantic web: Topic maps visualisation 2002 14
Ahmed, K. TMShare - Topic Map Fragment Exchange in a Peer-To-Peer Application 2003 12
Lacher, M.S., Decker, S. On the Integration of Topic Maps and RDF Data 2001 12
Ahmed, K. Topic Map design patterns for information architecture 2003 11
Barta, R. TMIP - A RESTful Topic Maps Interaction Protocol 2005 11
Garshol, L.M. What Are Topic Maps 2002 11
Garshol, L.M. TMRAP - Topic maps remote access protocol 2006 11
Maicher, L., Witschel, H.F. Merging of distributed topic maps based on the Subject Identity Measure (SIM) 2004 11
Durusau, P., Newcomb, S., Barta, R.
Topic maps reference model 10
Moore, G. RDF and Topic Maps - An exercise in convergence 2001 10
As a comparison between table 4.9 and 4.10, there were two articles that appeared in both tables.
They were “Metadata? Thesauri? Taxonomies? Topic Maps! Making Sense of It All” by Garshol, L.M.
and “TM4L: Creating and Browsing Educational Topic Maps” by Dicheva, D., Dichev, C. It showed that
these two articles have high quality and can be regarded as classics. Also, the highly cited article by
Dicheva, D., Dichev, C. could be the result of frequent self-citations. Self-citation is useful for
orientating the reader about the author’s prior work and to provide background information
(Sammarco, 2008). At the same time, authors who publish more have wider opportunities to cite
their previous work (Fowler & Aksnes, 2007). This could be the reason Dicheva D. and Dichev C. were
top productive authors in this study. The top cited references in table 4.10 is not listed in table 4.9
because these titles “XML Topic Maps (XTM) 1.0” by Pepper, S., Moore, G., “The TAO of Topic Maps -
Finding the Way in the Age of Info Glut” by Pepper, S. and “Topic Maps - Data Model” by Garshol,
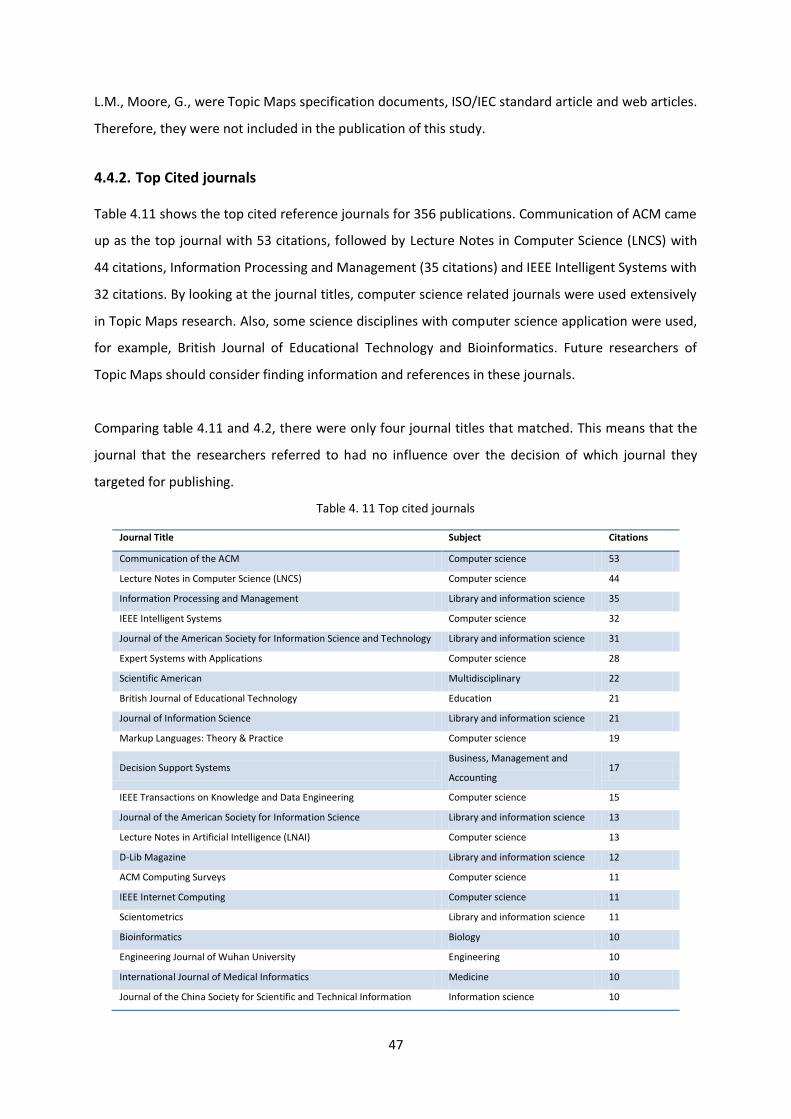
47
L.M., Moore, G., were Topic Maps specification documents, ISO/IEC standard article and web articles.
Therefore, they were not included in the publication of this study.
4.4.2. Top Cited journals
Table 4.11 shows the top cited reference journals for 356 publications. Communication of ACM came
up as the top journal with 53 citations, followed by Lecture Notes in Computer Science (LNCS) with
44 citations, Information Processing and Management (35 citations) and IEEE Intelligent Systems with
32 citations. By looking at the journal titles, computer science related journals were used extensively
in Topic Maps research. Also, some science disciplines with computer science application were used,
for example, British Journal of Educational Technology and Bioinformatics. Future researchers of
Topic Maps should consider finding information and references in these journals.
Comparing table 4.11 and 4.2, there were only four journal titles that matched. This means that the
journal that the researchers referred to had no influence over the decision of which journal they
targeted for publishing.
Table 4. 11 Top cited journals
Journal Title Subject Citations
Communication of the ACM Computer science 53
Lecture Notes in Computer Science (LNCS) Computer science 44
Information Processing and Management Library and information science 35
IEEE Intelligent Systems Computer science 32
Journal of the American Society for Information Science and Technology Library and information science 31
Expert Systems with Applications Computer science 28
Scientific American Multidisciplinary 22
British Journal of Educational Technology Education 21
Journal of Information Science Library and information science 21
Markup Languages: Theory & Practice Computer science 19
Decision Support Systems Business, Management and
Accounting 17
IEEE Transactions on Knowledge and Data Engineering Computer science 15
Journal of the American Society for Information Science Library and information science 13
Lecture Notes in Artificial Intelligence (LNAI) Computer science 13
D-Lib Magazine Library and information science 12
ACM Computing Surveys Computer science 11
IEEE Internet Computing Computer science 11
Scientometrics Library and information science 11
Bioinformatics Biology 10
Engineering Journal of Wuhan University Engineering 10
International Journal of Medical Informatics Medicine 10
Journal of the China Society for Scientific and Technical Information Information science 10
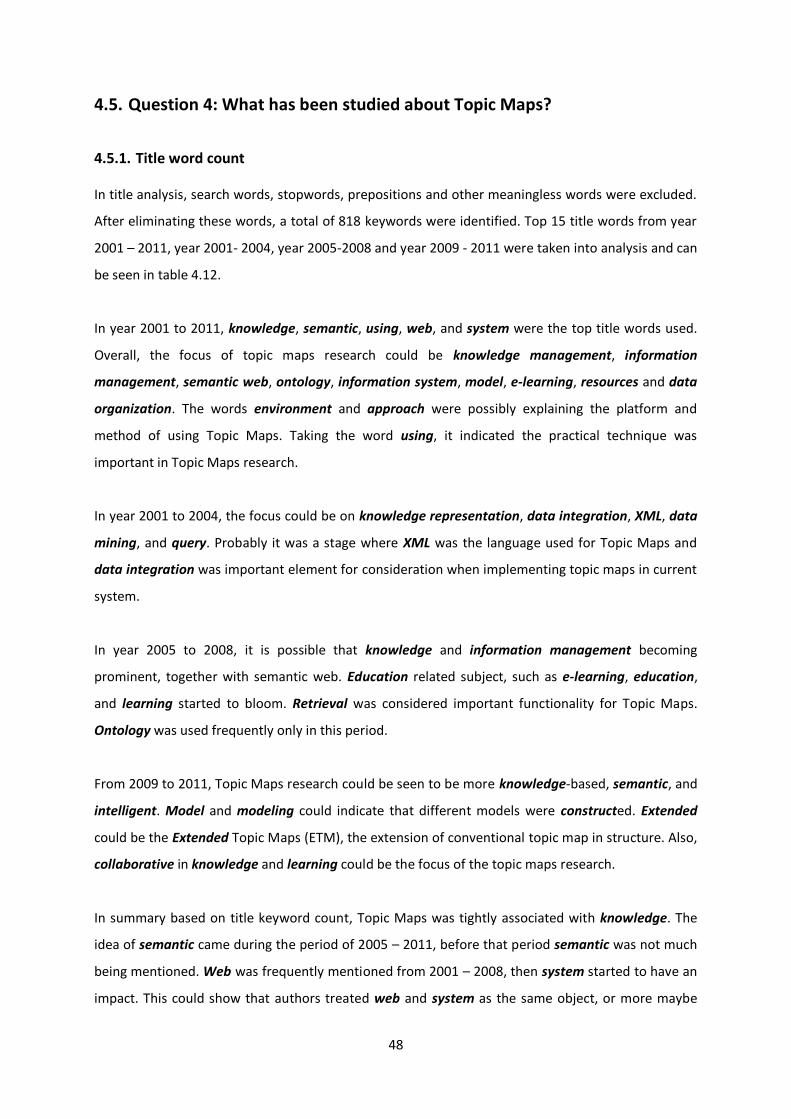
48
4.5. Question 4: What has been studied about Topic Maps?
4.5.1. Title word count
In title analysis, search words, stopwords, prepositions and other meaningless words were excluded.
After eliminating these words, a total of 818 keywords were identified. Top 15 title words from year
2001 – 2011, year 2001- 2004, year 2005-2008 and year 2009 - 2011 were taken into analysis and can
be seen in table 4.12.
In year 2001 to 2011, knowledge, semantic, using, web, and system were the top title words used.
Overall, the focus of topic maps research could be knowledge management, information
management, semantic web, ontology, information system, model, e-learning, resources and data
organization. The words environment and approach were possibly explaining the platform and
method of using Topic Maps. Taking the word using, it indicated the practical technique was
important in Topic Maps research.
In year 2001 to 2004, the focus could be on knowledge representation, data integration, XML, data
mining, and query. Probably it was a stage where XML was the language used for Topic Maps and
data integration was important element for consideration when implementing topic maps in current
system.
In year 2005 to 2008, it is possible that knowledge and information management becoming
prominent, together with semantic web. Education related subject, such as e-learning, education,
and learning started to bloom. Retrieval was considered important functionality for Topic Maps.
Ontology was used frequently only in this period.
From 2009 to 2011, Topic Maps research could be seen to be more knowledge-based, semantic, and
intelligent. Model and modeling could indicate that different models were constructed. Extended
could be the Extended Topic Maps (ETM), the extension of conventional topic map in structure. Also,
collaborative in knowledge and learning could be the focus of the topic maps research.
In summary based on title keyword count, Topic Maps was tightly associated with knowledge. The
idea of semantic came during the period of 2005 – 2011, before that period semantic was not much
being mentioned. Web was frequently mentioned from 2001 – 2008, then system started to have an
impact. This could show that authors treated web and system as the same object, or more maybe
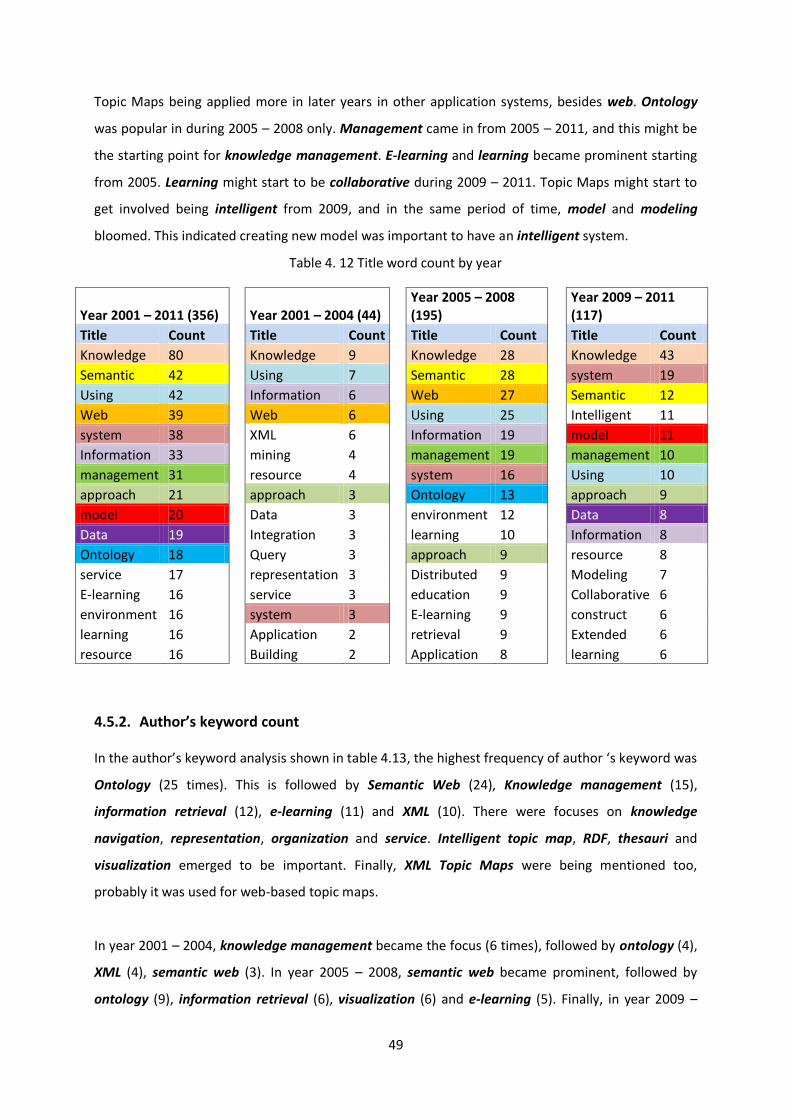
49
Topic Maps being applied more in later years in other application systems, besides web. Ontology
was popular in during 2005 – 2008 only. Management came in from 2005 – 2011, and this might be
the starting point for knowledge management. E-learning and learning became prominent starting
from 2005. Learning might start to be collaborative during 2009 – 2011. Topic Maps might start to
get involved being intelligent from 2009, and in the same period of time, model and modeling
bloomed. This indicated creating new model was important to have an intelligent system.
Table 4. 12 Title word count by year
Year 2001 – 2011 (356) Year 2001 – 2004 (44) Year 2005 – 2008 (195)
Year 2009 – 2011 (117)
Title Count
Title Count
Title Count
Title Count
Knowledge 80
Knowledge 9
Knowledge 28
Knowledge 43
Semantic 42
Using 7
Semantic 28
system 19
Using 42
Information 6
Web 27
Semantic 12
Web 39
Web 6
Using 25
Intelligent 11
system 38
XML 6
Information 19
model 11
Information 33
mining 4
management 19
management 10
management 31
resource 4
system 16
Using 10
approach 21
approach 3
Ontology 13
approach 9
model 20
Data 3
environment 12
Data 8
Data 19
Integration 3
learning 10
Information 8
Ontology 18
Query 3
approach 9
resource 8
service 17
representation 3
Distributed 9
Modeling 7
E-learning 16
service 3
education 9
Collaborative 6
environment 16
system 3
E-learning 9
construct 6
learning 16
Application 2
retrieval 9
Extended 6
resource 16 Building 2 Application 8 learning 6
4.5.2. Author’s keyword count
In the author’s keyword analysis shown in table 4.13, the highest frequency of author ‘s keyword was
Ontology (25 times). This is followed by Semantic Web (24), Knowledge management (15),
information retrieval (12), e-learning (11) and XML (10). There were focuses on knowledge
navigation, representation, organization and service. Intelligent topic map, RDF, thesauri and
visualization emerged to be important. Finally, XML Topic Maps were being mentioned too,
probably it was used for web-based topic maps.
In year 2001 – 2004, knowledge management became the focus (6 times), followed by ontology (4),
XML (4), semantic web (3). In year 2005 – 2008, semantic web became prominent, followed by
ontology (9), information retrieval (6), visualization (6) and e-learning (5). Finally, in year 2009 –
50
2011, Ontology came as the main focus (12), with intelligent topic maps (9), knowledge
management (7), knowledge navigation (7), semantic web (6) and thesauri (6).
In summary, ontology and semantic web were the frequently used keywords since beginning from
2001-2011. E-learning began to catch the attention of the researchers during the period of 2005 –
2011. XML was popular only in the beginning of the year. Information retrieval seemed to be
important throughout the years. Many keywords in 2001-2004 were data related, such as corpora,
large datasets, and metadata. This could be research related to data integration topic. Perhaps
data integration was the focus in 2001-2004. Text mining was only found in 2001-2004. In 2005-
2008, focus of Topic Map research was more on information retrieval, visualization and navigation,
most probably the Topic Maps was establishing itself in information architecture during this period
of the year. Finally, in year 2009-2011, Topic Maps seemed to be extended in providing intelligent
and knowledge-based systems or services. Nevertheless, the count of the keywords were too small
for making a summary of trend. Fu et al. (2010) mentioned that the large number of once-only
author keywords in the results which probably indicated a lack of continuity in research and a wide
disparity in research focuses. In another point of view, this showed that the mainstream research
was considered focusing on a small and scattered field.
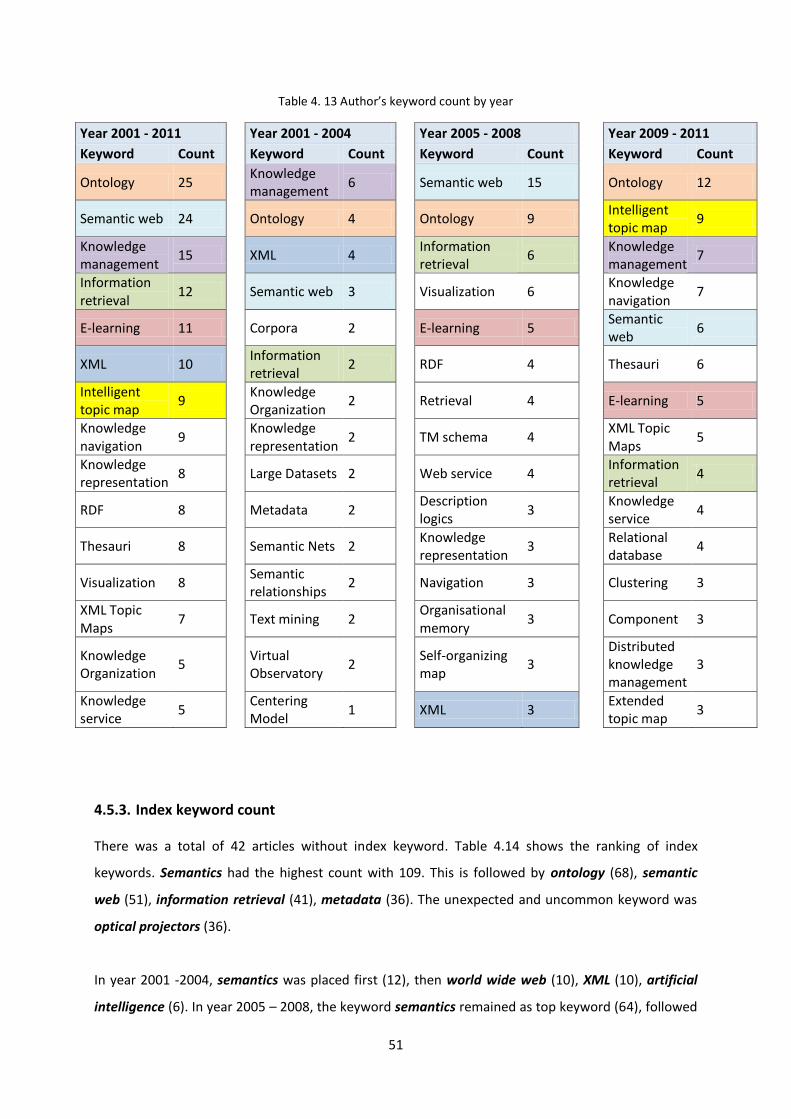
51
Table 4. 13 Author’s keyword count by year
Year 2001 - 2011 Year 2001 - 2004 Year 2005 - 2008 Year 2009 - 2011
Keyword Count
Keyword Count
Keyword Count
Keyword Count
Ontology 25
Knowledge management
6
Semantic web 15
Ontology 12
Semantic web 24
Ontology 4
Ontology 9
Intelligent topic map
9
Knowledge management
15
XML 4
Information retrieval
6
Knowledge management
7
Information retrieval
12
Semantic web 3
Visualization 6
Knowledge navigation
7
E-learning 11
Corpora 2
E-learning 5
Semantic web
6
XML 10
Information retrieval
2
RDF 4
Thesauri 6
Intelligent topic map
9
Knowledge Organization
2
Retrieval 4
E-learning 5
Knowledge navigation
9
Knowledge representation
2
TM schema 4
XML Topic Maps
5
Knowledge representation
8
Large Datasets 2
Web service 4
Information retrieval
4
RDF 8
Metadata 2
Description logics
3
Knowledge service
4
Thesauri 8
Semantic Nets 2
Knowledge representation
3
Relational database
4
Visualization 8
Semantic relationships
2
Navigation 3
Clustering 3
XML Topic Maps
7
Text mining 2
Organisational memory
3
Component 3
Knowledge Organization
5
Virtual Observatory
2
Self-organizing map
3
Distributed knowledge management
3
Knowledge service
5
Centering Model
1
XML 3
Extended topic map
3
4.5.3. Index keyword count
There was a total of 42 articles without index keyword. Table 4.14 shows the ranking of index
keywords. Semantics had the highest count with 109. This is followed by ontology (68), semantic
web (51), information retrieval (41), metadata (36). The unexpected and uncommon keyword was
optical projectors (36).
In year 2001 -2004, semantics was placed first (12), then world wide web (10), XML (10), artificial
intelligence (6). In year 2005 – 2008, the keyword semantics remained as top keyword (64), followed
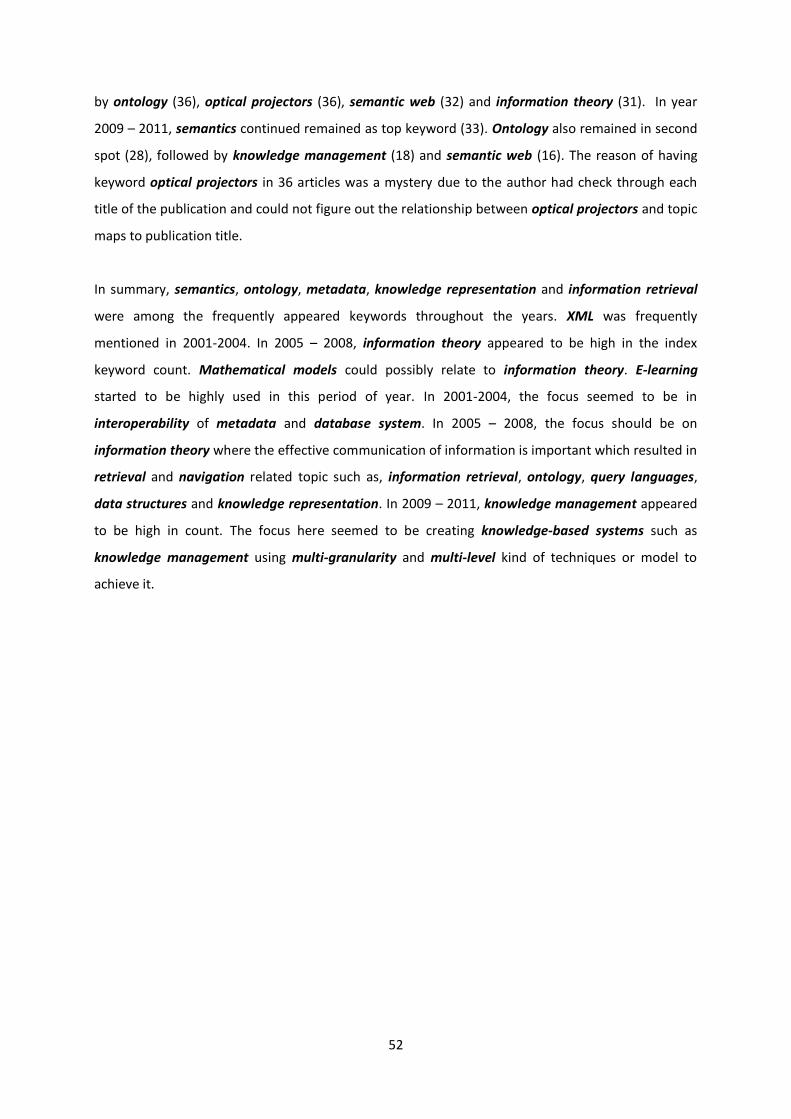
52
by ontology (36), optical projectors (36), semantic web (32) and information theory (31). In year
2009 – 2011, semantics continued remained as top keyword (33). Ontology also remained in second
spot (28), followed by knowledge management (18) and semantic web (16). The reason of having
keyword optical projectors in 36 articles was a mystery due to the author had check through each
title of the publication and could not figure out the relationship between optical projectors and topic
maps to publication title.
In summary, semantics, ontology, metadata, knowledge representation and information retrieval
were among the frequently appeared keywords throughout the years. XML was frequently
mentioned in 2001-2004. In 2005 – 2008, information theory appeared to be high in the index
keyword count. Mathematical models could possibly relate to information theory. E-learning
started to be highly used in this period of year. In 2001-2004, the focus seemed to be in
interoperability of metadata and database system. In 2005 – 2008, the focus should be on
information theory where the effective communication of information is important which resulted in
retrieval and navigation related topic such as, information retrieval, ontology, query languages,
data structures and knowledge representation. In 2009 – 2011, knowledge management appeared
to be high in count. The focus here seemed to be creating knowledge-based systems such as
knowledge management using multi-granularity and multi-level kind of techniques or model to
achieve it.
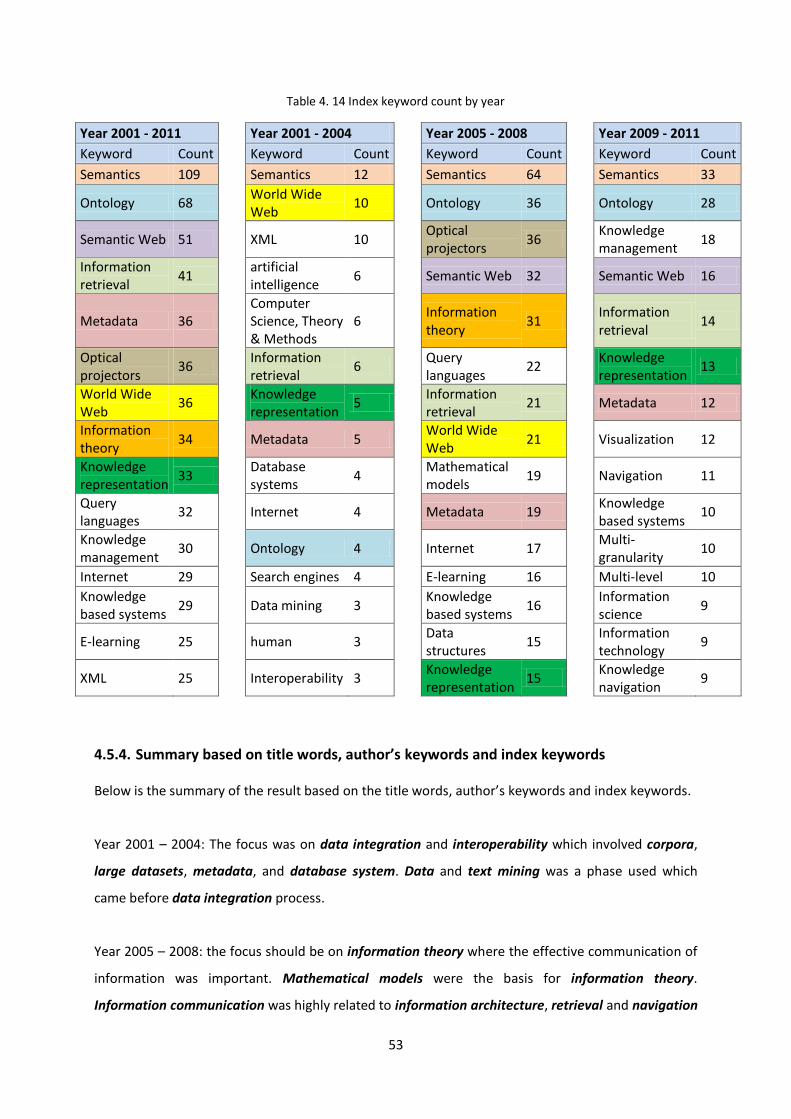
53
Table 4. 14 Index keyword count by year
Year 2001 - 2011 Year 2001 - 2004 Year 2005 - 2008 Year 2009 - 2011
Keyword Count
Keyword Count
Keyword Count
Keyword Count
Semantics 109 Semantics 12 Semantics 64 Semantics 33
Ontology 68 World Wide Web
10 Ontology 36 Ontology 28
Semantic Web 51 XML 10 Optical projectors
36 Knowledge management
18
Information retrieval
41 artificial intelligence
6 Semantic Web 32 Semantic Web 16
Metadata 36 Computer Science, Theory & Methods
6 Information theory
31 Information retrieval
14
Optical projectors
36 Information retrieval
6 Query languages
22 Knowledge representation
13
World Wide Web
36 Knowledge representation
5 Information retrieval
21 Metadata 12
Information theory
34 Metadata 5 World Wide Web
21 Visualization 12
Knowledge representation
33 Database systems
4 Mathematical models
19 Navigation 11
Query languages
32 Internet 4 Metadata 19 Knowledge based systems
10
Knowledge management
30 Ontology 4 Internet 17 Multi-granularity
10
Internet 29 Search engines 4 E-learning 16 Multi-level 10
Knowledge based systems
29 Data mining 3 Knowledge based systems
16 Information science
9
E-learning 25 human 3 Data structures
15 Information technology
9
XML 25 Interoperability 3 Knowledge representation
15 Knowledge navigation
9
4.5.4. Summary based on title words, author’s keywords and index keywords
Below is the summary of the result based on the title words, author’s keywords and index keywords.
Year 2001 – 2004: The focus was on data integration and interoperability which involved corpora,
large datasets, metadata, and database system. Data and text mining was a phase used which
came before data integration process.
Year 2005 – 2008: the focus should be on information theory where the effective communication of
information was important. Mathematical models were the basis for information theory.
Information communication was highly related to information architecture, retrieval and navigation
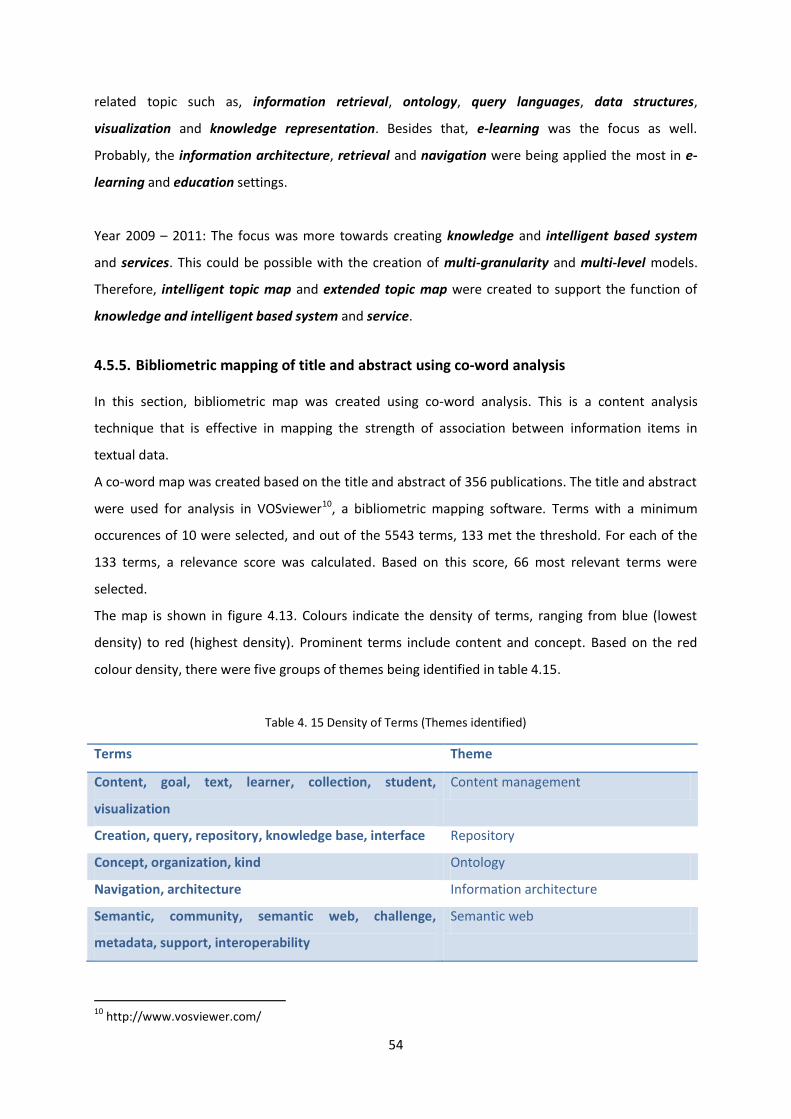
54
related topic such as, information retrieval, ontology, query languages, data structures,
visualization and knowledge representation. Besides that, e-learning was the focus as well.
Probably, the information architecture, retrieval and navigation were being applied the most in e-
learning and education settings.
Year 2009 – 2011: The focus was more towards creating knowledge and intelligent based system
and services. This could be possible with the creation of multi-granularity and multi-level models.
Therefore, intelligent topic map and extended topic map were created to support the function of
knowledge and intelligent based system and service.
4.5.5. Bibliometric mapping of title and abstract using co-word analysis
In this section, bibliometric map was created using co-word analysis. This is a content analysis
technique that is effective in mapping the strength of association between information items in
textual data.
A co-word map was created based on the title and abstract of 356 publications. The title and abstract
were used for analysis in VOSviewer10, a bibliometric mapping software. Terms with a minimum
occurences of 10 were selected, and out of the 5543 terms, 133 met the threshold. For each of the
133 terms, a relevance score was calculated. Based on this score, 66 most relevant terms were
selected.
The map is shown in figure 4.13. Colours indicate the density of terms, ranging from blue (lowest
density) to red (highest density). Prominent terms include content and concept. Based on the red
colour density, there were five groups of themes being identified in table 4.15.
Table 4. 15 Density of Terms (Themes identified)
Terms Theme
Content, goal, text, learner, collection, student,
visualization
Content management
Creation, query, repository, knowledge base, interface Repository
Concept, organization, kind Ontology
Navigation, architecture Information architecture
Semantic, community, semantic web, challenge,
metadata, support, interoperability
Semantic web
10 http://www.vosviewer.com/
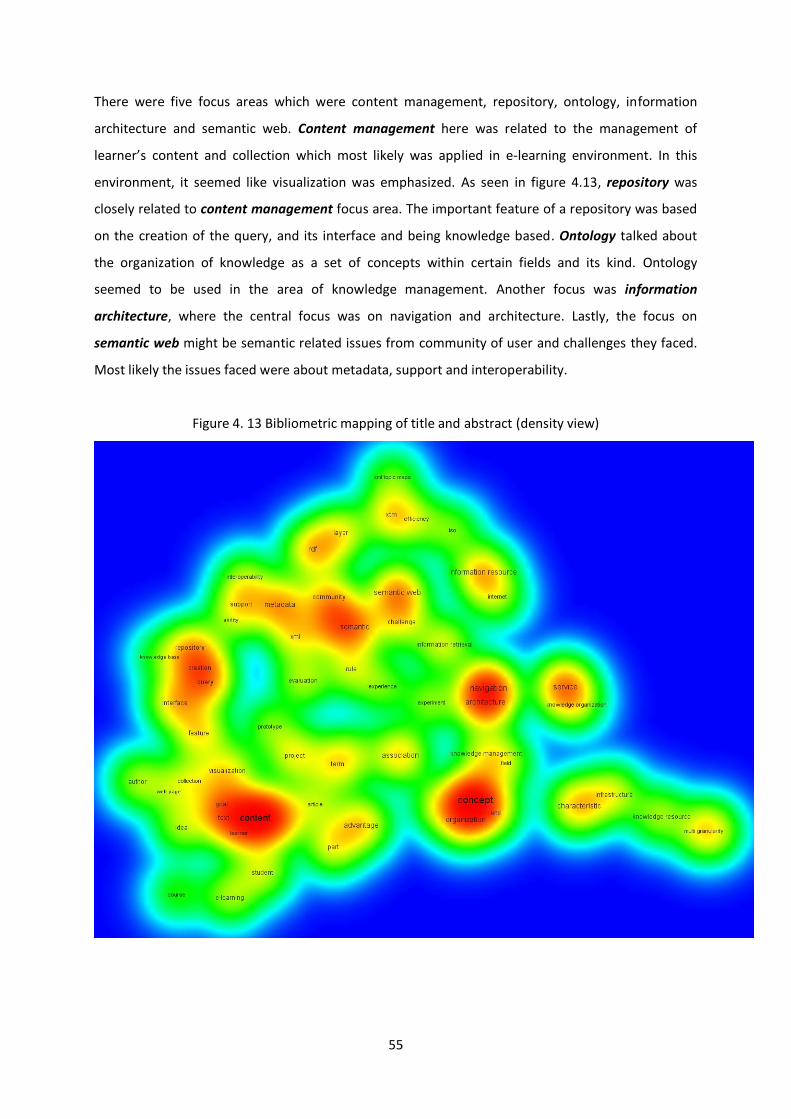
55
There were five focus areas which were content management, repository, ontology, information
architecture and semantic web. Content management here was related to the management of
learner’s content and collection which most likely was applied in e-learning environment. In this
environment, it seemed like visualization was emphasized. As seen in figure 4.13, repository was
closely related to content management focus area. The important feature of a repository was based
on the creation of the query, and its interface and being knowledge based. Ontology talked about
the organization of knowledge as a set of concepts within certain fields and its kind. Ontology
seemed to be used in the area of knowledge management. Another focus was information
architecture, where the central focus was on navigation and architecture. Lastly, the focus on
semantic web might be semantic related issues from community of user and challenges they faced.
Most likely the issues faced were about metadata, support and interoperability.
Figure 4. 13 Bibliometric mapping of title and abstract (density view)
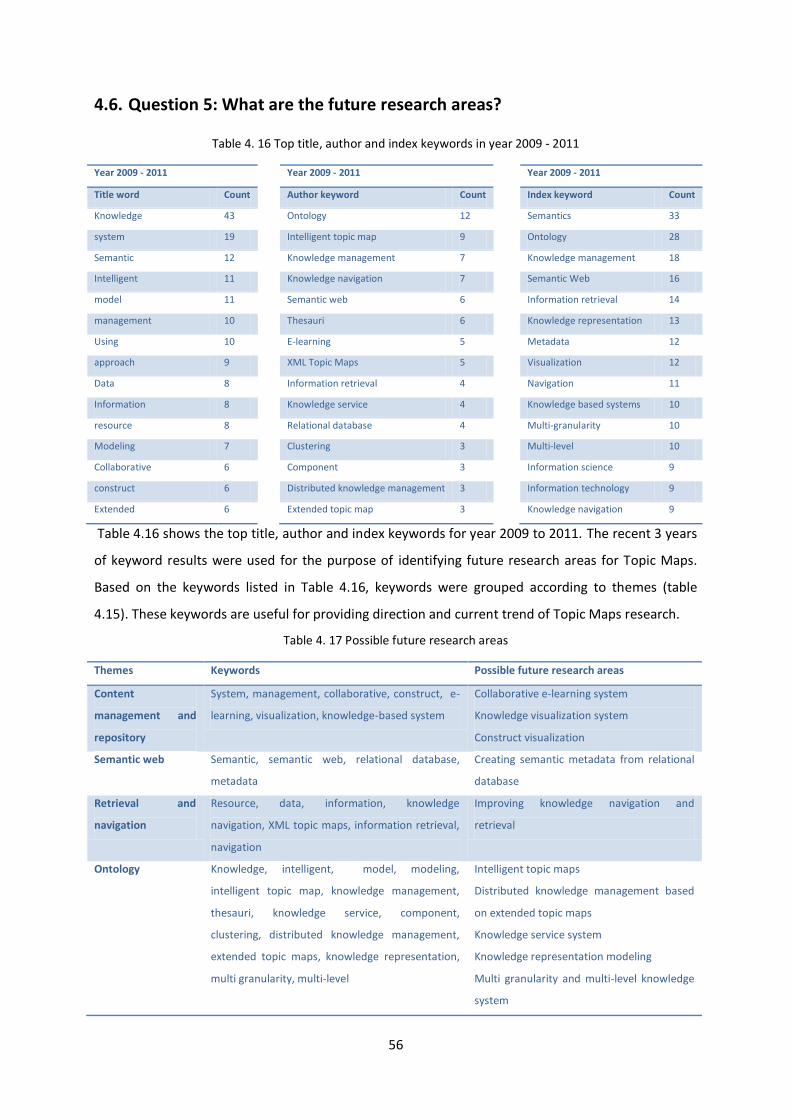
56
4.6. Question 5: What are the future research areas?
Table 4. 16 Top title, author and index keywords in year 2009 - 2011
Year 2009 - 2011 Year 2009 - 2011 Year 2009 - 2011
Title word Count Author keyword Count Index keyword Count
Knowledge 43 Ontology 12 Semantics 33
system 19 Intelligent topic map 9 Ontology 28
Semantic 12 Knowledge management 7 Knowledge management 18
Intelligent 11 Knowledge navigation 7 Semantic Web 16
model 11 Semantic web 6 Information retrieval 14
management 10 Thesauri 6 Knowledge representation 13
Using 10 E-learning 5 Metadata 12
approach 9 XML Topic Maps 5 Visualization 12
Data 8 Information retrieval 4 Navigation 11
Information 8 Knowledge service 4 Knowledge based systems 10
resource 8 Relational database 4 Multi-granularity 10
Modeling 7 Clustering 3 Multi-level 10
Collaborative 6 Component 3 Information science 9
construct 6 Distributed knowledge management 3 Information technology 9
Extended 6 Extended topic map 3 Knowledge navigation 9
Table 4.16 shows the top title, author and index keywords for year 2009 to 2011. The recent 3 years
of keyword results were used for the purpose of identifying future research areas for Topic Maps.
Based on the keywords listed in Table 4.16, keywords were grouped according to themes (table
4.15). These keywords are useful for providing direction and current trend of Topic Maps research.
Table 4. 17 Possible future research areas
Themes Keywords Possible future research areas
Content
management and
repository
System, management, collaborative, construct, e-
learning, visualization, knowledge-based system
Collaborative e-learning system
Knowledge visualization system
Construct visualization
Semantic web Semantic, semantic web, relational database,
metadata
Creating semantic metadata from relational
database
Retrieval and
navigation
Resource, data, information, knowledge
navigation, XML topic maps, information retrieval,
navigation
Improving knowledge navigation and
retrieval
Ontology Knowledge, intelligent, model, modeling,
intelligent topic map, knowledge management,
thesauri, knowledge service, component,
clustering, distributed knowledge management,
extended topic maps, knowledge representation,
multi granularity, multi-level
Intelligent topic maps
Distributed knowledge management based
on extended topic maps
Knowledge service system
Knowledge representation modeling
Multi granularity and multi-level knowledge
system
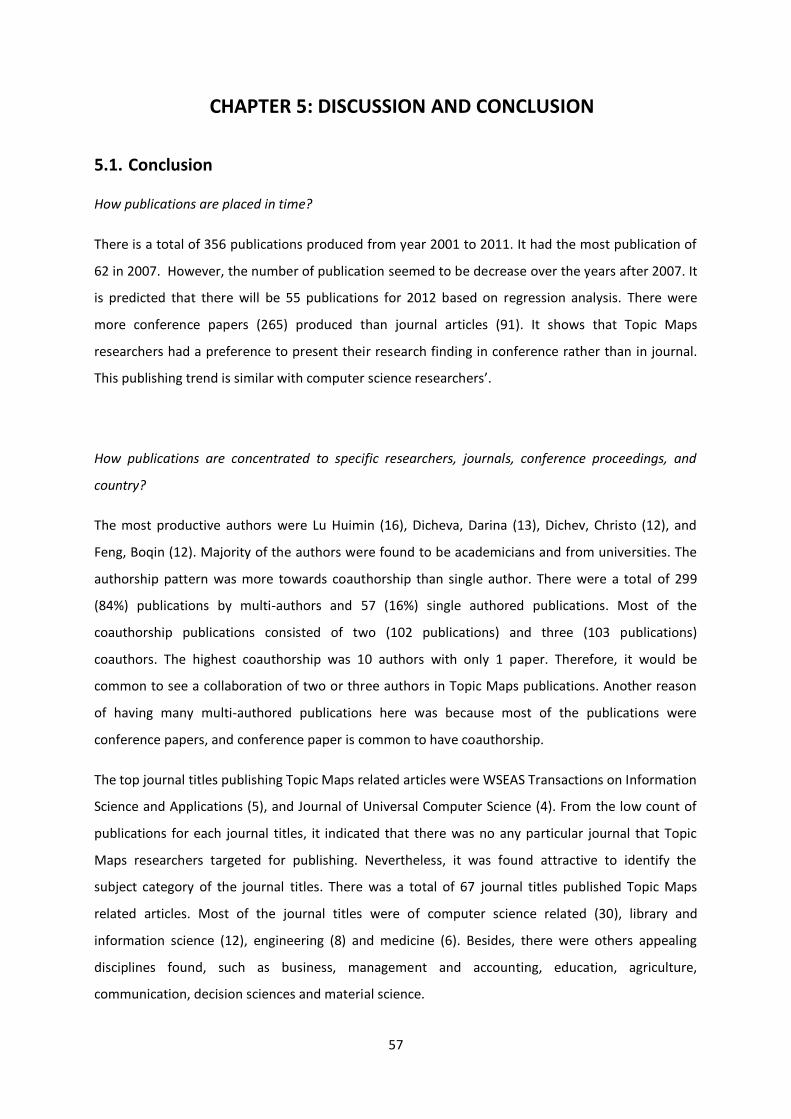
57
CHAPTER 5: DISCUSSION AND CONCLUSION
5.1. Conclusion
How publications are placed in time?
There is a total of 356 publications produced from year 2001 to 2011. It had the most publication of
62 in 2007. However, the number of publication seemed to be decrease over the years after 2007. It
is predicted that there will be 55 publications for 2012 based on regression analysis. There were
more conference papers (265) produced than journal articles (91). It shows that Topic Maps
researchers had a preference to present their research finding in conference rather than in journal.
This publishing trend is similar with computer science researchers’.
How publications are concentrated to specific researchers, journals, conference proceedings, and
country?
The most productive authors were Lu Huimin (16), Dicheva, Darina (13), Dichev, Christo (12), and
Feng, Boqin (12). Majority of the authors were found to be academicians and from universities. The
authorship pattern was more towards coauthorship than single author. There were a total of 299
(84%) publications by multi-authors and 57 (16%) single authored publications. Most of the
coauthorship publications consisted of two (102 publications) and three (103 publications)
coauthors. The highest coauthorship was 10 authors with only 1 paper. Therefore, it would be
common to see a collaboration of two or three authors in Topic Maps publications. Another reason
of having many multi-authored publications here was because most of the publications were
conference papers, and conference paper is common to have coauthorship.
The top journal titles publishing Topic Maps related articles were WSEAS Transactions on Information
Science and Applications (5), and Journal of Universal Computer Science (4). From the low count of
publications for each journal titles, it indicated that there was no any particular journal that Topic
Maps researchers targeted for publishing. Nevertheless, it was found attractive to identify the
subject category of the journal titles. There was a total of 67 journal titles published Topic Maps
related articles. Most of the journal titles were of computer science related (30), library and
information science (12), engineering (8) and medicine (6). Besides, there were others appealing
disciplines found, such as business, management and accounting, education, agriculture,
communication, decision sciences and material science.
58
There was a total of 265 conference papers taken into the analysis of obtaining the conference titles
where these papers were presented. There were 150 unique conference titles identified. Topic Map
Research and Application (TMRA) conference was the leading conference for Topic Maps with 62
papers. Followed by Annual ACM Southeast Conference, ACMSE (5 papers) and IEEE International
Conference on Advanced Learning Technologies, ICALT (5 papers). In term of the subject distribution
of the conference, majority of the conferences were computer science related (79), followed by
education (12), knowledge management (8), information science (7), engineering (7), business,
management and accounting (7). Other than that, there were agriculture, archive, communication,
control theory, environment science, ergonomics, mathematics, military, mobile technology,
nanotechnology, and geoscience.
Bibliographic data on the country distribution of publications were based on the affiliation
information of the authors. There were 41 countries identified, Europe (22), Asia (11), North and
South America (4) and Africa (10) and Oceania (1). China was the leading country in articles
productivity (57), followed by Germany (54), USA (51), South Korea (32), France (26), Taiwan (24),
Norway (17), UK (13) and Japan (13). However, in term of internationally collaborative articles, China
was placed at 11th spot with only 2 articles. USA was placed the first with 14 articles, then Germany
(11), France (10), UK (8) and Japan (6). The number of the international collaboration was quite low,
even though the number of coauthorship was high. This indicated that most researchers were
coauthored locally.
Which publications about Topic Maps are the most cited?
The top cited publications in this study were “Getting to the (c)ore of knowledge: mining biomedical
literature” by De Bruijn B. and Martin J with 42 citations. Followed by “TM4L: Creating and browsing
educational topic maps” by Dicheva D., Dichev C. (35 times), “Metadata? Thesauri? Taxonomies?
Topic maps! Making sense of it all” by Garshol L.M. (33 times) and “TRIPLE - A query, inference, and
transformation language for the Semantic Web” by Sintek M., Decker S. (33 times).
On the top cited references, the following was cited most in Topic Maps related literatures. “XML
Topic Maps (XTM) 1.0” by Pepper S. and Moore G (89 citations). Secondly, “The TAO of Topic Maps –
Finding the way in the age of info glut” by Pepper S (64 times), “ISO/IEC 13250:2000 Topic Maps:
information technology document description and processing languages” by Biezunski M, Bryan M,
and Newcomb S. These can be classified as the classic literatures for Topic Maps. Most of the
references were Topic Maps standard documents.
59
There were two articles that appeared as most cited by and cited, which were “Metadata? Thesauri?
Taxonomies? Topic Maps! Making Sense of It All” by Garshol, L.M. and “TM4L: Creating and Browsing
Educational Topic Maps” by Dicheva, D., Dichev, C. It might indicate the researchers viewed these
two articles as more quality and reliable.
Most Topic Maps researchers referred to computer science journals. The top cited journals were
Communication of ACM with 53 citations, followed by Lecture Notes in Computer Science (LNCS)
with 44 citations, Information Processing and Management (35 citations) and IEEE Intelligent Systems
with 32 citations. This could help future Topic Maps researchers to find resources in these journals.
What has been studied about Topic Maps?
Based on the title word, author’s keywords and index keywords, the focus of the Topic Maps
changed along the period. From 2001 to 2004, the focus was on data integration and interoperability.
In 2005 – 2008, the focus shifted to information theory where effective communication of
information, such as information architecture, retrieval and navigation was emphasized. Finally, from
2009 to 2011, the focus was more towards creating knowledge and intelligent based system and
services.
With the bibliometric mapping of title and abstract using co-word analysis, there were five themes
identified for Topic Maps. They were content management, repository, ontology, information
architecture, retrieval and navigation, and semantic web.
What are the future research areas?
Based on the recent three years of keywords result, the future research areas will possibly be
collaborative e-learning system, knowledge visualization system, visualization construction, semantic
metadata creation from a relational database, knowledge navigation and retrieval improvement,
intelligent topic map, distributed knowledge management based on extended topic maps,
knowledge service system, knowledge representation modeling, and multi granularity and multi-level
knowledge.
In conclusion, Topic Maps could still be relevant as a technology for the semantic web in coming
years. However, the usage of Topic Maps is predicted to be low after having analyzed the result from
this study. The reason is Topic Maps is viewed as immature 10-years-old technology. In additional,
60
other similar technology such as RDF could have done semantic web much better than Topic Maps,
which leads to the preference of RDF. Lastly, the absence of Topic Maps specific conference and
journal is the key factor of the low research activities on Topic Maps.
5.2. Discussion
From the result, the peak year for Topic Maps was in 2007. TMRA conferences were held every year
until 2010. Unfortunately, conference proceedings of TMRA 2008, 2009 and 2010 were not being
indexed neither in Web of Knowledge nor SCOPUS databases. This was because these proceedings
were published in LIV series by the University of Leipzig. Therefore, these three years of TMRA
conference papers’ bibliographic data were not being capture in this study. This was a limitation of
this study. If the conference papers for TMRA 2008, 2009 and 2010 were included in this study, the
peak period of Topic Maps would be from 2007 to 2009. This period of years could be the golden age
for Topic Maps where there were research, application and publication being produced.
The publication of Topic Maps literatures will still be continued on, and researchers will still write and
publish papers on Topic Maps. The question is the number of Topic Maps papers which will be
published. Topic Maps researchers have the strong inclination of presenting papers in conferences,
just as other computer scientists who favour publishing in conference rather than journal. This trend
will not be changed in few years time. As for conference papers related to Topic Maps, the trend will
probably decrease. Many leading Topic Maps conferences have been discontinued, for example,
Topic Maps Research and Applications (TMRA) which started in 2005 and ended in year 2010. It is
succeeded by the International ICST conference on No SQL Databases and Social Applications in year
2012. Other Topic Maps conference such as International Topic Maps User Conference were held
annually in Norway from 2007 and ended in 2010. Both of these conferences were subject specific
conference on Topic Maps and they are important conferences for promoting and pushing the usage
of Topic Maps technology. However, both conferences ended in the same year in 2010. The reason
for this incident of discontinuation could not be found, most likely the community started to show
lack of interest. Without these Topic Maps specific conferences, it is predicted that there will be a
drop in Topic Maps research, especially in conference proceedings. With the low number of
conference papers, it will affect the number of journal articles, as mentioned by Vardi (2009), only a
small portion of conference papers is followed by journal articles. Looking at the result of this study,
it is predicted that the number of journal articles will be slightly consistent and most likely it will not
exceed 20 articles per year, which is quite low. All these incidences indicate that Topic Maps might
have not reached technology maturity stage, but has lost its importance and significant now or
61
future. Perhaps Topic Maps has less commercial value for semantic web technology where most
would prefer RDF. This can be a further research topic.
However, from the study result, it is difficult to identify a dedicated journal which Topic Maps
researchers preferred to have their papers being published. It will be beneficial if a dedicated Topic
Maps journal being established which will help to boost up the Topic Maps research and theory
regardless of the discipline of researchers in, be it computer science, library and information science,
medicine or education. This could create an avenue for Topic Maps researchers to have a targeted
journal for publishing their work. Also, another benefit could be that with the increasing number in
journal articles could place Topic Maps close to technology maturity.
In term of authorship, Topic Maps research depends a lot on academician in universities. There were
not many authors from companies and commercial industries published papers in journals. These
authors might prefer presenting their study in conferences, and there are small chances of these
conference papers to be followed up by publishing in a journal. This is because most of the authors
from companies or commercial industries do not need to achieve key performance indicators in
research work like the academicians do. The authorship pattern in Topic Maps is more toward
coauthorship than single author. This is because of most publications are conference papers, and
coauthorship is common for this reason (Franceschet, 2010). It seems like the more technical is a
research work, the more collaborations it will have. It is wise to have a coauthorship work if the
research work is too technical and has tight deadline for submitting the conference paper.
Topic Maps article published in library and information science journal in 2003. Estrada (2009)
mentioned that Topic Maps was introduced to LIS community in 2003 at the series of conference.
However, in this study result, there was digital library conference (Second ACM/IEEE-CS Joint
Conference on Digital Libraries) held in 2002 and there was one Topic Maps related paper presented,
which showed that Topic Maps was possible being introduced to LIS community as early as 2002.
Perhaps Estrada (2009) did not mention about this conference because it might be considered as a
conference for computer scientists rather than librarians, which was more technical and not suitable
for general librarians.
The application of Topic Maps in the manufacturing sector was started in a university in Korea. There
were two journal articles 11 12 published by them in 2007. After that, in 2008, there was a conference
11 Lee, J., & Kim, K. (2007). A distributed product development architecture for engineering collaborations across ubiquitous virtual enterprises. The International Journal of Advanced Manufacturing Technology, 33(1), 59–70. doi:10.1007/s00170-006-0443-4 12 Chae, H., Kim, K., Choi, Y., Kim, C.-H., & Lee, J. Y. (2006). A view-based approach to modeling product semantics in design chains. The International Journal of Advanced Manufacturing Technology, 32(9-10), 863–876. doi:10.1007/s00170-006-0419-4
62
paper13 presented by a group of researchers from the non-academic institution in Korea. It shows
that the journal articles brought an impact in the manufacturing sector. As for the medical industry,
there were several Topic Maps related articles published as early as 2003. It was found that mostly
were journal articles. This shows that researchers in the medical field prefer to publish in journal
articles. Conferences might not be a popular avenue for them to showcase their research. However,
the last Topic Maps related article in the medical field was published in 2009, and in total there were
only 6 articles. This might indicate that Topic Maps was no longer useful in this field, and with only 6
articles, the potential of having Topic Maps to be applied in the medical field is low.
It is intriguing to look at the distribution of Topic Maps publication by country. There was a significant
influence of Topic Maps in East Asian countries, such as China, South Korea, Taiwan and Japan. The
highlight and booster for Topic Maps research in East Asia would probably be the AToMS (Asian Topic
Maps Summit)14 2007 held in Kyoto Japan. But there were two downfalls being identified for this
conference, first, AToMS was held once only. Second, conference proceeding was not produced. This
could indicate that AToMS was just a short term promotion of Topic Maps in Asia. If not, Topic Maps
research could have been a massive hit in East Asia.
In Europe, Germany, France, Norway and UK have a large share of Topic Maps research. Germany
and Norway are the main leading actor for Topic Maps research. It is because Germany was the
TMRA conference host country annually. Norway also hosted several Topic Maps conference and
there is a company called Ontopia with a suite of topic map solutions and business partner with
companies in USA, Japan, South Korea, Germany and UK. This might be the reason that Topic Maps
have influence in Japan and South Korea. With AToMS 2007 conference, Topic Maps influence could
possibly spread to China. Based on the result of this study, China had only 8 publications from 2002-
2007, and after 2007, the number of publication raised to 57. Nevertheless, Topic Maps is only well-
known in Norway among Northern European countries. Denmark, Sweden and Finland did not show
many publications about Topic Maps. This might show that Topic Maps is not an attractive
technology to these countries.
Referring to top cited references of 356 publications, standard documents from ISO website were
cited the most. Among the top references, there were three titles found with the word RDF within
the title. There are a few possibilities that these references were used. It could be the researchers
13 Jung, E.-H., Cho, K.-M., Song, K.-H., Nam, S.-H., & Lee, S.-W. (2008). Methodology of Topic Maps creation and Semantic Web for technological information search regarding injection-mold based on Collaboration Hub. Smart Manufacturing Application, 2008. ICSMA 2008. International Conference on (pp. 78 –83). doi:10.1109/ICSMA.2008.4505617 14 http://www.knowledge-synergy.com/news/atoms2007-en.html
63
were comparing the Topic Maps with RDF technology. Also, it could be about data integration or
dealing with interoperability between these two technologies.
From 2001 to 2004, Topic Maps focused on data integration and interoperability. In order for Topic
maps to establish itself in the early stage, the basic element like data should first be dealt with. The
ability of a technology to integrate data and interoperability issues are a serious concern for using a
new technology. It was desirable that Topic Maps could provide solutions.
From 2005 to 2008, Topic Maps shifted the focus on “information theory” for effective
communication of information. This might indicate that Topic Maps succeeded in dealing with data
integration and interoperability issue, and therefore, Topic Maps could establish itself in information
architecture, retrieval and navigation. E-learning was the application area identified. Education
application was targeted most likely because it was easier to implement and it had less risk involved.
Also, since most of the Topic Maps researchers were academicians, e-learning was an area which the
researchers found familiar with and could help or improve with the university’s teaching and learning
method.
From 2009 to 2010, Topic Maps had grown to be more knowledge and intelligent based. Topic Maps
was being extended, and element of “intelligence” was created. This was to support the reasoning of
knowledge and intelligent system, therefore, Topic Maps needed to acquire artificial intelligent and
reasoning features so that it is comparable with other latest technologies and keep up with the latest
development. The researchers created new names such as “intelligent topic map” and “extended
topic map”. This could be seen as to promote Topic Maps and perhaps created some rebranding to
make Topic Maps up-to-date and fresh.
Hence, the possible future research areas on Topic Maps should be something new, fresh, innovative
and could replace old techniques and technologies. There will be a wide range of research possibility
if Topic Maps goes into knowledge and intelligent based, bridging the gap closer between Topic
Maps and Semantic Web. Therefore, reasoning is an important element to be considered if to
connect it with semantic web and artificial intelligent. Another possible research area that Topic
Maps could venture into is mobile or business applications. Mobile application could have more
commercial value as compare to education such as e-learning. This could boost up the value of Topic
Maps.
In summary, Topic Maps could still “survive” or in use for coming more years. However, the usage of
Topic Maps might foresee to be low after having analyzed the result from this study. This might be
because Topic Maps is still an immature technology or Topic Maps is started losing out to other

64
similar technology such as RDF. From the academic point of view, the absence of Topic Maps specific
conference and journal could bring down the study on Topic Maps tremendously.
65
References
Ahmed, K. (2000). Topic Maps for repositories. XML Europe. Presented at the XML Europe 2000, Paris, France. Retrieved from http://gcc.uni-paderborn.de/www/wi/wi2/wi2_lit.nsf/94c2e6f98cf9af83c1256bc900524c42/310c856ae3f4cacd4125698b002e8927/$FILE/s29-04%20%28Topic%20Maps%20for%20repositories%29.pdf
Archambault, É., & Gagné, É. V. (2004). The Use of Bibliometrics in the Social Sciences and Humanities. Quebec, Canada. Retrieved from http://www.science-metrix.com/pdf/SM_2004_008_SSHRC_Bibliometrics_Social_Science.pdf
Biezunski, M., Newcomb, S., & Bryan, M. (2006). ISO/IEC JTC1/SC34 N323: Guide to the topic map standards. Retrieved April 10, 2012, from http://www1.y12.doe.gov/capabilities/sgml/sc34/document/0323.htm
Chen, K., & Guan, J. (2011). A bibliometric investigation of research performance in emerging nanobiopharmaceuticals. Journal of Informetrics, 5(2), 233–247. doi:10.1016/j.joi.2010.10.007
Chuang, K.-Y., Chuang, Y.-C., Ho, M., & Ho, Y.-S. (2011). Bibliometric analysis of public health research in Africa: The overall trend and regional comparisons. South African Journal of Science, 107(5/6). doi:10.4102/sajs.v107i5/6.309
Cobo, M. J., Lopez Herrera, A. G., Herrera-Viedma, E., & Herrera, F. (2011). Science mapping software tools: Review, analysis, and cooperative study among tools. J. Am. Soc. Inf. Sci. Technol., 62(7), 1382–1402. doi:10.1002/asi.21525
Cunningham, S. J., & Dillon, S. M. (1996). Authorship patterns in information systems. Scientometrics, 39(1), 19–27. doi:10.1007/BF02457428
Della Mea, V. (2011). 25 years of telepathology research: a bibliometric analysis. Diagnostic Pathology, 6 Suppl 1, S26. doi:10.1186/1746-1596-6-S1-S26
Egghe, L., & Rousseau, R. (1990). Introduction to Informetrics : quantitative methods in library, documentation and information science. Elsevier Science Publishers.
Estrada, L. M. M. (2009). Topic Maps and library and information science : an exploratory study of Topic Maps principles from a Knowledge and Information Organization perspective.
Fortnow, L. (2009). Time for computer science to grow up. Comm. ACM. Fosmire, M. (2001). Physics Conference Proceedings and the Electronic Environment -- An
Investigation of New Dissemination Patterns. Collection Management, 26(1), 25–33. Fowler, J., & Aksnes, D. (2007). Does self-citation pay? Scientometrics, 72(3), 427–437.
doi:10.1007/s11192-007-1777-2 Franceschet, M. (2010). The role of conference publications in CS. Commun. ACM, 53(12), 129–132.
doi:10.1145/1859204.1859234 Fu, H., Ho, Y., Sui, Y., & Li, Z. (2010). A bibliometric analysis of solid waste research during the period
1993-2008. Waste Management (New York, N.Y.), 30(12), 2410–2417. doi:10.1016/j.wasman.2010.06.008
Garshol, L. M. (2001). Topic maps, rdf, daml, oil : a comparison. Retrieved from http://www.ontopia.net/topicmaps/materials/tmrdfoildaml.html
Garshol, L. M. (2007). Topic maps in content management: the rise of the ITMS. Accessed on 10th November.
Garshol, L. M. (2002). What are Topic Maps. Retrieved from http://www.xml.com/lpt/a/2002/09/11/topicmaps.html
Garshol, L M. (2004). Metadata? Thesauri? Taxonomies? Topic maps! Making sense of it all. Journal of Information Science, 30(4), 378–391.
Garshol, L. M, & Moore, G. (2008). Topic Maps — Data Model. Retrieved April 10, 2012, from http://www.isotopicmaps.org/sam/sam-model/
66
Garshol, L.M. (2003). Living with topic maps and RDF. Online only, 13. Retrieved from http://www.ontopia.net/topicmaps/materials/tmrdf.html
Grønmo, G. O. (2003). Automagic topic maps. Retrieved April, 26. Retrieve from http://www.ontopia.net/topicmaps/materials/automagic.html
Huang, L. (2008). Study on prospect of emerging technology commercialization based on bibliometrics analysis. Management of Innovation and Technology, 2008. ICMIT 2008. 4th IEEE International Conference on (pp. 29 –33). doi:10.1109/ICMIT.2008.4654332
ISO/IEC JTC1/SC34/WG3. (2008). CD 13250-1, Information technology — Topic Maps — Part 1: Overview and Basic Concepts. Retrieved April 10, 2012, from http://www.itscj.ipsj.or.jp/sc34/open/1045.htm#d0e426
Jan, R. (2009). Citation Analysis of Library Trends. Webology, 6(1). KTweb. (2003). KTweb knowledge technology fact sheet - topic maps. Digital Media Resource. Kumara, A., Prakasan, E. R., Mohan, L., Kademani, B. S., & Kumar, V. (2009). Bibliometric and
Scientometric Studies in Physics and Engineering: Recent Ten Years Analysis. Retrieved March 14, 2012, from http://eprints.rclis.org/handle/10760/14829#.T2C5J7SwV3o
Le Grand, B., & De Paris, L. I. (2000). Topic Maps Visualization, 49–62. Li, Zhang, Y., Wang, X., & Ho, Y.-S. (2009). Bibliometric Analysis of Atmospheric Simulation Trends in
Meteorology and Atmospheric Science Journals. Croatica Chemica Acta, 82(3), 695–705. doi:Article
Liu, X., Zhang, L., & Hong, S. (2011). Global biodiversity research during 1900–2009: a bibliometric analysis. Biodiversity and Conservation, 20(4), 807–826.
Lukkari, E. (2011). Working Capital Management: a Bibliometric Study. Master's thesis, Lappeenranta University of Technology, Industrial Management, Lappeenranta, Finland.
Lundberg, J. (2006). Bibliometrics as a research assessment tool–impact beyond the impact factor. Dep of Learning, informatics, managment and ethics. Stockholm, Karolinska Institutet.
Mao, N., Wang, M.-H., & Ho, Y.-S. (2010). A Bibliometric Study of the Trend in Articles Related to Risk Assessment Published in Science Citation Index. Human and Ecological Risk Assessment An International Journal, 16(4), 801–824. doi:10.1080/10807039.2010.501248
Moppett, I. K., & Hardman, J. G. (2011). Bibliometrics of Anaesthesia Researchers in the UK. British Journal of Anaesthesia, 107(3), 351–356. doi:10.1093/bja/aer124
Park, J., & Hunting, S. (2002). XML Topic Maps: Creating and Using Topic Maps for the Web (1st ed., p. 640). Addison-Wesley Professional.
Patterson, D., Snyder, L., & Ullman, J. (1999). Evaluating Computer Scientists and Engineers For Promotion and Tenure. Computing Research News.
Pepper, Steve. (1999). Navigating haystacks and discovering needles: introducing the new topic map standard. Markup Language, 1(4), 47–74. doi:10.1162/109966299760283201
Pepper, S. (1999). Euler, Topic Maps, and Revolution. Proceedings of XML Europe, 99. Pepper, Steve. (2000). The TAO of Topic Maps. Knowledge Creation Diffusion Utilization,
(02/02/2004), 1–21. Pepper, Steve. (2002). Ten theses on Topic Maps and RDF. Ontopia,< http://www. ontopia.
net/topicmaps/materials/rdf. html>, Accessed, 23(08), 2003. Pepper, S., & Moore, G. (2001). XML topic maps (XTM) 1.0. TopicMaps. Org Specification xtm1-
20010806. Pepper, S., & Moore, G. (2010). Topic maps. Encyclopedia of Library and Information Sciences. New
York, NY : Taylor and Francis. Pepper, Steve, & Garshol, L. M. (2002). The XML Papers : Lessons on Applying Topic Maps.
Proceedings of XML 2002, (Iso 8879), 1–33. Pradhan, P., Panda, S., & Chandrakar, R. (2011). Authorship Pattern and Degree of Collaboration in
Indian Chemistry Literature. INFLIBNET Centre. Presutti, V., Garshol, L. M., Vitali, F., & Gessa, N. (2005). Towards the definition of guidelines for RDF
and Topic Maps interoperability. Proc. Of the 5th International Workshop on Knowledge
67
Markup and Semantic annotation (SemAnnot 2005) located at the 4rd International Semantic Web.
Rehn, C., & Kronman, U. (2008). Bibliometric handbook for Karolinska Institutet. Huddinge: Karolinska Institutet.
Rosas, S. R., Kagan, J. M., Schouten, J. T., Slack, P. A., & Trochim, W. M. K. (2011). Evaluating Research and Impact: A Bibliometric Analysis of Research by the NIH/NIAID HIV/AIDS Clinical Trials Networks. PLoS ONE, 6(3), 12. doi:10.1371/journal.pone.0017428
Sammarco, P. W. (2008). AS I SEE IT Journal visibility , self-citation , and reference limits : influences on Impact Factor and author performance review. Ethics in Science and Environmental Politics, 8, 121–125. doi:10.3354/esep00095
Sigma Scan 2.0. (2011). Growth of Chinese Science and Technology · Sigma Scan. Retrieved May 4, 2012, from http://www.sigmascan.org/Live/Issue/ViewIssue.aspx?IssueID=456&Title=Growth-of-Chinese-Science-and-Technology
Sun, J., Wang, M.-H., & Ho, Y.-S. (2012). A historical review and bibliometric analysis of research on estuary pollution. Marine Pollution Bulletin, 64(1), 13–21. doi:10.1016/j.marpolbul.2011.10.034
Thornley, C. V., McLoughlin, S. J., Johnson, A. C., & Smeaton, A. F. (2011). A Bibliometric Study of Video Retrieval Evaluation Benchmarking (TRECVid): A Methodological Analysis. Journal of Information Science, 37(6), 577–593. doi:10.1177/0165551511420032
Traynor, M. (2011). Bibliometrics as politics: the case of emerging disciplines. International Nursing Review, 58(1), 26–27. doi:10.1111/j.1466-7657.2010.00874.x
Ugolini, D., Neri, M., Casilli, C., Ceppi, M., Canessa, P. A., Ivaldi, G. P., Paganuzzi, M., et al. (2010). A bibliometric analysis of scientific production in mesothelioma research. Lung Cancer (Amsterdam, Netherlands), 70(2), 129–135. doi:10.1016/j.lungcan.2010.01.013
Vardi, M. Y. (2009). Conferences vs. journals in computing research. Communications of the ACM, 52(5), 5. doi:10.1145/1506409.1506410
Wrightson, A. (2001a). Seriously Capable Topic Maps. Ontopia AS. Wrightson, A. (2001b). Topic Maps and Knowledge Representation. Ontopia AS. Zhou, P., & Leydesdorff, L. (2006). The emergence of China as a leading nation in science. Research
Policy, 35(1), 83–104. Zhu, Q., & Willett, P. (2011). Bibliometric analysis of Chinese superconductivity research, 1986-2007.
Aslib Proceedings, 63(1), 101–119. doi:10.1108/00012531111103803
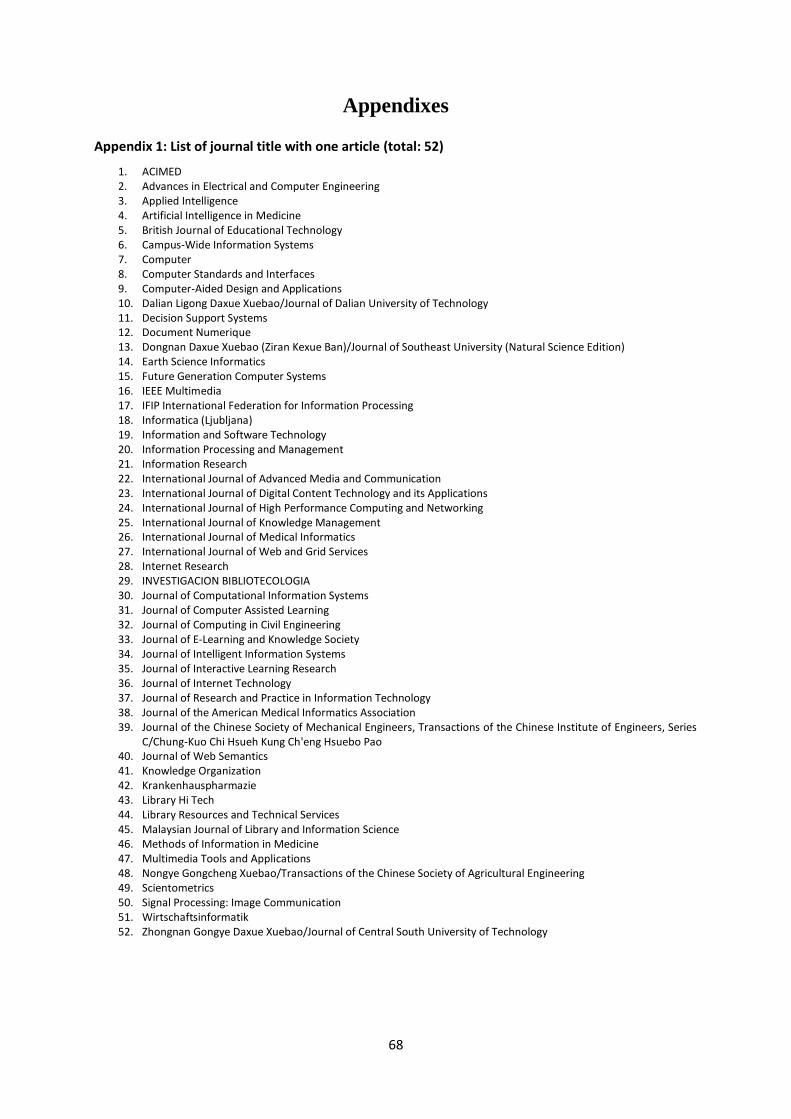
68
Appendixes
Appendix 1: List of journal title with one article (total: 52)
1. ACIMED 2. Advances in Electrical and Computer Engineering 3. Applied Intelligence 4. Artificial Intelligence in Medicine 5. British Journal of Educational Technology 6. Campus-Wide Information Systems 7. Computer 8. Computer Standards and Interfaces 9. Computer-Aided Design and Applications 10. Dalian Ligong Daxue Xuebao/Journal of Dalian University of Technology 11. Decision Support Systems 12. Document Numerique 13. Dongnan Daxue Xuebao (Ziran Kexue Ban)/Journal of Southeast University (Natural Science Edition) 14. Earth Science Informatics 15. Future Generation Computer Systems 16. IEEE Multimedia 17. IFIP International Federation for Information Processing 18. Informatica (Ljubljana) 19. Information and Software Technology 20. Information Processing and Management 21. Information Research 22. International Journal of Advanced Media and Communication 23. International Journal of Digital Content Technology and its Applications 24. International Journal of High Performance Computing and Networking 25. International Journal of Knowledge Management 26. International Journal of Medical Informatics 27. International Journal of Web and Grid Services 28. Internet Research 29. INVESTIGACION BIBLIOTECOLOGIA 30. Journal of Computational Information Systems 31. Journal of Computer Assisted Learning 32. Journal of Computing in Civil Engineering 33. Journal of E-Learning and Knowledge Society 34. Journal of Intelligent Information Systems 35. Journal of Interactive Learning Research 36. Journal of Internet Technology 37. Journal of Research and Practice in Information Technology 38. Journal of the American Medical Informatics Association 39. Journal of the Chinese Society of Mechanical Engineers, Transactions of the Chinese Institute of Engineers, Series
C/Chung-Kuo Chi Hsueh Kung Ch'eng Hsuebo Pao 40. Journal of Web Semantics 41. Knowledge Organization 42. Krankenhauspharmazie 43. Library Hi Tech 44. Library Resources and Technical Services 45. Malaysian Journal of Library and Information Science 46. Methods of Information in Medicine 47. Multimedia Tools and Applications 48. Nongye Gongcheng Xuebao/Transactions of the Chinese Society of Agricultural Engineering 49. Scientometrics 50. Signal Processing: Image Communication 51. Wirtschaftsinformatik 52. Zhongnan Gongye Daxue Xuebao/Journal of Central South University of Technology
69
Appendix 2: List of conference with one or two papers
Conference with one paper (Total: 118) 1. ACM International Conference on Design of Communication, SIGDOC 2008 2. ACM International Conference on Information and Knowledge Management, CIKM 2009 3. Annual Meeting of the American-Society-for-Information-Science-and-Technology 4. Annual SIGCSE Conference on Innovation and Technology in Computer Science Education 5. Archiving 2008 6. ASEE Annual Conference and Exposition 7. Astronomical Data Analysis 8. Bangalore Annual Compute Conference, COMPUTE'09 9. Chinese Control Conference, CCC 10. Conference on Technologies and Applications of Artificial Intelligence, TAAI 2010 11. Data Warehousing and Knowledge Discovery, Dawak 2003 12. EUC 2005 Workshops: UISW, NCUS, SecUbiq, USN, and TAUES 13. European Conference on Cognitive Ergonomics, ECCE 2011 14. European Conference on IR Research (ECIR) 15. European Conference on Research and Advanced Technology for Digital Libraries, ECDL 2008 16. European Conference on Technology Enhanced Learning, EC-TEL 2008 17. IASTED International Conference on Internet and Multimedia Systems and Applications, IMSA 2005 18. IEEE Congress on Evolutionary Computation, CEC 2008 19. IEEE International Computer Software and Applications Conference, COMPSAC 2009 20. IEEE International Conference on Communications Technology and Applications, IEEE ICCTA2009 21. IEEE International Conference on Computer Systems and Applications, 2006 22. IEEE International Conference on e-Science, e-Science 2009 23. IEEE International Conference on Information Reuse and Integration, IRI - 2005 24. IEEE International Conference on Intelligent Computing and Intelligent Systems, ICIS 2009 25. IEEE International Conference on Intelligent Data Acquisition and Advanced Computing Systems: Technology and Applications,
IDAACS'2011 26. IEEE International Conference on Internet Multimedia Services Architecture and Applications, IMSAA 2009 27. IEEE International Conference on Management of Innovation and Technology, ICMIT2010 28. IEEE International Conference on Network Infrastructure and Digital Content, IC-NIDC 2010 29. IEEE International Enterprise Distributed Object Computing Conference Workshops, EDOCW2006 30. IEEE International Geoscience and Remote Sensing Symposium, IGARSS 2005 31. IEEE International Symposium on Applied Computational Intelligence and Informatics, SACI 2011 32. IEEE Joint Conference on E-Commerce Technology and the 5th Enterprise Computing, E-Commerce and E-Services, CEC 2008
and EEE 2008 33. IEEE Network Operations and Management Symposium Workshops - NOMS 08 34. IEEE Symposium on Computers and Communications, ISCC 2010 35. IEEE Systems Readines Technology Conference -(AUTOTESTCON 2002) 36. IEEE Workshop on Computational Intelligence for Visual Intelligence, CIVI 2009 37. IEEE/ACIS International Conference on Computer and Information Science, ICIS 2006. In conjunction with 1st IEEE/ACIS
International Workshop on Component-Based Software Engineering, Software Architecture and Reuse, COMSAR 2006 38. IEEE/IFIP Network Operations and Management Symposium, NOMS 2010 39. IET International Conference on Frontier Computing. Theory, Technologies and Applications 40. IFIP International Conference on Computer and Computing Technologies in Agriculture and the 4th Symposium on Development
of Rural Information, CCTA 2010 41. IITA International Conference on Nanotechnology and Computer Engineering, CNCE 2010 42. Innovations in Information Technology, IIT 43. Int. Conf. on Applied, Numerical and Computational Mathematics, ICANCM'11, Int. Conf. on Computers, Digital Communications
and Computing, ICDCC'11, Int. Conference on Applied Social Science, Social Economy and Digital Convergence, IC-ASSSE-DC'11 44. International ACM Workshop on Traceability of Emerging Forms of Software Engineering, TEFSE 2005, Held in Conjunction with
the 20th IEEE/ACM International Conference on Automated Software Engineering, ASE 2005 45. International Conference on Adaptive Hypermedia and Adaptive Web-Based Systems, AH 2006 46. International Conference on Advanced Computer Science and Information Technology, AST 2011 47. International Conference on Advanced Learning Technologies, ICALT 2006 48. International Conference on Advances in Computer Science, Environment, Ecoinformatics, and Education, CSEE 2011 49. International Conference on Advances in Product Development and Reliability, PDR'2010 50. International Conference on Autonomous Infrastructure, Management and Security, AIMS 2009 51. International Conference on Complex, Intelligent and Software Intensive Systems, CISIS 2011 52. International Conference on Computational Intelligence and Software Engineering, CiSE 2009 53. International Conference on Computational Intelligence for Modelling, Control and Automation, Jointly with IAWTIC 2006:
International Conference on Intelligent Agents Web Technologies and International Commerce 54. International Conference on Computational Science and Its Applications - ICCSA 2005 55. International Conference on Computational Science, ICCS 2007 56. International Conference on Computer Distributed Control and Intelligent Environmental Monitoring, CDCIEM 2011 57. International Conference on Computer Research and Development, ICCRD 2011 58. International Conference on Computer, Mechatronics, Control and Electronic Engineering, CMCE 2010 59. International Conference on Computers and Advanced Technology in Education 60. International Conference on Computing, CIC 2006 61. International Conference on Computing, Information and Control, ICCIC 2011
70
62. International Conference on Convergent Information Technology, ICCIT 07 63. International Conference on Digital Information and Communication Technology and Its Applications, DICTAP 2011 64. International Conference on Education and Management Technology, ICEMT 2010 65. International Conference on Education Technology and Computer, ICETC 2010 66. International Conference on Electric and Electronics, EEIC 2011 67. International Conference on Electrical and Control Engineering, ICECE 2010 68. International Conference on Environmental Science and Information Application Technology, ESIAT 2009 69. International Conference on Extending Database Technology 70. International Conference on Future Information Technology, FutureTech 2011 71. International Conference on Fuzzy Systems and Knowledge Discovery, FSKD 2010 72. International Conference on Grid and Cooperative Computing, GCC 2008 73. International Conference on Hybrid Learning and Education, ICHL 2009 74. International Conference on Industrial, Engineering and Other Applications of Applied Intelligent Systems, IEA/AIE 2006 75. International Conference on Information Integration and Web-based Applications and Services, iiWAS 2008 76. International Conference on Information Sciences and Interaction Sciences, ICIS 2010 77. International Conference on Information Technology and Applications, ICITA 2005 78. International Conference on Information Technology Based Higher Education and Training, ITHET 2004 79. International Conference on Information Technology: New Generations, ITNG 2011 80. International Conference on Intelligent Computation Technology and Automation, ICICTA 2011 81. International Conference on Intelligent Systems Design and Applications, ISDA 2008 82. International Conference on Knowledge Engineering and Ontology Development, KEOD 2010 83. International Conference on Knowledge Management and Knowledge Technologies, i-KNOW 2011 84. International Conference on Management and Service Science, MASS 2011 85. International Conference on Management Science and Engineering, ICMSE'06 86. International Conference on Mechanic Automation and Control Engineering, MACE2010 87. International Conference on Metadata and Semantic Research, MTSR 2010 88. International Conference on Mobile Ubiquitous Computing, Systems, Services and Technologies, UBICOMM 2007 89. International Conference on Model and Data Engineering, MEDI 2011 90. International Conference on Programming Languages and Compilers, PLC'05 91. International Conference on Promotion and Innovation with New Technologies in Engineering Education, FINTDI 2011 92. International Conference on Service Systems and Service Management 93. International Conference on Smart Manufacturing Application, ICSMA 2008 94. International Conference on Smart Materials and Intelligent Systems 2010, SMIS 2010 95. International Conference on Software Engineering and Applications 96. International Conference on Software Engineering Research and Applications, SERA 2004 97. International Conference on Technologies for E-Learning and Digital Entertainment, Edutainment 2006 98. International Conference on Technology for Education, T4E 2011 99. International Conference on User Modeling, Adaptation and Personalization, UMAP 2010 100. International Florida Artificial Intelligence Research Society, FLAIRS - 24 101. International Forum on Information Technology and Applications, IFITA 2009 102. International Geoscience and Remote Sensing Symposium, IGARSS 2011 103. International IEEE Conference Intelligent Systems, IS 2008 104. International Symposium on Intelligent Systems and Informatics, SISY 2011 105. International Workshop on Data Engineering for Wireless and Mobile Access, MobiDE 2003 106. International Workshop on Database and Expert Systems Applications 107. International Workshop on Databases in Networked Information Systems, DNIS 2007 108. International Workshop on Web Information and Data Management, held in conjunction with the ACM 15th Conference on
Information and Knowledge Management, CIKM 2006 109. Joint Conference on Information Sciences, JCIS 2006 110. OTM Workshops 2004 111. Pacific Asia Conference on Knowledge Discovery and Data Mining, PAKDD 2008 112. TUG 2004 113. Virtual Observatories 114. VLDB Workshop on Ontologies-Based Databases and Information Systems, ODBIS 2006 - 32nd International Conference on Very
Large Data Bases 115. Workshop on Blended Learning, WBL 2008 116. Workshop on Intelligent Information Technology Application, IITA 2007 117. WSEAS Int.Conf. on DATA NETWORKS, COMMUNICATIONS and COMPUTERS 118. WSEAS International Conference on Applied Computer Science, ACS '09
71
Conference with two papers (Total: 23) 1. AAAI Workshop 2. ACM Symposium on Document Engineering 3. IEEE International Symposium on IT in Medicine and Education, ITME 4. IEEE Workshop on Intelligent Data Acquisition and Advanced Computing Systems: Technology and Applications, IDAACS 5. IEEE/WIC/ACM International Conference on Web Intelligence 6. IEEE/WIC/ACM International Conference on Web Intelligence and Intelligent Agent Technology 7. International Astronautical Congress 2010, IAC 2010 8. International Conference on Advanced Information Networking and Applications 9. International Conference on Asian Digital Libraries ICADL 10. International Conference on Computer Science and Software Engineering, CSSE 2008 11. International Conference on Computer Supported Cooperative Work in Design, CSCWD 2009 12. International Conference on Conceptual Structures, ICCS 13. International Conference on Convergence and Hybrid Information Technology 14. International Conference on Digital Information Management, ICDIM 15. International Conference on Information and Knowledge Engineering 16. International Conference on Information Science and Applications, ICISA 2011 17. International Conference on Information Science and Engineering, ICISE 18. International Conference on Intelligent Computing, ICIC 19. International Conference on Knowledge-Based and Intelligent Information and Engineering Systems, KES 20. International Conference on Web Engineering 21. International Symposium on Knowledge Acquisition and Modeling, KAM 22. International Symposium on Methodologies for Intelligent Systems 23. International Workshop on Principles and Practice of Semantic Web Reasoning, PPSWR 2006