exploration-exploitation trade-off features a saltatory search behaviour
TRANSCRIPT

rsif.royalsocietypublishing.org
ResearchCite this article: Volchenkov D, Helbach J,
Tscherepanow M, Kuhnel S. 2013 Exploration –
exploitation trade-off features a saltatory
search behaviour. J R Soc Interface 10:
20130352.
http://dx.doi.org/10.1098/rsif.2013.0352
Received: 17 April 2013
Accepted: 29 May 2013
Subject Areas:environmental science
Keywords:Levy foraging hypothesis, exploration –
exploitation trade-off, virtual environments
Author for correspondence:Dimitri Volchenkov
e-mail: [email protected]
†Present address: IDIADA Fahrzeugtechnik
GmbH, Manfred-Hochstatter-Straße 2, 85055
Ingolstadt-Etting, Germany.‡Present address: Beckhoff Automation GmbH,
Hulshorstweg 20, 33415 Verl, Germany.
& 2013 The Author(s) Published by the Royal Society. All rights reserved.
Exploration – exploitation trade-offfeatures a saltatory search behaviour
Dimitri Volchenkov1, Jonathan Helbach2,†, Marko Tscherepanow2,‡
and Sina Kuhnel3
1Faculty of Physics, 2Technical Faculty, and 3Physiological Psychology, Bielefeld University,Universitaetsstrasse 25, 33615 Bielefeld, Germany
Searching experiments conducted in different virtual environments over a
gender-balanced group of people revealed a gender irrelevant scale-free
spread of searching activity on large spatio-temporal scales. We have
suggested and solved analytically a simple statistical model of the coherent-
noise type describing the exploration–exploitation trade-off in humans
(‘should I stay’ or ‘should I go’). The model exhibits a variety of saltatory beha-
viours, ranging from Levy flights occurring under uncertainty to Brownian
walks performed by a treasure hunter confident of the eventual success.
1. IntroductionLevy foraging hypothesis [1–3] suggests that a saltatory search composed of
consecutive displacement lengths l drawn from a power-law distribution,
PðlÞ � l�m; ð1:1Þ
with the scaling exponent m approaching the theoretically optimal value m ¼ 2
would maximize a forager’s chance to locate sparsely and randomly distributed
prey [4–6] and therefore presents an evolutionary beneficial alternative strategy
to spatially intensive search. Foraging movement patterns that fit closely to walks
(1.1) known as Levy flights [7] were identified in many living spieces ranging
from micro-organisms to humans [4–6,8–20], although the reported scaling
exponents varied substantially for different animals, in different environmental
contexts. The rate of flight lengths decay in the population data is typically
described by a power law with an exponential cut-off revealing that an exponen-
tial decay rate dominates for extremely long travels [13,21]. It was further
suggested [22,23] that while the distribution of displacements for the population
aggregate appears to show a fat tail, the individual’s bout distributions do not.
Furthermore, when movement lengths within tracks fit a Brownian walk
(being exponentially distributed), but differ in the parameter of this exponential
distribution, the power law with exponential cut-off in the population data
would result from a superposition of these exponential distributions [23,24]. The
detailed statistically robust analysis of foraging trajectories of albatrosses [25] pro-
vided strong support for the individual character of search patterns: some
trajectories were well approximated by truncated Levy flights (1.1), others fitted
Brownian movement patterns, whereas a significant portion of trajectories were
not fitted by either distribution, as having both Levy and Brownian features.
Further progress in understanding of search behaviour calls for a model of a
feasible biological mechanism that allows animals and humans (i) reproducing
a variety of statistically different movement patterns, without demanding and
tedious computations, and (ii) spontaneous switching between them in dif-
ferent environments. In our paper, we propose such a model and solve it
analytically (§4).
The virtual environment (VE) provides a simplified way to see and experi-
ence the real world, supporting the sense of spatial presence via virtual
locomotion, rendering a clear sense of navigation and allowing for interactions
with objects through a user interface [26]. Not surprisingly, VE gained wide-
spread use in recent years as a tool for studying human behaviour,
rsif.royalsocietypublishing.orgJR
SocInterface10:20130352
2
maintaining the capacity to create unique experimental scen-arios under tightly controlled stimulus conditions. A major
problem for users of VE is maintaining knowledge of their
location and orientation while they move through space,
essentially when the whole path cannot be viewed at once
but occluded by objects in the environment [27]. Most of
human spatial abilities (such as navigating a large-scale
space and identifying a place) have evolved in natural environ-
ments over a very long time, using properties present in nature
as cues for spatial orientation and wayfinding [28]. However,
many of the natural body-based self-motion cues are absent
in VE, causing systematic spatial orientation problems in sub-
jects, and therefore calling for the instant invention of new
adaptive strategies to move through VE under reduced
multisensory conditions. The analysis of adaptive strategies
instantaneously evolving in VE accentuates the key biological
mechanisms of searching behaviour more vividly than the
analysis of empirical data recorded in situ. Furthermore, in
VE, we can study the mobility patterns of humans with extre-
mely high resolution, up to the scales of millimetres and
milliseconds, obtaining by far the most accurate data virtually
comparable to either the scales of a few meters/tenth of
seconds, kilometres per hours (in GPS tracking data; [19]), or
the scale of a few thousand kilometres per week (in banknote
travel patterns; [11]) discussed in the previous studies.
In order to understand the adaptive movement strategy
and to clarify the role of environmental structure in searching
and browsing, we conducted a treasure-hunting experiment
(§2.1) with a gender-balanced group of participants (§2.3), in
the different office VE (§2.2). People participated in our study
had to decide how to proceed amid uncertainty by solving
the exploration–exploitation dilemma (‘should I stay’ or ‘should
I go’) [29]. On the one hand, there was an option to continue
searching in the nearest neighbourhood (exploitation), in the
hope to get rewarded beyond the next door. Alternatively, sub-
jects could explore the parts of environment they had never
been to. The actual trajectory of search resulted from a perma-
nent balance between exploitation and exploration confronted
at all levels of behaviour across all timescales. We show that
balancing exploitation and exploration can be responsible for
the statistically variable searching behaviour, ranging from
Levy flights to Brownian walks. It is worth a mention that
the setting of our experiments was inconsistent with the
assumptions of Gittins that presented an optimal strategy for
trading off exploration and exploitation [30]. The probability
of delivering a reward was not fixed in our case; subjects did
not discount the value of each reward exponentially as a func-
tion of when it was acquired, and eventually the time of our
experiment was essentially limited (in contrast to an infinite
time horizon in the Gittins’ approach [30]). Subjects in our
study acted amid uncertainty, so that any precursive calcu-
lation of an optimal strategy was impossible for them.
Gender is often reported as a decisive factor in spatial cog-
nition research [31,32]. A review of gender differences in spatial
ability in real-world situations can be found in [33]. In this
paper, we do not discuss the gender mobility differences
observed in our experiments, leaving a detailed report on
that for a forthcoming publication. Based on the results of the
statistical data analysis, we discuss the role of scanning and
reorientations in a compensation of information deficiency
while moving through VE (§3.1), and on the experimentally
observed superdiffusive spread of searching activity on large
spatio-temporal scales (§3.2).
In §4, we have formulated a mathematical model of
decision-making when no precise information on a possibility
of rewards is available. The model can be solved analytically
for some important cases (see §4.3) and helps to generate bio-
logically relevant hypothesis about the fundamental process of
decision-making. We conclude in §5.
2. Methods2.1. Experimental design and procedureIn our treasure-searching experiments, every participant was
asked to browse an office VE searching for collectable objects.
For each time frame, the position and heading orientation of
the participant were tracked and subsequently analysed by con-
sidering the collections of displacements and turns as a series of
random events whose spatial and temporal distributions are
assumed to possess certain statistical regularities.
To motivate subjects for searching thoroughly, each found
object was rewarded with an extra 50 cents coin, in addition to
the basis remuneration for participation in the study. Treasure
hunters neither visited a real prototype of the VE model nor fore-
saw its floor plan before participating in the experiment. The
objects of search were big enough, contrast coloured, clearly vis-
ible toys: teddy bears and locomotives. At the beginning of each
trial, a number of toys (10 toys, for the smaller environment, and
15 toys, for the bigger one; see the §2.2 for details) were allocated
to randomly chosen offices, beyond closed doors, one toy per
room. Objects could be found immediately, as soon as the subject
opens the door and enters the room. In order to focus subjects on
the tasks, there was no communication between experimenter
and subject during the experiment.
Before entering the main exploration areas, every partici-
pant was trained in a virtual tutorial room, in order to get used
to stereoscopic imaging of the computer-simulated environment
(two-slightly different images accounting for the interpupillary
distance paired with stereo glasses providing a three-dimensional
display of the environment), to obtain a good command of a
Nintendo Wii remote controller, and to judge their perceived
motions via button presses. Although the search time was not lim-
ited, we have restricted the total number of doors subjects could
open during the experiment (by 10 doors, in the smaller environ-
ment, and by 15 doors, in the bigger one), in order to prevent a
sequential search at each office and to stimulate an exploration
activity in subjects. The experiment ended when the participant
opened 10 (15) doors.
Two AVI video fragments showing the records of the actual
searching experiment from a first-person perspective can be
found online.1
2.2. Virtual environmentsThe virtual models of two office environments existing in the
University of Bielefeld were rendered with the Autodesk 3ds
MAX DESIGN v. 2010 software and then projected for any user
viewpoint onto a wall-wide laboratory screen (4 � 2 m) with
the use of the Barco’s Galaxy NH-12 active stereoscopic three-
dimensional stereo projector. The sense of spatial presence was
in subjects supported in subjects by natural colour reproduc-
tion, extended grey levels and high brightness of the projector.
The control of user viewpoint motion through the VE was
implemented via the Bluetooth connected Wiimote, the primary
controller for Nintendo’s Wii console featured with motion-
sensing capability, which allows the user to manipulate items
on screen via gesture recognition and pointing through the use
of accelerometer and optical sensor technology.
VE model A (figure 1a) exactly reproduced the second
floor of a temporary building (2012) belonging to the Cognitive

9
(a)
(b)
12
142
2
2
18232731
15
18
20
Figure 1. Two models of the office VE were used in the treasure search experiments. The individual spaces of movement are identified with the nodes in thespatial graphs. (a) The VE model A consists of 48 interconnected spaces of movement, with a single central place (the central corridor denoted by the red node)that locates nine steps apart from any randomly chosen node in the spatial graph. (b) The VE model B consists of 68 interconnected spaces of movement and containsa network of well-connected central places (halls and connecting corridors) characterized by the first passage times ranging from 10 to 14 steps. (Online versionin colour.)
rsif.royalsocietypublishing.orgJR
SocInterface10:20130352
3
Interaction Technology-Centre of Excellence (CITEC, Bielefeld
University), and the VE model B (figure 1b) imitated the
ground floor of the future Interactive Intelligent Systems Institute
(Bielefeld University) presently under construction. Both environ-
ments consist of the standard adjacent offices, meeting rooms,
hallways and corridors providing space where people can
move, meet and discuss. Emergency exits and elevators that
exist in the actual buildings were not taken into account in our
experiments. The VE model A consists of 48 interconnected
individual spaces of movement (represented by nodes in the
spatial graph shown in figure 1a), and the VE model B includes
68 interconnected individual spaces of movement (the nodes of
the spatial graph shown in figure 1b).
The spatial structure is important because of its effect
on proximity: greater connectedness of a built environment
generally means more direct routes and thus shorter distances
between possible destinations. Connectedness also affects walk-
ing by expanding the choice of routes, thereby enabling some
duration of reorientation (s)
freq
uenc
y of
obs
erva
tion
0
0.001
0.002
0.003
1 2 3 4 5 6
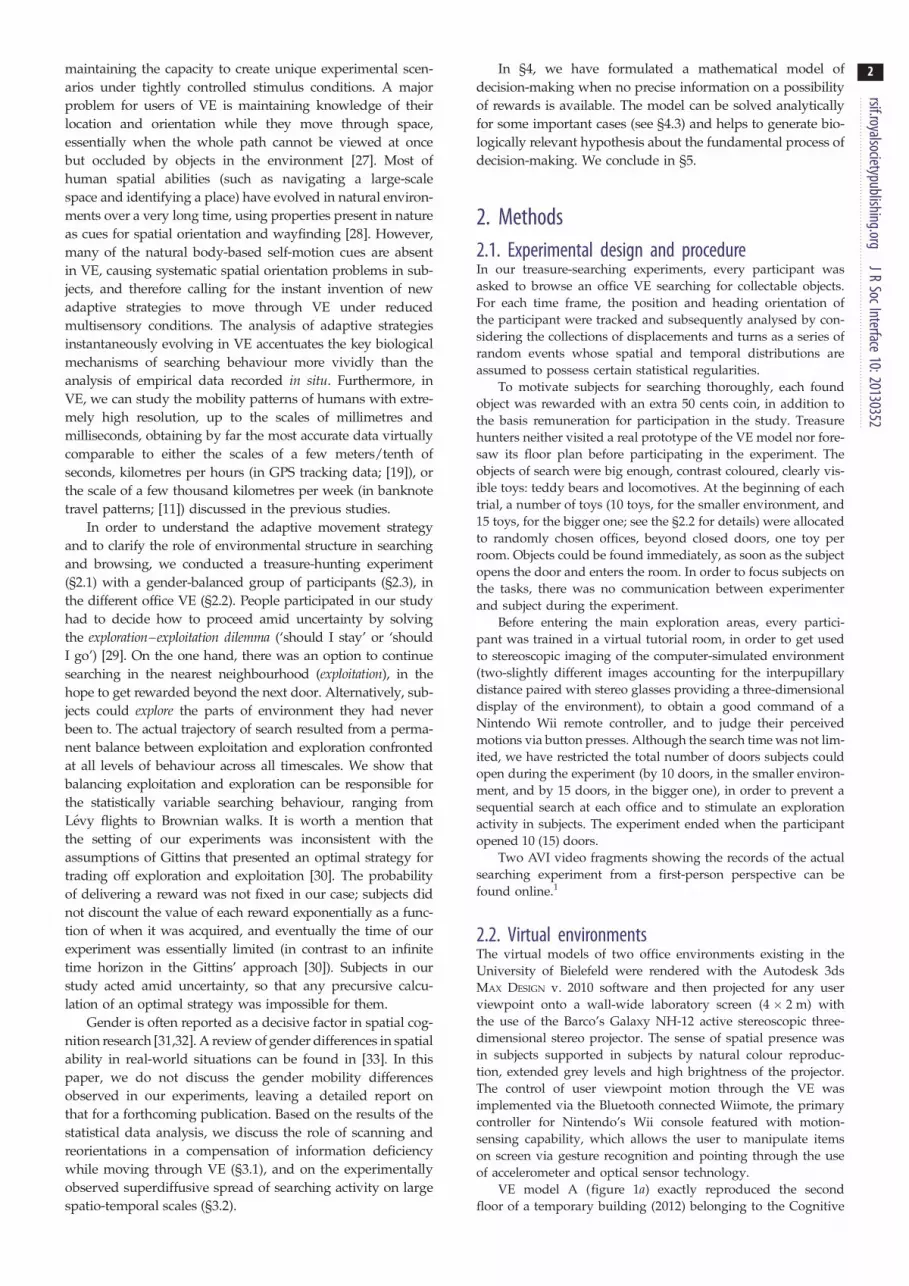
Figure 2. The typical distribution of scanning turns, reorientations andexplorative rotation durations while exploring a VE. The vertical dashedline indicates the duration of turn 1.5 s. (Online version in colour.)
rsif.royalsocietypublishing.orgJR
SocInterface10:20130352
4
variety in routes within the environment. Discovering importantspaces of movement and quantifying differences between
them in a spatial graph of the environment is not easy, because
any two spaces can be related by means of many paths. In
Blanchard & Volchenkov [34], we suggested using the properties
of random walks in order to analyse the structure of spatial
graphs and to spot structural isolation in urban environments.
Each node of the graph can be characterized with respect to
the entire graph structure by the first-passage time, the expected
number of steps required to reach the node for the first time
(without revisiting any intermediate node) starting from any
node of the graph chosen randomly, in accordance with the
stationary distribution of random walks. In built environments,
the first-passage time to a place can be understood as an average
number of elementary wayfinding instructions (such as ‘turn
left/right’, ‘pass by the door’, ‘walk on the corner’, etc.) required
to navigate a wanderer to the place from elsewhere within the
environment. The values of first passage times to the nodes of
the spatial graphs A and B are shown in figure 1 (in colour
online): the central places characterized with the minimal first-
passage times are red, and the secluded places with the
maximal first passage times shown in violet. The spatial struc-
ture of the VE model A analysed by means of the spatial graph
figure 1a is essentially simpler than the structure of model
B. Contrasted to model A, where offices are located along
three sequentially connected corridors providing a single path
between most of possible destinations, the spatial structure of
model B allows for many cyclic trips owing to a network of inter-
connected places and has a number of vantage points from
which a walker could observe the substantial parts of the
environment from different perspectives (see §3.1). The single
central spatial node (the central corridor) in VE model A is
located at nine steps apart from any randomly chosen node in
the spatial graph (figure 1a). VE model B contains a network of
well-connected spaces of movement characterized by the first
passage times ranging from 10 to 14 steps.
2.3. ParticipantsTwo gender-balanced groups of volunteers (82 participants in
total) took part in the controlled searching experiments conducted
in the office VE shown in figure 1a,b. Although participants
(mostly university students, with the mean age of 24.2 years and
a s.d. of 3.7 years) were recruited personally and through adver-
tisements at the University of Bielefeld. None of them had ever
been familiar with the actual building prototyping the virtual
models A and B. Prior to testing, all adult participants and parents
of children younger than 16 years old gave their informed writ-
ten consent for participation in the study. Participation in the
study was voluntary, and participants could revoke their partici-
pation consent and quit at any time and for any reason. The
standard provisions for data protection were adhered: all test
results were kept confidential. All individual data were managed
and processed anonymously, which eliminated any possibility of
identification of participants.
3. Results and discussions3.1. Scanning turns, reorientations and explorative
rotations in virtual environmentsSelf-motion through the VE suffers from a lack of many natu-
ral body-based cues. Natural methods of visual exploration are
also restricted in VE to that experienced through the display
representing only a limited field of view, suffering from the
degradation of sensory cues owing to device latencies and
blocking out all surrounding visual input. It was concluded
from various experiments that the optic flow without proprio-
ception, at least for the limited field of view of the virtual
display system, appears to be not effective for the updating
of heading direction [35], and even when physical motion
cues from free walking are included this is not necessarily
sufficient to enable good spatial orientation in VE [36].
Perhaps owing to systematic spatial orientation problems
occurring in VE compared with real-world situations,
most of the subjects participated in our study permanently
performed fast scanning turns (of 200–300 ms) by quick
altering pressing on the left and right buttons of the remote
controller, each time causing them to turn a greater or
lesser angle. Probably such a movement routine played an
important role for the proper self-motion perception as com-
pensating information deficiency experienced by subjects
while moving through VE under reduced multisensory con-
ditions. Longer turns (taking about half a second) were
observed when subjects redirected their walk or avoided
obstacles. Eventually the very long, explorative rotations
often including several complete revolutions (each time last-
ing up to a few seconds) occurred after far relocations, at
vantage points, along the borders of two or several vista
spaces, and at intersections of corridors that afford a broader
view of the environment.
The typical distribution of scanning turns, reorientations
and explorative rotation durations while exploring a VE is
presented in figure 2. The areas of adjacent rectangles in the
histogram are equal to the relative frequency of observations
in the duration interval. The total area of the histograms is
normalized to the number of data occurrences. The data
show that the vast majority of all reorientations performed
by subjects were the quick scanning turns, being the essential
part of the adaptive walking routine in VE. The vertical
dashed line in figure 2 stands for the rotation duration of
1.5 s; the locations of the correspondent points, at which par-
ticipants performed longer turns (without translations), are
displayed on the floor plans by the circles (figure 3a,b). The
diameter of a circle is proportionate to a number of long
turns recorded at its central point over all subjects.
Several studies conducted on small animals [14,15,37,38]
suggested that the switch between scanning and reorientation
behaviour in movement patterns of animals that search
emerges from complex mechanic-sensorial responses of ani-
mals to the local environment and could infer the effects of
limited perception and/or a patchy environmental structure.
When exploring patchy resources, animals could adjust

(a) (b)
Figure 3. (a,b) The floor plans of the models A and B with the locations of vantage points (shown by circles), where participants performed reorientations andexplorative turns lasting longer than 1.5 s. The diameter of a circle is proportionate to a number of long turns recorded at its central point. (Online version in colour.)
0.1
1.4
1.2
1.0
500
100
50
10
5
slopesª1.1
A B A B
0.5RMSF of displacements (m)
RM
SF o
f tu
rnin
g du
ratio
n (s
)
1.0 5 10
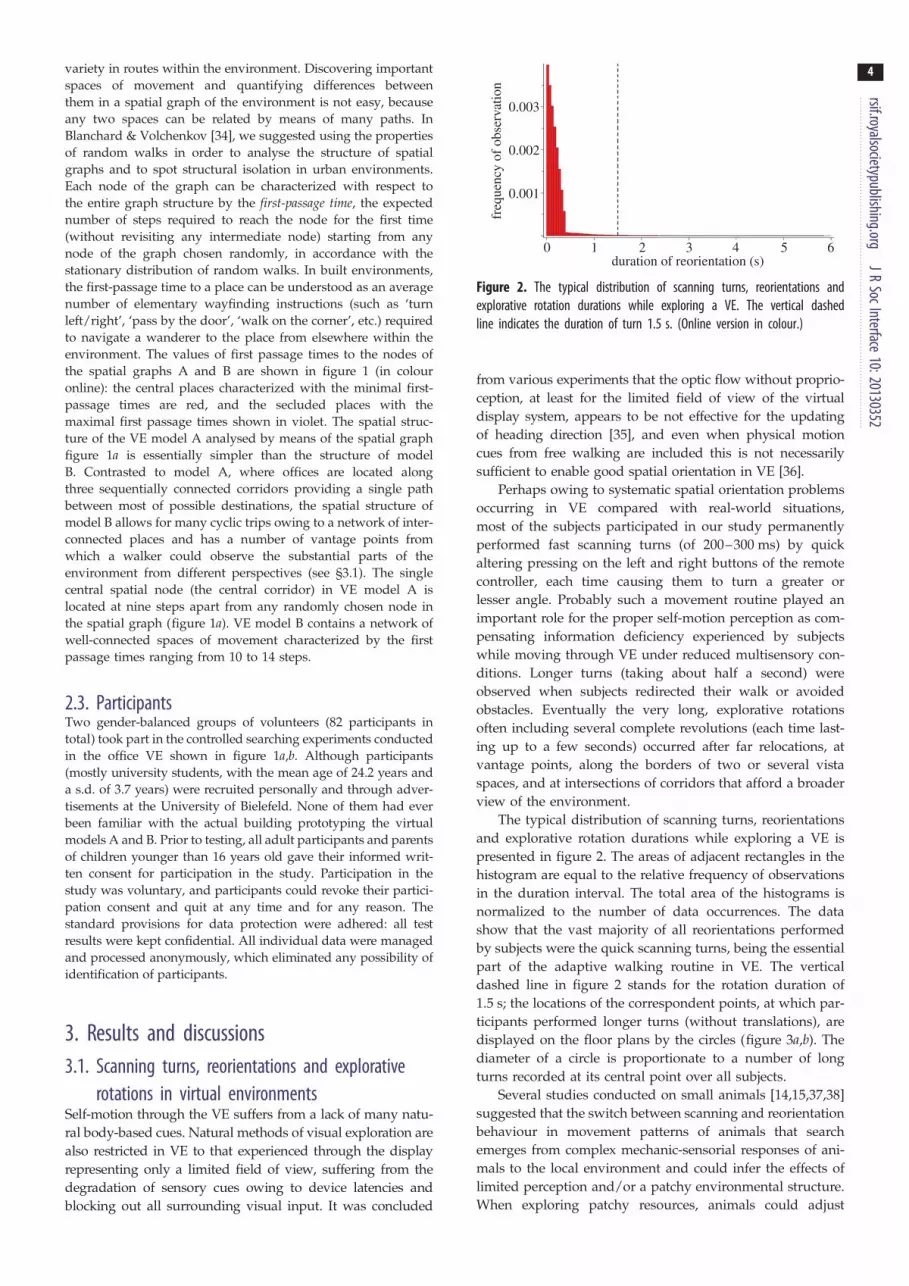
Figure 4. The root mean square fluctuations (RMSFs) of the total turning dur-ations is shown via the RMSF of the net displacement in the log – log scale, forall recorded reorientation points of all subjects, in both VE models. (Online ver-sion in colour.)
rsif.royalsocietypublishing.orgJR
SocInterface10:20130352
5
turning angle distributions, selecting a preferred turning
angle value that would allow organisms to stay within the
patch for a proper amount of time, maximizing the energetic
gain. For example, the zigzag motion of Daphnia appears to
be an optimal strategy for patch exploitation [38]. Therefore,
the distinction between quick scanning turns and a longer
reorientation behaviour is crucial to understand the statistical
patterns of search [1].
Being a part of the travelling routine in VE, quick scanning
turns performed by subjects during the walk induce corre-
lations between the total rotation turning durations and the
net displacements, on relatively small spatio-temporal scales
sensitive to the local structural features of the environment.
After reaching the natural limits of available space of
unobstructed motion or entering a new movement zone, the
subject performs a longer reorientation, perhaps in order to
explore the new environment visually that breaks the corre-
lations. We analysed the data on duration of reorientations of
subjects travelling through both VE models with the use
of the root mean square fluctuations (RMSFs) suitable for
detecting correlations [4,39].
The RMSF of displacements is calculated by
FsðnÞ ¼ffiffiffiffiffiffiffiffiffiffiffiffiffiffiffiffiffiffiffiffiffiffiffiffiffiffiffiffiffiffiffiffiffiffiffiffiffiffiffiffiffiffiffiffiffiffiffikðDSðnÞ2Þl� kDSðnÞl2
q; in which the net displace-
ment of the walker by the nth reorientation is SðnÞ ¼SðnÞ ¼
Pnk¼1 krkþ1 � rkk; rk is the recorded position of the
kth reorientation, DSðnÞ ¼ Sðnþ n0Þ �Sðn0Þ; and the angu-
lar brackets denote averaging over all data points n0 ¼ 1, . . .,
nmax. Similarly, the RMSF of rotation durations is calculated
by FtðnÞ ¼ffiffiffiffiffiffiffiffiffiffiffiffiffiffiffiffiffiffiffiffiffiffiffiffiffiffiffiffiffiffiffiffiffiffiffiffiffiffiffiffiffiffiffiffiffiffikðDTðnÞÞ2l� kDTðnÞl2
q; in which the total
rotation duration of the subject by the nth reorientation is
TðnÞ ¼Pn
k¼1 tk; tk is the duration of the kth reorientation,
DTðnÞ ¼ Tðnþ n0Þ � Tðn0Þ; and the angular brackets again
denote the average over all data points. In figure 4, we juxta-
posed the RMSF of the net displacement and the RMSF of the
total rotation durations, in the log–log scale, for all recorded
reorientations of subjects, separately for VE models A
and B. For both VE models, the graphs show the super
linear slope, d log Ft=d log Fs ffi 1:1; indicating the presence of
a strong positive relation that reinforces the total duration
of quick scanning turns with the increase in the net
displacement of subject. In the long run, the correlations gener-
ated by the fast-scale scanning behaviour vanish, which is
typical for a correlated random walk process [14]. Interestingly,
the ranges of correlations of the RMSF of turning durations and
the RMSF of net displacements in VE models A and B were
different: for VE model A, the correlations exist in the range of
net displacements from 0.1 to 6 m, and from 0.3 to 10 m
for VE model B. Perhaps the difference in the correlation
ranges of the net displacements is due to the different size of
the average space available for unobstructed movements, in
models A and B. It is obvious that such an intensive space

travel time (s)
no. s
ampl
es
00
20
40
60
80
20 40
5
100
no. s
ampl
esdistance between opened doors (m)
50
10
5
1
10 50 100
60
µt–2
µd–2
80 120 160
Figure 5. The histogram shows the frequency of travelling times between theconsequent door openings as a function of time. The bell-shaped dottedcurve represents the Gaussian distribution. Occasional long travels contributeinto the long right tail of the distribution dominated by a quadratic hyper-bola. On the outline, the data on dispersal of the consequent searchingevents are shown as a function of distance in the log – log scale for theVE model A (by black points) and for the VE model B (by grey points).The solid guide line indicates the inverse quadratic slope. The quadratichyperbolic decline constitutes a ‘fat-tail’ effect detected in the foraging move-ment patterns of many living spices, [4 – 6,8 – 20], in accordance with theLevy foraging hypothesis [1 – 3]. (Online version in colour.)
rsif.royalsocietypublishing.orgJR
SocInterface10:20130352
6
scan is performed by subjects only within their immediate
neighbourhoods and principally cannot be extended either to
the entire VE, or even to any of its significant parts, as the
superlinear increase of required time makes the scanning pro-
cess on large spatio-temporal scales biologically unfeasible.
Thus, after completing a phase of intensive search within the
patch of a size depending on the structural properties of
the environment, a treasure hunter moves to some other area
where the phase of intensive search is resumed. It is important
to mention that changes in reorientation behaviour, on large
spatio-temporal scales, can generate different anomalous diffu-
sion regimes, which, in turn, can affect the search efficiency of
random exploration processes [14].
3.2. Heavy-tailed distributions of human travels invirtual environment
In order to identify phases of specific activity in recorded
movement patterns and to reveal the underlying cognitive
mechanisms from their statistical properties, we have studied
the probability distributions of time intervals and distances
between consequent observable searching events (door open-
ings) as they can determine strong changes in the diffusive
properties of movement and in relevant spatial properties
of the trajectories. The distributions representing the data
on dispersal of the treasure hunters during the experiments
are shown in figure 5 for both VE models. Gender is found
as a factor-influencing navigation in VE: males were reported
to acquire route knowledge from landmarks faster than
females [40] and to spend less time in locating targets [41].
Interestingly, the form of the empirically observed distri-
butions (figure 5) was neither gender-specific nor sensitive
to the different global structure of the environments.
The data show that most of the consequent door openings
happen in the immediate neighbourhood of the actual pos-
ition of a participant. The dispersal statistics on the small
spatio-temporal scales shown in figure 5 can be well approxi-
mated by uncorrelated Gaussian random walks (see the
dotted bell-shaped curve) insensitive to the local structure
of the environment. Both distributions in figure 5 are remark-
able for the long right tails dominated by the quadratichyperbolas attenuating the super-diffusive spread of treasure
hunters on large spatio-temporal scales. A power-law tail in
the probability distributions of both travelling times and tra-
velled distances could arise from processes in which neither
time nor distance have a specific characteristic scale, so that
rare but extremely long and far ‘explorative’ travels can
occur, alternating between sequences of many relatively
short, ‘exploitative’ travels featuring local searches. The
power-law tails in the dispersal data provide evidence in
favour of a strong coupling between the large-scale move-
ments along the paths that cannot be viewed at once [16]
and the environmental structure. As in many empirical
phenomena, the tails of the distributions shown in figure 5
follow a power law only for values greater than some mini-
mum scales smin in space (about 10 m) and in time (about
20 s) that is consistent with the conclusion of the previous
section about the dynamic formation of immediate neighbour-
hoods, in which subjects perform intensive scanning. Our
observations are in agreement with the hypothesis that both
travelling times and travelled distances observed over the
group of people participating in the study were drawn from
a scale-invariant distribution of the form f(s)/ (smin/s)2 and
thus do not change for s� smin if scales are multiplied by a
common factor. However, it is important to note that statistics
of dispersion estimated over a sample of individual searching
behaviour could be as different from the power law (1.1) as fol-
lowing an exponential distribution, as many of these samples
were not statistically representative. Therefore, although the
power-law tails of the distributions shown in figure 5 are con-
sistent with the Levy foraging hypothesis [1–3], they rather
represent a group aggregate feature.
Geometrically, discrete-step random walks with movement
displacements drawn from the Levy distribution consist of
walking clusters with very large displacements between
them repeated over a wide range of scales [8,42]. Although
Levy flights are ubiquitous for representing intermittent
search, cruise and foraging strategies in living spices, to our
knowledge, this is the first report on the observation of Levy
flight search patterns in humans exploring the VE.
4. Model of exploration – exploitation trade-offfor searching behaviour
4.1. Arguments in favour of a self-organizedcritical model
The observed statistical properties of human search behaviour
in the VE call for a model that could exhibit the scale-invariant
characteristic of a critical point of a phase transition (corres-
pondent to the super-diffusive scale-free spread described by
the Levy distribution) spontaneously, without the need to
tune any control parameter to precise values. In statistical
physics, such a property of dynamical systems is known as
self-organized criticality [43]. Furthermore, a plausible model

rsif.royalsocietypublishing.orgJR
SocInterface10:20130352
7
has to be of a discrete nature, as the biological principleof intermittent locomotion assumes that animal behaviour
unavoidably produces observable punctuations, ‘producing
pauses and speeding patterns on the move’ [14]. These motiv-
ations reflect a fundamental ‘trade-off’ confronted by a treasure
hunter choosing between an exploitation of the scanning
movement routine within the familiar environment of nearest
neighbourhood, possibly at no reward, and a fast reloca-
tion aiming at exploration of unknown but potentially more
rewarding areas.
From a theoretical perspective, it is known that in a
stationary setting there exists an optimal strategy for explora-
tion [30] maximizing the reward over an infinite horizon
when the value of each reward is discounted exponentially
as a function of when it is acquired. However, to date,
there is no generally optimal solution to the exploration
versus exploitation problem [29,44], as human and other ani-
mals are prone to dynamically update their estimates of
rewards in response to diverse, mutable and perhaps discre-
pant factors, including elapsed time of search, annoying
failures to predict the location of a searched object, and
instantaneous mood swings that could change in a matter
of seconds. Therefore, it seems that a stochastic model mana-
ging a balance between exploration and exploitation may be
more biologically realistic [29].
There is growing evidence that the neuromodulatory
system involved in assessing reward and uncertainty in
humans is central to the exploration–exploitation trade-off
decision [44]. The problem can be cast in terms of a distinction
between expected uncertainty, coming from known unreliability
of predictive cues and coded in the brain by a neuromodularity
system with acetylcholine signals, and unexpected uncertainty,
triggered by strongly unexpected observations promoting
exploration and coded in the brain with noradrenaline (norepi-
nephrine) signals [45]. It was suggested in Yu & Dayan [45]
that an individual decides on whether to stay or to go accord-
ing to the current levels of acetylcholine and noradrenaline,
encoding the different types of uncertainty.
Summarizing the above-mentioned arguments, we are
interested in a self-organized critical model driven by a dis-
crete time random process of competing between two
factors featuring the different types of uncertainty. Various
coherent-noise models possessing the plausible features
were discussed [46,47] in connection to the standard sand
pile model [43] developed in self-organized criticality,
where the statistics of avalanche sizes and durations also
take a power-law form.
4.2. Mathematical model of decision-making in arandom search
The movement ecology framework [48] explicitly recognizes
animal movement as a result of a continuous ‘dialogue’
between environmental cues (external factors) and animal
internal states [14]. In our model, we rationalize the dialogue
nature of a decision-making process to take on searching in
highly unpredictable situations when no precise information
on a possibility of rewards is available. Despite its inherent
simplicity, the mathematical model formulated below can help
generate a hypothesis about fundamental biological proces-
ses and bring a possibility to look for a variety of biological
mechanisms under a common perspective.
We assume that an individual decides on whether to
‘exploit’ an immediate neighbourhood by search beyond
the next door or to ‘explore’ other parts of the environment
yet to be visited by comparing the guessed chances
q [ ½0; 1� of getting a reward beyond the next door, and
p [ ½0; 1� of finding a treasure elsewhere. It is not necessary
that p þ q ¼ 1. We suppose that at each time click the subject
updates one or both estimates and decides to proceed to a
part of the environment yet to be explored if q , p. Other-
wise, if q � p, she picks a next door randomly among those
not yet opened and searches for a treasure in the room
behind. We consider p and q to be the random variables
distributed over the interval [0, 1] with respect to the prob-
ability distribution functions (pdf) Prfp , ug ¼ G(u) and
Prfq , ug ¼ F(u), respectively. In general, F and G are two
arbitrary left-continuous increasing functions satisfying the
normalization conditions F(0) ¼ G(0) ¼ 0, F(1) ¼ G(1) ¼ 1.
We model the intermittent search patterns by a discrete
time random process in the following way. At time t ¼ 0,
the variable q is chosen with respect to pdf F, and p can be
chosen with respect to pdf G. If q , p, the subject relocates
by pressing a button on the controller and goes to time t ¼1. Given a fixed real number h [ ½0; 1�, at time t � 1, the
following events happen:
— with probability h, the chance to find a treasure in the
immediate neighbourhood (q) is estimated with pdf F,
and the chance to obtain a reward elsewhere ( p) is
chosen with pdf G.
Otherwise,
— with probability 12h, the chance to find a treasure in the
immediate neighbourhood (q) is estimated with pdf F, but
the chance to find it elsewhere ( p) keeps the value it had
at time t21.
Therefore, the parameter h quantifies the degree of coher-
ence between the two stochastic subprocesses characterized
by pdf F and G, respectively: the processes are coherent if
h ¼ 1, and incoherent if h ¼ 0.
If q � p, the local search phase continues; however, if
q , p, the subject presses the controller button and moves
further, going to time t þ 1. Eventually, at some time step t,when the estimated chance q exceeds the value p, the subject
stops and resumes searching within the immediate neigh-
bourhood. The integer value t ¼ T acquired in this random
process limits the time interval (and travelled distance)
between sequential phases of searching activity.
4.3. Analytical solutions for the decision-makingprocess
While studying the model introduced in §4.2, we are inte-
rested in the distribution of durations of the relocation
phases Ph(T; F, G) provided the probability distributions Fand G are given, and the coherence parameter h is fixed.
For many distributions F and G, the model can be solved
analytically. We shall denote Ph(T; F, G) simply by P(T ).
A straightforward computation shows directly from the
definitions that Pð0Þ ¼Ð 1
0 dGð pÞ(1� Fð pÞ): For T � 1,
the individual can either depart elsewhere (‘D’) or stay in
the neighbourhood (‘S’). Both events can take place either
in the ‘correlated’ way (with probability h; see (i)) (we
denote them Dc and Sc), or in the ‘uncorrelated’ way (with

rsif.royalsocietypublishing.orgJR
SocInterface10:20130352
8
probability 12h; see (ii)) (Du and Su). For T ¼ 1, we havefor example
Pð1Þ ¼ P½DSc� þ P½DSu�
¼ð1
0
dGð pÞFð pÞhð1� Fð pÞÞ þð1
0
dGð pÞFð pÞð1� hÞ
�ð1
0
dGðzÞð1� FðzÞÞ
¼ hBð1Þ þ ð1� hÞAð1ÞBð0Þ:
Similarly,
Pð2Þ ¼ h2Bð2Þ þ hð1� hÞAð1ÞBð1Þ þ hð1� hÞAð2ÞBð0Þ
þ ð1� hÞ2Að1Þ2Bð0Þ,
where we define, AðnÞ ¼Ð 1
0 dGð pÞFð pÞn and B(n) ¼ A(n) 2
A(n þ 1), for n ¼ 0, 1, 2, . . . .
It is useful to introduce the generating function of P(T ),
PðsÞ ¼X1T¼0
sTPðTÞ; PðTÞ ¼ 1
T!
dTPðsÞdsT
�����s¼0
:
Defining the following auxiliary functions
xðlÞ ¼ hlAðlþ 1Þ; for l� 1; xð0Þ ¼ 0;
yðlÞ ¼ ð1�hÞlAð1Þl�1; for l� 1; yð0Þ ¼ 0;zðlÞ ¼ hl[hBðlþ 1Þ þ ð1�hÞAðlþ 1ÞBð0Þ]; for l� 1; zð0Þ ¼ 0;r¼ hBð1Þ þ ð1�hÞAð1ÞBð0Þ;
we find
PðsÞ ¼ Bð0Þ þ rs
þ s½zðsÞ þ r xðsÞyðsÞ þ rAð1ÞyðsÞ þ Að1ÞyðsÞzðsÞ�1� xðsÞyðsÞ ;
ð4:1Þ
where xðsÞ; yðsÞ and zðsÞ are the generating functions of x(l ),
y(l ) and z(l ), respectively. In the marginal cases h ¼ 0 and
h ¼ 1, the probability P(T ) can be readily calculated. For
h ¼ 0, we have from (4.1)
Ph¼0ðsÞ ¼Bð0Þ
1� sAð1Þ : ð4:2Þ
From (4.2), one gets
Ph¼0ðTÞ ¼ Að1ÞTBð0Þ
¼ð1
0
dGð pÞFð pÞ� �Tð1
0
dGð pÞð1� Fð pÞÞ: ð4:3Þ
Therefore, in this case, for any choice of the pdf F and G, the
probability P(T ) decays exponentially. For h ¼ 1, (4.1) yields
Ph¼1ðsÞ ¼ BðsÞ, so that
Ph¼1ðTÞ ¼ BðTÞ ¼ð1
0
dGð pÞFð pÞTð1� Fð pÞÞ ð4:4Þ
for the special case of uniform densities dF(u) ¼ dG(u) ¼ du,
for all u [ ½0; 1� and for any h [ ½0; 1�. In this case, simpler
and explicit expressions can be given for PðsÞ and P(T ).
Namely, from equation (4.1), we get
PðsÞ ¼ 1
1þ ð1� hÞgðsÞ1þ gðsÞ
s� hgðsÞ
� �;
gðsÞ ;lnð1� hsÞ
hs:
ð4:5Þ
The asymptotic behaviour of P(T ) as T!1 is determined
by the singularity of the generating function PðsÞ that is
closest to the origin. For h ¼ 0, the generating function
PðsÞ ¼ ð2� sÞ�1 has a simple pole, and therefore P(T )
decays exponentially that agrees with the result (4.3).
For the intermediate values 0 , h , 1, the generating
function PðsÞ has two singularities. The first pole, s ¼ s0,
corresponds to the vanishing denominator 1 þ (12h)g(s),
where s0 ¼ s0(h) is the unique non-trivial solution of the
equation 2ln(12hs) ¼ hs/(12h). The second singularity,
s ¼ s1 ¼ h21, corresponds to the vanishing argument of the
logarithm. It is easy to see that 1 , s0 , s1, so that the domi-
nant singularity of PðsÞ is of the polar type, and for times
much larger than the crossover time Tc(h) � ln(s0(h))21 the
corresponding decay of P(T ) is exponential, with the rate
ln(s0(h)).
Eventually, when h tends to 1, the two singularities, s0
and s1 merge. More precisely, we have
Ph¼1ðsÞ ¼sþ ð1� sÞ lnð1� sÞ
s2: ð4:6Þ
The corresponding dominant term in (4.6) is of order O(T22)
[49]. This obviously agrees with the exact result one can
obtain from equation (4.4), with dF(u) ¼ dG(u) ¼ du,
Ph¼1ðTÞ ¼1
ðT þ 1ÞðT þ 2Þ : ð4:7Þ
Let us note that in the case of uniform densities it is possible
to obtain an expression of Ph(T ) for all times, and for any
value of h,
PhðTÞ ¼hT
ðT þ 1ÞðT þ 2Þ
þXT
k¼1
hT
kðT � k þ 1ÞðT � k þ 2ÞXk
m¼1
1� h
h
� �m
cm;k;
ð4:8Þ
in which
cm;k ¼m!X
l1 þ . . .þ lm ¼ k;li = 0
� l1l2 . . . lm�1lmðl1þ 1Þðk� l1Þ . . . ðlm�1þ 1Þðk� l1� . . .� lm�1Þðlm þ 1Þ :
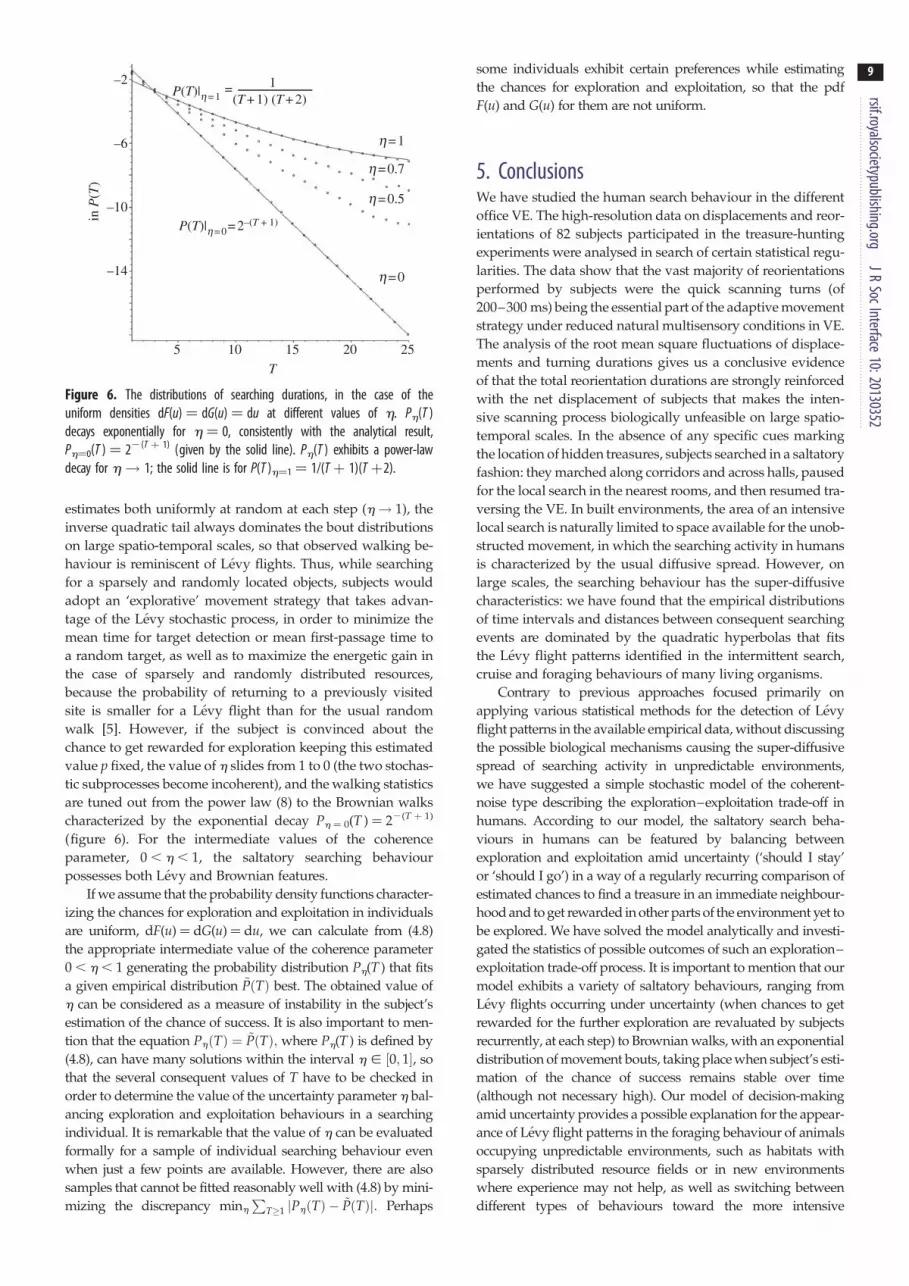
In figure 6, we have presented the probability distri-
butions of the searching durations for increasing values of
h. The proposed mathematical model suggests that the alge-
braic tail dominated by a quadratic hyperbola observed in the
distribution of time intervals and between sequential phases
of searching activity (figure 5) can arise owing to a trade-off
between exploitation versus exploration amid uncertainty.
In such a case, the variable T is set to count bins in the
histogram shown in figure 5 for the large scales s� smin.
Contrasted to locomotion in real environments, mobility in
VE depends on self-motion perception in virtual space and
convenience of the locomotion interface, rather than on phys-
iological factors of an individual such as height, weight, age
or fitness. The instantaneous translation velocity in the VE is
kept constant for any individual, as long as she presses a
button. Therefore, the scale-free distribution of time intervals
induces the scale-free distribution of travelling distances,
with the same scaling exponent.
We have shown that when balancing the chances to be
rewarded in the immediate neighbourhood (‘now and here’)
and later elsewhere (‘then and there’) amid uncertainty subject
5
–14
–10
–6
–2in
P(T
)P(T)|h = 1
P(T)|h=0=2–(T + 1)
= 1(T + 1) (T + 2)
10 15T
20 25
h=0
h=0.5
h=0.7
h=1
Figure 6. The distributions of searching durations, in the case of theuniform densities dF(u) ¼ dG(u) ¼ du at different values of h. Ph(T )decays exponentially for h ¼ 0, consistently with the analytical result,Ph¼0(T ) ¼ 22(T þ 1) (given by the solid line). Ph(T ) exhibits a power-lawdecay for h! 1; the solid line is for P(T )h¼1 ¼ 1/(T þ 1)(T þ2).
rsif.royalsocietypublishing.orgJR
SocInterface10:20130352
9
estimates both uniformly at random at each step (h! 1), the
inverse quadratic tail always dominates the bout distributions
on large spatio-temporal scales, so that observed walking be-
haviour is reminiscent of Levy flights. Thus, while searching
for a sparsely and randomly located objects, subjects would
adopt an ‘explorative’ movement strategy that takes advan-
tage of the Levy stochastic process, in order to minimize the
mean time for target detection or mean first-passage time to
a random target, as well as to maximize the energetic gain in
the case of sparsely and randomly distributed resources,
because the probability of returning to a previously visited
site is smaller for a Levy flight than for the usual random
walk [5]. However, if the subject is convinced about the
chance to get rewarded for exploration keeping this estimated
value p fixed, the value of h slides from 1 to 0 (the two stochas-
tic subprocesses become incoherent), and the walking statistics
are tuned out from the power law (8) to the Brownian walks
characterized by the exponential decay Ph ¼ 0(T ) ¼ 22(T þ 1)
(figure 6). For the intermediate values of the coherence
parameter, 0 , h , 1, the saltatory searching behaviour
possesses both Levy and Brownian features.
If we assume that the probability density functions character-
izing the chances for exploration and exploitation in individuals
are uniform, dF(u)¼ dG(u)¼ du, we can calculate from (4.8)
the appropriate intermediate value of the coherence parameter
0 , h , 1 generating the probability distribution Ph(T ) that fits
a given empirical distribution ~PðTÞ best. The obtained value of
h can be considered as a measure of instability in the subject’s
estimation of the chance of success. It is also important to men-
tion that the equation PhðTÞ ¼ ~PðTÞ; where Ph(T ) is defined by
(4.8), can have many solutions within the interval h [ ½0; 1�, so
that the several consequent values of T have to be checked in
order to determine the value of the uncertainty parameter h bal-
ancing exploration and exploitation behaviours in a searching
individual. It is remarkable that the value of h can be evaluated
formally for a sample of individual searching behaviour even
when just a few points are available. However, there are also
samples that cannot be fitted reasonably well with (4.8) by mini-
mizing the discrepancy minh
PT�1 jPhðTÞ � ~PðTÞj: Perhaps
some individuals exhibit certain preferences while estimating
the chances for exploration and exploitation, so that the pdf
F(u) and G(u) for them are not uniform.
5. ConclusionsWe have studied the human search behaviour in the different
office VE. The high-resolution data on displacements and reor-
ientations of 82 subjects participated in the treasure-hunting
experiments were analysed in search of certain statistical regu-
larities. The data show that the vast majority of reorientations
performed by subjects were the quick scanning turns (of
200–300 ms) being the essential part of the adaptive movement
strategy under reduced natural multisensory conditions in VE.
The analysis of the root mean square fluctuations of displace-
ments and turning durations gives us a conclusive evidence
of that the total reorientation durations are strongly reinforced
with the net displacement of subjects that makes the inten-
sive scanning process biologically unfeasible on large spatio-
temporal scales. In the absence of any specific cues marking
the location of hidden treasures, subjects searched in a saltatory
fashion: they marched along corridors and across halls, paused
for the local search in the nearest rooms, and then resumed tra-
versing the VE. In built environments, the area of an intensive
local search is naturally limited to space available for the unob-
structed movement, in which the searching activity in humans
is characterized by the usual diffusive spread. However, on
large scales, the searching behaviour has the super-diffusive
characteristics: we have found that the empirical distributions
of time intervals and distances between consequent searching
events are dominated by the quadratic hyperbolas that fits
the Levy flight patterns identified in the intermittent search,
cruise and foraging behaviours of many living organisms.
Contrary to previous approaches focused primarily on
applying various statistical methods for the detection of Levy
flight patterns in the available empirical data, without discussing
the possible biological mechanisms causing the super-diffusive
spread of searching activity in unpredictable environments,
we have suggested a simple stochastic model of the coherent-
noise type describing the exploration–exploitation trade-off in
humans. According to our model, the saltatory search beha-
viours in humans can be featured by balancing between
exploration and exploitation amid uncertainty (‘should I stay’
or ‘should I go’) in a way of a regularly recurring comparison of
estimated chances to find a treasure in an immediate neighbour-
hood and to get rewarded in other parts of the environment yet to
be explored. We have solved the model analytically and investi-
gated the statistics of possible outcomes of such an exploration–
exploitation trade-off process. It is important to mention that our
model exhibits a variety of saltatory behaviours, ranging from
Levy flights occurring under uncertainty (when chances to get
rewarded for the further exploration are revaluated by subjects
recurrently, at each step) to Brownian walks, with an exponential
distribution of movement bouts, taking place when subject’s esti-
mation of the chance of success remains stable over time
(although not necessary high). Our model of decision-making
amid uncertainty provides a possible explanation for the appear-
ance of Levy flight patterns in the foraging behaviour of animals
occupying unpredictable environments, such as habitats with
sparsely distributed resource fields or in new environments
where experience may not help, as well as switching between
different types of behaviours toward the more intensive

rsif.royalsocietypublishi
10
searching strategy that could occur during a single trip of atreasure hunter confident of the eventual success.
The treasure-hunting experiments were supported by the CognitiveInteraction Technology-Centre of Excellence (CITEC, Bielefeld Univer-sity). D.V. gratefully acknowledges the financial support by the projectMatheMACS (mathematics of multilevel anticipatory complex systems),the grant agreement no. 318723, supported by the EC Seventh Frame-work Programme FP7-ICT-2011-8. Conceived and designed the
experiments: M.T., S.K., D.V. Performed the experiments: J.H. Analysedthe data: D.V., J.H. Wrote the paper: D.V.
Endnote1Two AVI video fragments showing the records of actual searchingexperiments from the first-person perspective can be found athttp://youtu.be/17aNxvZFMRw (the VE model A) and http://youtu.be/_Jooi9ZXRGs (the VE model B).
ng.orgJR
ReferencesSocInterface10:20130352
1. Bartumeus F. 2007 Levy processes in animalmovement: an evolutionary hypothesis. Fractals 15,151 – 162. (doi:10.1142/S0218348X07003460)
2. Viswanathan GM, Raposo EP, da Luz MGE. 2008Levy flights and super-diffusion in the context ofbiological encounters and random searches. Phys.Life Rev. 5, 133 – 150. (doi:10.1016/j.plrev.2008.03.002)
3. Viswanathan GM, da Luz MGE, Raposo EP, StanleyHE. 2011 The physics of foraging: an introduction torandom searches and biological encounters.New York, NY: Cambridge University Press.
4. Viswanathan GM, Afanasyev V, Buldyrev SV, MurphyEJ, Prince PA, Stanley HE. 1996 Levy flight searchpatterns of wandering albatrosses. Nature (London)381, 413 – 415. (doi:10.1038/381413a0)
5. Viswanathan GM, Buldyrev S, Havlin S, da Luz MGE,Raposo EP, Stanley HE. 1999 Optimizing thesuccess of random searches. Nature (London) 401,911 – 914. (doi:10.1038/44831)
6. Buldyrev SV, Havlin S, Kazakov Aa, da Luz MGE,Raposo EP, Stanley HE, Viswanathan GM. 2001Average time spent by Levy flights and walks on aninterval with absorbing boundaries. Phys. Rev. E 64,041108. (doi:10.1103/PhysRevE.64.041108)
7. Levy M, Solomon S. 1996 Power laws arelogarithmic Boltzmann laws. Int. J. Mod. Phys. C 7,595 – 601. (doi:10.1142/S0129183196000491)
8. Shlesinger MF, Klafter J. 1986 Levy walks versusLevy flights. In On growth and form (eds H Stanley,N Ostrowsky), p. 279. Dordrecht, The Netherlands:Kluwer.
9. Cole BJ. 1995 Fractal time in animal behaviour: themovement activity of Drosophila. Anim. Behav. 50,1317 – 1324. (doi:10.1016/0003-3472(95)80047-6)
10. Atkinson RPD, Rhodes CJ, MacDonald DW, AndersonRM. 2002 Scale-free dynamics in the movementpatterns of jackals. Oikos 98, 134 – 140. (doi:10.1034/j.1600-0706.2002.980114.x)
11. Brockmann D, Hufnagel L, Geisel T. 2006 The scalinglaws of human travel. Nature 439, 462 – 465.(doi:10.1038/nature04292)
12. Seuronta L, Duponchel A-C, Chapperon C. 2007Heavy-tailed distributions in the intermittentmotion behaviour of the intertidal gastropodLittorina littorea. Physica A 385, 573 – 582. (doi:10.1016/j.physa.2007.07.029)
13. Sims DW et al. 2008 Scaling laws of marinepredator search behaviour. Nature 451,1098 – 1102. (doi:10.1038/nature06518)
14. Bartumeus F, Levin SA. 2008 Fractal reorientationclocks: Linking animal behaviour to statisticalpatterns of search. Proc. Natl Acad. Sci. USA 105,19 072 – 19 077. (doi:10.1073/pnas.0801926105)
15. Bartumeus F, Catalan J, Viswanathan GM, Raposo E,da Luz MGE. 2008 The influence of turning angleson the success of non-oriented animal searches.J. Theor. Biol. 252, 43 – 55. (doi:10.1016/j.jtbi.2008.01.009)
16. Bartumeus F. 2009 Behavioural intermittence, Levypatterns, and randomness in animal movement.Oikos 118, 488. (doi:10.1111/j.1600-0706.2008.17313.x)
17. Humphries NE et al. 2010 Environmental contextexplains Levy and Brownian movement patterns ofmarine predators. Nature 465, 1066 – 1069. (doi:10.1038/nature09116)
18. Hu Y, Zhang J, Huan D, Di Z. 2011 Toward a generalunderstanding of the scaling laws in human andanimal mobility. EPL 96, 38006. (doi:10.1209/0295-5075/96/38006)
19. Rhee I. 2011 On the Levy-walk nature of humanmobility. IEEE/ACM Trans. Network. 19, 630 – 643.(doi:10.1109/TNET.2011.2120618)
20. Sims DW, Humphries NE, Russell WB, Bruce BD.2012 Levy flight and Brownian search patterns of afree-ranging predator reflect different prey fieldcharacteristics. J. Anim. Ecol. 81, 432 – 442. (doi:10.1111/j.1365-2656.2011.01914.x)
21. Edwards AM et al. 2007 Revisiting Levy flight searchpatterns of wandering albatrosses, bumblebees anddeer. Nature 449, 1044 – 1048. (doi:10.1038/nature06199)
22. Turchin P. 1996 Fractal analyses of animalmovement: a critique. Ecology 77, 2086. (doi:10.2307/2265702)
23. Petrovskii S, Mashanova A, Jansen VAA. 2011Variation in individual walking behaviour createsthe impression of a Levy flight. Proc. Natl Acad.Sci. USA 108, 8704 – 8707. (doi:10.1073/pnas.1015208108)
24. Matthaus F, Mommer MS, Curk T, Dobnikar J. 2011On the origin and characteristics of noise-inducedLevy walks of E. Coli. PLoS ONE 6, e18623. (doi:10.1371/journal.pone.0018623)
25. Humphries NE, Weimerskirch H, Queiroz N, SouthallEJ, Sims DW. 2012 Foraging success of biologicalLevy flights recorded in situ. Proc. Natl Acad. Sci.USA 109, 7169 – 7174. (doi:10.1073/pnas.1121201109)
26. Wann JP, Mon-Williams M. 1996 What does virtualreality NEED?: human factors issues in the design ofthree-dimensional computer environments.Int. J. Hum. Comp. Stud. 44, 829 – 847. (doi:10.1006/ijhc.1996.0035)
27. Darken RP, Sibert JL. 1993 A toolset for navigationin virtual environments. In UIST ’93 Proc. of the 6thannual ACM symposium on user interface softwareand technology, Atlanta, GA, pp. 157 – 165.New York, NY: ACM.
28. Werner S, Long P. 2003 Cognition meets leCorbusier: cognitive principles of architecturaldesign. 112. In Spatial Cognition III. Lecture notes inartificial intelligence, vol. 2685 (eds C Freksa, WBrauer, C Habel, KF Wender), pp. 112 – 126. Berlin,Germany: Springer.
29. Cohen JD, McClure SM, Yu AJ. 2007 Should I stay orshould I go? How the human brain manages the trade-off between exploitation and exploration. Phil. Trans.R. Soc. B 362, 933 – 942. (doi:10.1098/rstb.2007.2098)
30. Gittins JC. 1989 Multi-armed bandit allocationindices. Wiley-Interscience series in systems andoptimization. Chichester, UK: John Wiley & Sons.
31. Lawton CA. 1994 Gender differences in way-findingstrategies: relationship to spatial ability and spatialanxiety. Sex Roles 30, 765 – 779. (doi:10.1007/BF01544230)
32. Devlin AS, Bernstein J. 1995 Interactive wayfinding:use of cues by men and women. J. Environ. Psychol.15, 23 – 38. (doi:10.1016/0272-4944(95)90012-8)
33. Voyer D, Voyer S, Bryden MP. 1995 Magnitude ofsex differences in spatial abilities: a meta-analysisand consideration of critical variables. Psychol. Bull.117, 250 – 270. (doi:10.1037/0033-2909.117.2.250)
34. Blanchard Ph, Volchenkov D. 2009 Mathematicalanalysis of urban spatial networks. Springer series:understanding complex systems. Berlin, Germany:Springer.
35. Klatzky RL, Loomis JM, Beall AC, Chance SS,Golledge RG. 1998 Spatial updating of self-positionand orientation during real, imagined, and virtuallocomotion. Psychol. Sci. 9, 293 – 298. (doi:10.1111/1467-9280.00058)
36. Riecke BE, Schulte-Pelkum J, Bulthoff HH. 2005Perceiving simulated ego-motions in virtual reality-comparing large screen displays with HMDs. In Proc.SPIE—VALVE: Vision, Action, and Locomotion inVirtual (and Real) Environments, San Jose, CA,vol. 5666 (eds BE Rogowitz, TN Pappas, SJ Daly),pp. 344 – 355. Bellingham, WA: SPIE.

rsif.royalsocietypublishing.orgJR
SocInterface
11
37. Komin N, Erdmann U, Schimansky-Geier L. 2004Random walk theory applied to daphnia motion.Fluct. Noise Lett. 4, L151 – L159. (doi:10.1142/S0219477504001756)38. Schimansky-Geier L, Erdmann U, Komin N. 2005Advantages of hopping on a zigzag course.Physica A 351, 51 – 59. (doi:10.1016/j.physa.2004.12.043)
39. Hurst HE, Black RP, Simaika YM. 1965 Long-termstorage: an experimental study. London, UK:Constable Publisher.
40. Cutmore TRH, Hine TJ, Maberly KJ, Langford NM,Hawgood G. 2000 Cognitive and gender factorsinfluencing navigation in a virtual environment.Int. J. Human – Computer Stud. 53, 223 – 249.(doi:10.1006/ijhc.2000.0389)
41. Chin-Teng L, Teng-Yi H, Wen-Jing L, Shu-Yen C,Yin-Hung L, Li-Wei K, Hung DL, Erik CC. 2012Gender differences in wayfinding in virtualenvironments with global or local landmarks. J. Environ.Psychol. 32, 89 – 96. (doi:10.1016/j.jenvp.2011.12.004)
42. Shlesinger M, Zaslavsky GM, Klafter J. 1993 Strangekinetics. Nature 363, 31 – 37. (doi:10.1038/363031a0)
43. Bak P, Tang C, Wiesenfeld K. 1987 Self-organizedcriticality: an explanation of 1/f noise. Phys. Rev.Lett. 59, 381 – 384. (doi:10.1103/PhysRevLett.59.381)
44. Cohen JD, Aston-Jones G. 2005 Cognitiveneuroscience: decision amid uncertainty.Nature 436, 471 – 472. (doi:10.1038/436471a)
45. Yu AJ, Dayan P. 2005 Uncertainty, neuromodulation,and attention. Neuron 46, 681 – 692. (doi:10.1016/j.neuron.2005.04.026)
46. Newman MEJ, Sneppen K. 1996 Avalanches, scalingand coherent noise. Phys. Rev. E 54, 6226 – 6231.(doi:10.1103/PhysRevE.54.6226)
47. Sneppen K, Newman MEJ. 1997 Coherent noise, scaleinvariance and intermittency in large systems. Physica D110, 209 – 222. (doi:10.1016/S0167-2789(97)00128-0)
48. Nathan R, Getz WM, Revilla E, Holyoak M, KadmonR, Saltz D, Smouse PE. 2008 A movement ecologyparadigm for unifying organismal movementresearch. Proc. Natl Acad. Sci. USA 105, 19 052 –19 059. (doi:10.1073/pnas.0800375105)
49. Flajolet P, Sedgewick R. 2009 Analytic combinatorics.Cambridge, UK: Cambridge University Press.
1 0:2 0130352