investment in intangible assets in canada: r\u0026d, innovation, brand, and mining, oil and gas...
TRANSCRIPT

Investment in Intangible Assets in Canada:R&D, Innovation, Brand, and Mining, Oil and Gas Exploration Expenditures
by John R. Baldwin, Wulong Gu, Amélie Lafrance and Ryan Macdonald
Economic Analysis Division R.H. Coats Bldg., 18th floor, 100 Tunney's Pasture Driveway
Telephone: 1-800-263-1136
Catalogue no. 15-206-X — No. 026
O
The Canadian Productivity Review
ISSN 1710-5269 ISBN 978-1-100-13957-9
Research Paper
Ottawa, Ontario K1A 0T6

How to obtain more information
Specific inquiries about this product and related statistics or services should be directed to the Media Hotline, Communications and Library Services Division, Statistics Canada, Ottawa, Ontario K1A 0T6 (telephone: 613-951-4636). For information about this product or the wide range of services and data available from Statistics Canada, visit our website at www.statcan.gc.ca or contact us by e-mail at [email protected] or by telephone from 8:30 a.m. to 4:30 p.m. Monday to Friday: Statistics Canada National Contact Centre
Toll-free telephone (Canada and the United States): Inquiries line 1-800-263-1136 National telecommunications device for the hearing impaired 1-800-363-7629 Fax line 1-877-287-4369
Local or international calls: Inquiries line 1-613-951-8116 Fax line 1-613-951-0581
Depository services program
Inquiries line 1-800-635-7943 Fax line 1-800-565-7757
Information to access the product
This product, Catalogue no. 15-206-X, is available for free in electronic format. To obtain a single issue, visit our website at www.statcan.gc.ca and select “Publications.” Standards of service to the public
Statistics Canada is committed to serving its clients in a prompt, reliable and courteous manner. To this end, the Agency has developed standards of service which its employees observe in serving its clients. To obtain a copy of these service standards, please contact Statistics Canada toll free at 1-800-263-1136. The service standards are also published on www.statcan.gc.ca under “About us” > “Providing services to Canadians.”
The Canadian Productivity Review
The Canadian Productivity Review is a series of applied studies that address issues involving the measurement, explanation, and improvement of productivity. Themes covered in the review include, but are not limited to, economic performance, capital formation, labour, prices, environment, trade, and efficiency at both national and provincial levels. The Review publishes empirical research, at different levels of aggregation, based on growth accounting, econometrics, index numbers and mathematical programming. The empirical research illustrates the application of theory and techniques to relevant public policy issues. The primary distribution medium for this series is the Internet. These studies can be downloaded from the Internet at www.statcan.gc.ca for free. All papers in The Canadian Productivity Review series go through institutional and peer review to ensure that they conform to Statistics Canada’s mandate as a government statistical agency and adhere to generally accepted standards of good professional practice. The papers in the series often include results derived from multivariate analysis or other statistical techniques. It should be recognized that the results of these analyses are subject to uncertainty in the reported estimates. The level of uncertainty will depend on several factors: the nature of the functional form used in the multivariate analysis; the type of econometric technique employed; the appropriateness of the statistical assumptions embedded in the model or technique; the comprehensiveness of the variables included in the analysis; and the accuracy of the data that are utilized. The peer group review process is meant to ensure that the papers in the series have followed accepted standards to minimize problems in each of these areas.
Statistics Canada Economic Analysis Division
Investment in Intangible Assets in Canada: R&D, Innovation, Brand, and Mining, Oil and Gas Exploration Expenditures John R. Baldwin, Wulong Gu, Amélie Lafrance and Ryan Macdonald
Published by authority of the Minister responsible for Statistics Canada © Minister of Industry, 2009 All rights reserved. The content of this electronic publication may be reproduced, in whole or in part, and by any means, without further permission from Statistics Canada, subject to the following conditions: that it be done solely for the purposes of private study, research, criticism, review or newspaper summary, and/or for non-commercial purposes; and that Statistics Canada be fully acknowledged as follows: Source (or “Adapted from”, if appropriate): Statistics Canada, year of publication, name of product, catalogue number, volume and issue numbers, reference period and page(s). Otherwise, no part of this publication may be reproduced, stored in a retrieval system or transmitted in any form, by any means—electronic, mechanical or photocopy—or for any purposes without prior written permission of Licensing Services, Client Services Division, Statistics Canada, Ottawa, Ontario, Canada K1A 0T6. December 2009 Catalogue no. 15-206-X, no. 026 Frequency: Occasional ISSN 1710-5269 ISBN 978-1-100-13957-9 Ottawa Authors’ names are listed alphabetically. La version française de cette publication est disponible (no 15-206-X au catalogue, no 026). Note of appreciation
Canada owes the success of its statistical system to a long-standing partnership between Statistics Canada, the citizens of Canada, its businesses, governments and other institutions. Accurate and timely statistical information could not be produced without their continued cooperation and goodwill.
The Canadian Productivity Review - 4 - Statistics Canada – Catalogue no. 15-206-X, no. 026
Table of contents
Abstract .....................................................................................................................................5
Preface.......................................................................................................................................6
Executive Summary..................................................................................................................9
1 Introduction.......................................................................................................................11
2 Intangible Investments .....................................................................................................12
3 Intangible Expenditures....................................................................................................13
3.1 Categories of Intangibles.........................................................................................13 3.1.1 Science and Innovation...................................................................................15 3.1.2 Mineral Exploration Expenditures....................................................................19 3.1.3 Advertising Expenditures ................................................................................19
3.2 Implementation.........................................................................................................20 3.2.1 Science Expenditures .....................................................................................20 3.2.2 Advertising Expenditures ................................................................................21 3.2.3 Mineral Exploration Expenditures....................................................................21 3.2.4 Time Series Consistency ................................................................................21
4 Intangible Investments in Canada ...................................................................................23
4.1 Total Economy..........................................................................................................23
4.2 Industry Differences.................................................................................................27
5 Conclusion ........................................................................................................................32
Appendix .................................................................................................................................34
References ..............................................................................................................................39
Symbols The following standard symbols are used in Statistics Canada publications:
. not available for any reference period
.. not available for a specific reference period … not applicable 0 true zero or a value rounded to zero 0s value rounded to 0 (zero) where there is a meaningful distinction between true zero and the value that
was rounded p preliminary r revised x suppressed to meet the confidentiality requirements of the Statistics Act E use with caution F too unreliable to be published
The Canadian Productivity Review - 5 - Statistics Canada – Catalogue no. 15-206-X, no. 026
Abstract
This paper presents estimates of intangible investment in Canada for the purpose of innovation, advertising and resource extraction. It first expands upon work by Beckstead and Gellatly (2003), Baldwin and Hanel (2003), Beckstead and Gellatly (2003), Beckstead and Vinodrai (2003) and Baldwin and Beckstead (2003) who argue that the scope of innovative activity extends beyond research and development (R&D) as defined by the Frascati Manual. It extends the definition of innovative activities to include all scientific and engineering expenditures – regardless of whether they are market–based or produced with a firm. The paper also considers expenditures on intangible items such as brands or resource exploration. The paper contributes to the existing literature by creating intangible investment estimates (science and engineering knowledge, advertising, mineral exploration by industry) using Statistics Canada’s high quality and internally consistent databases. It produces estimates that accord with other intangibles studies (Corrado, Hulten and Sichel 2005, 2006; Jalava, Ahmavarra and Alanen 2007) and shows that traditional R&D type investment estimates account for about a quarter of intangible science and engineering investments.

The Canadian Productivity Review - 6 - Statistics Canada – Catalogue no. 15-206-X, no. 026
Preface
Analysts take an interest in the underlying forces affecting growth in the Canadian economy, and so a number of Statistics Canada studies focus on the basic transformations taking place in the determinants of economic growth. These studies focus not so much on short-run patterns that reflect exchange–rate or commodity–price movements favouring some sectors or regions, but on the underlying production process and the nature of innovation. They examine the evolution of new patterns in the economy that are transformational in nature and widespread across all sectors. Different types of changes have caught the attention of analysts in recent years, ranging from the emergence of the high-tech economy, to the development of the knowledge economy, to the importance of innovation more generally. Central to the first topic is the notion that the use of advanced technologies, particularly information and communications technology (ICT), is the new critical capital input behind economic growth. The ICT revolution has been manifested in dramatic changes in the focus of investment. In particular, the percentage of investment in machinery and equipment that has been dedicated to information and communications technology has increased dramatically over time (Baldwin and Gu, 2007). Numerous studies at the macro level have found significant positive relationships between the stock of ICT capital and industry macroeconomic performance. Jorgenson and Stiroh (2000) report a positive relationship between U.S. industry multi-factor productivity growth and investments in information technology in the post 1995 period. Working at the industry-level, Stiroh (2001) finds a positive correlation between ICT-investment intensities and labour productivity growth. In Canada, Armstrong et al. (2002) examine the extent to which changes in output growth are driven by investments in information and communication technologies, such as hardware, software and telecommunications equipment. The authors report that the percentage of output growth attributable to ICT investment increased markedly over the 1995-2000 period—and further that there is a close relationship between ICT investment and productivity performance. Gu and Wang (2004) also find a close relationship in Canada between industry multifactor productivity growth and the use of both ICT technologies and highly skilled labour. At the micro level, other studies confirm the importance of ICT strategies for the success of individual firms. Baldwin and Sabourin (2001, 2004) find that manufacturing firms making the greatest use of ICT equipment grow more quickly, thereby gaining market share, and increasing their relative productivity. Beckstead and Gellatly (2003) investigate the profile of Canadian ICT industries to see whether or not they stand out in terms of their performance not only with regards to productivity growth but also to profitability, output, capital investment, trade, research and development (R&D), employment and labour quality. The report also examines a larger collection of science-based industries making contributions to industrial innovation via relatively large investments in research and development and human capital. Beckstead and Gellatly report that ICT industries are not the sole source of industrial innovation in the New Economy. Another set of ‘Knowledge-based’ industries that focus on research and development deserves attention in their own right. GDP growth, employment growth, productivity growth, investments in technology, and R&D expenditures are all areas in which the ICT sector excel; but in many respects, knowledge-based science industries outside the ICT sector that focus on R&D expenditures are equally
The Canadian Productivity Review - 7 - Statistics Canada – Catalogue no. 15-206-X, no. 026
dynamic. This indicates that a broader approach than the study of technology investments is required to fully capture the nature of the underlying changes taking place in the Canadian economy. R&D expenditures, which primarily involve expenditures on skilled labour (scientists), are also related to success. As such, science-based strategies that are an intrinsic part of the New High-Tech Knowledge Economy are not one-dimensional. The strategies involve the use of high-tech machinery and equipment, and simultaneously require the use of highly trained science workers. Studies on the broader concept of the knowledge economy also focus on the importance of worker skills and not just on technological machinery and equipment. They investigate whether production processes have increased their emphasis on higher skilled labour, or what some have called ‘knowledge’ workers. These papers focus first on narrow groups of knowledge workers defined in terms of scientists and then on larger groups that take into account higher education levels defined more broadly. Beckstead and Vinodrai (2003) and Baldwin and Beckstead (2003) report that the share of employment in the Canadian economy accounted for by ‘knowledge’ workers using both definitions increased at a steady rate over the period 1971 to 1996. In contrast to the studies of the ICT or the Knowledge Economy, Innovation studies focus on the broader determinants of the innovation process rather than just on new investments in ICT and R&D expenditures. Many innovations are modest, incremental changes, while others are more pathbreaking. Both contribute to the process of industrial renewal. Baldwin and Hanel (2003) report that innovation strategies and inputs to the innovation process differ substantially across manufacturing sectors. In some industries, they are centered on R&D and new product development. These require R&D personnel. In other industries, they involve incorporating new process technology and making use of the new intermediate products developed in other industries. The latter require engineers and applied scientists. In still other industries, they involve both. Innovation studies show that innovative firms are found across all industries. Baldwin and Gellatly (1998, 1999, and 2001) make use of survey evidence for firms across all sectors of the Canadian economy and report that there are firms with innovation profiles in all industries—in both manufacturing and service sectors. More importantly, it is these firms that grow more rapidly and are more successful in all sectors (Baldwin and Gellatly 2003); however their innovation profiles are tailored to the industry environment in which they are found and thus often differ. Some industries focus on R&D scientists—the creation of new knowledge. Others focus on other types of scientists—engineers—to incorporate new products and materials discovered in other industries into the production process of industries that make use of these discoveries—either as new machinery and equipment or as new intermediate materials. The latter involve expenditures that while different from R&D have many of the same properties—they create long-lived assets and they involve substantial scientific effort. In both cases, expenditures on people are used to make investments that contribute to a firm’s success. This study continues the focus of our previous studies on transformational change. It complements previous studies by examining the types of investments being made in the innovation process, but it extends the focus beyond just hardware like ICT that has provided the focus of much of macroeconomic productivity analysis. It complements the previous set of studies on the Knowledge economy in that it is interested in quantifying the investment made in knowledge capital, or what has come to be called Intangibles. In doing so, it parallels previous work in that it recognizes substantial investments are made here in workers, not only in developing their skills, but in developing new knowledge that the firm can harness for innovative

The Canadian Productivity Review - 8 - Statistics Canada – Catalogue no. 15-206-X, no. 026
activity. It also recognizes that some knowledge investments are made by purchasing R&D, patents, licenses, and technological know-how from other companies. This paper builds on our innovation studies by recognizing that there are a variety of different types of investments made in innovation. Only part of these innovation expenditures is included in R&D expenditures. Substantial investments in science-related expenditures outside of R&D are also made. The proportion of R&D and non-R&D science expenditures varies across industries because the nature of innovation differs across the sectors.

The Canadian Productivity Review - 9 - Statistics Canada – Catalogue no. 15-206-X, no. 026
Executive Summary
Studies of economic growth often focus on the importance of capital and its changing nature. These estimates of capital include machinery and equipment, buildings and engineering structures. In recent years, however, attention has focused more broadly on capital investment, especially on expenditures providing less-tangible assets. These investments take several different forms — scientific knowledge, brand value and, an understanding of the location and characteristic of natural resources. In all cases, the tangible and intangible capital assets are defined based on their ability to be used repeatedly in production processes for periods exceeding one year. While traditional estimates of scientific knowledge have focussed on the role of Research and Development (R&D), an expanded definition of innovative activity is necessary to fully analyze the role of scientific knowledge–creation in advancing economic growth. The issue with traditional R&D estimates stems from the use of information based on sources that develop data using the Frascati Manual (OECD 2002), which has the potential for underestimating investments in scientific knowledge (Baldwin, Beckstead and Gellatly 2003). This paper expands on the Frascati Manual definition of R&D, and estimates intangible investments in Canada for total sciences – Software, Purchased Science and Engineering, Own-account Science and Engineering and R&D – as well as Advertising and Mineral Exploration. For each asset category, estimates are created for investments by industry and for the Canadian business sector from 1981 to 2001. In doing so, the paper examines several issues pertinent to intangible investment. These are:
Why should the scope of intangible investment be expanded beyond the Frascati
Manual definition? There are two primary reasons why the Frascati Manual definition of science expenditures is expanded upon here:
o First, it misses expenditures that are, in essence, investments. These investments are made adapting, rather than inventing, new products and technologies; and,
o Second, it ignores the large amount of science that is purchased in the form of technological know-how, whether it be outside R&D (Frascati focuses only on R&D performed within a firm), consulting engineering and other services, patents, architectural services, and blueprints.
How large are intangible investments relative to tangible investments? Is the relationship
constant over time? Current dollar intangible investments are larger than investments in machinery and equipment (M&E) or buildings and structures. The difference is slight in the early 1980s, but expands rapidly as average annual M&E investment growth (5.2%) and building and construction investment growth (2.9%) failed to keep pace with intangibles growth (8.2%).
The Canadian Productivity Review - 10 - Statistics Canada – Catalogue no. 15-206-X, no. 026
As a result, by 2001 intangible investments are nearly twice as large as M&E investments and nearly 4 times as large as building and structure investments.
Which intangible investments are largest? Which grow fastest?
Scientific expenditures make up an average of 77.4% of intangible expenditures during the 1981 to 2001 period. Advertising expenditures have the second largest share (18.3%), followed by mineral exploration (4.3%). Within scientific expenditures, Own-account Science and Engineering (31.4%) and purchased scientific and engineering services (21.3%) are the largest categories. The R&D measure most closely associated with the Frascati manual definition accounts for 19.0%, with the remaining 5.6% is accounted for by software investments. The fastest growing intangible expenditure has been on software investment, which rose by an annual average of 13.9% from 1981 to 2001. As a result, software’s share of overall intangible investment rose from 2.5% in 1981 to 6.7% in 2001. R&D posted the second highest growth rate (10.8%), followed by mineral exploration (10.4%), advertising (7.7%), purchased science and engineering services (7.5%) and Own-account science and engineering (6.6%).
Which industries are responsible for the most intangible investment?
The expanded definition of intangibles employed here shows that intangible investments are spread across the entire business sector, in contrast to R&D which is more narrowly focussed. Although there are differences in the composition of intangible investments across industries, expenditures on intangible investments are roughly split between goods and services industries.
How do intangible investments vary by industry?
Even though all industries invest in intangible assets, there is a noticeable difference in the type of intangible asset purchased. The Mining, Oil and Gas industries are dominated by mineral exploration while Construction industries focus on purchased science and engineering, consisting mainly of engineering and architect services. Advertising services is most important in Retail Trade, Arts/Entertainment and Recreation, Accommodation and Food Services, and Other Services. At the aggregate business-sector level, R&D is dominated by other Own-account and purchased science services. This is also generally true at the industry level—even in those industries that account for most of the R&D. Other Own-account Science and Engineers is most important in Agriculture and Forestry, Utilities, Manufacturing, Wholesale, Information and Culture, Transportation, Finance, Administrative Support, and Utilities. Finally, Professional, Scientific and Technical Services is the one industry where R&D is the most important category—though even here, Own-account Other Science comes second. R&D is also relatively important in Manufacturing and Wholesale.

The Canadian Productivity Review - 11 - Statistics Canada – Catalogue no. 15-206-X, no. 026
1 Introduction
Studies of economic growth often focus on the importance of capital and its changing nature. In recent years, attention has focused on the changing pattern of investments in tangible machinery and equipment—in particular on the fact that an increasing proportion of investments in this area consist of investment in information and technology (Baldwin and Gu 2007). Studies by Gu and Wang (2004) for Canada and Jorgenson et al. (2000) for the United States report a positive correlation between Information and Communications Technology (ICT)-investment intensities and productivity growth at the industry level. Attention has also focused more broadly on other types of capital—expenditures that provide less tangible assets. One type of intangible knowledge capital that has received much attention is research and development (R&D), which consists mainly of expenditures on the wages of scientists. Beckstead and Gellatly (2003) study the characteristics of a wide range of industries, both those producing ICT, and those making use of extensive amounts of R&D, and find that both have dynamic profiles when it comes to productivity growth and also with regards to profitability; output; capital investment; trade; research and development; employment; and, labour quality. Science-based strategies are not one-dimensional. They involve both the production and use of high-tech machinery and equipment. They also simultaneously involve the use of highly trained science workers. Although both ICT and R&D underpin innovative activity, other inputs are also important. Baldwin and Hanel (2003) note how innovation strategies and inputs to the innovation process differ substantially across manufacturing sectors. In some industries, they are centered on R&D and new product development. In others, these strategies involve incorporating new process technology and making use of the new intermediate products developed in other industries. Innovation profiles are tailored to the industry environment in which they are found and thus often differ across industries. Some industries focus on R&D scientists—and create new knowledge that is manifested in new products that are sold to other industries. Others focus on other types of scientists—engineers—to incorporate new products and materials discovered in other industries into the production process of industries making use of these discoveries—either as new machinery and equipment or as new intermediate materials. The latter involves expenditures generally not classified as R&D but that have many of the same properties, in that they create assets and involve substantial scientific effort.
This study continues the focus of our previous studies on transformational change. It complements previous studies in that it examines the importance of the investments being made in the innovation process, but it extends the focus beyond just hardware like ICT that has provided the focus of much of macroeconomic productivity analysis and looks at a range of expenditures on intangibles. It complements previous studies on the Knowledge economy in that is interested in quantifying the amount of investment that is made in knowledge capital or what has come to be called Intangibles. And in doing so, it parallels previous work in that it recognizes substantial in-house investments are made here in workers—but not just in developing their skills, rather in having them develop new knowledge that the firm can harness for innovative activity. Investments are made both on R&D science-related investments and in non-R&D science-related investments. The former focuses on basic science and early stages of knowledge development for new products and processes. The latter are more closely related to the applied sciences. Investments are also made by purchasing knowledge from outsiders—in the form of R&D services, patents, licences, blueprints, designs, and technological know-how.

The Canadian Productivity Review - 12 - Statistics Canada – Catalogue no. 15-206-X, no. 026
2 Intangible Investments
Unlike investments in machines, investments in knowledge capital involve an investment in an asset that is less tangible. An investment in a machine provides the firm with a capability to produce future goods. So too does an investment in knowledge. A visitor to a plant that has recently invested in a new machine can see the machine. But he is less likely to see the asset that results from investments in assets whose major benefit is an increase in knowledge, unless that knowledge has been embodied in an asset like a patent, and not all innovations are patented (Baldwin and Hanel 2003). Intangible assets take many forms. The most familiar are research and development (R&D) expenditures. These are primarily expenditures on the wages and salaries of scientists—but they also include expenditures on intermediate materials, machinery, equipment and buildings required for the scientific process. R&D expenditures produce new and improved products and processes whose future value to the firm depends on how the market values those new products or process. Expenditures on computer software have similar characteristics. Some software is purchased; other software is created within the firm by skilled software programmers. Many of these expenditures have a value that lasts into the future. Placing a value on in-house intangible expenditures is important if the balance sheet of firms is to value a firm’s assets correctly, but measuring this value posed problems the accounting profession because the ultimate value of the assets is difficult to ascertain. For one thing, markets for knowledge are imperfect and not transparent. This is because the knowledge is often only useful in combination with other specialized inputs of the firm (its employees), and is not easily transferable except via a takeover of the firm as a whole. This reduces the scope of third-party markets for the product of intangible investments. In addition, even where there are third-party markets for the asset or for the asset when combined with other assets via a takeover, the gestation period for the investment may be longer than one year and the interim value of expenditures is difficult to determine. For example, companies that develop software sometimes do not fully realize the value of the software until they are acquired by other firms that then incorporate the new products into their own offerings.1 Intangibles also offer challenges to national accounting statisticians who calculate gross domestic product (GDP) by subtracting intermediate expenditures from total revenues to obtain value-added at the industry level, which is then aggregated across all industries to generate an economy-wide estimate of GDP. The size of industry value-added will be determined by what expenditures are classified as intermediate expenditures on materials. Expenditures by firms can be considered either as intermediate expenditures or as investments (expenditures that will create value in the future). Only the former are subtracted from revenues to create industry value-added. If the expenditure is not an intermediate expenditure, it needs to be capitalized, not expensed, and shifting expenditure from the intermediate category to the investment category will increase GDP (Jackson 2003). Depending on past investment profiles, it may also change the growth rate and estimates of productivity growth. While expenditures on machinery and equipment, buildings and engineering construction (pipelines, rail lines, dams) are considered as investments in most National Accounts, many other expenditures that have an investment characteristic are not. There are exceptions. At present, the System of National Accounts in Canada capitalizes expenditures on exploration for
1. See Aboody and Lev (1998) for a description of the issues surrounding the capitalization of software.

The Canadian Productivity Review - 13 - Statistics Canada – Catalogue no. 15-206-X, no. 026
oil, gas and minerals as well as software, and there are plans to capitalize research and development. However, there is a range of other expenditures—from advertising, to training, to general management expenses—that the economics profession considers as having an investment component that is not capitalized. Studies done for other countries (Corrado, Hulten and Sichel 2005, 2006); (Jalava, Ahmavarra and Alanen 2007) suggest that intangible investments loom large by comparison to tangible investments. Moreover, when they are appropriately capitalized, the picture of growth and its origins changes dramatically. In particular, the ratio of investment to GDP rises substantially and the rates of savings to GDP also increase. This paper investigates the importance of intangible capital expenditures for Canada and the effect of reclassifying those expenditures that are at present generally treated as intermediate expenditures to investment expenditures. In this paper investments are treated synonymously with expenditures. No adjustments are made for imports or exports, nor are shares used in an attempt to split expenditures into intermediate expenditure as opposed to output, as is done in Corrado, Hulten and Sichel (2005). Rather than employ ‘rules of thumb’ to determine the share of expenditures that may be intermediate expenses, in those areas where estimates may contain a proportion of intermediate expenditures we expect that depreciation rates will be higher. Conceptually this allows us to view all knowledge-based expenditures as ‘investments’, some of which depreciate very quickly. If this view is extended to all goods and services, then intermediate inputs are simply investments with a 100 percent depreciation rate. Intangible assets may have more of a transitory nature that than other types of investments, and using a depreciation rate rather than an arbitrary split between intermediate expenditures and investment is a preferable way of dealing with this issue2. Section 3 discusses the categories of intangibles that are used in this paper and the rationale for doing so. Section 4 discusses the size of intangible investments. It begins by examining the composition of aggregate intangible expenditures for Canada. Comparisons are then made between tangible and intangible investments and the differences across industries in the composition of intangibles. Section 5 concludes.
3 Intangible Expenditures
3.1 Categories of Intangibles
Generating an estimate of intangible investment requires assumptions about what constitutes an intangible expenditure and a reliable data source. The 1993 System of National Accounts (SNA 1993) states that:
Fixed assets are tangible or intangible assets produced as outputs from the production process that are themselves used repeatedly or continuously in other processes of production for more than one year. (Section 10.31)
This paper focuses on three categories of fixed intangible assets: science-related intangible investments; mineral exploration investments; and advertising.
2. We will deal with depreciation rates and estimates of capital stock in a subsequent paper.

The Canadian Productivity Review - 14 - Statistics Canada – Catalogue no. 15-206-X, no. 026
The paper differs from previous attempts to investigate the role of intangible assets in three ways. The first difference is that other attempts to estimate intangibles have often made use of ad-hoc sources of data—derived from advertising councils, and from industry sources.This paper makes use of data that are derived from internally consistent and comprehensive Statistics Canada data sources. Data on each of the areas covered here are available from a number of internal Statistics Canada sources and are already incorporated in the Input-output tables. Series on intangible expenditures are provided to the Input-output Accounts by individual industry surveys that collect detailed data on inputs like advertising and other purchases. Additional sources, such as data on payments abroad for research and development (R&D) and licences, come from the Balance of Payments. Statistics Canada collects detailed investment data at the industry level that is used to track investments on mineral exploration. All of this information is collected periodically—some annually, some from occasional surveys. It is incorporated into the estimates of gross output; value-added; materials and service inputs that are used to create annual estimates of GDP at the industry level in the Industry Input-output Accounts. More importantly, these industry accounts construct both industry Make and Use tables, by commodity, which provide detail on both commodities produced and commodities used by industry. This detail is used here to examine the extent to which advertising and science services are purchased by industry. Other information on Own-account science expenditure is available from detailed industry data on employment and wages of individual occupations derived from the Census of Population and from the Labour Force Survey. Finally, Statistics Canada has developed concordances that allow various data to be integrated together into a set of industry categories that are time-series coherent. These concordances are used here. While others have included a larger set of categories (in particular by extending the data to management and training), the quality of the data in these areas makes the evaluation of the conclusions derived there from somewhat problematic. In some cases, other studies have had to make use of third-party sources on research and development or advertising that are not integrated into the System of National Accounts’ Industry estimates. This paper makes use of the Canadian System of National Accounts that has already carefully measured many of the relevant categories of intangibles—but have included many of them as part of intermediate expenditures or as wage payments. We choose to commence our investigations by examining those categories of intangibles where relatively high quality data exist.3 Statistics Canada data sources in these areas provide a solid basis on which to rest estimates of expenditures in each of these areas, since both inputs and outputs are carefully balanced within the Input-output Accounts. In what follows, we discuss what is included in each category that we consider in this paper and briefly discuss the source of the data series used. More information on the data is contained in the appendix. The second novelty contained in this paper pertains to the breadth of the innovation expenditures considered. The paper extends the R&D category that normally receives most of the attention to a broader area of science-related expenditures more fully encompassing science-related innovation expenditures.4 As is argued in the next section, evidence suggests that R&D, as it is normally measured, covers only a portion of the total science-related expenditures required to introduce long-lived innovations in a firm.
3. Further work will extend our investigations into areas where measurement problems are greater. 4. See Baldwin, Beckstead and Gellatly (2005) for arguments on what needs to be included to fully capture science-
based innovation expenditures.

The Canadian Productivity Review - 15 - Statistics Canada – Catalogue no. 15-206-X, no. 026
In the following section, we motivate our focus—briefly with regards to advertising, mineral exploration expenditures and in somewhat greater detail for our science component—because our approach is more novel in this area.
3.1.1 Science and Innovation
Our first focus is on intangible investments on science. At its core are expenditures on research and development, although they only account for a portion of total science-related expenditures. There is a widely-accepted definition of R&D, established by the Organisation for Economic Cooperation and Development’s Frascati manual (OECD 2002). Statistics on R&D expenditures, collected in accordance with the Frascati manual, are published for a large number of countries as part of the OECD’s Main Science and Technology Indicators; however, these expenditures underestimate the total amount that domestic businesses spend on science-based innovation capital. R&D expenditures develop new knowledge and encompass "work directed towards the innovation, introduction, and improvement of products and processes" (Canadian Oxford Dictionary 2001). These expenditures are an essential part of the process by which new products, services and processes are developed and commercialized. As such, R&D expenditures have long-lasting value and are generally considered to be intangible investments.5 Unfortunately for our purposes, the traditional definition of R&D excludes much expenditure on scientific activities that have a long-lasting effect—primarily in the applied engineering area. The Statistics Canada definition of research and development, which has been adopted to meet the Frascati standard, includes all expenditures that support the systematic investigation in natural and engineering sciences undertaken to achieve scientific or commercial advances that are likely to be “patentable” (Statistics Canada 1991). Frascati outlines the basic criteria for distinguishing R&D from other innovation expenditures as “an appreciable element of novelty and the resolution of scientific and/or technological uncertainty” (OECD 2002:34). The emphasis on ‘patentable’ or ‘appreciable’ degree of novelty restricts most estimates of R&D expenditures to only a subset of total innovation expenditures. Innovation expenditures range from what some refer to as early-stage expenditures on basic new knowledge, to later-stage expenditures that facilitate the integration of innovations into working production systems involving more mundane, but nevertheless essential, tasks. Two issues must be dealt with when classifying innovation expenditure as falling under R&D or not. The first has to do with dividing up a stream of innovation expenditures that range from the earliest stage of ‘basic’ research, applied research, and experimental development that are considered as R&D, to the latter stages that only involve practical implementation. In Frascati, basic research is defined as experimental or theoretical work undertaken primarily to acquire new knowledge. Applied research is defined as original investigation to acquire new knowledge directed towards a specific practical aim or objective. Experimental development is defined as systematic work, drawing on existing knowledge gained from research and/or practical experience, which is directed towards producing new materials products. Each of these early stages that fall within the definition of R&D involves considerable uncertainty. The latter stages
5. The 1993 SNA manual indicated that it considered R&D to be an investment but did not recommend that it be
capitalized because of controversy around how narrowly it should be defined. The revised manual has now accepted that it should be capitalized, but included as a Satellite Account.
The Canadian Productivity Review - 16 - Statistics Canada – Catalogue no. 15-206-X, no. 026
are distinguished from the first in that uncertainty has been resolved and only implementation of concept is still required.6 The second issue has to do with deciding if the innovation involves an “appreciable” degree of novelty. Novelty has many dimensions. The innovation can be a world-first, a country-first or just a first for the firm involved. In Canada, only a small percentage of innovations are classified by innovators as world-firsts (Baldwin and Hanel 2003). If novelty is defined as a world-first, very little of scientific expenditures would be classified as R&D. On the other hand, novelty might be defined as a major breakthrough, although Hollander (1965), in his study of Dupont’s Rayon plants, found that most of the changes that led to productivity gains in rayon were incremental in nature. Use of this criterion to define novelty would leave little as R&D. Companies that respond to R&D surveys must first decide if their project warrants sufficient novelty to be included and if so, how to divide a project’s expenditures between those done before and after ‘uncertainty’ had been resolved—a difficult decision after the fact. How companies make these decisions is not well understood—nor whether the decision criteria are the same across companies. Nevertheless, what is relevant for this paper is that expenditures reported under R&D cannot be expected to fully cover all relevant innovation expenditures because it is not expected that they do so. The fact that a scientific expenditure may be incurred in part of the process where uncertainty has been more or less resolved or in the process of less than completely novel new products does not obviate either the usefulness of these expenditures or the need to capitalize them in the National Accounts, if they have long-term impact, (that is, if their effect lasts more than a year). Others who have studied the innovation process have made the point that there are considerable scientific expenditures required for innovation that are outside of what is traditionally included in the R&D category. In their case studies of the innovation process, Mowery and Rosenberg (1989) stress that inventions are often the result of discoveries in production and engineering departments. These discoveries are then turned over to research departments for a better understanding of the phenomenon so that they can be commercialized—in particular, so that products resulting from these discoveries can be mass produced. Once the research department has more fully investigated the science behind the invention, production and engineering departments are called upon to transform inventions into viable commercial products and processes. The contribution of production and engineering departments is critical to the overall success of the innovation process, and in many cases, involves path-breaking work, even though the expenditures in these areas are not consistently included within the ambit measured by traditional R&D measurement programs. Rosenberg (1976) has emphasized the importance of engineering departments in developing innovations steming not so much from new products, but from innovations associated with the evolution of production processes (that create process as opposed to product innovations), especially in industries producing standard materials or durable consumer goods. In these industries, operating conditions are difficult and economies of scale depend on the maintenance of capacity in each part of an integrated system of processes. The breakdown of any segment of the production process threatens the integrity of the whole. As Rosenberg recounts, production-engineering facilities are used to identify technical imbalances and resolve bottlenecks that, in turn, allow for improvements in productivity.
6. Peleg (2003) notes that the tax code in the United Kingdom specifically excludes from its definition of R&D
expenditures on commercial development that do not involve scientific or technological investigation or that occur after the resolution of uncertainties.
The Canadian Productivity Review - 17 - Statistics Canada – Catalogue no. 15-206-X, no. 026
These activities involve expenditures both internal and external to a firm. Within a firm, expenditures on scientific activities consist of the payment of wages and salaries of scientists and related support personnel, payments of capital services derived from the tangible capital used by scientists, and payments for needed materials. Expenditures are also made for know-how in the form of outside consulting and other forms of technological know-how, via licences or patents. Evidence from innovation surveys indicate these other expenditures are at least as important as the core expenditures classified as R&D. Confirmation of the importance of non R&D innovation expenditures is provided by a range of survey evidence. Baldwin, Beckstead and Gellatly (2005) report that Canadian firms think of their innovation investments as involving more than just R&D. Using survey evidence for Israel, the United States and Canada, (Kamin et al. 1982) provide evidence that non-R&D science-related expenditures that do not include capital investments account for about half of total innovation expenditures. Using a survey of new Canadian firms from a wide range of industries Johnson, Baldwin and Hinchley (1997) report, that while substantial investments were made in R&D, even more substantial science-related investments occurred elsewhere in the form of expenditures for acquisition of technological know-how. These exclude investments in machinery and equipment but include consulting services from engineers, architects, licences, patents and other technological ‘know-how’. In industries which are less R&D intensive (the majority of industries), technology expenditures outside machinery investments are twice as important as expenditures on R&D. Even in those industries where R&D intensity is higher, technology expenditures are half as large as R&D expenditures. Outside these science-related expenditures are the marketing costs associated with introducing innovations. The same story is revealed by evidence from specialized innovation surveys. Baldwin and Hanel (2003) use the 2003 Survey of Innovation and Advanced Technology that covered the Canadian manufacturing sector and report that only 17% of a firm’s most important innovation expense involved basic and applied research while, 10% involved the acquisition of technology (e.g., patents, trademarks, licenses, specialist consulting services, disclosure of know-how). The importance of non R&D innovation expenditures has been reported using Innovation surveys in other countries. Evangelista, Sandven, Sirilli and Smith (1997a) report on innovation costs taken from European Innovation surveys. The costs are broken down into three major categories—investment in plant, machinery and equipment; R&D; and non-R&D. The latter includes trial production; product design; market analysis; and licences or patents. In keeping with the Canadian results reported above, the non-R&D innovation investments are generally at least as large as R&D investments. Outside of machinery and equipment, R&D captures only about half of the investments that are required for innovation. One way to estimate the size of the science-related expenditures outside of R&D is to compare the total wage and salaries paid to all scientists with the wages and salaries paid to R&D scientists. Baldwin, Beckstead and Gellatly (2005) make use of earnings data derived from the Census of Population to measure the embodied contribution that specialized scientific workers make to the development of intangible science-based capital generated as part of the innovation process, and to compare it to the wages of R&D scientists derived from R&D surveys. There is a clear precedent for such an approach. In the Canadian System of National Accounts (SNA) and in the United States, the wages and salaries of programmers are used to proxy the
The Canadian Productivity Review - 18 - Statistics Canada – Catalogue no. 15-206-X, no. 026
contribution that the development of in-house software makes to aggregate investment flows. Baldwin, Beckstead and Gellatly (2005) adopt this approach, but extend it beyond just R&D personnel by using Census of Population Data to encompass a broader group of science workers who produce knowledge capital important to the production process—all scientist and engineers (computer and mathematical scientists, life science, physical sciences, social sciences, and engineers). Different categories of science workers contribute to the formation of intellectual capital—research scientists (by engaging in formal R&D); engineering consultants, technologists and technicians (by incorporating new technologies into existing production systems). By examining the number of workers and their remuneration in occupational science and engineering (S&E) (categories that are commonly seen to produce knowledge capital of a scientific nature), the importance of this process to an economy can be measured. The Canadian S&E estimate so calculated is almost twice as large as the official 1996 estimate of R&D personnel. R&D represents a core knowledge-creating function, but as Rosenberg argued and the innovation surveys show, R&D is far from the only means by which firms invest in the development of science-related intellectual capital associated with innovation. It follows therefore, that R&D scientists make up only a portion of all scientists. Differences in employment between R&D personnel and S&E workers also translate into significant differences in earnings. In Canada, wages and salaries paid to R&D personnel is only one third the size of the total earnings of all S&E employees in 1996. There are considerable expenditures on science personnel that are not captured in the wages and salaries of R&D personnel. Ample evidence then exists, both from historical studies of the innovation process and from statistical surveys of industry participants, that science expenditures outside of R&D are important. This is partly because firms incur considerable wage expenditures on scientists outside of the narrow definition normally applied when defining R&D, but also because firms purchase considerable intellectual capital from outside the firm. This is often not included in R&D estimates that focus only on activities conducted within the firm. Baldwin, Beckstead and Gellatly (2005) provide an indication of the size of the latter using Canadian balance of payments data that capture payments from abroad that Canadian firms make for:
a) R&D services, covering payments for basic and applied research and experimental development of new products and processes;
b) royalties and license fees, covering payments for the use of intangible, non-produced, non-financial assets and proprietary rights (such as patents, copyrights, trademarks,industrial processes, franchises, etc.) and with the use, through licensing agreements, of producedoriginals or prototypes (such as manuscripts and films); and
c) computer services, including payments for hardware and software consultancy;provision of advice and assistance on matters related to the management of computer resources; analysis, design and programming of systems ready to use; technicalconsultancy related to software development, supply and documentation of customized software; and the maintenance of other support services such as training.7
7. None of these expenditures are included in the official R&D statistics that consider only work performed in
Canada—see Baldwin, Beckstead and Gellatly (2005).

The Canadian Productivity Review - 19 - Statistics Canada – Catalogue no. 15-206-X, no. 026
In 1999, expenditures made abroad by Canadian firms in these three areas are 76% as large as their R&D expenditures in Canada. And to the extent that firms located in Canada are purchasing similar services from other firms within Canada, the amount spent by any firm on science inputs from other firms would be even larger relative to the expenditures that they perform on conducting their own R&D.
3.1.2 Mineral Exploration Expenditures
Science-based expenditures associated with R&D have fascinated analysts partially because of their association with the presumed modernity of laboratory facilities. But the expenditures that resource-based economies make on mineral exploration have characteristics that mean they should also be classified as intangible assets. These expenditures provide new information that is useful for production many years after they are made. Early–stage exploration expenditures are used to develop knowledge about where mineral resources are found and on the economic properties of the mineral or petroleum reserves. Like R&D, these expenditures often provide little in the way of tangible assets. It is in the later stage of development expenditures when mine heads and drill holes provide more tangible forms of development that are more closely associated in time with production. R&D can be viewed as early stage investments in innovation that are meant to reduce uncertainty. Exploration expenditures do the same for the resource economy. The early–stage exploration expenditures create knowledge assets—assets having economic value. The assets are often traded as rights to exploit a resource or as knowledge about the underlying geology that can be used in other exploration ventures. In the former case, value can be deduced from transactions in land rights. In the latter case, the value is embedded in the value of the firm and in the individuals who acquire the capability of interpreting geological information. In many cases, the exploration expenditures provide knowledge about an asset whose economic exploitation must await other events that change the economics of exploitation, such as an increase in the price of the mineral, or the development of infrastructure that would make the development of the asset economic. These mineral discoveries or the assets produced can pre-date production by many decades. For example, offshore oil fields close to Newfoundland were found as a result of drilling expenditures incurred in the 1980s but were not brought into production until after 2000.
3.1.3 Advertising Expenditures
Advertising expenditures provide firms with a reputation which, if extended beyond the present, has an impact on the value of the firm and should be considered an investment in intangibles. They provide brand value that has long been recognized as a valuable intangible asset. Advertising expenditures, like mineral exploration expenditures, involve a mix of categories that provide short-run effects and longer-run impacts. The transmission of information on the latest product prices via advertising primarily has a short-run impact; however, many expenditures serve to instil long-run loyalties and enhance the value of the firm. Studies in marketing provide numerous examples of trademarks having long-lasting effects—from the Morton salt trademark to the baking soda cow—that serve to engender sales to generations of consumers. Iconic Canadian brands include Hudson Bay, Canadian Tire, Tim Hortons, and Cirque de Soleil

The Canadian Productivity Review - 20 - Statistics Canada – Catalogue no. 15-206-X, no. 026
(Hanna and Middleton 2008). The value of these brands is revealed by the high price that is placed in acquiring product lines by large companies specializing in marketing a broad range of consumer product lines.
3.2 Implementation
3.2.1 Science Expenditures
In this study, we measure total innovation expenditures on science using four components—research and development; software; other Own-account Science, and; the purchase of scientific services and intellectual property. First we start with estimates of research and development, primarily based on the estimates of research and development expenditures developed by the Science, Innovation and Electronic Information Division of Statistics Canada. These expenditures include the wages and salaries of scientists, purchased intermediate materials, and; capital services from investment in buildings and machinery and equipment. Adjustments are made to the series to accord with recommendations of the SNA (2008) to fit into definitions required to be compatible with the National Accounts. In particular, the investments in physical capital are accumulated into capital stock and the capital services associated with this stock are added to wages and salaries. More detail is provided in the appendix. The survey-based R&D estimates are augmented to include estimates of ‘other professional, scientific and technical services’ from the Input-output accounts. The latter includes, for example, payment for research and development services, business consulting services of a wide variety (from general management, to finance, to strategic business plants, to accounting, to the development of advertising strategies). Second, we also include all expenditures on software in the general science category. These are taken directly from the Input-output Accounts. These estimates include wages and salaries of software engineers that proxy Own-account production, purchases of packaged software and programming services. The software expenditures are consistent in aggregate with the estimates produced in Jackson (2003). Third, we create a category corresponding to the Own-account ‘other’ science discussed previously. Own-account science and engineering expenditures consist of wages and salaries devoted to scientists and engineers in each year. This category is created from occupational data on scientists taken from benchmarks developed from Census data interpolated on an annual basis using the Labour Force Survey.8 The category consists of total wages and salaries of all scientists minus the wage component that is already included in research and development and in software. Fourth, we develop a category that takes into account the purchased services previously outlined as so important to the innovation process. These consist of two main types of assets. The first is that involving purchased intellectual property that involves transferable property rights—primarily the royalties and licence fees that are expended on intellectual property. The second type of asset involves purchased inputs that include architect, engineering and scientific
8. Using the methodology developed in Beckstead and Gellatly (2003b).
The Canadian Productivity Review - 21 - Statistics Canada – Catalogue no. 15-206-X, no. 026
services. These include expenditures related to construction of buildings and engineering services related to roads, electrical, rail and other engineering works.9 3.2.2 Advertising Expenditures
Advertising estimates are composed of business expenditures on items like advertising in print media; on radio and television; promotions and contests; business flyers and signs; advertising signs and displays; advertising services; advertising, and; promotions. Estimates here are taken from the Input-output tables developed by Statistics Canada for calculating industry GDP using the value-added approach. 3.2.3 Mineral Exploration Expenditures
Mineral exploration expenditures consist of all exploration; drilling; and geological and geophysical expenditures associated with the predevelopment stage of mineral and oil gas industry. The data are taken from the Investment and Capital Stock estimates that feed into the National Accounts. See the appendix for more details.
3.2.4 Time Series Consistency
The source data for the intangible estimates is drawn from multiple sources and in some cases, the sources have different taxonomies over time in both the industry and commodity dimensions. In a number of cases, the disaggregated data employed to calculate the industry estimates have time series inconsistencies where classifications change. The discontinuities have been removed. The expenditure estimates and data sources for each category are discussed in detail below and presented in Table 1.
9. For a discussion of the importance of engineering investments, see Baldwin and Dixon (2008).

The Canadian Productivity Review - 22 - Statistics Canada – Catalogue no. 15-206-X, no. 026
Table 1 Intangible assets by composition and data source Asset Comprises Data source Current treatmentAdvertising Advertising in print
media, radio andtelevision; promotions
and contests;business flyers; signs
Input-output tables ofStatistics Canada
Intermediateexpenditure
Purchased scienceand engineeringservices
Royalties;licensing fees;
architectural services
Input-output tables ofStatistics Canada
Intermediateexpenditure
Mineral exploration Exploration drilling;geological and
geophysicalexpenditures;
Investment andCapital Stock
Division estimates
Capitalized as aninvestment
Software Purchased software (pre-packaged andcustom designed);
own-account software
Final Demand Input-output tables of
Statistics Canada
Capitalized as aninvestment
Research and development
Wages and salaries ofindividuals involved
in research anddevelopment, purchased
materials, investment;other scientific services
Science, Innovation,Electronic Information
Division of StatisticsCanada / Input-output
tables of StatisticsCanada
Not currentlyincludedin gross
output estimates / intermediate expenditure
Own-account science and engineeringservices
Wages and salaries ofindividuals classified as
scientists andengineers net of
own-account softwareexpenditures and
research anddevelopment wages
and salaries
Labour Force Surveyand the 1981, 1986,
1991, 1996 and 2001censuses
Not currentlyincluded in
gross outputestimates
The current practice for the Canadian System of National Accounts is to treat software and mineral exploration as investments while advertising and purchased science and engineering services are treated as intermediate inputs. There are currently no Own-account research and development or scientific expenditures in estimates of industry value-added. The overall estimate of intangible expenditures reported here is produced by combining all estimates. In contrast, tangible investments are measured by the present total investments in machinery and equipment (minus software), buildings, engineering (minus exploration), and software investment. Estimates of intangibles in Canada are disaggregated by industry and by expenditure type. The industries considered here are business sector S-level industries that correspond to 2-digit North American Industry Classification System (NAICS) industries except for Finance, Insurance and Real Estate, which is a composite of NAICS 52 (Finance and Insurance), NAICS 53 (Real Estate and Leasing and Rental) and NAICS 55 (Management of Companies and
The Canadian Productivity Review - 23 - Statistics Canada – Catalogue no. 15-206-X, no. 026
Enterprises). Industries in Canada having a large public component are not considered. The business sector aggregate adopted here does not include public administration (NAICS 91), Education (NAICS 61) or Health Care and Social Assistance (NAICS 62). The industry disaggregation is accomplished using data from the Input/Output accounts and the census. Labour income, based on Own-account estimates taken from Census and Labour Force Survey data is benchmarked to the labour income in the Productivity Accounts. Capital Services are estimated by taking the ratio of operating surplus per industry and multiplying it by the percentage of industry tangible capital that is purchased for the R&D process.
4 Intangible Investments in Canada
4.1 Total Economy
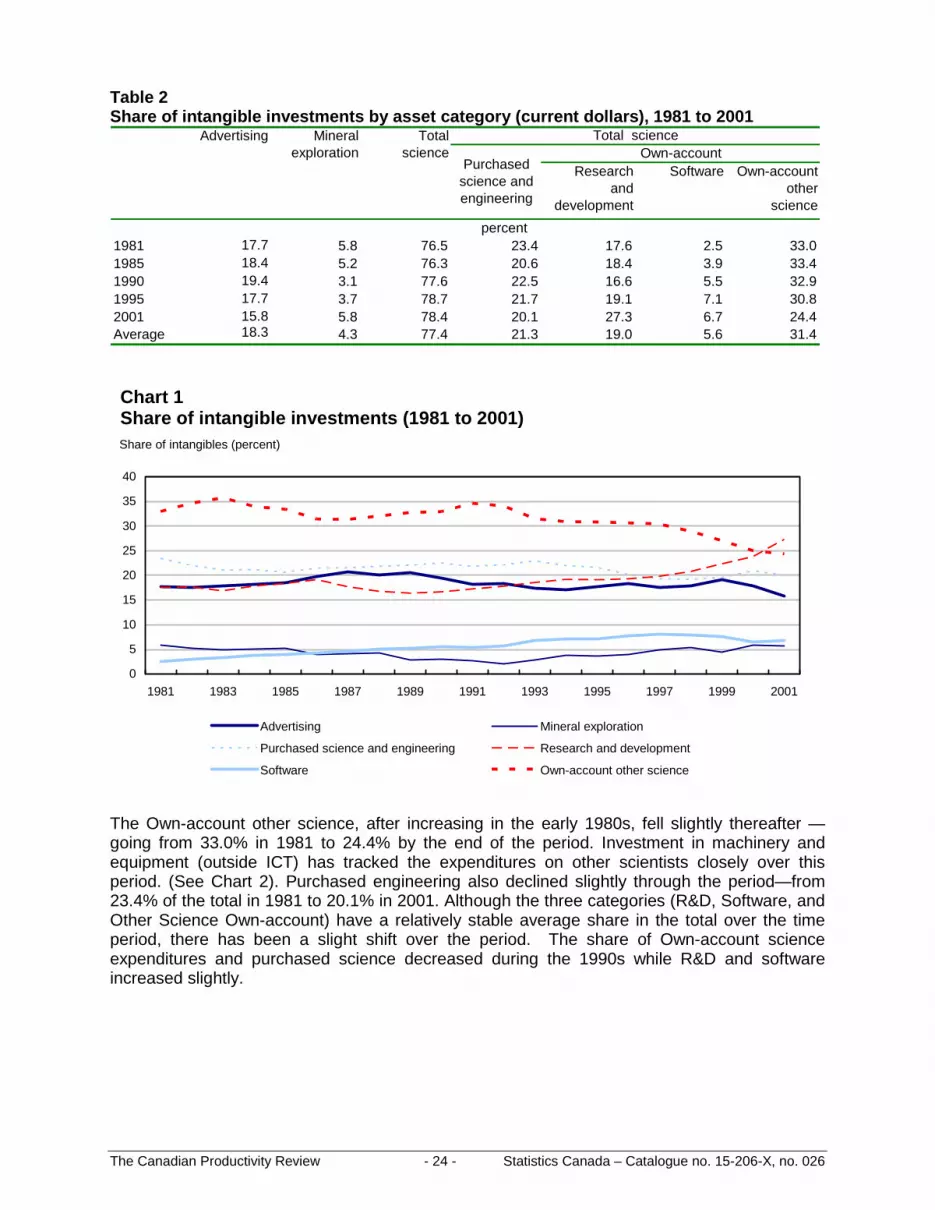
The share of intangible investments by three main categories: advertising, mineral exploration and all science (Research and development [R&D] software, own-account, other science and purchased services) is presented in Table 2. Science and innovation intangible expenditures are the most important—accounting for an average of 77.4% of total intangible investments over the period 1981 to 2001. Science related innovation expenditures have increased their share over time, rising from 76.5% in 1981 to 78.4% in 2001. Advertising is second with an average share of 18.3% and its importance varies procyclically. Mineral exploration is third, making up on average 4.3% of intangible expenditures. The share of mineral exploration fell from its levels of the early 1980s to lower levels in the mid 1980s but has steadily grown since then (Chart 1). Investment in software is the smallest component of all intangibles for the sample period, having a share of 2.5% in 1981 and increasing to 6.7% by the end of the period. In keeping with the onset of the computer revolution, the share of this component more than doubles over the period. While R&D garners most of the attention in innovation studies, it accounts for only between 17.6 and 27.3 percent of total intangible investments, although its share grew in the late 1990s. The Own-account other science-related investments are considerably more important than R&D. Even the purchased science and engineering component is at least as large as R&D. A portion of this comes from imports of software.10
10. The importance of R&D would be even smaller if exports of R&D were removed from the Own-account R&D
expenditures, as is done in some satellite accounts of R&D.
The Canadian Productivity Review - 24 - Statistics Canada – Catalogue no. 15-206-X, no. 026
Table 2 Share of intangible investments by asset category (current dollars), 1981 to 2001
Research and
development
Software Own-accountother
science
1981 17.7 5.8 76.5 23.4 17.6 2.5 33.01985 18.4 5.2 76.3 20.6 18.4 3.9 33.41990 19.4 3.1 77.6 22.5 16.6 5.5 32.91995 17.7 3.7 78.7 21.7 19.1 7.1 30.82001 15.8 5.8 78.4 20.1 27.3 6.7 24.4Average 18.3 4.3 77.4 21.3 19.0 5.6 31.4
percent
Total scienceOwn-account
Advertising Mineralexploration
Totalscience
Purchased science and engineering
Chart 1 Share of intangible investments (1981 to 2001)
0
5
10
15
20
25
30
35
40
1981 1983 1985 1987 1989 1991 1993 1995 1997 1999 2001
Advertising Mineral exploration
Purchased science and engineering Research and development
Software Own-account other science
Share of intangibles (percent)
The Own-account other science, after increasing in the early 1980s, fell slightly thereafter — going from 33.0% in 1981 to 24.4% by the end of the period. Investment in machinery and equipment (outside ICT) has tracked the expenditures on other scientists closely over this period. (See Chart 2). Purchased engineering also declined slightly through the period—from 23.4% of the total in 1981 to 20.1% in 2001. Although the three categories (R&D, Software, and Other Science Own-account) have a relatively stable average share in the total over the time period, there has been a slight shift over the period. The share of Own-account science expenditures and purchased science decreased during the 1990s while R&D and software increased slightly.

The Canadian Productivity Review - 25 - Statistics Canada – Catalogue no. 15-206-X, no. 026
The decline of other Own-account science comes mainly from a switch in the proportion of total scientists to the software category. This is in keeping with other findings that investment in machinery and equipment over this period switched from more traditional investment goods to ITC (Baldwin and Gu 2007).
Chart 2 Own-account other science and machinery and equipment investments (1981 to 2001)
0
10
20
30
40
50
60
70
80
90
1981 1983 1985 1987 1989 1991 1993 1995 1997 1999 20010
5
10
15
20
25
30
35
40
Machinery and equipment (excluding software) Own-account other science
Machinery and equipment (billions of dollars) Other science (billions of dollars)
Intangible investment in Canada has expanded by an average of 8.2% per year from 1981 to 2001, rising four fold from around $30 billion in 1981 to $144 billion in 2001 (Chart 3). Software investment expanded most rapidly, with an average annual growth of 13.9% per year. R&D investment had the second highest annual average growth rate (10.8%), followed by mineral exploration (10.4%), advertising (7.7%), purchased science and engineering services (7.5%) and Own-account science and engineering services (6.6%).
Analysis of the determinants of economic growth often focuses exclusively on investment in tangibles. Recent studies on the knowledge economy suggest that expenditures on knowledge workers have grown more quickly than total employment (Beckstead and Vinodrai 2003; Baldwin and Beckstead 2006). Since many knowledge workers produce intangibles, growth in intangibles that come from wage payments should also have been relatively high. At issue is the extent to which it is larger than the growth in investments in tangible assets, like machinery and equipment, buildings, and engineering structures. If so, the omission of intangibles from total investment will underestimate the rate at which overall investment has been growing.

The Canadian Productivity Review - 26 - Statistics Canada – Catalogue no. 15-206-X, no. 026
Chart 3 Intangible investment composition (1981 to 2001)
0
20
40
60
80
100
120
140
160
1981 1982 1983 1984 1985 1986 1987 1988 1989 1990 1991 1992 1993 1994 1995 1996 1997 1998 1999 2000 2001
Advertising Mineral exploration
Purchased science and engineering Research and development
Software Own-account other science
billions of dollars
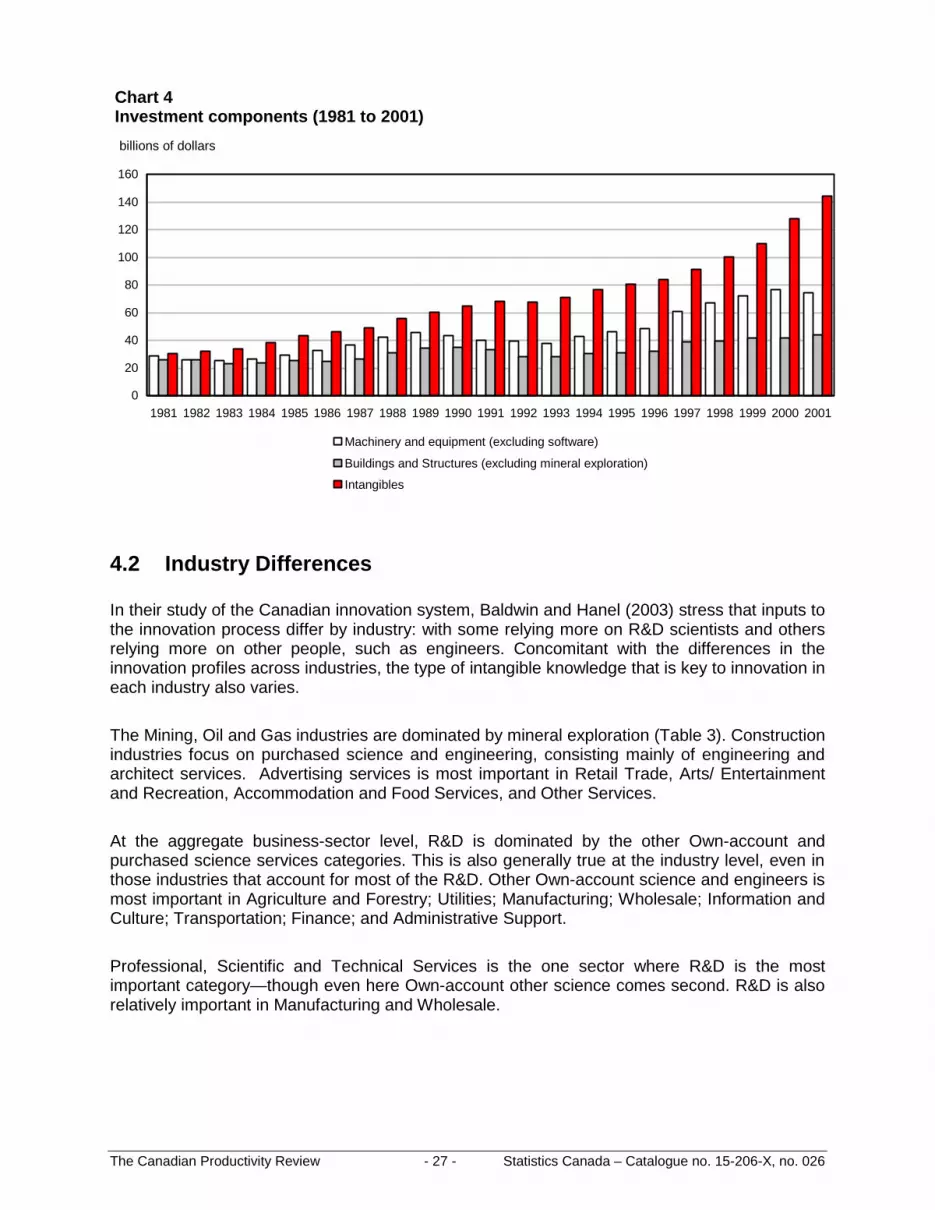
Investments in tangible capital, machinery and equipment or buildings and structures, has not kept pace with intangible investment. Investment in machinery and equipment rose at an average rate of 5.2% while buildings and structures only increased at an annual average of 2.9% over the period (Chart 4). As a result, although expenditures on all three capital types are roughly equal in the early 1980s, by the late 1990s and early 2000s, investments in the intangible assets considered here are around approximately double those in machinery and equipment, and four times greater than investments in buildings and structures. Moreover, investments in intangibles are less cyclical than investments in tangibles. The recession of the early 1990s saw a relatively larger pullback in investment in tangibles than intangibles. By the end of the decade, the difference between the absolute level of investment in intangibles and tangibles had widened considerably since the 1980s.
The Canadian Productivity Review - 27 - Statistics Canada – Catalogue no. 15-206-X, no. 026
Chart 4 Investment components (1981 to 2001)
0
20
40
60
80
100
120
140
160
1981 1982 1983 1984 1985 1986 1987 1988 1989 1990 1991 1992 1993 1994 1995 1996 1997 1998 1999 2000 2001
Machinery and equipment (excluding software)
Buildings and Structures (excluding mineral exploration)
Intangibles
billions of dollars
4.2 Industry Differences
In their study of the Canadian innovation system, Baldwin and Hanel (2003) stress that inputs to the innovation process differ by industry: with some relying more on R&D scientists and others relying more on other people, such as engineers. Concomitant with the differences in the innovation profiles across industries, the type of intangible knowledge that is key to innovation in each industry also varies. The Mining, Oil and Gas industries are dominated by mineral exploration (Table 3). Construction industries focus on purchased science and engineering, consisting mainly of engineering and architect services. Advertising services is most important in Retail Trade, Arts/ Entertainment and Recreation, Accommodation and Food Services, and Other Services. At the aggregate business-sector level, R&D is dominated by the other Own-account and purchased science services categories. This is also generally true at the industry level, even in those industries that account for most of the R&D. Other Own-account science and engineers is most important in Agriculture and Forestry; Utilities; Manufacturing; Wholesale; Information and Culture; Transportation; Finance; and Administrative Support. Professional, Scientific and Technical Services is the one sector where R&D is the most important category—though even here Own-account other science comes second. R&D is also relatively important in Manufacturing and Wholesale.

The Canadian Productivity Review - 28 - Statistics Canada – Catalogue no. 15-206-X, no. 026
Table 3 Share of intangible investments by asset category in each industry (1981 to 2001)
Advertising Mineralexploration
Purchasedscience andengineering
Research anddevelopment
Software Own-account
other science and engineering
All
Business sector 18.3 4.3 21.3 19.0 5.6 31.4 100.0
Agriculture and forestry 3.9 0.0 34.1 10.6 7.1 44.4 100.0
Mining, oil and gas 1.4 77.5 5.5 9.2 1.2 5.3 100.0
Utilities 6.7 0.0 5.9 13.2 11.7 62.5 100.0
Construction 5.0 0.0 90.4 3.4 0.3 0.8 100.0
Manufacturing 18.0 0.0 17.3 23.2 2.3 39.2 100.0
Wholesale 26.4 0.0 4.7 22.5 5.6 40.8 100.0
Retail 48.9 0.0 6.1 9.8 7.6 27.5 100.0
Transportation 19.1 0.0 8.9 6.3 19.1 46.7 100.0
Information and culture 26.3 0.0 16.2 14.4 11.0 32.1 100.0Finance, insurance, real estate and leasing 27.2 0.0 2.0 15.6 16.1 39.2 100.0
Professional 5.2 0.0 11.4 44.5 4.1 34.8 100.0
Administrative support 35.1 0.0 3.2 14.7 11.5 35.5 100.0
Arts 52.0 0.0 16.1 9.0 6.5 16.3 100.0
Accommodation 46.4 0.0 42.3 9.3 0.5 1.4 100.0
Other 41.4 0.0 2.7 10.9 10.0 35.1 100.0
percent
Although all industries are engaged in intangible investments, when viewed as a share of total business sector expenditure (Table 4), the investments tend to be concentrated in a smaller number of industries. The largest share of total R&D is found in Manufacturing (39.2%), followed by Professional, Scientific and Technical (26.7%), FIREL (Finance, Insurance, Real Estate and Leasing) (8.9%) (Table 4). Combined, these three industries account for 74.8% of all R&D expenditures. Similar concentrations are found in other intangible categories. The top three industries account for 60.1% of advertising investment; 84.5% of purchased science and engineering investment, 53.7% of software investment, and; 68.1% of Own-account other science investment. Despite the concentration of intangible expenditures in particular industries, the innovative activities implied by those expenditures are spread across the entire business sector. Intangibles are prominent in both the goods and services sectors. A larger share of advertising and software investments is made by service sector industries, while a larger share of purchased science and engineering and mineral exploration expenditures occur in the goods sector. The goods and services sectors account for about the same share in R&D and Own-account other science.

The Canadian Productivity Review - 29 - Statistics Canada – Catalogue no. 15-206-X, no. 026
Table 4 Share of intangible investments by asset category by industry (1981 to 2001)
Purchasedscience andengineering
Research and
development
Software Own-account
otherscience
Agriculture and forestry 0.1 0.0 0.6 0.3 0.5 0.6Mining, oil and gas 0.4 100.0 1.5 2.8 1.1 0.9Utilities 0.9 0.0 0.6 1.5 4.5 4.1Construction 3.0 0.0 48.6 1.9 0.6 0.3Manufacturing 31.9 0.0 28.9 39.2 13.2 41.2Wholesale 8.4 0.0 1.4 8.1 6.7 6.9Retail 13.2 0.0 1.3 2.6 6.8 4.2Transportation 3.3 0.0 1.3 1.0 10.6 5.1Information and culture 7.0 0.0 3.7 3.9 11.7 5.8Finance, insurance, real estate and leasing 15.8 0.0 1.1 8.9 28.7 15.0Professional 3.4 0.0 7.0 26.7 8.6 11.9Administrative support 3.2 0.0 0.3 1.3 3.3 2.0Arts 3.0 0.0 0.7 0.5 1.2 0.5Accommodation 3.9 0.0 2.9 0.7 0.2 0.1Other 2.6 0.0 0.1 0.7 2.1 1.3All industries 100.0 100.0 100.0 100.0 100.0 100.0Goods industries 36.2 100.0 80.3 45.6 20.0 47.1Services industries 63.8 0.0 19.7 54.4 80.0 52.9
percent
Total scienceAdvertising Mineral
exploration
The fastest growth in intangible expenditures comes from investments in software (Table 5). In the overall business sector, investment in software has grown most rapidly thereby increasing its share of total science expenditures. This is also the case across most industries. The rate of growth of software expenditures is as high or higher than most other categories in Utilities, Construction, Manufacturing; Transportation and Warehousing; Professional; Scientific and Technical; Arts and Entertainment; Accommodation; Food and Beverages; and Other Services. Since software expenditures supported the introduction of Information and Communications technologies, the fact that growth was rapid everywhere bears testimony to the widespread impact of the ICT revolution.

The Canadian Productivity Review - 30 - Statistics Canada – Catalogue no. 15-206-X, no. 026
Table 5 Intangible investment annual average growth by asset category in each industry (1981 to 2001)
Purchasedscience andengineering
Researchand
Development
Software Own-account
otherscience
Business sector 7.7 10.4 7.5 10.8 13.9 6.6Agriculture 8.4 0.0 4.6 18.0 10.1 12.4Mining, oil and gas 7.9 10.4 12.8 15.5 12.7 5.4Utilities 13.5 0.0 10.5 11.1 17.1 -1.0Construction 5.2 0.0 4.7 6.0 14.1 13.6Manufacturing 5.7 0.0 10.3 8.3 13.9 7.4Wholesale 9.8 0.0 24.3 19.3 20.4 3.0Retail 7.3 0.0 57.4 12.5 17.2 3.6Transportation 3.9 0.0 5.0 5.8 9.3 7.2Information and culture 7.9 0.0 6.6 11.6 20.2 11.9Finance, insurance, real estate and leasing 9.4 0.0 16.1 11.7 9.9 11.9Professional 11.8 0.0 13.1 13.5 17.1 3.9Administrative support 12.4 0.0 18.8 15.5 17.9 13.0Arts 13.6 0.0 5.8 12.6 15.0 7.7Accommodation 10.9 0.0 7.9 10.7 29.0 3.7Other 10.8 0.0 11.6 15.2 17.0 7.1
percent
Total scienceAdvertising Mineral
exploration
In terms of the relative importance of intangibles compared to tangibles, industries vary. Intangibles are less important than tangibles in Agriculture, Forestry, and Fishing, Mining, Oil and Gas Extraction, Utilities, Transportation and Warehousing, Finance, Insurance, and Real Estate, Information and Cultural, Arts, Entertainment and Recreation, Accommodation and Food Services, and Other Services (Chart 5). Intangibles are more important than tangibles in Construction, Manufacturing, Wholesale and Retail Trade, Professional, Scientific and Technical Services, Administrative Support and Waste Management. At the aggregate level, expenditures on tangibles like machinery and equipment are more cyclical than expenditures on intangibles (Chart 6). Intangibles grew more or less monotonically over the entire period, while tangibles fell back during the recession of the early 1990s. Inputs that involve higher adjustment costs have less cyclicality. Skilled labour tends to be hoarded in downturns as it is costly to hire and train this type of worker because of the non-codifiable knowledge that is embedded in a firm which must be imparted to skilled labour in order for the firm to take advantage of its capabilities. Intangibles also share some of the same properties, perhaps because they are complementary factors to skilled workers.

The Canadian Productivity Review - 31 - Statistics Canada – Catalogue no. 15-206-X, no. 026
Chart 5 Average annual ratio of intangible relative to tangible investments, 1981 to 2001
0 1 2 3 4 5 6
Business Sector
Agriculture
Mining, oil and gas
Utilities
Construction
Manufacturing
Wholesale
Retail
Transportation
Information and culture
FIREL¹
Professional
Administration
Arts
Accommodation
Other
average
Business sector
Intangible Share of Tangible Spending
1. Finance, insurance, real estate and leasing.
Chart 6 Investments by category over time (1981 to 2001)
0
100
200
300
400
500
600
1981 1982 1983 1984 1985 1986 1987 1988 1989 1990 1991 1992 1993 1994 1995 1996 1997 1998 1999 2000 2001
Machinery and equipment Buildings and structures Intangibles
index (1981=100)

The Canadian Productivity Review - 32 - Statistics Canada – Catalogue no. 15-206-X, no. 026
5 Conclusion
Investments in intangible capital have become increasingly important in the Canadian economy. These investments take several different forms: as scientific knowledge, brand value, and, an understanding of the location, properties and characteristics of natural resources. Traditional estimates of scientific knowledge focused on research and development (R&D) and were based on sources that develop data using the Frascati Manual to guide them. Baldwin, Beckstead and Gellatly (2003) argue that for several reasons this has the potential for underestimating investments in scientific knowledge. First, it misses substantial expenditures that are made adapting, rather than inventing, new products and technologies. Second, it ignores the large amount of science that is purchased in the form of technological know-how, whether it be outside R&D (Frascati focuses only on R&D performed within a firm), consulting engineering and other services, patents, architectural services, and blueprints. This paper examines this issue using an expanded definition of knowledge investment that includes not just expenditures on ‘novel’ processes where there is a degree of uncertainty, but also expenditures on knowledge creation on the factory floor, and purchased knowledge in the form of externally performed R&D, patents, and licences. The paper uses supply-use tables from the Input-output system produced by the Industry Accounts Division as well as Census of Population data on the wages and salaries of scientists. This produces more complete estimates of total investments made by Canadian business on scientific endeavours. R&D, as traditionally measured, makes up only about a quarter of the total of science-related expenditures. Own-account scientific endeavours and purchased science are much larger. Other intangibles that are covered here include software, mineral exploration and advertising expenditures. The importance attributed to intangibles accords with previous studies (Corrado, Hulten and Sichel 2005, 2006); (Ahmavarra, Alanen and Jalava 2007). The intangible investment estimates are at least as large as machinery and equipment or building investment in the early 1980s, and have expanded relative to tangible investments over time. By the end of the 2001, intangible investments are larger that total tangible investments. Every business sector industry in Canada engages in investments in intangible assets of one kind or another, although the type of intangible investment that dominates differs across industries. This stands in contrast to the R&D estimates alone which suggest that the manufacturing industry is the most important source of knowledge or intangible asset creation. Service sector industries are as important as goods sector industries with respect to investments in intangible assets. Moreover, a noteworthy share of intangible investment in Canada is made in understanding the natural world. These expenditures are made with the explicit purpose of finding and extracting non-renewable resources that are abundant in Canada and make an important contribution to national wealth.

The Canadian Productivity Review - 33 - Statistics Canada – Catalogue no. 15-206-X, no. 026
The knowledge and intangible investments made across all industries is complementary to investments in tangible assets, particularly machinery and equipment. Investments in scientific knowledge outside of R&D track expenditures in machinery and equipment closely. They are a critical part of the stage of the innovation process that brings new products and production techniques on-stream. This study has shown that these expenditures are quantitatively important. As Hollander’s (1965) work suggests, these expenditures may also lead to the greatest increases in productivity.
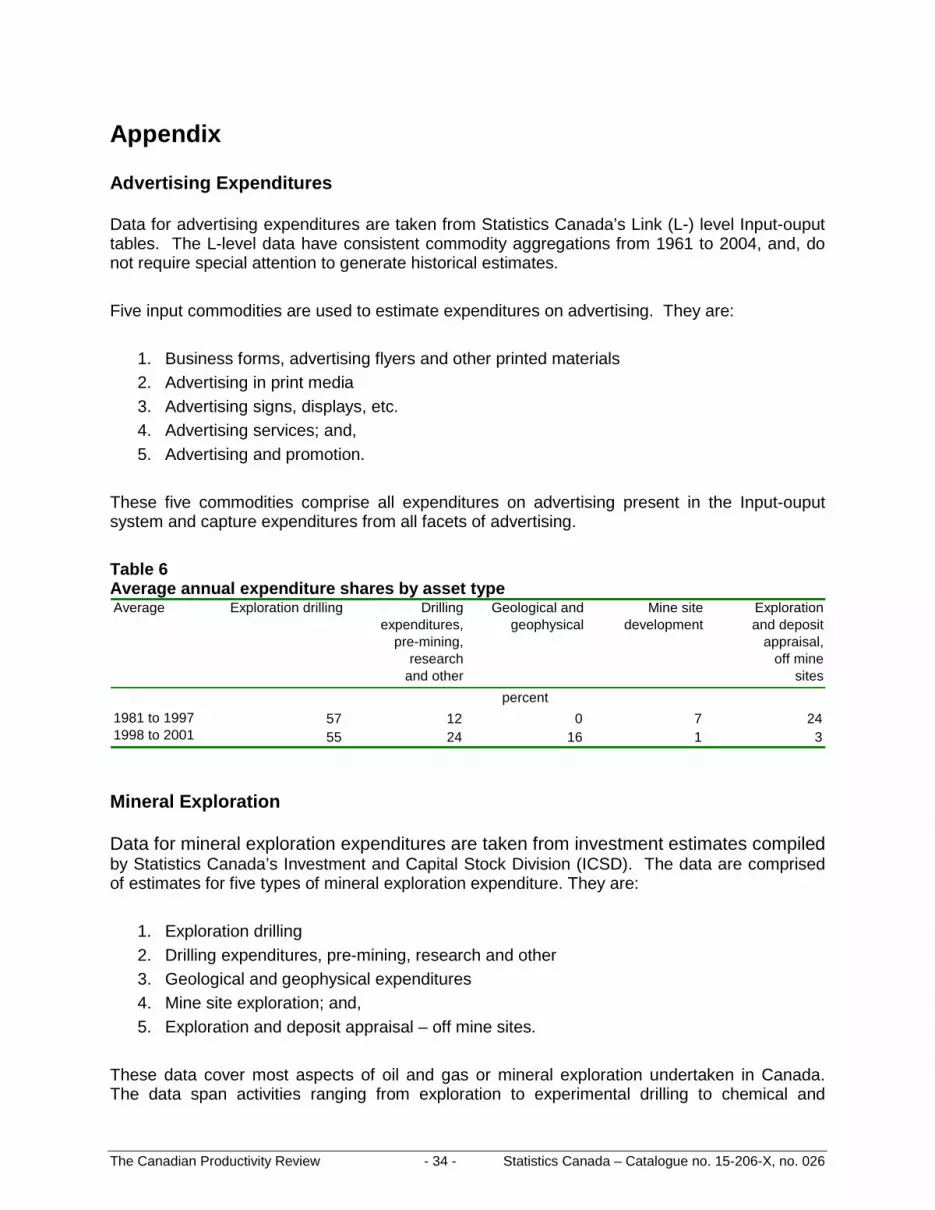
The Canadian Productivity Review - 34 - Statistics Canada – Catalogue no. 15-206-X, no. 026
Appendix
Advertising Expenditures Data for advertising expenditures are taken from Statistics Canada’s Link (L-) level Input-ouput tables. The L-level data have consistent commodity aggregations from 1961 to 2004, and, do not require special attention to generate historical estimates. Five input commodities are used to estimate expenditures on advertising. They are:
1. Business forms, advertising flyers and other printed materials 2. Advertising in print media 3. Advertising signs, displays, etc. 4. Advertising services; and, 5. Advertising and promotion.
These five commodities comprise all expenditures on advertising present in the Input-ouput system and capture expenditures from all facets of advertising. Table 6 Average annual expenditure shares by asset type Average Exploration drilling Drilling
expenditures,pre-mining,
researchand other
Geological andgeophysical
Mine sitedevelopment
Explorationand deposit
appraisal,off mine
sites
1981 to 1997 57 12 0 7 241998 to 2001 55 24 16 1 3
percent
Mineral Exploration Data for mineral exploration expenditures are taken from investment estimates compiled by Statistics Canada’s Investment and Capital Stock Division (ICSD). The data are comprised of estimates for five types of mineral exploration expenditure. They are:
1. Exploration drilling 2. Drilling expenditures, pre-mining, research and other 3. Geological and geophysical expenditures 4. Mine site exploration; and, 5. Exploration and deposit appraisal – off mine sites.
These data cover most aspects of oil and gas or mineral exploration undertaken in Canada. The data span activities ranging from exploration to experimental drilling to chemical and

The Canadian Productivity Review - 35 - Statistics Canada – Catalogue no. 15-206-X, no. 026
physical tests of ore samples for mineral concentrations and/or recoverable quantities of minerals from ore bodies. The estimates do not cover development drilling of existing known deposits, engineering projects for production facilities, enhancing recovery or tailings ponds. Estimates for geological and geophysical expenditures are only available from 1998 on because increased asset detail is available only after 1997. Prior to that, this component is included elsewhere. As a result, estimates for geological and geophysical expenditures begin in 1998, and the shares of expenditures on the various components change at that point (Chart 7, Table 7). Chart 7 Expenditure shares by component, 1981 to 2001
0
10
20
30
40
50
60
70
80
90
100
1981 1983 1985 1987 1989 1991 1993 1995 1997 1999 2001
Exploration and deposit appraisal, off mine sitesMine site developmentGeological and geophysicalDrilling expenditures, pre-mining, research and otherExploration drilling
Share (percent)
Table 7 Smoothing and spikes by industry, 1986
1986 timeseries breaks
Spike Spike year
Agriculture, forestry, fishing and hunting F F 1995Construction F … …Professional, scientific and technical services … F 1994Administrative and support, waste management and remediation services … F 1994Arts, entertainment and recreation F … …Other services F … …
The Canadian Productivity Review - 36 - Statistics Canada – Catalogue no. 15-206-X, no. 026
There is a distinct change in shares for most commodities post-1997 when compared with their pre-1998 values. In particular, mine site development and exploration and deposit appraisal expenditure shares shrink from 7% to 1% and 24% to 3% respectively. The share of drilling expenditures, pre-mining, research and other drops by a half.
Purchased Science and Engineering Services Data for purchased science and engineering services are taken from the W-level Input-ouput tables that provide a finer level of disaggregation than the L-level. Two science and engineering commodities are employed as estimates of intangible expenditures:
1. Royalties and license fees (excluding natural resources); and, 2. Architect, engineering and scientific services.
At the W-level, commodity classifications change over time leading to potential time series inconsistencies as the granularity of commodity structures change. In those cases where finer detail information is available post-1997 than in earlier periods, the share of expenditures in the more aggregate classification is employed to split estimates historically. For example, in 1986 there is a change in commodity classifications. Prior to 1986 architect, engineering and scientific services are included in an aggregate commodity that includes accounting and legal services. Post-1985 the two commodities have separate estimates. The pre-1986 estimates are split into architect, engineering and scientific services and accounting and legal services using the average share of architect, engineering and scientific services in the total from 1986 to 1991. Changes in commodity classifications can also induce changes in commodity estimates over time as they can induce changes to the balancing procedures used for the Input-ouput accounts. Commodity classification changes occur in 1986/1987 and 1996/1997 in the W-level tables. For those years the average growth rate from t-2, t-1, t+1 and t+2 is used to smooth the change. Estimates prior to the breaks are then backcast using Input-ouput growth rates. In the case of the Accommodation and Food Services industries, an additional aberrant observation was discovered in 1989. It was smoothed using the same procedure. Software Software estimates are taken from the Final Demand tables produced by Statistic Canada’s Input-output division. There are two Input-ouput commodities that house software estimates and the actual software expenditures can be isolated from the investment components of final demand:
1. Recordings, musical instruments, artists' supplies, etc.; and, 2. Software development, computer service and rent.
At the business sector level the data are consistent with the estimates from the Satellite Account developed by Jackson (2002) that was subsequently incorporated into the Canadian System of National Accounts.
The Canadian Productivity Review - 37 - Statistics Canada – Catalogue no. 15-206-X, no. 026
At the industry level, the data exhibit time–series discontinuities in 1997/1998 coinciding with changes in commodity classifications and industry classifications. The data are smoothed using a four period average growth rate. For 1997 the growth rate is an average of t-3,t-2,t-1 and t+2 growth rates. For 1998 the growth rate is an average of t-2,t+1,t+2 and t+3 growth rates. The levels are then backcast using the Input-output growth rates. In addition, specific industries exhibit breaks in 1986 and spikes in particular years (see Table 7). The breaks are smoothed using the average growth rate of t-2, t-1, t+1 and t+2 for the 1986 growth rate. For these industries the levels are backcast using the smoothed growth rates in 1986. For the spikes, the average level of t-1 and t+1 is used to substitute for the spike value. On aggregate, the smoothing of breaks and spikes does not affect the aggregate level of software investment. Rather, the aggregate is re-distributed across industries in a manner that is consistent over time by industry. Research and Development Research and Development (R&D) investment estimates are drawn from three sources: micro files from Statistics Canada’s Science, Innovation and Electronic Information Division (SIEID); the W-level Input-output tables; and, Statistics Canada’s Capital, Labour, Energy, Materials and Services (KLEMS) dataset. Own-account R&D expenditures are valued at cost. This involves estimating labour input, intermediate expenditures and capital services. The SIEID data are used to directly calculate expenditures on labour and intermediate expenses. The SIEID data also contains data on capital investments in M&E and buildings. This capital investment should already be captured in the investment surveys conducted by Statistics Canada. The relevant question is, therefore: what are the capital services that should be attributed to R&D production vs. production of other goods? The total nominal value of capital services is estimated in KLEMS by industry. The KLEMS capital services estimates are split into R&D and non-R&D capital services using the ratio of R&D investment in M&E and buildings to the total M&E and building investment in each industry. The R&D capital services are added to the labour and intermediate expenditure investments to form the Own-account capital services estimates. In Canada, some R&D is purchased. Much of this comes from imports of R&D. These expenditures are captured in the Other Scientific and Technical Services commodity in the W-level Input-output tables. The commodity is disaggregated from 1997 on. However, prior to 1997, Other Scientific and Technical Services are aggregated into Other Services to Business and Persons. The aggregate is split historically using the average share of Other Scientific and Technical Services in the aggregate, from 1997 to 2001. The estimates of Other Scientific and Technical Services are then added to the Own-account R&D estimates to form R&D investments by industry. Similar to other estimates that span changes in commodity and industry classification changes, the R&D investment estimates exhibit breaks in 1986 and 1997. In each case the growth rate

The Canadian Productivity Review - 38 - Statistics Canada – Catalogue no. 15-206-X, no. 026
for those years is replaced by the average of growth rates from t-2, t-1, t+1 and t+2. The historical levels are then backcast.
Own-account Science and Engineering Own-account Science and Engineering (O.A. Science) estimates are derived from census estimates of incomes earned by individuals employed in science and technology occupations. The census estimates are taken from an occupational taxonomy used by the U.S. National Science Foundation. It includes several occupational groups: computer and math scientists; life and related scientists; physical and related scientists; social and related scientists; engineers; science and engineering technologists; and architects. Consistent groupings were created from the 1980 and 1990 Standard Occupational Classification codes. The O.A. Science estimates are then benchmarked to the KLEMS database. The Census wage data for scientists was benchmarked to the Canadian Productivity Accounts database using total wages of all workers. Intercensal data are created using average wage shares of scientists taken from adjoining census points and total wages from the Productivity Accounts. The resulting estimates of Own-account science includes R&D scientists captured in the R&D estimates as well as programmers captured in the Software estimates. To adjust for the double counting, the labour income estimates from the SIEID R&D surveys and the labour portion of the Own-account software estimates are netted out of the Own-account science estimates derived from the Census Occupation data. This does not present a problem at the business sector level. However, at the industry level the split between industries from the O.A. Science differs from the split in the R&D and Software estimates. To make the estimates consistent, the O.A. Science estimates are re-split using the average weights from the R&D and Software estimates in 1997. The levels of O.A. Science by industry are then forecast and backcast from the re-split 1997 level. The O.A. Science estimates are time series consistent and do not require smoothing due to industry and commodity classification changes.

The Canadian Productivity Review - 39 - Statistics Canada – Catalogue no. 15-206-X, no. 026
References
Aboody, D. and B. Lev. 1998. “The Value-Relevance of Intangibles: The Case of Software Capitalization.” Journal of Accounting Research. Supplement. 161–191. Armstrong, P., T. Harchaoui, C. Jackson and F. Tarkhani. 2002. A Comparison of Canada – U.S. Economic Growth in the Information Age, 1981-2000: The Importance of Investment in Information and Communication Technologies. Economic Analysis (EA) Research Paper Series. Catalogue no. 11F0027MIE2002001. Ottawa: Statistics Canada. Baldwin, John R., Desmond Beckstead and Guy Gellatly. 2003. Canada’s Investments in Science and Innovation: Is the Existing Concept of Research and Development Sufficient? Economic Analysis (EA) Research Paper Series. Catalogue no. 11F0027MIE2005032. Ottawa: Statistics Canada. Baldwin, John R. and Jay Dixon. 2008. Infrastructure Capital: What Is It? Where Is It? How Much of It Is There? The Canadian Productivity Review. Catalogue no. 15-206-XIE2008016. Ottawa: Statistics Canada. Baldwin, J.R. and G. Gellatly. 1998. Are There High-Tech Industries or Only High-Tech Firms? Evidence from New Technology-Based Firms. Analytical Studies Branch Research Paper Series. Catalogue no. 11F0019MIE1998120. Ottawa: Statistics Canada. Baldwin, J.R. and G. Gellatly. 1999. “Developing High-Tech Classification Schemes: A Competency-Based Approach.” In New Technology-Based Firms in the 1990s. Volume VI. Edited by R. Oakey, W. During and S. Mukhtar. Oxford: Elsevier Science, 1999. Amsterdam: Pergamon. Baldwin, J.R. and G. Gellatly. 2001. “A Firm-Based Approach to Industry Classification: Identifying the Knowledge-Based Economy.” In Doing Business in the Knowledge-Based Economy. Edited by L. Lefebvre, E. Lefebvre and P. Mohnen. Boston: Kluwer Academic Publishers. Baldwin, John R. and Wulong Gu. 2007. Investment and Long-term Productivity Growth in the Canadian Business Sector, 1961 to 2002. The Canadian Productivity Review. Catalogue no. 15-206-XIE2007006. Ottawa: Statistics Canada. Baldwin, John.R. and Peter Hanel. 2003. Innovation and Knowledge Creation in an Open Economy. Cambridge University Press. Baldwin, John R. and Guy Gellatly. 2003. Innovation Strategies and Performance in Small Firms. Edward Elgar Publishing. Baldwin, John R. and David Sabourin. 2001. Impact of the Adoption of Advanced Information and Communication Technologies on Firm Performance in the Canadian Manufacturing Sector. Analytical Studies Branch Research Paper Series. Catalogue no. 11F0019MIE2001174. Ottawa: Statistics Canada. Baldwin, John R. and David Sabourin. 2004. The Effect of Changing Technology Use on Plant Performance in the Canadian Manufacturing Sector. Economic Analysis (EA) Research Paper Series. Catalogue no. 11F0027MIE2004020. Ottawa: Statistics Canada.
The Canadian Productivity Review - 40 - Statistics Canada – Catalogue no. 15-206-X, no. 026
Beckstead, Desmond and Guy Gellatly. 2003a. The Growth and Development of New Economy Industries. The Canadian Economy in Transition Research Paper Series. Catalogue no. 11-622-MIE2003002. Ottawa: Statistics Canada. Beckstead, D. and G. Gellatly. 2003b. Are Knowledge Workers Part of the New Economy? A note on the concentration of knowledge workers in different industrial environments. The Canadian Economy in Transition Research Paper Series. Catalogue no. 11-622-MIE2003005. Ottawa: Statistics Canada. Beckstead, Desmond, Mark Brown, Guy Gellatly and Catherine Seaborn. 2003. A Decade of Growth: The Emerging Geography of New Economy Industries in the 1990s. The Canadian Economy in Transition Research Paper Series. Catalogue no. 11-622-MIE2003003. Ottawa: Statistics Canada. Beckstead, Desmond and Tara Vinodrai. 2003. Dimensions of Occupational Changes in Canada’s Knowledge Economy, 1971-1996. The Canadian Economy in Transition Research Paper Series. Catalogue no. 11-622-MIE2003004. Ottawa: Statistics Canada.. Bernstein, Jeffrey I. and Theopharis P. Mamuneas. 2005. “R&D Depreciation, Stocks, User Costs and Productivity Growth for U.S. Knowledge Intensive Industries”. Paper presented at the Allied Social Science Association meeting at Philadelphia, January 9, 2005. Corrado, Carol A., Charles R. Hulten, and Daniel E. Sichel. 2005. “Measuring Capital and Technology: An Expanded Framework.” In) Measuring Capital in the New Economy. C. Corrado, J. Haltiwanger and D. Sichel (eds). NBER Studies in Income and Wealth. Volume 65. Chicago and London: University of Chicago Press. Corrado, C.A., C.R. Hulten and D.E. Sichel. 2006. “Intangible capital and economic growth”. NBER Working Paper 11948. Diewert, E. and N. Huang. 2007. “Estimation of R&D Depreciation Rates for the US Manufacturing and four Knowledge Intensive Industries”. University of British Columbia, working paper. Evangelista, R., T. Sandven, G. Sirilli and K. Smith. 1997a. “Measuring the Cost of Innovation in European Industry.” In Innovation Measurement and Policies. A. Arundels and R. Garrelfs (eds). European Commission, Luxembourg. Office for Official Publications of the European Communities. pp. 109–113. Gu, Wulong and Weimin Wang. 2004. “Information Technology and Productivity Growth: Evidence from Canadian Industries.” In Economic Growth in Canada and the United States in the Information Age. Dale W. Jorgenson (ed.). Industry Canada Research Monograph. Ottawa: Industry Canada. Hanna, Jeannette and Alan Middleton. 2008. Ikonica: A Field Guide to Canada's Brandscape. Douglas & McIntyre: Toronto.
The Canadian Productivity Review - 41 - Statistics Canada – Catalogue no. 15-206-X, no. 026
Harchaoui, T., F. Tarkhani, and B. Khanam. 2004. “Information Technology and Economic Growth in the Canadian and U.S. Private Economies.” In Economic Growth in Canada and the United States in the Information Age. Dale W. Jorgenson (ed.). Industry Canada Research Monograph. Ottawa: Industry Canada. Hollander, S. 1965. The Sources of Increased Efficiency: The Case of Dupont Rayon Plants. Cambridge: Cambridge University Press. Jackson, Chris. 2002. Capitalization of Software in the National Accounts. Income and Expenditure Accounts Technical Series. Catalogue no. 13-604-MIE2002037. Ottawa: Statistics Canada. Jalava, Jukka, Pirkko Aulin-Ahmavaara, and Aku Alanen. 2007. Intangible Capital in the Finnish Business Sector. 1975-2005. Discussion Paper No. 1103. The Research Institute of the Finnish Economy. Johnson, J., J.R. Baldwin, and C. Hinchley. 1997. Successful Entrants: Creating the Capacity for Survival and Growth. Catalogue no. 61-524-XPE. Ottawa: Statistics Canada. Jorgenson. Dale W. and Kevin J. Stiroh. 2000. “Raising the Speed Limit: U.S. Economic Growth in the Information Age.” Brookings Papers on Economic Activity. 1: 125–235. Lev, Baruch and Theodore Sougiannis. 1996. “The Capitalization, Amortization and Value Relevance of R&D.” Journal of Accounting and Economics. 21: 107–138. Nadiri, M. Iphaq and Ingmar R. Prucha. 1996. “Estimation of the Depreciation Rate of Physical and R&D Capital in the U.S. Total Manufacturing Sector.” Economic Inquiry. 34: 43–56. Okubo, Sumiye, Carol A. Robbins, Carol E. Moylan, Brian K. Sliker, Laura Schultz and Lisa S. Mataloni. 2006. “R&D Satellite Account: Preliminary Estimates.” Bureau of Economic Analysis-National Science Foundation. Washington: D.C. Organization for Economic Cooperation and Development. 2000. Is There A New Economy? First Report on the OECD Growth Project. OECD Publications. Paris, France. Organization for Economic Cooperation and Development. 2002. Frascati Manual 2002: Proposed Standard Practice of Surveys on Research and Development. OECD Publications. Paris, France. Pakes, Ariel and Mark Schankerman. 1984. “The Rate of Obsolescence of Patents, Research Gestation Lags and the Private Rate of Return to Research Resources.” In R&D, Patents and Productivity. Z. Griliches (ed.). 73–88. Chicago. University of Chicago Press. Peleg, S. 2003. “A Note on the Definition of R&D.” Paper for the Canberra II Group on the Measurement of Non-financial Assets. Voorburg. April 2003.

The Canadian Productivity Review - 42 - Statistics Canada – Catalogue no. 15-206-X, no. 026
Statistics Canada, 2007. “Depreciation Rates for the Productivity Accounts.” The Canadian Productivity Review. Catalogue no. 15-206-XIE2007005. Ottawa: Statistics Canada. Stiroh, K.J. 1999. “Is There a New Economy?” Challenge, July-August: 82–101.