exploration and exploitation in product innovation
TRANSCRIPT

Industrial and Corporate Change, pp. 1 of 31
doi:10.1093/icc/dtm013
Exploration and exploitation in
product innovation
Henrich R. Greve
A central theoretical problem in organizational evolution is how organizations
acquire new capabilities. Organizational exploitation of current capabilities often
reduces exploration of new capabilities, resulting in a short-term bias in
organizational adaptation (March, 1991). In addition, problemistic search and
slack search have different consequences for exploration and exploitation because
exploration has greater risk and less routinization. Exploration and exploitation are
also affected by organizational momentum (Kelly and Amburgey, 1991) and direct
competition from exploitation to exploration (March, 1991). These propositions
are tested using data on innovations in shipbuilding between 1972 and 2000.
Exploration and exploitation are fundamental activities of organizations and other
adaptive systems (March, 1991). Organizational exploration is search for new
knowledge, use of unfamiliar technologies, and creation of products with unknown
demand. Because these activities do not reliably and quickly produce revenue,
exploration has uncertain and distant benefits. Exploitation is use and refinement of
existing knowledge, technologies, and products, and has more certain and proximate
benefits. Exploration and exploitation both draw resources, and thus resource
constraints require organizations to make tradeoffs between them (Levinthal and
March, 1993).
Organizations appear to have difficulty making these tradeoffs. Exploration and
exploitation rely on different organizational routines and capabilities (Lewin et al.,
1999; Galunic and Eisenhardt, 2001; Benner and Tushman, 2003), so it is easier to
specialize in one of them than to efficiently perform a mixture of both. In technology
development, exploitation of existing stocks of knowledge appears to reduce the
incentives for exploring new knowledge and possibly even the ability to do so
(Levinthal and March, 1981; Tushman and Anderson, 1986; Leonard-Barton, 1995;
Christensen and Bower, 1996). Despite the difficulties in combining exploration
and exploitation, theory and empirical evidence suggests that too little of either
exploration or exploitation reduces performance (Levinthal and March, 1993;
� The Author 2007. Published by Oxford University Press on behalf of Associazione ICC. All rights reserved.
Industrial and Corporate Change Advance Access published May 26, 2007

Katila and Ahuja, 2002; Fagiolo and Dosi, 2003; He and Wong, 2004). This indicates
a need to learn more about how organizations shift between exploration and
exploitation.
Some of the earliest theoretical work relevant to exploration and exploitation is
the behavioral theory of the firm (Cyert and March, 1963), which posits problemistic
search and slack search as drivers of organizational learning and change in general
and innovations specifically. Later work on organizational learning has added much
theory and evidence (see reviews by Levitt and March, 1988; Miner and Mezias, 1996;
Schulz, 2002; Argote and Greve, 2007), and has proposed additional ways in which
organizational learning may affect innovations. These include the propositions that
routinization causes repetition of organizational changes (Kelly and Amburgey,
1991) and that scarce resources and pursuit of proximate awards cause exploitation
to drive out exploration (March, 1991). These propositions are a good foundation,
but added theoretical and empirical work is needed to assess which mechanisms
affect organizational exploration and exploitation through making innovations.
First, these propositions are so general that they do not specify the type of
organizational change that is predicted, so it is easier to predict that low performance
will lead to some sort of change than to predict that it will lead to exploration.
For example, low performance leads to downsizing (Ahmadjian and Robinson,
2001), which seems contrary to exploration. Second, theory of routines will not
predict exploration well if exploration events are too unique to become routinized.
Currently only the proposition that exploitation competes with exploration gives a
direct prediction on how exploration and exploitation interact, but consideration of
whether the other theoretical mechanisms have unequal effects on exploration and
exploitation may yield additional predictions. One contribution of this article is to
develop theory on how performance, slack, and routines affect exploration and
exploitation, including the proposition that the greater risk and diversity of
exploration innovations cause them to be affected differently from exploitation
innovations.
Third, the evidence on extant propositions is scarce with respect to organizational
innovations, though there is evidence from other forms of organizational change.
There is little research examining performance effects on innovations (Bolton, 1993;
Greve, 2003), but on some other outcomes such as risk taking and strategic changes
(Bromiley, 1991; Lant et al., 1992; Nickel and Rodriguez, 2002; Miller and Chen,
2004). Most research on organizational slack has looked for effects on R&D or
patenting (Kamien and Schwartz, 1982; Antonelli, 1989), which are intermediate
steps in the process of developing innovations. The well-known difficulties of
getting innovations based on R&D projects selected for product launch (Burgelman
and Sayles, 1986; Dougherty and Heller, 1994) caution against drawing strong
conclusions on innovativeness from R&D evidence. Routinization of organizational
change has been investigated through mergers and acquisitions, alliances, and other
strategic changes (Amburgey and Miner, 1992; Amburgey et al., 1993; Lavie and
2 of 31 H. R. Greve
Rosenkopf, 2006), but not through innovations. A second contribution of this article
is to empirically test these propositions using innovation data.
1. Theory and Hypotheses
1.1 Innovations as exploration and exploitation
Many writers emphasize the uncertainty involved in developing innovative products
and launching them in the market (Burgelman and Sayles, 1986; Van de Ven et al.,
1999), suggesting that innovations are a form of organizational exploration. Much
product development hews closely to the current knowledge of the firm (Griffin,
1997), however, it is important to distinguish explorative innovations from those
that exploit current knowledge. One point of departure is the distinction between
incremental innovations, which advance existing technology, and radical innova-
tions, which develop new technology (Dewar and Dutton, 1986). Radical innovations
fit the definition of exploration because development of new technology is a form of
knowledge development (Rosenkopf and Nerkar, 2001; Benner and Tushman, 2003).
Despite its merits, the definition is not immediately applicable to firm-level research
on exploration and exploitation. First, it defines innovations as radical with respect
to the industry as a whole, which ignores differences in the knowledge held by a focal
firm with respect to a given innovation. Indeed, the finding that a firm’s depth of
knowledge predicts early adoption of both incremental and radical innovations
(Dewar and Dutton, 1986) can be explained by prior knowledge of an innovative
technology allowing early adoption. Second, it does not sufficiently take into account
the link from the knowledge held by the firm prior to developing the innovation and
knowledge that must be generated in order to develop it. An innovation is more
explorative when the firm had less advance knowledge to assess the probability of
successfully developing the innovation and launching it in the market. To make this
judgment, researchers have emphasized novelty in the technological and market
domain as a useful criterion (Rosenkopf and Nerkar, 2001; Benner and Tushman,
2002; 2003). This is because innovations that are technologically very different from
existing products have lengthy and unpredictable development durations
(McDonough, III, 1993), and innovations that address unfamiliar markets have
unpredictable market success (Christensen and Bower, 1996). Thus, we may define
the extent of exploration in an innovation launch as its technological and market
novelty for the focal firm.
Firms can choose not only the extent to which they seek to innovate, but also
whether to emphasize exploitation innovations or exploration innovations.
Exploitation innovations that apply known technology are frequent in firms that
design and customize products based on customer requests and in mass-producing
firms with product development processes geared towards the interests of
Exploration and exploitation in product innovation 3 of 31
customers (Burgelman and Sayles, 1986), but firms also develop exploration
innovations through learning new technologies (Rosenkopf and Nerkar, 2001). In the
shipbuilding industry, which is the context of this study, container ships without
hatch covers were an innovation that improved container handling in ports. They
were different from the earlier container ships with hatch covers, but did not require
new technology because the engineering problems in building them were familiar
from other types of ships without hatch covers, and were thus an exploitation
innovation. On the other hand, aluminum honeycomb hulls were designed as a
replacement of conventional steel hulls for smaller vessels, but design and
manufacture of aluminum honeycomb hull involves new skills for shipbuilding
firms, who are familiar with the manufacturing and seagoing properties of steel.
1.2 Balancing exploration and exploitation
Many have argued the benefits of balancing exploration and exploitation
(March, 1991; Levinthal and March, 1993; Benner and Tushman, 2003). A preference
for exploration results in excessive costs of failed experiments and insufficient
rewards from successful ones. A preference for exploitation may not be harmful in
the short run, or even in the long run if the environment is stable, but it reduces the
organization’s ability to discover opportunities and respond to environmental
changes. Thus, a common expectation is that a balance of exploration and
exploitation is preferable, though the costs of insufficient exploration may not be
apparent in the short run. Empirical work has supported this proposition (Katila and
Ahuja, 2002; He and Wong, 2004).
The arguments for why a balance might be beneficial stand in stark contrast to
arguments on the difficulty of maintaining a balance between exploration and
exploitation. Exploration in technological domains requires greater diversity of
knowledge than exploitation, and hence a different set of capabilities (Nonaka and
Takeuchi, 1995). Exploration calls for less attention to the current organizational
strategy, lower conformity to current organizational practices, and less emphasis
on leveraging current strengths (Burgelman, 1991; March, 1991; Dougherty and
Heller, 1994; Leonard-Barton, 1995). An emphasis on routine development and
refinement benefits exploitation but will suppress exploration (Benner and Tushman,
2002). Experienced top management teams favor exploitation over exploration
(Beckman, 2006).
These pressures towards specialization are sufficiently strong to raise the question
of how an organization might balance—or mix—exploration and exploitation.
If exploration and exploitation do not coexist easily, as these arguments suggest,
then some form of decoupling between them is needed. Two possible alter-
natives are organizational decoupling by having specialized subunits or temporal
decoupling through switching (Levinthal and March, 1993; Gupta et al., 2006).
Decoupling across subunits is possible at some cost, though the need for
4 of 31 H. R. Greve

separate management approaches in the same organization will introduce tensions
(Benner and Tushman, 2002). Decoupling over time requires the organization to be
capable of switching between two sets of behaviors, including one (exploration) that
is presumably used less often (Burgelman, 2002). Both approaches to mixing the two
are possible and will produce outcomes that appear similar, as it is difficult to tell
whether an observed mix of exploration and exploitation over time is a result of
temporal decoupling or of organizational decoupling with independent launches of
exploration and exploitation innovations.
There are scraps of evidence on organizations that mostly exploit but sometimes
explore as well. Organizations with insufficient capabilities to explore new
opportunities can obtain them from the outside (Cattani, 2005), with alliances a
likely approach when the necessary capabilities are dispersed across organizations
(Beckman et al., 2004; Lavie and Rosenkopf, 2006). Product development teams
with diverse capabilities are effective at both exploration and exploitation, suggesting
that the underlying capabilities are less important than the goal of exploring or
exploiting (Taylor and Greve, 2006). However, there is still modest evidence to
support either the balancing or the specialization hypothesis, so we are left with
the contention that a balance is possible but probably difficult to maintain.
The hypotheses derived here concern pressures towards exploration and exploitation,
and assume that balance or specialization is a result of the relative strength of the
countervailing forces.
Two features of exploration innovations are important for deriving the
hypotheses. First, exploration innovations are diverse. It is difficult to obtain new
technology in a routine and repeated manner, and even applying existing technology
to make qualitatively new products is a process that likely differs every time. As one
moves towards exploitation, the innovations become more homogeneous. For
example, the ease of loading and discharging ships without hatch covers or with
hatch covers that extend the entire width of the deck suggests the potential for
applying such designs to other ship types. As another example, a firm that has made
an engine of record-breaking fuel efficiency will find it natural to pursue the next
record-breaking engine through the same development process and to market it to
the same customers. This difference matters for theory of routine behavior. Second,
exploration innovations are riskier than exploitation innovations because they
require acquisition of new knowledge, which is a difference that matters for theory of
risk taking.
Keeping these two differences in mind, we can examine whether learning
rules have different consequences for exploration and exploitation innovations.
The learning rules that will be investigated are problemistic search (Cyert and March,
1963: 120–121), slack search (Cyert and March, 1963: 279), organizational
momentum (Kelly and Amburgey, 1991), and the exploitation bias (March, 1991).
These learning rules are fundamental and have proven successful in predicting
Exploration and exploitation in product innovation 5 of 31

organizational change, but their consequences for exploration and exploitation have
not been sufficiently investigated.
1.3 Problemistic search and innovations
Bounded rationality reasoning predicts that decision makers determine goal
variables and set aspiration levels for each goal variable so that they can use a
simple decision rule: search sequentially through the alternatives until finding one
that satisfies the aspiration levels (March and Simon, 1958). When managers
experience performance below the aspiration level, they initiate problemistic search
for remedial actions (Cyert and March, 1963: 120–123). As a result, performance
below the aspiration level predicts a wide range of actions that managers view as
consequential for performance, such as strategic reorientation (Lant et al., 1992),
market entry (Greve, 1998; McDonald and Westphal, 2003), and innovations
(Bolton, 1993; Greve, 2003).
The basic form of this argument applies equally to exploration and exploitation
innovations and can thus not predict changes in the balance of the two, but a simple
extension leads to such a prediction. It has been observed that many innovations that
organizations develop are not launched because of perceived lack of fit with the
current strategy (Dougherty, 1992; Dougherty and Heller, 1994). This observation
leads to two suggestions. First, lack of fit with the current strategy characterizes
exploration innovations, suggesting that organizations that do not explore in actual
product launches do explore in the development process. Second, the role of
managerial evaluations of strategy fit in halting launches of exploration innovations
suggest that organizations could turn sharply towards exploration if managers viewed
the existing strategy less favorably or accepted more risk. Actions that depart from
the current strategy will have less known consequences and thus be seen as risky, and
low performance causes increased propensity to take risky actions (Kahneman and
Tversky, 1979; Bromiley, 1991; March and Shapira, 1992), making exploration
innovations benefit disproportionately from low performance. Hence, performance
should have a greater effect on exploration innovations:
Hypothesis 1a: When performance relative to the aspiration level decreases,
the rates of launching exploration innovations and exploitation innovations
increase.
Hypothesis 1b: Performance relative to the aspiration level has a stronger
effect on exploration innovations than on exploitation innovations.
1.4 Slack search and innovations
Slack resources are argued to be an important determinant of innovations (Jelinek
and Schoonhoven, 1990; Schoonhoven et al., 1990). Organizations with excess
resources engage in slack search, which is search for “innovations that would not be
6 of 31 H. R. Greve
approved in the face of scarcity but have strong subunit support” (Cyert and March,
1963: 279). Unlike problemistic search, slack search is unrelated to immediate
problems and guided mainly by the interests of the individuals and groups engaged
in search. Slack search is thus closely associated with organizational exploration
(March, 1991). Organizations with slack resources have greater opportunities for
experimentation and laxer performance monitoring, both of which are needed to
make exploration innovations (Lounamaa and March, 1987).
Slack in the form of administrative resources beyond what is necessary for the
short-term operation and maintenance of the organization is called absorbed slack
(Singh, 1986). Facilities for R&D, staff specialized for development purposes, and
time for development activities among other staff are examples of absorbed slack
useful for developing innovations. Absorbed slack less useful for developing
innovations includes large administrations, costly facilities, and high wage levels,
so absorbed slack only increases the supply of innovations if some of it is directed to
innovation development.
Slack in the form of financial reserves is called unabsorbed slack (Singh, 1986).
Unabsorbed slack is not directly helpful in the development of innovations, but it
affects the decision to continue R&D projects because great financial resources lead
to laxer performance monitoring of uncertain projects. Strict performance
monitoring can cause new activities to be aborted before the organization has
accumulated enough experience to know whether they will eventually improve its
performance (Lounamaa and March, 1987), which can cause premature termination
of R&D projects.
As argued previously, exploration innovations have high risk of termination as a
result of perceived lack of fit with the current strategy (Dougherty, 1992) and high
risk (Singh, 1986; Howell and Higgins, 1990), so an innovation development process
geared towards risk reduction and strategy congruence may weed them out even
before the launch stage. Organizational slack can save explorative development
processes in the form of unauthorized research (Jelinek and Schoonhoven, 1990;
Burgelman, 1991), leading to the suggestion that slack increases the development of
exploration innovations. However, this prediction cannot be made for exploration
innovations only, as low levels of slack could lead to termination of projects to
develop exploitation innovations as well. Thus, we predict that slack search increases
the rates of both exploration and exploitation innovations, but that the effect on
exploration innovations is greater:
Hypothesis 2a: When absorbed and unabsorbed slack resources increase, the
rates of launching exploration innovations and exploitation innovations
increase.
Hypothesis 2b: Absorbed and unabsorbed slack resources have
a stronger effect on exploration innovations than on exploitation
innovations.
Exploration and exploitation in product innovation 7 of 31
1.5 Routinization of innovative direction
Organizations build up routines when activities are performed repeatedly (Nelson
and Winter, 1982), and this routinization offers productivity advantages such as
those seen in learning-curve effects on the unit cost of production (Argote, 1999),
causing actions performed recently to be more efficiently executed. Also, major
managerial actions are subject to interpretation and self-attribution that give actions
recently performed greater prominence in decision making (March et al., 1991).
These mechanisms make repetition more likely than novelty and give greater
short-term rewards to repeated actions than to new ones (Levinthal and March,
1981). The result is organizational momentum, or the tendency to repeat previous
actions (Miller and Friesen, 1982; Kelly and Amburgey, 1991).
Organizational momentum is seen as one of the processes favoring exploitation
over exploration because momentum is caused by positive feedback from repetition
of known actions (Kelly and Amburgey, 1991). The homogeneity of exploitation
innovations may result in greater ease of routinizing them, but some organizations
also develop routines for making exploration innovations (Jelinek and Schoonhoven,
1990). Thus, an organization is more likely to make an exploitation innovation the
more recently it has made an exploitation innovation, and is more likely to make an
exploration innovation the more recently it has made an exploration innovation.
Conversely, organizational routines atrophy with disuse (Argote, 1999), making it
less likely that organizations will innovate when they have not done so for a while.
A parsimonious way of formalizing this argument is to let the likelihood of an
exploitation innovation and an exploration innovation, respectively, depend on the
duration since the last time the same kind of innovation has been made (Amburgey
et al., 1993). The weakening of routines through disuse implies that the effect of
duration is negative; making an innovation less likely the more time has passed since
the previous one. These predictions can be made:
Hypothesis 3a: The rate of launching exploration innovations decreases with
the duration since the last exploration innovation.
Hypothesis 3b: The rate of launching exploitation innovations decreases
with the duration since the last exploitation innovation.
1.6 Exploitation bias and innovative direction
Exploration and exploitation compete for a limited pool of resources, leaving
managers with a choice of which to support more strongly (March, 1991). Moreover,
exploitation and exploration differ in attention patterns because an organization that
explores seeks to learn from experiments performed by subunits, while an
organization that exploits seeks to make each subunit conduct activities that draw
on the existing organizational knowledge (March, 1991). An important mechanism
to support exploitation is cancellation of R&D projects that diverge from the
8 of 31 H. R. Greve
organizational strategy and transfer of resources to strategy-congruent projects
(Burgelman, 1991; Dougherty and Heller, 1994).
How the tradeoff between exploration and exploitation is made differs among
organizations, and may systematically depend on their prior record of exploration
and exploitation, as hypothesized earlier. In addition to this mechanism, theoretical
work has proposed that the tradeoff tends to be made in favor of exploiting more
intensely because exploitation has greater and more certain benefits in the short run,
which is a feedback pattern that easily draws attention and is rewarded by managerial
incentives (Levinthal and March, 1993). Thus, the competition for resources is
asymmetric, with exploitation innovations harming exploration innovations but not
the other way around. The result is that performing exploitation not only improves
the organizational routines for exploitation and increases the likelihood that
exploitation will be performed again; it also reduces the resources available for
exploration. Thus the prediction is:
Hypothesis 4: The rate of launching exploration innovations decreases with
the proportion of recent exploitation innovations.
1.7 Integration and theoretical problems
Through its prediction that resources allow generation of innovations, the theory of
slack search seems to posit the opposite effect on innovations as that of problemistic
search. On closer examination, the theories differ because problemistic search is a
theory of perceived performance shortfalls, while slack is one of excess resources.
An organization with reserves built up over a period of time but with recent
performance below its managers’ aspiration levels would simultaneously have
resources necessary for innovating and a perceived need to innovate, and would be
predicted to have a high likelihood of launching innovations. An organization with
low reserves may perform above the expectations of its managers, and would be
predicted to have a very low likelihood of launching innovations. One may still ask
whether these mechanisms are different only in principle, but in reality are correlated
because slack resources diminish as a result of low performance and increase as a
result of high performance.
There are two reasons for slack and performance to have low correlation. The first
is that slack is a stock of resources that is incrementally changed by the resource flow
from the performance. If firm differences in stocks are large compared with the
temporal variation in resource flows, then performance and slack will not be highly
correlated. The second is that the evaluation of performance by comparing with an
aspiration level decouples subjective evaluations of success from resource flows
(Levinthal and March, 1981). While these relations both reduce the correlation of
slack and performance, it is an empirical question whether they are distinct in a given
study context.
Exploration and exploitation in product innovation 9 of 31
Problemistic search also has a potential conflict with the theory of threat rigidity,
which argues that low performance may be viewed as a threat, leading to risk aversion
and inability to act (Staw et al., 1981). Theoretical work has sought to resolve this
conflict by determining the conditions under which low performance is seen as a
threat to the existence of the organization or as a repairable problem (March and
Shapira, 1992; Mone et al., 1998). This resolution fits well with evidence that
problemistic search is usually found in organizations with low profitability, but threat
rigidity has been observed in organizations close to bankruptcy or with extremely
low profitability (Wiseman and Bromiley, 1996; Ketchen and Palmer, 1999; Ferrier
et al., 2002; Miller and Chen, 2004). Hence, the prediction that innovations
become more likely as the performance declines should hold for most performance
levels, but may be counteracted by threat rigidity for very low performance.
Finally, an unresolved theoretical question is whether the increased rate of change
in low-performing organizations is a result of problemistic search (Cyert and March,
1963), risk taking (Singh, 1986; Bromiley, 1991), or a combination of the two
(Greve, 1998). The causes are difficult to distinguish because problemistic search and
risk taking make the same prediction as long as changing is more risky than not
changing. Investigation of exploration and exploitation innovations gives leverage for
discovering the role of risk, as the prediction that the effect on exploration
innovations is greater relies solely on theory of risk taking. Hence, if risk taking is
an important explanation for the reactions to low performance, the findings from
analyzing exploration innovation and exploitation innovations should diverge. If risk
taking is not important, and thus problemistic search alone accounts for the effect,
then the findings for exploration innovations and exploitation innovations should be
similar. Clearly, these hypotheses can supply evidence relevant to important
theoretical disputes.
2. Methods
2.1 Japanese shipbuilding
This study uses data on the Japanese shipbuilding industry from 1971 to 2000.
The Japanese shipbuilding industry built its competitiveness in the 1950s and early
60s through a combination of government financing of work-in-process inventories,
firms’ attention to production efficiency, and anticipation of demand changes such
as the tanker boom (Blumental, 1976; Chida and Davies, 1990). Modern production
facilities gave Japanese shipbuilders unrivaled labor productivity, and large
docks allowed them to dominate the supertanker market. Rapid delivery times
were also a source of competitive advantage, and were achieved through
effective production management and an avoidance of large order reserves
(Chida and Davies, 1990). Finally, innovations were used to increase the competitive
10 of 31 H. R. Greve

strength and create new market niches of large and high technology vessels
(Chida and Davies, 1990).
Ships are investment goods used in the production of transportation services.
They have highly flexible life-times: 20 years is often used as a rough estimate of the
lifetime of ships, but they can be scrapped earlier if the shipping firm does not see
prospects for transportation rates high enough to justify continued operations,
and can continue operating for at least a decade more if high rates justify the higher
insurance, maintenance, and repair costs of old ships. The result of these product
characteristics is an extremely variable demand, as shown in Figure 1. Because the
Japanese shipbuilding industry was the world’s largest when the oil shock of 1972
caused the shipbuilding market to collapse, it (along with Western Europe) took
most of the production cut. Western European production never recovered to past
levels as a result of large capacity cuts.
Japanese shipbuilders took a different approach to this crisis. Shipbuilding became
the target of Ministry of Technology and Industry policies for structural adjustment
of declining industries in the late 1970s, which included plans to cut capacity and to
merge some shipbuilders. The firms were able to negotiate joint capacity cuts, but the
ministry’s merger plan failed because the target firms resisted (Strath, 1994). After
the oil crisis passed, the shipbuilders were left to fend for themselves, as policy
attention turned to industries thought to have greater growth potential (Patrick,
1986). The shipbuilders kept their production capacity roughly constant after the
initial round of cuts and used ship repairs and non-shipbuilding business to
maintain activity. The average annual growth of production facilities in Japan fell
from 11% during the most intense expansion from 1967 to 1973 to 4% in the decade
0
2000
4000
6000
8000
10000
12000
14000
16000
18000
1964
1966
1968
1970
1972
1974
1976
1978
1980
1982
1984
1986
1988
1990
1992
1994
1996
1998
20
0020
0220
04
Year
1000
GT
JapanKoreaChinaAmericasW. EuropeE. EuropeOthers
Figure 1 World ship deliveries by nation or region of production.
Exploration and exploitation in product innovation 11 of 31
following the oil crisis and 1% in the next decade.1 However, employment levels were
cut throughout this period. As a result of these decisions, Japanese shipbuilding firms
captured much of the growth in the brief recovery in the first half of the 1980s and
the sustained recovery thereafter, but also took most of the production cuts in the
intervening recession. Possibly as a result of the order cancellations after the oil
shock, Japanese firms built multi-year order reserves when the shipbuilding market
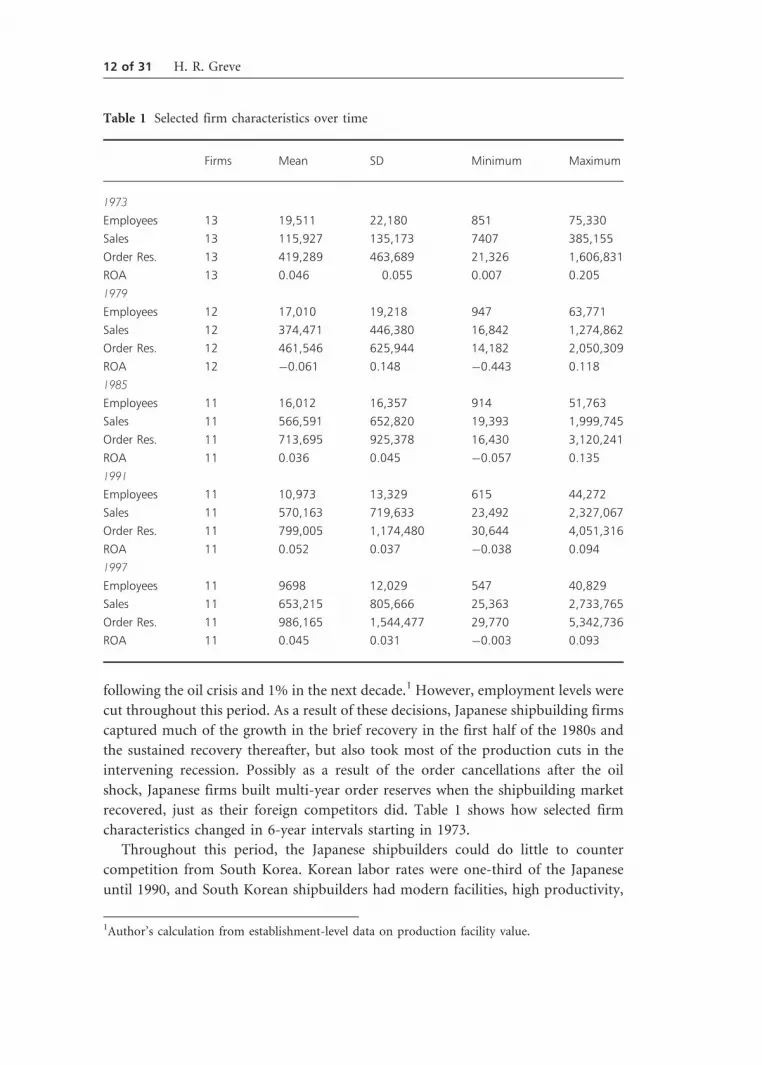
recovered, just as their foreign competitors did. Table 1 shows how selected firm
characteristics changed in 6-year intervals starting in 1973.
Throughout this period, the Japanese shipbuilders could do little to counter
competition from South Korea. Korean labor rates were one-third of the Japanese
until 1990, and South Korean shipbuilders had modern facilities, high productivity,
Table 1 Selected firm characteristics over time
Firms Mean SD Minimum Maximum
1973
Employees 13 19,511 22,180 851 75,330
Sales 13 115,927 135,173 7407 385,155
Order Res. 13 419,289 463,689 21,326 1,606,831
ROA 13 0.046 0.055 0.007 0.205
1979
Employees 12 17,010 19,218 947 63,771
Sales 12 374,471 446,380 16,842 1,274,862
Order Res. 12 461,546 625,944 14,182 2,050,309
ROA 12 �0.061 0.148 �0.443 0.118
1985
Employees 11 16,012 16,357 914 51,763
Sales 11 566,591 652,820 19,393 1,999,745
Order Res. 11 713,695 925,378 16,430 3,120,241
ROA 11 0.036 0.045 �0.057 0.135
1991
Employees 11 10,973 13,329 615 44,272
Sales 11 570,163 719,633 23,492 2,327,067
Order Res. 11 799,005 1,174,480 30,644 4,051,316
ROA 11 0.052 0.037 �0.038 0.094
1997
Employees 11 9698 12,029 547 40,829
Sales 11 653,215 805,666 25,363 2,733,765
Order Res. 11 986,165 1,544,477 29,770 5,342,736
ROA 11 0.045 0.031 �0.003 0.093
1Author’s calculation from establishment-level data on production facility value.
12 of 31 H. R. Greve

and government support. Recently, Chinese shipbuilders, which have yet-lower labor
rates, have expanded greatly, but are technologically behind the Japanese and South
Korean ones. The addition of shipbuilding capacity in China and elsewhere has kept
prices of most ship categories constant or even slightly declining after 19952 despite
the great increase in demand, but the shipbuilders have still been generally profitable
in this period as a result of the high capacity utilization. The idea of consolidation
through mergers resurfaced in year 2000 as two different groups of Japanese
shipbuilders announced that they were in talks to form alliances with a final goal of
merging (Hitachi-NKK and IHI-Sumitomo-Kawasaki-Mitsui; with industry leader
Mitsubishi notably absent from both groups). The first merger to be realized was IHI
and Sumitomo in October 2002.
2.2 Data
The data contain 13 firms, of which 11 were active throughout the study period,
while two disappeared through mergers in 1978 and 1985, respectively. These are all
the Japanese shipbuilding firms listed on the Tokyo and Osaka stock exchanges, and
all are present in the international market for oceangoing ships. The firms range in
size from the giant Mitsubishi Heavy Industries with more than 70,000 employees to
Hashihama Shipbuilding with about 800 employees.
Earlier work found that the Japanese shipbuilders launched innovations in
response to performance below the aspiration level, but did not find effects of slack
resources (Greve, 2003). That work did not distinguish between exploration
innovations and exploitation innovations, however, and estimated Poisson models of
the number of innovations per year, which does not allow testing of how the rate of
making innovations depends on the duration since the last innovation. Thus, the
hypotheses presented here have not seen previous testing.
2.3 Dependent variables
Innovations were identified by reading the monthly journals New Technology
Japan and Techno Japan from 1971 through 2000. The use of technology journals as
data sources reflects a tradeoff between the characteristics of alternative data
sources on innovations. Innovations are listed in the journals, when they meet
the industry’s definition of a technological innovation and are thus subject to
external review. The innovations in these journals are launched as products, unlike
patents, which are sometimes made just to record and protect a technological
advance not yet viewed as ready for use in a product. Because risk taking and
change of routines is important in the theory predicting exploration, mere recording
of a technological advance is a less appropriate dependent variable than the launch
2E.g., as reflected in the ship prices shown in Table 1.6.2 in Shipping Statistics Yearbook by the
Institute of Shipping Economics and Logistics.
Exploration and exploitation in product innovation 13 of 31

of a product innovation. Finally, firm sources such as annual reports lack
external review of the innovativeness of new technologies, so they are vulnerable
to self-presentation concerns.
Classification of the innovations was based on the written description of each
innovation as follows: (i) Exploration innovations were innovations that the sources
described as involving development of new technology or application of existing
technology not earlier used by the focal firm. Thus, Mitsubishi developing a semi-
submerged catamaran hull for high-speed passenger traffic for the first time in the
world and Ishikawajima-Harima developing a navigational simulator for the first
time in Japan were exploration innovations. This coding identified 70 exploration
innovations. (ii) All remaining innovations, 203 in total, were exploitation
innovations that did not involve the firm learning or developing new technology.
The frequency of exploitation innovations in the data reflects the ability of
shipbuilders to reconfigure existing technologies to provide new products, as in the
container ship example mentioned earlier and new marine engine designs by various
shipbuilders.
Figure 2 shows innovation event plots in which each innovation is placed in
a time line, and exploration and exploitation innovations are separated. The plots
are shown for three shipbuilders in the data: Mitsubishi, Mitsui, and Hitachi.
These have more than the average number of innovations, but this helps
demonstrate two features of their innovation plots that are typical of the firms in
the data. First, the rate of innovation is sensitive to the economic conditions,
as there are many more innovations in the troubled early period than in the
high-demand later period. The analysis will show that this difference is accounted
for by the effect of firm profitability on innovativeness. Second, there is
serial correlation in the type of innovation launched. Exploitation innovations
come in batches, and to some extent this seems to occur for exploration innovations
as well.
The latter observation is important for the theoretical arguments made earlier,
because it supports the idea of temporal specialization in exploration or exploitation
rather than mixing of the two. To provide a formal test, Table 2 shows a simple
analysis of the likelihood of switching innovation type. Each innovation is an
observation, and the dependent variable is whether the innovation is of a different
type (exploration or exploitation) than the previous. Firms are less likely to switch
from an exploitation innovation to an exploration innovation than the other way
around, as one would expect if exploitation drives out exploration. However, the
relative scarcity of exploration innovations can also explain this finding. There is not
a significant effect of the duration since the last innovation, though the positive sign
suggests that switching is least likely shortly after making an innovation. This is
similar to the tendency of self-reinforcing exploration and exploitation observed in
alliance formation (Lavie and Rosenkopf, 2006). Later analysis will examine the firm-
level determinant of each type of innovation.
14 of 31 H. R. Greve

2.4 Independent variables
Nikkei corporation’s NEEDS database of corporate accounts was used to download
accounting measures of performance and slack. Performance was measured through
return on assets (ROA), defined as the operating income divided by the total assets.
Return on assets is theoretically appealing because it is an estimate of economic rents
Exp
lora
tion
Exp
loita
tion
01jan1972 01jan1980 01jan1988
Mitsubishi
Exp
lora
tion
Exp
loita
tion
Inno
vatio
n
Exp
lora
tion
Exp
loita
tion
Inno
vatio
nIn
nova
tion
Hitachi
Mitsui
Date
Date
01jan1996
01jan1972 01jan1980 01jan1988 01jan1996
Date
01jan1972 01jan1980 01jan1988 01jan1996
Figure 2 Innovation event plots.
Exploration and exploitation in product innovation 15 of 31

and is salient in managerial performance evaluation. It is the preferred measure in
work on performance effects on organizational change and risk taking (Bromiley,
1991; Lant et al., 1992; Wiseman and Bromiley, 1996; Miller and Chen, 2004). Return
on equity is less preferred because it blends profitability from operations with
the debt–equity mix. Other measures that have seen less use are return on sales
(Audia et al., 2000) and various industry-specific performance measures (Miller and
Chen, 1994; Greve, 1998).
Following Cyert and March (1963: 123), the performance (P) was compared with
an aspiration level (A) computed as a mixture of a social and a historical aspiration
level. The social aspiration (SA) is the average of the other firms’ performance,
calculated as the average ROA of all shipbuilders in the data except the focal firm.
The historical aspiration (HA) level is a weighted average of the previous-year
historical aspiration level and the previous-year performance of the same firm.
Assuming a1 and a2 be weights, the formulae are:
Ati ¼ a1SAti þ ð1� a1ÞHAti
SAti ¼X
j 6¼iPt;j
� �=ðN� 1Þ
HAti ¼ a2HAt�1;i þ ð1� a2ÞPt�1;i
Here, t is a time subscript and i/j are firm subscripts. The weights were estimated
by searching over all parameter values in increments of 0.1 and taking the
combination giving the highest model log likelihood. This procedure yielded a1¼ 0.8
and a2¼ 0.2, which means that the industry average of performance had a weight of
0.8, the firm performance in the previous year had a weight of 0.16, and the historical
aspiration level in the previous year had a weight of 0.04. The performance was split
Table 2 Logit model of switching innovation type
Variable Estimate Odds Ratio
Previous innovation is exploitation �2.133** 0.118
(0.319)
Time since previous innovation 0.239 1.270
(0.157)
Constant 0.648
(0.368)
Log likelihood �146.598
Likelihood ratio test 53.1**
Standard errors are shown in parentheses. 258 observations.
**P50.01; two-sided tests.
16 of 31 H. R. Greve
into the two variables performance above the aspiration level and performance below
the aspiration level to allow a greater effect of performance above the aspiration level,
as predicted by performance feedback theory (Greve, 1998).
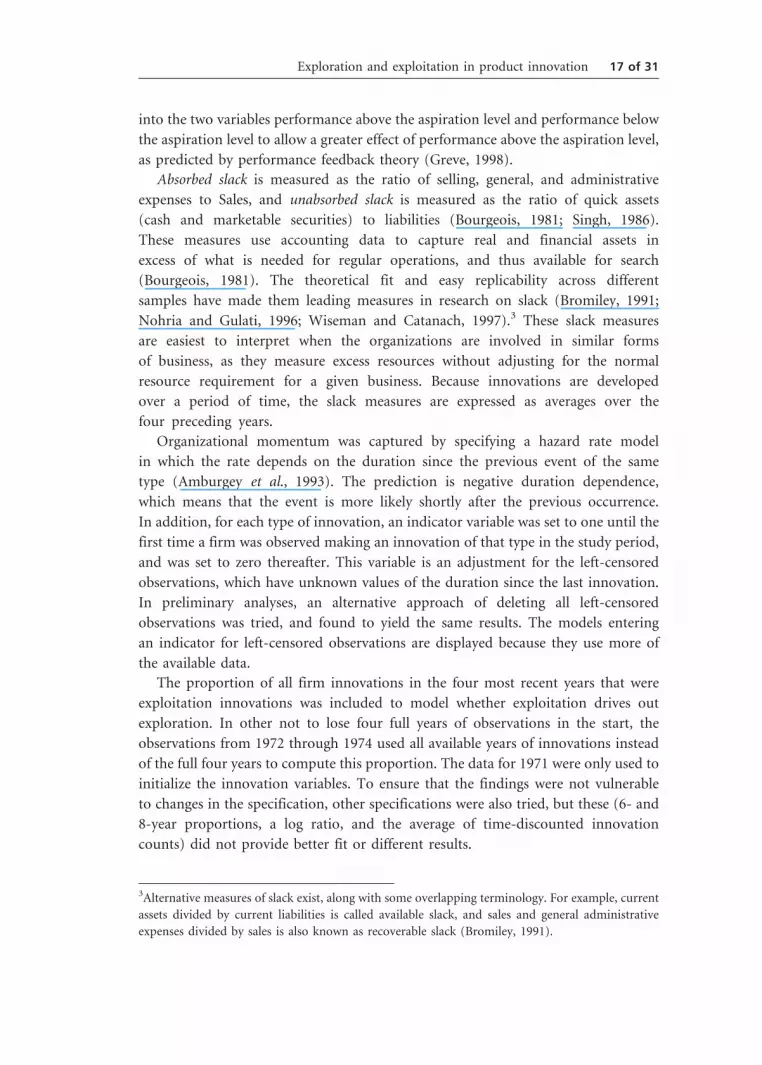
Absorbed slack is measured as the ratio of selling, general, and administrative
expenses to Sales, and unabsorbed slack is measured as the ratio of quick assets
(cash and marketable securities) to liabilities (Bourgeois, 1981; Singh, 1986).
These measures use accounting data to capture real and financial assets in
excess of what is needed for regular operations, and thus available for search
(Bourgeois, 1981). The theoretical fit and easy replicability across different
samples have made them leading measures in research on slack (Bromiley, 1991;
Nohria and Gulati, 1996; Wiseman and Catanach, 1997).3 These slack measures
are easiest to interpret when the organizations are involved in similar forms
of business, as they measure excess resources without adjusting for the normal
resource requirement for a given business. Because innovations are developed
over a period of time, the slack measures are expressed as averages over the
four preceding years.
Organizational momentum was captured by specifying a hazard rate model
in which the rate depends on the duration since the previous event of the same
type (Amburgey et al., 1993). The prediction is negative duration dependence,
which means that the event is more likely shortly after the previous occurrence.
In addition, for each type of innovation, an indicator variable was set to one until the
first time a firm was observed making an innovation of that type in the study period,
and was set to zero thereafter. This variable is an adjustment for the left-censored
observations, which have unknown values of the duration since the last innovation.
In preliminary analyses, an alternative approach of deleting all left-censored
observations was tried, and found to yield the same results. The models entering
an indicator for left-censored observations are displayed because they use more of
the available data.
The proportion of all firm innovations in the four most recent years that were
exploitation innovations was included to model whether exploitation drives out
exploration. In other not to lose four full years of observations in the start, the
observations from 1972 through 1974 used all available years of innovations instead
of the full four years to compute this proportion. The data for 1971 were only used to
initialize the innovation variables. To ensure that the findings were not vulnerable
to changes in the specification, other specifications were also tried, but these (6- and
8-year proportions, a log ratio, and the average of time-discounted innovation
counts) did not provide better fit or different results.
3Alternative measures of slack exist, along with some overlapping terminology. For example, current
assets divided by current liabilities is called available slack, and sales and general administrative
expenses divided by sales is also known as recoverable slack (Bromiley, 1991).
Exploration and exploitation in product innovation 17 of 31

Firms engaged in technological races may launch innovations as a response to
innovations made by other firms. To capture this effect, the number of innovations
made by other Japanese shipbuilding firms in the previous year is entered. To capture
the effect of firm size on innovation capability, the logarithm of the number of
workers was entered. Asset value was also considered as a size variable, but correlated
highly with the number of workers. To control for the effect of economic trends in
shipbuilding on R&D and innovation, a number of industry measures were entered
in exploratory runs, such as the finished tonnage completed by the Japanese
shipbuilders, the growth in shipping income, and various freight rates. Of these, the
Gulf–Europe freight rate proved to be the best predictor and was retained in the
analysis. Freight rates predict shipbuilding because they are high when there is
scarcity of shipping capacity. Finally, large customers may induce the shipbuilder to
make innovations as a result of their greater product development capabilities and
more specialized needs (Dyer and Singh, 1998; Darr and Talmud, 2003; Ingram and
Lifschitz, 2006). To control for this effect, the average customer size, specified as the
logarithm of the average number of ships owned by customers to whom it delivered
ships, was entered as a control variable. The independent variables were lagged
by 1 year.
Table 3 Descriptive statistics and correlation coefficients
Variable Mean SD 1 2 3 4 5 6 7 8 9
Innovations in
industry
13.298 9.576 1.00
Log employees 8.770 1.458 0.17 1.00
Freight rates 10.565 3.743 �0.32 �0.10 1.00
Average customer
size
3.382 0.944 �0.03 0.14 �0.04 1.00
Performance,
over aspiration
0.013 0.028 �0.06 �0.06 0.09 �0.12 1.00
Performance,
under aspiration
�0.016 0.035 0.02 0.16 �0.10 0.14 0.21 1.00
Absorbed slack 0.072 0.028 �0.41 0.48 0.24 0.12 �0.04 0.08 1.00
Unabsorbed slack 0.600 0.096 0.52 �0.23 �0.22 �0.05 �0.21 �0.05 �0.46 1.00
Exploitation
indicator
0.206 0.405 0.04 �0.62 �0.09 �0.03 0.09 �0.04 �0.39 0.26 1.00
Exploration
indicator
0.423 0.494 0.09 �0.83 �0.08 �0.12 0.10 �0.13 �0.76 0.36 0.58 1.00
Exploitation
proportion
0.846 0.239 �0.11 �0.47 �0.01 0.01 �0.00 �0.09 �0.41 0.09 0.30 0.55
4061 observations.
18 of 31 H. R. Greve
Table 3 displays the mean, SD, and correlation matrix of the independent
variables. Some variables have medium to high correlation, but preliminary analyses
with subsets of these variables indicated that the estimates were stable. In addition to
the correlations reported in the table, two correlations coefficients of interest are
those of the return on assets (not adjusted for aspiration levels) with absorbed slack
and unabsorbed slack. These are 0.05 and �0.23, respectively, showing that the
returns in a given year are practically unrelated to the organizational slack. Thus,
performance and slack are both conceptually and empirically distinct.
2.5 Statistical model
The analysis was performed as a continuous-time event history model with two
events—exploration innovation and exploitation innovation. These were modeled as
a competing risk model with a Gompertz specification of the rate and duration since
the last innovation of the same type as the time variable. The Gompertz model
specifies the rate (r) as a function of time (t) and covariates (X) with associated
coefficients (�) as follows:
rt ¼ e�X e�t
The Gompertz model can be fit to a rate that declines over time (which would
support H3a and H3b), one that is constant, or one that increases over time (which
would contradict H3a and H3b) depending on whether the duration parameter � is
negative, zero, or positive. Seemingly unrelated regression was used to obtain
significance tests of coefficient differences across the outcomes, as required by
hypotheses 1b and 2b.4 The data file split spells monthly, in order to update the
covariates, and the event times were precise to the nearest month. The data contained
three pairs of tied event times (two innovations by the same firm in the same
month), which were separated by letting them occur at a half-month interval. The
estimation was done with Stata 9.0.
3. Results
Table 4 presents the results of the analysis. It contains three sets of estimates. Model 1
omits the duration dependence and the proportion of exploitation innovations, and
is thus similar to the model specification in Greve (2003) except that it is a hazard
rate model instead of a count model, and it separates exploration innovations and
exploitation innovations instead of combining them.5 For exploitation innovations,
performance relative to the aspiration level has a negative and significant effect as
4The simpler test of mean equality of two normal distributions is incorrect because the coefficient
estimates are correlated with each other.
Exploration and exploitation in product innovation 19 of 31

Table 4 Event history models of innovations
(1) (2) (3)
Model Outcome Exploit Explore Exploit Explore Exploit Explore
Log employees 1.047** 1.120** 0.862** 0.881** 0.836** 0.879
(0.120) (0.214) (0.139) (0.279) (0.170) (0.280)
Log age �0.681 �2.310* �0.891 �2.210** �0.900 �2.206**
(0.777) (0.922) (0.848) (0.763) (0.841) (0.730)
Freight rates 0.015 0.104** 0.012 0.101** 0.012 0.101**
(0.024) (0.025) (0.022) (0.023) (0.023) (0.024)
Innovations in industry 0.007 0.023 0.003 0.016 0.001 0.016
(0.012) (0.015) (0.012) (0.012) (0.012) (0.013)
Average customer size 0.091 �0.187y 0.076 �0.158 0.088 �0.158
(0.094) (0.096) (0.098) (0.109) (0.112) (0.106)
Performance – aspiration level �10.047* �34.041** �9.394* �31.985** �9.733* �31.909**
(when over aspiration level) (4.384) (10.475) (4.756) (8.635) (4.720) (8.389)
Performance – aspiration level �2.399 26.634** �3.358 28.159** �3.459 28.167**
(when under aspiration level) (3.087) (7.809) (2.888) (6.369) (2.804) (6.559)
Absorbed slack 3.462 10.726y 2.461 8.303 1.616 8.301
(4.366) (6.525) (3.205) (6.561) (3.368) (6.560)
5Th
ism
od
elis
estimated
usin
gth
eexp
on
ential
distrib
utio
n,
wh
ichis
the
same
asa
Go
mp
ertzm
od
el
with
the
du
ration
dep
end
ence
con
strained
tob
ezero
.
20
of
31
H.
R.
Greve

Unabsorbed slack 4.329** 1.894 3.813** 0.876 3.849** 0.871
(1.254) (1.936) (1.173) (1.601) (1.198) (1.621)
Exploitation indicator 0.748 0.781
(1.118) (1.090)
Exploration indicator 0.816 0.820
(0.889) (0.910)
Duration since last �0.0104** �0.0109**
exploitation innovation (0.0037) (0.0039)
Duration since last �0.0092 �0.0093
exploration innovation (0.0059) (0.0065)
Exploitation proportion �0.408 0.024
(0.539) (0.449)
Constant �13.457** �7.009 �9.950* �3.875 �9.299* �3.877
(4.209) (4.867) (4.684) (4.997) (4.598) (4.987)
Events 195 67 195 67 195 67
Log pseudolikelihood �253.233 �101.981 �249.028 �99.727 �248.451 �99.727
Likelihood ratio Chi-square 252.228** 116.4469** 260.638** 120.9549** 261.792** 120.9549**
Degrees of freedom 9 9 11 11 12 12
Robust standard errors adjusted for clustering by firm are in parentheses. 4061 observations.
yP50.10; *P50.105; **P50.01; two-sided tests.
Exp
loratio
nan
dexp
loitatio
nin
pro
du
ctin
no
vation
21
of
31

predicted, but only above the aspiration level. For exploration innovations,
performance relative to the aspiration has a negative and significant effect above
the aspiration level, and a coefficient twice the size of that for exploitation
innovations, and a positive and significant effect below the aspiration level. The
results for exploitation innovations are exactly as those in Greve (2003), but the
positive effect of performance below the aspiration level on exploration innovations
is a new finding. It suggests that the greater risk of exploration innovations makes
these less likely for firms with very low performance, giving the greatest likelihood of
exploration innovations for firms with performance near the aspiration level. For
exploitation innovations, unabsorbed slack has a positive and significant effect. This
finding is different from Greve (2003), who found no effect of slack. The difference in
results suggests that financial resources are more important for exploitation
innovations.
Model 2 introduces the duration dependence variables, and is used to test
hypotheses 1 through 3. Hypothesis 1a is tested by the coefficient estimates for
performance minus aspiration levels, which show the same results as in model 1. The
effects on exploitation are both negative as predicted, and the coefficient above the
aspiration level is significant, in support of hypothesis 1a. The effect on exploration is
negative and significant above the aspiration level, in support of hypothesis 1a. Below
the aspiration level, the effect on exploration is positive and significant, which
contradicts hypothesis 1a and shows that this more risky outcome is less likely in
firms with very low performance. Hypothesis 1b is tested by seemingly unrelated
regression Chi-square tests of equality of the coefficients for performance across the
exploration and exploitation. Such tests were performed, but were not significant for
performance above the aspiration level despite the difference in effect magnitude.
The coefficients of performance below the aspiration level were significantly different
at the 5% level, consistent with hypothesis 1b.
Hypothesis 2a is tested by the coefficients for slack. The findings show lack of
support for an effect of absorbed slack on exploitation innovations, as before. The
coefficient for unabsorbed slack is positive and significant for exploitation,
supporting hypothesis 2a and indicating that financial resources help organizations
make exploitation innovations. For exploration innovations, neither slack variable
has significant effect. The Chi-square test for difference of coefficients used for
assessing hypothesis 2b found no significant difference of the effect of slack on the
two outcomes, so despite the different patterns of significance we cannot conclude
that slack affects exploration and exploitation differently.
Hypothesis 3a is tested by the duration coefficient of exploitation, and is
supported by the negative and significant negative coefficient estimates. Hypothesis
3b is tested by the duration coefficient of exploration, and fails to receive support
because the coefficient is insignificant. The exploitation coefficient shows the
predicted momentum from previous exploitation innovations, resulting in higher
rates of making exploitation innovations soon after a previous one than after some
22 of 31 H. R. Greve

time has passed. The duration coefficient is –0.0104, which implies that a firm that
lets 12 months lapse since the last exploitation innovation will have a rate of
innovating that drops to exp(12��0.0104)¼ 88.3% of the original rate. This is an
appreciable decline, but it is smaller than losses from production stoppages, which
have been estimated to as much as 90% in a year (Argote et al., 1990).
In model 3, the proportion of exploitation innovations has been added to capture
the effect of competition between exploration and exploitation. Hypothesis 4
predicts a negative effect for exploration, and also implies that no significant effect be
seen for exploitation. However, both coefficient estimates are insignificant, and fail
to support the hypothesis. Compared with model 2, model 3 has unchanged findings
on the variables testing hypotheses 1 through 3. This is important with respect to the
findings on duration, which could potentially be affected by entering the new
variable of exploitation proportion.
Various models were estimated to test the sensitivity of the estimates to changes in
the model specification. First, replacing absorbed slack with research and develop-
ment intensity gave no effect of R&D intensity on innovations and unchanged results
for the other variables. Second, estimating performance and slack variables separately
(but with all other variables entered) led to unchanged results. Performance and
slack appear to explain different parts of the variance in the rate of innovation.
Third, estimating models with frailty effects of firms (similar to random effects)
showed that the frailty effects were not significant, and showed only minor changes
in parameter estimates.
4. Discussion
The vulnerability of exploration is fundamental issue in organizational adaptation.
“Compared to returns from exploitation, returns from exploration are systematically
less certain, more remote in time, and organizationally more distant from the locus
of action and adaptation” (March, 1991: 73). Organizational routines such as local
search naturally lead to exploitation (Stuart and Podolny, 1996), and managerial
practices such as the search for production efficiency (Benner and Tushman, 2002)
and strategic consistency (Dougherty and Heller, 1994) have the same effect. Current
theory of exploration and exploitation raises the question of how organizations
manage to explore at all.
The theory developed here uses the lower risk and greater routinization of
exploitation to predict that exploration innovations are more sensitive to
performance and slack and less affected by momentum. Although the findings
suggested some differences between exploitation and exploration innovations,
the similarities are more salient. Exploration innovations were scarcer than
exploitation innovations in the data, but were generated by similar processes.
This is different from current theory, which specifies that low performance
Exploration and exploitation in product innovation 23 of 31

initially triggers local search and thus exploitation, but persistent problems cause
expansion of search and potentially lead to exploration (Cyert and March, 1963;
Grinyer and McKiernan, 1990; Katila and Ahuja, 2002). The findings of this study
suggest that reductions in performance significantly increased the rate of making
exploration innovations as well as that of exploitation innovations, and at the same
time. Managers solving problems do turn to exploitation as a solution, but also try
exploration. Problemistic search thus offers an explanation for why organizations
that usually exploit will sometimes try exploration.
The analyses showed that unabsorbed (financial) slack affected exploitation
innovations. This finding is perhaps surprising, and suggests that financial reserves
affects managerial decision making so strongly that they increase innovation launch
rates. Money in the bank obviously does not create innovations, but it does influence
managerial perceptions of risk. This finding is consistent with work showing that risk
taking is increased by unabsorbed slack, but not by absorbed slack (Singh, 1986), and
suggests a role of risk preferences in the launching of innovations.
The findings suggest that some organizations build up routines for exploration
that lead them to be overall more innovative than other organizations (Miller and
Friesen, 1982). The analyses showed decay in the rate of exploitation innovations,
when the duration since the last one increased, as routinization of innovations would
predict. The rates of decay for exploration innovations were approximately the same
as those for exploitation innovations, but not significant, so it is difficult to tell
whether these innovation types are routinized differently. Routinization theory
predicts repetition of innovation patterns, which explains both cross-sectional
differences of firm innovation rates and temporal clustering of individual firms’
exploration and exploitation innovations. The analysis did not show that
exploitation reduces exploration rates, and hence failed to support the direct
tradeoff between exploration and exploitation that theory has suggested (March,
1991). Overall the findings show that organizational learning theory explains how
organizations adjust the rates of exploration and exploitation innovations, but it does
better in predicting the overall level of each one than in predicting shifts between
them.
The study has some limitations that suggest a need for further work. First, the data
set is not sufficiently large that we can be sure that the failure to find differential
effects on exploration and exploitation is because the effects are not there, or because
the effects are too weak to be distinguished in the data. This problem is intrinsic to
the study of innovations, which are often rare events. A larger study might find
differential effects between these determinants of exploration and exploitation
innovations, and would give better indication of whether direct competition from
exploitation to exploration occurs.
Second, the single-industry research design leaves doubts about the general-
izability of the findings. There are industries with a higher baseline pace of
innovation because they use technologies that are in rapid development, as in
24 of 31 H. R. Greve

computing and telecommunications. Without further investigation we cannot be
sure that the organizational search processes seen in such industries are the same as
those observed here, so investigation of these hypotheses in industries with fast-
paced technological change should be a high priority.
Finally, exploration and exploitation are concepts that extend to the market
behavior of firms as well as to their technology behaviors. It is not clear that studies
can generalize across these two outcomes, although from a theoretical viewpoint,
symmetric findings are expected. When investigating exploration and exploitation in
markets, operationalizing the degree of exploration in a given action (such as a
market entry) is probably at least as difficult as when investigating exploration and
exploitation in technology. However, it would be highly valuable to investigate the
determinants of exploration and exploitation in markets.
There are clear opportunities for further research to extend our knowledge of the
drivers of exploration and exploitation. It would be useful to expand the search for
variables that shift the balance between exploration and exploitation, and to perform
similar tests of their joint effects on exploration innovation and exploitation
innovations. For example, an important topic in current research is how the network
positions of firms affect their innovativeness (Baum et al., 2000; Tsai, 2001; Ruef,
2002). It seems likely that network position affects the type of innovation firms make
as well as the overall level of innovativeness. Firms with diverse networks through
structural holes or diverse contacts may more easily obtain the knowledge necessary
to make exploration innovations (Burt, 2004).
However, innovation rates are not just determined by knowledge entering
organizations, but also by how knowledge is turned into innovations that are
launched as products (Fiol, 1996). Much work has sought to identify internal
organizational routines that efficiently generate innovations, as well as factors that
prevent successful innovation development (Burgelman and Sayles, 1986; Leonard-
Barton, 1995; Van de Ven et al., 1999). This work should be extended to also identify
factors that lead to more or less explorative innovations. The present findings showed
rather slow decay of innovation rates, implying that the ability to innovate is
embedded in relatively stable organizational structures and routines. Discovering
exactly what these structures and routines are requires direct examination of the
process.
The findings suggested a large influence of managerial decision making on
organizational innovations, as earlier work has done (Dougherty, 1992; Dougherty
and Heller, 1994). Specifically, managerial problem solving and risk taking seem to
account for the effects of performance relative to aspirations and unabsorbed slack.
This suggests that examination of additional managerial characteristics that may
influence organizational innovativeness will be fruitful. Clearly, characteristics that
predict willingness to accept applications of new knowledge would be particularly
important for exploration innovations. One conjecture is that management teams
with greater cognitive diversity will have greater willingness to launch exploration
Exploration and exploitation in product innovation 25 of 31

innovations because a diverse base of knowledge and interpretation improves the
ability to analyze such innovations (De Dreu and West, 2001).
Though the concepts of exploration and exploitation have deep roots in
organizational theory, empirical research distinguishing these types of innovations is
still in its infancy. This study and other recent empirical work have shown that
organizational theory can give testable predictions on how organizations choose
between exploration and exploitation, and that these predictions have some
empirical success. It seems likely that further investigation of organizational
exploration and exploitation will help develop the theory of organizational
adaptation to uncertain environments.
Acknowledgements
I am grateful for financial support from Japan’s Ministry of Education and for
helpful comments from Wesley Cohen, Jerker Denrell, Tai-Young Kim, Arie Lewin,
Torben Pedersen, Sim Sitkin, Bilian N. Sullivan, Anand Swaminathan, Alva Taylor,
Udo Zander, Xueguang Zhou, and seminar participants at Copenhagen Business
School, Duke University, Hong Kong University of Science and Technology, and the
Prince Bertil Symposium in Stockholm.
Address for correspondence
Henrich R. Greve, Norwegian School of Management BI, 0442 Oslo, Norway.
e-mail: [email protected]
References
Ahmadjian, C. L. and P. Robinson (2001), ‘Safety in numbers: downsizing and the
deinstitutionalization of permanent employment in Japan,’ Administrative Science Quarterly,
46, 622–654.
Amburgey, T. L., D. Kelly and W. P. Barnett (1993), ‘Resetting the clock: the dynamics of
organizational change and failure,’ Administrative Science Quarterly, 38, 51–73.
Amburgey, T. L. and A. S. Miner (1992), ‘Strategic Momentum: the effects of repetitive,
positional and contextual momentum on merger activity,’ Strategic Management Journal,
13, 335–348.
Antonelli, C. (1989), ‘A failure-inducement model of research and development expenditure:
Italian evidence from the early 1980s,’ Journal of Economic Behavior and Organization, 12,
159–180.
Argote, L. (1999), Organizational Learning: Creating, Retaining, and Transferring Knowledge.
Kluwer Academic Publishers: Boston.
26 of 31 H. R. Greve

Argote, L., S. L. Beckman and D. Epple (1990), ‘The persistence and transfer of learning in
industrial settings,’ Management Science, 36, 140–154.
Argote, L. and H. R. Greve (2007), ‘A behavioral theory of the firm–40 years and counting:
introduction and impact,’ Organization Science, 18, in print.
Audia, P. G., E. A. Locke and K. G. Smith (2000), ‘The paradox of success: an archival and a
laboratory study of strategic persistence following a radical environmental change,’ Academy
of Management Journal, 43, 837–853.
Baum, J. A. C., T. Calabrese and B. S. Silverman (2000), ‘Don’t go it alone: alliance network
composition and startups’ performance in Canadian biotechnology,’ Strategic Management
Journal, 21, 267–294.
Beckman, C. M. (2006), ‘The influence of founding team company affiliations on firm
behavior,’ Academy of Management Journal, 49, 741–758.
Beckman, C. M., P. R. Haunschild and D. J. Phillips (2004), ‘Friends or strangers? Firm-
specific uncertainty, market uncertainty, and network partner selection,’ Organization
Science, 15, 259–275.
Benner, M. J. and M. L. Tushman (2002), ‘Process management and technological innovation:
a longitudinal study of the photography and paint industries,’ Administrative Science
Quarterly, 47, 676–706.
Benner, M. J. and M. L. Tushman (2003), ‘Exploitation, exploration, and process
management: the productivity dilemma revisited,’ Academy of Management Review, 28,
238–256.
Blumental, T. (1976), ‘The Japanese shipbuilding industry,’ in H. Patrick (ed.),
Japanese Industrialization and its Social Consequences. University of California Press:
Berkeley.
Bolton, M. K. (1993), ‘Organizational innovation and substandard performance: when is
necessity the mother of innovation,’ Organization Science, 4, 57–75.
Bourgeois, L. J. (1981), ‘On the measurement of organizational slack,’ Academy of
Management Review, 6, 29–39.
Bromiley, P. (1991), ‘Testing a causal model of corporate risk taking and performance,’
Academy of Management Journal, 34, 37–59.
Burgelman, R. A. (1991), ‘Intraorganizational ecology of strategy making and organizational
adaptation: theory and field research,’ Organization Science, 2, 239–262.
Burgelman, R. A. (2002), ‘Strategy as vector and the inertia of coevolutionary lock-in,’
Administrative Science Quarterly, 47, 325–357.
Burgelman, R. A. and L. R. Sayles (1986), Inside Corporate Innovation: Strategy, Structure, and
Managerial Skills. Free Press: New York.
Burt, R. S. (2004), ‘Structural holes and good ideas,’ American Journal of Sociology, 110,
349–399.
Cattani, G. (2005), ‘Preadaptation, firm heterogeneity, and technological performance: a study
on the evolution of fiber optics, 1970–1995,’ Organization Science, 16, 563–580.
Exploration and exploitation in product innovation 27 of 31

Chida, T. and P. N. Davies (1990), The Japanese Shipping and Shipbuilding Industries: A History
of Their Modern Growth. Athlone press: London.
Christensen, C. M. and J. L. Bower (1996), ‘Customer power, strategic investment, and the
failure of leading firms,’ Strategic Management Journal, 17, 197–218.
Cyert, R. M. and J. G. March (1963), A Behavioral Theory of the Firm. Prentice-Hall:
Englewood Cliffs, NJ.
Darr, A. and I. Talmud (2003), ‘The structure of knowledge and seller-buyer networks in
markets for emergent technologies,’ Organization Studies, 24, 435–453.
De Dreu, C. K. W. and M. A. West (2001), ‘Minority dissent and team innovation: the
importance of participation in decision making,’ Journal of Applied Psychology, 86,
1191–1201.
Dewar, R. D. and J. E. Dutton (1986), ‘The adoption of radical and incremental innovations:
an empirical analysis,’ Management Science, 32, 1422–1433.
Dougherty, D. (1992), ‘Interpretive barriers to successful product innovation in large firms,’
Organization Science, 3, 179–202.
Dougherty, D. and T. Heller (1994), ‘The illegitimacy of successful product innovation in
established firms,’ Organization Science, 5, 200–218.
Dyer, J. H. and H. Singh (1998), ‘The relational view: cooperative strategy and sources of
interorganizational competitive advantage,’ Academy of Management Review, 23, 660–679.
Fagiolo, G. and G. Dosi (2003), ‘Exploitation, exploration and innovation in a model of
endogenous growth with locally interacting agents,’ Structural Change and Economic
Dynamics, 14, 237–273.
Ferrier, W. J., C. M. Fhionnlaoich, K. G. Smith and C. M. Grimm (2002), ‘The impact of
performance distress on aggressive competitive behavior: a reconciliation of conflicting
views,’ Managerial and Decision Economics, 23, 301–316.
Fiol, C. M. (1996), ‘Squeezing harder doesn’t always work: continuing the search for
consistency in innovation research,’ Academy of Management Review, 21, 1012–1021.
Galunic, D. C. and K. M. Eisenhardt (2001), ‘Architectural innovation and modular corporate
forms,’ Academy of Management Journal, 44, 1229–1249.
Greve, H. R. (1998), ‘Performance, aspirations, and risky organizational change,’
Administrative Science Quarterly, 44, 58–86.
Greve, H. R. (2003), ‘A behavioral theory of R&D expenditures and innovation: evidence from
shipbuilding,’ Academy of Management Journal, 46, 685–702.
Griffin, A. (1997), ‘The effect of project and process characteristics on product development
cycle time,’ Journal of Marketing Research, 34, 24–35.
Grinyer, P. and P. McKiernan (1990), ‘Generating major change in stagnating companies,’
Strategic Management Journal, 11, 131–146.
Gupta, A. K., K. G. Smith and C. E. Shalley (2006), ‘The interplay between exploration and
exploitation,’ Academy of Management Journal, 49, 693–706.
28 of 31 H. R. Greve
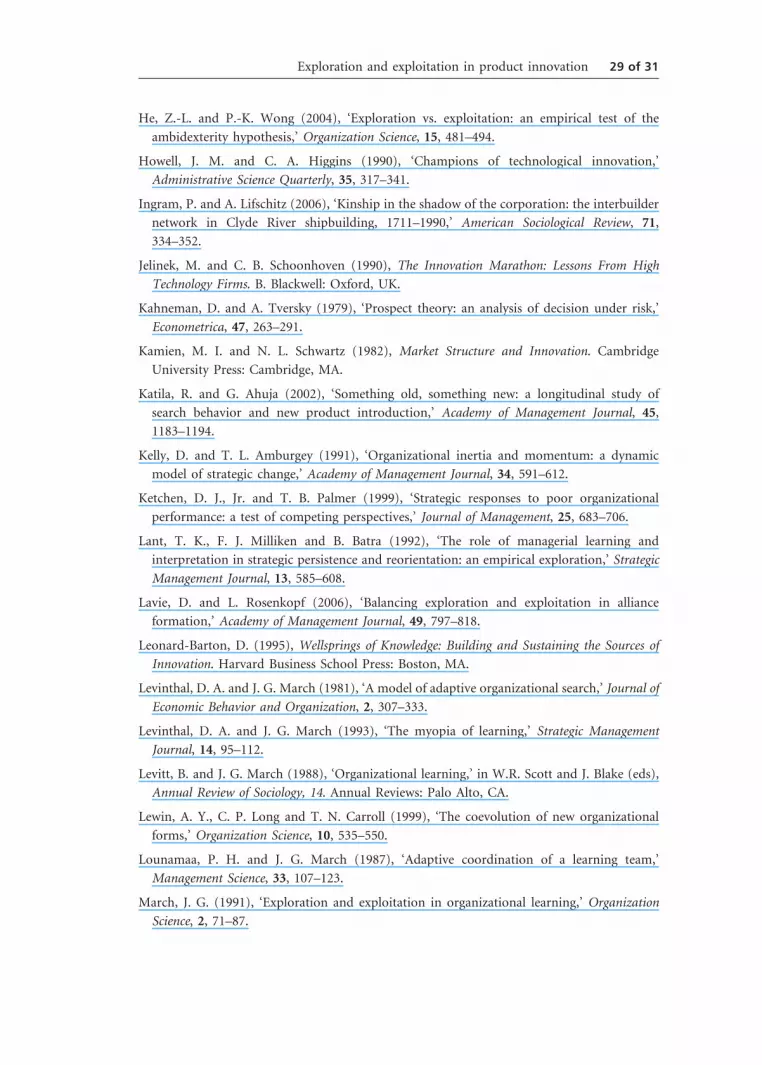
He, Z.-L. and P.-K. Wong (2004), ‘Exploration vs. exploitation: an empirical test of the
ambidexterity hypothesis,’ Organization Science, 15, 481–494.
Howell, J. M. and C. A. Higgins (1990), ‘Champions of technological innovation,’
Administrative Science Quarterly, 35, 317–341.
Ingram, P. and A. Lifschitz (2006), ‘Kinship in the shadow of the corporation: the interbuilder
network in Clyde River shipbuilding, 1711–1990,’ American Sociological Review, 71,
334–352.
Jelinek, M. and C. B. Schoonhoven (1990), The Innovation Marathon: Lessons From High
Technology Firms. B. Blackwell: Oxford, UK.
Kahneman, D. and A. Tversky (1979), ‘Prospect theory: an analysis of decision under risk,’
Econometrica, 47, 263–291.
Kamien, M. I. and N. L. Schwartz (1982), Market Structure and Innovation. Cambridge
University Press: Cambridge, MA.
Katila, R. and G. Ahuja (2002), ‘Something old, something new: a longitudinal study of
search behavior and new product introduction,’ Academy of Management Journal, 45,
1183–1194.
Kelly, D. and T. L. Amburgey (1991), ‘Organizational inertia and momentum: a dynamic
model of strategic change,’ Academy of Management Journal, 34, 591–612.
Ketchen, D. J., Jr. and T. B. Palmer (1999), ‘Strategic responses to poor organizational
performance: a test of competing perspectives,’ Journal of Management, 25, 683–706.
Lant, T. K., F. J. Milliken and B. Batra (1992), ‘The role of managerial learning and
interpretation in strategic persistence and reorientation: an empirical exploration,’ Strategic
Management Journal, 13, 585–608.
Lavie, D. and L. Rosenkopf (2006), ‘Balancing exploration and exploitation in alliance
formation,’ Academy of Management Journal, 49, 797–818.
Leonard-Barton, D. (1995), Wellsprings of Knowledge: Building and Sustaining the Sources of
Innovation. Harvard Business School Press: Boston, MA.
Levinthal, D. A. and J. G. March (1981), ‘A model of adaptive organizational search,’ Journal of
Economic Behavior and Organization, 2, 307–333.
Levinthal, D. A. and J. G. March (1993), ‘The myopia of learning,’ Strategic Management
Journal, 14, 95–112.
Levitt, B. and J. G. March (1988), ‘Organizational learning,’ in W.R. Scott and J. Blake (eds),
Annual Review of Sociology, 14. Annual Reviews: Palo Alto, CA.
Lewin, A. Y., C. P. Long and T. N. Carroll (1999), ‘The coevolution of new organizational
forms,’ Organization Science, 10, 535–550.
Lounamaa, P. H. and J. G. March (1987), ‘Adaptive coordination of a learning team,’
Management Science, 33, 107–123.
March, J. G. (1991), ‘Exploration and exploitation in organizational learning,’ Organization
Science, 2, 71–87.
Exploration and exploitation in product innovation 29 of 31
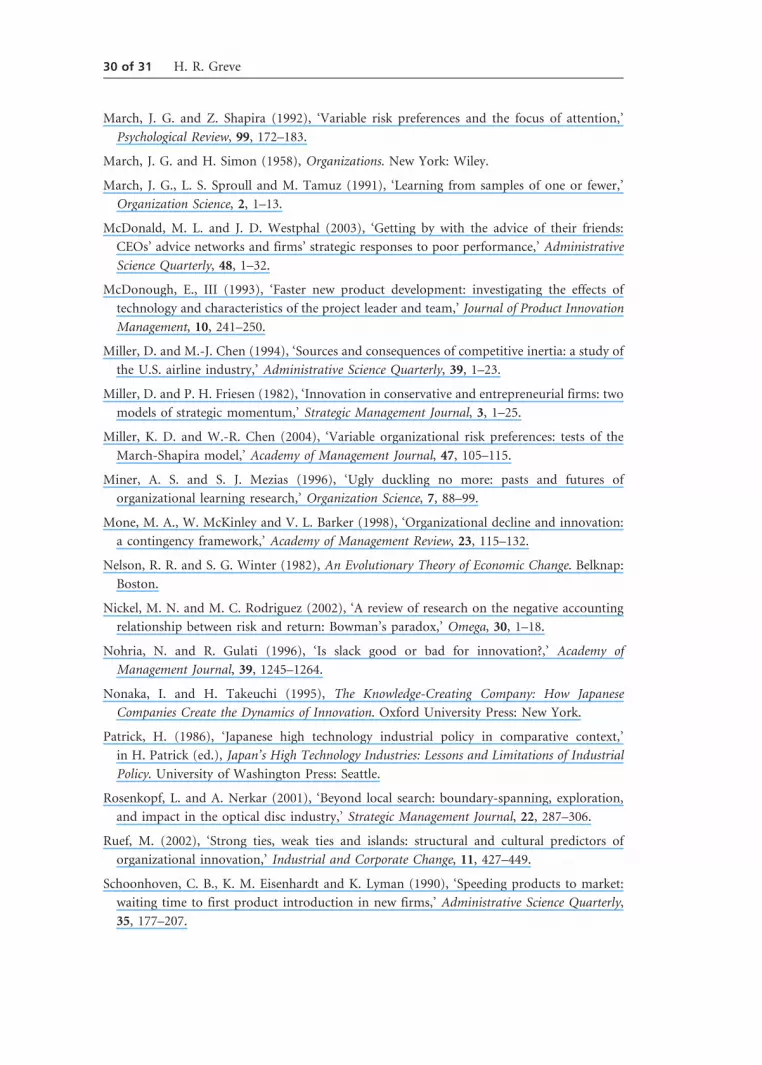
March, J. G. and Z. Shapira (1992), ‘Variable risk preferences and the focus of attention,’
Psychological Review, 99, 172–183.
March, J. G. and H. Simon (1958), Organizations. New York: Wiley.
March, J. G., L. S. Sproull and M. Tamuz (1991), ‘Learning from samples of one or fewer,’
Organization Science, 2, 1–13.
McDonald, M. L. and J. D. Westphal (2003), ‘Getting by with the advice of their friends:
CEOs’ advice networks and firms’ strategic responses to poor performance,’ Administrative
Science Quarterly, 48, 1–32.
McDonough, E., III (1993), ‘Faster new product development: investigating the effects of
technology and characteristics of the project leader and team,’ Journal of Product Innovation
Management, 10, 241–250.
Miller, D. and M.-J. Chen (1994), ‘Sources and consequences of competitive inertia: a study of
the U.S. airline industry,’ Administrative Science Quarterly, 39, 1–23.
Miller, D. and P. H. Friesen (1982), ‘Innovation in conservative and entrepreneurial firms: two
models of strategic momentum,’ Strategic Management Journal, 3, 1–25.
Miller, K. D. and W.-R. Chen (2004), ‘Variable organizational risk preferences: tests of the
March-Shapira model,’ Academy of Management Journal, 47, 105–115.
Miner, A. S. and S. J. Mezias (1996), ‘Ugly duckling no more: pasts and futures of
organizational learning research,’ Organization Science, 7, 88–99.
Mone, M. A., W. McKinley and V. L. Barker (1998), ‘Organizational decline and innovation:
a contingency framework,’ Academy of Management Review, 23, 115–132.
Nelson, R. R. and S. G. Winter (1982), An Evolutionary Theory of Economic Change. Belknap:
Boston.
Nickel, M. N. and M. C. Rodriguez (2002), ‘A review of research on the negative accounting
relationship between risk and return: Bowman’s paradox,’ Omega, 30, 1–18.
Nohria, N. and R. Gulati (1996), ‘Is slack good or bad for innovation?,’ Academy of
Management Journal, 39, 1245–1264.
Nonaka, I. and H. Takeuchi (1995), The Knowledge-Creating Company: How Japanese
Companies Create the Dynamics of Innovation. Oxford University Press: New York.
Patrick, H. (1986), ‘Japanese high technology industrial policy in comparative context,’
in H. Patrick (ed.), Japan’s High Technology Industries: Lessons and Limitations of Industrial
Policy. University of Washington Press: Seattle.
Rosenkopf, L. and A. Nerkar (2001), ‘Beyond local search: boundary-spanning, exploration,
and impact in the optical disc industry,’ Strategic Management Journal, 22, 287–306.
Ruef, M. (2002), ‘Strong ties, weak ties and islands: structural and cultural predictors of
organizational innovation,’ Industrial and Corporate Change, 11, 427–449.
Schoonhoven, C. B., K. M. Eisenhardt and K. Lyman (1990), ‘Speeding products to market:
waiting time to first product introduction in new firms,’ Administrative Science Quarterly,
35, 177–207.
30 of 31 H. R. Greve

Schulz, M. (2002), ‘Organizational learning,’ in J.A.C. Baum (ed.), Companion to
Organizations. Blackwell: Oxford, UK.
Singh, J. V. (1986), ‘Performance, slack, and risk taking in organizational decision making,’
Academy of Management Journal, 29, 562–585.
Staw, B. M., L. E. Sandelands and J. E. Dutton (1981), ‘Threat-rigidity effects in organizational
behavior: a multi-level analysis,’ Administrative Science Quarterly, 26, 501–524.
Strath, B. (1994), ‘Modes of governance in the shipbuilding industry in Germany, Sweden, and
Japan,’ in J.R. Hollingsworth, P.C. Schmitter and W. Streeck (eds), Governing Capitalist
Economies: Performance and Control of Economic Sectors. Oxford University Press:
New York.
Stuart, T. E. and J. M. Podolny (1996), ‘Local search and the evolution of technological
capabilities,’ Strategic Management Journal, 17, 21–38.
Taylor, A. and H. R. Greve (2006), ‘Superman or the fantastic four? Knowledge combination
and experience in innovative teams,’ Academy of Management Journal, 49, 723–740.
Tsai, W. (2001), ‘Knowledge transfer in intraorganizational networks: effects of network
position and absorptive capacity on business unit innovation and performance,’ Academy of
Management Journal, 44, 996–1004.
Tushman, M. L. and P. Anderson (1986), ‘Technological discontinuities and organizational
environments,’ Administrative Science Quarterly, 31, 439–465.
Van de Ven, A., D. E. Polley, R. Garud and S. Venkataraman (1999), The Innovation Journey.
Oxford University Press: New York.
Wiseman, R. M. and P. Bromiley (1996), ‘Toward a model of risk in declining organizations:
an empirical examination of risk, performance and decline,’ Organization Science, 7,
524–543.
Wiseman, R. M. and A. H. Catanach (1997), ‘A longitudinal disaggregation of operational risk
under changing regulations: evidence from the Savings and Loan industry,’ Academy of
Management Journal, 40, 799–830.
Exploration and exploitation in product innovation 31 of 31