drone detection and classification using machine learning
TRANSCRIPT
MASTER
THESIS
Drone Detection and Classification using MachineLearning and Sensor Fusion
Fredrik Svanström
Halmstad University, June 3, 2020

supervisors:PhD Cristofer EnglundPhD Fernando Alonso-FernandezPhD Eren Erdal Aksoy
examiner:Professor Slawomir Nowaczyk
Fredrik Svanström: Drone Detection and Classification using MachineLearning and Sensor Fusion, c©
A B S T R A C T
This thesis explores the process of designing an automatic multi-sensor drone detection system using machine learning and sensorfusion. Besides the more common video and audio sensors, the sys-tem also includes a thermal infrared camera. The results show thatutilizing an infrared sensor is a feasible solution to the drone detec-tion task, and even with slightly lower resolution, the performance isjust as good as a video sensor. The detector performance as a functionof the sensor-to-target distance is also investigated.
Using sensor fusion, the system is made more robust than the in-dividual sensors. It is observed that when using the proposed sensorfusion approach, the output system results are more stable, and thenumber of false detections is mitigated.
A video dataset containing 650 annotated infrared and visible videosof drones, birds, airplanes and helicopters is published. Addition-ally, an audio dataset with the classes drones, helicopters and back-grounds is also published.
iii

C O N T E N T S
1 introduction 1
1.1 Related work 2
1.1.1 Thermal infrared sensors 3
1.1.2 Sensors in the visible range 4
1.1.3 Acoustic sensors 6
1.1.4 RADAR 6
1.1.5 Other drone detection techniques 7
1.1.6 Sensor fusion 7
1.1.7 Drone detection datasets 8
1.2 Thesis scope 9
1.2.1 Thesis system specifications and limitations 9
2 methods and materials 11
2.1 Proposed methodology 12
2.2 System architecture 13
2.3 Hardware 16
2.3.1 Thermal infrared camera 17
2.3.2 Video camera 18
2.3.3 Fisheye lens camera 18
2.3.4 Microphone 18
2.3.5 RADAR module 18
2.3.6 ADS-B receiver 19
2.3.7 GPS receiver 20
2.3.8 Pan/tilt platform including servo controller 20
2.3.9 Laptop 21
2.4 Software 21
2.4.1 System software 22
2.4.2 Support software 35
2.5 Graphical user interface 36
2.6 Dataset for training and evaluation 41
3 results 47
3.1 Performance of the individual sensors 47
3.1.1 Thermal infrared detector and classifier 48
3.1.2 Video detector and classifier 53
3.1.3 Fisheye lens camera motion detector 60
3.1.4 Acoustic classifier 63
3.1.5 RADAR module 65
3.2 Sensor fusion and system performance 67
3.3 Drone detection dataset 81
4 discussion 85
5 conclusions 89
bibliography 91
v

1I N T R O D U C T I O N
Small and remotely controlled unmanned aerial vehicles (UAVs), here-inafter referred to as drones, can be useful and of benefit for society.Examples of their usefulness are to deliver automated external defib-rillators [1], to more effectively fight fires [2] and for law enforcementpurposes. Moreover, the low cost and ease of operation make dronessuitable for entertainment and amusement purposes [3].
Nevertheless, such drones can also be intentionally or unintention-ally misused, so that the safety and security of others are affected orthreatened. In the worse case, this can cause severe structural dam-age to an aircraft if it collides mid-air with a consumer-sized droneeven when flying at moderate speeds as shown by researchers at theUniversity of Dayton [4].
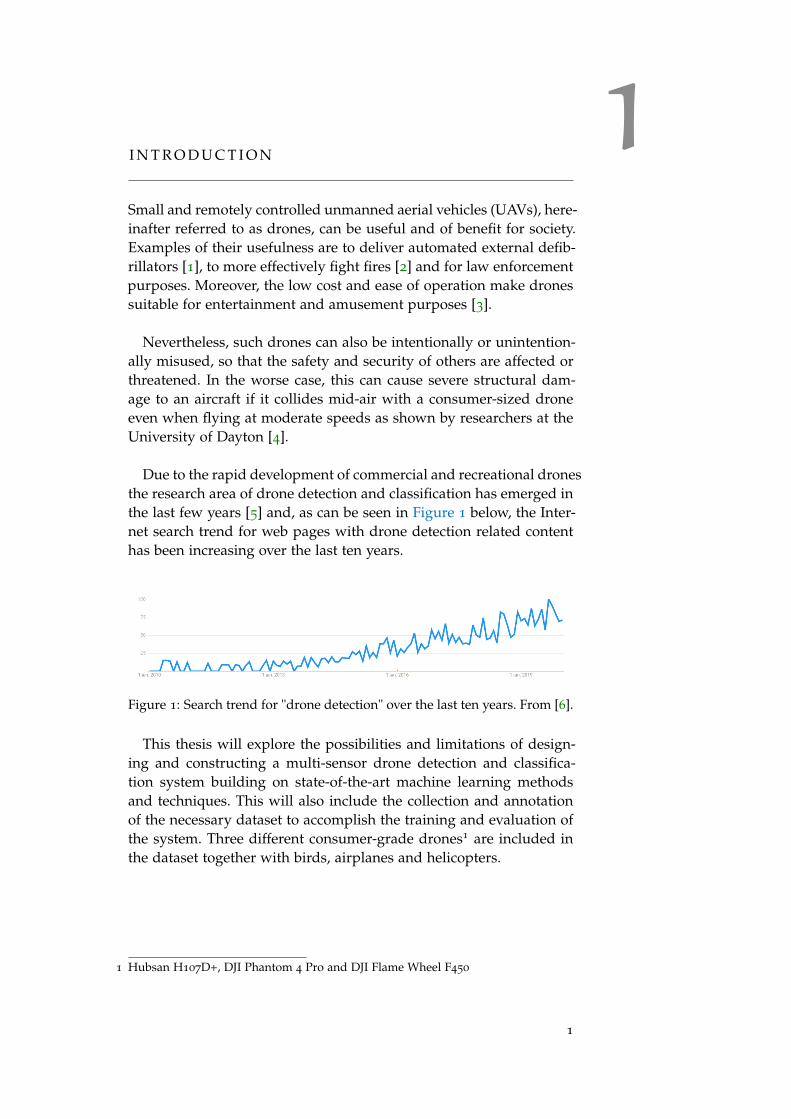
Due to the rapid development of commercial and recreational dronesthe research area of drone detection and classification has emerged inthe last few years [5] and, as can be seen in Figure 1 below, the Inter-net search trend for web pages with drone detection related contenthas been increasing over the last ten years.
Figure 1: Search trend for "drone detection" over the last ten years. From [6].
This thesis will explore the possibilities and limitations of design-ing and constructing a multi-sensor drone detection and classifica-tion system building on state-of-the-art machine learning methodsand techniques. This will also include the collection and annotationof the necessary dataset to accomplish the training and evaluation ofthe system. Three different consumer-grade drones1 are included inthe dataset together with birds, airplanes and helicopters.
1 Hubsan H107D+, DJI Phantom 4 Pro and DJI Flame Wheel F450
1
2 introduction
1.1 related work
To automatically detect flying drones, some form of sensor or sensorsystem is needed. As shown in [7], the fusion of data from multiplesensors, i.e. using several sensors in combination to achieve more ac-curate results than derived from single sensors, while compensatingfor their individual weaknesses, is well-founded when it comes to thedrone detection task.
The sensors that may be considered for drone detection and clas-sification tasks, and hence can be found in the related scientific lit-erature, are: RADAR (on several different frequency bands and bothactive and passive), cameras for the visible spectrum, cameras detect-ing thermal infrared emission (IR), microphones for the detection ofacoustic vibrations, i.e. sound, sensors to detect radio frequency sig-nals to and from the drone and the drone controller (RF), Scanninglasers (Lidar) and, as mentioned in [7] and explored further in [8],even humans. Recently it has also been successfully demonstratedthat animals can be trained to fulfil an anti-drone role [9].
Systems for drone detection utilizing one or more of the aforemen-tioned sensors may also be combined with some form of effector totry to bring the flying drone down or, in some other way, take controlof it. An effector component, however, is not part of this thesis work.
An introduction to the subject of drone detection is found in [10],published in 2018. It incorporates a comparison of advantages anddisadvantages for different drone detection and tracking techniques.Regarding sensor fusion, the authors state that "For accurate and quickdetection/tracking of UAVs, data fusion techniques that can simultaneouslyuse information from multiple types of sensors carry critical importance, andthis constitutes an open research area".
One of the conclusions of [10] is also that "Future research directionsinclude developing effective machine learning methods for detecting, clas-sifying, and tracking drones in various scenarios of interest". The paperalso briefly provides an overview of ways to interdict unauthorizeddrones.
According to the authors, [5] "presents a comprehensive review of cur-rent literature on drone detection and classification using machine learningwith different modalities". This paper, published in 2019, also summa-rizes the results of the related work found in the 50 references intoseveral tables, based on the type of sensor, to better describe the spec-ifications and limitations of the different techniques.
1.1 related work 3
One of the take-home messages is that the authors, on more thanone occasion, stresses the current lack of publicly available referencedatasets. Furthermore, they also write that "No study was presentedwhich investigated the classification performance as a function of drone dis-tance not to speak of determining the range using regression models. Thiscan be a very interesting research area in the future", and that "Most ofthe research in visual drone detection fails to specify the type of the acquisi-tion device, the drone type, the detection range, and the dataset used in theirresearch. These details are key to validate the work and make it comparablewith related literature".
A weakness of [5] is that it does not include any papers that makeuse of thermal infrared cameras and, as we will see next, this is some-thing that will be of importance to this thesis.
Also published in 2019, [7] has an exhaustive 178 references. Withinthese are not only articles specific to drone detection and classifica-tion, but also literature regarding the general techniques employed,e.g. useful aspects of sensor fusion and machine learning.
This paper is directly reflected in the further extent of the thesiswork with conclusions such as "For the case of thermal cameras, wepresent deep learning based methods for general object detection and clas-sification because, to the best of authors’ knowledge, there is currently nowork tackling the UAV detection and classification problem", and "Deeplearning based object detection and classification architectures have been suc-cessfully utilized on thermal imagery for generic targets yet not for UAVs.This could be the motivation for researchers to turn their attention to thisnovel subject".
1.1.1 Thermal infrared sensors
The work described in [11], from 2017, does not utilize any form ofmachine learning but instead the drone detection and classification isdone by a human in real-time looking at the output video stream.
The sensor used is a low-cost FLIR Lepton 80x60 pixels thermalcamera and with this connected to a Raspberry Pi the authors areable to detect three different drone types up to a distance of 100m.One of the things the authors mention is that it is the battery and notthe motors, as one may presume, that is the most significant sourceof heat radiation.
With the background from this paper and the ones above, this the-sis will try to extend these finding using a higher resolution sensor(FLIR Boson with 320x256 pixels) in combination with machine learn-
4 introduction
ing methods to build a system that automatically detects, classifiesand tracks drones. The IR-camera will also be combined with at leastone additional sensor.
The possible advantages of using not only video in the visible rangebut also a thermal infrared camera are explored to some extent in[12]. In the paper, from 2019, the authors describe how they combinethe sensors with deep-learning-based detection and tracking modules.The IR-videos used are stated to have a resolution of 1920x1080, butunfortunately, the sensor is not specified in any further detail.
To detect the drones, a Faster-RCNN is implemented and since "itis more difficult to acquire enough training data for training the thermaldrone detector", the authors of [12] also successfully explore the pos-sibility to use a modified Cycle-GAN (General Adversarial Network)to produce synthetic thermal training data.
The paper presents results using curves of the precision and recallof the detector and the authors conclude that "In both real-world andsynthetic thermal datasets, the thermal detector achieves better performancethan the visible detector". Sadly any details on the distance between thesensor and the target drone is omitted.
Finally, the authors claim that the visible and thermal datasets usedare made available as the "USC drone detection and tracking dataset",without giving any link to it in the paper. This dataset is also men-tioned in [13], but the link found in that paper is unfortunately notworking.
Compared to the results of [12], as summarized above, this thesiswill make use of three different drone types instead of just one inthe data set. It will also expand the number of target classes of thedetector to four and additionally explore the detection performanceas a function of sensor-to-target distance.
A thermal infrared camera is also used as one of the sensors in[14], but just as pointed out in [5], this paper, like several others, failsto specify the type, field of view or even the resolution of the usedsensors, so even if there are useful tables of the results in that paper,any comparison is unfortunately hard to achieve.
1.1.2 Sensors in the visible range
A widespread method to detect drones, as described in recent scien-tific papers, is to combine a video camera with a detector based on a
1.1 related work 5
convolutional neural network (CNN).
One of these papers, published in 2017, is [15] making an in-depthstudy of the performance of six different CNN-models for the dronedetection task. The paper presents metrics for training time and per-formance in speed (frames per second) as well as curves for preces-sion and recall. After comparing the six different solutions, the au-thors conclude that "considering speed and accuracy trade-offs, YOLOv21
might be the most appropriate detection model in our system".
As it turns out, when studying the subject of drone detection in im-ages in the visible range, the YOLOv2-architecture [16] is very com-mon. In [13], [17], [18] and [19] this is the preferred and implementedCNN-model. A lightweight version of the more recent YOLOv3 is uti-lized in [20].
The success of the YOLOv2 motivates the use of it in this thesis.This choice will also make it possible to compare the results to thepapers mentioned above. To be able to match the results from thethermal infrared sensor, the YOLOv2 is also used in that part.
The fact that the two primary sensors (IR and visible) of the dronedetector system in this thesis are placed on a pan/tilt platform alsoarises the need for a wide-angle sensor to steer the sensors in direc-tions where suspicious objects appear. In [20] a static camera with110
◦ field of view (FoV) is used to align a rotating narrow-field cam-era (the images from this is analysed with the YOLOv3-model aspointed out above). To find the objects to be investigated further bythe narrow-field camera, the video stream from the wide-angle one isanalysed by means of a Gaussian Mixture Model (GMM) foregrounddetector in one of the setups evaluated in [20].
The GMM foreground detector will also be implemented in thisthesis for the wide-angle sensor. However, the one used in this casehas an even wider FoV (180
◦). Just as pointed out in [20], this setup isprone to produce false alarms in some situations, but as described inSection 3.1.3, this can be mitigated by tuning the associated detectionand tracking algorithms.
Of the papers found using versions of the YOLO-architecture fordrone detection, [17] has the most output target classes with three(drone, airplane and helicopter) followed by [19] with two classes(drone and bird). None of the YOLO-papers report the detection ac-curacy as a function of the sensor-to-target distance.
1 You Only Look Once in its second version
6 introduction
1.1.3 Acoustic sensors
Numerous papers are also exploring the possibility to detect dronesusing acoustic sensors. Some of these papers, like [21], [22] and [23]utilize the Fast Fourier Transform (FFT) to extract features from theaudio signals.
However, it is observed that the Mel Frequency Cepstrum Coeffi-cients (MFCC) seems to be the most common feature extraction tech-nique, as used in [24], [25], [26] and [27]. The MFCC is "a non-linearmapping of the original frequency according to the auditory mechanism ofthe human ear. It is the most commonly used audio feature in current recog-nition tasks" [25].
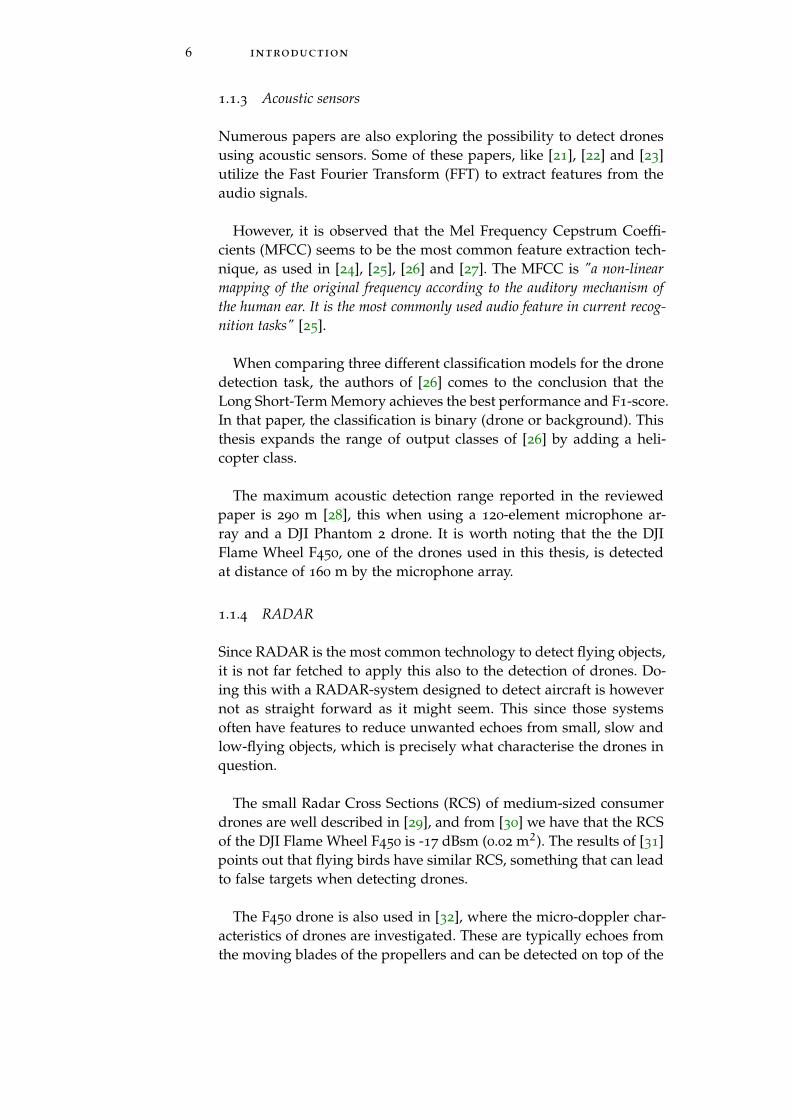
When comparing three different classification models for the dronedetection task, the authors of [26] comes to the conclusion that theLong Short-Term Memory achieves the best performance and F1-score.In that paper, the classification is binary (drone or background). Thisthesis expands the range of output classes of [26] by adding a heli-copter class.
The maximum acoustic detection range reported in the reviewedpaper is 290 m [28], this when using a 120-element microphone ar-ray and a DJI Phantom 2 drone. It is worth noting that the the DJIFlame Wheel F450, one of the drones used in this thesis, is detectedat distance of 160 m by the microphone array.
1.1.4 RADAR
Since RADAR is the most common technology to detect flying objects,it is not far fetched to apply this also to the detection of drones. Do-ing this with a RADAR-system designed to detect aircraft is howevernot as straight forward as it might seem. This since those systemsoften have features to reduce unwanted echoes from small, slow andlow-flying objects, which is precisely what characterise the drones inquestion.
The small Radar Cross Sections (RCS) of medium-sized consumerdrones are well described in [29], and from [30] we have that the RCSof the DJI Flame Wheel F450 is -17 dBsm (0.02 m2). The results of [31]points out that flying birds have similar RCS, something that can leadto false targets when detecting drones.
The F450 drone is also used in [32], where the micro-doppler char-acteristics of drones are investigated. These are typically echoes fromthe moving blades of the propellers and can be detected on top of the
1.1 related work 7
bulk motion doppler signal of the drone. Since the propellers are gen-erally made from plastic materials, the RCS of these parts are evensmaller, and in [29] it is stated that the echoes from the propellersare 20 to 25 dB weaker than that of the drone body itself. Neverthe-less, papers like [33], [34] and [35] all accompany [32] in exploringthe possibility to classify drones using the micro-doppler signature.
1.1.5 Other drone detection techniques
Very few drones are autonomous in the flight phase. Generally, theyare controlled by means of a manned ground equipment, and oftenthe drones themself also send out information on some radio fre-quency (RF). The three drones used in this thesis are all controlled inreal-time. The information sent out by the drones can range from justsimple telemetry data such as battery level (DJI Flame wheel F450),a live video stream (Hubsan H107D+), to both a video stream andextensive position and status information (DJI Phantom 4 Pro).
Utilizing the RF-fingerprint is described in [36], and in [37] a CNNis used to process the information from an antenna array so that thedirection to the drone controller can be calculated within a few de-grees. In [38], signals from 15 different drone controllers are classi-fied with an accuracy of 98.13% using only three RF-features1 in aK-Nearest Neighbour (KNN) classifier.
The use of LiDAR (Light Detection And Ranging) and LADAR(LAser Detection And Ranging) in combination with background sub-traction and a nearest neighbour classifier is shown to successfullydetect drones up to a distance of 2 km in [39].
1.1.6 Sensor fusion
As shown in [7] the fusion of data from multiple sensors, i.e. usingseveral sensors in combination to achieve more accurate results thanderived from single sensors, while compensating for their individualweaknesses, is well-founded when it comes to the drone detectiontask.
As mentioned above, the benefits of sensor fusion are also pointedout in [10], and in [40] the authors describe that "Audio detection,video detection, and RF detection are conducted in parallel. We considerthat missed detection of the intruding drone will bring more security threatsthan false alarm. Therefore, we use logical or operation to fuse the results ofthe above three detectors and obtain the final decision".
1 Shape factor, kurtosis (the tailedness of the energy curve), and the variance
8 introduction
Furthermore under the section Challenges and Open Research Is-sues they conclude that "Although we have realized basic functions fordrone surveillance in our anti-drone system, new challenges have been raised,and there are still some open research issues to be addressed: HeterogeneousInformation Fusion: The result of drone detection should be more than a sim-ple combination of the results separately obtained by audio, video, and RFsurveillance, which will induce great information loss. It is of great signif-icance to develop reliable techniques for the fusion of audio, video, and RFinformation from the aspect of feature fusion and decision fusion".
Without any further specifications of the sensors used besides thatthey are visible, thermal and 2D-radar [14] presents promising resultsfrom experiments using a multilayer perceptron (MLP) to performsensor fusion in a drone detector/classifier with just one output class.
Just as in [7] this thesis also considers early and late sensor fusionand differentiate these two principles based on if the sensor data isfused before or after the detection element.
1.1.7 Drone detection datasets
As mentioned above, [5] points out the lack of a publicly availabledataset. This is also the case in [7] where the authors highlight this es-pecially in the case of thermal infrared cameras and conclude that "thecreation of a dataset for UAV detection and classification based on thermalimages without an increased budget might be out of reach for many univer-sities and research centers". Furthermore, they also state that "there is astrong need for the collection of a real-world UAV audio dataset that couldserve as a benchmark for researchers to develop their algorithms".
In the references of [7], there are two useful links to datasets for vis-ible video detectors. One of these is [41], where 500 annotated droneimages can be found. The other link leads to the dataset [42] of theDrone-vs-Bird challenge held by the Horizon2020 SafeShore projectconsortium. However, the dataset is only available upon request andwith restrictions to the usage and sharing of the data. The Drone-vs-Bird challenge is also mentioned in [18], [19] and by the winning teamof the challenge in 2017 [43]. The results from the 2019 Drone-vs-Birdchallenge is presented in [44].
The dataset used in [20] is not publicly available due to confidential-ity. Since the work of that paper was founded by the French Ministryof Defence, one can presume that the dataset, in one way or another,is a property of the French Government or the French Armed Forces.
1.2 thesis scope 9
1.2 thesis scope
The scope of this thesis is twofold: First, to explore the possibilitiesand limitations of designing and constructing an automatic multi-sensor drone detection system building on state-of-the-art methodsand techniques. In some cases, these methods will also be extendedfrom conclusions and recommendations found in the related work.This extension is achieved by the use of a different sensor combi-nation, exploring the performance based on the sensor-to-target dis-tance, increasing the number of target classes, and incorporating anovel sensor fusion method for the drone detection task.
The second object of the thesis is to collect, compose and publisha drone detection dataset. This dataset should contain data from asmany of the sensors used as possible. The data and the associatedannotations should be in standard formats, so that the data can beimported, reviewed and even edited by others.
Thus, this thesis can be seen as incorporating all phases of design-ing an embedded and intelligent system. From the initial literaturestudy, the subsequent assessment and procurement of suitable sen-sors and hardware components, the design and 3D-printing of partsthat are not available, the programming and training of the system,and finally evaluating it and reporting the results. In this case, thethesis also includes the collection and composition of the requireddataset.
A key doctrine and principle of this thesis will be that to effectivelydetect the sought after drones the system must also, by all possiblemeans, detect and keep track of other flying objects that are likely tobe mistaken for a drone. This follows directly from the conclusions of[18] and [19].
1.2.1 Thesis system specifications and limitations
The system designed in this thesis shall:
• Utilize thermal infrared, visible video and acoustic sensors todetect and classify drones
• Incorporate an ADS-B1 receiver, so that objects flying with anactive transponder can be tracked
• Have four output target classes: airplane2, bird, drone and heli-copter3
1 Automatic Dependent Surveillance–Broadcast2 Manned fixed-wing aircraft3 Manned rotary-wing aircraft
10 introduction
• Have a time constraint on the pan/tilt servo control loop sothat it can track an object flying in front of the system at normalspeeds
• Be close to real-time in the sense that the time from possibleclassification to output is no more than one second
• Use components of standard type, e.g. not of military-grade, sothat it can easily be compared to other detection systems
• Be a stand-alone solution in the sense that it will work withoutan active internet connection
Moreover, the thesis shall include:
• An evaluation of detection and classification performance as afunction of the sensor-to-target distance
• An assessment of the possibilities to use early or late sensorfusion
• The composition and publication of a multi-class, multi-sensordataset
There are also some limitations to the scope of this thesis and someof these are that:
• The system will not be completely weather-proof• It will not have any effector part, i.e. the system will not try to
bring the flying drone down or in any other way take control ofit
• In the work LIDAR, RF, humans or animals will not be consid-ered as sensors to be used in the system setup
• Fixed-wing drones or drones of helicopter type will not be con-sidered, neither very rare aircraft types such as lighter-than-airballoons etc.
A description of the methods and materials used in this thesis isfound below in Chapter 2. The results are found in Chapter 3, fol-lowed by an interpretation of the findings in Chapter 4. Finally, inChapter 5 the main points are summarised together with researchquestions raised by the results.
2M E T H O D S A N D M AT E R I A L S
This chapter describes the proposed methodology and the automaticdrone detection system is also outlined. First, on a system-level andthereafter in deeper detail, both regarding hardware components, howthey are connected to the main computational resource, and the in-volved software.
As pointed out in [5] “Most of the research in visual drone detectionfails to specify the type of the acquisition device, the drone type, the detec-tion range, and the dataset used in their research. These details are key tovalidate the work and make it comparable with related literature”. Hencethe hardware used is initially specified in detail.
After that follows a description of the software running in thedrone detection system when it is active, including the graphical userinterface. The support software used for such tasks as to collect data,to set up the detectors and to evaluate the performance after trainingis also described. For all parts that include a machine learning feature,the training process is also presented.
Finally, the methods used for the composition of the drone detec-tion dataset are described, including the division of the dataset ac-cording to the sensor type, target class and sensor-to-target distancebin.
Since Matlab (version R2019b) is used as the primary developmentenvironment, the thesis text complies with the Matlab terminology sothat all programs are called scripts and what is commonly known as athread is denoted as a worker. To indicate the Matlab functions used,these are printed in a different font, e.g. trainYOLOv2ObjectDetector.In addition to the basic Matlab environment, the following toolboxesare also utilized:
• Image acquisition, including package for video interface• Image processing• Computer vision• Statistics and machine learning• Deep learning, including model for MobileNetv2 network• Audio• Communication• Parallel computing
11
12 methods and materials
2.1 proposed methodology
An efficient drone detection system must have the capability to bothcover a large volume of airspace, and at the same time have the res-olution enough to distinct the drone from other objects. Combiningwide and narrow field of view-cameras is one way to accomplish this[20]. Another way, shown in [17], is to use an array of high-resolutioncameras. Since this thesis incorporates only one infrared sensor, witha fixed field of view, there is no possibility to have neither a wide-angle infrared sensor or an array of such sensors. The proposed wayto achieve the desired volume coverage with the IR-sensor is to haveit on a moving platform. This platform can then either have objectsassigned to it or search by itself, at moments in time when the sensorson it are not busy detecting and classifying objects.
To be able to react to moving objects and also to have the ability totrack those, the combined time-constraints of the detection cycle andthe control loop of the moving platform means that the system mustwork in close to real-time. Hence, all the detection and classificationprocesses must be done efficiently and with as little delay as possible.The feedback loop of the moving platform must run at sub-secondspeed.
To be able to put together such a system, involving both severalsensors and mechanical part makes the importance of choosing theright methods critical. While reviewing the theoretical foundations ofmachine learning techniques, and at the same time look at the practi-cal results reported it is clear that such methods can be found.
This thesis will utilize three machine learning techniques. Two ofthese are supervised, and one is unsupervised. First, it has two detec-tors and classifiers build around the YOLOv2-architecture [16]. Boththese can be seen as a form of transfer learning, since the featureextraction parts build on an already-trained network. The YOLOv2-networks are trained using a dataset with an annotated ground truth.Hereinafter, in this theses, by detection we mean the process of bothdetecting the area where the object is in an image and the classifica-tion that assigns it to one of the labels or classes found in the groundtruth of the training dataset.
Furthermore, the second supervised machine learning techniqueused is a classification function building on the LSTM-architecture[45]. Since this is not detecting the position of an object, but only as-signs the input to the network to one of three label classes, we willrefer to this process just as classification.

2.2 system architecture 13
Finally, an unsupervised technique is also used in the drone detec-tion system. This is based on the segmentation of images using GMMbackground subtraction [46]. By employing this image segmentation,the system is able to find moving objects in the field of view of thewide-angle camera. This will also be referred to as detection even if itdoes not involve a classification of the object seen as in the YOLOv2-case. Since we are not providing the detector with any ground truthof what is foreground and background, this process falls under thecategory of unsupervised machine learning techniques.
One of the conclusions found in the related work is that to be ableto detect the drones with high enough efficiency, the system mustalso recognize and keep track of other flying objects that are likely tobe mistaken for a drone. For some of these drone-like objects, this isindigenous hard, e.g. birds. For others, it is technically possible sincesome of them announce their presence and location via radio. Thetechnical system for this is the ADS-B, over which most aircraft regu-larly transmit messages with varied content.
Combining the data from several sensors under the time constraintsdescribed above must be kept simple and streamlined. This togetherwith the fact that very few papers are exploring sensor fusion tech-niques is the motivation to have a system where the inclusion andweights of the sensors can be altered at runtime to find a feasible set-ting.
To be able to accomplish the necessary training of the detectors andclassifiers, a dataset is also collected. The annotation of this is doneso that the dataset can be inspected, edited and used by others. Thefact that the datasets for the thermal infrared and the visible videosensors are collected under the same conditions, and using the sametargets ensures that a comparison between the two sensor types iswell-founded.
2.2 system architecture
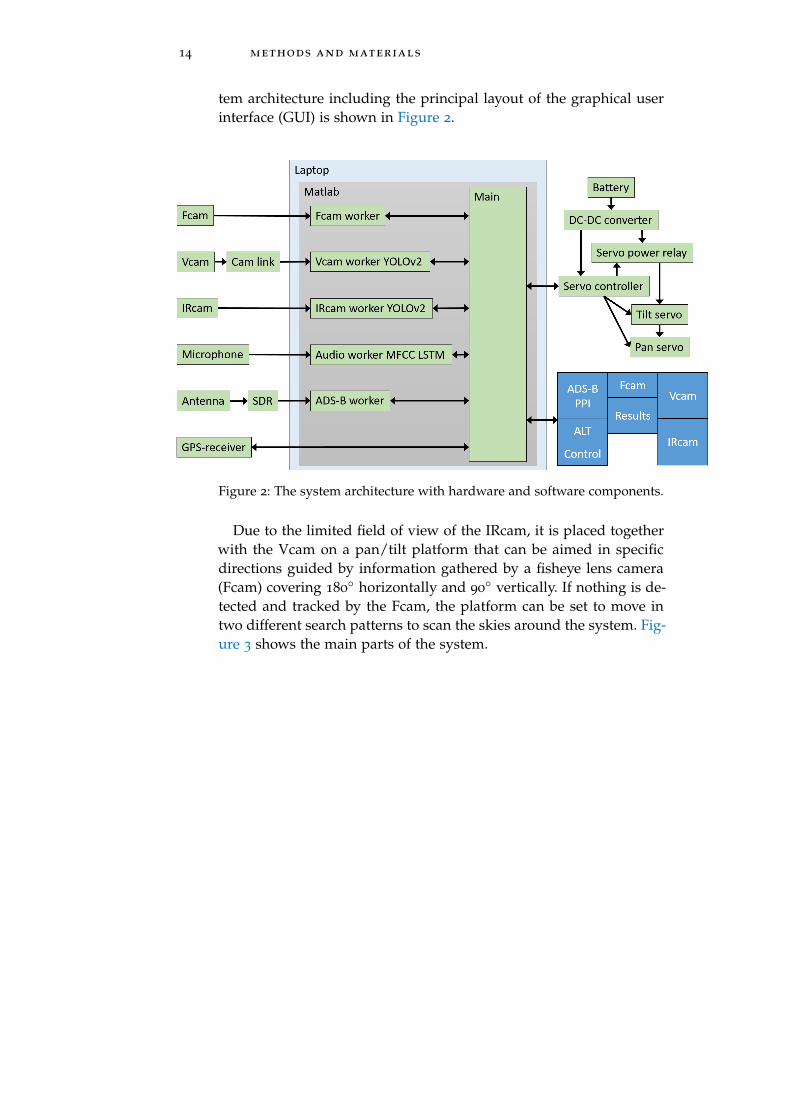
The system utilizes a thermal infrared camera (IRcam) and a videocamera (Vcam) as the primary electro-optical sensors for the detec-tion and classification. To keep track of cooperative aircraft1 in theairspace, ADS-B information is made available in the system. Audiodata is used to detect if a drone or a helicopter is in the vicinity of thesystem using their respective distinctive sounds when they are air-borne. All computations in the system are made in a standard laptop.This is also used to present the detection results to the user. The sys-
1 Cooperative aircraft are here defined as being equipped with an equipment thatbroadcasts the aircraft’s position, velocity vectors and identification information
14 methods and materials
tem architecture including the principal layout of the graphical userinterface (GUI) is shown in Figure 2.
Figure 2: The system architecture with hardware and software components.
Due to the limited field of view of the IRcam, it is placed togetherwith the Vcam on a pan/tilt platform that can be aimed in specificdirections guided by information gathered by a fisheye lens camera(Fcam) covering 180
◦ horizontally and 90◦ vertically. If nothing is de-
tected and tracked by the Fcam, the platform can be set to move intwo different search patterns to scan the skies around the system. Fig-ure 3 shows the main parts of the system.
2.2 system architecture 15
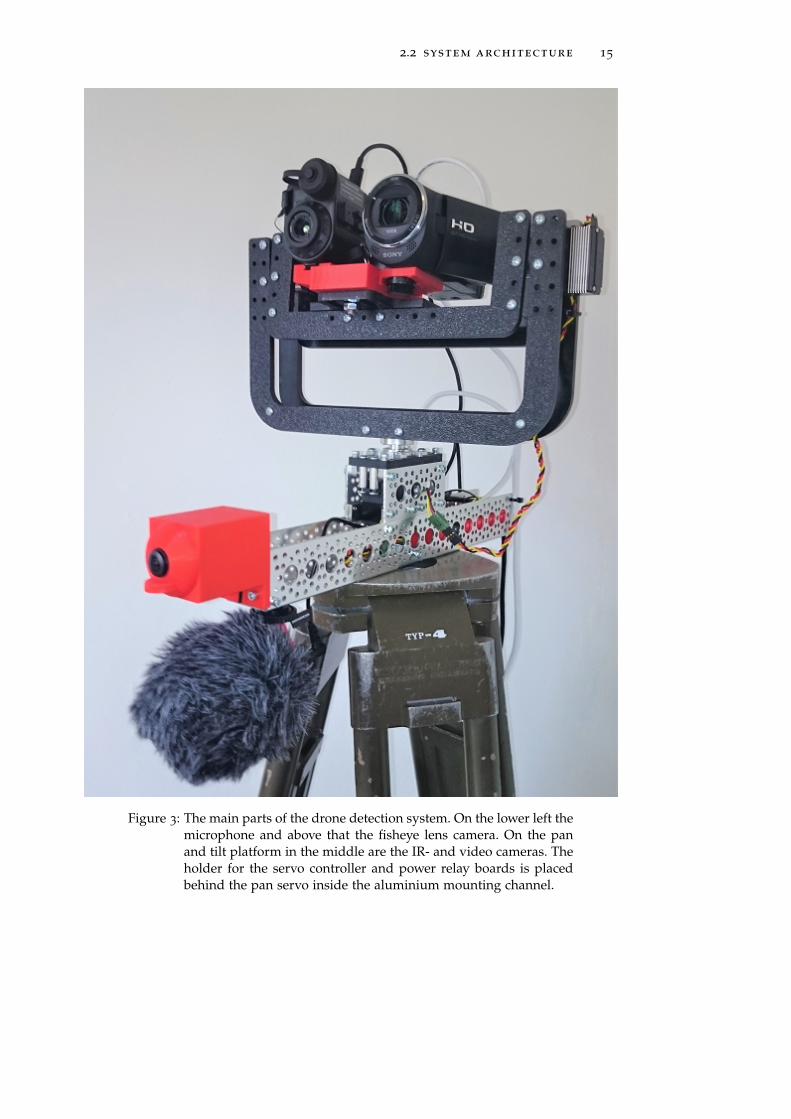
Figure 3: The main parts of the drone detection system. On the lower left themicrophone and above that the fisheye lens camera. On the panand tilt platform in the middle are the IR- and video cameras. Theholder for the servo controller and power relay boards is placedbehind the pan servo inside the aluminium mounting channel.
16 methods and materials
2.3 hardware
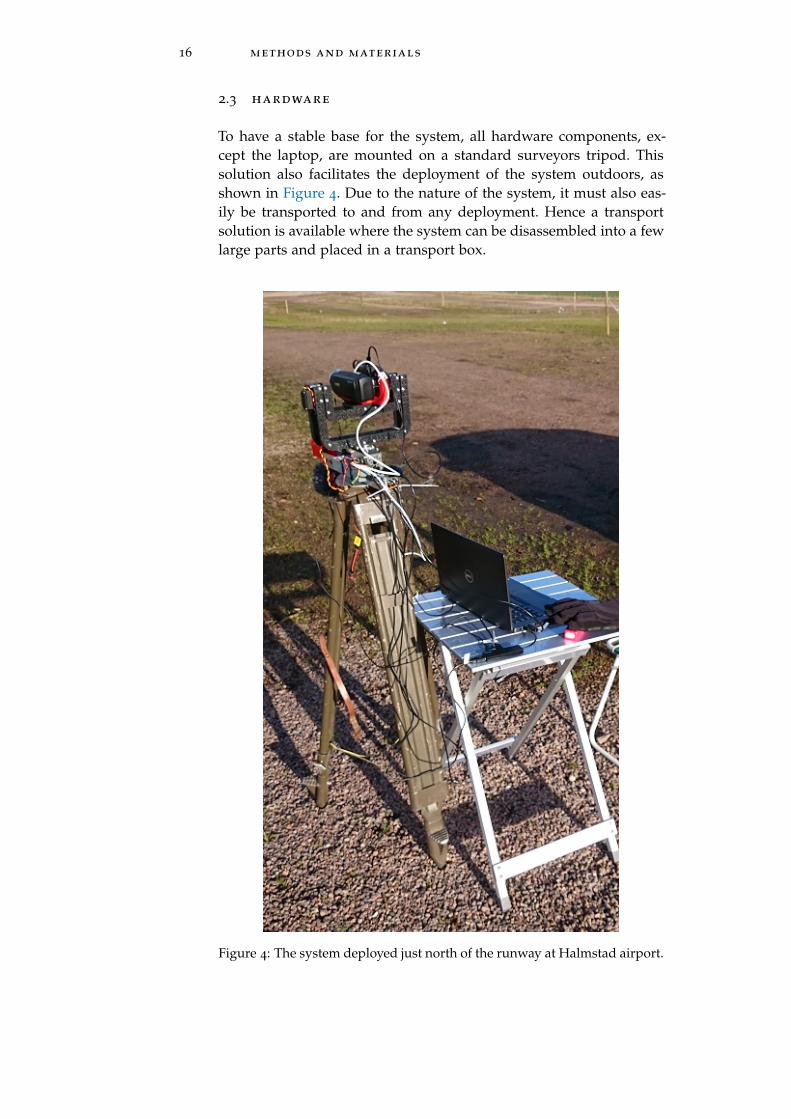
To have a stable base for the system, all hardware components, ex-cept the laptop, are mounted on a standard surveyors tripod. Thissolution also facilitates the deployment of the system outdoors, asshown in Figure 4. Due to the nature of the system, it must also eas-ily be transported to and from any deployment. Hence a transportsolution is available where the system can be disassembled into a fewlarge parts and placed in a transport box.
Figure 4: The system deployed just north of the runway at Halmstad airport.

2.3 hardware 17
Just as in the design of any embedded system, the power consump-tion of the system components have also been taken into considera-tion, not to overload the laptop’s built-in ports and the added USB-hub. For this purpose, the current drawn by all components havebeen measured using a Ruideng AT34 tester.
2.3.1 Thermal infrared camera
The thermal infrared camera used is a FLIR Breach PTQ-136 usingthe Boson 320x256 pixels detector. The field of view of the IR-camerais 24
◦ horizontally and 19◦ vertically. Figure 5 shows an image taken
from the IRcam video stream.
Figure 5: The F450 drone flying at a distance of 3 m in front on the IRcam.
Notably, the Boson sensor of the FLIR Breach has a higher resolu-tion than the one used in [11] where a FLIR Lepton sensor with 80x60
pixels was used. In that paper, the authors were able to detect threedifferent drone types up to a distance of 100m, however this detectionwas done manually by a person looking at the live video stream andnot, as in this thesis, by means of a trained embedded and intelligentsystem.
The IRcam has two output formats, a raw 320x256 pixels format(Y16 with 16-bit greyscale) and an interpolated 640x512 pixels im-age in the I420 format (12 bits per pixel). For the interpolated imageformat, the colour palette can be changed, and several other image
18 methods and materials
processing features are also available. In the system, the raw formatis used to avoid the extra overlaid text information of the interpolatedimage. This choice also grants a better control of the image process-ing operations as they are implemented in Matlab instead.
The output from the IRcam is sent to the laptop via a USB-C portat a rate of 60 frames per second (FPS). The IRcam is also poweredvia the USB connection.
2.3.2 Video camera
A Sony HDR-CX405 video camera is used to record the scenes in thevisible range of the spectrum. The output of this camera is an HDMI-signal and hence a frame grabber in the form of an Elgato Cam Link4K is used to feed the laptop with a 1280x720 video stream in YUY2-format (16 bits per pixel) at 50 FPS.
The Vcam has an adjustable zoom lens, and with this, the field ofview can be set to be both wider or narrower than that describedabove of the IRcam. The Vcam is set to have about the same field ofview as the IRcam.
2.3.3 Fisheye lens camera
To monitor a larger part of the surroundings of the system an ELP8 megapixel 180
◦ fisheye lens camera is also used. This outputs a1024x768 video stream in Mjpg-format at 30 FPS via a USB connector.
2.3.4 Microphone
To be able to capture the distinct sound that drones emit when flyinga Boya BY-MM1 mini cardioid directional microphone is also con-nected to the laptop.
2.3.5 RADAR module
As described in the specification of the system architecture in Sec-tion 2.2 a RADAR module is not incorporated final design. However,since one was available, it was assessed to be included and hencealso described in this section. In Section 3.1.5 the performance of theRADAR module is described, and the exclusion of it is motivated bythe short practical detection range. Figure 6 shows the radar moduleand some of its features.
2.3 hardware 19
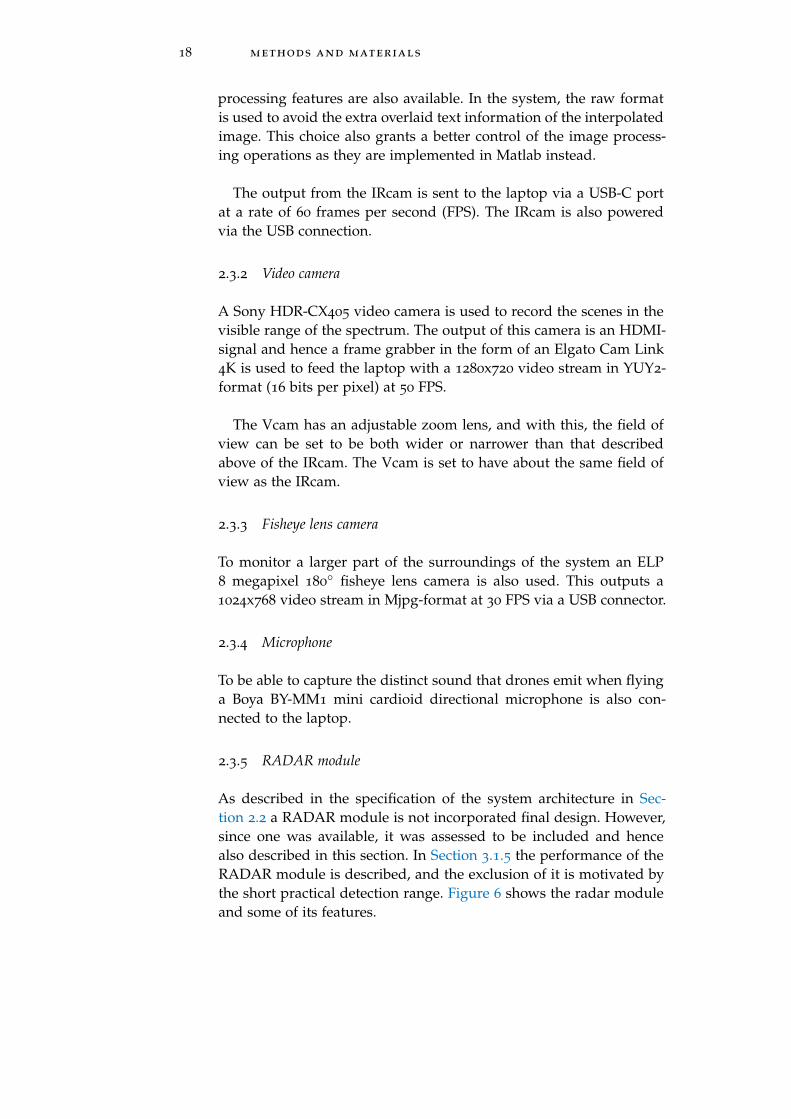
Figure 6: The radar module K-MD2. From [47].
Furthermore, [47] describes the module as "a high-end 3D radartransceiver with three receiving channels and a low phase noise, PLL1 con-trolled transmitter. The target information from the three receive antennasis digitized and the high speed digital signal processing performs range anddoppler FFT’s with an update rate of 20 measurements per second. Using theserial interface, many operating parameters such as frequency, bandwidthand repetition rate can be adjusted. Results are available in target list formatas well as in raw range-doppler matrices. Ethernet and a serial communica-tion interfaces are included".
Interestingly, the K-MD2 radar module is also found to be used inanother research project connected to drones. In [48] it is utilized, notto detect drones, but instead mounted on board one as part of thenavigation aids in GNSS2 denied environments.
2.3.6 ADS-B receiver
To track aircraft equipped with transponders, an ADS-B receiver isalso used. This consists of an antenna and a NooElec Nano 2+ Soft-ware Defined Radio receiver (SDR). This is tuned to 1090 MHz so thatthe identification and positional data sent out as a part of the 1 Hzsquitter message can be decoded and displayed. The Nano 2+ SDRreceiver is connected to the laptop using USB.
1 Phase-locked loop2 Global Navigation Satellite System
20 methods and materials
2.3.7 GPS receiver
To present the decoded ADS-B data in a correct way the system is alsoequipped with a G-STAR IV BU-353S4 GPS receiver connected viaUSB. The receiver outputs messages following the National MarineElectronics Association (NMEA) format standard.
2.3.8 Pan/tilt platform including servo controller
To be able to detect targets in a wider field of view than just 24◦ hori-
zontally and 19◦ vertically the IR- and video cameras are mounted on
a pan/tilt platform. This is the Servocity DDT-560H direct drive tiltplatform together with the DDP-125 Pan assembly, also from Servoc-ity. To achieve the pan/tilt motion two Hitec HS-7955TG servos areused.
A Pololu Mini Maestro 12-Channel USB servo controller is includedso that the respective position of the servos can be controlled from thelaptop. Since the servos have shown a tendency to vibrate when hold-ing the platform in specific directions a third channel of the servocontroller is also used to give the possibility to switch on and off thepower to the servos using a small optoisolated relay board.
To supply the servos with the necessary voltage and power, both anet adapter and a DC-DC converter are available. The DC-DC solu-tion is used when the system is deployed outdoors and, for simplicity,it uses the same battery type as one of the available drones.
Some other parts from Actobotics are also used in the mountingof the system and the following has been designed and 3D-printed:adapters for the IR-, video- and fisheye lens cameras, a radar modulemounting plate and a case for the servo controller and power relayboards.
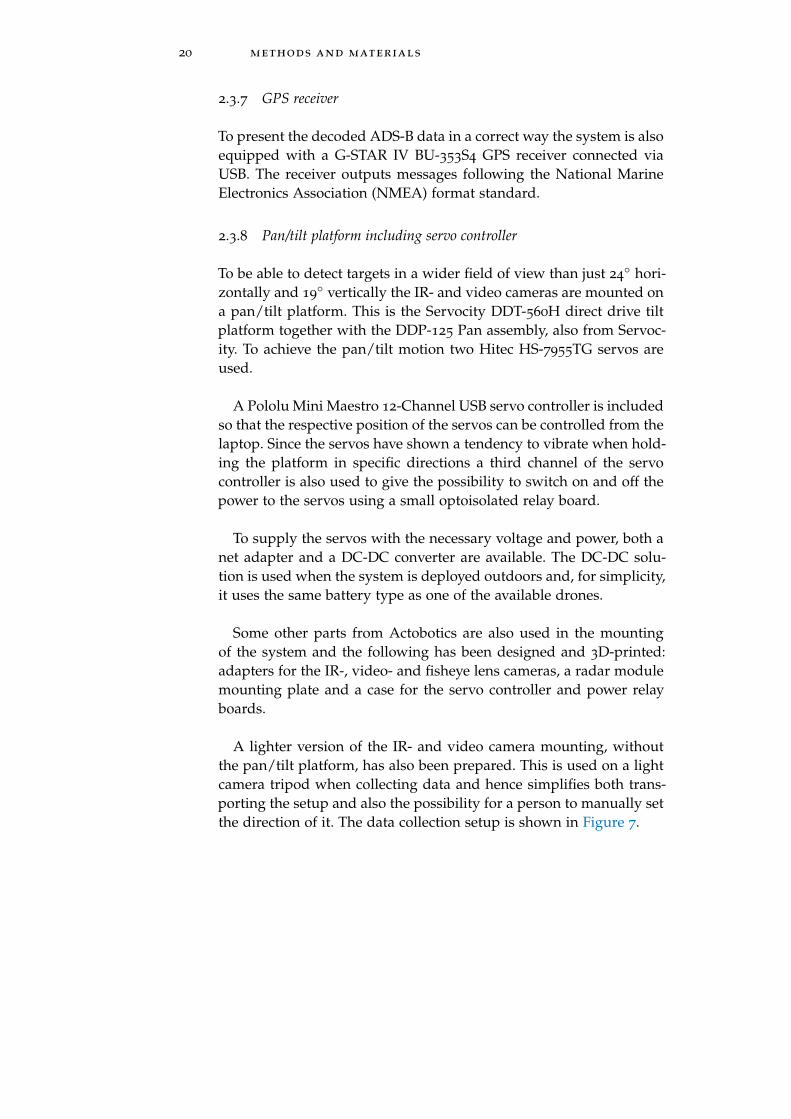
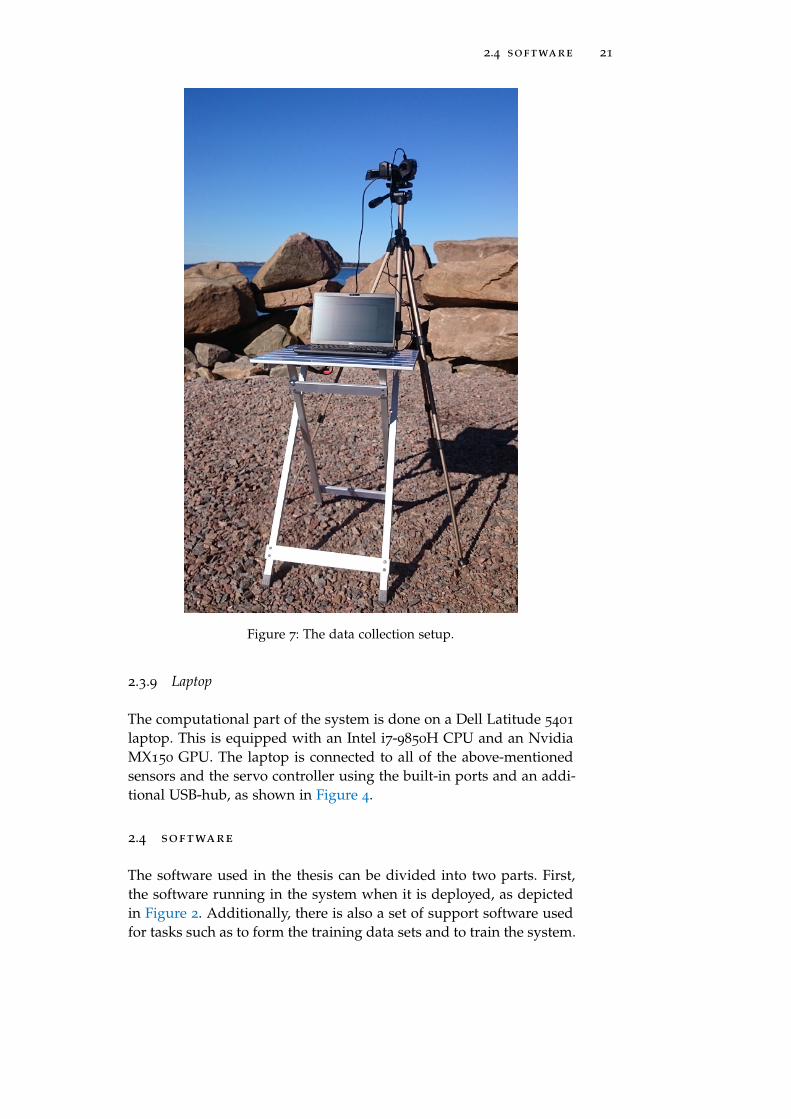
A lighter version of the IR- and video camera mounting, withoutthe pan/tilt platform, has also been prepared. This is used on a lightcamera tripod when collecting data and hence simplifies both trans-porting the setup and also the possibility for a person to manually setthe direction of it. The data collection setup is shown in Figure 7.
2.4 software 21
Figure 7: The data collection setup.
2.3.9 Laptop
The computational part of the system is done on a Dell Latitude 5401
laptop. This is equipped with an Intel i7-9850H CPU and an NvidiaMX150 GPU. The laptop is connected to all of the above-mentionedsensors and the servo controller using the built-in ports and an addi-tional USB-hub, as shown in Figure 4.
2.4 software
The software used in the thesis can be divided into two parts. First,the software running in the system when it is deployed, as depictedin Figure 2. Additionally, there is also a set of support software usedfor tasks such as to form the training data sets and to train the system.
22 methods and materials
2.4.1 System software
The software running when the drone detector is deployed consistsof the main script and five "workers", as shown in Figure 2. These arethreads running in parallel, and having such is enabled by the Mat-lab parallel computing toolbox. The transfer of messages between themain program and the workers is done using pollable data queues.Only commands and results are sent and hence the displays of thevideo streams are part of the respective worker.
The Fcam worker utilizes a foreground/background detector to-gether with a multi-object Kalman filter tracker, and after calculatingthe position of the best-tracked target1, it sends the azimuth and ele-vation angles to the main program. Based on this, the main programcan then control the pan/tilt platform servos via the servo controller,so that the moving object can be analysed further by the IR- and videocameras.
The IRcam and Vcam workers are similar in their basic structureand both import and run a trained YOLOv2 detector and classifier.The information sent to the main script is the class of the detected tar-get, the confidence2, and the horizontal and vertical offsets in degreesfrom the centre point of the image. The latter information is used bythe main script to calculate servo commands when an object is beingtracked by the system.
The Audio worker sends information about the class and confi-dence to the main script. Unlike the others, the ADS-B worker hastwo output queues. One is consisting of current tracks and the otherof the history tracks. This is done so that the presentation clearlyshows the heading and altitude changes of the targets.
All of the above workers also send a confirmation of the commandfrom the main script to run the detector/classifier or to be idle. Thenumber of frames per second currently processed is also sent to themain script.
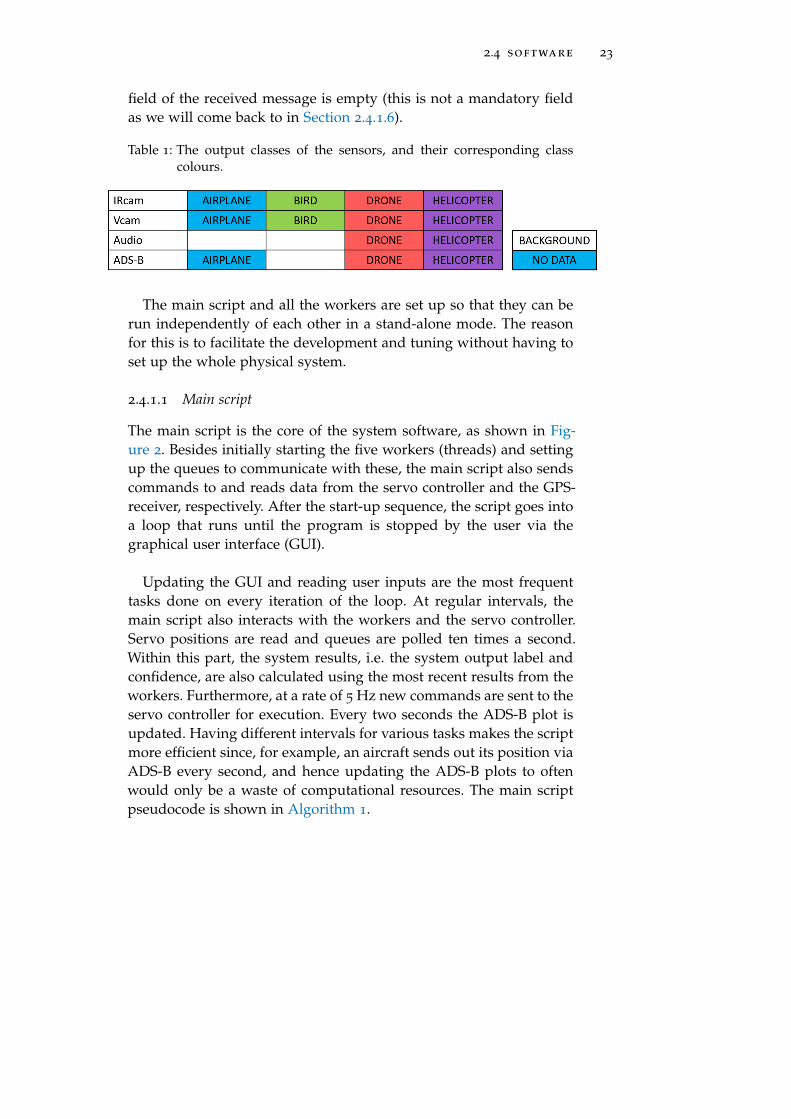
Looking further into the different output classes or labels that themain code can receive from the workers, as shown in Table 1, it is clearthat not all sensors can output all the target classes used in this thesis.Furthermore, the audio worker has an additional background classand the ADS-B will output the NoData-class if the vehicle category
1 Defined to be the one with the longest track history2 This is the class-specific confidence score for each bounding box, i.e. the product of
the conditional class probability and the individual bounding box prediction confi-dence, as defined in 49
2.4 software 23
field of the received message is empty (this is not a mandatory fieldas we will come back to in Section 2.4.1.6).
Table 1: The output classes of the sensors, and their corresponding classcolours.
The main script and all the workers are set up so that they can berun independently of each other in a stand-alone mode. The reasonfor this is to facilitate the development and tuning without having toset up the whole physical system.
2.4.1.1 Main script
The main script is the core of the system software, as shown in Fig-ure 2. Besides initially starting the five workers (threads) and settingup the queues to communicate with these, the main script also sendscommands to and reads data from the servo controller and the GPS-receiver, respectively. After the start-up sequence, the script goes intoa loop that runs until the program is stopped by the user via thegraphical user interface (GUI).
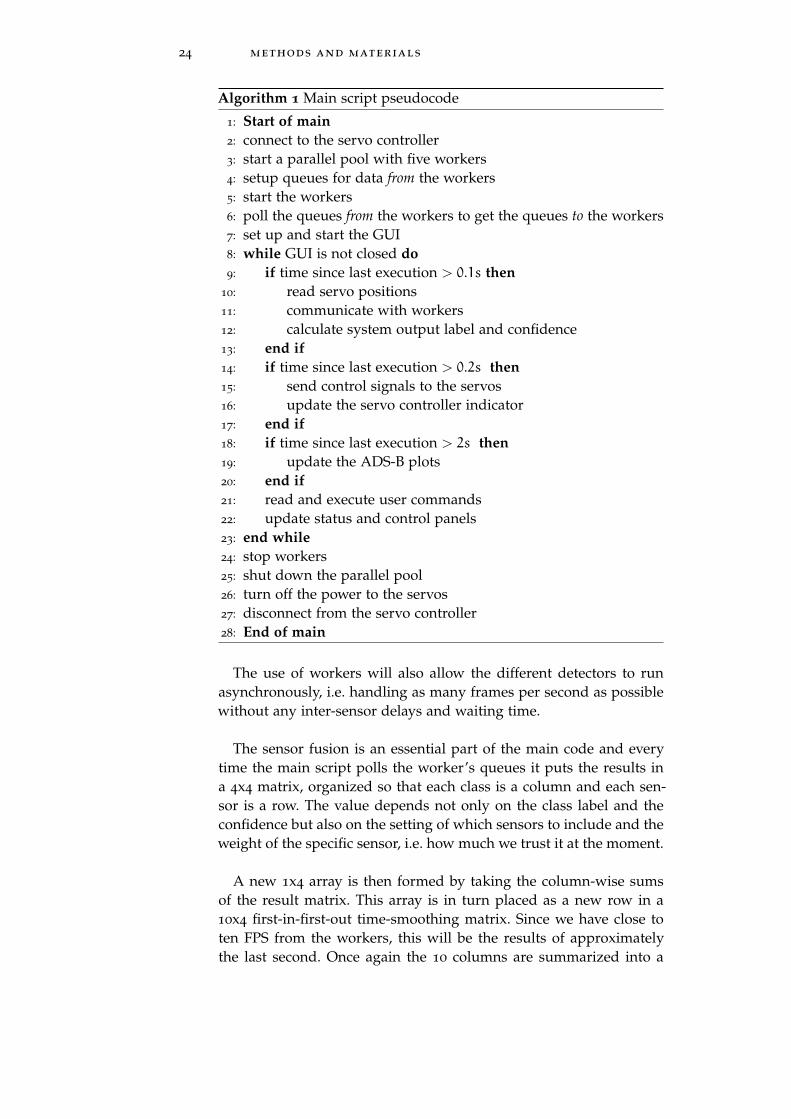
Updating the GUI and reading user inputs are the most frequenttasks done on every iteration of the loop. At regular intervals, themain script also interacts with the workers and the servo controller.Servo positions are read and queues are polled ten times a second.Within this part, the system results, i.e. the system output label andconfidence, are also calculated using the most recent results from theworkers. Furthermore, at a rate of 5 Hz new commands are sent to theservo controller for execution. Every two seconds the ADS-B plot isupdated. Having different intervals for various tasks makes the scriptmore efficient since, for example, an aircraft sends out its position viaADS-B every second, and hence updating the ADS-B plots to oftenwould only be a waste of computational resources. The main scriptpseudocode is shown in Algorithm 1.
24 methods and materials
Algorithm 1 Main script pseudocode
1: Start of main2: connect to the servo controller3: start a parallel pool with five workers4: setup queues for data from the workers5: start the workers6: poll the queues from the workers to get the queues to the workers7: set up and start the GUI8: while GUI is not closed do9: if time since last execution > 0.1s then
10: read servo positions11: communicate with workers12: calculate system output label and confidence13: end if14: if time since last execution > 0.2s then15: send control signals to the servos16: update the servo controller indicator17: end if18: if time since last execution > 2s then19: update the ADS-B plots20: end if21: read and execute user commands22: update status and control panels23: end while24: stop workers25: shut down the parallel pool26: turn off the power to the servos27: disconnect from the servo controller28: End of main
The use of workers will also allow the different detectors to runasynchronously, i.e. handling as many frames per second as possiblewithout any inter-sensor delays and waiting time.
The sensor fusion is an essential part of the main code and everytime the main script polls the worker’s queues it puts the results ina 4x4 matrix, organized so that each class is a column and each sen-sor is a row. The value depends not only on the class label and theconfidence but also on the setting of which sensors to include and theweight of the specific sensor, i.e. how much we trust it at the moment.
A new 1x4 array is then formed by taking the column-wise sumsof the result matrix. This array is in turn placed as a new row in a10x4 first-in-first-out time-smoothing matrix. Since we have close toten FPS from the workers, this will be the results of approximatelythe last second. Once again the 10 columns are summarized into a
2.4 software 25
1x4 array, and the column with the highest value will be the outputsystem class.
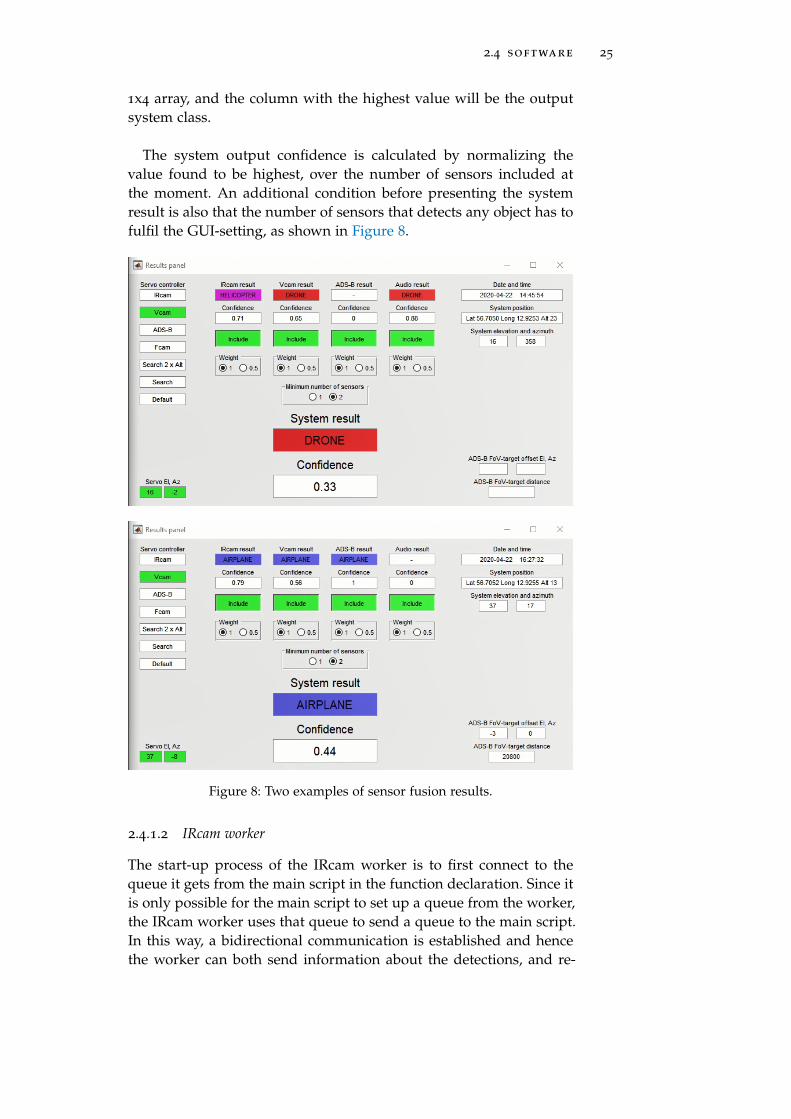
The system output confidence is calculated by normalizing thevalue found to be highest, over the number of sensors included atthe moment. An additional condition before presenting the systemresult is also that the number of sensors that detects any object has tofulfil the GUI-setting, as shown in Figure 8.
Figure 8: Two examples of sensor fusion results.
2.4.1.2 IRcam worker
The start-up process of the IRcam worker is to first connect to thequeue it gets from the main script in the function declaration. Since itis only possible for the main script to set up a queue from the worker,the IRcam worker uses that queue to send a queue to the main script.In this way, a bidirectional communication is established and hencethe worker can both send information about the detections, and re-
26 methods and materials
ceive commands, such as when to run the detector and when to goidle.
If no queue is given to the IRcam worker function when it is started,the function assumes that it is running in a stand-alone mode and actsaccordingly.
The next actions taken at start-up is loading the detector and con-necting to the IR-camera. The video stream is thereafter started andset to be continuous using the triggerconfig-command, so that theworker can use the getsnaphot-function to read an image at any timewithin the loop it goes into when running.
The IR camera has several mounting points and when attachedto the 3D-printed adapter, on which it and the video camera aremounted, the raw image output stream is upside down. Hence, thefirst image processing operation is imrotate followed by imflatfield
with σ = 30 1 and then imadjust to increase the contrast of the image.
Next, the input image is processed by the YOLOv2-detector, with agiven detection threshold and the execution environment set to GPU.The output from the detector consists of an array of class labels, con-fidence scores and bounding boxes for all objects that have been de-tected and classified. The detector output may be no data at all, orjust as well, data for several detected objects. In this implementation,only the detection with the highest confidence score is sent to themain script.
The image from the IR camera is just 320x256 pixels, so in orderto present the result in the GUI using a window similar in size tothe video camera output, the image is resized to 640x512 pixels. Thenthe bounding box together with the class label and confidence scoreare inserted in the image. To clearly indicate the detected class theinserted annotation uses the same colour scheme as presented in Ta-ble 1.
To give information about the current state of the detector and theperformance in terms of frames per second (FPS), this information isalso inserted in the top left corner of the image. The current framesper second processed by the worker is also sent to the main scripttogether with the detection results.
The YOLOv2 detector is set up and trained using one of the scriptsbelonging to the support software. The YOLOv2 is formed by mod-
1 The flat-field correction uses Gaussian smoothing with a standard deviation of σ toapproximate the shading component of the input image
2.4 software 27
ifying a pretrained MobileNetv2 following [50], so that the first 12
layers, out of 53, are used for feature extraction. The input layer isupdated1 so that is has the size of 256x256x3. The choice of this par-ticular size is motivated by the fact that the image is always resized tofit the input layer. This resize operation will always make the imagesmaller or keep it at its original size, so using 256 causes the leastinformation loss since it is the height of the IR images.
Six detection layers and three final layers are also added to the net-work. Besides setting the number of output classes of the final layersthe anchor boxes used are also specified.
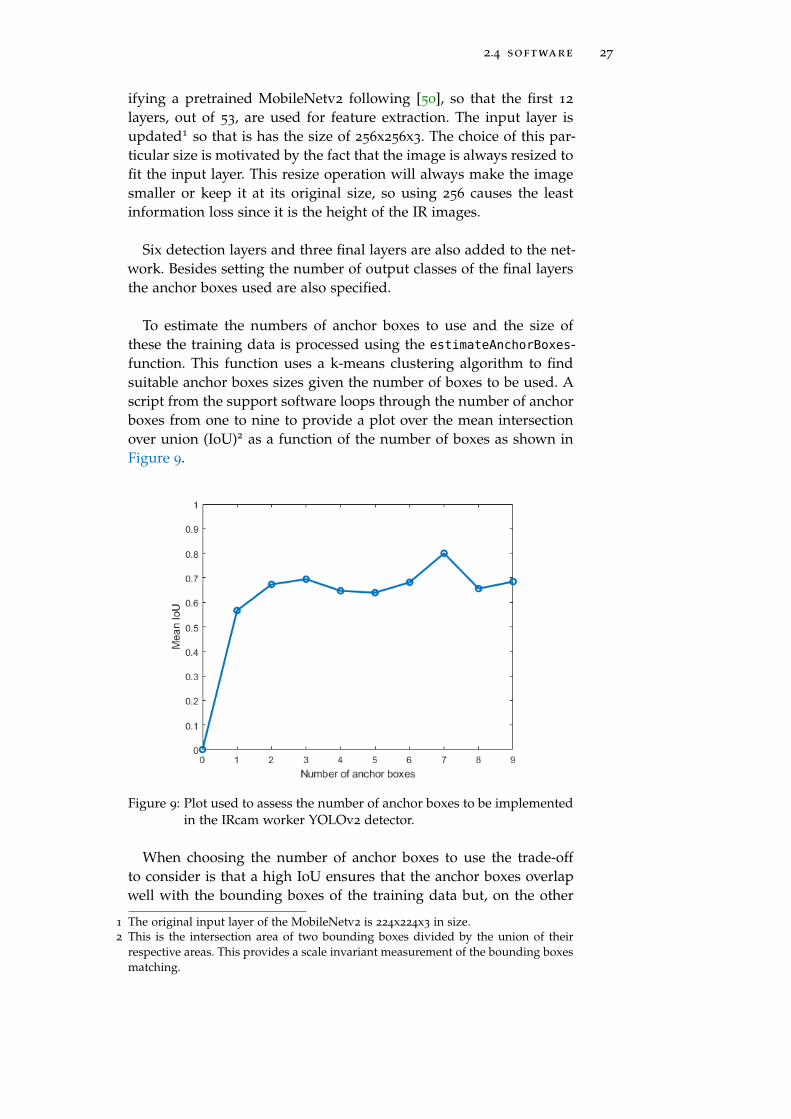
To estimate the numbers of anchor boxes to use and the size ofthese the training data is processed using the estimateAnchorBoxes-function. This function uses a k-means clustering algorithm to findsuitable anchor boxes sizes given the number of boxes to be used. Ascript from the support software loops through the number of anchorboxes from one to nine to provide a plot over the mean intersectionover union (IoU)2 as a function of the number of boxes as shown inFigure 9.
Figure 9: Plot used to assess the number of anchor boxes to be implementedin the IRcam worker YOLOv2 detector.
When choosing the number of anchor boxes to use the trade-offto consider is that a high IoU ensures that the anchor boxes overlapwell with the bounding boxes of the training data but, on the other
1 The original input layer of the MobileNetv2 is 224x224x3 in size.2 This is the intersection area of two bounding boxes divided by the union of their
respective areas. This provides a scale invariant measurement of the bounding boxesmatching.
28 methods and materials
hand, using more anchor boxes will also increase the computationalcost and may lead to overfitting. After assessing the plot, the num-ber of anchor boxes is chosen to be three and the sizes of these, withthe scaling factor of 0.8 in width to match the downsize of the in-put layer from 320 to 256 pixels, are taken from the output of theestimateAnchorBoxes-function.
The detector is trained using data picked from the available datasetafter the evaluation data have been selected and put aside, as de-scribed in Section 2.6. The training data for the IRcam YOLOv2 de-tector consists of 120 video clips, each one just over 10 seconds andevenly distributed among all classes and all distance bins, makingthe total number of annotated images in the training set 37428. Thedetector is trained for five epochs1 using the stochastic gradient de-scent with momentum (SGDM) optimizer and an initial learning rateof 0.001.
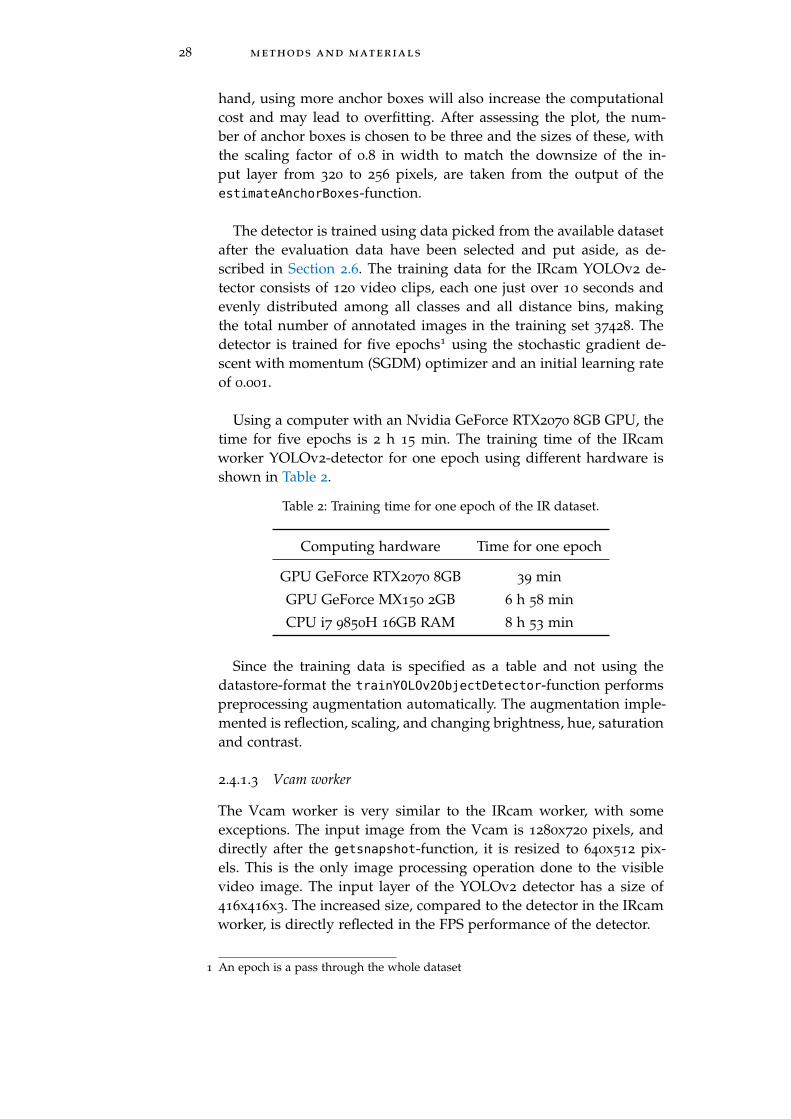
Using a computer with an Nvidia GeForce RTX2070 8GB GPU, thetime for five epochs is 2 h 15 min. The training time of the IRcamworker YOLOv2-detector for one epoch using different hardware isshown in Table 2.
Table 2: Training time for one epoch of the IR dataset.
Computing hardware Time for one epoch
GPU GeForce RTX2070 8GB 39 min
GPU GeForce MX150 2GB 6 h 58 min
CPU i7 9850H 16GB RAM 8 h 53 min
Since the training data is specified as a table and not using thedatastore-format the trainYOLOv2ObjectDetector-function performspreprocessing augmentation automatically. The augmentation imple-mented is reflection, scaling, and changing brightness, hue, saturationand contrast.
2.4.1.3 Vcam worker
The Vcam worker is very similar to the IRcam worker, with someexceptions. The input image from the Vcam is 1280x720 pixels, anddirectly after the getsnapshot-function, it is resized to 640x512 pix-els. This is the only image processing operation done to the visiblevideo image. The input layer of the YOLOv2 detector has a size of416x416x3. The increased size, compared to the detector in the IRcamworker, is directly reflected in the FPS performance of the detector.
1 An epoch is a pass through the whole dataset
2.4 software 29
Due to the increased image size used to train the detector, the train-ing time is also extended compared to the IR case. When using a com-puter with an Nvidia GeForce RTX2070 8GB GPU, the time for oneepoch is 2 h 25 min, which is significantly longer than what is pre-sented in Table 2. The training set consists of 37519 images, and thedetector is trained for five epochs just as the detector of the IRcamworker.
2.4.1.4 Fcam worker
Initially, the fisheye lens camera was mounted facing upwards, but,as it turned out, this caused the image distortion to be significant inthe area just above the horizon where the interesting targets usuallyappear. After turning the camera so that it faces forward, as can beseen in Figure 3, the motion detector is less affected by the imagedistortion, and since half of the field of view is not used anyway, thisis a feasible solution. Initially, the image was cropped so that the halfwhere the pan/tilt platform obscures the view was not used. Nowinstead, the part of the image covering the area below the horizon infront of the system is not processed.
The Fcam worker sets up queues and connects to the camera muchin the same way as the IRcam and Vcam workers. The input im-age from the camera is 1024x768 pixels, and immediately after thegetsnapshot-function the lower part of the image is cropped so that1024x384 pixels remain to be processed.
The image is then analysed using the ForegroundDetector-functionof the Computer vision toolbox. This uses a background subtractionalgorithm based on Gaussian Mixture Models (GMM). The outputfrom this function is a binary mask where moving objects are ones,and the stationary background is zero ideally. The mask is next pro-cessed with the imopen-function that first performs a morphologicalerosion followed by a dilation. The structural element parameter ofthe imopen-function is set to just 3x3 so that only very small objectsare deleted.
To get rid of noise from the parts of the square-shaped image sensorthat lie outside the circular area seen by the fisheye lens, the mask im-age is also multiplied with another binary mask before it is processedby the BlobAnalysis-function. This outputs an array of centroids andbounding boxes for all objects that are considered to be moving.
All these centroids and bounding boxes are sent to a Kalman filtermulti-object tracker, which is a customised version of a script avail-able in one of the Matlab computer vision toolbox tutorials [51]. Outof the tracks started and updated by the Kalman filter, the one with
30 methods and materials
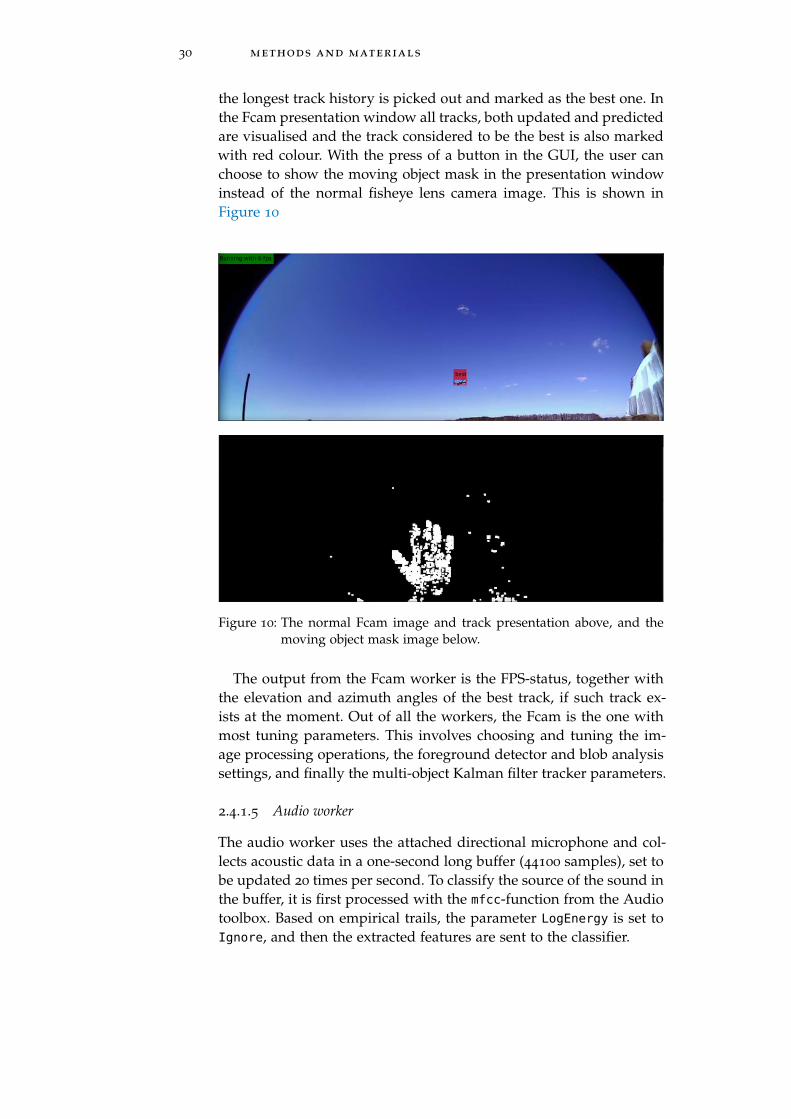
the longest track history is picked out and marked as the best one. Inthe Fcam presentation window all tracks, both updated and predictedare visualised and the track considered to be the best is also markedwith red colour. With the press of a button in the GUI, the user canchoose to show the moving object mask in the presentation windowinstead of the normal fisheye lens camera image. This is shown inFigure 10
Figure 10: The normal Fcam image and track presentation above, and themoving object mask image below.
The output from the Fcam worker is the FPS-status, together withthe elevation and azimuth angles of the best track, if such track ex-ists at the moment. Out of all the workers, the Fcam is the one withmost tuning parameters. This involves choosing and tuning the im-age processing operations, the foreground detector and blob analysissettings, and finally the multi-object Kalman filter tracker parameters.
2.4.1.5 Audio worker
The audio worker uses the attached directional microphone and col-lects acoustic data in a one-second long buffer (44100 samples), set tobe updated 20 times per second. To classify the source of the sound inthe buffer, it is first processed with the mfcc-function from the Audiotoolbox. Based on empirical trails, the parameter LogEnergy is set toIgnore, and then the extracted features are sent to the classifier.
2.4 software 31
The LSTM-classifier used consists of an input layer, two bidirec-tional LSTM layers with a drop out layer in between, a fully connectedlayer, followed by a softmax layer and a classification layer. The clas-sifier builds on [52] but with the extension of increasing the numberof classes from two to three and an additional dropout layer betweenthe bidirectional LSTM layers.
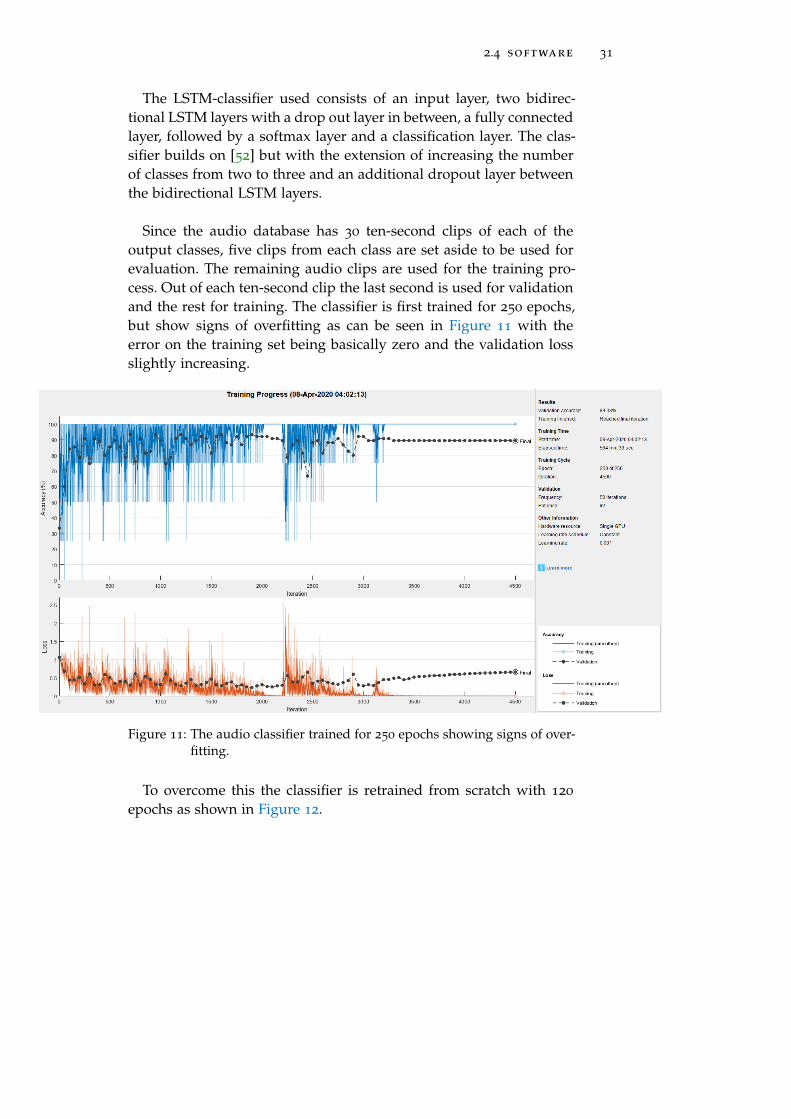
Since the audio database has 30 ten-second clips of each of theoutput classes, five clips from each class are set aside to be used forevaluation. The remaining audio clips are used for the training pro-cess. Out of each ten-second clip the last second is used for validationand the rest for training. The classifier is first trained for 250 epochs,but show signs of overfitting as can be seen in Figure 11 with theerror on the training set being basically zero and the validation lossslightly increasing.
Figure 11: The audio classifier trained for 250 epochs showing signs of over-fitting.
To overcome this the classifier is retrained from scratch with 120
epochs as shown in Figure 12.
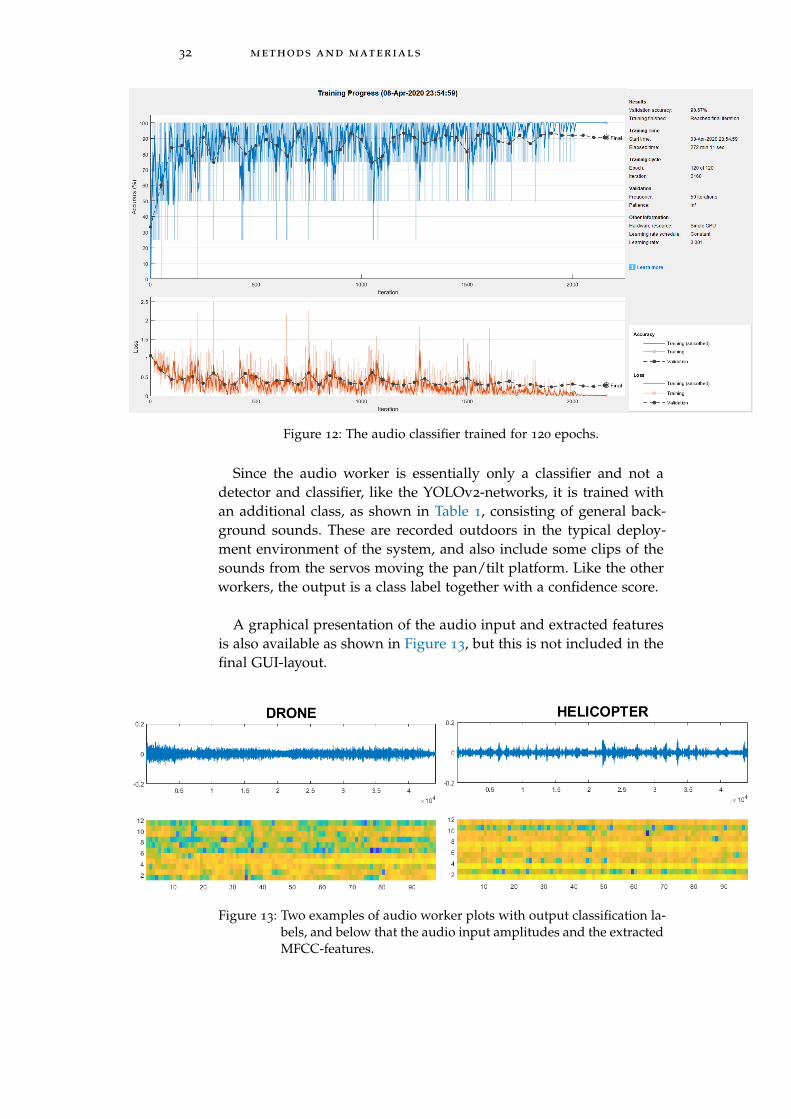
32 methods and materials
Figure 12: The audio classifier trained for 120 epochs.
Since the audio worker is essentially only a classifier and not adetector and classifier, like the YOLOv2-networks, it is trained withan additional class, as shown in Table 1, consisting of general back-ground sounds. These are recorded outdoors in the typical deploy-ment environment of the system, and also include some clips of thesounds from the servos moving the pan/tilt platform. Like the otherworkers, the output is a class label together with a confidence score.
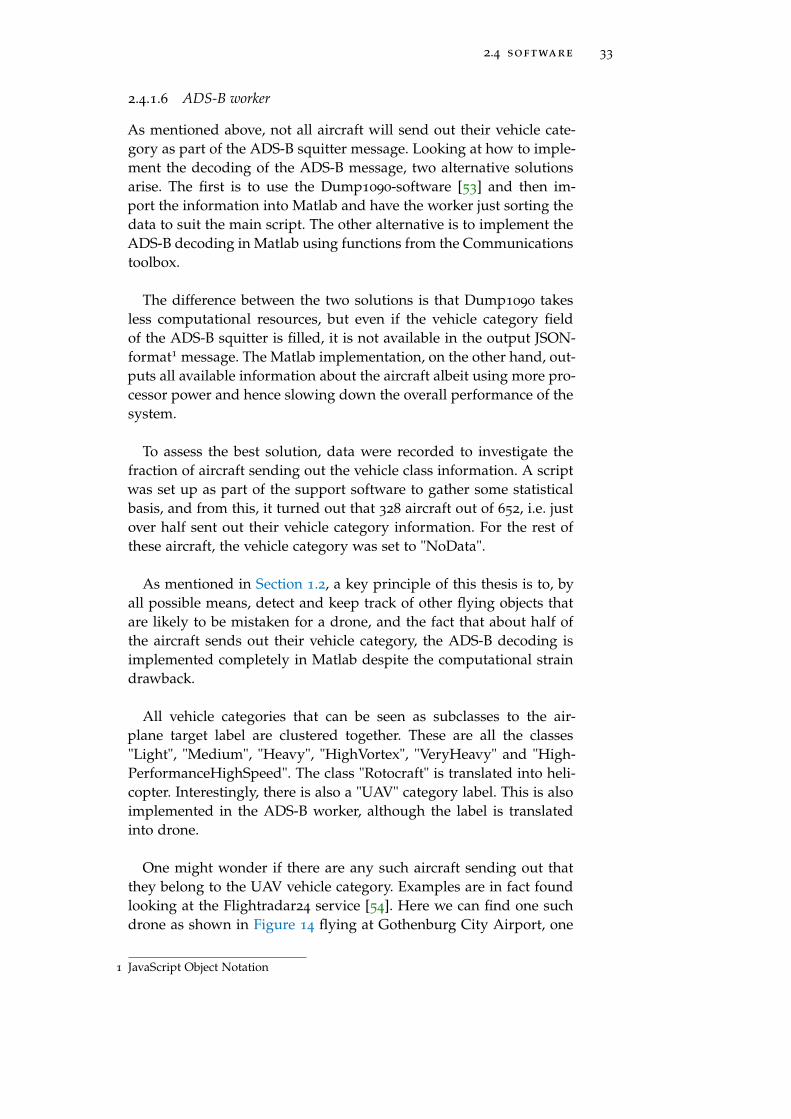
A graphical presentation of the audio input and extracted featuresis also available as shown in Figure 13, but this is not included in thefinal GUI-layout.
Figure 13: Two examples of audio worker plots with output classification la-bels, and below that the audio input amplitudes and the extractedMFCC-features.
2.4 software 33
2.4.1.6 ADS-B worker
As mentioned above, not all aircraft will send out their vehicle cate-gory as part of the ADS-B squitter message. Looking at how to imple-ment the decoding of the ADS-B message, two alternative solutionsarise. The first is to use the Dump1090-software [53] and then im-port the information into Matlab and have the worker just sorting thedata to suit the main script. The other alternative is to implement theADS-B decoding in Matlab using functions from the Communicationstoolbox.
The difference between the two solutions is that Dump1090 takesless computational resources, but even if the vehicle category fieldof the ADS-B squitter is filled, it is not available in the output JSON-format1 message. The Matlab implementation, on the other hand, out-puts all available information about the aircraft albeit using more pro-cessor power and hence slowing down the overall performance of thesystem.
To assess the best solution, data were recorded to investigate thefraction of aircraft sending out the vehicle class information. A scriptwas set up as part of the support software to gather some statisticalbasis, and from this, it turned out that 328 aircraft out of 652, i.e. justover half sent out their vehicle category information. For the rest ofthese aircraft, the vehicle category was set to "NoData".
As mentioned in Section 1.2, a key principle of this thesis is to, byall possible means, detect and keep track of other flying objects thatare likely to be mistaken for a drone, and the fact that about half ofthe aircraft sends out their vehicle category, the ADS-B decoding isimplemented completely in Matlab despite the computational straindrawback.
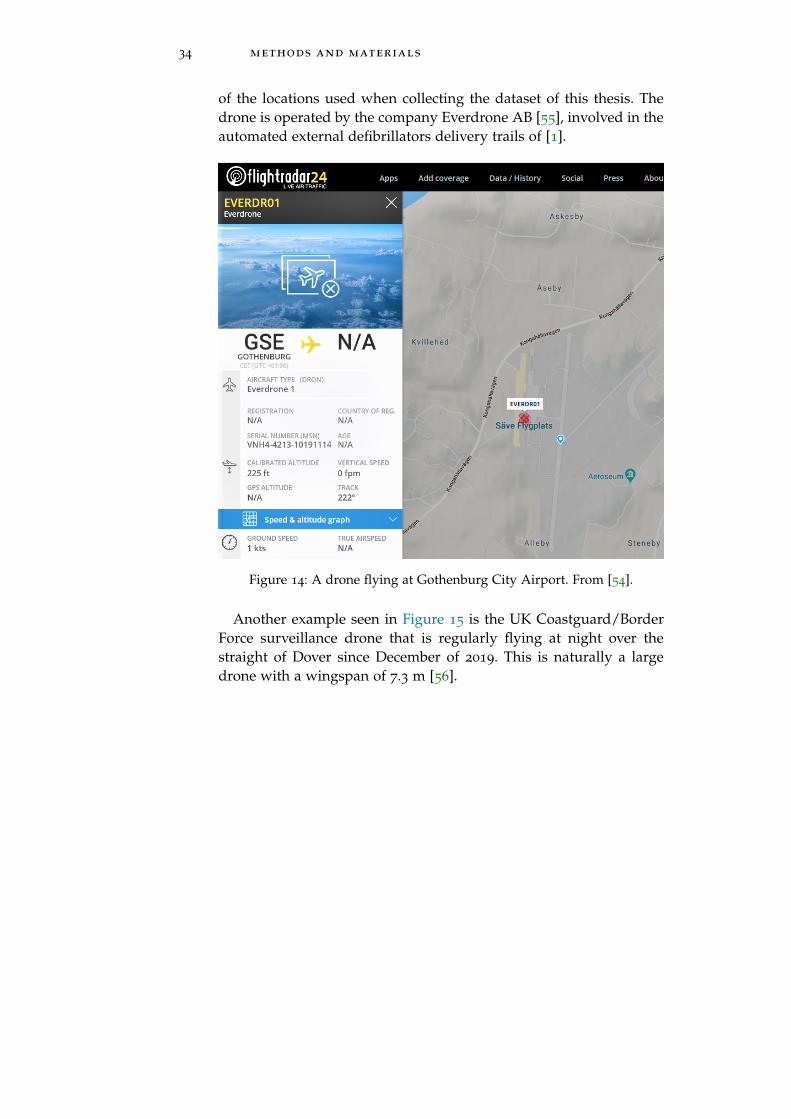
All vehicle categories that can be seen as subclasses to the air-plane target label are clustered together. These are all the classes"Light", "Medium", "Heavy", "HighVortex", "VeryHeavy" and "High-PerformanceHighSpeed". The class "Rotocraft" is translated into heli-copter. Interestingly, there is also a "UAV" category label. This is alsoimplemented in the ADS-B worker, although the label is translatedinto drone.
One might wonder if there are any such aircraft sending out thatthey belong to the UAV vehicle category. Examples are in fact foundlooking at the Flightradar24 service [54]. Here we can find one suchdrone as shown in Figure 14 flying at Gothenburg City Airport, one
1 JavaScript Object Notation
34 methods and materials
of the locations used when collecting the dataset of this thesis. Thedrone is operated by the company Everdrone AB [55], involved in theautomated external defibrillators delivery trails of [1].
Figure 14: A drone flying at Gothenburg City Airport. From [54].
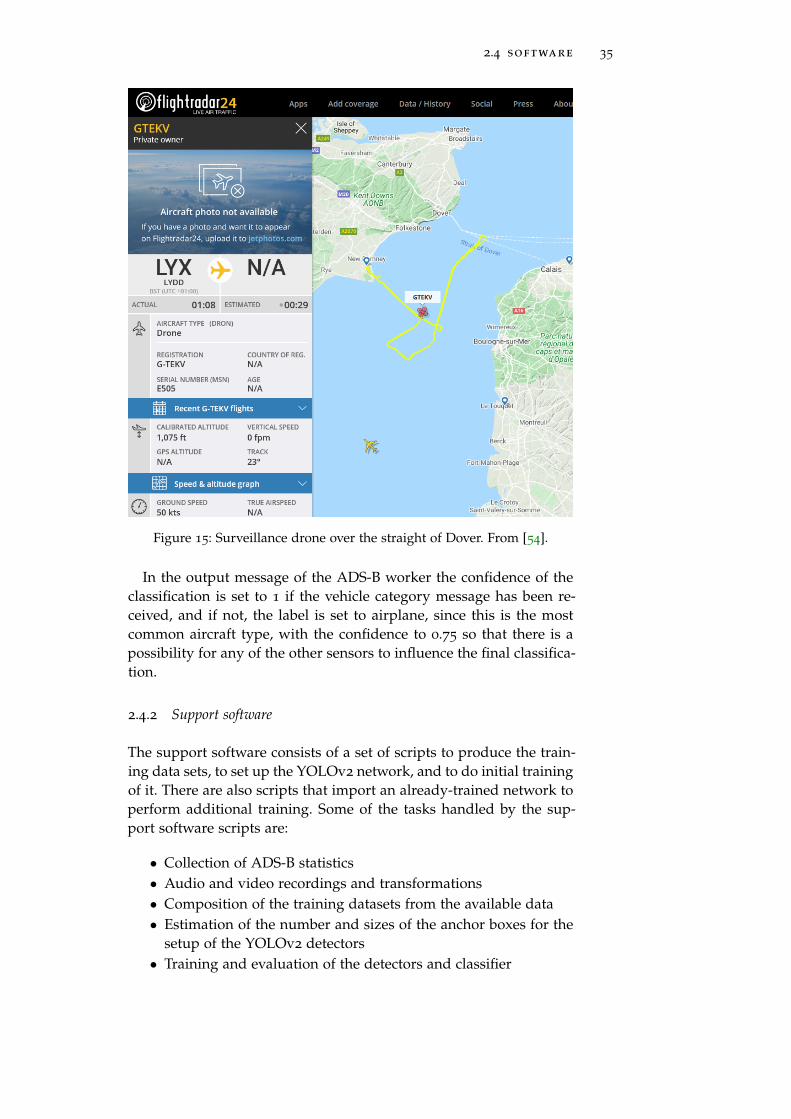
Another example seen in Figure 15 is the UK Coastguard/BorderForce surveillance drone that is regularly flying at night over thestraight of Dover since December of 2019. This is naturally a largedrone with a wingspan of 7.3 m [56].
2.4 software 35
Figure 15: Surveillance drone over the straight of Dover. From [54].
In the output message of the ADS-B worker the confidence of theclassification is set to 1 if the vehicle category message has been re-ceived, and if not, the label is set to airplane, since this is the mostcommon aircraft type, with the confidence to 0.75 so that there is apossibility for any of the other sensors to influence the final classifica-tion.
2.4.2 Support software
The support software consists of a set of scripts to produce the train-ing data sets, to set up the YOLOv2 network, and to do initial trainingof it. There are also scripts that import an already-trained network toperform additional training. Some of the tasks handled by the sup-port software scripts are:
• Collection of ADS-B statistics• Audio and video recordings and transformations• Composition of the training datasets from the available data• Estimation of the number and sizes of the anchor boxes for the
setup of the YOLOv2 detectors• Training and evaluation of the detectors and classifier
36 methods and materials
The Matlab video labelling app can also be considered to be a partof the support software, together with the Maestro Control Center[57] used to configure the servo controller, and the K-MD2-RadarControl Panel.
2.5 graphical user interface
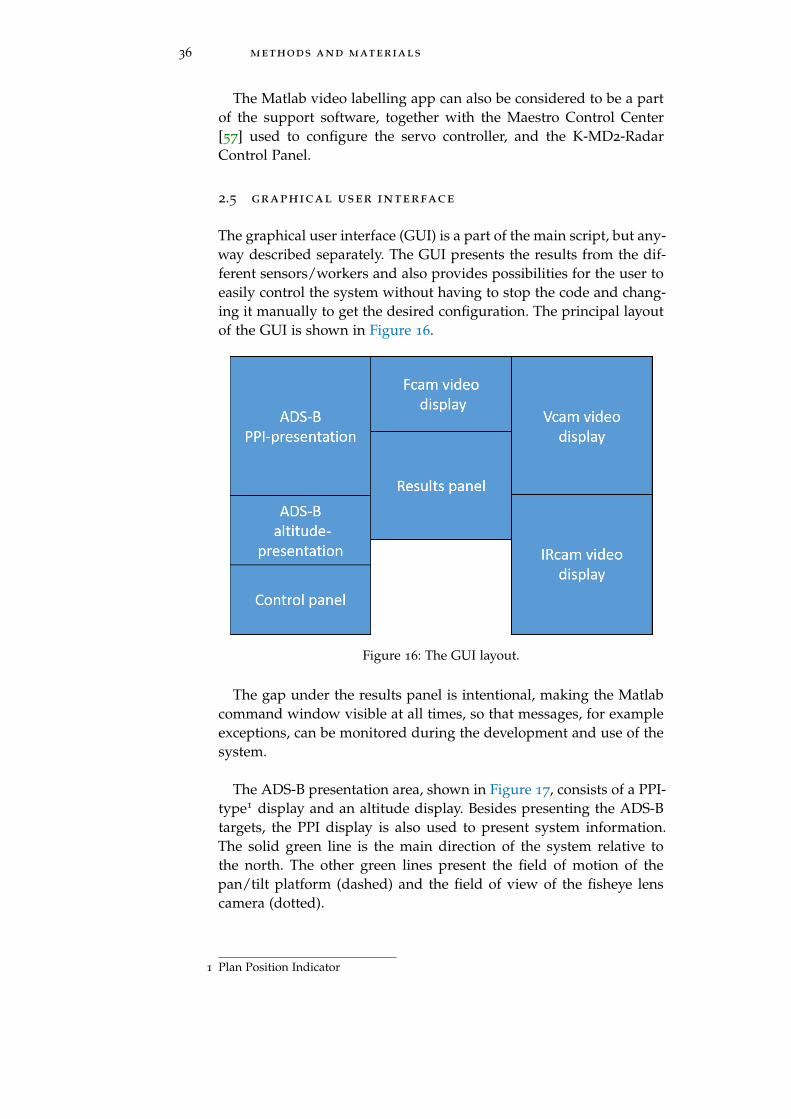
The graphical user interface (GUI) is a part of the main script, but any-way described separately. The GUI presents the results from the dif-ferent sensors/workers and also provides possibilities for the user toeasily control the system without having to stop the code and chang-ing it manually to get the desired configuration. The principal layoutof the GUI is shown in Figure 16.
Figure 16: The GUI layout.
The gap under the results panel is intentional, making the Matlabcommand window visible at all times, so that messages, for exampleexceptions, can be monitored during the development and use of thesystem.
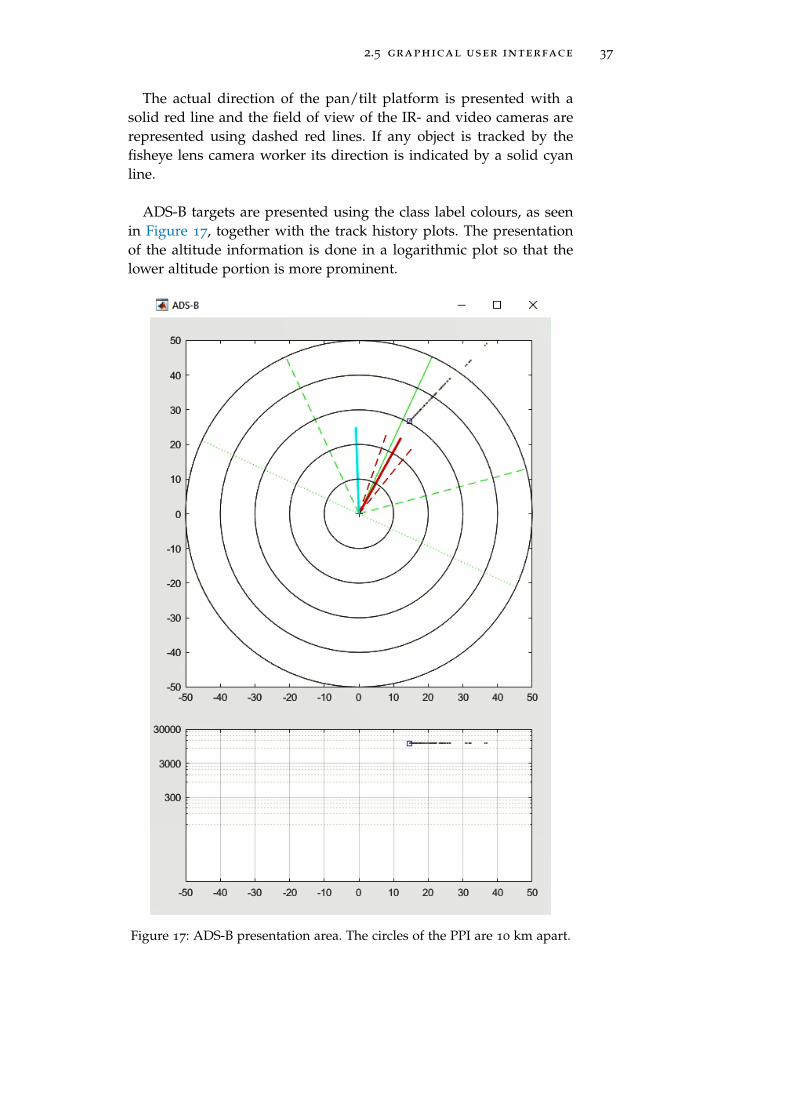
The ADS-B presentation area, shown in Figure 17, consists of a PPI-type1 display and an altitude display. Besides presenting the ADS-Btargets, the PPI display is also used to present system information.The solid green line is the main direction of the system relative tothe north. The other green lines present the field of motion of thepan/tilt platform (dashed) and the field of view of the fisheye lenscamera (dotted).
1 Plan Position Indicator
2.5 graphical user interface 37
The actual direction of the pan/tilt platform is presented with asolid red line and the field of view of the IR- and video cameras arerepresented using dashed red lines. If any object is tracked by thefisheye lens camera worker its direction is indicated by a solid cyanline.
ADS-B targets are presented using the class label colours, as seenin Figure 17, together with the track history plots. The presentationof the altitude information is done in a logarithmic plot so that thelower altitude portion is more prominent.
Figure 17: ADS-B presentation area. The circles of the PPI are 10 km apart.
38 methods and materials
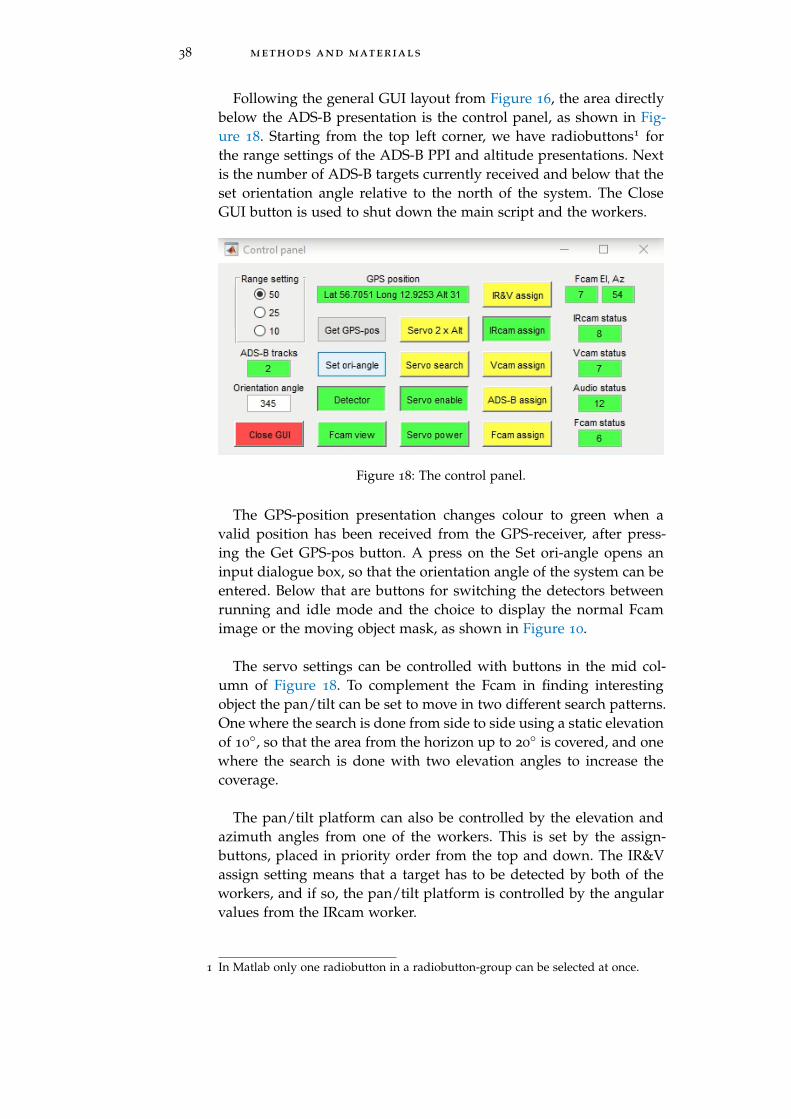
Following the general GUI layout from Figure 16, the area directlybelow the ADS-B presentation is the control panel, as shown in Fig-ure 18. Starting from the top left corner, we have radiobuttons1 forthe range settings of the ADS-B PPI and altitude presentations. Nextis the number of ADS-B targets currently received and below that theset orientation angle relative to the north of the system. The CloseGUI button is used to shut down the main script and the workers.
Figure 18: The control panel.
The GPS-position presentation changes colour to green when avalid position has been received from the GPS-receiver, after press-ing the Get GPS-pos button. A press on the Set ori-angle opens aninput dialogue box, so that the orientation angle of the system can beentered. Below that are buttons for switching the detectors betweenrunning and idle mode and the choice to display the normal Fcamimage or the moving object mask, as shown in Figure 10.
The servo settings can be controlled with buttons in the mid col-umn of Figure 18. To complement the Fcam in finding interestingobject the pan/tilt can be set to move in two different search patterns.One where the search is done from side to side using a static elevationof 10
◦, so that the area from the horizon up to 20◦ is covered, and one
where the search is done with two elevation angles to increase thecoverage.
The pan/tilt platform can also be controlled by the elevation andazimuth angles from one of the workers. This is set by the assign-buttons, placed in priority order from the top and down. The IR&Vassign setting means that a target has to be detected by both of theworkers, and if so, the pan/tilt platform is controlled by the angularvalues from the IRcam worker.
1 In Matlab only one radiobutton in a radiobutton-group can be selected at once.

2.5 graphical user interface 39
The rightmost column of Figure 18 is status information regardingthe performance in FPS of the workers, and the elevation and azimuthangles of the Fcam worker target if such target exists. The status dis-plays are red if the worker is not connected, yellow of the detector isidle, and green if it is running.
The results panel features settings for the sensor fusion and presentsthe workers and system results to the user. The servo controller col-umn seen in Figure 19 indicates the source of information currentlycontrolling the servos of the pan/tilt platform.
Figure 19: The results panel. Here a bird is detected and tracked by theIRcam worker.
In the lower-left corner of Figure 19, the angles of the servos arepresented. The settings for the sensor fusion and the detection resultspresentation are found in the middle of the panel, as described inSection 2.4.1.1. The information in the right part of the panel is thecurrent time and the position of the system. The system elevation andazimuth relative to the north are also presented here. Note the differ-ence in azimuth angle compared to the lower-left corner where thesystem internal angle of the pan/tilt platform is presented.
The last part of Figure 19 presents offset angles for the ADS-B tar-get, if one is present at the moment in the field of view of the IR-and video cameras. These values are used to detect systematic errorsin the orientation of the system. The sloping distance to the ADS-Btarget is also presented here. See the bottom part of Figure 8 for anexample of this.
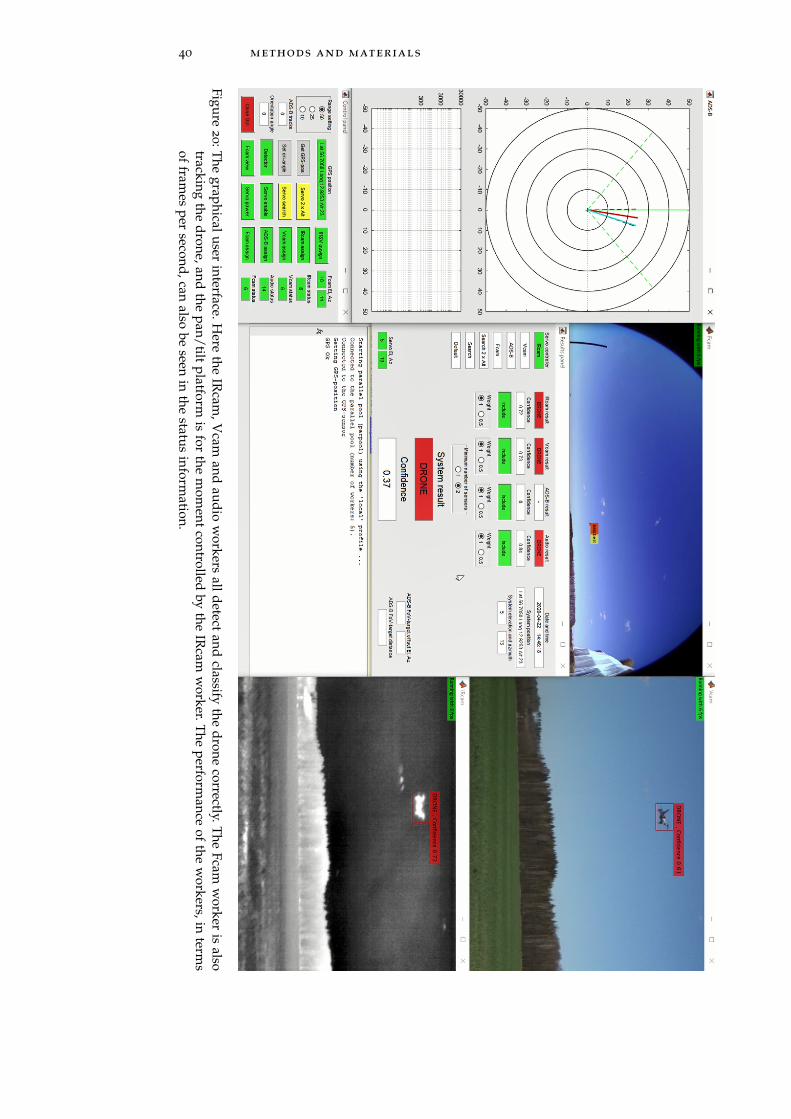
Figure 20 shows the whole GUI, including the video displays. Theimage is turned 90
◦ to use the space of the document better.
40 methods and materials
Figure2
0:Thegraphicaluser
interface.Here
theIR
cam,V
camand
audiow
orkersalldetect
andclassify
thedrone
correctly.TheFcam
worker
isalso
trackingthe
drone,andthe
pan/tiltplatform
isfor
them
oment
controlledby
theIR
camw
orker.Theperform
anceof
thew
orkers,interm
sof
frames
persecond,can
alsobe
seenin
thestatus
information.
2.6 dataset for training and evaluation 41
2.6 dataset for training and evaluation
The videos in the dataset are recorded at locations in and aroundHalmstad and Falkenberg, at Halmstad Airport (HAD1/ESMT2), Gothen-burg City Airport (GSE/ESGP) and Malmö Airport (MMX/ESMS).
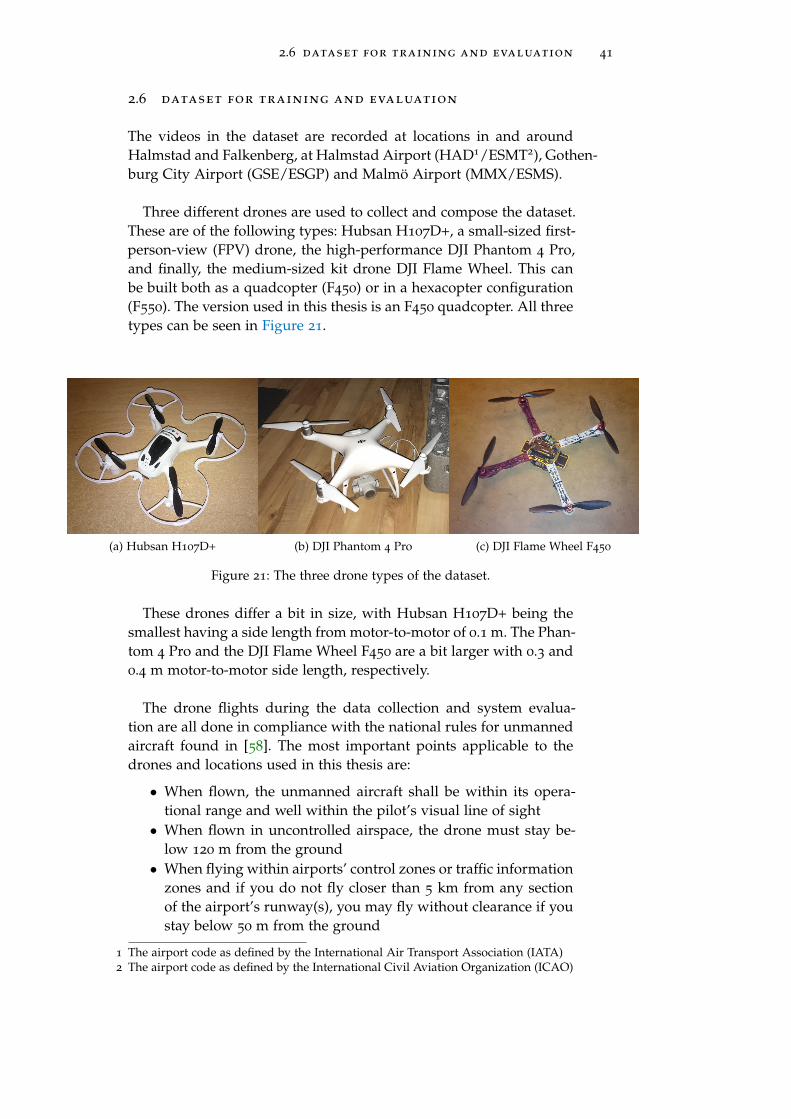
Three different drones are used to collect and compose the dataset.These are of the following types: Hubsan H107D+, a small-sized first-person-view (FPV) drone, the high-performance DJI Phantom 4 Pro,and finally, the medium-sized kit drone DJI Flame Wheel. This canbe built both as a quadcopter (F450) or in a hexacopter configuration(F550). The version used in this thesis is an F450 quadcopter. All threetypes can be seen in Figure 21.
(a) Hubsan H107D+ (b) DJI Phantom 4 Pro (c) DJI Flame Wheel F450
Figure 21: The three drone types of the dataset.
These drones differ a bit in size, with Hubsan H107D+ being thesmallest having a side length from motor-to-motor of 0.1 m. The Phan-tom 4 Pro and the DJI Flame Wheel F450 are a bit larger with 0.3 and0.4 m motor-to-motor side length, respectively.
The drone flights during the data collection and system evalua-tion are all done in compliance with the national rules for unmannedaircraft found in [58]. The most important points applicable to thedrones and locations used in this thesis are:
• When flown, the unmanned aircraft shall be within its opera-tional range and well within the pilot’s visual line of sight
• When flown in uncontrolled airspace, the drone must stay be-low 120 m from the ground
• When flying within airports’ control zones or traffic informationzones and if you do not fly closer than 5 km from any sectionof the airport’s runway(s), you may fly without clearance if youstay below 50 m from the ground
1 The airport code as defined by the International Air Transport Association (IATA)2 The airport code as defined by the International Civil Aviation Organization (ICAO)
42 methods and materials
• For the protection of people, animals and property which areunrelated to the flight, there must be a horizontal safety dis-tance between these and the unmanned aircraft throughout theflight
Since the drones must be flown within visual range, the datasetis recorded in daylight, even if the system designed in the thesis, tosome extent can be effective even in complete darkness using the ther-mal infrared and acoustic sensors. The ADS-B information receivedis naturally also working as usual at night.
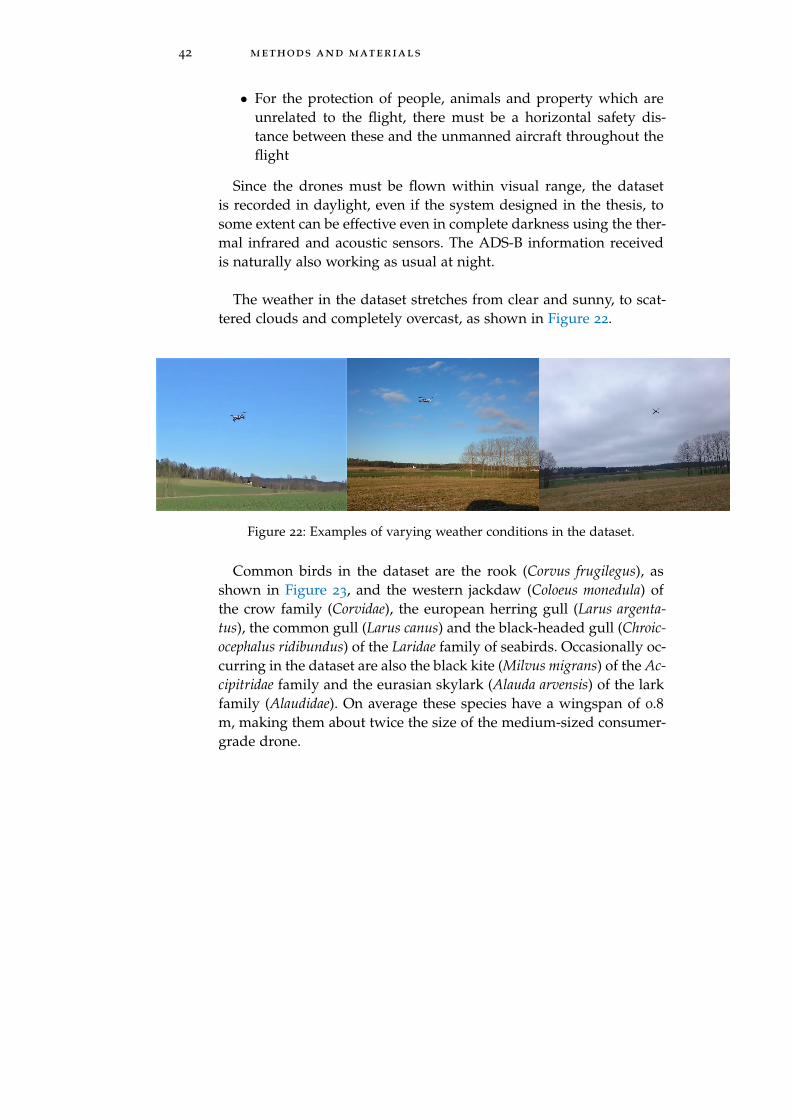
The weather in the dataset stretches from clear and sunny, to scat-tered clouds and completely overcast, as shown in Figure 22.
Figure 22: Examples of varying weather conditions in the dataset.
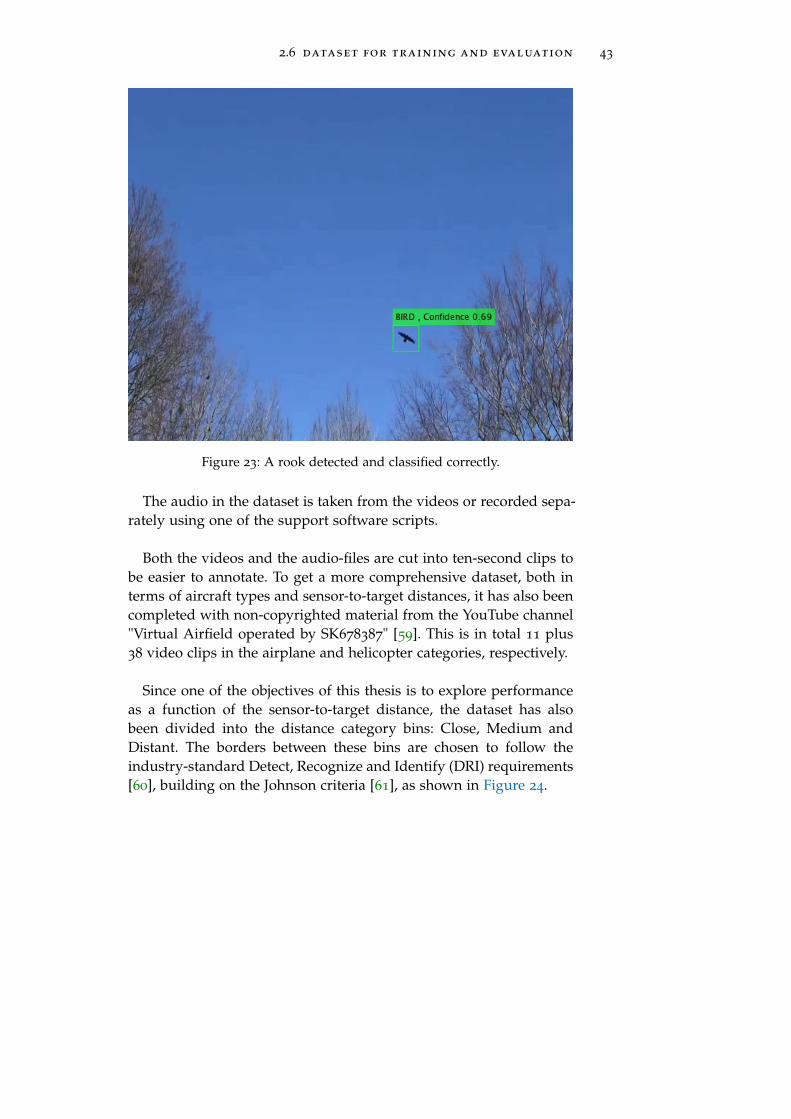
Common birds in the dataset are the rook (Corvus frugilegus), asshown in Figure 23, and the western jackdaw (Coloeus monedula) ofthe crow family (Corvidae), the european herring gull (Larus argenta-tus), the common gull (Larus canus) and the black-headed gull (Chroic-ocephalus ridibundus) of the Laridae family of seabirds. Occasionally oc-curring in the dataset are also the black kite (Milvus migrans) of the Ac-cipitridae family and the eurasian skylark (Alauda arvensis) of the larkfamily (Alaudidae). On average these species have a wingspan of 0.8m, making them about twice the size of the medium-sized consumer-grade drone.
2.6 dataset for training and evaluation 43
Figure 23: A rook detected and classified correctly.
The audio in the dataset is taken from the videos or recorded sepa-rately using one of the support software scripts.
Both the videos and the audio-files are cut into ten-second clips tobe easier to annotate. To get a more comprehensive dataset, both interms of aircraft types and sensor-to-target distances, it has also beencompleted with non-copyrighted material from the YouTube channel"Virtual Airfield operated by SK678387" [59]. This is in total 11 plus38 video clips in the airplane and helicopter categories, respectively.
Since one of the objectives of this thesis is to explore performanceas a function of the sensor-to-target distance, the dataset has alsobeen divided into the distance category bins: Close, Medium andDistant. The borders between these bins are chosen to follow theindustry-standard Detect, Recognize and Identify (DRI) requirements[60], building on the Johnson criteria [61], as shown in Figure 24.

44 methods and materials
Figure 24: The DRI-requirements. From [60].
The Close distance bin is from 0 m out to a distance where thetarget is 15 pixels wide in the IRcam image, i.e. the requirement forrecognition according to DRI. The Medium bin stretches from wherethe target is from 15, and down to 5 pixels, hence around the DRI de-tection point, and the Distant bin is beyond that. Given the resolutionand field of view of the IRcam and the object class sizes: Drone 0.4m, bird 0.8 m, helicopter1
10 m and airplane220 m, we get a distance
division for the different object types summarized in Table 3.
Table 3: The distance bin division for the different target classes.
Bin Class
AIRPLANE BIRD DRONE HELICOPTER
Close < 1000 m < 40 m < 20 m < 500 m
Medium 1000-3000 m 40-120 m 20-60 m 500-1500 m
Distant > 3000 m > 120 m > 60 m > 1500 m
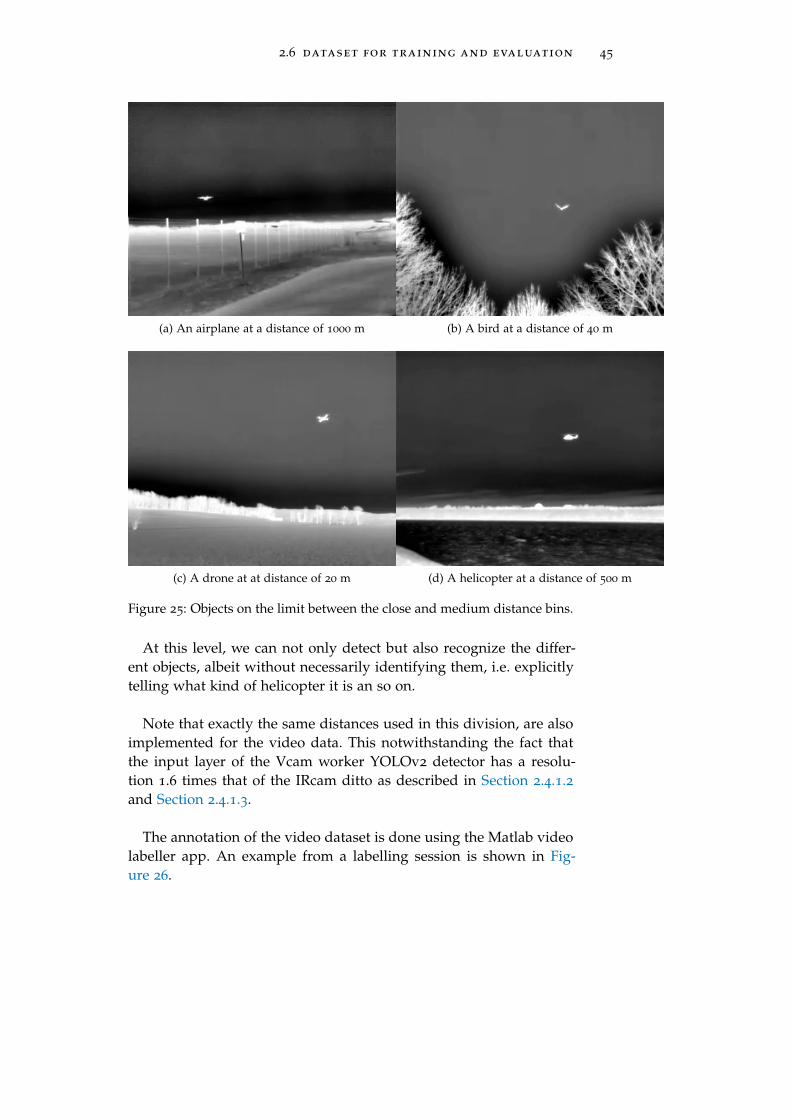
To illustrate the detect, recognize and identify concept, objects fromall the target classes being 15 pixels i width are shown in Figure 25.
1 Bell 429, one of the helicopter types in the dataset, has a length of 12.7 m2 Saab 340 has a length of 19.7 m and a wingspan of 21.4 m
2.6 dataset for training and evaluation 45
(a) An airplane at a distance of 1000 m (b) A bird at a distance of 40 m
(c) A drone at at distance of 20 m (d) A helicopter at a distance of 500 m
Figure 25: Objects on the limit between the close and medium distance bins.
At this level, we can not only detect but also recognize the differ-ent objects, albeit without necessarily identifying them, i.e. explicitlytelling what kind of helicopter it is an so on.
Note that exactly the same distances used in this division, are alsoimplemented for the video data. This notwithstanding the fact thatthe input layer of the Vcam worker YOLOv2 detector has a resolu-tion 1.6 times that of the IRcam ditto as described in Section 2.4.1.2and Section 2.4.1.3.
The annotation of the video dataset is done using the Matlab videolabeller app. An example from a labelling session is shown in Fig-ure 26.
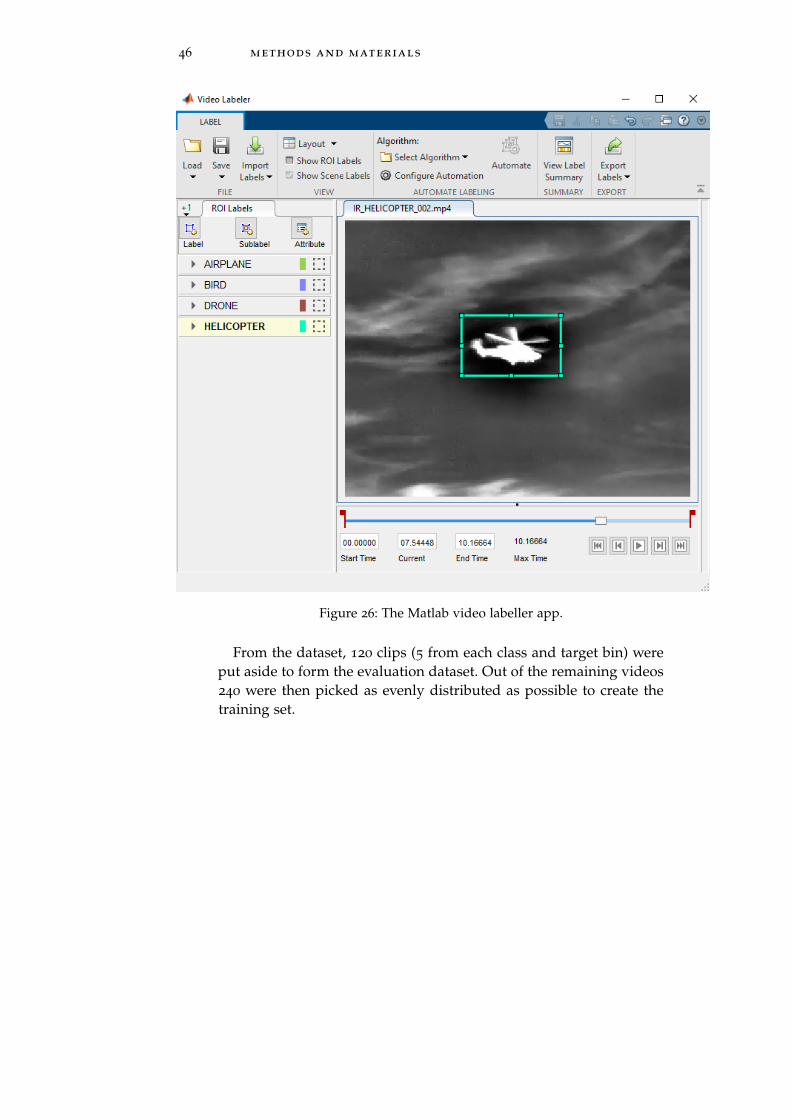
46 methods and materials
Figure 26: The Matlab video labeller app.
From the dataset, 120 clips (5 from each class and target bin) wereput aside to form the evaluation dataset. Out of the remaining videos240 were then picked as evenly distributed as possible to create thetraining set.
3R E S U LT S
Recall that the scope of this thesis work was twofold: First, to ex-plore the possibilities and limitations of designing and constructinga multi-sensor drone detection system while building on state-of-the-art methods and techniques. Secondly, to collect, compose and pub-lish a drone detection dataset.
In what follows the results of the thesis are outlined, initially withthe performance of the drone detection system, on both sensor andsystem levels, and finally, the dataset and its content is presented.
The evaluation of the system performance has been the hardestthing to do, both in terms of finding other work to compare with, butalso since not all of the scenarios that the system should be able tohandle are practically feasible to evaluate. For example, testing thedrone detection capability of the system at a busy airport would notonly be breaking the rules and regulation for drone flights but couldalso put people and property at risk.
First, the evaluation is done on detector level, this means measuringthe performance in terms of precision1, recall2 and F1-score3, of theindividual sensor on a single image or audio signal. Secondly, theevaluation is done on system-level, i.e. the total output of the systemafter the sensor fusion part. Such results are sparse, but can be foundin [40] and [14].
3.1 performance of the individual sensors
To evaluate the individual sensors, a part of the dataset was put asideat an early stage and hence kept out of the training process. The eval-uation set for the audio classifier contains five 10-second clips fromeach output category. Since the classifier processes a one-second in-put buffer, the evaluation set is also cut into that length, and using anoverlap of 0.5, there are a total of 297 clips in the evaluation set, 99
from each class.
1 How many of the selected items are relevant? Precision = tptp+fp
2 How many of the relevant items are selected? Recall = tptp+fn
3 The F1-score is defined to be the harmonic mean of the precision and recall, henceF1 = 2 · precision·recall
precision+recall
47
48 results
For the audio classifier, the performance is presented using a con-fusion matrix. The precision, recall and F1-score of the classifier arealso calculated, so that this can be compared to related results.
For the detectors of the IRcam and Vcam workers, not only theclassification label but also the placement of the bounding box mustbe taken under consideration. In this the IoU, as defined in Sec-tion 2.4.1.2, is used once more. The use similar IoU-requirements fa-cilitates the results to be compared, and looking at the related work,we see that an IoU of 0.5 is used in [15], [18] and [19]. A lower IoU of0.2 is used in [43].
The evaluation set is composed of five representative videos fromeach class and distance bin. Since the videos are not all preciselyten seconds1, the total number of images in each evaluation set is aspresented in Table 4.
Table 4: The number of images in the evaluation dataset.
Sensor Distance bin Total
Close Medium Distant
IR 6256 6226 6209 18691
Visible 6256 6254 6263 18773
The performances of the video detectors are both evaluated usingthe bboxPrecisionRecall-function to get the precision, recall and F1-score. Since we also have a confidence score of each detection theevaluateDetectionPrecision can be utilized to get plotted curves ofprecision as a function of the recall value, i.e. the PR-curve.
An important thing to keep in mind is that the ground truth ismade by a person and will contain both errors and inconsistency re-garding the placements and sizes of the bounding boxes.
3.1.1 Thermal infrared detector and classifier
Results regarding the use of an IR-sensor can be found in [11]. How-ever, the sensor used in that article to detect drones, up to a distanceof 100 m, has a resolution of just 80x60 pixels, and the system doesnot involve any form of machine learning feature. In that paper, threedifferent drones were used, and a DJI Phantom 4 was detected by thesetup up to a distance of 51 m.
1 10.4 seconds on average

3.1 performance of the individual sensors 49
In [12], curves for the precision and recall of a machine learningbased thermal detector are presented. It is stated that the video clipsused for training and evaluation have a frame resolution of 1920x1080.Unfortunately, the paper fails to mention if this is also the resolutionof the sensor. Neither is the input size if the detection network spec-ified in detail, other than that the images are rescaled so that theshorter side has 600 pixels.
The most substantial results to relate to in [12], is that since thesystem also contains a video camera with the same image size as thethermal one, the authors can conclude that the thermal drone detec-tor has a performance over 8% better than the video detector.
Using the distance bin division described in Section 2.6 the pre-cision and recall of the IRcam worker detector, with a confidencethreshold set to 0.5 and an IoU-requirement of 0.5, are shown in Ta-ble 5, Table 6 and Table 7 below. This thesis conforms to the use of anIoU-requirement of 0.5.
Table 5: Precision and recall of the IRcam worker detector for the distancebin Close.
Class Average
AIRPLANE BIRD DRONE HELICOPTER
Precision 0.9197 0.7591 0.9159 0.9993 0.8985
Recall 0.8736 0.8508 0.8790 0.8792 0.8706
Table 6: Precision and recall of the IRcam worker detector for the distancebin Medium.
Class Average
AIRPLANE BIRD DRONE HELICOPTER
Precision 0.8281 0.5063 0.8951 0.9554 0.7962
Recall 0.7039 0.7033 0.8034 0.8355 0.7615
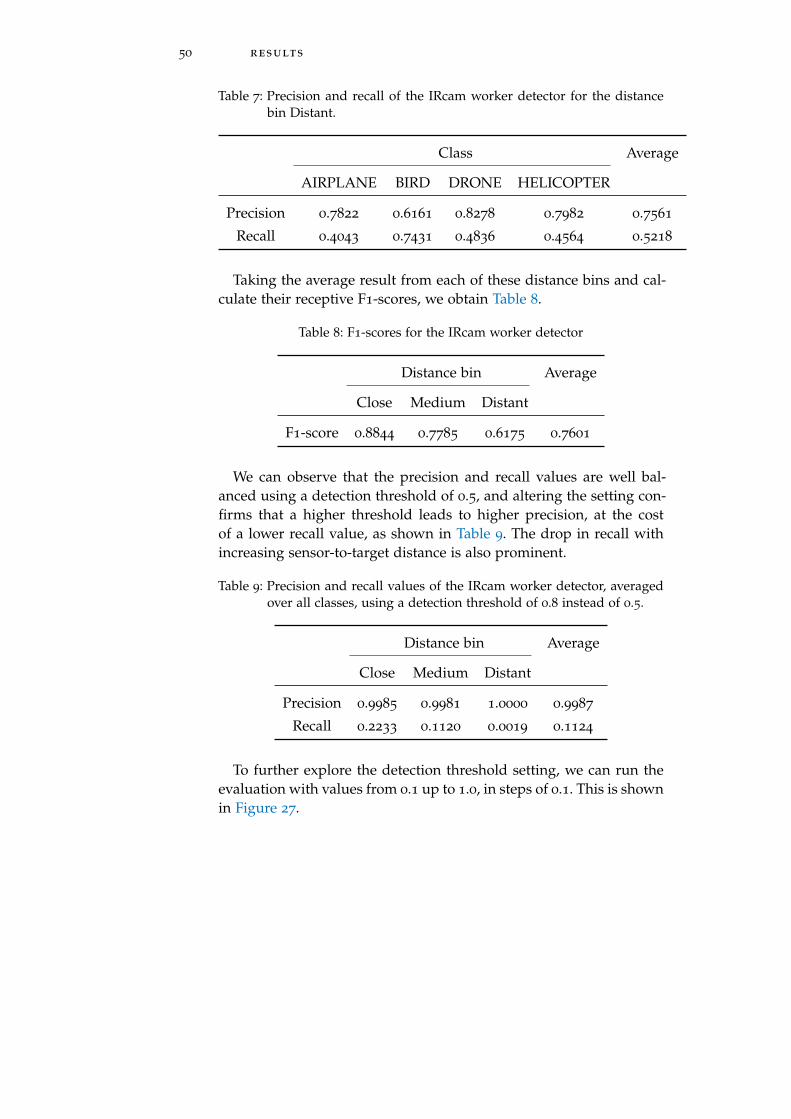
50 results
Table 7: Precision and recall of the IRcam worker detector for the distancebin Distant.
Class Average
AIRPLANE BIRD DRONE HELICOPTER
Precision 0.7822 0.6161 0.8278 0.7982 0.7561
Recall 0.4043 0.7431 0.4836 0.4564 0.5218
Taking the average result from each of these distance bins and cal-culate their receptive F1-scores, we obtain Table 8.
Table 8: F1-scores for the IRcam worker detector
Distance bin Average
Close Medium Distant
F1-score 0.8844 0.7785 0.6175 0.7601
We can observe that the precision and recall values are well bal-anced using a detection threshold of 0.5, and altering the setting con-firms that a higher threshold leads to higher precision, at the costof a lower recall value, as shown in Table 9. The drop in recall withincreasing sensor-to-target distance is also prominent.
Table 9: Precision and recall values of the IRcam worker detector, averagedover all classes, using a detection threshold of 0.8 instead of 0.5.
Distance bin Average
Close Medium Distant
Precision 0.9985 0.9981 1.0000 0.9987
Recall 0.2233 0.1120 0.0019 0.1124
To further explore the detection threshold setting, we can run theevaluation with values from 0.1 up to 1.0, in steps of 0.1. This is shownin Figure 27.
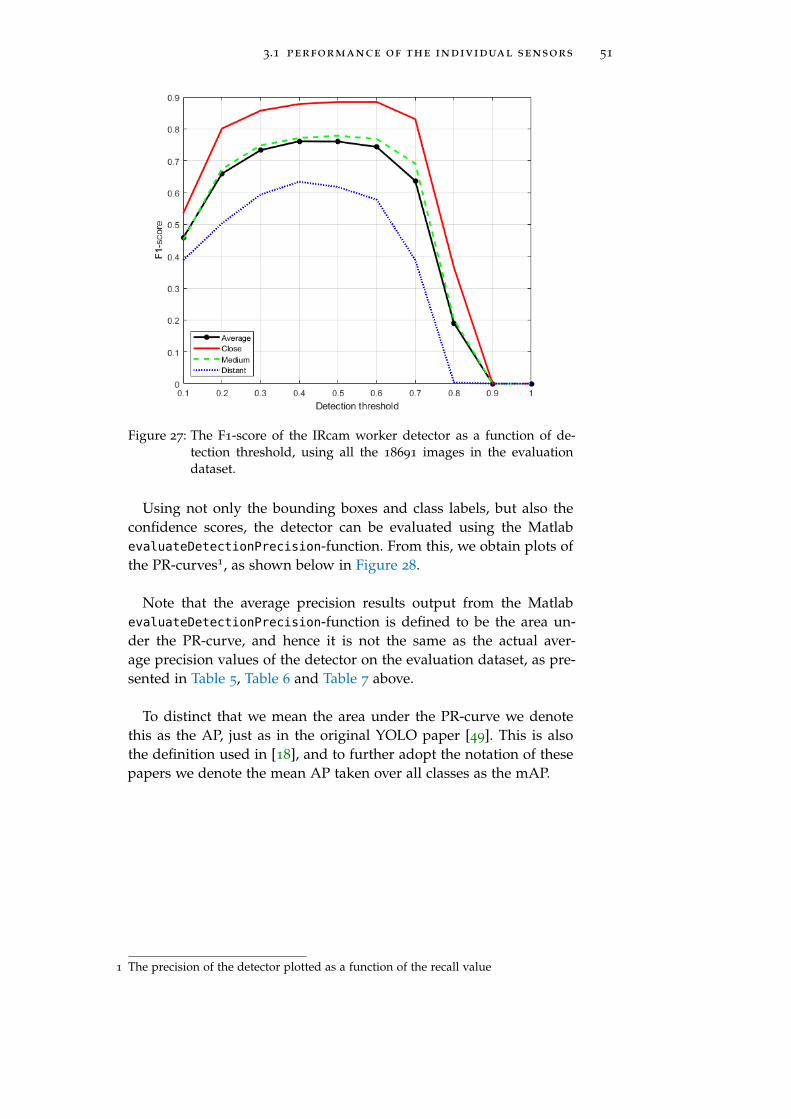
3.1 performance of the individual sensors 51
Figure 27: The F1-score of the IRcam worker detector as a function of de-tection threshold, using all the 18691 images in the evaluationdataset.
Using not only the bounding boxes and class labels, but also theconfidence scores, the detector can be evaluated using the MatlabevaluateDetectionPrecision-function. From this, we obtain plots ofthe PR-curves1, as shown below in Figure 28.
Note that the average precision results output from the MatlabevaluateDetectionPrecision-function is defined to be the area un-der the PR-curve, and hence it is not the same as the actual aver-age precision values of the detector on the evaluation dataset, as pre-sented in Table 5, Table 6 and Table 7 above.
To distinct that we mean the area under the PR-curve we denotethis as the AP, just as in the original YOLO paper [49]. This is alsothe definition used in [18], and to further adopt the notation of thesepapers we denote the mean AP taken over all classes as the mAP.
1 The precision of the detector plotted as a function of the recall value
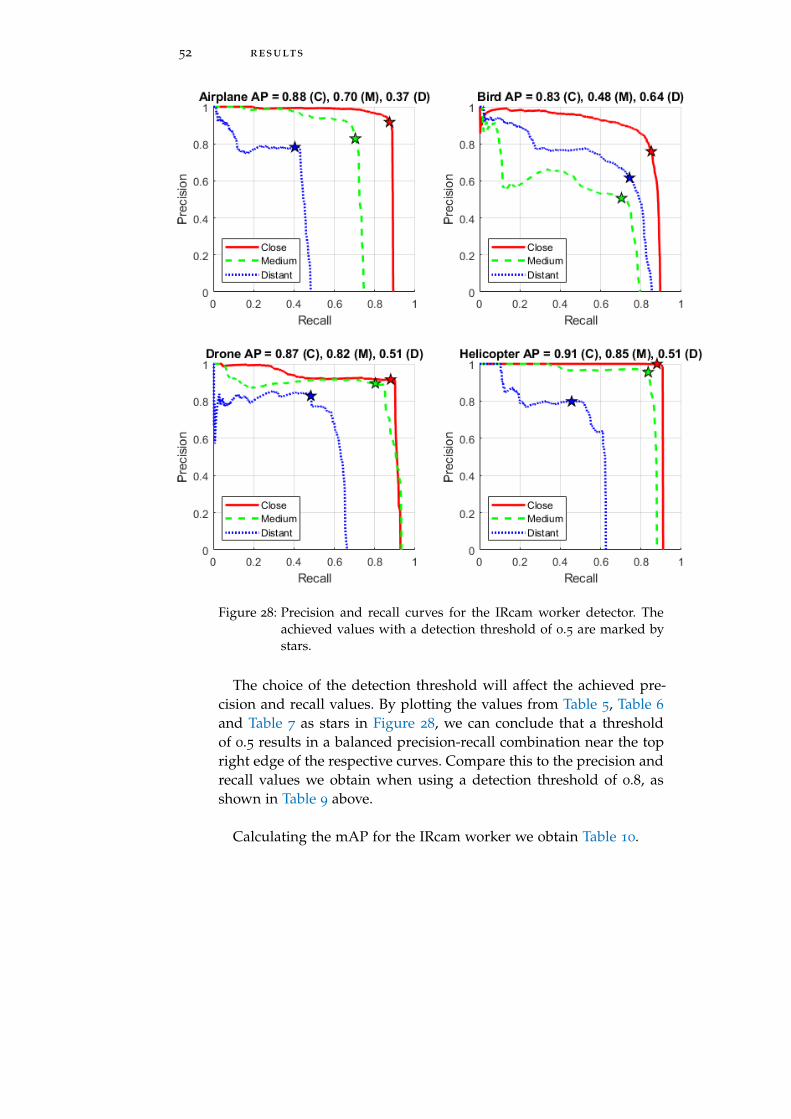
52 results
Figure 28: Precision and recall curves for the IRcam worker detector. Theachieved values with a detection threshold of 0.5 are marked bystars.
The choice of the detection threshold will affect the achieved pre-cision and recall values. By plotting the values from Table 5, Table 6
and Table 7 as stars in Figure 28, we can conclude that a thresholdof 0.5 results in a balanced precision-recall combination near the topright edge of the respective curves. Compare this to the precision andrecall values we obtain when using a detection threshold of 0.8, asshown in Table 9 above.
Calculating the mAP for the IRcam worker we obtain Table 10.

3.1 performance of the individual sensors 53
Table 10: The mean values, over all classes, of the area under the PR-curve(mAP) of the IRcam worker detector for the different distance binsincluding the average of these values.
Distance bin Average
Close Medium Distant
mAP 0.8704 0.7150 0.5086 0.7097
The results presented above will be compared to the results of thevideo detector in what follows below.
From observations of the behaviour when running the drone de-tection system, we can also point out that a common source of falsealarms of the IRcam worker detector are small clouds and edges oflarge clouds lit up by the sun. An example of this can be seen inFigure 29.
Figure 29: A false target of the IRcam worker detector caused by a smallcloud lit by the sun.
3.1.2 Video detector and classifier
To be able to compare the results of the IRcam worker to the perfor-mance of the Vcam worker detector the same methods and settingsas above are used to get Table 11, Table 12, Table 13 and Table 14.

54 results
Table 11: Precision and recall of the Vcam worker detector for the distancebin Close.
Class Average
AIRPLANE BIRD DRONE HELICOPTER
Precision 0.8989 0.8284 0.8283 0.9225 0.8695
Recall 0.7355 0.7949 0.9536 0.9832 0.8668
Table 12: Precision and recall of the Vcam worker detector for the distancebin Medium.
Class Average
AIRPLANE BIRD DRONE HELICOPTER
Precision 0.8391 0.7186 0.7710 0.9680 0.8242
Recall 0.7306 0.7830 0.7987 0.7526 0.7662
Table 13: Precision and recall of the Vcam worker detector for the distancebin Distant.
Class Average
AIRPLANE BIRD DRONE HELICOPTER
Precision 0.7726 0.6479 0.8378 0.6631 0.7303
Recall 0.7785 0.7841 0.5519 0.5171 0.6579
Table 14: F1-scores for the Vcam worker detector.
Distance bin Average
Close Medium Distant
F1-score 0.8682 0.7942 0.6922 0.7849
These results differ no more than 3% from the results of the IRcamworker detector. Recall that the input layers of the YOLOv2-detectorsare different and hence that the resolution of the Vcam worker1 is1.625 higher than that of the IRcam worker2. So even with a lower res-olution, and the fact that the image is in greyscale and not in colour,the IR sensor performs as well as the visible one. This conforms well
1 416x416 pixels2 256x256 pixels
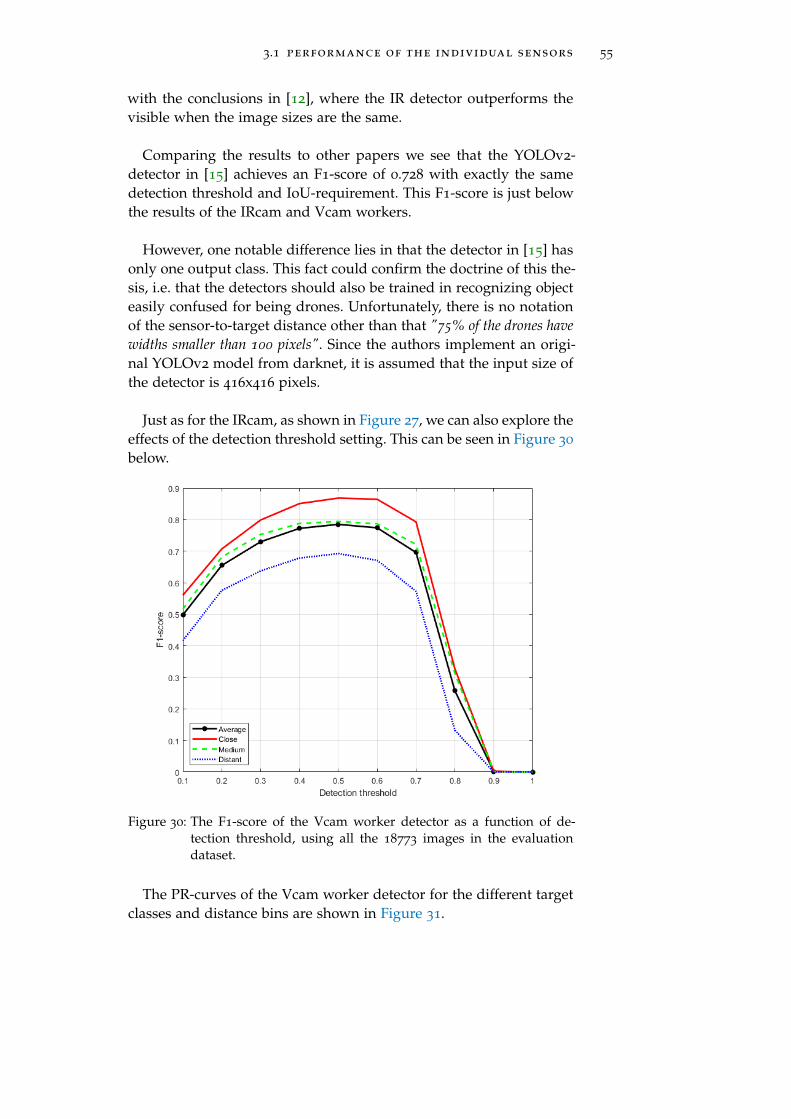
3.1 performance of the individual sensors 55
with the conclusions in [12], where the IR detector outperforms thevisible when the image sizes are the same.
Comparing the results to other papers we see that the YOLOv2-detector in [15] achieves an F1-score of 0.728 with exactly the samedetection threshold and IoU-requirement. This F1-score is just belowthe results of the IRcam and Vcam workers.
However, one notable difference lies in that the detector in [15] hasonly one output class. This fact could confirm the doctrine of this the-sis, i.e. that the detectors should also be trained in recognizing objecteasily confused for being drones. Unfortunately, there is no notationof the sensor-to-target distance other than that "75% of the drones havewidths smaller than 100 pixels". Since the authors implement an origi-nal YOLOv2 model from darknet, it is assumed that the input size ofthe detector is 416x416 pixels.
Just as for the IRcam, as shown in Figure 27, we can also explore theeffects of the detection threshold setting. This can be seen in Figure 30
below.
Figure 30: The F1-score of the Vcam worker detector as a function of de-tection threshold, using all the 18773 images in the evaluationdataset.
The PR-curves of the Vcam worker detector for the different targetclasses and distance bins are shown in Figure 31.
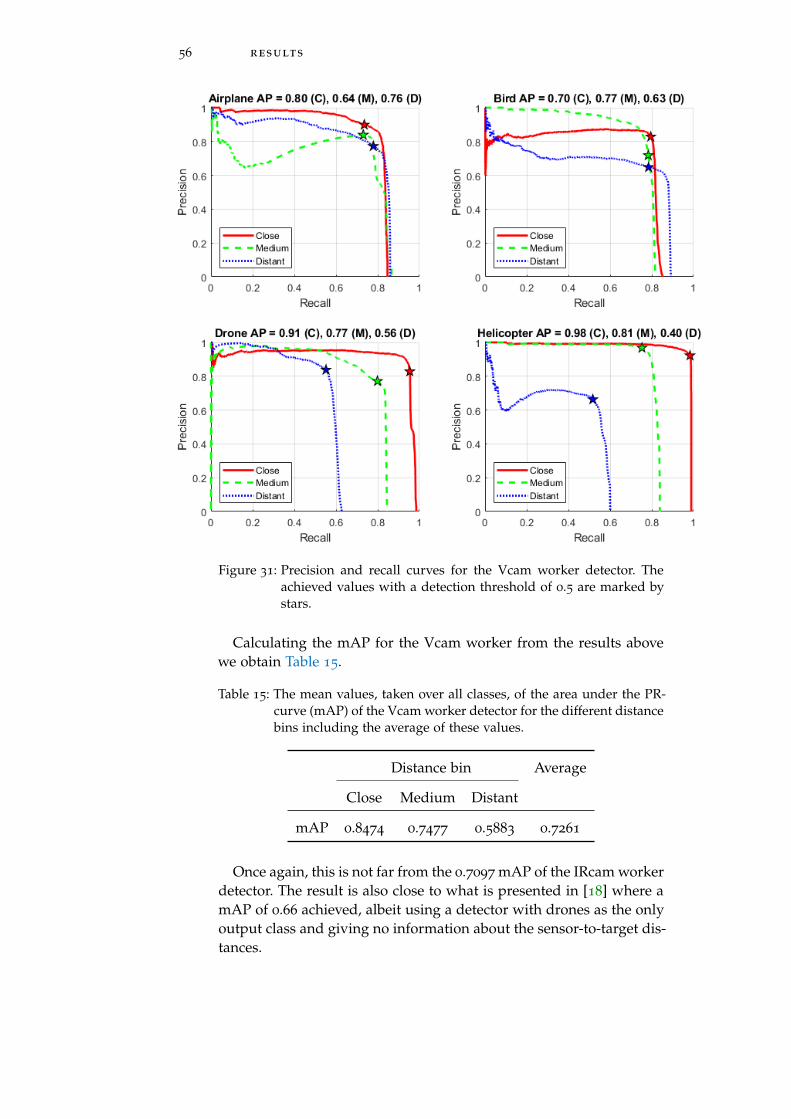
56 results
Figure 31: Precision and recall curves for the Vcam worker detector. Theachieved values with a detection threshold of 0.5 are marked bystars.
Calculating the mAP for the Vcam worker from the results abovewe obtain Table 15.
Table 15: The mean values, taken over all classes, of the area under the PR-curve (mAP) of the Vcam worker detector for the different distancebins including the average of these values.
Distance bin Average
Close Medium Distant
mAP 0.8474 0.7477 0.5883 0.7261
Once again, this is not far from the 0.7097 mAP of the IRcam workerdetector. The result is also close to what is presented in [18] where amAP of 0.66 achieved, albeit using a detector with drones as the onlyoutput class and giving no information about the sensor-to-target dis-tances.

3.1 performance of the individual sensors 57
A YOLOv2-architecture with an input size of 480x480 pixels is im-plemented in [19]. Moreover, the detector has two output classes,birds and drones. Based on the presented PR-curve, the authors statethat they "can understand from the curve that precision and recall can beachieved to be approximately 0.9 at the same time".
The performances of the IRcam and Vcam detectors together withthe reported comparable results are summarized in Table 16. Addi-tionally, the table shows the output classes used. [44] presents theresults of the four teams participating in the 2019 Drone-vs-Bird de-tection challenge, so from that the results of the winning team [62] isalso included in the Table 16. The approach of [62] is to first use a U-net to perform a two-class semantic segmentation that differentiatesflying targets from the background. Then a Resnetv2 is implementedto classify flying targets as birds or drones.
Table 16: Results from the related work and the IRcam and Vcam workerdetectors.
Source/Detector Results Classes1
Precision Recall F1-score mAP
Park et al. 2017 [15] 0.73 D
Liu et al. 2018 [17] 0.99 0.802 A, D, H
Saqib et al. 2017 [18] 0.66 D
Aker and Kalkan. 2017 [19] ≈ 0.9 ≈ 0.9 B, D
Craye and Ardjoune. 2019 [62] 0.73 B, D
IRcam worker detector 0.82 0.72 0.76 0.71 A, B, D, H
Vcam worker detector 0.81 0.76 0.78 0.73 A, B, D, H
Notably, when inspecting the PR-curves in Figure 31, the Vcamworker detector performs outstandingly when it comes to distant air-planes. This has its explanation in that such targets often presents avery large signature consisting not only of the airplane itself but alsocontrails behind it. An example of this, from a system evaluation ses-sion, is seen in Figure 32. In this screenshot, an airplane is detectedand classified at a sloping distance of more than 35000 m. At this dis-tance even a large commercial airplane is only about 1.4 pixels, andhence well below the detection limit of the DRI-criteria.
1 Shortened to fit the table. A = Airplane, B = Bird, D = Drone and H = Helicopter2 This is denoted as accuracy in the paper, but from the context and description it is
assumed that it is actually the recall that is reported. The result in the table is theaverage of the following class results: Airplane 0.9603, Drone 0.5213 and Helicopter0.9047
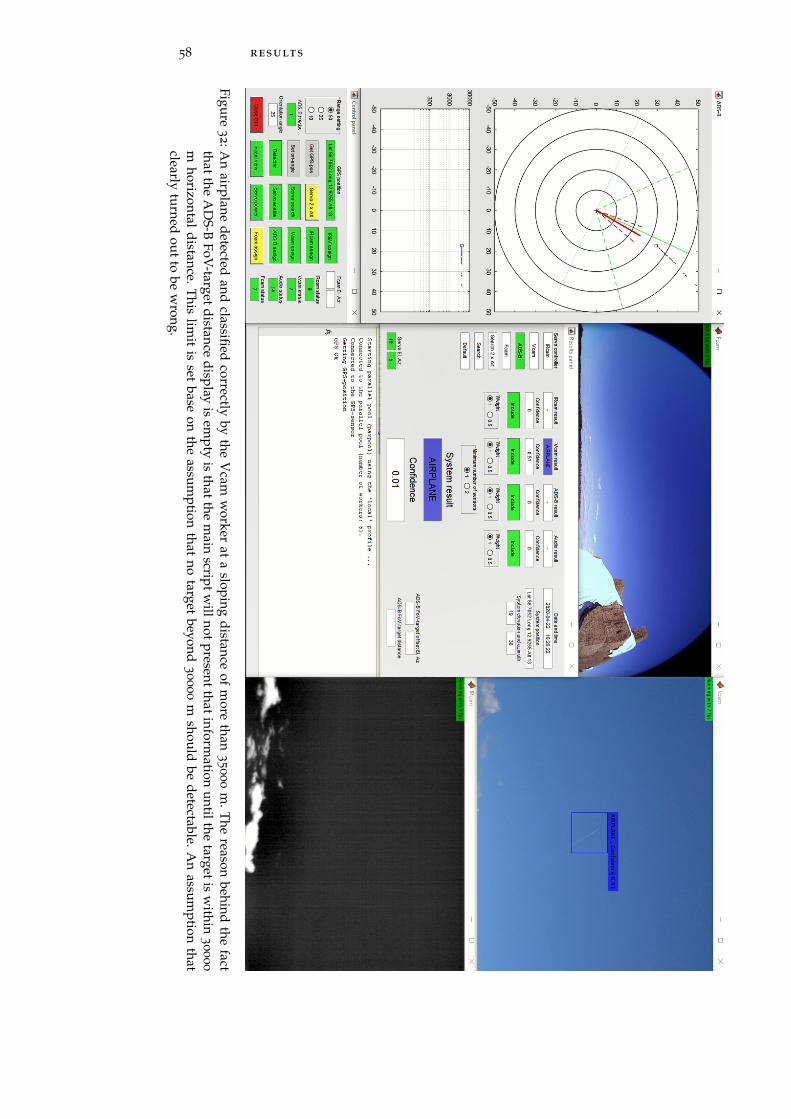
58 results
Figure3
2:An
airplanedetected
andclassified
correctlyby
theV
camw
orkerat
asloping
distanceof
more
than3
50
00
m.The
reasonbehind
thefact
thattheA
DS-B
FoV-targetdistance
displayis
empty
isthatthe
main
scriptwillnotpresentthatinform
ationuntilthe
targetisw
ithin3
00
00
mhorizontal
distance.This
limit
isset
baseon
theassum
ptionthat
notarget
beyond3
00
00
mshould
bedetectable.A
nassum
ptionthat
clearlyturned
outto
bew
rong.
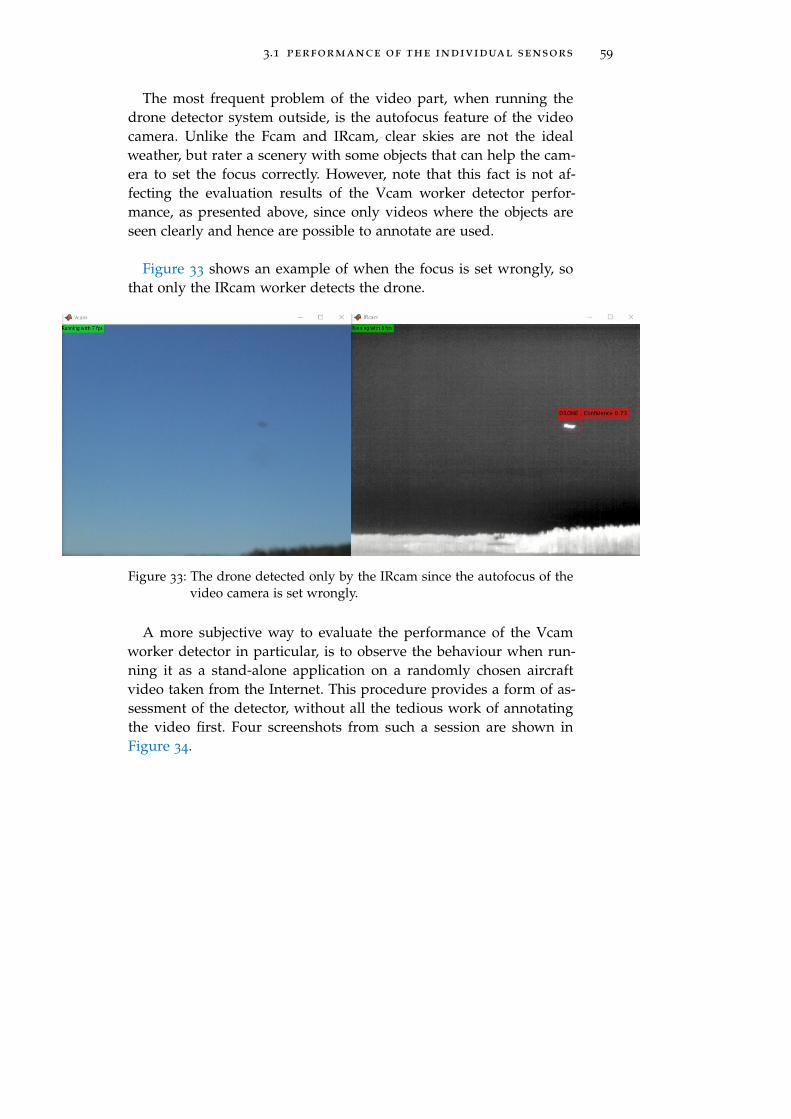
3.1 performance of the individual sensors 59
The most frequent problem of the video part, when running thedrone detector system outside, is the autofocus feature of the videocamera. Unlike the Fcam and IRcam, clear skies are not the idealweather, but rater a scenery with some objects that can help the cam-era to set the focus correctly. However, note that this fact is not af-fecting the evaluation results of the Vcam worker detector perfor-mance, as presented above, since only videos where the objects areseen clearly and hence are possible to annotate are used.
Figure 33 shows an example of when the focus is set wrongly, sothat only the IRcam worker detects the drone.
Figure 33: The drone detected only by the IRcam since the autofocus of thevideo camera is set wrongly.
A more subjective way to evaluate the performance of the Vcamworker detector in particular, is to observe the behaviour when run-ning it as a stand-alone application on a randomly chosen aircraftvideo taken from the Internet. This procedure provides a form of as-sessment of the detector, without all the tedious work of annotatingthe video first. Four screenshots from such a session are shown inFigure 34.
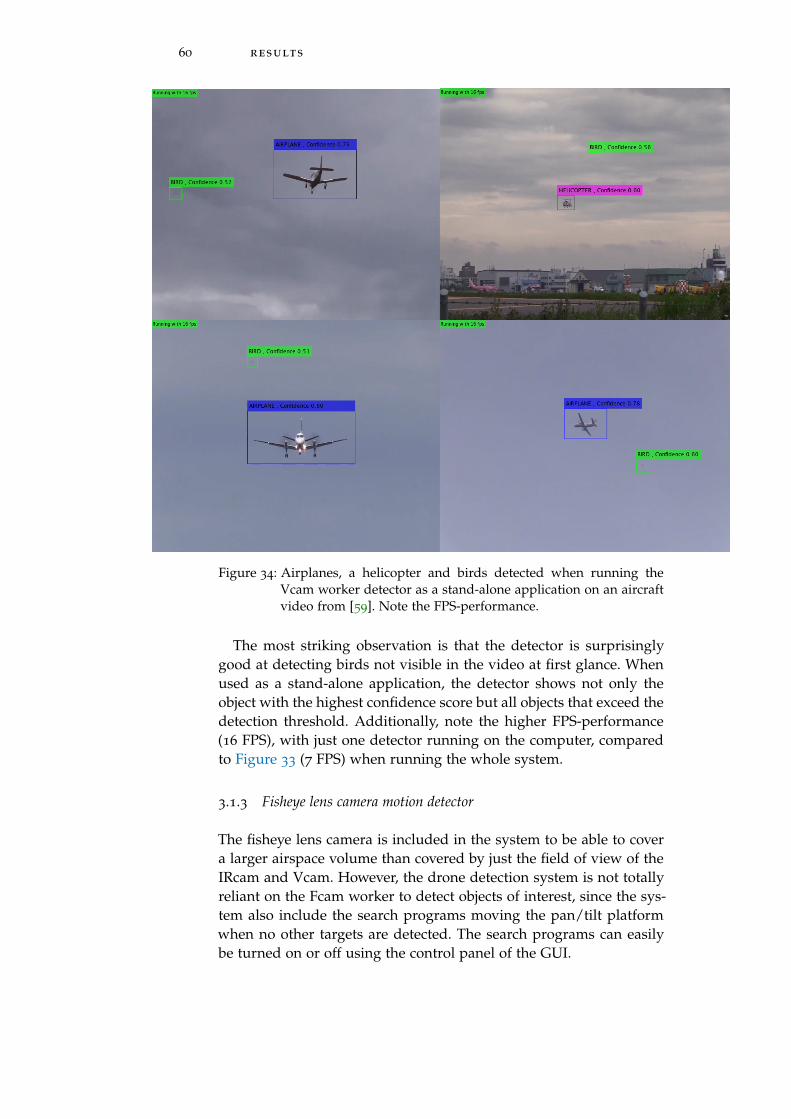
60 results
Figure 34: Airplanes, a helicopter and birds detected when running theVcam worker detector as a stand-alone application on an aircraftvideo from [59]. Note the FPS-performance.
The most striking observation is that the detector is surprisinglygood at detecting birds not visible in the video at first glance. Whenused as a stand-alone application, the detector shows not only theobject with the highest confidence score but all objects that exceed thedetection threshold. Additionally, note the higher FPS-performance(16 FPS), with just one detector running on the computer, comparedto Figure 33 (7 FPS) when running the whole system.
3.1.3 Fisheye lens camera motion detector
The fisheye lens camera is included in the system to be able to covera larger airspace volume than covered by just the field of view of theIRcam and Vcam. However, the drone detection system is not totallyreliant on the Fcam worker to detect objects of interest, since the sys-tem also include the search programs moving the pan/tilt platformwhen no other targets are detected. The search programs can easilybe turned on or off using the control panel of the GUI.
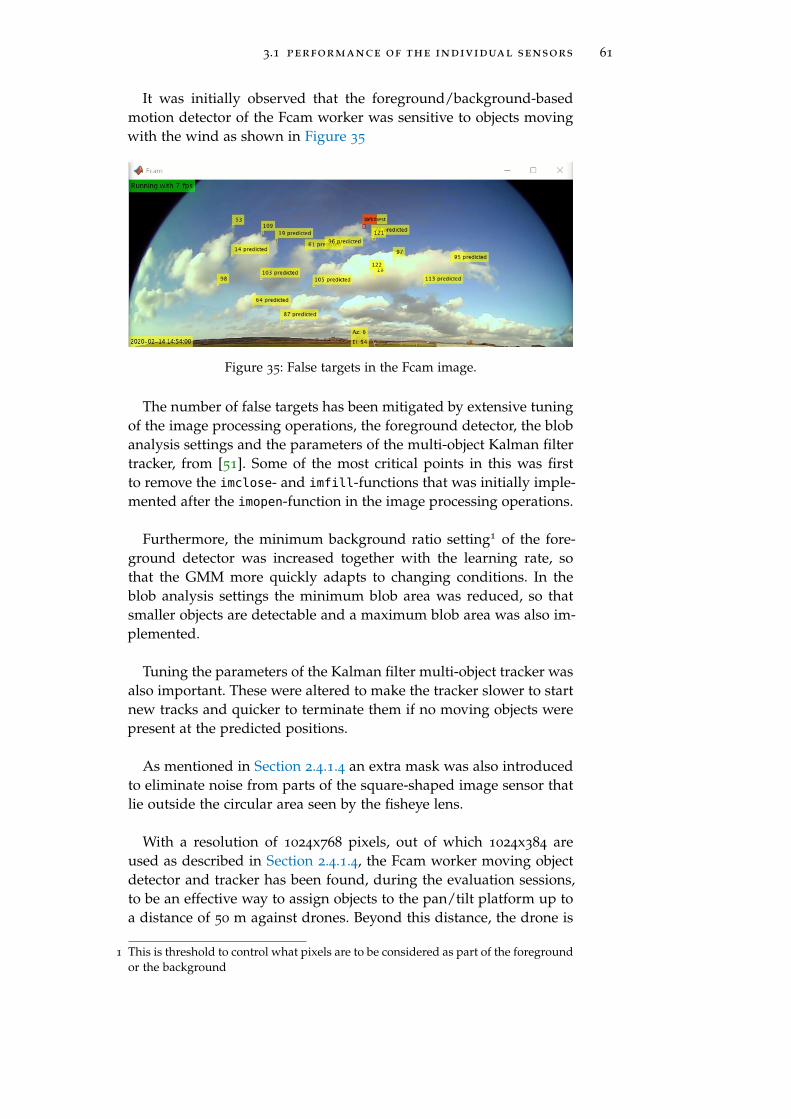
3.1 performance of the individual sensors 61
It was initially observed that the foreground/background-basedmotion detector of the Fcam worker was sensitive to objects movingwith the wind as shown in Figure 35
Figure 35: False targets in the Fcam image.
The number of false targets has been mitigated by extensive tuningof the image processing operations, the foreground detector, the blobanalysis settings and the parameters of the multi-object Kalman filtertracker, from [51]. Some of the most critical points in this was firstto remove the imclose- and imfill-functions that was initially imple-mented after the imopen-function in the image processing operations.
Furthermore, the minimum background ratio setting1 of the fore-ground detector was increased together with the learning rate, sothat the GMM more quickly adapts to changing conditions. In theblob analysis settings the minimum blob area was reduced, so thatsmaller objects are detectable and a maximum blob area was also im-plemented.
Tuning the parameters of the Kalman filter multi-object tracker wasalso important. These were altered to make the tracker slower to startnew tracks and quicker to terminate them if no moving objects werepresent at the predicted positions.
As mentioned in Section 2.4.1.4 an extra mask was also introducedto eliminate noise from parts of the square-shaped image sensor thatlie outside the circular area seen by the fisheye lens.
With a resolution of 1024x768 pixels, out of which 1024x384 areused as described in Section 2.4.1.4, the Fcam worker moving objectdetector and tracker has been found, during the evaluation sessions,to be an effective way to assign objects to the pan/tilt platform up toa distance of 50 m against drones. Beyond this distance, the drone is
1 This is threshold to control what pixels are to be considered as part of the foregroundor the background
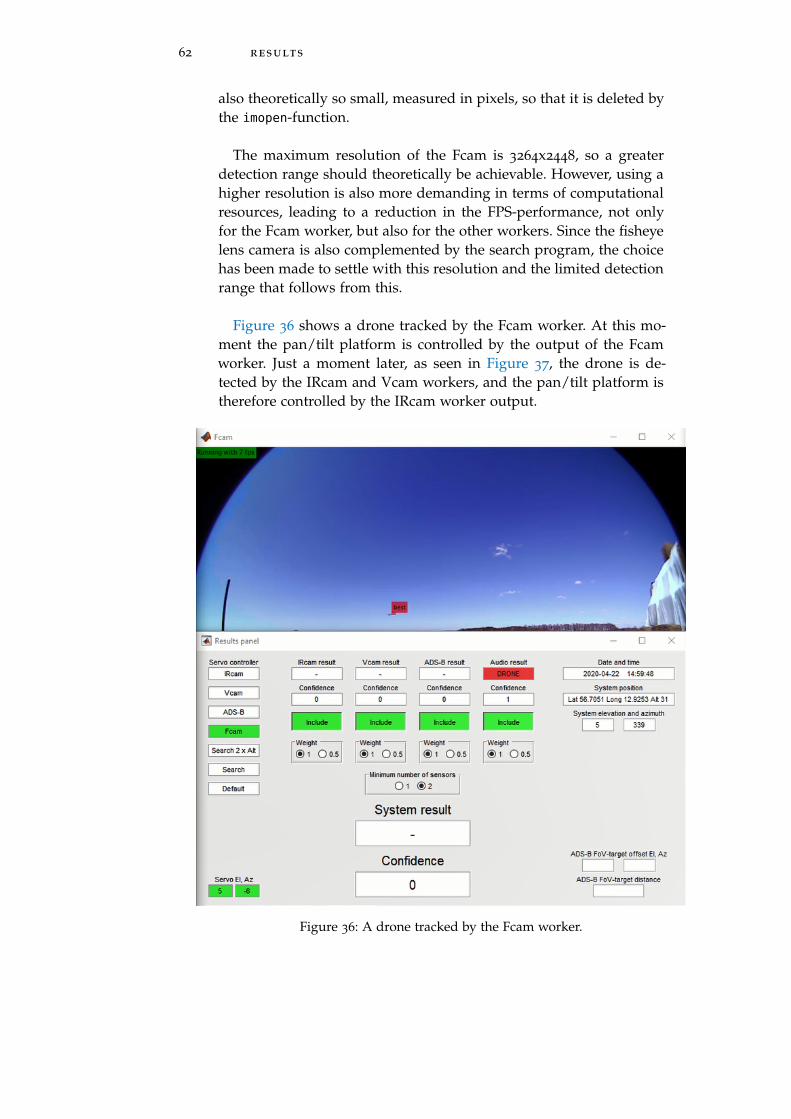
62 results
also theoretically so small, measured in pixels, so that it is deleted bythe imopen-function.
The maximum resolution of the Fcam is 3264x2448, so a greaterdetection range should theoretically be achievable. However, using ahigher resolution is also more demanding in terms of computationalresources, leading to a reduction in the FPS-performance, not onlyfor the Fcam worker, but also for the other workers. Since the fisheyelens camera is also complemented by the search program, the choicehas been made to settle with this resolution and the limited detectionrange that follows from this.
Figure 36 shows a drone tracked by the Fcam worker. At this mo-ment the pan/tilt platform is controlled by the output of the Fcamworker. Just a moment later, as seen in Figure 37, the drone is de-tected by the IRcam and Vcam workers, and the pan/tilt platform istherefore controlled by the IRcam worker output.
Figure 36: A drone tracked by the Fcam worker.

3.1 performance of the individual sensors 63
Figure 37: The results panel just after Figure 36. Note the time stamp.
3.1.4 Acoustic classifier
Using the 297 clips of the evaluation audio dataset and the Matlabconfusionchart-function we obtain the confusion matrix shown inFigure 38.
Figure 38: Confusion matrix from the evaluation of the audio classifier
So from this, we can put together Table 17 with the precision andrecall results for the different classes and can thereby also calculatethe average over all classes.
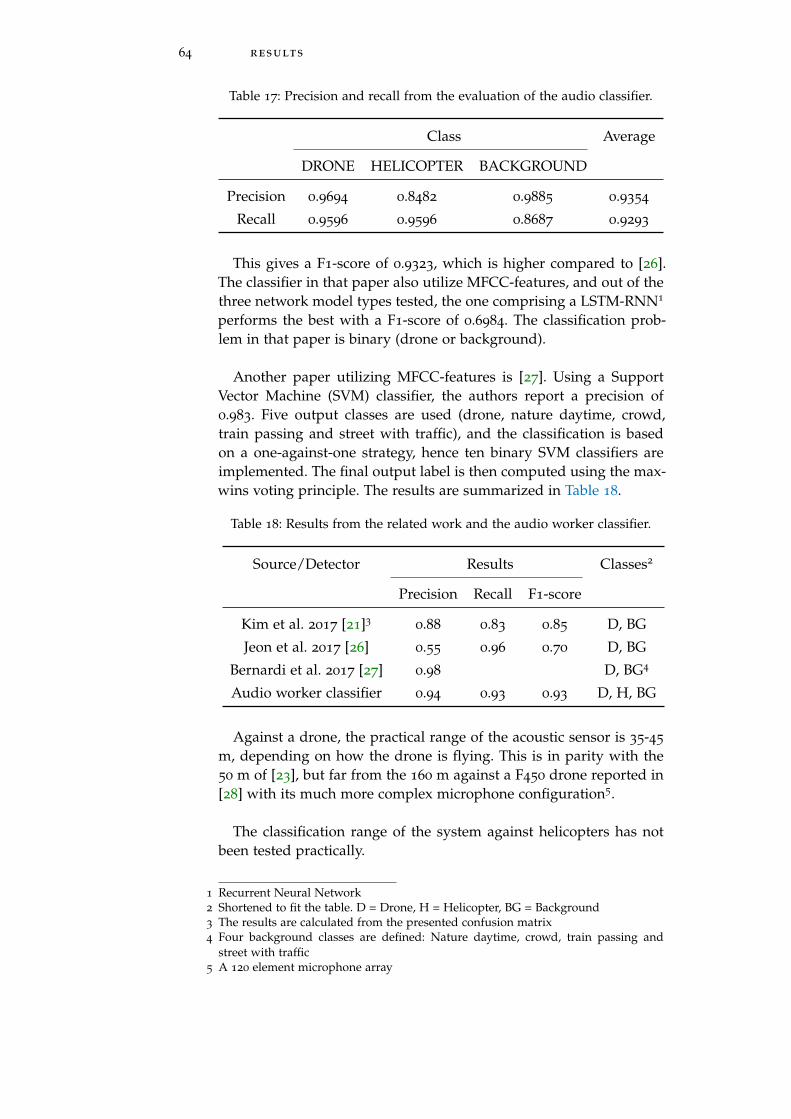
64 results
Table 17: Precision and recall from the evaluation of the audio classifier.
Class Average
DRONE HELICOPTER BACKGROUND
Precision 0.9694 0.8482 0.9885 0.9354
Recall 0.9596 0.9596 0.8687 0.9293
This gives a F1-score of 0.9323, which is higher compared to [26].The classifier in that paper also utilize MFCC-features, and out of thethree network model types tested, the one comprising a LSTM-RNN1
performs the best with a F1-score of 0.6984. The classification prob-lem in that paper is binary (drone or background).
Another paper utilizing MFCC-features is [27]. Using a SupportVector Machine (SVM) classifier, the authors report a precision of0.983. Five output classes are used (drone, nature daytime, crowd,train passing and street with traffic), and the classification is basedon a one-against-one strategy, hence ten binary SVM classifiers areimplemented. The final output label is then computed using the max-wins voting principle. The results are summarized in Table 18.
Table 18: Results from the related work and the audio worker classifier.
Source/Detector Results Classes2
Precision Recall F1-score
Kim et al. 2017 [21]30.88 0.83 0.85 D, BG
Jeon et al. 2017 [26] 0.55 0.96 0.70 D, BG
Bernardi et al. 2017 [27] 0.98 D, BG4
Audio worker classifier 0.94 0.93 0.93 D, H, BG
Against a drone, the practical range of the acoustic sensor is 35-45
m, depending on how the drone is flying. This is in parity with the50 m of [23], but far from the 160 m against a F450 drone reported in[28] with its much more complex microphone configuration5.
The classification range of the system against helicopters has notbeen tested practically.
1 Recurrent Neural Network2 Shortened to fit the table. D = Drone, H = Helicopter, BG = Background3 The results are calculated from the presented confusion matrix4 Four background classes are defined: Nature daytime, crowd, train passing and
street with traffic5 A 120 element microphone array
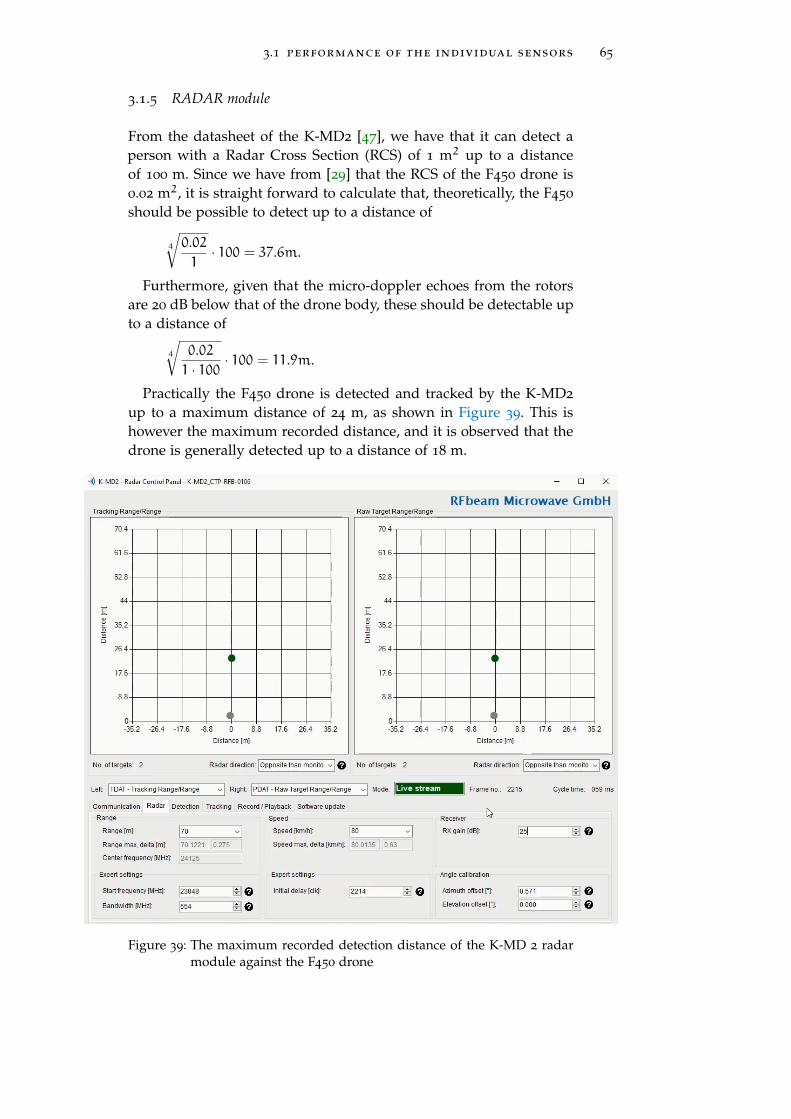
3.1 performance of the individual sensors 65
3.1.5 RADAR module
From the datasheet of the K-MD2 [47], we have that it can detect aperson with a Radar Cross Section (RCS) of 1 m2 up to a distanceof 100 m. Since we have from [29] that the RCS of the F450 drone is0.02 m2, it is straight forward to calculate that, theoretically, the F450
should be possible to detect up to a distance of
4
√0.021
· 100 = 37.6m.
Furthermore, given that the micro-doppler echoes from the rotorsare 20 dB below that of the drone body, these should be detectable upto a distance of
4
√0.021 · 100
· 100 = 11.9m.
Practically the F450 drone is detected and tracked by the K-MD2
up to a maximum distance of 24 m, as shown in Figure 39. This ishowever the maximum recorded distance, and it is observed that thedrone is generally detected up to a distance of 18 m.
Figure 39: The maximum recorded detection distance of the K-MD 2 radarmodule against the F450 drone
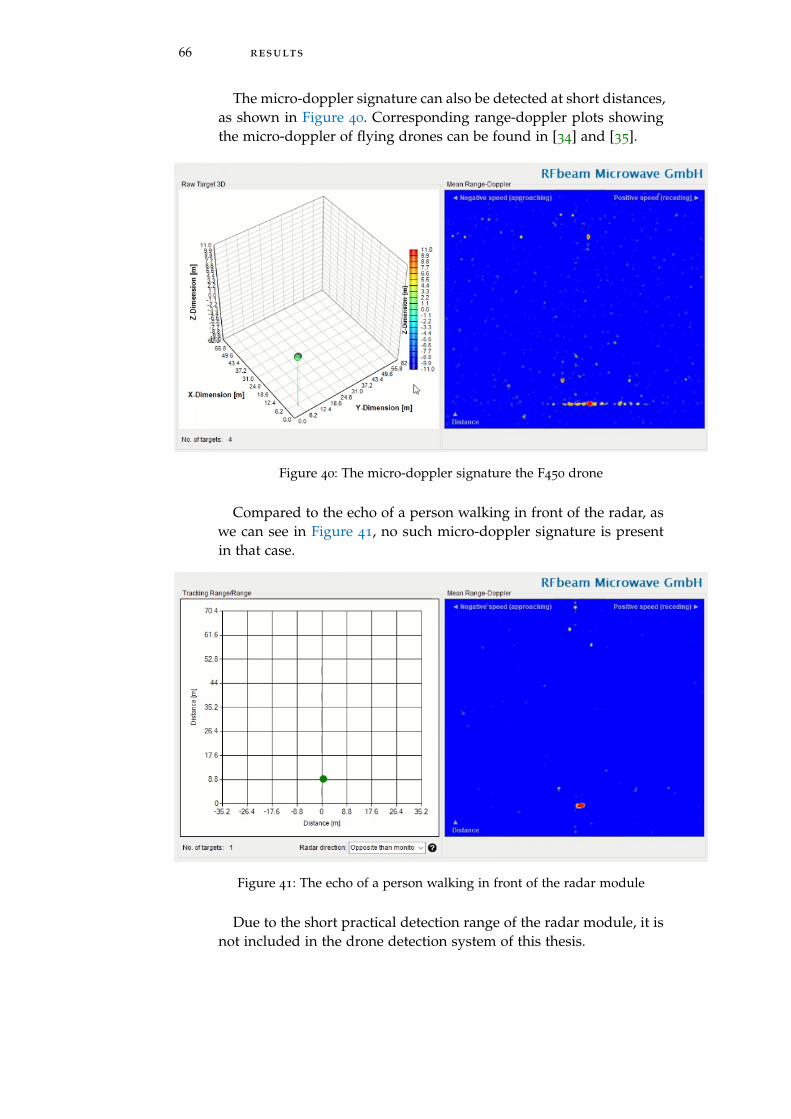
66 results
The micro-doppler signature can also be detected at short distances,as shown in Figure 40. Corresponding range-doppler plots showingthe micro-doppler of flying drones can be found in [34] and [35].
Figure 40: The micro-doppler signature the F450 drone
Compared to the echo of a person walking in front of the radar, aswe can see in Figure 41, no such micro-doppler signature is presentin that case.
Figure 41: The echo of a person walking in front of the radar module
Due to the short practical detection range of the radar module, it isnot included in the drone detection system of this thesis.
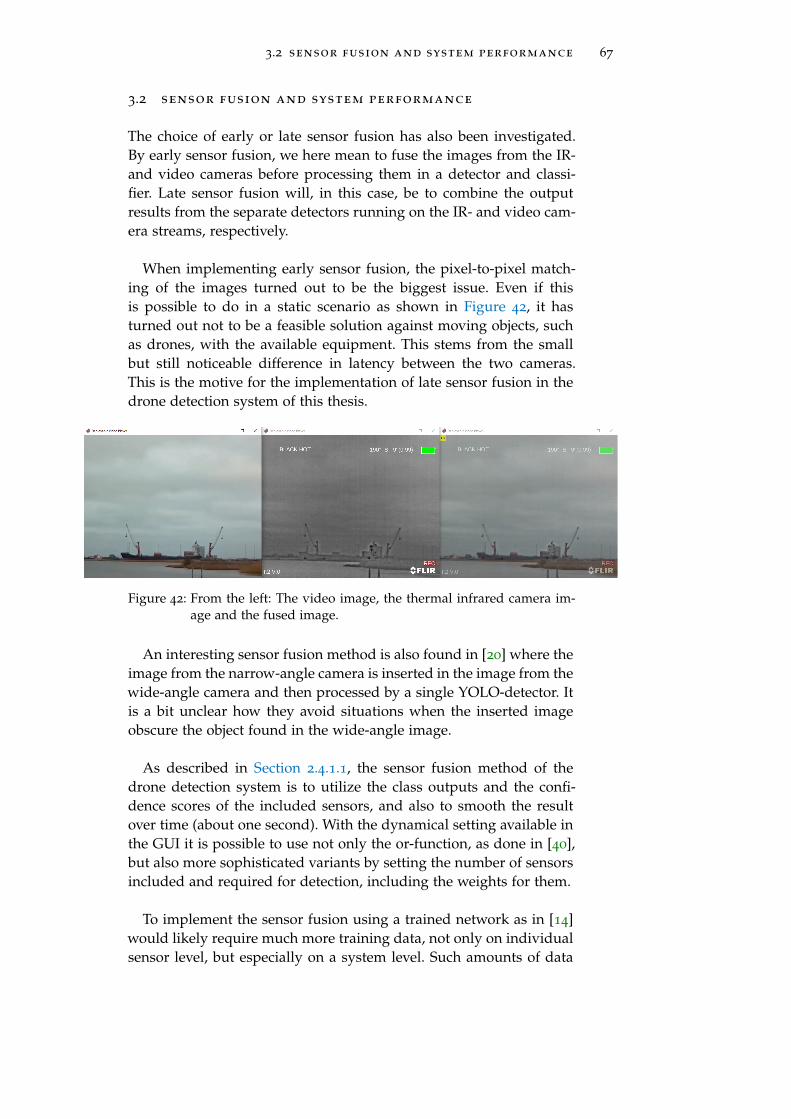
3.2 sensor fusion and system performance 67
3.2 sensor fusion and system performance
The choice of early or late sensor fusion has also been investigated.By early sensor fusion, we here mean to fuse the images from the IR-and video cameras before processing them in a detector and classi-fier. Late sensor fusion will, in this case, be to combine the outputresults from the separate detectors running on the IR- and video cam-era streams, respectively.
When implementing early sensor fusion, the pixel-to-pixel match-ing of the images turned out to be the biggest issue. Even if thisis possible to do in a static scenario as shown in Figure 42, it hasturned out not to be a feasible solution against moving objects, suchas drones, with the available equipment. This stems from the smallbut still noticeable difference in latency between the two cameras.This is the motive for the implementation of late sensor fusion in thedrone detection system of this thesis.
Figure 42: From the left: The video image, the thermal infrared camera im-age and the fused image.
An interesting sensor fusion method is also found in [20] where theimage from the narrow-angle camera is inserted in the image from thewide-angle camera and then processed by a single YOLO-detector. Itis a bit unclear how they avoid situations when the inserted imageobscure the object found in the wide-angle image.
As described in Section 2.4.1.1, the sensor fusion method of thedrone detection system is to utilize the class outputs and the confi-dence scores of the included sensors, and also to smooth the resultover time (about one second). With the dynamical setting available inthe GUI it is possible to use not only the or-function, as done in [40],but also more sophisticated variants by setting the number of sensorsincluded and required for detection, including the weights for them.
To implement the sensor fusion using a trained network as in [14]would likely require much more training data, not only on individualsensor level, but especially on a system level. Such amounts of data
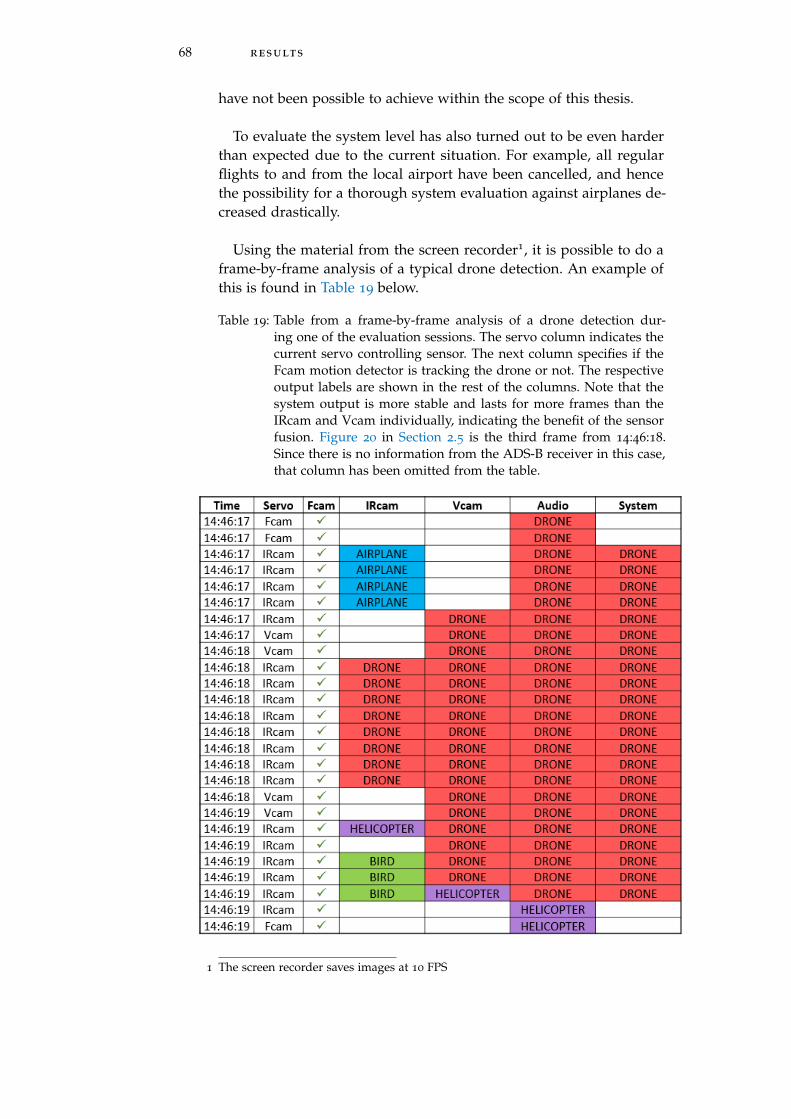
68 results
have not been possible to achieve within the scope of this thesis.
To evaluate the system level has also turned out to be even harderthan expected due to the current situation. For example, all regularflights to and from the local airport have been cancelled, and hencethe possibility for a thorough system evaluation against airplanes de-creased drastically.
Using the material from the screen recorder1, it is possible to do aframe-by-frame analysis of a typical drone detection. An example ofthis is found in Table 19 below.
Table 19: Table from a frame-by-frame analysis of a drone detection dur-ing one of the evaluation sessions. The servo column indicates thecurrent servo controlling sensor. The next column specifies if theFcam motion detector is tracking the drone or not. The respectiveoutput labels are shown in the rest of the columns. Note that thesystem output is more stable and lasts for more frames than theIRcam and Vcam individually, indicating the benefit of the sensorfusion. Figure 20 in Section 2.5 is the third frame from 14:46:18.Since there is no information from the ADS-B receiver in this case,that column has been omitted from the table.
1 The screen recorder saves images at 10 FPS
3.2 sensor fusion and system performance 69
As an attempt to measure the efficiency of the sensor fusion, wecan consider occasions such as the one described in Table 19, as be-ing a detection opportunity. If we define this to be when the drone iscontinuously observable in the field of view of the IRcam and Vcam,and hence possible for the system (including the audio classifier) toanalyse and track, we can find 73 such opportunities in the screenrecordings from the evaluation sessions.
The duration of the individual detection opportunities is from justfractions of a second up to 28 seconds. This is highly dependent onhow the drone is flying and if the system is able to track the drone ornot. We can see that Table 19 describes the frame-by-frame analysisof a detection opportunity lasting for three seconds.
Comparing the system results after the sensor fusion1 with the out-put from the respective sensors, we can observe that the system out-puts a drone classification at some time in 78% of the detection op-portunities. Closest to this is the performance of the Vcam detectorthat outputs a drone classification in 67% of the opportunities.
It is also possible to look at the system behaviour without a droneflying in front of it. This provides an opportunity to analyse the falsedetections that the system outputs. Out of the videos from the evalua-tion session, a ten minutes long section was reviewed frame-by-frame.Table 20 shows the timestamps, sensor types, causes of the false detec-tions, and the resulting output labels. Setting the minimum numberof sensors-option to two prevents all of the false detections in thetable from becoming false detections on a system level.
1 Having all sensors included with weight 1.0, and the minimum number of sensorsset to two

70 results
Table 20: Table of false detections appearing in a ten minutes long section ofscreen recording from an evaluation session, including the type ofobject causing the false detection.
The false detections caused by insects flying just in front of the sen-sors are very short-lived. The ones caused by clouds can last longer,sometimes several seconds. Figure 43 shows the false detections ofthe IRcam at 02:34 and the Vcam at 02:58 from Table 20.
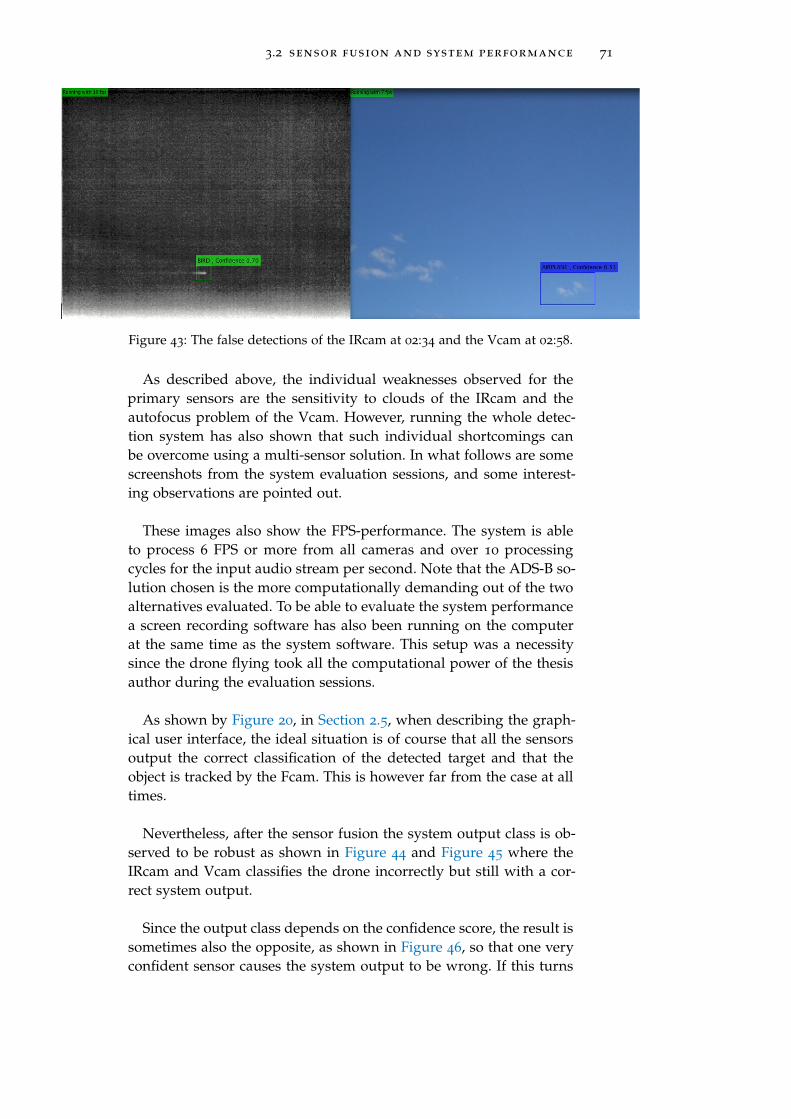
3.2 sensor fusion and system performance 71
Figure 43: The false detections of the IRcam at 02:34 and the Vcam at 02:58.
As described above, the individual weaknesses observed for theprimary sensors are the sensitivity to clouds of the IRcam and theautofocus problem of the Vcam. However, running the whole detec-tion system has also shown that such individual shortcomings canbe overcome using a multi-sensor solution. In what follows are somescreenshots from the system evaluation sessions, and some interest-ing observations are pointed out.
These images also show the FPS-performance. The system is ableto process 6 FPS or more from all cameras and over 10 processingcycles for the input audio stream per second. Note that the ADS-B so-lution chosen is the more computationally demanding out of the twoalternatives evaluated. To be able to evaluate the system performancea screen recording software has also been running on the computerat the same time as the system software. This setup was a necessitysince the drone flying took all the computational power of the thesisauthor during the evaluation sessions.
As shown by Figure 20, in Section 2.5, when describing the graph-ical user interface, the ideal situation is of course that all the sensorsoutput the correct classification of the detected target and that theobject is tracked by the Fcam. This is however far from the case at alltimes.
Nevertheless, after the sensor fusion the system output class is ob-served to be robust as shown in Figure 44 and Figure 45 where theIRcam and Vcam classifies the drone incorrectly but still with a cor-rect system output.
Since the output class depends on the confidence score, the result issometimes also the opposite, as shown in Figure 46, so that one veryconfident sensor causes the system output to be wrong. If this turns
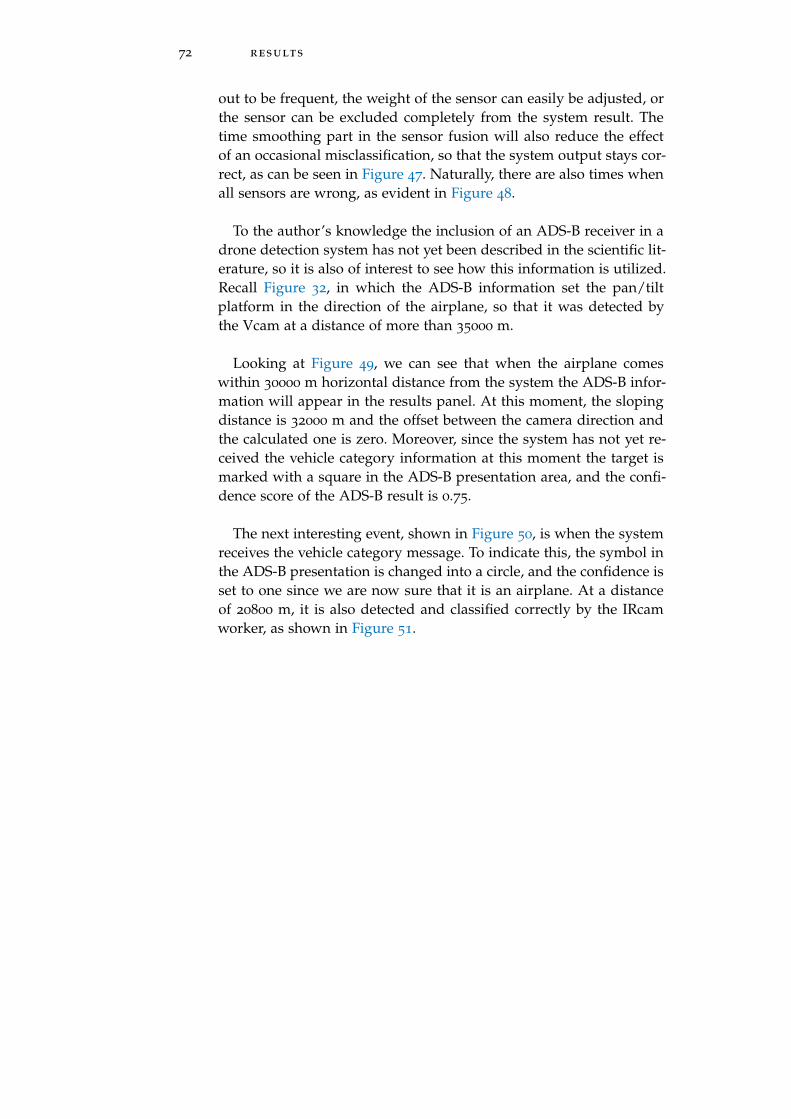
72 results
out to be frequent, the weight of the sensor can easily be adjusted, orthe sensor can be excluded completely from the system result. Thetime smoothing part in the sensor fusion will also reduce the effectof an occasional misclassification, so that the system output stays cor-rect, as can be seen in Figure 47. Naturally, there are also times whenall sensors are wrong, as evident in Figure 48.
To the author’s knowledge the inclusion of an ADS-B receiver in adrone detection system has not yet been described in the scientific lit-erature, so it is also of interest to see how this information is utilized.Recall Figure 32, in which the ADS-B information set the pan/tiltplatform in the direction of the airplane, so that it was detected bythe Vcam at a distance of more than 35000 m.
Looking at Figure 49, we can see that when the airplane comeswithin 30000 m horizontal distance from the system the ADS-B infor-mation will appear in the results panel. At this moment, the slopingdistance is 32000 m and the offset between the camera direction andthe calculated one is zero. Moreover, since the system has not yet re-ceived the vehicle category information at this moment the target ismarked with a square in the ADS-B presentation area, and the confi-dence score of the ADS-B result is 0.75.
The next interesting event, shown in Figure 50, is when the systemreceives the vehicle category message. To indicate this, the symbol inthe ADS-B presentation is changed into a circle, and the confidence isset to one since we are now sure that it is an airplane. At a distanceof 20800 m, it is also detected and classified correctly by the IRcamworker, as shown in Figure 51.
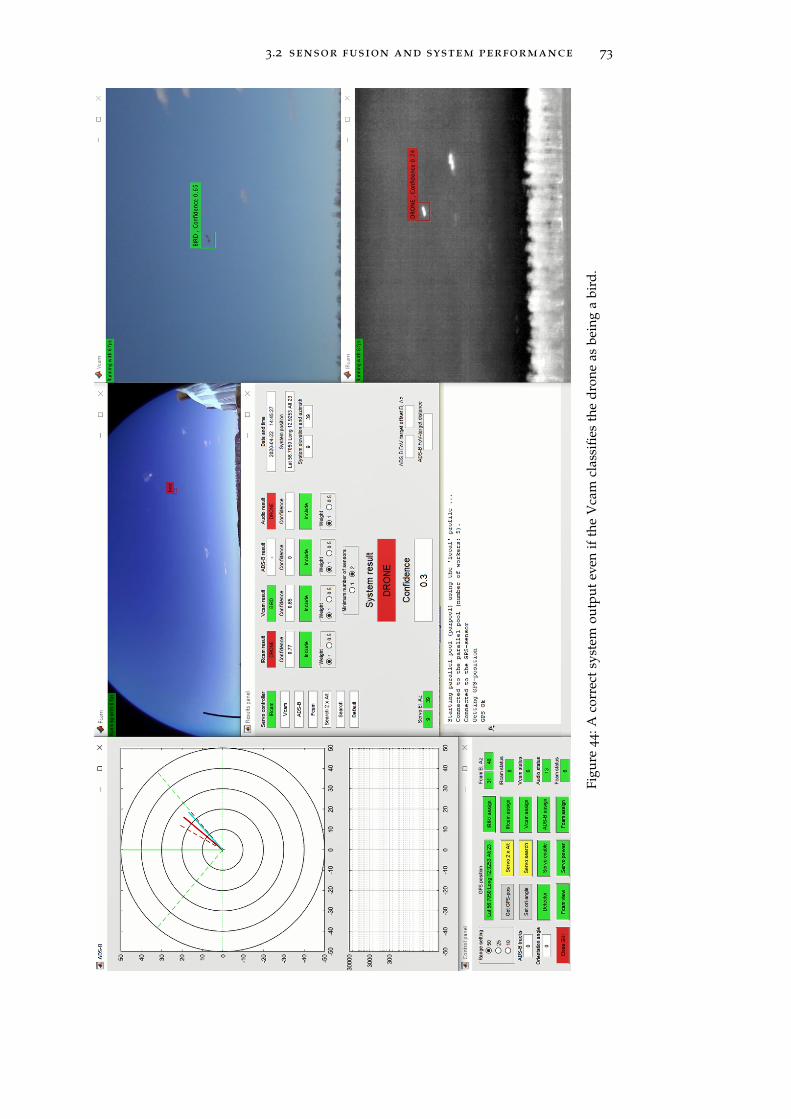
3.2 sensor fusion and system performance 73
Figu
re4
4:A
corr
ect
syst
emou
tput
even
ifth
eV
cam
clas
sifie
sth
edr
one
asbe
ing
abi
rd.
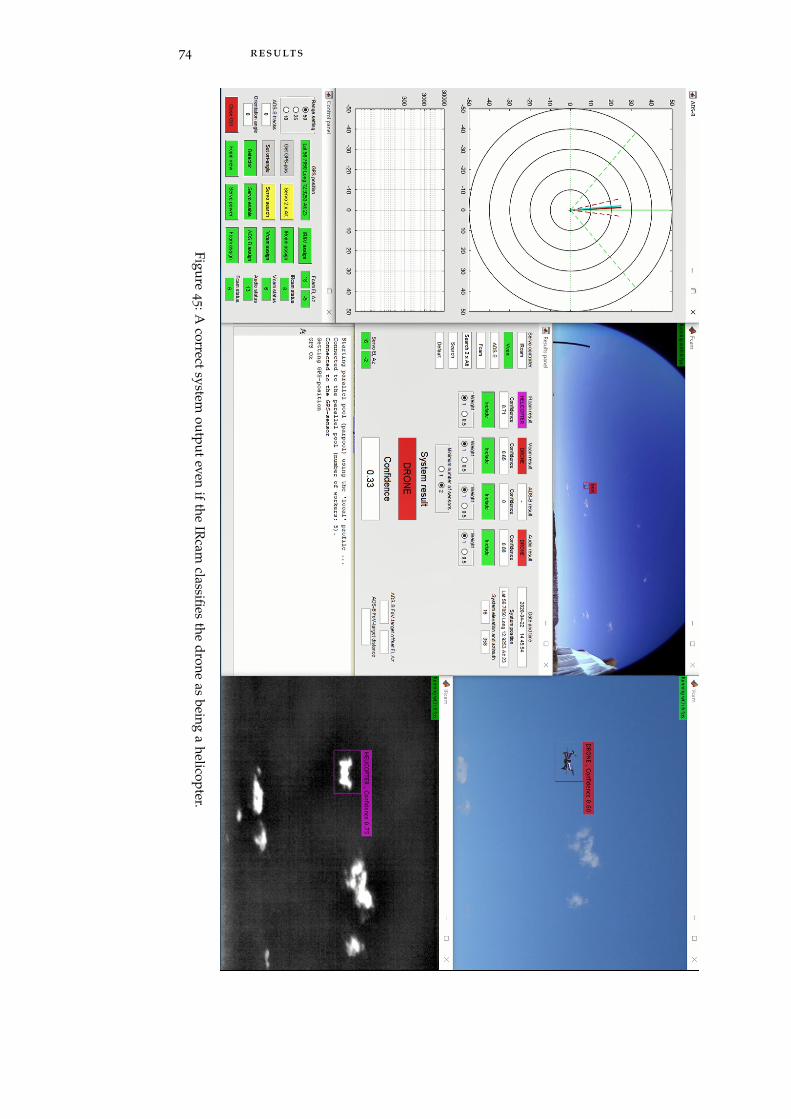
74 results
Figure4
5:Acorrect
systemoutput
evenif
theIR
camclassifies
thedrone
asbeing
ahelicopter.
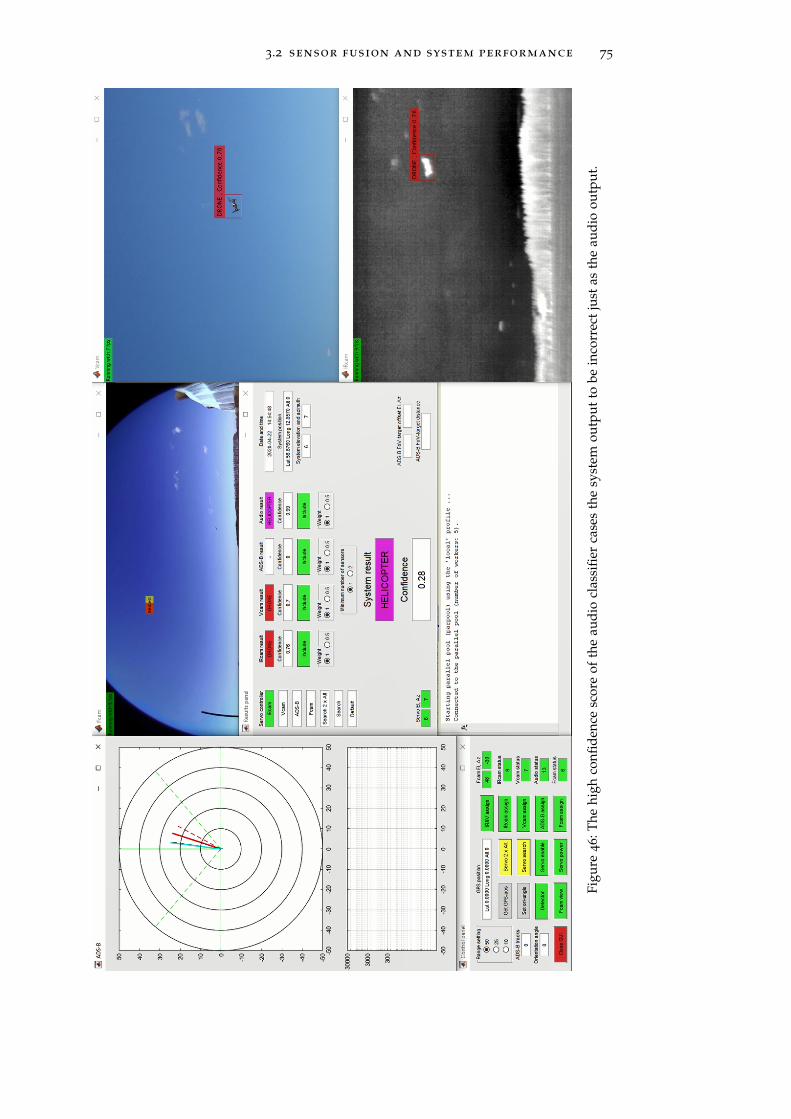
3.2 sensor fusion and system performance 75
Figu
re4
6:T
hehi
ghco
nfide
nce
scor
eof
the
audi
ocl
assi
fier
case
sth
esy
stem
outp
utto
bein
corr
ect
just
asth
eau
dio
outp
ut.
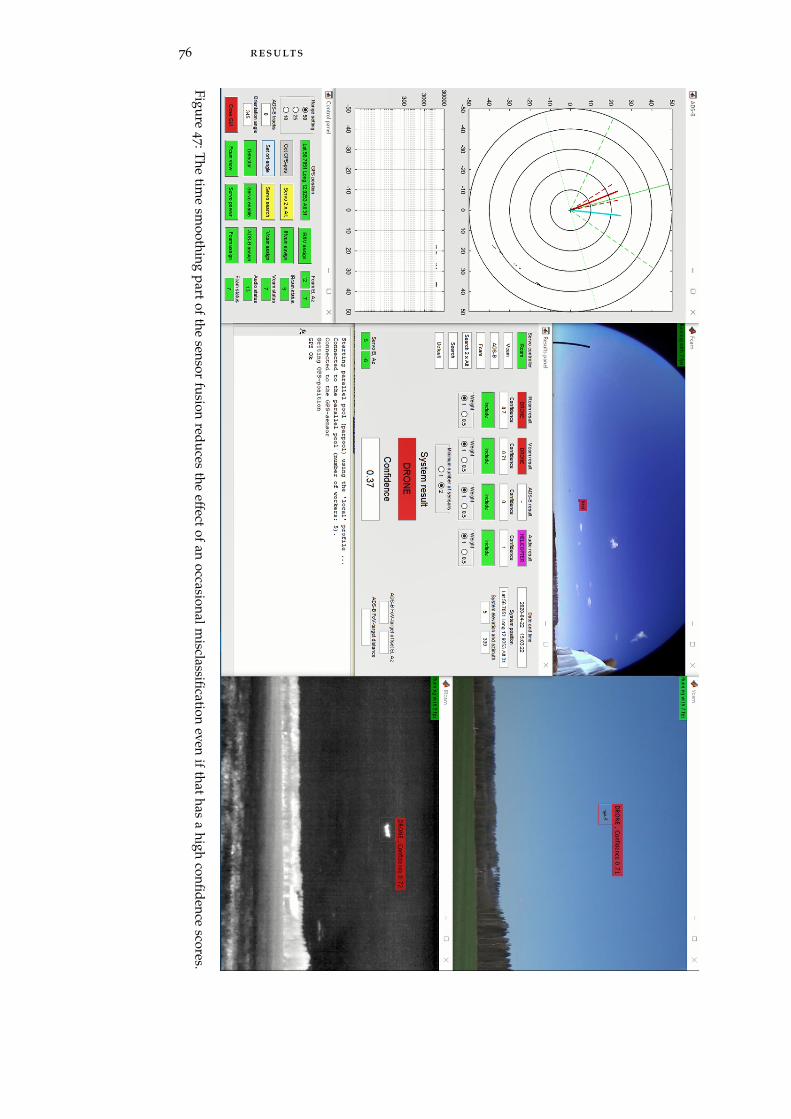
76 results
Figure4
7:The
time
smoothing
partof
thesensor
fusionreduces
theeffect
ofan
occasionalmisclassification
evenif
thathas
ahigh
confidencescores.
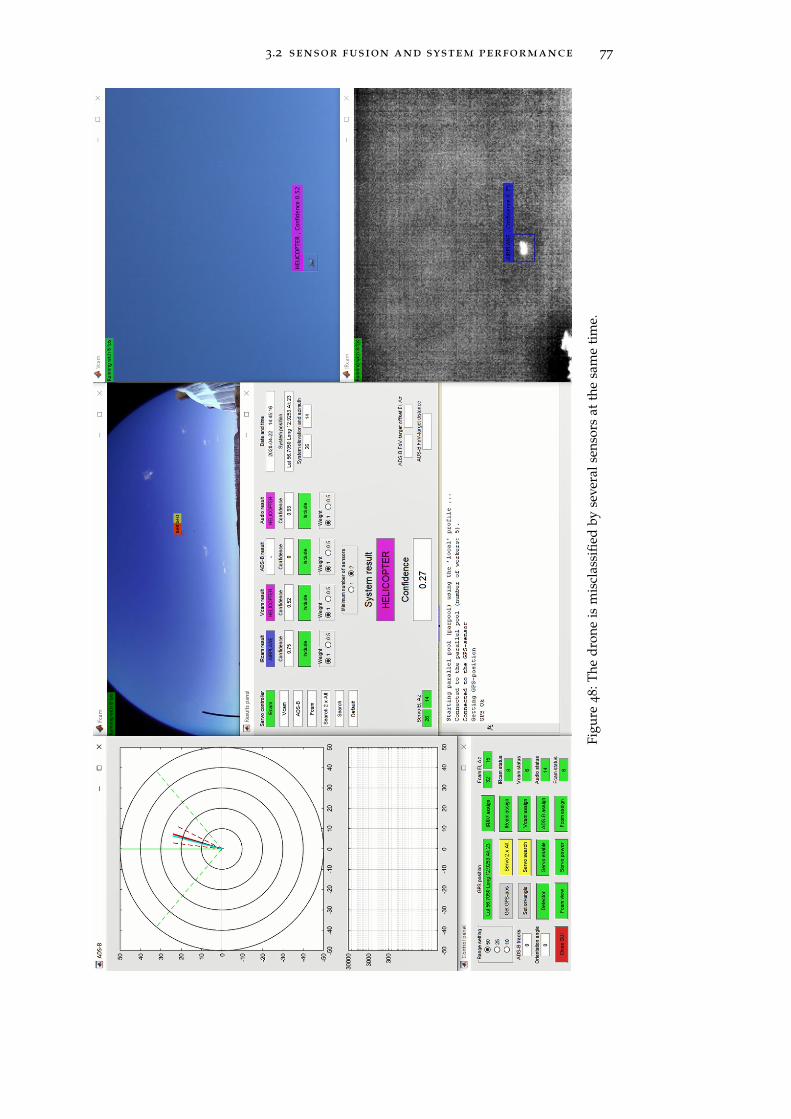
3.2 sensor fusion and system performance 77
Figu
re4
8:T
hedr
one
ism
iscl
assi
fied
byse
vera
lsen
sors
atth
esa
me
tim
e.

78 results
Figure4
9:When
theairplane
isw
ithin3
00
00
mhorizontaldistance
theA
DS-B
information
ispresented
inthe
resultspanel.
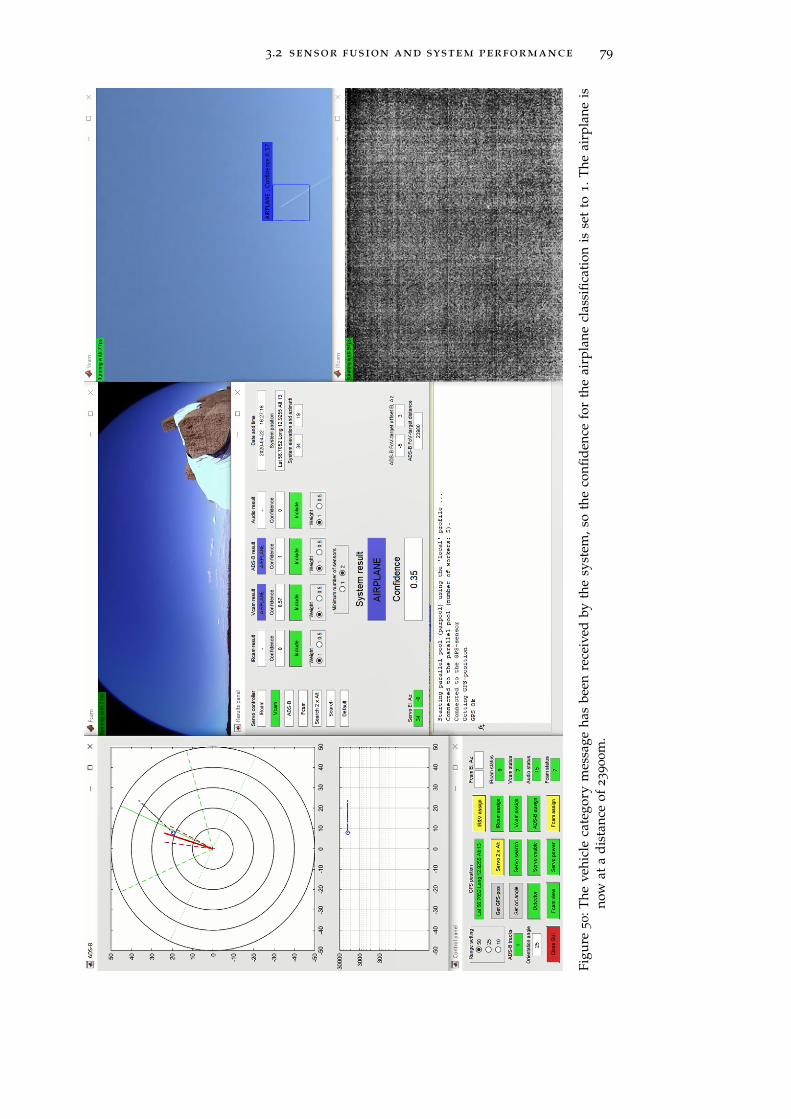
3.2 sensor fusion and system performance 79
Figu
re5
0:T
heve
hicl
eca
tego
rym
essa
geha
sbe
enre
ceiv
edby
the
syst
em,s
oth
eco
nfide
nce
for
the
airp
lane
clas
sific
atio
nis
set
to1
.The
airp
lane
isno
wat
adi
stan
ceof
23
90
0m
.

80 results
Figure5
1:Theairplane
isdetected
bythe
IRcam
worker
ata
distanceof
20
80
0m
.
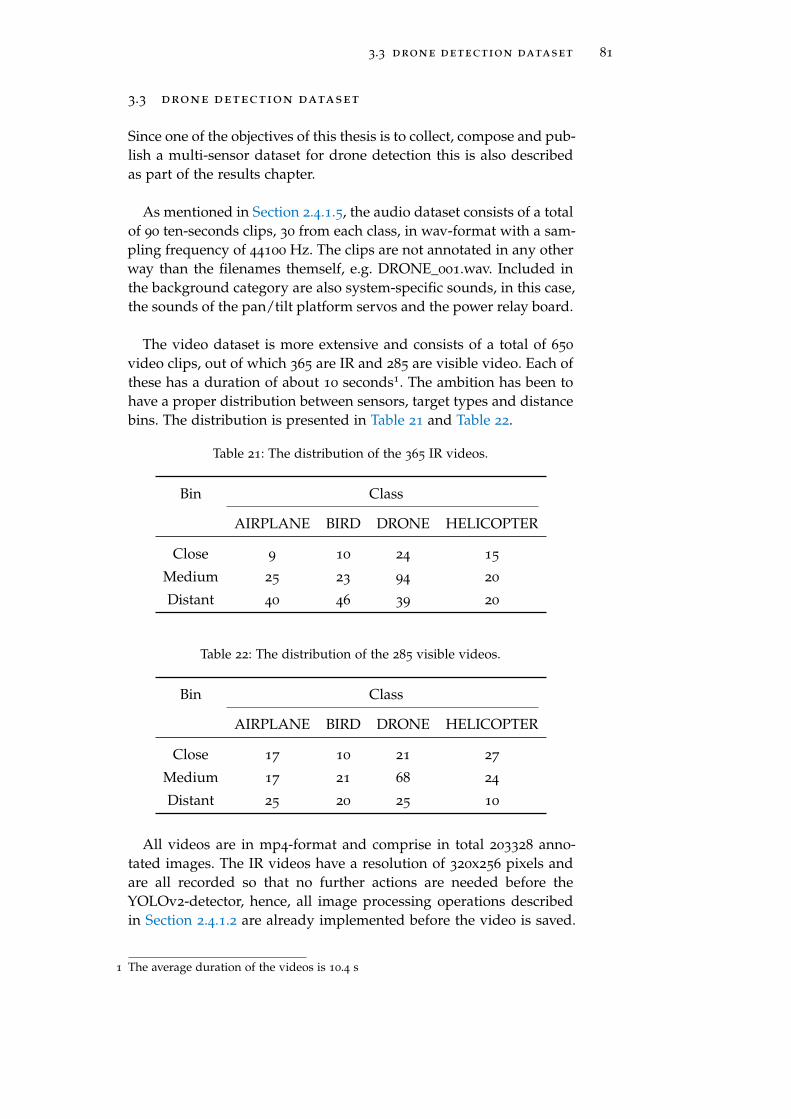
3.3 drone detection dataset 81
3.3 drone detection dataset
Since one of the objectives of this thesis is to collect, compose and pub-lish a multi-sensor dataset for drone detection this is also describedas part of the results chapter.
As mentioned in Section 2.4.1.5, the audio dataset consists of a totalof 90 ten-seconds clips, 30 from each class, in wav-format with a sam-pling frequency of 44100 Hz. The clips are not annotated in any otherway than the filenames themself, e.g. DRONE_001.wav. Included inthe background category are also system-specific sounds, in this case,the sounds of the pan/tilt platform servos and the power relay board.
The video dataset is more extensive and consists of a total of 650
video clips, out of which 365 are IR and 285 are visible video. Each ofthese has a duration of about 10 seconds1. The ambition has been tohave a proper distribution between sensors, target types and distancebins. The distribution is presented in Table 21 and Table 22.
Table 21: The distribution of the 365 IR videos.
Bin Class
AIRPLANE BIRD DRONE HELICOPTER
Close 9 10 24 15
Medium 25 23 94 20
Distant 40 46 39 20
Table 22: The distribution of the 285 visible videos.
Bin Class
AIRPLANE BIRD DRONE HELICOPTER
Close 17 10 21 27
Medium 17 21 68 24
Distant 25 20 25 10
All videos are in mp4-format and comprise in total 203328 anno-tated images. The IR videos have a resolution of 320x256 pixels andare all recorded so that no further actions are needed before theYOLOv2-detector, hence, all image processing operations describedin Section 2.4.1.2 are already implemented before the video is saved.
1 The average duration of the videos is 10.4 s
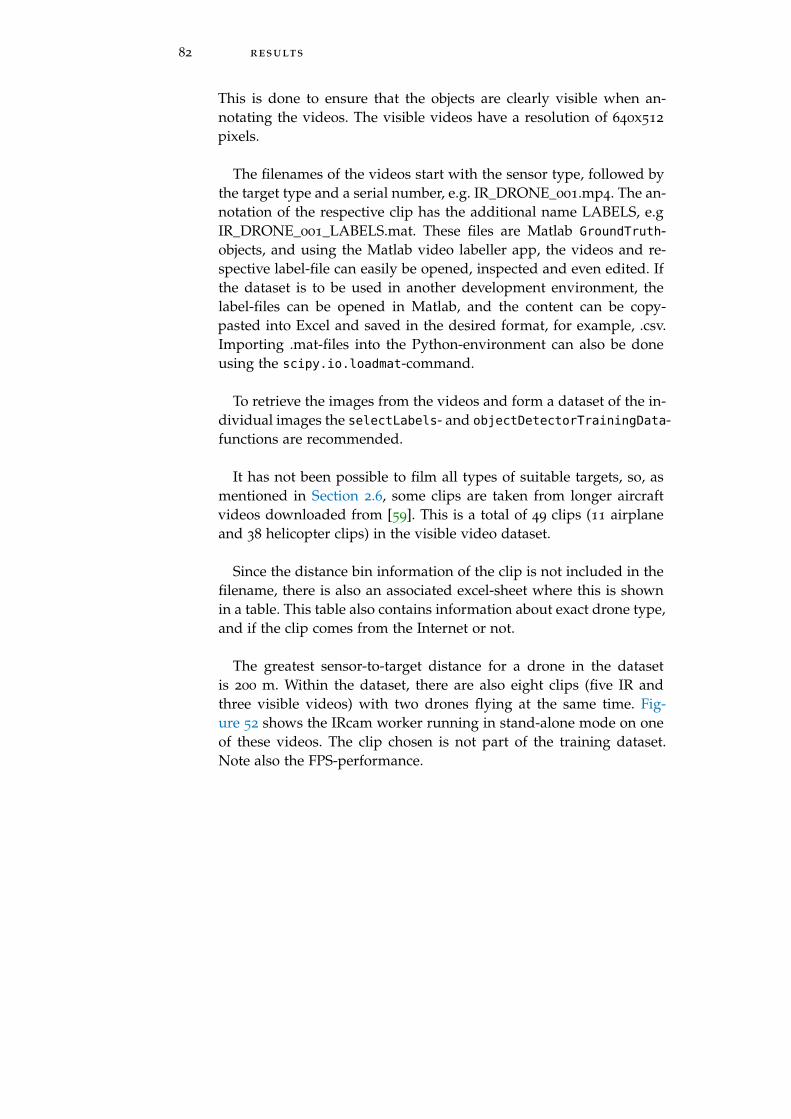
82 results
This is done to ensure that the objects are clearly visible when an-notating the videos. The visible videos have a resolution of 640x512
pixels.
The filenames of the videos start with the sensor type, followed bythe target type and a serial number, e.g. IR_DRONE_001.mp4. The an-notation of the respective clip has the additional name LABELS, e.gIR_DRONE_001_LABELS.mat. These files are Matlab GroundTruth-objects, and using the Matlab video labeller app, the videos and re-spective label-file can easily be opened, inspected and even edited. Ifthe dataset is to be used in another development environment, thelabel-files can be opened in Matlab, and the content can be copy-pasted into Excel and saved in the desired format, for example, .csv.Importing .mat-files into the Python-environment can also be doneusing the scipy.io.loadmat-command.
To retrieve the images from the videos and form a dataset of the in-dividual images the selectLabels- and objectDetectorTrainingData-functions are recommended.
It has not been possible to film all types of suitable targets, so, asmentioned in Section 2.6, some clips are taken from longer aircraftvideos downloaded from [59]. This is a total of 49 clips (11 airplaneand 38 helicopter clips) in the visible video dataset.
Since the distance bin information of the clip is not included in thefilename, there is also an associated excel-sheet where this is shownin a table. This table also contains information about exact drone type,and if the clip comes from the Internet or not.
The greatest sensor-to-target distance for a drone in the datasetis 200 m. Within the dataset, there are also eight clips (five IR andthree visible videos) with two drones flying at the same time. Fig-ure 52 shows the IRcam worker running in stand-alone mode on oneof these videos. The clip chosen is not part of the training dataset.Note also the FPS-performance.
3.3 drone detection dataset 83
Figure 52: Two drones detected and classified correctly by the IRcamworker.

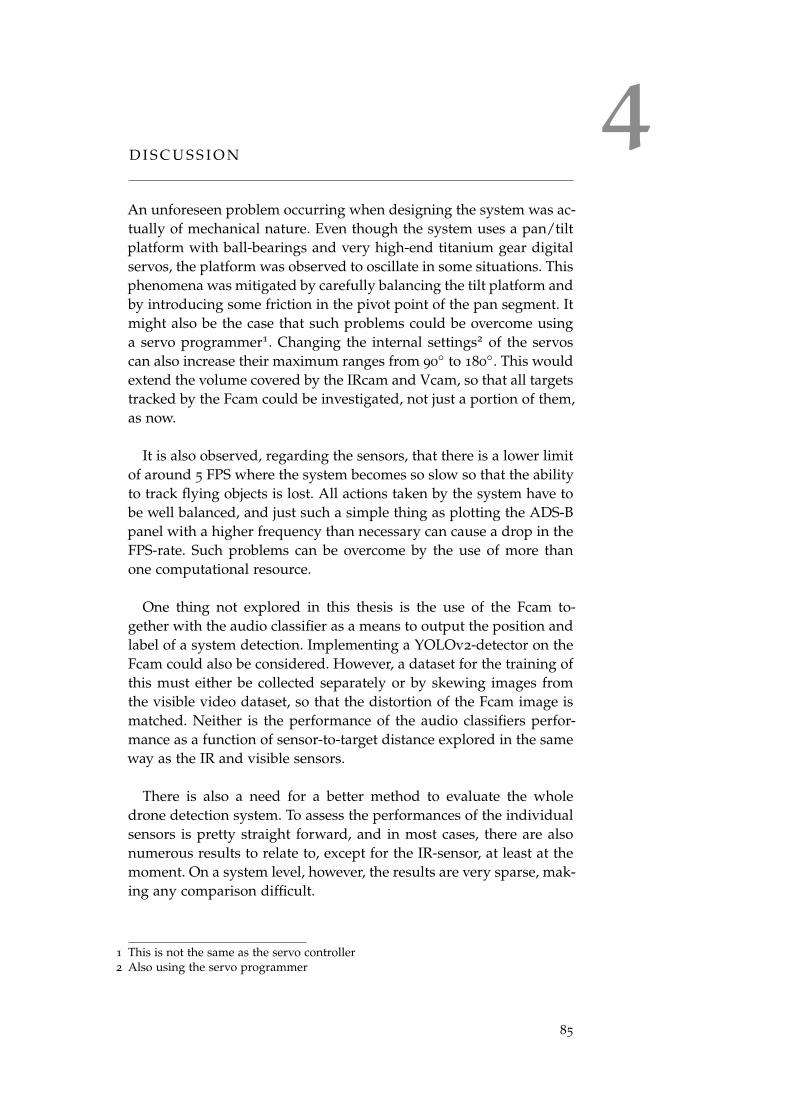
4D I S C U S S I O N
An unforeseen problem occurring when designing the system was ac-tually of mechanical nature. Even though the system uses a pan/tiltplatform with ball-bearings and very high-end titanium gear digitalservos, the platform was observed to oscillate in some situations. Thisphenomena was mitigated by carefully balancing the tilt platform andby introducing some friction in the pivot point of the pan segment. Itmight also be the case that such problems could be overcome usinga servo programmer1. Changing the internal settings2 of the servoscan also increase their maximum ranges from 90
◦ to 180◦. This would
extend the volume covered by the IRcam and Vcam, so that all targetstracked by the Fcam could be investigated, not just a portion of them,as now.
It is also observed, regarding the sensors, that there is a lower limitof around 5 FPS where the system becomes so slow so that the abilityto track flying objects is lost. All actions taken by the system have tobe well balanced, and just such a simple thing as plotting the ADS-Bpanel with a higher frequency than necessary can cause a drop in theFPS-rate. Such problems can be overcome by the use of more thanone computational resource.
One thing not explored in this thesis is the use of the Fcam to-gether with the audio classifier as a means to output the position andlabel of a system detection. Implementing a YOLOv2-detector on theFcam could also be considered. However, a dataset for the training ofthis must either be collected separately or by skewing images fromthe visible video dataset, so that the distortion of the Fcam image ismatched. Neither is the performance of the audio classifiers perfor-mance as a function of sensor-to-target distance explored in the sameway as the IR and visible sensors.
There is also a need for a better method to evaluate the wholedrone detection system. To assess the performances of the individualsensors is pretty straight forward, and in most cases, there are alsonumerous results to relate to, except for the IR-sensor, at least at themoment. On a system level, however, the results are very sparse, mak-ing any comparison difficult.
1 This is not the same as the servo controller2 Also using the servo programmer
85
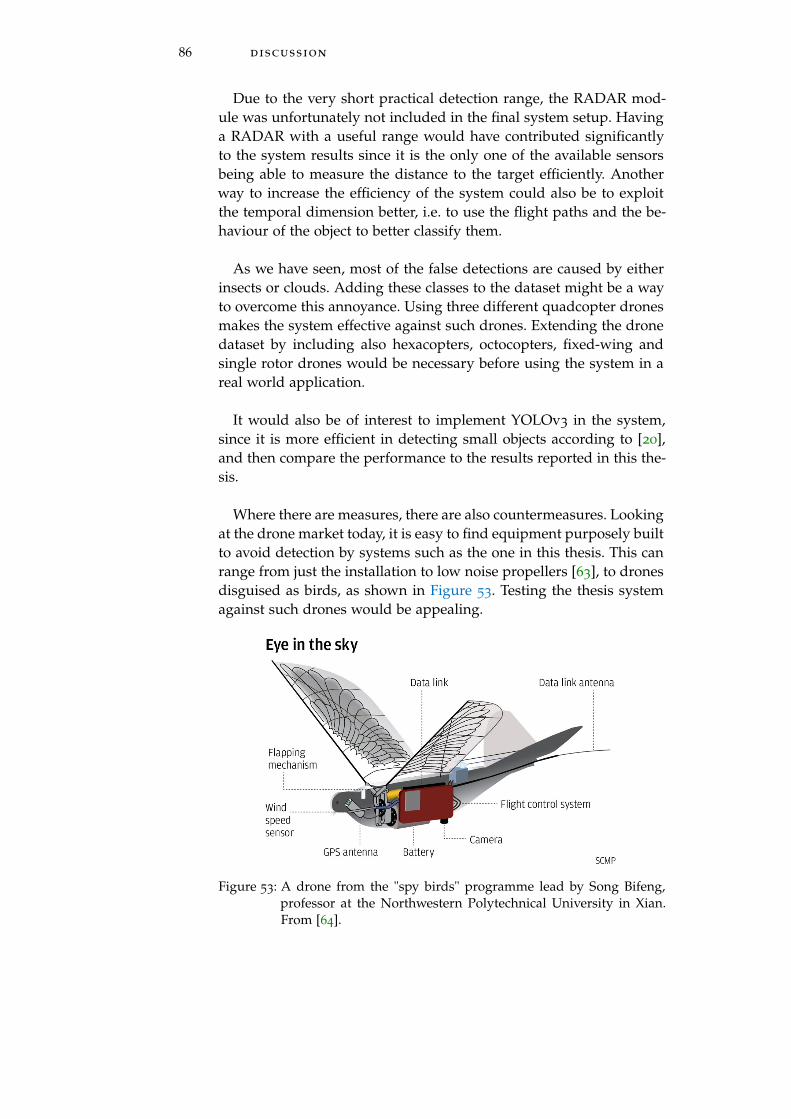
86 discussion
Due to the very short practical detection range, the RADAR mod-ule was unfortunately not included in the final system setup. Havinga RADAR with a useful range would have contributed significantlyto the system results since it is the only one of the available sensorsbeing able to measure the distance to the target efficiently. Anotherway to increase the efficiency of the system could also be to exploitthe temporal dimension better, i.e. to use the flight paths and the be-haviour of the object to better classify them.
As we have seen, most of the false detections are caused by eitherinsects or clouds. Adding these classes to the dataset might be a wayto overcome this annoyance. Using three different quadcopter dronesmakes the system effective against such drones. Extending the dronedataset by including also hexacopters, octocopters, fixed-wing andsingle rotor drones would be necessary before using the system in areal world application.
It would also be of interest to implement YOLOv3 in the system,since it is more efficient in detecting small objects according to [20],and then compare the performance to the results reported in this the-sis.
Where there are measures, there are also countermeasures. Lookingat the drone market today, it is easy to find equipment purposely builtto avoid detection by systems such as the one in this thesis. This canrange from just the installation to low noise propellers [63], to dronesdisguised as birds, as shown in Figure 53. Testing the thesis systemagainst such drones would be appealing.
Figure 53: A drone from the "spy birds" programme lead by Song Bifeng,professor at the Northwestern Polytechnical University in Xian.From [64].
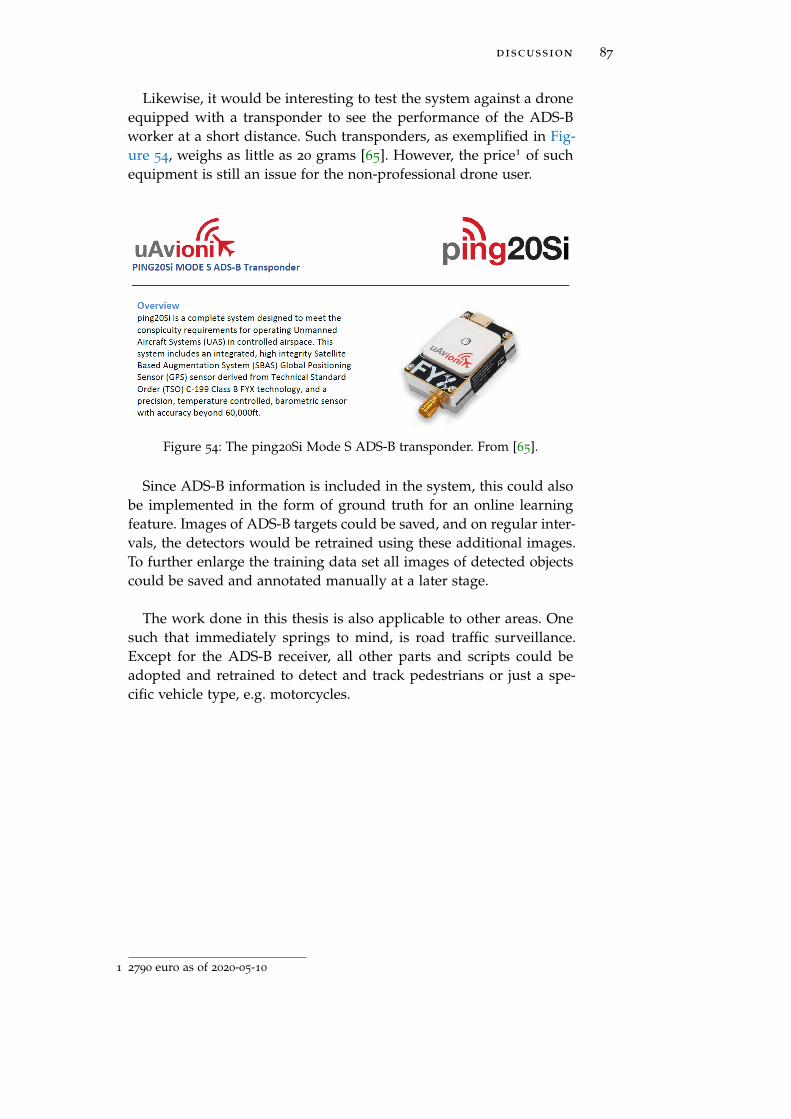
discussion 87
Likewise, it would be interesting to test the system against a droneequipped with a transponder to see the performance of the ADS-Bworker at a short distance. Such transponders, as exemplified in Fig-ure 54, weighs as little as 20 grams [65]. However, the price1 of suchequipment is still an issue for the non-professional drone user.
Figure 54: The ping20Si Mode S ADS-B transponder. From [65].
Since ADS-B information is included in the system, this could alsobe implemented in the form of ground truth for an online learningfeature. Images of ADS-B targets could be saved, and on regular inter-vals, the detectors would be retrained using these additional images.To further enlarge the training data set all images of detected objectscould be saved and annotated manually at a later stage.
The work done in this thesis is also applicable to other areas. Onesuch that immediately springs to mind, is road traffic surveillance.Except for the ADS-B receiver, all other parts and scripts could beadopted and retrained to detect and track pedestrians or just a spe-cific vehicle type, e.g. motorcycles.
1 2790 euro as of 2020-05-10


5C O N C L U S I O N S
The increased use of drones and the raising concerns of safety andsecurity issues following from this highlights the need for efficientand robust drone detection systems.
This thesis explores the possibilities to design and build a multi-sensor drone detection system utilizing state-of-the-art machine learn-ing techniques, and sensor fusion. The performance of the individualsensors are evaluated in terms of F1-score and mean average preci-sion (mAP).
The results confirm that general machine learning techniques canbe applied to input data from infrared sensors making them wellsuited for the drone detection task. The infrared detector achieves anF1-score of 0.7601, showing similar performance as the visible videodetector with an F1-score of 0.7849. The audio classifier achieves anF1-score of 0.9323.
Besides the analysis of the feasibility of an infrared sensor, thisthesis expands the number of target classes utilized in the detectorscompared to the related papers. The thesis also comprise a novel in-vestigation of the detection performance as a function of sensor-to-target distance, with a distance bin division derived from the Detect,Recognize and Identify (DRI) requirements based on the Johnson cri-teria.
The proposed sensor fusion makes the detection and classificationmore robust than that of any of the sensors individually. It also showsthe efficiency of sensor fusion as a means to mitigate false detections.To the author’s knowledge, the system is also the first to explore thebenefits of including ADS-B data to better separate targets prone tobe mistaken for drones.
Due to the lack of a publicly available dataset, the other main con-cern of this thesis was to contribute with such a multi-sensor dataset.This dataset is especially suited for the comparison of infrared andvisible video detectors due to the similarities in conditions and targettypes in the set.
The dataset is made up of 650 video clips containing a total of203328 annotated images, and has four target classes: Drones, birds,
89
90 conclusions
airplanes and helicopters. Furthermore, the dataset has a distance bindivision, making it possible to explore the sensor-to-target distanceperformance of the detector. There is also an audio dataset with 900
seconds of acoustic data from drones, helicopters and backgrounds.
Further research could be to implement a distance estimation func-tion based on the output from the detectors. Such research could alsoinclude the investigation of distributed sensors and to further makeuse of the temporal dimension to separate drones form other targetsbased on the behaviour over time as they are tracked by the system.
This thesis also discloses the need for a benchmark or standardwhen it comes to the evaluation of machine learning and sensor fu-sion applications on a system level.
The drone detection dataset is available at:https://github.com/DroneDetectionThesis/Drone-detection-dataset
The author of this thesis can be contacted at:[email protected]
B I B L I O G R A P H Y
[1] J. Sanfridsson et al. Drone delivery of an automated externaldefibrillator – a mixed method simulation study of bystander ex-perience. Scandinavian Journal of Trauma, Resuscitation and Emer-gency Medicine, 27, 2019.
[2] M. Innocente and P. Grasso. Self-organising swarms of firefight-ing drones: Harnessing the power of collective intelligence in de-centralised multi-robot systems. Journal of Computational Science,34:80–101, 2019.
[3] The World Air Sports Federation FAI. World droneracing championship. https://www.fai.org/world-cups/
drone-racing-2020, April 2020.
[4] Aviation International News. What happens when a drone hitsan airplane wing? About the University of Dayton research in-stitute. https://www.youtube.com/watch?v=QH0V7kp-xg0, April2020.
[5] B. Taha and A. Shoufan. Machine learning-based drone detec-tion and classification: State-of-the-art in research. IEEE Access,7:138669–138682, 2019.
[6] Google Trends. https://trends.google.com/trends/explore?
date=all&q=dronedetection, April 2020.
[7] S. Samaras et al. Deep learning on multi sensor data for counterUAV applications — a systematic review. Sensors, 19(4837), 2019.
[8] S. Boddhu et al. A collaborative smartphone sensing platform fordetecting and tracking hostile drones. Proceedings Volume 8742,Ground/Air Multisensor Interoperability, Integration, and Networkingfor Persistent ISR IV, 2013.
[9] Guard From Above BV. https://guardfromabove.com/, Febru-ary 2020.
[10] I. Güvenc et al. Detection, tracking, and interdiction for amateurdrones. IEEE Communications magazine, 56:75–81, 2018.
[11] P. Andrasi et al. Night-time detection of UAVs using thermal in-frared camera. Transportation Research Procedia, 28:183–190, 2017.
[12] Y. Wang et al. Towards visible and thermal drone monitoringwith convolutional neural networks. APSIPA Transactions on Sig-nal and Information Processing, 8, 2017.
91
92 bibliography
[13] M. Wu et al. Real-time drone detection using deep learning ap-proach. Machine Learning and Intelligent Communications. MLI-COM 2018. Lecture Notes of the Institute for Computer Sciences,Social Informatics and Telecommunications Engineering, 251:22–32,2018.
[14] D. Tzovaras et al. Multimodal deep learning framework for en-hanced accuracy of UAV detection. LNCS, 11754:768–777, 2019.
[15] J. Park et al. A comparison of convolutional object detectorsfor real-time drone tracking using a PTZ camera. 17th Interna-tional Conference on Control, Automation and Systems (ICCAS 2017),pages 696–699, 2017.
[16] J. Redmon and A. Farhandi. YOLO9000: Better, faster, stronger.IEEE Conference on Computer Vision and Pattern Recognition(CVPR), 2017.
[17] H. Liu et al. A drone detection with aircraft classification basedon a camera array. IOP Conference Series: Materials Science andEngineering, 322(052005), 2018.
[18] M. Saqib et al. A study on detecting drones using deep convo-lutional neural networks. 14th IEEE International Conference onAdvanced Video and Signal Based Surveillance (AVSS), 2017.
[19] C. Aker and S. Kalkan. Using deep networks for drone detection.14th IEEE International Conference on Advanced Video and SignalBased Surveillance (AVSS), 2017.
[20] E. Unlu et al. Deep learning-based strategies for the detectionand tracking of drones using several cameras. IPSJ Transactionson Computer Vision and Applications volume, 11, 2019.
[21] J. Kim et al. Real-time UAV sound detection and analysis system.IEEE Sensors Applications Symposium (SAS), 2017.
[22] N. Siriphun et al. Distinguishing drone types based on acous-tic wave by IoT device. 22nd International Computer Science andEngineering Conference (ICSEC), 2018.
[23] S. Park et al. Combination of radar and audio sensors for iden-tification of rotor-type unmanned aerial vehicles (UAVs). IEEESENSORS, 2015.
[24] M. Anwar et al. Machine learning inspired sound-based amateurdrone detection for public safety applications. IEEE Transactionson Vehicular Technology, 68:2526–2534, 2019.
[25] H. Liu et al. Drone detection based on an audio-assisted cameraarray. IEEE Third International Conference on Multimedia Big Data(BigMM), 2017.
bibliography 93
[26] S. Jeon et al. Empirical study of drone sound detection in real-lifeenvironment with deep neural networks. 25th European SignalProcessing Conference (EUSIPCO), 2017.
[27] A. Bernardini et al. Drone detection by acoustic signature iden-tification. Electronic Imaging: Imaging and Multimedia Analytics ina Web and Mobile World, pages 60–64, 2017.
[28] J. Busset et al. Detection and tracking of drones using advancedacoustic cameras. Proc. SPIE 9647, Unmanned/Unattended Sensorsand Sensor Networks XI; and Advanced Free-Space Optical Communi-cation Techniques and Applications, 2015.
[29] J. Patel et al. Review of radar classification and RCS characterisa-tion techniques for small UAVs or drones. IET Radar, Sonar andNavigation, 12:911–919, 2018.
[30] A. Herschfelt et al. Consumer-grade drone radar cross-sectionand micro-doppler phenomenology. IEEE Radar Conference(RadarConf), 2017.
[31] J. Gong et al. Interference of radar detection of drones by birds.Progress In Electromagnetics Research M, 81:1–11, 2019.
[32] L. Fuhrmann et al. Micro-doppler analysis and classification ofUAVs at Ka band. 18th International Radar Symposium (IRS), 2017.
[33] S Björklund. Target detection and classification of small dronesby boosting on radar micro-doppler. 15th European Radar Confer-ence (EuRAD), 2018.
[34] J. Drozdowicz et al. 35 GHz FMCW drone detection system. 17thInternational Radar Symposium (IRS), 2016.
[35] S. Rahman and D. Robertson. Radar micro-doppler signaturesof drones and birds at K-band and W-band. Scientific Reports, 8,2018.
[36] S. Birnbach et al. Wi-fly?: Detecting privacy invasion attacks byconsumer drones. NDSS Symposium, 2017.
[37] A. Shorten et al. Localisation of drone controllers from RF sig-nals using a deep learning approach. Proceedings of the Interna-tional Conference on Pattern Recognition and Artificial Intelligence,pages 89–97, 2018.
[38] M. Ezuma et al. Detection and classification of UAVs using RFfingerprints in the presence of interference. IEEE Open Journal ofthe Communications Society, 1:60–76, 2019.
[39] B. Kim et al. V-RBNN based small drone detection in augmenteddatasets for 3D LADAR system. Sensors, 18(11), 2018.
94 bibliography
[40] X. Shi et al. Anti-drone system with multiple surveillance tech-nologies: architecture, implementation, and challenges. IEEECommunications Magazine, pages 69–74, April 2018.
[41] C. Reiser. Github page. https://github.com/creiser/
drone-detection, January 2020.
[42] SafeShore consortium. http://safeshore.eu/dataset/, January2020.
[43] A. Schumann et al. Deep cross-domain flying object classifica-tion for robust uav detection. 14th IEEE International Conferenceon Advanced Video and Signal Based Surveillance (AVSS), 68, 2017.
[44] A. Coluccia et al. Drone-vs-bird detection challenge at IEEEAVSS2019. 16th IEEE International Conference on Advanced Videoand Signal Based Surveillance (AVSS), 2019.
[45] S. Hochreiter and J. Schmidhuber. Long Short-Term Memory.Neural Computations, 9(8):1735–1780, 1997.
[46] W. Grimson and C. Stauffer. Adaptive background mixture mod-els for real-time tracking. IEEE Computer Society Conference onComputer Vision and Pattern Recognition, 1:2246–2252, 1999.
[47] RFbeam Microwave GmbH. Datasheet of K-MD2.https://www.rfbeam.ch/files/products/21/downloads/
Datasheet_K-MD2.pdf, November 2019.
[48] M. Mostafa et al. Radar and visual odometry integrated systemaided navigation for uavs in gnss denied environment. Sensors,18(9), 2018.
[49] J. Redmon et al. You Only Look Once unified, real-time objectdetection. IEEE Conference on Computer Vision and Pattern Recog-nition (CVPR), 2016.
[50] MathWorks. https://se.mathworks.com/help/vision/
examples/create-yolo-v2-object-detection-network.html,October 2019.
[51] MathWorks. https://se.mathworks.com/help/vision/
examples/motion-based-multiple-object-tracking.html,October 2019.
[52] MathWorks. https://se.mathworks.com/help/audio/
examples/classify-gender-using-long-short-term-memory-networks.
html, October 2019.
[53] M. Robb. Github page. https://github.com/MalcolmRobb/
dump1090, December 2019.
bibliography 95
[54] Flightradar24. https://www.flightradar24.com, April 2020.
[55] Everdrone AB. https://www.everdrone.com/, April 2020.
[56] YouTube channel "Jake’s wings". https://www.youtube.com/
watch?v=XoQ79hcZrb8, April 2020.
[57] Pololu. Maestro servo controller, Windows drivers and soft-ware (release 130422). https://www.pololu.com/product/1352/
resources, November 2019.
[58] TSFS 2017:110 Transportstyrelsens föreskrifter om obemannadeluftfartyg. 2017.
[59] YouTube channel "VIRTUAL AIRFIELD operated bySK678387". https://www.youtube.com/channel/
UCx-PY5Q1Z5sJOQ9e8wvwvWQ, January 2020.
[60] Infiniteoptics. Whitepaper on thermal DRI. https://www.
infinitioptics.com/sites/default/files/attachments/
Infiniti%20DRI%20Whitepaper.pdf, April 2020.
[61] P. Chevalier. On the specification of the DRI requirements for astandard NATO target. Researchgate publication, 2016.
[62] C. Craye and S. Ardjoune. Spatio-temporal semantic segmenta-tion for drone detection. 16th IEEE International Conference onAdvanced Video and Signal Based Surveillance (AVSS), 2019.
[63] Master Airscrew from the Windsor PropellerLLC. https://www.masterairscrew.com/products/
dji-mavic-air-stealth-upgrade-propellers-x4-black, May2020.
[64] South China Morning Post. https://www.
scmp.com/news/china/society/article/2152027/
china-takes-surveillance-new-heights-flock-robotic-doves-do-they,May 2020.
[65] uAvioni. Datasheet of ping20Si. https://uavionix.com/
downloads/ping20s/Ping20Si-DataSheet.pdf, May 2020.