structural weakening of the merapi dome identified by drone
TRANSCRIPT

Nat. Hazards Earth Syst. Sci., 18, 3267–3281, 2018https://doi.org/10.5194/nhess-18-3267-2018© Author(s) 2018. This work is distributed underthe Creative Commons Attribution 4.0 License.
Structural weakening of the Merapi dome identified by dronephotogrammetry after the 2010 eruptionHerlan Darmawan1,2, Thomas R. Walter1, Valentin R. Troll3,4, and Agus Budi-Santoso5
1Dept. Physics of Earth, GFZ German Research Center for Geosciences, Telegrafenberg, 14473, Potsdam, Germany2Laboratory of Geophysics, Department of Physics, Faculty of Mathematics and Natural Sciences,Universitas Gadjah Mada, Yogyakarta 55281, Indonesia3Dept. of Earth Science, Section for Mineralogy, Petrology and Tectonics, Uppsala University,Villavägen 16, 752 36 Uppsala, Sweden4Faculty of Geological Engineering, Universitas Padjajaran, Jatinangor 45363, Bandung, Indonesia5BPPTKG (Balai Penyelidikan dan Pengembangan Teknologi Kebencanaan Geologi),Jalan Cendana 15, Yogyakarta 55166, Indonesia
Correspondence: Herlan Darmawan ([email protected])
Received: 26 April 2018 – Discussion started: 7 May 2018Revised: 22 October 2018 – Accepted: 7 November 2018 – Published: 12 December 2018
Abstract. Lava domes are subjected to structural weaken-ing that can lead to gravitational collapse and produce pyro-clastic flows that may travel up to several kilometers from avolcano’s summit. At Merapi volcano, Indonesia, pyroclasticflows are a major hazard, frequently causing high numbers ofcasualties. After the Volcanic Explosivity Index 4 eruption in2010, a new lava dome developed on Merapi volcano andwas structurally destabilized by six steam-driven explosionsbetween 2012 and 2014. Previous studies revealed that theexplosions produced elongated open fissures and a delineatedblock in the southern dome sector. Here, we investigatedthe geomorphology, structures, thermal fingerprint, alterationmapping and hazard potential of the Merapi lava dome by us-ing drone-based geomorphologic data and forward-lookingthermal infrared images. The block on the southern dome ofMerapi is delineated by a horseshoe-shaped structure with amaximum depth of 8 m and it is located on the unbuttressedsouthern steep flank. We identify intense thermal, fumaroleand hydrothermal alteration activities along this horseshoe-shaped structure. We conjecture that hydrothermal alterationmay weaken the horseshoe-shaped structure, which then maydevelop into a failure plane that can lead to gravitational col-lapse. To test this instability hypothesis, we calculated thefactor of safety and ran a numerical model of block-and-ashflow using Titan2D. Results of the factor of safety analysisconfirm that intense rainfall events may reduce the internal
friction and thus gradually destabilize the dome. The titan2Dmodel suggests that a hypothetical gravitational collapse ofthe delineated unstable dome sector may travel southwardfor up to 4 km. This study highlights the relevance of grad-ual structural weakening of lava domes, which can influencethe development fumaroles and hydrothermal alteration ac-tivities of cooling lava domes for years after initial emplace-ment.
1 Introduction
Lava domes are viscous lava extrusions that accumulate atvolcanic vents and experience exogenous and endogenousgrowth (Hale, 2008). During formation of lava domes, theymay start lateral flow as coulees, be subject to cooling andsubsidence and can develop concentric fractures on the flat-topped summit of the dome (Walter et al., 2013b; Salzer etal., 2017; Rhodes et al., 2018). Many details of the develop-ment, geometric organization and actual formation processesof dome structures remain poorly understood. External fac-tors such as intense rainfall, hydrothermal alteration, gasoverpressure, mechanical weakening and earthquakes mayfurther augment instability and promote a dome collapse(Voight and Elsworth, 2000; Reid et al., 2001; Ball et al.,2015). Once fracture arrangements are established in a lava
Published by Copernicus Publications on behalf of the European Geosciences Union.
3268 H. Darmawan et al.: Structural weakening of the Merapi dome identified by drone photogrammetry
dome, volcanic gas and rainwater are able to flow that maycause hydrothermal alteration and gas overpressure along thestructure, which may lead to dome destruction even duringquiescent periods (Voight and Elsworth, 2000; Reid et al.,2001; Elsworth et al., 2004; Simmons et al., 2004; Taron etal., 2007; Ball et al., 2015). Structural weakening and thusinstability of a lava dome due to these processes may thencause hazardous rock falls or block-and-ash flows (Calder etal., 2015).
The dome collapse at Soufrière Hills Volcano (SHV),Montserrat in 1998–1999, is an example of rain-triggeredcollapse that followed a period of quiescence. The SHVdome collapse produced pyroclastic density currents (PDC)with a volume of 22× 106 m3 that traveled up to ∼ 3 kmfrom the summit (Norton et al., 2002; Elsworth et al., 2004).The rainwater infiltrated through identified fractures, pro-duced gas overpressure within the lava dome carapace, andthen triggered dome collapses that were characterized by hy-drothermal alteration and structural instability (Voight, 2000;Elsworth et al., 2004). This event demonstrates that identi-fying a structural weakening is crucial for volcanic hazardmitigation.
However, identifying the potential hazard of lava domesis often difficult and requires high-quality observationaldatasets complemented by modeling analyses (Voight, 2000).Dome building volcanoes are often steep sided hazardousedifices, where direct access is very limited and acquisitionof high-quality field data is challenging. In contrast, remotesensing techniques, such as satellite imageries, aerial pho-togrammetric and thermal imaging can provide detailed in-formation on the structure, deformation, geomorphology andthermal signature of active lava domes (James and Varley,2012; Walter et al., 2013a; Salzer et al., 2014; Thiele et al.,2017; Darmawan et al., 2018), which allows the study of im-portant parameters for assessment of dome instability and po-tential hazards (Voight and Elsworth, 2000; Elsworth et al.,2004; Simmons et al., 2004; Taron et al., 2007). In this re-spect, the degree of instability of lava domes can be assessedby using a factor of safety equation (Voight and Elsworth,2000; Simmons et al., 2004; Taron et al., 2007). Factor ofsafety (FS) is widely used to calculate slope stability (Bishop,1955) and it is calculated by dividing resisting forces to driv-ing forces that act on a failure plane (α; Voight, 2000). Aresult of FS≤ 1 indicates a failure condition. However, in alava dome some additional forces may act on a failure planedue to, e.g., degassing and rainfall activities (Simmons et al.,2004). Here, we test the first factor of safety model at theMerapi lava dome to assess its stability under rainfall condi-tions.
In a case of structural dome instability, the hazard arisingfrom dome collapses can be simulated by geophysical massflow software, such as Titan2D (Patra et al., 2005; Sheri-dan et al., 2005). Titan2D is a software to model 2-D geo-physical mass flow based on a depth averaged model for anincompressible continuum granular flow and was validated
through laboratory experiments (Patra et al., 2005). It is pub-licly available and has been used to map dynamics and dis-tribution of block-and-ash flows at Merapi during the 2006and 2010 eruptions (Charbonnier and Gertisser, 2009, 2012;Charbonnier et al., 2013).
In this study, we employed drone photogrammetry andterrestrial laser scanning (TLS), thermal mapping, factor ofsafety calculation and Titan2D simulation to assess struc-tural instability and hazards potential of the current Merapilava dome. Combination of TLS and drone photogrammetryis able to generate a high-resolution digital elevation model(DEM) of the Merapi summit, which compares favorably tothe satellite-based DEM. For the first time, we are now ableto generate a realistic model of the morphology and structureat the Merapi summit. Thermal mapping by using a forward-looking infrared (FLIR) camera also provides detailed loca-tions of hydrothermal fluid activity. The information of geo-morphology, structure and thermal activity allows us to ana-lyze the factor of safety, and to set up a forward simulation ofthe Titan2D model. The combined results help to better un-derstand the relevance of dome fracturing, structural weaken-ing and to outline the potential hazard zone affected in caseof a dome sector collapse.
1.1 Merapi volcano
Merapi volcano is a basaltic to andesitic volcano that formeddue to subduction of the Indo-Australian oceanic plate be-neath the Eurasian continental plate (Hamilton, 1979). Mer-api volcano is one of the most active and dangerous volca-noes in Indonesia, with more than 1 million people livingon the volcano’s flanks. Moreover, the city of Yogyakartawith 3 million inhabitants is located only ∼ 30 km from thevolcano’s summit (Fig. 1; Lavigne et al., 2015). The vol-canic activity of Merapi has been well documented since the1800s and its typical eruption style is dome extrusion andblock-and-ash flows (Voight et al., 2000). The extrusion rateof a lava dome at Merapi may strongly vary, ranging from∼ 0.04 m3 s−1 (Siswowidjoyo et al., 1995), up to 35 m3 s−1
or more during, e.g., the 2010 volcanic crisis (Pallister et al.,2013).
Merapi shows signs of interactions with surrounding envi-ronmental influences, and for instance rainfall appears to cor-relate with fumarole activity and seismic intensity (Richteret al., 2004), and tectonic earthquakes can influence eruptiveactivity (Walter et al., 2007, 2015; Carr et al., 2018). Thevolcano erupted several times during the last few decades,once every 3–5 years on average, with the largest explosiveevent recorded in 2010. The 2010 eruption removed parts ofthe summit area (Surono et al., 2012), excavated a ∼ 200 mdeep crater and was followed by re-growth of a new dome(Kubanek et al., 2015). The new lava dome was intermit-tently destroyed by several explosive events again between2012 and 2014, which also caused elongated open fissures(Fig. 1b, c; Walter et al., 2015), and a horseshoe-shaped
Nat. Hazards Earth Syst. Sci., 18, 3267–3281, 2018 www.nat-hazards-earth-syst-sci.net/18/3267/2018/

H. Darmawan et al.: Structural weakening of the Merapi dome identified by drone photogrammetry 3269
Figure 1. (a) Shaded relief of DEM from Gerstenecker et al. (2005) shows the morphology of Merapi volcano, the most active volcanoin Indonesia. Merapi is located ∼ 30 km from the densely populated city of Yogyakarta and therefore the activity of Merapi is intensivelymonitored by five observatories (blue dots). (b) TLS and drone photogrammetry field campaigns have been conducted in September 2014and October 2015, respectively, to investigate the detailed structure and morphology of the Merapi lava dome. Coordinates are in UniversalTransverse Mercator (UTM) meters. (c) The aerial image of the Merapi dome in 2014 shows the delineated unstable dome sector on thesouthern flank that is the focus of the present investigation.
structure that highly altered and delineated the southern partof the dome (Fig. 1c; Darmawan et al., 2018). The horseshoe-shaped structure is posing a safety risk due to weakeningfrom hydrothermal alteration and may possibly collapse inthe foreseeable future.
2 Data and methods
2.1 Observational data
We conducted TLS, drone photogrammetry and thermal in-frared field campaigns to investigate geomorphology, struc-ture, hydrothermal alteration and thermal distribution ofthe Merapi lava dome. The TLS data was acquired on
www.nat-hazards-earth-syst-sci.net/18/3267/2018/ Nat. Hazards Earth Syst. Sci., 18, 3267–3281, 2018

3270 H. Darmawan et al.: Structural weakening of the Merapi dome identified by drone photogrammetry
Figure 2. (a) Slope map of the Merapi summit shows that the Merapi flanks are steep, especially the crater which has a slope of ∼ 80◦.(b) Photomosaic of drone aerial images shows that the summit is highly fractured with 150◦ from N to E and highly altered. (c) Rockalteration occurs at the crater wall, the fissure at the dome, and the southern sector of the dome. A cross section of lines (d) r-s and (e) p-qshow that the crater has a maximum depth of 146 m at the northeast area. The current Merapi dome is located in the middle of the deep craterand shows a possible unstable sector as sketched in (e).
18 September 2014 by using a Riegl 6000 instrument fromthe eastern rim of the summit crater (7◦32′25.0161′′ S,110◦26′51.2110′′ E), looking down westward onto the dome.The TLS instrument was set by using a pulse repetition rate(PRR) of 30 kHz, an observation range of 0.129–4393.75 m,a theta range (vertical) of 73–120◦, a sampling angle of0.041◦ and a phi range (horizontal) of 33–233◦ with a sam-pling angle of 0.05◦. We used 12 local reflectors to correct ro-tation errors. The TLS instrument extracted a 3-D point cloudmodel of the Merapi summit with 2.8 million data points. Amajor benefit of the TLS methodology is the high-resolutionand precision in the field of view; however, shadowing effectsare significant.
In order to solve the shadow effects, we applied a struc-ture from motion (SfM) technique (Szeliski, 2011) to gen-erate a 3-D model based on 2-D drone images that were ac-quired on 6 October 2015. We used a DJI Phantom drone thatflew loops at a height of ∼ 140 m over the dome and took
nadir photographs with 2 s regular interval and 12 megapixelresolution. These photographs were processed by using ag-isoft photoscan professional software to generate a 3-D pointcloud model of the Merapi summit. We then combined the3-D point clouds of TLS and SfM data by using point pair-picking registration method in Cloud Compare software.More details about the data acquisition and the processing ofTLS and SfM data are described in Darmawan et al. (2017,2018). The combined 3-D TLS-SfM point cloud was interpo-lated in ArcMap to generate a digital elevation model (DEM)with a resolution of 0.5 m. The DEM was used for geomor-phological, topography and slope analysis.
To further investigate any changes related to structural in-stability, we conducted drone photogrammetry on 2 Septem-ber 2017 by using a DJI Mavic pro drone. The drone flew∼ 50 m above the dome, carried a camera with a resolutionof 12 Megapixels and captured 408 aerial images. However,as strong degassing at the fumaroles limited visibility, 3-D
Nat. Hazards Earth Syst. Sci., 18, 3267–3281, 2018 www.nat-hazards-earth-syst-sci.net/18/3267/2018/
H. Darmawan et al.: Structural weakening of the Merapi dome identified by drone photogrammetry 3271
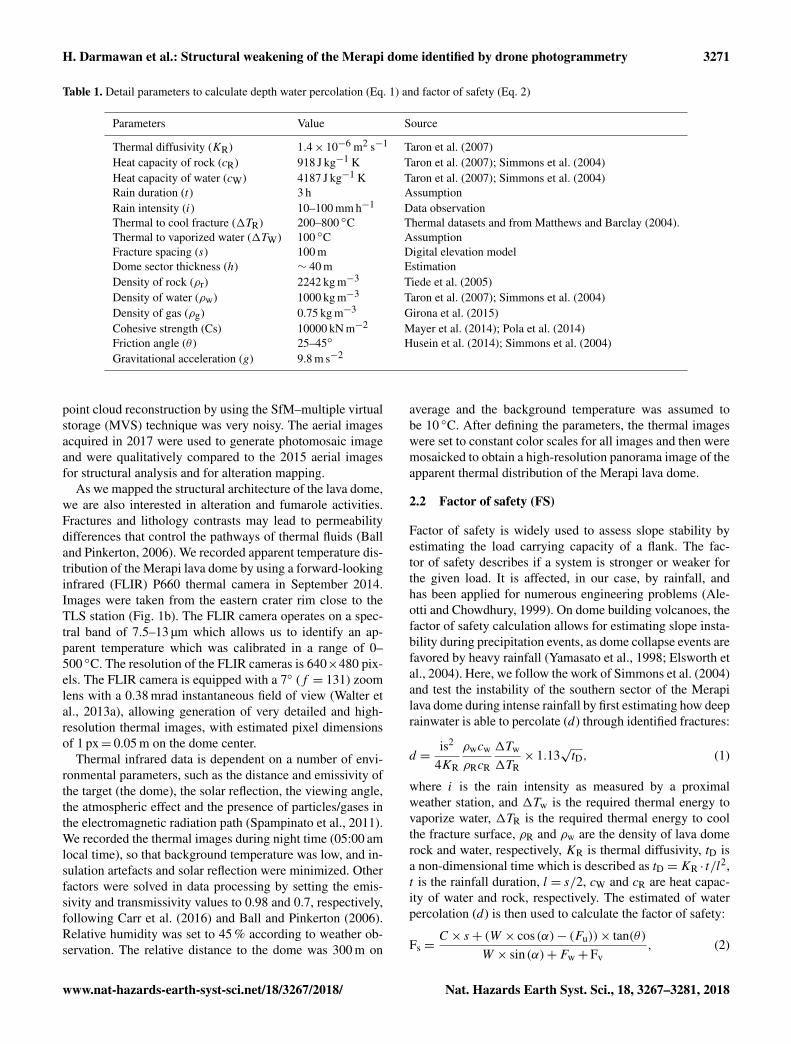
Table 1. Detail parameters to calculate depth water percolation (Eq. 1) and factor of safety (Eq. 2)
Parameters Value Source
Thermal diffusivity (KR) 1.4× 10⁻⁶ m2 s−1 Taron et al. (2007)Heat capacity of rock (cR) 918 J kg−1 K Taron et al. (2007); Simmons et al. (2004)Heat capacity of water (cW) 4187 J kg−1 K Taron et al. (2007); Simmons et al. (2004)Rain duration (t) 3 h AssumptionRain intensity (i) 10–100 mm h−1 Data observationThermal to cool fracture (1TR) 200–800 ◦C Thermal datasets and from Matthews and Barclay (2004).Thermal to vaporized water (1TW) 100 ◦C AssumptionFracture spacing (s) 100 m Digital elevation modelDome sector thickness (h) ∼ 40 m EstimationDensity of rock (ρr) 2242 kg m−3 Tiede et al. (2005)Density of water (ρw) 1000 kg m−3 Taron et al. (2007); Simmons et al. (2004)Density of gas (ρg) 0.75 kg m−3 Girona et al. (2015)Cohesive strength (Cs) 10000 kN m−2 Mayer et al. (2014); Pola et al. (2014)Friction angle (θ ) 25–45◦ Husein et al. (2014); Simmons et al. (2004)Gravitational acceleration (g) 9.8 m s−2
point cloud reconstruction by using the SfM–multiple virtualstorage (MVS) technique was very noisy. The aerial imagesacquired in 2017 were used to generate photomosaic imageand were qualitatively compared to the 2015 aerial imagesfor structural analysis and for alteration mapping.
As we mapped the structural architecture of the lava dome,we are also interested in alteration and fumarole activities.Fractures and lithology contrasts may lead to permeabilitydifferences that control the pathways of thermal fluids (Balland Pinkerton, 2006). We recorded apparent temperature dis-tribution of the Merapi lava dome by using a forward-lookinginfrared (FLIR) P660 thermal camera in September 2014.Images were taken from the eastern crater rim close to theTLS station (Fig. 1b). The FLIR camera operates on a spec-tral band of 7.5–13 µm which allows us to identify an ap-parent temperature which was calibrated in a range of 0–500 ◦C. The resolution of the FLIR cameras is 640×480 pix-els. The FLIR camera is equipped with a 7◦ (f = 131) zoomlens with a 0.38 mrad instantaneous field of view (Walter etal., 2013a), allowing generation of very detailed and high-resolution thermal images, with estimated pixel dimensionsof 1 px= 0.05 m on the dome center.
Thermal infrared data is dependent on a number of envi-ronmental parameters, such as the distance and emissivity ofthe target (the dome), the solar reflection, the viewing angle,the atmospheric effect and the presence of particles/gases inthe electromagnetic radiation path (Spampinato et al., 2011).We recorded the thermal images during night time (05:00 amlocal time), so that background temperature was low, and in-sulation artefacts and solar reflection were minimized. Otherfactors were solved in data processing by setting the emis-sivity and transmissivity values to 0.98 and 0.7, respectively,following Carr et al. (2016) and Ball and Pinkerton (2006).Relative humidity was set to 45 % according to weather ob-servation. The relative distance to the dome was 300 m on
average and the background temperature was assumed tobe 10 ◦C. After defining the parameters, the thermal imageswere set to constant color scales for all images and then weremosaicked to obtain a high-resolution panorama image of theapparent thermal distribution of the Merapi lava dome.
2.2 Factor of safety (FS)
Factor of safety is widely used to assess slope stability byestimating the load carrying capacity of a flank. The fac-tor of safety describes if a system is stronger or weaker forthe given load. It is affected, in our case, by rainfall, andhas been applied for numerous engineering problems (Ale-otti and Chowdhury, 1999). On dome building volcanoes, thefactor of safety calculation allows for estimating slope insta-bility during precipitation events, as dome collapse events arefavored by heavy rainfall (Yamasato et al., 1998; Elsworth etal., 2004). Here, we follow the work of Simmons et al. (2004)and test the instability of the southern sector of the Merapilava dome during intense rainfall by first estimating how deeprainwater is able to percolate (d) through identified fractures:
d =is2
4KR
ρwcw
ρRcR
1Tw
1TR× 1.13
√tD, (1)
where i is the rain intensity as measured by a proximalweather station, and 1Tw is the required thermal energy tovaporize water, 1TR is the required thermal energy to coolthe fracture surface, ρR and ρw are the density of lava domerock and water, respectively, KR is thermal diffusivity, tD isa non-dimensional time which is described as tD =KR · t/l
2,t is the rainfall duration, l = s/2, cW and cR are heat capac-ity of water and rock, respectively. The estimated of waterpercolation (d) is then used to calculate the factor of safety:
Fs =C× s+ (W × cos(α)− (Fu))× tan(θ)
W × sin(α)+Fw+Fv, (2)
www.nat-hazards-earth-syst-sci.net/18/3267/2018/ Nat. Hazards Earth Syst. Sci., 18, 3267–3281, 2018
3272 H. Darmawan et al.: Structural weakening of the Merapi dome identified by drone photogrammetry
where C is the cohesive strength, W (unstable dome sectorweight)= s×h× ρR× g and s is the fracture spacing, h isthe unstable dome sector thickness, α is the inclination offailure plane, θ is friction angle and g is the gravitationalforce. During intense rainfall, rainwater is able to percolatethrough identified fractures, interacting with the hot interiorof the lava dome, thus increasing degassing activity and thengenerating water forces (Fw= 0.5× d2
× cos(α)× ρw× g),uplift force from the volcanic gas (Fu= 0.5× d × cos(α)×ρg×g×s) and vaporized water force (Fv= d×cos(α)×ρg×
g× (h−d); Fig. 7a), where ρg is the density of gas. A resultof FS≤ 1 indicates a potential failure, whilst a FS larger than1 describes a stable condition.
Factor of safety calculation requires careful parameter jus-tification. For the parameters, we consider the rain gaugedata that recorded by hydro-meteorological stations aroundMerapi volcano, and set the rainfall intensity (i) to 10–100 mm h−1. The fracture spacing (s) is 100 m and mim-ics a translational fault with hanging wall thickness (h) of∼ 40 m (Fig. 7a). The temperature gradient from the surfaceto the dome interior (1Tw) is 200–800 ◦C, which is basedon our thermal data and thermodynamic models of the lavadome interior (Matthews and Barclay, 2004). Friction an-gle is from 25 to 45◦, which is on the range of friction forrock on rock material (Husain et al., 2014; Simmons et al.,2004). The density of Merapi rock is 2242 kg m−3 (Tiede etal., 2005). As the rock is progressively altered, we assumethat the dome rock is homogenous and has cohesion strengthof 10 MPa, following studies of rock strength of altered rockfrom Mayer et al. (2016); Pola et al. (2014). Details of theparameters used to calculate the factor of safety and waterpercolation are listed in Table 1 and a critical discussion ofthe parameters can be found in Sect. 4.1.
2.3 Scenario modeling of block-and-ash flows
Based on analysis of geomorphology, structure and factor ofsafety, we are able to identify potential hazards. We then sim-ulated a hazard scenario of gravity driven avalanches by us-ing Titan2D software. The Titan2D software has been usedby previous studies to simulate block-and-ash flows due tolava dome collapses (Widiwijayanti et al., 2007; Charbon-nier and Gertisser, 2009; Procter et al., 2009; Charbonnierand Gertisser, 2012; Charbonnier et al., 2013). The input pa-rameters of Titan2D should be defined carefully to reduceuncertainty during simulation and to obtain the most realis-tic result. For parameterization, the volume of the collapseis based on the structurally delineated southern dome sector.The collapse volume is set to 0.3×10⁶ m3, which representsa deep water percolation and gentle slope failure plane (α)scenario. The bed coulomb friction parameter, the most sen-sitive parameter that controls the flow and material distribu-tion (Sheridan et al., 2005; Charbonnier and Gertisser, 2009),is set to between 28 and 16◦, from the top of the dome tothe lowest slope, respectively (Table 2), following a study of
Table 2. Detail input parameters in Titan2D simulation
Parameters Input data Source
Topography model UpdatedDEM
Drone photogrammetry+TLS+DEM fromGerstnecker et al. (2005)
Number of flux source 1 Assumption
Duration (s) 3600 s Maximum timecomputation
Volume 300 000 m3 DEM+ failure planeinclination fromFS analysis
Initial velocity 0 Assumption
Internal coulombfriction angle
30◦ Charbonnier etal. (2012)
Bed coulombfriction angleZone 1: >2426Zone 2: 2053–2425Zone 3: 1680–2052Zone 4: 1555–1679Zone 5: 1431–1554Zone 6: 1306–1430Zone 7: 1182–1305Zone 8: 0–1181
28◦
27◦
26◦
24◦
22◦
20◦
18◦
16◦
Charbonnier etal. (2012)Zone 1: >2426Zone 2: 2053–2425Zone 3: 1680–2052Zone 4: 1555–1679Zone 5: 1431–1554Zone 6: 1306–1430Zone 7: 1182–1305Zone 8: 0–1181
single dome collapses after the 14 June 2006 eruption (Char-bonnier and Gertisser, 2009). This range of the bed frictionparameter will consider the topography effect during simu-lation and produce realistic mass flow model. The initial ve-locity is set to 0 m s−1 as we assume that the failure mecha-nism is not involving large magmatic pressure. We used theupdated digital elevation model of the Merapi summit fromour TLS and drone photogrammetry data and extended it inthe far field by merging it with the published 2005 digitalelevation model (Gerstenecker et al., 2005). A full set of pa-rameters used for Titan2D simulation is listed in Table 2 andthe limitations of Titan2D are discussed in Sect. 4.1.
3 Results
3.1 Geomorphology and structure of the Merapisummit
The high-resolution slope map and the photomosaic showthe geomorphology and structure of the Merapi summit(Fig. 2). The 2010 explosive eruption formed a deep craterthat opened in the southeast direction and is surrounded byold domes with slopes of 45◦. Shortly after the 2010 erup-tion, a lava dome formed at the middle of the crater. The deepcrater is steeply inclined with a slope of ∼ 80◦ and has a di-ameter of 356 m, a maximum depth of 118 m at the northwestcrater wall, 146 m at the northeast crater wall and 73 m at the
Nat. Hazards Earth Syst. Sci., 18, 3267–3281, 2018 www.nat-hazards-earth-syst-sci.net/18/3267/2018/

H. Darmawan et al.: Structural weakening of the Merapi dome identified by drone photogrammetry 3273
Figure 3. (a) Detailed slope map of the Merapi lava dome thatshows that the top of the dome is relatively flat. The fissure andthe northern part of the dome are steeply inclined with a slope of≥ 80◦. The southern block possibly consists of two different flowunits which are separated by a gently inclined terrace. A cross sec-tion of the lines (b) k-l and (c) m-n that shows that the horseshoe-shaped structure has a maximum depth of 8 m.
southwest crater wall, as shown in cross section of lines p-qand r-s (Fig. 2a, d and e). The high-resolution drone pho-tomosaic clearly shows that the summit is highly fracturedwith an azimuth of N150◦ E and shows fumarole activity andyellowis sulfur deposition, especially around the crater wall(Fig. 2b and c). A remnant of altered rocks after the 2010eruption is exposed at the north crater wall and southeastbasal surface. Degassing activity is identified at the fissurearea, southern dome, west crater wall and northeast crater(green points in Fig. 2c). This degassing activity causes pro-gressive hydrothermal alteration that may weaken and desta-bilize the dome rock. Some of the altered rocks on the craterwall fall and produce gravity driven rock falls that are de-posited inside the crater. Some materials of the 2012–2014explosions are also deposited inside the crater and on the topof the lava dome (Fig. 2c).
Further analysis of the slope and structure of the lavadome shows that the top of the dome is relatively flat, whilethe open fissure is steeply inclined with slope of ∼ 80◦. Ahorseshoe-shaped fault-like structure is identified and it de-lineates a block in the southern dome sector (Fig. 3a). Thestructure can be traced for a length of over 165 m and theblock has dimensions of 100 m×80 m. The cross section pro-files of line k-l and m-n show that the maximum depths of thehorseshoe-shaped fault structure in the northwest, northeastand southwest are 6, 8 and 3 m, respectively (Fig. 3b andc). The delineated block is steeply inclined at ∼ 50◦, hostsabundant fractures, has a blocky appearance and consists oftwo or three steep regions, which are separated by gently in-clined terraces that may indicate different flow units as alsoobserved from the drone aerial image (Figs. 3a and 4a). Asthe unstable dome sector is located on a steep slope (Fig. 3a),it is critical to monitor changes on the southern part of theMerapi dome.
Close-range aerial images show more details of thehorseshoe-shaped structures and the southern block (Fig. 4).We find five fractures in three different areas (c, d and e).A closer view of those fractures (first, second, fourth andfifth) reveals that they have a width of 0.3–1.3 m (Fig. 4c,d and e). Comparison of drone aerial images between 2015and 2017 shows a progressive hydrothermal alteration pro-cesses around those fractures within just 2 years. The yel-low color surrounding the active fractures indicates sulfurdeposit around the fumaroles, which are stronger expressedin the 2017 images, especially around the fracture number5 (area e-e’). It may indicate a structural weakening due tohydrothermal alteration. The hydrothermal activities at thehorseshoe-shaped structure are also observed by our thermalcamera, which is described below.
3.2 Thermal variation of the Merapi dome
Forward-looking infrared thermal mapping allows identifica-tion of the apparent temperature of the dome surface and themain regions of hydrothermal fluid-flow on the horseshoe-shaped structure. We find that the mean apparent tempera-ture at the dome surface is about 6–14 ◦C (Fig. 5a). The lowapparent temperature of the dome surface is related to dataacquisition that is performed at night and the insulating ashdeposits that covered the dome during six distinct phreaticexplosions that occurred between 2012 and 2014 (Darmawanet al., 2018). The highest apparent temperatures are foundat the northern margins of the dome with a maximum tem-perature of 201.7 ◦C. The high-resolution of 1 px= 0.05 min the 2014 thermal data allowed further investigation of thehorseshoe-shaped structure in more detail. We show the ther-mal fingerprint of the fractures in three areas, c, d and e, witha maximum apparent temperature of 161, 150 and 31 ◦C, re-spectively (Fig. 5b). The cross section temperature profile ofthe horseshoe-shaped structure (Fig. 5b) shows a strong ther-
www.nat-hazards-earth-syst-sci.net/18/3267/2018/ Nat. Hazards Earth Syst. Sci., 18, 3267–3281, 2018

3274 H. Darmawan et al.: Structural weakening of the Merapi dome identified by drone photogrammetry
Figure 4. (a) Photomosaic of UAV aerial images acquired in 2015 that shows detailed structures on the Merapi lava dome. The dome ishighly fractured at the fissure area, at the dome margin and on the southern dome. (b) A different unit flow and three fracture areas (c, d ande) are clearly identified by our photomosaic drone aerial images. Coordinates are in UTM. Zoomed images of drone images between 2015and 2017 at those three fractures area show a mechanical weakening due to hydrothermal alteration, especially at the fracture number 5 (areae–e’). We estimate that the diameter of the first, second, third, fourth and fifth fractures is 0.7, 0.3, 1, 1.3 and 0.3 m, respectively.
Figure 5. (a) Photomosaic of high-resolution thermal images taken from the eastern flank (inset) shows the variation of apparent thermalvariation of the Merapi dome in 2014. (b) We find high temperatures around ≥ 140 ◦C at the horseshoe-shaped structure and along thefracture area of c, d and e as identified by our drone camera. High thermal pixel value may indicate a hydrothermal fluid activity that canprogressively alter and ultimately weaken the dome.
Nat. Hazards Earth Syst. Sci., 18, 3267–3281, 2018 www.nat-hazards-earth-syst-sci.net/18/3267/2018/
H. Darmawan et al.: Structural weakening of the Merapi dome identified by drone photogrammetry 3275
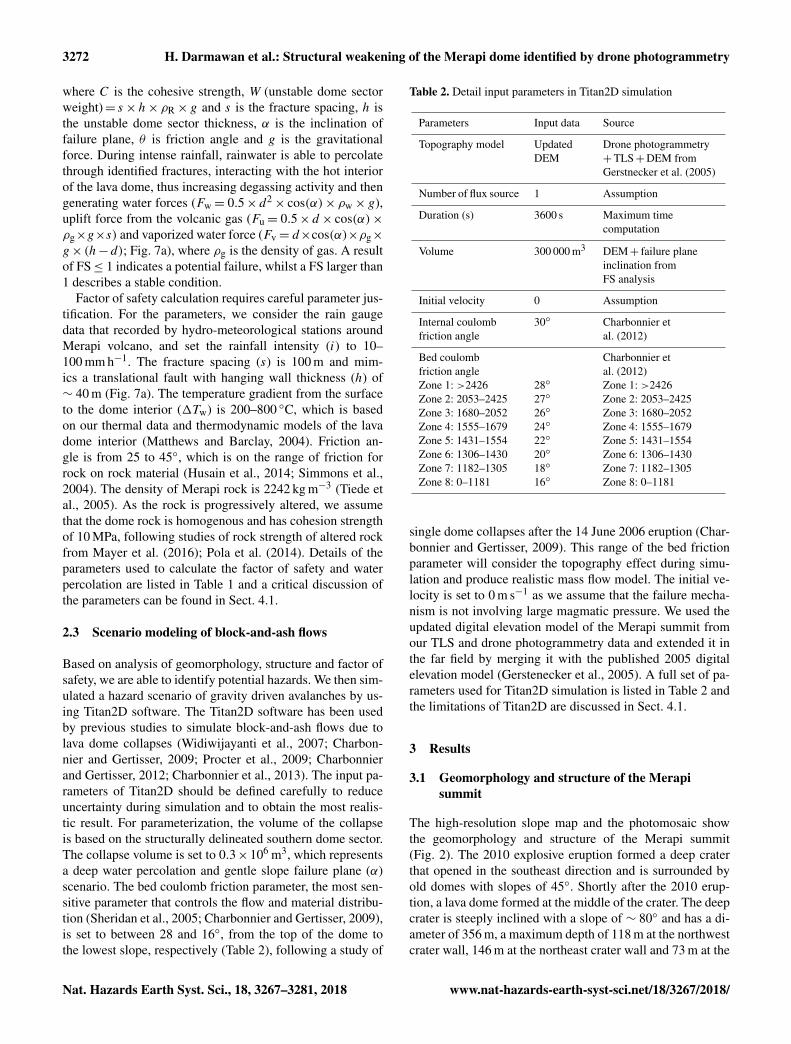
Figure 6. (a) Depth of rainwater percolation, as a function of rain-fall intensity at Merapi, is controlled by the temperature of thedome. By assuming the minimum and maximum temperature ofthe dome of 200 and 800 ◦C, respectively, the estimation of depthwater percolation is 10 to 60 m (red circles) during typical rainfall(grey area). (b) The typical intensity of rainfall from April 2012 toJuly 2014 was 10–35 mm h−1 (grey area) and was calculated basedon average rain intensity from five observatories near Merapi (seeFig. 1a).
mal signal in the horseshoe-shaped structure, which indicatesa prominent pathway for hydrothermal fluids.
We repeated the thermal mapping campaign of the lavadome 3 years later (September 2017). The apparent tempera-ture of fracture number 5 (area e) increased from 31 up to∼ 70 ◦C, which may indicate an increase of hydrothermalfluid activity in fracture number 5 (area e). The increasingof thermal activity in fracture 5 (area e) is highly correlatedwith the increase of hydrothermal alteration activity as ob-served by drone images in 2017 (Fig. 4e-e’). However, as thethermal cameras used in 2014 and 2017 are different, the re-sults cannot be directly compared. More details on this repeatthermal mapping can be found in the Supplement.
3.3 Factor of safety results
Assessment of factor of safety during intense rainfall firstrequires quantification of the effect of rainwater. Based ona typical rainfall event (intensity of 10–35 mm h−1) and as-suming a rain duration of ∼ 3 h, we calculate the rainwaterpercolation between 10 and 60 m by using Eq. (1) (Fig. 6).The 10 and 60 m depth water percolation are then used to cal-culate the factor of safety as a function of failure plane incli-nation (Fig. 7). Results show that failure (FS≤ 1) may occurwhen the failure plane is 25 and 45◦ (α ≥ θ ) during shallowwater percolation (10 m) scenario (black lines in Fig. 7b). Itindicates that friction (θ ) controls the stability during shallow
water percolation. For the deep water percolation scenario(60 m), the plane inclinations at failure mode (FS≤ 1) are 15and 39◦ for friction angles (θ ) of 25 and 45◦, respectively(red lines in Fig. 7b). This indicates that friction cannot re-sist the total driving forces when rainwater percolates deeply.Calculation of the factor of safety reveals that the delineateddome sector is particularly unstable during deep water per-colation (d ∼ 60 m). Using a basal inclination of 15◦, the es-timated unstable rock volume during intense rainfall eventsis 0.3× 10⁶ m3.
3.4 Scenario numerical model of block-and-ash flows
The estimated volume is now used as an input for the Titan2Dsimulation. Titan2D simulation results show that the debrismaterial mobilizes down into the southeastern valley and willreach 1.9 km from the summit at the first minute (Fig. 8).After 10 min, the debris materials are deflected by the Kendilhills (yellow triangle) and the main flow travels further toGendol river valley with distance of 2.6 km from the summit.Within 30 min, the main flow reaches a distance of 3.1 kmand it continues to travel along Gendol river valley. The flowfinally stops with a maximum runout distance of 3.6 km fromthe summit. Most of the material is deposited at the upstreamof Gendol river with a maximum thickness of ∼ 10 m. Thepotential hazard area (red polygon) due to the small volumeof the single dome collapse is 1.5 km2.
4 Discussion
4.1 Limitations
We find some limitations during drone, TLS and thermal dataacquisition due to the complexity and hazardous access at theMerapi summit after the 2010 explosive eruption. The dronewas caught by turbulence due to fumarole activity and strongwinds, and the TLS data could only be obtained from theeastern crater wall since a different scan position was too haz-ardous at the Merapi summit. Therefore, the TLS data havesignificant shadowing effects. However, the advantage of theTLS data is that it is highly accurate and the drone is able tocover the shadow area. The combination of TLS and dronephotogrammetry is therefore able to generate a digital ele-vation model with a resolution of 0.5 m and a photomosaicwith a resolution up to 0.03 m. We find that the combina-tion of TLS and drone photogrammetry is robust and can beapplied for geomorphology and structural mapping at steepsided dome building volcanoes.
The thermal variation was investigated by using a FLIRcamera. Parameters such as emissivity, surface roughness,viewing angle, atmospheric effects, volcanic gas, instrumen-tal errors, solar radiation and solar heating may affect thepixel value of the FLIR thermal images (Spampinato et al.,2011). The effect of solar radiation and solar heating waslargely reduced by acquiring the FLIR data before sunrise.
www.nat-hazards-earth-syst-sci.net/18/3267/2018/ Nat. Hazards Earth Syst. Sci., 18, 3267–3281, 2018

3276 H. Darmawan et al.: Structural weakening of the Merapi dome identified by drone photogrammetry
Figure 7. (a) Cross section of the Merapi lava dome shows that the horseshoe-shaped structure may develop into a translational fault withfracture spacing (s) up to 100 m and a hanging wall thickness of∼ 40 m. The stability of the unstable dome sector is influenced by the weight(W ), water force (FW), vaporized water force (FV) and gas uplift force (Fu) along the fault boundary during intense rainfall (Modified fromSimmons et al., 2004). (b) Analysis of factor of safety for the southern dome sector shows that deep water percolation (red lines) may reducefailure plane inclination and failure may occur even if the failure plane is inclined gently below the friction angle (α<θ ).
However, parameters of emissivity, transmissivity, relativehumidity, distance and temperature background may be in-fluential during data processing. We tested the sensitivity ofthese parameters and we found that emissivity is the mostsensitive parameter. Increasing emissivity by 0.01 will re-duce the apparent temperature by ∼ 1 ◦C. By assuming arange of emissivity between 0.95 and 0.98, which is com-mon on dome building volcanoes (Merapi and Colima, Mex-ico; Walter et al., 2013a; Carr et al., 2016), we infer that ourapparent temperature has an uncertainty of ∼ 3 ◦C. For thestructural analysis performed, this is an acceptable range.
The degree of dome instability is estimated by using thefactor of safety calculation, assuming an intense rainfallevent similar to the study of Simmons et al. (2004), where theparameters of dome sector geometry (thickness and fracturespacing), temperature, the friction angle, the rock strength,and the intensity and duration of the rainfall may influencethe result. Our factor of safety analysis is constrained for thesouthern Merapi dome sector. For this we hypothesize a frac-ture spacing (s) of 100 m, thickness (h) of 40 m, cohesivestrength of 10 MPa following the studies of rock strength ofaltered rock from Mayer et al. (2016) and Pola et al. (2014),dome temperature of 200–800 ◦C during typical rainfall atMerapi (intensity of 10–35 mm h−1 and duration of ∼ 3 h)and friction angles of 25 and 45◦ (Simmons et al., 2004; Hu-sein et al., 2014).
Our morphological analysis, thermal images and rainfallgauges provide realistic information of the fracture spacing(s), temperature to cool the dome (1TR) and rainfall inten-sity; however, the parameters of dome thickness, rainfall du-
ration and the temperature required to vaporize rainwater(1Tw) have some uncertainty. Here, we tested those param-eters and found that the rainfall duration is the most sensi-tive parameter as it influences the depth of water percolation.Doubling the rainfall duration from 3 to 6 h with an intensityof 35 mm h−1 will increase the water percolation by up to10 m, which will decrease the factor of safety by ∼ 0.09 andreduce the failure plane inclination (α) by 1◦, while the domethickness and temperature required to vaporize the rain wa-ter (1Tw) are not significantly affected. Doubling the blockthickness reduces the factor of safety by ∼ 0.01 and reduc-ing the temperature to vaporize the water (1Tw) from 100to 90 ◦C only increases the factor of safety by ∼ 0.006. Byassuming rainfall duration of 12 h during the rainy season,we estimate the failure plane inclination have an uncertaintyof ±3◦ that may affect the uncertainty of the volume of thecollapsing block by ±65.000 m3. We also assume that therock cohesion is homogenous, while our drone photomosaicdata shows that the degree of alteration that may influencethe rock cohesion is spatially varied. We then further ana-lyzed the factor of safety with heterogeneous rock cohesionin Sect. 4.3.
In a case of dome sector failure, the potential hazard zoneis estimated by usingTitan2D software. Our Titan2D modelrepresents an approximation of runout distance, deposit andpotential hazard area due to single small volume dome col-lapses. However, Titan2D is not able to model pyroclasticsurges. The pyroclastic surges that occurred and jumped overKendil hills during the 2010 eruption could not be modeledby Titan2D as surges are diluted, mixed with gas and the
Nat. Hazards Earth Syst. Sci., 18, 3267–3281, 2018 www.nat-hazards-earth-syst-sci.net/18/3267/2018/

H. Darmawan et al.: Structural weakening of the Merapi dome identified by drone photogrammetry 3277
Figure 8. Result of the numerical simulation of the pyroclasticblock-and-ash flow that may form due to the collapse of the delin-eated southern dome sector after 1, 10, 30 and 60 min. The block-and-ash flow is deflected by the Kendil hills (yellow triangle) within∼ 1 min after the collapse. The red outline indicates the total inun-dation zone as a result of the deposition of the block-and-ash flowmaterial. Coordinates are in UTM meters.
propagation is not controlled by topography (Charbonnieret al., 2013). In order to solve the propagation of pyroclas-tic surge, a two-layer model has been proposed by assumingthat pyroclastic density currents (PDCs) consist of two dis-tinct layers, a concentrated layer (block-and-ash flow) anda diluted layer (ash-cloud surge; Kelfoun et al., 2017). Themobility of each layer is solved by using a depth-averagedalgorithm. Results of this model were successful in simulat-ing the mobility of pyroclastic density currents of the Merapieruption in 26 October and 5 November 2010.
Other limitations of Titan2D are the grain interactionswhich are controlled and simply solved by coulomb fric-tions (bed and internal); while in reality, the interaction ofgrains in pyroclastic density currents is complex, as thegrains size varies and the momentum produced by this in-teraction is able to transport large lithics over great distances(≥ 10 km; Dufek et al., 2009). A study of grains size of py-roclastic flow also suggests that finer grain size may producea higher mobility of the center of the mass flow (Cagnoli
and Piersanti, 2015, 2017). As the grains interaction is onlycontrolled by coulomb frictions in Titan2D, adjustment ofcoulomb frictions should be taken carefully and we used val-idated coulomb frictions from Charbonnier et al. (2012) inthis study to obtain a reliable result.
4.2 Geomorphology and structural instability at theMerapi summit
The current morphology and structure on the Merapi domeshow progressive hydrothermal alteration that may causestructural weakening. Previous studies show that hydrother-mal alteration is able to weaken the dome rock up to 0.2–10 MPa (Pola et al., 2014; Wyering et al., 2014) and pro-motes a failure even during quiescence periods (Lopez andWilliams, 1993; Reid et al., 2001). Our alteration, thermaland structural mapping datasets show that the southern Mer-api dome and southwestern Merapi flank area are subjectedto structural mechanical weakening. The southern dome sec-tor is delineated by a curved horseshoe-shaped structurewhich was already identified even before the 2012–2014 ex-plosions (Darmawan et al., 2018). The structure then be-came more strongly expressed and gradually deepened dur-ing the 2012–2014 explosions. The horseshoe-shaped struc-ture is now 8 m deep, highly fractured and provides pathwaysfor fumaroles as identified by thermal camera. The presenceof progressive hydrothermal alteration in fracture 5 (area E)probably points to a mechanical weakening and future struc-tural instability due to hydrothermal alteration.
Whether the altered fractures are deep reaching or not,however, is difficult to quantify. Our data only identify al-teration at the surface and our model assumes that thehorseshoe-shaped fracture is deeply altered and may trans-form to a translational fault due to lateral progressive hy-drothermal alteration processes. Imaging the failure plane ischallenging at the Merapi summit. Resistivity tomographycould only be realized at elevation of 2400 m (400 below theMerapi summit) at the southern flank of Merapi and founda hydrothermal system at a depth of 200 m (Byrdina et al.,2017). If alteration progressively occurs at a depth of 200 mand gradually forms a failure plane, the southern dome andsouthwestern flank may be prone to serious structural weak-ening and instability due to hydrothermal alteration.
Progressive hydrothermal alteration also intensively oc-curs at the open fissure area. The open fissure is highly frac-tured, actively degassing and intensively altered, as shownfrom our drone photomosaic image (Fig. 2b). The latest erup-tion in May 2018 occurred at the fissure area. Although noseismic or deformation precursors were observed, the ther-mal signal dramatically increased 15 min before the eruptionalong the fissure area (BPPTKG, 2018b). Further analysis oferuption material suggests that the May 2018 eruption con-tained an abundance of altered materials, which indicates thatthe open fissure area is structurally already weakened dueto hydrothermal alteration. The weakened structure thus pro-
www.nat-hazards-earth-syst-sci.net/18/3267/2018/ Nat. Hazards Earth Syst. Sci., 18, 3267–3281, 2018

3278 H. Darmawan et al.: Structural weakening of the Merapi dome identified by drone photogrammetry
Figure 9. Conceptual model of slope stability shows the geometryof (a) the southern Merapi dome sector and (b) the southwesternMerapi flank. The hydrothermal alteration along the fracture, theestimation of ground water and the heterogeneity of the rock cohe-sion are also indicated. Our calculation of factor of safety by usingthe Fellenius method shows that the southern dome is relatively sta-ble (FS= 2.6), while the southwestern Merapi flank is approachinga warning (FS= 1.3) and requires further monitoring and assess-ment.
vides a pathway to release gas overpressure and controls thelocation of the steam explosion in May 2018.
4.3 Implications for future dome failure
Geomorphology and structural mapping imply a structuralweakening on the southern dome, at the open fissure andat western crater wall. Results of factor of safety calcula-tions show that deep water percolation may reduce the fric-tion and may increase hydrothermal alteration that furtherweakens the dome structure. However, our results of factorof safety assume that the rock cohesion strength is homoge-nous, while in fact, the rock cohesion strength is probablyheterogeneous as the magnitude of alteration and associatedcohesion strength is spatially varied. Therefore, we furtheranalyzed the stability of the dome by using Fellenius (or-
dinary slice) factor of safety and varying the rock cohesionstrength. Fellenius factor of safety is widely used to ana-lyze slope stability and the method assumes that the massabove the failure plane is divided into n slices and the exter-nal forces (vertical shear and horizontal forces, Xn and En,respectively) are zero (Fig. 9). The acting forces on each sliceare the weight, pore pressure (u) and rock cohesion (c), re-spectively (Fig. 9a inset). We assume that the rock cohesionat basal failure is heterogeneous. The rock cohesion whichlocated close to the altered fracture is 10 MPa, while the rockcohesion of fresh rock is 100 MPa (Pola et al., 2014; Wyeringet al., 2014) and the water deeply percolates (≥ 60 m; Fig. 9).We find that the factor of safety on the southern dome is 2.6(Fig. 9a) which indicates a stable condition. We infer thatfresh rock is strong enough to resist and to stabilize the dome.The factor of safety of the southwestern flank is 1.3 whichmay indicate a warning condition. We therefore also recom-mend monitoring the stability of the southwestern flank ashistorically the southwestern flank has frequently collapsedover the past decades.
Other factors, such as a new magma extrusion and gasoverpressure, may also destabilize and trigger a dome fail-ure. Gas pressurization may promote deep-seated failure andexplosive eruptions, while slow rate magma extrusion cangradually make the dome overly steep and trigger gravita-tional collapses (Voight and Elsworth, 2000).
Currently, a new dome is growing at the middle of openfissure with volume of 135 000 m3 and extrusion rate of0.01 m3 s−1 (BPPTKG, 2018a). The extrusion of a new domeinvolves degassing activity that increases hydrothermal alter-ation in the southern dome sector. Further investigation of theinteraction of the new dome extrusion and structural weaken-ing is now required.
4.4 Block-and-ash flow hazard along the Gendol valley
Our simulation of block failure and mobility along the Gen-dol valley shows the potential hazard due to structural weak-ening on the southern dome. The southern dome, with a vol-ume of ∼ 0.3× 10⁶ m3, may fail and produce block-and-ashflow with a maximum runout distance of 3.6 km and an af-fected hazard area of 1.5 km2. This runout distance is typ-ical for a single dome collapse with a volume of ≤ 106 m3
(VEI= 1). The single dome collapse in 2006 with a volumeof 1×10⁶ m3 traveled along Gendol valley and destroyed thevillage of Kaliadem which was located 4.5 km from the sum-mit (Charbonnier and Gertisser, 2009; Ratdomopurbo et al.,2013). Therefore, we infer that our potential hazard modelis relevant and realistic for single dome collapse with VEI1. However, we did not consider the potential collapses ofthe new lava dome that is currently forming at the open fis-sure and is growing above the frozen lava dome. As the cur-rent morphology of the Merapi summit that opened to theGendol valley (south–southeast), we infer that the new lavadome could potentially collapse into the Gendol valley due to
Nat. Hazards Earth Syst. Sci., 18, 3267–3281, 2018 www.nat-hazards-earth-syst-sci.net/18/3267/2018/

H. Darmawan et al.: Structural weakening of the Merapi dome identified by drone photogrammetry 3279
magma intrusion, gravitational instability, gas overpressure,structural weakening, intense rainfall and earthquakes. Werecommend to further monitor and investigate the potentialhazard of the new lava dome in the near future.
5 Conclusions
Detailed morphological and structural studies of the activeMerapi volcano reveal a structural weakening due to hy-drothermal alteration on the southern dome. We identify a165 m long horseshoe-shaped structure with a depth of 6 mthat encircles the southern dome sector which has volume of∼ 0.3× 10⁶ m3. The structure is highly fractured and pro-vides pathways for hydrothermal fluids which can lead tostructural instability.
Our results from factor of safety calculations indicate thatintense rainfall events at the Merapi summit are able to re-duce the failure plane inclination. The southern dome mayfail due to new activities or mechanical weakening. By us-ing Titan2D flow simulation we estimate that the collapse ofthe unstable dome sector may produce block-and-ash flowthat travels southward with a maximum runout distance of∼ 4 km from the summit.
Data availability. Data are available with the GFZ data servicewith DOI https://doi.org/10.5880/GFZ.2.1.2017.003 (Darmawan etal., 2017).
Supplement. The supplement related to this article is availableonline at: https://doi.org/10.5194/nhess-18-3267-2018-supplement.
Author contributions. HD collected the drone dataset, analyzed thedata, and wrote the paper under supervision of TRW and VRT. TRWcollected the infrared data and wrote and improved the paper. VRTwrote and improved the paper. ABS provided the rainfall dataset.
Competing interests. The authors declare that they have no conflictof interest.
Acknowledgements. This is a contribution to VOLCAPSE, whichis a research project funded by the European Research Councilunder the European Union’s H2020 Programme/ERC consol-idator grant ERC-CoG 646858. The authors also acknowledge ascholarship grant from Deutscher Akademischer Austauschdienst(DAAD), Germany, reference no. 91525854, a research grant bythe Swedish Research Council (VOLTAGE project) and financialsupport by the Swedish Center for Natural Hazard and DisasterSciences (CNDS). We would like to also thank Mehdi Nikkhooand Nicole Richter for the data acquisition of the terrestrial laserscan, Michele Pantaleo for the data acquisition of thermal imagesin 2014, and Edgar Zon for supporting the 2014 fieldwork. We
also thank François Beauducel for supporting FLUKE camerarecording during fieldwork in 2017 and special thanks goes toBPPTKG (Merapi Volcano Observatory) for all of their supportduring fieldwork in 2014, 2015 and 2017. We also thank SylvainCharbonnier and an anonymous referee for their constructivereview.
The article processing charges for this open-accesspublication were covered by a ResearchCentre of the Helmholtz Association.
Edited by: Giovanni MacedonioReviewed by: Sylvain Charbonnier and one anonymous referee
References
Aleotti, P. and Chowdhury, R.: Landslide hazard assessment: sum-mary review and new perspectives, B. Eng. Geol. Environ., 58,21–44, 1999.
Ball, J. L., Stauffer, P. H., Calder, E. S., and Valentine, G. A.: Thehydrothermal alteration of cooling lava domes, B. Volcanol., 77,1–16, https://doi.org/10.1007/s00445-015-0986-z, 2015.
Ball, M. and Pinkerton, H.: Factors affecting the accuracy of ther-mal imaging cameras in volcanology, J. Geophys. Res., 111, 1–18, https://doi.org/10.1029/2005jb003829, 2006.
Bishop, A. W.: The use of the slip circle in the stability analysis ofslopes, Geotechnique, 5, 7–17, 1955.
BPPTKG.: Laporan aktivitas Gunung Merapi tanggal28 September–4 Oktober 2018, access: 12 October, 2018a.
BPPTKG.: Diskusi Scientific Forum: Kajian Erupsi Freatik G. Mer-api 11 Mei 2018, access: 12 October, 2018b.
Byrdina, S., Friedel, S., Vandemeulebrouck, J., Budi-Santoso,A., Suhari, Suryanto, W., Rizal, M. H., Winata, E., andKusdaryanto: Geophysical image of the hydrothermal systemof Merapi volcano, J. Volcanol. Geoth. Res., 329, 30–40,https://doi.org/10.1016/j.jvolgeores.2016.11.011, 2017.
Cagnoli, B. and Piersanti, A.: Grain size and flow vol-ume effects on granular flow mobility in numerical simu-lations: 3-D discrete element modeling of flows of angularrock fragments, J. Geophys. Res.-Sol. Ea., 120, 2350–2366,https://doi.org/10.1002/2014jb011729, 2015.
Cagnoli, B. and Piersanti, A.: Combined effects of grain size,flow volume and channel width on geophysical flow mobil-ity: three-dimensional discrete element modeling of dry anddense flows of angular rock fragments, Solid Earth, 8, 177–188,https://doi.org/10.5194/se-8-177-2017, 2017.
Calder, E. S., Lavallé, Y., Kendrick, J. E., and Bernstein, M.: LavaDome Eruptions, in: The encyclopedia of volcanoes 2nd edition,edited by: Sigurdsson, H., Houghton, B., Mc Nutt, R. S., Rymer,H., and Stix, J., Elsevier, United States, 343–362, 2015.
Carr, B. B., Clarke, A. B., and Vanderkluysen, L.: The 2006 lavadome eruption of Merapi Volcano (Indonesia): Detailed anal-ysis using MODIS TIR, J. Volcanol. Geoth. Res., 311, 60–71,https://doi.org/10.1016/j.jvolgeores.2015.12.004, 2016.
Carr, B. B., Clarke, A. B., and de’ Michieli Vitturi, M.:Earthquake induced variations in extrusion rate: A numer-ical modeling approach to the 2006 eruption of Merapi
www.nat-hazards-earth-syst-sci.net/18/3267/2018/ Nat. Hazards Earth Syst. Sci., 18, 3267–3281, 2018

3280 H. Darmawan et al.: Structural weakening of the Merapi dome identified by drone photogrammetry
Volcano (Indonesia), Earth Planet. Sc. Lett., 482, 377–387,https://doi.org/10.1016/j.epsl.2017.11.019, 2018.
Charbonnier, S. J. and Gertisser, R.: Numerical simulations ofblock-and-ash flows using the Titan2D flow model: examplesfrom the 2006 eruption of Merapi Volcano, Java, Indonesia,B. Volcanol., 71, 953–959, https://doi.org/10.1007/s00445-009-0299-1, 2009.
Charbonnier, S. J. and Gertisser, R.: Evaluation of geophysi-cal mass flow models using the 2006 block-and-ash flows ofMerapi Volcano, Java, Indonesia: Towards a short-term hazardassessment tool, J. Volcanol. Geoth. Res., 231–232, 87–108,https://doi.org/10.1016/j.jvolgeores.2012.02.015, 2012.
Charbonnier, S. J., Germa, A., Connor, C. B., Gertisser, R.,Preece, K., Komorowski, J. C., Lavigne, F., Dixon, T.,and Connor, L.: Evaluation of the impact of the 2010pyroclastic density currents at Merapi volcano from high-resolution satellite imagery, field investigations and numer-ical simulations, J. Volcanol. Geoth. Res., 261, 295–315,https://doi.org/10.1016/j.jvolgeores.2012.12.021, 2013.
Darmawan, H., Walter, T. R., Brotopuspito, K. S., Subandriyo, andNandaka, I. G. M. A.: Morphological and structural changes atthe Merapi lava dome monitored in 2012–15 using unmannedaerial vehicles (UAVs), J. Volcanol. Geoth. Res., 349, 256–267,https://doi.org/10.1016/j.jvolgeores.2017.11.006, 2018.
Darmawan, H., Walter, T., Richter, N., and Nikkoo, M.: Highresolution Digital Elevation Model of Merapi summit in 2015generated by UAVs and TLS, V. 2015 GFZ Data Services,https://doi.org/10.5880/GFZ.2.1.2017.003, 2017.
Dufek, J., Wexler, J., and Manga, M.: Transport capacityof pyroclastic density currents: Experiments and models ofsubstrate-flow interaction, J. Geophys. Res.-Sol. Ea., 114, 1–13,https://doi.org/10.1029/2008jb006216, 2009.
Elsworth, D., Voight, B., Thompson, G., and Young, S. R.: Thermal-hydrologic mechanism for rainfall-triggered collapse of lavadomes, Geology, 32, 969–972, https://doi.org/10.1130/g20730.1,2004.
Gerstenecker, C., Läufer, G., Steineck, D., Tiede, C., and Wrobel,B.: Validation of Digital Elevation Models around Merapi Vol-cano, Java, Indonesia, Nat. Hazards Earth Syst. Sci., 5, 863–876,https://doi.org/10.5194/nhess-5-863-2005, 2005.
Girona, T., Costa, F., Taisne, B., Aggangan, and Ildefonso,S.: Fractal degassing from Erebus and Mayon volca-noes revealed by a new method to monitor H2O emis-sion cycles, J. Geophys. Res.-Sol. Ea., 120, 2988–3002,https://doi.org/10.1002/2014JB011797, 2015.
Hale, A. J.: Lava dome growth and evolution with an independentlydeformable talus, Geophys. J. Int., 174, 391–417, 2008.
Hamilton, W.: Tectonics of the Indonesian Region, U.S. Geologi-cal Survey Professional Paper 1078, United States GovernmentPrinting Office, Washington, 1979.
Husain, T., Elsworth, D., Voight, B., Mattioli, G., andJansma, P.: Influence of extrusion rate and magma rheol-ogy on the growth of lava domes: Insights from particle-dynamics modeling, J. Volcanol. Geoth. Res., 285, 100–117,https://doi.org/10.1016/j.jvolgeores.2014.08.013, 2014.
James, M. R. and Varley, N.: Identification of structural con-trols in an active lava dome with high resolution DEMs:Volcán de Colima, Mexico, Geophys. Res. Lett., 39, 1–5,https://doi.org/10.1029/2012gl054245, 2012.
Kelfoun, K., Gueugneau, V., Komorowski, J. K., Aisyah, N., Cho-lik, N., and Merciecca, C.: Simulation of block-and-ash flowsand ash-cloud surges of the 2010 eruption of Merapi volcanowith a two-layer model, J. Geophys. Res.-Sol. Ea., 122, 4277–4292, https://doi.org/10.1002/2017JB013981, 2017.
Kubanek, J., Westerhaus, M., Schenk, A., Aisyah, N., Brotopus-pito, K. S., and Heck, B.: Volumetric change quantification of the2010 Merapi eruption using TanDEM-X InSAR, Remote Sens.Environ., 164, 16–25, https://doi.org/10.1016/j.rse.2015.02.027,2015.
Lavigne, F., Morin, J., and Surono: The atlas of Merapi Volcano,Laboratoire de Geographie Physique, CNRS UMR, France,2015.
Lopez, D. L. and Williams, S. N.: Catastrophic volcanic collapse:relation to hydrothermal processes, Science, 260, 1794–1796,https://doi.org/10.1126/science.260.5115.1794, 1993.
Matthews, A. J. and Barclay, J.: A thermodynamical model forrainfall-triggered volcanic dome collapse, Geophys. Res. Lett.,31, 1–4, https://doi.org/10.1029/2003gl019310, 2004.
Mayer, K., Scheu, B., Montanaro, C., Yilmaz, T. I., Isaia,R., Aßbichler, D., and Dingwell, D. B.: Hydrothermal al-teration of surficial rocks at Solfatara (Campi Flegrei):Petrophysical properties and implications for phreatic erup-tion processes, J. Volcanol. Geoth. Res., 320, 128–143,https://doi.org/10.1016/j.jvolgeores.2016.04.020, 2016.
Norton, G. E., Watts, R. B., Voight, B., Mattioli, G. S., Herd, R.A., Young, S. R., Devine, G. E., Aspinall, W. P., Bonadonna,C., Baptie, B. J., Edmonds, M., Jolly, A. D., Loughlin, S. C.,Luckett, R., and Sparks, R. S. J.: Pyroclastic flow and ex-plosive activity at Soufriere Hills Volcano, Montserrat, dur-ing a period of virtually no magma extrusion (March 1998 toNovember 1999), Geological Society, London, Memiors, 21,https://doi.org/10.1144/GSL.MEM.2002.021.01.21, 2002.
Pallister, J. S., Schneider, D. J., Griswold, J. P., Keeler, R.H., Burton, W. C., Noyles, C., Newhall, C. G., and Ratdo-mopurbo, A.: Merapi 2010 eruption – Chronology and extru-sion rates monitored with satellite radar and used in erup-tion forecasting, J. Volcanol. Geoth. Res., 261, 144–152,https://doi.org/10.1016/j.jvolgeores.2012.07.012, 2013.
Patra, A. K., Bauer, A. C., Nichita, C. C., Pitman, E.B., Sheridan, M. F., Bursik, M., Rupp, B., Webber, A.,Stinton, A. J., Namikawa, L. M., and Renschler, C. S.:Parallel adaptive numerical simulation of dry avalanchesover natural terrain, J. Volcanol. Geoth. Res., 139, 1–21,https://doi.org/10.1016/j.jvolgeores.2004.06.014, 2005.
Pola, A., Crosta, G. B., Fusi, N., and Castellanza, R.: Generalcharacterization of the mechanical behaviour of different vol-canic rocks with respect to alteration, Eng. Geol., 169, 1–13,https://doi.org/10.1016/j.enggeo.2013.11.011, 2014.
Procter, J. N., Cronin, S. J., Platz, T., Patra, A., Dalbey, K., Sheridan,M., and Neall, V.: Mapping block-and-ash flow hazards basedon Titan 2-D simulations: a case study from Mt. Taranaki, NZ,Nat. Hazards, 53, 483–501, https://doi.org/10.1007/s11069-009-9440-x, 2009.
Ratdomopurbo, A., Beauducel, F., Subandriyo, J., Agung Nan-daka, I. G. M., Newhall, C. G., Suharna, Sayudi, D. S.,Suparwaka, H., and Sunarta: Overview of the 2006 erup-tion of Mt. Merapi, J. Volcanol. Geoth. Res., 261, 87–97,https://doi.org/10.1016/j.jvolgeores.2013.03.019, 2013.
Nat. Hazards Earth Syst. Sci., 18, 3267–3281, 2018 www.nat-hazards-earth-syst-sci.net/18/3267/2018/

H. Darmawan et al.: Structural weakening of the Merapi dome identified by drone photogrammetry 3281
Reid, M. E., Sisson, T. W., and Brien, D. L.: Volcano collapsepromoted by hydrothermal alteration and edifice shape, MountRainier, Washington, Geology, 29, 779–782, 2001.
Rhodes, E., Kennedy, B. M., Lavallee, Y., Hornby, A., Edwards, M.,and Chigna, G.: Textural insights into the evolving lava domecycles at Santiaguito lava dome, Guatemala, Front. Earth Sci., 6,1–18, https://doi.org/10.3389/feart.2018.00030, 2018.
Richter, G., Wassermann, J., Zimmer, M., and Ohrnberger, M.: Cor-relation of seismic activity and fumarole temperature at the Mt.Merapi volcano (Indonesia) in 2000, J. Volcanol. Geoth. Res.,135, 331–342, 2004.
Salzer, J. T., Nikkhoo, M., Walter, T. R., Sudhaus, H., Reyes-Davila,G., Breton, M., and Arambula, R.: Satellite radar data revealshort-term pre-explosive displacements and a complex conduitsystem at Volcan de Colima, Mexico, Front. Earth Sci., 2, 1–11,https://doi.org/10.3389/feart.2014.00012, 2014.
Salzer, J. T., Milillo, P., Varley, N., Perissin, D., Pantaleo, M., andWalter, T. R.: Evaluating links between deformation, topographyand surface temperature at volcanic domes: Results from a multi-sensor study at Volcán de Colima, Mexico, Earth Planet. Sc.Lett., 479, 354–365, https://doi.org/10.1016/j.epsl.2017.09.027,2017.
Sheridan, M. F., Stinton, A. J., Patra, A., Pitman, E. B.,Bauer, A., and Nichita, C. C.: Evaluating Titan2D mass-flowmodel using the 1963 Little Tahoma Peak avalanches, MountRainier, Washington, J. Volcanol. Geoth. Res., 139, 89–102,https://doi.org/10.1016/j.jvolgeores.2004.06.011, 2005.
Simmons, J., Elsworth, D., and Voight, B.: Instability of exoge-nous lava lobes during intense rainfall, B. Volcanol., 66, 725–734, https://doi.org/10.1007/s00445-004-0353-y, 2004.
Siswowidjoyo, S., Suryo, I., and Yokoyama, I.: Magma eruptionrates of Merapi volcano, Central Java, Indonesia during one cen-tury (1890–1992), B. Volcanol., 57, 111–116, 1995.
Spampinato, L., Calvari, S., Oppenheimer, C., and Boschi, E.: Vol-cano surveillance using infrared cameras, Earth-Sci. Rev., 106,63–91, https://doi.org/10.1016/j.earscirev.2011.01.003, 2011.
Surono, Jousset, P., Pallister, J., Boichu, M., Buongiorno, M. F.,Budisantoso, A., Costa, F., Andreastuti, S., Prata, F., Schnei-der, D., Clarisse, L., Humaida, H., Sumarti, S., Bignami, C.,Griswold, J., Carn, S., Oppenheimer, C., and Lavigne, F.:The 2010 explosive eruption of Java’s Merapi volcano – A“100-year” event, J. Volcanol. Geoth. Res., 241–242, 121–135,https://doi.org/10.1016/j.jvolgeores.2012.06.018, 2012.
Szeliski, R.: Structure from motion, in: Computer Vision, Springer,London, 2011.
Taron, J., Elsworth, D., Thompson, G., and Voight, B.: Mecha-nisms for rainfall-concurrent lava dome collapses at SoufrièreHills Volcano, 2000–2002, J. Volcanol. Geoth. Res., 160, 195–209, https://doi.org/10.1016/j.jvolgeores.2006.10.003, 2007.
Thiele, S. T., Varley, N., and James, M. R.: Thermal pho-togrammetric imaging: A new technique for monitoringdome eruptions, J. Volcanol. Geoth. Res., 337, 140–145,https://doi.org/10.1016/j.jvolgeores.2017.03.022, 2017.
Tiede, C., Camacho, A. G., Gerstenecker, C., Fernández, J., andSuyanto, I.: Modeling the density at Merapi volcano area, In-donesia, via the inverse gravimetric problem, Geochem. Geophy.Geosy., 6, 1–13, https://doi.org/10.1029/2005gc000986, 2005.
Voight, B.: Structural stability of andesite volcanoes andlava domes, Philos. T. Roy. Soc. A, 358, 1663–1703,https://doi.org/10.1098/rsta.2000.0609, 2000.
Voight, B. and Elsworth, D.: Instability and collapse of hazardousgas-pressurized lava domes, Geophys. Res. Lett., 27, 1–4, 2000.
Voight, B., Constantine, E. K., Siswowidjoyo, S., and Torley, R.:Historical eruptions of Merapi Volcano, Central Java, Indonesia1768–1998, J. Volcanol. Geoth. Res., 100, 69–138, 2000.
Walter, T. R., Wang, R., Zimmer, M., Grosser, H., Lühr, B., and Rat-domopurbo, A.: Volcanic activity influenced by tectonic earth-quakes: Static and dynamic stress triggering at Mt. Merapi, Geo-phys. Res. Lett., 34, 1–5, https://doi.org/10.1029/2006gl028710,2007.
Walter, T. R., Legrand, D., Granados, H. D., Reyes, G., andArámbula, R.: Volcanic eruption monitoring by thermal imagecorrelation: Pixel offsets show episodic dome growth of theColima volcano, J. Geophys. Res.-Sol. Ea., 118, 1408–1419,https://doi.org/10.1002/jgrb.50066, 2013a.
Walter, T. R., Ratdomopurbo, A., Subandriyo, Aisyah, N., Bro-topuspito, K. S., Salzer, J., and Lühr, B.: Dome growthand coulée spreading controlled by surface morphology, asdetermined by pixel offsets in photographs of the 2006Merapi eruption, J. Volcanol. Geoth. Res., 261, 121–129,https://doi.org/10.1016/j.jvolgeores.2013.02.004, 2013b.
Walter, T. R., Subandriyo, J., Kirbani, S., Bathke, H., Suryanto,W., Aisyah, N., Darmawan, H., Jousset, P., Luehr, B. G.,and Dahm, T.: Volcano-tectonic control of Merapi’s lavadome splitting: The November 2013 fracture observed fromhigh resolution TerraSAR-X data, Tectonophysics, 639, 23–33,https://doi.org/10.1016/j.tecto.2014.11.007, 2015.
Widiwijayanti, C., Hidayat, D., Voight, B., Patra, A., and Pitman,E. B.: Modeling dome-collapse pyroclastic flows for crisis as-sessments on Montserrat with TITAN2D, Cities on Volcanoes 5,Shimabara, Japan, The volcanological Society of Japan, 11P34,2007.
Wyering, L. D., Villeneuve, M. C., Wallis, I. C., Siratovich, P. A.,Kennedy, B. M., Gravley, D. M., and Cant, J. L.: Mechanicaland physical properties of hydrothermally altered rocks, TaupoVolcanic Zone, New Zealand, J. Volcanol. Geoth. Res., 288, 76–93, https://doi.org/10.1016/j.jvolgeores.2014.10.008, 2014.
Yamasato, H., Kitagawa, S., and Komiya, M.: Effect of rainfall ondacitic lava dome collapse at Unzen volcano, Japan, Pap. Meteo-rol. Geophys., 48, 73–78, 1998.
www.nat-hazards-earth-syst-sci.net/18/3267/2018/ Nat. Hazards Earth Syst. Sci., 18, 3267–3281, 2018