the future of the drone economy - levitate capital
TRANSCRIPT
A Report From Levitate Capital
The Future of the
Drone Economy
A comprehensive analysis of the economic potential,
market opportunities, and strategic considerations in
the drone economy

1
Disclaimer
The information contained herein is intended for general informational purposes only,
does not take into account the reader’s specific circumstances, and may not reflect the
latest developments.
Certain information contained herein has been obtained from third-party sources,
which although believed to be accurate, has not been independently verified by Levitate
Capital. Further, certain information (including forward-looking statements and
economic and market information) has been obtained from published sources and/or
prepared by third parties and in certain cases has not been updated through the date
hereof. While such sources are believed to be reliable, Levitate Capital does not assume
any responsibility for the accuracy or completeness of such information. Levitate Capital
does not undertake any obligation to update the information contained herein as of any
future date.
Levitate Capital LLC disclaims, to the fullest extent, any liability for the accuracy and
completeness of the information in this document and for any acts and omissions made
on such information.
Levitate Capital has invested in a few companies mentioned in this paper, including but
not limited to: Dedrone, Elroy Air, Matternet, Shield AI, Skydio, Skyports, and
Volocopter.
2
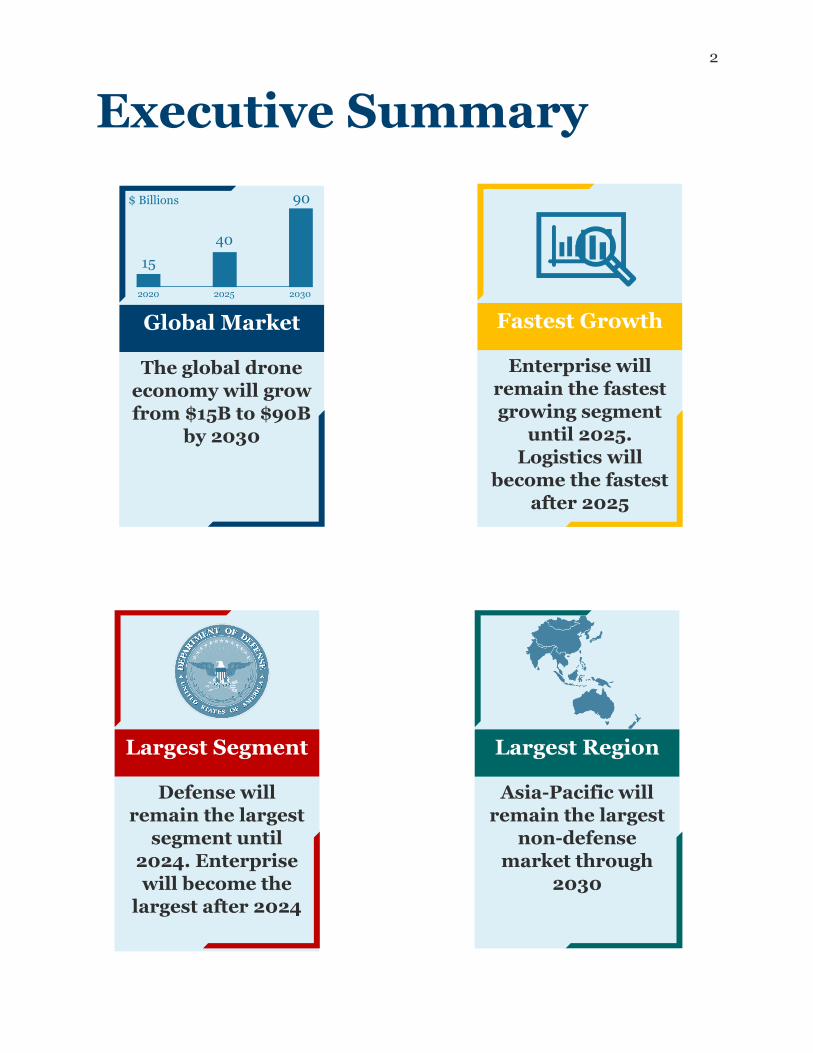
Executive Summary
The global drone
economy will grow
from $15B to $90B
by 2030
Global Market
15
40
90 $ Billions
2020 2025 2030
Enterprise will
remain the fastest
growing segment
until 2025.
Logistics will
become the fastest
after 2025
Fastest Growth
Defense will
remain the largest
segment until
2024. Enterprise
will become the
largest after 2024
Largest Segment
Asia-Pacific will
remain the largest
non-defense
market through
2030
Largest Region
3
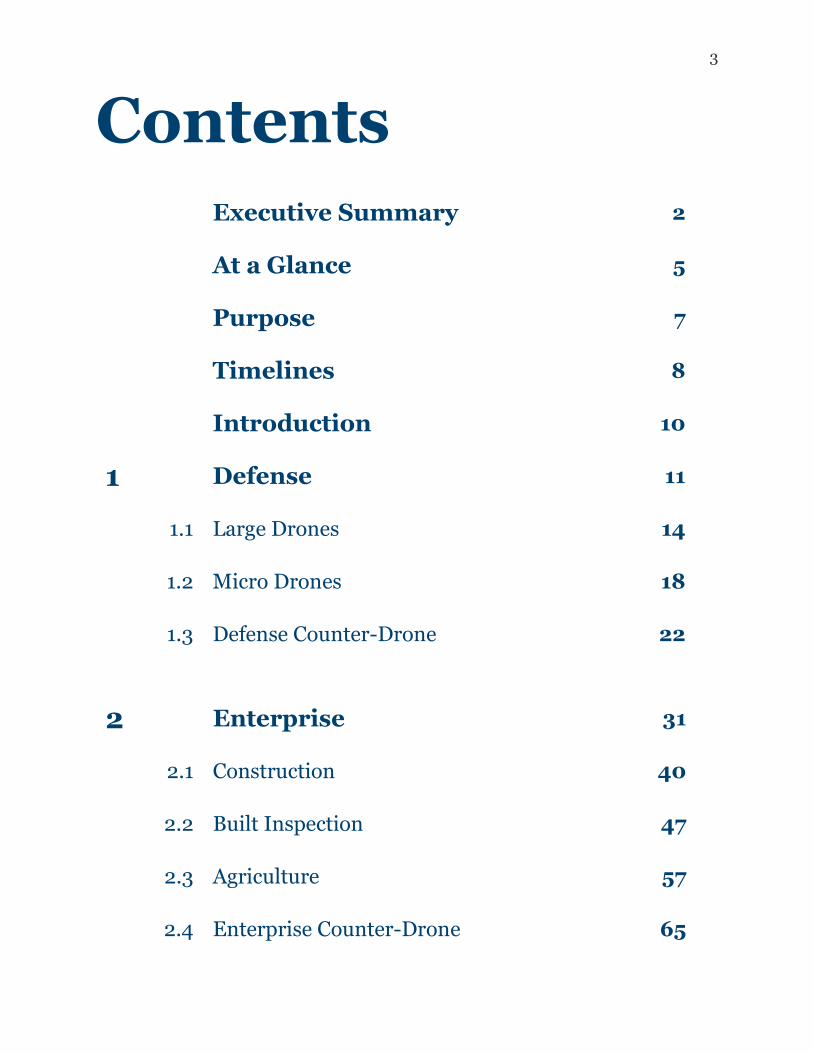
Contents
Executive Summary 2
At a Glance 5
Purpose 7
Timelines 8
Introduction 10
1 Defense 11
1.1 Large Drones 14
1.2 Micro Drones 18
1.3 Defense Counter-Drone 22
2 Enterprise 31
2.1 Construction 40
2.2 Built Inspection 47
2.3 Agriculture 57
2.4 Enterprise Counter-Drone 65
4
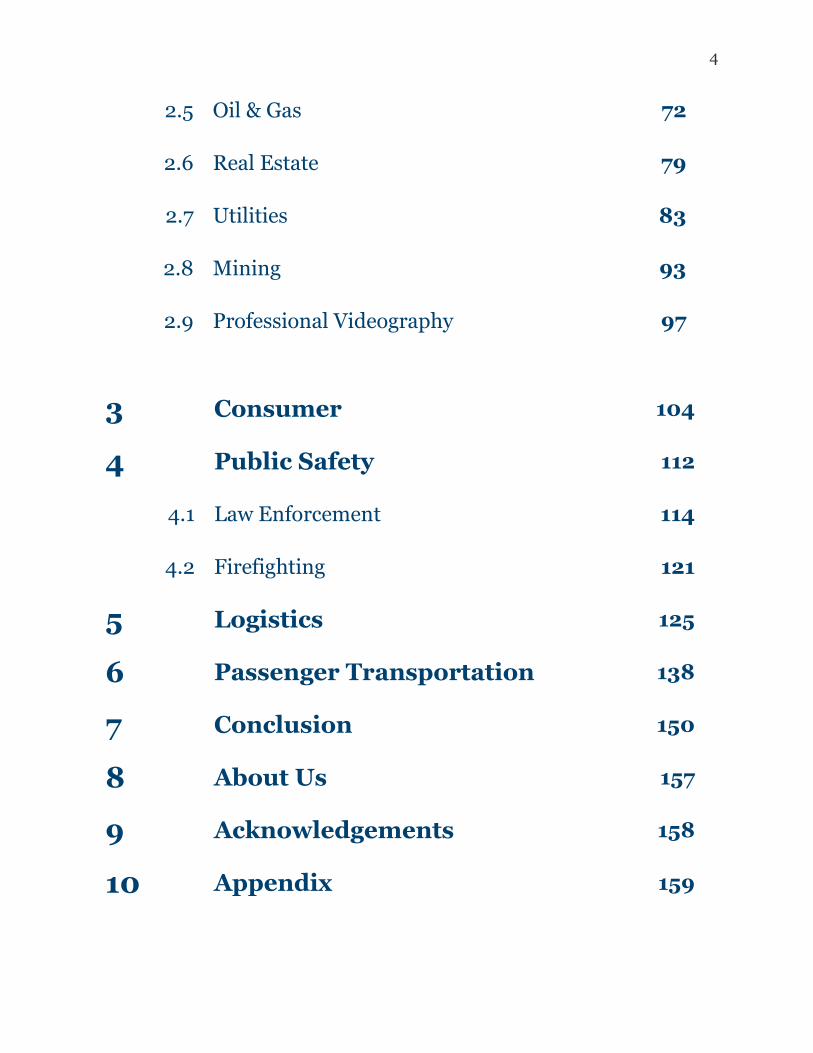
2.5 Oil & Gas 72
2.6 Real Estate 79
2.7 Utilities 83
2.8 Mining 93
2.9 Professional Videography 97
3 Consumer 104
4 Public Safety 112
4.1 Law Enforcement 114
4.2 Firefighting 121
5 Logistics 125
6 Passenger Transportation 138
7 Conclusion 150
8 About Us 157
9 Acknowledgements 158
10 Appendix 159
5
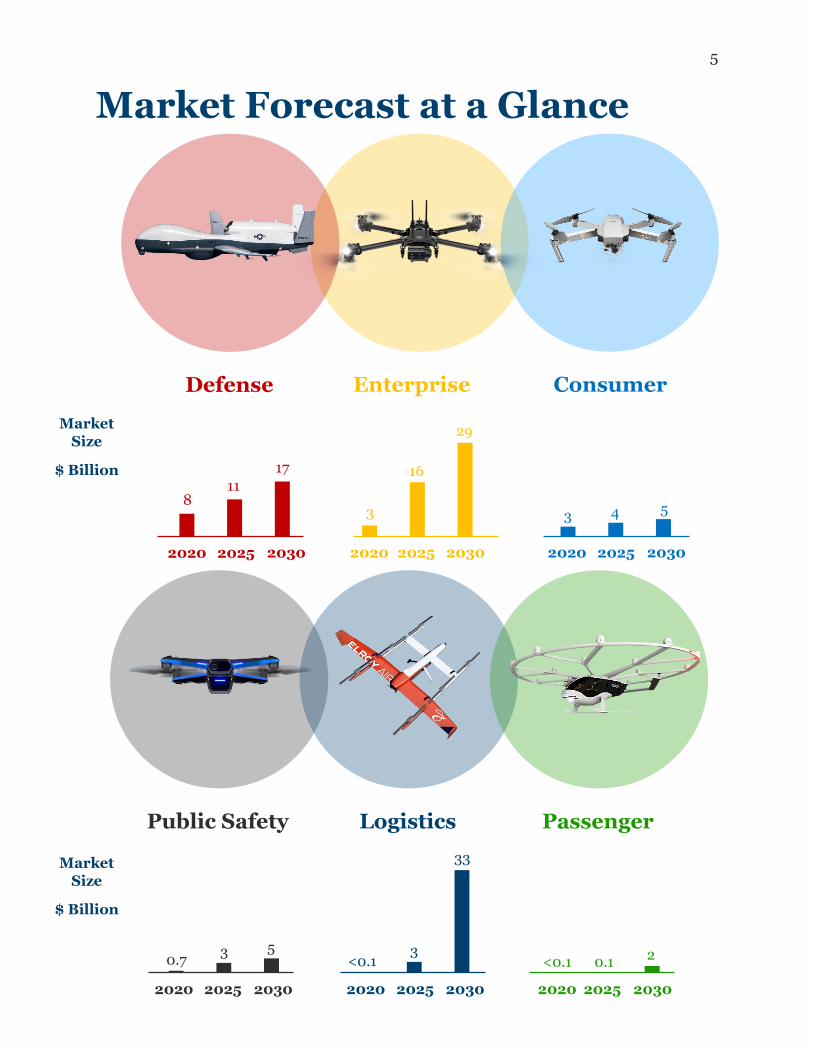
Market Forecast at a Glance
Enterprise
3
16
29
2020 2025 2030
Consumer
3 4 5
2020 2025 2030
Market
Size
$ Billion
Market
Size
$ Billion
Defense
8 11
17
2020 2025 2030
Public Safety
0.7 3 5
2020 2025 2030
Logistics
<0.1 3
33
2020 2025 2030
Passenger
<0.1 0.1 2
2020 2025 2030
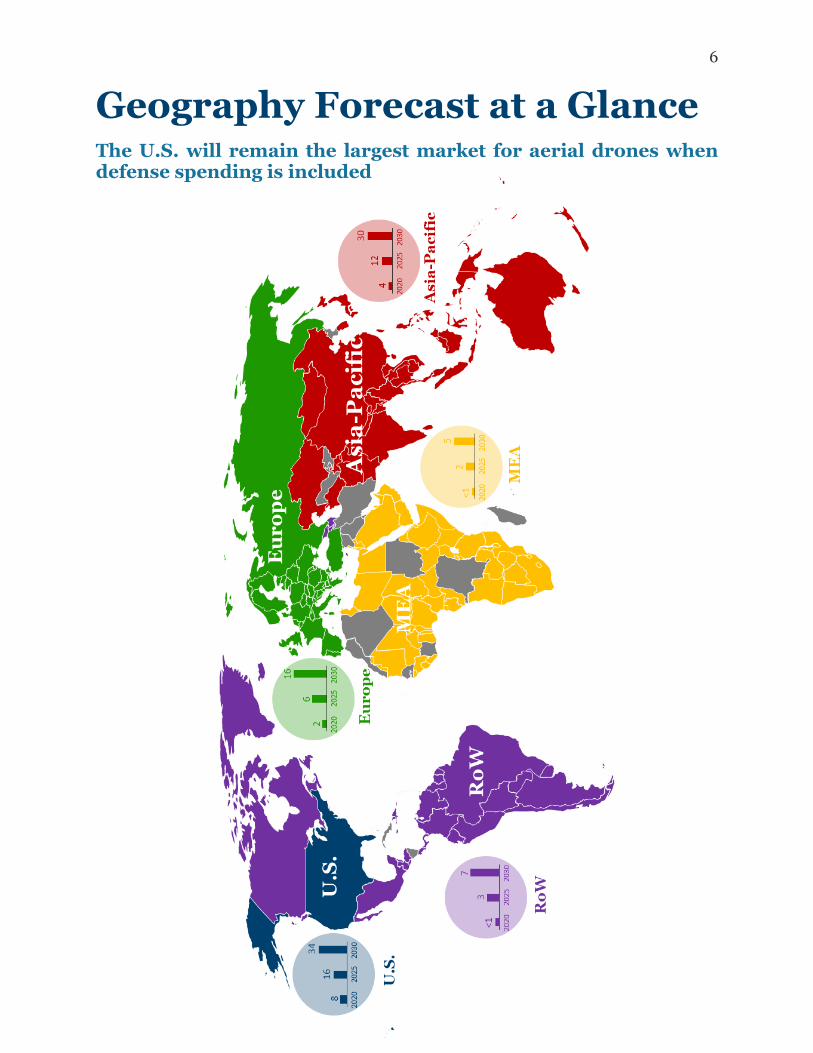
6
Geography Forecast at a Glance The U.S. will remain the largest market for aerial drones when defense spending is included
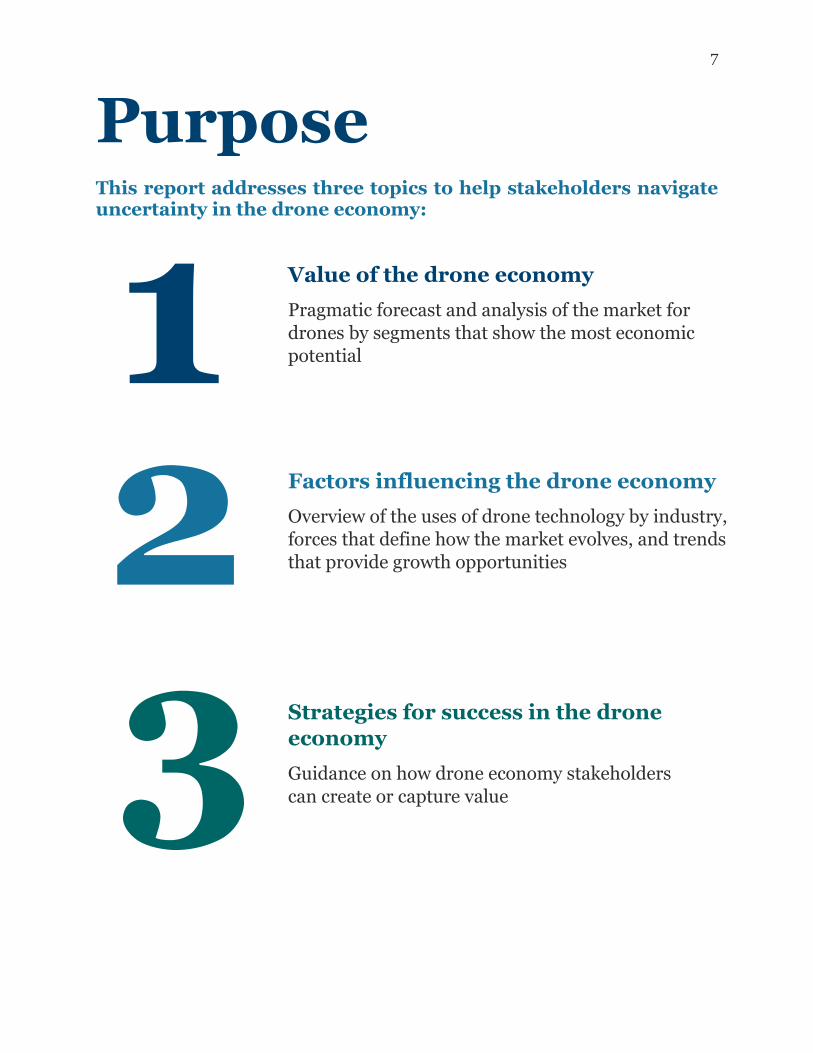
7
Purpose This report addresses three topics to help stakeholders navigate uncertainty in the drone economy:
1
2
3
Value of the drone economy
Pragmatic forecast and analysis of the market for
drones by segments that show the most economic
potential
Factors influencing the drone economy
Overview of the uses of drone technology by industry,
forces that define how the market evolves, and trends
that provide growth opportunities
Strategies for success in the drone
economy
Guidance on how drone economy stakeholders
can create or capture value
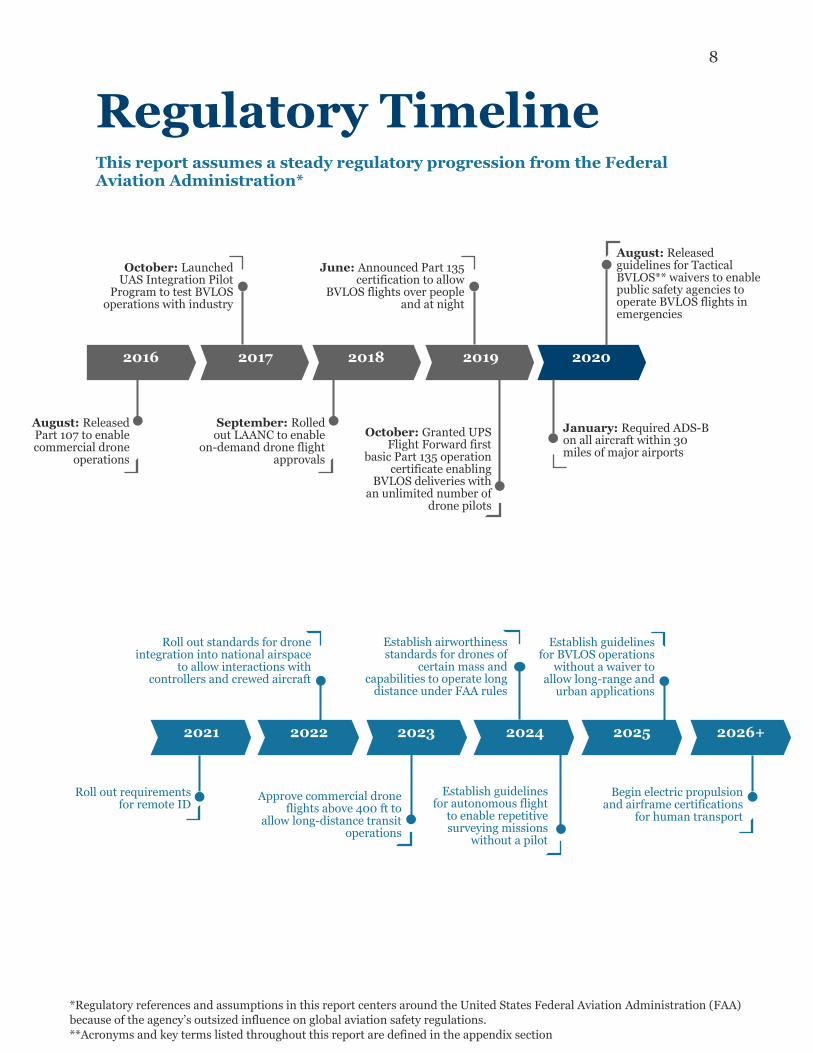
8
Regulatory Timeline
This report assumes a steady regulatory progression from the Federal Aviation Administration*
*Regulatory references and assumptions in this report centers around the United States Federal Aviation Administration (FAA)
because of the agency’s outsized influence on global aviation safety regulations. **Acronyms and key terms listed throughout this report are defined in the appendix section
2016 2018 2020 2017 2019
October: Launched UAS Integration Pilot
Program to test BVLOS operations with industry
August: Released Part 107 to enable commercial drone
operations
October: Granted UPS Flight Forward first
basic Part 135 operation certificate enabling
BVLOS deliveries with an unlimited number of
drone pilots
January: Required ADS-B on all aircraft within 30 miles of major airports
June: Announced Part 135 certification to allow
BVLOS flights over people and at night
September: Rolled out LAANC to enable
on-demand drone flight approvals
August: Released guidelines for Tactical BVLOS** waivers to enable public safety agencies to operate BVLOS flights in emergencies
2021 2023 2025 2022 2024
Establish airworthiness standards for drones of
certain mass and capabilities to operate long
distance under FAA rules
Roll out standards for drone integration into national airspace
to allow interactions with controllers and crewed aircraft
Establish guidelines for BVLOS operations
without a waiver to allow long-range and
urban applications
2026+
Roll out requirements for remote ID
Approve commercial drone flights above 400 ft to
allow long-distance transit operations
Begin electric propulsion and airframe certifications
for human transport
Establish guidelines for autonomous flight
to enable repetitive surveying missions
without a pilot
9
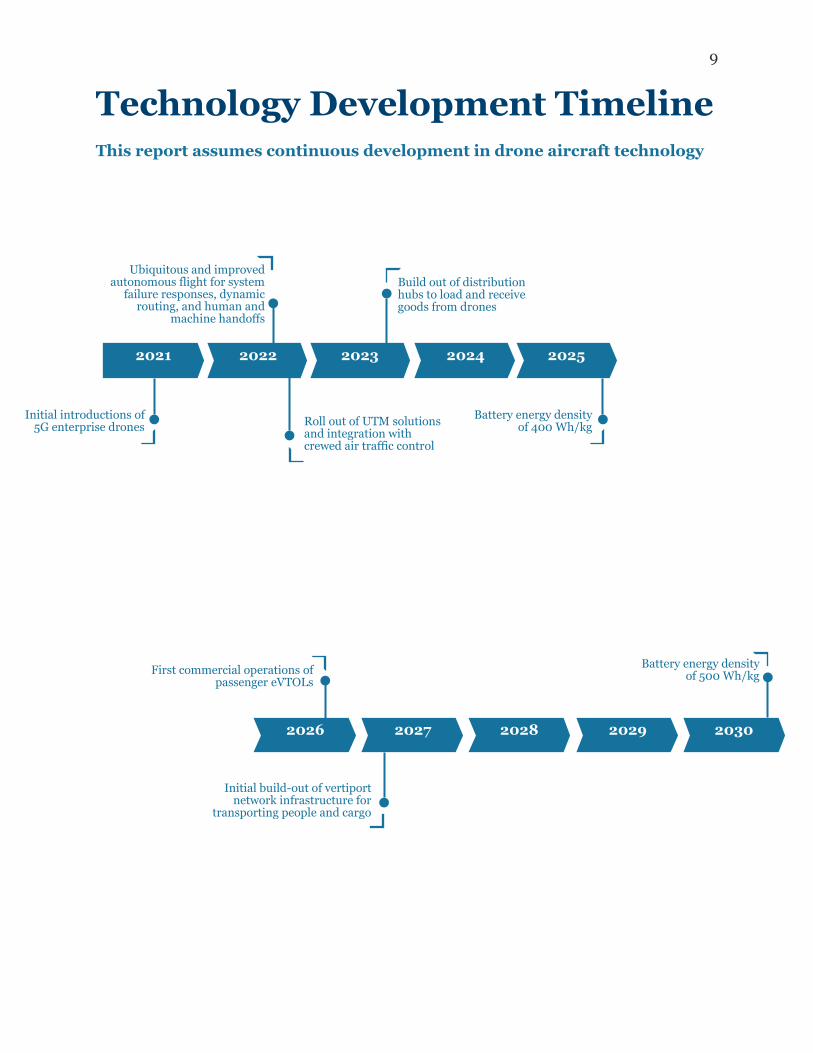
Technology Development Timeline This report assumes continuous development in drone aircraft technology
2021 2023 2025 2022 2024
Ubiquitous and improved autonomous flight for system
failure responses, dynamic routing, and human and
machine handoffs
Build out of distribution hubs to load and receive goods from drones
Battery energy density of 400 Wh/kg Roll out of UTM solutions
and integration with crewed air traffic control
Initial introductions of 5G enterprise drones
2026 2028 2030 2027 2029
Initial build-out of vertiport network infrastructure for
transporting people and cargo
First commercial operations of passenger eVTOLs
Battery energy density of 500 Wh/kg
10
Introduction
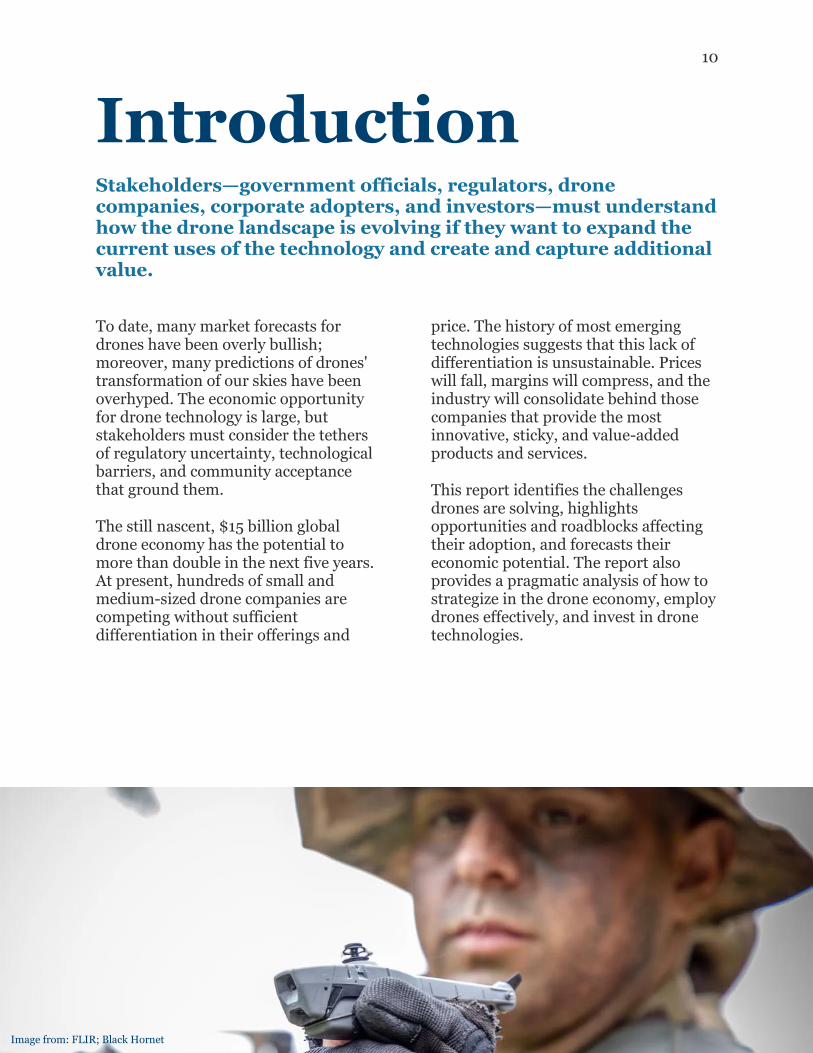
Stakeholders—government officials, regulators, drone companies, corporate adopters, and investors—must understand how the drone landscape is evolving if they want to expand the current uses of the technology and create and capture additional value.
To date, many market forecasts for drones have been overly bullish; moreover, many predictions of drones' transformation of our skies have been overhyped. The economic opportunity for drone technology is large, but stakeholders must consider the tethers of regulatory uncertainty, technological barriers, and community acceptance that ground them.
The still nascent, $15 billion global drone economy has the potential to more than double in the next five years. At present, hundreds of small and medium-sized drone companies are competing without sufficient differentiation in their offerings and
price. The history of most emerging technologies suggests that this lack of differentiation is unsustainable. Prices will fall, margins will compress, and the industry will consolidate behind those companies that provide the most innovative, sticky, and value-added products and services.
This report identifies the challenges drones are solving, highlights opportunities and roadblocks affecting their adoption, and forecasts their economic potential. The report also provides a pragmatic analysis of how to strategize in the drone economy, employ drones effectively, and invest in drone technologies.
Image from: FLIR; Black Hornet
11
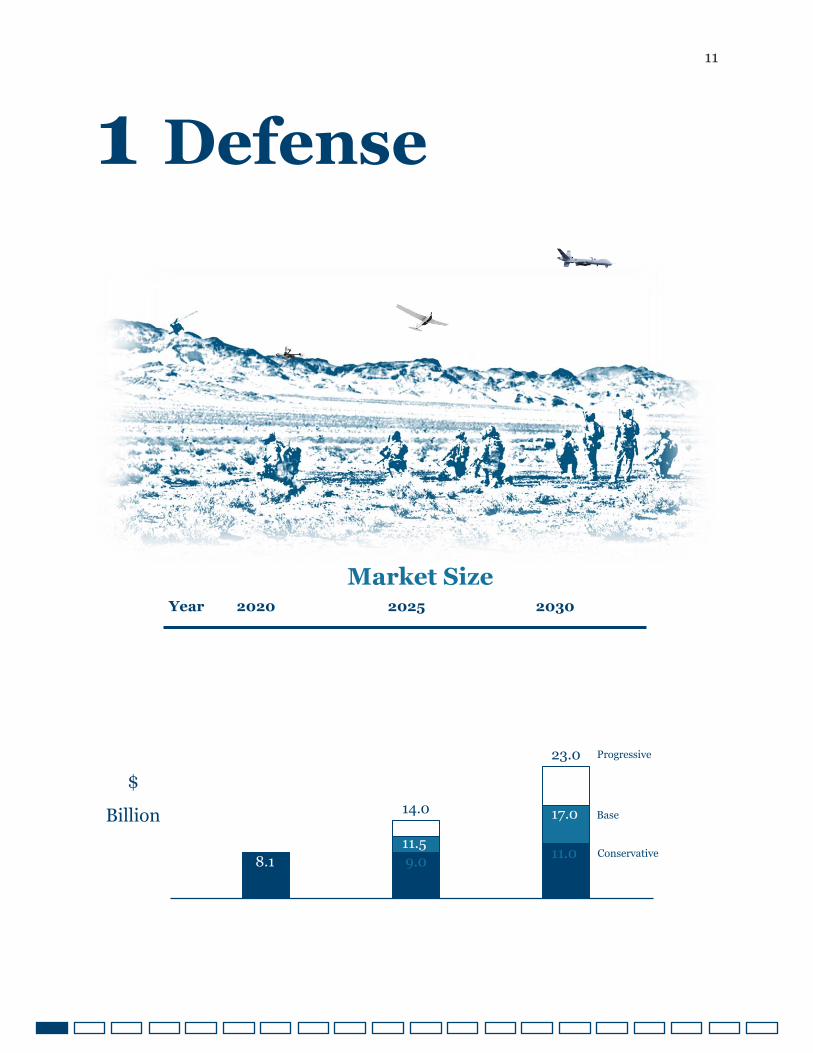
1 Defense
14 $
Billion
Market Size
Year 2020 2025 2030
8.1 9.0 11.0
11.5
17.0 14.0
23.0 Progressive
Base
Conservative
12
1 Defense
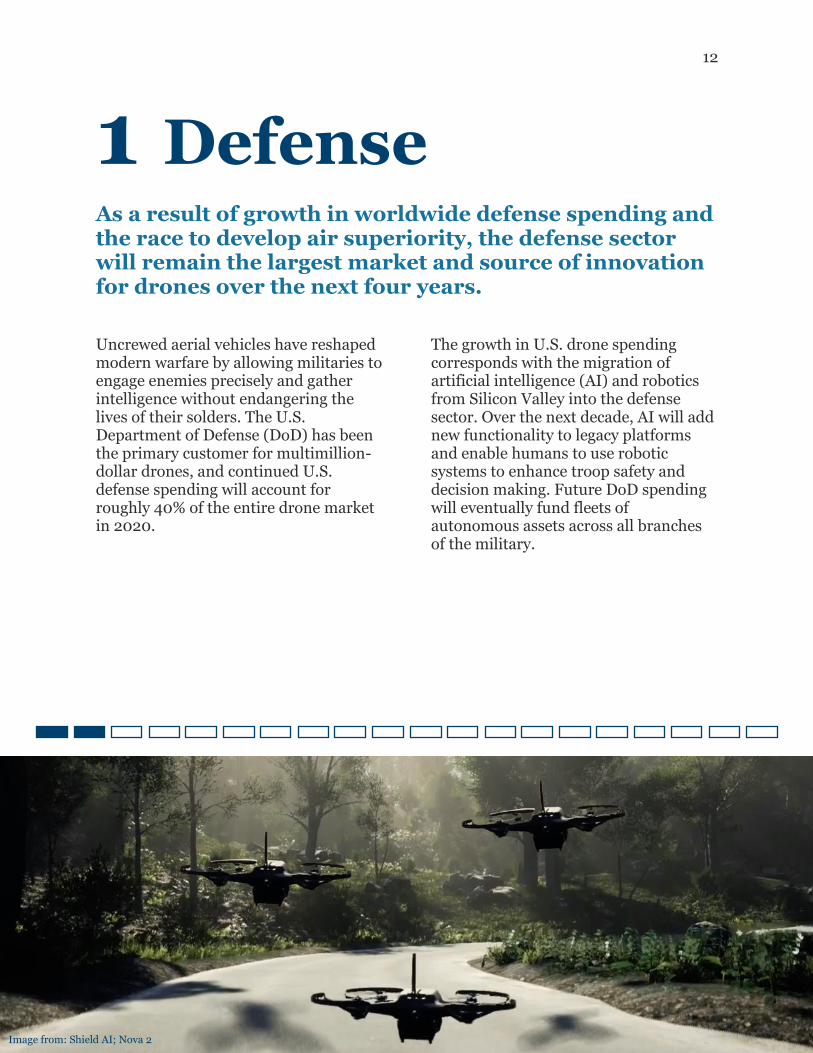
As a result of growth in worldwide defense spending and the race to develop air superiority, the defense sector will remain the largest market and source of innovation for drones over the next four years.
Uncrewed aerial vehicles have reshaped modern warfare by allowing militaries to engage enemies precisely and gather intelligence without endangering the lives of their solders. The U.S. Department of Defense (DoD) has been the primary customer for multimillion-dollar drones, and continued U.S. defense spending will account for roughly 40% of the entire drone market in 2020.
The growth in U.S. drone spending corresponds with the migration of artificial intelligence (AI) and robotics from Silicon Valley into the defense sector. Over the next decade, AI will add new functionality to legacy platforms and enable humans to use robotic systems to enhance troop safety and decision making. Future DoD spending will eventually fund fleets of autonomous assets across all branches of the military.
Image from: Shield AI; Nova 2
13
1 Defense
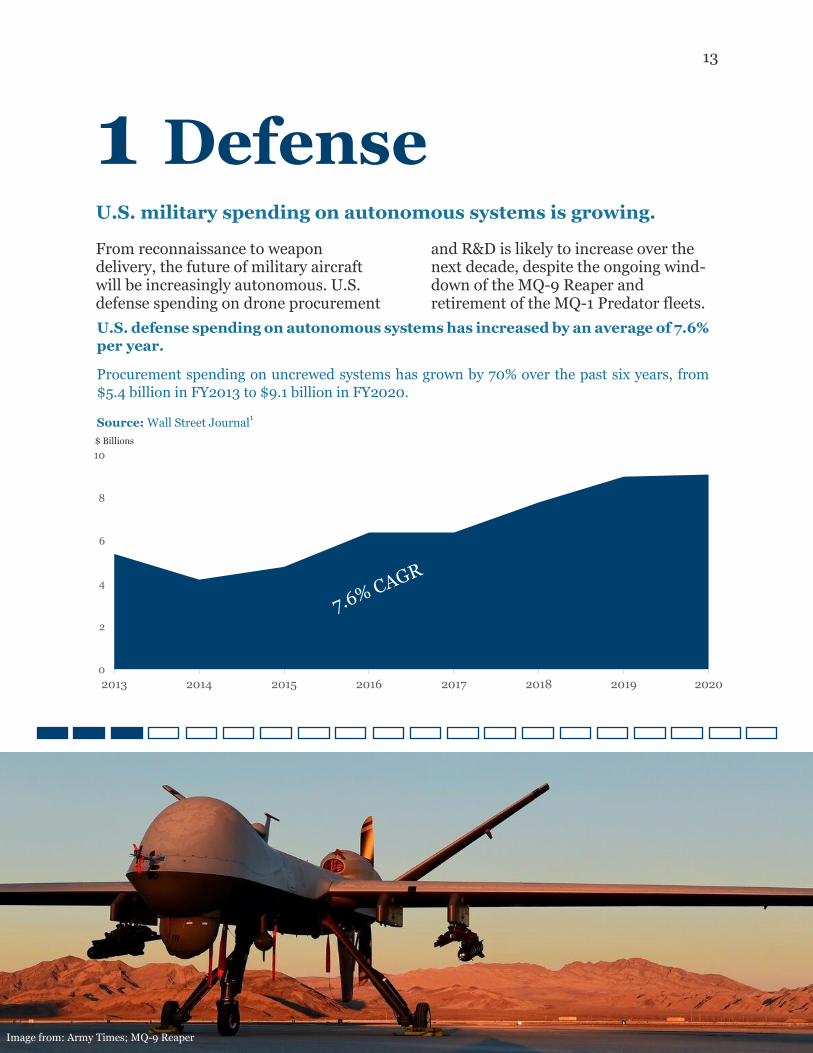
U.S. military spending on autonomous systems is growing.
From reconnaissance to weapon delivery, the future of military aircraft will be increasingly autonomous. U.S. defense spending on drone procurement
and R&D is likely to increase over the next decade, despite the ongoing wind-down of the MQ-9 Reaper and retirement of the MQ-1 Predator fleets.
U.S. defense spending on autonomous systems has increased by an average of 7.6%
per year.
Procurement spending on uncrewed systems has grown by 70% over the past six years, from
$5.4 billion in FY2013 to $9.1 billion in FY2020.
Source: Wall Street Journal1
0
2
4
6
8
10
2013 2014 2015 2016 2017 2018 2019 2020
$ Billions
Image from: Army Times; MQ-9 Reaper
14
1.1 Defense: Large Drones
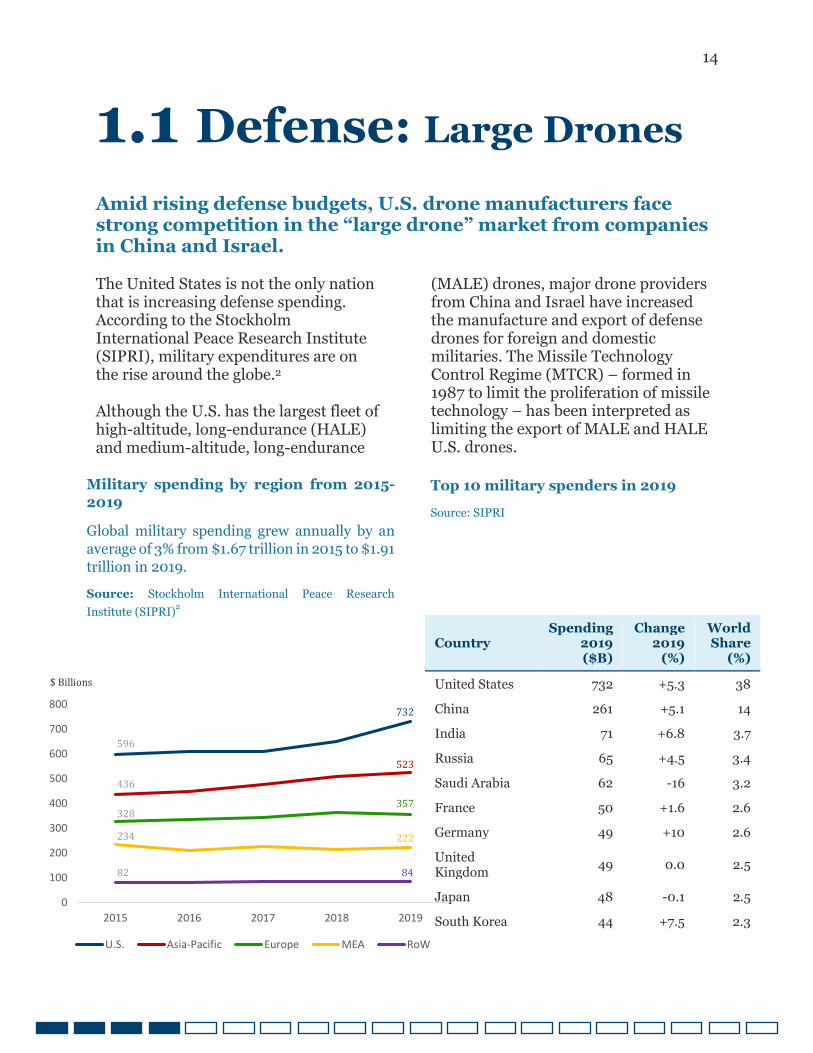
Amid rising defense budgets, U.S. drone manufacturers face strong competition in the “large drone” market from companies in China and Israel. The United States is not the only nation that is increasing defense spending. According to the Stockholm International Peace Research Institute (SIPRI), military expenditures are on the rise around the globe.2
Although the U.S. has the largest fleet of high-altitude, long-endurance (HALE) and medium-altitude, long-endurance
(MALE) drones, major drone providers from China and Israel have increased the manufacture and export of defense drones for foreign and domestic militaries. The Missile Technology Control Regime (MTCR) – formed in 1987 to limit the proliferation of missile technology – has been interpreted as limiting the export of MALE and HALE U.S. drones.
Country Spending
2019 ($B)
Change 2019
(%)
World Share
(%)
United States 732 +5.3 38
China 261 +5.1 14
India 71 +6.8 3.7
Russia 65 +4.5 3.4
Saudi Arabia 62 -16 3.2
France 50 +1.6 2.6
Germany 49 +10 2.6
United Kingdom
49 0.0 2.5
Japan 48 -0.1 2.5
South Korea 44 +7.5 2.3
Military spending by region from 2015-
2019
Global military spending grew annually by an
average of 3% from $1.67 trillion in 2015 to $1.91
trillion in 2019.
Source: Stockholm International Peace Research
Institute (SIPRI)2
0
100
200
300
400
500
600
700
800
2015 2016 2017 2018 2019
U.S. Asia-Pacific Europe MEA RoW
$ Billions
732
523
357
222
84
596
436
328
234
82
Top 10 military spenders in 2019
Source: SIPRI
15
1.1 Defense: Large Drones
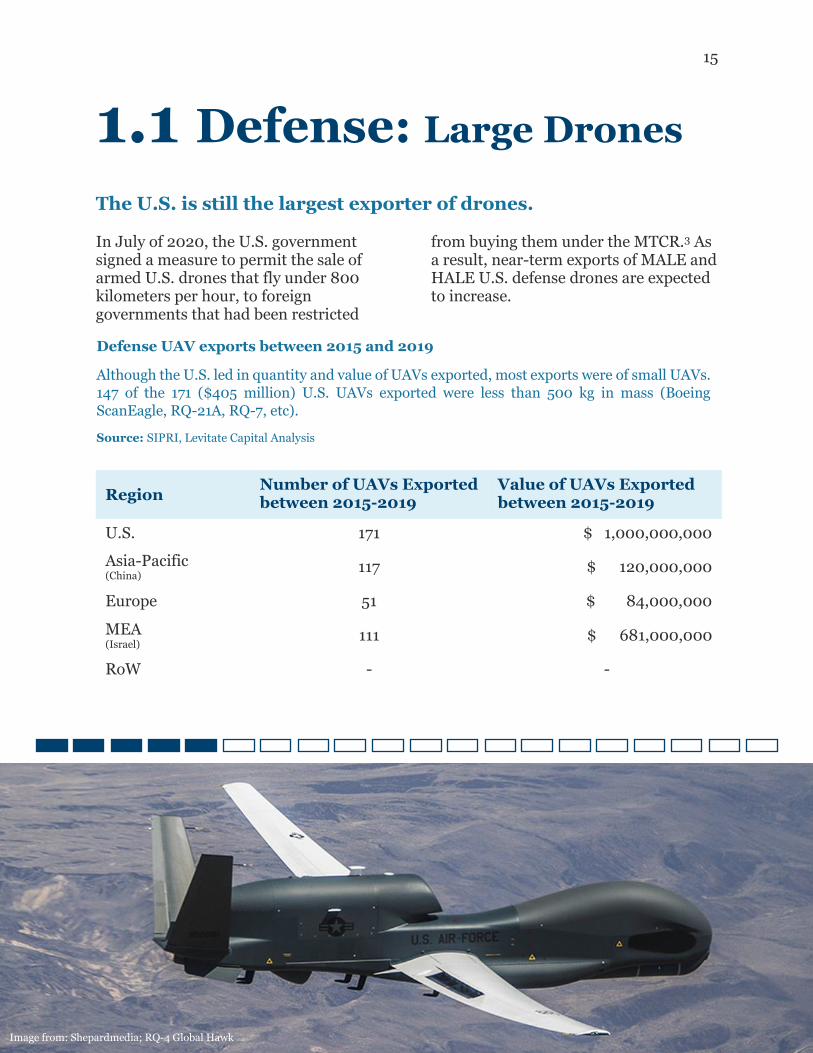
The U.S. is still the largest exporter of drones. In July of 2020, the U.S. government signed a measure to permit the sale of armed U.S. drones that fly under 800 kilometers per hour, to foreign governments that had been restricted
from buying them under the MTCR.3 As a result, near-term exports of MALE and HALE U.S. defense drones are expected to increase.
Region Number of UAVs Exported between 2015-2019
Value of UAVs Exported between 2015-2019
U.S. 171 $ 1,000,000,000 Asia-Pacific (China) 117 $ 120,000,000
Europe 51 $ 84,000,000
MEA (Israel) 111 $ 681,000,000
RoW - -
Defense UAV exports between 2015 and 2019
Although the U.S. led in quantity and value of UAVs exported, most exports were of small UAVs.
147 of the 171 ($405 million) U.S. UAVs exported were less than 500 kg in mass (Boeing
ScanEagle, RQ-21A, RQ-7, etc).
Source: SIPRI, Levitate Capital Analysis
Image from: Shepardmedia; RQ-4 Global Hawk
16
1.1 Defense: Large Drones
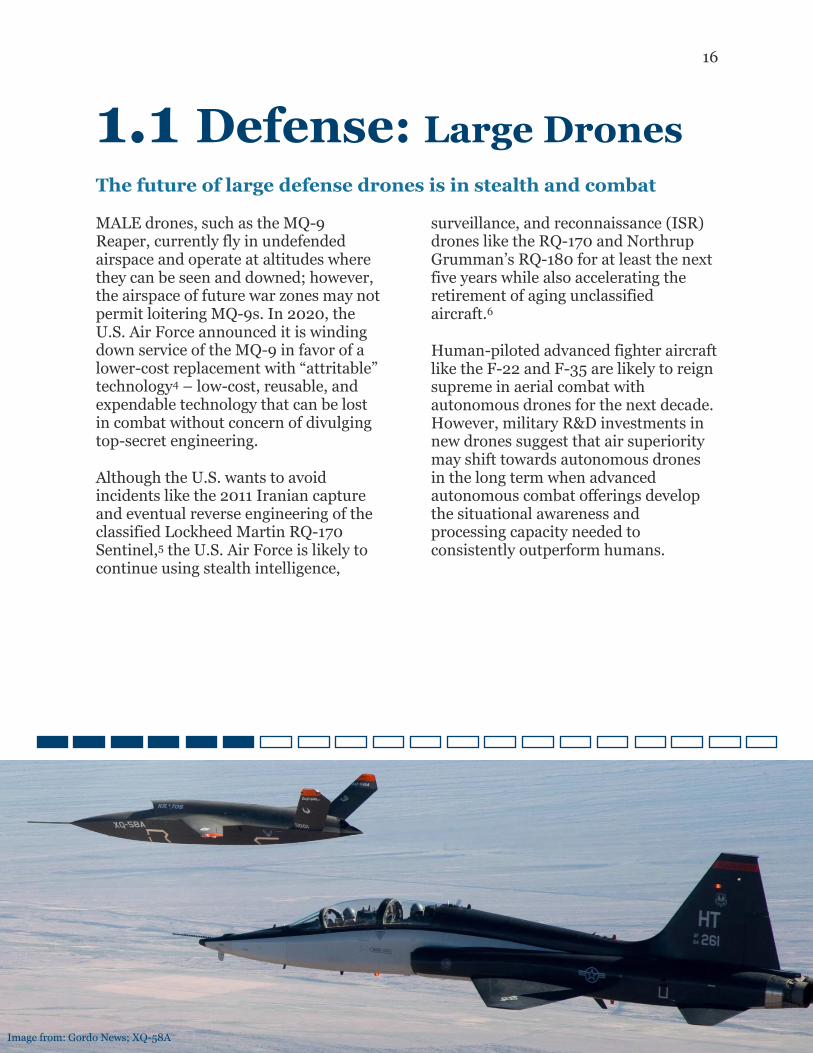
The future of large defense drones is in stealth and combat
MALE drones, such as the MQ-9 Reaper, currently fly in undefended airspace and operate at altitudes where they can be seen and downed; however, the airspace of future war zones may not permit loitering MQ-9s. In 2020, the U.S. Air Force announced it is winding down service of the MQ-9 in favor of a lower-cost replacement with “attritable” technology4 – low-cost, reusable, and expendable technology that can be lost in combat without concern of divulging top-secret engineering.
Although the U.S. wants to avoid incidents like the 2011 Iranian capture and eventual reverse engineering of the classified Lockheed Martin RQ-170 Sentinel,5 the U.S. Air Force is likely to continue using stealth intelligence,
surveillance, and reconnaissance (ISR) drones like the RQ-170 and Northrup Grumman’s RQ-180 for at least the next five years while also accelerating the retirement of aging unclassified aircraft.6
Human-piloted advanced fighter aircraft like the F-22 and F-35 are likely to reign supreme in aerial combat with autonomous drones for the next decade. However, military R&D investments in new drones suggest that air superiority may shift towards autonomous drones in the long term when advanced autonomous combat offerings develop the situational awareness and processing capacity needed to consistently outperform humans.
Image from: Gordo News; XQ-58A
17
1.1 Defense: Large Drones
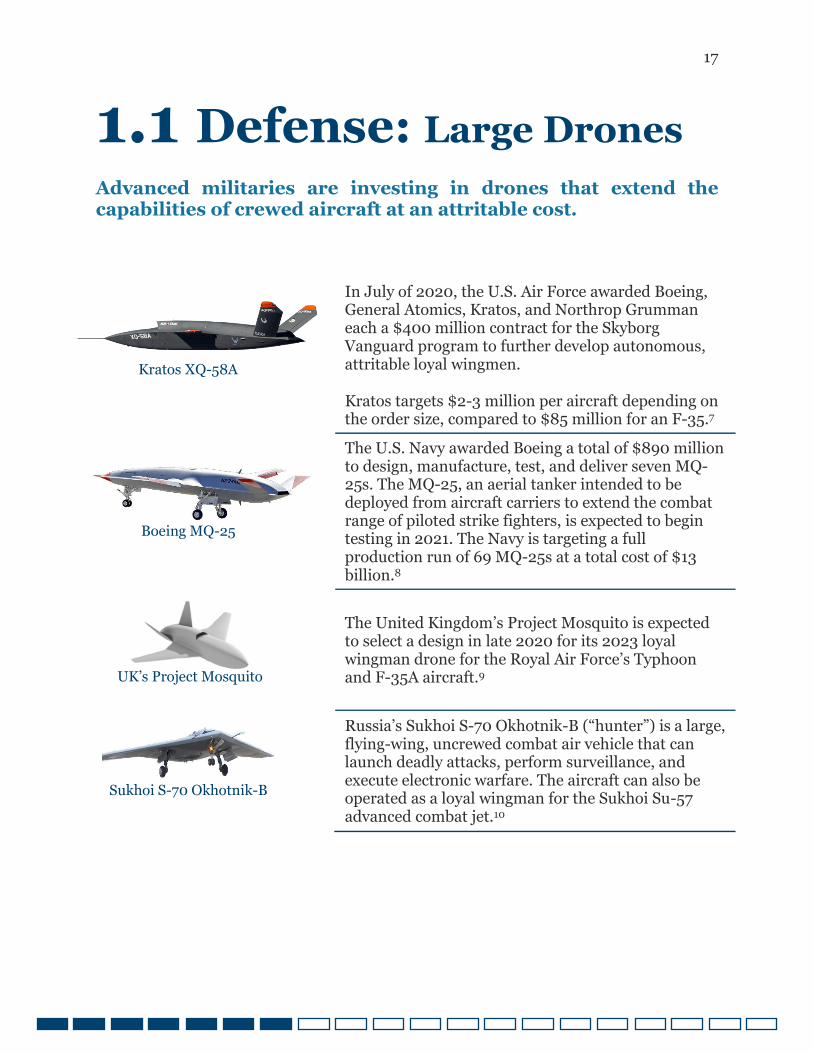
Advanced militaries are investing in drones that extend the capabilities of crewed aircraft at an attritable cost.
In July of 2020, the U.S. Air Force awarded Boeing, General Atomics, Kratos, and Northrop Grumman each a $400 million contract for the Skyborg Vanguard program to further develop autonomous, attritable loyal wingmen.
Kratos targets $2-3 million per aircraft depending on the order size, compared to $85 million for an F-35.7
The U.S. Navy awarded Boeing a total of $890 million to design, manufacture, test, and deliver seven MQ-25s. The MQ-25, an aerial tanker intended to be deployed from aircraft carriers to extend the combat range of piloted strike fighters, is expected to begin testing in 2021. The Navy is targeting a full production run of 69 MQ-25s at a total cost of $13 billion.8
The United Kingdom’s Project Mosquito is expected to select a design in late 2020 for its 2023 loyal wingman drone for the Royal Air Force’s Typhoon and F-35A aircraft.9
Russia’s Sukhoi S-70 Okhotnik-B (“hunter”) is a large, flying-wing, uncrewed combat air vehicle that can launch deadly attacks, perform surveillance, and execute electronic warfare. The aircraft can also be operated as a loyal wingman for the Sukhoi Su-57 advanced combat jet.10
Kratos XQ-58A
Boeing MQ-25
UK’s Project Mosquito
Sukhoi S-70 Okhotnik-B
18
1.2 Defense: Micro Drones
Defense micro drones are on the rise. While large HALE and MALE drones will continue to account for most worldwide defense drone spending, defense arsenals will soon add more compact rotary drones. Compact drones are not new on the battlefield. The U.S. has deployed AeroVironment’s fixed-wing RQ-11 Raven and RQ-20 Puma drones at the battalion level for midrange reconnaissance since the mid-2000s and 2010s, respectively. In May of 2020, the U.S. Army awarded AeroVironment a $76 million Lethal Miniature Aerial Missile Systems (LMAMS) procurement contract for its Switchblade drone, a back-packable loitering munition drone for beyond visual line of sight (BVLOS) targets.11
Rotary drones, however, have been notably absent from military toolkits
because of their slow speeds, short battery lives, and fragility compared with fixed-winged alternatives.
Improvements in rotary drone performance and the integration of powerful onboard sensors have unlocked tactical use cases for military adoption. In February of 2020, the Swiss Armed Forces chose Europe’s leading drone company, Parrot, to supply rotary drones for its Mini UAV program.12
In August of 2020, the U.S. DoD’s Defense Innovation Unit (DIU) approved five U.S. made multi-rotor drones for use in government applications.
19
1.2 Defense: Micro Drones
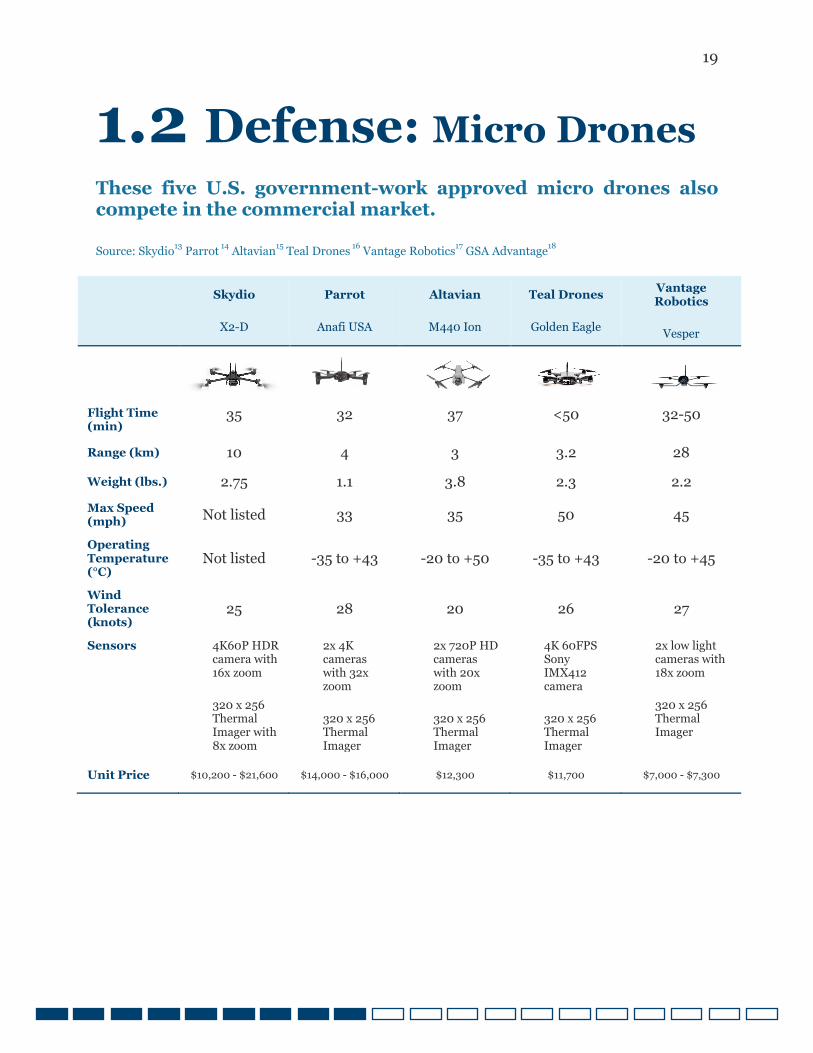
These five U.S. government-work approved micro drones also compete in the commercial market. Source: Skydio
13 Parrot
14 Altavian
15 Teal Drones
16 Vantage Robotics
17 GSA Advantage
18
Skydio
X2-D
Parrot
Anafi USA
Altavian
M440 Ion
Teal Drones
Golden Eagle
Vantage Robotics
Vesper
Flight Time (min)
35 32 37 <50 32-50
Range (km) 10 4 3 3.2 28
Weight (lbs.) 2.75 1.1 3.8 2.3 2.2
Max Speed (mph)
Not listed 33 35 50 45
Operating Temperature (°C)
Not listed -35 to +43 -20 to +50 -35 to +43 -20 to +45
Wind Tolerance (knots)
25 28 20 26 27
Sensors 4K60P HDR camera with 16x zoom
320 x 256 Thermal Imager with 8x zoom
2x 4K cameras with 32x zoom
320 x 256 Thermal Imager
2x 720P HD cameras with 20x zoom
320 x 256 Thermal Imager
4K 60FPS Sony IMX412 camera
320 x 256 Thermal Imager
2x low light cameras with 18x zoom
320 x 256 Thermal Imager
Unit Price $10,200 - $21,600 $14,000 - $16,000 $12,300 $11,700 $7,000 - $7,300
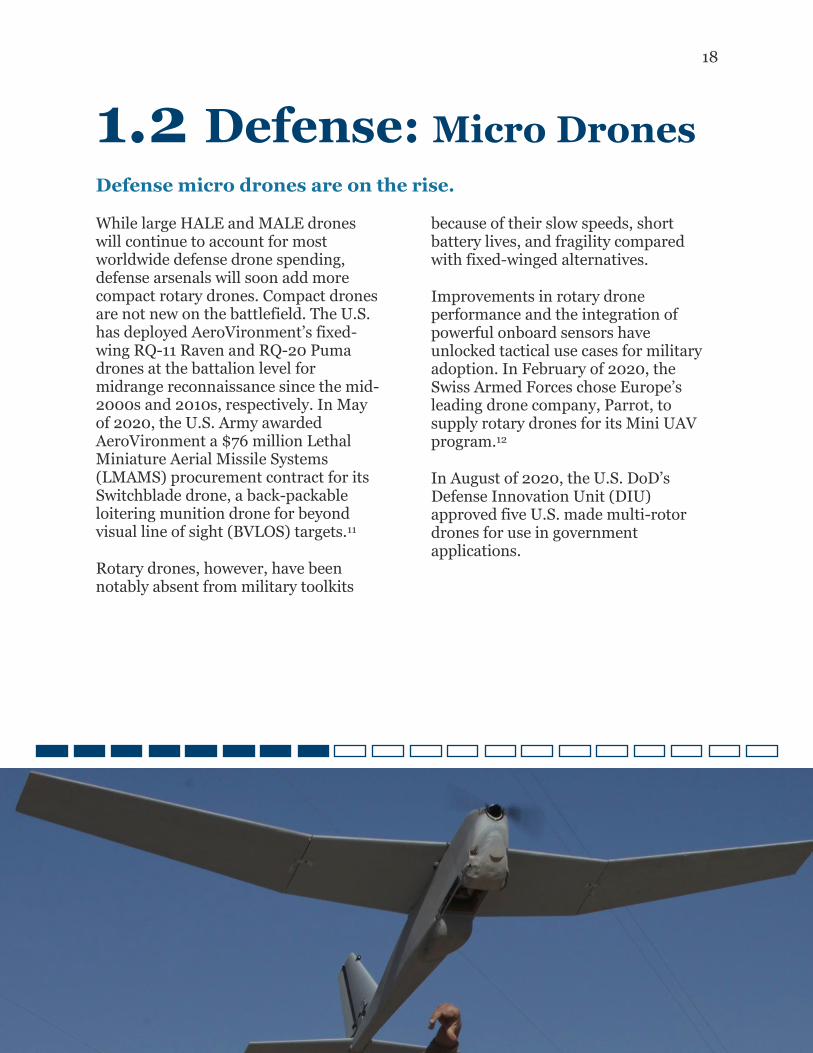
Image from: U.S. Marine Corps; RQ-20 Puma

20
1.2 Defense: Micro Drones
Ground forces procurement contracts for micro drones could be lucrative.
Small drones in the military are rapidly deployed situational awareness tools. They can be deployed to gain a bird’s eye view of the battlefield or to autonomously navigate a building to clear rooms before troops enter.
Modern military ground forces will likely acquire at least one rotary drone per platoon to perform short-range, quick-look reconnaissance missions, resulting in more than 19,000 units acquired by the U.S. Army and U.S. Marine Corps (USMC).
Total costs to supply U.S. Army
and USMC units with micro
drones
The progressive case is one drone per
squad in a soldier-borne sensor
capacity, and the conservative case is
one drone per company.
Replacements are not included.
Source: Levitate Capital Analysis
Squad Platoon Company
U.S. Army U.S. Marines
$1.3B
$400M
$60M
71%
29%
65%
35%
10 troops 36 troops 200 troops
Image from: Skydio; Skydio X2
21
1.2 Defense Defense aircraft forecast methodology
In this market analysis, military drones refer to aircraft designed to operate alongside armed forces. These aircraft range from multi-rotor and hand-launched drones to jet aircraft.
Comparing the total value of known drones acquired by the U.S. military over the past five years with known drones acquired by other nations, the ratio of drone procurement spending of other regions to the United States was determined to be 14% for Asia-Pacific, 12% for Europe, 5% for the Middle East and Africa, and 6% for the rest of the world.
The forecast of future U.S. defense procurement spending is based on the Congressional Budget Office’s projection for U.S. Air Force aircraft procurement.20
In 2019, U.S. defense spending on drones was $6 billion with more than 60%, or $3.7 billion, spent on procurement.21 This report assumes future U.S. defense spending will maintain its historical procurement to RDT&E spending ratio. Investment in drones has historically grown at roughly 7% per year since 201322 and drones have historically represented approximately 3.5% of U.S. Air Force and Navy procurement spending. This ratio is anticipated to increase by 0.25% each year as autonomous aircraft play larger roles in future engagements.
The conservative case assumes that drone spending as a percentage of budgets will not grow over time. The progressive case assumes an accelerated reduction in the use of crewed aircraft with an annual increase in drone spending as a percentage of budgets by 0.3%.
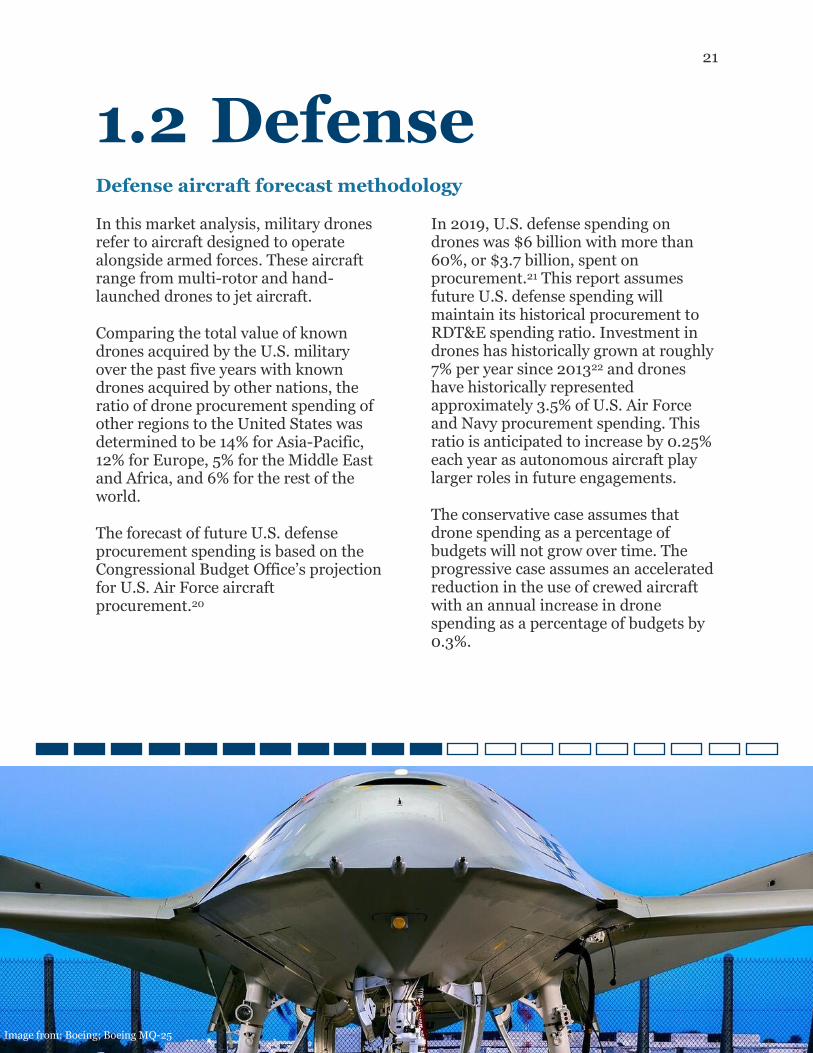
Image from: Boeing; Boeing MQ-25
22
1.3 Defense: Counter Drone
U.S. defense tends to research counter drone rather than procure technology. Faced with a dramatic uptick in attacks from off-the-shelf drones on the battlefield, the U.S. DoD poured billions of dollars into counter uncrewed aircraft systems (CUAS). The vast majority of spending was awarded to prime defense contractors for R&D contracts. Testing and R&D have accounted for almost all defense CUAS spending because many of the more than 530 counter-drone systems produced by more than 150 manufacturers in 33 countries23 either offer unproven capabilities or perform differently than advertised outside of a controlled environment.
While future defense spending on CUAS will shift from R&D towards
procurement, previous recipients of CUAS R&D contracts and a small group of the highest performing CUAS currently in use by the U.S. DoD will be the primary recipients of future U.S. defense CUAS spending.24
Going forward, all U.S. military branches will synchronize on a common architecture for evaluating, acquiring, and interoperating emerging CUAS technology on an annual basis. CUAS companies that have not received U.S. DoD contracts may explore opportunities from other NATO member defense departments or the smaller but growing commercial market.
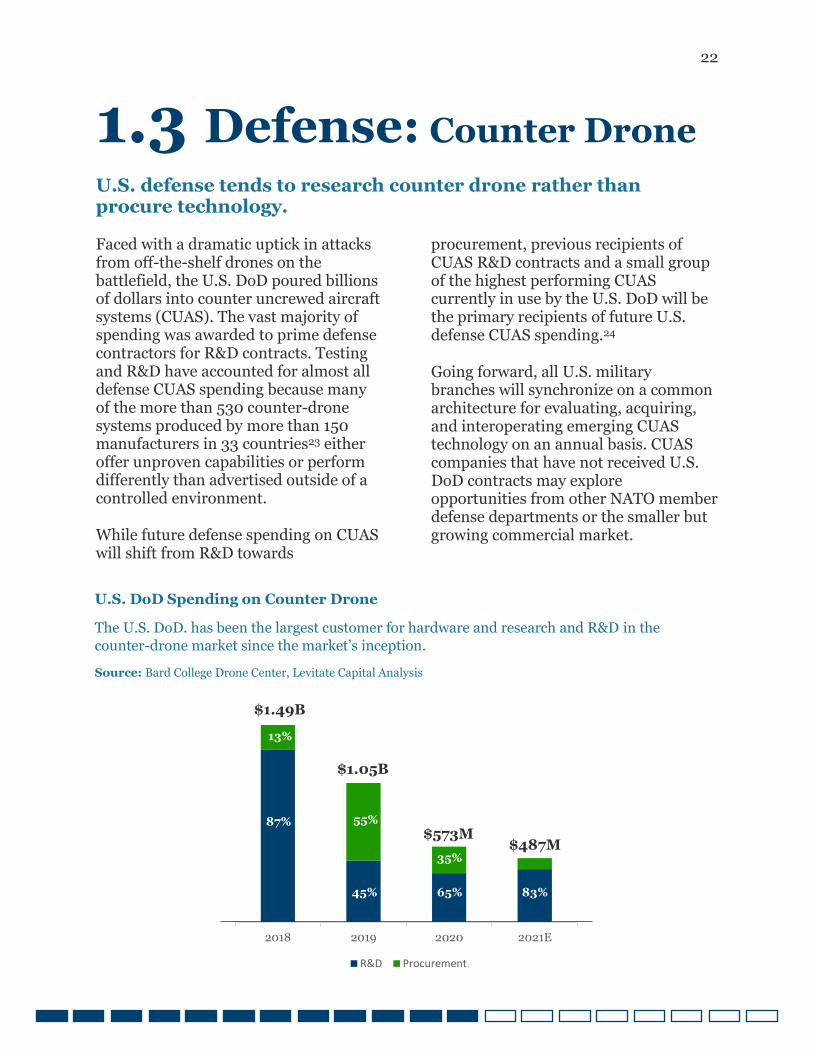
U.S. DoD Spending on Counter Drone
The U.S. DoD. has been the largest customer for hardware and research and R&D in the
counter-drone market since the market’s inception.
Source: Bard College Drone Center, Levitate Capital Analysis
2018 2019 2020 2021E
R&D Procurement
$1.49B
$1.05B
87%
13%
65%
35% $573M
$487M
45% 65% 83%
55%
35%
23
1.3 Defense: Counter Drone
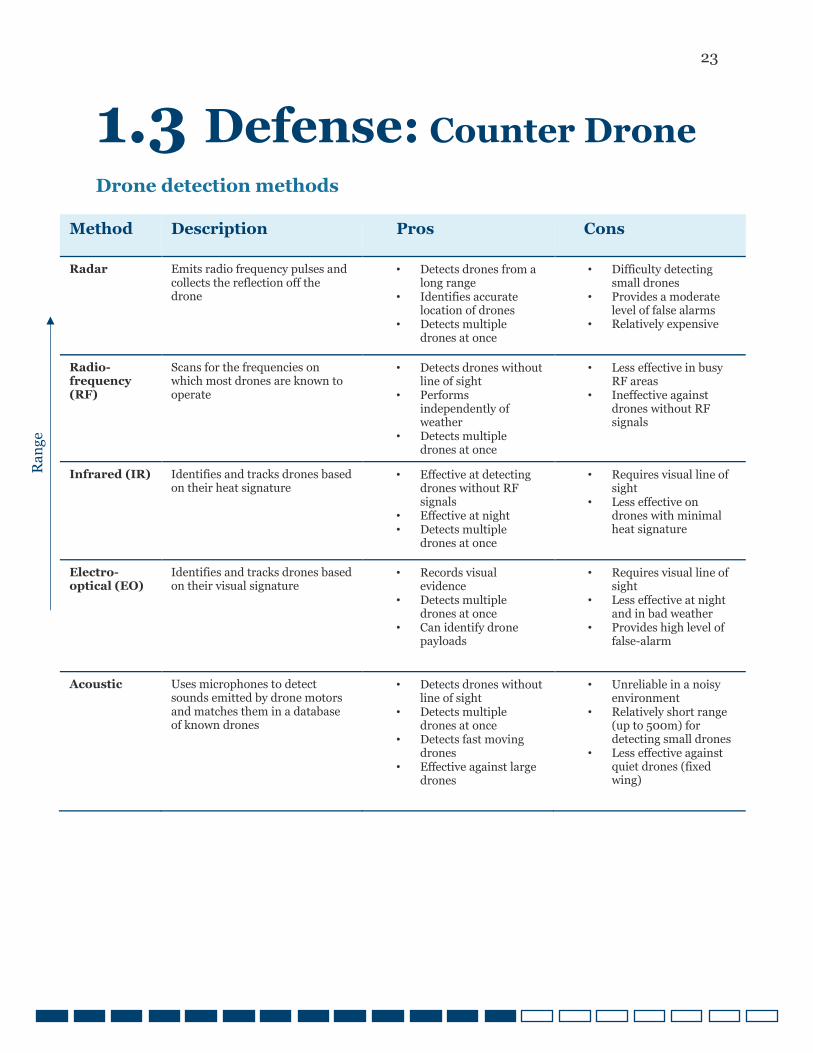
Drone detection methods
Method Description Pros Cons
Radar
Emits radio frequency pulses and collects the reflection off the drone
• Detects drones from a long range
• Identifies accurate location of drones
• Detects multiple drones at once
• Difficulty detecting small drones
• Provides a moderate level of false alarms
• Relatively expensive
Radio-frequency (RF)
Scans for the frequencies on which most drones are known to operate
• Detects drones without line of sight
• Performs independently of weather
• Detects multiple drones at once
• Less effective in busy RF areas
• Ineffective against drones without RF signals
Infrared (IR) Identifies and tracks drones based on their heat signature
• Effective at detecting drones without RF signals
• Effective at night • Detects multiple
drones at once
• Requires visual line of sight
• Less effective on drones with minimal heat signature
Electro-optical (EO)
Identifies and tracks drones based on their visual signature
• Records visual evidence
• Detects multiple drones at once
• Can identify drone payloads
• Requires visual line of sight
• Less effective at night and in bad weather
• Provides high level of false-alarm
Acoustic
Uses microphones to detect sounds emitted by drone motors and matches them in a database of known drones
• Detects drones without line of sight
• Detects multiple drones at once
• Detects fast moving drones
• Effective against large drones
• Unreliable in a noisy environment
• Relatively short range (up to 500m) for detecting small drones
• Less effective against quiet drones (fixed wing)
Ra
ng
e
24
1.3 Defense: Counter Drone
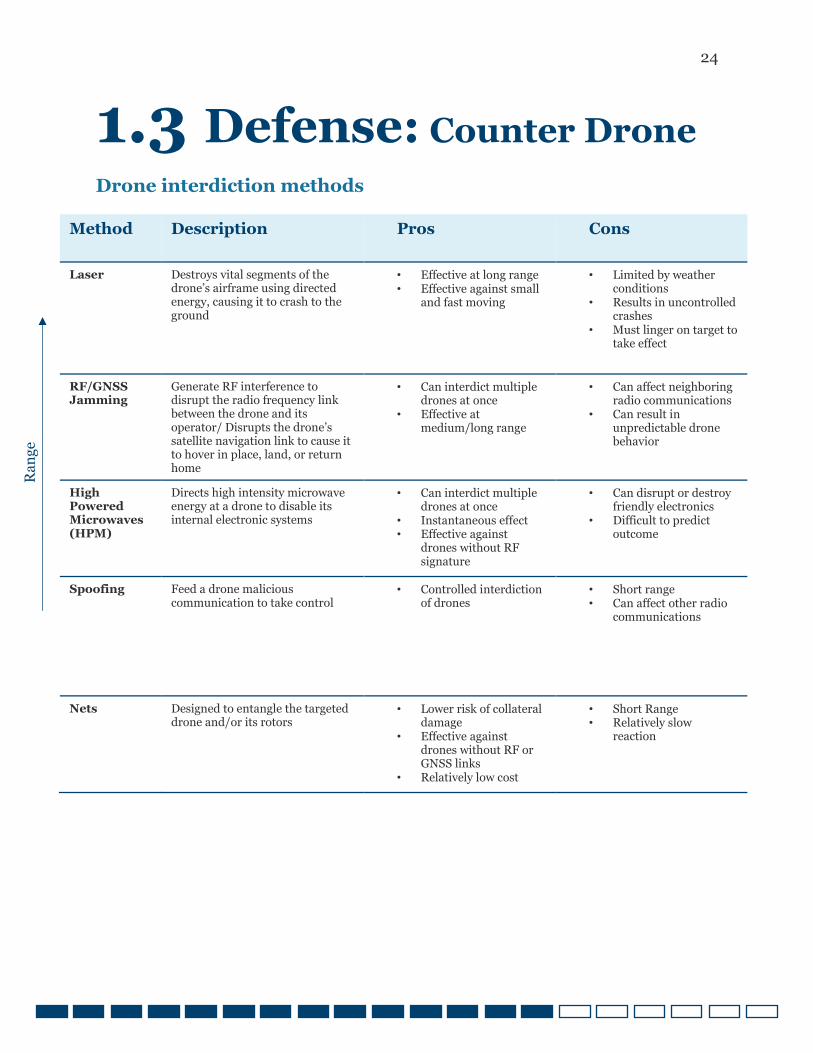
Drone interdiction methods
Method Description Pros Cons
Laser
Destroys vital segments of the drone’s airframe using directed energy, causing it to crash to the ground
• Effective at long range • Effective against small
and fast moving
• Limited by weather conditions
• Results in uncontrolled crashes
• Must linger on target to take effect
RF/GNSS Jamming
Generate RF interference to disrupt the radio frequency link between the drone and its operator/ Disrupts the drone’s satellite navigation link to cause it to hover in place, land, or return home
• Can interdict multiple drones at once
• Effective at medium/long range
• Can affect neighboring radio communications
• Can result in unpredictable drone behavior
High Powered Microwaves (HPM)
Directs high intensity microwave energy at a drone to disable its internal electronic systems
• Can interdict multiple drones at once
• Instantaneous effect • Effective against
drones without RF signature
• Can disrupt or destroy friendly electronics
• Difficult to predict outcome
Spoofing Feed a drone malicious communication to take control
• Controlled interdiction of drones
• Short range • Can affect other radio
communications
Nets
Designed to entangle the targeted drone and/or its rotors
• Lower risk of collateral damage
• Effective against drones without RF or GNSS links
• Relatively low cost
• Short Range • Relatively slow
reaction
Ra
ng
e
25
1.3 Defense: Counter Drone
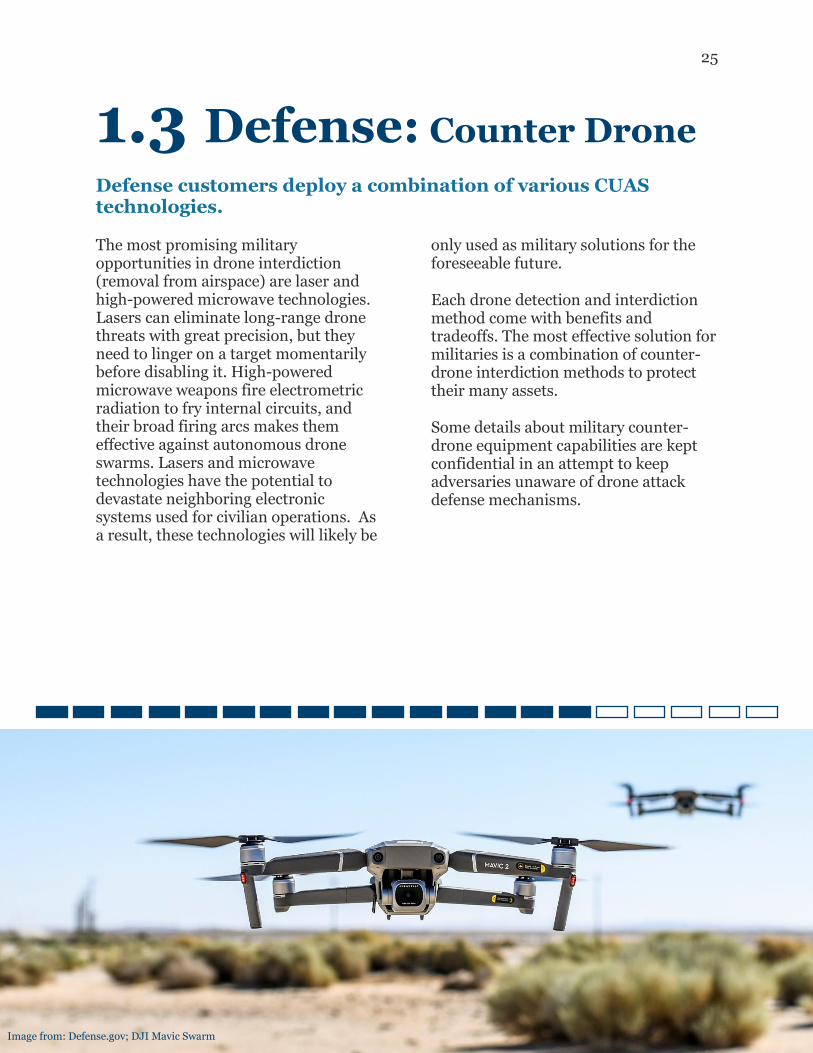
Defense customers deploy a combination of various CUAS technologies.
The most promising military opportunities in drone interdiction (removal from airspace) are laser and high-powered microwave technologies. Lasers can eliminate long-range drone threats with great precision, but they need to linger on a target momentarily before disabling it. High-powered microwave weapons fire electrometric radiation to fry internal circuits, and their broad firing arcs makes them effective against autonomous drone swarms. Lasers and microwave technologies have the potential to devastate neighboring electronic systems used for civilian operations. As a result, these technologies will likely be
only used as military solutions for the foreseeable future.
Each drone detection and interdiction method come with benefits and tradeoffs. The most effective solution for militaries is a combination of counter-drone interdiction methods to protect their many assets.
Some details about military counter-drone equipment capabilities are kept confidential in an attempt to keep adversaries unaware of drone attack defense mechanisms.
Image from: Defense.gov; DJI Mavic Swarm
26
1.3 Defense: Counter Drone
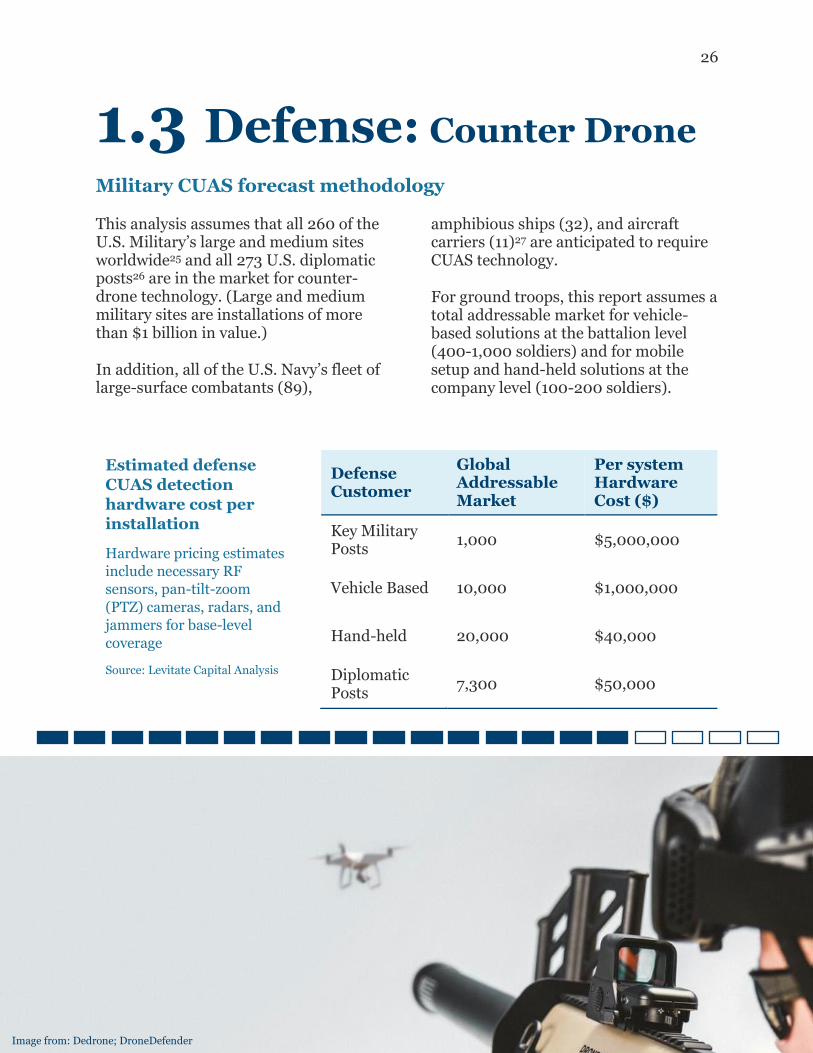
Military CUAS forecast methodology
This analysis assumes that all 260 of the U.S. Military’s large and medium sites worldwide25 and all 273 U.S. diplomatic posts26 are in the market for counter-drone technology. (Large and medium military sites are installations of more than $1 billion in value.)
In addition, all of the U.S. Navy’s fleet of large-surface combatants (89),
amphibious ships (32), and aircraft carriers (11)27 are anticipated to require CUAS technology.
For ground troops, this report assumes a total addressable market for vehicle-based solutions at the battalion level (400-1,000 soldiers) and for mobile setup and hand-held solutions at the company level (100-200 soldiers).
Defense Customer
Global Addressable Market
Per system Hardware Cost ($)
Key Military Posts
1,000 $5,000,000
Vehicle Based 10,000 $1,000,000
Hand-held 20,000 $40,000
Diplomatic Posts
7,300 $50,000
Estimated defense
CUAS detection
hardware cost per
installation
Hardware pricing estimates
include necessary RF
sensors, pan-tilt-zoom
(PTZ) cameras, radars, and
jammers for base-level
coverage
Source: Levitate Capital Analysis
Image from: Dedrone; DroneDefender
27
1.4 Defense: Government
Government agencies are significant early customers for the drone economy.
Venture capital investors have long been wary of the U.S. defense sector. The fast-burn lifecycles of venture capital-backed companies mean they can exit the market via acquisition or liquidation before completing the federal government’s multi-year contracting and procurement process. In addition, DoD requirements can be burdensome for small businesses to meet and have the potential to divert resources away from long-term planning initiatives.
However, capital-intensive businesses need large customers to scale, and when it comes to procurement, the U.S. government is as large as it gets. Defense investments are, therefore, an essential source of fuel for hardware
companies in the drone economy. Unlike many software businesses that have high margins and offer ease of scalability, government contracts help fund the necessary upfront investments that allow hardware businesses to build a scalable product for the enterprise and consumer market. In this regard, government funding can supply an essential source of non-dilutive, early-stage capital that capital-intensive businesses need to address barriers to entry.
As an example, NASA and the U.S. Air Force were the primary customers of small businesses in the nascent semiconductor and computer industry in the 1960s.28
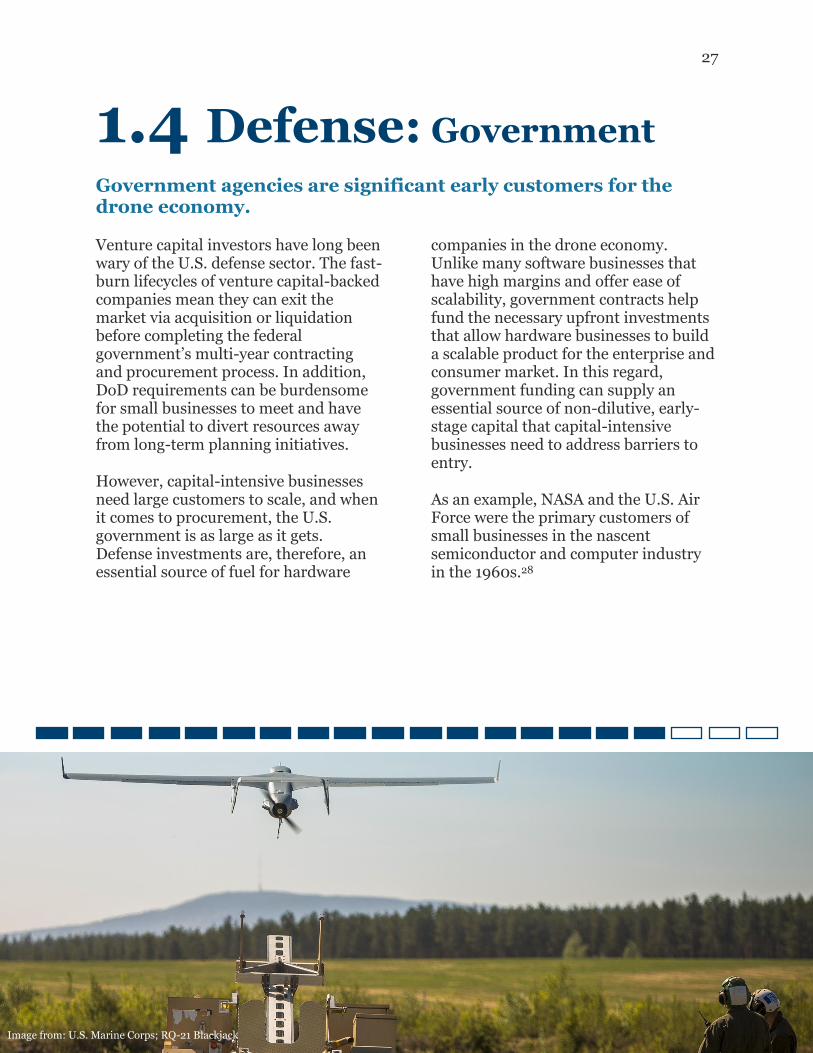
Image from: U.S. Marine Corps; RQ-21 Blackjack
28
1.4 Defense: Government
The U.S. government has a history of jumpstarting capital-intensive businesses.
More recently, we have seen the impact of government support in space companies like SpaceX, whose innovations have been primarily funded by contracts from its largest customer, NASA. According to the Space Angel’s 2019 Report on U.S. Government Support of the Entrepreneurial Space Age, NASA’s commercial contracts have fueled the growth of 67 aerospace companies with $7.2B in public funding between 2000 and 2018.29
Today, we see the impact of government customers in technology companies like Anduril, backed by Andreessen
Horowitz and Founders Fund, which has raised over $200 million with an almost $2 billion valuation by demonstrating success in partnering with the Department of Defense and Homeland Security.30
Anduril, founded by Palmer Luckey, builds technology for military and border security and has more than $100 million in contracts listed on a federal database,31 including an almost $36 million contract from the U.S. Customs and Border Protection (CBP) in September, 2020 for its AI-powered autonomous surveillance towers.
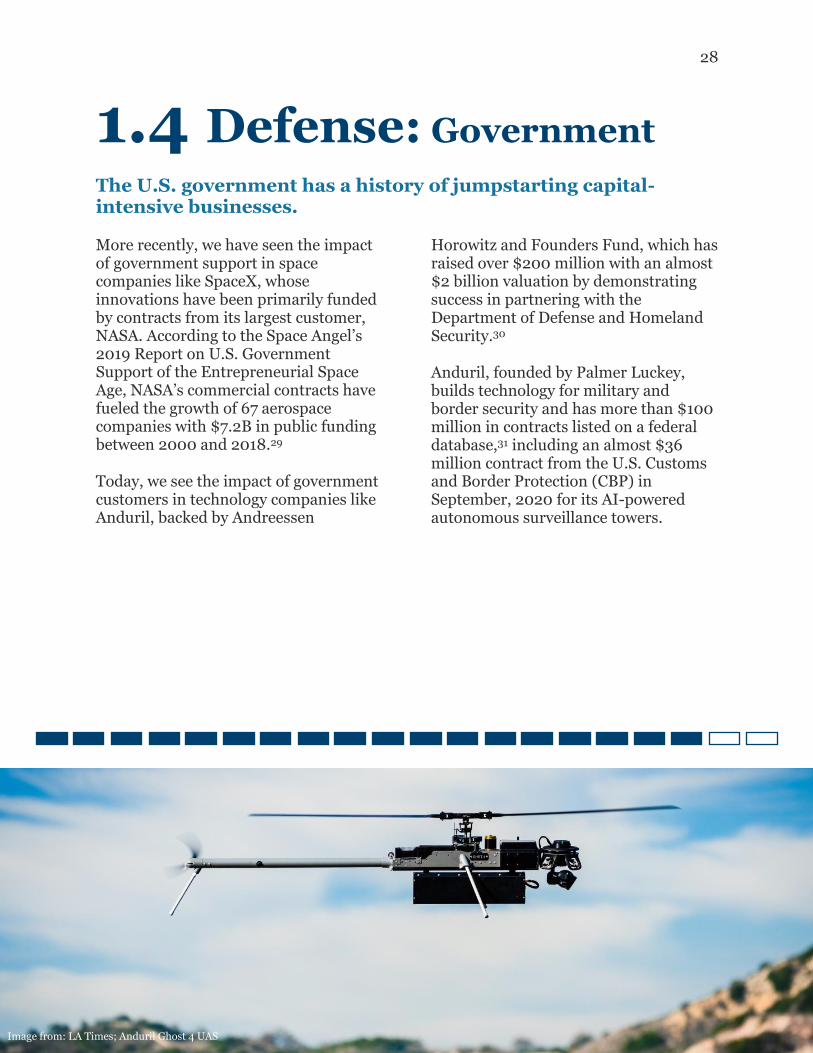
Image from: LA Times; Anduril Ghost 4 UAS
29
1.4 Defense: Government
U.S. companies have many avenues for gaining government support.
U.S. companies that will be a part of the drone economy of the future stand to benefit from early-adopter funding from the U.S. federal government and U.S. DoD.
The Small Business Innovation Research (SBIR) program enables small businesses to engage in federally funded R&D projects with commercialization
potential. Organizations within the U.S. DoD, such as the Defense Innovation Unit (DIU) and the Army Futures Command, aim to facilitate fast-moving enterprise collaboration with the U.S. DoD. Ultimately, these programs provide an avenue for U.S. government investment in U.S. innovation. The best government support model is to drive demand for innovative drone technology.
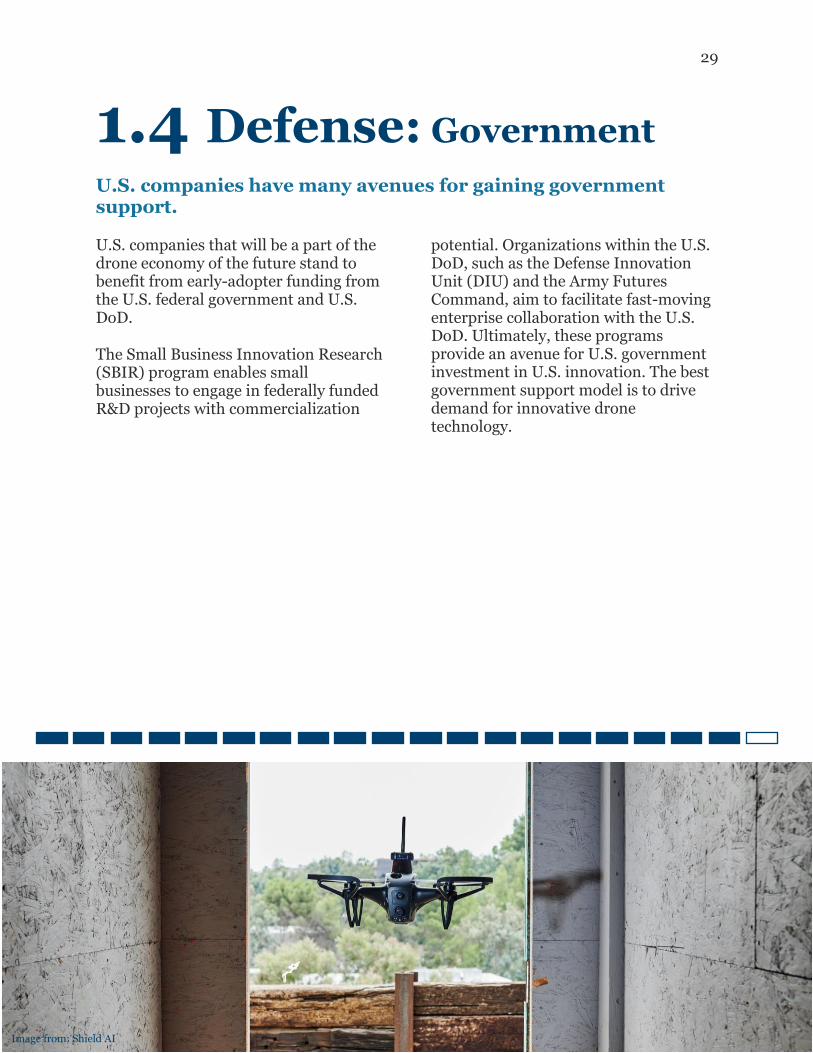
Image from: Shield AI
30
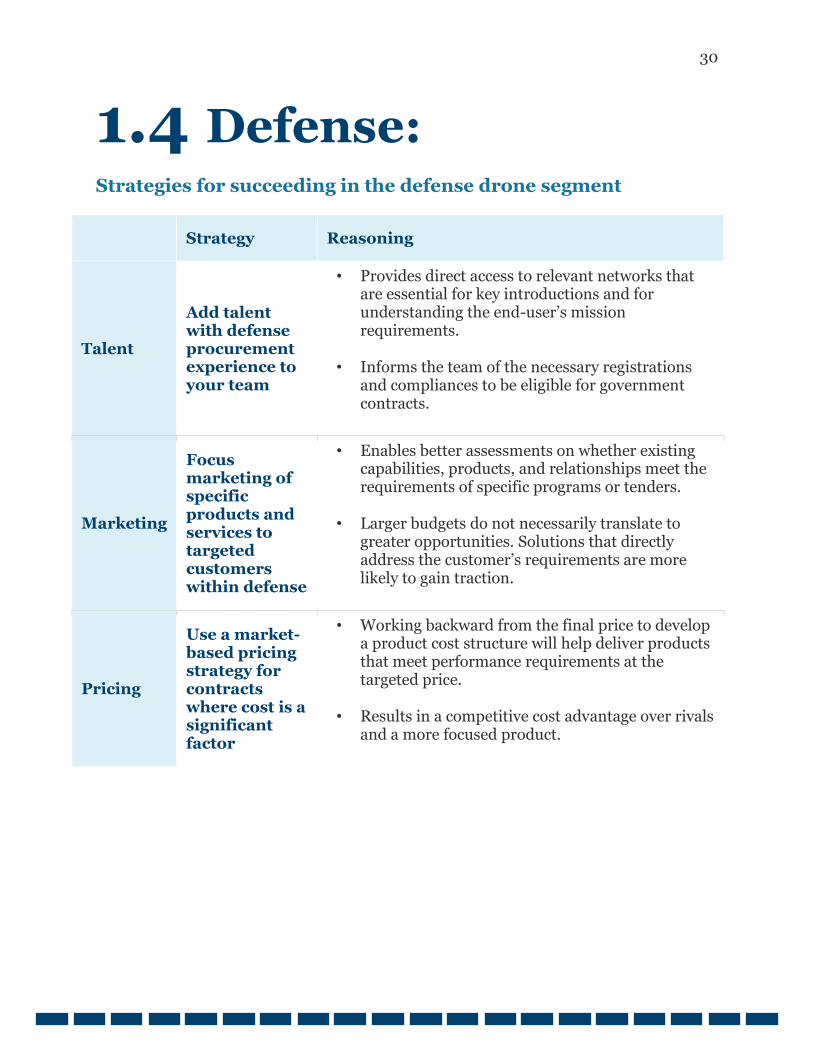
1.4 Defense:
Strategies for succeeding in the defense drone segment
Strategy Reasoning
Talent
Add talent with defense procurement experience to your team
• Provides direct access to relevant networks that are essential for key introductions and for understanding the end-user’s mission requirements.
• Informs the team of the necessary registrations and compliances to be eligible for government contracts.
Marketing
Focus marketing of specific products and services to targeted customers within defense
• Enables better assessments on whether existing capabilities, products, and relationships meet the requirements of specific programs or tenders.
• Larger budgets do not necessarily translate to greater opportunities. Solutions that directly address the customer’s requirements are more likely to gain traction.
Pricing
Use a market-based pricing strategy for contracts where cost is a significant factor
• Working backward from the final price to develop a product cost structure will help deliver products that meet performance requirements at the targeted price.
• Results in a competitive cost advantage over rivals and a more focused product.
31
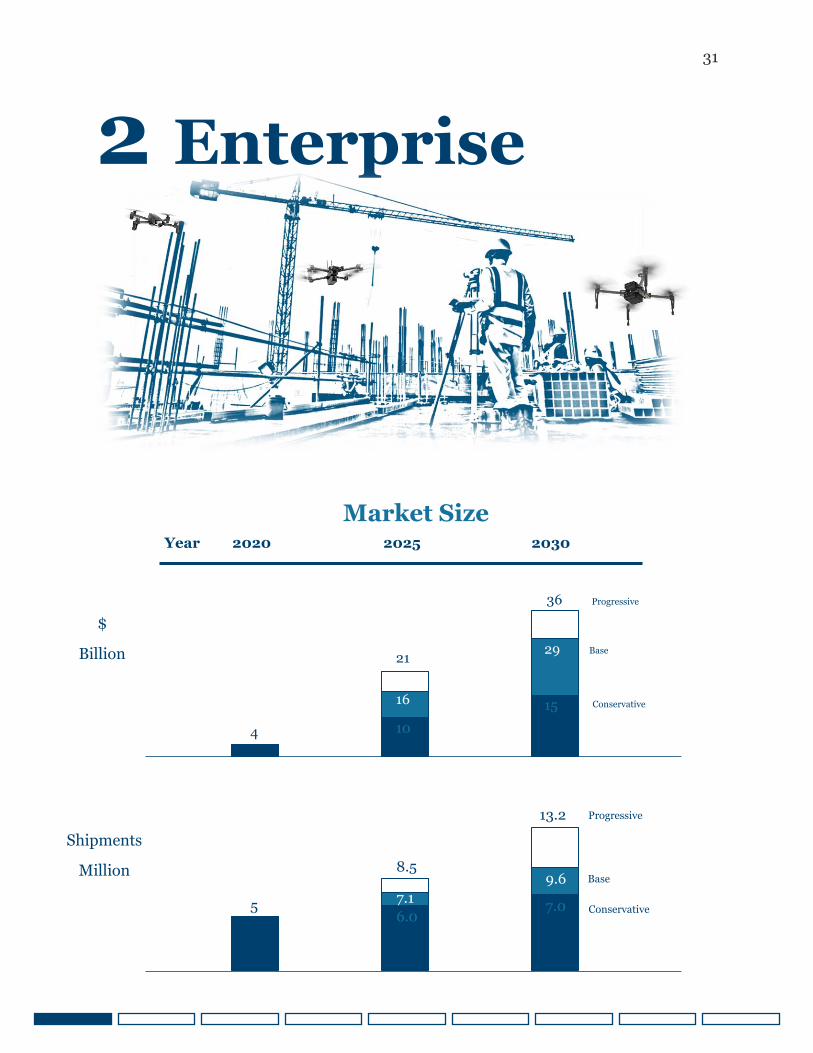
2 Enterprise
$
Billion
Market Size
Year 2020 2025 2030
Shipments
Million
4 10
15 16
29 21
36 Progressive
Base
Conservative
5
8.5
13.2
7.1 9.6
6.0 7.0
Progressive
Base
Conservative
32
Videography
Mining
Utilities
Real Estate
Oil & Gas
Counter Drone
Agriculture
Built Inspection
Construction
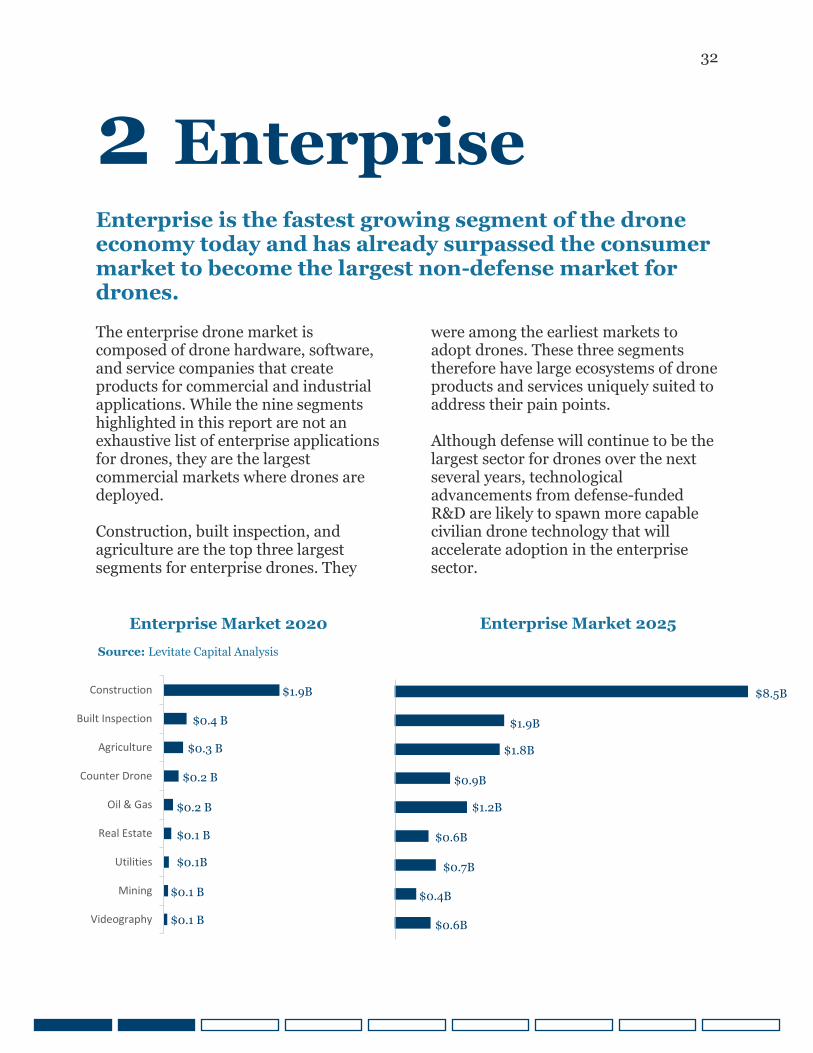
2 Enterprise
Enterprise is the fastest growing segment of the drone economy today and has already surpassed the consumer market to become the largest non-defense market for drones.
The enterprise drone market is composed of drone hardware, software, and service companies that create products for commercial and industrial applications. While the nine segments highlighted in this report are not an exhaustive list of enterprise applications for drones, they are the largest commercial markets where drones are deployed. Construction, built inspection, and agriculture are the top three largest segments for enterprise drones. They
were among the earliest markets to adopt drones. These three segments therefore have large ecosystems of drone products and services uniquely suited to address their pain points. Although defense will continue to be the largest sector for drones over the next several years, technological advancements from defense-funded R&D are likely to spawn more capable civilian drone technology that will accelerate adoption in the enterprise sector.
$1.9B
$0.4 B
$0.3 B
$0.2 B
$0.2 B
$0.1 B
$0.1B
$0.1 B
$0.1 B
Enterprise Market 2020
Source: Levitate Capital Analysis
Enterprise Market 2025
$8.5B
$1.9B
$1.8B
$0.9B
$1.2B
$0.6B
$0.7B
$0.6B
$0.4B
33
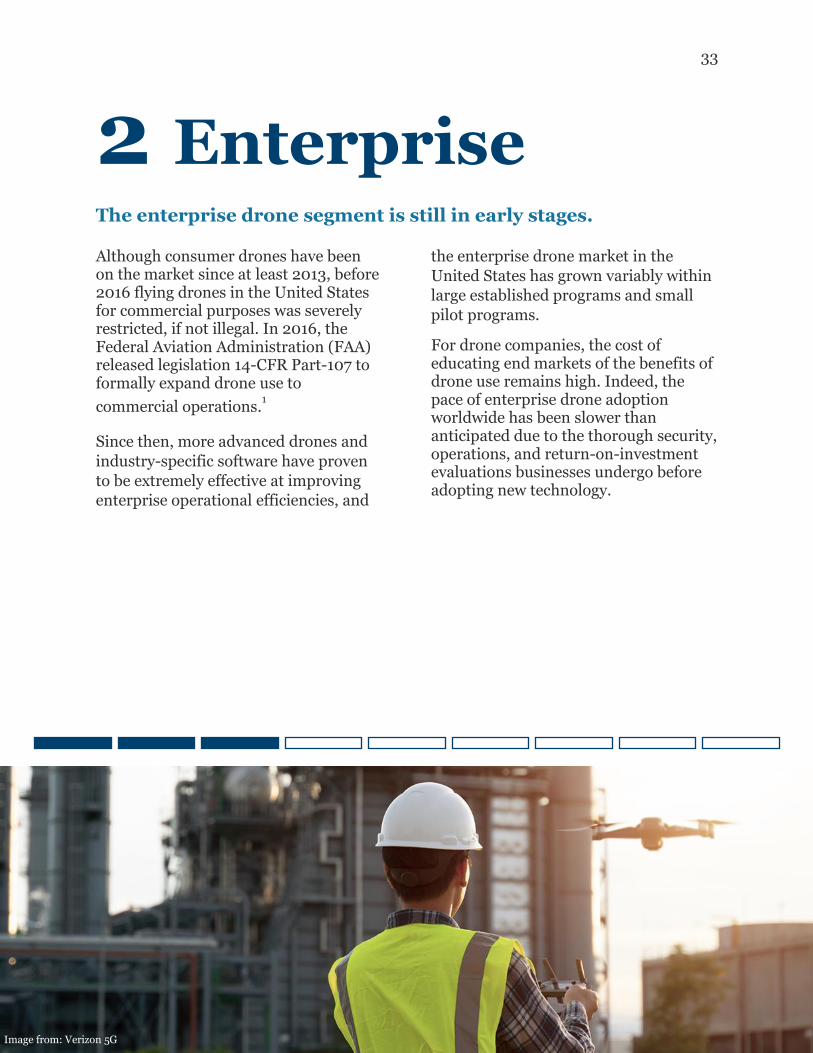
2 Enterprise
The enterprise drone segment is still in early stages. Although consumer drones have been on the market since at least 2013, before 2016 flying drones in the United States for commercial purposes was severely restricted, if not illegal. In 2016, the Federal Aviation Administration (FAA) released legislation 14-CFR Part-107 to formally expand drone use to
commercial operations.1
Since then, more advanced drones and
industry-specific software have proven
to be extremely effective at improving
enterprise operational efficiencies, and
the enterprise drone market in the
United States has grown variably within
large established programs and small
pilot programs.
For drone companies, the cost of educating end markets of the benefits of drone use remains high. Indeed, the pace of enterprise drone adoption worldwide has been slower than anticipated due to the thorough security, operations, and return-on-investment evaluations businesses undergo before adopting new technology.
Image from: Verizon 5G
34
2 Enterprise
The enterprise drone industry is addressing the technical and regulatory barriers required to scale.
Today, most enterprise drone programs are still in their infancy. They are still identifying the applications for drones, the types of data to collect, and the software and storage solutions required to gather and manage drone-gathered data. Many potential enterprise drone users are ill-equipped to store and analyze the terabytes of data drones collect.
Most current pilot programs require drone operations to be conducted within visual line of sight. Over the next five years, however, more Beyond Visual Line of Sight (BVLOS) requests will be approved as detect-and-avoid
technologies mature and as regulations grow increasingly flexible.
In-house drone programs have demonstrated their ability to improve operational efficiency over traditional methods, but many programs do not bring a sufficient return on investment because they consist of ten or fewer drones instead of the hundreds of drones required to scale.
By the end of the decade, completely autonomous fleets of drones will be fully integrated into existing Internet of things (IoT) ecosystems.
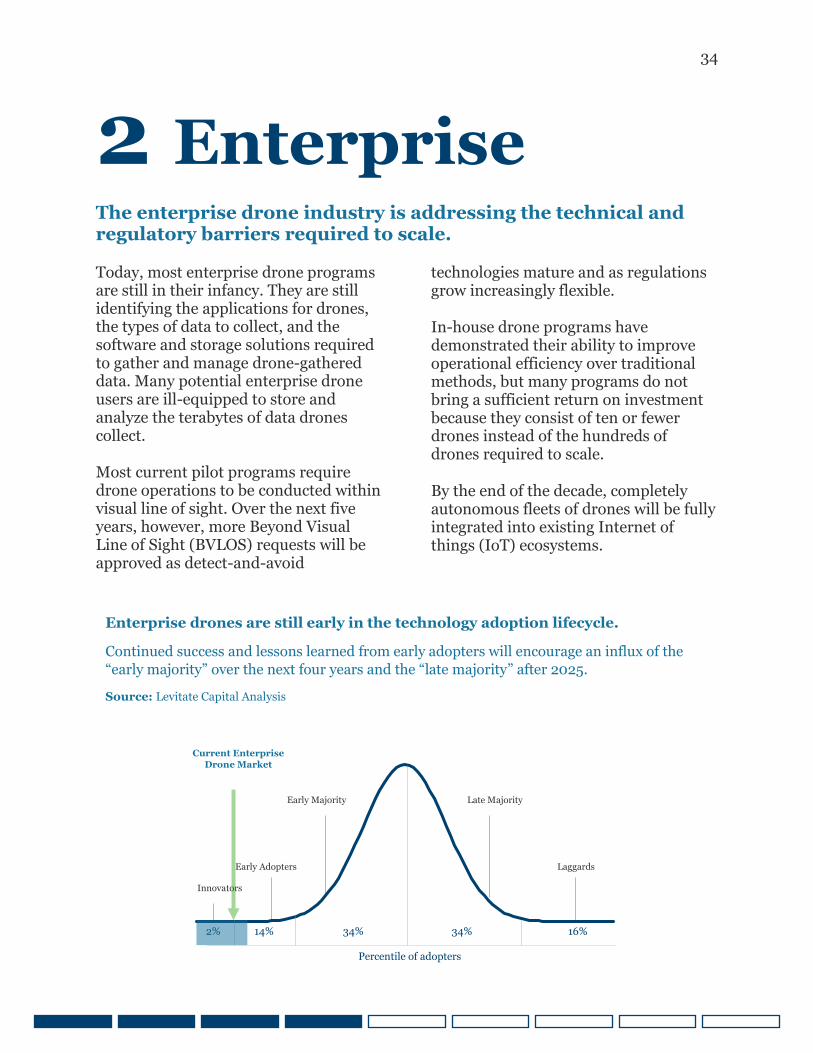
Enterprise drones are still early in the technology adoption lifecycle.
Continued success and lessons learned from early adopters will encourage an influx of the
“early majority” over the next four years and the “late majority” after 2025.
Source: Levitate Capital Analysis
Innovators
Early Adopters
Early Majority Late Majority
Laggards
16% 34% 34% 14% 2%
Current Enterprise
Drone Market
Percentile of adopters
35
2 Enterprise
Nascent enterprise drone programs will expand as costs come down.
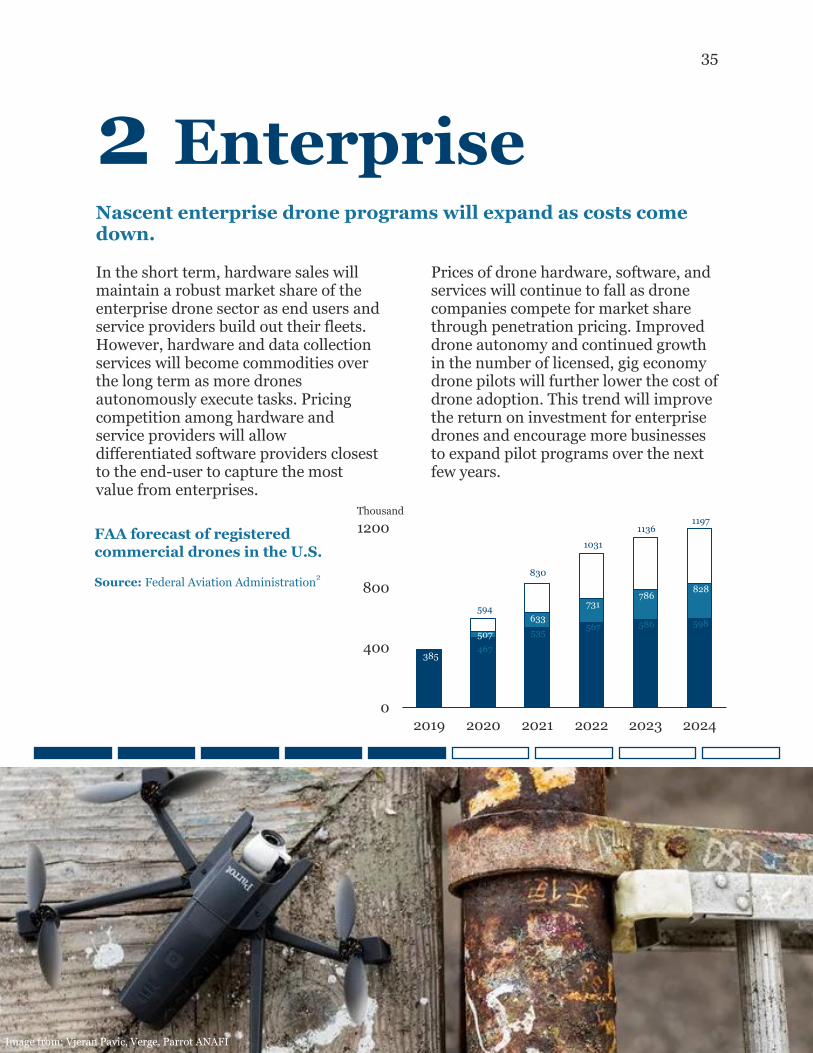
In the short term, hardware sales will maintain a robust market share of the enterprise drone sector as end users and service providers build out their fleets. However, hardware and data collection services will become commodities over the long term as more drones autonomously execute tasks. Pricing competition among hardware and service providers will allow differentiated software providers closest to the end-user to capture the most value from enterprises.
Prices of drone hardware, software, and services will continue to fall as drone companies compete for market share through penetration pricing. Improved drone autonomy and continued growth in the number of licensed, gig economy drone pilots will further lower the cost of drone adoption. This trend will improve the return on investment for enterprise drones and encourage more businesses to expand pilot programs over the next few years.
FAA forecast of registered
commercial drones in the U.S.
Source: Federal Aviation Administration2
0
400
800
1200
2019 2020 2021 2022 2023 2024
385
Thousand
507
594
467
633
830
535
731
1031
567
786
1136
586
828
1197
598
Image from: Vjeran Pavic, Verge, Parrot ANAFI
36
2 Enterprise
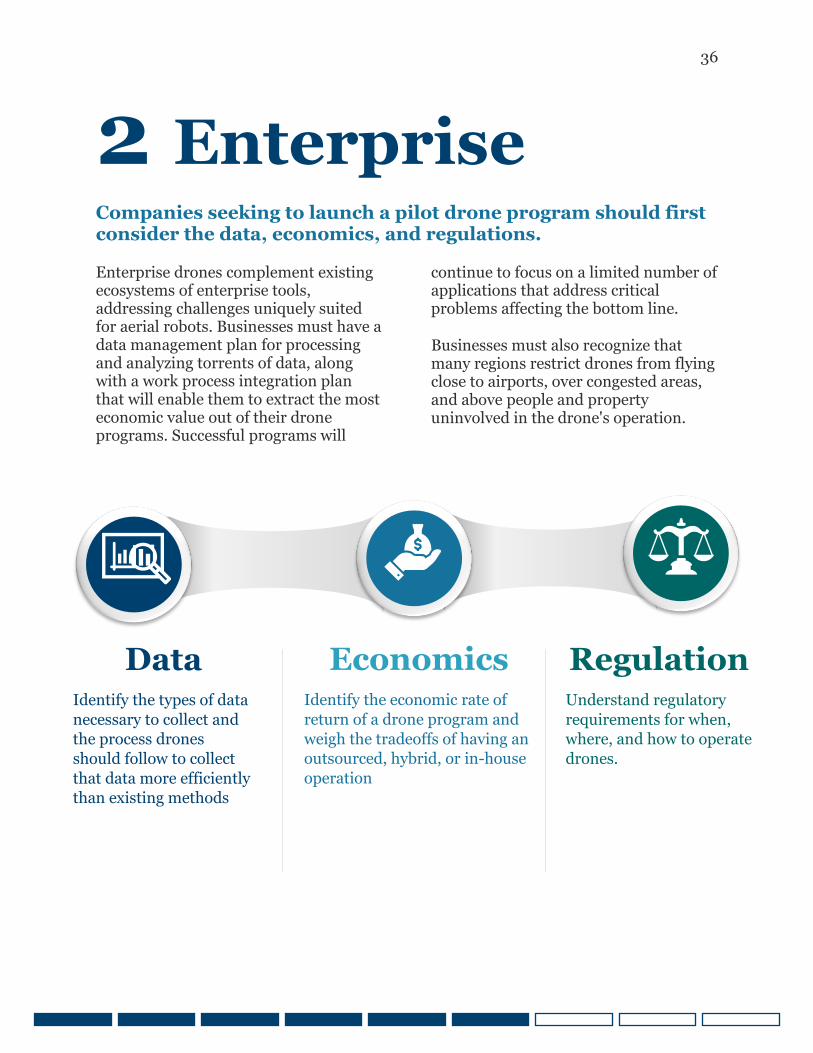
Companies seeking to launch a pilot drone program should first consider the data, economics, and regulations.
Enterprise drones complement existing ecosystems of enterprise tools, addressing challenges uniquely suited for aerial robots. Businesses must have a data management plan for processing and analyzing torrents of data, along with a work process integration plan that will enable them to extract the most economic value out of their drone programs. Successful programs will
continue to focus on a limited number of applications that address critical problems affecting the bottom line.
Businesses must also recognize that many regions restrict drones from flying close to airports, over congested areas, and above people and property uninvolved in the drone's operation.
Data
Identify the types of data
necessary to collect and
the process drones
should follow to collect
that data more efficiently
than existing methods
Economics
Identify the economic rate of
return of a drone program and
weigh the tradeoffs of having an
outsourced, hybrid, or in-house
operation
Regulation
Understand regulatory
requirements for when,
where, and how to operate
drones.
37
2 Enterprise
Companies should engage all necessary stakeholders to develop a strategy for operating a drone program.
In all enterprise segments, local ordinances on privacy, trespassing, nuisance activities, intellectual property rights, and contractor licensing may directly apply to commercial drone operations. Businesses may need to notify and obtain written consent and releases from workers and site visitors to avoid infringement of reasonable expectations of privacy.
Companies employing drones must engage and communicate with all stakeholders to clarify how drone-collected data will be collected and used and to establish trust that this data will not be used for any form of retribution.
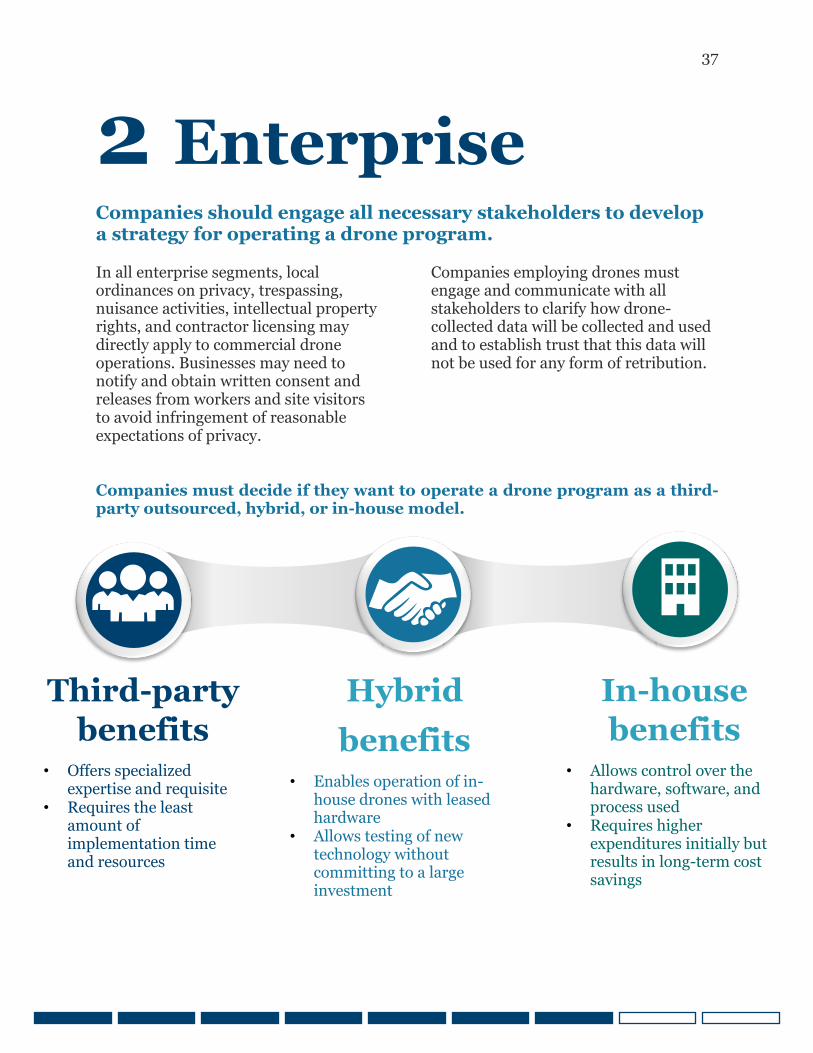
Companies must decide if they want to operate a drone program as a third-party outsourced, hybrid, or in-house model.
Third-party
benefits
• Offers specialized expertise and requisite
• Requires the least amount of implementation time and resources
Hybrid
benefits
• Enables operation of in-house drones with leased hardware
• Allows testing of new technology without committing to a large investment
In-house
benefits
• Allows control over the hardware, software, and process used
• Requires higher expenditures initially but results in long-term cost savings
38
2 Enterprise
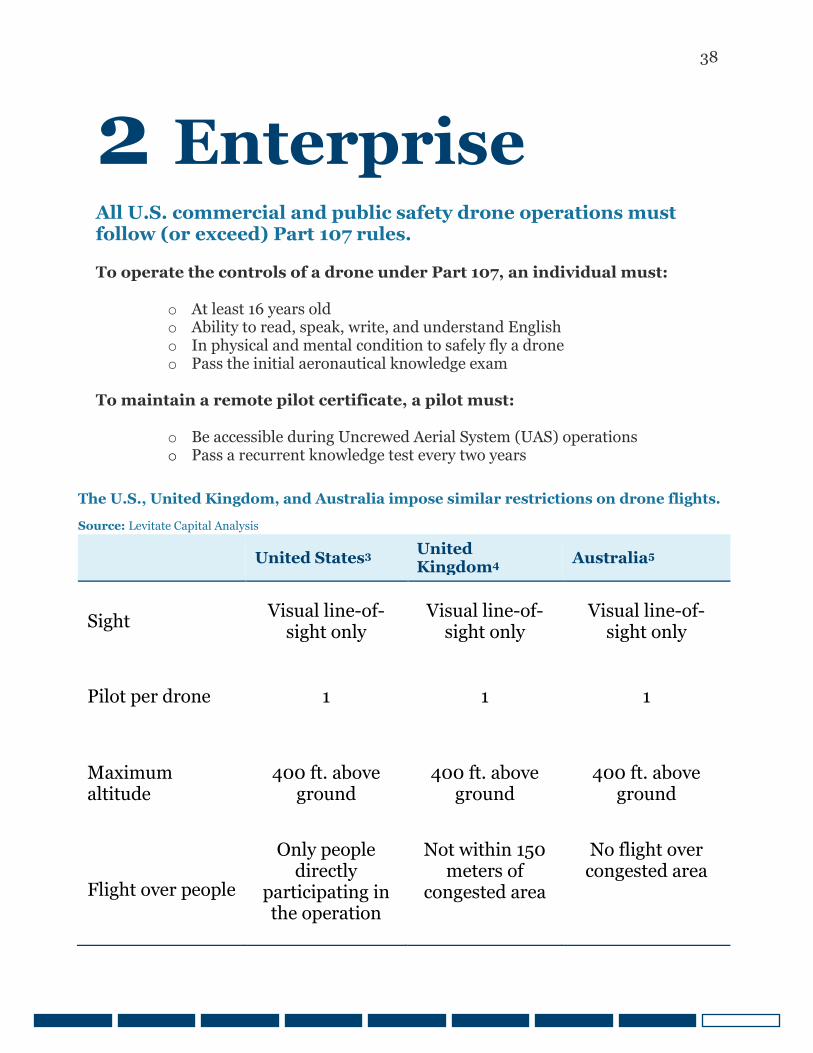
All U.S. commercial and public safety drone operations must follow (or exceed) Part 107 rules.
To operate the controls of a drone under Part 107, an individual must:
o At least 16 years old o Ability to read, speak, write, and understand English o In physical and mental condition to safely fly a drone o Pass the initial aeronautical knowledge exam
To maintain a remote pilot certificate, a pilot must:
o Be accessible during Uncrewed Aerial System (UAS) operations o Pass a recurrent knowledge test every two years
United States3 United Kingdom4
Australia5
Sight Visual line-of-
sight only Visual line-of-
sight only Visual line-of-
sight only
Pilot per drone 1 1 1
Maximum altitude
400 ft. above ground
400 ft. above ground
400 ft. above ground
Flight over people
Only people directly
participating in the operation
Not within 150 meters of
congested area
No flight over congested area
The U.S., United Kingdom, and Australia impose similar restrictions on drone flights.
Source: Levitate Capital Analysis
39
2 Enterprise
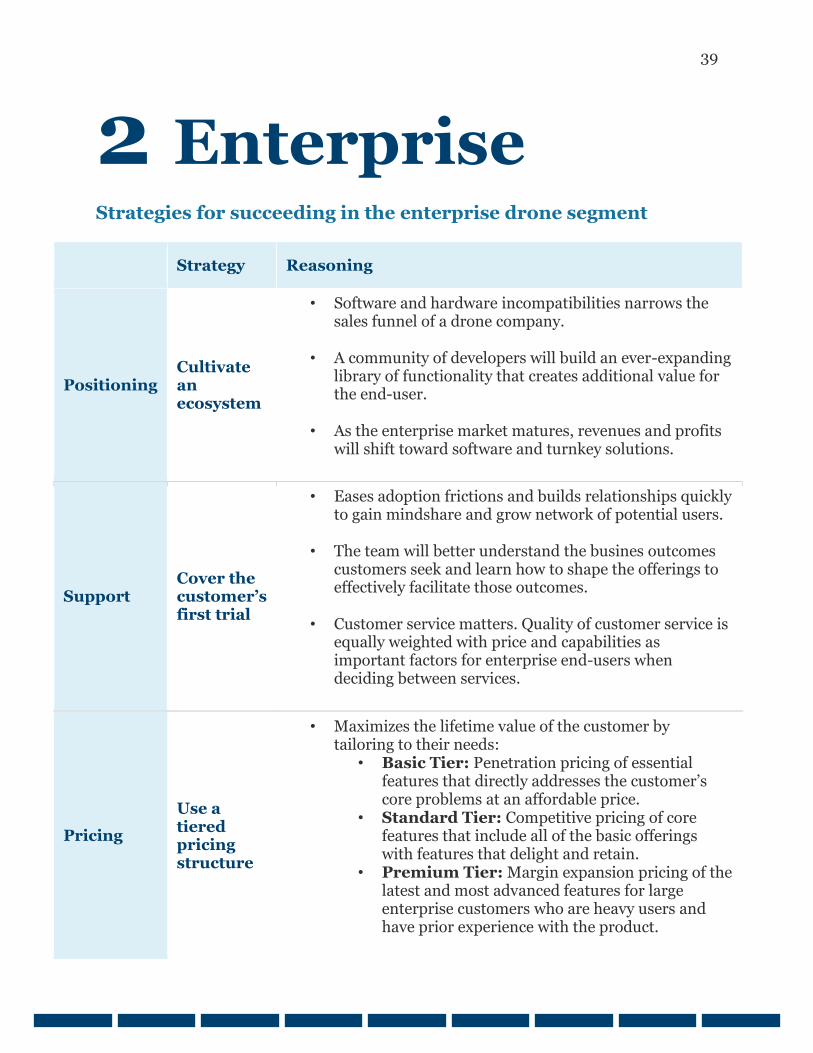
Strategies for succeeding in the enterprise drone segment
Strategy Reasoning
Positioning Cultivate an ecosystem
• Software and hardware incompatibilities narrows the sales funnel of a drone company.
• A community of developers will build an ever-expanding library of functionality that creates additional value for the end-user.
• As the enterprise market matures, revenues and profits
will shift toward software and turnkey solutions.
Support Cover the customer’s first trial
• Eases adoption frictions and builds relationships quickly to gain mindshare and grow network of potential users.
• The team will better understand the busines outcomes customers seek and learn how to shape the offerings to effectively facilitate those outcomes.
• Customer service matters. Quality of customer service is
equally weighted with price and capabilities as important factors for enterprise end-users when deciding between services.
Pricing
Use a tiered pricing structure
• Maximizes the lifetime value of the customer by tailoring to their needs:
• Basic Tier: Penetration pricing of essential features that directly addresses the customer’s core problems at an affordable price.
• Standard Tier: Competitive pricing of core features that include all of the basic offerings with features that delight and retain.
• Premium Tier: Margin expansion pricing of the latest and most advanced features for large enterprise customers who are heavy users and have prior experience with the product.
40
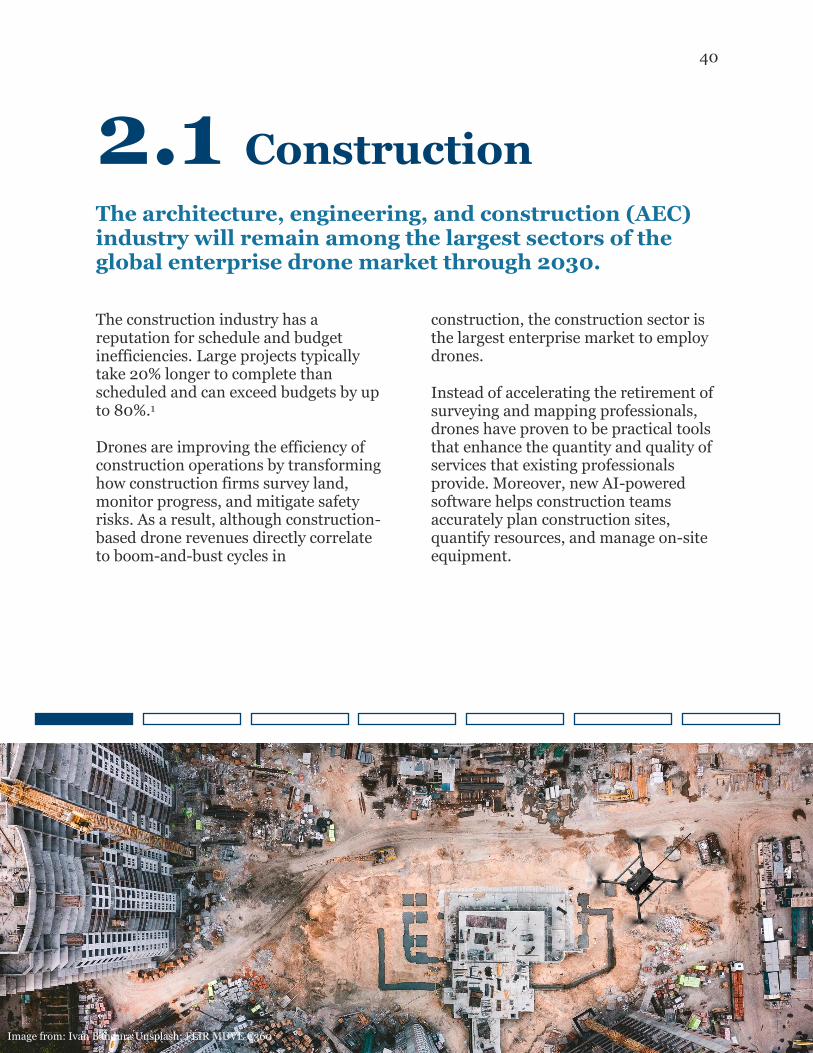
2.1 Construction
The architecture, engineering, and construction (AEC) industry will remain among the largest sectors of the global enterprise drone market through 2030. The construction industry has a reputation for schedule and budget inefficiencies. Large projects typically take 20% longer to complete than scheduled and can exceed budgets by up to 80%.1
Drones are improving the efficiency of construction operations by transforming how construction firms survey land, monitor progress, and mitigate safety risks. As a result, although construction-based drone revenues directly correlate to boom-and-bust cycles in
construction, the construction sector is the largest enterprise market to employ drones.
Instead of accelerating the retirement of surveying and mapping professionals, drones have proven to be practical tools that enhance the quantity and quality of services that existing professionals provide. Moreover, new AI-powered software helps construction teams accurately plan construction sites, quantify resources, and manage on-site equipment.
Image from: Ivan Bandura Unsplash; FLIR MUVE C360
41
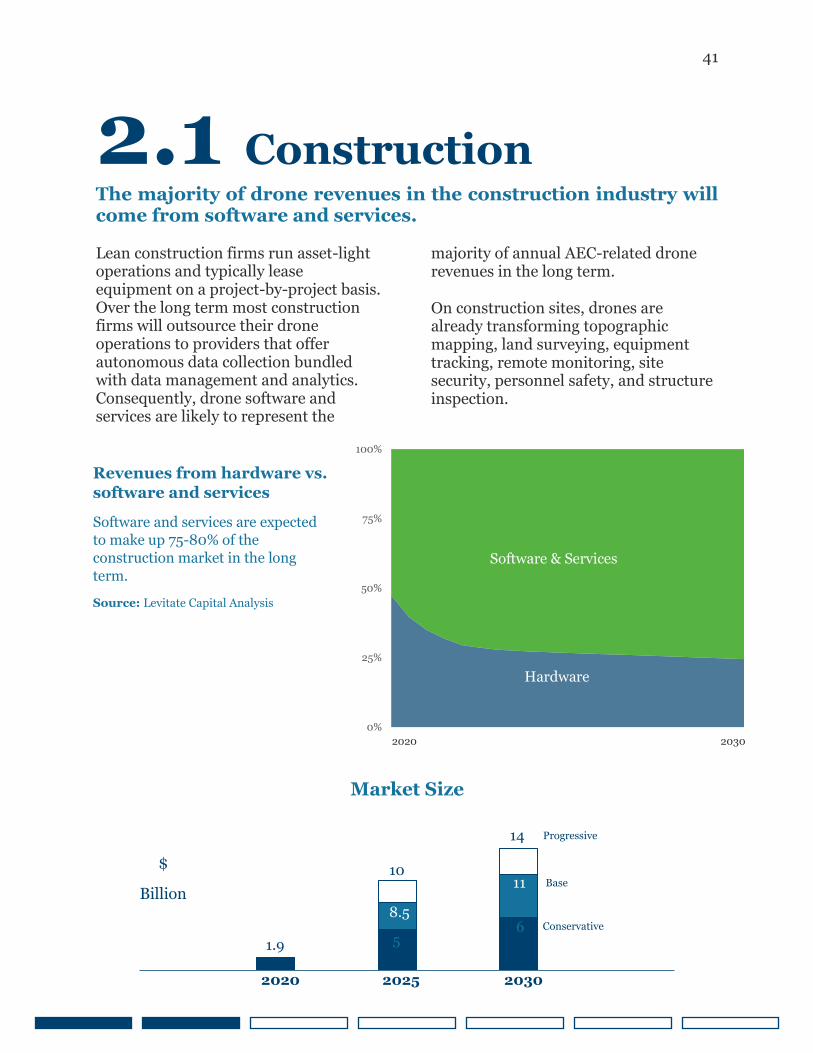
2.1 Construction
The majority of drone revenues in the construction industry will come from software and services. Lean construction firms run asset-light operations and typically lease equipment on a project-by-project basis. Over the long term most construction firms will outsource their drone operations to providers that offer autonomous data collection bundled with data management and analytics. Consequently, drone software and services are likely to represent the
majority of annual AEC-related drone revenues in the long term.
On construction sites, drones are already transforming topographic mapping, land surveying, equipment tracking, remote monitoring, site security, personnel safety, and structure inspection.
Revenues from hardware vs.
software and services
Software and services are expected
to make up 75-80% of the
construction market in the long
term.
Source: Levitate Capital Analysis
0%
25%
50%
75%
100%
2020 2030
Software & Services
Hardware
1.9 5 6
8.5
11 10
14 Progressive
Base
Conservative
2020 2025 2030
Market Size
$
Billion
42
2.1 Construction
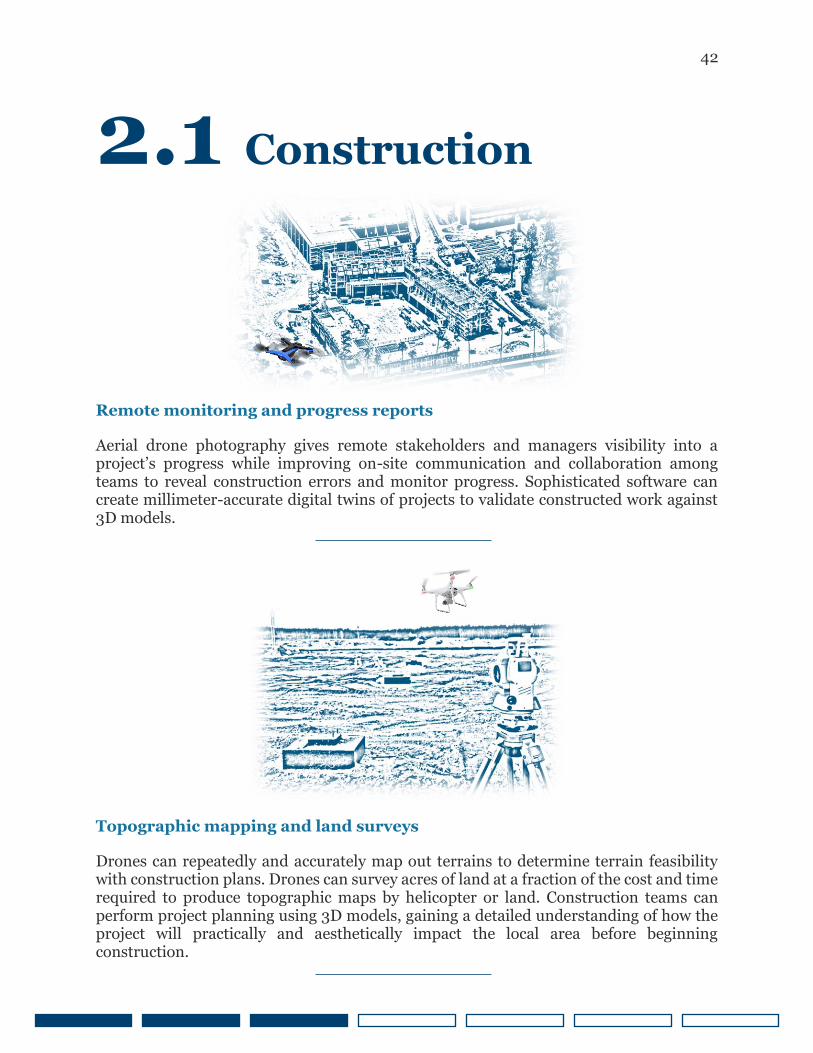
Remote monitoring and progress reports
Aerial drone photography gives remote stakeholders and managers visibility into a project’s progress while improving on-site communication and collaboration among teams to reveal construction errors and monitor progress. Sophisticated software can create millimeter-accurate digital twins of projects to validate constructed work against 3D models. Topographic mapping and land surveys
Drones can repeatedly and accurately map out terrains to determine terrain feasibility with construction plans. Drones can survey acres of land at a fraction of the cost and time required to produce topographic maps by helicopter or land. Construction teams can perform project planning using 3D models, gaining a detailed understanding of how the project will practically and aesthetically impact the local area before beginning construction.
43
2.1 Construction
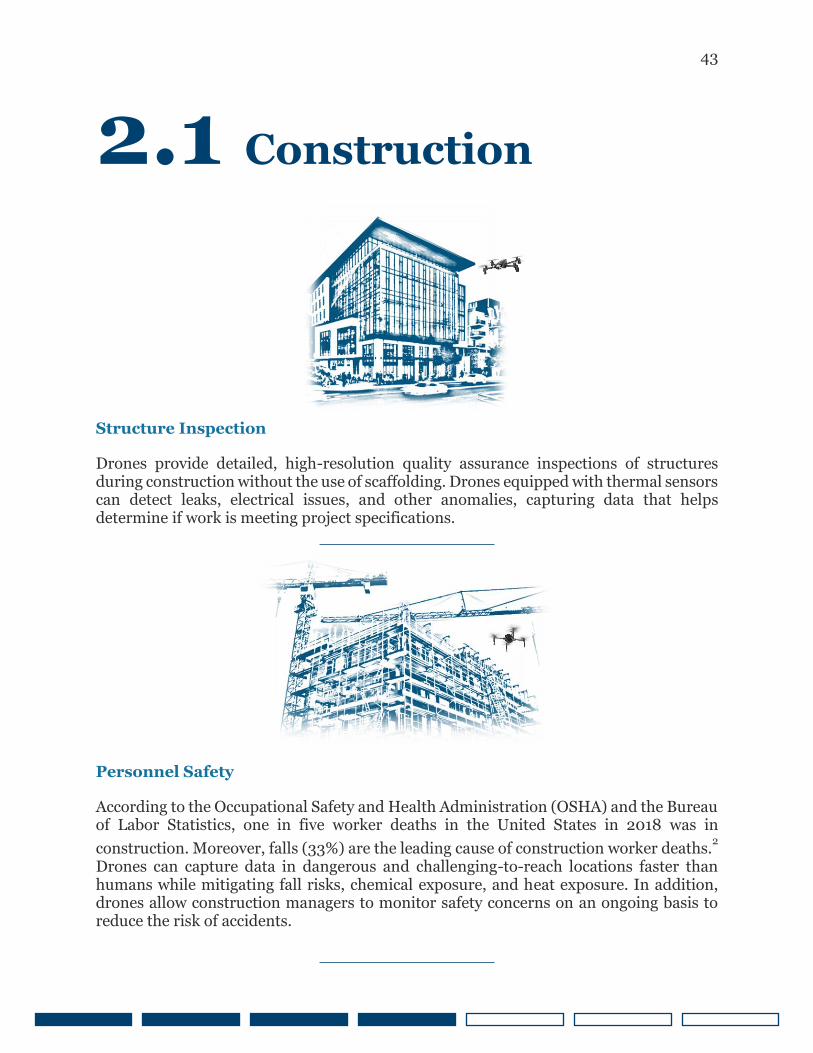
Structure Inspection
Drones provide detailed, high-resolution quality assurance inspections of structures during construction without the use of scaffolding. Drones equipped with thermal sensors can detect leaks, electrical issues, and other anomalies, capturing data that helps determine if work is meeting project specifications. Personnel Safety
According to the Occupational Safety and Health Administration (OSHA) and the Bureau of Labor Statistics, one in five worker deaths in the United States in 2018 was in
construction. Moreover, falls (33%) are the leading cause of construction worker deaths.2
Drones can capture data in dangerous and challenging-to-reach locations faster than humans while mitigating fall risks, chemical exposure, and heat exposure. In addition, drones allow construction managers to monitor safety concerns on an ongoing basis to reduce the risk of accidents.
44
2.1 Construction
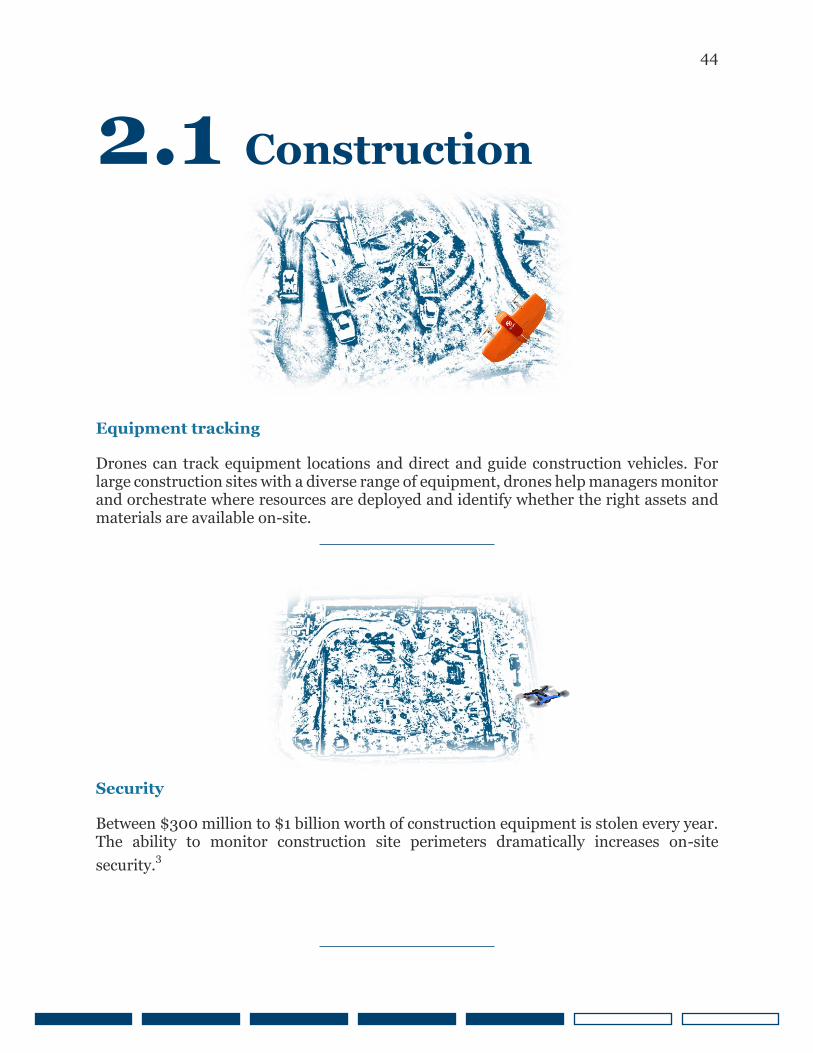
Equipment tracking
Drones can track equipment locations and direct and guide construction vehicles. For large construction sites with a diverse range of equipment, drones help managers monitor and orchestrate where resources are deployed and identify whether the right assets and materials are available on-site.
Security
Between $300 million to $1 billion worth of construction equipment is stolen every year. The ability to monitor construction site perimeters dramatically increases on-site
security.3
45
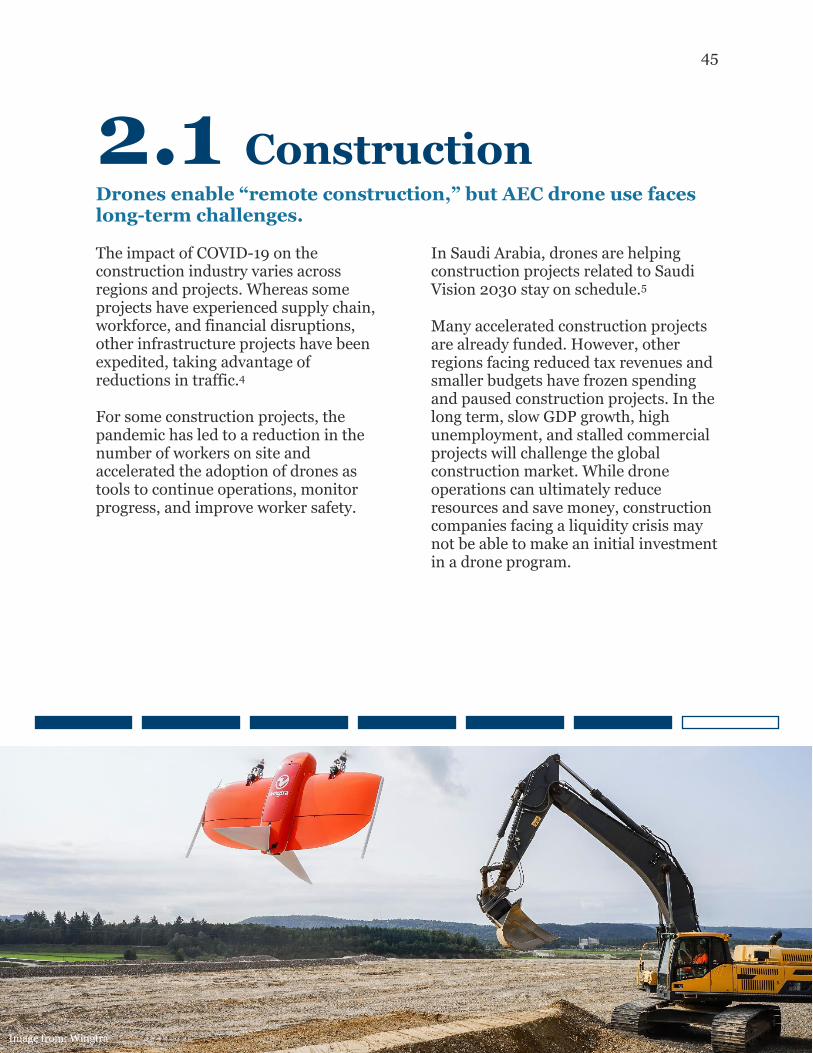
2.1 Construction Drones enable “remote construction,” but AEC drone use faces long-term challenges. The impact of COVID-19 on the construction industry varies across regions and projects. Whereas some projects have experienced supply chain, workforce, and financial disruptions, other infrastructure projects have been expedited, taking advantage of reductions in traffic.4
For some construction projects, the pandemic has led to a reduction in the number of workers on site and accelerated the adoption of drones as tools to continue operations, monitor progress, and improve worker safety.
In Saudi Arabia, drones are helping construction projects related to Saudi Vision 2030 stay on schedule.5
Many accelerated construction projects are already funded. However, other regions facing reduced tax revenues and smaller budgets have frozen spending and paused construction projects. In the long term, slow GDP growth, high unemployment, and stalled commercial projects will challenge the global construction market. While drone operations can ultimately reduce resources and save money, construction companies facing a liquidity crisis may not be able to make an initial investment in a drone program.
Image from: Wingtra
46
2.1 Construction
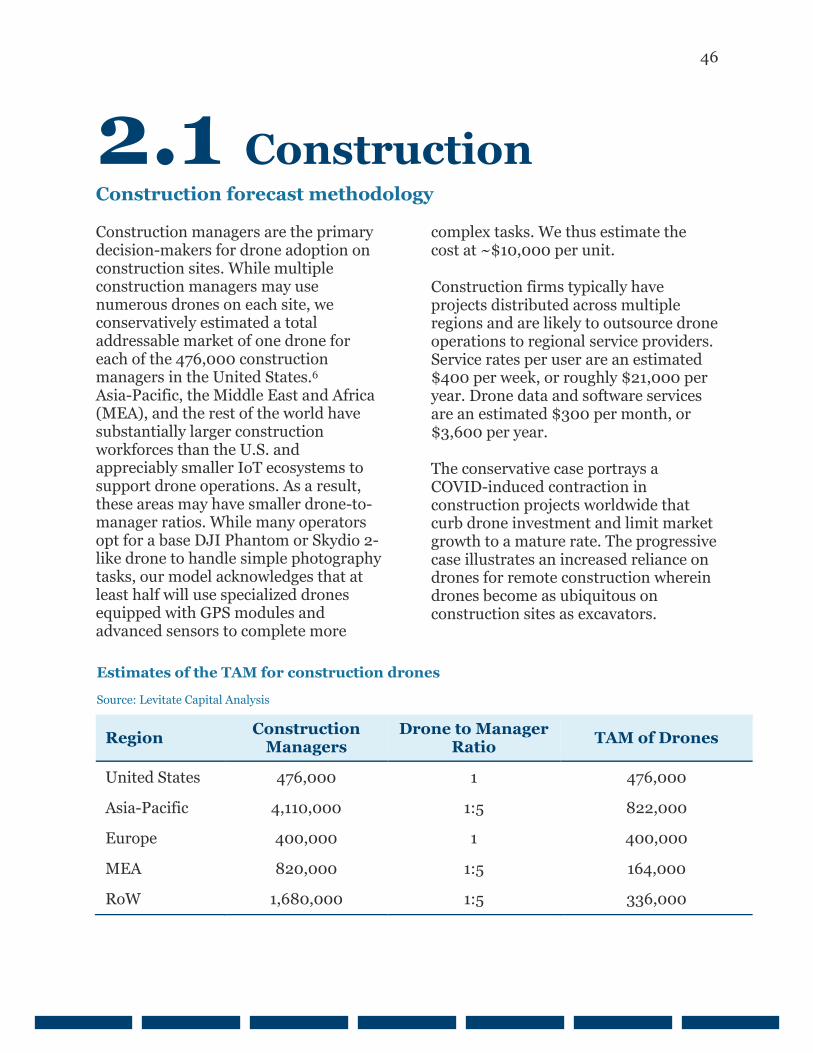
Construction forecast methodology Construction managers are the primary decision-makers for drone adoption on construction sites. While multiple construction managers may use numerous drones on each site, we conservatively estimated a total addressable market of one drone for each of the 476,000 construction managers in the United States.6 Asia-Pacific, the Middle East and Africa (MEA), and the rest of the world have substantially larger construction workforces than the U.S. and appreciably smaller IoT ecosystems to support drone operations. As a result, these areas may have smaller drone-to-manager ratios. While many operators opt for a base DJI Phantom or Skydio 2-like drone to handle simple photography tasks, our model acknowledges that at least half will use specialized drones equipped with GPS modules and advanced sensors to complete more
complex tasks. We thus estimate the cost at ~$10,000 per unit.
Construction firms typically have projects distributed across multiple regions and are likely to outsource drone operations to regional service providers. Service rates per user are an estimated $400 per week, or roughly $21,000 per year. Drone data and software services are an estimated $300 per month, or $3,600 per year.
The conservative case portrays a COVID-induced contraction in construction projects worldwide that curb drone investment and limit market growth to a mature rate. The progressive case illustrates an increased reliance on drones for remote construction wherein drones become as ubiquitous on construction sites as excavators.
Region Construction
Managers Drone to Manager
Ratio TAM of Drones
United States 476,000 1 476,000
Asia-Pacific 4,110,000 1:5 822,000
Europe 400,000 1 400,000
MEA 820,000 1:5 164,000
RoW 1,680,000 1:5 336,000
Estimates of the TAM for construction drones
Source: Levitate Capital Analysis
47
2.2 Built Environment Inspection
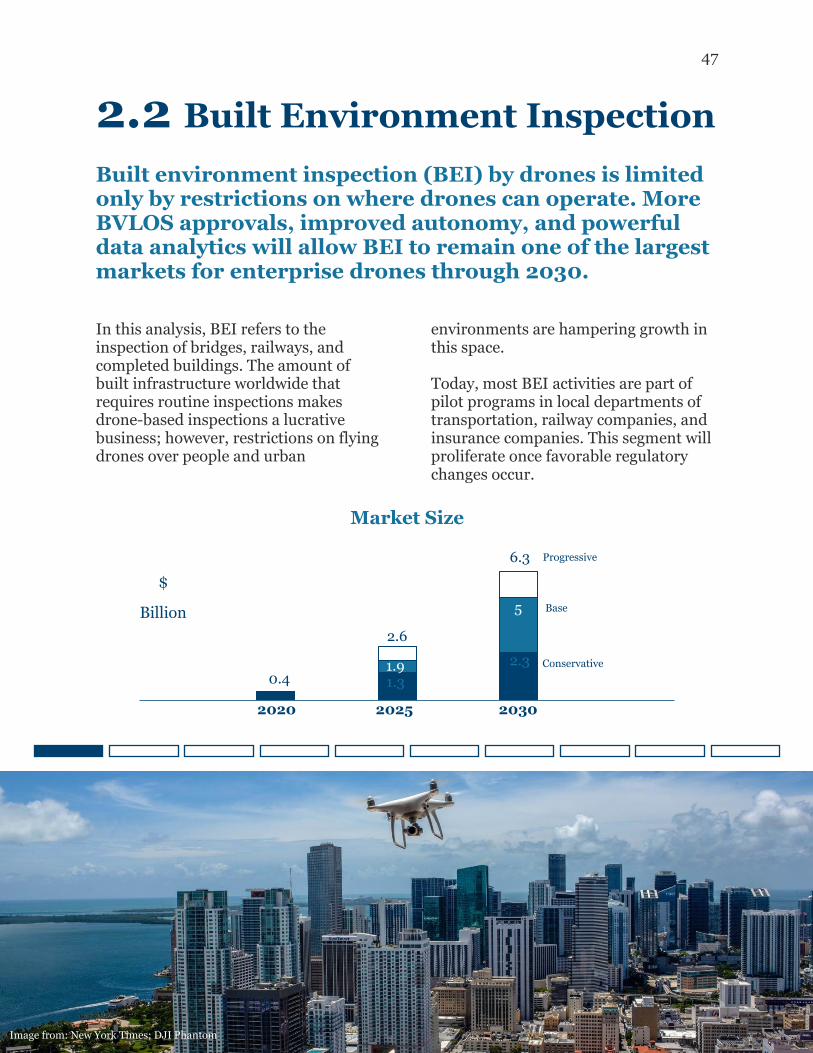
Built environment inspection (BEI) by drones is limited only by restrictions on where drones can operate. More BVLOS approvals, improved autonomy, and powerful data analytics will allow BEI to remain one of the largest markets for enterprise drones through 2030.
In this analysis, BEI refers to the inspection of bridges, railways, and completed buildings. The amount of built infrastructure worldwide that requires routine inspections makes drone-based inspections a lucrative business; however, restrictions on flying drones over people and urban
environments are hampering growth in this space. Today, most BEI activities are part of pilot programs in local departments of transportation, railway companies, and insurance companies. This segment will proliferate once favorable regulatory changes occur.
0.4 1.3
2.3 1.9
5
2.6
6.3 Progressive
Base
Conservative
2020 2025 2030
Market Size
$
Billion
Image from: New York Times; DJI Phantom
48
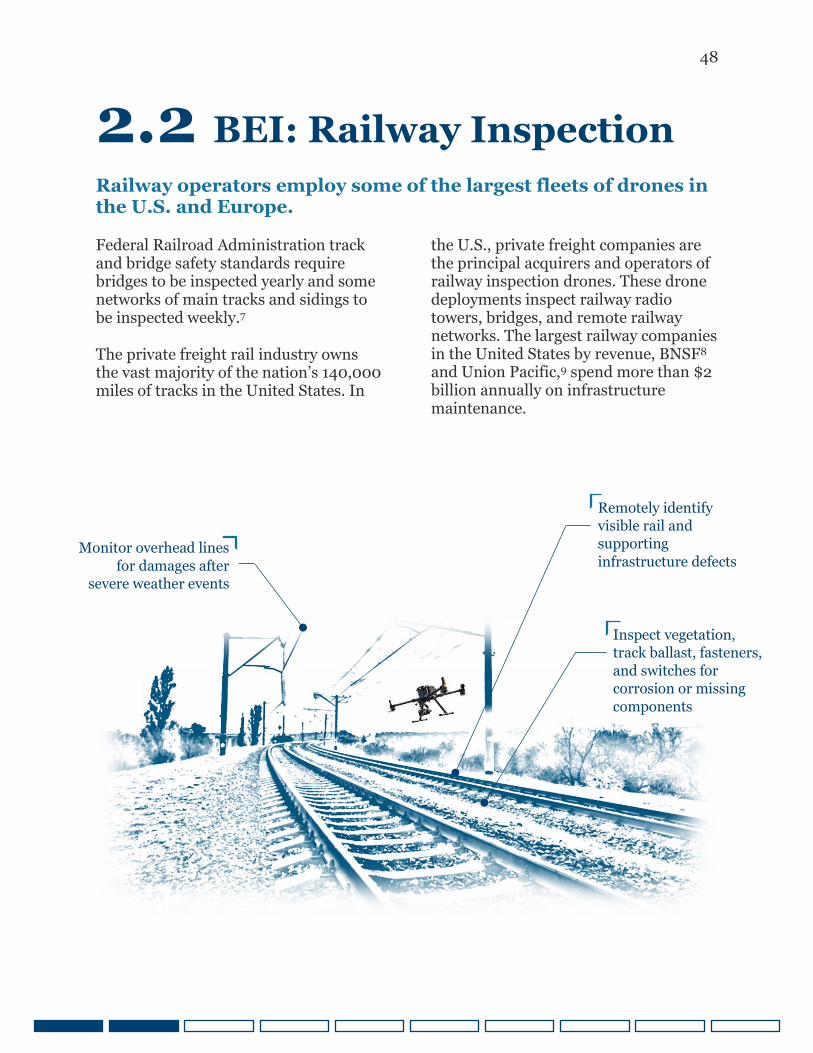
2.2 BEI: Railway Inspection
Railway operators employ some of the largest fleets of drones in the U.S. and Europe.
Federal Railroad Administration track and bridge safety standards require bridges to be inspected yearly and some networks of main tracks and sidings to be inspected weekly.7
The private freight rail industry owns the vast majority of the nation’s 140,000 miles of tracks in the United States. In
the U.S., private freight companies are the principal acquirers and operators of railway inspection drones. These drone deployments inspect railway radio towers, bridges, and remote railway networks. The largest railway companies in the United States by revenue, BNSF8 and Union Pacific,9 spend more than $2 billion annually on infrastructure maintenance.
Inspect vegetation,
track ballast, fasteners,
and switches for
corrosion or missing
components
Monitor overhead lines
for damages after
severe weather events
Remotely identify
visible rail and
supporting
infrastructure defects
49
2.2 BEI: Railway Inspection
Drones enable on-demand inspections of remote railway assets.
In partnership with the FAA’s Pathfinder Program, BNSF uses rotorcraft drones equipped with high-definition cameras to inspect railway bridges and assess railway network conditions after destructive weather events.10 BNSF inspects more than 32,500 miles of its railway across the U.S. twice a week and uses drones to reduce the cost and difficulty of inspecting track hundreds of miles away from major population centers.11
Unlike BNSF, many companies using drone-based railway inspections in Europe and the United States are still running pilot programs that have yet to scale. The primary inhibitor of growth is thousands of miles of railway networks
that require BVLOS approvals for each mission.
Railway inspection drones are on track to becoming commonplace fixtures along significant railway routes. In the near term, autonomous inspections will be performed by strategically positioned “drones-in-a-box,” drones that deploy from and return to self-contained landing “boxes.”
As autonomous drone railway inspections become widely available, asset-light railroad operators that do not want to manage a distributed team of drone monitors will likely scale down their internal drone programs in favor of an outsourced model.
50
2.2 BEI: Railway Inspection
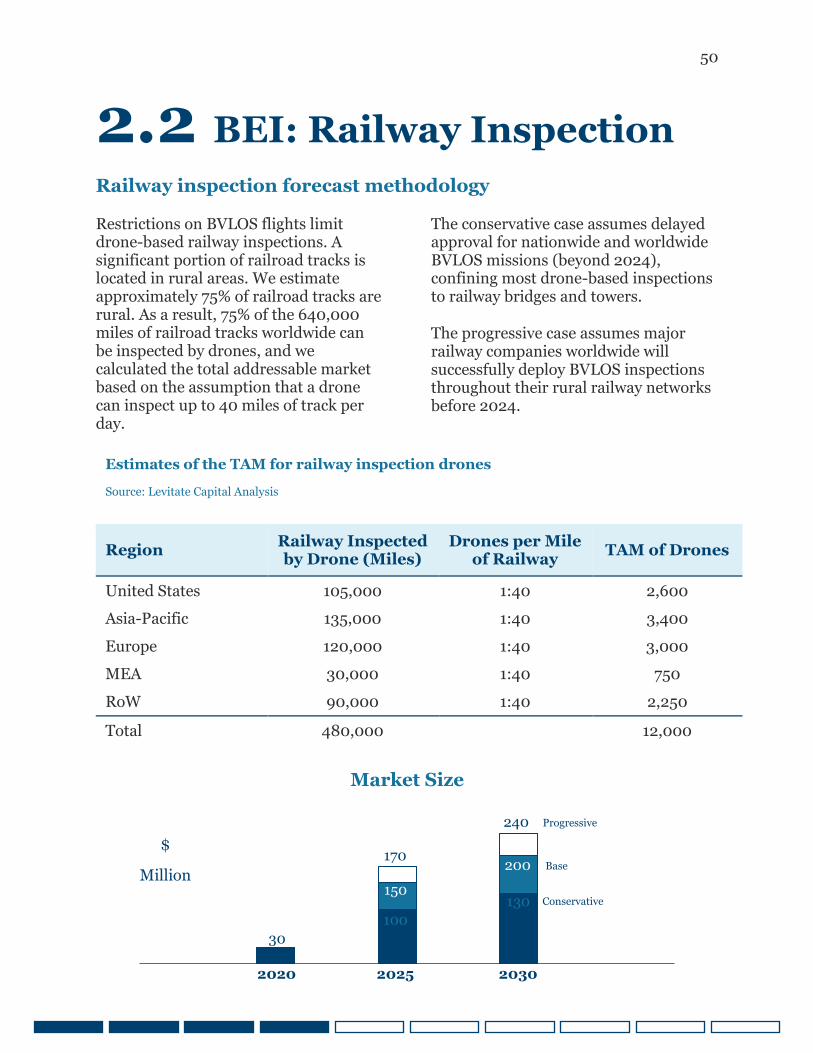
Railway inspection forecast methodology
Restrictions on BVLOS flights limit drone-based railway inspections. A significant portion of railroad tracks is located in rural areas. We estimate approximately 75% of railroad tracks are rural. As a result, 75% of the 640,000 miles of railroad tracks worldwide can be inspected by drones, and we calculated the total addressable market based on the assumption that a drone can inspect up to 40 miles of track per day.
The conservative case assumes delayed approval for nationwide and worldwide BVLOS missions (beyond 2024), confining most drone-based inspections to railway bridges and towers.
The progressive case assumes major railway companies worldwide will successfully deploy BVLOS inspections throughout their rural railway networks before 2024.
Region Railway Inspected by Drone (Miles)
Drones per Mile of Railway
TAM of Drones
United States 105,000 1:40 2,600
Asia-Pacific 135,000 1:40 3,400
Europe 120,000 1:40 3,000
MEA 30,000 1:40 750
RoW 90,000 1:40 2,250
Total 480,000 12,000
Estimates of the TAM for railway inspection drones
Source: Levitate Capital Analysis
30 100
130 150
200 170
240 Progressive
Base
Conservative
2020 2025 2030
Market Size
$
Million
51
2.2 BEI: Bridge Inspection
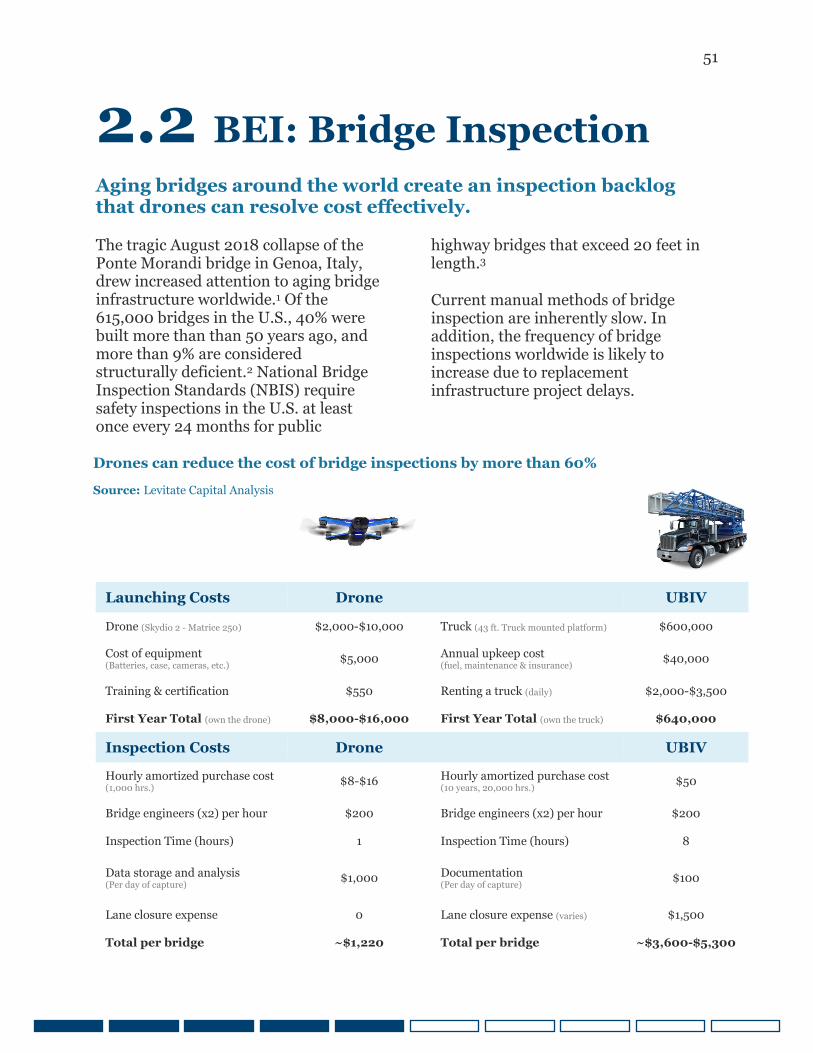
Aging bridges around the world create an inspection backlog that drones can resolve cost effectively.
The tragic August 2018 collapse of the Ponte Morandi bridge in Genoa, Italy, drew increased attention to aging bridge infrastructure worldwide.1 Of the 615,000 bridges in the U.S., 40% were built more than than 50 years ago, and more than 9% are considered structurally deficient.2 National Bridge Inspection Standards (NBIS) require safety inspections in the U.S. at least once every 24 months for public
highway bridges that exceed 20 feet in length.3
Current manual methods of bridge inspection are inherently slow. In addition, the frequency of bridge inspections worldwide is likely to increase due to replacement infrastructure project delays.
Launching Costs Drone UBIV
Drone (Skydio 2 - Matrice 250) $2,000-$10,000 Truck (43 ft. Truck mounted platform) $600,000
Cost of equipment (Batteries, case, cameras, etc.) $5,000 Annual upkeep cost
(fuel, maintenance & insurance) $40,000
Training & certification $550 Renting a truck (daily) $2,000-$3,500
First Year Total (own the drone) $8,000-$16,000 First Year Total (own the truck) $640,000
Inspection Costs Drone UBIV
Hourly amortized purchase cost (1,000 hrs.) $8-$16 Hourly amortized purchase cost
(10 years, 20,000 hrs.) $50
Bridge engineers (x2) per hour $200 Bridge engineers (x2) per hour $200
Inspection Time (hours) 1 Inspection Time (hours) 8
Data storage and analysis (Per day of capture) $1,000 Documentation
(Per day of capture) $100
Lane closure expense 0 Lane closure expense (varies) $1,500
Total per bridge ~$1,220 Total per bridge ~$3,600-$5,300
Drones can reduce the cost of bridge inspections by more than 60%
Source: Levitate Capital Analysis
52
2.2 BEI: Bridge Inspection
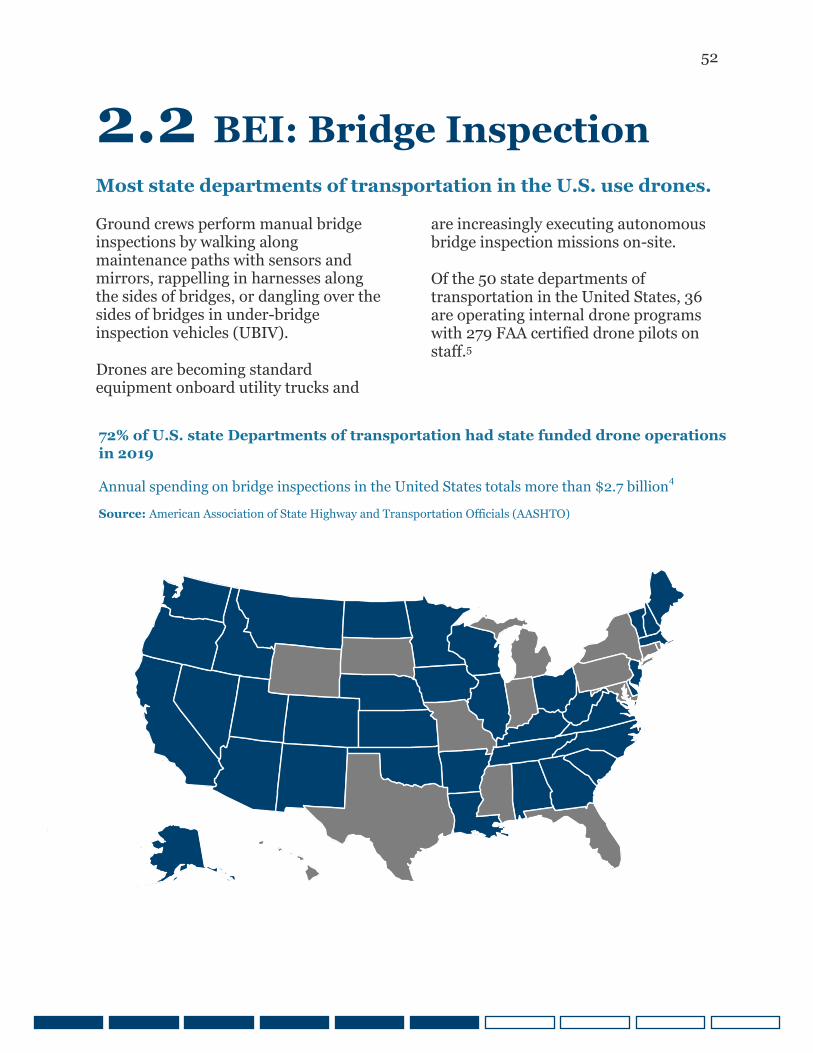
Most state departments of transportation in the U.S. use drones.
Ground crews perform manual bridge inspections by walking along maintenance paths with sensors and mirrors, rappelling in harnesses along the sides of bridges, or dangling over the sides of bridges in under-bridge inspection vehicles (UBIV).
Drones are becoming standard equipment onboard utility trucks and
are increasingly executing autonomous bridge inspection missions on-site.
Of the 50 state departments of transportation in the United States, 36 are operating internal drone programs with 279 FAA certified drone pilots on staff.5
72% of U.S. state Departments of transportation had state funded drone operations
in 2019
Annual spending on bridge inspections in the United States totals more than $2.7 billion4
Source: American Association of State Highway and Transportation Officials (AASHTO)
53
2.2 BEI: Bridge Inspection
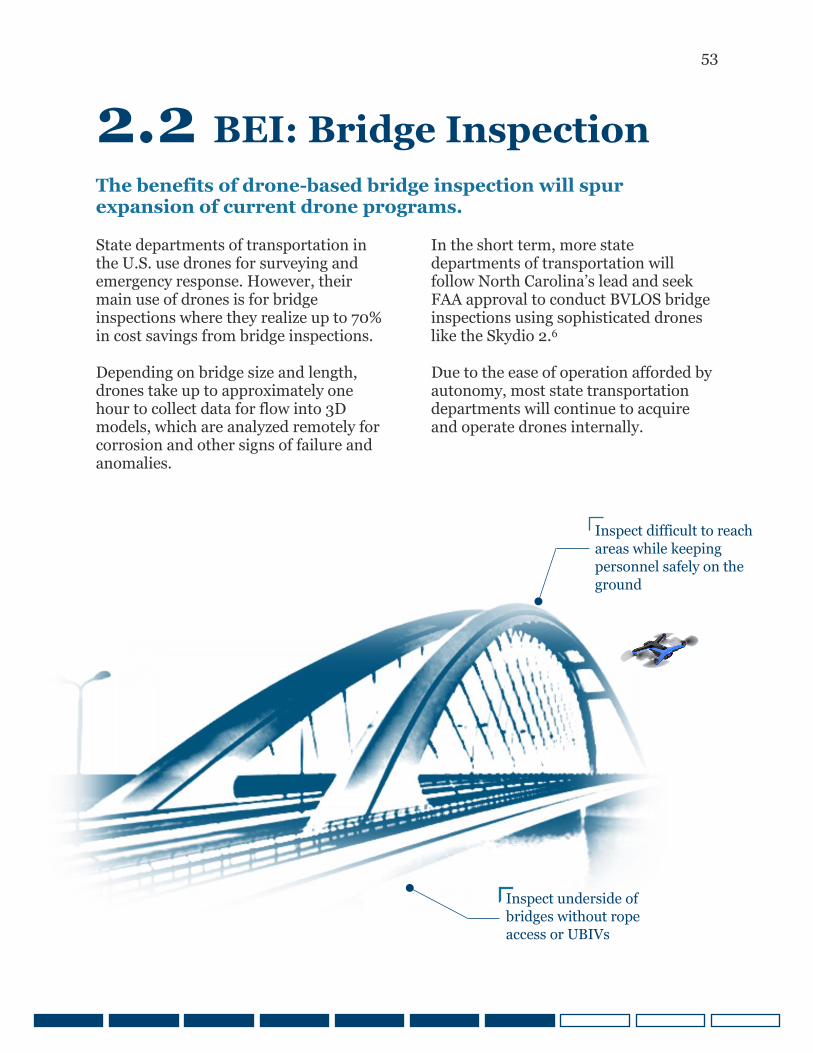
The benefits of drone-based bridge inspection will spur expansion of current drone programs.
State departments of transportation in the U.S. use drones for surveying and emergency response. However, their main use of drones is for bridge inspections where they realize up to 70% in cost savings from bridge inspections.
Depending on bridge size and length, drones take up to approximately one hour to collect data for flow into 3D models, which are analyzed remotely for corrosion and other signs of failure and anomalies.
In the short term, more state departments of transportation will follow North Carolina’s lead and seek FAA approval to conduct BVLOS bridge inspections using sophisticated drones like the Skydio 2.6
Due to the ease of operation afforded by autonomy, most state transportation departments will continue to acquire and operate drones internally.
Inspect underside of
bridges without rope
access or UBIVs
Inspect difficult to reach
areas while keeping
personnel safely on the
ground
54
2.2 BEI: Bridge Inspection
Bridge inspection forecast methodology
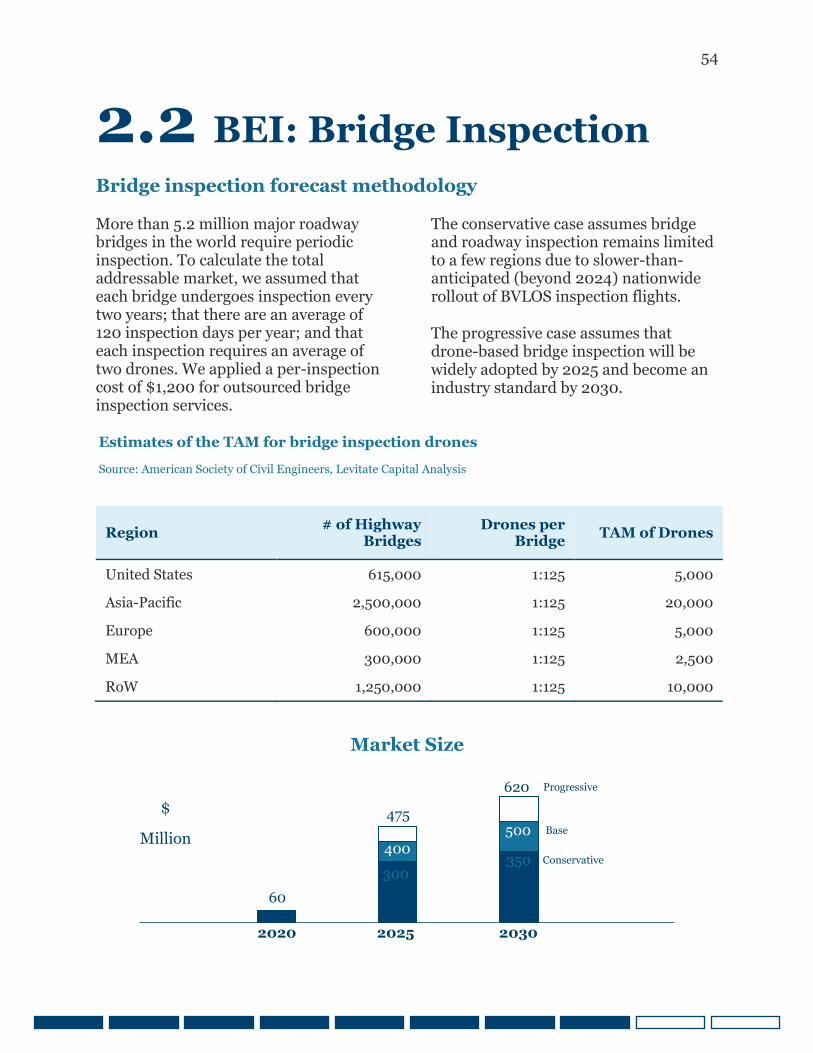
More than 5.2 million major roadway bridges in the world require periodic inspection. To calculate the total addressable market, we assumed that each bridge undergoes inspection every two years; that there are an average of 120 inspection days per year; and that each inspection requires an average of two drones. We applied a per-inspection cost of $1,200 for outsourced bridge inspection services.
The conservative case assumes bridge and roadway inspection remains limited to a few regions due to slower-than-anticipated (beyond 2024) nationwide rollout of BVLOS inspection flights.
The progressive case assumes that drone-based bridge inspection will be widely adopted by 2025 and become an industry standard by 2030.
Region # of Highway Bridges
Drones per Bridge TAM of Drones
United States 615,000 1:125 5,000 Asia-Pacific 2,500,000 1:125 20,000
Europe 600,000 1:125 5,000
MEA 300,000 1:125 2,500
RoW 1,250,000 1:125 10,000
Estimates of the TAM for bridge inspection drones
Source: American Society of Civil Engineers, Levitate Capital Analysis
60
300 350
400 500
475
620 Progressive
Base
Conservative
2020 2025 2030
Market Size
$
Million
55
2.2 BEI: Property Inspection Drones are already essential tools for processing insurance claims. Drones are transforming how building façade inspectors and insurance adjusters examine structures. Building façade inspectors currently rappel down the sides of buildings or construct expensive scaffolding to perform routine inspections on tall buildings every five years.12 Drones will render scaffolding and rappelling unnecessary except for repair work.
Drones are already becoming standard equipment for insurance claim professionals. Insurance agencies have been deploying drones since 2015 to accelerate dangerous and time-intensive inspections at claims sites while keeping employees safely on the ground.
Travelers Insurance launched its drone program in January 2017. By March 2019, 650 FAA-certified claim professionals completed more than 53,000 Travelers Insurance inspection flights across 48 states.13 In 2019, the FAA granted State Farm the first national waiver to conduct drone operations over people and BVLOS for catastrophic assessments through November 2022.14
As roof scanning and property damage software grow increasingly advanced, more insurance agencies will take to the skies to improve worker safety and inspection speed and accuracy.
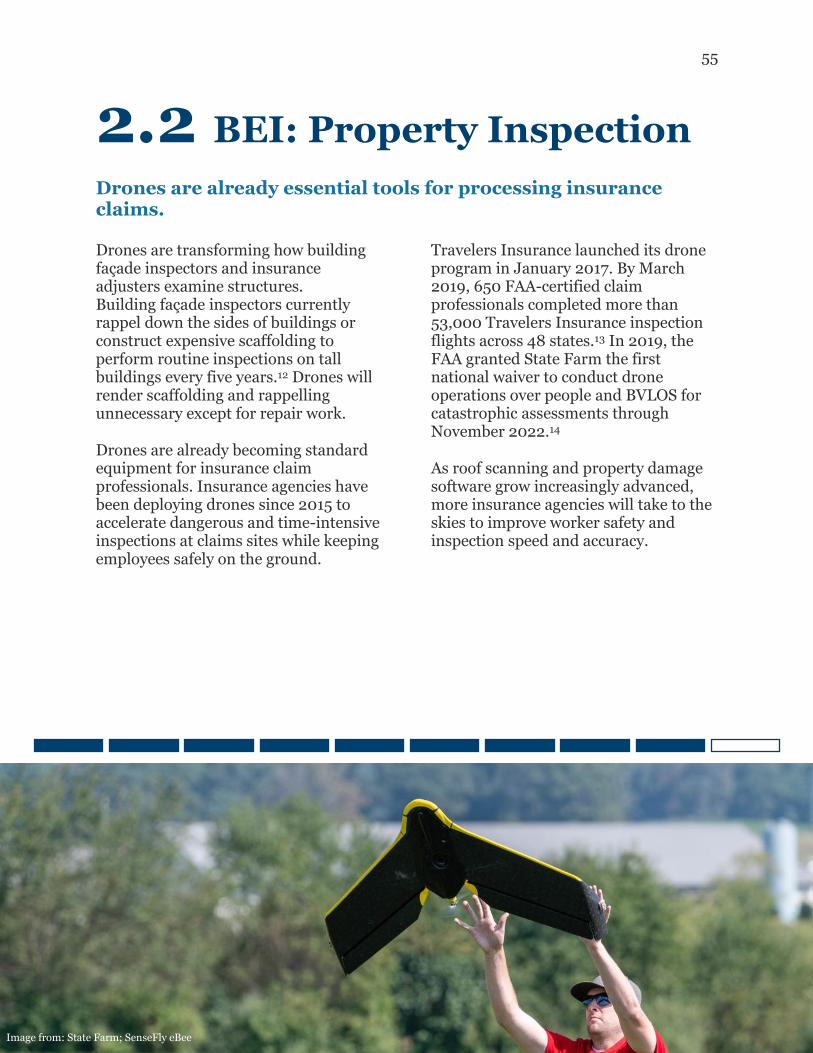
Image from: State Farm; SenseFly eBee
56
2.2 BEI: Property Inspection
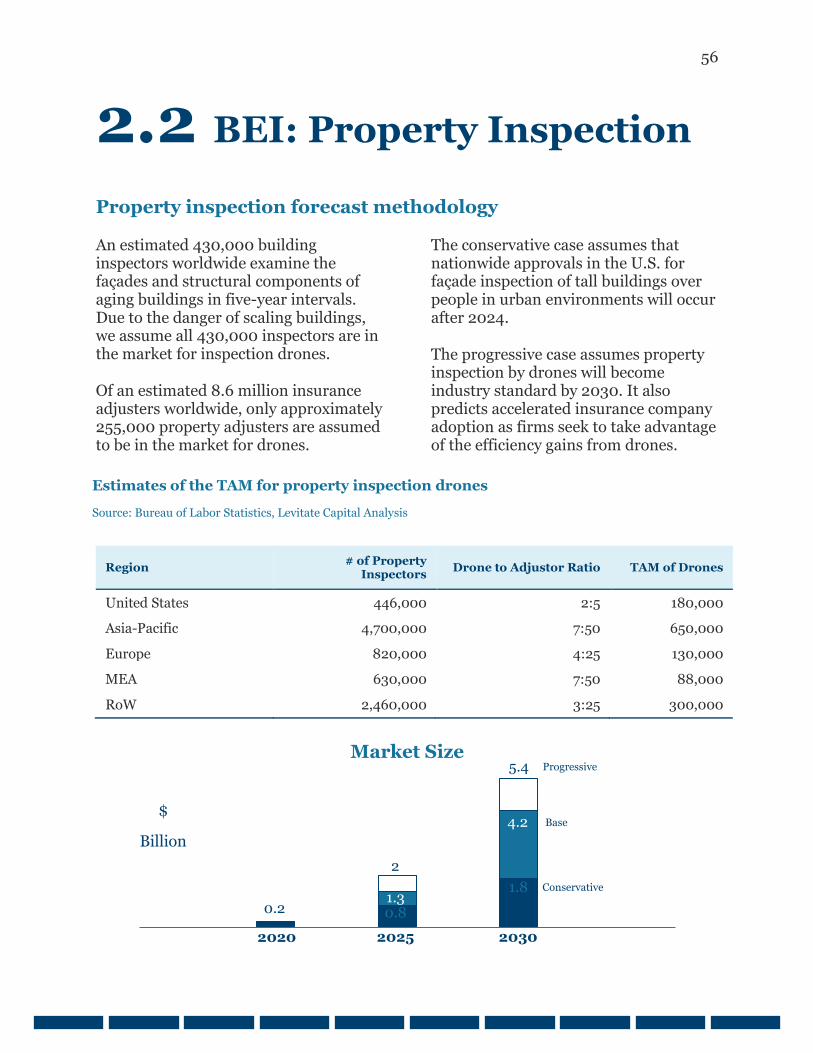
Property inspection forecast methodology
An estimated 430,000 building inspectors worldwide examine the façades and structural components of aging buildings in five-year intervals. Due to the danger of scaling buildings, we assume all 430,000 inspectors are in the market for inspection drones.
Of an estimated 8.6 million insurance adjusters worldwide, only approximately 255,000 property adjusters are assumed to be in the market for drones.
The conservative case assumes that nationwide approvals in the U.S. for façade inspection of tall buildings over people in urban environments will occur after 2024.
The progressive case assumes property inspection by drones will become industry standard by 2030. It also predicts accelerated insurance company adoption as firms seek to take advantage of the efficiency gains from drones.
Region # of Property Inspectors Drone to Adjustor Ratio TAM of Drones
United States 446,000 2:5 180,000 Asia-Pacific 4,700,000 7:50 650,000 Europe 820,000 4:25 130,000 MEA 630,000 7:50 88,000 RoW 2,460,000 3:25 300,000
Estimates of the TAM for property inspection drones
Source: Bureau of Labor Statistics, Levitate Capital Analysis
0.2 0.8
1.8 1.3
4.2
2
5.4 Progressive
Base
Conservative
2020 2025 2030
Market Size
$
Billion
57
2.3 Agriculture
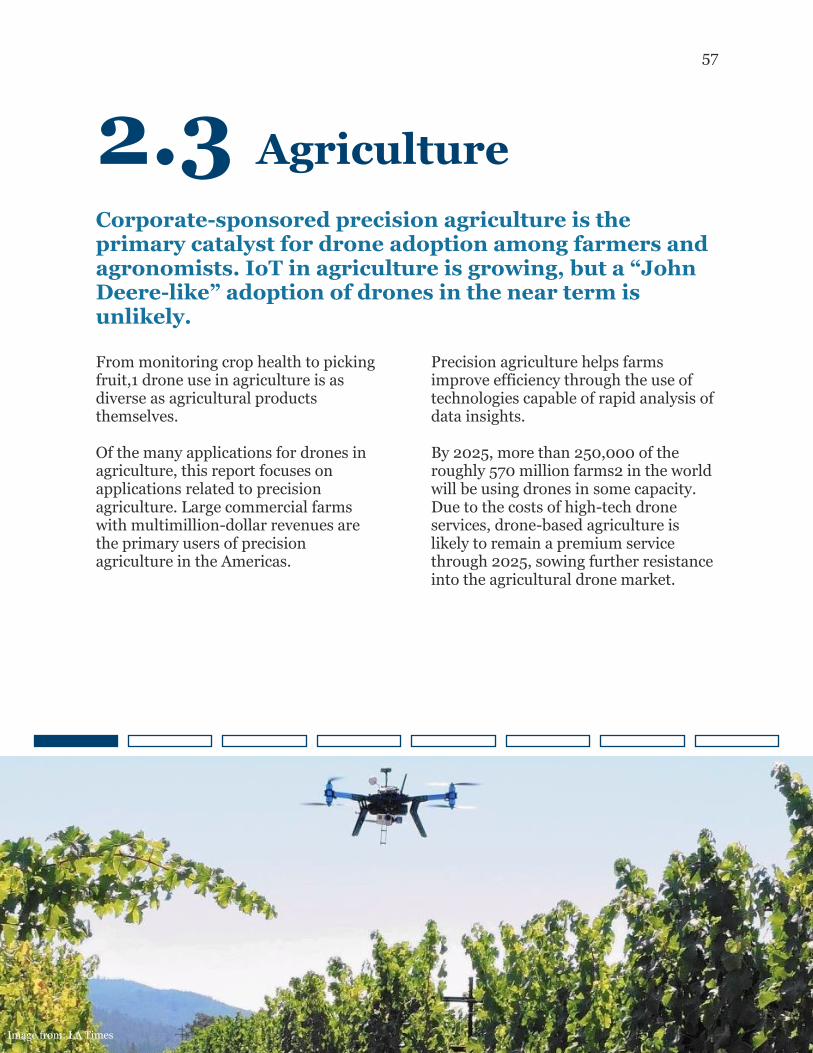
Corporate-sponsored precision agriculture is the primary catalyst for drone adoption among farmers and agronomists. IoT in agriculture is growing, but a “John Deere-like” adoption of drones in the near term is unlikely. From monitoring crop health to picking fruit,1 drone use in agriculture is as diverse as agricultural products themselves. Of the many applications for drones in agriculture, this report focuses on applications related to precision agriculture. Large commercial farms with multimillion-dollar revenues are the primary users of precision agriculture in the Americas.
Precision agriculture helps farms improve efficiency through the use of technologies capable of rapid analysis of data insights. By 2025, more than 250,000 of the roughly 570 million farms2 in the world will be using drones in some capacity. Due to the costs of high-tech drone services, drone-based agriculture is likely to remain a premium service through 2025, sowing further resistance into the agricultural drone market.
Image from: LA Times
58
2.3 Agriculture
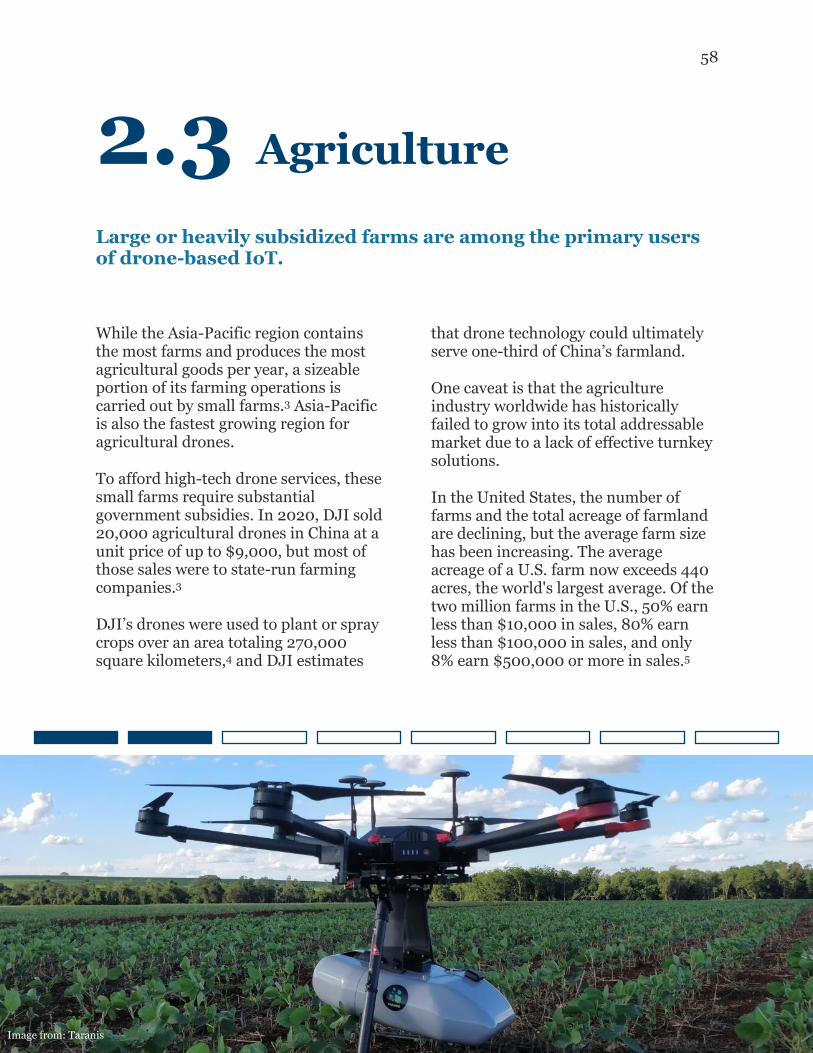
Large or heavily subsidized farms are among the primary users of drone-based IoT.
While the Asia-Pacific region contains the most farms and produces the most agricultural goods per year, a sizeable portion of its farming operations is carried out by small farms.3 Asia-Pacific is also the fastest growing region for agricultural drones.
To afford high-tech drone services, these small farms require substantial government subsidies. In 2020, DJI sold 20,000 agricultural drones in China at a unit price of up to $9,000, but most of those sales were to state-run farming companies.3
DJI’s drones were used to plant or spray crops over an area totaling 270,000 square kilometers,4 and DJI estimates
that drone technology could ultimately serve one-third of China’s farmland.
One caveat is that the agriculture industry worldwide has historically failed to grow into its total addressable market due to a lack of effective turnkey solutions.
In the United States, the number of farms and the total acreage of farmland are declining, but the average farm size has been increasing. The average acreage of a U.S. farm now exceeds 440 acres, the world's largest average. Of the two million farms in the U.S., 50% earn less than $10,000 in sales, 80% earn less than $100,000 in sales, and only 8% earn $500,000 or more in sales.5
Image from: Taranis
59
2.3 Agriculture
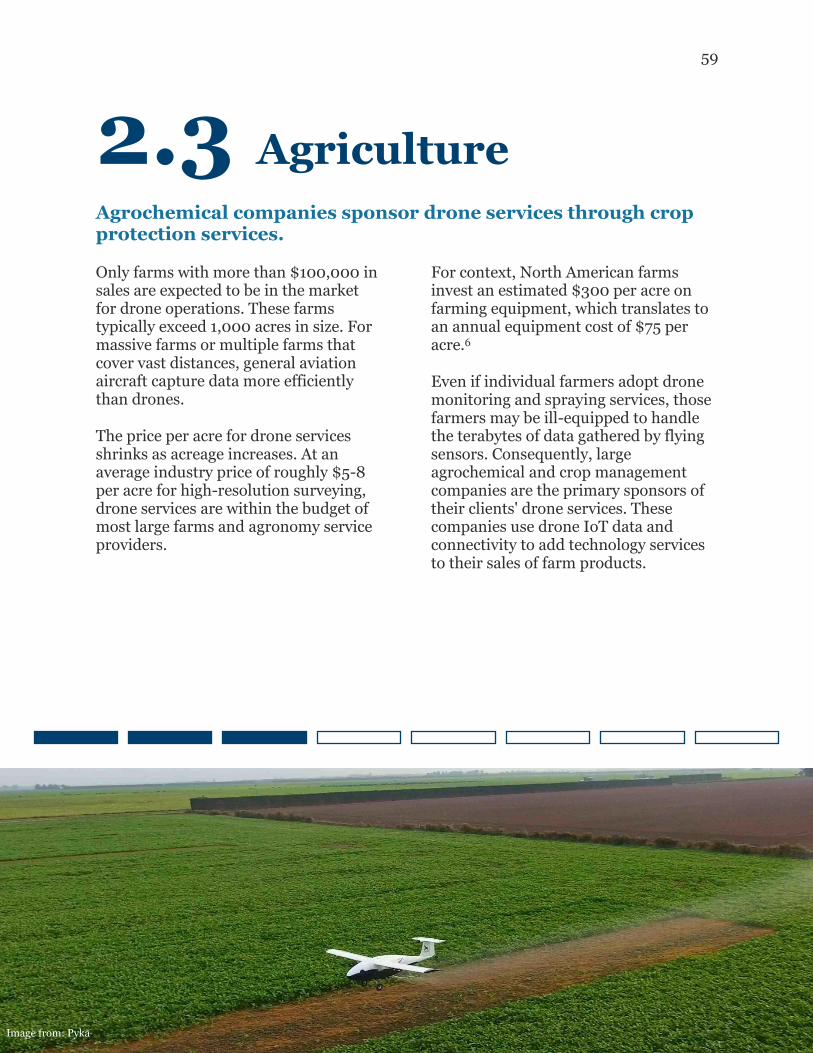
Agrochemical companies sponsor drone services through crop protection services.
Only farms with more than $100,000 in sales are expected to be in the market for drone operations. These farms typically exceed 1,000 acres in size. For massive farms or multiple farms that cover vast distances, general aviation aircraft capture data more efficiently than drones.
The price per acre for drone services shrinks as acreage increases. At an average industry price of roughly $5-8 per acre for high-resolution surveying, drone services are within the budget of most large farms and agronomy service providers.
For context, North American farms invest an estimated $300 per acre on farming equipment, which translates to an annual equipment cost of $75 per acre.6
Even if individual farmers adopt drone monitoring and spraying services, those farmers may be ill-equipped to handle the terabytes of data gathered by flying sensors. Consequently, large agrochemical and crop management companies are the primary sponsors of their clients' drone services. These companies use drone IoT data and connectivity to add technology services to their sales of farm products.
Image from: Pyka
60
2.3 Agriculture
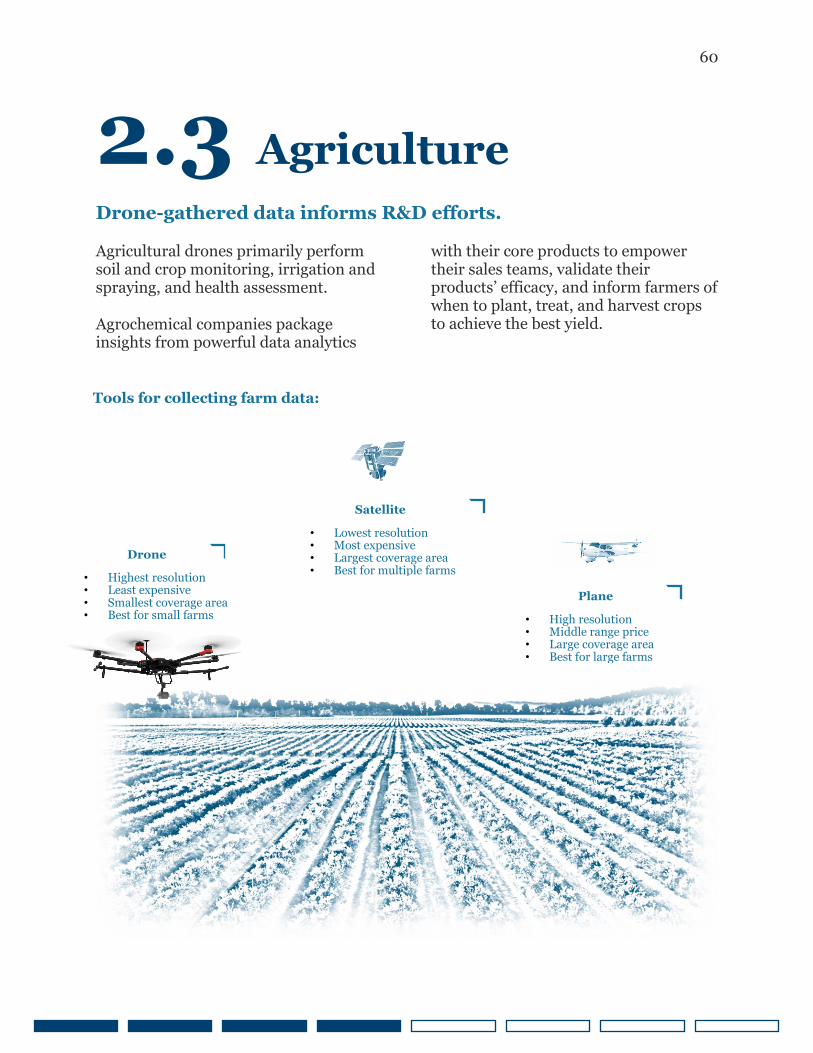
Drone-gathered data informs R&D efforts.
Agricultural drones primarily perform soil and crop monitoring, irrigation and spraying, and health assessment.
Agrochemical companies package insights from powerful data analytics
with their core products to empower their sales teams, validate their products’ efficacy, and inform farmers of when to plant, treat, and harvest crops to achieve the best yield.
Tools for collecting farm data:
Drone
• Highest resolution • Least expensive • Smallest coverage area • Best for small farms
Satellite
• Lowest resolution • Most expensive • Largest coverage area • Best for multiple farms
Plane
• High resolution • Middle range price • Large coverage area • Best for large farms
61
2.3 Agriculture
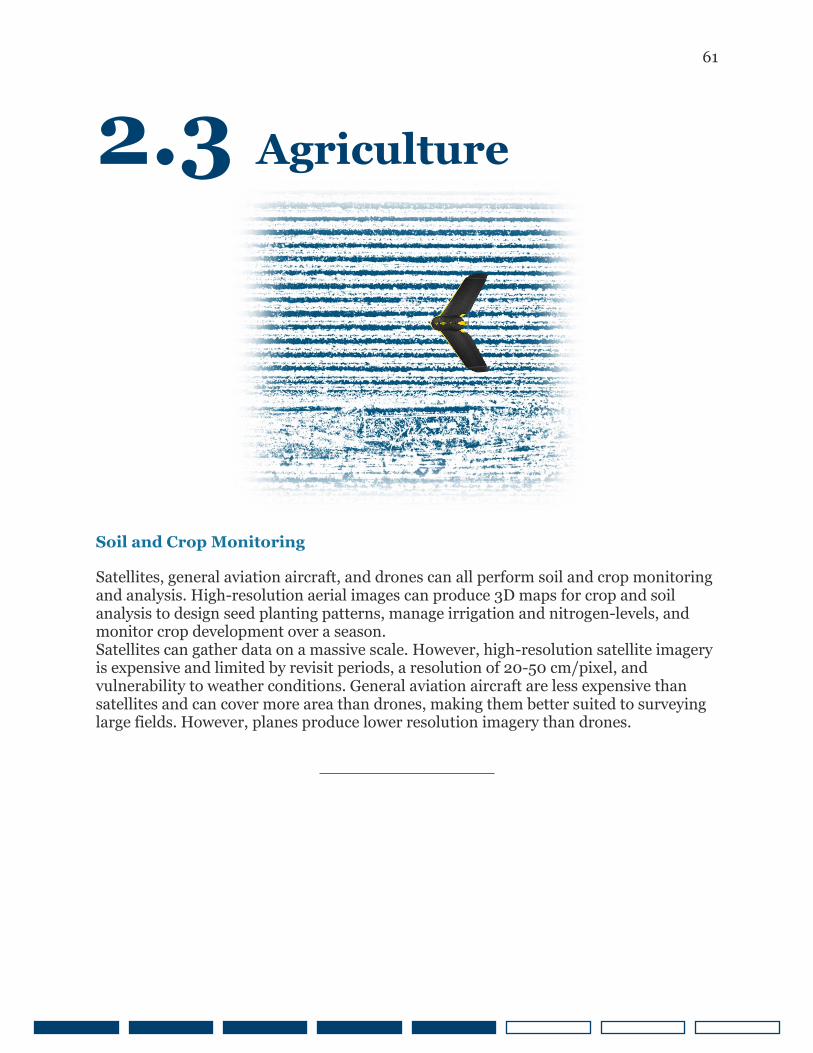
Soil and Crop Monitoring
Satellites, general aviation aircraft, and drones can all perform soil and crop monitoring and analysis. High-resolution aerial images can produce 3D maps for crop and soil analysis to design seed planting patterns, manage irrigation and nitrogen-levels, and monitor crop development over a season. Satellites can gather data on a massive scale. However, high-resolution satellite imagery is expensive and limited by revisit periods, a resolution of 20-50 cm/pixel, and vulnerability to weather conditions. General aviation aircraft are less expensive than satellites and can cover more area than drones, making them better suited to surveying large fields. However, planes produce lower resolution imagery than drones.
62
2.3 Agriculture
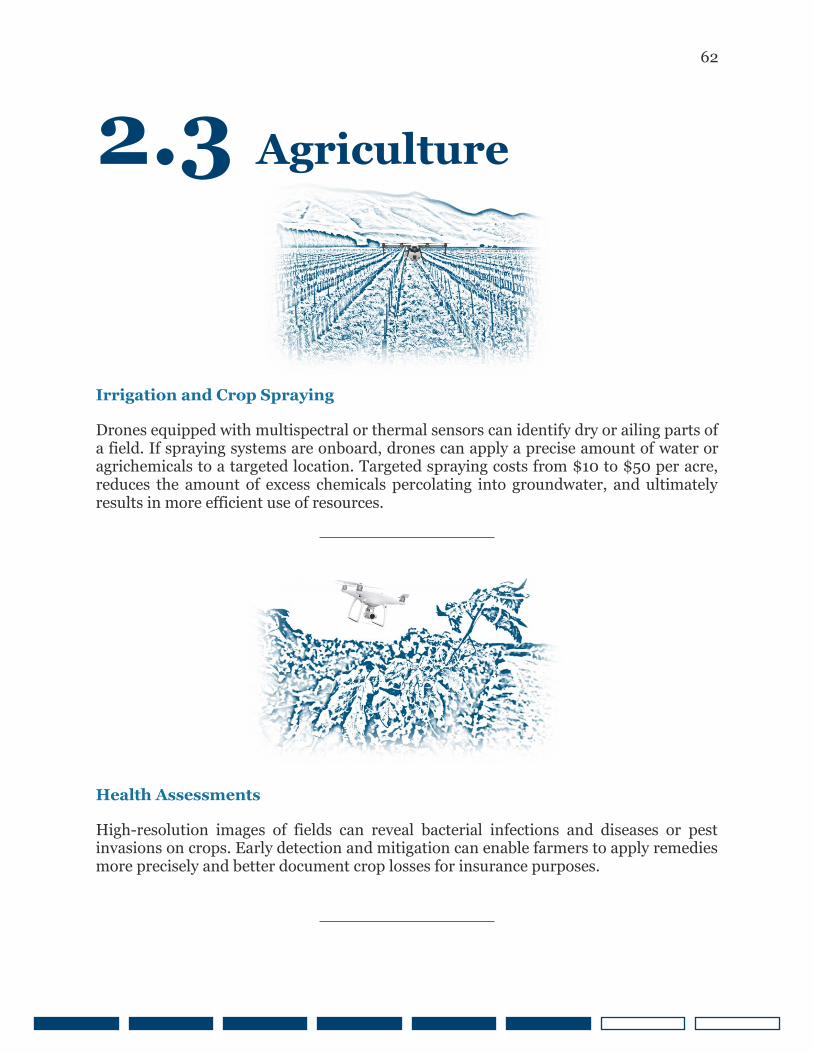
Irrigation and Crop Spraying
Drones equipped with multispectral or thermal sensors can identify dry or ailing parts of a field. If spraying systems are onboard, drones can apply a precise amount of water or agrichemicals to a targeted location. Targeted spraying costs from $10 to $50 per acre, reduces the amount of excess chemicals percolating into groundwater, and ultimately results in more efficient use of resources.
Health Assessments
High-resolution images of fields can reveal bacterial infections and diseases or pest invasions on crops. Early detection and mitigation can enable farmers to apply remedies more precisely and better document crop losses for insurance purposes.
63
2.3 Agriculture
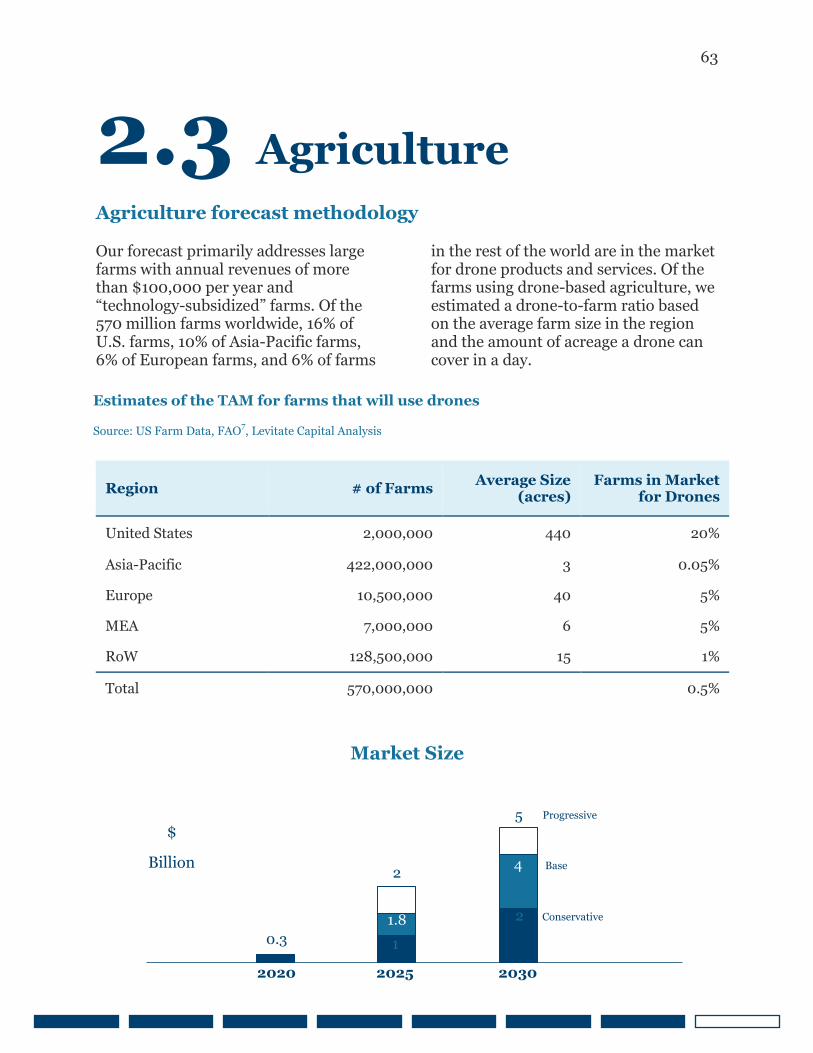
Agriculture forecast methodology
Our forecast primarily addresses large farms with annual revenues of more than $100,000 per year and “technology-subsidized” farms. Of the 570 million farms worldwide, 16% of U.S. farms, 10% of Asia-Pacific farms, 6% of European farms, and 6% of farms
in the rest of the world are in the market for drone products and services. Of the farms using drone-based agriculture, we estimated a drone-to-farm ratio based on the average farm size in the region and the amount of acreage a drone can cover in a day.
Region # of Farms Average Size (acres)
Farms in Market for Drones
United States 2,000,000 440 20%
Asia-Pacific 422,000,000 3 0.05%
Europe 10,500,000 40 5%
MEA 7,000,000 6 5%
RoW 128,500,000 15 1%
Total 570,000,000 0.5%
Estimates of the TAM for farms that will use drones
Source: US Farm Data, FAO7, Levitate Capital Analysis
0.3 1
2 1.8
4 2
5 Progressive
Base
Conservative
2020 2025 2030
Market Size
$
Billion
64
2.3 Agriculture
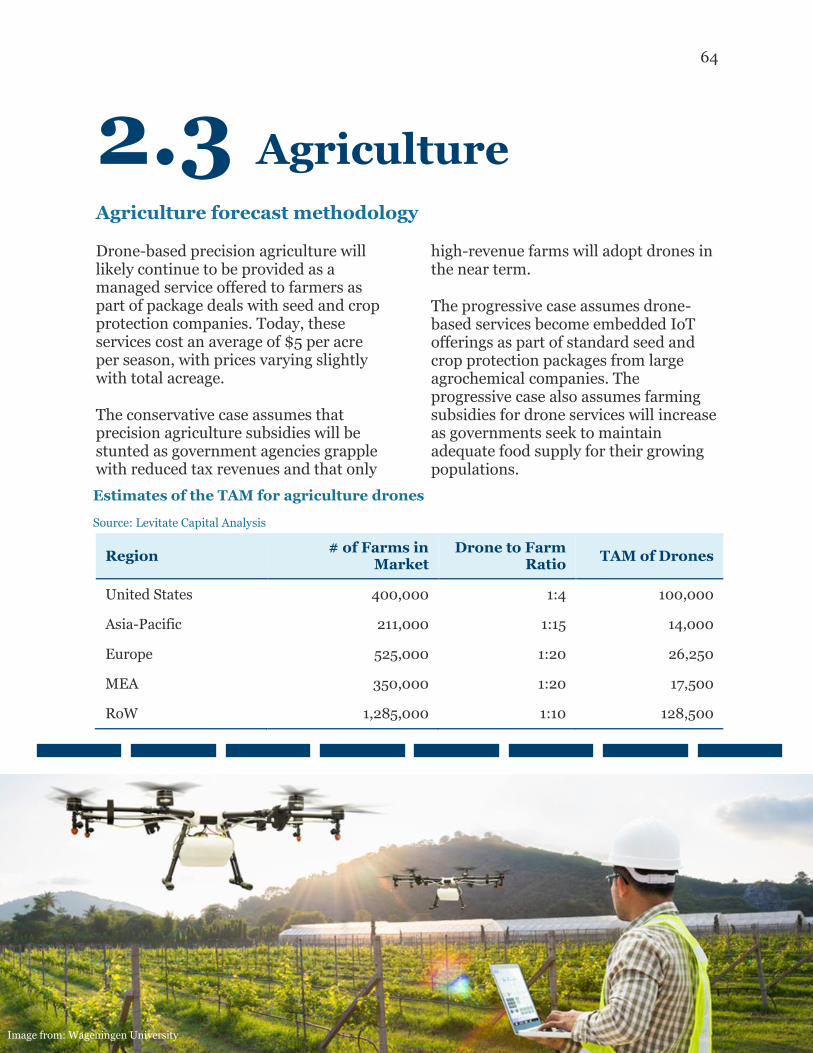
Agriculture forecast methodology
Drone-based precision agriculture will likely continue to be provided as a managed service offered to farmers as part of package deals with seed and crop protection companies. Today, these services cost an average of $5 per acre per season, with prices varying slightly with total acreage.
The conservative case assumes that precision agriculture subsidies will be stunted as government agencies grapple with reduced tax revenues and that only
high-revenue farms will adopt drones in the near term.
The progressive case assumes drone-based services become embedded IoT offerings as part of standard seed and crop protection packages from large agrochemical companies. The progressive case also assumes farming subsidies for drone services will increase as governments seek to maintain adequate food supply for their growing populations.
Region # of Farms in Market
Drone to Farm Ratio TAM of Drones
United States 400,000 1:4 100,000
Asia-Pacific 211,000 1:15 14,000
Europe 525,000 1:20 26,250
MEA 350,000 1:20 17,500
RoW 1,285,000 1:10 128,500
Estimates of the TAM for agriculture drones
Source: Levitate Capital Analysis
Image from: Wageningen University
65
2.4 Enterprise Counter Drone
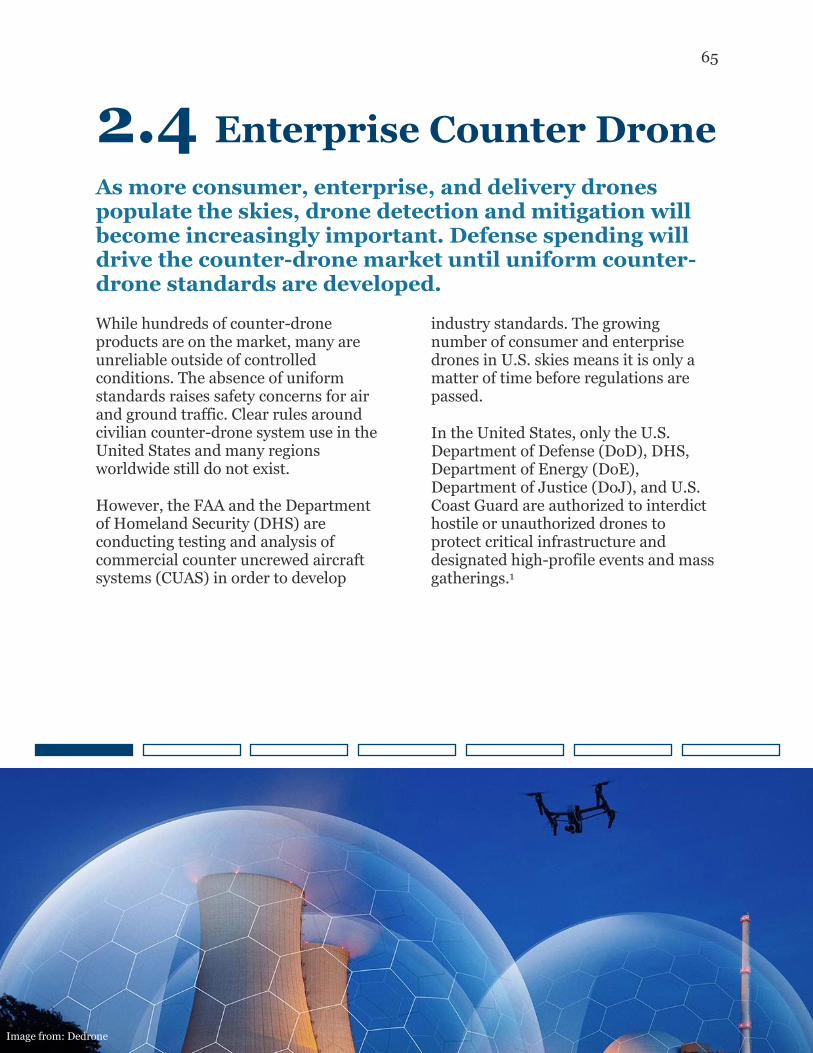
As more consumer, enterprise, and delivery drones populate the skies, drone detection and mitigation will become increasingly important. Defense spending will drive the counter-drone market until uniform counter-drone standards are developed.
While hundreds of counter-drone products are on the market, many are unreliable outside of controlled conditions. The absence of uniform standards raises safety concerns for air and ground traffic. Clear rules around civilian counter-drone system use in the United States and many regions worldwide still do not exist.
However, the FAA and the Department of Homeland Security (DHS) are conducting testing and analysis of commercial counter uncrewed aircraft systems (CUAS) in order to develop
industry standards. The growing number of consumer and enterprise drones in U.S. skies means it is only a matter of time before regulations are passed.
In the United States, only the U.S. Department of Defense (DoD), DHS, Department of Energy (DoE), Department of Justice (DoJ), and U.S. Coast Guard are authorized to interdict hostile or unauthorized drones to protect critical infrastructure and designated high-profile events and mass gatherings.1
Image from: Dedrone
66
2.4 Enterprise Counter Drone
Current CUAS restrictions leave critical infrastructure and venues vulnerable to malicious drones.
Critical infrastructure, government buildings, and mass-gathering venues are currently soft targets for malicious drones.
The FAA has warned local authorities and event organizers that unauthorized use of CUAS systems to protect high-profile events may violate FAA, Federal
Communications Commission (FCC), and federal aviation laws. In response, organizations such as the NFL are educating fans about drone restrictions and urging Congress to extend CUAS authority to state and local law enforcement in order to impose temporary flight restrictions over large sporting events.
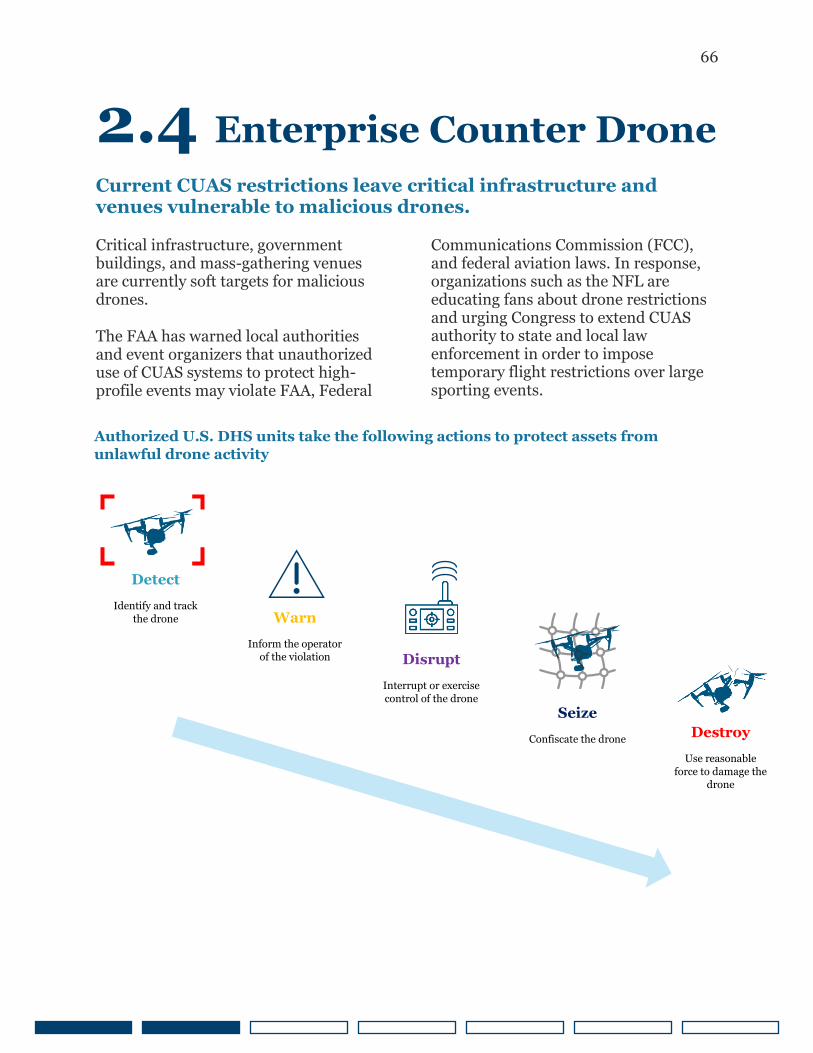
Authorized U.S. DHS units take the following actions to protect assets from
unlawful drone activity
Source: Department of Homeland Security
Detect
Identify and track
the drone Warn
Inform the operator of the violation Disrupt
Interrupt or exercise
control of the drone Seize
Confiscate the drone Destroy
Use reasonable
force to damage the drone
67
2.4 Enterprise Counter Drone
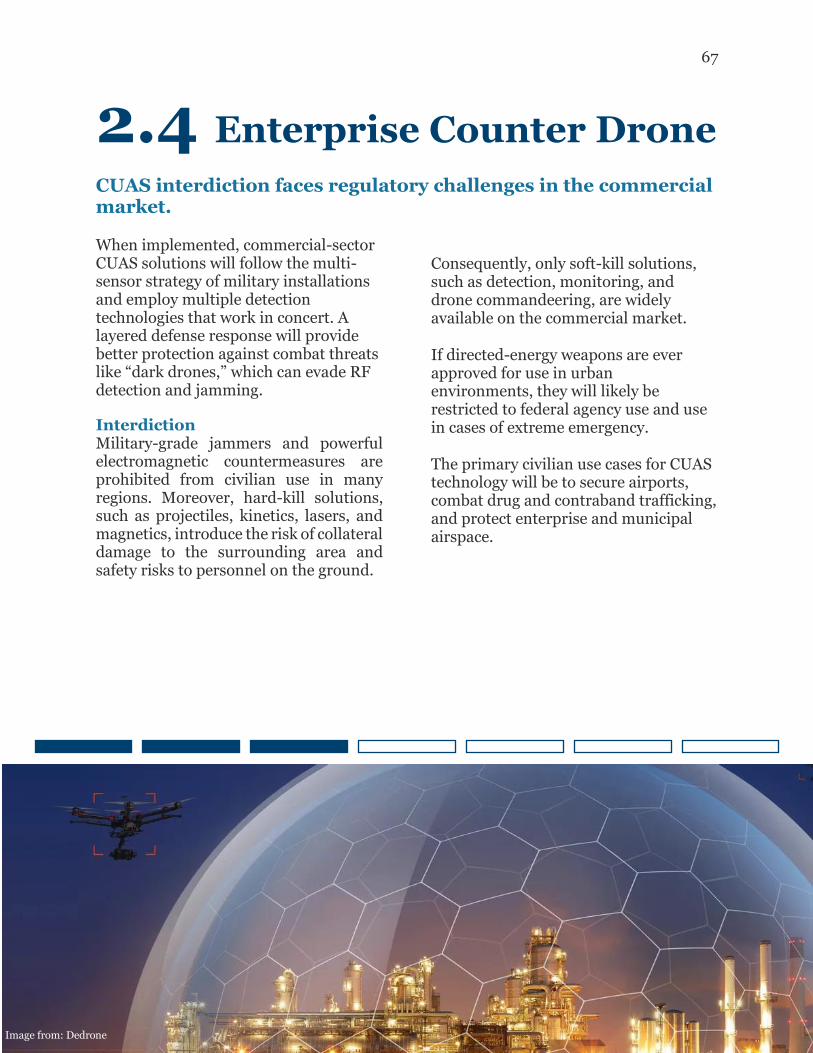
CUAS interdiction faces regulatory challenges in the commercial market.
When implemented, commercial-sector CUAS solutions will follow the multi-sensor strategy of military installations and employ multiple detection technologies that work in concert. A layered defense response will provide better protection against combat threats like “dark drones,” which can evade RF detection and jamming.
Interdiction
Military-grade jammers and powerful electromagnetic countermeasures are prohibited from civilian use in many regions. Moreover, hard-kill solutions, such as projectiles, kinetics, lasers, and magnetics, introduce the risk of collateral damage to the surrounding area and safety risks to personnel on the ground.
Consequently, only soft-kill solutions, such as detection, monitoring, and drone commandeering, are widely available on the commercial market.
If directed-energy weapons are ever approved for use in urban environments, they will likely be restricted to federal agency use and use in cases of extreme emergency.
The primary civilian use cases for CUAS technology will be to secure airports, combat drug and contraband trafficking, and protect enterprise and municipal airspace.
Image from: Dedrone
68
2.4 Enterprise Counter Drone
Airports
U.S. airports currently lack the legal authority to deploy counter-drone technologies due to the potential risk to crewed aircraft and air traffic control equipment. The primary airport customers of CUAS technology have been in Europe, mainly due to high-profile
slowdowns after drone sightings.2 If the U.S. adopts CUAS policies similar to those in
the United Kingdom, the more than 5,000 public airports in the U.S. will become an immense opportunity for CUAS solutions.
Protected Enterprise Airspace
As drone missions become increasingly commonplace in the skies, demand for securing and controlling airspace around sensitive enterprises will increase. Many businesses use geofencing, a service that triggers a notification when a mobile device or RFID tag enters or exits a virtual geographical boundary to prohibit pilots from unknowingly intruding into their airspace. Many major open-air stadiums, theme parks, and seaports will eventually be in the market for more sophisticated drone detection technology.
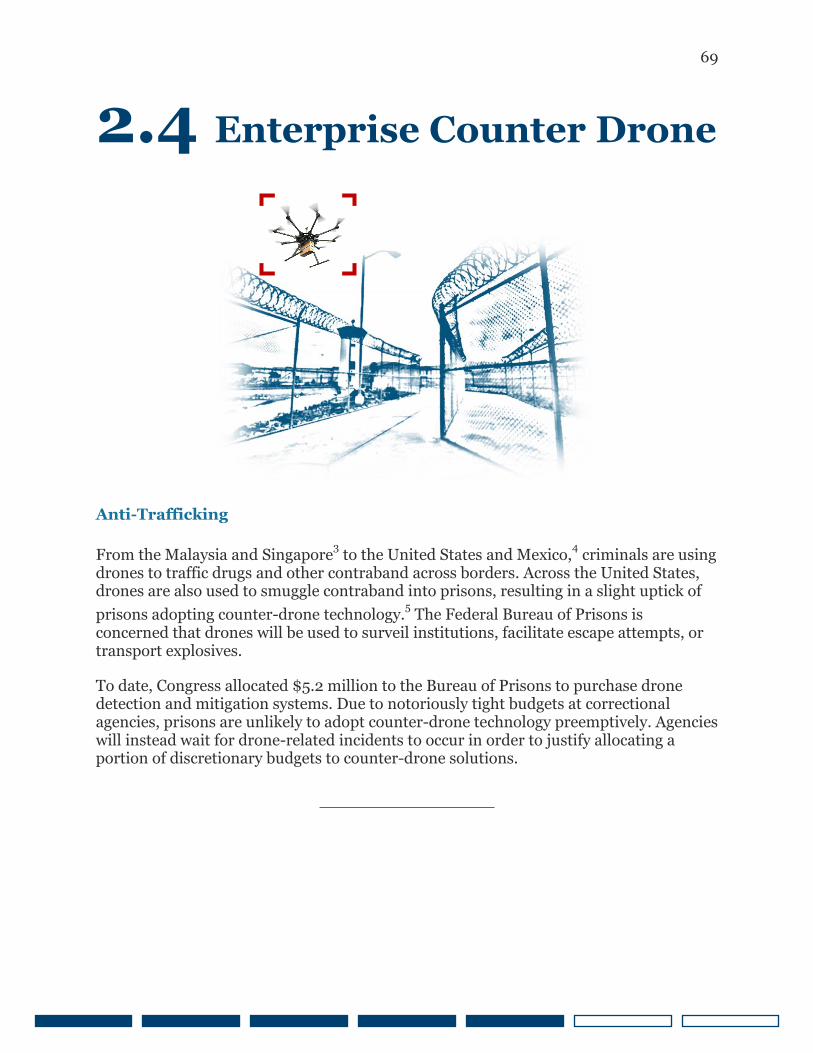
69
2.4 Enterprise Counter Drone
Anti-Trafficking
From the Malaysia and Singapore3 to the United States and Mexico,
4 criminals are using
drones to traffic drugs and other contraband across borders. Across the United States, drones are also used to smuggle contraband into prisons, resulting in a slight uptick of
prisons adopting counter-drone technology.5 The Federal Bureau of Prisons is
concerned that drones will be used to surveil institutions, facilitate escape attempts, or transport explosives.
To date, Congress allocated $5.2 million to the Bureau of Prisons to purchase drone detection and mitigation systems. Due to notoriously tight budgets at correctional agencies, prisons are unlikely to adopt counter-drone technology preemptively. Agencies will instead wait for drone-related incidents to occur in order to justify allocating a portion of discretionary budgets to counter-drone solutions.
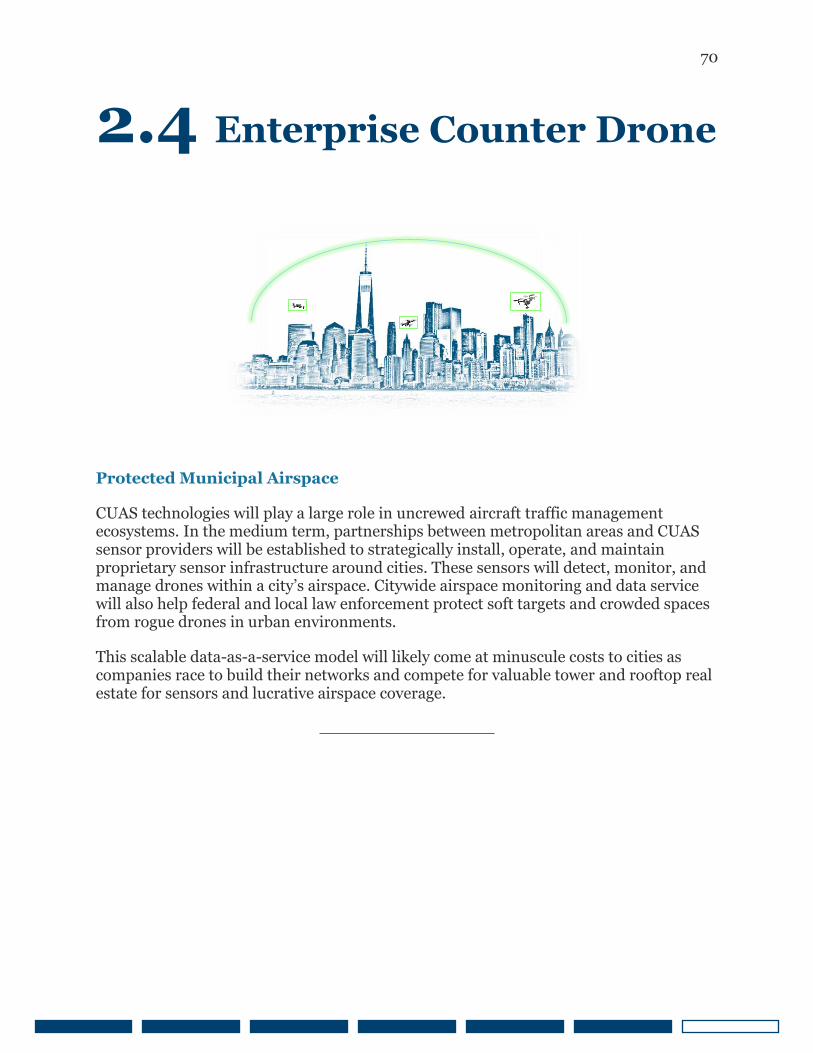
70
2.4 Enterprise Counter Drone
Protected Municipal Airspace
CUAS technologies will play a large role in uncrewed aircraft traffic management ecosystems. In the medium term, partnerships between metropolitan areas and CUAS sensor providers will be established to strategically install, operate, and maintain proprietary sensor infrastructure around cities. These sensors will detect, monitor, and manage drones within a city’s airspace. Citywide airspace monitoring and data service will also help federal and local law enforcement protect soft targets and crowded spaces from rogue drones in urban environments.
This scalable data-as-a-service model will likely come at minuscule costs to cities as companies race to build their networks and compete for valuable tower and rooftop real estate for sensors and lucrative airspace coverage.
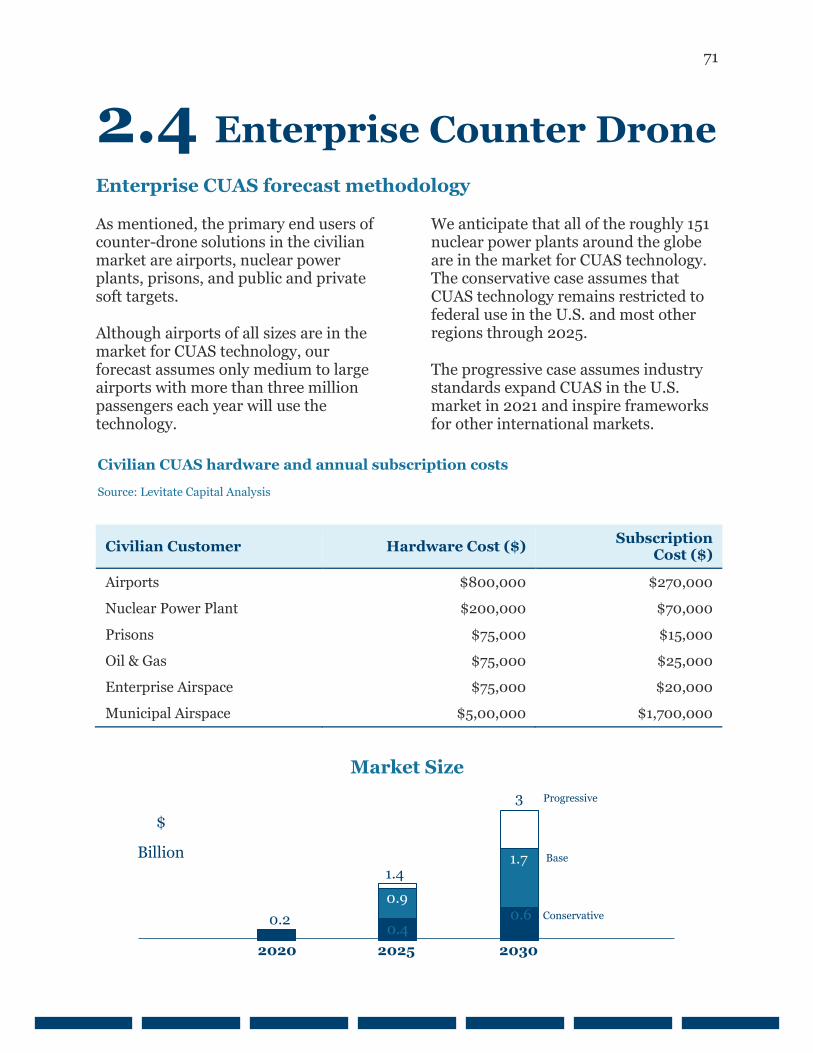
71
2.4 Enterprise Counter Drone
Enterprise CUAS forecast methodology
As mentioned, the primary end users of counter-drone solutions in the civilian market are airports, nuclear power plants, prisons, and public and private soft targets.
Although airports of all sizes are in the market for CUAS technology, our forecast assumes only medium to large airports with more than three million passengers each year will use the technology.
We anticipate that all of the roughly 151 nuclear power plants around the globe are in the market for CUAS technology. The conservative case assumes that CUAS technology remains restricted to federal use in the U.S. and most other regions through 2025.
The progressive case assumes industry standards expand CUAS in the U.S. market in 2021 and inspire frameworks for other international markets.
Civilian Customer Hardware Cost ($) Subscription Cost ($)
Airports $800,000 $270,000 Nuclear Power Plant $200,000 $70,000 Prisons $75,000 $15,000 Oil & Gas $75,000 $25,000 Enterprise Airspace $75,000 $20,000 Municipal Airspace $5,00,000 $1,700,000
Civilian CUAS hardware and annual subscription costs
Source: Levitate Capital Analysis
0.2 0.4
0.6 0.9
1.7 1.4
3 Progressive
Base
Conservative
2020 2025 2030
Market Size
$
Billion
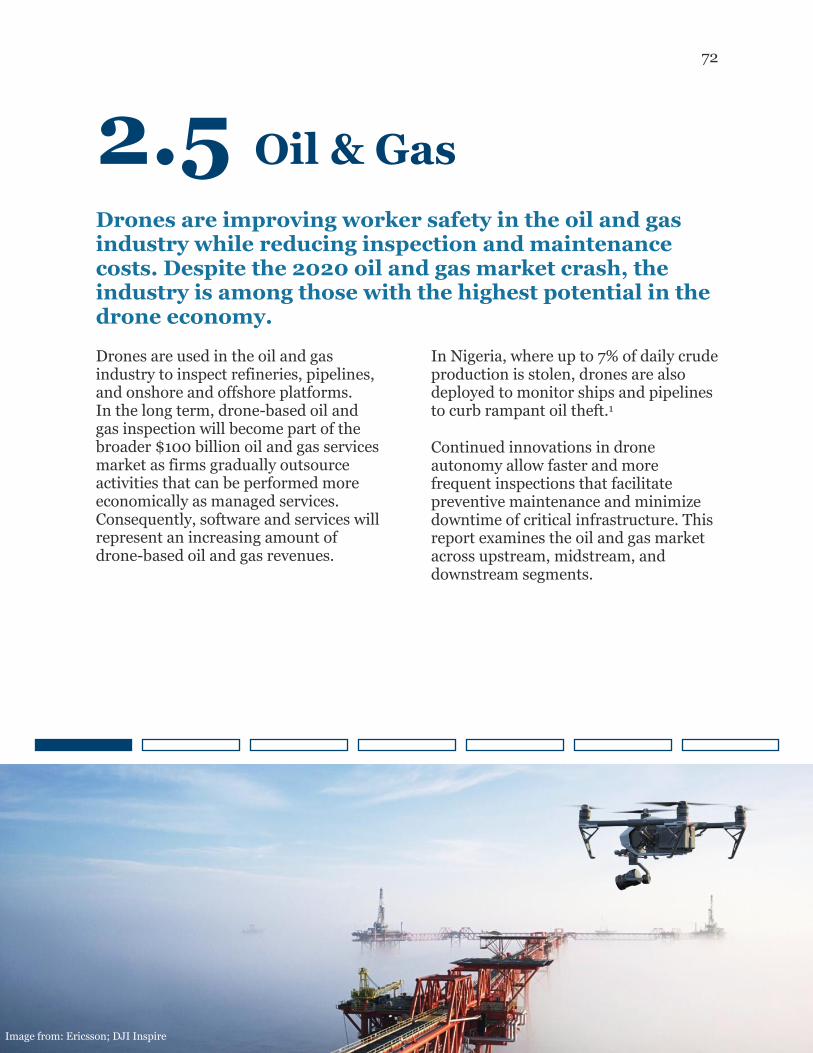
72
2.5 Oil & Gas
Drones are improving worker safety in the oil and gas industry while reducing inspection and maintenance costs. Despite the 2020 oil and gas market crash, the industry is among those with the highest potential in the drone economy.
Drones are used in the oil and gas industry to inspect refineries, pipelines, and onshore and offshore platforms. In the long term, drone-based oil and gas inspection will become part of the broader $100 billion oil and gas services market as firms gradually outsource activities that can be performed more economically as managed services. Consequently, software and services will represent an increasing amount of drone-based oil and gas revenues.
In Nigeria, where up to 7% of daily crude production is stolen, drones are also deployed to monitor ships and pipelines to curb rampant oil theft.1
Continued innovations in drone autonomy allow faster and more frequent inspections that facilitate preventive maintenance and minimize downtime of critical infrastructure. This report examines the oil and gas market across upstream, midstream, and downstream segments.
Image from: Ericsson; DJI Inspire
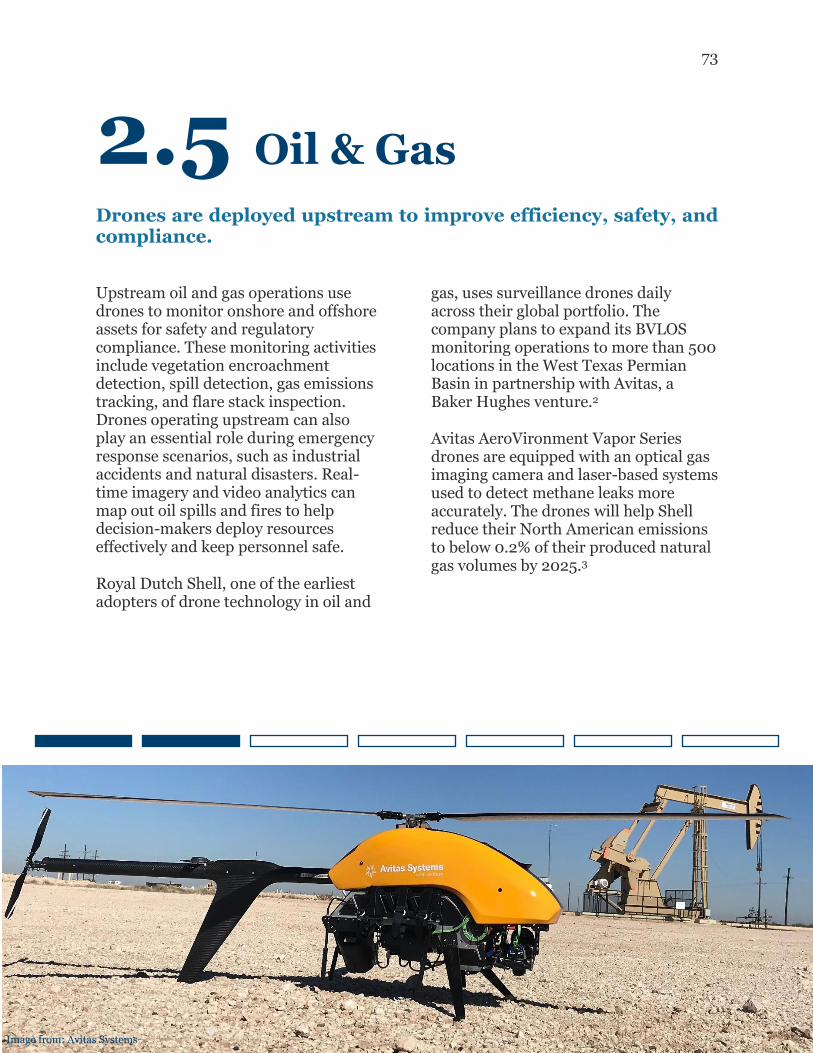
73
2.5 Oil & Gas
Drones are deployed upstream to improve efficiency, safety, and compliance.
Upstream oil and gas operations use drones to monitor onshore and offshore assets for safety and regulatory compliance. These monitoring activities include vegetation encroachment detection, spill detection, gas emissions tracking, and flare stack inspection. Drones operating upstream can also play an essential role during emergency response scenarios, such as industrial accidents and natural disasters. Real-time imagery and video analytics can map out oil spills and fires to help decision-makers deploy resources effectively and keep personnel safe.
Royal Dutch Shell, one of the earliest adopters of drone technology in oil and
gas, uses surveillance drones daily across their global portfolio. The company plans to expand its BVLOS monitoring operations to more than 500 locations in the West Texas Permian Basin in partnership with Avitas, a Baker Hughes venture.2
Avitas AeroVironment Vapor Series drones are equipped with an optical gas imaging camera and laser-based systems used to detect methane leaks more accurately. The drones will help Shell reduce their North American emissions to below 0.2% of their produced natural gas volumes by 2025.3
Image from: Avitas Systems
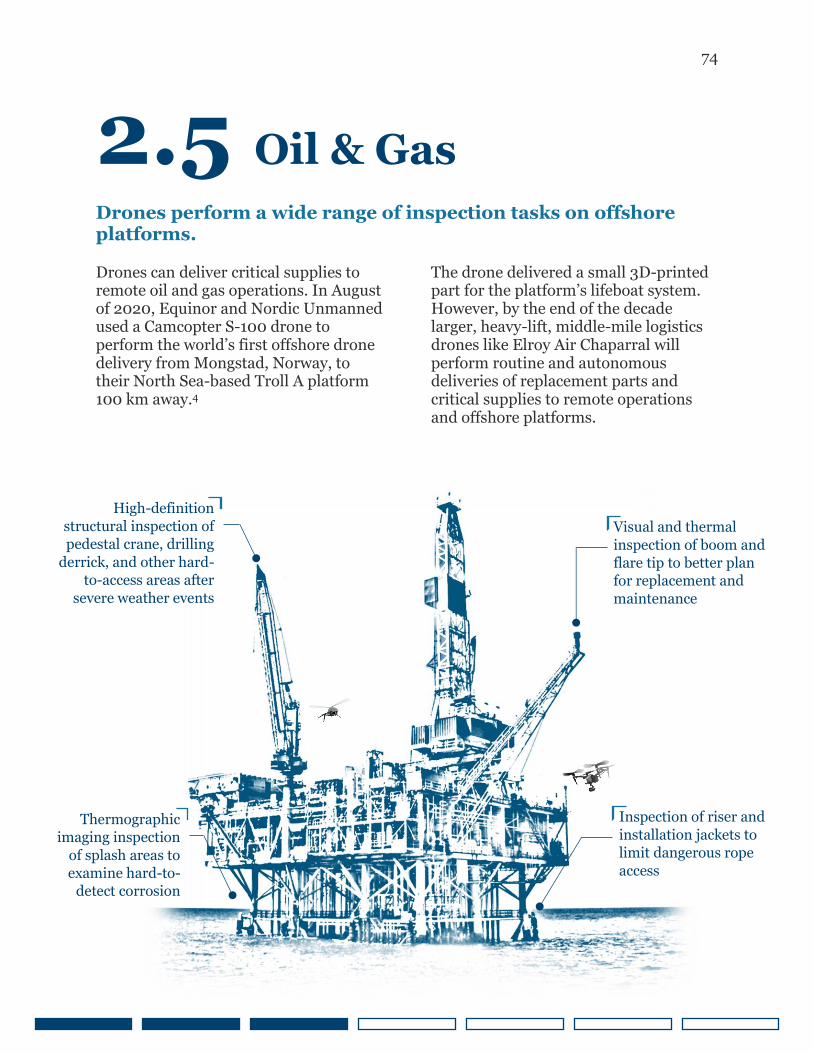
74
2.5 Oil & Gas
Drones perform a wide range of inspection tasks on offshore platforms.
Drones can deliver critical supplies to remote oil and gas operations. In August of 2020, Equinor and Nordic Unmanned used a Camcopter S-100 drone to perform the world’s first offshore drone delivery from Mongstad, Norway, to their North Sea-based Troll A platform 100 km away.4
The drone delivered a small 3D-printed part for the platform’s lifeboat system. However, by the end of the decade larger, heavy-lift, middle-mile logistics drones like Elroy Air Chaparral will perform routine and autonomous deliveries of replacement parts and critical supplies to remote operations and offshore platforms.
Inspection of riser and
installation jackets to
limit dangerous rope
access
Thermographic
imaging inspection
of splash areas to
examine hard-to-
detect corrosion
Visual and thermal
inspection of boom and
flare tip to better plan
for replacement and
maintenance
High-definition
structural inspection of
pedestal crane, drilling
derrick, and other hard-
to-access areas after
severe weather events
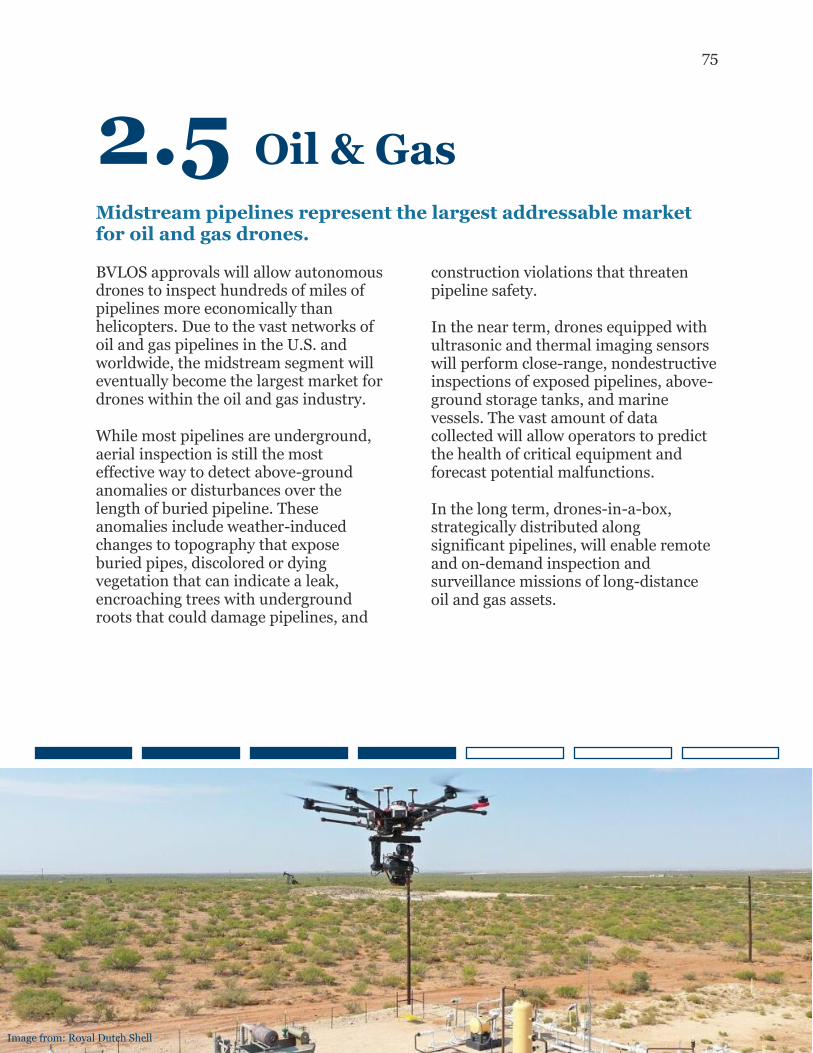
75
2.5 Oil & Gas
Midstream pipelines represent the largest addressable market for oil and gas drones.
BVLOS approvals will allow autonomous drones to inspect hundreds of miles of pipelines more economically than helicopters. Due to the vast networks of oil and gas pipelines in the U.S. and worldwide, the midstream segment will eventually become the largest market for drones within the oil and gas industry.
While most pipelines are underground, aerial inspection is still the most effective way to detect above-ground anomalies or disturbances over the length of buried pipeline. These anomalies include weather-induced changes to topography that expose buried pipes, discolored or dying vegetation that can indicate a leak, encroaching trees with underground roots that could damage pipelines, and
construction violations that threaten pipeline safety.
In the near term, drones equipped with ultrasonic and thermal imaging sensors will perform close-range, nondestructive inspections of exposed pipelines, above-ground storage tanks, and marine vessels. The vast amount of data collected will allow operators to predict the health of critical equipment and forecast potential malfunctions.
In the long term, drones-in-a-box, strategically distributed along significant pipelines, will enable remote and on-demand inspection and surveillance missions of long-distance oil and gas assets.
Image from: Royal Dutch Shell
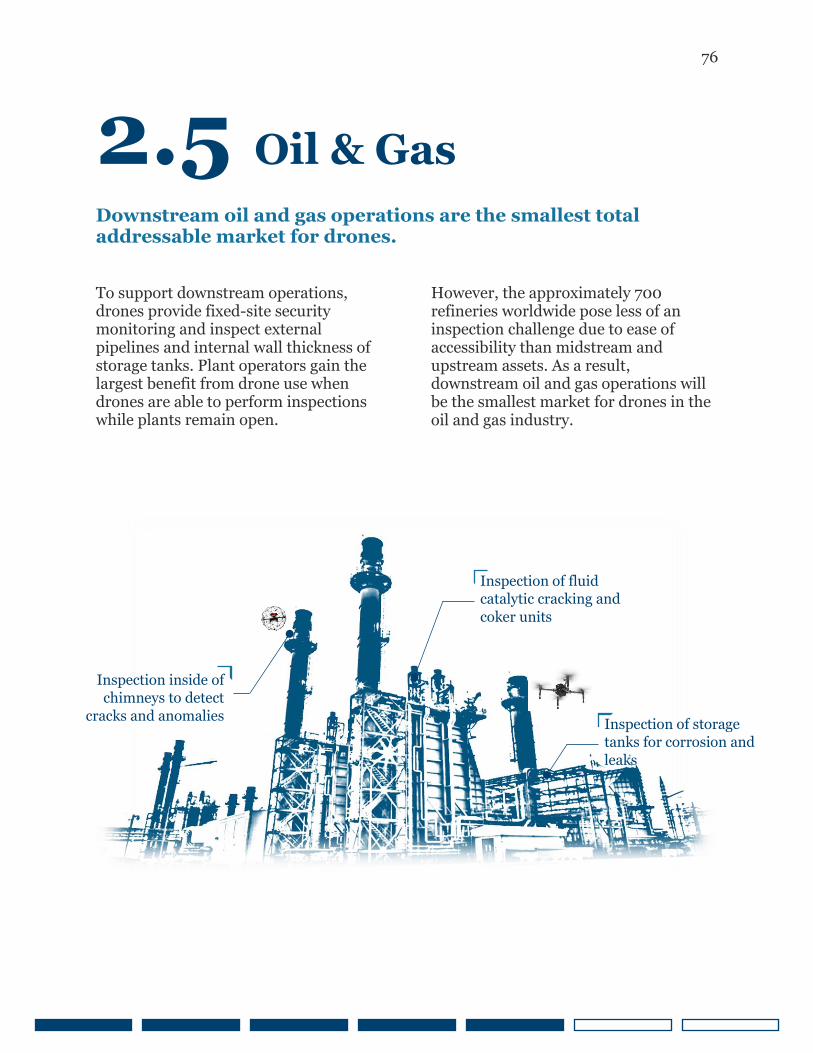
76
2.5 Oil & Gas
Downstream oil and gas operations are the smallest total addressable market for drones.
To support downstream operations, drones provide fixed-site security monitoring and inspect external pipelines and internal wall thickness of storage tanks. Plant operators gain the largest benefit from drone use when drones are able to perform inspections while plants remain open.
However, the approximately 700 refineries worldwide pose less of an inspection challenge due to ease of accessibility than midstream and upstream assets. As a result, downstream oil and gas operations will be the smallest market for drones in the oil and gas industry.
Inspection of fluid
catalytic cracking and
coker units
Inspection inside of
chimneys to detect
cracks and anomalies Inspection of storage
tanks for corrosion and
leaks
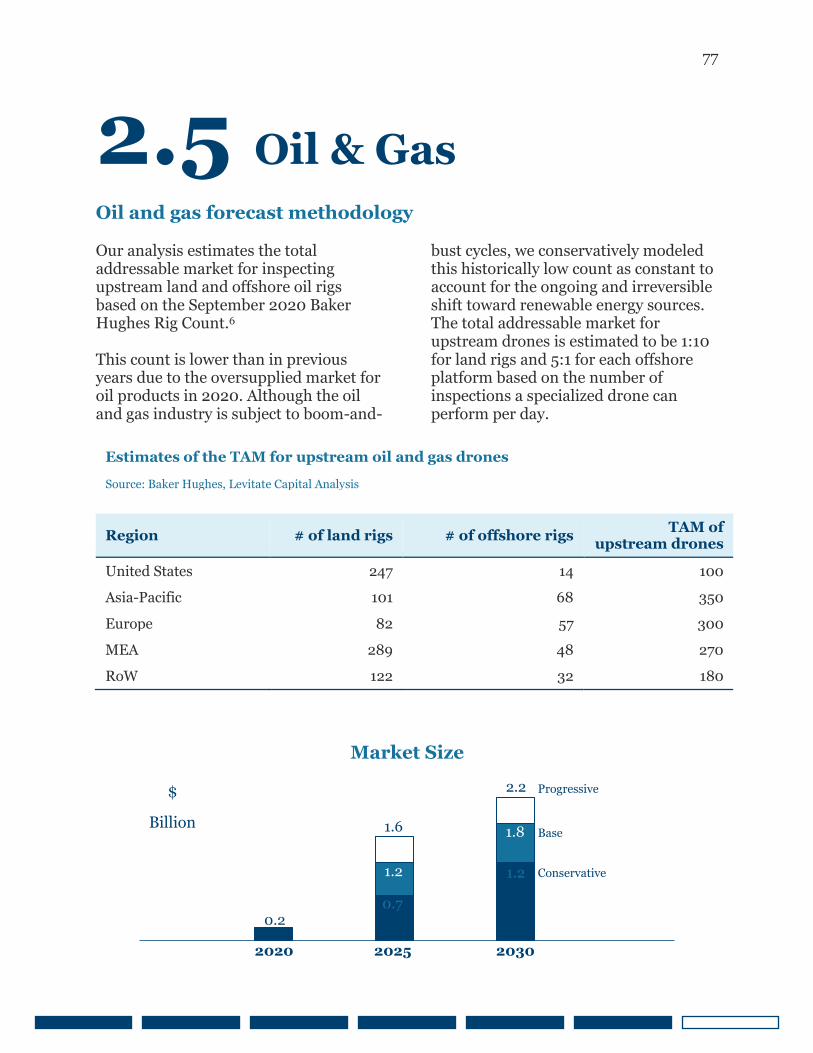
77
2.5 Oil & Gas
Oil and gas forecast methodology Our analysis estimates the total addressable market for inspecting upstream land and offshore oil rigs based on the September 2020 Baker Hughes Rig Count.6 This count is lower than in previous years due to the oversupplied market for oil products in 2020. Although the oil and gas industry is subject to boom-and-
bust cycles, we conservatively modeled this historically low count as constant to account for the ongoing and irreversible shift toward renewable energy sources. The total addressable market for upstream drones is estimated to be 1:10 for land rigs and 5:1 for each offshore platform based on the number of inspections a specialized drone can perform per day.
Region # of land rigs # of offshore rigs TAM of upstream drones
United States 247 14 100 Asia-Pacific 101 68 350 Europe 82 57 300 MEA 289 48 270 RoW 122 32 180
Estimates of the TAM for upstream oil and gas drones
Source: Baker Hughes, Levitate Capital Analysis
0.2 0.7
1.2 1.2
1.8 1.6
2.2 Progressive
Base
Conservative
2020 2025 2030
Market Size
$
Billion
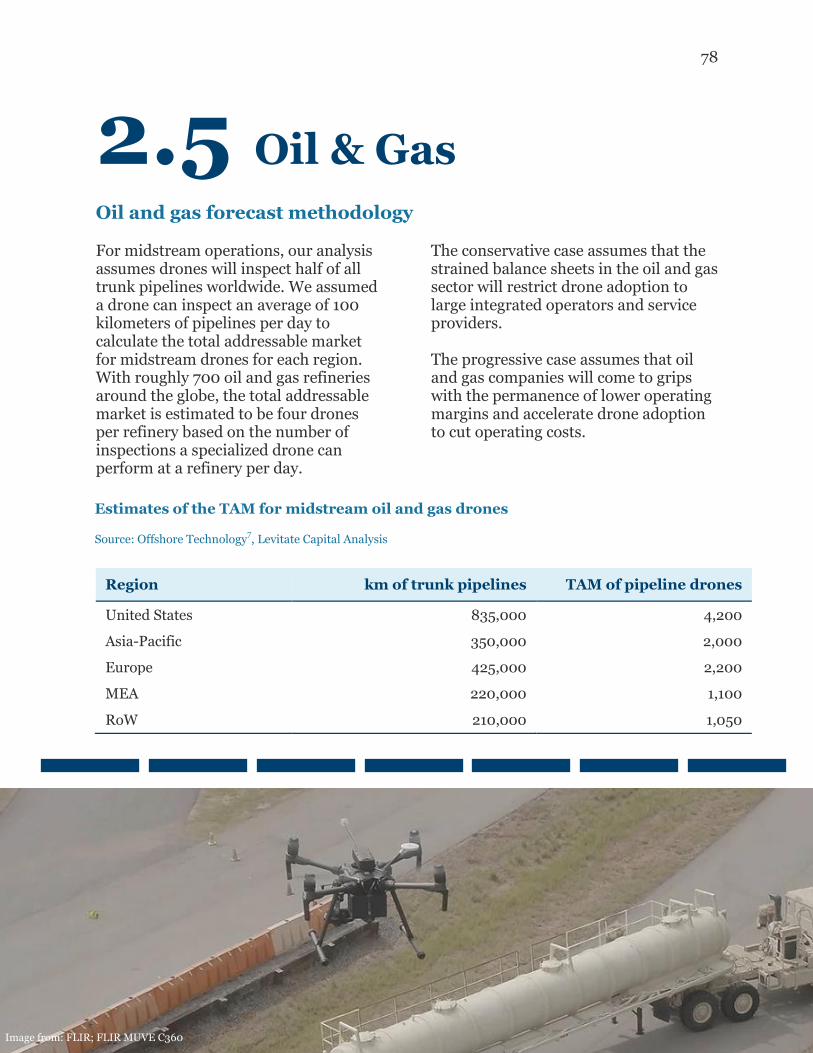
78
2.5 Oil & Gas
Oil and gas forecast methodology For midstream operations, our analysis assumes drones will inspect half of all trunk pipelines worldwide. We assumed a drone can inspect an average of 100 kilometers of pipelines per day to calculate the total addressable market for midstream drones for each region. With roughly 700 oil and gas refineries around the globe, the total addressable market is estimated to be four drones per refinery based on the number of inspections a specialized drone can perform at a refinery per day.
The conservative case assumes that the strained balance sheets in the oil and gas sector will restrict drone adoption to large integrated operators and service providers. The progressive case assumes that oil and gas companies will come to grips with the permanence of lower operating margins and accelerate drone adoption to cut operating costs.
Region km of trunk pipelines TAM of pipeline drones
United States 835,000 4,200 Asia-Pacific 350,000 2,000 Europe 425,000 2,200 MEA 220,000 1,100 RoW 210,000 1,050
Estimates of the TAM for midstream oil and gas drones
Source: Offshore Technology7, Levitate Capital Analysis
Image from: FLIR; FLIR MUVE C360
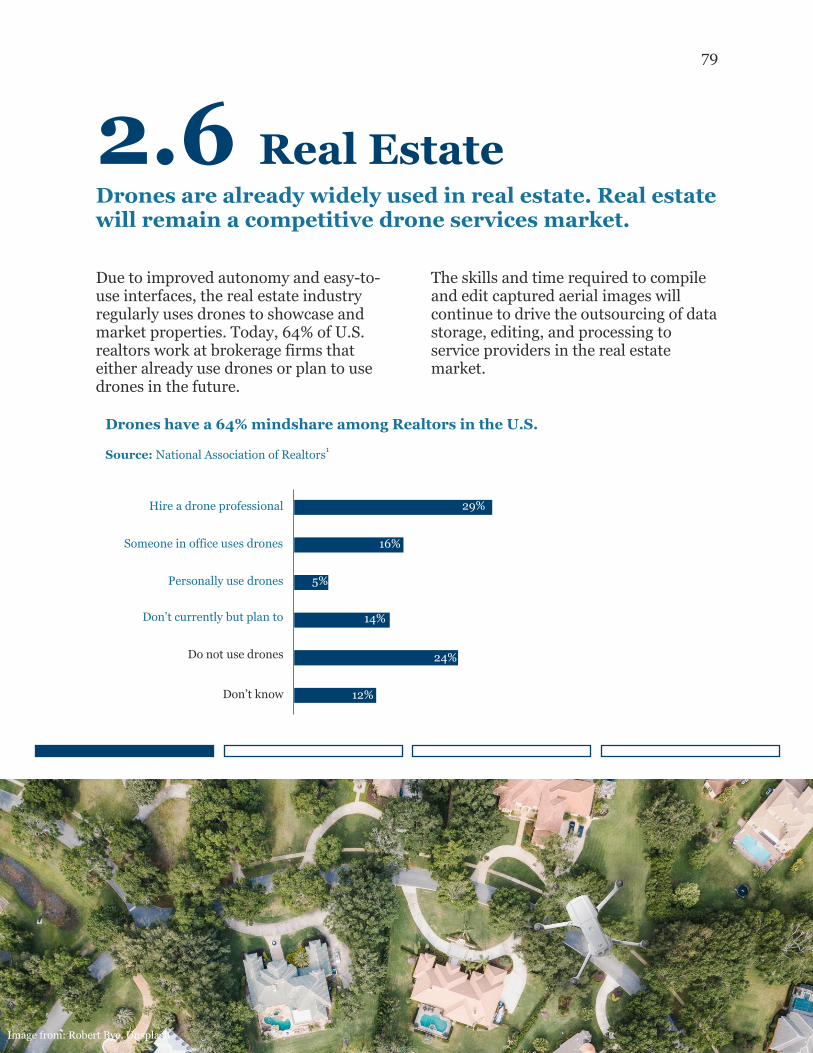
79
2.6 Real Estate
Drones are already widely used in real estate. Real estate will remain a competitive drone services market.
Due to improved autonomy and easy-to-use interfaces, the real estate industry regularly uses drones to showcase and market properties. Today, 64% of U.S. realtors work at brokerage firms that either already use drones or plan to use drones in the future.
The skills and time required to compile and edit captured aerial images will continue to drive the outsourcing of data storage, editing, and processing to service providers in the real estate market.
Drones have a 64% mindshare among Realtors in the U.S.
Source: National Association of Realtors1
29%
16%
5%
14%
24%
12%
Hire a drone professional
Don’t know
Do not use drones
Someone in office uses drones
Personally use drones
Don’t currently but plan to
Image from: Robert Bye, Unsplash
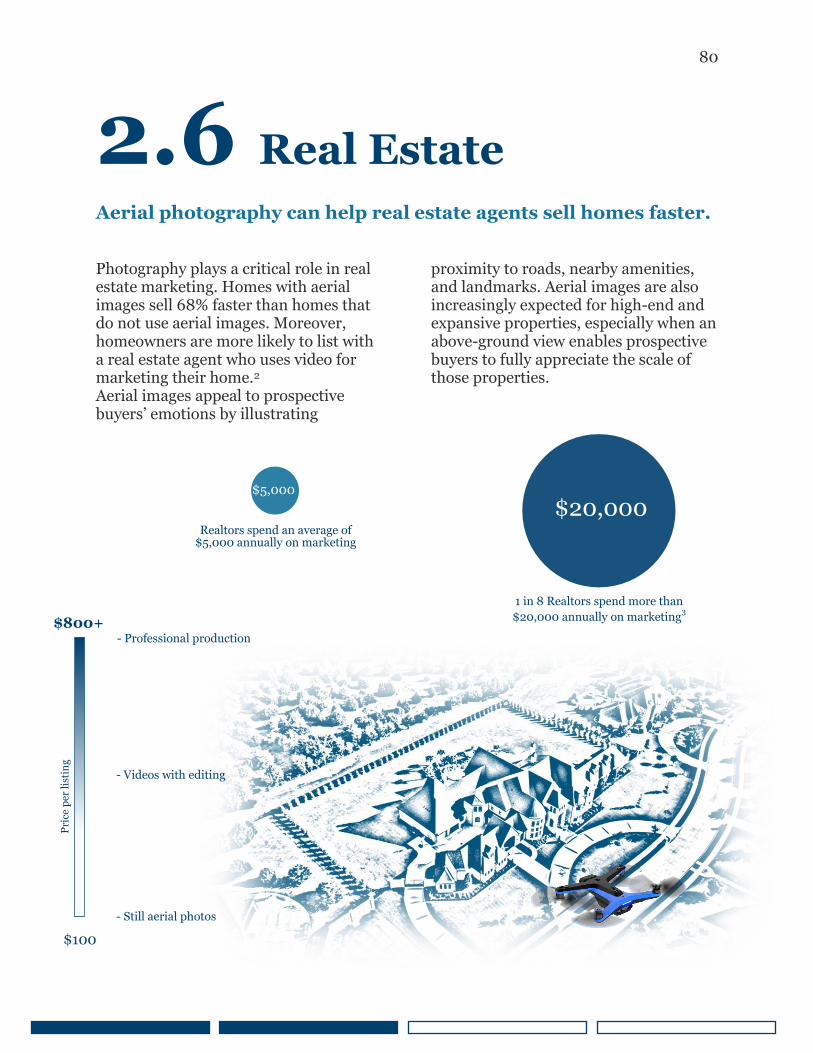
80
2.6 Real Estate
Aerial photography can help real estate agents sell homes faster. Photography plays a critical role in real estate marketing. Homes with aerial images sell 68% faster than homes that do not use aerial images. Moreover, homeowners are more likely to list with a real estate agent who uses video for marketing their home.2 Aerial images appeal to prospective buyers’ emotions by illustrating
proximity to roads, nearby amenities, and landmarks. Aerial images are also increasingly expected for high-end and expansive properties, especially when an above-ground view enables prospective buyers to fully appreciate the scale of those properties.
$800+
$100
- Still aerial photos
- Videos with editing
- Professional production
Pri
ce p
er l
isti
ng
$5,000
$20,000 Realtors spend an average of
$5,000 annually on marketing
1 in 8 Realtors spend more than
$20,000 annually on marketing3
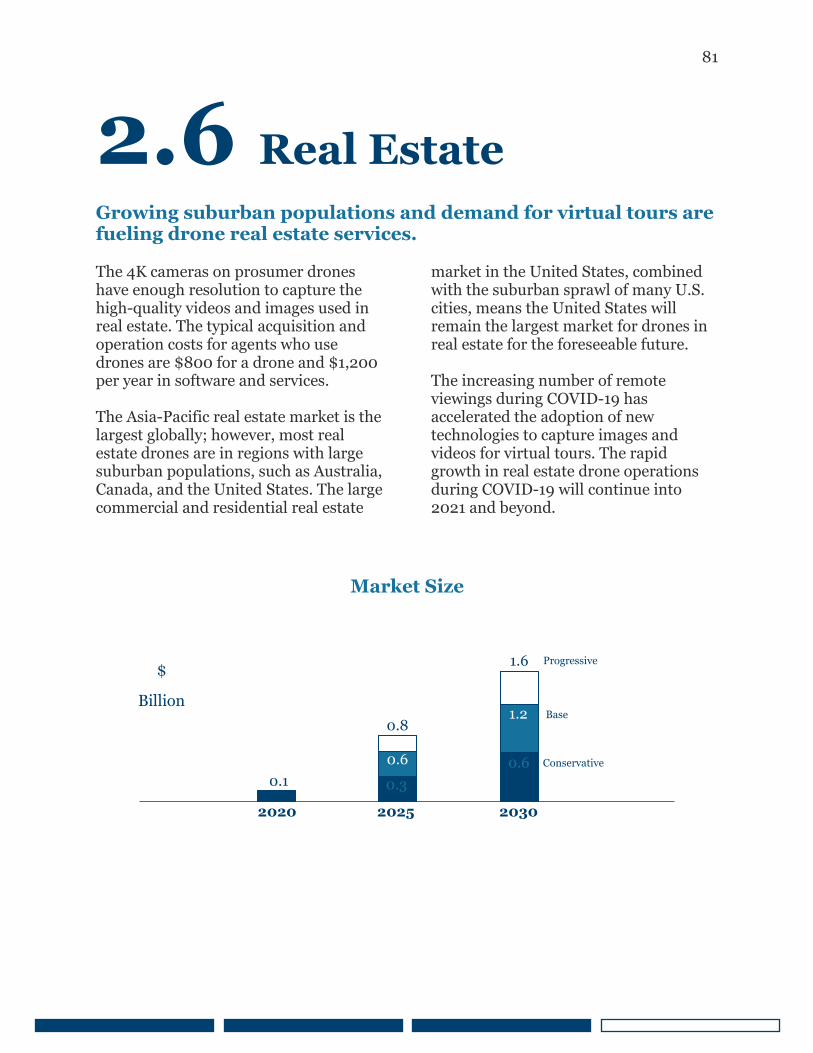
81
2.6 Real Estate
Growing suburban populations and demand for virtual tours are fueling drone real estate services. The 4K cameras on prosumer drones have enough resolution to capture the high-quality videos and images used in real estate. The typical acquisition and operation costs for agents who use drones are $800 for a drone and $1,200 per year in software and services. The Asia-Pacific real estate market is the largest globally; however, most real estate drones are in regions with large suburban populations, such as Australia, Canada, and the United States. The large commercial and residential real estate
market in the United States, combined with the suburban sprawl of many U.S. cities, means the United States will remain the largest market for drones in real estate for the foreseeable future. The increasing number of remote viewings during COVID-19 has accelerated the adoption of new technologies to capture images and videos for virtual tours. The rapid growth in real estate drone operations during COVID-19 will continue into 2021 and beyond.
0.1 0.3
0.6 0.6
1.2 0.8
1.6 Progressive
Base
Conservative
2020 2025 2030
Market Size
$
Billion
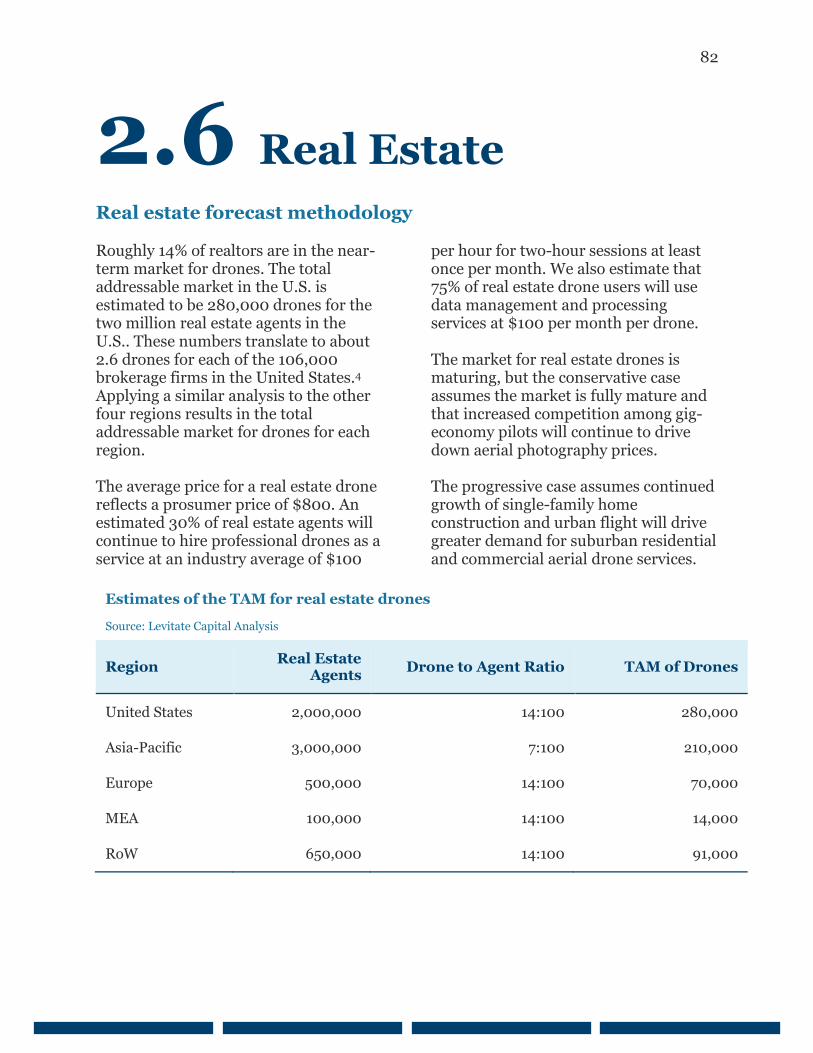
82
2.6 Real Estate
Real estate forecast methodology Roughly 14% of realtors are in the near-term market for drones. The total addressable market in the U.S. is estimated to be 280,000 drones for the two million real estate agents in the U.S.. These numbers translate to about 2.6 drones for each of the 106,000 brokerage firms in the United States.4 Applying a similar analysis to the other four regions results in the total addressable market for drones for each region. The average price for a real estate drone reflects a prosumer price of $800. An estimated 30% of real estate agents will continue to hire professional drones as a service at an industry average of $100
per hour for two-hour sessions at least once per month. We also estimate that 75% of real estate drone users will use data management and processing services at $100 per month per drone. The market for real estate drones is maturing, but the conservative case assumes the market is fully mature and that increased competition among gig-economy pilots will continue to drive down aerial photography prices. The progressive case assumes continued growth of single-family home construction and urban flight will drive greater demand for suburban residential and commercial aerial drone services.
Region Real Estate Agents Drone to Agent Ratio TAM of Drones
United States 2,000,000 14:100 280,000
Asia-Pacific 3,000,000 7:100 210,000
Europe 500,000 14:100 70,000
MEA 100,000 14:100 14,000
RoW 650,000 14:100 91,000
Estimates of the TAM for real estate drones
Source: Levitate Capital Analysis
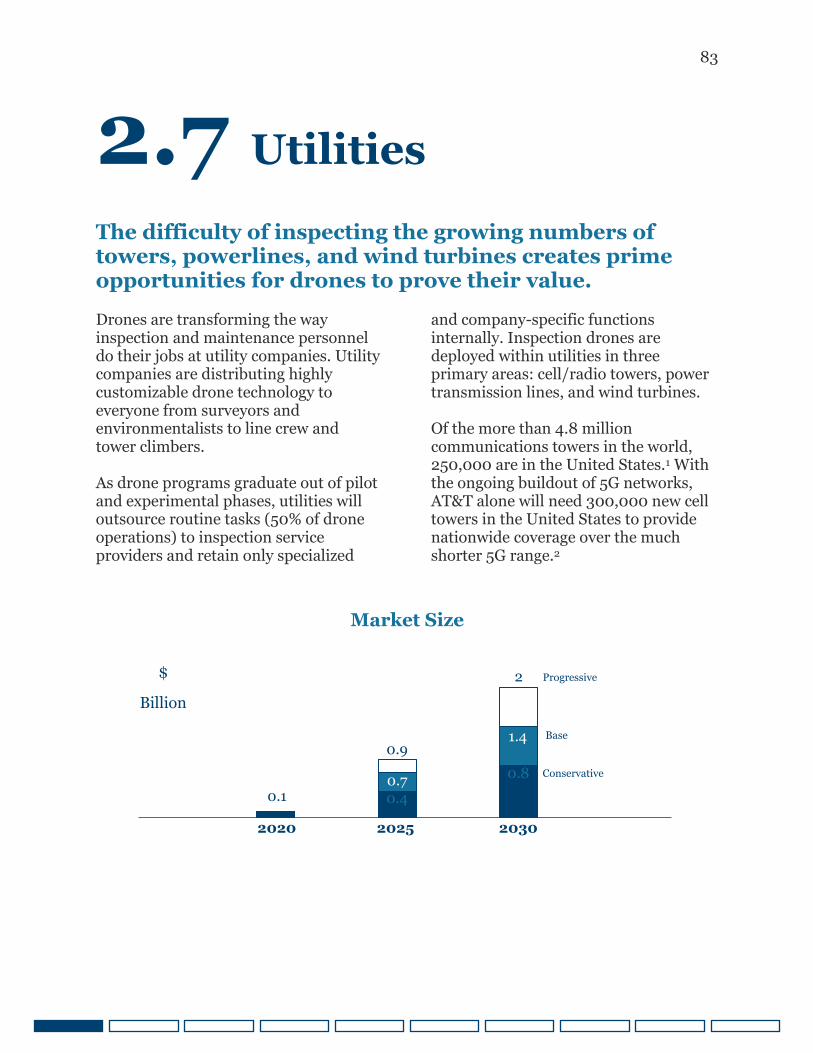
83
2.7 Utilities
The difficulty of inspecting the growing numbers of towers, powerlines, and wind turbines creates prime opportunities for drones to prove their value. Drones are transforming the way inspection and maintenance personnel do their jobs at utility companies. Utility companies are distributing highly customizable drone technology to everyone from surveyors and environmentalists to line crew and tower climbers. As drone programs graduate out of pilot and experimental phases, utilities will outsource routine tasks (50% of drone operations) to inspection service providers and retain only specialized
and company-specific functions internally. Inspection drones are deployed within utilities in three primary areas: cell/radio towers, power transmission lines, and wind turbines. Of the more than 4.8 million communications towers in the world, 250,000 are in the United States.1 With the ongoing buildout of 5G networks, AT&T alone will need 300,000 new cell towers in the United States to provide nationwide coverage over the much shorter 5G range.2
0.1 0.4
0.8 0.7
1.4 0.9
2 Progressive
Base
Conservative
2020 2025 2030
Market Size
$
Billion
84
2.7 Utilities: Tower Inspection
Drones will help alleviate the maintenance burden of thousands of new 5G towers. Although these new 5G towers will not be as tall as current cell phone towers, routine inspection of each tower every one to three years will require a leap forward in productivity.3 Tower inspection by drone requires proximity flights around each tower. Therefore, they are performed under Part-107 regulation in the U.S. within line-of-sight of an operator and below 400 feet. Tower inspection by drone requires proximity flights around each tower. For new 5G towers in the U.S., these flights occur within line of sight of an operator and lower than 400 feet above ground level, so they meet Part-107 regulatory requirements.
Autonomous drones equipped with high-resolution optical and thermal imaging cameras are enabling many inspections to occur from the ground. In such cases, climbers need to scale towers only to perform repairs, increasing safety and efficiency. Remote technicians can perform more in-depth inspections by analyzing drone-gathered images with photogrammetry software that creates digital models of the towers. Technicians can also feed the images into analytics software to perform corrosion and other anomaly detection. Upon widespread regulatory approval of BVLOS operations, strategically positioned drones-in-a-box will remotely deploy to perform tower inspections on demand.
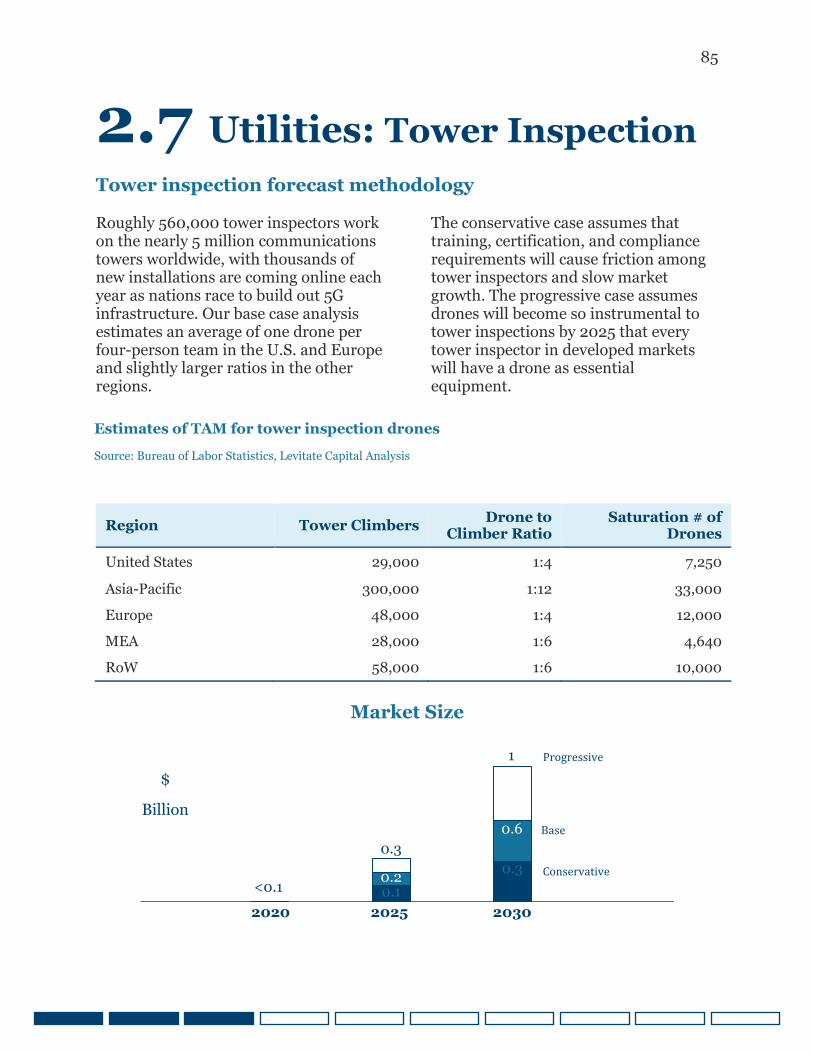
85
2.7 Utilities: Tower Inspection
Tower inspection forecast methodology Roughly 560,000 tower inspectors work on the nearly 5 million communications towers worldwide, with thousands of new installations are coming online each year as nations race to build out 5G infrastructure. Our base case analysis estimates an average of one drone per four-person team in the U.S. and Europe and slightly larger ratios in the other regions.
The conservative case assumes that training, certification, and compliance requirements will cause friction among tower inspectors and slow market growth. The progressive case assumes drones will become so instrumental to tower inspections by 2025 that every tower inspector in developed markets will have a drone as essential equipment.
Region Tower Climbers Drone to Climber Ratio
Saturation # of Drones
United States 29,000 1:4 7,250 Asia-Pacific 300,000 1:12 33,000 Europe 48,000 1:4 12,000 MEA 28,000 1:6 4,640 RoW 58,000 1:6 10,000
Estimates of TAM for tower inspection drones
Source: Bureau of Labor Statistics, Levitate Capital Analysis
<0.1 0.1
0.3 0.2
0.6 0.3
1 Progressive
Base
Conservative
2020 2025 2030
Market Size
$
Billion
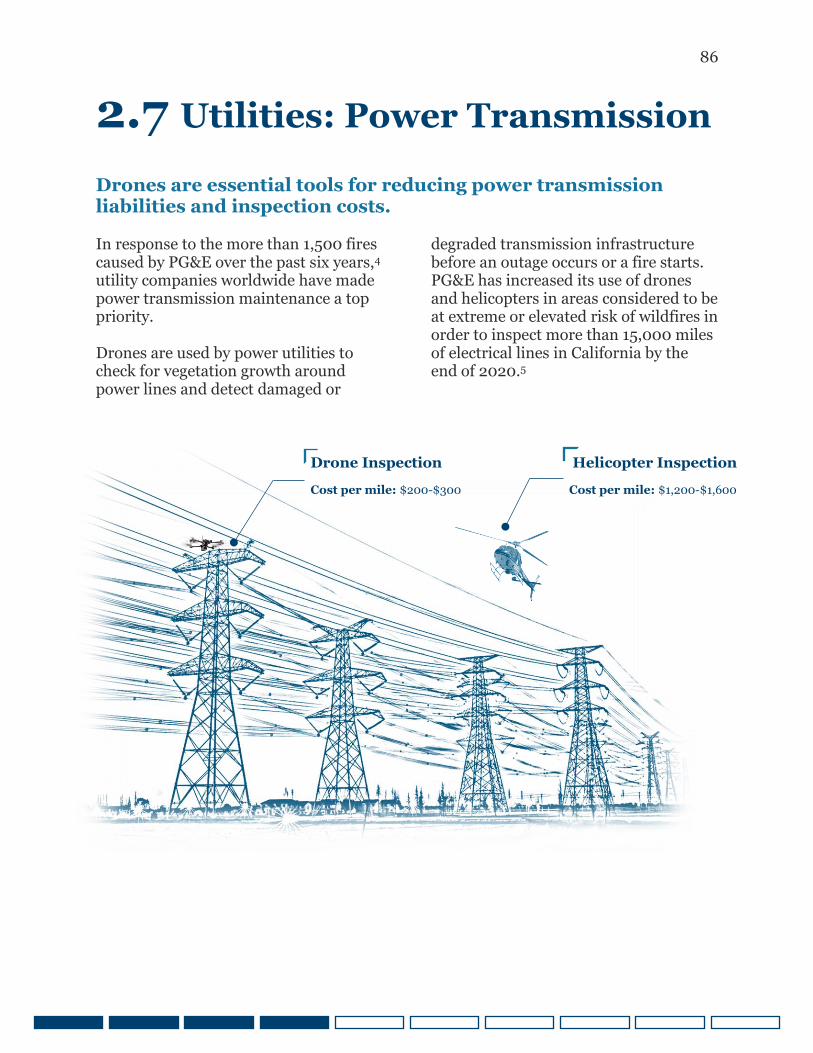
86
2.7 Utilities: Power Transmission
Drones are essential tools for reducing power transmission liabilities and inspection costs. In response to the more than 1,500 fires caused by PG&E over the past six years,4 utility companies worldwide have made power transmission maintenance a top priority. Drones are used by power utilities to check for vegetation growth around power lines and detect damaged or
degraded transmission infrastructure before an outage occurs or a fire starts. PG&E has increased its use of drones and helicopters in areas considered to be at extreme or elevated risk of wildfires in order to inspect more than 15,000 miles of electrical lines in California by the end of 2020.5
Helicopter Inspection
Cost per mile: $1,200-$1,600
Drone Inspection
Cost per mile: $200-$300
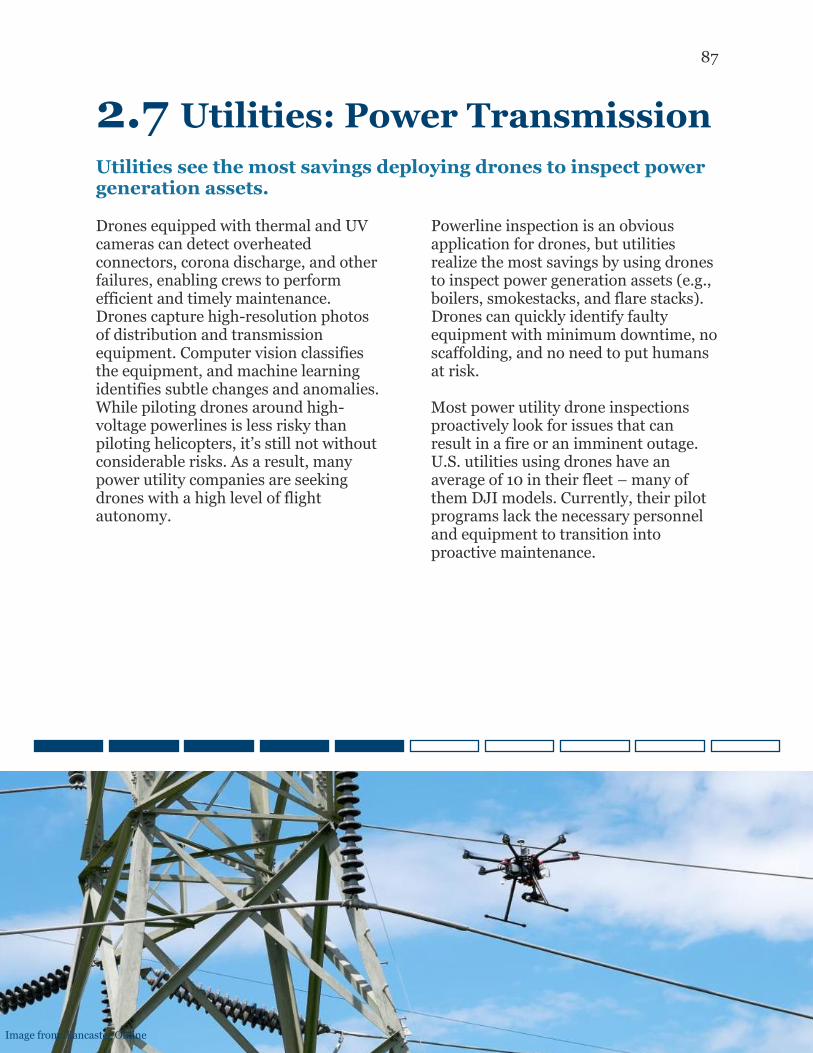
87
2.7 Utilities: Power Transmission
Utilities see the most savings deploying drones to inspect power generation assets. Drones equipped with thermal and UV cameras can detect overheated connectors, corona discharge, and other failures, enabling crews to perform efficient and timely maintenance. Drones capture high-resolution photos of distribution and transmission equipment. Computer vision classifies the equipment, and machine learning identifies subtle changes and anomalies. While piloting drones around high-voltage powerlines is less risky than piloting helicopters, it’s still not without considerable risks. As a result, many power utility companies are seeking drones with a high level of flight autonomy.
Powerline inspection is an obvious application for drones, but utilities realize the most savings by using drones to inspect power generation assets (e.g., boilers, smokestacks, and flare stacks). Drones can quickly identify faulty equipment with minimum downtime, no scaffolding, and no need to put humans at risk. Most power utility drone inspections proactively look for issues that can result in a fire or an imminent outage. U.S. utilities using drones have an average of 10 in their fleet – many of them DJI models. Currently, their pilot programs lack the necessary personnel and equipment to transition into proactive maintenance.
Image from: Lancaster Online
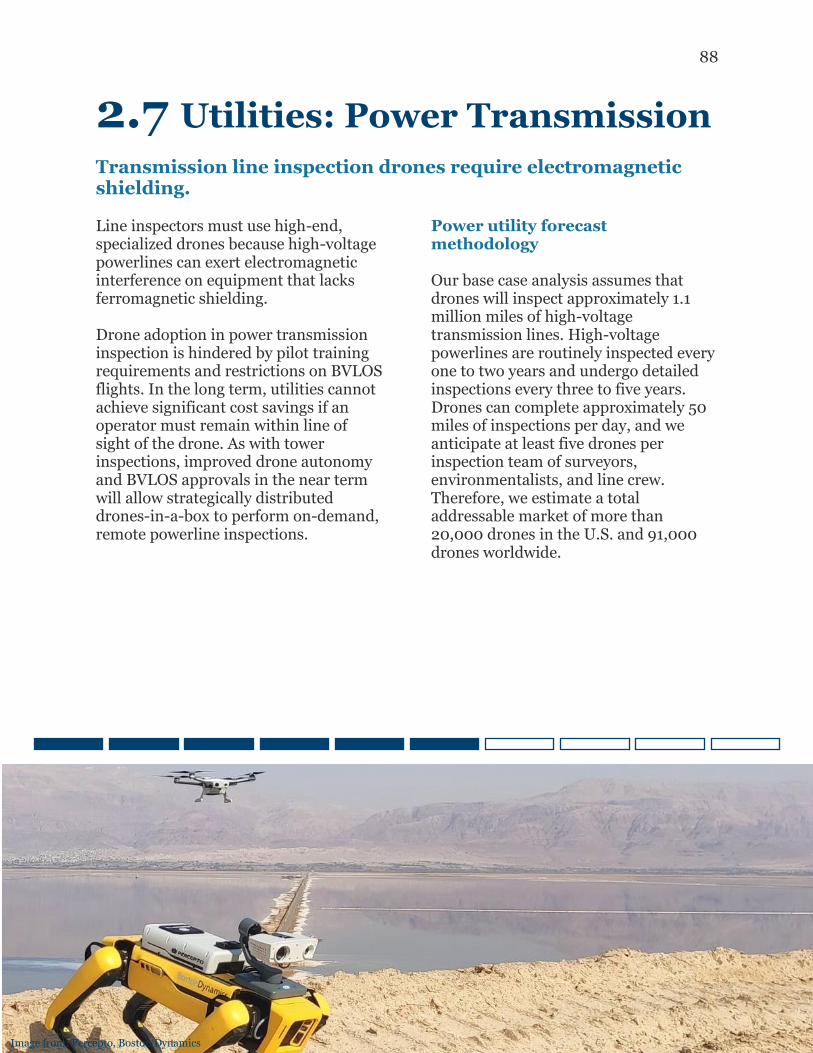
88
2.7 Utilities: Power Transmission
Transmission line inspection drones require electromagnetic shielding. Line inspectors must use high-end, specialized drones because high-voltage powerlines can exert electromagnetic interference on equipment that lacks ferromagnetic shielding. Drone adoption in power transmission inspection is hindered by pilot training requirements and restrictions on BVLOS flights. In the long term, utilities cannot achieve significant cost savings if an operator must remain within line of sight of the drone. As with tower inspections, improved drone autonomy and BVLOS approvals in the near term will allow strategically distributed drones-in-a-box to perform on-demand, remote powerline inspections.
Power utility forecast methodology
Our base case analysis assumes that drones will inspect approximately 1.1 million miles of high-voltage transmission lines. High-voltage powerlines are routinely inspected every one to two years and undergo detailed inspections every three to five years. Drones can complete approximately 50 miles of inspections per day, and we anticipate at least five drones per inspection team of surveyors, environmentalists, and line crew. Therefore, we estimate a total addressable market of more than 20,000 drones in the U.S. and 91,000 drones worldwide.
Image from: Percepto, Boston Dynamics
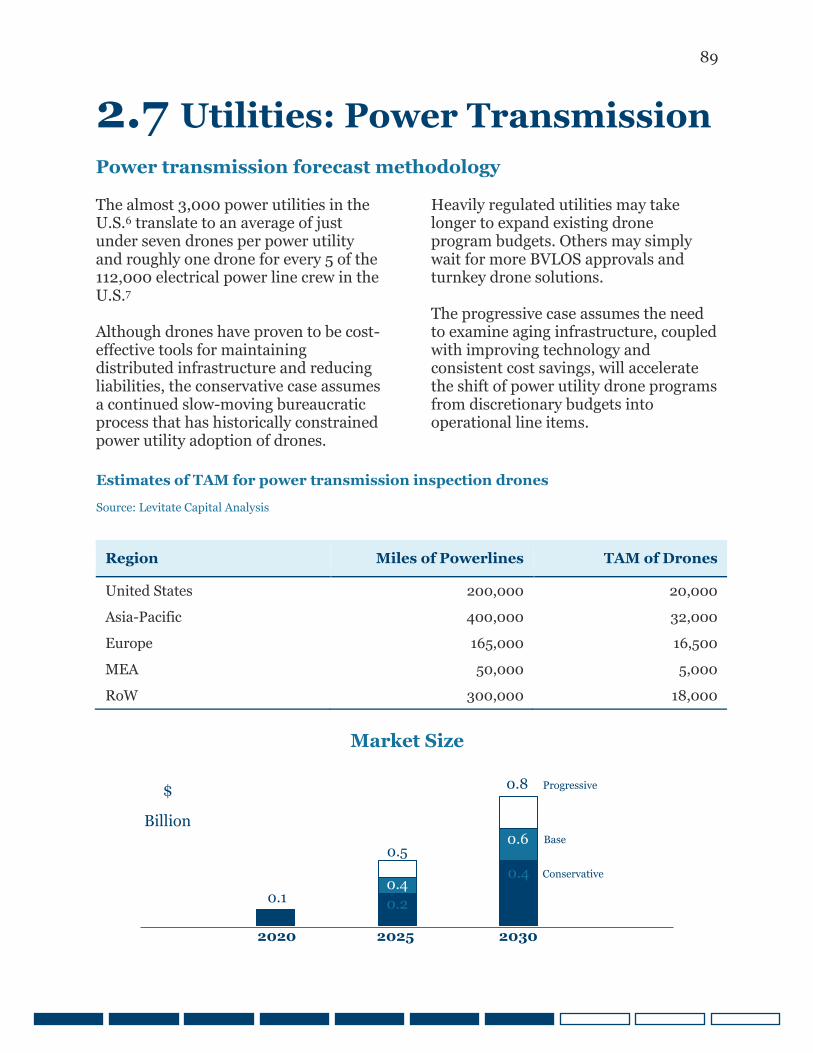
89
2.7 Utilities: Power Transmission
Power transmission forecast methodology The almost 3,000 power utilities in the U.S.6 translate to an average of just under seven drones per power utility and roughly one drone for every 5 of the 112,000 electrical power line crew in the U.S.7 Although drones have proven to be cost-effective tools for maintaining distributed infrastructure and reducing liabilities, the conservative case assumes a continued slow-moving bureaucratic process that has historically constrained power utility adoption of drones.
Heavily regulated utilities may take longer to expand existing drone program budgets. Others may simply wait for more BVLOS approvals and turnkey drone solutions. The progressive case assumes the need to examine aging infrastructure, coupled with improving technology and consistent cost savings, will accelerate the shift of power utility drone programs from discretionary budgets into operational line items.
Region Miles of Powerlines TAM of Drones
United States 200,000 20,000 Asia-Pacific 400,000 32,000 Europe 165,000 16,500 MEA 50,000 5,000 RoW 300,000 18,000
Estimates of TAM for power transmission inspection drones
Source: Levitate Capital Analysis
Market Size
0.1 0.2
0.4 0.4
0.6 0.5
0.8 Progressive
Base
Conservative
2020 2025 2030
$
Billion
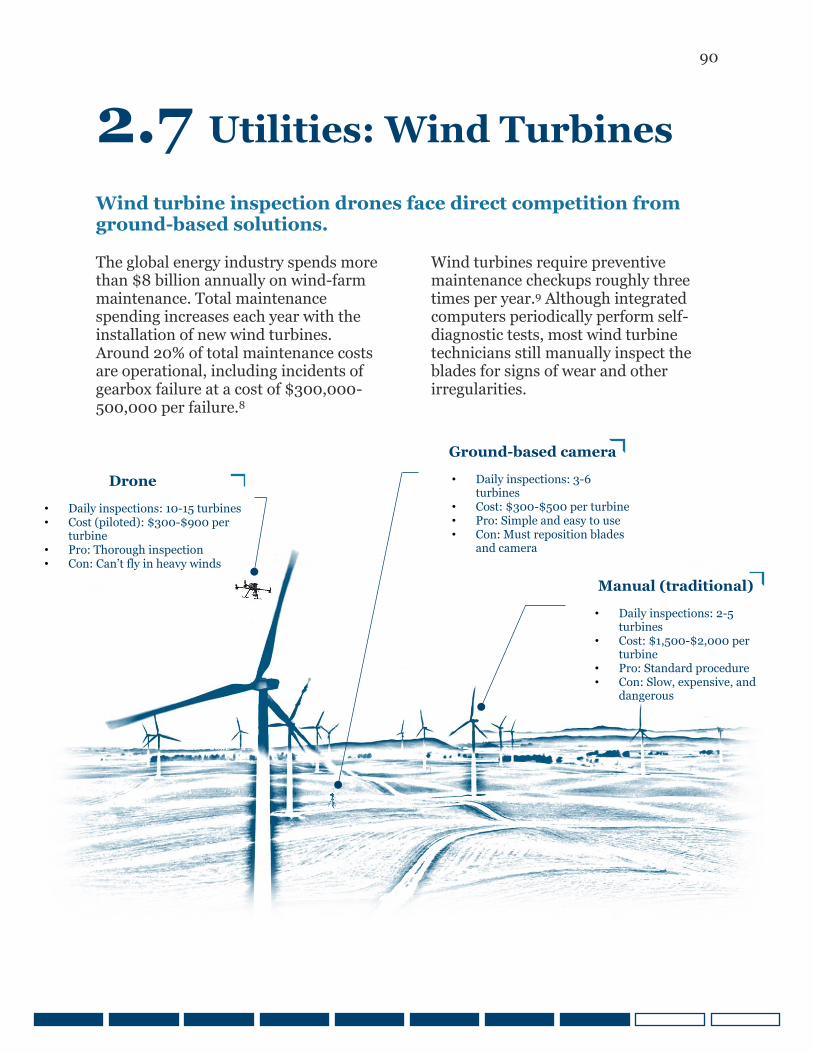
90
2.7 Utilities: Wind Turbines
Wind turbine inspection drones face direct competition from ground-based solutions. The global energy industry spends more than $8 billion annually on wind-farm maintenance. Total maintenance spending increases each year with the installation of new wind turbines. Around 20% of total maintenance costs are operational, including incidents of gearbox failure at a cost of $300,000-500,000 per failure.8
Wind turbines require preventive maintenance checkups roughly three times per year.9 Although integrated computers periodically perform self-diagnostic tests, most wind turbine technicians still manually inspect the blades for signs of wear and other irregularities.
Drone
• Daily inspections: 10-15 turbines • Cost (piloted): $300-$900 per
turbine • Pro: Thorough inspection • Con: Can’t fly in heavy winds
Ground-based camera
• Daily inspections: 3-6 turbines
• Cost: $300-$500 per turbine • Pro: Simple and easy to use • Con: Must reposition blades
and camera
Manual (traditional)
• Daily inspections: 2-5 turbines
• Cost: $1,500-$2,000 per turbine
• Pro: Standard procedure • Con: Slow, expensive, and
dangerous
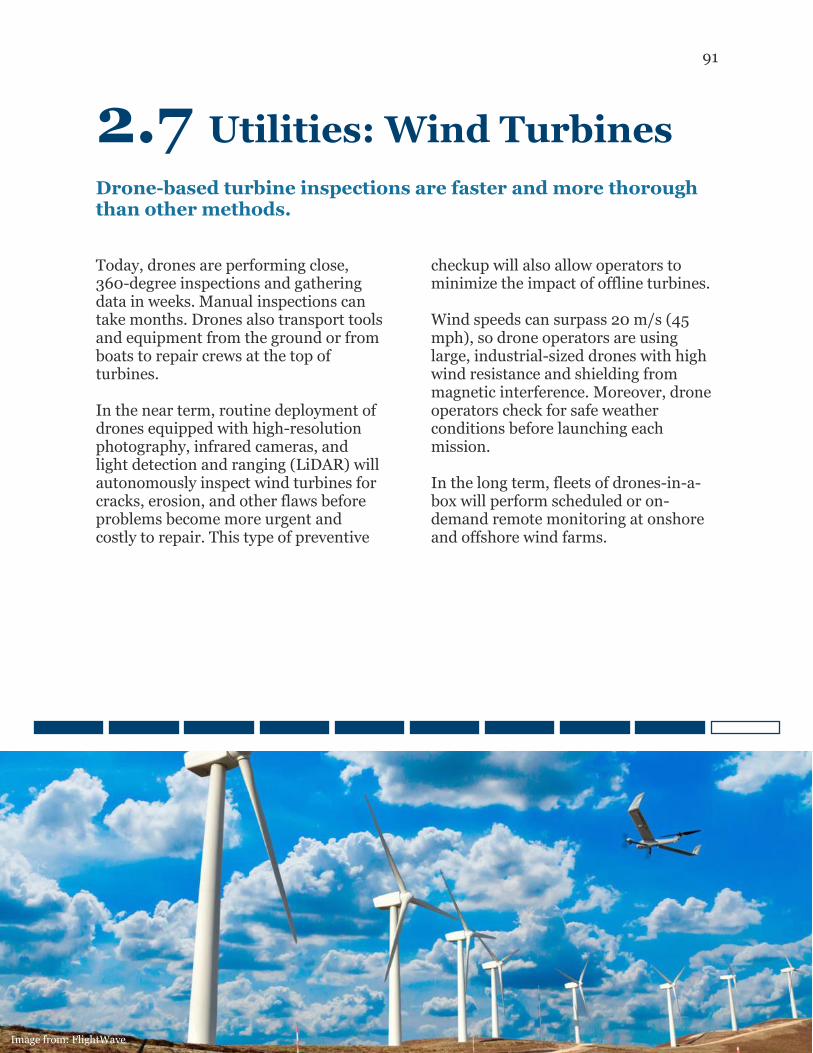
91
2.7 Utilities: Wind Turbines
Drone-based turbine inspections are faster and more thorough than other methods. Today, drones are performing close, 360-degree inspections and gathering data in weeks. Manual inspections can take months. Drones also transport tools and equipment from the ground or from boats to repair crews at the top of turbines. In the near term, routine deployment of drones equipped with high-resolution photography, infrared cameras, and light detection and ranging (LiDAR) will autonomously inspect wind turbines for cracks, erosion, and other flaws before problems become more urgent and costly to repair. This type of preventive
checkup will also allow operators to minimize the impact of offline turbines. Wind speeds can surpass 20 m/s (45 mph), so drone operators are using large, industrial-sized drones with high wind resistance and shielding from magnetic interference. Moreover, drone operators check for safe weather conditions before launching each mission. In the long term, fleets of drones-in-a-box will perform scheduled or on-demand remote monitoring at onshore and offshore wind farms.
Image from: FlightWave
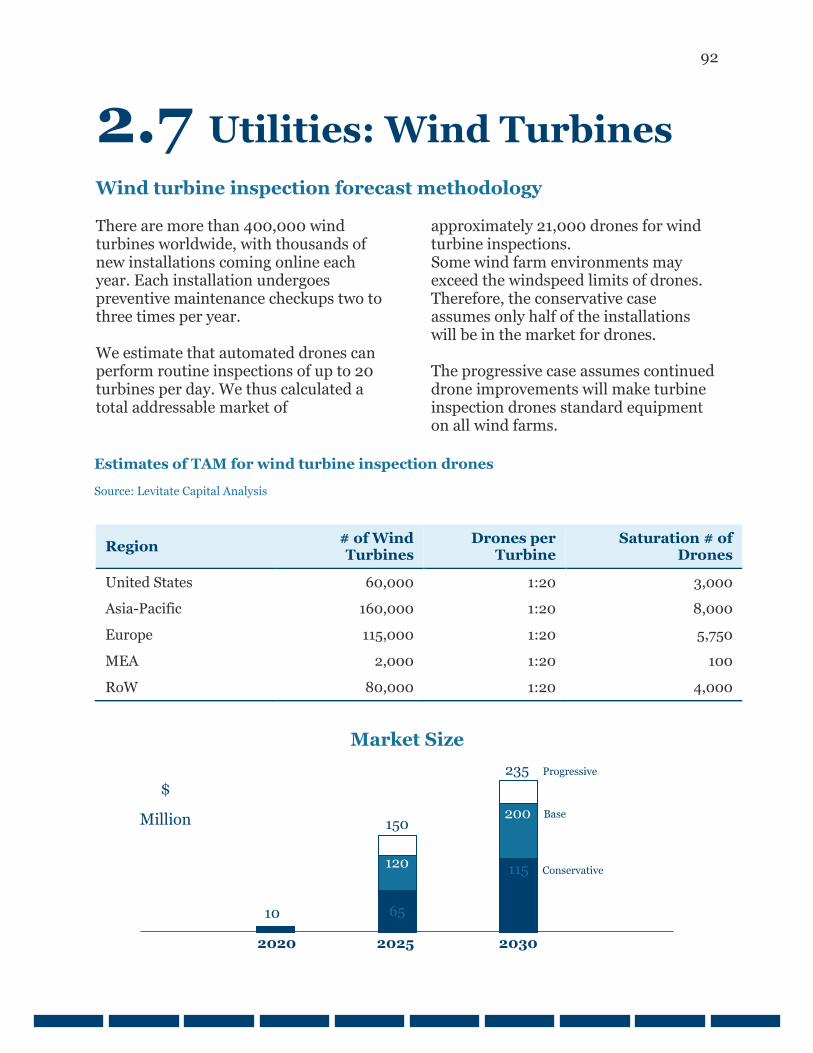
92
2.7 Utilities: Wind Turbines
Wind turbine inspection forecast methodology There are more than 400,000 wind turbines worldwide, with thousands of new installations coming online each year. Each installation undergoes preventive maintenance checkups two to three times per year. We estimate that automated drones can perform routine inspections of up to 20 turbines per day. We thus calculated a total addressable market of
approximately 21,000 drones for wind turbine inspections. Some wind farm environments may exceed the windspeed limits of drones. Therefore, the conservative case assumes only half of the installations will be in the market for drones. The progressive case assumes continued drone improvements will make turbine inspection drones standard equipment on all wind farms.
Region # of Wind Turbines
Drones per Turbine
Saturation # of Drones
United States 60,000 1:20 3,000 Asia-Pacific 160,000 1:20 8,000 Europe 115,000 1:20 5,750 MEA 2,000 1:20 100 RoW 80,000 1:20 4,000
Estimates of TAM for wind turbine inspection drones
Source: Levitate Capital Analysis
Market Size
10 65
115 120
200 150
235 Progressive
Base
Conservative
2020 2025 2030
$
Million
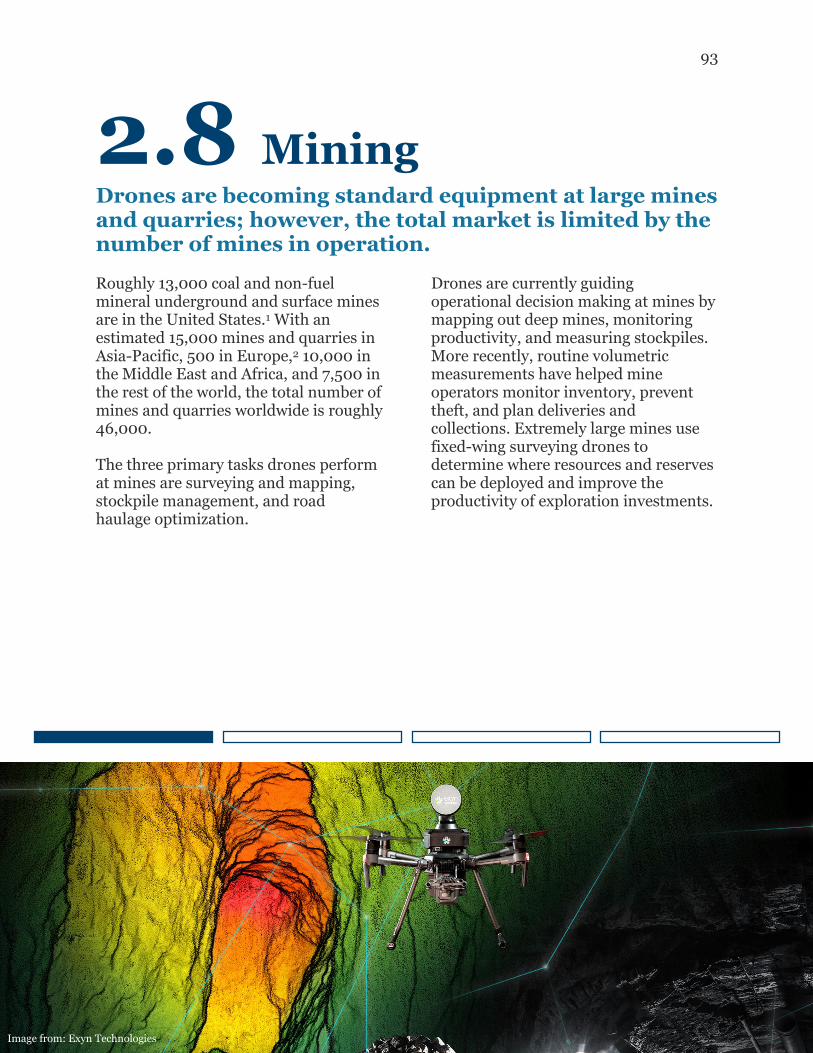
93
2.8 Mining
Drones are becoming standard equipment at large mines and quarries; however, the total market is limited by the number of mines in operation.
Roughly 13,000 coal and non-fuel mineral underground and surface mines are in the United States.1 With an estimated 15,000 mines and quarries in Asia-Pacific, 500 in Europe,2 10,000 in the Middle East and Africa, and 7,500 in the rest of the world, the total number of mines and quarries worldwide is roughly 46,000. The three primary tasks drones perform at mines are surveying and mapping, stockpile management, and road haulage optimization.
Drones are currently guiding operational decision making at mines by mapping out deep mines, monitoring productivity, and measuring stockpiles. More recently, routine volumetric measurements have helped mine operators monitor inventory, prevent theft, and plan deliveries and collections. Extremely large mines use fixed-wing surveying drones to determine where resources and reserves can be deployed and improve the productivity of exploration investments.
Image from: Exyn Technologies
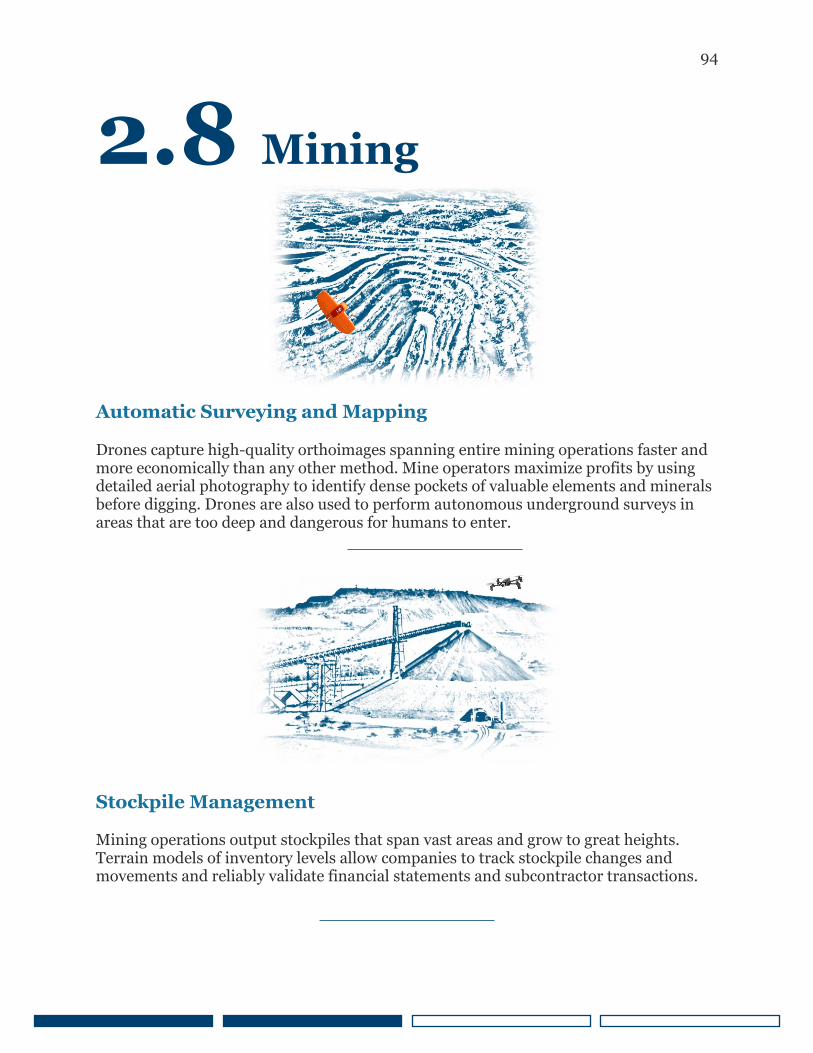
94
2.8 Mining
Automatic Surveying and Mapping
Drones capture high-quality orthoimages spanning entire mining operations faster and more economically than any other method. Mine operators maximize profits by using detailed aerial photography to identify dense pockets of valuable elements and minerals before digging. Drones are also used to perform autonomous underground surveys in areas that are too deep and dangerous for humans to enter.
Stockpile Management
Mining operations output stockpiles that span vast areas and grow to great heights. Terrain models of inventory levels allow companies to track stockpile changes and movements and reliably validate financial statements and subcontractor transactions.
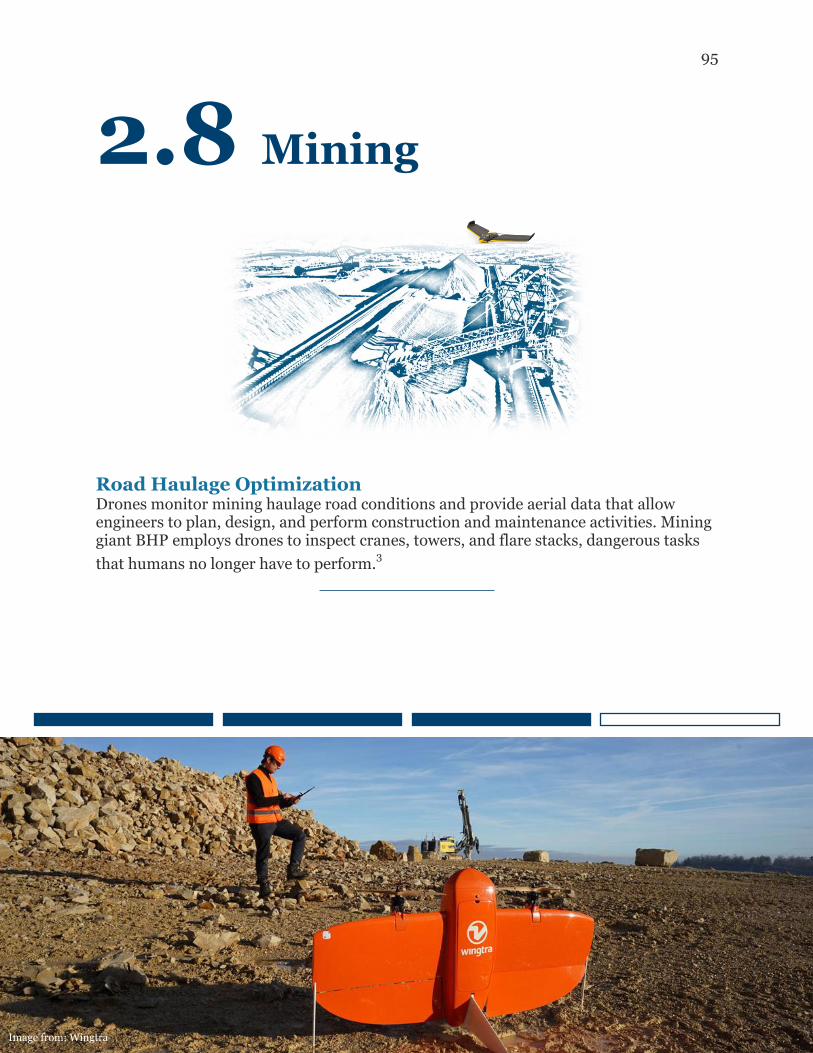
95
2.8 Mining
Road Haulage Optimization
Drones monitor mining haulage road conditions and provide aerial data that allow engineers to plan, design, and perform construction and maintenance activities. Mining giant BHP employs drones to inspect cranes, towers, and flare stacks, dangerous tasks
that humans no longer have to perform.3
Image from: Wingtra
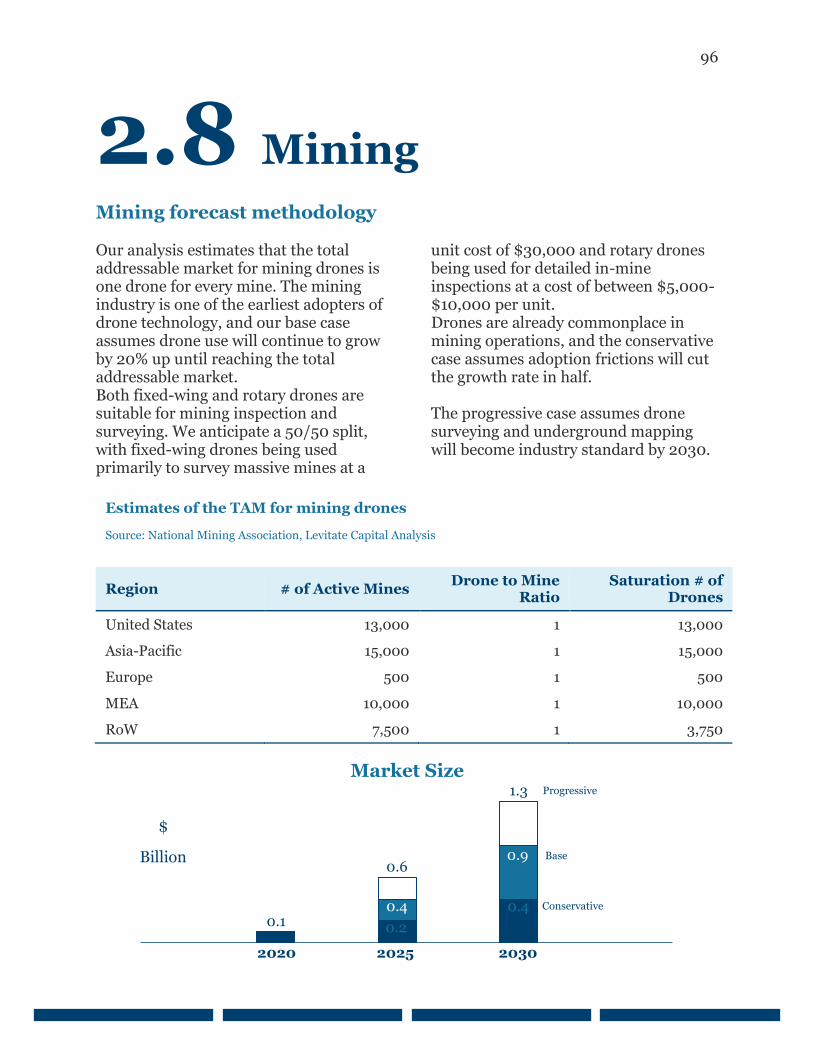
96
2.8 Mining
Mining forecast methodology Our analysis estimates that the total addressable market for mining drones is one drone for every mine. The mining industry is one of the earliest adopters of drone technology, and our base case assumes drone use will continue to grow by 20% up until reaching the total addressable market. Both fixed-wing and rotary drones are suitable for mining inspection and surveying. We anticipate a 50/50 split, with fixed-wing drones being used primarily to survey massive mines at a
unit cost of $30,000 and rotary drones being used for detailed in-mine inspections at a cost of between $5,000-$10,000 per unit. Drones are already commonplace in mining operations, and the conservative case assumes adoption frictions will cut the growth rate in half. The progressive case assumes drone surveying and underground mapping will become industry standard by 2030.
Region # of Active Mines Drone to Mine Ratio
Saturation # of Drones
United States 13,000 1 13,000 Asia-Pacific 15,000 1 15,000 Europe 500 1 500 MEA 10,000 1 10,000 RoW 7,500 1 3,750
Estimates of the TAM for mining drones
Source: National Mining Association, Levitate Capital Analysis
Market Size
0.1 0.2
0.4 0.4
0.9 0.6
1.3 Progressive
Base
Conservative
2020 2025 2030
$
Billion
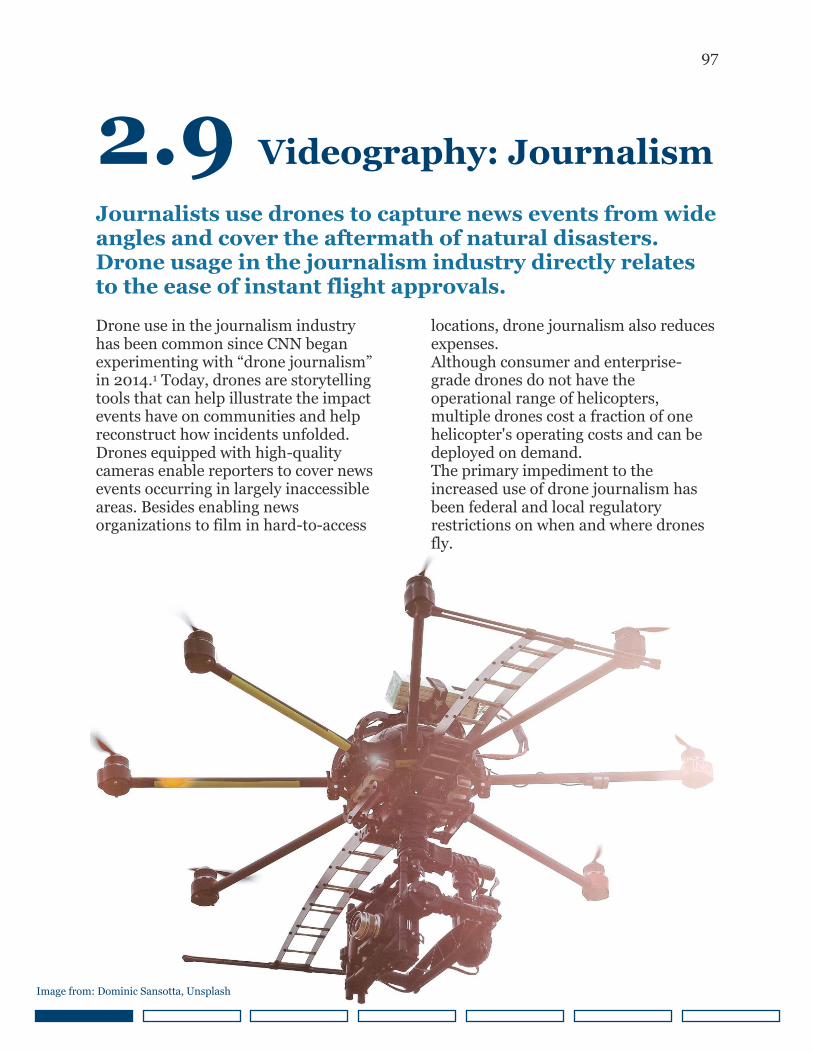
97
2.9 Videography: Journalism
Journalists use drones to capture news events from wide angles and cover the aftermath of natural disasters. Drone usage in the journalism industry directly relates to the ease of instant flight approvals.
Drone use in the journalism industry has been common since CNN began experimenting with “drone journalism” in 2014.1 Today, drones are storytelling tools that can help illustrate the impact events have on communities and help reconstruct how incidents unfolded. Drones equipped with high-quality cameras enable reporters to cover news events occurring in largely inaccessible areas. Besides enabling news organizations to film in hard-to-access
locations, drone journalism also reduces expenses. Although consumer and enterprise-grade drones do not have the operational range of helicopters, multiple drones cost a fraction of one helicopter's operating costs and can be deployed on demand. The primary impediment to the increased use of drone journalism has been federal and local regulatory restrictions on when and where drones fly.
Image from: Dominic Sansotta, Unsplash
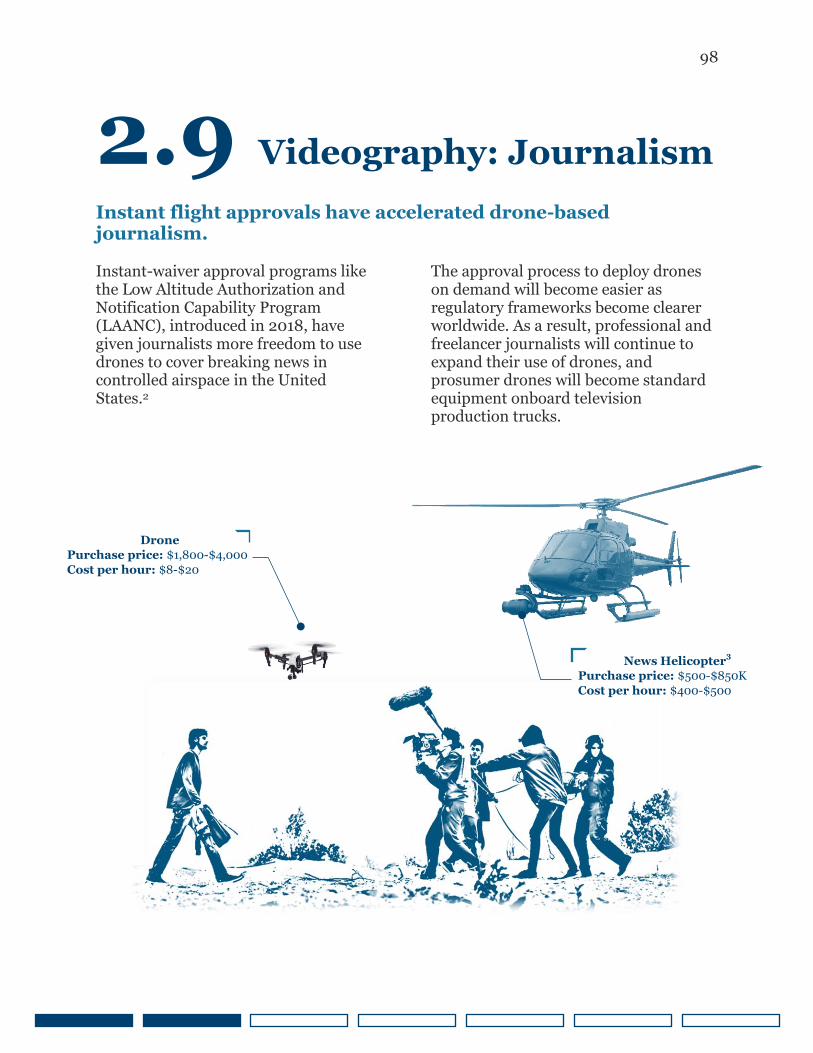
98
2.9 Videography: Journalism
Instant flight approvals have accelerated drone-based journalism. Instant-waiver approval programs like the Low Altitude Authorization and Notification Capability Program (LAANC), introduced in 2018, have given journalists more freedom to use drones to cover breaking news in controlled airspace in the United States.2
The approval process to deploy drones on demand will become easier as regulatory frameworks become clearer worldwide. As a result, professional and freelancer journalists will continue to expand their use of drones, and prosumer drones will become standard equipment onboard television production trucks.
Drone Purchase price: $1,800-$4,000 Cost per hour: $8-$20
News Helicopter3
Purchase price: $500-$850K Cost per hour: $400-$500
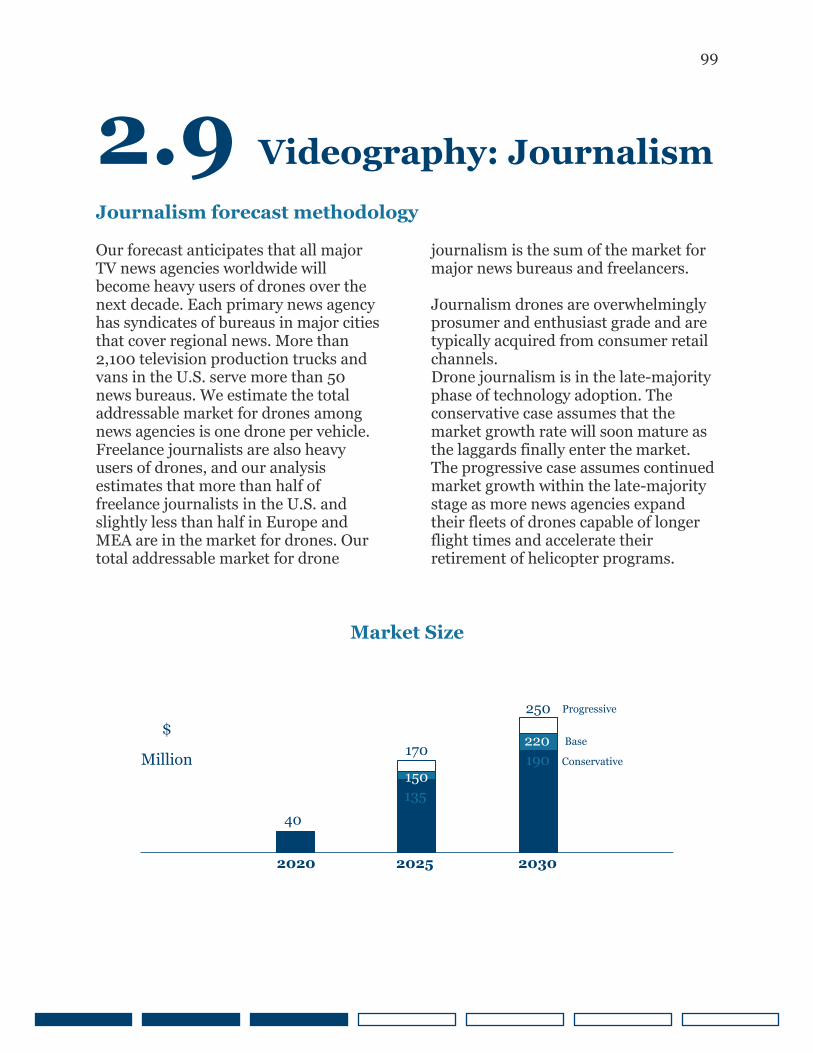
99
2.9 Videography: Journalism
Journalism forecast methodology Our forecast anticipates that all major TV news agencies worldwide will become heavy users of drones over the next decade. Each primary news agency has syndicates of bureaus in major cities that cover regional news. More than 2,100 television production trucks and vans in the U.S. serve more than 50 news bureaus. We estimate the total addressable market for drones among news agencies is one drone per vehicle. Freelance journalists are also heavy users of drones, and our analysis estimates that more than half of freelance journalists in the U.S. and slightly less than half in Europe and MEA are in the market for drones. Our total addressable market for drone
journalism is the sum of the market for major news bureaus and freelancers. Journalism drones are overwhelmingly prosumer and enthusiast grade and are typically acquired from consumer retail channels. Drone journalism is in the late-majority phase of technology adoption. The conservative case assumes that the market growth rate will soon mature as the laggards finally enter the market. The progressive case assumes continued market growth within the late-majority stage as more news agencies expand their fleets of drones capable of longer flight times and accelerate their retirement of helicopter programs.
40
135
190 150
220 170
250 Progressive
Base
Conservative
2020 2025 2030
Market Size
$
Million
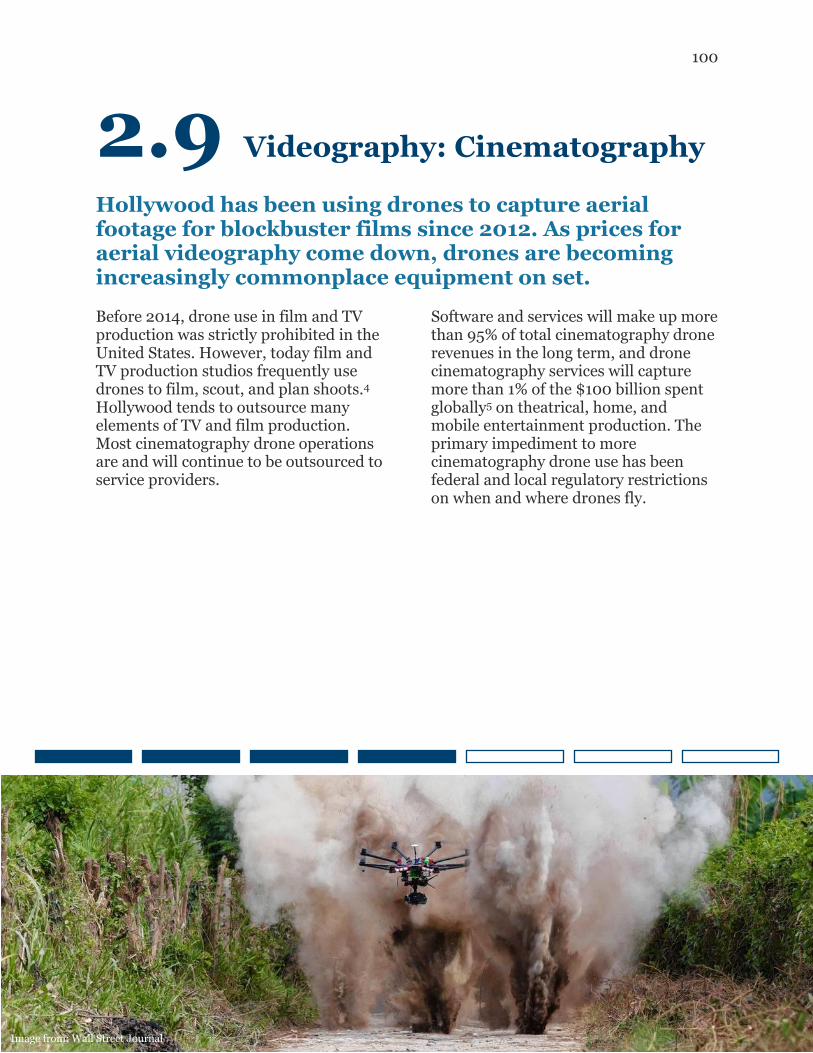
100
2.9 Videography: Cinematography
Hollywood has been using drones to capture aerial footage for blockbuster films since 2012. As prices for aerial videography come down, drones are becoming increasingly commonplace equipment on set.
Before 2014, drone use in film and TV production was strictly prohibited in the United States. However, today film and TV production studios frequently use drones to film, scout, and plan shoots.4 Hollywood tends to outsource many elements of TV and film production. Most cinematography drone operations are and will continue to be outsourced to service providers.
Software and services will make up more than 95% of total cinematography drone revenues in the long term, and drone cinematography services will capture more than 1% of the $100 billion spent globally5 on theatrical, home, and mobile entertainment production. The primary impediment to more cinematography drone use has been federal and local regulatory restrictions on when and where drones fly.
Image from: Wall Street Journal
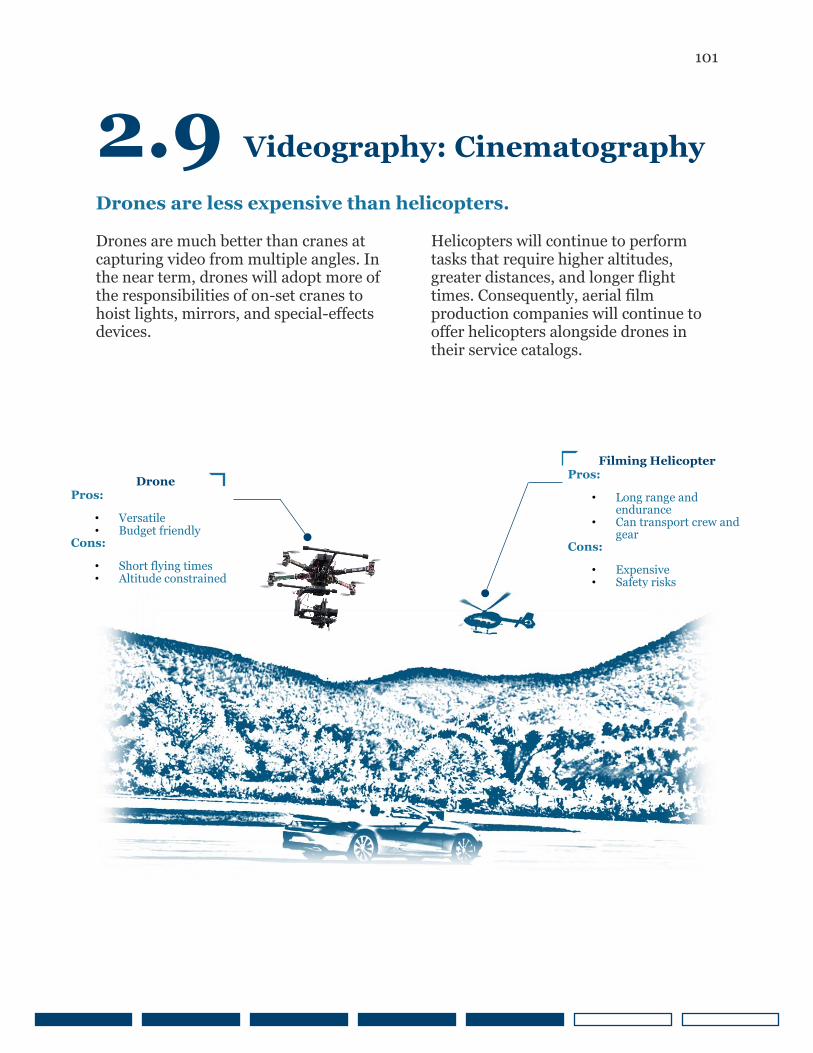
101
2.9 Videography: Cinematography
Drones are less expensive than helicopters. Drones are much better than cranes at capturing video from multiple angles. In the near term, drones will adopt more of the responsibilities of on-set cranes to hoist lights, mirrors, and special-effects devices.
Helicopters will continue to perform tasks that require higher altitudes, greater distances, and longer flight times. Consequently, aerial film production companies will continue to offer helicopters alongside drones in their service catalogs.
Drone Pros:
• Versatile • Budget friendly
Cons:
• Short flying times • Altitude constrained
Filming Helicopter Pros:
• Long range and endurance
• Can transport crew and gear
Cons:
• Expensive • Safety risks
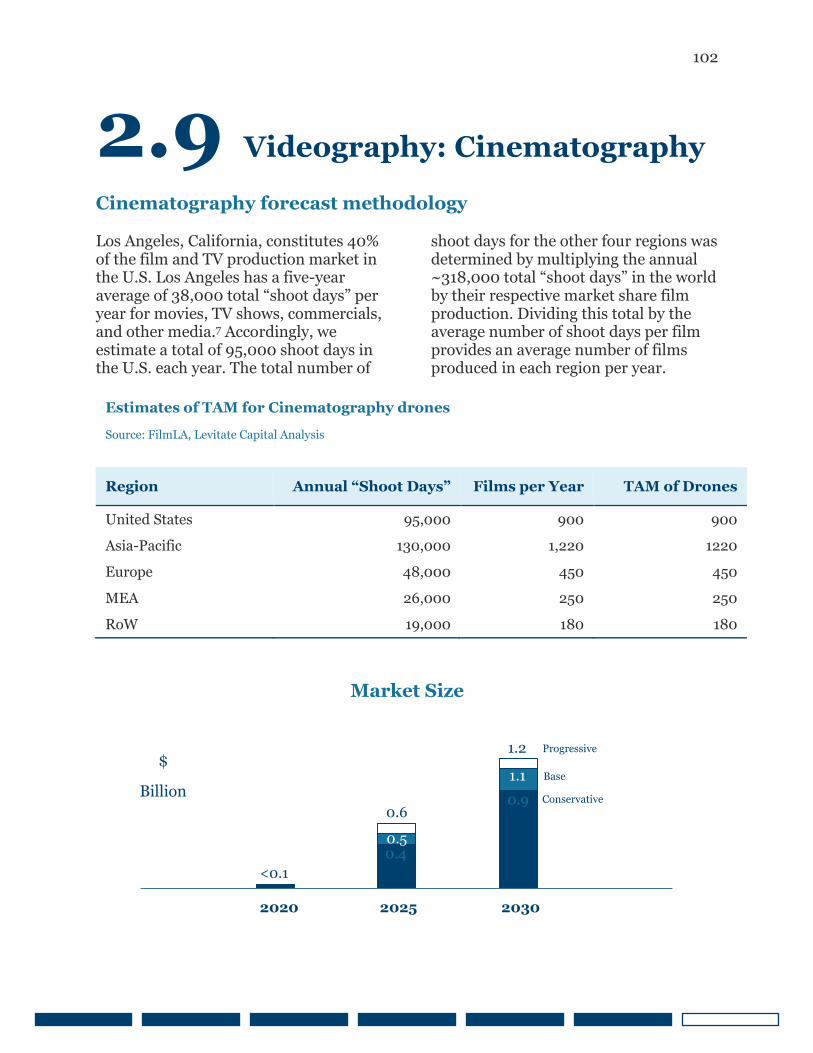
102
2.9 Videography: Cinematography
Cinematography forecast methodology Los Angeles, California, constitutes 40% of the film and TV production market in the U.S. Los Angeles has a five-year average of 38,000 total “shoot days” per year for movies, TV shows, commercials, and other media.7 Accordingly, we estimate a total of 95,000 shoot days in the U.S. each year. The total number of
shoot days for the other four regions was determined by multiplying the annual ~318,000 total “shoot days” in the world by their respective market share film production. Dividing this total by the average number of shoot days per film provides an average number of films produced in each region per year.
Region Annual “Shoot Days” Films per Year TAM of Drones
United States 95,000 900 900 Asia-Pacific 130,000 1,220 1220 Europe 48,000 450 450 MEA 26,000 250 250 RoW 19,000 180 180
Estimates of TAM for Cinematography drones
Source: FilmLA, Levitate Capital Analysis
Market Size
<0.1 0.4
0.9
0.5
1.1
0.6
1.2 Progressive
Base
Conservative
2020 2025 2030
$
Billion
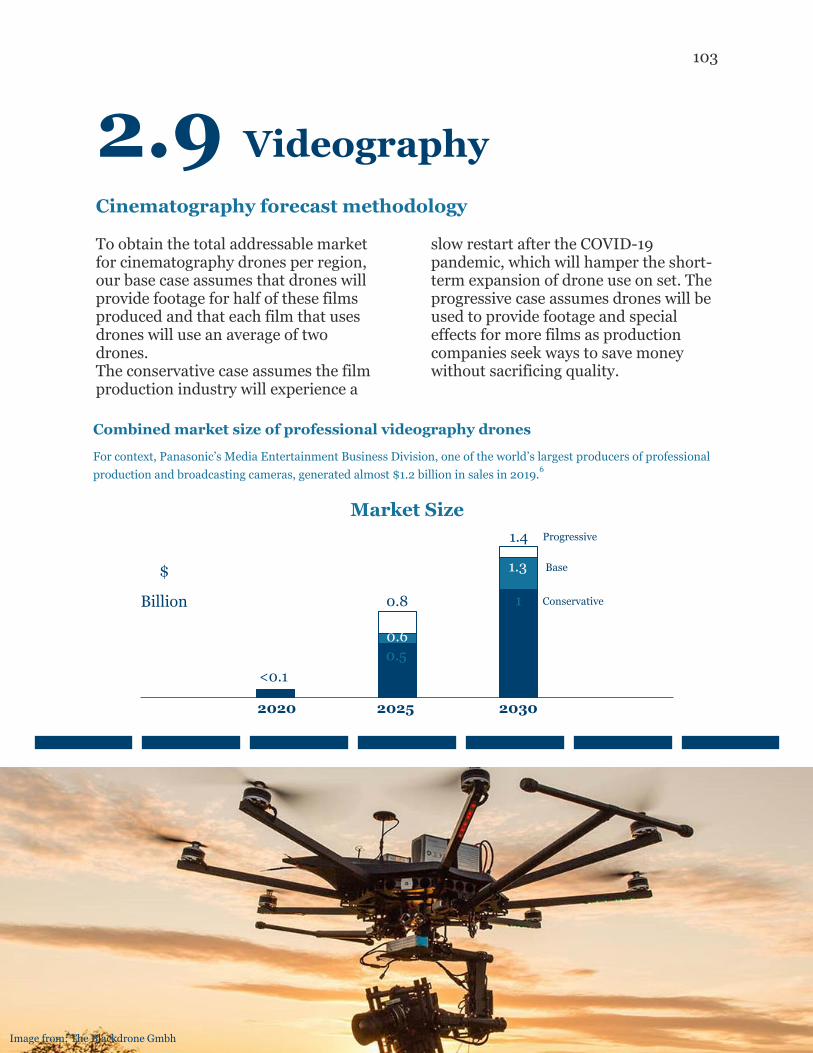
103
2.9 Videography
Cinematography forecast methodology To obtain the total addressable market for cinematography drones per region, our base case assumes that drones will provide footage for half of these films produced and that each film that uses drones will use an average of two drones. The conservative case assumes the film production industry will experience a
slow restart after the COVID-19 pandemic, which will hamper the short-term expansion of drone use on set. The progressive case assumes drones will be used to provide footage and special effects for more films as production companies seek ways to save money without sacrificing quality.
Combined market size of professional videography drones
For context, Panasonic’s Media Entertainment Business Division, one of the world’s largest producers of professional
production and broadcasting cameras, generated almost $1.2 billion in sales in 2019.6
<0.1
0.5
1
0.6
1.3
0.8
1.4 Progressive
Base
Conservative
2020 2025 2030
Market Size
$
Billion
Image from: The Blackdrone Gmbh
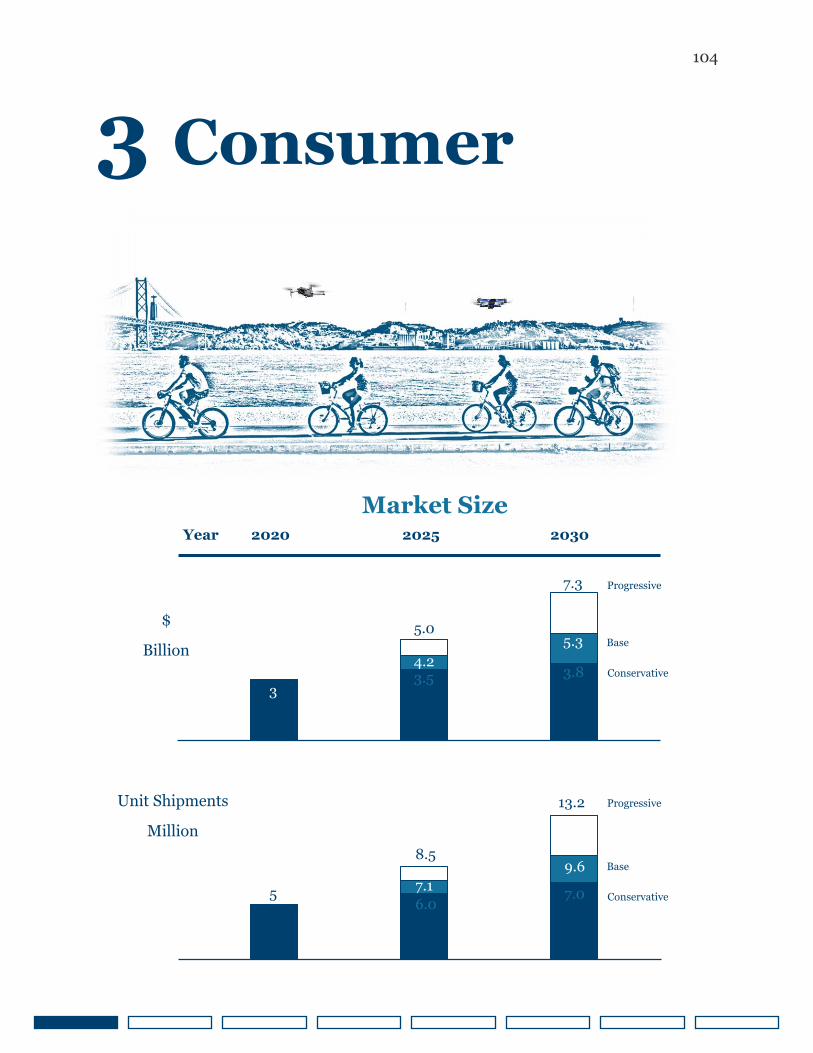
104
3 Consumer
$
Billion
Market Size
Year 2020 2025 2030
Unit Shipments
Million
3 3.5 3.8 4.2
5.3 5.0
7.3 Progressive
Base
Conservative
5
8.5
13.2
7.1 9.6
6.0 7.0
Progressive
Base
Conservative
105
3 Consumer
The significance of consumer drones within the drone economy will decline as commercial applications take off. We expect the consumer drone market to reach maturity by 2025.
Most people who think about drones picture consumer drones. However, the defense and enterprise segments of the drone economy are both larger than the consumer drone segment. Growth in the “experience economy” and demands for standout social media content have led to widespread drone use for aerial photography. However, according to the Federal Aviation Administration (FAA), growth in the number of recreational drone
registrations in the United States has slowed as prices for popular drones have increased and early adopters have become satisfied with existing technology. In 2019, prices for popular DJI drones in the U.S. increased by 13% after the country imposed new tariffs on Chinese-made goods.1 Due to these factors, the FAA estimates that the number of registered recreational drones in the U.S. will reach saturation by 2024.2
Image from: DJI; DJI Mavic Air 2
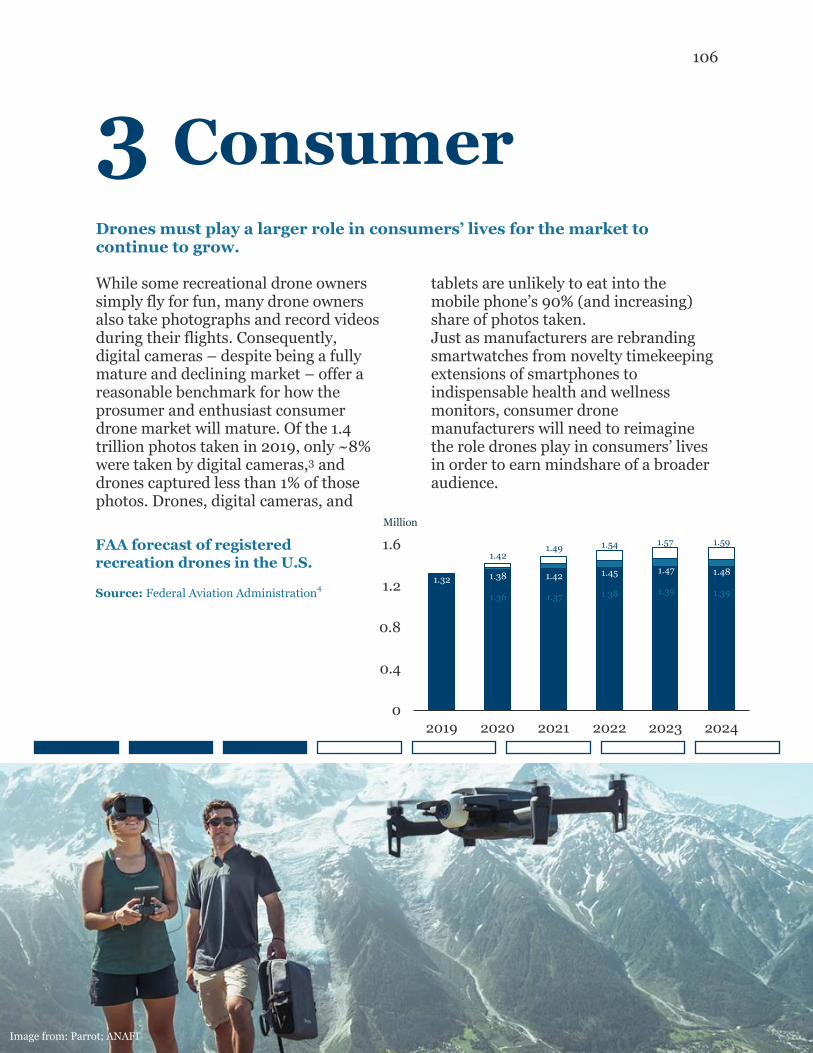
106
3 Consumer
Drones must play a larger role in consumers’ lives for the market to continue to grow. While some recreational drone owners simply fly for fun, many drone owners also take photographs and record videos during their flights. Consequently, digital cameras – despite being a fully mature and declining market – offer a reasonable benchmark for how the prosumer and enthusiast consumer drone market will mature. Of the 1.4 trillion photos taken in 2019, only ~8% were taken by digital cameras,3 and drones captured less than 1% of those photos. Drones, digital cameras, and
tablets are unlikely to eat into the mobile phone’s 90% (and increasing) share of photos taken. Just as manufacturers are rebranding smartwatches from novelty timekeeping extensions of smartphones to indispensable health and wellness monitors, consumer drone manufacturers will need to reimagine the role drones play in consumers’ lives in order to earn mindshare of a broader audience.
FAA forecast of registered
recreation drones in the U.S.
Source: Federal Aviation Administration4
0
0.4
0.8
1.2
1.6
2019 2020 2021 2022 2023 2024
1.32
Million
1.38
1.42
1.36
1.42
1.49
1.37
1.45
1.54
1.38
1.47
1.57
1.39 1.48
1.59
1.39
Image from: Parrot; ANAFI
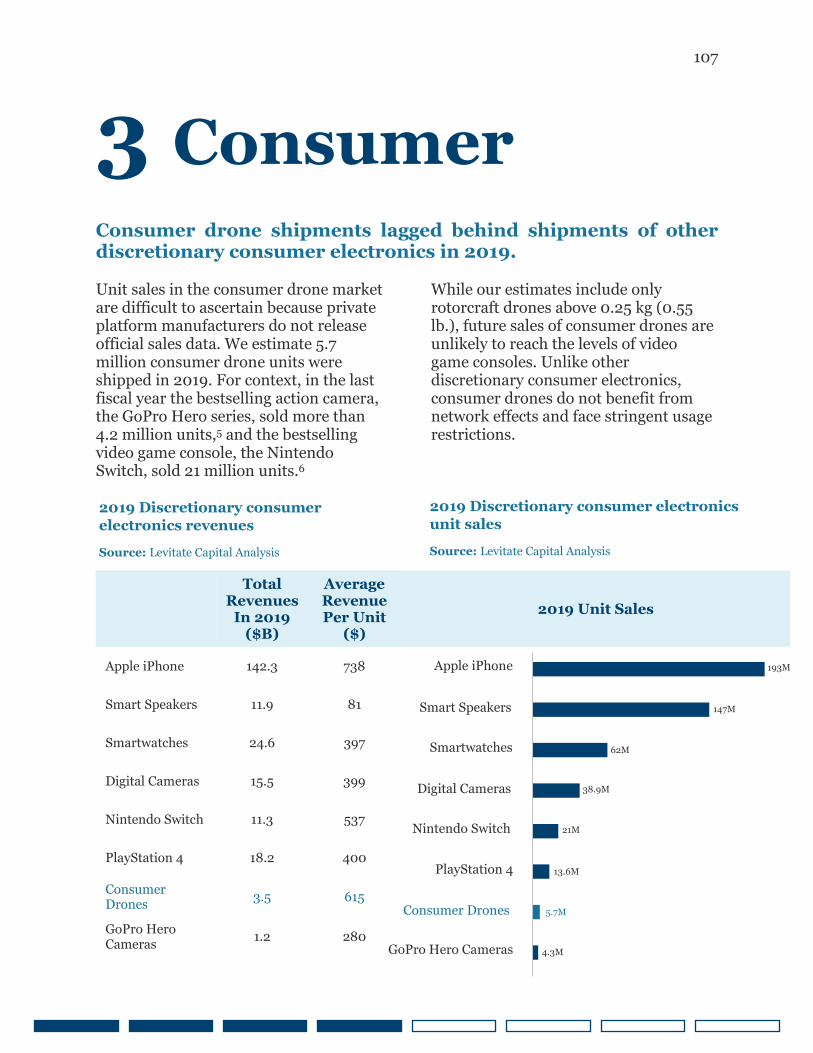
107
3 Consumer
Consumer drone shipments lagged behind shipments of other discretionary consumer electronics in 2019. Unit sales in the consumer drone market are difficult to ascertain because private platform manufacturers do not release official sales data. We estimate 5.7 million consumer drone units were shipped in 2019. For context, in the last fiscal year the bestselling action camera, the GoPro Hero series, sold more than 4.2 million units,5 and the bestselling video game console, the Nintendo Switch, sold 21 million units.6
While our estimates include only rotorcraft drones above 0.25 kg (0.55 lb.), future sales of consumer drones are unlikely to reach the levels of video game consoles. Unlike other discretionary consumer electronics, consumer drones do not benefit from network effects and face stringent usage restrictions.
Total Revenues
In 2019 ($B)
Average Revenue Per Unit
($) 2019 Unit Sales
Apple iPhone 142.3 738
Smart Speakers 11.9 81
Smartwatches 24.6 397
Digital Cameras 15.5 399
Nintendo Switch 11.3 537
PlayStation 4 18.2 400
Consumer Drones
3.5 615
GoPro Hero Cameras
1.2 280
2019 Discretionary consumer
electronics revenues
Source: Levitate Capital Analysis
2019 Discretionary consumer electronics
unit sales
Source: Levitate Capital Analysis
193M
147M
38.9M
62M
21M
13.6M
5.7M
4.3M
Consumer Drones
Apple iPhone
Smart Speakers
Smartwatches
Digital Cameras
Nintendo Switch
PlayStation 4
GoPro Hero Cameras
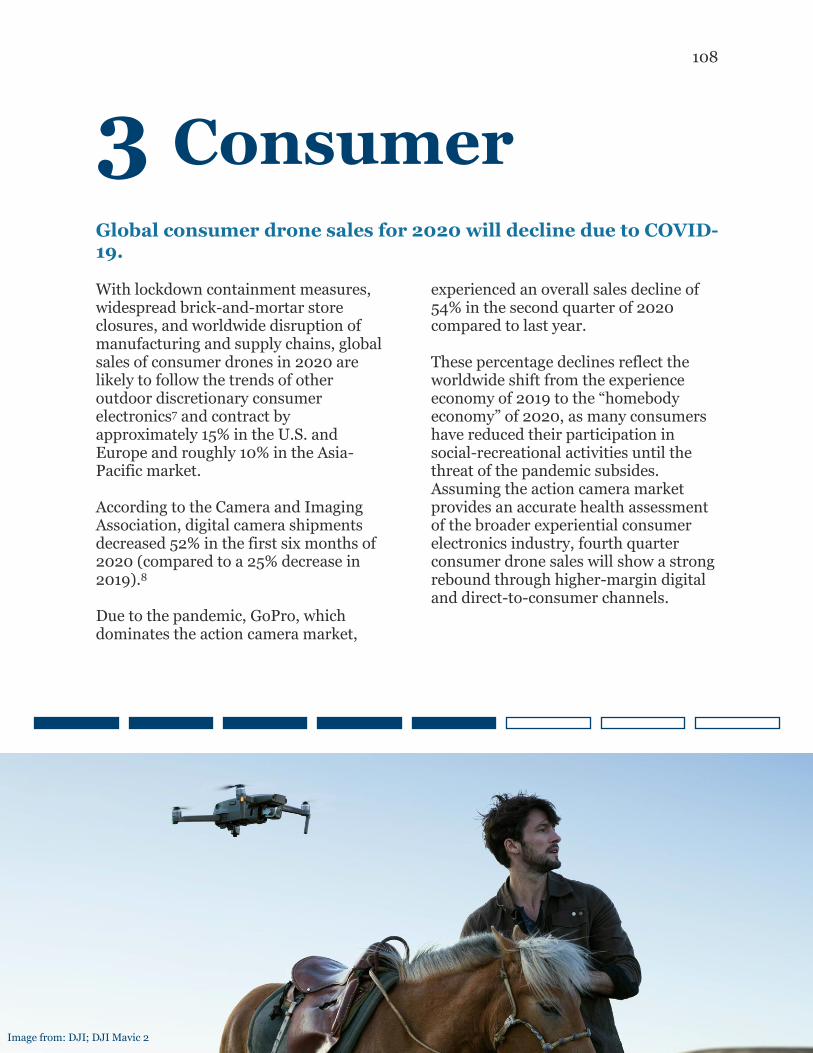
108
3 Consumer
Global consumer drone sales for 2020 will decline due to COVID-19. With lockdown containment measures, widespread brick-and-mortar store closures, and worldwide disruption of manufacturing and supply chains, global sales of consumer drones in 2020 are likely to follow the trends of other outdoor discretionary consumer electronics7 and contract by approximately 15% in the U.S. and Europe and roughly 10% in the Asia-Pacific market. According to the Camera and Imaging Association, digital camera shipments decreased 52% in the first six months of 2020 (compared to a 25% decrease in 2019).8 Due to the pandemic, GoPro, which dominates the action camera market,
experienced an overall sales decline of 54% in the second quarter of 2020 compared to last year. These percentage declines reflect the worldwide shift from the experience economy of 2019 to the “homebody economy” of 2020, as many consumers have reduced their participation in social-recreational activities until the threat of the pandemic subsides. Assuming the action camera market provides an accurate health assessment of the broader experiential consumer electronics industry, fourth quarter consumer drone sales will show a strong rebound through higher-margin digital and direct-to-consumer channels.
Image from: DJI; DJI Mavic 2
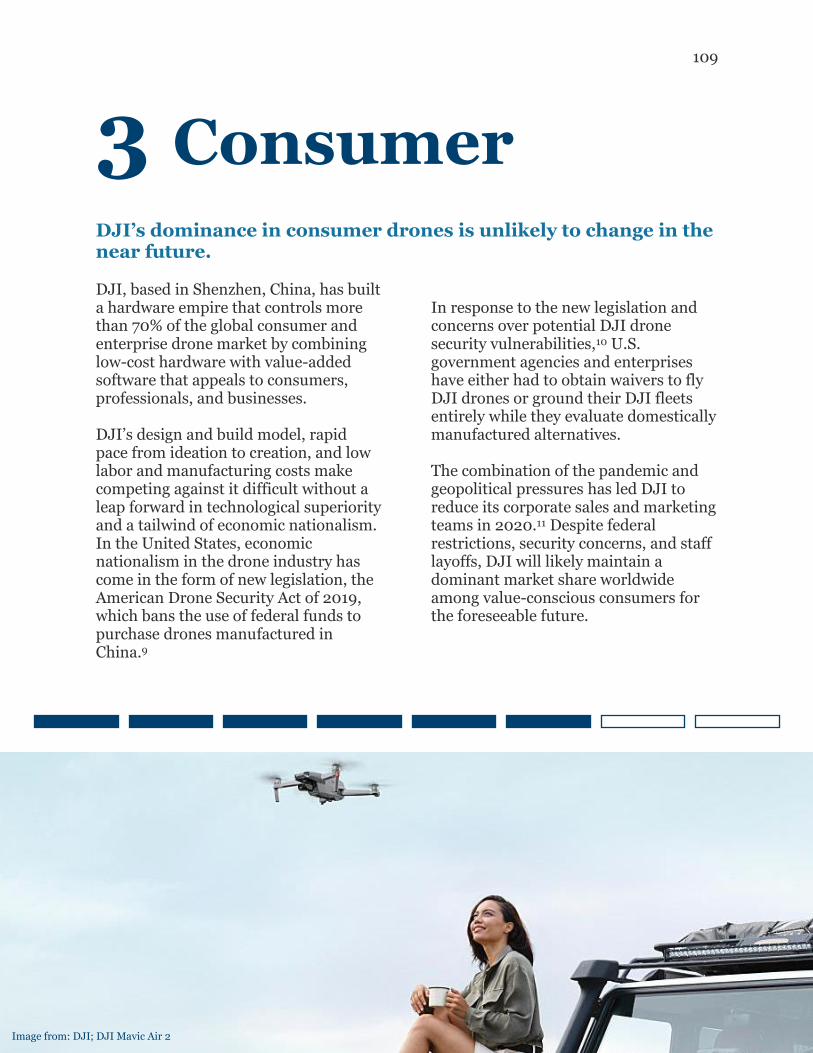
109
3 Consumer
DJI’s dominance in consumer drones is unlikely to change in the near future. DJI, based in Shenzhen, China, has built a hardware empire that controls more than 70% of the global consumer and enterprise drone market by combining low-cost hardware with value-added software that appeals to consumers, professionals, and businesses. DJI’s design and build model, rapid pace from ideation to creation, and low labor and manufacturing costs make competing against it difficult without a leap forward in technological superiority and a tailwind of economic nationalism. In the United States, economic nationalism in the drone industry has come in the form of new legislation, the American Drone Security Act of 2019, which bans the use of federal funds to purchase drones manufactured in China.9
In response to the new legislation and concerns over potential DJI drone security vulnerabilities,10 U.S. government agencies and enterprises have either had to obtain waivers to fly DJI drones or ground their DJI fleets entirely while they evaluate domestically manufactured alternatives. The combination of the pandemic and geopolitical pressures has led DJI to reduce its corporate sales and marketing teams in 2020.11 Despite federal restrictions, security concerns, and staff layoffs, DJI will likely maintain a dominant market share worldwide among value-conscious consumers for the foreseeable future.
Image from: DJI; DJI Mavic Air 2
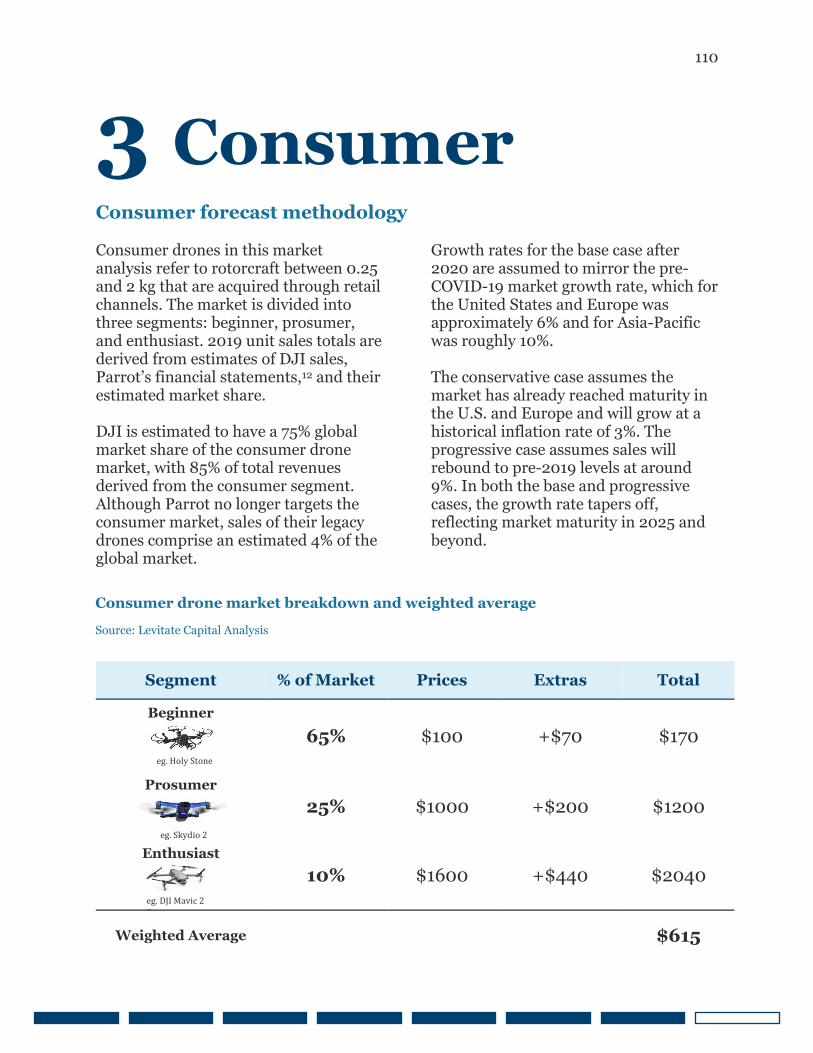
110
3 Consumer
Consumer forecast methodology Consumer drones in this market analysis refer to rotorcraft between 0.25 and 2 kg that are acquired through retail channels. The market is divided into three segments: beginner, prosumer, and enthusiast. 2019 unit sales totals are derived from estimates of DJI sales, Parrot’s financial statements,12 and their estimated market share. DJI is estimated to have a 75% global market share of the consumer drone market, with 85% of total revenues derived from the consumer segment. Although Parrot no longer targets the consumer market, sales of their legacy drones comprise an estimated 4% of the global market.
Growth rates for the base case after 2020 are assumed to mirror the pre-COVID-19 market growth rate, which for the United States and Europe was approximately 6% and for Asia-Pacific was roughly 10%. The conservative case assumes the market has already reached maturity in the U.S. and Europe and will grow at a historical inflation rate of 3%. The progressive case assumes sales will rebound to pre-2019 levels at around 9%. In both the base and progressive cases, the growth rate tapers off, reflecting market maturity in 2025 and beyond.
Segment % of Market Prices Extras Total
Beginner 65% $100 +$70 $170
Prosumer 25% $1000 +$200 $1200
Enthusiast 10% $1600 +$440 $2040
Weighted Average $615
Consumer drone market breakdown and weighted average
Source: Levitate Capital Analysis
eg. Holy Stone
eg. Skydio 2
eg. DJI Mavic 2
Pro
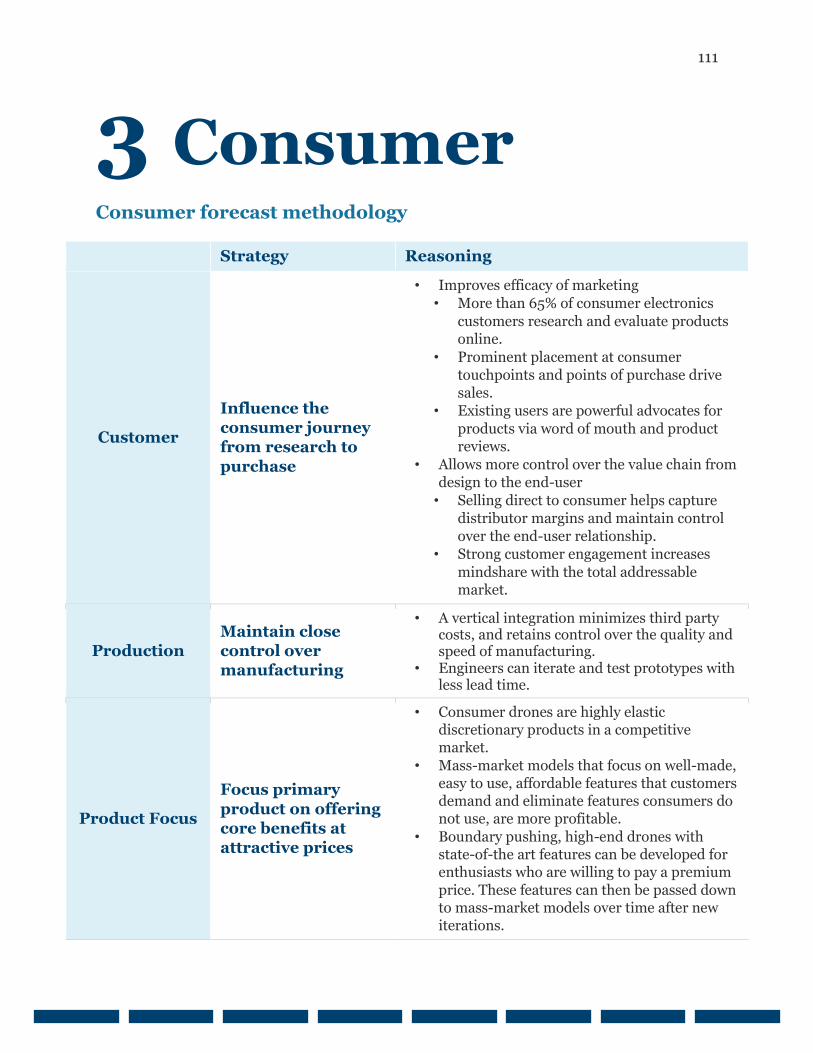
111
3 Consumer
Consumer forecast methodology
Strategy Reasoning
Customer
Influence the consumer journey from research to
purchase
• Improves efficacy of marketing
• More than 65% of consumer electronics
customers research and evaluate products online.
• Prominent placement at consumer
touchpoints and points of purchase drive
sales.
• Existing users are powerful advocates for
products via word of mouth and product reviews.
• Allows more control over the value chain from
design to the end-user
• Selling direct to consumer helps capture
distributor margins and maintain control
over the end-user relationship.
• Strong customer engagement increases
mindshare with the total addressable market.
Production
Maintain close control over manufacturing
• A vertical integration minimizes third party costs, and retains control over the quality and speed of manufacturing.
• Engineers can iterate and test prototypes with less lead time.
Product Focus
Focus primary
product on offering core benefits at attractive prices
• Consumer drones are highly elastic discretionary products in a competitive market.
• Mass-market models that focus on well-made, easy to use, affordable features that customers demand and eliminate features consumers do not use, are more profitable.
• Boundary pushing, high-end drones with state-of-the art features can be developed for enthusiasts who are willing to pay a premium
price. These features can then be passed down to mass-market models over time after new iterations.
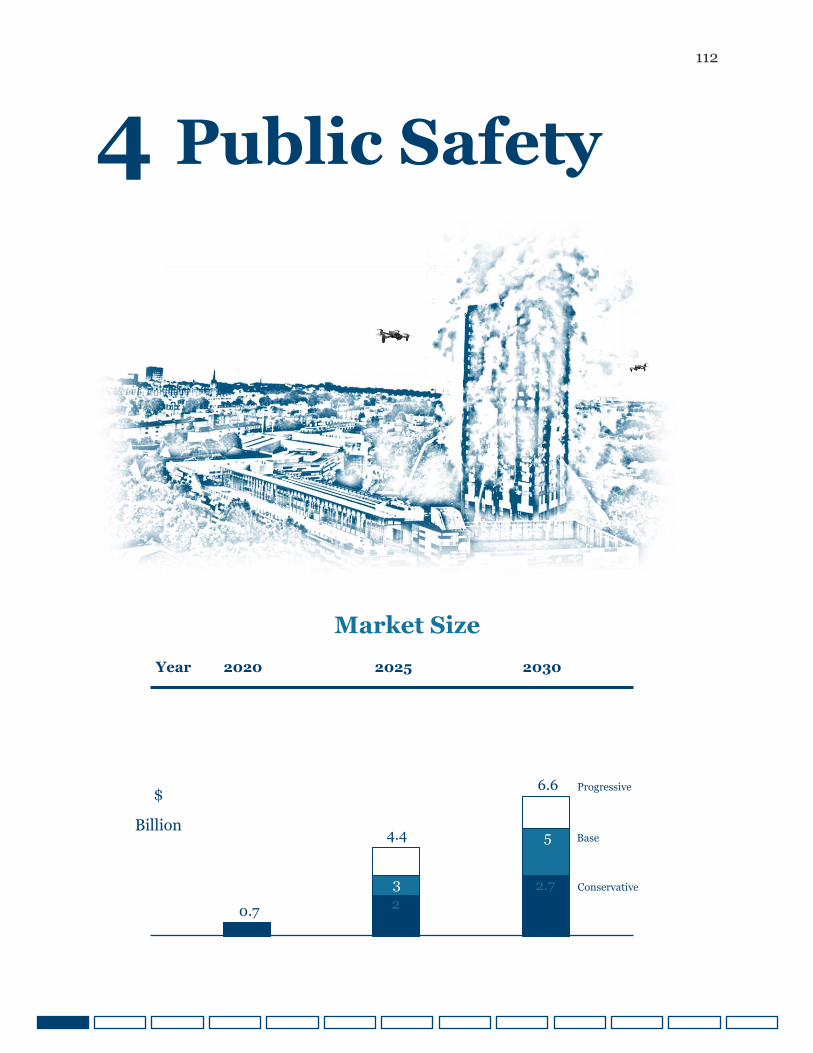
112
4 Public Safety
1
6
10 $
Billion
Market Size
Year 2020 2025 2030
8.1 2 2.7 3
5 4.4
6.6
0.7
Progressive
Base
Conservative
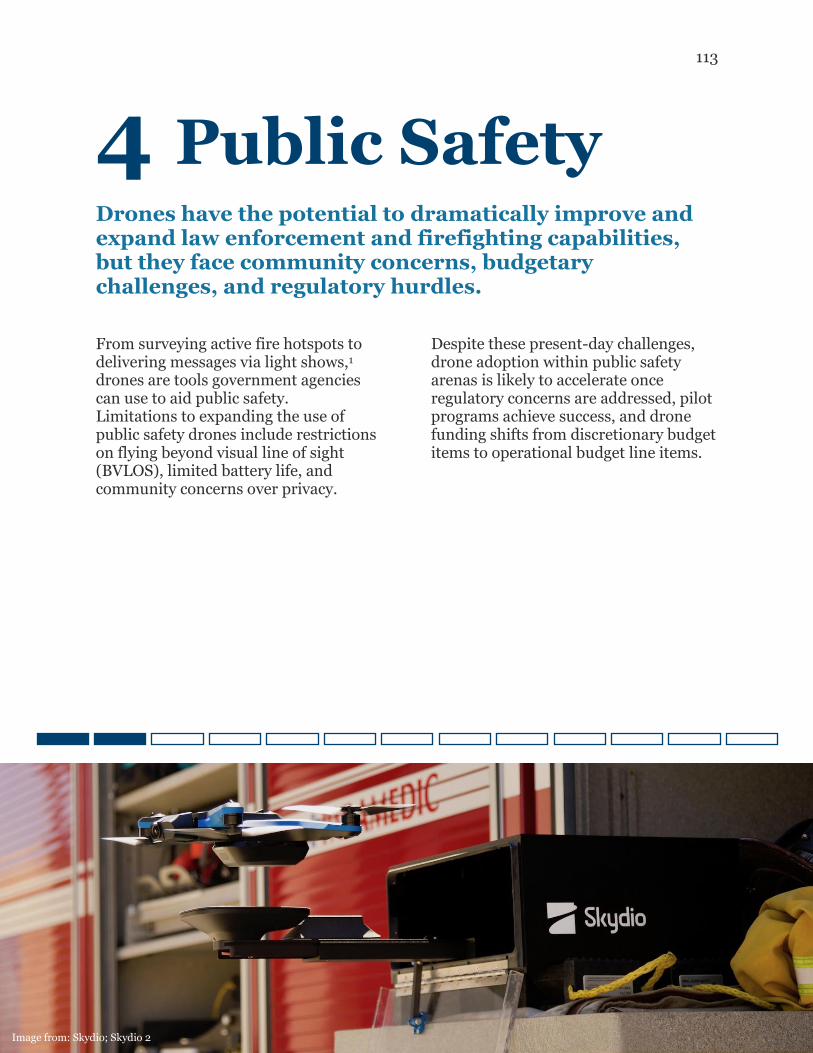
113
4 Public Safety
Drones have the potential to dramatically improve and expand law enforcement and firefighting capabilities, but they face community concerns, budgetary challenges, and regulatory hurdles. From surveying active fire hotspots to delivering messages via light shows,1 drones are tools government agencies can use to aid public safety. Limitations to expanding the use of public safety drones include restrictions on flying beyond visual line of sight (BVLOS), limited battery life, and community concerns over privacy.
Despite these present-day challenges, drone adoption within public safety arenas is likely to accelerate once regulatory concerns are addressed, pilot programs achieve success, and drone funding shifts from discretionary budget items to operational budget line items.
Image from: Skydio; Skydio 2
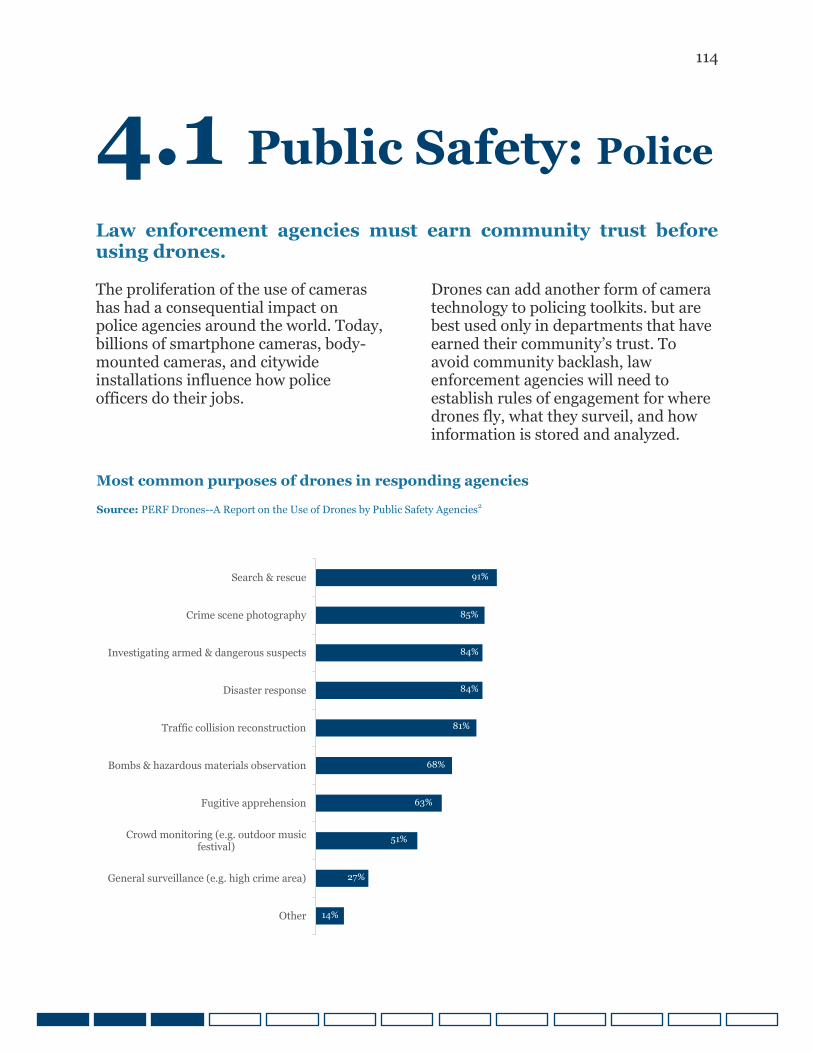
114
4.1 Public Safety: Police
Law enforcement agencies must earn community trust before using drones. The proliferation of the use of cameras has had a consequential impact on police agencies around the world. Today, billions of smartphone cameras, body-mounted cameras, and citywide installations influence how police officers do their jobs.
Drones can add another form of camera technology to policing toolkits. but are best used only in departments that have earned their community’s trust. To avoid community backlash, law enforcement agencies will need to establish rules of engagement for where drones fly, what they surveil, and how information is stored and analyzed.
Most common purposes of drones in responding agencies
Source: PERF Drones--A Report on the Use of Drones by Public Safety Agencies2
Other
General surveillance (e.g. high crime area)
Crowd monitoring (e.g. outdoor musicfestival)
Fugitive apprehension
Bombs & hazardous materials observation
Traffic collision reconstruction
Disaster response
Investigating armed & dangerous suspects
Crime scene photography
Search & rescue 91%
85%
84%
84%
81%
68%
63%
51%
27%
14%
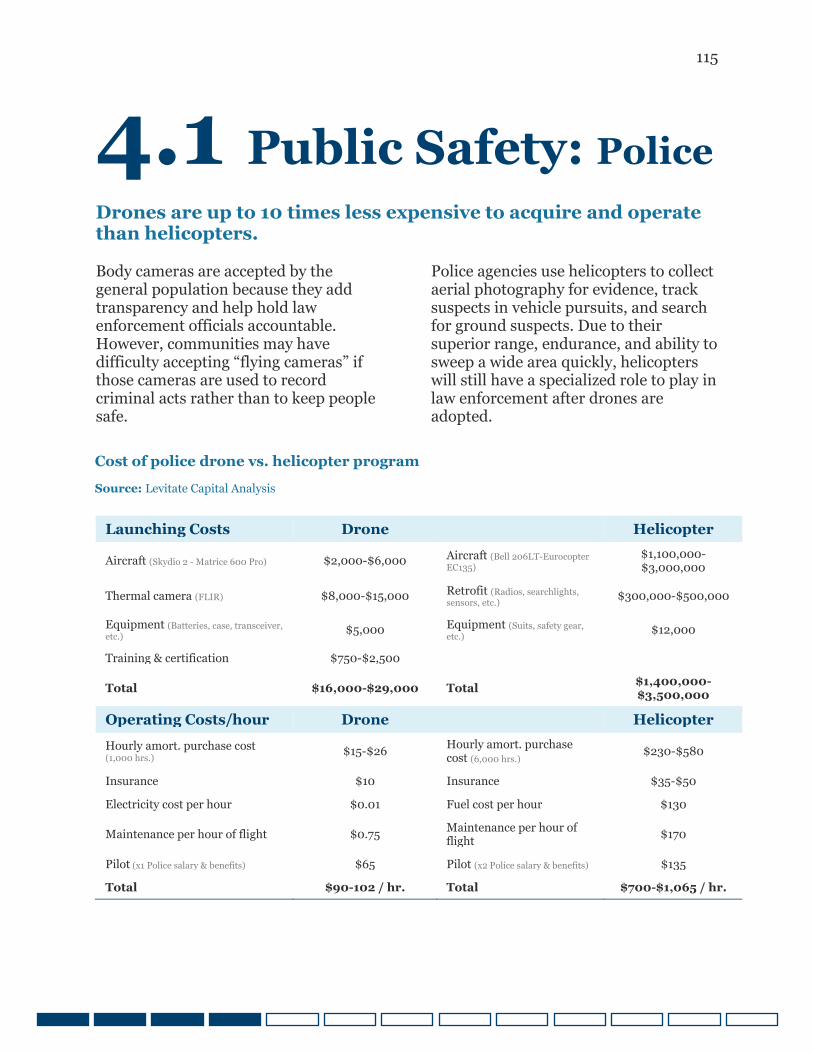
115
4.1 Public Safety: Police
Drones are up to 10 times less expensive to acquire and operate than helicopters. Body cameras are accepted by the general population because they add transparency and help hold law enforcement officials accountable. However, communities may have difficulty accepting “flying cameras” if those cameras are used to record criminal acts rather than to keep people safe.
Police agencies use helicopters to collect aerial photography for evidence, track suspects in vehicle pursuits, and search for ground suspects. Due to their superior range, endurance, and ability to sweep a wide area quickly, helicopters will still have a specialized role to play in law enforcement after drones are adopted.
Launching Costs Drone Helicopter
Aircraft (Skydio 2 - Matrice 600 Pro) $2,000-$6,000 Aircraft (Bell 206LT-Eurocopter EC135)
$1,100,000-$3,000,000
Thermal camera (FLIR) $8,000-$15,000 Retrofit (Radios, searchlights, sensors, etc.) $300,000-$500,000
Equipment (Batteries, case, transceiver, etc.) $5,000 Equipment (Suits, safety gear,
etc.) $12,000
Training & certification $750-$2,500
Total $16,000-$29,000 Total $1,400,000-$3,500,000
Operating Costs/hour Drone Helicopter Hourly amort. purchase cost (1,000 hrs.) $15-$26 Hourly amort. purchase
cost (6,000 hrs.) $230-$580
Insurance $10 Insurance $35-$50 Electricity cost per hour $0.01 Fuel cost per hour $130
Maintenance per hour of flight $0.75 Maintenance per hour of flight $170
Pilot (x1 Police salary & benefits) $65 Pilot (x2 Police salary & benefits) $135 Total $90-102 / hr. Total $700-$1,065 / hr.
Cost of police drone vs. helicopter program
Source: Levitate Capital Analysis
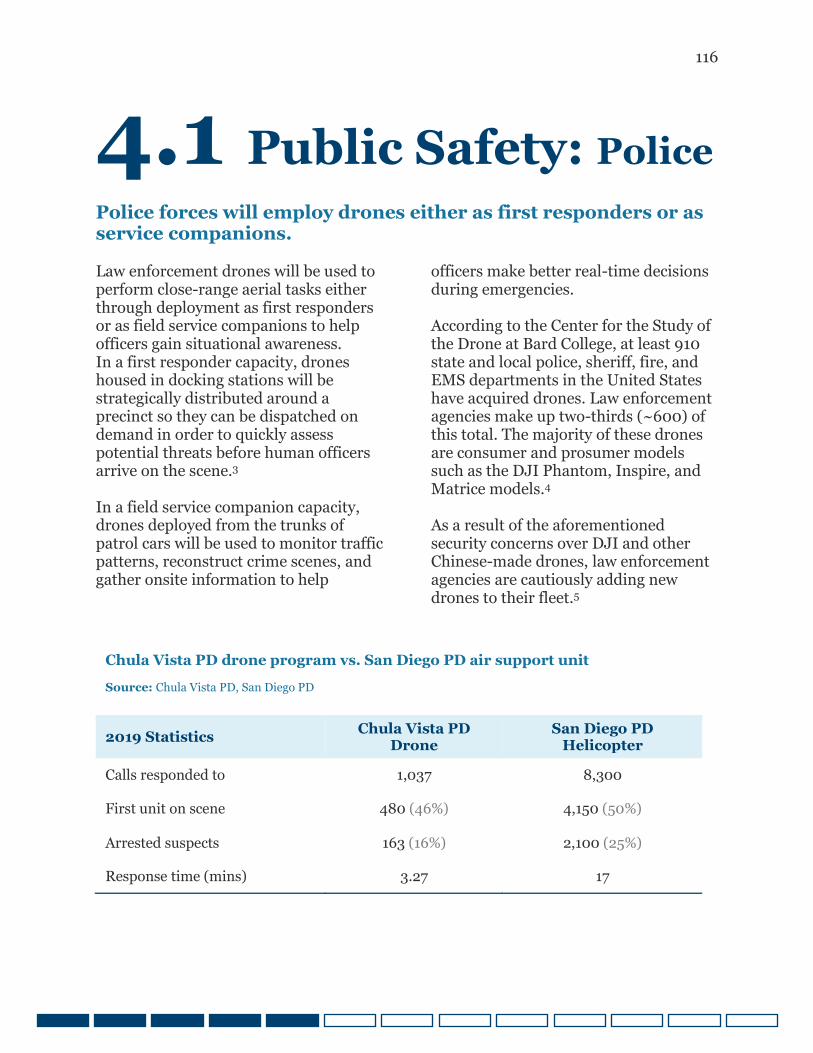
116
4.1 Public Safety: Police
Police forces will employ drones either as first responders or as service companions. Law enforcement drones will be used to perform close-range aerial tasks either through deployment as first responders or as field service companions to help officers gain situational awareness. In a first responder capacity, drones housed in docking stations will be strategically distributed around a precinct so they can be dispatched on demand in order to quickly assess potential threats before human officers arrive on the scene.3 In a field service companion capacity, drones deployed from the trunks of patrol cars will be used to monitor traffic patterns, reconstruct crime scenes, and gather onsite information to help
officers make better real-time decisions during emergencies. According to the Center for the Study of the Drone at Bard College, at least 910 state and local police, sheriff, fire, and EMS departments in the United States have acquired drones. Law enforcement agencies make up two-thirds (~600) of this total. The majority of these drones are consumer and prosumer models such as the DJI Phantom, Inspire, and Matrice models.4 As a result of the aforementioned security concerns over DJI and other Chinese-made drones, law enforcement agencies are cautiously adding new drones to their fleet.5
2019 Statistics Chula Vista PD Drone
San Diego PD Helicopter
Calls responded to 1,037 8,300
First unit on scene 480 (46%) 4,150 (50%)
Arrested suspects 163 (16%) 2,100 (25%)
Response time (mins) 3.27 17
Chula Vista PD drone program vs. San Diego PD air support unit
Source: Chula Vista PD, San Diego PD
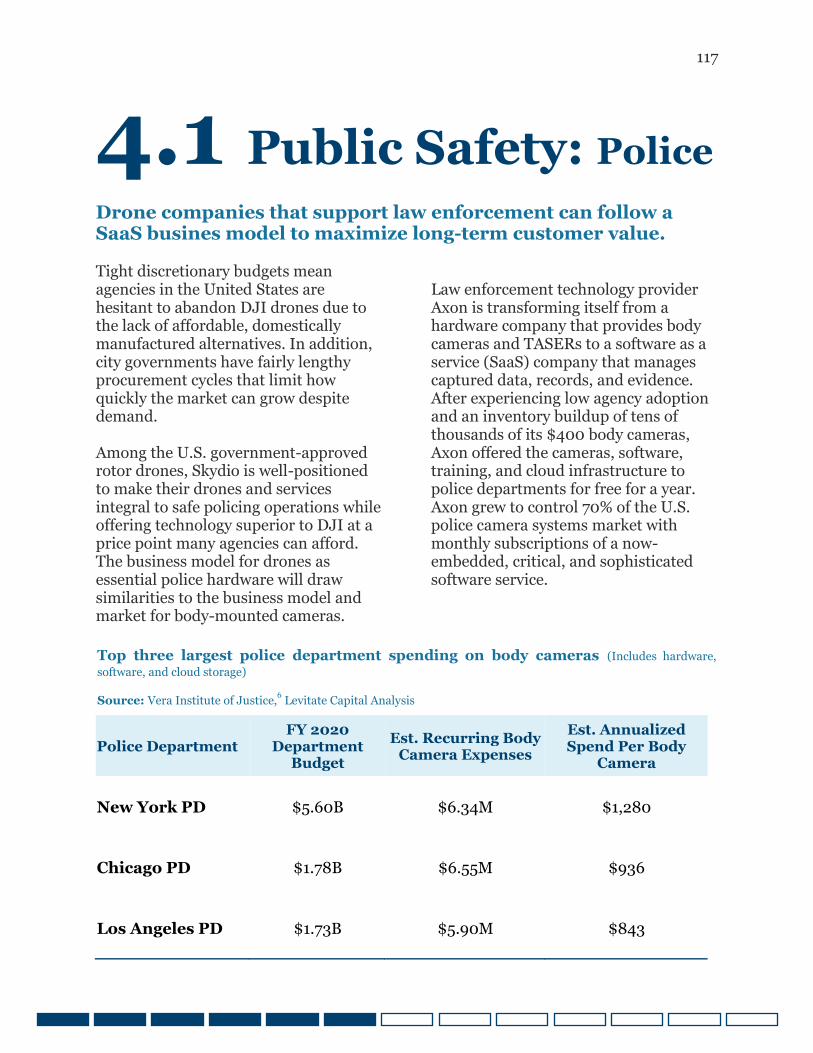
117
4.1 Public Safety: Police
Drone companies that support law enforcement can follow a SaaS busines model to maximize long-term customer value. Tight discretionary budgets mean agencies in the United States are hesitant to abandon DJI drones due to the lack of affordable, domestically manufactured alternatives. In addition, city governments have fairly lengthy procurement cycles that limit how quickly the market can grow despite demand. Among the U.S. government-approved rotor drones, Skydio is well-positioned to make their drones and services integral to safe policing operations while offering technology superior to DJI at a price point many agencies can afford. The business model for drones as essential police hardware will draw similarities to the business model and market for body-mounted cameras.
Law enforcement technology provider Axon is transforming itself from a hardware company that provides body cameras and TASERs to a software as a service (SaaS) company that manages captured data, records, and evidence. After experiencing low agency adoption and an inventory buildup of tens of thousands of its $400 body cameras, Axon offered the cameras, software, training, and cloud infrastructure to police departments for free for a year. Axon grew to control 70% of the U.S. police camera systems market with monthly subscriptions of a now-embedded, critical, and sophisticated software service.
Police Department FY 2020
Department Budget
Est. Recurring Body Camera Expenses
Est. Annualized Spend Per Body
Camera
New York PD $5.60B $6.34M $1,280
Chicago PD $1.78B $6.55M $936
Los Angeles PD $1.73B $5.90M $843
Top three largest police department spending on body cameras (Includes hardware,
software, and cloud storage)
Source: Vera Institute of Justice,6 Levitate Capital Analysis
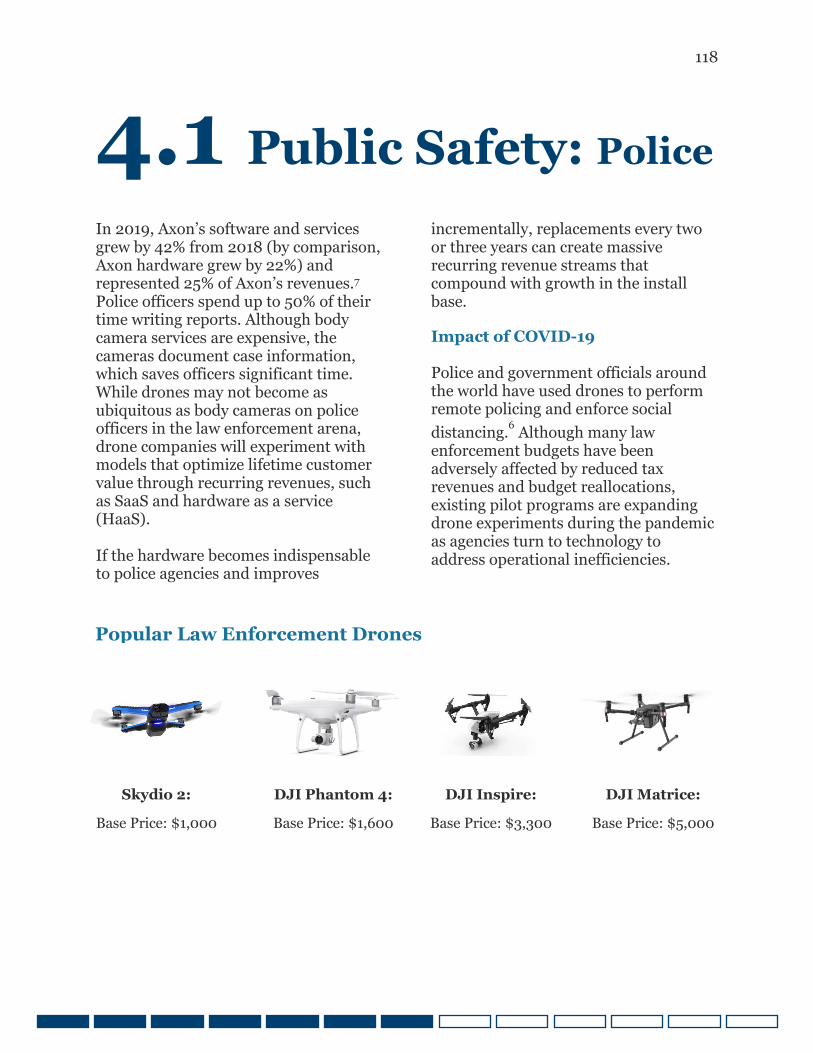
118
4.1 Public Safety: Police
In 2019, Axon’s software and services grew by 42% from 2018 (by comparison, Axon hardware grew by 22%) and represented 25% of Axon’s revenues.7 Police officers spend up to 50% of their time writing reports. Although body camera services are expensive, the cameras document case information, which saves officers significant time. While drones may not become as ubiquitous as body cameras on police officers in the law enforcement arena, drone companies will experiment with models that optimize lifetime customer value through recurring revenues, such as SaaS and hardware as a service (HaaS). If the hardware becomes indispensable to police agencies and improves
incrementally, replacements every two or three years can create massive recurring revenue streams that compound with growth in the install base.
Impact of COVID-19
Police and government officials around the world have used drones to perform remote policing and enforce social
distancing.6 Although many law
enforcement budgets have been adversely affected by reduced tax revenues and budget reallocations, existing pilot programs are expanding drone experiments during the pandemic as agencies turn to technology to address operational inefficiencies.
DJI Phantom 4:
Base Price: $1,600
DJI Inspire:
Base Price: $3,300
DJI Matrice:
Base Price: $5,000
Skydio 2:
Base Price: $1,000
Popular Law Enforcement Drones
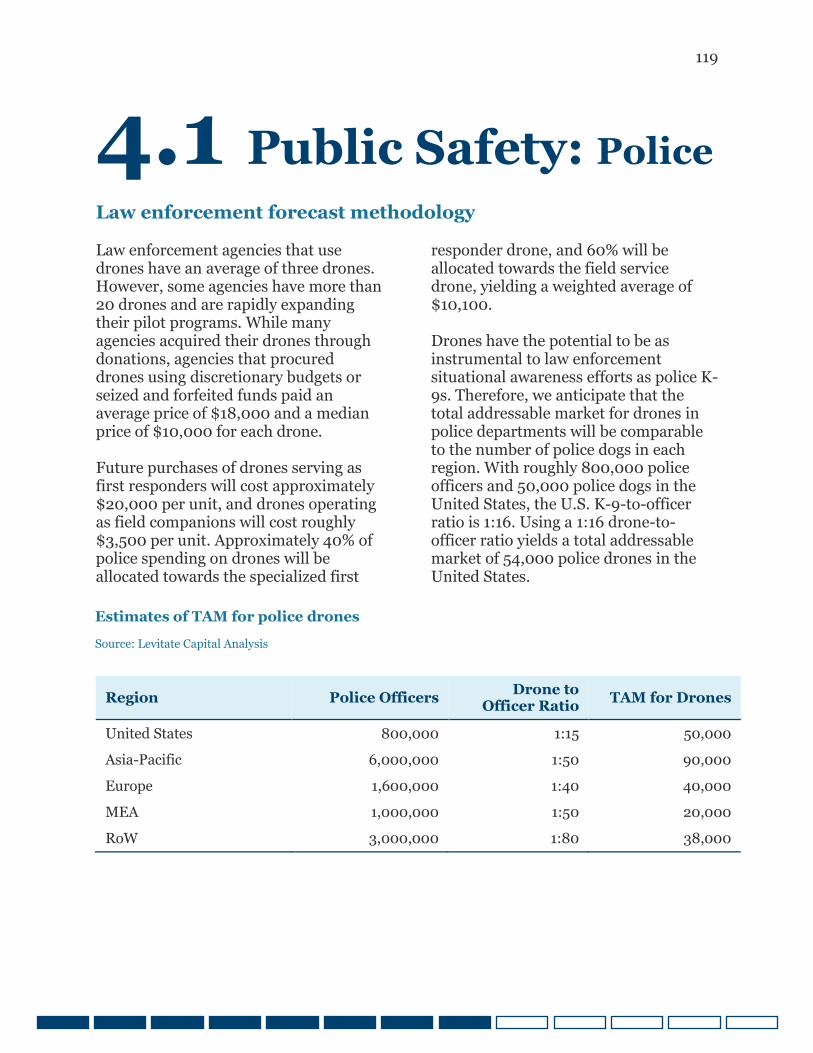
119
4.1 Public Safety: Police
Law enforcement forecast methodology Law enforcement agencies that use drones have an average of three drones. However, some agencies have more than 20 drones and are rapidly expanding their pilot programs. While many agencies acquired their drones through donations, agencies that procured drones using discretionary budgets or seized and forfeited funds paid an average price of $18,000 and a median price of $10,000 for each drone. Future purchases of drones serving as first responders will cost approximately $20,000 per unit, and drones operating as field companions will cost roughly $3,500 per unit. Approximately 40% of police spending on drones will be allocated towards the specialized first
responder drone, and 60% will be allocated towards the field service drone, yielding a weighted average of $10,100. Drones have the potential to be as instrumental to law enforcement situational awareness efforts as police K-9s. Therefore, we anticipate that the total addressable market for drones in police departments will be comparable to the number of police dogs in each region. With roughly 800,000 police officers and 50,000 police dogs in the United States, the U.S. K-9-to-officer ratio is 1:16. Using a 1:16 drone-to-officer ratio yields a total addressable market of 54,000 police drones in the United States.
Region Police Officers Drone to Officer Ratio TAM for Drones
United States 800,000 1:15 50,000 Asia-Pacific 6,000,000 1:50 90,000 Europe 1,600,000 1:40 40,000 MEA 1,000,000 1:50 20,000 RoW 3,000,000 1:80 38,000
Estimates of TAM for police drones
Source: Levitate Capital Analysis
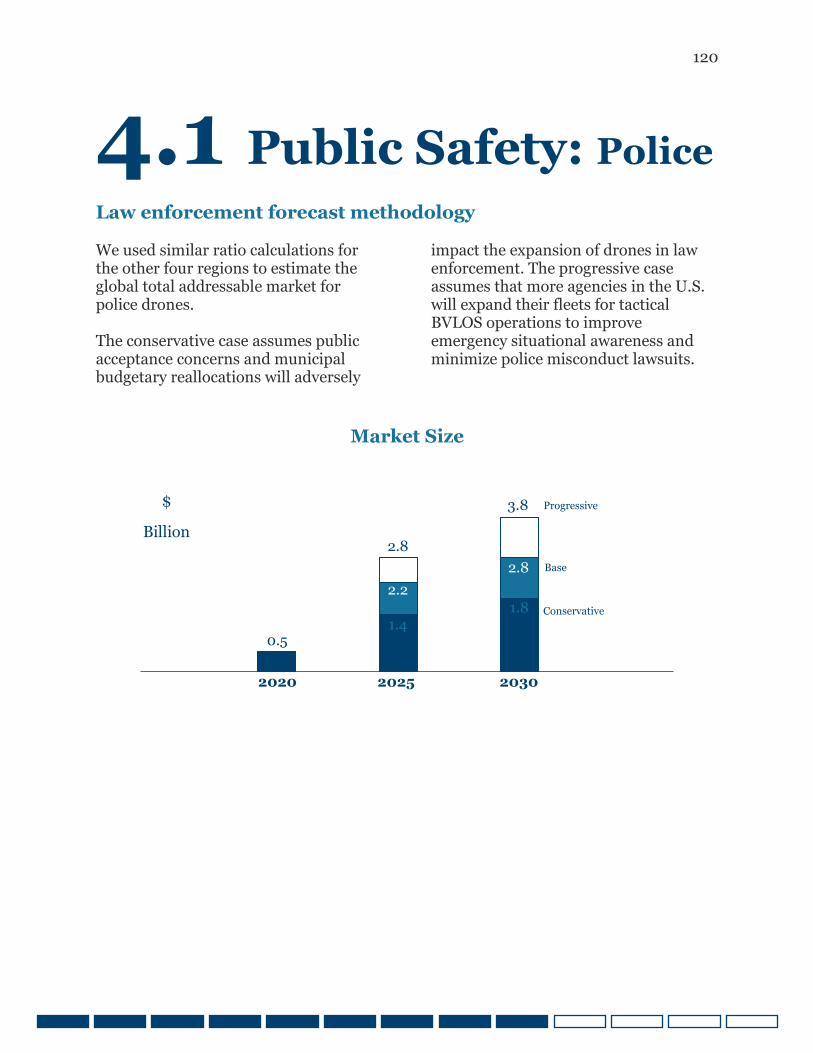
120
4.1 Public Safety: Police
Law enforcement forecast methodology We used similar ratio calculations for the other four regions to estimate the global total addressable market for police drones. The conservative case assumes public acceptance concerns and municipal budgetary reallocations will adversely
impact the expansion of drones in law enforcement. The progressive case assumes that more agencies in the U.S. will expand their fleets for tactical BVLOS operations to improve emergency situational awareness and minimize police misconduct lawsuits.
Market Size
0.5 1.4
1.8 2.2
2.8
2.8
3.8 Progressive
Base
Conservative
2020 2025 2030
$
Billion
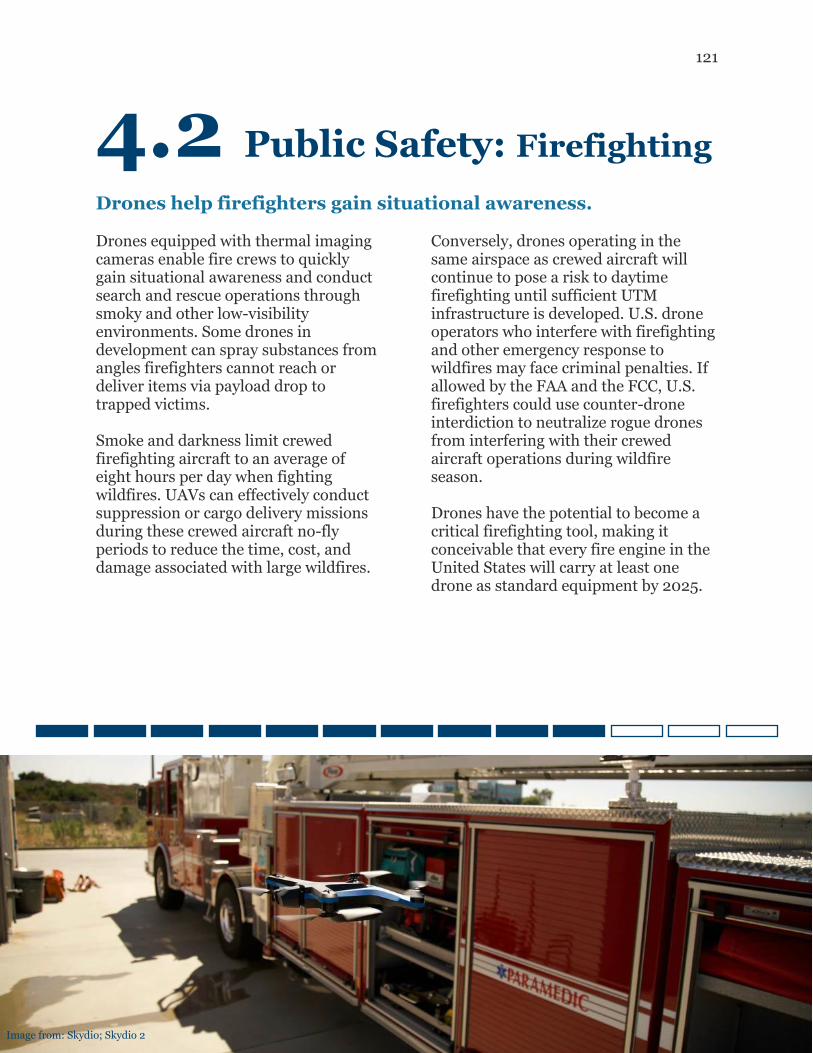
121
4.2 Public Safety: Firefighting
Drones help firefighters gain situational awareness. Drones equipped with thermal imaging cameras enable fire crews to quickly gain situational awareness and conduct search and rescue operations through smoky and other low-visibility environments. Some drones in development can spray substances from angles firefighters cannot reach or deliver items via payload drop to trapped victims. Smoke and darkness limit crewed firefighting aircraft to an average of eight hours per day when fighting wildfires. UAVs can effectively conduct suppression or cargo delivery missions during these crewed aircraft no-fly periods to reduce the time, cost, and damage associated with large wildfires.
Conversely, drones operating in the same airspace as crewed aircraft will continue to pose a risk to daytime firefighting until sufficient UTM infrastructure is developed. U.S. drone operators who interfere with firefighting and other emergency response to wildfires may face criminal penalties. If allowed by the FAA and the FCC, U.S. firefighters could use counter-drone interdiction to neutralize rogue drones from interfering with their crewed aircraft operations during wildfire season. Drones have the potential to become a critical firefighting tool, making it conceivable that every fire engine in the United States will carry at least one drone as standard equipment by 2025.
Image from: Skydio; Skydio 2
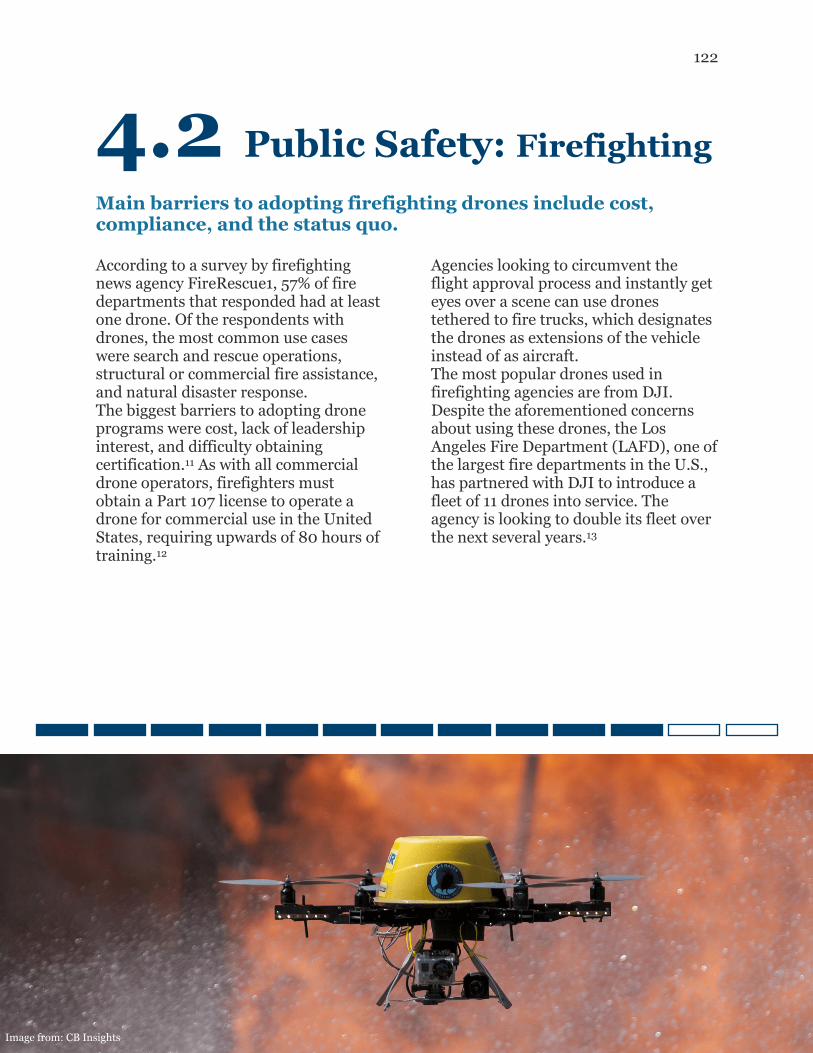
122
4.2 Public Safety: Firefighting
Main barriers to adopting firefighting drones include cost, compliance, and the status quo. According to a survey by firefighting news agency FireRescue1, 57% of fire departments that responded had at least one drone. Of the respondents with drones, the most common use cases were search and rescue operations, structural or commercial fire assistance, and natural disaster response. The biggest barriers to adopting drone programs were cost, lack of leadership interest, and difficulty obtaining certification.11 As with all commercial drone operators, firefighters must obtain a Part 107 license to operate a drone for commercial use in the United States, requiring upwards of 80 hours of training.12
Agencies looking to circumvent the flight approval process and instantly get eyes over a scene can use drones tethered to fire trucks, which designates the drones as extensions of the vehicle instead of as aircraft. The most popular drones used in firefighting agencies are from DJI. Despite the aforementioned concerns about using these drones, the Los Angeles Fire Department (LAFD), one of the largest fire departments in the U.S., has partnered with DJI to introduce a fleet of 11 drones into service. The agency is looking to double its fleet over the next several years.13
Image from: CB Insights
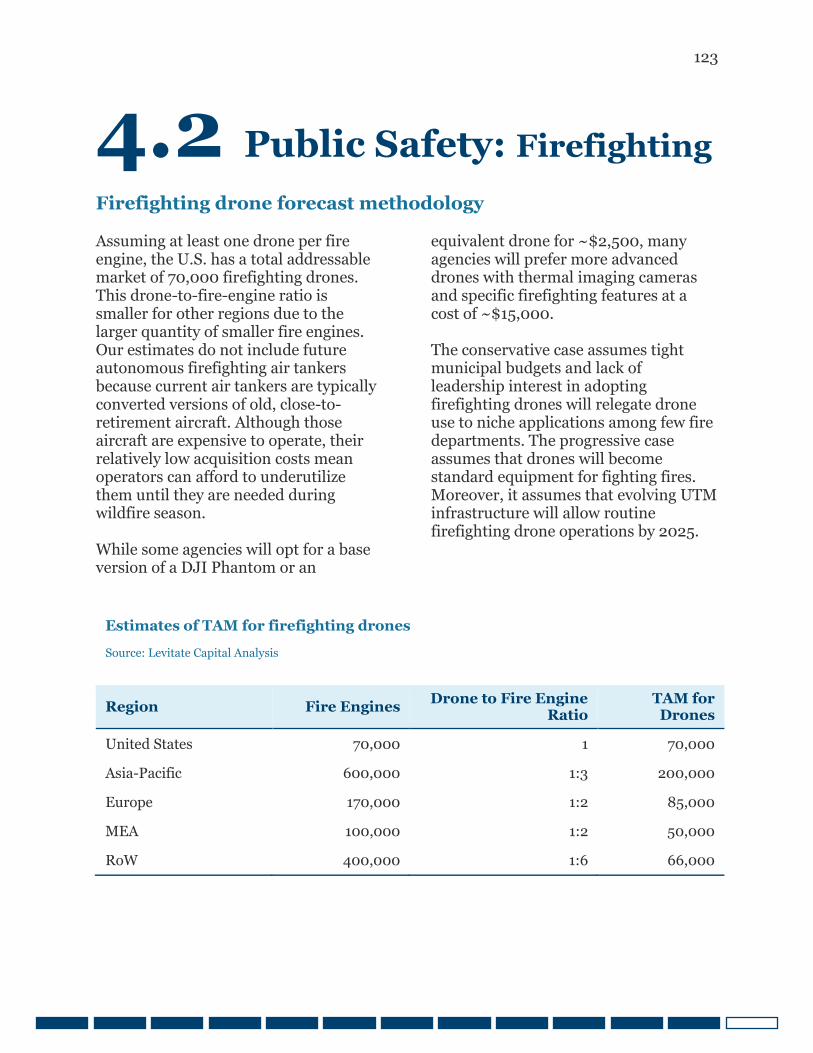
123
4.2 Public Safety: Firefighting
Firefighting drone forecast methodology Assuming at least one drone per fire engine, the U.S. has a total addressable market of 70,000 firefighting drones. This drone-to-fire-engine ratio is smaller for other regions due to the larger quantity of smaller fire engines. Our estimates do not include future autonomous firefighting air tankers because current air tankers are typically converted versions of old, close-to-retirement aircraft. Although those aircraft are expensive to operate, their relatively low acquisition costs mean operators can afford to underutilize them until they are needed during wildfire season. While some agencies will opt for a base version of a DJI Phantom or an
equivalent drone for ~$2,500, many agencies will prefer more advanced drones with thermal imaging cameras and specific firefighting features at a cost of ~$15,000. The conservative case assumes tight municipal budgets and lack of leadership interest in adopting firefighting drones will relegate drone use to niche applications among few fire departments. The progressive case assumes that drones will become standard equipment for fighting fires. Moreover, it assumes that evolving UTM infrastructure will allow routine firefighting drone operations by 2025.
Region Fire Engines Drone to Fire Engine Ratio
TAM for Drones
United States 70,000 1 70,000
Asia-Pacific 600,000 1:3 200,000
Europe 170,000 1:2 85,000
MEA 100,000 1:2 50,000
RoW 400,000 1:6 66,000
Estimates of TAM for firefighting drones
Source: Levitate Capital Analysis
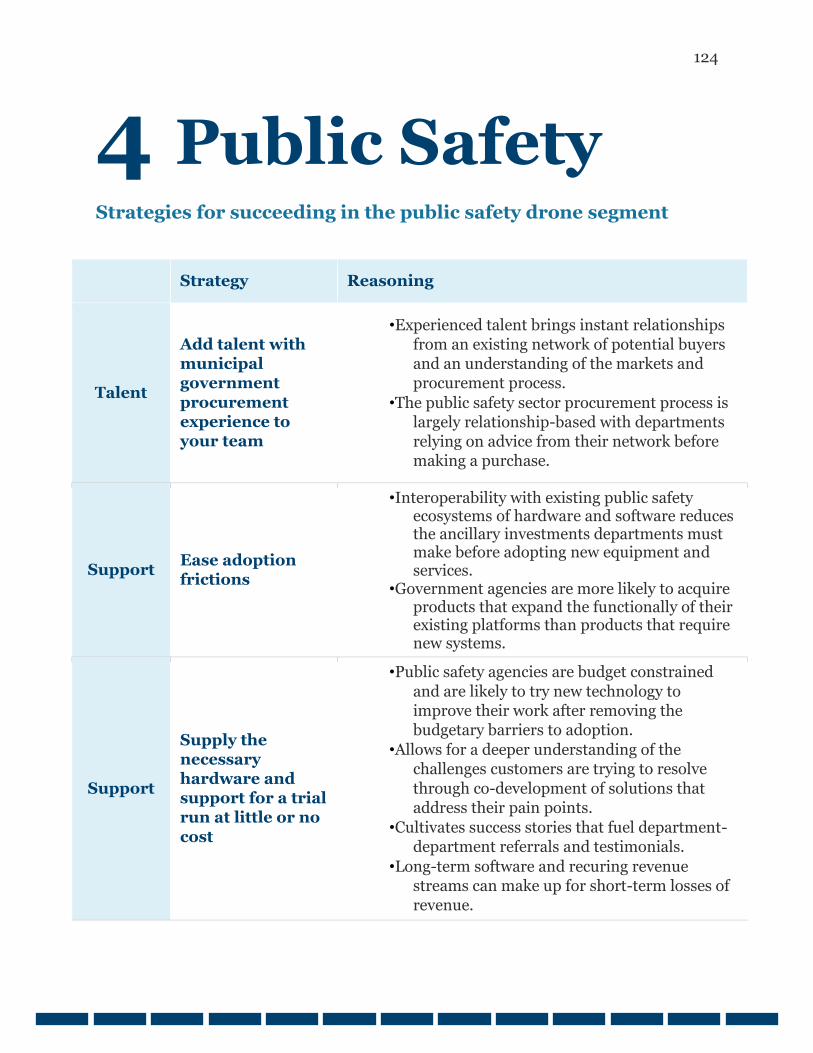
124
4 Public Safety
Strategies for succeeding in the public safety drone segment
Strategy Reasoning
Talent
Add talent with municipal government
procurement experience to your team
• Experienced talent brings instant relationships from an existing network of potential buyers and an understanding of the markets and procurement process.
• The public safety sector procurement process is largely relationship-based with departments relying on advice from their network before making a purchase.
Support Ease adoption frictions
• Interoperability with existing public safety ecosystems of hardware and software reduces the ancillary investments departments must make before adopting new equipment and services.
• Government agencies are more likely to acquire products that expand the functionally of their existing platforms than products that require new systems.
Support
Supply the necessary hardware and support for a trial run at little or no
cost
• Public safety agencies are budget constrained
and are likely to try new technology to improve their work after removing the budgetary barriers to adoption.
• Allows for a deeper understanding of the challenges customers are trying to resolve
through co-development of solutions that address their pain points.
• Cultivates success stories that fuel department-department referrals and testimonials.
• Long-term software and recuring revenue streams can make up for short-term losses of revenue.
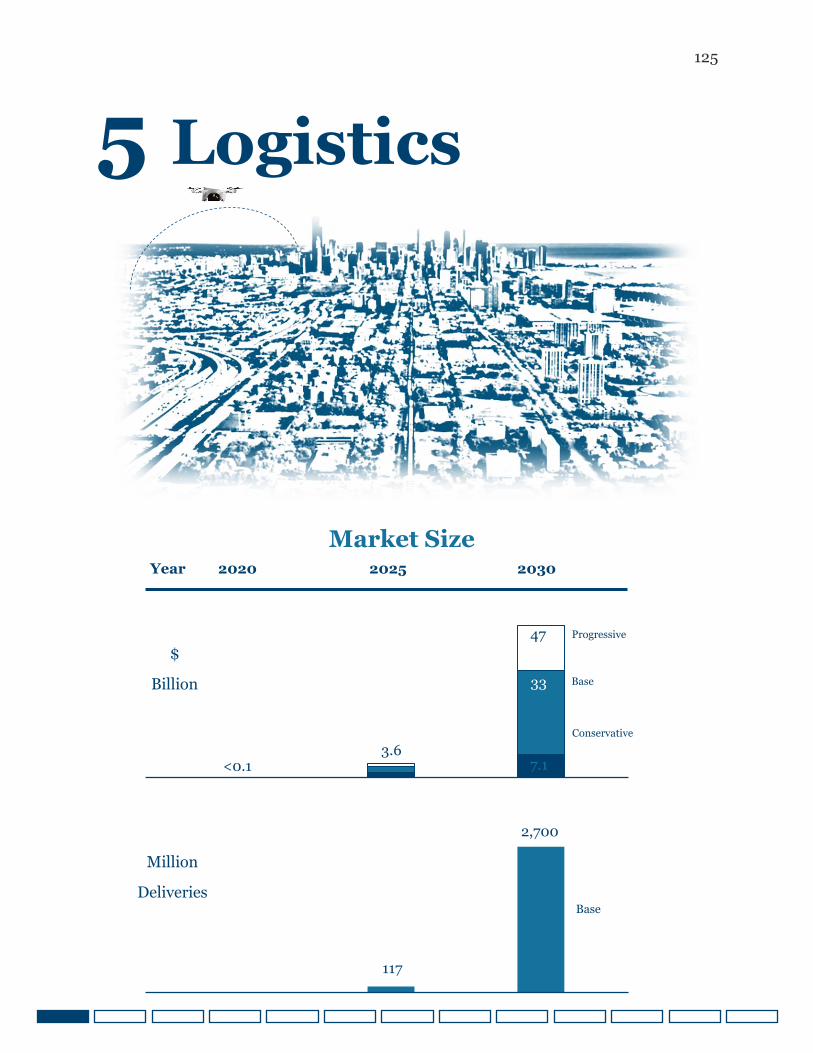
125
5 Logistics
117
2,700
Market Size
Year 2020 2025 2030
Million
Deliveries
8.1
7.1
6.0
33
3.6
47
<0.1
Progressive
Base
Conservative
$
Billion
Base
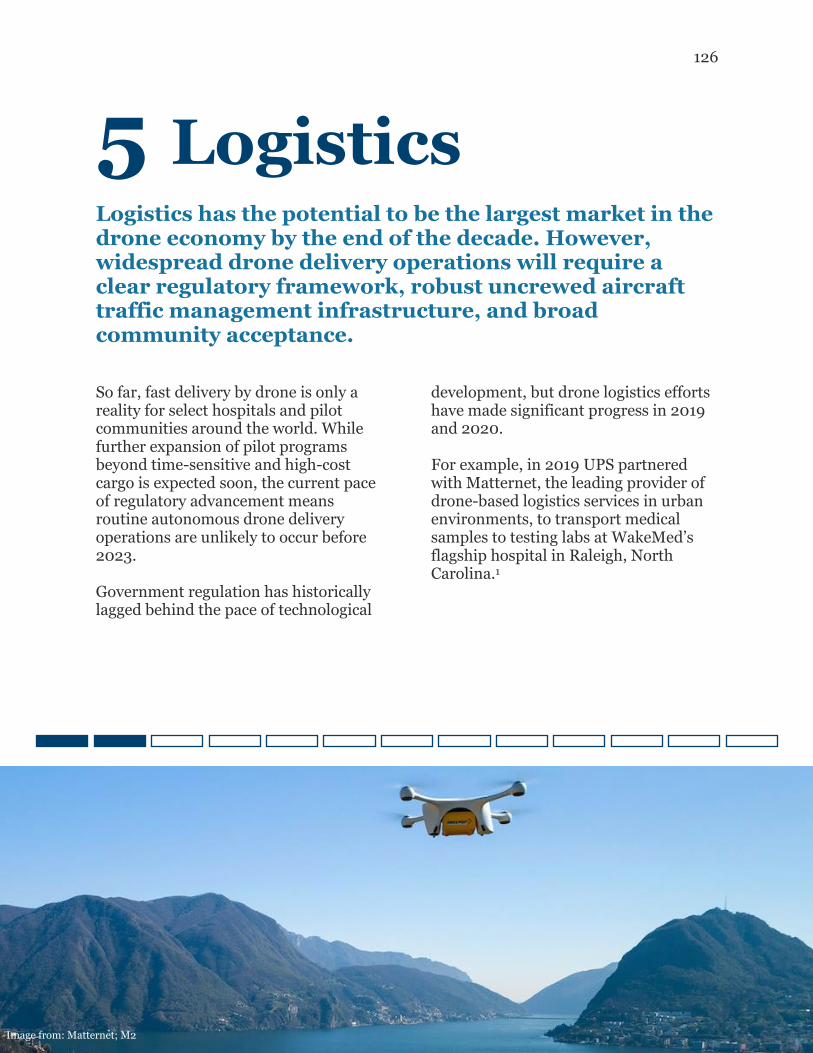
126
5 Logistics
Logistics has the potential to be the largest market in the drone economy by the end of the decade. However, widespread drone delivery operations will require a clear regulatory framework, robust uncrewed aircraft traffic management infrastructure, and broad community acceptance.
So far, fast delivery by drone is only a reality for select hospitals and pilot communities around the world. While further expansion of pilot programs beyond time-sensitive and high-cost cargo is expected soon, the current pace of regulatory advancement means routine autonomous drone delivery operations are unlikely to occur before 2023. Government regulation has historically lagged behind the pace of technological
development, but drone logistics efforts have made significant progress in 2019 and 2020. For example, in 2019 UPS partnered with Matternet, the leading provider of drone-based logistics services in urban environments, to transport medical samples to testing labs at WakeMed’s flagship hospital in Raleigh, North Carolina.1
Image from: Matternet; M2
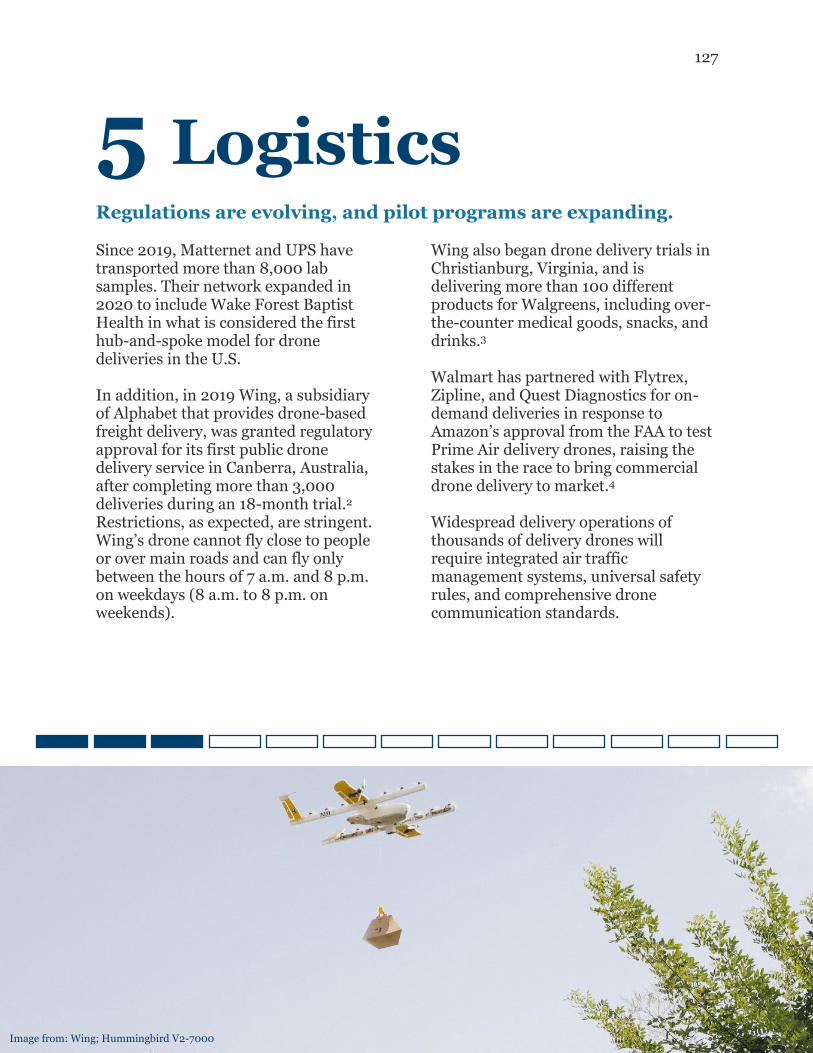
127
5 Logistics
Regulations are evolving, and pilot programs are expanding. Since 2019, Matternet and UPS have transported more than 8,000 lab samples. Their network expanded in 2020 to include Wake Forest Baptist Health in what is considered the first hub-and-spoke model for drone deliveries in the U.S. In addition, in 2019 Wing, a subsidiary of Alphabet that provides drone-based freight delivery, was granted regulatory approval for its first public drone delivery service in Canberra, Australia, after completing more than 3,000 deliveries during an 18-month trial.2 Restrictions, as expected, are stringent. Wing’s drone cannot fly close to people or over main roads and can fly only between the hours of 7 a.m. and 8 p.m. on weekdays (8 a.m. to 8 p.m. on weekends).
Wing also began drone delivery trials in Christianburg, Virginia, and is delivering more than 100 different products for Walgreens, including over-the-counter medical goods, snacks, and drinks.3 Walmart has partnered with Flytrex, Zipline, and Quest Diagnostics for on-demand deliveries in response to Amazon’s approval from the FAA to test Prime Air delivery drones, raising the stakes in the race to bring commercial drone delivery to market.4 Widespread delivery operations of thousands of delivery drones will require integrated air traffic management systems, universal safety rules, and comprehensive drone communication standards.
Image from: Wing; Hummingbird V2-7000
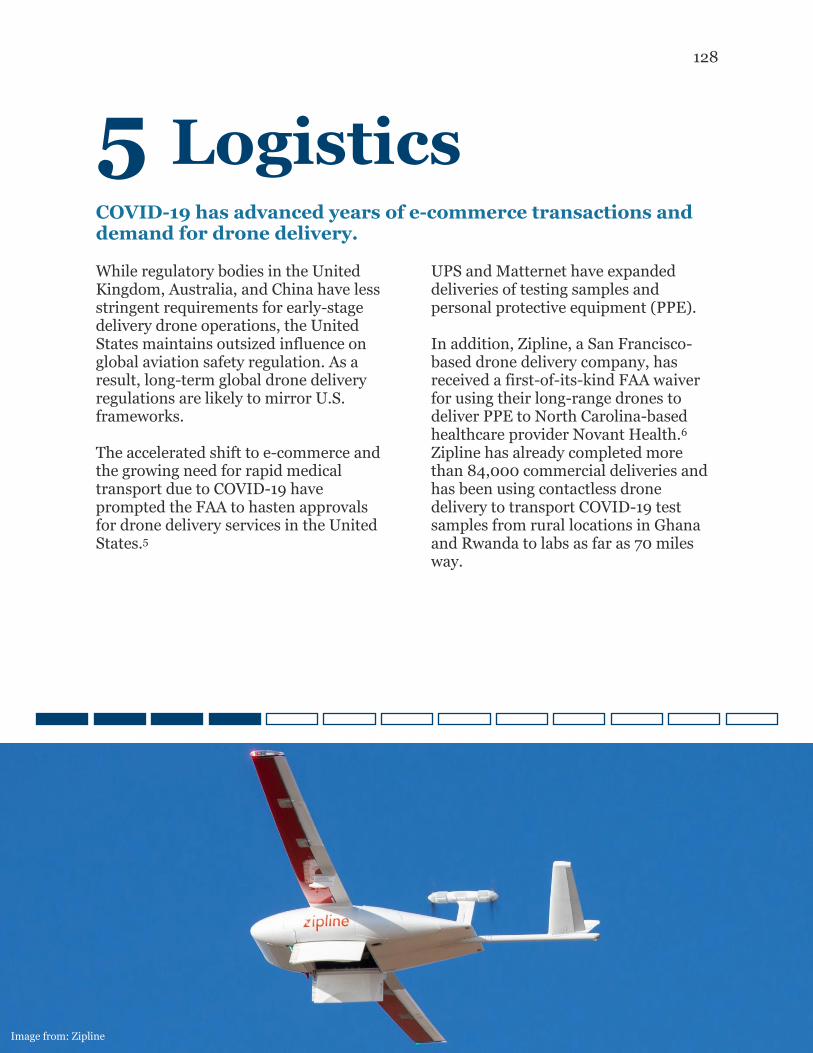
128
5 Logistics
COVID-19 has advanced years of e-commerce transactions and demand for drone delivery. While regulatory bodies in the United Kingdom, Australia, and China have less stringent requirements for early-stage delivery drone operations, the United States maintains outsized influence on global aviation safety regulation. As a result, long-term global drone delivery regulations are likely to mirror U.S. frameworks. The accelerated shift to e-commerce and the growing need for rapid medical transport due to COVID-19 have prompted the FAA to hasten approvals for drone delivery services in the United States.5
UPS and Matternet have expanded deliveries of testing samples and personal protective equipment (PPE). In addition, Zipline, a San Francisco-based drone delivery company, has received a first-of-its-kind FAA waiver for using their long-range drones to deliver PPE to North Carolina-based healthcare provider Novant Health.6 Zipline has already completed more than 84,000 commercial deliveries and has been using contactless drone delivery to transport COVID-19 test samples from rural locations in Ghana and Rwanda to labs as far as 70 miles way.
Image from: Zipline
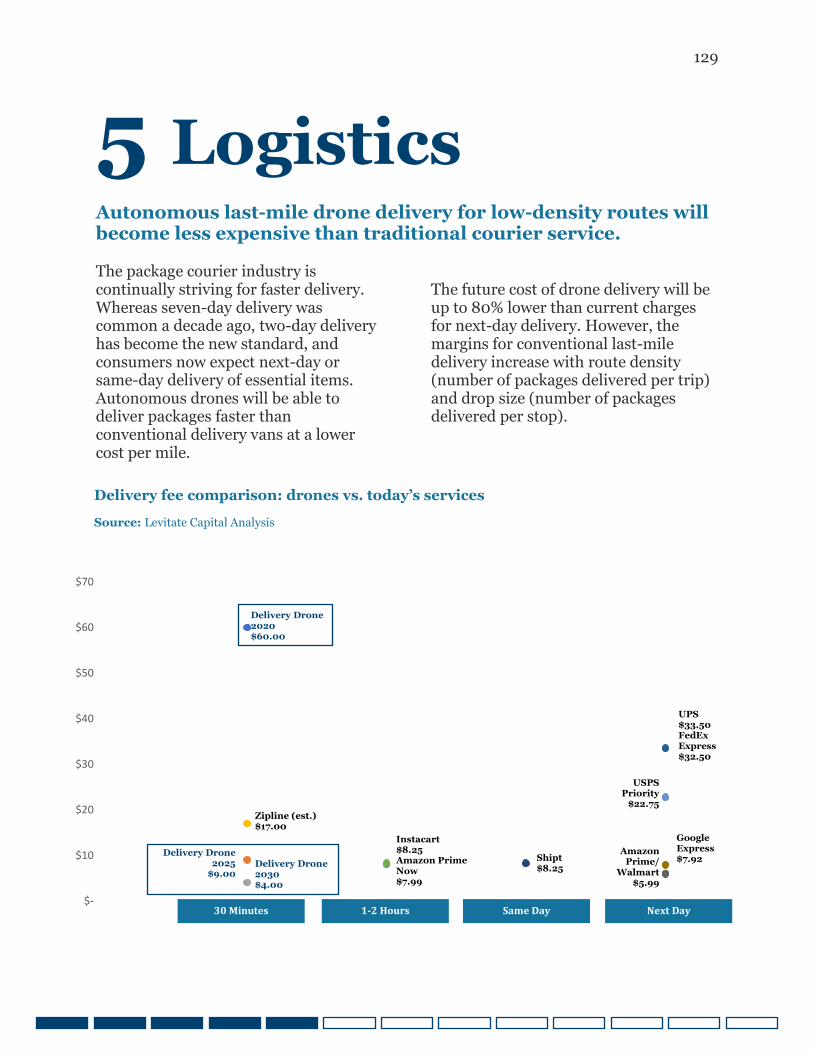
129
5 Logistics
Autonomous last-mile drone delivery for low-density routes will become less expensive than traditional courier service. The package courier industry is continually striving for faster delivery. Whereas seven-day delivery was common a decade ago, two-day delivery has become the new standard, and consumers now expect next-day or same-day delivery of essential items. Autonomous drones will be able to deliver packages faster than conventional delivery vans at a lower cost per mile.
The future cost of drone delivery will be up to 80% lower than current charges for next-day delivery. However, the margins for conventional last-mile delivery increase with route density (number of packages delivered per trip) and drop size (number of packages delivered per stop).
Delivery fee comparison: drones vs. today’s services
Source: Levitate Capital Analysis
$-
$10
$20
$30
$40
$50
$60
$70
30 Minutes 1-2 Hours Same Day Next Day
Delivery Drone 2020 $60.00
Zipline (est.) $17.00
Delivery Drone 2025
$9.00 Delivery Drone 2030 $4.00
Instacart $8.25 Amazon Prime Now $7.99
Shipt $8.25
UPS $33.50 FedEx Express $32.50
Google Express $7.92
USPS Priority
$22.75
Amazon Prime/
Walmart $5.99
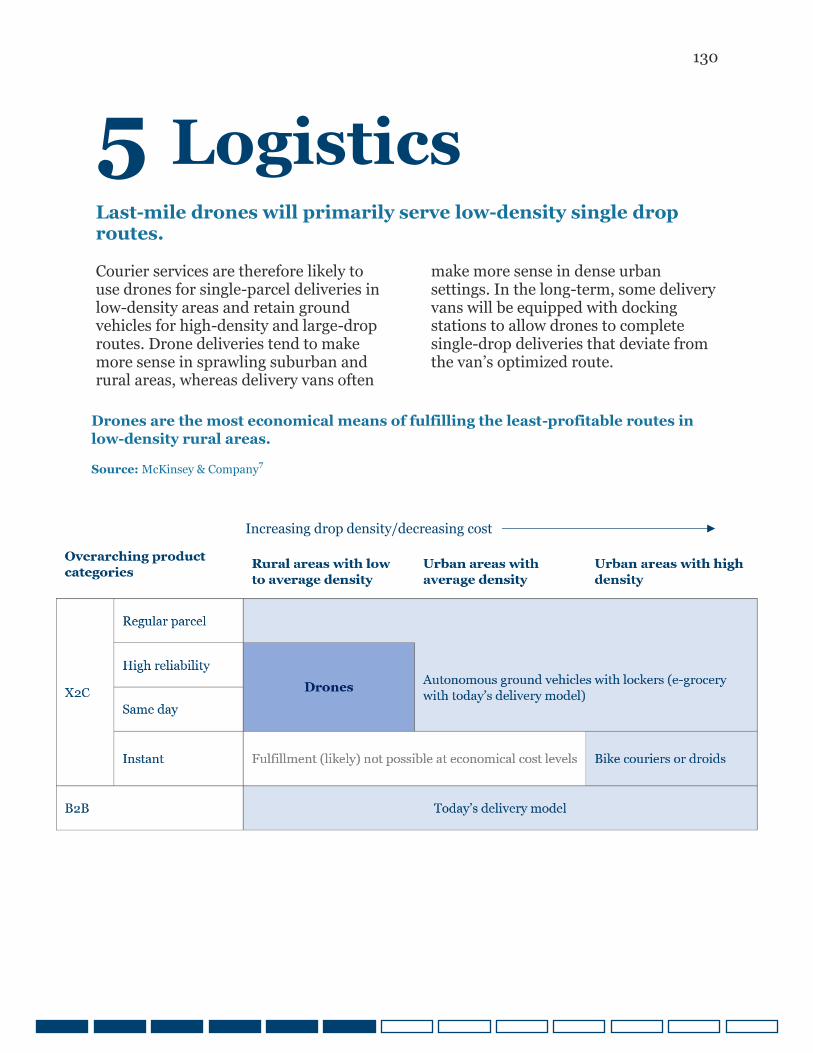
130
5 Logistics
Last-mile drones will primarily serve low-density single drop routes. Courier services are therefore likely to use drones for single-parcel deliveries in low-density areas and retain ground vehicles for high-density and large-drop routes. Drone deliveries tend to make more sense in sprawling suburban and rural areas, whereas delivery vans often
make more sense in dense urban settings. In the long-term, some delivery vans will be equipped with docking stations to allow drones to complete single-drop deliveries that deviate from the van’s optimized route.
Drones are the most economical means of fulfilling the least-profitable routes in
low-density rural areas.
Source: McKinsey & Company7
Increasing drop density/decreasing cost
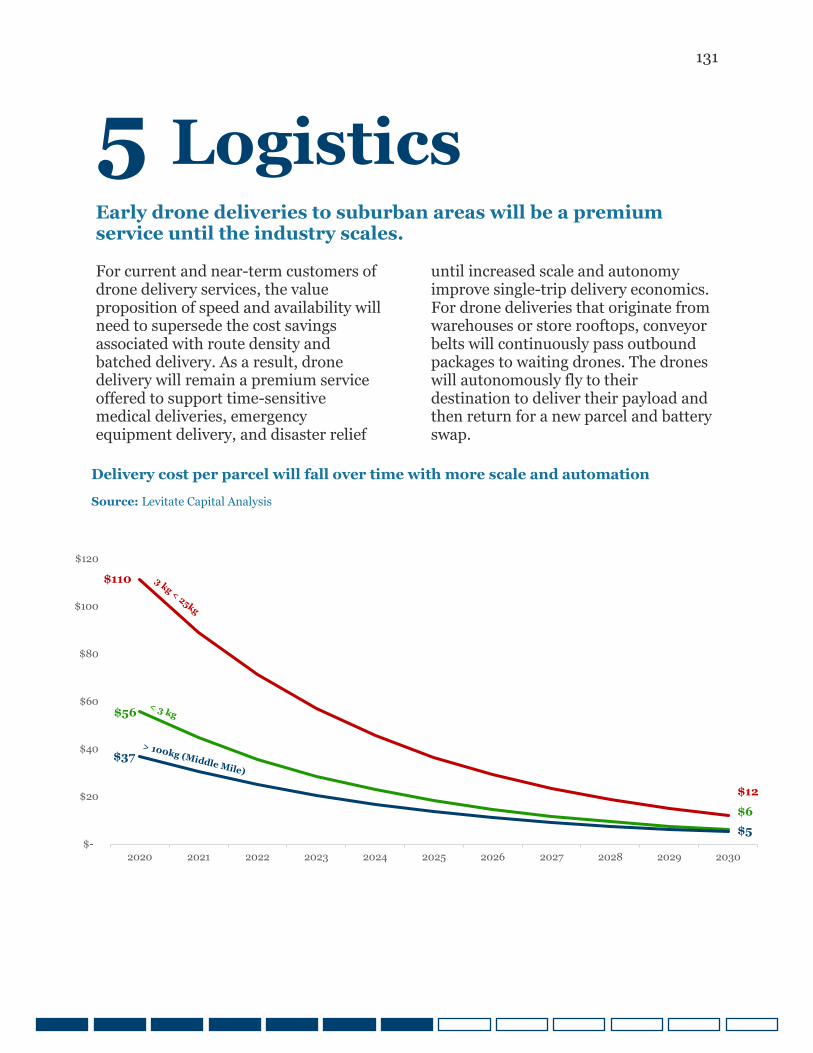
131
5 Logistics
Early drone deliveries to suburban areas will be a premium service until the industry scales. For current and near-term customers of drone delivery services, the value proposition of speed and availability will need to supersede the cost savings associated with route density and batched delivery. As a result, drone delivery will remain a premium service offered to support time-sensitive medical deliveries, emergency equipment delivery, and disaster relief
until increased scale and autonomy improve single-trip delivery economics. For drone deliveries that originate from warehouses or store rooftops, conveyor belts will continuously pass outbound packages to waiting drones. The drones will autonomously fly to their destination to deliver their payload and then return for a new parcel and battery swap.
Delivery cost per parcel will fall over time with more scale and automation
Source: Levitate Capital Analysis
$-
$20
$40
$60
$80
$100
$120
2020 2021 2022 2023 2024 2025 2026 2027 2028 2029 2030
$12
$6 $5
$110
$56
$37
132
5 Logistics
Every link in the shipping value chain must be examined for efficiency opportunities.
Because shipping is a price sensitive
business, couriers that move millions of
packages per day examine every link in
the logistics supply chain, including the
often-overlooked middle mile journey,
to minimize costs per parcel.
Middle mile logistics refers to the
transport of goods from ports to
distribution centers, between
distribution centers, and from
distribution centers to stores.
Whereas last mile delivery drones
compete with courier-owned delivery
vans and crowdsourced delivery models,
middle mile drones will compete with
semi-trucks and intermodal freight
networks. Middle mile operators are
investing in electric and autonomous
trucks to lower their cost and emissions,
but future ground vehicles will still be
subjected to the limitations of ground
infrastructure.
Generally, the cost of moving freight is
inversely proportional to the amount of
freight moved simultaneously.
Consequently, ships and trains offer the
lowest cost per ton-mile because they
distribute variable costs over large
tonnage of goods and long distances
during each trip. As parcels are
transferred to smaller vehicles, the per-
mile cost of transportation typically
increases –with the most expensive
being a single vehicle carrying a single
parcel.
As a result, drones in the near term are
likely to be more expensive per kg-mile
than fully loaded trucks. However,
middle mile drones can reduce the hours
of transportation and handoff times
associated with trucks and other ground
vehicles and transfer the economic value
of time savings to the sender and
receiver.
Regions that are far from metropolitan
hubs are typically the least profitable
areas to deliver goods and require
networks of cargo feeder planes and
freight brokers to move parcels on
behalf of larger couriers. Because hub
and spoke operations using middle mile
drones can circumvent airport
infrastructure and reduce the number of
handoffs necessary to ship parcels to
remote regions, middle mile drones
provide remote locations with access to
fast air cargo delivery service.
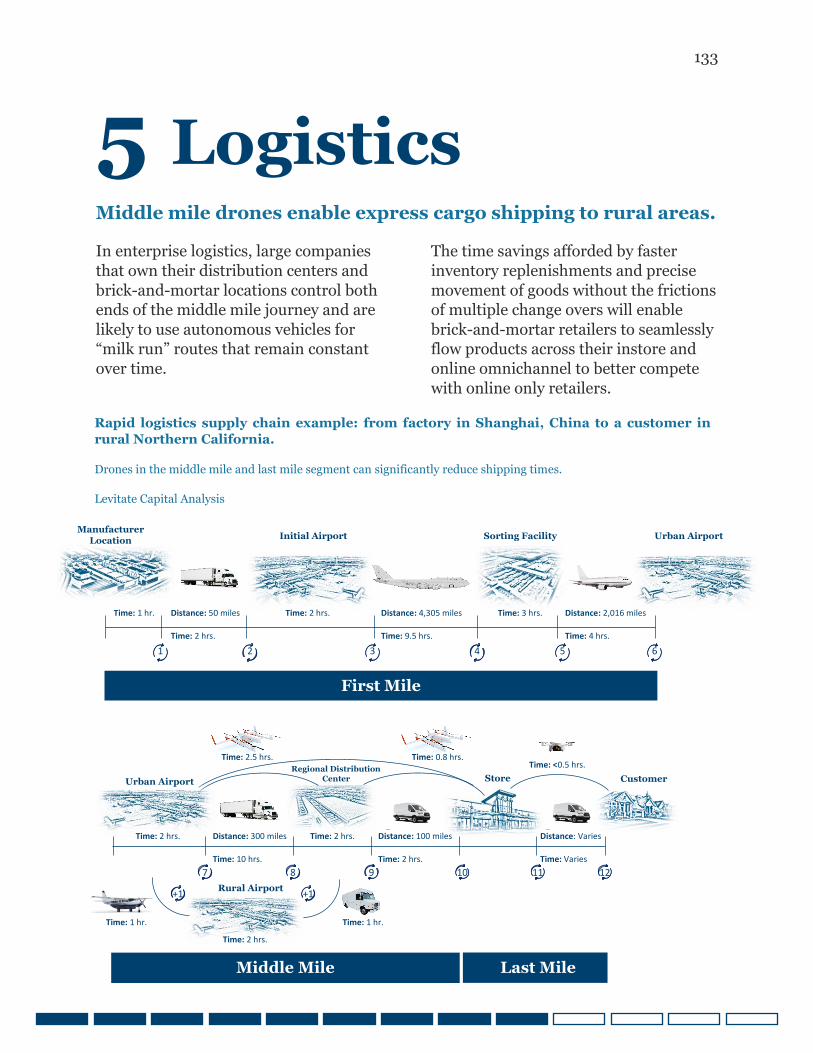
133
Manufacturer Location Initial Airport Sorting Facility
1
First Mile
2 3 4 5 6
Distance: 50 miles
Time: 2 hrs.
Distance: 4,305 miles
Time: 9.5 hrs.
Distance: 2,016 miles
Time: 4 hrs.
Time: 1 hr. Time: 2 hrs. Time: 3 hrs.
Urban Airport
5 Logistics
Middle mile drones enable express cargo shipping to rural areas.
In enterprise logistics, large companies
that own their distribution centers and
brick-and-mortar locations control both
ends of the middle mile journey and are
likely to use autonomous vehicles for
“milk run” routes that remain constant
over time.
The time savings afforded by faster
inventory replenishments and precise
movement of goods without the frictions
of multiple change overs will enable
brick-and-mortar retailers to seamlessly
flow products across their instore and
online omnichannel to better compete
with online only retailers.
Last Mile
Regional Distribution Center Store Customer
Middle Mile
7 8 9 10 11 12
Distance: 300 miles
Time: 10 hrs.
Distance: 100 miles
Time: 2 hrs.
Distance: Varies
Time: Varies
Time: 2 hrs. Time: 2 hrs.
Rural Airport
Time: 1 hr. Time: 1 hr. Time: 2 hrs.
+1 +1
Urban Airport
Time: 2.5 hrs. Time: 0.8 hrs. Time: <0.5 hrs.
Rapid logistics supply chain example: from factory in Shanghai, China to a customer in
rural Northern California.
Drones in the middle mile and last mile segment can significantly reduce shipping times.
Levitate Capital Analysis
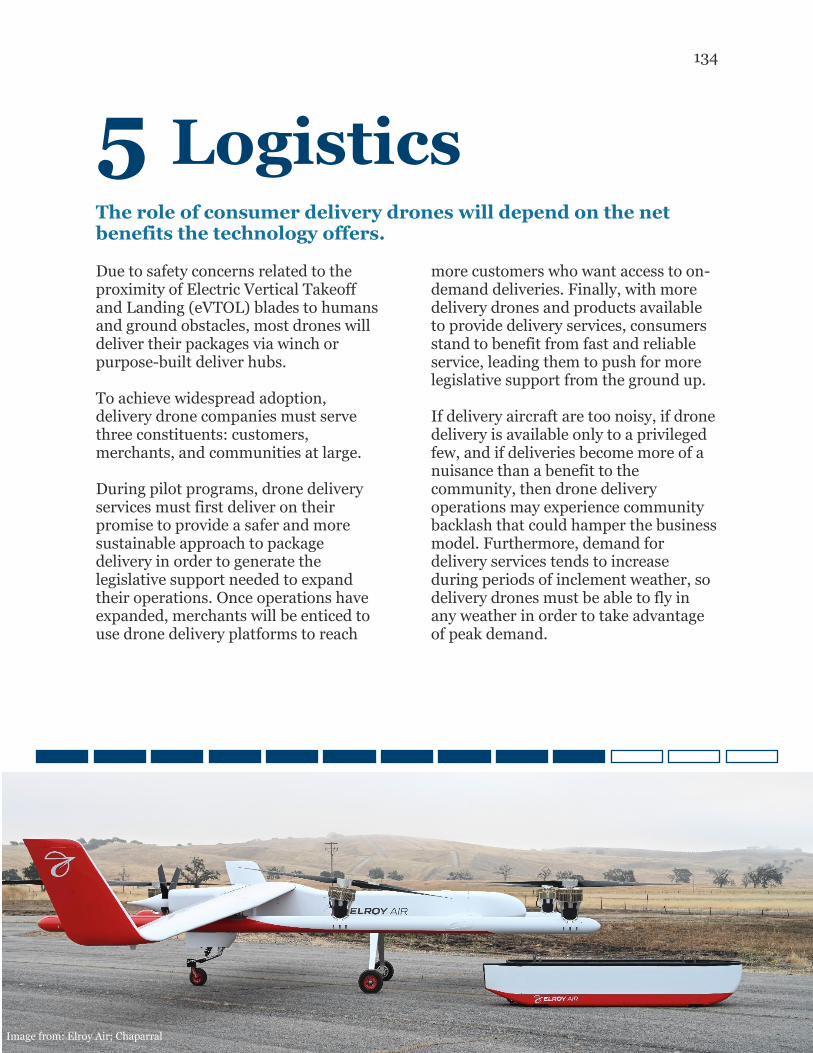
134
5 Logistics
The role of consumer delivery drones will depend on the net benefits the technology offers. Due to safety concerns related to the proximity of Electric Vertical Takeoff and Landing (eVTOL) blades to humans and ground obstacles, most drones will deliver their packages via winch or purpose-built deliver hubs. To achieve widespread adoption, delivery drone companies must serve three constituents: customers, merchants, and communities at large. During pilot programs, drone delivery services must first deliver on their promise to provide a safer and more sustainable approach to package delivery in order to generate the legislative support needed to expand their operations. Once operations have expanded, merchants will be enticed to use drone delivery platforms to reach
more customers who want access to on-demand deliveries. Finally, with more delivery drones and products available to provide delivery services, consumers stand to benefit from fast and reliable service, leading them to push for more legislative support from the ground up. If delivery aircraft are too noisy, if drone delivery is available only to a privileged few, and if deliveries become more of a nuisance than a benefit to the community, then drone delivery operations may experience community backlash that could hamper the business model. Furthermore, demand for delivery services tends to increase during periods of inclement weather, so delivery drones must be able to fly in any weather in order to take advantage of peak demand.
Image from: Elroy Air; Chaparral
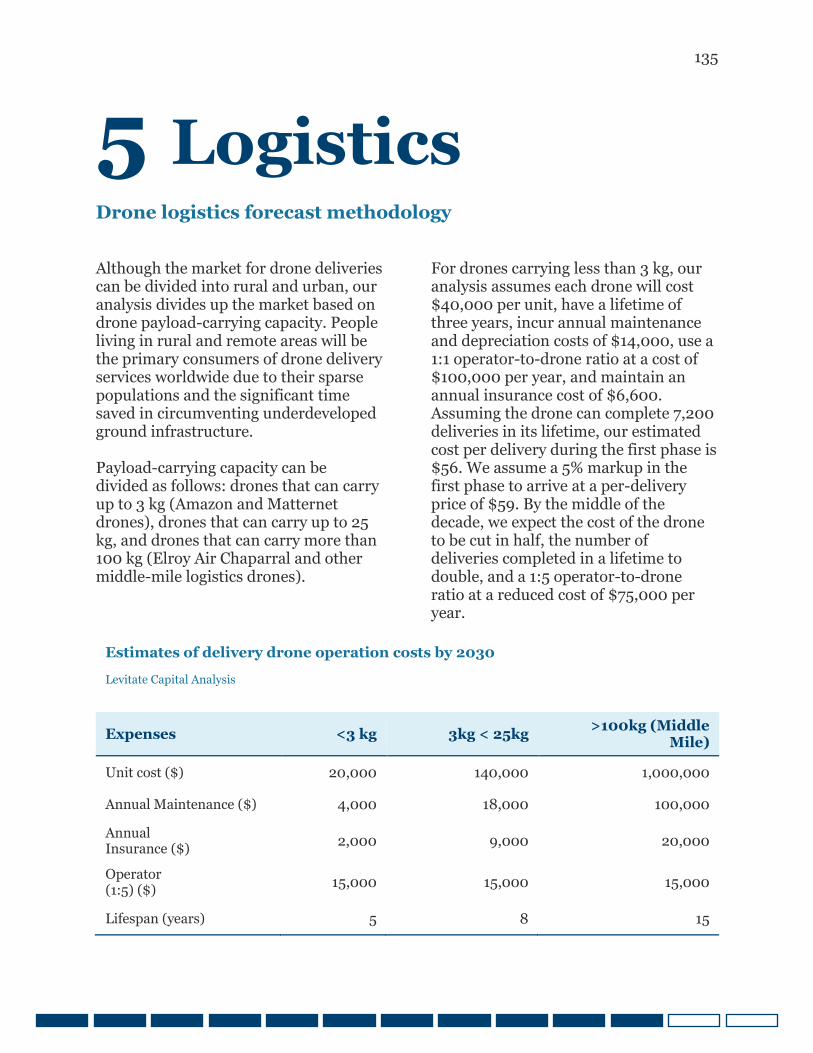
135
5 Logistics
Drone logistics forecast methodology Although the market for drone deliveries can be divided into rural and urban, our analysis divides up the market based on drone payload-carrying capacity. People living in rural and remote areas will be the primary consumers of drone delivery services worldwide due to their sparse populations and the significant time saved in circumventing underdeveloped ground infrastructure. Payload-carrying capacity can be divided as follows: drones that can carry up to 3 kg (Amazon and Matternet drones), drones that can carry up to 25 kg, and drones that can carry more than 100 kg (Elroy Air Chaparral and other middle-mile logistics drones).
For drones carrying less than 3 kg, our analysis assumes each drone will cost $40,000 per unit, have a lifetime of three years, incur annual maintenance and depreciation costs of $14,000, use a 1:1 operator-to-drone ratio at a cost of $100,000 per year, and maintain an annual insurance cost of $6,600. Assuming the drone can complete 7,200 deliveries in its lifetime, our estimated cost per delivery during the first phase is $56. We assume a 5% markup in the first phase to arrive at a per-delivery price of $59. By the middle of the decade, we expect the cost of the drone to be cut in half, the number of deliveries completed in a lifetime to double, and a 1:5 operator-to-drone ratio at a reduced cost of $75,000 per year.
Expenses <3 kg 3kg < 25kg >100kg (Middle Mile)
Unit cost ($) 20,000 140,000 1,000,000
Annual Maintenance ($) 4,000 18,000 100,000
Annual Insurance ($) 2,000 9,000 20,000
Operator (1:5) ($) 15,000 15,000 15,000
Lifespan (years) 5 8 15
Estimates of delivery drone operation costs by 2030
Levitate Capital Analysis
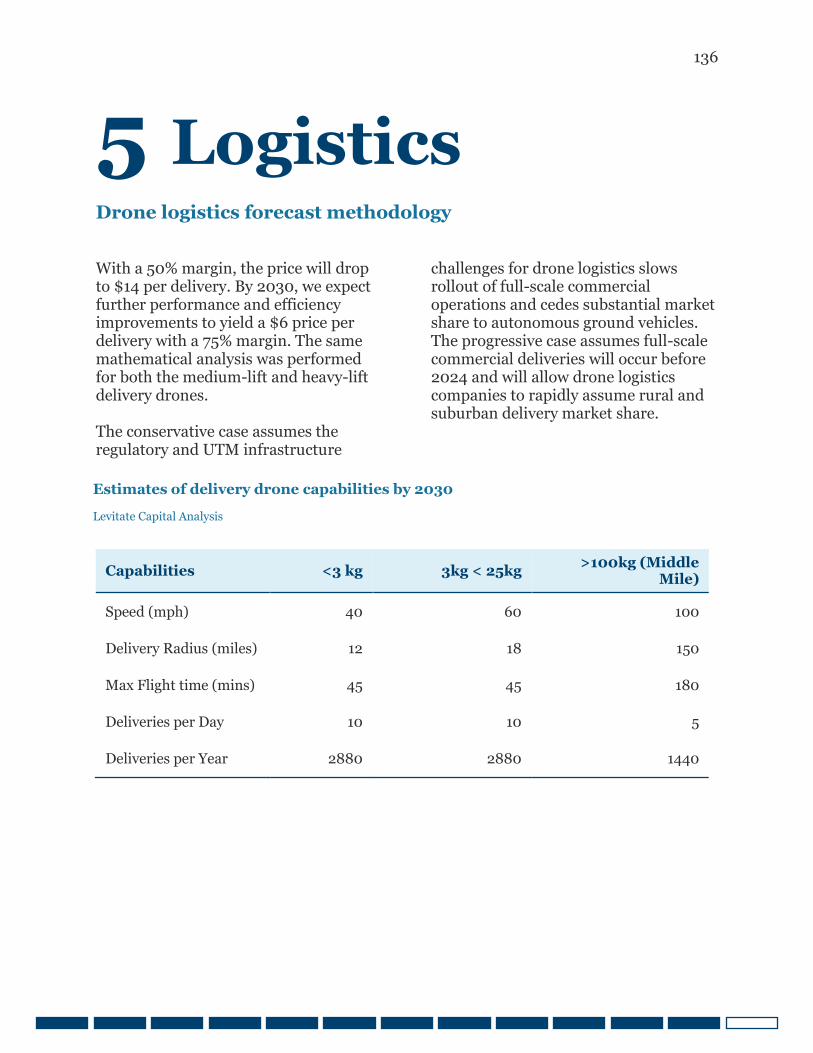
136
5 Logistics
Drone logistics forecast methodology With a 50% margin, the price will drop to $14 per delivery. By 2030, we expect further performance and efficiency improvements to yield a $6 price per delivery with a 75% margin. The same mathematical analysis was performed for both the medium-lift and heavy-lift delivery drones. The conservative case assumes the regulatory and UTM infrastructure
challenges for drone logistics slows rollout of full-scale commercial operations and cedes substantial market share to autonomous ground vehicles. The progressive case assumes full-scale commercial deliveries will occur before 2024 and will allow drone logistics companies to rapidly assume rural and suburban delivery market share.
Capabilities <3 kg 3kg < 25kg >100kg (Middle Mile)
Speed (mph) 40 60 100
Delivery Radius (miles) 12 18 150
Max Flight time (mins) 45 45 180
Deliveries per Day 10 10 5
Deliveries per Year 2880 2880 1440
Estimates of delivery drone capabilities by 2030
Levitate Capital Analysis
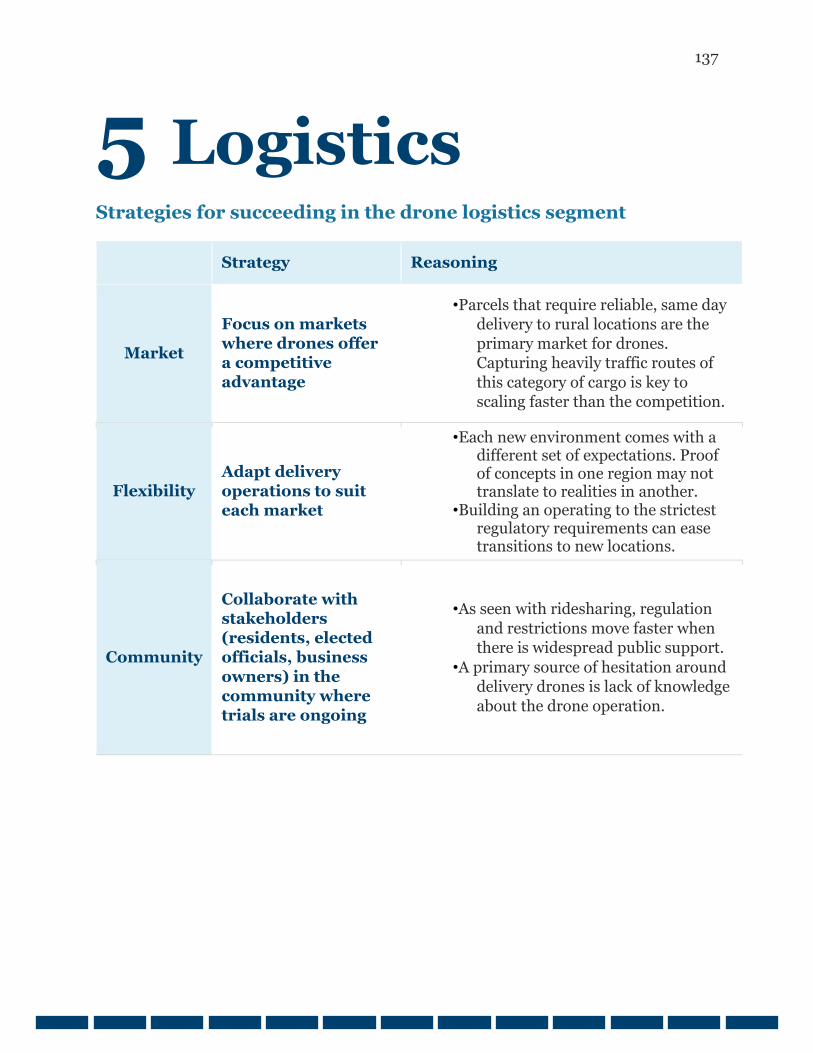
137
5 Logistics
Strategies for succeeding in the drone logistics segment
Strategy Reasoning
Market
Focus on markets where drones offer a competitive advantage
• Parcels that require reliable, same day delivery to rural locations are the primary market for drones. Capturing heavily traffic routes of
this category of cargo is key to scaling faster than the competition.
Flexibility
Adapt delivery operations to suit each market
• Each new environment comes with a different set of expectations. Proof of concepts in one region may not translate to realities in another.
• Building an operating to the strictest regulatory requirements can ease transitions to new locations.
Community
Collaborate with stakeholders (residents, elected officials, business
owners) in the community where trials are ongoing
• As seen with ridesharing, regulation
and restrictions move faster when there is widespread public support.
• A primary source of hesitation around delivery drones is lack of knowledge
about the drone operation.
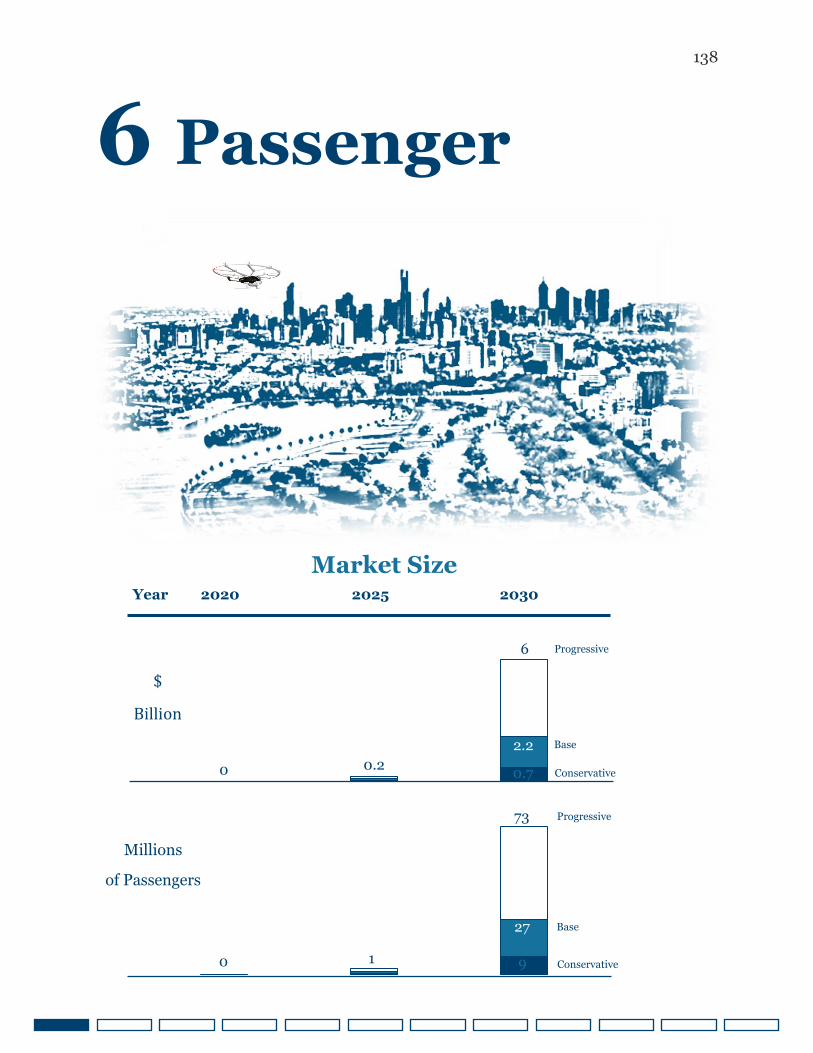
138
6 Passenger
2
17
$
Billion
Market Size
Year 2020 2025 2030
Millions
of Passengers
8.1
0.7
2.2 0.2
6
0
Progressive
Base
Conservative
0
73
27
1 9
Progressive
Base
Conservative
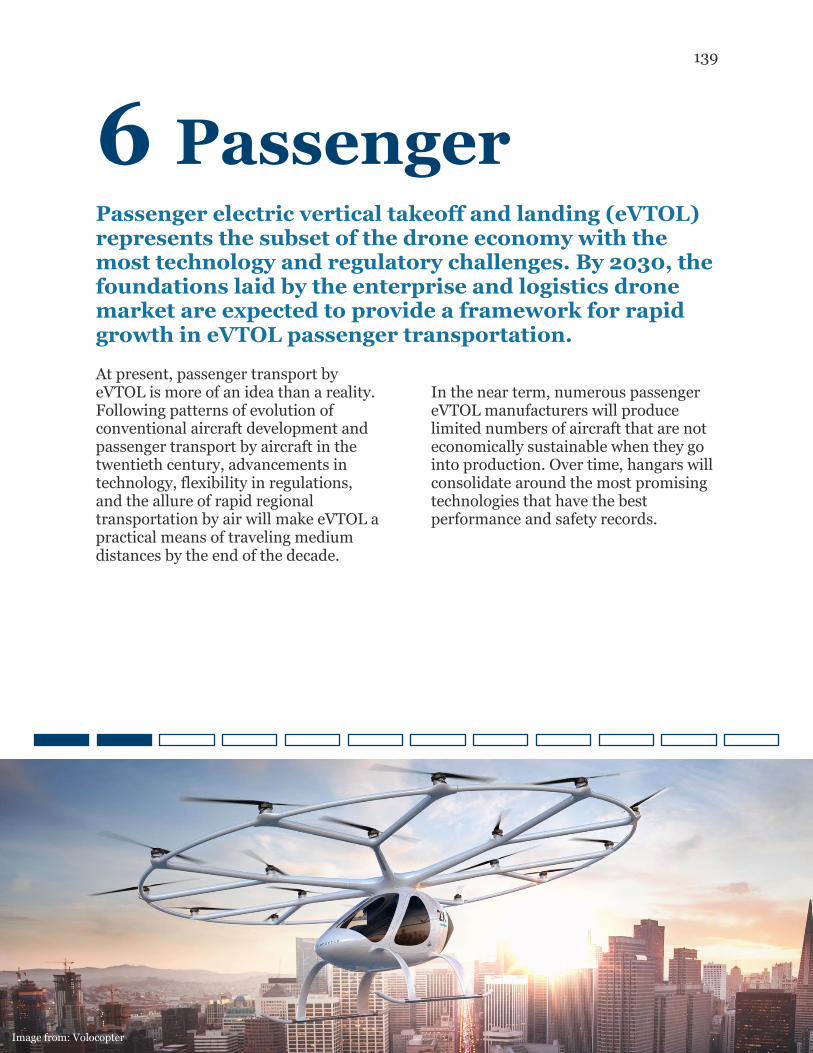
139
6 Passenger
Passenger electric vertical takeoff and landing (eVTOL) represents the subset of the drone economy with the most technology and regulatory challenges. By 2030, the foundations laid by the enterprise and logistics drone market are expected to provide a framework for rapid growth in eVTOL passenger transportation.
At present, passenger transport by eVTOL is more of an idea than a reality. Following patterns of evolution of conventional aircraft development and passenger transport by aircraft in the twentieth century, advancements in technology, flexibility in regulations, and the allure of rapid regional transportation by air will make eVTOL a practical means of traveling medium distances by the end of the decade.
In the near term, numerous passenger eVTOL manufacturers will produce limited numbers of aircraft that are not economically sustainable when they go into production. Over time, hangars will consolidate around the most promising technologies that have the best performance and safety records.
Image from: Volocopter
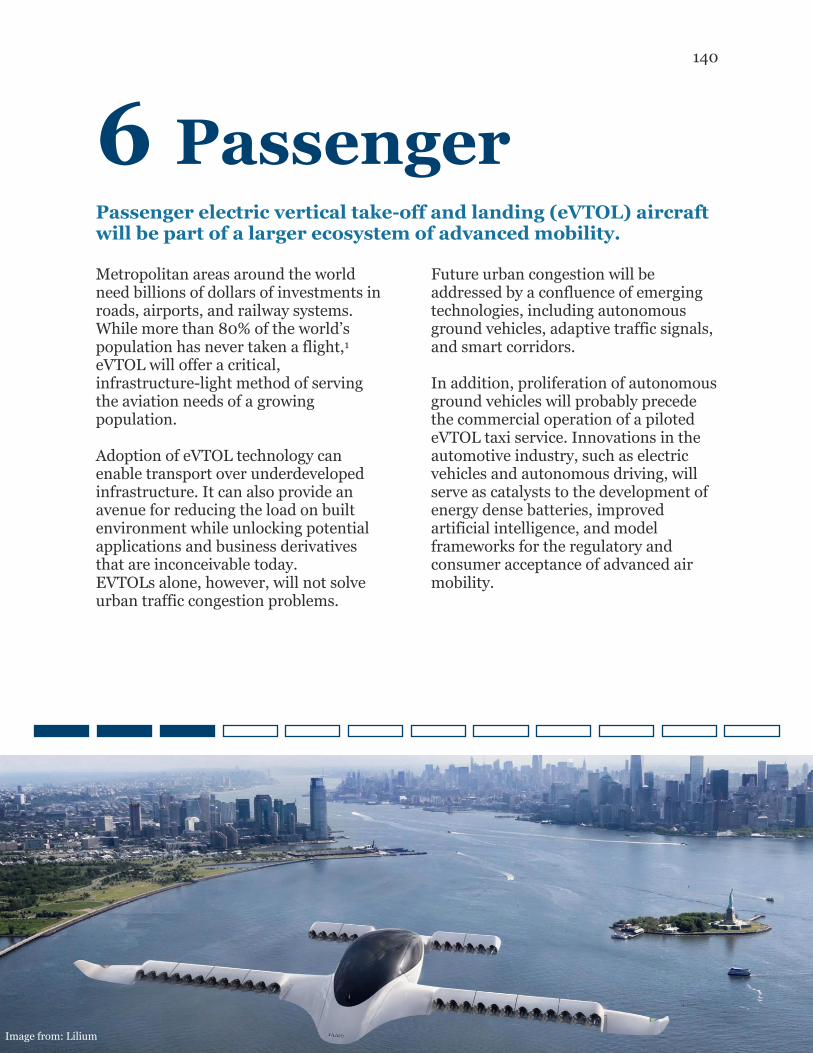
140
6 Passenger
Passenger electric vertical take-off and landing (eVTOL) aircraft will be part of a larger ecosystem of advanced mobility. Metropolitan areas around the world need billions of dollars of investments in roads, airports, and railway systems. While more than 80% of the world’s population has never taken a flight,1 eVTOL will offer a critical, infrastructure-light method of serving the aviation needs of a growing population. Adoption of eVTOL technology can enable transport over underdeveloped infrastructure. It can also provide an avenue for reducing the load on built environment while unlocking potential applications and business derivatives that are inconceivable today. EVTOLs alone, however, will not solve urban traffic congestion problems.
Future urban congestion will be addressed by a confluence of emerging technologies, including autonomous ground vehicles, adaptive traffic signals, and smart corridors. In addition, proliferation of autonomous ground vehicles will probably precede the commercial operation of a piloted eVTOL taxi service. Innovations in the automotive industry, such as electric vehicles and autonomous driving, will serve as catalysts to the development of energy dense batteries, improved artificial intelligence, and model frameworks for the regulatory and consumer acceptance of advanced air mobility.
Image from: Lilium
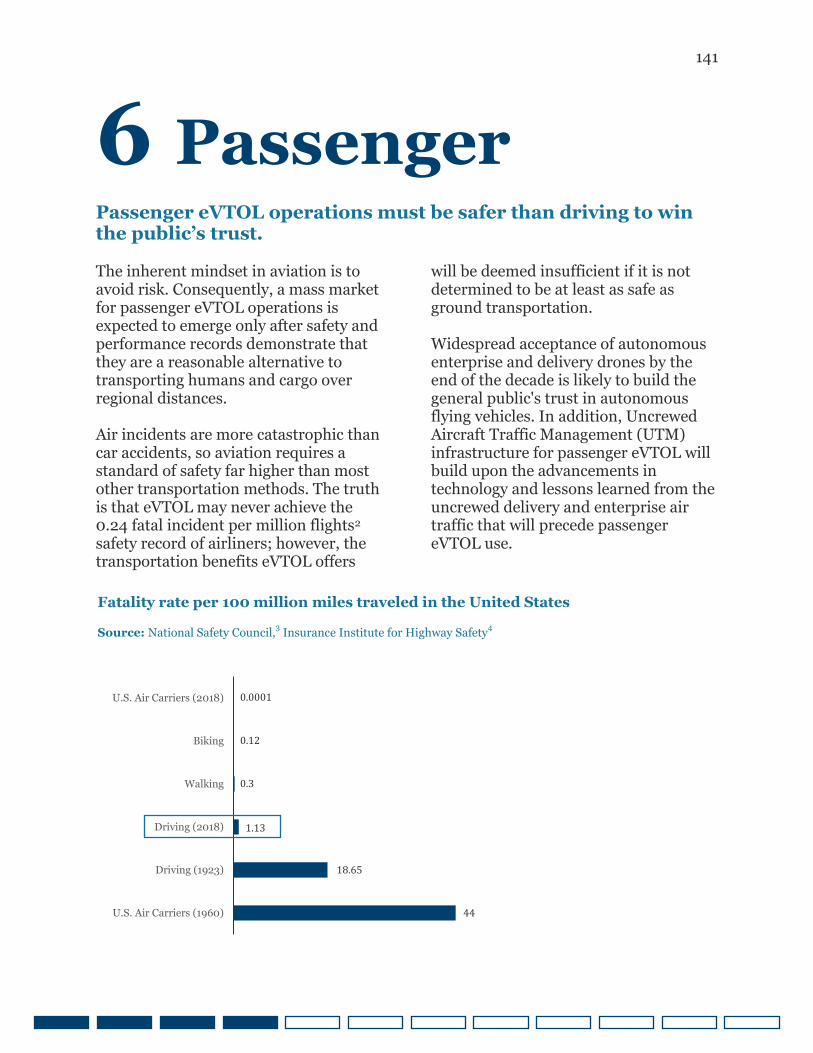
141
6 Passenger
Passenger eVTOL operations must be safer than driving to win the public’s trust. The inherent mindset in aviation is to avoid risk. Consequently, a mass market for passenger eVTOL operations is expected to emerge only after safety and performance records demonstrate that they are a reasonable alternative to transporting humans and cargo over regional distances. Air incidents are more catastrophic than car accidents, so aviation requires a standard of safety far higher than most other transportation methods. The truth is that eVTOL may never achieve the 0.24 fatal incident per million flights2 safety record of airliners; however, the transportation benefits eVTOL offers
will be deemed insufficient if it is not determined to be at least as safe as ground transportation. Widespread acceptance of autonomous enterprise and delivery drones by the end of the decade is likely to build the general public's trust in autonomous flying vehicles. In addition, Uncrewed Aircraft Traffic Management (UTM) infrastructure for passenger eVTOL will build upon the advancements in technology and lessons learned from the uncrewed delivery and enterprise air traffic that will precede passenger eVTOL use.
Fatality rate per 100 million miles traveled in the United States
Source: National Safety Council,3 Insurance Institute for Highway Safety
4
U.S. Air Carriers (1960)
Driving (1923)
Driving (2018)
Walking
Biking
U.S. Air Carriers (2018) 0.0001
0.12
0.3
1.13
18.65
44
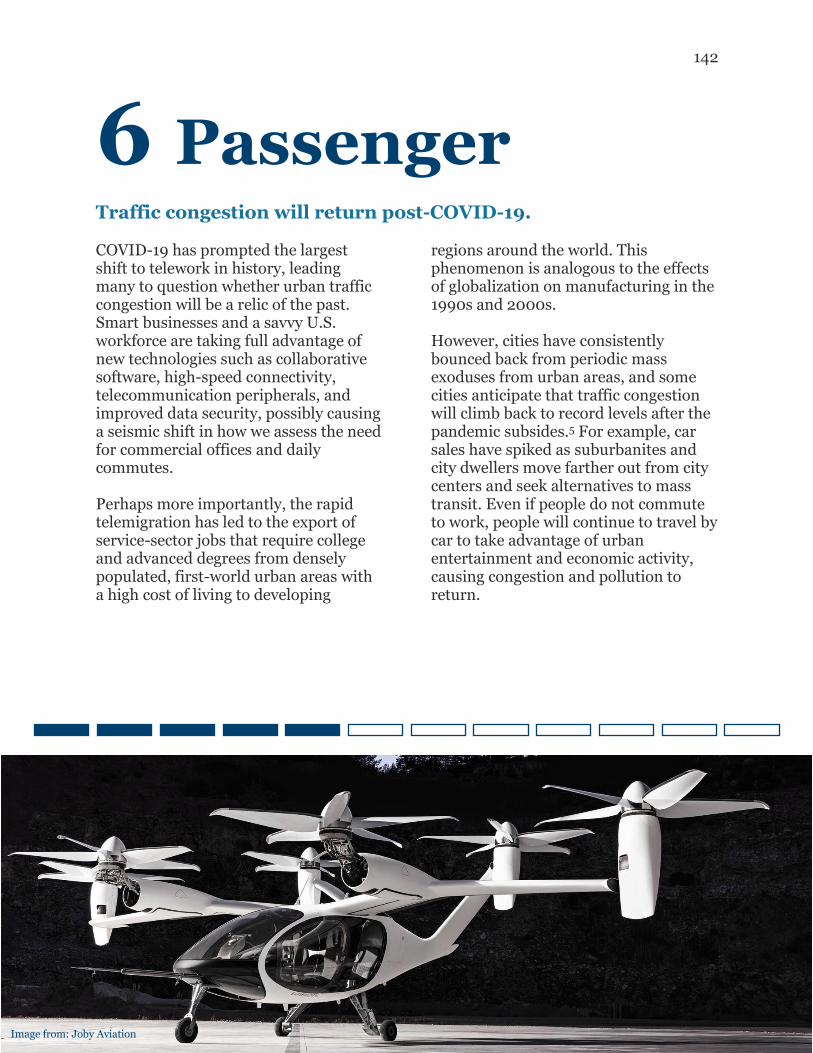
142
6 Passenger
Traffic congestion will return post-COVID-19. COVID-19 has prompted the largest shift to telework in history, leading many to question whether urban traffic congestion will be a relic of the past. Smart businesses and a savvy U.S. workforce are taking full advantage of new technologies such as collaborative software, high-speed connectivity, telecommunication peripherals, and improved data security, possibly causing a seismic shift in how we assess the need for commercial offices and daily commutes. Perhaps more importantly, the rapid telemigration has led to the export of service-sector jobs that require college and advanced degrees from densely populated, first-world urban areas with a high cost of living to developing
regions around the world. This phenomenon is analogous to the effects of globalization on manufacturing in the 1990s and 2000s. However, cities have consistently bounced back from periodic mass exoduses from urban areas, and some cities anticipate that traffic congestion will climb back to record levels after the pandemic subsides.5 For example, car sales have spiked as suburbanites and city dwellers move farther out from city centers and seek alternatives to mass transit. Even if people do not commute to work, people will continue to travel by car to take advantage of urban entertainment and economic activity, causing congestion and pollution to return.
Image from: Joby Aviation
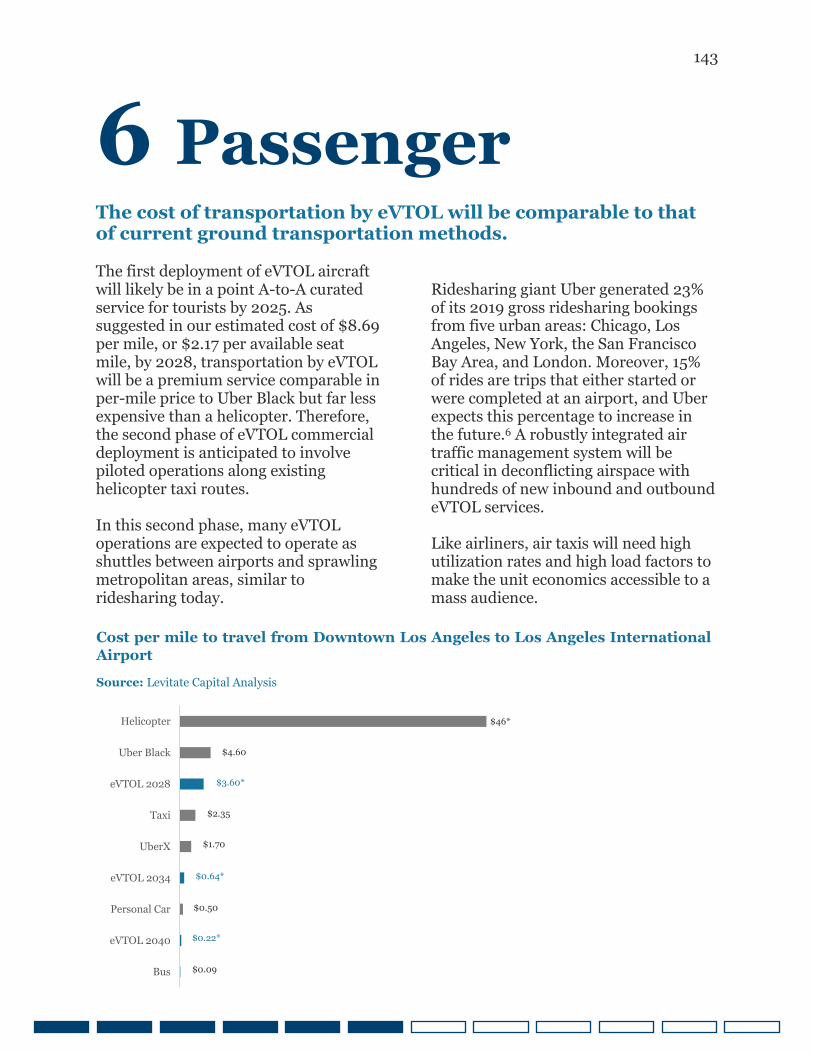
143
6 Passenger
The cost of transportation by eVTOL will be comparable to that of current ground transportation methods. The first deployment of eVTOL aircraft will likely be in a point A-to-A curated service for tourists by 2025. As suggested in our estimated cost of $8.69 per mile, or $2.17 per available seat mile, by 2028, transportation by eVTOL will be a premium service comparable in per-mile price to Uber Black but far less expensive than a helicopter. Therefore, the second phase of eVTOL commercial deployment is anticipated to involve piloted operations along existing helicopter taxi routes. In this second phase, many eVTOL operations are expected to operate as shuttles between airports and sprawling metropolitan areas, similar to ridesharing today.
Ridesharing giant Uber generated 23% of its 2019 gross ridesharing bookings from five urban areas: Chicago, Los Angeles, New York, the San Francisco Bay Area, and London. Moreover, 15% of rides are trips that either started or were completed at an airport, and Uber expects this percentage to increase in the future.6 A robustly integrated air traffic management system will be critical in deconflicting airspace with hundreds of new inbound and outbound eVTOL services. Like airliners, air taxis will need high utilization rates and high load factors to make the unit economics accessible to a mass audience.
Cost per mile to travel from Downtown Los Angeles to Los Angeles International
Airport
Source: Levitate Capital Analysis
Bus
eVTOL 2040
Personal Car
eVTOL 2034
UberX
Taxi
eVTOL 2028
Uber Black
Helicopter
$0.09
$46*
$4.60
$3.60*
$2.35
$1.70
$0.64*
$0.50
$0.22*
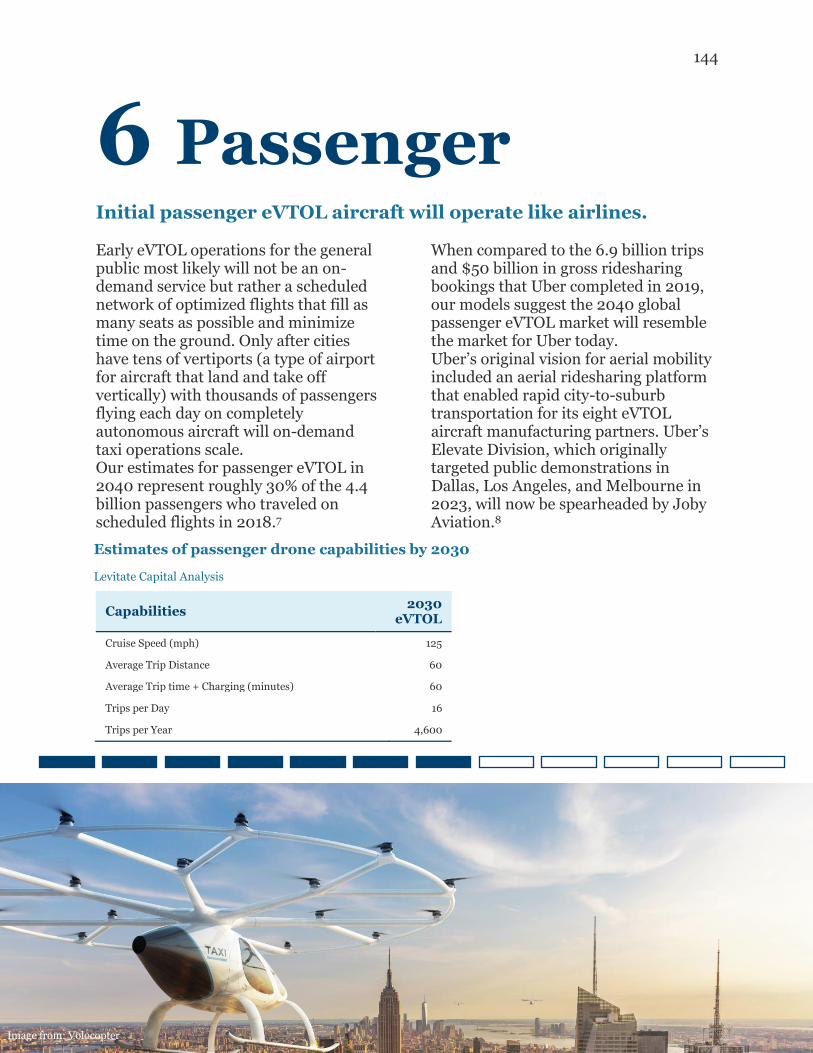
144
6 Passenger
Initial passenger eVTOL aircraft will operate like airlines. Early eVTOL operations for the general public most likely will not be an on-demand service but rather a scheduled network of optimized flights that fill as many seats as possible and minimize time on the ground. Only after cities have tens of vertiports (a type of airport for aircraft that land and take off vertically) with thousands of passengers flying each day on completely autonomous aircraft will on-demand taxi operations scale. Our estimates for passenger eVTOL in 2040 represent roughly 30% of the 4.4 billion passengers who traveled on scheduled flights in 2018.7
When compared to the 6.9 billion trips and $50 billion in gross ridesharing bookings that Uber completed in 2019, our models suggest the 2040 global passenger eVTOL market will resemble the market for Uber today. Uber’s original vision for aerial mobility included an aerial ridesharing platform that enabled rapid city-to-suburb transportation for its eight eVTOL aircraft manufacturing partners. Uber’s Elevate Division, which originally targeted public demonstrations in Dallas, Los Angeles, and Melbourne in 2023, will now be spearheaded by Joby Aviation.8
Capabilities 2030
eVTOL
Cruise Speed (mph) 125
Average Trip Distance 60
Average Trip time + Charging (minutes) 60
Trips per Day 16
Trips per Year 4,600
Estimates of passenger drone capabilities by 2030
Levitate Capital Analysis
Image from: Volocopter
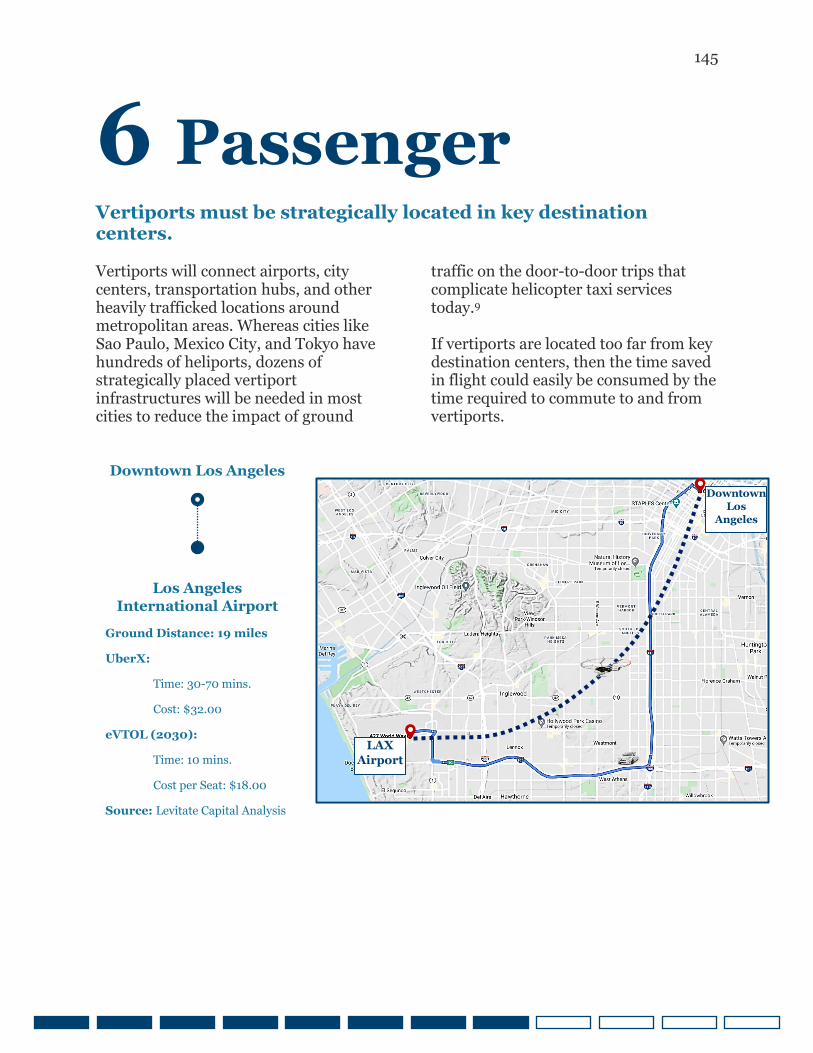
145
6 Passenger
Vertiports must be strategically located in key destination centers. Vertiports will connect airports, city centers, transportation hubs, and other heavily trafficked locations around metropolitan areas. Whereas cities like Sao Paulo, Mexico City, and Tokyo have hundreds of heliports, dozens of strategically placed vertiport infrastructures will be needed in most cities to reduce the impact of ground
traffic on the door-to-door trips that complicate helicopter taxi services today.9 If vertiports are located too far from key destination centers, then the time saved in flight could easily be consumed by the time required to commute to and from vertiports.
Downtown Los Angeles
Los Angeles
International Airport
Ground Distance: 19 miles
UberX:
Time: 30-70 mins.
Cost: $32.00
eVTOL (2030):
Time: 10 mins.
Cost per Seat: $18.00
Source: Levitate Capital Analysis
LAX
Airport
Downtown Los
Angeles
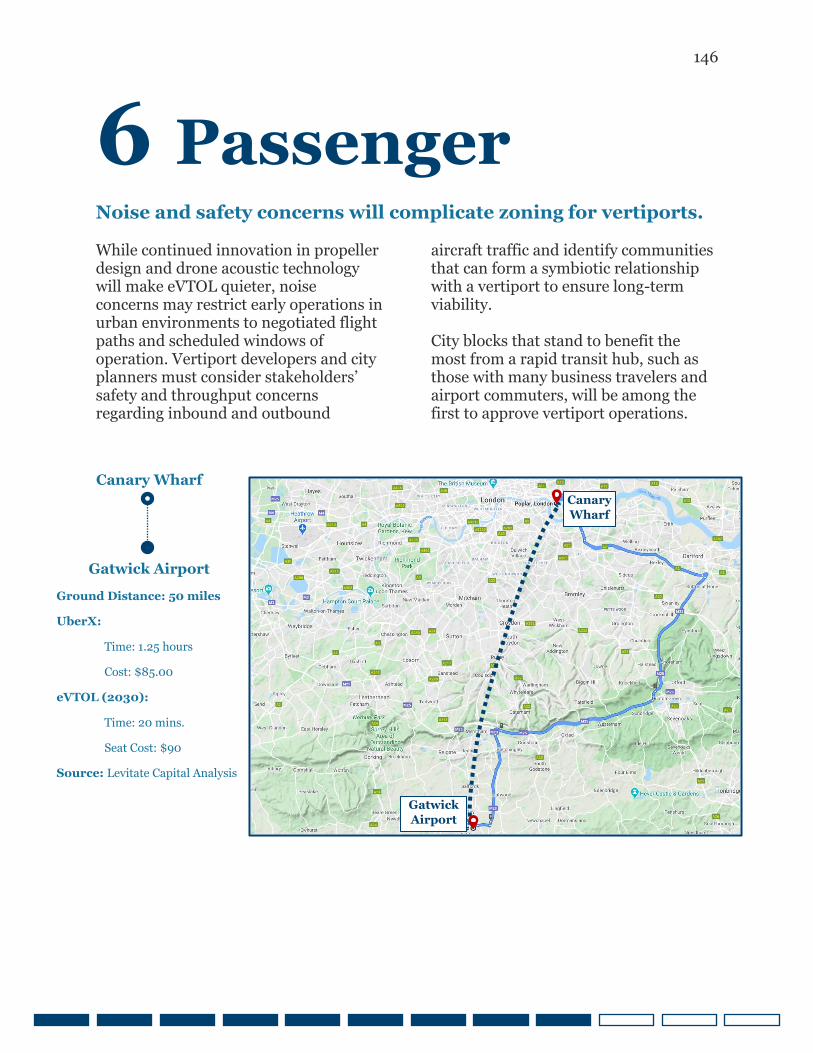
146
6 Passenger
Noise and safety concerns will complicate zoning for vertiports. While continued innovation in propeller design and drone acoustic technology will make eVTOL quieter, noise concerns may restrict early operations in urban environments to negotiated flight paths and scheduled windows of operation. Vertiport developers and city planners must consider stakeholders’ safety and throughput concerns regarding inbound and outbound
aircraft traffic and identify communities that can form a symbiotic relationship with a vertiport to ensure long-term viability. City blocks that stand to benefit the most from a rapid transit hub, such as those with many business travelers and airport commuters, will be among the first to approve vertiport operations.
Canary Wharf
Gatwick Airport
Ground Distance: 50 miles
UberX:
Time: 1.25 hours
Cost: $85.00
eVTOL (2030):
Time: 20 mins.
Seat Cost: $90
Source: Levitate Capital Analysis
Canary
Wharf
Gatwick
Airport
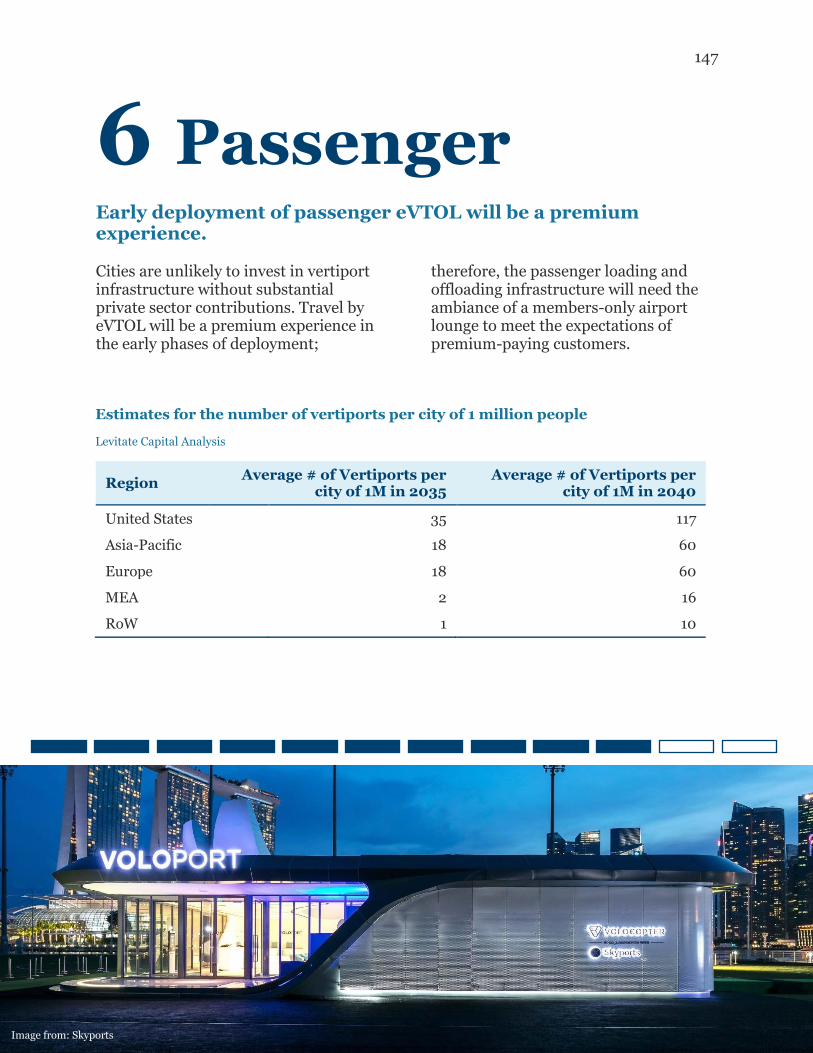
147
6 Passenger
Early deployment of passenger eVTOL will be a premium experience. Cities are unlikely to invest in vertiport infrastructure without substantial private sector contributions. Travel by eVTOL will be a premium experience in the early phases of deployment;
therefore, the passenger loading and offloading infrastructure will need the ambiance of a members-only airport lounge to meet the expectations of premium-paying customers.
Region Average # of Vertiports per city of 1M in 2035
Average # of Vertiports per city of 1M in 2040
United States 35 117 Asia-Pacific 18 60 Europe 18 60 MEA 2 16 RoW 1 10
Estimates for the number of vertiports per city of 1 million people
Levitate Capital Analysis
Image from: Skyports
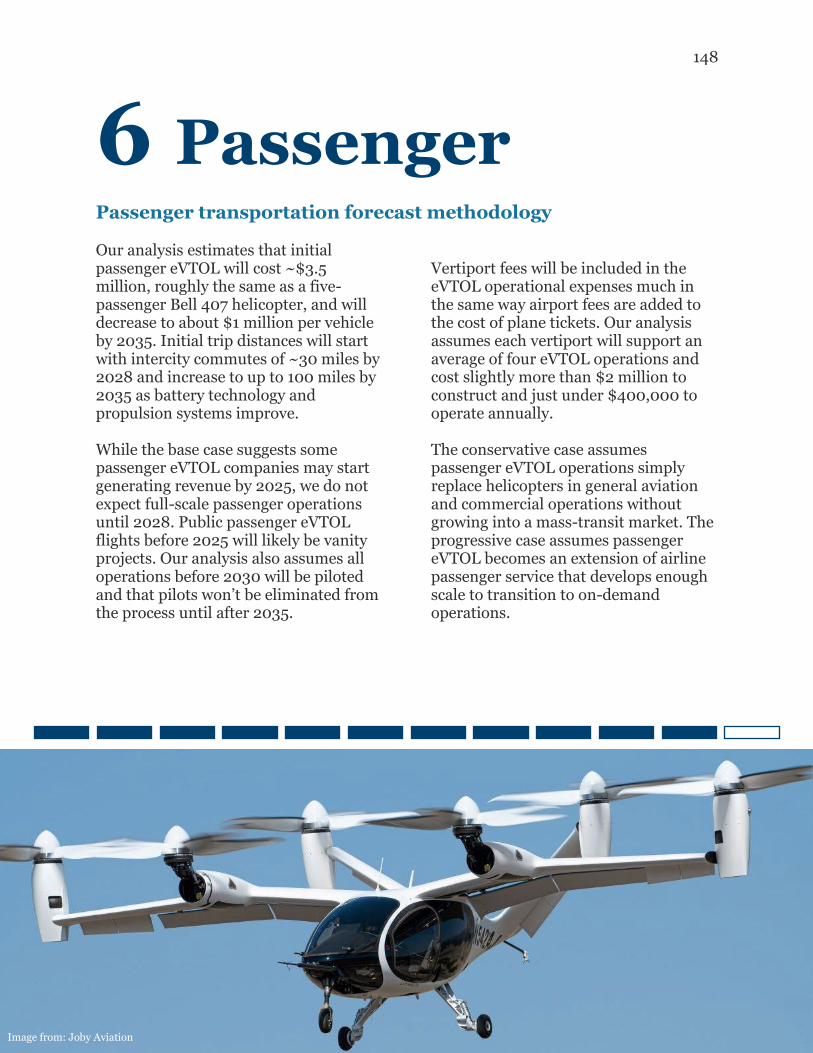
148
6 Passenger
Passenger transportation forecast methodology Our analysis estimates that initial passenger eVTOL will cost ~$3.5 million, roughly the same as a five-passenger Bell 407 helicopter, and will decrease to about $1 million per vehicle by 2035. Initial trip distances will start with intercity commutes of ~30 miles by 2028 and increase to up to 100 miles by 2035 as battery technology and propulsion systems improve. While the base case suggests some passenger eVTOL companies may start generating revenue by 2025, we do not expect full-scale passenger operations until 2028. Public passenger eVTOL flights before 2025 will likely be vanity projects. Our analysis also assumes all operations before 2030 will be piloted and that pilots won’t be eliminated from the process until after 2035.
Vertiport fees will be included in the eVTOL operational expenses much in the same way airport fees are added to the cost of plane tickets. Our analysis assumes each vertiport will support an average of four eVTOL operations and cost slightly more than $2 million to construct and just under $400,000 to operate annually. The conservative case assumes passenger eVTOL operations simply replace helicopters in general aviation and commercial operations without growing into a mass-transit market. The progressive case assumes passenger eVTOL becomes an extension of airline passenger service that develops enough scale to transition to on-demand operations.
Image from: Joby Aviation
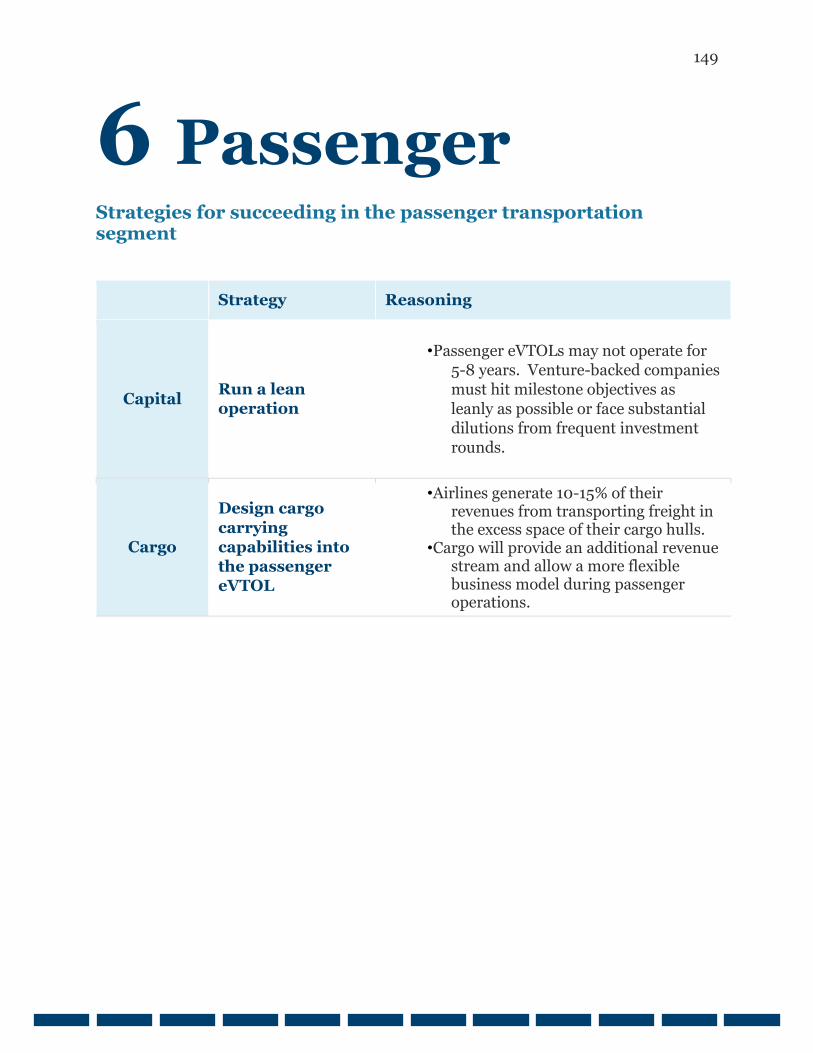
149
6 Passenger
Strategies for succeeding in the passenger transportation segment
Strategy Reasoning
Capital Run a lean operation
• Passenger eVTOLs may not operate for 5-8 years. Venture-backed companies must hit milestone objectives as
leanly as possible or face substantial dilutions from frequent investment rounds.
Cargo
Design cargo
carrying capabilities into the passenger eVTOL
• Airlines generate 10-15% of their revenues from transporting freight in the excess space of their cargo hulls.
• Cargo will provide an additional revenue stream and allow a more flexible business model during passenger operations.
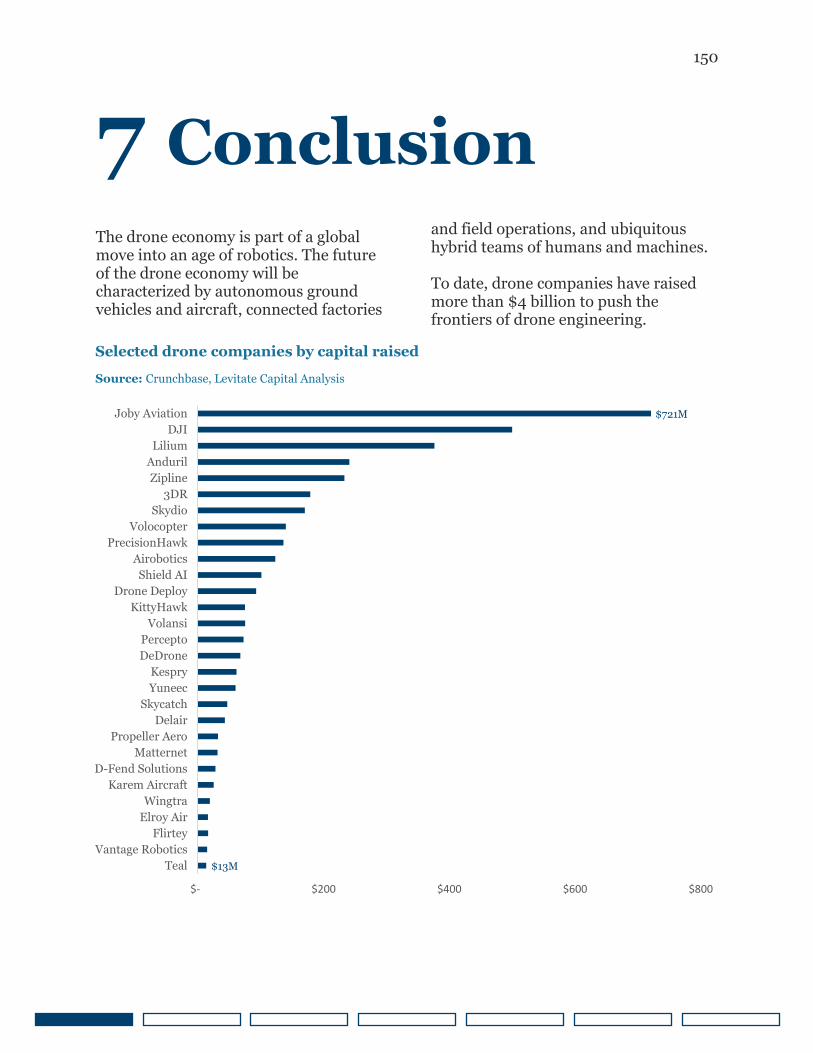
150
7 Conclusion
The drone economy is part of a global move into an age of robotics. The future of the drone economy will be characterized by autonomous ground vehicles and aircraft, connected factories
and field operations, and ubiquitous hybrid teams of humans and machines. To date, drone companies have raised more than $4 billion to push the frontiers of drone engineering.
$- $200 $400 $600 $800
Teal
Vantage Robotics
Flirtey
Elroy Air
Wingtra
Karem Aircraft
D-Fend Solutions
Matternet
Propeller Aero
Delair
Skycatch
Yuneec
Kespry
DeDrone
Percepto
Volansi
KittyHawk
Drone Deploy
Shield AI
Airobotics
PrecisionHawk
Volocopter
Skydio
3DR
Zipline
Anduril
Lilium
DJI
Joby Aviation
Selected drone companies by capital raised
Source: Crunchbase, Levitate Capital Analysis
$721M
$13M
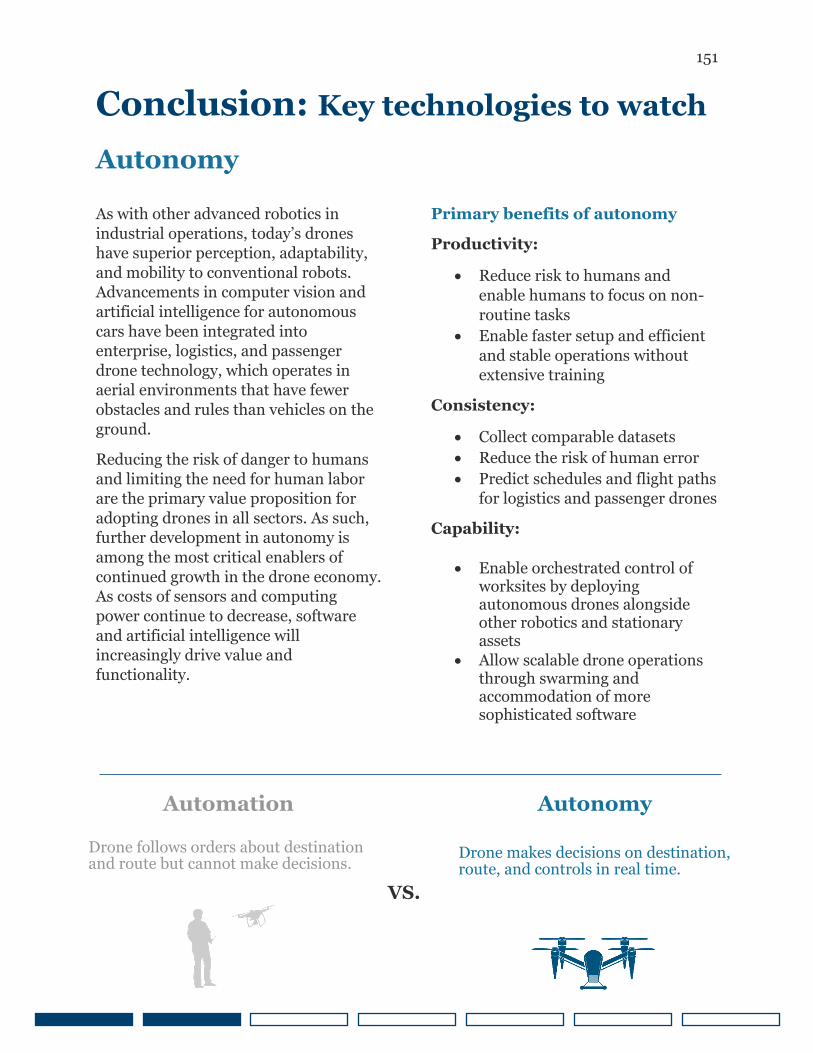
151
Conclusion: Key technologies to watch
Autonomy
As with other advanced robotics in
industrial operations, today’s drones
have superior perception, adaptability,
and mobility to conventional robots.
Advancements in computer vision and
artificial intelligence for autonomous
cars have been integrated into
enterprise, logistics, and passenger
drone technology, which operates in
aerial environments that have fewer
obstacles and rules than vehicles on the
ground.
Reducing the risk of danger to humans
and limiting the need for human labor
are the primary value proposition for
adopting drones in all sectors. As such,
further development in autonomy is
among the most critical enablers of
continued growth in the drone economy.
As costs of sensors and computing
power continue to decrease, software
and artificial intelligence will
increasingly drive value and
functionality.
Primary benefits of autonomy
Productivity:
• Reduce risk to humans and
enable humans to focus on non-
routine tasks
• Enable faster setup and efficient
and stable operations without
extensive training
Consistency:
• Collect comparable datasets
• Reduce the risk of human error
• Predict schedules and flight paths
for logistics and passenger drones
Capability:
• Enable orchestrated control of worksites by deploying autonomous drones alongside other robotics and stationary assets
• Allow scalable drone operations through swarming and accommodation of more sophisticated software
Automation
Drone follows orders about destination and route but cannot make decisions.
Autonomy Drone makes decisions on destination, route, and controls in real time.
VS.
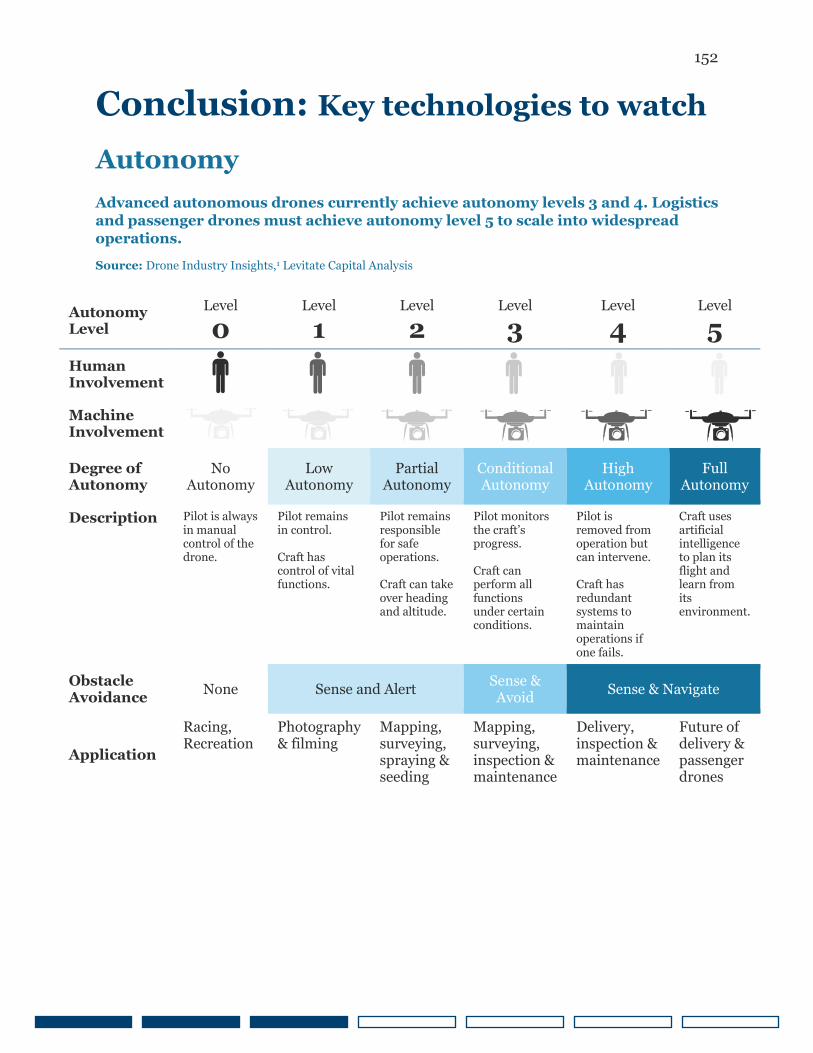
152
Conclusion: Key technologies to watch
Autonomy
Autonomy Level
Level
0
Level
1
Level
2
Level
3
Level
4
Level
5
Human Involvement
Machine Involvement
Degree of Autonomy
No Autonomy
Low Autonomy
Partial Autonomy
Conditional Autonomy
High Autonomy
Full Autonomy
Description Pilot is always in manual control of the drone.
Pilot remains in control. Craft has control of vital functions.
Pilot remains responsible for safe operations. Craft can take over heading and altitude.
Pilot monitors the craft’s progress. Craft can perform all functions under certain conditions.
Pilot is removed from operation but can intervene. Craft has redundant systems to maintain operations if one fails.
Craft uses artificial intelligence to plan its flight and learn from its environment.
Obstacle Avoidance
None Sense and Alert Sense & Avoid
Sense & Navigate
Application
Racing, Recreation
Photography & filming
Mapping, surveying, spraying & seeding
Mapping, surveying, inspection & maintenance
Delivery, inspection & maintenance
Future of delivery & passenger drones
Advanced autonomous drones currently achieve autonomy levels 3 and 4. Logistics
and passenger drones must achieve autonomy level 5 to scale into widespread
operations.
Source: Drone Industry Insights,1 Levitate Capital Analysis
153
Conclusion: Key technologies to watch
Energy storage and consumption
Although passenger eVTOLs are building upon the same battery technology used in electric cars, they draw power more quickly and for longer periods of time, and they must hold reserve power to safely hover and land in case of emergency. Therefore, battery technology and energy consumption are significant technological considerations for passenger and logistics drone manufacturers.
Specific energy is a per-unit mass metric for an energy source’s ability to store energy and defines a battery’s capacity in weight (Wh/kg). Today’s best batteries have a specific energy of around 250 Wh/kg. Industry experts estimate that a battery with a specific energy of 800 Wh/kg is required for reliable long-distance electric flight. For reference, jet fuel has a specific energy of 12,000 Wh/kg. We anticipate battery energy densities of 400 Wh/kg by 2025 and 500 Wh/kg by 2030.
Consequently, near-term electric aircraft will travel only short distances and have limited load-carrying capacity. Early
heavy-lift and long-distance drones are likely to be hybrid-electric aircraft that use electric motors for propulsion in addition to fuel-powered generators.
Sustainable electric flight depends on the battery and aircraft design. Engineers are using lightweight composites and optimized aerodynamics to shave ounces in order to achieve the highest lift-to-drag ratio possible and reduce battery power requirements. Beyond the airframe, logistics and passenger drone manufacturers are also shaving weight off avionics, motors, and other onboard flight systems. As a result, leading passenger eVTOLs currently in development can travel as far as 150 miles at up to 200 mph.2
New enterprise and consumer drones are exploiting battery technology and low-power-consumption computer chips developed for the smart phone industry to extend battery life. In addition, manufacturers of small drones use miniaturized sensors and composite materials to reduce the drone’s weight and extend battery life.
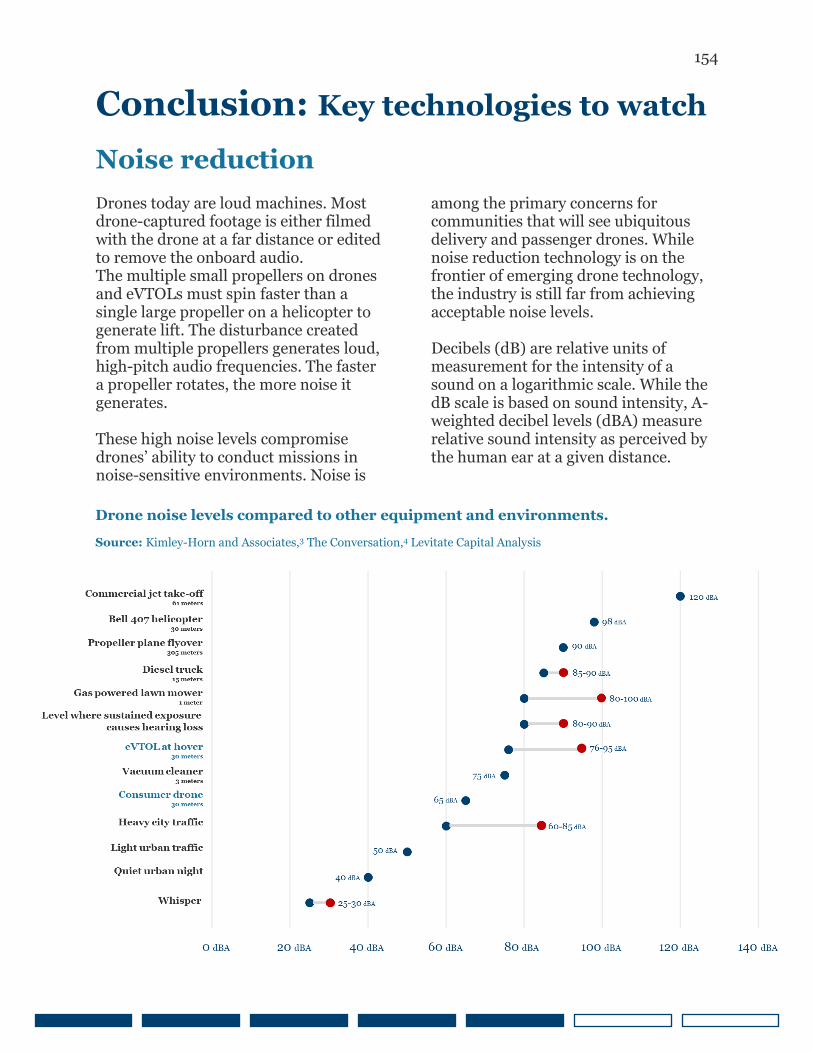
154
Conclusion: Key technologies to watch
Noise reduction
Drones today are loud machines. Most drone-captured footage is either filmed with the drone at a far distance or edited to remove the onboard audio. The multiple small propellers on drones and eVTOLs must spin faster than a single large propeller on a helicopter to generate lift. The disturbance created from multiple propellers generates loud, high-pitch audio frequencies. The faster a propeller rotates, the more noise it generates. These high noise levels compromise drones’ ability to conduct missions in noise-sensitive environments. Noise is
among the primary concerns for communities that will see ubiquitous delivery and passenger drones. While noise reduction technology is on the frontier of emerging drone technology, the industry is still far from achieving acceptable noise levels. Decibels (dB) are relative units of measurement for the intensity of a sound on a logarithmic scale. While the dB scale is based on sound intensity, A-weighted decibel levels (dBA) measure relative sound intensity as perceived by the human ear at a given distance.
Drone noise levels compared to other equipment and environments.
Source: Kimley-Horn and Associates,3 The Conversation,4 Levitate Capital Analysis
155
Conclusion: Key technologies to watch
Noise reduction
Enterprise and consumer drones hovering at an altitude of 15 meters can be louder than 65 dBA, and passenger eVTOLs at 30 meters can be as loud as 95 dBA. For context, OSHA’s permissible noise exposure limit is 90 dBA for an eight-hour time-weighted average.5 The exposure time is cut in half for every 5-dBA increase. If noise levels exceed 80 dBA, people must speak loudly to be heard. For noise levels above 85 dBA, people must shout to communicate with others an arm’s length away. Noise levels will affect the frequency of passenger and delivery drone operations. The FAA suggests aircraft noise in residential areas should not
average above 65dB in a 24-hour period.6 Technologies under development for reducing drone noise levels include propeller designs that combine large blade areas with low tip speeds, lightweight materials that reduce the amount of lift required to fly the aircraft (allowing slower propeller speeds), and ducts that reduce the intensity of noise-contributing vortices. Leading passenger eVTOLs hovering 30 meters away can achieve noise levels of 76 dB. However, despite promising progress on noise reduction, the industry still has a ways to go before widespread adoption.
156
7 Conclusion
As drone technology continues to graduate beyond military and recreational uses and improve commercial productivity, accelerate logistics, and transport humans, its economic potential will continue to break down technology and regulatory barriers. Today, some of the most attractive investment opportunities in the drone economy serve the largest market: defense. Government R&D funding allows drone companies to rely less on variable venture capital and more on non-dilutive fixed-priced contracts. Despite new programs to improve partnerships between the U.S. Department of Defense and the private sector, government contracts are still difficult to win. Therefore, drone companies that have a successful record of winning government contracts are likely to have a resource advantage over competitors that rely solely on venture capital. The most attractive investment opportunities in the drone economy also prioritize artificial intelligence (AI) as a core driver of value. Outside the consumer market, every market segment in the drone economy requires autonomous drones in order to achieve widespread adoption. Drone companies that have managed to recruit the best AI engineering talent amid the worldwide shortage of AI engineers stand to gain a competitive advantage. As with many industries that were jumpstarted with defense funding, the commercial sector will eventually
outgrow the need for government support. The most attractive opportunities in the enterprise drone space center around high-value software. The primary value enterprises derive from drones comes from the data they collect and the software they use to analyze that data; therefore, unless coupled with mission-critical software, drone hardware will become increasingly commoditized. While drone-based logistics could become the largest market by 2030, companies in the sector currently face more regulatory and technology barriers than all other sectors except passenger. The most attractive drone logistics companies have a track record of receiving regulatory approvals in multiple geographies and forming meaningful partnerships with corporations that ship products in high volumes. Passenger drones are the riskiest opportunities in the drone economy. Although the segment could become the largest market for drones in the 2030s, it is the farthest away from generating meaningful revenue and will require the most capital. The most attractive companies in this space are those that are closest to certification with global regulators and those making significant progress in extending range, minimizing noise, and reducing system complexity. The drone economy evolves every year, and while many variables could change the trajectory of our industry forecast, we will stay on top of exciting new developments and opportunities as they occur within the space.

157
8 About Us
About the author About Levitate Capital
Dario Constantine is a senior associate at
Levitate Capital where he focuses on drone
technology companies. He aims to invest in today’s
innovators who share Levitate’s vision for the
pivotal role uncrewed aerial vehicles will play in
the world over the next decade and beyond.
Before starting a career in venture capital, Dario
was a senior engineer at Maxar Technologies where
he led the spacecraft configuration designs of
geostationary satellites.
Dario earned an MBA from the Stanford Graduate
School of Business, where he was an Arbuckle
Leadership Fellow, and a bachelor’s degree and
master’s degree in mechanical engineering from
Columbia University.
Email: [email protected]
Levitate Capital is a venture capital firm focused
on next-generation air mobility.
We see the coming revolution as one of the
profound transformations of modern society.
Our investments cover a broad range of ventures
and new business models that will complement our
aerial mobility networks of the future.
Sign up for our newsletter and follow us at
levitatecap.com
158
David Merrill Kofi Asante
John Fernandez Duncan Walker
Guillaume Delepine
Maximilian Boosfeld
Carolyn Daughters Kirsten Bartok Touw
Tess Hatch
Brian Hinman
9 Acknowledgements
We thank the following contributors for their insights and input.
Levitate Portfolio Companies
159
10 Appendix A: Key Terms
Term Meaning Description
AAM Advanced Air Mobility New types of aircraft, airspace management systems, and other technologies that enable the movement of goods and people through the airspace.
ADS-B Automatic Dependent Surveillance-Broadcast
Surveillance technology that periodically broadcasts an aircraft’s position to enable it to be tracked by air traffic controllers and pilots.
AEC Architecture, Engineering and Construction
Sector of the construction industry that provides services on the architectural design, engineering design, and construction services.
BEI Built Environment Inspection
Human-made structures, features, and facilities that provide the setting for human activity.
BVLOS Beyond Visual Line of Sight
Ability for pilots of unmanned aerial vehicles to fly beyond visual range. This capability enables a drone to cover farther distances and conduct complex operations without human interference.
CAGR Compound Annual Growth Rate
A rate at which the market grows over a period of time if it had the same growth rate each year.
CUAS Counter Uncrewed Aerial System
Also written as counter-UAS or counter-drone. These are systems for detecting or intercepting uncrewed aircraft.
DoD United States Department of Defense
U.S. federal executive department responsible for coordinating and supervising all agencies and functions of the government directly related to national security and the United States Armed Forces.
DHS United States Department of Homeland Security
U.S. federal executive department responsible for public safety with missions involving anti-terrorism, border security, cyber security, and disaster protection. Its function is comparable to the interior ministries of other countries.
Drone Unmanned aerial vehicles
“Drones” in this report exclusively refers to aircraft either operated remotely or autonomously.
160
10 Appendix A: Key Terms
Term Meaning Description
DoJ United States Department of Justice
U.S. federal executive department responsible for enforcing the law and administration of justice in the United States. Its function is comparable to interior ministries of justice of other countries.
DoT United States Department of Transportation
U.S. federal executive department concerned with all forms of transportation within the United States.
EASA European Union Aviation Safety Agency
Agency of the European Union (EU) with powers to regulate European civil aviation. It carries out certification, regulation and standardization and also performs investigation and monitoring over new type certificates and other design-related airworthiness approvals for aircraft, engines, propellers and parts.
eVTOL Electric Vertical Takeoff and Landing
Aircraft that use electric propulsion to takeoff and land vertically. These aircraft promise to be quieter, safer, and less expensive to manufacture and operate than a helicopter. Additionally, these aircraft will likely include a degree of autonomy.
FAA Federal Aviation Administration
Governmental body of the United States with powers to regulate all aspects of U.S. civil aviation as well as over its surrounding international waters. Its powers include the construction and operation of airports, air traffic management, the certification of personnel and aircraft, and the protection of U.S. assets during the launch or re-entry of commercial space vehicles.
HALE (UAV)
High-Altitude Long Endurance (Unmanned Aerial Vehicle)
Unmanned aerial vehicle that flies at altitudes up to 60,000 ft (18,000 m) for periods up to 32 hours. Aircraft like the RQ-4 Global Hawk fall into this category.
IoT Internet of Things The network of physical objects embedded with sensors, software, and other technologies in order to collect data from and connect and exchange data with other devices and systems over the Internet
LAANC Low Altitude Authorization and Notification Capability
Collaboration with the FAA and industry that provides drone pilots with access to controlled airspace at or below 400ft and awareness of where pilots can and cannot fly. It also provides Air Traffic Professionals with visibility into where and when drones are operating.
MALE (UAV)
Medium-Altitude Long Endurance (Unmanned Aerial Vehicle)
Unmanned aerial vehicle that flies at altitudes up to 30,000 ft (9,000 m) for periods up to 24 hours. Aircraft like the MQ-9 Reaper fall into this category.
161
10 Appendix A: Key Terms
Term Meaning Description
MEA Middle East and Africa Countries that make up the Middle East and Africa.
Part-107 FAA commercial drone guidelines
Guidelines set by the FAA for operators of commercial drones less than 55 lbs.
Part-135 FAA Air Carrier and Operator Certification
Guidelines and certification set by the FAA that either allows a certificate holder to conduct interstate, foreign, or oversees transportation throughout the U.S. (Air Carrier Certificate) or within the same state in the U.S. (Operating Certificate).
Remote ID
A digital license plate for drones that communicates identification of a drone and its operator. Its expected rollout in 2021 will make it the first UTM standard and a milestone towards BVLOS and night time operations.
RoW Rest of the World Refers to all regions outside of the United States, Asia-Pacific, Europe, and Middle East and Africa. Therefore, RoW primarily consists of Canada and Latin America.
TAM Total Addressable Market
Total opportunity size (revenue or user base) for a product or service.
UAS/UAV Uncrewed Aerial System/ Unmanned Aerial Vehicle
Uncrewed Aerial System (UAS) refers to the aircraft, ground control stations, communication systems, and other support equipment that enables an aircraft to fly without a pilot. Uncrewed Aerial Vehicles, also referred to as “Drones,” are aircraft without a pilot on board and are a component of UAS.
UTM Uncrewed Aircraft Traffic Management
A traffic management ecosystem for low-altitude drone operations that will identify services, roles and responsibilities, information architecture, data exchange protocols, software functions, infrastructure, and performance requirements.
162
10 Appendix B: References
Defense References
1. Wall Street Journal: https://www.wsj.com/articles/for-u-s-military-drones-airspace-is-growing-more-congested-dangerous-11562232600
2. Stockholm international Peace Research Institute: https://www.sipri.org/media/press-release/2020/global-military-expenditure-sees-largest-annual-increase-decade-says-sipri-reaching-1917-billion
3. CNBC: https://www.cnbc.com/2020/07/24/trump-allows-defense-contractors-to-sell-more-armed-drones-to-foreign-militaries.html
4. Airforce Mag: https://www.airforcemag.com/abrupt-end-to-mq-9-production-surprises-general-atomics/
5. Defense News: https://www.defensenews.com/global/mideast-africa/2018/02/12/israel-air-force-says-seized-iranian-drone-is-a-knockoff-of-us-sentinel/
6. National Interest: https://nationalinterest.org/blog/buzz/it%E2%80%99s-safe-bet-us-air-force-buying-stealth-spy-drones-127767
7. Airforce Times: https://www.airforcetimes.com/news/your-air-force/2019/03/08/air-force-offers-glimpse-of-new-stealthy-combat-drone-during-first-flight/
8. Breaking Defense: https://breakingdefense.com/2020/09/uss-vinson-flies-f-35s-quietly-readies-for-new-refueling-drone/
9. Aviation International News: https://www.ainonline.com/aviation-news/defense/2020-07-17/project-mosquito-uks-loyal-wingman-program-moves-ahead
10. National Interest: https://nationalinterest.org/blog/buzz/how-good-russias-new-sukhoi-s-70-okhotnik-b-hunter-stealth-drone-105886
11. SUAS News: https://www.suasnews.com/2020/05/us-army-awards-aerovironment-146-lmams-contract-funded-at-76-million-for-first-year-of-switchblade-systems-procurement/
12. Global Newswire: https://www.globenewswire.com/news-release/2020/02/17/1985804/0/en/Parrot-chosen-by-the-Swiss-Army-for-the-supply-of-micro-drones.html
13. Skydio: https://www.skydio.com/pages/skydio-x2 14. ParrotUSA: https://www.parrot.com/us/drones/anafi-usa 15. Altavian: https://www.altavian.com/ion-m440 16. Teal Drones: https://tealdrones.com/suas-golden-eagle/ 17. Vantage Robotics: https://vantagerobotics.com/vesper/ 18. GSA Advantage: https://www.gsaadvantage.gov/

163
10 Appendix B: References
Defense References
19. Bard College Drone Center: https://dronecenter.bard.edu/files/2018/04/CSD-Drone-Spending-FY19-Web-1.pdf
20. Congressional Budget Office: https://www.cbo.gov/system/files/2018-12/54657-AirForceAviationFunding.pdf
21. Bard College Drone Center: https://dronecenter.bard.edu/drones-in-the-fy19-defense-budget/
22. Boston Consulting Group: https://www.bcg.com/en-us/publications/2020/isr-tech-disrupt-market-defense-drones
23. Bard College Drone Center: https://dronecenter.bard.edu/files/2018/02/CSD-Counter-Drone-Systems-Report.pdf
24. Military.com: https://www.military.com/daily-news/2020/06/30/these-are-7-anti-drone-weapons-us-military-plans-invest.html
25. Base Structure Report: https://www.acq.osd.mil/eie/Downloads/BSI/Base%20Structure%20Report%20FY18.pdf
26. Global Diplomacy Index: https://globaldiplomacyindex.lowyinstitute.org 27. Congressional Budget Office: https://www.cbo.gov/system/files/2019-10/55685-
CBO-Navys-FY20-shipbuilding-plan.pdf 28. Fed Tech Magazine: https://fedtechmagazine.com/article/2018/09/how-
government-helped-spur-microchip-industry 29. NASA SBIR: https://sbir.nasa.gov/content/publications 30. Forbes: https://www.forbes.com/sites/jeremybogaisky/2020/07/01/anduril-
raises-200-million-to-fund-ambitious-plans-to-build-a-defense-tech-giant/#f961c333c5e5
31. Federal Database: https://www.fpds.gov/ezsearch/search.do?indexName=awardfull&templateName=1.5.1&s=FPDS.GOV&q=anduril
164
10 Appendix B: References
Enterprise Overview References
1. Federal Aviation Administration: https://www.faa.gov/news/fact_sheets/news_story.cfm?newsId=20516
2. Federal Aviation Administration: https://www.faa.gov/data_research/aviation/aerospace_forecasts/media/Unmanned_Aircraft_Systems.pdf
3. Federal Aviation Administration: https://www.faa.gov/news/fact_sheets/news_story.cfm?newsId=22615
4. Civil Aviation Authority: https://www.caa.co.uk/Consumers/Unmanned-aircraft/Recreational-drones/Recreational-drone-flights/
5. Civil Aviation Safety Authority: https://www.casa.gov.au/drones
Construction References
1. McKinsey & Company: https://www.mckinsey.com/industries/capital-projects-and-infrastructure/our-insights/imagining-constructions-digital-future
2. Occupational Safety and Health Administration: https://www.osha.gov/data/commonstats
3. Construction Connect: https://www.constructconnect.com/blog/high-cost-construction-equipment-theft
4. The Atlantic: https://www.theatlantic.com/politics/archive/2020/05/coronavirus-pandemic-infrastructure-week/611125/]
5. Arabian Business: https://www.arabianbusiness.com/technology/448916-saudi-arabia-to-turn-to-drones-to-re-start-construction-sector-says-falcon-eye-ceo
6. Bureau of Labor Statistics: https://www.bls.gov/oes/2018/may/oes119021.htm
165
10 Appendix B: References
Built Environment Inspection References
1. The Guardian: https://www.theguardian.com/cities/2019/feb/26/what-caused-the-genoa-morandi-bridge-collapse-and-the-end-of-an-italian-national-myth
2. Infrastructure Report Card: https://www.infrastructurereportcard.org/cat-item/bridges/
3. Transportation.gov: https://www.transportation.gov/testimony/highway-bridge-inspections
4. George Mason University: https://catsr.vse.gmu.edu/SYST490/490_2014_BI/BIS_FinalReport.pdf
5. AASHTO: https://aashtojournal.org/2019/05/24/aashto-survey-finds-drone-use-exploding-among-state-dots/
6. SUAS News: https://www.suasnews.com/2020/10/ncdot-and-skydio-secure-the-first-true-bvlos-waiver-under-part-107/
7. Progressive Rail Roading: https://www.progressiverailroading.com/mow/article/Railroads-continue-to-tap-drone-technology-to-inspect-track-bridges--57270
8. BNSF: https://www.bnsf.com/about-bnsf/financial-information/pdf/10k-llc-2019.pdf
9. Union Pacific: https://www.up.com/investor/annual/ 10. Progressive Rail Roading:
https://www.progressiverailroading.com/bnsf_railway/article/Inside-BNSFs-advanced-drone-inspection-operation—57346
11. SUAS News: https://www.suasnews.com/2015/06/why-bnsf-railway-is-using-drones-to-inspect-thousands-of-miles-of-rail-lines/
12. NY Times: https://www.nytimes.com/2019/03/08/realestate/the-building-inspector-as-action-hero.html
13. Kittyhawk.io: https://kittyhawk.io/resources/case-studies/Travelers.pdf 14. State Farm: https://newsroom.statefarm.com/state-farm-gets-1st-national-faa-
waiver/
166
10 Appendix B: References
Agriculture References
1. Tevel-Tech: https://www.tevel-tech.com/ 2. Science Direct:
https://www.sciencedirect.com/science/article/pii/S0305750X15002703 3. Financial Times: https://www.ft.com/content/afa5e042-4c50-11e9-bbc9-
6917dce3dc62 4. Asia.Nikkei: https://asia.nikkei.com/Business/China-tech/Teardown-of-DJI-
drone-reveals-secrets-of-its-competitive-pricing 5. National Agricultural Statistics Service:
https://www.nass.usda.gov/Publications/Todays_Reports/reports/fnlo0220.pdf 6. Producer: https://www.producer.com/2017/06/per-acre-equipment-calculation-
can-be-revealing/ 7. Food and Agriculture Organization:
http://www.fao.org/fileadmin/templates/ess/documents/meetings_and_workshops/APCAS23/documents_OCT10/APCAS-10-28_-Small_farmers.pdf
Enterprise Counter Drone References
1. Congressional Research Service: https://fas.org/sgp/crs/homesec/IF11550.pdf 2. CNBC: https://www.cnbc.com/2018/12/20/drone-sightings-shut-down-
britains-gatwick-airport.html 3. Today Online: https://www.todayonline.com/singapore/4-arrested-suspected-
drug-trafficking-using-drone-flew-between-kranji-and-jb 4. Airspace Mag: https://www.airspacemag.com/flight-today/narcodrones-
180974934/ 5. The Verge: https://www.theverge.com/2017/6/18/15818224/drones-prisons-
smuggling-contraband
167
10 Appendix B: References
Oil & Gas References 1. All Africa: https://allafrica.com/stories/201911070020.html 2. Royal Dutch Shell: https://www.shell.us/energy-and-innovation/shale-gas-and-
oil/drone-development-permian-basin.html 3. Journal of Petroleum Technology: https://pubs.spe.org/en/jpt/jpt-article-
detail/?art=7576 4. SUAS News: https://www.suasnews.com/2020/08/nordic-unmanned-equinor-
deliver-to-offshore-oil-rig-troll-a/ 5. International Energy Agency: https://www.iea.org/reports/methane-tracker-
2020/methane-from-oil-gas 6. Baker Hughes: https://investors.bakerhughes.com/news-releases/news-release-
details/baker-hughes-announces-june-2020-rig-counts 7. Offshore Technology: https://www.offshore-technology.com/comment/north-
america-has-the-highest-oil-and-gas-pipeline-length-globally
Real Estate References 1. National Association of Realtors:
https://www.nar.realtor/sites/default/files/documents/2019-real-estate-in-a-digital-age-08-22-2019.pdf
2. Rismedia: http://rismedia.com/2016/12/20/drones-real-estate-marketing/ 3. Real Trends: https://www.realtrends.com/blog/realtor-marketing-tools 4. National Association of Realtors: https://www.nar.realtor/research-and-
statistics/quick-real-estate-statistics
Utilities References 1. Fierce Wireless: https://www.fiercewireless.com/wireless/china-tower-counts-1-
95m-tower-sites-dwarfing-us-tower-sites 2. Forbes: https://www.forbes.com/sites/stephenmcbride1/2019/03/20/this-
stock-is-americas-5g-landlord-and-it-pays-a-3-8-dividend/#61e4a9056644 3. Wireless Estimator: http://wirelessestimator.com/content/industryinfo/312 4. Wall Street Journal: https://www.wsj.com/articles/pg-e-sparked-at-least-1-500-
california-fires-now-the-utility-faces-collapse-11547410768 5. Wall Street Journal: https://www.wsj.com/articles/california-utilities-hope-
drones-ai-will-lower-risk-of-future-wildfires-11599816601 6. Energy Information Administration:
https://www.eia.gov/todayinenergy/detail.php?id=40913 7. Bureau of Labor Statistics: https://www.bls.gov/oes/current/oes499051.htm 8. Royal Dutch Shell: https://www.shell.com/business-customers/lubricants-for-
business/sector-expertise/power-industry/wind-power/true-cost-of-wind-turbine-maintenance.html
9. Next Era Energy: https://www.nexteraenergyresources.com/what-we-do/wind/faqs.html
168
10 Appendix B: References
Mining References
1. National Mining Association: https://nma.org/wp-content/uploads/2018/10/msha_number_operations_by_sector_2018.pdf
2. European Commission: https://ec.europa.eu/eurostat/statistics-explained/index.php/Mining_and_quarrying_statistics_-_NACE_Rev._2#Structural_profile
3. Drone DJ: https://dronedj.com/2019/08/01/bhp-saves-5-million-using-drones/
Professional Videography References
1. CNN: https://money.cnn.com/2014/06/23/media/drones-news-research/ 2. Federal Aviation Administration:
https://www.faa.gov/uas/programs_partnerships/data_exchange/ 3. IBJ: https://www.ibj.com/articles/63395-local-tv-news-stations-abandon-or-
reduce-use-of-pricey-choppers 4. Time: https://time.com/5295594/drones-hollywood-artists/ 5. Deadline: https://deadline.com/2020/03/mpaa-annual-report-box-office-
worldwide-revenues-mobile-home-entertainment-1202879659/ 6. Panasonic:
https://www.panasonic.com/global/corporate/ir/pdf/annual/2019/pana_ar2019e_12.pdf
7. FilmLA: https://www.filmla.com/wp-content/uploads/2020/01/2019_YTD_Local_production_days-WEB.pdf
169
10 Appendix B: References
Consumer References
1. The Verge: https://www.theverge.com/2019/9/3/20848383/dji-drones-price-raises-trump-china-tariffs-trade-war
2. Federal Aviation Administration: https://www.faa.gov/uas/resources/by_the_numbers/
3. MyLio: https://focus.mylio.com/tech-today/how-many-photos-will-be-taken-in-2020
4. Federal Aviation Administration: https://www.faa.gov/data_research/aviation/aerospace_forecasts/media/unmanned_aircraft_systems.pdf
5. GoPro: https://s21.q4cdn.com/291350743/files/doc_financials/2020/q2/Supplemental-Slides.pdf
6. Nintendo: https://www.nintendo.co.jp/ir/en/finance/hard_soft/ 7. McKinsey: https://www.mckinsey.com/business-functions/marketing-and-
sales/our-insights/a-global-view-of-how-consumer-behavior-is-changing-amid-covid-19
8. Camera and Imaging Products Association: http://www.cipa.jp/stats/dc_e.html 9. Congress.gov: https://www.congress.gov/bill/116th-congress/senate-bill/2502 10. New York Times: https://www.nytimes.com/2020/07/23/us/politics/dji-
drones-security-vulnerability.html 11. Reuters: https://www.reuters.com/article/us-china-tech-dji-focus/chinese-
dronemaker-dji-makes-sweeping-cuts-in-long-march-reforms-idUSKCN25D0HF 12. Parrot: https://s3.eu-central-1.amazonaws.com/corporate.parrot.com/files/s3fs-
public/2019-03/Parrot_CP_T4-2018_20190315_EN_vDEF.pdf
170
10 Appendix B: References
Public Safety References
1. CNN: https://www.cnn.com/2020/07/08/asia/south-korea-drones-trnd/index.html
2. DoJ: https://cops.usdoj.gov/RIC/Publications/cops-w0894-pub.pdf 3. NBC San Diego: https://www.nbcsandiego.com/news/local/chula-vista-pds-
drone-program-given-special-permission-by-faa-to-operate-in-low-altitudes/2360811/
4. Bard College Drone Center: https://dronecenter.bard.edu/public-safety-drones-update/
5. TechCrunch: https://techcrunch.com/2020/03/11/us-order-foreign-drones/ 6. Vera Institute of Justice: https://www.vera.org/publications/what-policing-
costs-in-americas-biggest-cities 7. Axon:
https://s22.q4cdn.com/113350915/files/doc_downloads/gov_docs/annual/AAXN-2019-Annual-Report.pdf
8. DroneDJ: https://dronedj.com/2020/04/07/daytona-beach-police-drones-enforce-covide-19-park-closure/
9. Chula Vista PD: https://www.chulavistaca.gov/departments/police-department/programs/uas-drone-program
10. San Diego PD: https://www.sandiego.gov/sites/default/files/legacy/citycouncil/cd3/pdf/faqairsupport.pdf
11. FireRescue1: https://www.firerescue1.com/emergency-response-in-the-drone-age/articles/6-takeaways-on-how-fire-departments-are-using-drones-and-the-barriers-preventing-purchase-CDQozj7OMa49hjHd/
12. FireApparatusMagazine: https://www.fireapparatusmagazine.com/2018/10/01/fire-department-drones-serve-a-variety-of-needs-on-incident-scenes/#gref
13. TechCrunch: https://techcrunch.com/2019/10/20/the-los-angeles-fire-department-wants-more-drones/
171
10 Appendix B: References
Logistics References 1. UPS: https://www.ups.com/us/en/services/knowledge-
center/article.page?name=the-sky-is-the-limit-for-medical-drones&kid=art169a5e96709
2. The Verge: https://www.theverge.com/2019/4/9/18301782/wing-drone-delivery-google-alphabet-canberra-australia-public-launch
3. Washington Post: https://www.washingtonpost.com/local/trafficandcommuting/virginia-town-becomes-home-to-nations-first-drone-package-delivery-service/2019/10/19/4b777d24-f1ff-11e9-89eb-ec56cd414732_story.html
4. CNBC: https://www.cnbc.com/2020/09/14/amazon-walmart-delivery-drone-battle-escalates-with-zipline-deal.html
5. Fortune: https://fortune.com/2020/07/13/coronavirus-drones-dji-wing-flytrex-covid-19-pandemic/
6. Business Insider: https://www.businessinsider.com/zipline-drones-deliver-masks-for-coronavirus-doctors-2020-6#zipline-drones-operate-out-of-an-emergency-drone-fulfillment-center-in-kannapolis-north-carolina-2
7. McKinsey & Company: https://www.mckinsey.com/~/media/mckinsey/industries/travel%20transport%20and%20logistics/our%20insights/how%20customer%20demands%20are%20reshaping%20last%20mile%20delivery/parcel_delivery_the_future_of_last_mile.ashx
Passenger References 1. CNBC: https://www.cnbc.com/2017/12/07/boeing-ceo-80-percent-of-people-
never-flown-for-us-that-means-growth.html 2. Reuters: https://www.reuters.com/article/us-airlines-safety-
worldwide/fatalities-on-commercial-passenger-aircraft-rise-in-2018-idUSKCN1OW007
3. National Safety Council: https://injuryfacts.nsc.org/motor-vehicle/historical-fatality-trends/deaths-and-rates/
4. Insurance Institute for Highway Safety: https://www.iihs.org/topics/fatality-statistics/detail/state-by-state
5. SF Examiner: https://www.sfexaminer.com/news/with-traffic-on-the-rise-city-looks-to-congestion-pricing-as-a-possible-fix/
6. Uber: https://s23.q4cdn.com/407969754/files/doc_financials/2019/ar/Uber-Technologies-Inc-2019-Annual-Report.pdf
7. International Air Transport Association: https://www.iata.org/contentassets/a686ff624550453e8bf0c9b3f7f0ab26/wats-2019-mediakit.pdf
8. The Verge: https://www.theverge.com/2020/12/2/22086597/uber-sells-flying-taxi-elevate-joby-aviation
9. CNN: https://www.cnn.com/2019/10/04/tech/uber-copter-review/index.html
172
10 Appendix B: References
Conclusion References
1. Drone Industry Insights; https://www.droneii.com/drone-autonomy 2. Forbes: https://www.forbes.com/sites/jeremybogaisky/2020/11/23/joby-
batteries-electric-aviation/?sh=4e84ef1776a7 3. Sandiego County:
https://www.sandiegocounty.gov/dplu/docs/081024/TM5499-NOISE-T.pdf 4. The conversation: https://theconversation.com/drones-to-deliver-incessant-
buzzing-noise-and-packages-116257 5. OSHA: https://www.osha.gov/Publications/laboratory/OSHAfactsheet-
laboratory-safety-noise.pdf 6. FAA: https://www.faa.gov/regulations_policies/policy_guidance/noise/history/