chronology and weathering history of red dunes (teri sands
TRANSCRIPT

*Addresses of the authors: 1Department of Geology and Environmental Science, Christ College, Irinjalakuda, Thrissur, Kerala, India, 680 125; 2Department of Environmental Science, University of Kerala, Kariavattom Campus, Thiruvananthapuram, Kerala, India, 695 581; 3Federal Institute for Geosciences and Natural Resources, Stilleweg 2, 30655 Hannover, Germany; 4Leibniz Institute for Applied Geophysics, Geochronology and Isotope Hydrology, Stilleweg 2, 30655 Hannover, Germany / [email protected].
Chronology and weathering history of red dunes (Teri Sands) in the southwest coast of Tamil Nadu, India
Linto Alappat1,4, Sabu Joseph2, Sumiko Tsukamoto4, Stephan Kaufhold3 & Manfred Frechen4*
Alappat, L., Joseph, S., Tsukamoto, S., Kaufhold, S. & Frechen, M. (2016): Chronology and weathering history of red dunes (Teri Sands) in the southwest coast of Tamil Nadu, India. – Z. Dt. Ges. Geowiss., 168: 183–198, Stuttgart.
Abstract: Red dune sands in the southwest coast of Tamil Nadu, India, were examined to understand its chronology of formation using OSL chronometry. Degrees of weathering of these sands were deduced from field observation, clay mineral composition and geochemistry of the bulk sample. The sands were found to have been deposited in two episodes, i.e. be-tween 16–9 ka and at 4.5 ka in the middle and lower parts of the dune field. The late Pleistocene deposition of sand in the upper terrace was associated with abundant sand supply owing to the lower sea level. The second stage of dune accretion at 4.5 ka was observed at the lower level relative to the present day coast. It was presumably associated with late Holocene higher sea level in the coasts of south India and deposition of sand in the backshore region on top of the previous indurated aeolian deposits. The elevated topography of the area acted as an obstruction to trap the sand-laden onshore winds and fa-cilitated accumulation. Spatio-temporal variation in sand accretion was observed in terrace I at the central part of the dunes. The geochemistry and mineralogy of the sands is controlled by initial aeolian sediment sorting and chemical weathering leading to the alteration of feldspars to kaolinite and associated compositional variations in the major elements. The red colour in the sands is found to be related to the concentration of hematite in the fine fraction.
Keywords: OSL dating, chemical index of alteration, red dunes, chemical weathering, Pleistocene, Holocene
© 2016 E. Schweizerbart’sche Verlagsbuchhandlung, Stuttgart, Germany DOI: 10.1127/zdgg/2016/0055
www.schweizerbart.de1860-1804/0055 $ 7.20
Z. Dt. Ges. Geowiss. (German J. Geol.), 168 (1), p. 183–198, 10 figs., 3 tables ArticlePublished online April 2016
1. Introduction
The red dunes with its distinct colour and apparent similarity with red beds observed in the geological strata (Bensing et al. 2005) has attracted the interest of many researchers (Folk 1976, Gardner & Pye 1981, Norris 1969, Pye & Tsoar 2009, Walker 1979). Red dunes occur along the coastal belts typi-cally in the low to mid-latitude areas of the world (Nages-wara Rao et al. 2006, Roskin et al. 2011, 2012, Singhvi et al. 1986, Zheng & Wei 1998, Zhang et al. 2008). Sand mobilisa-tion in these coastal areas is largely controlled by variation in the regional climate (mainly wind and precipitation), sand availability and sea level (Kocurek 1998). The reddening may occur post-depositional (e.g. Berner 1969, Gardner & Pye 1981) or may be due to the presence of red detrital sand and clay (e.g. Bensing et al. 2005, Besler 2008). There were several questions raised by earlier workers such as nature and climatic conditions favourable for the formation of red sands and the role of time in the reddening process (e.g. Gardner & Pye 1981 and references therein). Redness index
had also been used as an indicator of relative age of its for-mation (Norris 1969, Turner 1980, Walker 1979). However, Roskin et al. (2012) have shown the insensitivity of colour of this aeolian formation to age. One of the major factors be-hind the dune reddening is weathering of heavy minerals and/or progressive loss of ferromagnesian minerals present in the sand (Gardner 1981, Van Houten 1961, 1964) under the influence of precipitation and temperature (Folk 1976, Gardner & Pye 1981, Pye & Tsoar 2009).
Red dune sands in the southeast coast of India (Fig. 1A) have been studied for its colour (Gardner 1981, Gardner & Pye 1981), sedimentology and geochemistry (Joseph et al. 1997, 1999, 2002), palaeoclimate and archaeology (Gardner & Martingell 1990, Joseph & Thrivikramji 2005, Jayangonda-perumal et al. 2012, Thrivikramji et al. 2008) and for its eco-nomic significance (Chandrasekharan & Murugan 2001). However, the chronologies of these sand dunes are largely unknown. Except for few attempts by Jayagondaperumal et al. (2012) and Alappat et al. (2013) using luminescence dating, the majority of studies have relied on the limited radiocarbon

184 Linto Alappat et al.
dates available from land-snails (Gardner 1981) and rhizoliths (Joseph & Thrivikramji 2005) found in the sand. When the general lack of well-preserved organic materials in dunes lim-its the application of 14C dating, optically stimulated lumines-cence (OSL) dating is a useful chronological tool, which uses quartz and feldspar that are ubiquitous in nature.
The present study reports results from three key sections from the north and south of a dune transect at Muttom (Fig. 1B) in the southwest coast of India. An attempt has been made to extend the chronological information of the dune complex reported in the earlier publications (Alappat et al. 2013, Jayagondaperumal et al. 2012). This study aims to at-tain the following objectives: (i) to develop an event chro-nology to understand the spatial and temporal expansion of dune field on the west coast, (ii) to establish the role of geo-morphology and sea level in sand accretion, and (iii) to de-termine the stratigraphic and geochemical signatures for in-ferring the process of weathering and reddening of sands. OSL dating was used to understand the chronology and geo-chemistry of sands to obtain information on weathering.
2. Study area
The study area is located at Muttom in the southwest coast of India (8°07’56” N; 77°19’84” E), and belongs to the southern part of the red sand belt present between latitude of N 8°00’ to 9°30’ and longitude of E 77°18’ to 79° 00’ (Fig. 1). The sections offer large thickness of deposits and their occurrence against an elevated upland offers unique opportunity to col-lect samples on a spatial extension. The aerial extent of red sand on this small promontory is approximately 3 km2, and ~1 km2 area has deep gully erosion with badland topography towards the coast. These dunes have indurated sections at two distinct levels and are termed as terrace I and
II henceforth. Terrace I is located about 900 m inland with an elevation of ~75 m above MSL (Fig. 1B). The dune is ori-ented NNW to SSE, spreading for about 1.7 km. Precipitation data (2004–2011) from the Indian Meteorological Depart-ment show that the area receives ~1300 mm average annual rainfall from both the SW and NE monsoons (http://www.imd.gov.in/section/hydro/distrainfall/districtrain.html).
2.1 Regional geology and geomorphology
Geology of the area is represented by the Khondalite Belt, south of the Southern Granulite Terrain that has undergone high-grade, high to ultrahigh temperature metamorphism
Fig. 1: (A) Map of the study area indicating sample location in the west coast and distribution of red dunes at the coasts of Tamil Nadu (both coastal and inland dunes). Inset showing Tamil Nadu, India, where red dunes are seen. (B) Digital elevation model of Muttom in the west coast with sections and terrace contours marked. White stars indicate the sections MT-1-4 studied by Alappat et al. (2013). Figure modified after Alappat et al. (2013).
Fig. 2: Geological map of parts of South Kerala and Tamil Nadu. Modified after the Geological and Mineral Map of Kerala and Tamil Nadu, Geological Survey of India (2005, 2006).
185Chronology and weathering history of red dunes (Teri Sands) in the southwest coast of Tamil Nadu, India
(Chacko et al. 1987, 1996). Archaean granulitic rocks, pri-marily peninsular gneiss (garnet-sillimanite-biotite, graphite gneiss) and charnockite gneiss are the major rocks found in the region (Fig. 2). Bands of fine- to medium-grain pyrox-ene-bearing mafic granulite, patches of garnet-biotite gneiss, aluminous metapelites and calc-silicate rocks and un-meta-
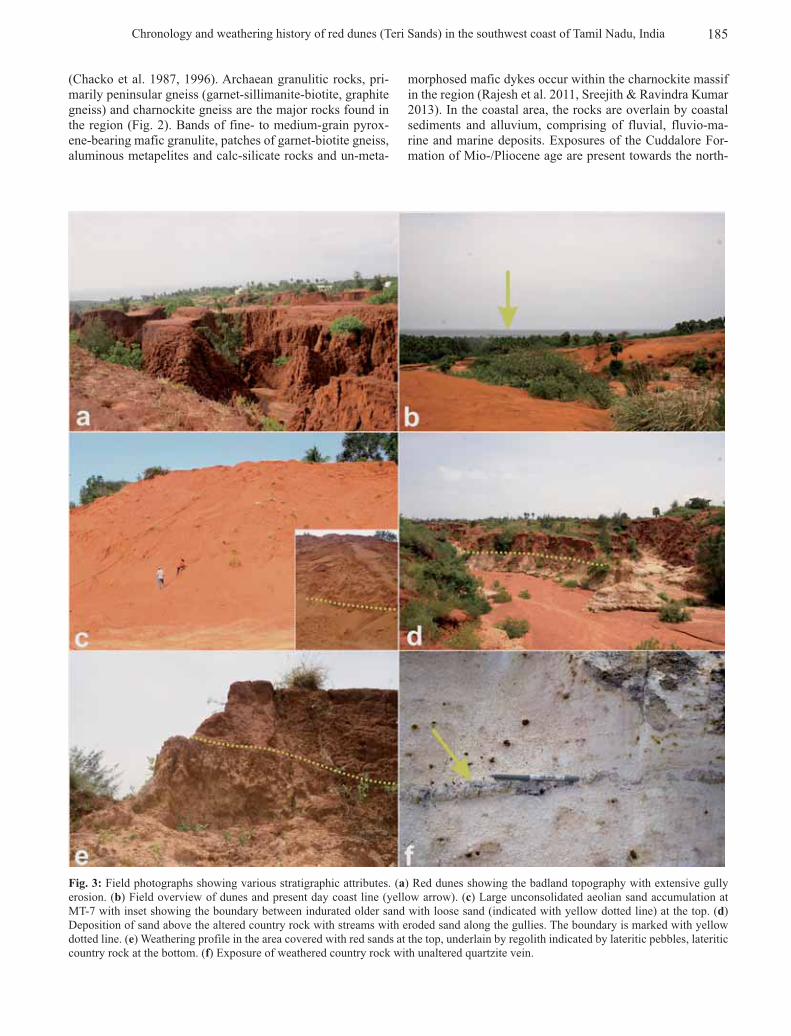
Fig. 3: Field photographs showing various stratigraphic attributes. (a) Red dunes showing the badland topography with extensive gully erosion. (b) Field overview of dunes and present day coast line (yellow arrow). (c) Large unconsolidated aeolian sand accumulation at MT-7 with inset showing the boundary between indurated older sand with loose sand (indicated with yellow dotted line) at the top. (d) Deposition of sand above the altered country rock with streams with eroded sand along the gullies. The boundary is marked with yellow dotted line. (e) Weathering profile in the area covered with red sands at the top, underlain by regolith indicated by lateritic pebbles, lateritic country rock at the bottom. (f) Exposure of weathered country rock with unaltered quartzite vein.
morphosed mafic dykes occur within the charnockite massif in the region (Rajesh et al. 2011, Sreejith & Ravindra Kumar 2013). In the coastal area, the rocks are overlain by coastal sediments and alluvium, comprising of fluvial, fluvio-ma-rine and marine deposits. Exposures of the Cuddalore For-mation of Mio-/Pliocene age are present towards the north-
186 Linto Alappat et al.
east. The red sands in the coastal dunes directly overlie the basement sandstone formation, whereas in the near coastal dunes it rests on a discrete calcrete horizon. These coastal red dune sands have been reported to be a valuable source of heavy minerals such as ilmenite, rutile, zircon, monazite and sillimanite (Chandrasekharan & Murugan 2001).
The study area occurs as a promontory overlooking into the Arabian Sea, forming a headland and a bay configuration (Fig. 1B). The general geomorphologic features of the area include streams, wetlands, flood plains, palaeo-river chan-nels etc. This palaeo-landscape is cut across by modern dunes, beach ridges, swales and beaches along the coast. The area exhibits badland topography, exposing a ~10 m thick sand unit in the central part and weathered country rock to-wards the coast, which dips gently towards the SE (Figs. 3a, b, d). The exposures in the area show high degree of weath-ering in which the red sands are seen in the upper part, which is underlain by a regolith cover with laterised, weathered country rock at the bottom (Figs. 3c, d, e, f).
2.2 Sample collection
Red dunes were present in two terraces at different levels. Terrace I is located in the upper level (30–75 m above MSL) about 1 km from the coast. Sections here show a continuous, large accumulation of sand, mostly consolidated with a thin (<1 m) layer of loose massive sand accumulation at the top. Sands in the section were devoid of primary depositional structures in the consolidated section, and they were largely intact in the upper and loose units. Vertical polygonal cracks in the consolidated part were possibly formed due to the shrinking and swelling of clay in the interstitial matrix (Fig. 3a). Terrace II is closer (~300 m) to the coast and located at a lower level (20–30 m above MSL; Fig. 1b). Altogether eight samples were collected from three sections for OSL dating (Fig. 4), two from terrace I (MT-5 and 6) and one from terrace II (MT-7; Fig. 1). Results of chronological studies on the samples (Fig. 5) collected from the central part of the same area (MT-1 to 4) have been reported by an earlier study (Alappat et al. 2013; Fig. 5b). Section MT-5 is located at the northwest side (Fig. 1b and 5a) and MT- 6 in the central part of the dune system (Fig. 1b and 5b). Section MT-7 was exca-vated across an active dune, where the dune was in contact with the indurated palaeo-surface in the SE direction (Figs. 1a, 3c and 5a).
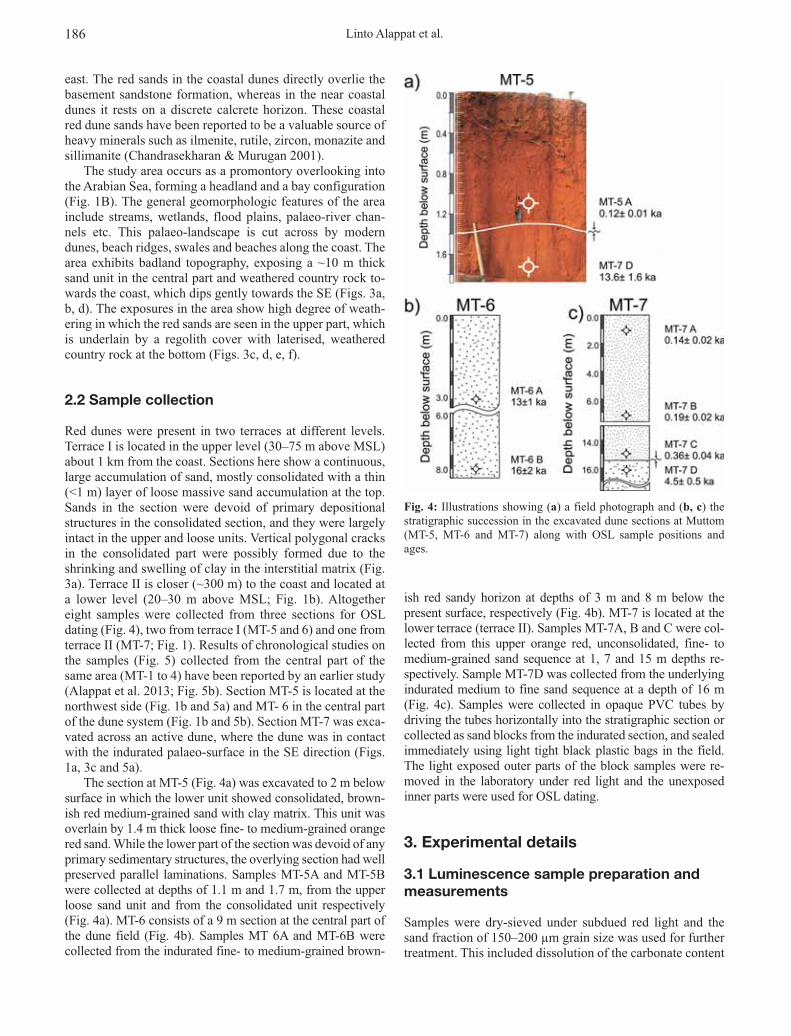
The section at MT-5 (Fig. 4a) was excavated to 2 m below surface in which the lower unit showed consolidated, brown-ish red medium-grained sand with clay matrix. This unit was overlain by 1.4 m thick loose fine- to medium-grained orange red sand. While the lower part of the section was devoid of any primary sedimentary structures, the overlying section had well preserved parallel laminations. Samples MT-5A and MT-5B were collected at depths of 1.1 m and 1.7 m, from the upper loose sand unit and from the consolidated unit respectively (Fig. 4a). MT-6 consists of a 9 m section at the central part of the dune field (Fig. 4b). Samples MT 6A and MT-6B were collected from the indurated fine- to medium-grained brown-
ish red sandy horizon at depths of 3 m and 8 m below the present surface, respectively (Fig. 4b). MT-7 is located at the lower terrace (terrace II). Samples MT-7A, B and C were col-lected from this upper orange red, unconsolidated, fine- to medium-grained sand sequence at 1, 7 and 15 m depths re-spectively. Sample MT-7D was collected from the underlying indurated medium to fine sand sequence at a depth of 16 m (Fig. 4c). Samples were collected in opaque PVC tubes by driving the tubes horizontally into the stratigraphic section or collected as sand blocks from the indurated section, and sealed immediately using light tight black plastic bags in the field. The light exposed outer parts of the block samples were re-moved in the laboratory under red light and the unexposed inner parts were used for OSL dating.
3. Experimental details
3.1 Luminescence sample preparation and measurements
Samples were dry-sieved under subdued red light and the sand fraction of 150–200 μm grain size was used for further treatment. This included dissolution of the carbonate content
Fig. 4: Illustrations showing (a) a field photograph and (b, c) the stratigraphic succession in the excavated dune sections at Muttom (MT-5, MT-6 and MT-7) along with OSL sample positions and ages.
187Chronology and weathering history of red dunes (Teri Sands) in the southwest coast of Tamil Nadu, India
30 nm). A Hoya U-340 (7.5 mm) filter was placed between the photomultiplier tube (PMT) and sample to detect lumi-nescence signals from quartz grains.
Dose recovery tests at various preheat temperatures (be-tween 160 and 260 °C at 20 °C increment) were carried out in order to understand the dependence of preheat tempera-ture used in the SAR protocol in recovering the known labo-ratory dose using two samples (MT-5B and MT-6A). Sample discs were bleached using blue LEDs and a known labora-tory dose of ~90 Gy was given. The dose recovery at differ-ent preheat temperature shows that the given dose was re-covered effectively at a preheat temperature between 180 and 200 °C with a cut heat of 160 °C (Fig. 6a). The dose re-covery values (mean of three aliquots) along with their recy-cling and recuperation (Fig. 6b) have shown that a combina-tion of 200 °C preheat and 160 °C cut heat is suitable for the De measurements.
The samples were tested for feldspar contamination by checking the post IR-OSL signal from an additional regen-eration dose point included at the end of the SAR protocol
with 0.1 N hydrochloric acid (HCl), disaggregation with 0.01 N sodium oxalate (C2Na2O4) and removal of organic matter with 30 % hydrogen peroxide (H2O2), as proposed by Aitken (1985). Quartz grains were separated from other min-erals by density separation using an aqueous solution of so-dium poly-tungstate (3Na2 WO4 9WO3 H2O) with the density of 2.65 g cm-3 and subsequently etched using 40 % hydro-fluoric acid (HF) for 80 minutes to remove any feldspar con-taminations and the alpha irradiated outer rim of quartz grains. Samples were then washed, dried and sieved again through the 150 μm mesh. The etched and sieved quartz grains (150 μm) were held as a monolayer of 6–4 mm dia-meter on stainless steel discs using silicone oil.
The single aliquot regenerative dose (SAR) protocol for quartz (Murray & Wintle 2000, Wintle & Murray 2006) was used to determine the equivalent dose of the samples. An automated Riso TL/OSL DA-15 reader attached to a 90Sr/90Y beta source, which delivers a dose rate of 0.16 Gy/s, was used for the OSL measurements. The quartz grains were stimulated by blue light emitting diodes (LED) (470 ±
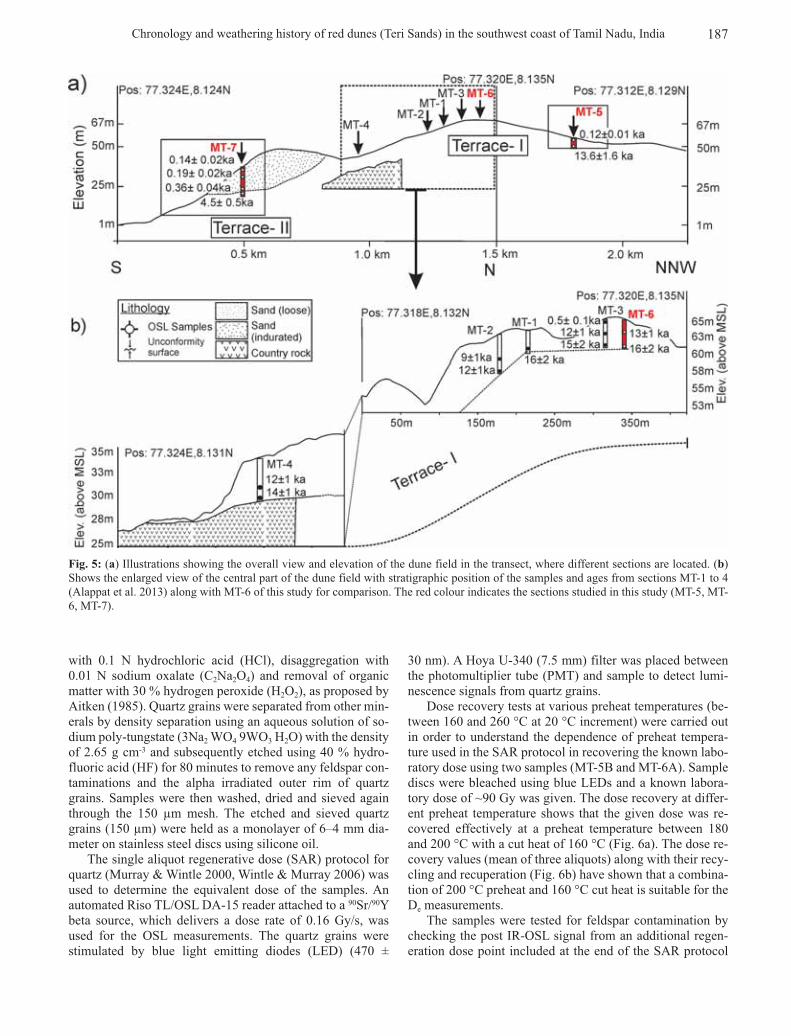
Fig. 5: (a) Illustrations showing the overall view and elevation of the dune field in the transect, where different sections are located. (b) Shows the enlarged view of the central part of the dune field with stratigraphic position of the samples and ages from sections MT-1 to 4 (Alappat et al. 2013) along with MT-6 of this study for comparison. The red colour indicates the sections studied in this study (MT-5, MT-6, MT-7).

188 Linto Alappat et al.
(Duller 2003). The measured De values were accepted if the recycling ratio was between 0.90 and 1.10, recuperation was <5 % of the natural (Murray & Wintle 2000) and the OSL-IR depletion ratio was between 0.85 and 1.15 (Duller 2003). Measurement uncertainty of 1.5 % was incorporated for cal-culation of De values. The total numbers of accepted aliquots out of measured are shown in Table 1. The De values were calculated using signals integrated over the first 0.64 s and an early background was subtracted corresponding to 1.12 to 2.4 s. The final De estimates were obtained from the frac-tional weighted mean of De values and standard error ob-tained from 17 to 48 aliquots for each sample. The over dis-persion (%) values (Table 1) of the distribution was calcu-lated using the central age model (Galbraith et al. 1999).
3.2 Dose rate measurements
Dose rate measurements were carried out on 700 g of dried sand samples, which were packed and sealed air-tight into Marinelli-beakers to prevent radon loss. The samples were stored for one month after sealing to re-establish 226Ra-222Rn equilibrium. External dose rates (Table 1) for the samples were calculated from the activity concentrations of decay
Fig. 6: Diagrams showing the (A) dose recovery ratio, (B) recy-cling and recuperation at various temperatures between 160 and 260 °C for samples MT-5B and MT-6A. Good dose recovery was observed at temperatures between 180 and 200 °C and a tempera-ture of 200 °C was chosen as the measurement temperature with a cut heat of 160 °C (highlighted in grey background).
Tab
le 1
: T
he la
b co
des,
dep
th, m
oist
ure
cont
ent a
nd d
etai
ls o
f do
se r
ate
and
lum
ines
cenc
e m
easu
rem
ents
of
sam
ples
in th
e st
udy.
De v
alue
s ar
e ca
lcul
ated
fro
m th
e fr
actio
nal w
eigh
ted
mea
n of
dis
trib
utio
n an
d st
anda
rd e
rror
s ar
e sh
own.
Ove
r-di
sper
sion
(%) i
s ca
lcul
ated
bas
ed o
n ce
ntra
l age
mod
el w
ith p
rogr
am in
corp
orat
ed w
ithin
the
Ana
lyst
(V4.
0) s
oftw
are
pack
age.
* =
Smal
l (~4
mm
) al
iquo
ts.
Sam
ple
IDL
ab C
ode
Dep
th
(cm
)M
oist
ure
cont
ent
(%)
K (%)
Th
(ppm
)U
(pp
m)
Cos
mic
dos
e(m
Gy
a-1)
Dos
e ra
te
(mG
y a-1
)D
e-m
ean
(Gy)
nO
D
(%)
Age
(ka)
MT-
5AL
UM
. 233
111
05
± 2
0.50
± 0
.01
479.
2 ±
0.1
21.4
9 ±
0.04
0.16
± 0
.02
32.2
± 3
.23.
9 ±
0.1
24 (
24)
170.
12 ±
0.0
1
MT-
5BL
UM
. 233
217
05
± 2
0.34
± 0
.01
107.
2 ±
0.1
5.31
± 0
.02
0.14
± 0
.01
7.4
± 0.
710
0.0
± 6.
121
(30
)29
13.6
± 1
.6
MT-
6A*
LU
M. 2
329
300
8 ±
20.
37 ±
0.0
013
8.3
± 0.
16.
14 ±
0.0
30.
10 ±
0.0
19.
0 ±
0.9
119.
0 ±
4.8
24 (
30)
1813
.2 ±
1.4
MT-
6B*
LU
M. 2
330
800
8 ±
20.
24 ±
0.0
013
2.6
± 0.
15.
62 ±
0.0
20.
04 ±
0.0
08.
5 ±
0.9
134.
6 ±
11.4
15 (
24)
2715
.9 ±
2.1
MT-
7AL
UM
. 233
310
05
± 2
0.27
± 0
.00
231.
1 ±
0.2
10.4
9 ±
0.03
0.16
± 0
.02
15.7
± 1
.62.
27 ±
0.0
925
(30
)18
0.14
± 0
.02
MT-
7BL
UM
. 233
470
05
± 2
0.22
± 0
.00
104.
5 ±
0.1
5.5
± 0.
030.
06 ±
0.0
17.
3 ±
0.7
1.35
± 0
.03
29 (
33)
120.
19 ±
0.0
2
MT-
7CL
UM
. 233
515
005
± 2
0.14
± 0
.00
52.9
± 0
.12.
81 ±
0.0
20.
03 ±
0.0
03.
7 ±
0.4
1.34
± 0
.04
20 (
24)
120.
36 ±
0.0
4
MT-
7D*
LU
M. 2
336
1600
5 ±
20.
33 ±
0.0
110
6.1
± 0.
16.
27 ±
0.0
20.
02 ±
0.0
07.
4 ±
0.7
32.9
± 1
.342
(48
)23
4.5
± 0.
5
189Chronology and weathering history of red dunes (Teri Sands) in the southwest coast of Tamil Nadu, India
chains 238U (214Bi and 214Pb), 232Th (228Ac, 212Pb and 208Tl) and 40K measured using high resolution gamma spectrometry (High Purity Germanium – HPGe) at the Leibniz Institute for Applied Geophysics (LIAG) in Hannover, Germany. The dose rate conversion factors of Guérin et al. (2011) and beta attenuation factors of Mejdahl (1979) were applied for calcu-lation. The cosmic dose rate was calculated based on the method proposed by Prescott & Hutton (1994), considering the geographic location, altitude and depth of sample. The moisture content varied (5–10 %; Table 1) over different pro-files and was used as the percentage of the present day water content to the dry weight of the unit sample. The internal dose rate of the quartz sample was assumed negligible, con-sidering the high concentration of external sources as the sole contributor to the dose rate of the sample (Table 1). The altitude of the area with respect to the mean sea level (MSL) was obtained using a Differential Global Positioning System (DGPS).
3.3 Bulk geochemistry and mineral composition
Geochemistry of the sands was used to ascertain the intensity of weathering and mineral alteration in the dune sands within the younger and older (based on OSL chronology) units. Samples from all studied units were analysed for bulk geo-chemistry to determine the major and trace element concen-tration. In addition to the bulk samples, the finer (<100 μm) fraction of samples from the older units were also analysed to understand the variation of major and minor elements. Geochemical element analyses were carried out by an X-ray fluorescence spectrometry (XRF) using Panalytical Axios and a PW2400 spectrometer at the Federal Institute for Geo-sciences and Natural Resources (BGR), Hannover, Germany. Samples were powdered, prepared by mixing with a flux ma-terial (Lithium-metaborate Spectroflux, Flux No. 100A, Alfa Aesar) and melting into glass beads in a graphite crucible, which were analysed by wavelength dispersive XRF (WD-XRF). To determine the loss on ignition (LOI) 1000 mg of sample material was heated to 1030 °C for 10 min.
XRD patterns were recorded using a Panalytical X’Pert Pro MPD X-ray diffractometer (Cu-Kα radiation generated at 40 kV and 30 mA), equipped with a variable divergence slit (20 mm irradiated length), primary and secondary soller, Scientific X’Celerator detector (active length 0.59°), and a sample changer (sample diameter 28 mm). The samples were investigated from 2° to 85° 2θ with a step size of 0.0167° 2θ and a measuring time of 10 sec per step. For specimen preparation, the top loading technique was used. For measuring mid infrared (MIR) spectra, the KBr pellet technique (1 mg sample / 200 mg KBr) was applied. Spectra were collected on a Thermo Nicolet Nexus FTIR spectrom-eter (MIR beam splitter: KBr, detector DTGS TEC). The resolution was adjusted to 2 cm-1.
The samples collected for OSL dating was subjected to grain size analyses, sand-silt-clay ratio to understand the tex-tural maturity and degree of sorting. About 100 g of each
sample was used for grain size analyses and the result was calculated using the method of Folk & Ward (1957) employ-ing the Gradistat programme (Blott & Pye 2001).
4. Results
4.1 OSL chronology
Dose rates range between 3.7 and 32.2 Gy ka-1 due to the high concentration of Th (53–479 ppm) in the sediment (Ta-ble 1). The De distributions of the samples have shown a tight normal distribution with less scatter between the De values (Fig. 7). The results of OSL dating are summarised in Table 1. The OSL dating of samples MT-5B collected from the lower part of the profile at a depth of 1.7 m gave an age of 13.6 ± 1.6 ka and MT-5B taken from the upper unit at a depth of 1.1 m was deposited at 0.12 ± 0.01 ka (Fig. 4a). The two samples (MT-6A, B) collected from the central part of the dunes at the profile MT-6 at depths of 3 and 8 m yielded ages of 13 ± 1 and 16 ± 2 ka, respectively (Fig. 4b ). MT-7D col-lected from the indurated unit at the lower part of profile MT-7 (close to present day coast) showed OSL ages of 4.5 ± 0.5 ka and for three samples (MT-7A, B and C) collected from the loose aeolian sand in the upper part at depths of 1, 7 and 15 m the OSL ages were 0.14 ± 0.02 ka, 0.19 ± 0.02 ka and 0.36 ± 0.04 ka, respectively (Fig. 4c).
4.2 Major and minor elements
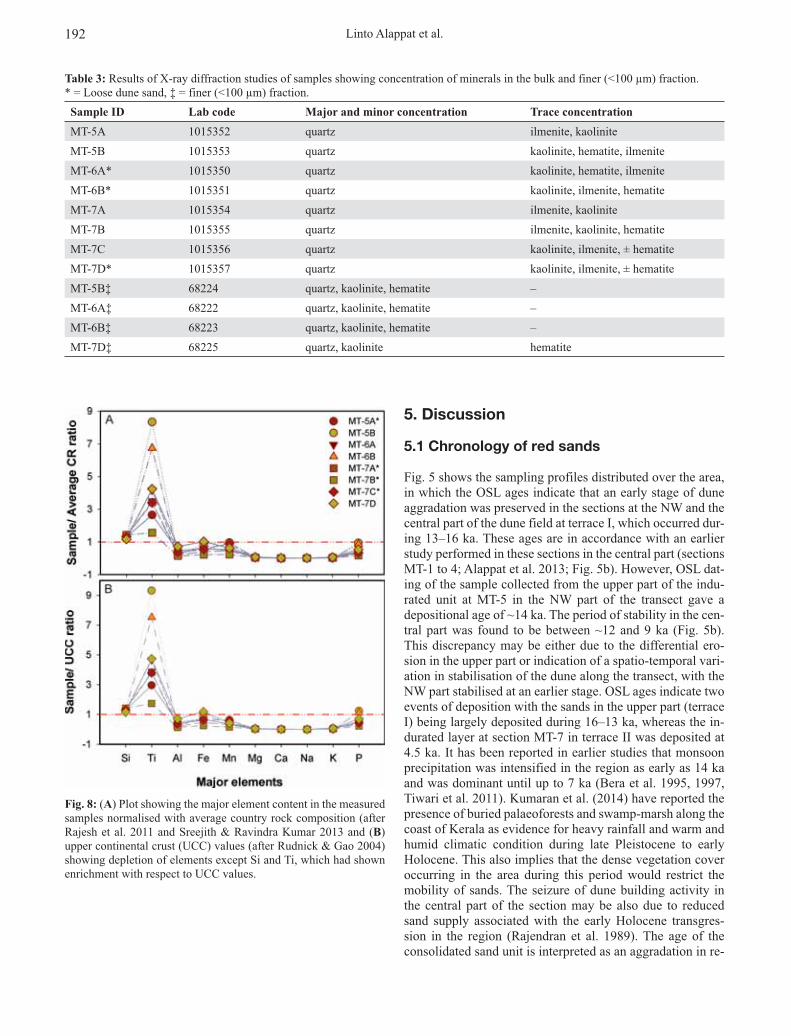
The sands in the area were moderately well sorted, having a mean grain size of ~230 μm with an average value of ~73 % sand and ~25 % clay. Major element data are presented as weight percentage of oxides and trace elements in ppm (Table 2). The chemical compositions of red dune sands are dominated by SiO2, Al2O3, Fe2O3 and TiO2 with decreasing order. The SiO2 concentration varied between 77 and 94 %, whereas Fe2O3 and TiO2 content varied between 1 and 6 % and Al2O3 within 2–11 %. The average concentration of ma-jor elements within the country rock was obtained from the values of 81 samples reported in Rajesh et al. (2011) and Sreejith & Ravindra Kumar (2013). A relative enrichment of SiO2 and TiO2 concentration, with depletion of Al2O3 and marginal reduction in the concentration of Fe2O3 in sands was observed, in comparison with the country rock and up-per continental crust (UCC) values (Rudnick & Gao 2003). While concentrations of MnO and P2O5 are similar to that of the CR and UCC, near complete depletion of Mg, Ca, Na and K was observed in the samples (Fig. 8). A relative enrich-ment of Ce, Hf, La, Nb, Nd, Sm, Th, U and Zr and depletion of Ba, Co, Cu, Ni, Rb and Sr was observed (Table 2).
The values for loss on ignition (LOI) showed higher values for older sand units, whereas the younger sand units showed much lesser values. The Chemical Index of Altera-tion (CIA; Nesbitt et al. 1996, Nesbitt & Young 1982) calcu-lated for the samples showed higher values between 0.97 and 0.98. Samples that were analysed from the finer

190 Linto Alappat et al.
(<100 μm) fraction showed a large reduction in the silicate concentration with marginal decrease in TiO2 concentration. The concentrations of Al and Fe also increased substantially along with trace element concentrations of B, Cr and Zr (Table 2).
4.3 XRD and IR analysis
All samples analysed with X-ray diffraction showed the dominance of quartz in the bulk fraction (Table 3). Samples from the older indurated units (MT-5B, MT-6A, B and MT-7 D) and sample MT-7C from the lower part of the loose aeo-lian sand unit contained kaolinite and some hematite with a minor amount of ilmenite. The samples from unconsolidated dune sands contained ilmenite and less kaolinite. In addition, the finer (<100 μm) fraction of samples (MT-5B, MT-6A, B and MT-7 D) showed predominance of quartz, kaolinite and hematite in decreasing order in the XRD analyses. Hematite was found as traces in the finer fraction of sample MT-7D.
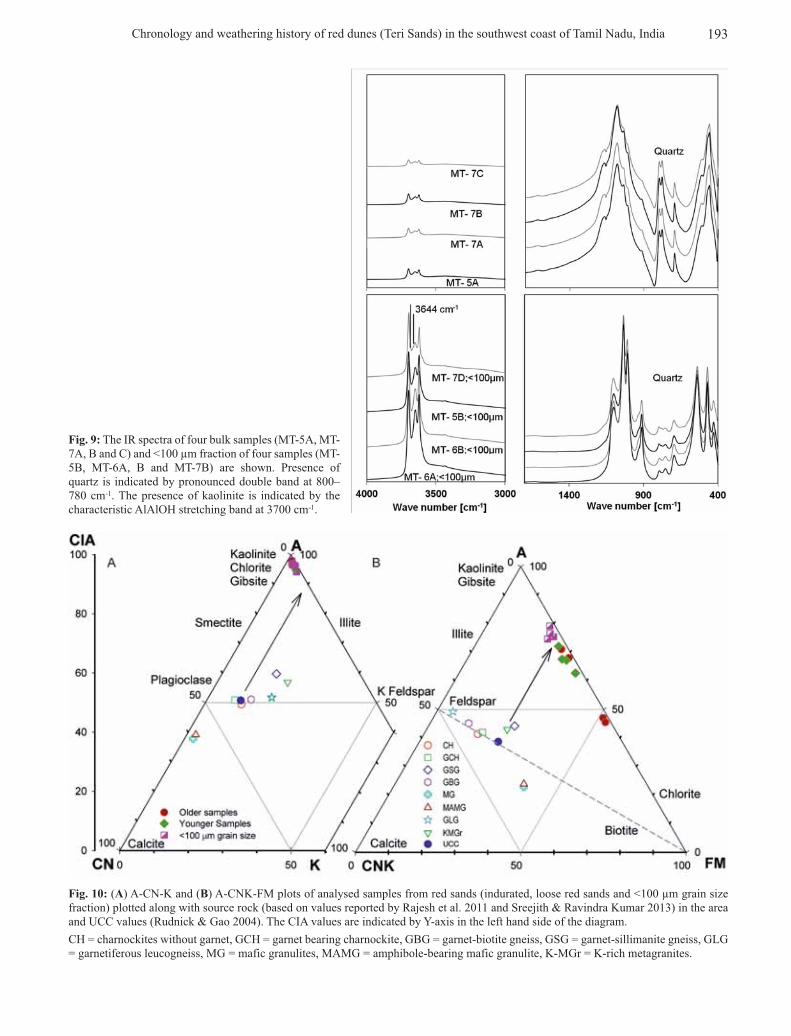
With the IR spectroscopy, all samples were confirmed with dominance of quartz, identified by the double peak at 800–780 cm-1 (Fig. 9). In the OH stretching region, however, the presence of a kaolinite type mineral is indicated by the characteristic AlAlOH stretching band at 3700 cm-1 (Fig. 9). Adjacent to the prominent kaolinite vibration band, the pres-ence of two further kaolinite bands and particularly the ab-sence of the fourth band at approximately 3644 cm-1 indicate to a b-axis disordered kaolinite. To further investigate this aspect, the finer (<100 μm) fraction of four samples was in-vestigated with IR. As evident from Fig. 9, only the sample MT-5B showed some intensity at 3644 cm-1, which indicates the highest degree of structural order compared to the other samples. By XRD, hematite and ilmenite were found ex-plaining the chemical data but they could not be detected by IR because they are IR insensitive. Neither IR nor XRD indi-cated the presence of mica or mica related phases.
Fig. 7: Diagram showing the equivalent dose (De) distribution of selected samples (MT-5A, MT-6A, MT-7B and MT-7D). The measured De, number of accepted aliquots (with total in brackets) and values of over-dispersion is also shown.

191Chronology and weathering history of red dunes (Teri Sands) in the southwest coast of Tamil Nadu, India
Table 2: Results of bulk geochemistry of samples including major element concentration (%) and trace elements (ppm) analysed using XRF. UCC concentration of elements reported by Rudnick & Gao (2004) is also shown along with calculated values of CIA for all samples.* = Loose dune sand, ‡ = <100 μm fraction, a = major elements recast to 100 % anhydrous.
Elements MT-5A*
MT-5B
MT-6A
MT-6B
MT-7A*
MT-7B*
MT-7C*
MT-7D
MT-5B‡
MT-6A‡
MT-6B‡
MT-7D‡
UCCa
Maj
or e
lem
ents
(%
)
SiO2 85.91 81.51 83.34 84.78 90.77 94.31 87.42 76.79 49.77 44.87 47.23 55.07 66.92
TiO2 1.90 5.96 2.98 4.81 2.46 1.11 2.42 3.03 1.77 2.29 2.96 2.05 0.64
Al2O3 7.07 3.00 5.26 2.68 2.98 2.00 5.35 10.94 25.83 27.79 27.22 22.01 15.40
Fe2O3 3.50 5.06 3.42 4.23 2.38 1.25 3.12 5.97 9.65 11.80 9.61 8.15 5.04
MnO 0.03 0.06 0.03 0.05 0.03 0.02 0.06 0.04 0.08 0.06 0.05 0.19 0.10
MgO 0.10 0.10 0.07 0.09 0.06 0.04 0.11 0.12 0.31 0.25 0.18 0.37 2.48
CaO 0.01 0.02 0.02 0.02 0.01 0.01 0.03 0.05 0.04 0.12 0.09 0.11 3.59
Na2O 0.01 0.01 0.01 0.01 0.01 0.01 0.01 0.02 0.05 0.05 0.03 0.05 3.27
K2O 0.20 0.06 0.06 0.05 0.07 0.05 0.22 0.20 0.76 0.54 0.34 0.98 2.80
P2O5 0.08 0.19 0.08 0.17 0.05 0.03 0.06 0.11 0.20 0.20 0.30 0.16 0.15
LOI (%) 0.78 2.88 4.23 2.07 0.81 0.98 0.75 2.17 11.01 11.38 11.00 10.19 --
Total 99.59 98.85 99.51 98.96 99.63 99.81 99.55 99.44 99.46 99.35 99.01 99.32 100.39
CIA 97 97 98 97 97 96 98 97 97 98 98 95 51
Tra
ce e
lem
ents
(m
g kg
-1)
Ba 60 23 69 21 20 19 50 90 624 247 340 201 224
Bi 2 3 2 3 2 2 2 2 0.16 4 2 2 2
Ce 306 1249 297 1114 234 112 296 387 63 536 741 439 571
Co 5 6 4 4 6 3 11 4 17.3 6 7 10 41
Cr 67 101 96 84 66 35 105 126 92 229 341 168 150
Cs 6 24 12 21 11 6 10 12 4.9 17 15 14 15
Cu 14 15 9 11 10 10 15 18 28 38 23 42 47
Ga 10 6 9 6 6 4 8 16 17.5 37 37 35 29
Hf 25 84 30 70 26 8 23 37 5.3 32 78 31 51
La 148 621 153 558 117 58 159 199 31 285 391 221 283
Mo 3 3 3 3 3 2 4 3 1.1 4 3 3 3
Nb 40 127 59 100 55 24 50 62 12 47 59 35 43
Nd 117 538 103 468 87 42 120 151 27 213 275 183 250
Ni 20 8 10 6 9 6 35 35 47 95 53 80 78
Pb 17 26 17 22 12 9 18 27 17 50 55 47 47
Rb 23 10 7 13 10 10 27 19 84 51 31 81 113
Sb 6 7 6 7 6 6 6 6 0.4 6 6 6 6
Sc 8 8 7 7 5 2 7 12 14 27 22 23 21
Sm 22 71 30 66 16 13 26 21 4.7 35 50 28 51
Sn 3 3 3 3 3 3 3 3 2.1 3 3 3 3
Sr 30 10 47 9 11 9 17 68 320 181 271 115 72
Ta 4 10 4 8 4 4 4 6 0.9 5 7 5 4
Th 107 485 123 432 99 46 113 138 10.5 155 273 136 174
U 4 18 4 20 3 3 6 5 2.7 6 11 7 10
V 75 138 84 105 68 36 76 131 97 215 189 169 143
W 4 4 4 4 4 4 4 4 1.9 8 7 4 10
Y 19 28 16 25 15 10 20 24 21 40 43 46 72
Zn 31 61 35 51 27 14 36 45 67 67 77 72 96
Zr 1024 4058 1540 3205 1281 516 1230 1546 193 1501 3465 1234 2089
192 Linto Alappat et al.
5. Discussion
5.1 Chronology of red sands
Fig. 5 shows the sampling profiles distributed over the area, in which the OSL ages indicate that an early stage of dune aggradation was preserved in the sections at the NW and the central part of the dune field at terrace I, which occurred dur-ing 13–16 ka. These ages are in accordance with an earlier study performed in these sections in the central part (sections MT-1 to 4; Alappat et al. 2013; Fig. 5b). However, OSL dat-ing of the sample collected from the upper part of the indu-rated unit at MT-5 in the NW part of the transect gave a depositional age of ~14 ka. The period of stability in the cen-tral part was found to be between ~12 and 9 ka (Fig. 5b). This discrepancy may be either due to the differential ero-sion in the upper part or indication of a spatio-temporal vari-ation in stabilisation of the dune along the transect, with the NW part stabilised at an earlier stage. OSL ages indicate two events of deposition with the sands in the upper part (terrace I) being largely deposited during 16–13 ka, whereas the in-durated layer at section MT-7 in terrace II was deposited at 4.5 ka. It has been reported in earlier studies that monsoon precipitation was intensified in the region as early as 14 ka and was dominant until up to 7 ka (Bera et al. 1995, 1997, Tiwari et al. 2011). Kumaran et al. (2014) have reported the presence of buried palaeoforests and swamp-marsh along the coast of Kerala as evidence for heavy rainfall and warm and humid climatic condition during late Pleistocene to early Holocene. This also implies that the dense vegetation cover occurring in the area during this period would restrict the mobility of sands. The seizure of dune building activity in the central part of the section may be also due to reduced sand supply associated with the early Holocene transgres-sion in the region (Rajendran et al. 1989). The age of the consolidated sand unit is interpreted as an aggradation in re-
Table 3: Results of X-ray diffraction studies of samples showing concentration of minerals in the bulk and finer (<100 μm) fraction.* = Loose dune sand, ‡ = finer (<100 μm) fraction.
Sample ID Lab code Major and minor concentration Trace concentration
MT-5A 1015352 quartz ilmenite, kaolinite
MT-5B 1015353 quartz kaolinite, hematite, ilmenite
MT-6A* 1015350 quartz kaolinite, hematite, ilmenite
MT-6B* 1015351 quartz kaolinite, ilmenite, hematite
MT-7A 1015354 quartz ilmenite, kaolinite
MT-7B 1015355 quartz ilmenite, kaolinite, hematite
MT-7C 1015356 quartz kaolinite, ilmenite, ± hematite
MT-7D* 1015357 quartz kaolinite, ilmenite, ± hematite
MT-5B‡ 68224 quartz, kaolinite, hematite –
MT-6A‡ 68222 quartz, kaolinite, hematite –
MT-6B‡ 68223 quartz, kaolinite, hematite –
MT-7D‡ 68225 quartz, kaolinite hematite
Fig. 8: (A) Plot showing the major element content in the measured samples normalised with average country rock composition (after Rajesh et al. 2011 and Sreejith & Ravindra Kumar 2013 and (B) upper continental crust (UCC) values (after Rudnick & Gao 2004) showing depletion of elements except Si and Ti, which had shown enrichment with respect to UCC values.
193Chronology and weathering history of red dunes (Teri Sands) in the southwest coast of Tamil Nadu, India
Fig. 9: The IR spectra of four bulk samples (MT-5A, MT-7A, B and C) and <100 μm fraction of four samples (MT-5B, MT-6A, B and MT-7B) are shown. Presence of quartz is indicated by pronounced double band at 800–780 cm-1. The presence of kaolinite is indicated by the characteristic AlAlOH stretching band at 3700 cm-1.
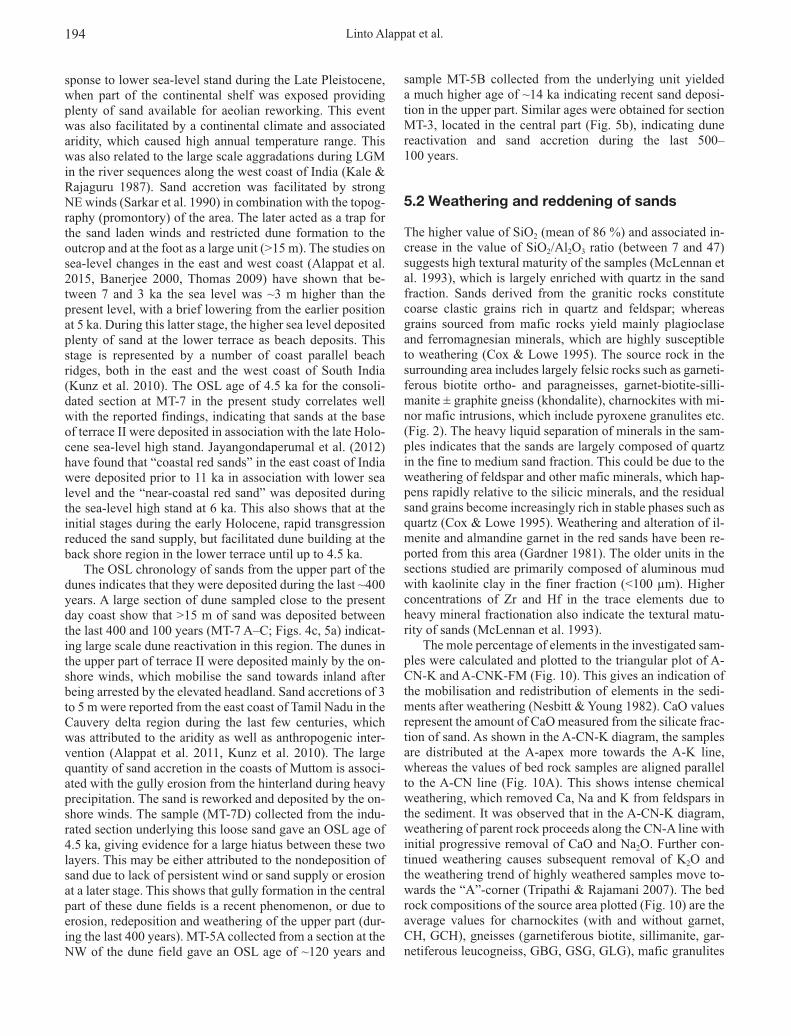
Fig. 10: (A) A-CN-K and (B) A-CNK-FM plots of analysed samples from red sands (indurated, loose red sands and <100 μm grain size fraction) plotted along with source rock (based on values reported by Rajesh et al. 2011 and Sreejith & Ravindra Kumar 2013) in the area and UCC values (Rudnick & Gao 2004). The CIA values are indicated by Y-axis in the left hand side of the diagram.
CH = charnockites without garnet, GCH = garnet bearing charnockite, GBG = garnet-biotite gneiss, GSG = garnet-sillimanite gneiss, GLG = garnetiferous leucogneiss, MG = mafic granulites, MAMG = amphibole-bearing mafic granulite, K-MGr = K-rich metagranites.
194 Linto Alappat et al.
sponse to lower sea-level stand during the Late Pleistocene, when part of the continental shelf was exposed providing plenty of sand available for aeolian reworking. This event was also facilitated by a continental climate and associated aridity, which caused high annual temperature range. This was also related to the large scale aggradations during LGM in the river sequences along the west coast of India (Kale & Rajaguru 1987). Sand accretion was facilitated by strong NE winds (Sarkar et al. 1990) in combination with the topog-raphy (promontory) of the area. The later acted as a trap for the sand laden winds and restricted dune formation to the outcrop and at the foot as a large unit (>15 m). The studies on sea-level changes in the east and west coast (Alappat et al. 2015, Banerjee 2000, Thomas 2009) have shown that be-tween 7 and 3 ka the sea level was ~3 m higher than the present level, with a brief lowering from the earlier position at 5 ka. During this latter stage, the higher sea level deposited plenty of sand at the lower terrace as beach deposits. This stage is represented by a number of coast parallel beach ridges, both in the east and the west coast of South India (Kunz et al. 2010). The OSL age of 4.5 ka for the consoli-dated section at MT-7 in the present study correlates well with the reported findings, indicating that sands at the base of terrace II were deposited in association with the late Holo-cene sea-level high stand. Jayangondaperumal et al. (2012) have found that “coastal red sands” in the east coast of India were deposited prior to 11 ka in association with lower sea level and the “near-coastal red sand” was deposited during the sea-level high stand at 6 ka. This also shows that at the initial stages during the early Holocene, rapid transgression reduced the sand supply, but facilitated dune building at the back shore region in the lower terrace until up to 4.5 ka.
The OSL chronology of sands from the upper part of the dunes indicates that they were deposited during the last ~400 years. A large section of dune sampled close to the present day coast show that >15 m of sand was deposited between the last 400 and 100 years (MT-7 A–C; Figs. 4c, 5a) indicat-ing large scale dune reactivation in this region. The dunes in the upper part of terrace II were deposited mainly by the on-shore winds, which mobilise the sand towards inland after being arrested by the elevated headland. Sand accretions of 3 to 5 m were reported from the east coast of Tamil Nadu in the Cauvery delta region during the last few centuries, which was attributed to the aridity as well as anthropogenic inter-vention (Alappat et al. 2011, Kunz et al. 2010). The large quantity of sand accretion in the coasts of Muttom is associ-ated with the gully erosion from the hinterland during heavy precipitation. The sand is reworked and deposited by the on-shore winds. The sample (MT-7D) collected from the indu-rated section underlying this loose sand gave an OSL age of 4.5 ka, giving evidence for a large hiatus between these two layers. This may be either attributed to the nondeposition of sand due to lack of persistent wind or sand supply or erosion at a later stage. This shows that gully formation in the central part of these dune fields is a recent phenomenon, or due to erosion, redeposition and weathering of the upper part (dur-ing the last 400 years). MT-5A collected from a section at the NW of the dune field gave an OSL age of ~120 years and
sample MT-5B collected from the underlying unit yielded a much higher age of ~14 ka indicating recent sand deposi-tion in the upper part. Similar ages were obtained for section MT-3, located in the central part (Fig. 5b), indicating dune reactivation and sand accretion during the last 500–100 years.
5.2 Weathering and reddening of sands
The higher value of SiO2 (mean of 86 %) and associated in-crease in the value of SiO2/Al2O3 ratio (between 7 and 47) suggests high textural maturity of the samples (McLennan et al. 1993), which is largely enriched with quartz in the sand fraction. Sands derived from the granitic rocks constitute coarse clastic grains rich in quartz and feldspar; whereas grains sourced from mafic rocks yield mainly plagioclase and ferromagnesian minerals, which are highly susceptible to weathering (Cox & Lowe 1995). The source rock in the surrounding area includes largely felsic rocks such as garneti-ferous biotite ortho- and paragneisses, garnet-biotite-silli-manite ± graphite gneiss (khondalite), charnockites with mi-nor mafic intrusions, which include pyroxene granulites etc. (Fig. 2). The heavy liquid separation of minerals in the sam-ples indicates that the sands are largely composed of quartz in the fine to medium sand fraction. This could be due to the weathering of feldspar and other mafic minerals, which hap-pens rapidly relative to the silicic minerals, and the residual sand grains become increasingly rich in stable phases such as quartz (Cox & Lowe 1995). Weathering and alteration of il-menite and almandine garnet in the red sands have been re-ported from this area (Gardner 1981). The older units in the sections studied are primarily composed of aluminous mud with kaolinite clay in the finer fraction (<100 μm). Higher concentrations of Zr and Hf in the trace elements due to heavy mineral fractionation also indicate the textural matu-rity of sands (McLennan et al. 1993).
The mole percentage of elements in the investigated sam-ples were calculated and plotted to the triangular plot of A-CN-K and A-CNK-FM (Fig. 10). This gives an indication of the mobilisation and redistribution of elements in the sedi-ments after weathering (Nesbitt & Young 1982). CaO values represent the amount of CaO measured from the silicate frac-tion of sand. As shown in the A-CN-K diagram, the samples are distributed at the A-apex more towards the A-K line, whereas the values of bed rock samples are aligned parallel to the A-CN line (Fig. 10A). This shows intense chemical weathering, which removed Ca, Na and K from feldspars in the sediment. It was observed that in the A-CN-K diagram, weathering of parent rock proceeds along the CN-A line with initial progressive removal of CaO and Na2O. Further con-tinued weathering causes subsequent removal of K2O and the weathering trend of highly weathered samples move to-wards the “A”-corner (Tripathi & Rajamani 2007). The bed rock compositions of the source area plotted (Fig. 10) are the average values for charnockites (with and without garnet, CH, GCH), gneisses (garnetiferous biotite, sillimanite, gar-netiferous leucogneiss, GBG, GSG, GLG), mafic granulites
195Chronology and weathering history of red dunes (Teri Sands) in the southwest coast of Tamil Nadu, India
(MG and amphibole-bearing mafic granulite, MAMG) and K-rich metagranites (K-MGr) based on major element con-centrations reported by Rajesh et al. (2011) and Sreejith & Ravindra Kumar (2013).
In the A-CNK-FM diagram, the weathering in the initial stage is demonstrated by removal of CNK and the values move along the A-CNK line towards the A-apex (Fig. 10). Further weathering causes enrichment of FM and samples moves along the A-FM trend (Fig. 10; Tripathi & Rajamani 2007). The CIA values obtained for unaltered bedrock in the region varies from 38 for mafic rocks such as mafic granulite (MG and MAMG) to 59 for granites and gneiss (CH, GCH, GBG, GSG, GLG, KMGr) as shown in Fig. 10. CIA values calculated for UCC (Rudnick & Gao 2003) gave a value close to 50, whereas the values obtained from our samples fall between 96 and 98 indicating high concentration of sec-ondary aluminous clay minerals. This correlates well with the results from XRD and IR analysis, which show the pres-ence of kaolinite in the samples.
Since change in CIA indicates the proportion of feldspar in the soil, consistently higher values (>96) obtained for the samples show that it was largely depleted with feldspar. Fur-thermore, the presence of Al2O3 in the samples may be largely due to the amount of clay (largely as coating on the sand surface) as well as little feldspar grains incorporated in the sands, which may have resulted in higher CIA values.
Contemporaneous climate exerts a major role in weather-ing and soil formation. Humid and tectonically stable condi-tions facilitate chemical weathering and alteration of primary minerals. Materials produced in the weathering profile sepa-rate into quartz-rich sand and highly aluminous mud, in which the secondary clay minerals are associated with the mud fraction (Nesbitt 2003). In tropical climates, the second-ary phases formed during the incongruent dissolution of sili-cate minerals due to chemical weathering are kaolinite, Al and Fe hydroxides. As these minerals do not incorporate Ca, Na, K and Mg, these are largely dissolved in solutions (Gail-lardet et al. 1999). The bulk of red sands are generally en-riched in Si, Fe, Al and Ti along with associated depletion of Mg, Ca, Na and K. Al and Ti are found to be immobile ele-ments during sediment weathering (Young & Nesbitt 1998). However, the concentration of Si in the finer (<100 μm) frac-tion was reduced to a mean value ~57 % of the bulk fraction, furthermore an increase in Fe2O3 + MgO was observed. The samples showed distinct enrichment of Al, Ca, Na and K in the finer fraction, indicating the removal of feldspars from coarse grains and enrichment of the same towards the finer fraction (Table 2). Higher relative concentration of feldspars in red dunes in the finer fraction was reported by Joseph et al. (1999), due to breakdown and progressive removal of feld-spar from the larger grain fraction. The removal of plagio-clase from the sands due to its relatively less resistance to the weathering solutions indicates a degree of weathering in which plagioclase was converted into clay mineral (McLen-nan et al. 2003). The geochemical as well as spectroscopic (XRD and IR analysis) data indicate that the incorporation of clay into the finer fractions is related to the in-situ weather-ing of feldspars.
Trace elements that are not incorporated into clay miner-als or oxides are either removed by the solutions or absorbed into the surfaces of clay minerals and other charged particles during weathering (Cox & Lowe 1995). Heavy minerals such as zircon, monazite, chromite, ilmenite, titanite and ru-tile are the important carriers of trace elements in clastic sediments (Veizer & Mackenzie 2004). The process of sort-ing during aeolian transportation is highly efficient in the concentration of heavy minerals in the sand fraction. High concentrations of Zr and Hf were observed in these sands and these were related to the heavy mineral zircon in placer sands, the presence of which has been reported in the red sands (Angusamy & Rajamanickam 2000, Dinesh et al. 2010, Nageswara Rao et al. 2006). The study also reveals the role of heavy mineral fractionation during sediment sorting and recycling (McLennan et al. 1993) as indicated by the substantially high values of Zr/Sc (between 128 and 507) and Th/Sc (between 12 and 62) compared to the UCC values (13.8 and 0.8 respectively; Rudnick & Gao 2003). Except two samples (MT-6A and MT-7D), all samples have shown substantial increase in Rb/Sr ratio (ranging between 0.8 and 1.6) compared to a value of 0.3 for UCC concentration. Dur-ing weathering a significant increase in the Rb/Sr ratio is ob-served because the larger alkali trace element Rb+ is retained on exchange sites of clays compared to the smaller Sr2+ ele-ment (McLennan et al. 1993). The trace element concentra-tion indicated by the enrichment of La and Th along with higher ratios of these elements with Sc reflects the relatively felsic average provenance compositions (McLennan et al. 1993).
The characteristic red colour in the sands is associated with the hematite present in their matrix (Goss 1987). The origin of red colour in the red beds of geological formations can be explained in two ways, as either iron oxides or hema-tite of detrital origin from the lateritic weathering of source rocks (Van Houten 1961, 1964) or of diagenetic origin, from the weathering of iron bearing minerals (Walker 1967, 1979, Folk 1976, Besler 2008). The red colour of the sands in the study area was attributed to iron oxides formed in situ from the weathering of heavy minerals, primarily almandine gar-net with the presence of intra-stratal solution (Gardner 1981, Gardner & Pye 1981, Joseph et al. 1999, Thrivikramji et al. 2008) occurring either as coatings on sand grains or as stain-ing on intergranular clay matrix (Gardner & Pye 1981). In natural conditions, ferric oxyhydroxides are precipitated from the supersaturated aqueous solution with hematite and goethite, in which goethite precipitates at low temperature and pressure. Hematite on the other hand was formed from long-term ageing of amorphous hydrated Fe oxides (limo-nite) or by dehydration of crystalline goethite (Berner 1969, Goss 1987, Langmuir 1971, Tripathi & Rajamani 2007). These liberated iron oxides then are attached to the clay min-erals and coat the quartz grains (Besler 2008). It was ob-served that garnet, which is found in larger quantities in beach sands of south India, is insignificant in red sands occurring in the same region (Chandrasekharan & Muru-gan 2001). The XRD analysis of samples from red sands have shown the presence of hematite in the finer fraction of
196 Linto Alappat et al.
the indurated dunes. Dune formation is favoured under arid to semi-arid conditions and the reddening of dune sands must have occurred when the climatic conditions became more humid with enhanced precipitation. The analysis of samples from the finer fraction (<100 μm) of red sands showed presence of kaolinite and hematite in the sand ma-trix. XRD analysis of clay collected from the quartz grain surface was reported to have shown the presence of kaolinite and hematite (Thrivikramji et al. 2008, Besler 2008). Kaolin-ite is effective in transporting iron on the surfaces of clay particles as oxides and oxyhydroxides (Carroll 1958, Ben-sing et al. 2005).
The upper part of the dune building period in the studied section occurs in a time where other proxy records (pollens and C and O isotopes) indicate gradual strengthening of SW monsoon with periods of intermittent dry intervals (Tiwari et al. 2011). The stable carbon isotope ratios of peats from the Nilgiri Hills, South India, had shown clear predominance of C4 vegetation during LGM, which generally is associated with arid conditions and declining values, after ~16 ka indi-cate moist C3 type vegetation before again giving way to the C4 vegetation between 10–6 ka (Sukumar et al. 1993, Raja-gopalan et al. 1997). The pollen analysis of sediments from Berijam Lake in the Palani Hills of South India have shown change in vegetation index during 14.5–7 ka BP correspond-ing to a warm and humid climate (Bera et al. 1995, 1997). This along with OSL ages from the present study suggests that the dune accretion in this area happened during periods of transitional climate from dry to humid settings and this along with the seasonality in the weather cycles facilitated weathering and oxidation of Fe in these sands. The second stage of dune accretion in the area is preserved in terrace II at 4.5 ka and the geochemistry of sands shows that weather-ing and reddening of these near coastal sands are postdeposi-tional and was formed as an indurated unit underlying the modern dune sand. The gullies that are occupied by streams during monsoon along with its tributaries carry large quan-tity of red sand eroded from the upper plains to the coast line. A large section (~9 m) of sand that occurs near the coast cov-ering this late Holocene unit indicates recent sand accumula-tion, possibly due to subsequent erosion and recycling of sand from the upper level.
6. Conclusions
– Two major periods of dune building activity were ob-served in the west coast between 16–13 ka and during 4.5 ka. Sands at terrace I were accumulated during >16 ka until up to 9 ka and the sand accumulation at terrace II occurred at 4.5 ka, which was then covered by modern sands since the last 500 years.
– The stabilisation of the dunes in the upper part at terrace I was associated with humid climatic conditions due to en-hanced SW-monsoons and depletion of sand due to early Holocene transgression. Terrace II was formed during the sea-level highstand at 4.5 ka as sands accumulated in the back shore region carried by strong onshore winds.
– Major and trace element concentration in the sands indi-cates high textural maturity for the sands with high degree of sorting and recycling. The CIA values of red sands in comparison with source rocks and UCC values indicate intense chemical weathering of sands.
– Geochemistry as well as XRD and IR analysis indicates the presence of kaolinite in the clay fraction, formed due to the chemical weathering of feldspar. It also shows the presence of hematite and goethite in the samples indicat-ing these to be the source of red colour in the sands.
– The presence of hematite in association with kaolinite in the older indurated units indicates that their formation is associated with in-situ weathering during early diagenesis.
7. Acknowledgements
This research has been supported by Leibniz DAAD fellow-ship funded by the German Academic Exchange Service (DAAD) and the Leibniz Institute for Applied Geophysics (LIAG), Hannover, which is gratefully acknowledged. The authors are grateful to Lara Wacha and Priyadarsi D. Roy for their thoughtful suggestions to improve the earlier version of this manuscript.
8. References
Aitken, M.J. (1985): Thermoluminescence dating: 359 p., London (Academic Pr.).
Alappat, L., Frechen, M., Ramesh, R., Tsukamoto, S. & Srinivasalu , S. (2011): Evolution of late Holocene coastal dunes in the Cau-very delta region of Tamil Nadu, India. – J. Asian Earth Sci., 42: 381–397; DOI: 10.1016/j.jseaes.2011.05.019.
Alappat, L., Seralathan, P., Shukla, A.D., Thrivikramji, K.P. & Sin-ghvi, A.K. (2013): Chronology of red dune aggradations of South India and its palaeo-environmental significance. – Geo-chronometria, 40 (4): 274–282; DOI: 10.2478/s13386-013-0118-5.
Alappat, L., Frechen, M., Sree Kumar, S., Suresh Babu, D.S., Ra-jan, R. & Tsukamoto, S. (2015): Evidence of Late Holocene shoreline progradation in the coast of Kerala, South India ob-tained from OSL dating of palaeo-beach ridges. – Geomorphol-ogy, 245: 73–86.
Angusamy, N. & Rajamanickam, G.V. (2000): Distribution of heavy minerals along the beach from Mandapam to Kanyaku-mari. – J. Geol. Soc. India, 56: 199–211.
Banerjee, P.K. (2000): Holocene and Late Pleistocene relative sea level fluctuations along the east coast of India. – Mar. Geol., 167: 243–260.
Bensing, J.P., Mozley, P.S. & Dunbar, N.W. (2005): Importance of clay in iron transport and sediment reddening: evidence from reduction features of the Abo Formation, New Mexico, USA. – J. Sediment. Res., 75 (4): 562–571.
Bera, S.K., Gupta, H.P. & Farooqui, A. (1995): Berijam Lake. 20,000 yrs. sequence of paleofloristics and paleoenvironment in Palni Hills, South India. – Geophytology, 26: 99–104.
Bera, S.K., Farooqui, A. & Gupta, H.P. (1997): Late Pleistocene–Holocene vegetation and environment in and around Marian Shola, Palni Hills, Tamil Nadu. – Palaeobotanist, 46: 191–195.
197Chronology and weathering history of red dunes (Teri Sands) in the southwest coast of Tamil Nadu, India
Berner, R.A. (1969): Goethite stability and the origin of red beds. – Geochim. Cosmochim. Acta, 33: 267–273.
Besler, H. (2008): Chapter Six: Quartz sand as an indicator of hu-mid periods. – In: Besler, H., Bolten, A., Bubenzer, O., Hilgers, A. & Van Loon, A.J. (ed.): The Great Sand Sea in Egypt – for-mation, dynamics and environmental change – a sediment-ana-lytical approach. – Dev. Sedimentol., 59: 129–144.
Blott, S.J. & Pye, K. (2001): Gradistat: a grain size distribution and statistics package for the analysis of unconsolidated sediments. – Earth Surf. Processes Landf., 26 (11): 1237–1248.
Carroll, D. (1958): Role of clay minerals in the transportation of iron. – Geochim. Cosmochim. Acta, 14 (1): 1–28.
Chacko, T., Ravindra Kumar, G.R.A. & Newton, R.C. (1987): Metamorphic P-T conditions of the Kerala (south India) Khon-dalite Belt, a granulite facies supracrustal terrain. – J. Geol., 95: 343–358.
Chacko, T., Lamb, M. & Farquhar, J. (1996): Ultra-high tempera-ture metamorphism in the Kerala Khondalite Belt. – Gondwana Research Group Memoir, 3: 157–165.
Chandrasekharan, S. & Murugan, C. (2001): Heavy minerals in the beach and the coastal red sands (Teris) of Tamilnadu. – In: Dhana Raju, R., Ali, M.A. & Krisnan, S. (ed.): Beach and in-land heavy mineral sand deposits of India. – Exploration and Research for Atomic Minerals, 13: 87–109.
Cox, R. & Lowe, D.R. (1995): A conceptual review of regional-scale controls on the composition of clastic sediment and the co-evolution of continental blocks and their sedimentary cover. – J. Sediment. Res., 65 (1): 1–12.
Dinesh, A.C., Maran, N., Shareef, N.M., Chandrasekhariah, K.C. & Jayaprakash, C. (2010): Observations on the reported incidence of micro-diamonds in the beach sands of the Kanyakumari coast, Tamil Nadu. – J. Geol. Soc. India, 76: 587–588.
Duller, G.A.T. (2003): Distinguishing quartz and feldspar in single grain luminescence measurements. – Radiat. Measurem., 37: 161–165.
Folk, R.L. (1976): Reddening of desert sands: Simpson Desert, N. T., Australia. – J. Sediment. Res., 46: 604–615.
Folk, R.L. & Ward, W.C. (1957): Brazos River Bar: a study in the significance of grain-size parameters. – J. Sediment. Petrol., 27: 3–26.
Gaillardet, J., Dupré, B. & Allègre, C.J. (1999): Geochemistry of large river suspended sediments: silicate weathering or recy-cling tracer? – Geochim. Cosmochim., 63 (23): 4037–4051.
Galbraith, R.F., Roberts, R.G., Laslett, G.M., Yoshida, H. & Olley, J.M. (1999): Optical dating of single and multiple grains of quartz from Jinmium rock shelter, northern Australia. Part I, experimental design and statistical models. – Archaeometry, 41 (2): 339–364.
Gardner, R.A.M. (1981): Reddening of dune sands – evidence from southeast India. – Earth Surf. Processes Landf., 6: 459–468.
Gardner, R.A.M. & Martingell, H. (1990): Microlithic sites and their paleoenvironmental setting, Southeast India; a reevalua-tion. – Geoarchaeology, 5: 1–13.
Gardner, R.A.M. & Pye, K. (1981): Nature, origin and palaeoenvi-ronmental significance of red coastal and desert dune sands. – Progr. Phys. Geogr., 5: 514–534.
Goss, C.J. (1987): The kinetics and reaction mechanism of the goe-thite to hematite transformation. – Mineral. Mag., 51 (3): 437–451.
Guérin, G., Mercier, N. & Adamiec, G. (2011): Dose-rate conver-sion factors: update. – Ancient TL, 29: 5–8.
Jayangondaperumal, R., Murari, M.K., Sivasubramanian, P., Chan-drasekar, N. & Singhvi, A.K. (2012): Luminescence dating of
fluvial and coastal red sediments in the SE coast, India, and implications for paleoenvironmental changes and dune redden-ing. – Quatern. Res., 77: 468–481.
Joseph, S. & Thrivikramji, K.P. (2005): Origin of calcretes in Teris, southern Tamil Nadu. Origin and paleoenvironmental implica-tions. – J. Geol. Soc. India, 65: 158–168.
Joseph, S., Thrivikramaji, K.P. & Anirudhan, S. (1997): Textural parameters, discriminant analysis and depositional environ-ments of Teri Sands, Southern Tamil Nadu. – J. Geol. Soc. In-dia, 50: 323–329.
Joseph, S., Thrivikramji, K.P. & Anirudhan, S. (1999): Mud con-tent, clay minerals and oxidation states of iron in Teris of south-ern Tamil Nadu. Implication to the origin of Redness. – Journal of the Indian Association of Sedimentologists, 18: 83–94.
Joseph, S., Thrivikramji, K.P. & Babu, D.S.S. (2002): State of al-teration of ilmenite in Teris, southern Tamil Nadu. – J. Geol. Soc. India, 60: 537–546.
Kale, V.S. & Rajaguru, S.N. (1987): Late Quaternary alluvial his-tory of the northwestern Deccan upland region. – Nature, 325: 612–614.
Kocurek, G. (1998): Aeolian system response to external forcing factors – a sequence stratigraphic view of the Saharan region. – In: Alsharan, A.S., Glennie, K.W., Whittle, G.L. & Kendall, C.G.S.C. (ed.): Quaternary deserts and climatic change: 327–337, Rotterdam (Balkema).
Kumaran, K.P.N., Padmalal, D., Nair, K.M., Limaye Ruta, B., Gu-leria, J.S., Srivastava, R. & Shukla, A. (2014): Vegetation re-sponse and landscape dynamics of Indian summer monsoon variations during Holocene: an eco-geomorphological appraisal of tropical evergreen forest subfossil logs. – Plos One, 9 (4): 1–24.
Kunz, A., Frechen, M., Ramesh, R. & Urban, B. (2010): Lumines-cence dating of late Holocene dunes showing remnants of early settlement in Cuddalore and evidence of monsoon activity in south east India. – Quatern. Int., 222: 194–208; DOI: 10.1016/j.quaint.2009.10.042.
Langmuir, D. (1971): Particle size effect on the reaction goethite = hematite + water. – Am. J. Sci., 271 (2): 147–156.
McLennan, S.M., Hemming, S., McDaniel, D.K. & Hanson, G.N. (1993): Geochemical approaches to sedimentation, provenance, and tectonics. – Geol. Soc. Am., Spec. Pap., 284: 21–21.
McLennan, S.M., Bock, B., Hemming, S.R., Hurowitz, J.A., Lev, S.M. & McDaniel, D.K. (2003): The roles of provenance and sedimentary processes in the geochemistry of sedimentary rocks. – In: Lentz, D.R. (ed.): Geochemistry of sediments and sedimentary rocks: evolutionary considerations to mineral de-posit-forming environments. – GeoText, 4: 7–38.
Mejdahl, V. (1979): Thermoluminescence dating. Beta dose attenu-ation in quartz grains. – Archaeometry, 21: 61–63.
Murray, A.S. & Wintle, A.G. (2000): Luminescence dating of quartz using an improved single-aliquot regenerative-dose pro-tocol. – Radiat. Measurem., 32: 57–73.
Nageswara Rao, K., Udaya Bhaskara Rao, C., Vijaya Prakash, P. & Timma Reddy, K. (2006): Morphostratigraphy and evolution of the Quaternary red sands near Bhimunipatnam, east coast of India. – J. Geol. Soc. India, 68: 857–873.
Nesbitt, H.W. (2003): Petrogenesis of siliciclastic sediments and sedimentary rocks. – In: Lentz, D.R. (ed.): Geochemistry of sediments and sedimentary rocks: evolutionary considerations to mineral deposit-forming environments. – GeoText, 4: 39–51.
Nesbitt, H.W. & Young, G.M. (1982): Early Proterozoic climates and plate motions inferred from major element chemistry of lu-tites. – Nature, 299: 715–717.

198 Linto Alappat et al.
Nesbitt, H.W., Young, G.M., McLennan, S.M. & Keays, R.R. (1996): Effects of chemical weathering and sorting on the petrogenesis of siliciclastic sediments, with implications for provenance studies. – J. Geol., 104: 525–542.
Norris, R.M. (1969): Dune reddening and time. – J. Sediment. Pet-rol., 39: 7–11.
Prescott, J.R. & Hutton, J.T. (1994): Cosmic ray contributionsto dose rates for luminescence and ESR dating. Large depths and long-term time variations. – Radiat. Measurem., 23: 497–500.
Pye, K. & Tsoar, H. (2009): Aeolian sand and sand dunes: 476 p., Berlin (Springer).
Rajagopalan, G., Sukumar, R., Ramesh, R., Pant, R.K. & Rajagopa-lan, G. (1997): Late Quaternary vegetational and climatic changes from tropical peats in southern India – an extended record up to 40,000 years BP. – Curr. Sci., 73: 60–63.
Rajendran, C.P., Rajagopalan, G. & Narayanaswamy (1989): Qua-ternary geology of Kerala: evidence from radiocarbon dates. – J. Geol. Soc. India, 33 (3): 218–222.
Rajesh, H.M., Santosh, M. & Yoshikura, S. (2011): The Nagercoil Charnockite: a magnesian, calcic to calc-alkalic granitoid dehy-drated during a granulite-facies metamorphic event. – J. Petrol., 52 (2): 375–400.
Roskin, J., Porat, N., Tsoar, H., Blumberg, D.G. & Zander, A.M. (2011): Age, origin and climatic controls on vegetated linear dunes in the northwestern Negev Desert (Israel). – Quatern. Sci. Rev., 30: 1649–1674.
Roskin, J., Blumberg, D.G., Porat, N., Tsoar, H. & Rozenstein, O. (2012): Do dune sands redden with age? The case of the north-western Negev dunefield, Israel. – Aeolian Res., 5: 63–75; DOI: 10.1016/j.aeolia.2011.11.004.
Rudnick, R.L. & Gao, S. (2003): Composition of the continental crust. – Treatise on Geochemistry, 3: 1–64.
Sarkar, A., Ramesh, R. & Bhattacharya, S.K. (1990): Oxygen iso-tope evidence for a stronger winter monsoon current during the last glaciation. – Nature, 343: 549–551.
Singhvi, A.K., Deraniyagala, S.U. & Sengupta, D. (1986): Thermo-luminescence dating of Quaternary red-sand beds. A case study of coastal dunes in Sri Lanka. – Earth Planet. Sci. Lett., 80: 139–144.
Sreejith, C. & Ravindra Kumar, G.R. (2013): Petrogenesis of high-K metagranites in the Kerala Khondalite Belt, southern India: a possible magmatic-arc link between India, Sri Lanka, and Madagascar. – J. Geodyn., 63: 69–82.
Sukumar, R., Ramesh, R., Pant, R.K. & Rajagopalan, G. (1993): A δ13C record of late Quaternary climate change from tropical peats in southern India. – Nature, 364: 703–706.
Thomas, P.J. (2009): Luminescence dating of beachrock in the southeast coast of India – potential for Holocene shoreline re-construction. – J. Coastal Res., 25 (1): 1–7.
Thrivikramji, K.P., Joseph, S. & Anirudhan, S. (2008): Teris of southern Tamil Nadu. Saga of Holocene climate change. – Geol. Soc. India, Mem., 74: 351–359.
Tiwari, M., Singh, A.K. & Ramesh, R. (2011): High-resolution monsoon records since last glacial maximum: a comparison of marine and terrestrial paleoarchives from South Asia. – Journal of Geological Research, 2011, Article ID 765248: 12 p.
Tripathi, J.K. & Rajamani, V. (2007): Geochemistry and origin of ferruginous nodules in weathered granodioritic gneisses, Mysore Plateau, Southern India. – Geochim. Cosmochim. Acta, 71 (7): 1674–1688.
Turner, P. (1980): Continental red beds: 537 p., Amsterdam (Else-vier).
Van Houten, F.B. (1961): Climatic significance of red beds. – In: Nair, A.E.M. (ed.): Descriptive palaeoclimatology: 89–139, New York (Interscience).
Van Houten, F.B. (1964): Origin of red beds – some unsolved prob-lems. – In: Nair, A.E.M. (ed.): Problems in palaeoclimatology: 647–661, New York (Interscience).
Veizer, J. & Mackenzie, F.T. (2004): Evolution of sedimentary rocks. – In: Holland, H.D. & Turekian, K.K. (ed.): Treatise on geochemistry, 7: 369–407, Oxford (Elsevier).
Walker, T.R. (1967): Formation of Red Beds in modern and ancient deserts. – Geol. Soc. America, Bull., 78: 353–368.
Walker, T.R. (1979): Red colour in dune sand. – In: McKee, E.D. (ed.): A study of global sand seas. – U.S. Geol. Surv., Prof. Pap., 1052: 62–81.
Wintle, A.G. & Murray, A.S. (2006): A review of quartz optically stimulated luminescence characteristics and their relevance in single-aliquot regeneration dating protocols. – Radiat. Meas-urem., 41 (4): 369–391.
Young, G.M. & Nesbitt, H.W. (1998): Processes controlling the dis-tribution of Ti and Al in weathering profiles, siliciclastic sedi-ments and sedimentary rocks. – J. Sediment. Res., 68: 448–455.
Zhang, J., Yuan, B. & Zhou, L. (2008): Luminescence chronology of “Old Red Sand” in Jinjiang and its implications for optical dating of sediments in South China. – Chin. Sci. Bull., 53: 591–601.
Zheng, W. & Wei, W. (1998): Formation of “old red sands” and paleogeographic environment on South China coasts. – Science in China, Series D, Earth Sciences, 41: 306–313.
Manuscript received: 28.07.2015Accepted for publication: 11.03.2016