energy supply - teri press
TRANSCRIPT
ENERGY SUPPLY RENEWABLE ENERGY 5
AT A GLANCE The Indian solar photovoltaic (SPV) market has witnessed
signi�cant growth since the launch of the Jawaharlal Nehru National Solar Mission (JNNSM) in 2010. The total installed capacity has risen from 40 MW in 2010 to 8513.23 MW till 30 September 2016.
A 50 MW solar thermal power plant has been set up at Nokh village in the Jaisalmer district of Rajasthan and it has started commercial operations.
According to the Ministry of New and Renewable Energy (MNRE), about 57 000 family-size biogas plants were set up till May 2016 against the projected target of 1.10 lakh biogas plants.
Net metering noti�cations have been released in 33 states/union territories.
The current potential for generating energy from surplus agricultural and forestry residues is estimated to be about 18 000 MW. As on September 2016, the cumulative installed capacity of grid-interactive biomass power generation, gasi�cation and bagasse cogeneration was 4882.33 MW and power generation from waste was about 115.08 MW.
Both solar thermal power and concentrated solar power can have a signi�cant proportion of components manufactured in India, except solar grade mirrors. This suits very well with the “Make in India” initiative of the government, and indigenous manufacturing of all major components can be promoted through the “Make in India” campaign.
The Ministry of New and Renewable Energy (MNRE) has identi�ed the techno-economically feasible potential for solar water heating systems as 40 million m2 (Saxena and Srivastava 2012). Out of this, 12 million m² area was installed till 2015 (MNRE 2016b).
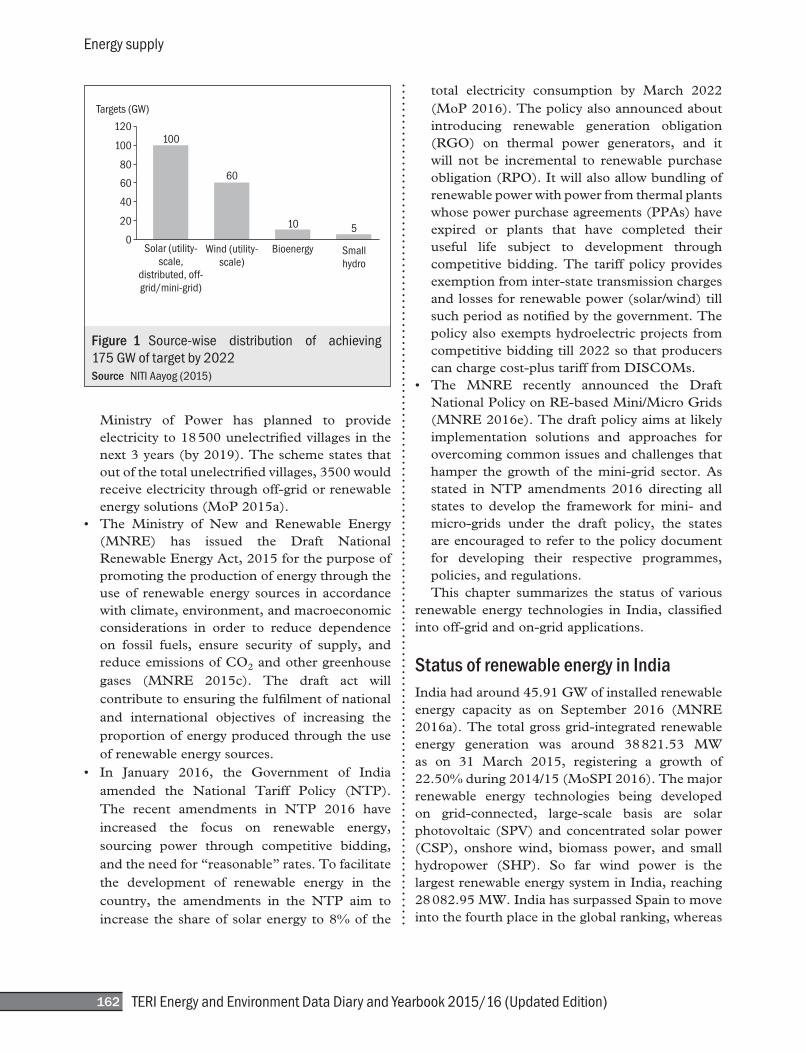
IntroductionRenewable energy technologies utilize energy that comes from continually replenished resources, such as sunlight, wind, biomass, water, geothermal heat, and ocean energy. The worldwide growth of renewable energy began in the 1990s and accelerated significantly in the 2000s. The total investment in renewable energy in 2013 was $214 billion worldwide, a fall from 2011/12 due to significant cost reduction and also policy uncertainty (BNEF 2014). India has also announced plans for attracting investments worth $100 billion in the renewable energy sector during the next few years, along with the proposed revision of the National Solar Mission targets to 100 GW of solar power compared to the earlier target of 22 GW by 2022. The government has also announced a target of 60 GW of installed wind power capacity by 2022 (NITI Aayog 2015). The Government of India has set an ambitious target of achieving 175 GW of renewable energy by 2022 (Figure 1).
Renewable energy has grown due to supportive government policies, rising costs of the conventional energy, reduction in costs of renewable energy technology, and economies of scale in manufacturing. Renewable energy applications are also growing in end-use sectors, such as heating/cooling, transport, and power.
The following are some regulatory and policy initiatives taken by the Government of India to boost the Indian renewable energy sector:• Under the Deendayal Upadhyaya Gram Jyoti
Yojana (DDUGJY) (erstwhile RGGVY), the
lR;eso t;rs
Government of India Ministry of New and Renewable Energy
This chapter is sponsored by Ministry of New and Renewable Energy
Energy supply
TERI Energy and Environment Data Diary and Yearbook 2015/16 (Updated Edition)162
Ministry of Power has planned to provide electricity to 18 500 unelectrified villages in the next 3 years (by 2019). The scheme states that out of the total unelectrified villages, 3500 would receive electricity through off-grid or renewable energy solutions (MoP 2015a).
• The Ministry of New and Renewable Energy(MNRE) has issued the Draft NationalRenewable Energy Act, 2015 for the purpose of promoting the production of energy through the use of renewable energy sources in accordance with climate, environment, and macroeconomic considerations in order to reduce dependence on fossil fuels, ensure security of supply, and reduce emissions of CO2 and other greenhouse gases (MNRE 2015c). The draft act will contribute to ensuring the fulfilment of national and international objectives of increasing the proportion of energy produced through the use of renewable energy sources.
• In January 2016, the Government of Indiaamended the National Tariff Policy (NTP). The recent amendments in NTP 2016 have increased the focus on renewable energy, sourcing power through competitive bidding, and the need for “reasonable” rates. To facilitate the development of renewable energy in the country, the amendments in the NTP aim to increase the share of solar energy to 8% of the
total electricity consumption by March 2022 (MoP 2016). The policy also announced about introducing renewable generation obligation (RGO) on thermal power generators, and it will not be incremental to renewable purchase obligation (RPO). It will also allow bundling of renewable power with power from thermal plants whose power purchase agreements (PPAs) have expired or plants that have completed their useful life subject to development through competitive bidding. The tariff policy provides exemption from inter-state transmission charges and losses for renewable power (solar/wind) till such period as notified by the government. The policy also exempts hydroelectric projects from competitive bidding till 2022 so that producers canchargecost-plustarifffromDISCOMs.
• The MNRE recently announced the DraftNational Policy on RE-based Mini/Micro Grids (MNRE 2016e). The draft policy aims at likely implementation solutions and approaches for overcoming common issues and challenges that hamper the growth of the mini-grid sector. As stated in NTP amendments 2016 directing all states to develop the framework for mini- and micro-grids under the draft policy, the states are encouraged to refer to the policy document for developing their respective programmes, policies, and regulations.This chapter summarizes the status of various
renewable energy technologies in India, classified into off-grid and on-grid applications.
Status of renewable energy in IndiaIndia had around 45.91 GW of installed renewable energy capacity as on September 2016 (MNRE 2016a). The total gross grid-integrated renewable energy generation was around 38 821.53 MW as on 31 March 2015, registering a growth of 22.50% during 2014/15 (MoSPI 2016). The major renewable energy technologies being developed on grid-connected, large-scale basis are solar photovoltaic(SPV)andconcentratedsolarpower(CSP), onshore wind, biomass power, and small hydropower (SHP). So far wind power is the largest renewable energy system in India, reaching 28 082.95 MW. India has surpassed Spain to move into the fourth place in the global ranking, whereas
120
100
80
60
40
20
0
100
60
10 5
Solar (utility-
scale,
distributed, off-
grid/mini-grid)
Wind (utility-
scale)
Bioenergy Small
hydro
Targets (GW)
Figure 1 Source-wise distribution of achieving 175 GW of target by 2022Source NITI Aayog (2015)
Renewable energy
TERI Energy and Environment Data Diary and Yearbook 2015/16 (Updated Edition) 163
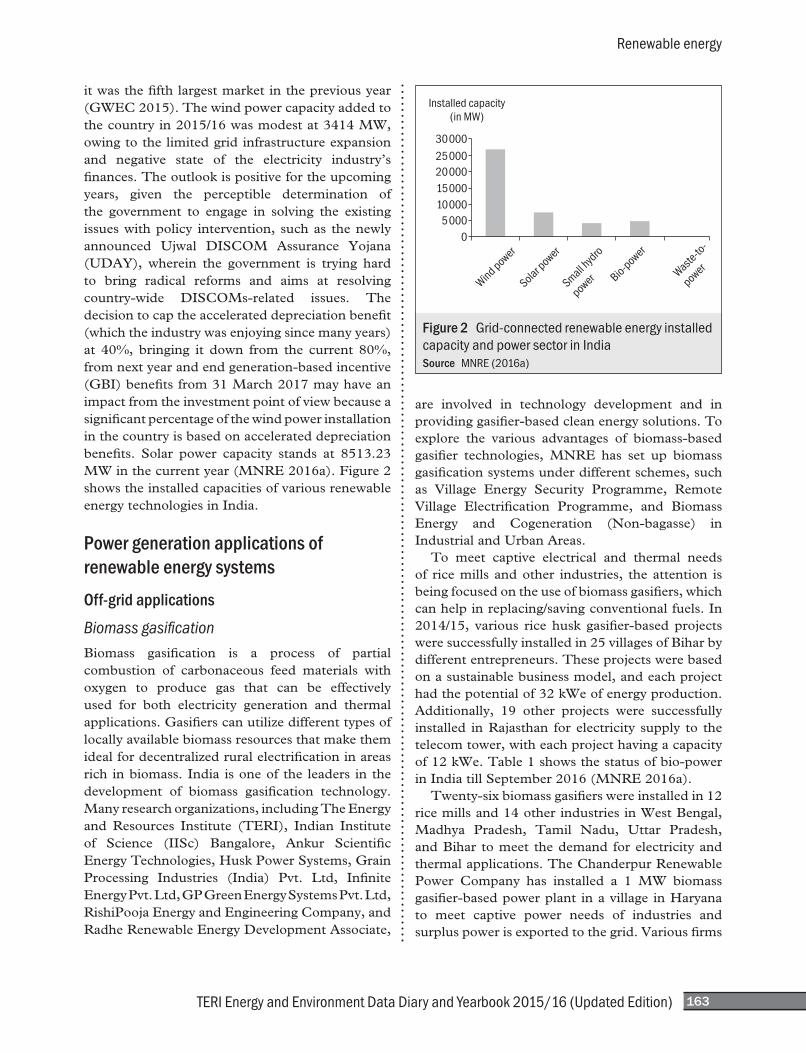
it was the fifth largest market in the previous year (GWEC 2015). The wind power capacity added to the country in 2015/16 was modest at 3414 MW, owing to the limited grid infrastructure expansion and negative state of the electricity industry’s finances. The outlook is positive for the upcoming years, given the perceptible determination of the government to engage in solving the existing issues with policy intervention, such as the newly announced Ujwal DISCOM Assurance Yojana(UDAY), wherein the government is trying hardto bring radical reforms and aims at resolving country-wide DISCOMs-related issues. Thedecision to cap the accelerated depreciation benefit (which the industry was enjoying since many years) at 40%, bringing it down from the current 80%, from next year and end generation-based incentive (GBI) benefits from 31 March 2017 may have an impact from the investment point of view because a significant percentage of the wind power installation in the country is based on accelerated depreciation benefits. Solar power capacity stands at 8513.23 MW in the current year (MNRE 2016a). Figure 2 shows the installed capacities of various renewable energy technologies in India.
Power generation applications of renewable energy systems
Off-grid applications
Biomass gasificationBiomass gasification is a process of partial combustion of carbonaceous feed materials with oxygen to produce gas that can be effectively used for both electricity generation and thermal applications. Gasifiers can utilize different types of locally available biomass resources that make them ideal for decentralized rural electrification in areas rich in biomass. India is one of the leaders in the development of biomass gasification technology. Many research organizations, including The Energy and Resources Institute (TERI), Indian Institute of Science (IISc) Bangalore, Ankur Scientific Energy Technologies, Husk Power Systems, Grain Processing Industries (India) Pvt. Ltd, Infinite Energy Pvt. Ltd, GP Green Energy Systems Pvt. Ltd, RishiPooja Energy and Engineering Company, and RadheRenewableEnergyDevelopmentAssociate,
are involved in technology development and in providing gasifier-based clean energy solutions. To explore the various advantages of biomass-based gasifier technologies, MNRE has set up biomass gasification systems under different schemes, such as Village Energy Security Programme, RemoteVillage Electrification Programme, and BiomassEnergy and Cogeneration (Non-bagasse) in IndustrialandUrbanAreas.
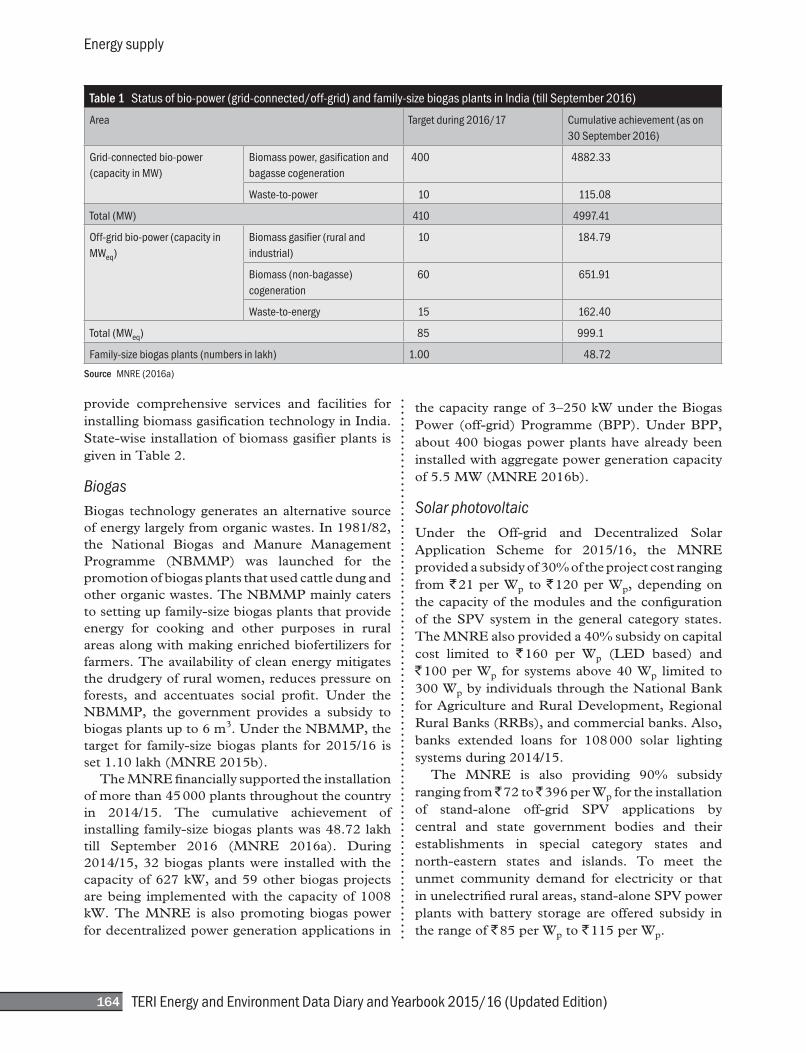
To meet captive electrical and thermal needs of rice mills and other industries, the attention is being focused on the use of biomass gasifiers, which can help in replacing/saving conventional fuels. In 2014/15, various rice husk gasifier-based projects were successfully installed in 25 villages of Bihar by different entrepreneurs. These projects were based on a sustainable business model, and each project had the potential of 32 kWe of energy production. Additionally, 19 other projects were successfully installed in Rajasthan for electricity supply to the telecom tower, with each project having a capacity of 12 kWe. Table 1 shows the status of bio-power in India till September 2016 (MNRE 2016a).
Twenty-six biomass gasifiers were installed in 12 rice mills and 14 other industries in West Bengal, Madhya Pradesh, Tamil Nadu, Uttar Pradesh,and Bihar to meet the demand for electricity and thermal applications. The Chanderpur Renewable Power Company has installed a 1 MW biomass gasifier-based power plant in a village in Haryana to meet captive power needs of industries and surpluspowerisexportedtothegrid.Variousfirms
Figure 2 Grid-connected renewable energy installed capacity and power sector in IndiaSource MNRE (2016a)
Energy supply
TERI Energy and Environment Data Diary and Yearbook 2015/16 (Updated Edition)164
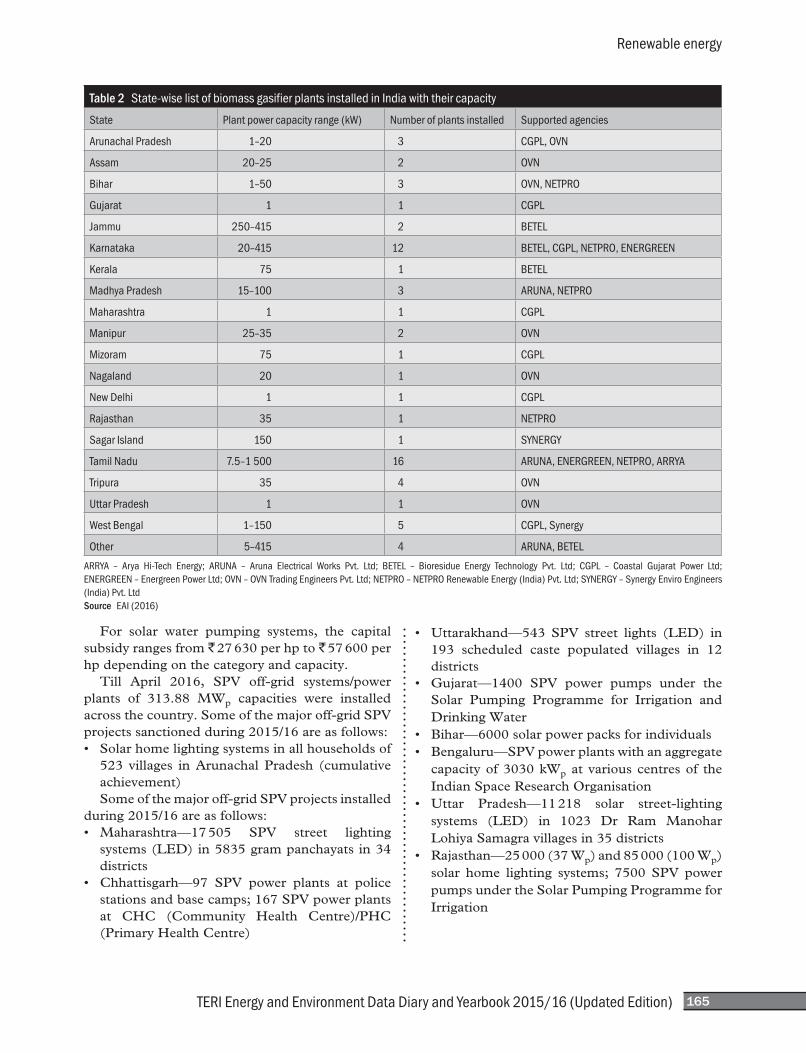
provide comprehensive services and facilities for installing biomass gasification technology in India. State-wise installation of biomass gasifier plants is given in Table 2.
BiogasBiogas technology generates an alternative source of energy largely from organic wastes. In 1981/82, the National Biogas and Manure Management Programme (NBMMP) was launched for the promotion of biogas plants that used cattle dung and other organic wastes. The NBMMP mainly caters to setting up family-size biogas plants that provide energy for cooking and other purposes in rural areas along with making enriched biofertilizers for farmers. The availability of clean energy mitigates the drudgery of rural women, reduces pressure on forests, and accentuates social profit. Under theNBMMP, the government provides a subsidy to biogas plants up to 6 m3.UndertheNBMMP,thetarget for family-size biogas plants for 2015/16 is set 1.10 lakh (MNRE 2015b). The MNRE financially supported the installation of more than 45 000 plants throughout the country in 2014/15. The cumulative achievement of installing family-size biogas plants was 48.72 lakh till September 2016 (MNRE 2016a). During2014/15, 32 biogas plants were installed with the capacity of 627 kW, and 59 other biogas projects are being implemented with the capacity of 1008 kW. The MNRE is also promoting biogas power for decentralized power generation applications in
the capacity range of 3–250 kW under the Biogas Power (off-grid) Programme (BPP).UnderBPP,about 400 biogas power plants have already been installed with aggregate power generation capacity of 5.5 MW (MNRE 2016b).
Solar photovoltaicUnder the Off-grid and Decentralized SolarApplication Scheme for 2015/16, the MNRE provided a subsidy of 30% of the project cost ranging from ` 21 per Wp to ` 120 per Wp, depending on the capacity of the modules and the configuration of theSPVsystem in thegeneral category states.The MNRE also provided a 40% subsidy on capital cost limited to ` 160 per Wp (LED based) and` 100 per Wp for systems above 40 Wp limited to 300 Wp by individuals through the National Bank forAgricultureandRuralDevelopment,RegionalRural Banks (RRBs), and commercial banks. Also, banks extended loans for 108 000 solar lighting systems during 2014/15. The MNRE is also providing 90% subsidy ranging from ̀ 72 to ̀ 396 per Wp for the installation of stand-alone off-grid SPV applications bycentral and state government bodies and their establishments in special category states and north-eastern states and islands. To meet the unmet community demand for electricity or that inunelectrifiedruralareas,stand-aloneSPVpowerplants with battery storage are offered subsidy in the range of ` 85 per Wp to ` 115 per Wp.
Table 1 Status of bio-power (grid-connected/off-grid) and family-size biogas plants in India (till September 2016)
Area Target during 2016/17 Cumulative achievement (as on 30 September 2016)
Grid-connected bio-power (capacity in MW)
Biomass power, gasification and bagasse cogeneration
400 4882.33
Waste-to-power 10 115.08
Total (MW) 410 4997.41
Off-grid bio-power (capacity in MWeq)
Biomass gasifier (rural and industrial)
10 184.79
Biomass (non-bagasse) cogeneration
60 651.91
Waste-to-energy 15 162.40
Total (MWeq) 85 999.1
Family-size biogas plants (numbers in lakh) 1.00 48.72
Source MNRE (2016a)
Renewable energy
TERI Energy and Environment Data Diary and Yearbook 2015/16 (Updated Edition) 165
For solar water pumping systems, the capital subsidy ranges from ` 27 630 per hp to ` 57 600 per hp depending on the category and capacity. Till April 2016, SPV off-grid systems/powerplants of 313.88 MWp capacities were installed acrossthecountry.Someofthemajoroff-gridSPVprojects sanctioned during 2015/16 are as follows: • Solarhomelightingsystemsinallhouseholdsof
523 villages in Arunachal Pradesh (cumulative achievement)
Someofthemajoroff-gridSPVprojectsinstalledduring 2015/16 are as follows:• Maharashtra—17505 SPV street lighting
systems(LED)in5835grampanchayatsin34districts
• Chhattisgarh—97 SPV power plants at policestationsandbasecamps;167SPVpowerplantsat CHC (Community Health Centre)/PHC (Primary Health Centre)
• Uttarakhand—543 SPV street lights (LED) in193 scheduled caste populated villages in 12 districts
• Gujarat—1400 SPV power pumps under theSolar Pumping Programme for Irrigation and DrinkingWater
• Bihar—6000solarpowerpacksforindividuals• Bengaluru—SPVpowerplantswithanaggregate
capacity of 3030 kWp at various centres of the Indian Space Research Organisation
• Uttar Pradesh—11218 solar street-lightingsystems (LED) in 1023 Dr Ram ManoharLohiya Samagra villages in 35 districts
• Rajasthan—25000(37Wp) and 85 000 (100 Wp) solar home lighting systems; 7500 SPV powerpumps under the Solar Pumping Programme for Irrigation
Table 2 State-wise list of biomass gasifier plants installed in India with their capacity
State Plant power capacity range (kW) Number of plants installed Supported agencies
Arunachal Pradesh 1–20 3 CGPL, OVN
Assam 20–25 2 OVN
Bihar 1–50 3 OVN, NETPRO
Gujarat 1 1 CGPL
Jammu 250–415 2 BETEL
Karnataka 20–415 12 BETEL, CGPL, NETPRO, ENERGREEN
Kerala 75 1 BETEL
Madhya Pradesh 15–100 3 ARUNA, NETPRO
Maharashtra 1 1 CGPL
Manipur 25–35 2 OVN
Mizoram 75 1 CGPL
Nagaland 20 1 OVN
New Delhi 1 1 CGPL
Rajasthan 35 1 NETPRO
Sagar Island 150 1 SYNERGY
Tamil Nadu 7.5–1 500 16 ARUNA, ENERGREEN, NETPRO, ARRYA
Tripura 35 4 OVN
Uttar Pradesh 1 1 OVN
West Bengal 1–150 5 CGPL, Synergy
Other 5–415 4 ARUNA, BETEL
ARRYA – Arya Hi-Tech Energy; ARUNA – Aruna Electrical Works Pvt. Ltd; BETEL – Bioresidue Energy Technology Pvt. Ltd; CGPL – Coastal Gujarat Power Ltd; ENERGREEN – Energreen Power Ltd; OVN – OVN Trading Engineers Pvt. Ltd; NETPRO – NETPRO Renewable Energy (India) Pvt. Ltd; SYNERGY – Synergy Enviro Engineers (India) Pvt. LtdSource EAI (2016)
Energy supply
TERI Energy and Environment Data Diary and Yearbook 2015/16 (Updated Edition)166
Duringtheyear,solarsystemsoftotalcapacity67 MWp, including solar lanterns, solar home lights, solar street lights, solar pumps, mini/micro-grids, and power plants, were installed in various states. Some of the completed projects during the current financial year are as follows: • Himachal Pradesh—8552 solar street lights in
various villages• Chhattisgarh—641 solar power plants having
a total capacity of 2830 kWp at various places, including industries
• Uttar Pradesh—12453 solar street lights invillages
• Jammu and Kashmir—69 solar power plantshaving a total capacity of 1738 kWp in various places
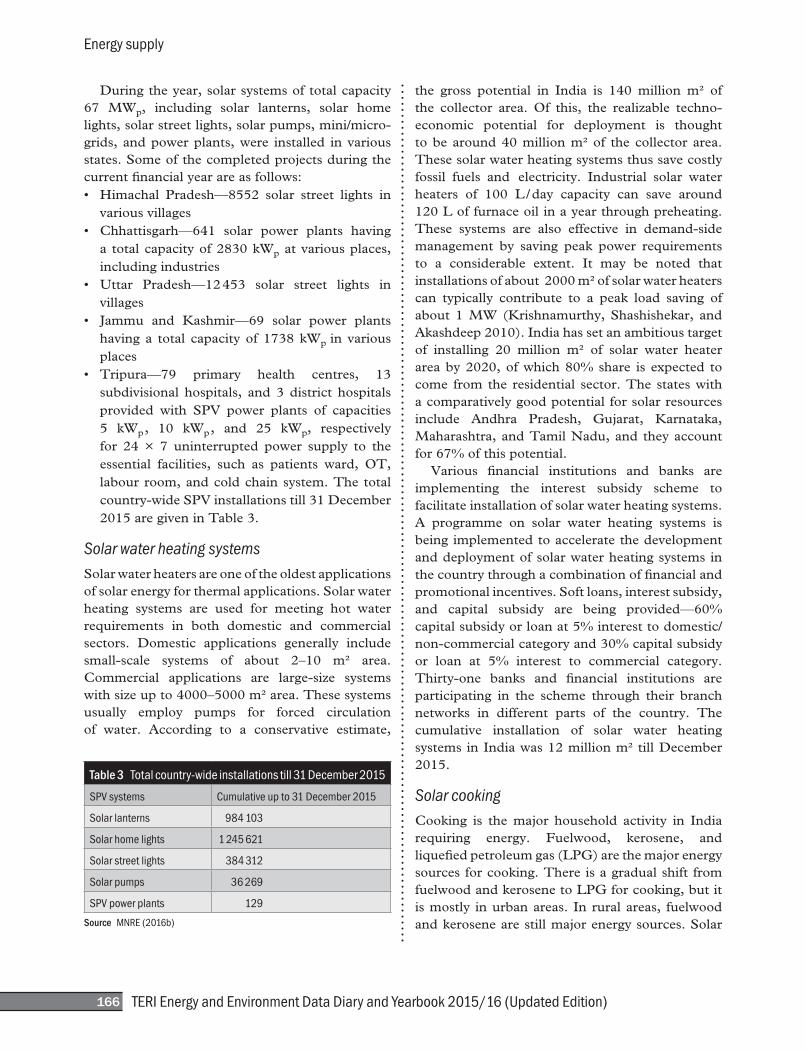
• Tripura—79 primary health centres, 13subdivisional hospitals, and 3 district hospitals provided with SPV power plants of capacities5 kWp , 10 kWp , and 25 kWp, respectively for 24 × 7 uninterrupted power supply to the essential facilities, such as patients ward, OT, labour room, and cold chain system. The total country-wideSPVinstallationstill31December2015 are given in Table 3.
Solar water heating systemsSolar water heaters are one of the oldest applications of solar energy for thermal applications. Solar water heating systems are used for meeting hot water requirements in both domestic and commercial sectors. Domestic applications generally includesmall-scale systems of about 2–10 m² area. Commercial applications are large-size systems with size up to 4000–5000 m² area. These systems usually employ pumps for forced circulation of water. According to a conservative estimate,
the gross potential in India is 140 million m² of the collector area. Of this, the realizable techno-economic potential for deployment is thought to be around 40 million m² of the collector area. These solar water heating systems thus save costly fossil fuels and electricity. Industrial solar water heaters of 100 L / day capacity can save around 120 L of furnace oil in a year through preheating. These systems are also effective in demand-side management by saving peak power requirements to a considerable extent. It may be noted that installations of about 2000 m² of solar water heaters can typically contribute to a peak load saving of about1MW(Krishnamurthy,Shashishekar, andAkashdeep 2010). India has set an ambitious target of installing 20 million m² of solar water heater area by 2020, of which 80% share is expected to come from the residential sector. The states with a comparatively good potential for solar resources include Andhra Pradesh, Gujarat, Karnataka,Maharashtra, and Tamil Nadu, and they account for 67% of this potential. Various financial institutions and banks areimplementing the interest subsidy scheme to facilitate installation of solar water heating systems. A programme on solar water heating systems is being implemented to accelerate the development and deployment of solar water heating systems in the country through a combination of financial and promotional incentives. Soft loans, interest subsidy, and capital subsidy are being provided—60%capital subsidy or loan at 5% interest to domestic/non-commercial category and 30% capital subsidy or loan at 5% interest to commercial category. Thirty-one banks and financial institutions are participating in the scheme through their branch networks in different parts of the country. The cumulative installation of solar water heating systemsinIndiawas12millionm²tillDecember2015.
Solar cookingCooking is the major household activity in India requiring energy. Fuelwood, kerosene, and liquefied petroleum gas (LPG) are the major energy sources for cooking. There is a gradual shift from fuelwood and kerosene to LPG for cooking, but it is mostly in urban areas. In rural areas, fuelwood and kerosene are still major energy sources. Solar
Table 3 Total country-wide installations till 31 December 2015
SPV systems Cumulative up to 31 December 2015
Solar lanterns 984 103
Solar home lights 1 245 621
Solar street lights 384 312
Solar pumps 36 269
SPV power plants 129
Source MNRE (2016b)
Renewable energy
TERI Energy and Environment Data Diary and Yearbook 2015/16 (Updated Edition) 167
cooking offers a good alternative for domestic applications. At the micro level, solar cookers facilitate financial savings for the consumer; at the macro level, they help in the saving of LPG and fuelwood. However, installations have remained somewhat limited as these systems are not user-friendly. There are many types of solar cookers, such as box type, concentrating (dish), indirect heating, with or without heat storage, and hybrid. Out of these types, the box-type solar cookers have entered the commercialization stage. The solar cooker programme was started in India with various promotional efforts, including government subsidies. Soft loans are currently available for the purchase of solar cookers through some designated nationalized banks. Solar cooking can also be effectively used for institutional or community cooking applications, such as in religious places or hostels. Community cooking systems generally employ steam-based cooking using low pressure steam, which can be easily provided using simple solar concentrators operating at moderate temperatures. A parabolic concentrator technology named “Scheffler” was developed to meet this need. This technology is specifically suitable for such applications owing to its low cost and easy manufacturing and is being promoted through government schemes and incentives.
Concentrated solar thermal systemsThe industrial sector is the highest consumer of energy among all sectors. Typical energy demand for the industrial sector is approximately 53% of the total energy consumption. Of this, usually 60%–70% of the energy is used in the form of heat, out of which 70% is used for applications below 250°C (MoSPI 2015). About 37% of the total energy is consumed in the form of heat by industrial processes, which is a large potential area for the use of solar thermal systems (Bhave 2012). Numerous industrial processes within this wide range of operating temperature from 100°C to 250°C can be easily integrated with solar energy. The main application areas are food, dairy, textile, paper, manufacturing, and chemical industries. Various processes in these industries requireprocess heat as the major energy input. Though a wide range of potentially suitable application areas
are available, applicability and feasibility in real practice depend on a number of parameters, such as solar system configuration, scale of the system, and type of the conventional fuel in the existing system. The economics of the solar industrial process heat (SIPH) system play a crucial role in making projects viable for actual installation. The SIPH system needs to be carefully sized to maximize system performance.
Industries have shown increasing interest in this sector, and various indigenously developed technologies are now commercially available. These technologies can operate at various temperature ranges and utilize heat mediums such as pressurized hot water, thermic oil, and low- or high-pressure steam. Some of the available technologies are Scheffler, parabolic troughs, two-axis tracking parabolic dishes, two-axis tracking Fresnelized dishes, linear Fresnel reflectors, evacuated tube, unglazed collector, and so on. The total installed capacity of concentrated solar thermal systems in India is about 45 000 m² (MNRE 2016b). The major companies using these technologies in India include Clique Solar, Thermax, Forbes Solar, Megawatt Solutions, and KGDS Pvt. Ltd. TheMNRE is promoting these systems with various schemes and incentives, such as capital subsidy and soft loans.
Solar air heatingA solar air heater is a type of energy collector in which energy from the sun is captured by an absorbing medium and used for heating air. The main applications of solar air heaters are in industrial and agriculture sectors which require hot air for drying. Solar air collectors are classified into two categories: unglazed solar collectors and glazed solarcollectors.Unglazedsolarcollectorsprimarilyuse ambient air. They are low-cost collectors and require only one penetration into the building, or if existing fan inlets are used, no additional penetrations are necessary. The efficiency of a solar collector is highest when the temperature of the air entering the solar panel is equal to the ambient temperature. This occurs with solar heaters that draw outside air into the solar heater instead of room air. Glazed solar collectors are designed primarily for space heating, and they recirculate building air through a solar air panel where the air
Energy supply
TERI Energy and Environment Data Diary and Yearbook 2015/16 (Updated Edition)168
is heated and then directed back into the building. These solar space heating systems require at least two penetrations into the building and perform only when the air in the solar collector is warmer than the room temperature in the building. Most glazed collectors are used in the residential sector. Solar air heating systems, based on flat plate collectors, are useful in food processing industries for drying various food products. These industries generally require hot air at low temperature as process heat for drying products, such as tea leaves/coffee beans, and also for processing fruits, spices, cereals, mushroom, papad, vegetables, fish, and seafood. Hot air is also required in industries such as leather, textiles, chemicals, rubber, paper, and pharmaceuticals. Major Indian solar air heater manufacturers include ATR Solar, Inter Solar, and Planters Energy Network, and chief international manufacturers include Conserval Engineering, Cansolair, and American Solar.
Grid-connected applications
Biomass-based cogeneration and bio-powerBiomass-based power generation has been increasing rapidly in India with the installation of megawatt-scale plants processing a variety of biomass residues such as shells, husks, de-oiled cakes, and wood. According to the MNRE, about 32% of the total primary energy use in the country is derived from biomass and more than 70% of the country’s population depends on biomass for energy needs. The MNRE has realized the potential and role of biomass energy in the Indian context and thus initiated a number of programmes for the promotion of efficient biomass conversion technologies to be used in various sectors of the economy. India has more than 5464 MW biomass-based power plants comprising 4545 MW grid-connected and 918 MW off-grid power plants. Out of the total grid-connected capacity, the major share comes from 3008 MW bagasse cogeneration, followed by 1410 MW biomass combustion-based power plants. While off-grid capacity comprises 602 MW non-bagasse cogeneration, mainly as captive power plants, about 18 MW biomass gasifier systems are being used for meeting electricity needs in rural areas and 152 MW equivalent biomass gasifier systems have been deployed for thermal applications in industries.
Overall, India produces 686 MT of gross crop residue biomass annually, of which 234 MT (34% of gross) is estimated as surplus for bioenergy generation (Hiloidhari, Das, andBaruah 2014). The potential for power generation from agricultural and agro-industrial residues is estimated at about 18 000 MW. With progressive higher steam temperature and pressure, as well as efficient project configuration in new sugar mills and modernization of existing ones, the potential for surplus power generation through bagasse cogeneration in sugar mills is estimated at 7 000 MW. The potential for bagasse cogeneration lies mainly in the 9 sugar producing states, with the maximum potential of about 1250 MW each in Maharashtra and Uttar Pradesh. Thus, thetotal estimated biomass power potential is about 25 000 MW. About 150 MW equivalent biomass gasifier systems have been set up for grid and off-grid projects. More than 300 rice mills and other industries are using gasifier systems for meeting their captive power and thermal applications. In addition, about 70 biomass gasifier systems are providing electricity to more than 230 villages in the country.
Urban and industrial waste-to-energyThe MNRE has initiated a programme on energy recovery from urban, industrial, and agricultural wastes. The idea is to set up large-size biogas plants to produce biogas or bio-compressed natural gas (bio-CNG) or to generate power. The programme provides Central Financial Assistance for power generation from biogas through biomethanation of urban and agricultural waste / residues, including cattle dung, or for the production of bio-CNG, at ` 2 crore per megawatt, limited to ` 5 crore per project. These projects are set up by state nodal agencies, urban local bodies / municipal corporations, or entrepreneurs.
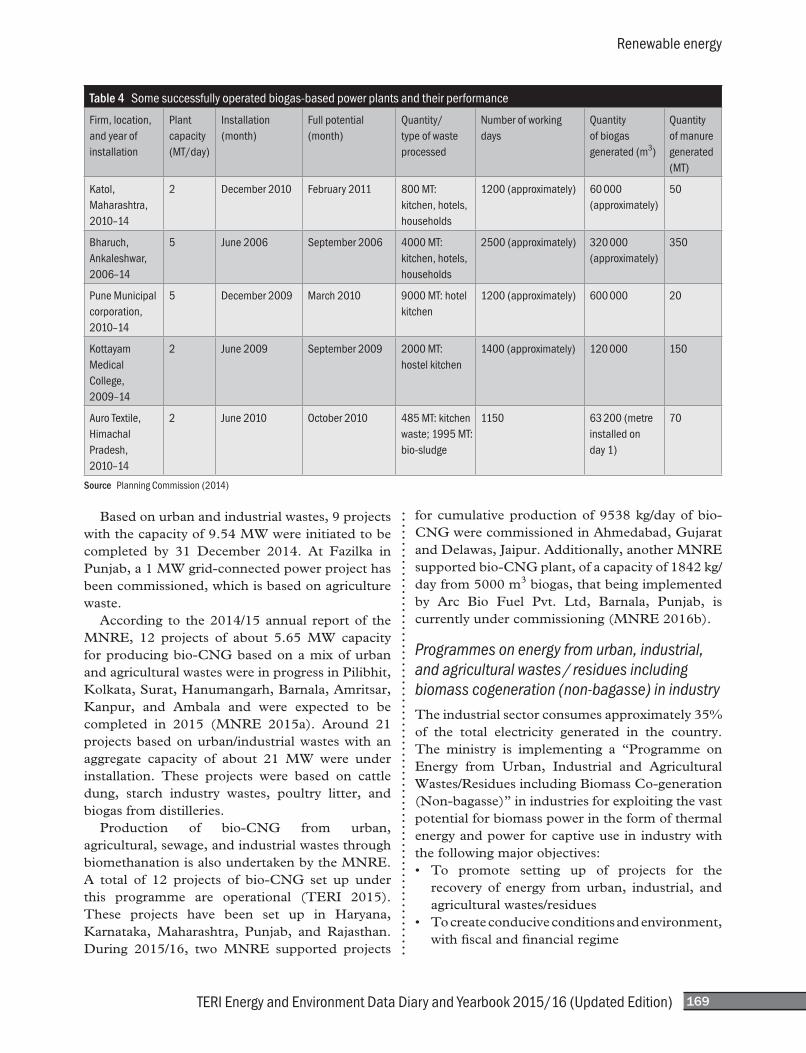
As per the NITI Aayog Annual Report 2014, biomethanation technology, processing segregated biodegradable wet wastes from households and establishments, with a capacity ranging from 100 kg/day to 10 tonnes/day, has been successfully employed in 172 locations in India. Table 4 provides the details of five biomethanation plants that were successfully operated by municipalities and private operators.
Renewable energy
TERI Energy and Environment Data Diary and Yearbook 2015/16 (Updated Edition) 169
Based on urban and industrial wastes, 9 projects with the capacity of 9.54 MW were initiated to be completed by 31 December 2014. At Fazilka inPunjab, a 1 MW grid-connected power project has been commissioned, which is based on agriculture waste. According to the 2014/15 annual report of the MNRE, 12 projects of about 5.65 MW capacity for producing bio-CNG based on a mix of urban and agricultural wastes were in progress in Pilibhit, Kolkata,Surat,Hanumangarh,Barnala,Amritsar,Kanpur, and Ambala and were expected to becompleted in 2015 (MNRE 2015a). Around 21 projects based on urban/industrial wastes with an aggregate capacity of about 21 MW were under installation. These projects were based on cattle dung, starch industry wastes, poultry litter, and biogas from distilleries. Production of bio-CNG from urban, agricultural, sewage, and industrial wastes through biomethanation is also undertaken by the MNRE. A total of 12 projects of bio-CNG set up under this programme are operational (TERI 2015). These projects have been set up in Haryana, Karnataka, Maharashtra, Punjab, and Rajasthan.During 2015/16, two MNRE supported projects
for cumulative production of 9538 kg/day of bio-CNG were commissioned in Ahmedabad, Gujarat andDelawas,Jaipur.Additionally,anotherMNREsupported bio-CNG plant, of a capacity of 1842 kg/day from 5000 m3 biogas, that being implemented by Arc Bio Fuel Pvt. Ltd, Barnala, Punjab, is currently under commissioning (MNRE 2016b).
Programmes on energy from urban, industrial, and agricultural wastes / residues including biomass cogeneration (non-bagasse) in industryThe industrial sector consumes approximately 35% of the total electricity generated in the country. The ministry is implementing a “Programme on Energy from Urban, Industrial and AgriculturalWastes/Residues including Biomass Co-generation (Non-bagasse)” in industries for exploiting the vast potential for biomass power in the form of thermal energy and power for captive use in industry with the following major objectives:• To promote setting up of projects for the
recovery of energy from urban, industrial, and agricultural wastes/residues
• Tocreateconduciveconditionsandenvironment,with fiscal and financial regime
Table 4 Some successfully operated biogas-based power plants and their performance
Firm, location, and year of installation
Plant capacity (MT/day)
Installation (month)
Full potential (month)
Quantity/type of waste processed
Number of working days
Quantity of biogas generated (m3)
Quantity of manure generated (MT)
Katol, Maharashtra, 2010–14
2 December 2010 February 2011 800 MT: kitchen, hotels, households
1200 (approximately) 60 000 (approximately)
50
Bharuch, Ankaleshwar, 2006–14
5 June 2006 September 2006 4000 MT: kitchen, hotels, households
2500 (approximately) 320 000 (approximately)
350
Pune Municipal corporation, 2010–14
5 December 2009 March 2010 9000 MT: hotel kitchen
1200 (approximately) 600 000 20
Kottayam Medical College, 2009–14
2 June 2009 September 2009 2000 MT: hostel kitchen
1400 (approximately) 120 000 150
Auro Textile, Himachal Pradesh, 2010–14
2 June 2010 October 2010 485 MT: kitchen waste; 1995 MT: bio-sludge
1150 63 200 (metre installed on day 1)
70
Source Planning Commission (2014)
Energy supply
TERI Energy and Environment Data Diary and Yearbook 2015/16 (Updated Edition)170
• To develop, demonstrate, and disseminateutilization of wastes and residues for recovery of energy
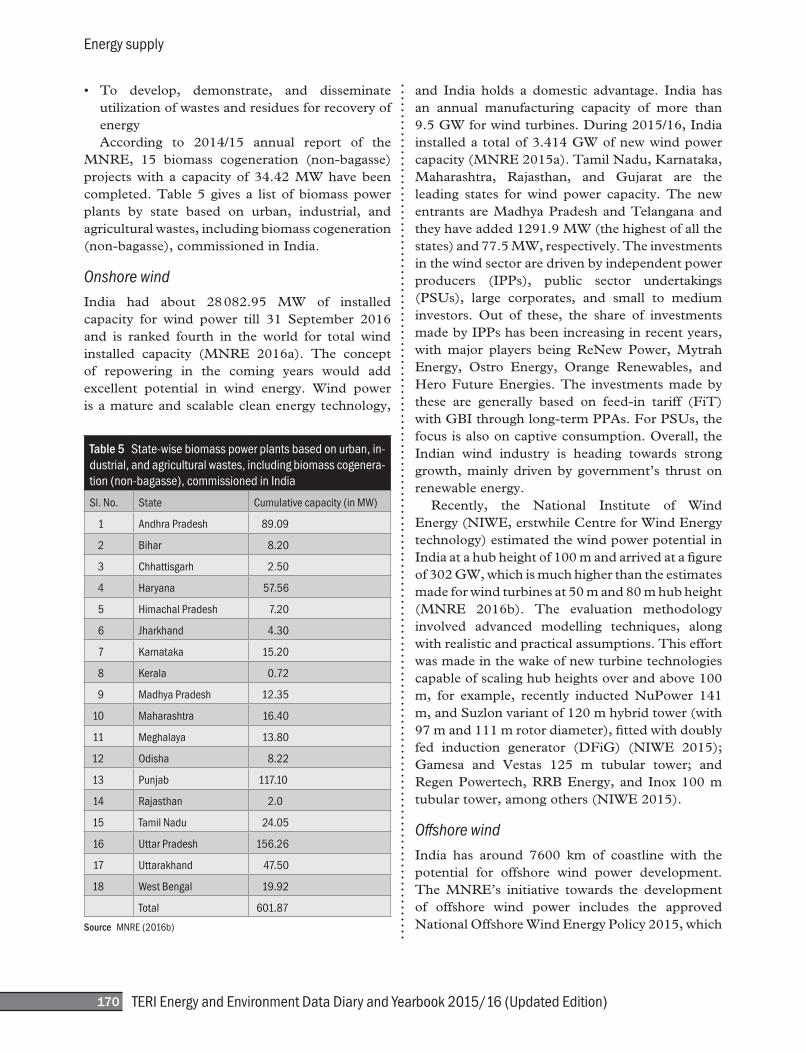
According to 2014/15 annual report of the MNRE, 15 biomass cogeneration (non-bagasse) projects with a capacity of 34.42 MW have been completed. Table 5 gives a list of biomass power plants by state based on urban, industrial, and agricultural wastes, including biomass cogeneration (non-bagasse), commissioned in India.
Onshore windIndia had about 28 082.95 MW of installed capacity for wind power till 31 September 2016 and is ranked fourth in the world for total wind installed capacity (MNRE 2016a). The concept of repowering in the coming years would add excellent potential in wind energy. Wind power is a mature and scalable clean energy technology,
and India holds a domestic advantage. India has an annual manufacturing capacity of more than 9.5GWforwindturbines.During2015/16,Indiainstalled a total of 3.414 GW of new wind power capacity(MNRE2015a).TamilNadu,Karnataka,Maharashtra, Rajasthan, and Gujarat are the leading states for wind power capacity. The new entrants are Madhya Pradesh and Telangana and they have added 1291.9 MW (the highest of all the states) and 77.5 MW, respectively. The investments in the wind sector are driven by independent power producers (IPPs), public sector undertakings (PSUs), large corporates, and small to mediuminvestors. Out of these, the share of investments made by IPPs has been increasing in recent years, with major players being ReNew Power, Mytrah Energy, Ostro Energy, Orange Renewables, and Hero Future Energies. The investments made by these are generally based on feed-in tariff (FiT) withGBIthroughlong-termPPAs.ForPSUs,thefocus is also on captive consumption. Overall, the Indian wind industry is heading towards strong growth, mainly driven by government’s thrust on renewable energy.
Recently, the National Institute of Wind Energy (NIWE, erstwhile Centre for Wind Energy technology) estimated the wind power potential in India at a hub height of 100 m and arrived at a figure of 302 GW, which is much higher than the estimates made for wind turbines at 50 m and 80 m hub height (MNRE 2016b). The evaluation methodology involved advanced modelling techniques, along with realistic and practical assumptions. This effort was made in the wake of new turbine technologies capable of scaling hub heights over and above 100 m, for example, recently inducted NuPower 141 m, and Suzlon variant of 120 m hybrid tower (with 97 m and 111 m rotor diameter), fitted with doubly fed induction generator (DFiG) (NIWE 2015);Gamesa and Vestas 125 m tubular tower; andRegen Powertech, RRB Energy, and Inox 100 m tubular tower, among others (NIWE 2015).
Offshore windIndia has around 7600 km of coastline with the potential for offshore wind power development. The MNRE’s initiative towards the development of offshore wind power includes the approved National Offshore Wind Energy Policy 2015, which
Table 5 State-wise biomass power plants based on urban, in-dustrial, and agricultural wastes, including biomass cogenera-tion (non-bagasse), commissioned in India
Sl. No. State Cumulative capacity (in MW)
1 Andhra Pradesh 89.09
2 Bihar 8.20
3 Chhattisgarh 2.50
4 Haryana 57.56
5 Himachal Pradesh 7.20
6 Jharkhand 4.30
7 Karnataka 15.20
8 Kerala 0.72
9 Madhya Pradesh 12.35
10 Maharashtra 16.40
11 Meghalaya 13.80
12 Odisha 8.22
13 Punjab 117.10
14 Rajasthan 2.0
15 Tamil Nadu 24.05
16 Uttar Pradesh 156.26
17 Uttarakhand 47.50
18 West Bengal 19.92
Total 601.87
Source MNRE (2016b)
Renewable energy
TERI Energy and Environment Data Diary and Yearbook 2015/16 (Updated Edition) 171
came into effect on 7 October 2015. The National Offshore Wind Energy Policy aims to provide a conducive environment for harnessing offshore wind energy, including setting up a demonstration offshore wind power project to showcase technology and build investors’ confidence. The National Offshore Wind Energy Authority (NOWA) will be constituted under the MNRE, which will be the nodal agency for offshore wind projects in the country. NOWA will carry out resource assessment and surveys in the exclusive economic zones (EEZs) of the country and simultaneously enter into contract with project developers for the development of offshore wind energy project in the territorial waters (PIB 2013). As per the National Offshore Wind Energy Policy, preliminary assessments along the coastline have indicated prospects for the development of offshore wind power. Wind resource data collected from the coastlineofRameshwaramandKanyakumariin Tamil Nadu and from the Gujarat coast show reasonable potential. A preliminary assessment suggests the potential for establishing a 1 GW capacity wind farm along the coastline of both RameshwaramandKanyakumari. In 2013, a 4-year project called Facilitating Offshore Wind in India (FOWIND) wasinitiated with the help of European Union. Theproject aims at identifying potential zones for development through techno-commercial analysis and preliminary resource assessment in the Gulf of Khambhat off the coast of Gujarat. A GlobalWind Energy Council (GWEC) led consortium is implementing this project in Gujarat and Tamil Nadu, wherein NIWE is the knowledge partner. FOWINDisworkingincloseconsultationwiththeMNRE and state government agencies to establish a road map for offshore wind power development in India. The other partners of the consortium include the Centre for Study of Science, Technology and Policy (CSTEP), DNV GL, Gujarat PowerCorporation Ltd (GPCL), and the World Institute of Sustainable Energy (WISE). The first planned demonstration offshore wind power project along the Gujarat coast will be of about 100 MW capacity. Subsidy has been proposed for setting up evacuation and transmission infrastructure for the offshore wind power project, including financial support for carrying out studies
such as wind resource assessment, environment impact assessment, oceanographic survey, and bathymetric studies. The MNRE would assist in obtaining necessary clearances during the implementation of the project. This demonstration project, being the first in the country, will certainly provide enough learning to move into this sector by taking up similar viable projects in the future, enabling India to enter the club of countries in the business of offshore wind power generation.
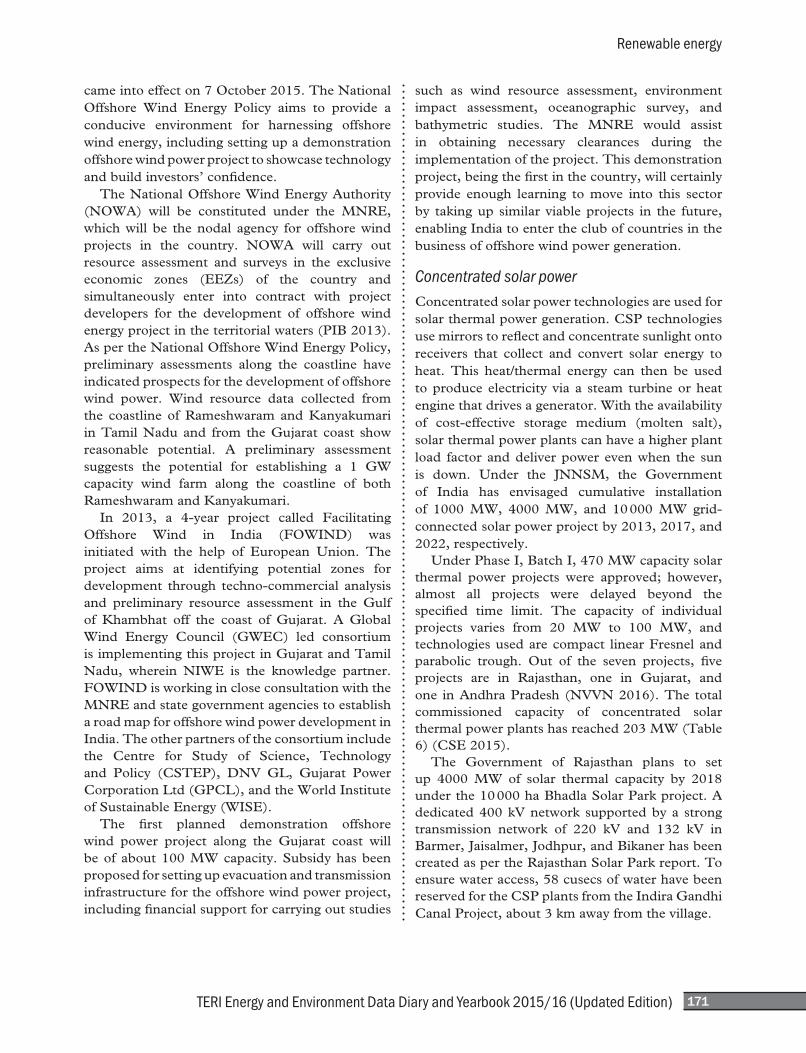
Concentrated solar powerConcentrated solar power technologies are used for solar thermal power generation. CSP technologies use mirrors to reflect and concentrate sunlight onto receivers that collect and convert solar energy to heat. This heat/thermal energy can then be used to produce electricity via a steam turbine or heat engine that drives a generator. With the availability of cost-effective storage medium (molten salt), solar thermal power plants can have a higher plant load factor and deliver power even when the sun is down. Under the JNNSM, the Governmentof India has envisaged cumulative installation of 1000 MW, 4000 MW, and 10 000 MW grid-connected solar power project by 2013, 2017, and 2022, respectively. UnderPhaseI,BatchI,470MWcapacitysolarthermal power projects were approved; however, almost all projects were delayed beyond the specified time limit. The capacity of individual projects varies from 20 MW to 100 MW, and technologies used are compact linear Fresnel and parabolic trough. Out of the seven projects, five projects are in Rajasthan, one in Gujarat, and one inAndhraPradesh(NVVN2016). The total commissioned capacity of concentrated solar thermal power plants has reached 203 MW (Table 6) (CSE 2015).
The Government of Rajasthan plans to set up 4000 MW of solar thermal capacity by 2018 under the 10 000 ha Bhadla Solar Park project. A dedicated400kVnetworksupportedbya strongtransmission network of 220 kV and 132 kV inBarmer,Jaisalmer,Jodhpur,andBikanerhasbeencreated as per the Rajasthan Solar Park report. To ensure water access, 58 cusecs of water have been reserved for the CSP plants from the Indira Gandhi Canal Project, about 3 km away from the village.
Energy supply
TERI Energy and Environment Data Diary and Yearbook 2015/16 (Updated Edition)172
Solar photovoltaicTheIndianSPVmarkethasseensignificantgrowthsince the launch of JNNSM in 2010. The totalinstalled capacity has risen from 40 MW in 2010 to 8513.23 MW as on 30 September 2016. In mid-2015, the Government of India revised its target to 100 GW SPV capacity by 2022. Ofthis, 60 GW is expected to come through ground-mounted utility-scale solar power plants and 40 GW through rooftop solar installations. To meet the capacity targets, the government has decided to take the following measures:• ProvisionofRPOforsolarpowerintheNTP• Settingupultra-megasolarpowerprojectsand
solar parks of 20 GW cumulative capacity across various states
• Concessional import/excise duty exemptionfor setting up solar power plants, accelerated depreciation, and tax holiday incentives
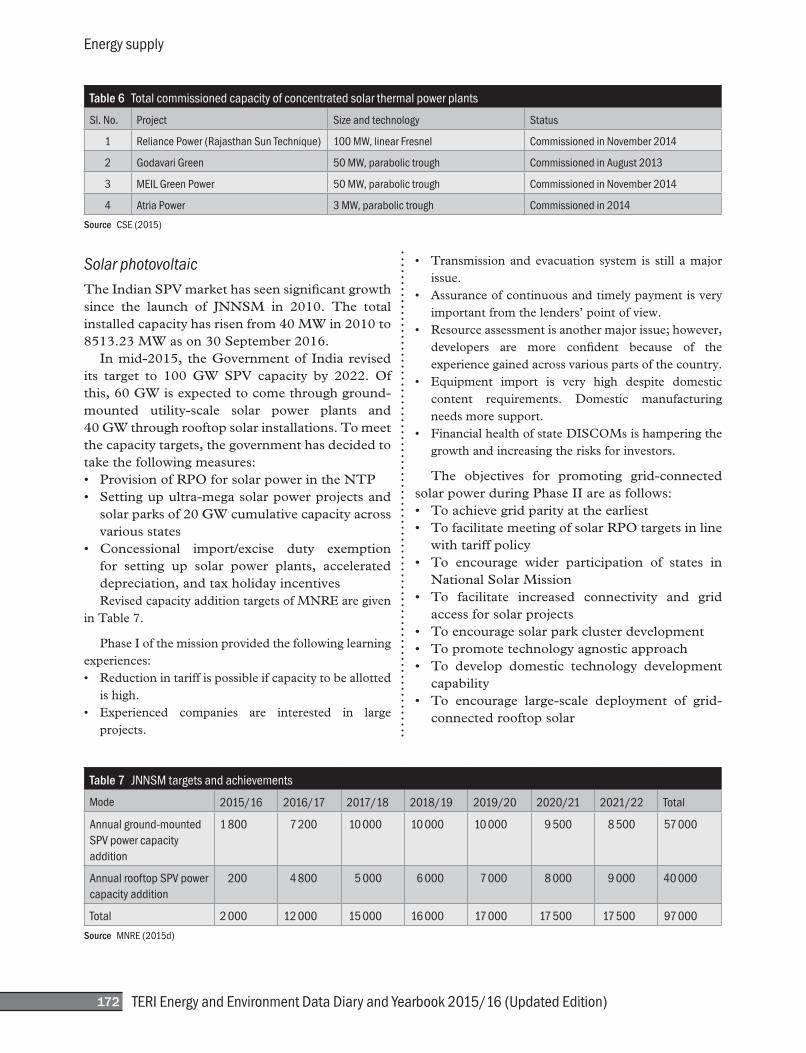
Revised capacity addition targets of MNRE are given in Table 7.
Phase I of the mission provided the following learning experiences:• Reductionintariffispossibleifcapacitytobeallotted
is high.• Experienced companies are interested in large
projects.
• Transmissionandevacuationsystem is stillamajorissue.
• Assuranceofcontinuousandtimelypaymentisveryimportant from the lenders’ point of view.
• Resourceassessmentisanothermajorissue;however,developers are more confident because of the experience gained across various parts of the country.
• Equipment import is very high despite domesticcontent requirements. Domestic manufacturingneeds more support.
• FinancialhealthofstateDISCOMsishamperingthegrowth and increasing the risks for investors.
The objectives for promoting grid-connected solar power during Phase II are as follows:• Toachievegridparityattheearliest• TofacilitatemeetingofsolarRPOtargetsinline
with tariff policy• To encourage wider participation of states in
National Solar Mission• To facilitate increased connectivity and grid
access for solar projects• Toencouragesolarparkclusterdevelopment• Topromotetechnologyagnosticapproach• To develop domestic technology development
capability• To encourage large-scale deployment of grid-
connected rooftop solar
Table 6 Total commissioned capacity of concentrated solar thermal power plants
Sl. No. Project Size and technology Status
1 Reliance Power (Rajasthan Sun Technique) 100 MW, linear Fresnel Commissioned in November 2014
2 Godavari Green 50 MW, parabolic trough Commissioned in August 2013
3 MEIL Green Power 50 MW, parabolic trough Commissioned in November 2014
4 Atria Power 3 MW, parabolic trough Commissioned in 2014
Source CSE (2015)
Table 7 JNNSM targets and achievements
Mode 2015/16 2016/17 2017/18 2018/19 2019/20 2020/21 2021/22 Total
Annual ground-mounted SPV power capacity addition
1 800 7 200 10 000 10 000 10 000 9 500 8 500 57 000
Annual rooftop SPV power capacity addition
200 4 800 5 000 6 000 7 000 8 000 9 000 40 000
Total 2 000 12 000 15 000 16 000 17 000 17 500 17 500 97 000
Source MNRE (2015d)
Renewable energy
TERI Energy and Environment Data Diary and Yearbook 2015/16 (Updated Edition) 173
• To encourage captive and third-party sale ofsolar power to meet power shortages in industry
• Toencouragelocalmanufacturing• To support focused research and development
(R&D)initiatives• Todeveloprenewableenergycertificate(REC)
market• Todevelopstoragesystems
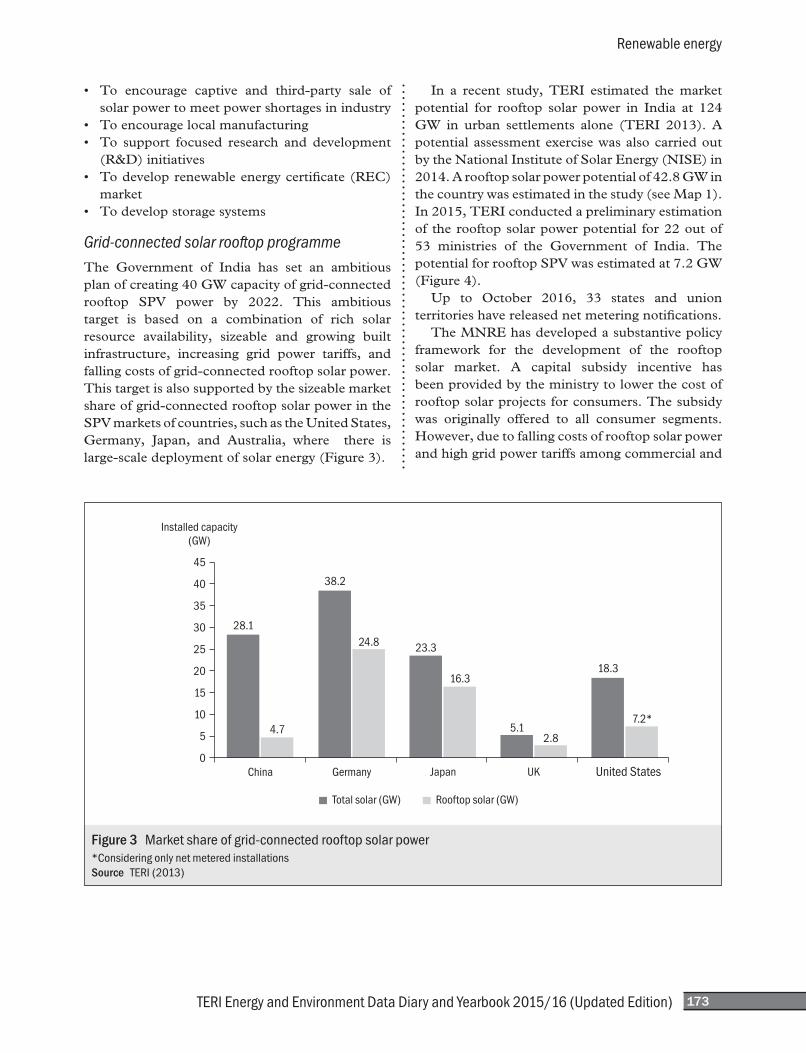
Grid-connected solar rooftop programmeThe Government of India has set an ambitious plan of creating 40 GW capacity of grid-connected rooftop SPV power by 2022. This ambitioustarget is based on a combination of rich solar resource availability, sizeable and growing built infrastructure, increasing grid power tariffs, and falling costs of grid-connected rooftop solar power. This target is also supported by the sizeable market share of grid-connected rooftop solar power in the SPVmarketsofcountries,suchastheUnitedStates,Germany, Japan, and Australia, where there islarge-scale deployment of solar energy (Figure 3).
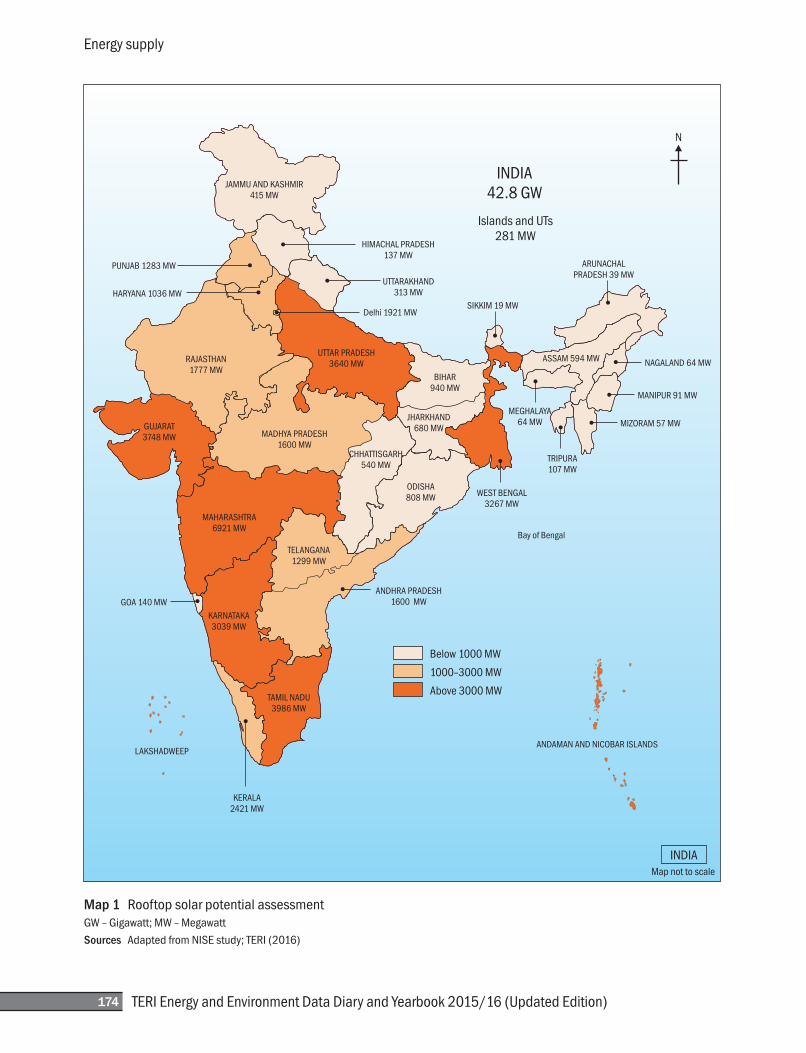
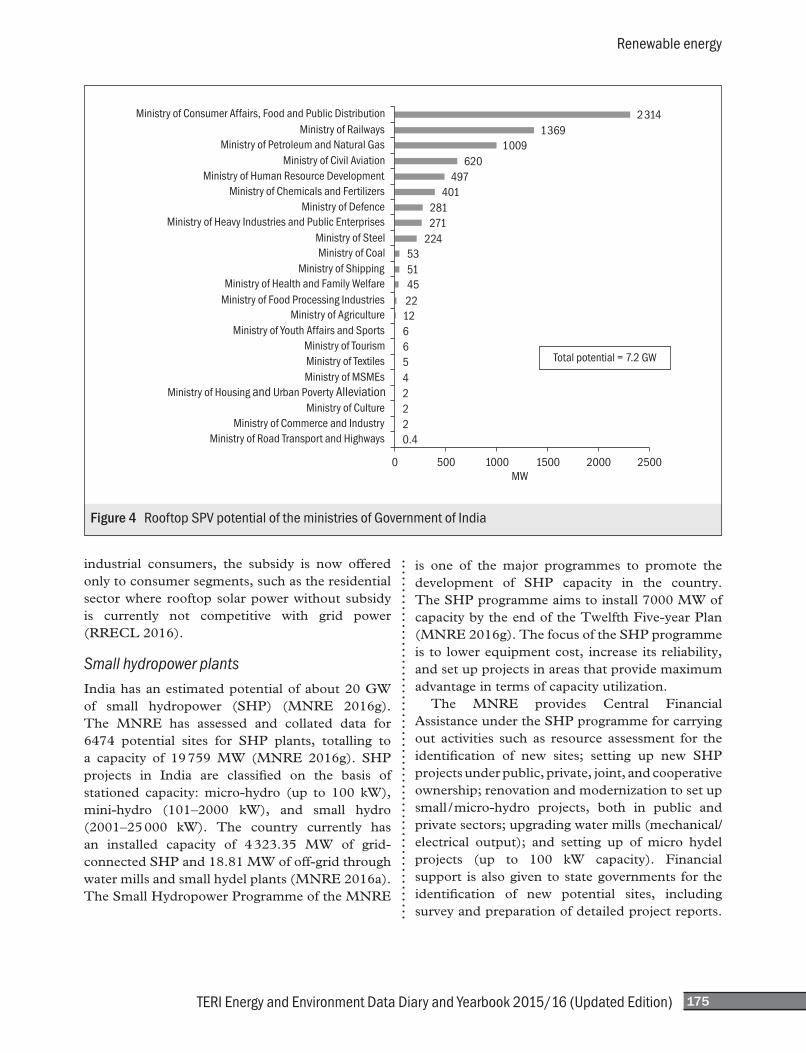
In a recent study, TERI estimated the market potential for rooftop solar power in India at 124 GW in urban settlements alone (TERI 2013). A potential assessment exercise was also carried out by the National Institute of Solar Energy (NISE) in 2014. A rooftop solar power potential of 42.8 GW in the country was estimated in the study (see Map 1). In 2015, TERI conducted a preliminary estimation of the rooftop solar power potential for 22 out of 53 ministries of the Government of India. The potentialforrooftopSPVwasestimatedat7.2GW(Figure 4). Up to October 2016, 33 states and unionterritories have released net metering notifications.
The MNRE has developed a substantive policy framework for the development of the rooftop solar market. A capital subsidy incentive has been provided by the ministry to lower the cost of rooftop solar projects for consumers. The subsidy was originally offered to all consumer segments. However, due to falling costs of rooftop solar power and high grid power tariffs among commercial and
45
40
35
30
25
20
15
10
5
0
38.2
24.823.3
16.3
2.85.1
18.3
7.2*4.7
28.1
China Germany Japan UK United States
Installed capacity
(GW)
Total solar (GW) Rooftop solar (GW)
Figure 3 Market share of grid-connected rooftop solar power*Considering only net metered installationsSource TERI (2013)
Energy supply
TERI Energy and Environment Data Diary and Yearbook 2015/16 (Updated Edition)174
Map 1 Rooftop solar potential assessment GW – Gigawatt; MW – Megawatt
Sources Adapted from NISE study; TERI (2016)
Renewable energy
TERI Energy and Environment Data Diary and Yearbook 2015/16 (Updated Edition) 175
industrial consumers, the subsidy is now offered only to consumer segments, such as the residential sector where rooftop solar power without subsidy is currently not competitive with grid power (RRECL 2016).
Small hydropower plantsIndia has an estimated potential of about 20 GW of small hydropower (SHP) (MNRE 2016g). The MNRE has assessed and collated data for 6474 potential sites for SHP plants, totalling to a capacity of 19 759 MW (MNRE 2016g). SHP projects in India are classified on the basis of stationed capacity: micro-hydro (up to 100 kW), mini-hydro (101–2000 kW), and small hydro (2001–25 000 kW). The country currently has an installed capacity of 4 323.35 MW of grid-connected SHP and 18.81 MW of off-grid through water mills and small hydel plants (MNRE 2016a). The Small Hydropower Programme of the MNRE
is one of the major programmes to promote the development of SHP capacity in the country. The SHP programme aims to install 7000 MW of capacity by the end of the Twelfth Five-year Plan (MNRE 2016g). The focus of the SHP programme is to lower equipment cost, increase its reliability, and set up projects in areas that provide maximum advantage in terms of capacity utilization.
The MNRE provides Central Financial Assistance under the SHP programme for carrying out activities such as resource assessment for the identification of new sites; setting up new SHP projects under public, private, joint, and cooperative ownership; renovation and modernization to set up small / micro-hydro projects, both in public and private sectors; upgrading water mills (mechanical/electrical output); and setting up of micro hydel projects (up to 100 kW capacity). Financial support is also given to state governments for the identification of new potential sites, including survey and preparation of detailed project reports.
Figure 4 Rooftop SPV potential of the ministries of Government of India
Energy supply
TERI Energy and Environment Data Diary and Yearbook 2015/16 (Updated Edition)176
It also helps the state governments in formulating policies for the development of SHP projects and exploitation of their potential. In addition, technical support is being provided to SHP units through the Alternate Hydro Energy Centre, Indian Institute of Technology, Roorkee. With India targeting a capacity addition of 175 GW through renewable energy by 2022, SHP projects are expected to cover a significant share of 5 GW (PIB 2015). The government-run schemes, if evaluated, could help achieve the maximum utilization potential of SHP plants considering the current diffusion and dissemination pattern in the country.
Other technologies
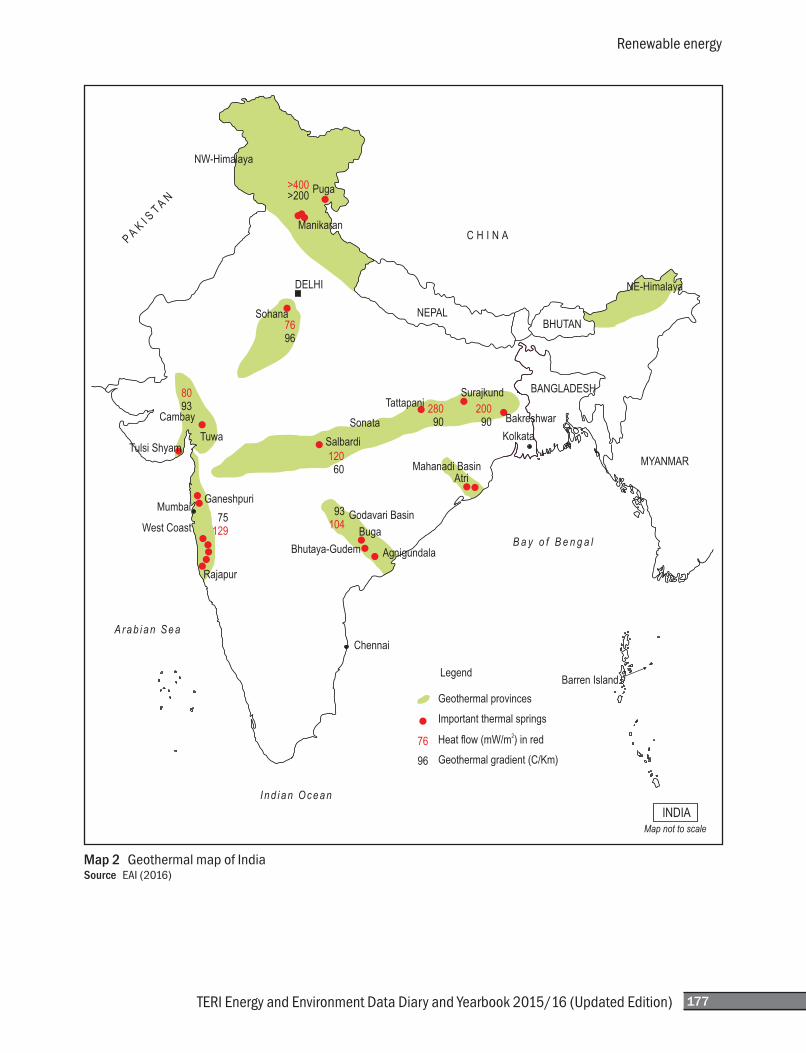
Geothermal energyIndia is reported to have a geothermal potential of 10 000 MW. Gujarat, Chhattisgarh, Andhra Pradesh, and West Bengal are the first Indian states that plan to build geothermal power plants with capacities ranging from 3 MW to 5 MW (Asian Power 2013). The current projects and potential areas of geothermal resources in India are located inPugaValley (JammuandKashmir),Tattapani(Chhattisgarh), Godavari Basin, Manikaran (Himachal Pradesh), Bakreswar (West Bengal), Tuwa(Gujarat),Unai(Maharashtra),andJalgaon(Maharashtra) (EAI 2016). Map 2 shows the potential areas or geothermal hot spots in India. A number of Indian firms have already signed memoranda of understanding for geothermal projects. All these projects involve companies such asPanxGeothermal,LNJBhilwara,TataPower,Thermax, Avni Energy Systems, GeoSyndicate Power Pvt. Ltd, ONGC, Mitsubishi, and NTPC (EAI 2016). The capital cost of installing 1 MW of geothermal energy works out to be `16–20 crore. The government is in the process of forming an agency to oversee the exploration of geothermal resources that are declared as “national resource” (Nair 2013).
Hydrogen energyAt present, hydrogen energy is only at the stage of research, development, and demonstration. Although futuristic and niche, a lot of development is happening in this sector. The National Hydrogen
Energy Road Map prepared in 2007, feeding in the National Hydrogen Energy Programme, envisages that 1 million hydrogen-fuelled vehicles would be on Indian roads and 1000 MW aggregate hydrogen-based power-generating capacity would be created in the country, both by 2020 (MNRE 2016d). Environmentally benign processes / technologies for the production of hydrogen have been developed and demonstrated. Materials / alloys /methods have been developed for the storage of hydrogen as metal hydrides. The application of hydrogen in fuel cells for power generation has been demonstrated as a result of initiatives taken by this ministry. Hydrogen-fuelled small power-generating sets and about 15 hydrogen-fuelled motorcycles are being demonstrated in the campus of Banaras Hindu University, Varanasi. Facilitiesfor dispensing hydrogen blended CNG fuel have beensetupinFaridabadandDelhi,andcatalyticcombustion systems for residential (cookers) and industrial sectors have also been developed and demonstrated. The Ministry of Science and Technology, CSIR Laboratories, Ministry of Petroleum and Natural Gas, Defence Research andDevelopmentOrganisation,IndianSpaceResearchOrganisation, Department of Atomic Energy, oiland gas companies, and private sector automobile companies are also involved in the research, development, and demonstration programmes related to hydrogen (MNRE 2016d).
Fuel cellsThe MNRE runs the Chemical Sources of Energy Programme for the development of fuel cell technology. A fuel cell–battery hybrid vehicle with indigenously developed 10 kW proton exchange membrane fuel cell (PEMFC) stack has undergone field performance evaluation. Efforts made are expected to lead to the indigenous production and wider applications of fuel cell systems in the country. Fuel cells are emerging as power sources for automobiles. The widespread use of fuel cells for power generation, transport, and other applications is expected to reduce dependence on scarce fossil fuels and help in preserving the environment. Some of the achievements made so far are as follows (MNRE 2016c):
Renewable energy
TERI Energy and Environment Data Diary and Yearbook 2015/16 (Updated Edition) 177
Map 2 Geothermal map of IndiaSource EAI (2016)
Energy supply
TERI Energy and Environment Data Diary and Yearbook 2015/16 (Updated Edition)178
• Indigenous base for research and industrialproduction being established
• R&D projects leading to technology/process/material development
• Prototypes of PEMFCs and phosphoric acidfuel cells developed
• Application of fuel cells demonstrated fordecentralized power generation
• A 3 kW capacity uninterrupted power supplybased on PEMFC developed
• Reformerfora10kWPEMFCsystemdevelopedand tested
Liquid biofuelsTo meet the increasing energy needs of the country and provide energy security, the National Policy on Biofuels was announced in December 2009.The major goals of the policy are development and utilization of indigenous non-food feedstocks raised on degraded or wastelands; thrust on research and development on cultivation, processing, and production of biofuels; and a blending mandate of 20% ethanol and biodiesel by 2017. A variety of fuels can be produced from biomass resources, including liquid fuels such as ethanol, methanol, butanol, biodiesel, and pyrolytic oil (or bio-oil). Biofuels are primarily used to fuel vehicles, but they can also be used in fuel engines or cells for electricity generation. Liquid biofuels are an approach to moving our economy to a more sustainable basis because they lead us away from fossil fuels. Unlikeotherrenewableenergysources,biomasscan be directly converted to liquid fuels for our transportation needs. India’s first biofuel station would be commissioned in Hassan, Karnataka.According to the Biofuel Task Force and Bharat Petroleum Corporation Ltd, it would be set up at the Biofuel Park campus near Madenur village. Around 0.5 L of biodiesel has to be added and supplied to vehicles for every 10 L of the conventional diesel. There are three major technological pathways for making liquid biofuels: biochemical (e.g. enzymatic fermentation) to make bio-alcohols, thermochemical (e.g. pyrolysis, gasification) to make bio-oil and Fischer–Tropsch fuels, and transesterification to make biodiesel.
Three government institutions—MNRE,Department of Biotechnology (DBT), andDepartmentofScienceandTechnology(DST)—are directly promoting and supporting different alternativebiofuelprogrammesinIndia.IntheR&Dprogrammes, the MNRE is primarily supporting the thermochemical and chemical routes, such as pyrolysis for bio-oil and transesterification for biodieselproduction,whereasDBTis supportingthe biochemical and other biotechnological routes for bioethanol, biodiesel, and algal biofuel production. The MNRE is formulating a national policy on biofuels, besides supporting research, development, and demonstration of biofuels. In India, pyrolysis through the thermochemical route has not been extensively tapped compared to other thermochemical conversion technologies, such as gasification and combustion for power generation. Research on pyrolysis for liquid fuel and chemicals in India has reached the pilot scale from the bench scale. However, no commercial plant has been built yet. The MNRE’s R&D strategyon thermochemical biomass conversion shows that there is special thrust on basic research into pyrolysis, capability generation, and systematic experimental and modelling work on low and high temperature. Pyrolysis is definitely the first step towards this goal.
Ocean energy India has 159 km2 of tropical water in the EEZ, with a power density of 0.2 MW/km2. In the subsequent sections, the developments and advancements of ocean thermal and tidal energy in India would be described.
Ocean thermal energy
Ocean thermal energy conversion (OTEC) can still be considered a nascent technology. However, the potential is significant because oceans capture a large amount of sunlight falling on the earth. In 1998, the erstwhile Ministry of Non-Conventional Energy Sources had sanctioned a project named Demonstrationof1MWOTECPowerPlanttotheNational Institute of Ocean Technology, Chennai, which was suspended in 2009/10 due to shortage of funds (NIOT 2016).The MNRE has estimated that India has a potential of exploiting 80 000–180 000 MW of OTEC-based power (TERI 2015).
Renewable energy
TERI Energy and Environment Data Diary and Yearbook 2015/16 (Updated Edition) 179
Tidal energy
India has a long coastline with estuaries and gulfs, where tides are strong enough to move turbines for electrical power generation. The Gulf of Cambay andtheGulfofKutchinGujaratonthewestcoasthave the maximum tidal range of 11 m and 8 m, respectively, and the average tidal range of 6.77 m and 5.23 m, respectively. The maximum tidal range in the Sundarbans area is 5 m approximately and the average tidal range is 2.97 m. The identified economic power potential is of the order of 8000 MW with about 7000 MW in the Gulf of Cambay, 1200 MW in the Gulf of Kutch inGujarat, and 100 MW in the Gangetic Delta inthe Sundarbans region of West Bengal (MNRE 2016f). The ministry has sanctioned a project for setting up a 3.75 MW demonstration tidal power plant at Durgaduani Creek in Sundarbans, WestBengal, to the West Bengal Renewable Energy DevelopmentAgency.TheNationalHydroelectricPower Corporation Ltd is executing the project on a turnkey basis. The Government of Gujarat has formed a special purpose vehicle with public–private partnership and sponsored a study for the large-scale exploitation of tidal energy across the coastline of Gujarat. This study is based on one of the advanced technologies developed so far. In this technology, the kinetic energy of tidal currents has been proposed to be harnessed under the water and along the flow of water without using the conventional methods such as water wheel or other types of turbines (MNRE 2016f).
Renewable energy technology integrationThe large amounts of renewable electricity generation around the country has created new challenges for the transmission and distribution sectors. Augmentation of transmission capacity enables better management of renewable energy, which is variable in nature. From a long-term perspective, transmission capacity needs to be augmented with the conventional sources, energy storage, and adequate reactive power sources in the network. From a short-term perspective, there needs to be better forecasting of renewable energy to help utilities in efficient scheduling and dispatch of renewable energy generation, thereby contributing
to grid stability. In the report titled “Green Energy Corridors,” the Power Grid Corporation of India has estimated that around ` 43 000 crore would be required to strengthen and develop the evacuation and transmission infrastructure for the planned addition of renewable power capacity in the next 5 years. Currently, renewable energy generated anywhere in the country is absorbed within the state grids.
Challenges in the renewable energy sectorVariouschallengesandbarriersimpedethescaling-up of renewable energy technologies in India. The barriers span policy, regulatory, financial, technological, and institutional aspects and can be specific to individual renewable energy sources or can be overarching and hinder renewable energy deployment in general.
Reducing per unit cost and bringing renewables to grid parity pose a challenge. Although costs have fallen drastically over the past few years, there is a need to continuously innovate to increase efficiency and bring down costs further. Innovations can be brought about in various ways. It is possible to harness lower wind speeds with better technology, develop high-efficiency solar cells from carbon nanotube materials, channel the energy of tides and waves to produce electricity, harness the large potential of offshore wind energy, use alternative transport fuels to make travelling less carbon intensive, utilize hydrogen for energy storage, and have a larger grid with lower losses of electricity. There are specific challenges for each renewable fuel source.
For biomass, there is an absence of effective institutional and financing mechanism, reflected by the absence of commercial and service networks (biomass depots for collection, transportation, and delivery of biomass fuels) at the national, regional, and local levels, and limited access to financing and lack of interest on the part of state electricity boards in promoting biomass power generation. Biomass projects have also a long gestation period, and the project development cycle requires several years to be completed. Biomass fuel supply risks are twofold: the first is the physical availability, observed in the case of all biomass power projects (rainfall, harvesting effectiveness, and productivity).
Energy supply
TERI Energy and Environment Data Diary and Yearbook 2015/16 (Updated Edition)180
The second is the question of contracted supply encountered when dealing with distributed biomass supplies. The inability to lock up sufficient supplies of biomass from various sources will hinder project finance and implementation. For wind power, there is a lack of an appropriate regulatory framework to facilitate the purchase of renewable energy from outside the host state, inadequate grid connectivity, high wheeling and open access charges in some states, and delays in obtaining land and obtaining statutory clearances, which have hindered faster deployment. The wind sector is also very vulnerable to changes in policy and incentives as demonstrated by drastic drop in installations due to reduction in accelerated depreciation benefit and GBI in the past year. For solar power, high capital cost and payback period; lower efficiency; need for back-up or storage; insufficient solar radiation data; lack of consumer awareness about technology; lack of trained people and training institutes; absence of financing mechanism; and lack of local infrastructure, political commitment, and research and development are hindering faster deployment (Ansari,Kharb,Luthra,et al. 2013). There are limitations to setting up SHP projects due to difficult and remote terrains in hilly/mountainous regions with severe infrastructural constraints and difficulty in transmission of power to the grid. The locational hurdles also prolong the gestation period and push up the per-megawatt capital costs, even as the power evacuation and transmission facilities at the sites remain inadequate. Additionally, there are also delays in acquiring land and obtaining statutory clearances. A number of factors undermine the current RPO and REC markets in India. The most critical issue is that non-compliance is not penalized, and if it is penalized, the penalty is to be paid mostly by the indebted state electricity boards. This is compounded by another counterproductive trend: RPO targets are not ambitious enough to create a market pull. Some states such as Rajasthan have
reduced their target to match the actual renewable energyproduction.Veryfewstateshaveescalating RPO targets. Tamil Nadu has set a target lower than its (considerable) renewable power generation. The REC market has its own challenges over and above the unpredictable demand from RPOs. Only around 50% of RECs are actually sold, and trading dips drastically during the early months of a financial year. This makes RECs not bankable. There are a number of further bottlenecks and open questions, for instance, the lack of market aggregators (trading is allowed only through the energy exchanges), the discussion about vintage RECs, or clarifications on whether captive and off-grid renewable energy plants can generate RECs.
International status of renewable energy and India’s positionIndia added more than 4 GW of renewable energy capacity in the previous year. SPV and windaccounted for almost 70% of renewable additions in 2013. Renewables made up approximately 17% of the total additions from all sources during 2013. India was the fourth largest market for wind power in 2013, with more than 1.7 GW of wind power installed. This was, however, a shrink of 26% over the previous year, primarily due to the devaluation oftherupeeagainsttheUSdollarandtheremovalof key support policies in 2012. The reinstatement of GBI in late 2013, however, helped revive the market. India leads in the use of concentrating solar thermal systems, with at least 145 systems producing steam, primarily for cooking. India also leads the world in the total capacity of small gasifiers for electricity generation, with a capacity exceeding 155 MW. Additionally, India, Brazil, China, and South Africa are in the lead for the development of large-scale programmes that address the dual challenges of energy access and sustainability.
Renewable energy
TERI Energy and Environment Data Diary and Yearbook 2015/16 (Updated Edition) 181
Wind–solar hybrid
Renewable energy sources such as wind power and solar energy offer the potential to mitigate climate change, enhance energy security, and improve access to clean energy. However, renewable energy projects based on wind or solar energy technology are facing a few challenges, such as intermittency in power generation profile with seasonal variations in power output, high cost of separate connectivity and evacuation infrastructure, and suboptimal utilization of land. These issues can be addressed by a renewable energy hybrid project. In renewable energy hybrid, the solar panels can be installed in the intervening spaces between the wind turbines upon addressing the shadow effect. This will enhance power generation from the given land by harnessing both renewable energy sources. As both solar power and wind power are infirm in nature, they pose certain challenges on grid security and stability. Many studies have revealed that solar and wind are almost complementary to each other and merging of the two technologies would help minimize the variability, apart from optimally utilizing the infrastructure, including land and transmission system. Studies also suggest that there are large areas where both wind and solar have high to moderate potential. The existing wind farms have scope of enhancing solar PV capacity and there may be wind potential in the vicinity of the existing solar PV plant. Suitable policy interventions are required not only for new wind–solar hybrid plants but also for hybridization of the existing wind and solar plants. To promote the hybrid renewable energy project, the Ministry of New and Renewable Energy has come out with the draft National Wind-Solar Hybrid Policy 2016, with the objective of providing a framework for promotion of the large grid-connected wind–solar PV hybrid system. The draft policy will ensure optimal and efficient utilization of transmission infrastructure and land, reducing the variability in renewable power generation and thus achieving better grid stability. The draft policy aims to add 10 GW of wind–solar hybrid capacity by 2022.
Energy supply
TERI Energy and Environment Data Diary and Yearbook 2015/16 (Updated Edition)182
ReferencesAnsari, M. F., R. K. Kharb, S. Luthra, S. Shimmi, and S. Chatterji. 2013.
Analysis of barriers to implement solar power installations in India. Renewable and Sustainable Energy Reviews 27: 163–174
Asian Power. 2013. Gujarat bids for India’s first geothermal power plant. Details available at http://asian-power.com/project/news/gujarat-bids-india%E2%80%99s-first-geothermal-power-plant; last accessed on 27 July 2016
Bhave, A. G. 2012. Industrial process heat applications of solar energy. International Journal of Modern Engineering Research 2(5): 3800–3802
BNEF (Bloomberg New Energy Finance). 2014. Global Trends in Renewable Energy Investment 2014. Frankfurt am Main, Germany: Frankfurt School-UNEP Collaborating Centre, United Nations Environment Programme, and Bloomberg New Energy Finance
CSE (Centre for Science and Environment). 2015. The state of concentrated solar power in India: A roadmap to developing solar thermal technologies in India. Details available at www.cseindia.org/userfiles/State%20of%20CSP%20in%20India%20low.pdf
EAI (Energy Alternatives India). 2016. India geo-thermal energy. Details available at www.eai.in/ref/ae/geo/geo.html; last accessed on 27 July 2016
Global Wind Energy Council (GWEC). 2015. Global Wind Statistics 2015 - GWEC. Details available at http://www.gwec.net/wp-content/uploads/vip/GWEC-PRstats-2015_LR.pdf
Hiloidhari, M., D. Das, and D.C. Baruah. 2014. Bioenergy potential from crop residue biomass in India. Renewable and Sustainable Energy Reviews 32: 504–512
Krishnamurthy, K. N., K.S. Shashishekar, and B.N. Akashdeep. 2010. Performance analysis of vacuum tube collectors for hard water using jacket type heat exchanger. International Journal of Engineering Research and Technology 3: 641–651
MNRE (Ministry of New and Renewable Energy). 2014. Annual Report 2013-14. Details available at http://mnre.gov.in/file-manager/annual-report/2014-2015/EN/Chapter%201/chapter_1.htm
MNRE (Ministry of New and Renewable Energy). 2015a. Annual Report 2014-15. Details available at http://mnre.gov.in/file-manager/annual-report/2014-2015/EN/Chapter%201/chapter_1.htm; last accessed on 26 July 2016
MNRE (Ministry of New and Renewable Energy). 2015b. Implementation of National Biogas and Manure Management Programme (NBMMP).Details available at http://mnre.gov.in/file-manager/offgrid-biogas/Physical-Targets-2015-16-of-NBMMP.pdf; last accessed on 27 July 2016
MNRE (Ministry of New and Renewable Energy). 2015c. National Renewable Energy Act 2015: Draft. Details available at http://mnre.gov.in/file-manager/UserFiles/draft-rea-2015.pdf; last accessed on 26 July 2016
MNRE (Ministry of New and Renewable Energy). 2015d. Scaling-up grid connected solar projects. Details available at http://mnre.gov.in/file-manager/grid-solar/100000MW-Grid-Connected-Solar-Power-
Projects-by-2021-22.pdf; last accessed on 27 July 2016MNRE (Ministry of New and Renewable Energy). 2016a. Physical
progress. Details available at http://mnre.gov.in/mission-and-vision-2/achievements; last accessed on May 2016
MNRE (Ministry of New and Renewable Energy). 2016b. Annual Report 2015-16. New Delhi: Ministry of New and Renewable Energy
MNRE (Ministry of New and Renewable Energy). 2016c. Chemical energy. Details available at www.mnre.gov.in/schemes/new-technologies/chemical-energy; last accessed on 27 July 2016
MNRE (Ministry of New and Renewable Energy). 2016d. Hydrogen energy. Details available at www.mnre.gov.in/schemes/new-technologies/hydrogen-energy; last accessed on 26 July 2016
MNRE (Ministry of New and Renewable Energy). 2016e. National policy for renewable energy based micro and mini grids. Details available at http://mnre.gov.in/file-manager/UserFiles/draft-national-Mini_Micro-Grid-Policy.pdf; last accessed on 26 July 2016
MNRE (Ministry of New and Renewable Energy). 2016f. Ocean energy. Details available at www.mnre.gov.in/schemes/new-technologies/tidal-energy; last accessed on 26 July 2016
MNRE (Ministry of New and Renewable Energy). 2016g. Small Hydro Power Programme. Details available at http://mnre.gov.in/schemes/grid-connected/small-hydro; last accessed on 27 July 2016
MoP (Ministry of Power). 2015a. Deendayal Upadhyaya Gram Jyoti Yojana. Villages Electrified across the Country. Details available at www.ddugjy.in; last accessed on 26 July 2016
MoP (Ministry of Power). 2015b. Power sector glance. Details available at http://powermin.nic.in/power-sector-glance-all-india; last accessed on 26 July 2016
MoP (Ministry of Power). 2016. Tariff policy resolution. Details available at http://powermin.nic.in/upload/pdf/Tariff_Policy-Resolution_Dated_28012016.pdf; last accessed on 26 July 2016
MoSPI (Ministry of Statistics and Programme Implementation). 2015. Energy statistics. Details available at http://mospi.nic.in/Mospi_New/upload/Energy_stats_2015_26mar15.pdf; last accessed on 26 July 2016
MoSPI (Ministry of Statistics and Programme Implementation). 2016. Energy statistics. Details available at http://www.mospi.gov.in/sites/default/files/publication_reports/Energy_statistics_2016.pdf; last accessed on 10 November 2016
Nair, A. 2013. State pitches for first geothermal energy plant in country. Details available at http://archive.indianexpress.com/news/state-pitches-for-first-geothermal-energy-plant-in-country/1147784; last accessed on 27 July 2016
NIOT (National Institute of Ocean Technology). 2016. Details available at https://www.niot.res.in last accessed on 26 July 2016
NITI Aayog. 2015. Report of the expert group on 175 GW RE by 2022.Details available at http://niti.gov.in/writereaddata/files/writereaddata/files/document_publication/report-175-GW-RE.pdf
NIWE (National Institute of Wind Energy). 2015. Revised list of models and manufacturers of wind turbines. Details available at http://niwe.res.in/assets/Docu/RLMM_Main_List_28.09.2015.pdf; last
Renewable energy
TERI Energy and Environment Data Diary and Yearbook 2015/16 (Updated Edition) 183
accessed on 27 July 2016NVVN (NTPC Vidyut Vyapar Nigam). 2016. List of selected projects.
Details available at http://nvvn.co.in/Selected%20Projects%20List.pdf; last accessed on 27 July 2016
PIB (Press Information Bureau). 2013. National Offshore Wind Energy Authority (NOWA) to be constituted shortly. Details available at http://pib.nic.in/newsite/PrintRelease.aspx?relid=98283; last accessed on 27 July 2016
PIB (Press Information Bureau). 2015. Year-end review: Solar power target reset to one lakh MW; Several states witness silent revolution of rooftop solar power generation; National wind energy policy brought in; PM launches International Solar Alliance; 56 solar cities in the offing; One lakh solar pumps for irrigation; Renewable energy law to be enacted. Details available at http://pib.nic.in/newsite/PrintRelease.aspx?relid=133220
Planning Commission. 2014. Report of the Task Force on Waste to Energy (Volume I). New Delhi: Planning Commission, Government of India
RRECL (Rajasthan Renewable Energy Corporation Ltd). 2016. Revised tender document under rooftop solar power generation scheme. Details available at http://www.rrecl.com/manage/Revised_RT_Tender_25MW.pdf; last accessed on 26 July 2016
Saxena, A. and G. Srivastava. 2012. Potential and economics of solar water heating. MIT International Journal of Mechanical Engineering2: 98
TERI (The Energy and Resources Institute). 2013. Reaching the Sun with Rooftop Solar. New Delhi: Shakti Sustainable Energy Foundation
TERI (The Energy and Resources Institute). 2015. TERI Energy & Environment Data Diary and Yearbook (TEDDY) 2015/16. New Delhi: TERI
TERI (The Energy and Resources Institute). 2016. Grid Parity of Solar PV Rooftop Systems for the Commercial and Industrial Sectors.New Delhi: TERI
BibliographyCEA (Central Electricity Authority). 2012. Monthly generation report
(renewable energy sources). Details available at www.cea.nic.in/ reports/articles/god/renewable_energy.pdf
IEA (International Energy Agency). 2011. Key World Energy Statistics 2011. Paris: IEA
MNRE (Ministry of New and Renewable Energy). 2012a. Jawaharlal Nehru National Solar Mission Phase II–Policy Document. Details available at http://mnre.gov.in/file-manager/UserFiles/draft-jnnsmpd-2.pdf
MNRE (Ministry of New and Renewable Energy). 2012b. India has estimated potential for 19,750 MW of small hydro power projects. Details available at http://pib.nic.in/newsite/PrintRelease. aspx?relid=86860; last accessed on 13 August 2013
NRDC (Natural Resources Defense Council). 2012. Constructing change: Accelerating energy efficiency in India’s buildings market. Details available at www.nrdc.org/international/files/india-constructing-change-report.pdf; last accessed on 6 September 2013
NREL (National Renewable Energy Laboratory). 2012. Learning about renewable energy. Details available at www.nrel.gov/learning/re_basics.html; last accessed on 19 August 2013
PIB (Press Information Bureau). 2012. India is committed to increasing share of renewable energy, says Dr. Farooq Abdullah at IIEA, Dublin. Details available at http://pib.nic.in/ newsite/mbErel.aspx?relid=84919; last accessed on 2 August 2013
Ramesh, M. 2013. Wind power capacity addition falls to 1,700 MW. Details available at www.thehindubusinessline.com/companies/ wind-power-capacity-addition-falls-to-1700-mw/article4610962. ece
REN 21. 2014. Renewables 2014 Global Status Report: REN21. Paris: Renewable Energy Policy Network for the 21st Century (REN 21)