article - cell press
TRANSCRIPT

Article
Developmentally regulated
impairment ofparvalbumin interneuron synaptic transmission in anexperimental model of Dravet syndromeGraphical abstract
Highlights
d ‘‘Mini-slices’’ allow recording of neurons from the same
mouse at two time points
d PV interneurons show transient impairment of spike
generation in Dravet syndrome mice
d Dysfunction of PV-IN synaptic transmission is long lasting
Kaneko et al., 2022, Cell Reports 38, 110580March 29, 2022 ª 2022 The Author(s).https://doi.org/10.1016/j.celrep.2022.110580
Authors
Keisuke Kaneko, Christopher B. Currin,
Kevin M. Goff, Eric R. Wengert,
Ala Somarowthu, Tim P. Vogels,
Ethan M. Goldberg
In brief
Dravet syndrome is caused by variants in
SCN1A with loss of function of Nav1.1
sodium channels. Kaneko et al. use the
‘‘mini-slice’’ to record at two
developmental time points. Impaired
spike generation of Nav1.1-expressing
PV interneurons in Scn1a+/� mice is
transient, while abnormalities of PV
interneuron synaptic transmission
persist.
ll

OPEN ACCESS
llArticle
Developmentally regulated impairment ofparvalbumin interneuron synaptic transmission inan experimental model of Dravet syndromeKeisuke Kaneko,1 Christopher B. Currin,2 Kevin M. Goff,3,4 Eric R. Wengert,1 Ala Somarowthu,1 Tim P. Vogels,2
and Ethan M. Goldberg1,4,5,6,7,*1Division of Neurology, Department of Pediatrics, The Children’s Hospital of Philadelphia, Abramson Research Center, Philadelphia, PA
19104, USA2The Institute of Science and Technology Austria, Am Campus 1, Klosterneuburg, Austria3Medical Scientist Training Program (MSTP), The University of Pennsylvania Perelman School of Medicine, Philadelphia, PA 19104, USA4Neuroscience Graduate Group, The University of Pennsylvania Perelman School of Medicine, Philadelphia, PA 19104, USA5Department of Neurology, The University of Pennsylvania Perelman School of Medicine, Philadelphia, PA 19104, USA6Department of Neuroscience, The University of Pennsylvania Perelman School of Medicine, Philadelphia, PA 19104, USA7Lead contact
*Correspondence: [email protected]
https://doi.org/10.1016/j.celrep.2022.110580
SUMMARY
Dravet syndrome is a neurodevelopmental disorder characterized by epilepsy, intellectual disability, andsudden death due to pathogenic variants in SCN1A with loss of function of the sodium channel subunitNav1.1. Nav1.1-expressing parvalbumin GABAergic interneurons (PV-INs) from young Scn1a+/� mice showimpaired action potential generation. An approach assessing PV-IN function in the same mice at two timepoints shows impaired spike generation in all Scn1a+/� mice at postnatal days (P) 16–21, whether deceasedprior or surviving to P35, with normalization by P35 in surviving mice. However, PV-IN synaptic transmissionis dysfunctional in young Scn1a+/� mice that did not survive and in Scn1a+/� miceR P35. Modeling confirmsthat PV-IN axonal propagation is more sensitive to decreased sodium conductance than spike generation.These results demonstrate dynamic dysfunction in Dravet syndrome: combined abnormalities of PV-IN spikegeneration and propagation drives early disease severity, while ongoing dysfunction of synaptic transmis-sion contributes to chronic pathology.
INTRODUCTION
Dravet syndrome (DS) is a neurodevelopmental disorder charac-
terized by temperature-sensitive seizures, treatment-resistant ep-
ilepsy, developmental delay, and intellectual disability with fea-
tures of autism spectrum disorder (ASD), and increased
incidence of sudden unexpected death in epilepsy (SUDEP). DS
is due to heterozygous pathogenic loss-of-function variants in
the gene SCN1A encoding the voltage-gated sodium (Na+) chan-
nel a subunit Nav1.1 (Dravet, 2011; Scheffer, 2012). While new
pharmacological therapies for DS have emerged, including
cannabidiol (CBD) (Kaplan et al., 2017; Khan et al., 2018) and fen-
fluramine (Ceulemans et al., 2016; Schoonjans et al., 2017), and
antisense oligonucleotide-based approaches may be on the hori-
zon (Han et al., 2020), treatment remains essentially palliative, and
there is no cure. Previous studies in experimental mouse models
of DS (Scn1a+/� mice) show prominent dysfunction of cerebral
cortex GABAergic interneurons (INs) at early time points (second
and third postnatal weeks), particularly the parvalbumin (PV)-ex-
pressing subclass (PV-INs) (Yu et al., 2006; Ogiwara et al., 2007;
Tai et al., 2014; De Stasi et al., 2016). However, recent data sug-
This is an open access article under the CC BY-N
gest that impairments of spike generation may be transient (Fa-
vero et al., 2018), which raises the question as to the mechanism
of chronic epilepsy, intellectual disability, ASD, and ongoing sud-
den death in Scn1a+/�mice and DS patients. This finding also has
important implications for emerging efforts to increase expression
of SCN1A as a potential therapeutic strategy (Colasante et al.,
2019; Han et al., 2020; Yamagata et al., 2020).
Accurate assessment of PV-IN function across development is
confounded by the fact that most data on PV-IN function and
dysfunction in DS derive from recordings from acutely dissoci-
ated neurons or brain slices from Scn1a+/� mice before or at
onset of epilepsy (prior to postnatal day 21 [P21]); hence, a pro-
portion of Scn1a+/� mice included in prior studies conducted at
or before P21 would have been expected to die from status epi-
lepticus or a SUDEP-like phenomenon if not used for experi-
ments. It is possible—and perhaps likely—that mice remaining
alive represent a nonrandom subset of the initial population.
There is a spectrum of disease severity in Scn1a+/� mice (Haw-
kins et al., 2016, 2017), similar to that observed in humans (Har-
kin et al., 2007; Mei et al., 2019), the basis of which is unclear but
may involve genetic modifiers (Hawkins and Kearney, 2016;
Cell Reports 38, 110580, March 29, 2022 ª 2022 The Author(s). 1C-ND license (http://creativecommons.org/licenses/by-nc-nd/4.0/).
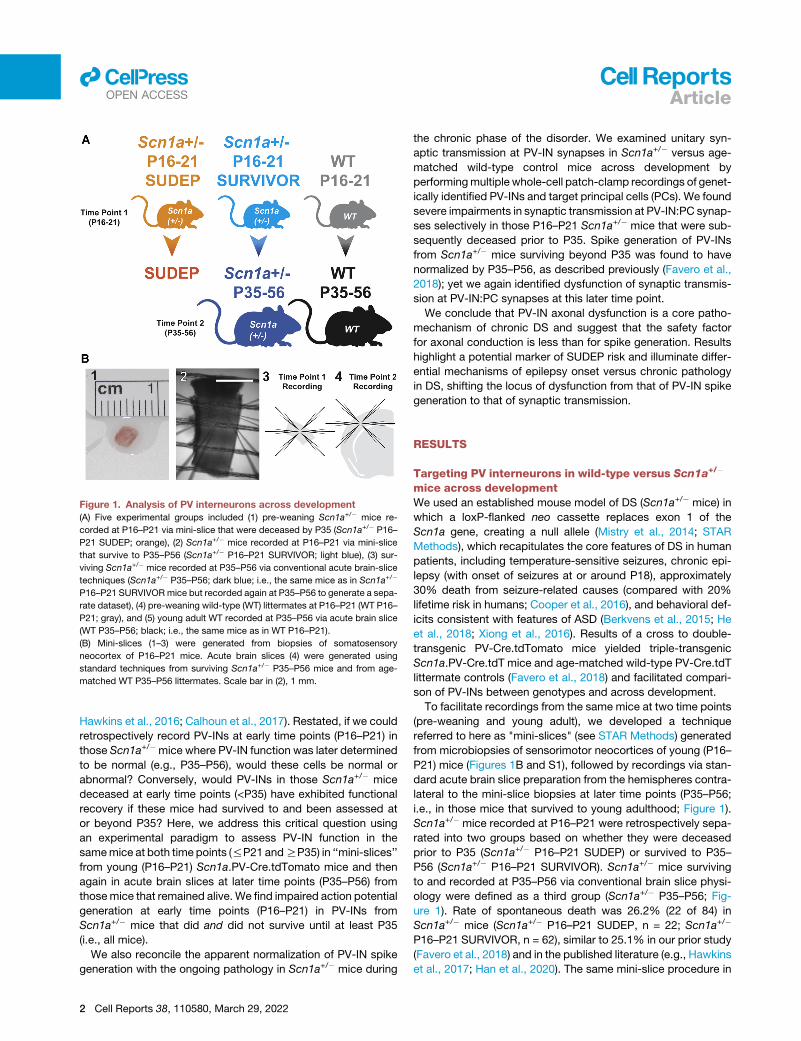
Figure 1. Analysis of PV interneurons across development
(A) Five experimental groups included (1) pre-weaning Scn1a+/� mice re-
corded at P16–P21 via mini-slice that were deceased by P35 (Scn1a+/� P16–
P21 SUDEP; orange), (2) Scn1a+/� mice recorded at P16–P21 via mini-slice
that survive to P35–P56 (Scn1a+/� P16–P21 SURVIVOR; light blue), (3) sur-
viving Scn1a+/� mice recorded at P35–P56 via conventional acute brain-slice
techniques (Scn1a+/� P35–P56; dark blue; i.e., the same mice as in Scn1a+/�
P16–P21 SURVIVORmice but recorded again at P35–P56 to generate a sepa-
rate dataset), (4) pre-weaning wild-type (WT) littermates at P16–P21 (WT P16–
P21; gray), and (5) young adult WT recorded at P35–P56 via acute brain slice
(WT P35–P56; black; i.e., the same mice as in WT P16–P21).
(B) Mini-slices (1–3) were generated from biopsies of somatosensory
neocortex of P16–P21 mice. Acute brain slices (4) were generated using
standard techniques from surviving Scn1a+/� P35–P56 mice and from age-
matched WT P35–P56 littermates. Scale bar in (2), 1 mm.
Articlell
OPEN ACCESS
Hawkins et al., 2016; Calhoun et al., 2017). Restated, if we could
retrospectively record PV-INs at early time points (P16–P21) in
those Scn1a+/� mice where PV-IN function was later determined
to be normal (e.g., P35–P56), would these cells be normal or
abnormal? Conversely, would PV-INs in those Scn1a+/� mice
deceased at early time points (<P35) have exhibited functional
recovery if these mice had survived to and been assessed at
or beyond P35? Here, we address this critical question using
an experimental paradigm to assess PV-IN function in the
samemice at both time points (%P21 andRP35) in ‘‘mini-slices’’
from young (P16–P21) Scn1a.PV-Cre.tdTomato mice and then
again in acute brain slices at later time points (P35–P56) from
thosemice that remained alive. We find impaired action potential
generation at early time points (P16–P21) in PV-INs from
Scn1a+/� mice that did and did not survive until at least P35
(i.e., all mice).
We also reconcile the apparent normalization of PV-IN spike
generation with the ongoing pathology in Scn1a+/� mice during
2 Cell Reports 38, 110580, March 29, 2022
the chronic phase of the disorder. We examined unitary syn-
aptic transmission at PV-IN synapses in Scn1a+/� versus age-
matched wild-type control mice across development by
performingmultiple whole-cell patch-clamp recordings of genet-
ically identified PV-INs and target principal cells (PCs). We found
severe impairments in synaptic transmission at PV-IN:PC synap-
ses selectively in those P16–P21 Scn1a+/� mice that were sub-
sequently deceased prior to P35. Spike generation of PV-INs
from Scn1a+/� mice surviving beyond P35 was found to have
normalized by P35–P56, as described previously (Favero et al.,
2018); yet we again identified dysfunction of synaptic transmis-
sion at PV-IN:PC synapses at this later time point.
We conclude that PV-IN axonal dysfunction is a core patho-
mechanism of chronic DS and suggest that the safety factor
for axonal conduction is less than for spike generation. Results
highlight a potential marker of SUDEP risk and illuminate differ-
ential mechanisms of epilepsy onset versus chronic pathology
in DS, shifting the locus of dysfunction from that of PV-IN spike
generation to that of synaptic transmission.
RESULTS
Targeting PV interneurons in wild-type versus Scn1a+/�
mice across developmentWe used an established mouse model of DS (Scn1a+/� mice) in
which a loxP-flanked neo cassette replaces exon 1 of the
Scn1a gene, creating a null allele (Mistry et al., 2014; STAR
Methods), which recapitulates the core features of DS in human
patients, including temperature-sensitive seizures, chronic epi-
lepsy (with onset of seizures at or around P18), approximately
30% death from seizure-related causes (compared with 20%
lifetime risk in humans; Cooper et al., 2016), and behavioral def-
icits consistent with features of ASD (Berkvens et al., 2015; He
et al., 2018; Xiong et al., 2016). Results of a cross to double-
transgenic PV-Cre.tdTomato mice yielded triple-transgenic
Scn1a.PV-Cre.tdT mice and age-matched wild-type PV-Cre.tdT
littermate controls (Favero et al., 2018) and facilitated compari-
son of PV-INs between genotypes and across development.
To facilitate recordings from the same mice at two time points
(pre-weaning and young adult), we developed a technique
referred to here as "mini-slices" (see STAR Methods) generated
from microbiopsies of sensorimotor neocortices of young (P16–
P21) mice (Figures 1B and S1), followed by recordings via stan-
dard acute brain slice preparation from the hemispheres contra-
lateral to the mini-slice biopsies at later time points (P35–P56;
i.e., in those mice that survived to young adulthood; Figure 1).
Scn1a+/� mice recorded at P16–P21 were retrospectively sepa-
rated into two groups based on whether they were deceased
prior to P35 (Scn1a+/� P16–P21 SUDEP) or survived to P35–
P56 (Scn1a+/� P16–P21 SURVIVOR). Scn1a+/� mice surviving
to and recorded at P35–P56 via conventional brain slice physi-
ology were defined as a third group (Scn1a+/� P35–P56; Fig-
ure 1). Rate of spontaneous death was 26.2% (22 of 84) in
Scn1a+/� mice (Scn1a+/� P16–P21 SUDEP, n = 22; Scn1a+/�
P16–P21 SURVIVOR, n = 62), similar to 25.1% in our prior study
(Favero et al., 2018) and in the published literature (e.g., Hawkins
et al., 2017; Han et al., 2020). The same mini-slice procedure in

Figure 2. Transient impairments in action
potential generation in PV interneurons in
all Scn1a+/� mice
(A) Representative current-clamp recordings from
PV-INs from all groups (1–5). Note that PV-INs from
all Scn1a+/� mice recorded at P16–P21, including
those that did or did not survive to P35–P56, ex-
hibited markedly abnormal excitability with action
potential failure (shown in detail in 1a–c and 2a–c),
while Scn1a+/� P35–P56 mice exhibit normal action
potential generation and repetitive firing similar to
WT P35–P56 mice.
(B) Input-output curves show steady-state firing
frequency forPV-INs fromeachgroup. Excitability of
P16–P21 Scn1a+/� mice that did (SURVIVOR) and
did not (SUDEP) survive to young adulthood was
decreased relative to age-matched WT P16–P21
and to PV-INs from surviving Scn1a+/� P35–P56
mice. See Table S1.
(C–E) Summary data for maximal steady-state firing
frequency (C), input resistance (D), and restingmem-
brane potential (E) in PV-INs from each group.
*p < 0.05; **p < 0.01; ***p < 0.001; ****p < 0.0001 via
mixed-effects modeling (see STAR Methods). n.s.,
not significant.
Articlell
OPEN ACCESS
wild-type mice (pre-weaning, wild type [WT] P16–P21; young
adult, WT P35–P56) was associated with 0% mortality (0 of 37).
Hence, we defined five experimental datasets and focused
on six key comparisons: Scn1a+/� P16–P21 SUDEP versus
Scn1a+/� P16–P21 SURVIVOR (to assess for any difference be-
tween Scn1a+/� mice recorded at P16–P21 that die prior to P35
versus those that survive to young adulthood), Scn1a+/� P16–
P21 SUDEP versus WT P16–P21 and Scn1a+/� P16–P21
SURVIVOR versus WT P16–P21 (to determine the difference be-
tween the two groups of pre-weaningScn1a+/�mice versus age-
matched WT littermate controls), Scn1a+/� P16–P21 SURVIVOR
versus Scn1a+/� P35–P56 (to assess the developmental trajec-
tory of PV-IN excitability in surviving Scn1a+/� mice), Scn1a+/�
P35–P56 versusWT P35–P56 (to compare surviving young-adult
Scn1a+/� mice with age-matched WT controls), and WT P16–
P21 versusWT P35–P56 (to assess the developmental trajectory
of PV-IN excitability in WT mice).
PV-INs from all Scn1a+/� mice showimpairments in action potentialgeneration at early time pointsWe then performed whole-cell patch-
clamp recordings from identified tdTo-
mato-positive PV-INs in layer 4 primary
somatosensory neocortex. Recordings
from Scn1a+/� P16–P21 SUDEP versus
Scn1a+/� P16–P21 SURVIVOR mice ad-
dressed a key unresolved question:
whether PV-INs recorded in surviving
Scn1a+/� P35–P56 mice were ever
abnormal (i.e., would such cells have been
abnormal if recorded at earlier time points).
We found that PV-INs recorded in mini-
slices fromScn1a+/�P16-21 SUDEPmice
(Figure 2A1) and PV-INs recorded in mini-slices from Scn1a+/�
P16–P21 SURVIVOR mice (Figure 2A2) all exhibited markedly
abnormal electrical excitability relative to PV-INs recorded in
mini-slices from age-matched littermate control WT P16–P21
mice (Figure 2A4) and to PV-INs from young-adult Scn1a+/�
P35–P56 mice (Figure 2A3), across a range of measures that
depend on Na+ channel function, including indicators of action
potential generation and repetitive firing (Figures 2B and 2C;
Table S1). PV-INs fromWTmice exhibited higher firing frequency
at the later time point (WT P35–P56 relative to WT P16–P21),
consistent with normal maturation of PV-IN excitability (Gold-
berg et al., 2011). Identical results were obtained after normal-
izing for minor differences in input resistance (Table S1; see
STAR Methods). We constructed a linear mixed-effects model
to account for variability between mice as well as the necessarily
imbalanced sizes of the experimental groups; the model was fit
to the data with mouse as a random factor.
Cell Reports 38, 110580, March 29, 2022 3

Articlell
OPEN ACCESS
In contrast, we found no differences in various passive mem-
brane properties (Figures 2E and S2; Table S1), although we did
find small genotype differences in input resistance (Figure 2D;
Table S1) and measures related to this (rheobase current injec-
tion; membrane time constant; Figure S2; Table S1).
Data obtained in WT P16–P21 mice via the mini-slice proced-
ure were qualitatively similar to prior recordings from PV-INs
from mouse neocortex obtained via standard acute brain slice
techniques (Goldberg et al., 2011). However, to determine
whether the mini-slice alters physiology of PV-INs, we directly
compared PV-INs in mini-slice versus acute brain slice from
P16–P21 Scn1a+/� mice and found no differences across a
broad range of measures (n = 11 cells from four mice each; Fig-
ure S4; Table S2). The mini-slice procedure had no effect on
body weight or on temperature threshold for seizure induction
measured at P35 for Scn1a+/� mice that did versus did not un-
dergo the mini-slice procedure (see Figure S4).
Hence, action potential generation is impaired at early time
points in all PV-INs fromScn1a+/�mice at%P21, including those
that do and do not survive to P35, while confirming our prior re-
sults (Favero et al., 2018) that action potential generation of PV-
INs from Scn1a+/� mice has normalized by P35–P56.
Group-specific impairments in PV-IN synaptictransmission in Scn1a+/� miceThe findings reported above represent somewhat of a paradox
and raise two critical questions relevant to pathomechanisms
of DS. Action potential generation and repetitive and high-fre-
quency firing of PV-INs was impaired in all Scn1a+/� mice at
P16–P21, yet some mice were deceased by P35 while others
survived to P35–P56. The basis for this profound difference is
unclear. Second, PV-INs from young-adult Scn1a+/� P35–P56
mice had recovered high-frequency discharge characteristic
of mature fast-spiking PV-INs (Jonas et al., 2004; Hu et al.,
2014; Favero et al., 2018). However, Scn1a+/� mice that survive
to P35 continue to exhibit chronic epilepsy, features of ASD,
and ongoing SUDEP. Hence, the chronic pathology in DS
cannot be attributed to abnormal PV-IN spike generation. We
hypothesized that persistent deficits might exist in synaptic
transmission—perhaps due to impaired spike propagation—
given the dependence of PV-IN axonal function on a high Na+
channel density at the axon initial segment (AIS) (Hu and Jonas,
2014).
To assay the fidelity of GABAergic transmission at PV-IN
synapses, we performed multiple whole-cell patch-clamp re-
cordings and measured the properties of evoked inhibitory
post-synaptic currents (IPSCs) (in voltage clamp) recorded in
PCs in response to action potentials in presynaptic PV-INs
(generated in current clamp; Figure 3A). PCs were patched using
an internal solution containing high chloride (Cl) such that ECl� =
�17 mV and inhibitory postsynaptic potentials (IPSPs) were re-
corded as depolarizations, while IPSCs were recorded as large
inward currents at a holding potential of �80 mV (STAR
Methods). This approach facilitated detection of small IPSCs
versus synaptic failures.
The PV-IN:PC synapse is known to be a reliable connection
with a low (near-zero) failure rate due to high release probability
from multiple boutons per connection (Galarreta and Hestrin,
4 Cell Reports 38, 110580, March 29, 2022
1998; Kraushaar and Jonas, 2000; Ali et al., 2001; Beierlein
et al., 2003; Goldberg et al., 2005; Hu et al., 2014). We stimulated
PV-INs with single action potentials and found a low rate of syn-
aptic failures in WT P16–P21 (0.00 ± 0.01; n = 23 connections
from 10 mice) and P35–P56 mice (0.00 ± 0.01; n = 13 connec-
tions from 10 mice). However, we detected failures in Scn1a+/�
mice, including Scn1a+/� P16–P21 SUDEP (0.03 ± 0.01; n = 21
connections from seven mice; p = 0.2412 versus WT P16–P21)
and Scn1a+/� P35–P56 (0.04 ± 0.02; n = 23 connections from
13 mice; p = 0.2344 versus WT P35–P56), with a lower but still
non-zero failure rate in Scn1a+/� P16–P21 SURVIVOR mice
(0.02 ± 0.01; n = 55 connections from 22mice; p = 0.7725 versus
Scn1a+/� P16–P21 SUDEP and 0.6161 versus WT P16–P21).
We then stimulated presynaptic PV-INs to discharge trains of
repetitive action potentials and identified a marked increase
in frequency- or activity-dependent synaptic failure specifically
in Scn1a+/� P16–P21 SUDEP and Scn1a+/� P35–P56 mice,
but not Scn1a+/� P16–P21 SURVIVOR (Figures 3B and 3C;
Table S1). For example, in approximately one-third of trials,
the final stimulus in a 10-pulse train at 40 Hz resulted in failure
at PV-IN:PC connections in Scn1a+/� P16–P21 SUDEP mice
(0.29 ± 0.07; n = 21 connections from seven mice), a rate that
was 3-fold higher than for Scn1a+/� P16–P21 no SUDEP mice
(0.09 ± 0.02; n = 55 connections from 22 mice; p = 0.0378
versus Scn1a+/� P16–P21 SUDEP via mixed-effects modeling
with post hoc correction for multiple comparisons via Holm-Si-
dak test) or for age-matched littermate control WT P16–P21
mice (0.09 ± 0.04; n = 23 connections from 10 mice; p =
0.0432 versus Scn1a+/� P16–P21 SUDEP). Failure rate was
also 3-fold higher in young-adult Scn1a+/� P35–P56 mice
(0.27 ± 0.04; n = 23 connections from 13 mice) than for age-
matched littermate control WT P35–P56 mice (0.11 ± 0.05;
n = 13 connections from 10 mice; p = 0.0378 versus Scn1a+/�
P35–P56; Figure 3C4). For the last event in a 30-pulse train at
120 Hz, failures occurred in approximately one-third of trials
at PV-IN:PC synapses from surviving Scn1a+/� P35–P56 mice
(Figure 3C6).
Failures may be due to impaired action potential propaga-
tion for the following reasons. First, the presence of a presyn-
aptic action potential was directly confirmed in the multiple
whole-cell recording configuration, ruling out failure of spike
generation (only apparent in PV-INs from Scn1a+/� mice dur-
ing trains of repetitive firing in response to prolonged, large-
amplitude current injections). Second, the PV-IN:PC con-
nection is characterized by large-amplitude IPSCs that
were further augmented by our experimental conditions,
and this—combined with <2 pA peak-to-peak noise of our
recording system—makes it unlikely that we were incorrectly
labeling small IPSCs as failures. We performed an analysis
of the contingency of the amplitude of the IPSC in response
to the second presynaptic action potential (IPSC2) based on
the success or failure of the first event (IPSC1) in a paired-
pulse paradigm (Figure S6A). Action potential invasion of the
presynaptic terminal leads to spike-evoked calcium influx
that engages short-term synaptic plasticity mechanisms (syn-
aptic depression in the case of the PV-IN synapse; Zucker and
Regehr, 2002; Xiang et al., 2002; Beierlein et al., 2003); hence,
presence or absence of synaptic depression of IPSC2 can be

Figure 3. Persistent impairments in AP propagation in PV interneurons
(A) Multiple whole-cell recording from tdTomato-positive PV-INs as well as principal cells. Shown is a representative image of two PV-INs (cells no. 2 and no. 5)
and four PCs (cells no. 1, no. 3, no. 4, and no. 6) in the mini-slice preparation under infrared differential interference contrast (IR-DIC) and corresponding epi-
fluorescence (1; showing tdTomato-positive PV-INs). Four synaptic connections were identified from cell no. 2 (in black), which produce depolarization in cells no.
1, no. 2, no. 3, and no. 4 (arrows; in gray; 2).
(B) Representative examples of evoked unitary inhibitory postsynaptic currents (uIPSCs) in an Scn1a+/� P16–P21 SUDEP mouse (1) and age-matched WT P16–
P21 littermate (2). Presynaptic PV-INs were recorded in current clamp, and IPSCs were recorded in PCs in voltage clamp as inward currents. Red arrowheads,
synaptic failures.
(C) Summary data for failure rate (range, 0 to 1), calculated as the number of failures divided by total stimuli (failures plus number of success). See Table S1. Note
that failures occurred at frequencies that PV-INs could clearly generate at the soma andweremore pronouncedwith successive stimulation (4 and 6) yet were still
present early in trains (3 and 5).
(D) Relationship between failure rate and presynaptic firing frequency across groups. *p < 0.05; **p < 0.01; ***p < 0.001; n.s., not significant; via mixed-effects
modeling. See Table S1.
Cell Reports 38, 110580, March 29, 2022 5
Articlell
OPEN ACCESS

Figure 4. Prolonged synaptic latency at PV interneuron connections
(A) Representative examples from each group illustrating synaptic latency,
measured from peak of the presynaptic AP (dotted line at left) to onset (arrows)
of the postsynaptic uIPSC (mean, black; individual traces, gray). The dotted
line at right corresponds to a latency of 0.65 ms, to approximate the mean
value for WT mice (at P16–P21 and P35–P56).
(B) Summary data. *p < 0.05 via mixed-effects modeling.
See Table S1.
Articlell
OPEN ACCESS
used as an indicator of whether calcium influx occurred and
hence whether a somatic action potential arrived successfully
at the presynapse. At neocortical PV-IN:PC connections in
Scn1a+/� mice, the amplitude of IPSC2 was smaller if IPSC1
was a success versus a failure (31.9 ± 7.0 pA for success
versus 48.8 ± 11.0 pA for failure; n = 20; p = 0.0023; Fig-
ure S6B1), consistent with synaptic depression (paired pulse
ratio [PPR] = 0.65). However, if the response to the first pre-
synaptic action potential resulted in failure, the amplitude of
6 Cell Reports 38, 110580, March 29, 2022
IPSC2 was the same as the mean amplitude of IPSC1 when
IPSC1 was a success (48.9 ± 11.0 pA for IPSC2 if IPSC1
was a failure versus 54.7 ± 10.8 pA for IPSC1 if IPSC1 was
a success; n = 20; p = 0.17; Figure S6B2). Such data suggest
that presynaptic calcium channels did not open in trials in
which a failure was observed, consistent with failure of prop-
agation of the somatic action potential to the synapse.
In addition, we found that synaptic latency (measured from
the peak of the action potential to onset of the unitary IPSC)
was prolonged in Scn1a+/� P16–P21 SUDEP mice relative to
age-matched littermate control and in young-adult Scn1a+/�
P35–P56 mice versus WT P35–P56 control (Figures 4A and
4B; Table S1), being 0.87 ± 0.08 ms in Scn1a+/� P16–P21
SUDEP (n = 21 connections from seven mice), 0.78 ± 0.05 in
Scn1a+/� P16–P21 SURVIVOR (n = 55 connections from 22
mice; p = 0.6923 versus Scn1a+/� P16–P21 SUDEP), 0.87 ±
0.08 ms in Scn1a+/� P35–P56 (n = 23 connections from 13
mice), 0.61 ± 0.04 in WT P16–P21 (n = 23 connections from
10 mice; p = 0.0229 versus Scn1a+/� P16–P21 SUDEP; p =
0.0366 versus Scn1a+/� P16–P21 SURVIVOR), and 0.62 ±
0.05 ms in WT P35–P56 (p = 0.0469 versus Scn1a+/� P35–
P56 via mixed-effects modeling with post hoc correction via
Holm-Sidak test). While we did find that the presynaptic action
potential (AP) half-width was slightly longer in Scn1a+/� P16–
P21 SUDEP and Scn1a+/� P16–P21 SURVIVOR than in WT
P16–P21 mice (Table S1), this difference was much smaller
than and hence cannot account for the observed difference in
synaptic latency and is more likely due to the prolonged rising
phase of the AP (with lower dV/dt) in Scn1a+/� P16–P21 mice
relative to WT.
Synaptic latency is determined by axon length, conduction ve-
locity, and synaptic delay (Sabatini and Regehr, 1999), as well as
release probability (Boudkkazi et al., 2007, 2011), and prolonged
latency could reflect slowed conduction velocity along PV-IN
axons. This interpretation is supported by prior work showing
increased synaptic latency at PV-IN:PC synapses in rat dentate
gyrus with low concentrations of tetrodotoxin (TTX) (Hu and
Jonas, 2014). We found that bath application of low concentra-
tions of TTX (10 nM; estimated to block approximately 50% of
Nav1.1-containing voltage-gated Na+ channels; Smith and
Goldin, 1998) had minimal effect on the PV-IN firing pattern in
WT P16–P21 mice (Figure 5A) but led to a 2-fold increase in fail-
ure rate in a frequency-dependent manner similar to what was
observed in age-matched pre-weaning Scn1a+/� P16–P21
SUDEP mice. Failure rate for the fifth pulse in the train was
0.08 ± 0.03 for control and 0.15 ± 0.05 after application of
10 nM TTX (n = 11 connections from four mice; p = 0.020 versus
control via two-tailed Student’s t test); failure rate for the last
pulse in a 120-Hz train was 0.12 ± 0.04 in control and 0.23 ±
0.07 after 10 nM TTX (p = 0.047 versus control; Figures 5B, 5D,
and 5E). Synaptic latency also increased from 0.49 ± 0.02 to
0.64 ± 0.06 ms after application of TTX (p = 0.016 versus control;
Figures 5C and 5F). Hence, loss of Nav1.1 in PV-INs may prefer-
entially affect synaptic transmission over spike generation.
Expression of Nav1.1 at PV interneuron axonsDirect whole-cell voltage-clamp recordings from PV-INs in den-
tate gyrus indicate the presence of Na+ conductance along the

Figure 5. Low concentrations of TTX repro-
duce the effect of heterozygous loss of
Nav1.1 on PV-IN synaptic transmission
(A) Electrophysiological discharge pattern of a PV-
IN from a P18 WT.PV-Cre.tdT mouse in response
to a 600-ms, 800-pA current injection before (top,
black) and after (middle; magenta) bath application
of 10 nM TTX, with washout (bottom; gray).
(B) Repetitive stimulation of presynaptic PV-INs
elicited IPSCs in postsynaptic principal cells (left)
with a higher failure rate after bath application of
10 nM TTX (right). Note that PV-INs can follow
120-Hz stimulation in the presence of TTX.
(C) Prolonged synaptic latency after TTX applica-
tion. Shown is a presynaptic action potential
aligned to peak (top), with the onset of the post-
synaptic IPSC response (bottom).
(D–F) Summary data show increased failure rate for
the fifth (D) and last (E) IPSC in a train at 120 Hz and
for synaptic latency (F). *p < 0.05.
Articlell
OPEN ACCESS
axon (Hu and Jonas, 2014; Hu et al., 2018). PV-IN axons in ce-
rebral cortex of rodent and human are extensively myelinated
along internodal regions and between axonal branch points (Mi-
cheva et al., 2016; Stedehouder et al., 2017; Benamer et al.,
2020). Using immunohistochemistry and confocal microscopy,
we confirmed that Nav1.1 is expressed at the AIS of PV-INs (Fig-
ure S7A), consistent with previous results (Ogiwara et al., 2007;
Li et al., 2014; Goff and Goldberg, 2019). We also found Nav1.1
expression along axons, at branch points (Figure S7A1), and at
presumptive pre-terminal axons (Figure S7A3). We used auto-
mated filtering, segmentation, and extraction from reconstructed
z stacks (Figures S7B–S7D) and found that Nav1.1 more prom-
inently labeled branching structures (mean, 3.60 ± 0.24 branches
per labeled structure; n = 6,718 puncta from n = 10 z stacks from
n = 3 mice from WT P35–P56 mice) relative to pan-Nav (1.74 ±
0.37 branches per labeled structure; n = 1,409 puncta from n =
7 z stacks; p < 0.0001 via mixed-effects model; Figure S7E; see
STAR Methods). Nav1.1-positive structures were shorter in
length (Nav1.1, 33.8 ± 0.92 mm; pan-Nav, 48.5 ± 4.4 mm; p =
0.0009) and less linear (ratio index for Nav1.1, 2.74 ± 0.03;
pan-Nav, 4.98 ± 0.17; p < 0.00001;
Figures S7F and S7G). We compared
Nav1.1 immunolabeling in young-adult
WT P35–P56 and Scn1a+/� P35–P56
mice and found a marked reduction in
overall normalized intensity of Nav1.1
immunoreactivity in Scn1a+/� P35–P56
relative to WT (WT, 96.3 ± 10.6; Scn1a+/�,72.7 ± 6.0; p = 0.025), with a reduction in
labeling of branching structures (WT, 3.60
± 0.24 branches/puncta; Scn1a+/�, 2.56 ±
0.10; p = 0.00009) and decreased length
of labeled puncta (WT, 33.8 ± 0.92 mm;
Scn1a+/�, 29.3 ± 0.3 mm; p < 0.00001)
but no change in linearity of puncta (WT,
2.74 ± 0.03; Scn1a+/�, 2.84 ± 0.06; p =
0.013; Figures S7I–S7L), supporting the
possibility of a preferential decrease in Nav1.1 at distal axons
and branching structures relative to the AIS.
Alterations in PV interneuron:principal cell connectionprobabilityWe next assessed for differences in connection rate between
PV-INs and PCs in Scn1a+/� versus WT mice, as evidence of
decreased connectivity—perhaps due to fewer connections be-
tween and/or fewer synaptic boutons per synapse at PV-IN:PC
connections—could potentially explain the decreased unitary
IPSC (uIPSC) amplitude observed in pre-weaning Scn1a+/�
mice. The connection rate of neocortical PV-INs to PCs obtained
via paired recordings in brain slice varies widely, ranging from
25% to 50% in the published literature (Packer and Yuste,
2011; Espinoza et al., 2018; Vickers et al., 2018), and depends
on slice preparation technique, distance between recorded cells,
and other considerations.
We found that PV-IN:PC connection rate was 21.9% (21 con-
nections out of a maximum possible of 96) in Scn1a+/� P16–P21
SUDEP mice yet was 32.6% (105/322) in Scn1a+/� P16–P21
Cell Reports 38, 110580, March 29, 2022 7

(legend on next page)
8 Cell Reports 38, 110580, March 29, 2022
Articlell
OPEN ACCESS

Articlell
OPEN ACCESS
SURVIVOR, similar to the connection rate of 35.0% (77/220)
observed in age-matched littermate WT P16–P21 mice (p =
0.023 versus Scn1a+/� P16–P21 SUDEP via chi square test).
Connection rate was 18.8% (46/245) in surviving young-adult
Scn1a+/� P35–P56 mice and 33.8% (52/154) in age-matched
WT P35–P56 (p < 0.0011 versus Scn1a+/� P35–P56 via chi
square test; Figure S8B). Hence, we found lower connection
probability selectively in Scn1a+/� P16–P21 SUDEP and in sur-
viving young-adult Scn1a+/� P35–P56 mice.
We performed immunohistochemical labeling (see STAR
Methods) for synaptotagmin-2 (Syt2), a specific marker of PV-
IN synapses (Sommeijer and Levelt, 2012; Bouhours et al.,
2017; van Lier et al., 2020), and confirmed that Syt2-positive
boutons were perisomatic and PV positive (Figure S8A). We
then quantified the number of PV-IN boutons surrounding the
cell bodies of PCs in all experimental groups (Figure S8B)
and found a small but statistically significant decrease in the
number of Syt2-positive puncta around PCs in Scn1a+/� P16–
P21 SUDEP relative to Scn1a+/� P16–P21 SURVIVOR and
WT P16–P21 and in Scn1a+/� P35–P56 relative to WT P35–
P56 (Figure S8C). The number of puncta around PCs was
10.4 ± 0.3 in Scn1a+/� P16–P21 SUDEP mice (n = 142 cells
from six slices from two mice), 12.9 ± 0.3 in Scn1a+/� P16–
P21 SURVIVOR (n = 147 cells from eight slices from six mice;
ANOVA (4, 706) = 1.615; p < 0.0001 versus Scn1a+/� P16–
P21 SUDEP with post hoc correction for multiple comparisons
via Holm-Sidak test), 12.7 ± 0.3 in Scn1a+/� P35–P56 (n = 163
cells from eight slices from four mice; p = 0.65 versus Scn1a+/�
P16–P21 SURVIVOR), 13.3 ± 0.3 in WT P16–P21 (n = 122 cells
from six slices from three mice; p < 0.0001 versus Scn1a+/�
P16–P21 SUDEP; p = 0.65 versus Scn1a+/� P16–P21
SURVIVOR), and 14.2 ± 0.4 in WT P35–P56 (n = 134 cells
from seven slices from three mice; p = 0.001 versus Scn1a+/�
P35–P56; p = 0.12 versus WT P16–P21). Such findings are
consistent with a decreased number of synaptic terminals at
PV-IN:PC synapses in Scn1a+/� P16–P21 SUDEP and in
Scn1a+/� P35–P56 mice and compatible with the observed dif-
ferences in connection probability. This may contribute to the
Figure 6. Amulti-compartment model supports the selective effect of N
interneuron synapse
(A) A morphologically realistic PV-IN with a single myelinated axon, nodes of Ran
(B) Shown are membrane potential traces recorded at the AIS (solid light green lin
soma at t = 20 ms. The enlarged trace shows the action potential generated at t
Nav1.1 deletion is indicated by a black arrow, the combination of which is a ‘‘del
green; propagation, dark orange).
(C) Average firing rate of a neuron with progressive Nav1.1 deletion. Differences
(dashed light orange line) represent propagation failures (shaded blue area), whi
(D) Failure of stimulation corresponds to a pulse being delivered (at 120 Hz) but
Failure of propagation refers to an action potential generated at the AIS that d
conditions when a pulsewas delivered, but an action potential was not generated a
paradigm first appears at 30% Nav1.1 deletion but returns to zero at 70% Nav1
(E) The model generates potential explanations for the experimental observations
with failures represented as in (B). Bar plots show the firing rate of the AIS (soli
represents WT P16–P21 in the experimental setup (gray), while 50% Nav1.1 (in
Scn1a+/� P16–P21 SURVIVOR. The model can simulate different ways to recove
ation has recovered but action potential propagation is still impaired. The first is a
tance in soma and AISwas 120%of baseline (20%Nav1.1 addition) and nodal Nav
P35–P56 group was also modeled by upregulation of another transient sodium c
See STAR Methods and Figure S9 for details.
observed differences in uIPSC amplitude at PV-IN:PC synap-
ses in Scn1a+/� mice but likely cannot account for the observed
increases in synaptic failure rates.
A multi-compartment interneuron model supports apreferential impact of reduction in Na+ conductance onaction potential propagationBecause we could not directly attribute synaptic transmission
failure to failure of AP propagation, we constructed a multi-
compartment model of a PV-IN to assess the differential effects
of reduction of Na+ current density at the soma and AIS versus
axon on features of AP initiation and propagation (see STAR
Methods).
Selectively reducing Nav1.1 by 50% (to model heterozygous
loss of Nav1.1) in specific neuronal compartments (‘‘deletion
paradigm’’) caused AP failure (Figure 6). Failure could be of initi-
ation or of propagation (Figure 6D). When Nav1.1 was partially
deleted in the soma, AIS, and nodes (‘‘�soma �AIS �nodes’’
in Figures 6B–6D, modeling Scn1a+/� P16–P21 SUDEP mice),
spike generation fails at the soma and AIS, as seen experimen-
tally (Figure 2A1). This was also true for the ‘‘�soma�AIS’’ dele-
tion paradigm. However, when Nav1.1 was impaired specifically
at the nodes (‘‘�nodes’’ deletion paradigm, modeling Scn1a+/�
P35–P56), APs continued to be generated at the AIS but did
not propagate to the terminal.
The firing rate for both AIS and presynaptic terminal recording
sites dramatically decreased with further Nav1.1 deletion in both
the�soma�AIS�nodes and�soma�AIS paradigms. Progres-
sive deletion at the nodes had no effect on the firing rate at the
AIS.
We then stimulated the model with brief repetitive current in-
jections (Figure 6D). Failures could be that of stimulation (a pulse
was delivered but an AP was not recorded at the presynaptic
terminal), initiation (an AP was not recorded at the AIS), or prop-
agation (an AP was recorded at the AIS, but not at the terminal).
Progressive loss of Nav1.1 in the �soma �AIS �nodes deletion
paradigm yielded substantial propagation failures first apparent
at 40% Nav1.1 deletion and initiation failures at 30% Nav1.1
a+ reduction at the axon on the fidelity of synaptic transmission at an
vier (‘‘nodes’’), and pre-synaptic terminal.
e) and terminal (dashed light orange line), following injection of 0.75 nA into the
he AIS and propagated along the axon to the terminal. The compartment(s) of
etion paradigm.’’ Colored arrows represent the time of a failure (initiation, dark
in firing rate between the AIS (solid light green line) and pre-synaptic terminal
ch increase with further deletion.
without an action potential detected at the pre-synaptic terminal within 2 ms.
id not reach the terminal. Failure of initiation was considered to occur under
t the AIS. For example, propagation failure in the�soma�AIS�nodes deletion
.1 deletion because there is no longer any spike initiation.
. Traces were from the AIS (solid lines) and pre-synaptic terminal (dashed lines)
d) and pre-synaptic terminal (hatched pattern). Baseline Nav1.1 in the model
the soma, AIS, and nodes) represents Scn1a+/� P16–P21 SUDEP (orange) or
r the properties of the Scn1a+/� P35–P56 group, where action potential gener-
redistribution of Nav1.1 from nodes to soma and AIS such that Nav1.1 conduc-
1.1 conductance was 40%of its baseline (60%Nav1.1 deletion). The Scn1a+/�
urrent by 120% in the soma and 130% in the AIS.
Cell Reports 38, 110580, March 29, 2022 9

Figure 7. A dual optogenetics strategy dem-
onstrates impaired PV interneuron spike
propagation in Scn1a+/� mice
(A) Experimental timeline showing viral
injection of both AAV9.DIO.ChrimsonR.mRuby2
and AAV.DIO.hChR2.eYFP into PV-Cre mice at
P0 (left) and time points 1 (mini-slice; center) and
2 (acute brain slice; right) recordings.
(B) Representative confocal images showing
expression of PV (Alexa Fluor 405; blue),
hChR2.eYFP (green), and ChrimsonR.mRuby2
(red). Scale bar, 20 mm.
(CandD)Representativedata for evokedoIPSCs re-
corded in principal cells in response to repetitive
photostimulation with ChR2 (C1 and D1) or Chrim-
sonR (C2 and D2) in Scn1a+/� P35–P56 mice
(C) and WT P35–P56 mice (D).
(E) Summary data for the index of oIPSCn/oIPSC1 in
response to blue-light photostimulation minus
oIPSCn/oIPSC1 in response to red-light photosti-
mulation (blue-red index). *p<0.05viamixed-effects
modeling.
See Table S3.
Articlell
OPEN ACCESS
deletion. Similarly, the�soma�AIS deletion paradigm exhibited
propagation failures from 50%Nav1.1 deletion and initiation fail-
ures from 70% Nav1.1 deletion. As expected, the �nodes dele-
tion paradigm showed only propagation failures, which were
apparent from 80% Nav1.1 deletion.
The model was also used to explore possible mechanisms for
the functional recovery seen in Scn1a+/� P35–P56 mice (Fig-
ure 6E). One option explored was the possibility that Nav1.1 pro-
tein could be redistributed from the axon to the AIS, leading to
recovery of normal spike generation but worsening of spike
propagation. The second option involved upregulation of Na+
conductance, modeling a condition of compensatory upregula-
tion of, for example, Nav1.3 and/or Nav1.6 subunits, as has
been proposed (Favero et al., 2018; Figure S9).
The results of the model provide proof of principle that Nav1.1
deletion in specific compartments leads to differential effects on
AP initiation and propagation and supports the mechanism of
transition from Scn1a+/� P16–P21 to P35–P56 as potentially
10 Cell Reports 38, 110580, March 29, 2022
occurring via redistribution of Nav1.1 or
the upregulation of other Nav1.X Na+
channel subunits.
A dual optogenetic approachsupports existence of frequency-dependent spike propagationfailure in Scn1a+/� miceTo further confirm the above inferences,
we used a dual optogenetic approach in
which an excitatory opsin was expressed
at the PV-IN soma while a second
spectrally distinct opsin was expres-
sed preferentially at synaptic terminals
(Figures 7A and S10), facilitating selective
generation of somatic versus axo-sy-
naptic spikes. We used Cre-dependent
AAVs to express the excitatory opsin
hChR2 (AAV9.Ef1a.DIO.hChR2(E123A).EYFP), which is prefer-
entially targeted to the axon and synapse (Baker et al., 2016;
Grubb and Burrone, 2010; Mattis et al., 2012), as well as a
soma-targeted, red-shifted opsin (AAV9.hSyn.DIO.Chrim-
sonR.mRuby2.ST; Pegard et al., 2017), in Scn1a.PV-Cre mice
and WT PV-Cre littermate controls. We then performed whole-
cell voltage-clamp recording of IPSCs in PCs in response to
blue (490 nm; ChR2) and red-light (660 nm; ChrimsonR) photosti-
mulation (optogenetically evoked IPSCs [oIPSCs]; Figures 7C
and 7D). We confirmed that ChrimsonR was selectively ex-
pressed at the soma of PV-INs, and hChR2 was expressed pref-
erentially along the axon and at synaptic terminals (Figure 7B).
oIPSCs were recorded as large outward currents at a holding
potential of +10 mV (ECl = �110 mV; see STAR Methods).
Recording of PCs combined with photostimulation of surround-
ing PV-INs revealed a progressive decrease in the amplitude of
successive oIPSCs with repeated red-light (somatic) stimulation
that was far greater than the decrease observed in response to

Articlell
OPEN ACCESS
blue-light (axon and terminal) stimulation (Figures 7C–7E). We
quantified the ratio of oIPSC2/oIPSC1 and oIPSC5/oIPSC1 at
20, 40, and 120 Hz for blue-light (hChR2) and red-light (Chrim-
sonR) stimulation (Figures 7C, 7D, and S10; Table S3). To
compare responses between groups, we calculated a blue:red
index, defined as the arithmetic difference between the blue
oIPSC2/oIPSC1 or oIPSC5/oIPSC1 ratio and the red oIPSC2/
oIPSC1 or oIPSC5/oIPSC1 ratio. A value of zero reflects no dif-
ference in the dynamics of the response to red and blue light
and suggests and the somatically generated response is equally
efficacious to the axo-synaptic response during repetitive stim-
ulation; this index yields a positive value if there is a greater
decrease in oIPSC amplitude with successive stimulation in
response to red (somatic) relative to blue light and reflects
enhanced efficacy of the axo-synaptic response during repeti-
tive stimulation (Figure 7E; Table S3).
There was no significant difference between genotypes or
ages in the axon- and synaptic-terminal-evoked oIPSC2/oIPSC1
and oIPSC5/oIPSC1 ratio. However, we found marked differ-
ences in soma-evoked oIPSC5/oIPSC1 and oIPSC2/oIPSC1 ra-
tio between groups (Figure S10; Table S3). This yielded a
blue:red index value near zero for Scn1a+/� P16–P21
SURVIVOR as well as WT P16–P21 and P35–P56, indicating
no difference in the frequency-dependent dynamics of the
oIPSC between somatic and axo-synaptic photostimulation in
these groups. However, we found that recordings in Scn1a+/�
P16–P21 SUDEP and Scn1a+/� P35–P56 mice exhibited signifi-
cantly larger values for this blue:red index (Figure 7E; Table S3),
indicating a relative reduction in the somatically evoked oIPSC
response. For example, the oIPSC5/oIPSC1 index at 120 Hz
was 0.11 ± 0.03 for Scn1a+/� P16–P21 SUDEP (n = 18 PCs
from eight mice), �0.01 ± 0.04 for Scn1a+/� P16–P21
SURVIVOR (n = 30 PCs from 10 mice; p = 0.0424 versus
Scn1a+/� P16–P21 SUDEP via mixed-effects model), 0.10 ±
0.04 for Scn1a+/� P35–P56 (n = 26 PCs from six mice; p =
0.1563 versus Scn1a+/� P16–P21 SURVIVOR), �0.01 ± 0.03
for WT P16–P21 (n = 26 PCs from eight mice; p = 0.0424 versus
Scn1a+/� P16–P21 SUDEP; p = 0.9042 versus Scn1a+/� P16–
P21 SURVIVOR), and �0.02 ± 0.02 for WT P35–P56 (n = 28
PCs from eight mice; p = 0.0431 versus Scn1a+/� P35–P56
and 0.8723 versus WT P16–P21). We confirmed that PV-INs at
all age groups could reliably follow brief (1-ms) pulses of red-light
photostimulation at 120 Hz (Figure S10).
This result is consistent with a frequency- and activity-depen-
dent failure of synaptic transmission with somatic stimulation
that can be ‘‘bypassed’’ via direct axo-synaptic stimulation.
Such findings support the results of the multiple whole-cell elec-
trophysiology experiments and modeling, indicating that failures
of synaptic transmission reflect frequency-dependent failure of
the somatic AP to efficiently drive neurotransmitter release at
PV-IN synapses in Scn1a+/� mice.
DISCUSSION
Advances in genetic testing in the neurodevelopmental disor-
ders have led to the identification of hundreds of gene asso-
ciations (Parenti et al., 2020). Understanding how such genetic
variation leads to disease has proven challenging (Sahin and
Sur, 2015; del Pino et al., 2018). This remains the case for DS,
despite being the most common of the epileptic encephalopa-
thies, affecting 1 in 15,000 individuals in the United States (Wu
et al., 2015).
Our prior work demonstrated that abnormalities in PV-IN spike
generation in Scn1a+/� mice were in fact transient and restricted
to early developmental time points (Yu et al., 2006; Ogiwara
et al., 2007; Tai et al., 2014; Tsai et al., 2015; De Stasi et al.,
2016); PV-INs in young-adult Scn1a+/� P35–P56 mice had
recovered the ability to discharge sustained trains of APs at
high frequency (Favero et al., 2018). The AIS—defined by
ankyrin-G immunoreactivity—was longer in PV-INs from
Scn1a+/�mice as compared withWT controls (perhaps suggest-
ing a prior history of decreased excitability; Grubb et al., 2011;
Bender and Trussell, 2012; Wefelmeyer et al., 2016; Yamada
and Kuba, 2016). In addition, we had found a clear ‘‘hump’’ in
the phase plot in PV-INs from Scn1a+/� P35–P56 mice that
was not seen inWTP16–P21 or P35–P56mice (Figure S3A), sug-
gesting spatiotemporal separation of the AIS and somatic
spikes, hypothesized to be due to an extension of or distal shift
in the location and/or extent of the AIS, perhaps secondary to
upregulation of non-Nav1.1 Na+ channel subunits and/or to
slowing of spike propagation.
However, Scn1a+/� mice in the chronic phase of the disorder
continue to exhibit seizures (albeit at decreased frequency),
ASD-related phenotypes, and SUDEP-like phenomena—as is
the case with human patients and which cannot be explained
by impaired AP generation by PV-INs. Hence, the primary goal
of the present study was to investigate PV-IN synaptic transmis-
sion as an indirect measure of spike propagation. We hypothe-
sized that PV-INs are able to reconstitute high-frequency firing
at the soma via still unidentified mechanisms yet cannot recover
axonal excitability resulting from loss of Nav1.1. We confirmed
that PV-INs in young-adult Scn1a+/� P35–P56 mice indeed
recover fast spiking yet exhibit impaired synaptic transmission,
as evidenced by markedly increased failure rates (Figure 3) and
prolonged synaptic delay (Figure 4). This establishes PV-IN
axonal dysfunction is an important locus of pathology in the
chronic phase of DS. Such a conclusion makes logical sense,
as prior work showed that low concentrations of TTX estimated
to block �50% of Na+ channels produce only mild effects on AP
generation in PV-INs, consistent with the presence of a ‘‘super-
critical’’ density of Na+ channels at the AIS (Hu and Jonas, 2014).
However, high Na+ channel density is required for spike reliability
and propagation speed.While PV-INs inScn1a+/�P16–P21mice
do exhibit impairments in AP generation, these cells are still able
to discharge sustained trains of APs at >200 Hz (Figures 2B and
2C), just as PV-INs in WT mice retain fast-spiking capabilities in
the presence of low concentrations of TTX (Figure 5).
The mini-slice technique to evaluateelectrophysiological properties across developmentOur prior work (Favero et al., 2018; Tran et al., 2020; Mattis et
al., 2022) and much of the work in the field is limited by the
obvious fact that we could only record from young-adult
Scn1a+/� mice that had actually survived. Hence, it could be
the case that PV-INs found to exhibit normal high-frequency
firing at RP35 had always been normal, with PV-IN dysfunction
Cell Reports 38, 110580, March 29, 2022 11

Articlell
OPEN ACCESS
being present only in those mice deceased prior to P35. Hence,
a secondary aim of the study was to resolve this issue, which
required development of a method to perform targeted record-
ings from PV-INs from the same animal at two different time
points and within-animal comparison. This approach confirmed
that PV-IN dysfunction is preset at early time points, even in
those animals that survive to young adulthood and allowed
us to show that recovery of PV-IN AP generation occurs in
the same animals in which PV-IN excitability was directly
shown to be dysfunctional at earlier time points. Furthermore,
identification of combined abnormalities in spike generation
and synaptic transmission in Scn1a+/� mice that exhibit early
mortality may represent a marker predictive of SUDEP. This
mini-slice technique could prove widely applicable to the study
of risk factors for mortality in various preclinical models of se-
vere neurological disease.
We validated the mini-slice approach extensively: in a dedi-
cated cohort of age-matched littermates, we demonstrated
that recordings from PV-INs obtained via mini-slice did not
differ from those obtained via standard acute brain slice prep-
aration (Figure S4; Table S2). Furthermore, mini-slice per-
formed at P16–P21 had no effect on growth or mortality and
did not alter temperature threshold for seizure induction at
P35 (Figure S4). This confirms recordings obtained in mini-slice
are similar to what would have been obtained via standard
acute brain slice and that no obvious long-term impairments
were caused by the procedure. It should be noted that inflam-
mation with microglial activation likely occurs at the biopsy site
with surrounding neuronal cell death; hence, all experiments in
acute slice performed at the second time point were performed
in the contralateral hemisphere. This approach allowed us to
record from PV-INs in the same layer and brain area at both
time points.
Combined early impairments in spike generation andspike propagation as a risk factor for early mortalityPV-INs from all Scn1a+/� mice showed impairments in spike
generation at early time points, regardless of survival to or death
prior to P35, while PV-INs had recovered high-frequency firing in
Scn1a+/� mice surviving to adulthood. However, the fidelity of
synaptic transmission at PV-IN:PC synapses was decreased
selectively at P16–P21 in those Scn1a+/�mice that subsequently
died of SUDEP relative tomice that survived (Figures 3C and 3D).
This was confirmed by a dual optogenetics approach that al-
lowed us to separate somatic and axo-synaptic stimulation of
PV-INs (Figures 7 and S10) and revealed a relative impairment
of somatically generated, but not axo-synaptic oIPSCs (Fig-
ure 7E), suggesting that direct stimulation of PV-IN terminals
can bypass PV-IN axonal dysfunction. And while PV-INs from
Scn1a+/� P35–P56 mice did not show impairments in spike gen-
eration (Figures 2, S2C, S2F, and S3, consistent with the results
of our previous study; Favero et al., 2018), we found frequency-
dependent impairment in synaptic transmission at PV-IN:PC
synapses at this young-adult time point, similar to that observed
in Scn1a+/� P16–P21 SUDEP mice (Figures 3, 4, and 6). These
results suggest that (1) combined early impairments in spike
generation and synaptic transmission may be a risk factor for
early mortality in Scn1a+/� mice, (2) severe impairments in syn-
12 Cell Reports 38, 110580, March 29, 2022
aptic transmission are involved in the pathophysiology of
continued symptoms of DS in the chronic phase, and (3) targeted
modulation of axonal or presynaptic function may represent a
therapeutic approach to this disorder.
Implications for development of novel therapies forDravet syndromeWe provide evidence that PV-INs in Scn1a+/� mice exhibit
impaired synaptic transmission, that early impairments in PV-
IN synaptic transmission may predict SUDEP risk, and that
such deficits persist across development and may contribute
to the defining pathology of DS in the chronic phase of the disor-
der. This has important implications for efforts to increase
expression of SCN1A as a therapeutic strategy (Colasante
et al., 2019; Han et al., 2020; Yamagata et al., 2020). Upregula-
tion of SCN1A may be ineffective if administered after disease
onset if chronic dysfunction is driven by a mechanism other
than haploinsufficiency of Nav1.1. Of note, AAV-mediated upre-
gulation of the voltage-gated Na+ channel b1 accessory sub-
unit—which regulates a subunit expression, plasma membrane
localization, and subcellular targeting, among other functions
(O’Malley and Isom, 2015)—led to decreased seizure frequency,
improved performance on cognitive tests, and reduced mortality
in Scn1a+/� mice (Niibori et al., 2020). Our findings suggest that
increasing fidelity of PV-IN synaptic transmission, perhaps via
upregulation of Nav1.1 specifically in the axo-synaptic compart-
ment, such as at nodes and/or axonal branch points (Micheva
et al., 2016; Stedehouder et al., 2017; Benamer et al., 2020) or
by otherwise bypassing axonal dysfunction, may be important
for the treatment of DS.
Limitations of the studyA limitation of the present study is the lack of detailed anatomical
reconstruction of individual PV-INs. However, our conclusions
are supported by the results of the computational modeling
and the dual optogenetics experiment. Yet some questions
remain unanswered, such as the mechanistic basis of the
observed differences in synaptic transmission between the
Scn1a+/� P16–P21 SUDEP and SURVIVOR conditions.
We consider it unlikely that the main findings could be due
exclusively to changes in presynaptic calcium channels at PV-
IN synapses in Scn1a+/� mice, such as in functional properties,
density, and/or subtype identity. Were this the case, one would
expect a change in short-term synaptic plasticity (summarized
in Table S1). It is not clear how such an alternative explanation
could account for the stochastic yet frequency-dependent na-
ture of the observed failures of synaptic transmission.
There is unlikely to be a singular cellular or circuit mechanism
of DS or of any complex neurodevelopmental disorder. It is
known that excitability of somatostatin (SST) and vasoactive in-
testinal peptide (VIP)-INs are also impaired in DS (Tai et al., 2014;
Rubinstein et al., 2015; Almog et al., 2021) and that VIP-IN
dysfunction persists in young-adult Scn1a+/� mice (Goff and
Goldberg, 2019). The present work focused on neocortical PV-
INs, yet it is clear that the hippocampus, and, in particular, the
dentate gyrus, is a prominent locus of pathology in DS models
(Liautard et al., 2013; Dutton et al., 2017; Stein et al., 2019;Mattis

Articlell
OPEN ACCESS
et al., 2022) and in human patients (Van Poppel et al., 2012; Gaily
et al., 2013).
STAR+METHODS
Detailed methods are provided in the online version of this paper
and include the following:
d KEY RESOURCES TABLE
d RESOURCE AVAILABILITY
B Lead contact
B Materials availability
B Data and code availability
d EXPERIMENTAL MODEL AND SUBJECT DETAILS
d METHOD DETAILS
B Viral injections
B Acute slice preparation
B Mini-slice preparation
B Recordings of electrophysiological membrane/firing
properties and unitary IPSCs
B Recordings of optogenetic evoked IPSCs
B Immunohistochemistry
B Electrophysiology data analysis
B NEURON model
d QUANTIFICATION AND STATISTICAL ANALYSIS
SUPPLEMENTAL INFORMATION
Supplemental information can be found online at https://doi.org/10.1016/j.
celrep.2022.110580.
ACKNOWLEDGMENTS
We would like to thank Bernardo Rudy, Joanna Mattis, and Laura Mcgarry for
comments on a previous version of the manuscript; Xiaohong Zhang for expert
technical support and mouse colony maintenance; Melody Cheng for assis-
tance with generation of the graphical abstract; and Jennifer Kearney for the
gift of Scn1a+/� mice. This work was supported by the National Institute of
Neurological Disorders and Stroke of the National Institutes of Health under
F31NS111803 (to K.M.G.) and K08NS097633 and R01NS110869 (to E.M.G.),
the Dravet Syndrome Foundation (to A.S.), an ERC Consolidator Grant
(SYNAPSEEK) (to T.P.V.), and the NOMIS Foundation through the NOMIS Fel-
lowships program at IST Austria (to C.C.). The graphical abstract was prepared
using BioRender software (BioRender.com).
AUTHOR CONTRIBUTIONS
Conceptualization andmethodology, K.K., C.B.C., K.M.G., T.P.V., and E.M.G.;
formal analysis, K.K., C.B.C., K.M.G., A.S., T.P.V., and E.M.G.; investigation,
K.K., C.B.C., E.R.W., K.M.G., and E.M.G.; software, C.B.C., A.S., and
K.M.G.; validation, E.R.W. and E.M.G.; writing – original draft, K.K. and
E.M.G.; writing – review and editing, K.K., C.B.C., K.M.G., A.S., T.P.V., and
E.M.G.; project administration, E.M.G.; funding acquisition, E.M.G.
DECLARATION OF INTERESTS
The authors declare no competing interests.
INCLUSION AND DIVERSITY
We worked to ensure sex balance in the selection of non-human subjects.
While citing references scientifically relevant for this work, we also actively
worked to promote gender balance in our reference list.
Received: July 21, 2021
Revised: January 9, 2022
Accepted: March 6, 2022
Published: March 29, 2022
REFERENCES
Agmon, A., and Connors, B.W. (1991). Thalamocortical responses of mouse
somatosensory (barrel) cortex in vitro. Neuroscience 41, 365–379.
Ali, A.B., Rossier, J., Staiger, J.F., and Audinat, E. (2001). Kainate receptors
regulate unitary IPSCs elicited in pyramidal cells by fast-spiking interneurons
in the neocortex. J. Neurosci. 21, 2992–2999.
Almog, Y., Fadila, S., Brusel, M., Mavashov, A., Anderson, K., and Rubinstein,
M. (2021). Developmental alterations in firing properties of hippocampal CA1
inhibitory and excitatory neurons in a mouse model of Dravet syndrome. Neu-
robiol. Dis. 148, 105209.
Baker, C.A., Elyada, Y.M., Parra, A., and Bolton, M.M.L. (2016). Cellular reso-
lution circuit mapping with temporal-focused excitation of soma-targeted
channelrhodopsin. Elife 5, 1–15.
Beierlein, M., Gibson, J.R., and Connors, B.W. (2003). Two dynamically
distinct inhibitory networks in layer 4 of the neocortex. J. Neurophysiol. 90,
2987–3000.
Benamer, N., Vidal, M., Balia, M., and Angulo, M.C. (2020). Myelination of par-
valbumin interneurons shapes the function of cortical sensory inhibitory cir-
cuits. Nat. Commun. 11, 1–14.
Bender, K.J., and Trussell, L.O. (2012). The physiology of the axon initial
segment. Annu. Rev. Neurosci. 35, 249–265.
Berecki, G., Bryson, A., Terhag, J., Maljevic, S., Gazina, E.V., Hill, S.L., and
Petrou, S. (2019). SCN1A gain of function in early infantile encephalopathy.
Ann. Neurol. 85, 514–525.
Berkvens, J.J.L., Veugen, I., Veendrick-Meekes, M.J.B.M., Snoeijen-Schou-
wenaars, F.M., Schelhaas, H.J., Willemsen, M.H., Tan, I.Y., and Aldenkamp,
A.P. (2015). Autism and behavior in adult patients with Dravet syndrome
(DS). Epilepsy Behav. 47, 11–16.
Boudkkazi, S., Carlier, E., Ankri, N., Caillard, O., Giraud, P., Fronzaroli-Moli-
nieres, L., and Debanne, D. (2007). Release-dependent variations in synaptic
latency: a putative code for short- and long-term synaptic dynamics. Neuron
56, 1048–1060.
Boudkkazi, S., Fronzaroli-Molinieres, L., and Debanne, D. (2011). Presynaptic
action potential waveform determines cortical synaptic latency. J. Physiol.
589, 1117–1131.
Bouhours, B., Gjoni, E., Kochubey, O., and Schneggenburger, R. (2017). Syn-
aptotagmin2 (syt2) drives fast release redundantly with syt1 at the output syn-
apses of parvalbumin-expressing inhibitory neurons. J. Neurosci. 37, 4604–
4617.
Calhoun, J.D., Hawkins, N.A., Zachwieja, N.J., and Kearney, J.A. (2017). Cac-
na1g is a genetic modifier of epilepsy in a mouse model of Dravet syndrome.
Epilepsia 58, e111–e115.
Ceulemans, B., Schoonjans, A.S., Marchau, F., Paelinck, B.P., and Lagae, L.
(2016). Five-year extended follow-up status of 10 patients with Dravet syn-
drome treated with fenfluramine. Epilepsia 57, e129–e134.
Colasante, G., Lignani, G., Brusco, S., Di Berardino, C., Carpenter, J., Gian-
nelli, S., Valassina, N., Bido, S., Ricci, R., Castoldi, V., et al. (2019). dCas9-
based Scn1a gene activation restores inhibitory interneuron excitability and at-
tenuates seizures in Dravet syndrome mice. Mol. Ther. 28, 235–253.
Cooper, M.S., Mcintosh, A., Crompton, D.E., McMahon, J.M., Schneider, A.,
Farrell, K., Ganesan, V., Gill, D., Kivity, S., Lerman-Sagie, T., et al. (2016). Mor-
tality in Dravet syndrome. Epilepsy Res. 128, 43–47.
De Stasi, A.M., Farisello, P., Marcon, I., Cavallari, S., Forli, A., Vecchia, D., Losi,
G., Mantegazza, M., Panzeri, S., Carmignoto, G., et al. (2016). Unaltered
network activity and interneuronal firing during spontaneous cortical dynamics
in vivo in a mouse model of severe myoclonic epilepsy of infancy. Cereb. Cor-
tex 26, 1778–1794.
Cell Reports 38, 110580, March 29, 2022 13

Articlell
OPEN ACCESS
del Pino, I., Rico, B., and Marın, O. (2018). Neural circuit dysfunction in mouse
models of neurodevelopmental disorders. Curr. Opin. Neurobiol. 48, 174–182.
Dravet, C. (2011). The core Dravet syndrome phenotype. Epilepsia 52, 3–9.
Dutton, S.B.B., Dutt, K., Papale, L.A., Helmers, S., Goldin, A.L., and Escayg, A.
(2017). Early-life febrile seizures worsen adult phenotypes in Scn1a mutants.
Exp. Neurol. 293, 159–171.
Espinoza, C., Guzman, S.J., Zhang, X., and Jonas, P. (2018). Parvalbumin+ in-
terneurons obey unique connectivity rules and establish a powerful lateral-in-
hibition microcircuit in dentate gyrus. Nat. Commun. 9, 1–10.
Favero, M., Sotuyo, N.P., Lopez, E., Kearney, J.A., and Goldberg, E.M. (2018).
A transient developmental window of fast-spiking interneuron dysfunction in a
mouse model of dravet syndrome. J. Neurosci. 38, 7912–7927.
Gaily, E., Anttonen, A.K., Valanne, L., Liukkonen, E., Traskelin, A.L., Polvi, A.,
Lommi, M., Muona, M., Eriksson, K., and Lehesjoki, A.E. (2013). Dravet syn-
drome: new potential genetic modifiers, imaging abnormalities, and ictal find-
ings. Epilepsia 54, 1577–1585.
Galarreta, M., and Hestrin, S. (1998). Frequency-dependent synaptic depres-
sion and the balance of excitation and inhibition in the neocortex. Nat. Neuro-
sci. 1, 587–594.
Goff, K.M., and Goldberg, E.M. (2019). Vasoactive intestinal peptide-express-
ing interneurons are impaired in a mouse model of Dravet syndrome. Elife 8,
1–28.
Goldberg, E.M., Watanabe, S., Chang, S.Y., Joho, R.H., Huang, Z.J., Leonard,
C.S., and Rudy, B. (2005). Specific functions of synaptically localized potas-
sium channels in synaptic transmission at the neocortical GABAergic fast-
spiking cell synapse. J. Neurosci. 25, 5230–5235.
Goldberg, E.M., Jeong, H.-Y., Kruglikov, I., Tremblay, R., Lazarenko, R.M., and
Rudy, B. (2011). Rapid developmental maturation of neocortical FS cell
intrinsic excitability. Cereb. Cortex 21, 666–682.
Grubb, M.S., and Burrone, J. (2010). Channelrhodopsin-2 localised to the axon
initial segment. PLoS One 5, e13761.
Grubb, M.S., Shu, Y., Kuba, H., Rasband, M.N., Wimmer, V.C., and Bender,
K.J. (2011). Short- and long-term plasticity at the axon initial segment.
J. Neurosci. 31, 16049–16055.
Han, Z., Chen, C., Christiansen, A., Ji, S., Lin, Q., Anumonwo, C., Liu, C., Le-
iser, S.C., Meena, Aznarez, I., et al. (2020). Antisense oligonucleotides in-
crease Scn1a expression and reduce seizures and SUDEP incidence in a
mouse model of Dravet syndrome. Sci. Transl. Med. 12, eaaz6100.
Harkin, L.A., McMahon, J.M., Iona, X., Dibbens, L., Pelekanos, J.T., Zuberi,
S.M., Sadleir, L.G., Andermann, E., Gill, D., Farrell, K., et al. (2007). The spec-
trum of SCN1A-related infantile epileptic encephalopathies. Brain 130,
843–852.
Hawkins, N.A., and Kearney, J.A. (2016). Hlf is a genetic modifier of epilepsy
caused by voltage-gated sodium channel mutations. Epilepsy Res. 119,
20–23.
Hawkins, N.A., Zachwieja, N.J., Miller, A.R., Anderson, L.L., and Kearney, J.A.
(2016). Fine mapping of a Dravet syndrome modifier locus on mouse chromo-
some 5 and candidate gene analysis by RNA-seq. PLoS Genet. 12, e1006398.
Hawkins, N.A., Anderson, L.L., Gertler, T.S., Laux, L., George, A.L., and Kear-
ney, J.A. (2017). Screening of conventional anticonvulsants in a genetic mouse
model of epilepsy. Ann. Clin. Transl. Neurol. 4, 326–339.
He, N., Li, B.M., Li, Z.X., Wang, J., Liu, X.R., Meng, H., Tang, B., Bian,W.J., Shi,
Y.W., and Liao, W.P. (2018). Few individuals with Lennox-Gastaut syndrome
have autism spectrum disorder: a comparison with Dravet syndrome.
J. Neurodev. Disord. 10, 4–11.
Hu, H., and Jonas, P. (2014). A supercritical density of Na+ channels ensures
fast signaling in GABAergic interneuron axons. Nat. Neurosci. 17, 686–693.
Hu, H., Gan, J., and Jonas, P. (2014). Interneurons. Fast-spiking, parvalbumin+
GABAergic interneurons: from cellular design to microcircuit function. Science
345, 1255263.
14 Cell Reports 38, 110580, March 29, 2022
Hu, H., Roth, F.C., Vandael, D., and Jonas, P. (2018). Complementary tuning of
Na+ and K+ channel gating underlies fast and energy-efficient action poten-
tials in GABAergic interneuron axons. Neuron 98, 156–165.e6.
Jonas, P., Bischofberger, J., Fricker, D., and Miles, R. (2004). Interneuron di-
versity series: fast in, fast out–temporal and spatial signal processing in hippo-
campal interneurons. Trends Neurosci. 27, 30–40.
Kaplan, J.S., Stella, N., Catterall, W.A., and Westenbroek, R.E. (2017). Canna-
bidiol attenuates seizures and social deficits in a mouse model of Dravet syn-
drome. Proc. Natl. Acad. Sci. U. S. A. 114, 11229–11234.
Khan, A.A., Shekh-Ahmad, T., Khalil, A., Walker, M.C., and Ali, A.B. (2018).
Cannabidiol exerts antiepileptic effects by restoring hippocampal interneuron
functions in a temporal lobe epilepsy model. Br. J. Pharmacol. 175, 2097–
2115.
Klapoetke, N.C., Murata, Y., Kim, S.S., Pulver, S.R., Birdsey-Benson, A., Cho,
Y.K., Morimoto, T.K., Chuong, A.S., Carpenter, E.J., Tian, Z., et al. (2014). In-
dependent optical excitation of distinct neural populations (Nature Methods
(2014) 11, (338-346. Nat. Methods 11, 972.
Kraushaar, U., and Jonas, P. (2000). Efficacy and stability of quantal GABA
release at a hippocampal interneuron-principal neuron synapse. J. Neurosci.
20, 5594–5607.
Li, T., Tian, C., Scalmani, P., Frassoni, C., Mantegazza,M.,Wang, Y., Yang,M.,
Wu, S., and Shu, Y. (2014). Action potential initiation in neocortical inhibitory
interneurons. PLoS Biol. 12, e1001944.
Liautard, C., Scalmani, P., Carriero, G., De Curtis, M., Franceschetti, S., and
Mantegazza, M. (2013). Hippocampal hyperexcitability and specific epilepti-
form activity in a mouse model of Dravet syndrome. Epilepsia 54, 1251–1261.
Mattis, J., Somarowthu, A., Goff, K.M., Yom, J., Sotuyo, N.P., McGarry, L.M.,
Feng, H., Kaneko, K., and Goldberg, E.M. (2022). Corticohippocampal circuit
dysfunction in a mouse model of Dravet syndrome. eLife 11:e69293. https://
doi.org/10.7554/eLife.69293.
Mattis, J., Tye, K.M., Ferenczi, E.A., Ramakrishnan, C., O’Shea, D.J., Prakash,
R., Gunaydin, L.A., Hyun, M., Fenno, L.E., Gradinaru, V., et al. (2012). Princi-
ples for applying optogenetic tools derived from direct comparative analysis
of microbial opsins. Nat. Methods 9, 159–172.
Mei, D., Cetica, V., Marini, C., and Guerrini, R. (2019). Dravet syndrome as part
of the clinical and genetic spectrum of sodium channel epilepsies and enceph-
alopathies. Epilepsia 60, S2–S7.
Micheva, K.D., Wolman, D., Mensh, B.D., Pax, E., Buchanan, J., Smith, S.J.,
and Bock, D.D. (2016). A large fraction of neocortical myelin ensheathes axons
of local inhibitory neurons. Elife 5, 1–29.
Miller, A.R., Hawkins, N.A., Mccollom, C.E., and Kearney, J.A. (2014). Mapping
genetic modifiers of survival in a mouse model of Dravet syndrome. Genes
Brain Behav. 13, 163–172.
Mistry, A.M., Thompson, C.H., Miller, A.R., Vanoye, C.G., George, A.L., and
Kearney, J.A. (2014). Strain- and age-dependent hippocampal neuron sodium
currents correlate with epilepsy severity in Dravet syndrome mice. Neurobiol.
Dis. 65, 1–11.
Niibori, Y., Lee, S.J., Minassian, B.A., and Hampson, D.R. (2020). Sexually
divergent mortality and partial phenotypic rescue after gene therapy in a
mouse model of Dravet syndrome. Hum. Gene Ther. 31, 339–351.
O’Malley, H.A., and Isom, L.L. (2015). Sodium channel b subunits: emerging
targets in channelopathies. Annu. Rev. Physiol. 77, 481–504.
Ogiwara, I., Miyamoto, H., Morita, N., Atapour, N., Mazaki, E., Inoue, I., Take-
uchi, T., Itohara, S., Yanagawa, Y., Obata, K., et al. (2007). Nav1.1 localizes to
axons of parvalbumin-positive inhibitory interneurons: a circuit basis for
epileptic seizures in mice carrying an Scn1a gene mutation. J. Neurosci. 27,
5903–5914.
Packer, A.M., and Yuste, R. (2011). Dense, unspecific connectivity of neocor-
tical parvalbumin-positive interneurons: a canonical microcircuit for inhibition?
J. Neurosci. 31, 13260–13271.
Parenti, I., Rabaneda, L.G., Schoen, H., and Novarino, G. (2020). Neurodeve-
lopmental disorders: from genetics to functional pathways. Trends Neurosci.
43, 608–621.

Articlell
OPEN ACCESS
Pegard, N.C., Mardinly, A.R., Oldenburg, I.A., Sridharan, S., Waller, L., and
Adesnik, H. (2017). Three-dimensional scanless holographic optogenetics
with temporal focusing (3D-SHOT). Nat. Commun. 8, 1–14.
Ramaswamy, S., Courcol, J.D., Abdellah, M., Adaszewski, S.R., Antille, N.,
Arsever, S., Atenekeng, G., Bilgili, A., Brukau, Y., Chalimourda, A., et al.
(2015). The neocortical microcircuit collaboration portal: a resource for rat so-
matosensory cortex. Front. Neural Circuits 9, 44.
Rubinstein, M., Han, S., Tai, C., Westenbroek, R.E., Hunker, A., Scheuer, T.,
and Catterall, W.A. (2015). Dissecting the phenotypes of Dravet syndrome
by gene deletion. Brain 138, 2219–2233.
Sabatini, B.L., and Regehr, W.G. (1999). Timing of synaptic transmission.
Annu. Rev. Physiol. 61, 521–542.
Sahin, M., and Sur, M. (2015). Genes, circuits, and precision therapies for
autism and related neurodevelopmental disorders. Science 350, aab3897.
Scheffer, I.E. (2012). Diagnosis and long-term course of Dravet syndrome. Eur.
J. Paediatr. Neurol. 16, S5.
Schoonjans, A., Paelinck, B.P., Marchau, F., Gunning, B., Gammaitoni, A., Ga-
ler, B.S., Lagae, L., and Ceulemans, B. (2017). Low-dose fenfluramine signifi-
cantly reduces seizure frequency in Dravet syndrome: a prospective study of a
new cohort of patients. Eur. J. Neurol. 24, 309–314.
Smith, R.D., and Goldin, A.L. (1998). Functional analysis of the rat I sodium
channel in Xenopus oocytes. J. Neurosci. 18, 811–820.
Sommeijer, J.P., and Levelt, C.N. (2012). Synaptotagmin-2 is a reliable marker
for parvalbumin positive inhibitory boutons in the mouse visual cortex. PLoS
One 7, 1–12.
Stedehouder, J., Couey, J.J., Brizee, D., Hosseini, B., Slotman, J.A., Dirven,
C.M.F., Shpak, G., Houtsmuller, A.B., and Kushner, S.A. (2017). Fast-spiking
parvalbumin interneurons are frequently myelinated in the cerebral cortex of
mice and humans. Cereb. Cortex 27, 5001–5013.
Stein, R.E., Kaplan, J.S., Li, J., and Catterall, W.A. (2019). Hippocampal dele-
tion of Nav1.1 channels in mice causes thermal seizures and cognitive deficit
characteristic of Dravet syndrome. Proc. Natl. Acad. Sci. U S A. 116, 16571–
16576.
Tai, C., Abe, Y., Westenbroek, R.E., Scheuer, T., and Catterall, W.A. (2014).
Impaired excitability of somatostatin- and parvalbumin-expressing cortical in-
terneurons in amousemodel of Dravet syndrome. Proc. Natl. Acad. Sci. U S A.
111, e3139–e3148.
Tran, C.H., Vaiana, M., Nakuci, J., Somarowthu, A., Goff, K.M., Goldstein, N.,
Murthy, P., Muldoon, S.F., and Goldberg, E.M. (2020). Interneuron desynchro-
nization precedes seizures in amousemodel of Dravet syndrome. J. Neurosci.
40, 2764–2775.
Tsai, M.S., Lee, M.L., Chang, C.Y., Fan, H.H., Yu, I.S., Chen, Y.T., You, J.Y.,
Chen, C.Y., Chang, F.C., Hsiao, J.H., et al. (2015). Functional and structural
deficits of the dentate gyrus network coincide with emerging spontaneous sei-
zures in an Scn1amutant dravet syndromemodel during development. Neuro-
biol. Dis. 77, 35–48.
van Lier, M., Hadi Saiepour, M., Kole, K., Cheyne, J.E., Zabouri, N., Blok, T.,
Qin, Y., Ruimschotel, E., Alexander Heimel, J., Lohmann, C., et al. (2020).
Disruption of critical period plasticity in a mouse model of neurofibromatosis
type 1. J. Neurosci. 40, 5495–5509.
Van Poppel, K., Patay, Z., Roberts, D., Clarke, D.F., McGregor, A., Perkins,
F.F., and Wheless, J.W. (2012). Mesial temporal sclerosis in a cohort of chil-
dren with SCN1A gene mutation. J. Child Neurol. 27, 893–897.
Vickers, E.D., Clark, C., Osypenko, D., Fratzl, A., Kochubey, O., Bettler, B., and
Schneggenburger, R. (2018). Parvalbumin-interneuron output synapses show
spike-timing-dependent plasticity that contributes to auditory map remodel-
ing. Neuron 99, 720–735.e6.
Wefelmeyer, W., Puhl, C.J., and Burrone, J. (2016). Homeostatic plasticity of
subcellular neuronal structures: from inputs to outputs. Trends Neurosci. 39,
656–667.
Wu, Y.W., Sullivan, J., McDaniel, S.S., Meisler, M.H., Walsh, E.M., Li, S.X., and
Kuzniewicz, M.W. (2015). Incidence of dravet syndrome in a US population.
Pediatrics 136, e1310–e1315.
Xiang, Z., Huguenard, J.R., and Prince, D.A. (2002). Synaptic inhibition of py-
ramidal cells evoked by different interneuronal subtypes in layer V of rat visual
cortex. J. Neurophysiol. 88, 740–750.
Xiong, Z., Yi, L., Cao, D., He, W., Chen, J., Gao, S., and Sun, X. (2016). Dravet
syndromewith autism inherited from a paternal mosaic heterozygousmutation
on SCN1A. J. Neurol. Sci. 369, 53–56.
Yamada, R., and Kuba, H. (2016). Structural and functional plasticity at the
axon initial segment. Front. Cell. Neurosci. 10, 1–7.
Yamagata, T., Raveau, M., Kobayashi, K., Miyamoto, H., Tatsukawa, T., Ogi-
wara, I., Itohara, S., Hensch, T.K., and Yamakawa, K. (2020). CRISPR/dCas9-
based Scn1a gene activation in inhibitory neurons ameliorates epileptic and
behavioral phenotypes of Dravet syndrome model mice. Neurobiol. Dis. 141,
104954.
Yu, F.H., Mantegazza, M., Westenbroek, R.E., Robbins, C.a., Kalume, F., Bur-
ton, K.a., Spain, W.J., McKnight, G.S., Scheuer, T., and Catterall, W.A. (2006).
Reduced sodium current in GABAergic interneurons in a mouse model of se-
vere myoclonic epilepsy in infancy. Nat. Neurosci. 9, 1142–1149.
Zucker, R.S., and Regehr, W.G. (2002). Short-term synaptic plasticity. Annu.
Rev. Physiol. 64, 355–405.
Cell Reports 38, 110580, March 29, 2022 15

Articlell
OPEN ACCESS
STAR+METHODS
KEY RESOURCES TABLE
REAGENT or RESOURCE SOURCE IDENTIFIER
Antibodies
Rabbit anti-parvalbumin Swant Cat# PV27; RRID:AB_2631173
ZNP-1 (Mouse anti-synaptotagmin 2) ZFIN Cat# ZDB-ATB-081002-25;
RRID:AB_10013783
Mouse anti-Nav1.1 (K74/71) NeuroMab Cat# 75–023; RRID:AB_2877321
Mouse anti-Pan-Nav1 (N419/40) NeuroMab Cat# 75–405; RRID:AB_2877589
Alexa Fluor 405 goat anti-rabbit Molecular Probes Cat# A31556
Alexa Fluor 488 goat anti-mouse (IgG2a) Molecular Probes Cat# A21131
Alexa Fluor 488 goat anti-mouse (IgG1) Molecular Probes Cat# A21121
Bacterial and virus strains
pAAV-hSyn-DIO-ChrimsonR-mRuby2-ST Addgene Cat# 105448-AAV9
pAAV-Ef1a-DIO-hChR2(E123A)-EYFP Addgene Cat# 35507-AAV9
Chemicals, peptides, and recombinant proteins
Tetrodotoxin citrate abcam Cat# ab120055
Experimental models: Organisms/strains
Wild-type 129S6.SvEvTac Mice Taconic Biosciences RRID:IMSR_TAC:129sve
Wild-type C57BL/6J Mice Jackson Laboratory RRID:IMSR_JAX:000664
Scn1a+/- Mice Laboratory of Jennifer Kearney,
Northwestern University
RRID:MMRRC_037107-JAX
Pvalb-Cre Mice Jackson Laboratory RRID:IMSR_JAX:017320
Ai14 Mice Jackson Laboratory RRID:IMSR_JAX:007914
Oligonucleotides
Primer: Jax007914/Ai14D wt-f:
AAG GGA GCT GCA GTG GAG TA
Integrated DNA Technologies N/A
Primer: Jax007914/Ai14D wt-r:
CCG AAA ATC TGT GGG AAG TC
Integrated DNA Technologies N/A
Primer: Jax007914/Ai14D mt-f:
GGC ATT AAA GCA GCG TAT CC
Integrated DNA Technologies N/A
Primer: Jax007914/Ai14D mt-r:
CTG TTC CTG TAC GGC ATG G
Integrated DNA Technologies N/A
Primer: Jax017320/PvCre mt-f:
AAA TGC TTC TGT CCG TTT GC
Integrated DNA Technologies N/A
Primer: Jax017320/PvCre mt-r:
ATG TTT AGC TGG CCC AAA TG
Integrated DNA Technologies N/A
Primer: Jax017320/PvCre wt-f:
CAG AGC AGG CAT GGT GAC TA
Integrated DNA Technologies N/A
Primer: Jax017320/PvCre wt-r:
AGT ACC AAG CAG GCA GGA GA
Integrated DNA Technologies N/A
Primer: MMRRC_037107-JAX/
Scn1atm1Kea, common-f:
AGT CTG TAC CAG GCA GAA CTT G
Integrated DNA Technologies N/A
Primer: MMRRC_037107-JAX/
Scn1atm1Kea, wt-r:
CCC TGA GAT GTG GGT GAA TAG
Integrated DNA Technologies N/A
Primer: MMRRC_037107-JAX/
Scn1atm1Kea, mt-r:
AGA CTG CCT TGG GAA AAG CG
Integrated DNA Technologies N/A
Software and algorithms
(Continued on next page)
e1 Cell Reports 38, 110580, March 29, 2022

Continued
REAGENT or RESOURCE SOURCE IDENTIFIER
pClamp 11.0 Molecular Devices N/A
MATLAB MathWorks N/A
GraphPad Prism 9.0.1 GraphPad Software Inc. RRID: SCR_002798 https://www.
graphpad.com/scientific-software/prism/
Adobe Illustrator 2020 Adobe N/A
Fiji:ImageJ Open Source at https://fiji.sc RRID:SCR_002285
BioRender BioRender N/A
Source data This paper https://doi.gin.g-node.org/10.12751/
g-node.4adqko
Resource code This paper https://doi.org/10.5281/zenodo.6298722
Articlell
OPEN ACCESS
RESOURCE AVAILABILITY
Lead contactFurther information and requests for resources should be directed to and will be fulfilled by the lead contact, Ethan M. Goldberg
Materials availabilityThis study did not generate any new reagents.
Data and code availabilitySource data is available at https://doi.gin.g-node.org/10.12751/g-node.4adqko and from the corresponding author upon request.
All original code has been deposited at GitHub (https://github.com/GoldbergNeuroLab/Kaneko-et-al.-2022) and at https://doi.org/
10.5281/zenodo.6298722 and is publicly available as of the date of publication.
Any additional information required to reanalyse the data reported in this paper is available from the lead contact upon request.
EXPERIMENTAL MODEL AND SUBJECT DETAILS
All procedures and experiments were approved by the Institutional Animal Care and Use Committee at The Children’s Hospital of
Philadelphia and were conducted in accordance with the ethical guidelines of the National Institutes of Health. Both male and female
mice were used in equal proportions; the key genotype- and age-dependent group differences were observed for both male and fe-
male mice (not shown). After weaning at P21, mice were group-housed with up to five mice per cage and maintained on a 12-h light/
dark cycle with ad libitum access to food and water.
Mouse strains used in this study included:Scn1a+/-mice on a 129S6.SvEvTac background (RRID:MMRRC_037107-JAX) generated
by a targeted deletion of exon 1 of the Scn1a gene, PV-Cremice (B6; 129P2-Pvalbtm1(cre)Arbr/J; RRID:IMSR_JAX:017320); tdTomato
reporter/Ai14 mice (Rosa-CAG-LSL-tdTomato; RRID: IMSR_JAX:007914; on a C57BL/6J background); wild-type 129S6.SvEvTac (Ta-
conic Biosciences model #129SVE; RRID:IMSR_TAC: 129sve); and wild-type C57BL/6J (RRID:IMSR_JAX:000664).
Homozygous PV-Cre mice were crossed to homozygous Ai14 mice to generate PV-Cre.tdT double heterozygotes on a C57BL/6J
background. Female PV-Cre.tdT double heterozygotes were then crossed to male 129S6.Scn1a+/- mice to generate Scn1a.PV-
Cre.tdT mice and WT.PV-Cre.tdT littermate controls. The genotype of all mice was determined via PCR of tail snips obtained at
P7 and was re-confirmed for each mouse after they were sacrificed for slice preparation. All mice used for experiments were on a
strict 50:50 129S6:C57BL/6J genetic background, and Scn1a+/- mice on this background have been shown to replicate the salient
core phenotypic features of Dravet Syndrome observed in human patients (Miller et al., 2014;Mistry et al., 2014).We observed similar
rates of spontaneous death (22/84, or 26.2% by P56) for Scn1a.PV-Cre.tdT mice in a prior study (Favero et al., 2018).
METHOD DETAILS
Viral injectionsAdeno-associated viruses (AAV) encoding the red-shifted channelrhodopsin variant ChrimsonR (Klapoetke et al., 2014) tagged with
mRuby2 (AAV9.hSyn.DIO.ChrimsonR.mRuby2.ST; Addgene Catalog No. 105448; titer, 2.13 3 1013 GC/mL; made available for dis-
tribution by Edward Boyden and Hillel Adesnik) and eYFP-tagged hChR2 tagged (AAV9.EF1a.DIO.hChR2(E123A).EYFP; Addgene
Catalog No. 35507; titer, 0.73 3 1013 GC/mL) were injected into S1 through the skull of mice age P0 using a NanoFil syringe
(10 mL; WPI) under ice anesthesia. Mice recovered on a heating pad within 10 min and were placed in their home cage.
Cell Reports 38, 110580, March 29, 2022 e2

Articlell
OPEN ACCESS
Acute slice preparationMice were deeply anesthetized with 5% isoflurane and transcardially perfused with ice-cold aCSF containing (in mM): KCl, 2.5;
NaH2PO4, 1.25; HEPES, 20; N-Methyl-D-glucamine (NMDG), 93; L-ascorbic acid (sodium salt), 5; thiourea, 2; sodium pyruvate, 3;
CaCl2, 0.5; MgSO4, 10; D-glucose, 25; N-acetyl-L-cysteine, 12; NaHCO3, 30; with pH adjusted to 7.30 with HCl and osmolarity
adjusted to 310 mOsm, and equilibrated with 95% O2 and 5% CO2. Slices recovered in modified aCSF for 30 min at 32�C. Sliceswere transferred to standard (recording) aCSF containing (in mM): NaCl, 125; KCl, 2.5; MgSO4, 2; NaH2PO4, 1.25; CaCl2, 2;
D-glucose, 20; NaHCO3, 26. Slices were maintained at room temperature for up to 3 h before recording. Slices were then transferred
to a recording chamber on the stage of an upright microscope (Olympus) and continuously perfused using a diaphragm pump
(Smoothflow Pump Q Series, Model #Q-100-TT-ULP-ES, TACMINA CORPORATION, Japan) and suction (PC-21, NARISHIGE,
Japan) with recording aCSF at a rate of 3 mL/min at 30 ± 1�C.
Mini-slice preparationMice were placed in a stereotaxic apparatus (Kopf Model #963) and deeply anesthetized via inhalation of 3–5% isoflurane in oxygen
for induction and maintained at 1.5–2% during the surgery. Under sterile conditions, a 3 mm diameter craniotomy was made over-
lying primary somatosensory cortex using a hand-held drill (Osada EXL-M40) equipped a 1.0 mm diameter drill bit (NeoBurr #EF4).
Then, four shallow cuts were made using a #10 scalpel blade in a 1–2 mm square, avoiding surface arteries/arterioles and veins/ve-
nules. The rectangular approximately 23 23 0.8–1.0mmdepth biopsy specimenwas then removed using the tip of the scalpel blade
(Figure 1B1). The collected tissue was immediately placed into ice-cold, oxygenated, modified aCSF (see Acute slice preparation)
containing 3% low-melting point agarose (Lonza; Catalog Number 50101). The tissue block was allowed to harden in a plastic
mold on ice, oriented so as to obtain coronal sections to facilitate subsequent visualization of neocortical layers, and then mounted
immediately on the specimen holder of a Leica VT-1200S vibratome using cyanoacrylate glue and sliced at 300 mm. Hemostasis was
achieved with Gelfoam� sterile sponges (Pfizer) soaked in aCSF. The craniotomy bone flap was replaced and the scalp was sutured.
Mini-slices were then subject to the same post-sectioning and recording procedures as acute brain slices (see above).
Recordings of electrophysiological membrane/firing properties and unitary IPSCsPV-INs were identified by tdTomato expression visualized with epifluorescence and displayed non-accommodating trains of
relatively brief action potentials. Spiny stellate cells (PCs; principal cells) were identified by morphology under infrared differential
interference contrast (IR-DIC) and the presence of a regular-spiking firing pattern. Whole-cell recordings were obtained from layer
4 primary somatosensory cortex (S1; ’’barrel’’). Patch pipettes were pulled from borosilicate glass using a P-97 puller (Sutter Instru-
ments) and filled with intracellular solution containing (in mM): K-gluconate, 65; KCl, 65; MgCl2, 2; HEPES, 10; EGTA, 0.5; Phospho-
creatine-Tris2, 10; ATP (magnesium salt), 4; GTP (sodium salt), 0.3; pH was adjusted to 7.30 with KOH, and osmolarity adjusted to
290 mOsm. Pipettes had a resistance of 3–4 MU when filled and placed in recording solution. Unitary IPSCs were obtained via 2–6
simultaneous patch clamp recordings from neurons located within 100 mm of one another in a mini-slice in pre-weaning mice (Fig-
ure 1B) or a thalamocortical slice (Agmon and Connors, 1991) in young adult mice (Figure 3A1 and 3A2). Recordings in young adult
mice were performed in sensorimotor cortex of the hemisphere contralateral to that of prior mini-slice biopsy.
Voltage was sampled at 100 kHz with a MultiClamp 700B amplifier (Molecular Devices), filtered at 2 kHz by Lowpass and Bessel
filters, digitized using a DigiData 1550B, and acquired using pClamp11 software. Recordings were discarded if the cell had an un-
stable resting membrane potential and/or a membrane potential of PV-INs greater (less negative) than �60 mV, or if access resis-
tance increased by > 20% during the recording. We did not correct for liquid junction potential.
Recordings of optogenetic evoked IPSCsPV-INs were identified by mRuby2 expression visualized with epifluorescence and PCs were identified as above. To record optoge-
netically-evoked spikes in PV-INs (Figure S10), we used a regular intracellular solution containing (in mM): K-gluconate, 130; KCl, 6.3;
MgCl2, 1; HEPES, 10; EGTA, 0.5; Phosphocreatine-Tris2, 10; ATP (magnesium salt), 4; GTP (sodium salt), 0.3; pH was adjusted to
7.30 with KOH, and osmolarity adjusted to 290 mOsm. To record optogenetic evoked IPSCs in PCs (Figure 7), we used a cesium-
based intracellular solution containing, in mM: cesium methanesulfonate, 125; HEPES, 15; EGTA, 0.5; QX-314, 2; Phosphocreatine-
Tris2, 10; tetraethylammonium chloride, 2; ATP (magnesium salt), 4; GTP (sodium salt), 0.3; pH was adjusted to 7.30 with KOH, and
osmolarity adjusted to 290 mOsm.
ImmunohistochemistryFor visualization of PV-IN axonal boutons, microbiopsies collected from P16-21 mice were drop-fixed in 4% PFA. Mice from P35-56
mice were deeply anesthetized with isoflurane, then transcardially perfused with 10–15 mL of 4% PFA in PBS and postfixed for 24 h.
Brain tissuewas then transferred to 30%sucrose solution for 24–48 h and then 40 mmcoronal sections through S1weremade using a
sliding microtome (American Optical). After washing in PBS, the slices were blocked (3% normal goat serum, 2% BSA, 0.3% Triton
X-100 in PBS) for 1 h at room temperature to decrease nonspecific staining, and then washed in PBS. The sections were then trans-
ferred into solution containing mouse-a-synaptotagmin-2 primary antibody (1:5000; ZFIN ZDB-ATB-081002-25) with 1% normal
goat serum, 0.2% BSA, and 0.3% Triton X-100 in PBS at 4�C overnight in the dark. After washing in PBS, the incubated
sections were transferred into a solution containing the secondary antibody (Alexa Fluor 488-conjugated goat anti-mouse IgG2a;
e3 Cell Reports 38, 110580, March 29, 2022

Articlell
OPEN ACCESS
1:500, Molecular Probes A21131) with 2% BSA and 0.3% Triton X-100 in PBS at 4�C overnight in the dark. Sections were then
mounted on glass slides and imaged using a confocal microscope (Leica SP8) equipped with a 40X objective (Leica HC PL APO
40X NA 1.30 OIL CS2). Bouton density was counted surrounding putative principle cell somata in a randomly selected
100 3 100 mm area in layer 4 primary somatosensory neocortex.
For validation of optogenetic experiments, Scn1a.PV-Cre.tdT and WT.PV-Cre.tdT mice injected in the subdural space with
AAV9.hSyn.DIO.ChrimsonR.mRuby2.ST and AAV9.EF1a.DIO.hChR2(E123A).EYFP at P0 and processed for immunohistochemistry
at P35-56 as described above. Tissue sections were transferred to a solution containing rabbit anti-PV antibody (1:1000; Swant
PV27), 1% normal goat serum, 0.2% BSA, and 0.3% Triton X-100 in PBS, and incubated at 4�C overnight in the dark. After washing
in PBS, the incubated sections were transferred into solution containing secondary antibody (Alexa Fluor 405; 1:500, Thermo Fisher
A31556) with 2% BSA and 0.3% Triton X-100 in PBS at 4�C overnight in the dark. Sections were mounted on glass slides and confocal
microscopy was performed to visualize cells immunopositive for PV and co-expressing hChR2-eYFP and ChrimsonR-mRuby2.
Na + channel immunohistochemistry was performed on free-floating brain tissue sections following light fixation and permeabili-
zation as described previously (Goff and Goldberg, 2019). Briefly, isoflurane-anesthetized mice were transcardially perfused with 1%
paraformaldehyde and 0.5% MeOH in PBS; then, the brain were removed and post-fixed in perfusate at room temperature for 1 h
50 mm thick sections were cut on a Leica VT-1200S vibratome, and then blocked and permeabilized with 0.2% Triton X-100 (Sigma)
and 10% normal goat serum in PBS for one hour at room temperature. Slices were stained overnight at 4�C with a primary antibody
directed against Nav1.1 (NeuroMab K74/71) or Pan-Nav (NeuroMab N419/40) in PBS with 3% BSA (BSA, Sigma) and 0.2% Triton
X-100. The following day, the slices were washed with PBS and stained with a secondary antibody, Alexa Fluor 488-conjugated
goat anti-mouse IgG1 or IgG2 respectively (Molecular Probes), in PBS, with 3% BSA and 0.2% Triton X-100. Slices were mounted,
cover-slipped, and sealed before imaging on a Leica TCS SP8 confocal microscope. All imagining was done at 80X using identical
laser power, exposure, and averaging parameters. Several Z-stacks of Layer IV barrel cortex and spanning the thickness of each
section were taken using 1 mm steps for each sample. The dimensions of each z stack were 150 mm3 150 mmX 20–40 mm thickness.
For automated analysis of confocal images, Z-stacks were first imported into ImageJ, and the green channel (Nav1.1 or Pan-Nav)
was exported as a.tif image sequence excluding any sections near the surface of the slicewhich tended to showbrighter non-specific
labeling. These sequences were imported into MATLAB, where each image was segmented in the following sequence: each plane in
the sequence was binarized using Otsu’smethod to determine a global threshold; then, the activecontour function was used to refine
the generated mask for 100 iterations using the edge detection method; and finally, the image mask was refined using imopen and
imfill. The utilized functions are all available through the MATLAB Image Processing and computer vision toolbox, and accessed
through the image segmenter app. A fraction of the segmented images were checked against a blind scorer and were found to
be in good agreement with well-defined Nav1.1 and Pan-Nav puncta. Puncta with a total length smaller than 2 mm or with an area
greater than 160 mm2 were filtered out of analysis, as these were not usually reported as staining by a blind scorer but rather seemed
to be non-specific labeling of large structures like blood vessels/nuclei and visual noise. The individual images were then recon-
structed into a 3D volume, and segmentation analysis was done in 3D using the regionprops function. From this, we extracted
themajor andminor axis length, number of branch points, and a 2D flattened representation of each puncta for calculation of linearity
as the ratio of the major to the minor axis. Mean intensity values for each puncta were normalized by subtracting the median back-
ground value of each slice of the z stack. ‘‘Branches’’ were defined by the built-in MATLAB function as the number of branch points
for an individual puncta, with a ‘‘branchpoint’’ corresponding to a point on the extracted 3D volume where a pixel splits into two or
more structures. Linearity was defined as the unit-less ratio of major to minor axis.
Loss of Nav1.1 in Scn1a+/- mice results in lower fluorescence intensity (Figures S7H and S7I). Because of this, we did not to use a
simple threshold level for puncta detection; instead, the multistep algorithm described above achieves greater consistency across
experiments and tissue sections with different overall fluorescence intensity levels and maintained performance in conditions with
relatively lower fluorescence intensity and corrected for near-threshold ‘‘dropout’’ of low(er) intensity puncta in Scn1a+/- mice.
Electrophysiology data analysisAll analysis was performed manually in Clampfit (pCLAMP) or using routines written in MATLAB. Resting membrane potential (Vm)
was calculated using the average value of a 1 s sweep with no direct current injection. Input resistance (Rm) was calculated using
the response to hyperpolarizing current injections near rest using Rm = V/I. AP threshold was calculated as the value at which the
derivative of the voltage (dV/dt) first reached 10 mV/ms. Spike height refers to the absolute maximum voltage value of an individual
AP, while spike amplitude was calculated as the difference between spike height and AP threshold for a given AP. AP rise time is the
time from AP threshold to the peak of the AP. AP half-width (AP 1/2-width) is defined as the width of the AP (in ms) at half-maximal
amplitude. AP afterhyperpolarization (AHP) amplitude is calculated as the depth of the afterhyperpolarization (in mV) relative to AP
threshold. Unless indicated, all quantification of single spike properties was done using the first AP elicited at rheobase.
Rheobase was determined as the minimum current injection that elicited APs using a 600 ms sweep at 25 pA intervals. Maximal
instantaneous firing was calculated using the smallest interspike interval (ISI) elicited at near-maximal current injection. Maximal
steady-state firing was defined as the maximal mean firing frequency during the last 300 ms of a suprathreshold 600 ms current in-
jection, with aminimum requirement for a spike being an amplitude of 40mVwith a clear AP threshold of dV/dt > 10mV/ms and height
overshooting at least 0mV. All I-f plots were created using the steady-state firing calculated for each current step, counting failures as
0 for subsequent current steps.
Cell Reports 38, 110580, March 29, 2022 e4
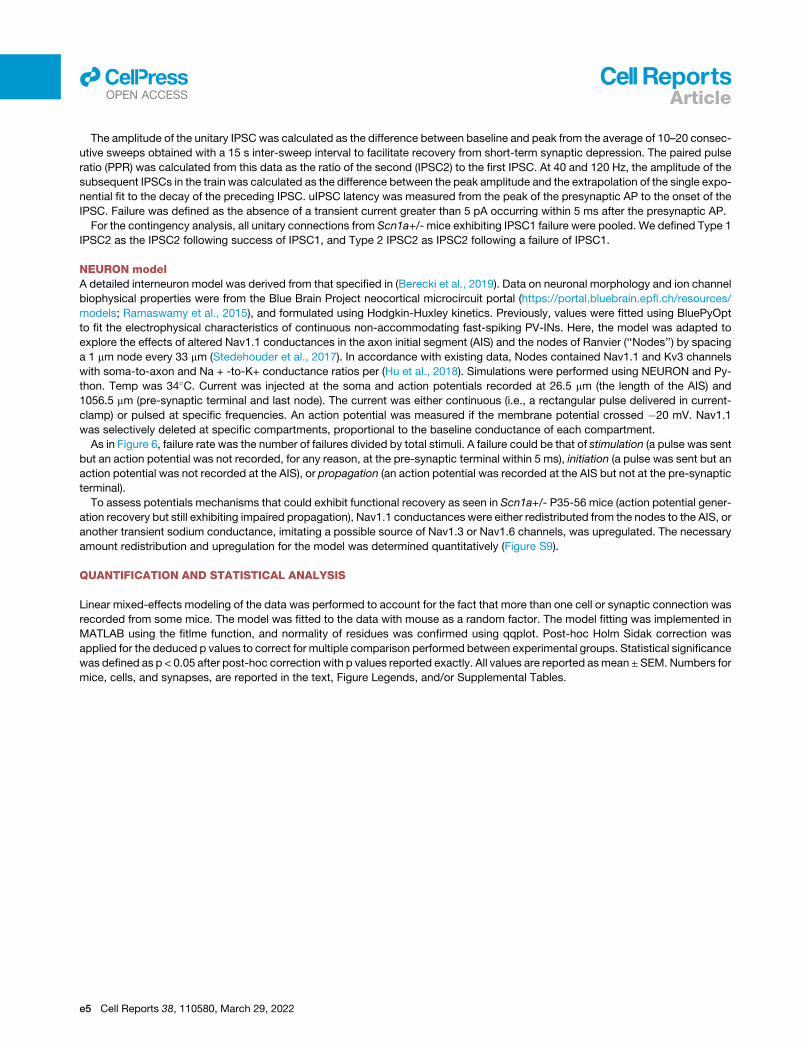
Articlell
OPEN ACCESS
The amplitude of the unitary IPSC was calculated as the difference between baseline and peak from the average of 10–20 consec-
utive sweeps obtained with a 15 s inter-sweep interval to facilitate recovery from short-term synaptic depression. The paired pulse
ratio (PPR) was calculated from this data as the ratio of the second (IPSC2) to the first IPSC. At 40 and 120 Hz, the amplitude of the
subsequent IPSCs in the train was calculated as the difference between the peak amplitude and the extrapolation of the single expo-
nential fit to the decay of the preceding IPSC. uIPSC latency was measured from the peak of the presynaptic AP to the onset of the
IPSC. Failure was defined as the absence of a transient current greater than 5 pA occurring within 5 ms after the presynaptic AP.
For the contingency analysis, all unitary connections from Scn1a+/- mice exhibiting IPSC1 failure were pooled. We defined Type 1
IPSC2 as the IPSC2 following success of IPSC1, and Type 2 IPSC2 as IPSC2 following a failure of IPSC1.
NEURON modelA detailed interneuron model was derived from that specified in (Berecki et al., 2019). Data on neuronal morphology and ion channel
biophysical properties were from the Blue Brain Project neocortical microcircuit portal (https://portal.bluebrain.epfl.ch/resources/
models; Ramaswamy et al., 2015), and formulated using Hodgkin-Huxley kinetics. Previously, values were fitted using BluePyOpt
to fit the electrophysical characteristics of continuous non-accommodating fast-spiking PV-INs. Here, the model was adapted to
explore the effects of altered Nav1.1 conductances in the axon initial segment (AIS) and the nodes of Ranvier (‘‘Nodes’’) by spacing
a 1 mm node every 33 mm (Stedehouder et al., 2017). In accordance with existing data, Nodes contained Nav1.1 and Kv3 channels
with soma-to-axon and Na + -to-K+ conductance ratios per (Hu et al., 2018). Simulations were performed using NEURON and Py-
thon. Temp was 34�C. Current was injected at the soma and action potentials recorded at 26.5 mm (the length of the AIS) and
1056.5 mm (pre-synaptic terminal and last node). The current was either continuous (i.e., a rectangular pulse delivered in current-
clamp) or pulsed at specific frequencies. An action potential was measured if the membrane potential crossed �20 mV. Nav1.1
was selectively deleted at specific compartments, proportional to the baseline conductance of each compartment.
As in Figure 6, failure rate was the number of failures divided by total stimuli. A failure could be that of stimulation (a pulse was sent
but an action potential was not recorded, for any reason, at the pre-synaptic terminal within 5 ms), initiation (a pulse was sent but an
action potential was not recorded at the AIS), or propagation (an action potential was recorded at the AIS but not at the pre-synaptic
terminal).
To assess potentials mechanisms that could exhibit functional recovery as seen in Scn1a+/- P35-56 mice (action potential gener-
ation recovery but still exhibiting impaired propagation), Nav1.1 conductances were either redistributed from the nodes to the AIS, or
another transient sodium conductance, imitating a possible source of Nav1.3 or Nav1.6 channels, was upregulated. The necessary
amount redistribution and upregulation for the model was determined quantitatively (Figure S9).
QUANTIFICATION AND STATISTICAL ANALYSIS
Linear mixed-effects modeling of the data was performed to account for the fact that more than one cell or synaptic connection was
recorded from some mice. The model was fitted to the data with mouse as a random factor. The model fitting was implemented in
MATLAB using the fitlme function, and normality of residues was confirmed using qqplot. Post-hoc Holm Sidak correction was
applied for the deduced p values to correct for multiple comparison performed between experimental groups. Statistical significance
was defined as p < 0.05 after post-hoc correction with p values reported exactly. All values are reported asmean ±SEM. Numbers for
mice, cells, and synapses, are reported in the text, Figure Legends, and/or Supplemental Tables.
e5 Cell Reports 38, 110580, March 29, 2022

Cell Reports, Volume 38
Supplemental information
Developmentally regulated impairment of
parvalbumin interneuron synaptic transmission in
an experimental model of Dravet syndrome
Keisuke Kaneko, Christopher B. Currin, Kevin M. Goff, Eric R. Wengert, AlaSomarowthu, Tim P. Vogels, and Ethan M. Goldberg
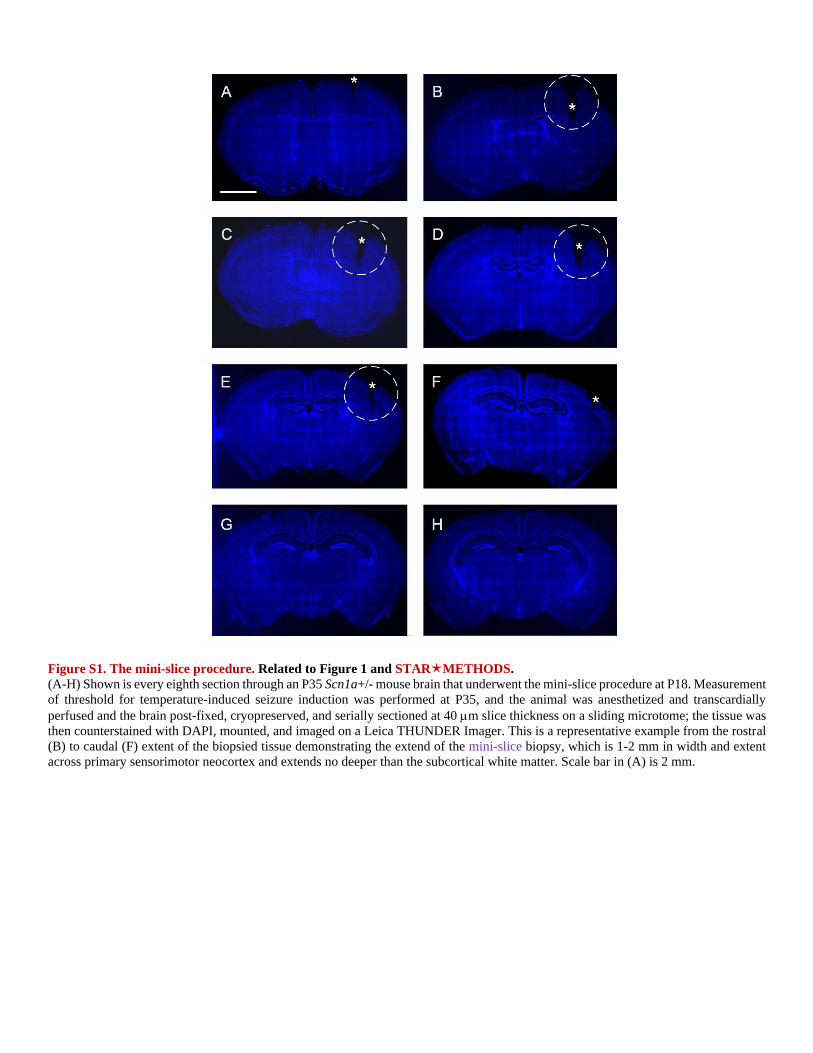
Figure S1. The mini-slice procedure. Related to Figure 1 and STARMETHODS.
(A-H) Shown is every eighth section through an P35 Scn1a+/- mouse brain that underwent the mini-slice procedure at P18. Measurement
of threshold for temperature-induced seizure induction was performed at P35, and the animal was anesthetized and transcardially
perfused and the brain post-fixed, cryopreserved, and serially sectioned at 40 m slice thickness on a sliding microtome; the tissue was
then counterstained with DAPI, mounted, and imaged on a Leica THUNDER Imager. This is a representative example from the rostral
(B) to caudal (F) extent of the biopsied tissue demonstrating the extend of the mini-slice biopsy, which is 1-2 mm in width and extent
across primary sensorimotor neocortex and extends no deeper than the subcortical white matter. Scale bar in (A) is 2 mm.

Figure S2. Excitability of PV interneurons in Scn1a+/- vs. wild-type mice. Related to Figure 2.
Representative traces of PV-INs from Scn1a+/- P16-21 SUDEP (A), Scn1a+/- P16-21 SURVIVOR (B), Scn1a+/- P35-56 (C), WT P16-
21 (D), and WT P35-56 (E). Shown is the response to a -200 pA hyperpolarizing current injection (A1-E1), a near-rheobase current
injection (A2-E2), and an 800 pA depolarizing current injection (A3-E3), with an expanded view at onset of firing (A4-E4) and at spike
failure (A5 and B5).
(F) Summary data for maximal steady state firing frequency. Note decreased maximal steady-state firing frequency in PV interneurons
from Scn1a+/- mice at early developmental time points relative to age-matched WT control, with recovery by P35-56. See also Table
S1B.
(G-I) Passive membrane properties for PV-INs from each group, including rheobase (G), membrane time constant (H), and membrane
potential sag (I). See also Table S1A.

Figure S3. Properties of single PV interneuron action potentials. Related to Figure 2.
(A) Representative individual APs (top) and corresponding phase plots (bottom) from PV-INs in each group. AP threshold is indicated
with an arrow; a second inflection point (“hump”), corresponding to the onset of the AIS spike, if present, is indicated by an asterisk
(*). See Table S5. Note the presence of a hump in Scn1a+/- mice but not in WT.
(B) Summary data for AP threshold (1), AP half-width (2), AP rise time (3), AP height (4), AHP amplitude (5), and maximal dV/dt (6).
See also Table S5.

Figure S4. Validation of the mini-slice procedure. Related to Figures 1 and 2.
(A-H) The mini-slice procedure does not alter the electrophysiological properties of PV interneurons. (A-B) Example of a PV-IN from
P16-21 Scn1a+/- mice obtained via standard acute brain slice (A) or mini-slice (B). Note the presence of brief action potentials with
fast, deep afterhyperpolarization with near-threshold current injections, with action potential failure at higher amplitude current injection.
(C-H) Summary data showing no difference across a range of passive membrane properties or properties of individual action potentials
between PV-INs from Scn1a+/- mice obtained via either method.
(I-J) The mini-slice procedure does not alter aspects of Dravet syndrome phenotype or influence mouse viability. (I) Mini-slice
procedure performed at P18-21 had no effect on the temperature threshold of seizure induction in Scn1a+/- mice tested at P35. We
performed the mini-slice procedure on Scn1a+/- mice at P18-21 and compared pre-biopsy weight vs. weight at P35 and found no
difference between a cohort of mice that did vs. did not undergo the mini-slice procedure: mice undergoing mini-slice were 6.4 ± 0.2
mg at time of mini-slice biopsy (mean ± SE; n = 6) and 20.5 ± 0.3 mg at P35, while an age-matched cohort of Scn1a+/- littermates were
6.9 ±0.4 mg (n = 3) at P18-21 and 19.8 ± 0.5 mg at P35 (p = 0.60 vs. mini-slice via two-tailed Student’s t-test). (J) We then measured
the threshold for temperature-induced seizures in surviving mice and found this to be identical between mice that did and did not undergo
the mini-slice procedure: this value was 40.3 ± 0.1 C for minislice (n = 3) vs. 39.9 ± 0. C for age-matched Scn1a+/- littermates (n =
6) that not undergo biopsy (p = 0.3220 vs. mini-slice).

Figure S5. Properties of PV-IN:PC unitary connections. Related to Figure 3.
(A) Representative recordings of PV-IN:PC unitary IPSCs (uIPSCs) for all experimental groups (1-5).
(B) Summary data for uIPSC amplitude. See also Table S6.
(C-E) Summary data for paired-pulse ratio at 20 (C), 40 (D), and 120 Hz (E). See also Table S6.
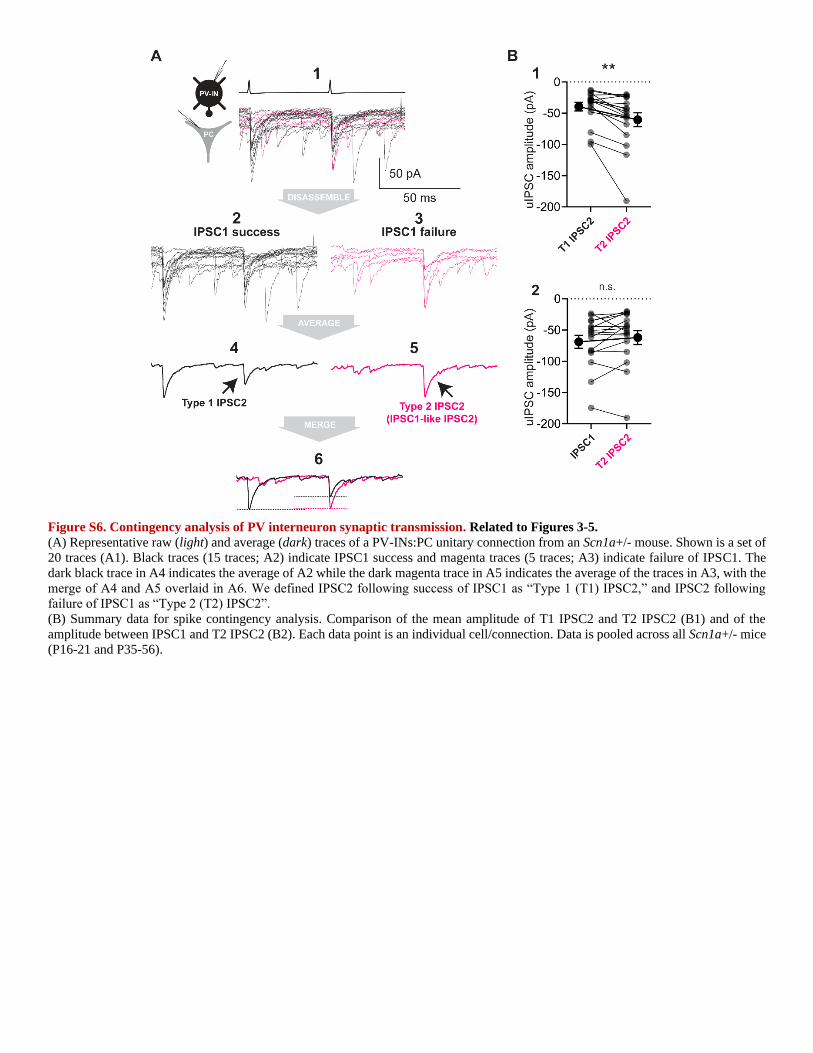
Figure S6. Contingency analysis of PV interneuron synaptic transmission. Related to Figures 3-5.
(A) Representative raw (light) and average (dark) traces of a PV-INs:PC unitary connection from an Scn1a+/- mouse. Shown is a set of
20 traces (A1). Black traces (15 traces; A2) indicate IPSC1 success and magenta traces (5 traces; A3) indicate failure of IPSC1. The
dark black trace in A4 indicates the average of A2 while the dark magenta trace in A5 indicates the average of the traces in A3, with the
merge of A4 and A5 overlaid in A6. We defined IPSC2 following success of IPSC1 as “Type 1 (T1) IPSC2,” and IPSC2 following
failure of IPSC1 as “Type 2 (T2) IPSC2”.
(B) Summary data for spike contingency analysis. Comparison of the mean amplitude of T1 IPSC2 and T2 IPSC2 (B1) and of the
amplitude between IPSC1 and T2 IPSC2 (B2). Each data point is an individual cell/connection. Data is pooled across all Scn1a+/- mice
(P16-21 and P35-56).

Figure S7. Nav expression at PV interneuron axons in WT and Scn1a+/- mice. Related to Figure 3.
(A) Immunohistochemical analysis demonstrates Nav1.1 and Pan-Nav labelling of parvalbumin interneuron axons. (A1) Example
confocal image taken from an adult WT.PV-Cre.tdT mouse, demonstrating immunoreactivity for Pan-Nav (green) as well as endogenous
tdTomato signal (red) in layer IV barrel cortex. Pan-Nav labelling shows some smaller puncta, but mainly labels longer linear structures,
some of which colocalize to PV-IN AIS (yellow dotted lines). (A2-3) Immunohistochemistry for Nav1.1 performed as in Figure S7A1.
Note that Nav1.1 expression at PV-IN AIS is also apparent, but labels a shorter, more proximal extent of axon relative to pan-Nav, as
reported previously. In addition, in layer IV, there is dense neuropil labelling, which partially colocalizes with PV-IN branch points (A2)
and presumptive basket cell pre-terminal axon/terminal forks (A3). Scale bar is 5 μm for all images.
(B-L) Comparison of pan-Nav and Nav1.1 labelling in WT and Scn1a+/- mice. (B) Quantification of both pan-Nav and Nav1.1 labelling
(scale bar = 40 μM) using (C) automated filtering and segmentation of reconstructed z-stacks of layer IV barrel cortex to extract (D)
individual Nav puncta. Nav1.1 is more likely to label complex and/or branching structures compared to pan-Nav (E-G). Quantification
of the number of branch points, linearity, and major axis length of Nav1.1 and pan-Nav puncta (6,718 puncta from n = 10 Nav1.1 z-
stacks, and 1,409 puncta from n = 7 pan-Nav z-stacks from n = 3 WT mice).
(H) Example confocal images of Nav1.1 labelling in Layer IV barrel cortex from both WT and Scn1a+/- mice (I-L). Using the same
segmentation as above, quantification of the normalized intensity of extracted puncta, as well as the parameters in (E-G) (6,718 puncta
from n = 10 z-stacks from n = 3 WT mice, and 3,130 puncta from n = 10 z-stacks from n = 3 Scn1a+/- mice; *, p < 0.05,**, p < 0.01,
***, p < 0.001 whether there is a difference in means between groups determined by a mixed effects linear model treating mice as
random effects). Note that the pan-Nav antibody also recognizes Nav1.1; however, apparent labeling of pyramidal cell axon initial
segments in (B) is prominent due to concomitant labeling of Nav1.2 and 1.6 at the pyramidal cell AIS, the parallel orientation of the
pyramidal cell AIS vs. the random orientation of the PV-IN AIS, and the fact that pyramidal cells are more numerous than PV-INs.

Figure S8. Lower PV interneuron connection probability and decreased bouton numbers in Scn1a+/- mice. Related to Figure 3.
(A) Shown are confocal images from an Scn1a+/- mouse at age P55 indicating immunoreactivity for Syt2 (left; green) and tdTomato
expression in Scn1a.PV-IN.tdTomato mice (middle; red), with merge (right). Scale bar, 10 m.
(B) Representative confocal images of perisomatic Syt2-positive PV-IN synaptic boutons (arrowheads) surrounding principle cells in
each group (Scn1a+/- and WT; P16-21 and P35-56), with pie charts depicting the PV-IN:PC connection probability for all groups
obtained in multiple whole-cell recording experiments in acute brain slice.
(C) Violin plots illustrating summary data for the number of perisomatic puncta per principle cell across all groups.

Figure S9. Model parameters used to explore the mechanism of the observed experimental results. Related to Figure 6.
(A) Membrane potential traces recorded at the axon initial segment (AIS, solid light green line) and pre-synaptic terminal (dashed light
orange line), following an injection of 0.75 nA current into the soma from 20 ms. Colored downward arrows represent the time of a
failure (initiation, dark green, or propagation, dark orange), the expected time that an action potential would occur. Columns represent
10, 30, 50, 70, and 90 % extent of Nav1.1 deletion (proportional to a neuronal compartment’s baseline). Rows are the different deletion
paradigms explored.
(B) The average firing rate of a neuron with progressive Nav1.1 deletion. The difference in firing rates between the AIS (solid light
green line) and the pre-synaptic terminal (dashed light orange line) represents the propagation failure (shaded blue area), which increases
with further deletion.
(C) Input-output curves for baseline (0 %), 50 %, and 70 % Nav1.1 deletion. The difference in firing rates between the AIS (solid light
green line) and the pre-synaptic terminal (dashed light orange line) represents the propagation failure (shaded blue area). Note that the
interneuron enters depolarization block at higher input currents, as seen experimentally. Propagation failure is exacerbated by Nav1.1
deletion. The dashed purple line is 0.75 nA, which is the input current typically used elsewhere.

(D) For a control, all the sodium channels in the model were modulated, rather than just the Nav1.1 channel, as a representation of TTX
strength. The interneuron firing rates for different input currents were evaluated against total Na+ deletion to assess their drop-off.
(E) A possible mechanism whereby Scn1a+/- PV-INs recover action potential generation by P35-56 was to redistribute Nav1.1 channels
from the nodes to the AIS and soma. The firing rate at the AIS (diamond markers) and pre-synaptic terminals (circle markers) was
explored to investigated as a function of Nav1.1 redistribution to elicit similar baseline firing rate (gray shaded area) at the AIS but still
exhibiting impaired propagation. To reach this behavior, Nav1.1 conductances in the soma and AIS were above baseline levels to
compensate for the (further) nodal Nav1.1 deletion (60 %, light green; 70 %, blue; and 80 %, dark blue). Note that the total Nav1.1
conductance was still below baseline levels; that is, the total additional Nav1.1 conductance in the soma and AIS was less than Nav1.1
deleted at the nodes, for the range explored. The values chosen for the traces in Figure 6 are indicated by orange outlines: 20 % addition
of soma and AIS Nav1.1, and 60 % deletion of nodal Nav1.1.
(F) Another possible mechanism whereby Scn1a+/- PV-INs recover action potential generation by P35-56 is to upregulate other sodium
channels like Nav1.3 or Nav1.6 while Nav1.1 was 50 % deleted. Here, the model’s other transient sodium channel “Nav1.X”, as
previously described in (Berecki et al. 2019), was upregulated to recover activity. Each block (white border) in the heatmap shows the
firing rate for the soma, AIS, and pre-synaptic terminals from left to right (separated by light gray lines). To recover activity, the Nav1.X
could be 120 % of baseline at the soma and 130 % of baseline at the AIS, as represented by the orange border and used in Figure 6.

Figure S10. Bypassing the soma with axo-synaptic stimulation enhances the fidelity of synaptic transmission at PV-IN synapses.
Related to Figure 7.
(A) Schematic illustrating a PV-IN expressing 2 types of excitatory opsin at spatially distinct sites.
(B) Photoactivation of hChR2 and ChrimsonR reliably drive action potentials in PV interneurons across a range of frequencies. A whole-
cell current-clamp recording from a PV-IN with representative traces for red light-driven trains of five action potentials at 20 (1), 40 (2),
and 120 Hz (3).
(C-G). Summary data for (C)oIPSC2/oIPSC1 and (D) oIPSC5/oIPSC1 in response to blue light (ChR2; axo-synaptic) photostimulation,
versus (E) oIPSC2/oIPSC1 and (F) oIPSC5/oIPSC1 in response to red light (ChrimsonR.mRuby2.ST; somatic) photostimulation. (G)
Data for the six key comparisons. See also Table S3.