an integrated geophysical study of the beattie magnetic anomaly, south africa
TRANSCRIPT
�������� ����� ��
An integrated geophysical study of the Beattie Magnetic Anomaly, SouthAfrica
Stephanie Scheiber-Enslin, Jorg Ebbing, Susan J. Webb
PII: S0040-1951(14)00479-XDOI: doi: 10.1016/j.tecto.2014.08.021Reference: TECTO 126428
To appear in: Tectonophysics
Received date: 11 April 2014Revised date: 21 August 2014Accepted date: 30 August 2014
Please cite this article as: Scheiber-Enslin, Stephanie, Ebbing, Jorg, Webb, Susan J., Anintegrated geophysical study of the Beattie Magnetic Anomaly, South Africa, Tectono-physics (2014), doi: 10.1016/j.tecto.2014.08.021
This is a PDF file of an unedited manuscript that has been accepted for publication.As a service to our customers we are providing this early version of the manuscript.The manuscript will undergo copyediting, typesetting, and review of the resulting proofbefore it is published in its final form. Please note that during the production processerrors may be discovered which could affect the content, and all legal disclaimers thatapply to the journal pertain.
ACC
EPTE
D M
ANU
SCR
IPT
ACCEPTED MANUSCRIPT
1
An integrated geophysical study of the Beattie Magnetic Anomaly, South Africa
Stephanie Scheiber-Enslinab,*
, Jörg Ebbingc, Susan J. Webb
b
a Geophysics Unit, Council for Geoscience, Pretoria, 0184, South Africa
b School of Geoscience, University of the Witwatersrand, Johannesburg, 2000, South Africa
c Department of Geoscience, Christian-Albrechts University, Kiel, 24118, Germany
* Corresponding author. Tel.: +27 11 717 6606; Fax: +27 86 672 8967;
Email addresses: [email protected] (S. Scheiber-Enslin), [email protected]
kiel.de (J. Ebbing), [email protected] (S.J. Webb)
Abstract
The source of the Beattie magnetic anomaly (BMA) still remains unclear, with several
competing hypotheses. Here we add a piece to the puzzle by investigating available potential
field data over the anomaly. Filtered magnetic data show the BMA as part of a group of linear
magnetic anomalies. As the linear anomaly north of the BMA is associated with exposed
supracrustals, migmatites and shear zones within the Natal thrust terranes we assume a
similar source for the BMA. This source geometry, constrained by seismic and MT data, fits
potential field data over the BMA and other magnetic linear anomalies in the south-central
and south-western Karoo. In these models the bodies deepen from ~5 km towards the south,
with horizontal extents of ~20-60 km and vertical extents of ~10-15 km. Densities range from
2800- 2940 kg/m3 and magnetic susceptibilities from 10-100 x 10
-3 SI. These magnetic
susceptibilities are higher than field values from supracrustal rocks (10-60 x 10-3
SI) but
could be due to the fact that no remanent magnetization was included in the model. The
ACC
EPTE
D M
ANU
SCR
IPT
ACCEPTED MANUSCRIPT
2
lithologies associated with the different linear anomalies vary as is evident from varying
anomaly amplitudes. The strong signal of the BMA is linked to high magnetic susceptibility
granulite facies supracrustals (~10-50 x 10-3
SI) as seen in the Antarctic, where the mobile
belt continued during Gondwana times.
Keywords: Beattie anomaly; mobile belt; magnetic field; forward modelling
1. Introduction
The Beattie magnetic anomaly (BMA) that runs along almost the entire southern
portion of South Africa (Figure 1) was first recognized in the early 1900s (Beattie, 1909) but
even today its source is the matter of an ongoing debate. On the east coast, where the BMA
source is at its shallowest, it is truncated by the Agulhas fracture zone, implying that the body
causing the anomaly formed prior to Gondwana breakup (Pitts et al., 1992).
Several geophysical studies have been conducted to better understand the source of
the magnetic anomaly. One of these include a large-scale magnetic survey carried out in
southern South Africa in the early 1970s (and later extended), which led to the identification
of the Southern Cape Conductive Belt (SCCB, Figure 1) (de Beer et al., 1982; de Beer and
Gough, 1980; Gough et al., 1973). This 140 km broad and 1000 km long conductive zone that
runs east-to-west across southern South Africa was suggested to be linked to a lower crustal
or upper mantle source. The rough coincidence of the SCCB and BMA led to the proposal of
a common source, namely a dipping slab of serpentinized oceanic crust representing a Pan
African suture zone (~500 Ma) (de Beer et al., 1982; de Beer and Meyer, 1983; de Beer et al.,
1974; Hälbich, 1993). A receiver function study recognized discontinuities at ~8-11 am and
~18 km depth at four seismic stations in this region that were attributed to this slab (Harvey
ACC
EPTE
D M
ANU
SCR
IPT
ACCEPTED MANUSCRIPT
3
et al., 2001). The BMA and SCCB show no special correlation with younger (≤180 Ma)
large-scale geological features such as the edge of the inland plateau (Figure 1).
Studies by Corner (1989) correlating geological and magnetic data, led to the
hypothesis that the BMA forms part of the NNMB basement rocks. Corner (1989) proposed
water movement and mineralization along low-angle thrust zones within the basement as the
source, as well as the extension of the BMA into Antarctica. Thomas et al. (1992b) in turn
suggested that the BMA is one of several magnetic linear anomalies visible along the east
coast of South Africa, which are associated with shear zones within the Natal basement. The
magnetic linear anomaly north of the BMA close to Amanzimtoti was labelled the Williston
anomaly, and the Mbashe anomaly was identified to the south of the BMA (Thomas et al.,
1992b).
Several geophysical studies have been conducted in recent years in the south-western
Karoo linked to the Inkaba yeAfrica project, which have explored deeper basement structures
including the BMA. These include Magnetotelluric (MT) studies (Weckmann et al., 2007a;
Weckmann et al., 2007b), as well as a near-vertical reflection study (Lindeque et al., 2011;
Lindeque et al., 2007) and wide-angle refraction studies (Stankiewicz et al., 2008;
Stankiewicz et al., 2007). These studies placed the source of the anomaly in the south-
western Karoo at a depth of between 5 and 15 km within the mid-crust.
A comprehensive magnetic modeling study by Quesnel et al. (2009) showed that two
wide, highly-magnetized sheet-like prisms (~80 km, > 5 A.m-1
) provide the best-fit for the
BMA. Tankard et al. (2009) used geological and geophysical data to attribute the BMA to
volcanic rift fill, while the SCCB is linked to upthrust mantle using teleseismic Moho depths.
Despite these comprehensive studies of the BMA, a more detailed investigation of
existing magnetic and gravity data over the anomaly is needed. In this study we present an
integrated analysis using these and other geophysical data to identify the source of the
ACC
EPTE
D M
ANU
SCR
IPT
ACCEPTED MANUSCRIPT
4
anomaly. We also investigate similar linear magnetic anomalies within the Natal belt, one of
which partly outcrops north of the Beattie on the east coast of South Africa. Newly
investigated links between geology and magnetic anomalies in this region are extended to the
source of the Beattie.
2. Geology of the Namaqua-Natal Metamorphic Belt and Cape Fold Belt
The source of the BMA is covered across its entire extent by younger sediments. To
the north of the anomaly Namaqua-Natal mobile belt (NNMB) basement rocks are exposed,
while to the south deformed Cape Supergroup rocks are exposed in the Cape Fold Belt
(CFB). As several previous geophysical studies have linked the anomaly to this mobile belt
(Corner, 1989; Thomas et al., 1992b; Weckmann et al., 2007b), we investigate the exposed
Natal portion of the belt on the east coast of South Africa.
The NNMB abuts the KVC and dates to the formation of Rodinia around 1 Ga
(Jacobs et al., 1993). This belt can be traced through the Falkland Plateau to Western
Dronning Maud Land in east Antarctica as these regions were joined during Gondwana times
(Frimmel, 2004; Grantham et al., 2001; Jacobs et al., 1997).
While commonly thought of as one continuous belt, several studies have highlighted
differences between the Natal and Namaqua belts. The Natal crust in the east has been
identified as entirely juvenile with isotope model ages younger than ~1.5 Ga (using Rb-Sr,
Sm-Nd and U-Pb dating; Eglington et al., 1989; Thomas and Eglington, 1990); while the
Namaqua crust in the northwest contains older fragments of crust (2.0-1.7 Ga, using U-Pb
and Sm-Nd dating; Raith et al., 2003; Robb et al., 1999) as well as juvenile fragments
identified using isotope dating (Cornell et al., 1986; Geringer et al., 1994). Isotopic analysis
of basement rocks from deep SOEKOR boreholes (KA1/66, KC1/70, QU1/65 and WE1/66 in
ACC
EPTE
D M
ANU
SCR
IPT
ACCEPTED MANUSCRIPT
5
Figure 1) was used to define a boundary between the Namaqua and Natal belts in the south-
western Karoo (Eglington, 2006; Eglington and Armstrong, 2003). Most importantly,
borehole QU1/65 contains basement rocks from both terranes and is therefore on the
boundary between the two belts. These data confirm the boundary previously suggested using
geophysical data (de Beer and Meyer, 1984; Thomas et al., 1992b).
The Natal belt developed as a result of oceanic-arc tectonics, with arc complexes
forming in a basin to the south and accreting onto the KVC to the north during basin closure
(Cornell et al., 2006) (Figure 2). The oceanic/island-arc of the Tugela terrane was emplaced
onto the craton boundary between 1155 and 1140 Ma, followed by the accretion of the
Mzumbe-Margate terranes between ~1091 and ~1070 Ma (age estimates vary slightly from
study to study) (McCourt et al., 2006). Subsequent crustal thickening resulted in regional
deformation fabrics and metamorphism. During the intrusion of the Oribi Gorge Suite (pulses
at 1070 and 1030 Ma), the regime of deformation changed from northward-vergent fold and
thrust tectonics, to ENE-trending sinistral shear (Eglington and Armstrong, 2003; Jacobs et
al., 1993), resulting in the formation of large shear zones. This change in the tectonic regime
was most likely due to continued northeast-southwest convergence along the approximately
east-west craton margin (Jacobs and Thomas, 1994).
These large-scale shear zones commonly define terrane boundaries. The Tugela
terrane at amphibolite and greenschist facies is separated by the ENE-trending Lilani-
Mabigulu shear zone from the upper amphibolite (and locally granulite) facies Mzumbe
terrane. The Melville thrust and associated shear zone (Lovat shear zone) in turn forms the
boundary to the Margate terrane in the south, which has been metamorphosed to granulite
facies (Jacobs et al., 1993; Thomas, 1989). An additional shear zone, the Vungu shear zone,
has most recently been mapped by Voordouw (2010) further south of the Melville thrust.
ACC
EPTE
D M
ANU
SCR
IPT
ACCEPTED MANUSCRIPT
6
Lithostratigraphic units making up the Mzumbe and Margate terranes include the
supracrustal gneisses of the Mapumulo and Mzimkulu groups respectively, as well as S-type
orthogneisses that are the oldest intrusives (SACS, 1980). Younger rocks within the Mzumbe
terrane include S-type granitoids and mafic intrusions (Equeefa Suite), and the more recent
A-type plutons of the Oribi Gorge Suite (McCourt et al., 2006).
The Mapumulo metamorphic rocks of the Mzumbe terrane are subdivided into the
Quha and Ndonyane Formations in the south, while rocks in the northern part of the terrane
are yet unclassified. There formations comprise heterogeneous layered gneisses
(supracrustals) and migmatites with a wide range of compositions (Thomas, 1992). These
deformed units originate mainly from sedimentary and volcanic/volcaniclastic rocks, and to a
less extent extruded and/or eroded products from juvenile volcanic arcs (Thomas et al.,
1992a; Thomas and Eglington, 1990). Several rocks within this terrane would be expected to
be highlight magnetic, such as prominent layers (~1 m) of fine-grained banded magnetite
quartzite, grunerite and garnet in the north of the Mzumbe terrane (Scogings et al., 1984).
Serpentinite and amphibolite are found closely associated with these supracrustals.
A study by Maré and Thomas (1998) on one of these Oribi plutons led to the proposal
that the strong magnetic signal associated with these plutons is due to the plutons themselves,
as well as remnants of the supracrustal Mapumulo suite gneisses beneath the pluton. More
specifically those from the Ndonyane formation displayed the largest measured magnetic
susceptibilities (0.2 to 22.8 x 10⁻³
SI) and a Königsberger ratio of ~4, i.e. significant remanent
magnetization. A range of palaeomagnetic results were collected for these supracrustal rocks
though a single virtual palaeomagnetic pole position could not be defined. Microscope
studies by Máre and Thomas (1998) show that magnetite is the dominant opagque phase in
the Ndonyane gneisses of the Mapumulo group, while within the Oribi Gorge suite ilmenite
dominates. Opagque mineral grains in the study range from 10 – 200 μm.
ACC
EPTE
D M
ANU
SCR
IPT
ACCEPTED MANUSCRIPT
7
Exposed older rocks exist within the Cape sediments south of the BMA (including the
Gamtoos, Kango and Kaaimans Groups; Söhnge and Hälbich, 1983). These rocks have been
used to support the ideal that the BMA forms part of a Pan African suture zone between the
NNMB and these Saldanian rocks below the CFB (de Beer et al., 1982; Hälbich, 1993;
Harvey et al., 2001; Pitts et al., 1992). More recent work, however, has suggested that these
metasediments form part of the precursor rift sequences of the Cape Supergroup (Barnett et
al., 1997). The question still therefore exists whether the NNMB continues below the Cape
Supergroup.
3. Previous Geophysical Studies
Recent geophysical studies in the western Cape have attempted to shed light on the
broader tectonic setting of the BMA, as well as the horizontal and vertical extents of the
source body. During Inkaba yeAfrica geophysical surveying in the western Cape, Weckmann
et al. (2007a; 2007b) identified anomalous MT zones associated with the BMA that are
attributed to a crustal-scale shear zone in the NNMB, with graphite mineralization similar to
those suggested by Thomas et al. (1992b). Weckmann et al. (2007a) also attributed the SCCB
to higher than expected conductivity levels within the NNMB. Initial suggestions of
serpentinized oceanic crust as the source of the SCCB (de Beer et al., 1982; de Beer and
Meyer, 1983; de Beer et al., 1974; Hälbich, 1993) can also be argued against as serpentinite
has been shown to be a poor electrical conductor (Airo and Loukola-Ruskeeniemi, 2004;
Kawano et al., 2012; Reynard et al., 2011). Studies have shown that it is high salinity fluids
moving through the serpentinite that increases its conductivity (e.g. serpentinite in the mantle
wedge above a subduction zone has a conductivity of 0.001 S/m, while with circulating saline
ACC
EPTE
D M
ANU
SCR
IPT
ACCEPTED MANUSCRIPT
8
fluids this value increases to 0.1–1 S/m (Reynard et al., 2011)). In addition, the SCCB
stretches from the east to the west coast of South Africa whereas the BMA does not.
From reflection seismic data, Lindeque et al. (2007) suggested that the BMA is a
strata bound massive sulphide-magnetite deposit flanked by smaller deposits with
overlapping metasomatic aureoles, with some of these deposits being conductive and
magnetic while others are one or the other. Several of these regions correlate with high
velocity zones on the refraction seismic data (Stankiewicz et al., 2007). Lindeque et al.
(2007) compared this deposit to the Bushmanland ore district within the Namaqua basement,
though the Bushmanland deposits are significantly smaller (<10 km extent) (Bailie et al.,
2007). Lindeque et al. (2011) also suggested that since no suture zone is visible on the
seismic data, the NNMB continues below the Cape sediments. However, near-vertical
features are not easily visible on seismic data. Anomalous geophysical regions are correlated
across datasets in the modelling section of this study. Similar parabolic reflectors are seen on
some of the historic SOEKOR seismic profiles collected in the 1970s (Fatti, 1970).
Basic potential field modeling of the anomaly by Pitts et al. (1992) showed the BMA
as a 30 km wide south dipping slab. This model could not, however, clearly resolve whether
serpentinized crust or another rock type is the cause of the anomaly. Similarly, basic
magnetic modeling by Weckmann et al. (2007a) defined the BMA source as 100 to 150 km
wide (with a minimum width of 50 km if remanence is included). This body correlates with
mid-crustal zones of high resistivity on the MT data and regions of high seismic velocity
(Stankiewicz et al., 2007), while the high conductivity anomaly is modeled as a fault or shear
zone within this magnetic body.
The two wide highly-magnetized sheet-like prisms identified as the source geometry
by Quesnel et al. (2009) were modelled at depths of 9-12 km and 13-18 km, one of which
coincides with a high velocity region. Quesnel et al. (2009) proposed that these prisms
ACC
EPTE
D M
ANU
SCR
IPT
ACCEPTED MANUSCRIPT
9
represent granulite-facies mid-crustal rocks within the NNMB.. These models are a good
starting point; however, predefined geometrical shapes used during modelling seldom reflect
geology and therefore will be expanded on in this study.
Tankard et al. (2009) suggestion that the SCCB can be attributed to upthrust mantle
can be argued against as the teleseismic data are interpolated to draw this conclusion, and no
evidence for upthrusting is seen on the refraction seismic images from Stankiewicz et al.
(2008).
In this study we use these geological observations, as well as magnetic filtering and
potential field modelling constrained by these seismic and MT data, to better understand
which of these anomaly sources are more feasible.
4. Data
4.1 Regional
Datasets used to investigate the BMA in this study include the regional free air
anomaly data (Venter et al., 1999) as well as regional aeromagnetic data (Stettler et al., 1999)
(Figure 3). The magnetic data (Figure 3a) were collected by the Council for Geoscience from
the 1980s to late 1990s, flown at a line spacing of 1 km and sample spacing of around 60 m.
The flight height for the survey was between 100-150 m. Poor magnetic data in the south
over the Cape Fold Mountains due to variable flight heights make interpretation of these data
difficult. The final aeromagnetic anomaly has been calculated with respect to the normal
Earth magnetic field (Intensity: 28 500 nT, Declination: -23˚, Inclination: -66˚).
The gravity data were collected with a station spacing of approximately 14 km. The
free-air gravity anomaly map is shown in Figure 3b. The ETOPO1 topographic model with a
resolution of 1 arc-min (Amante and Eakins, 2009) was used for calculation of the Bouguer
anomaly (BA, Figure 3c). The density used for the Bouguer correction is 2670 kg/m3. The
ACC
EPTE
D M
ANU
SCR
IPT
ACCEPTED MANUSCRIPT
10
terrain corrected gravity data released by the CGS was not used, as several of the elevation
measurements were made using barometers which can introduce an error of 2 – 5 mGal
(Leaman, 1984). In addition, the vertical uncertainty of the ETOPO1 data is 10 m therefore
making it insufficient to recalculate the terrain correction. The isostatic anomaly map is
calculated assuming an elastic thickness of 5 km, reference depth of 35 km and density
contrast of 400 kg/m between the crust and the mantle (Figure 3d).
4.2 Petrophysical studies
Petrophysical data are necessary for constructing realistic potential field models over
the BMA, and are drawn from the Natal mobile belt. Field observations reveal the rapid
change in rock types and magnetic susceptibilities over small distances within this highly
sheared Natal terrane. For example, magnetic susceptibility measurements made close to the
boundary between the Mapumulo metamorphic rocks and Margate Granite Suite showed a
change from granite (3 x 10⁻³
SI), to gneiss (6 x 10⁻³
SI), to migmatite (12 x 10-3
SI), and back
to the gneiss and granite (9 and 2 x 10⁻³
SI respectively) over a distance of ~0.5 m. Less than
100 m further west a magnetic susceptibility measurement of less than 1 x 10⁻³
SI was
obtained for a similar gneiss. Thin section analysis confirmed that the dominant opaque
mineral is magnetite, with samples containing between 1 and 3% opaque minerals.
Magnetic susceptibility data from the CGS Petrophysical Properties Atlas (Maré,
2012) help identify which rock types are associated with magnetic anomalies in this region.
Data for the Mzumbe terrane and associated rock types are shown in Figure 4 and for the
Margate terrane in Figure 5. For the supracrustal rocks in the Mzumbe terrane, a large
number of samples have magnetic susceptibilities > 10 x 10-3
SI, with the highest value
recorded for a gneiss (62 x 10-3
SI). Several serpentinite and amphibolite samples are closely
associated with the Mzumbe supracrustal rocks, with two samples displaying high
ACC
EPTE
D M
ANU
SCR
IPT
ACCEPTED MANUSCRIPT
11
susceptibilities (41 and 45 x 10-3
SI respectively). For the Mzumbe orthogneiss suites the
highest magnetic susceptibilities are for gneisses, which are an order of magnitude smaller
than several of the supracrustal samples (< 10 x 10-3
SI). For the Mzumbe mafics and
younger granitoids (S-type) the magnitudes are similar to those for the orthogneisses, except
for a granite sample that is an order of magnitude larger (55 x 10-3
SI) and several monzonites
and syenites samples (10 - 25 x 10-3
SI). These high susceptibility samples form part of the
Sezela Suite that is concentrated just inland from the town of Pennington on the east coast.
Within the Margate terrane, magnetic susceptibility values for supracrustal rocks are
lower than for the Mzumbe terrane, though there are fewer samples most likely due to a lack
of exposure. The highest magnetic susceptibility for the supracrustal rocks is for a basalt
sample (12 x 10-3
SI), while the remainder of samples (gneiss and granulite) display magnetic
susceptibility values of < 2 x 10⁻³
SI. For the Margate orthogneiss suite, amphibolite, gneiss,
granite and granulite samples have magnetic susceptibilities < 10 x 10-3
SI, while two diorite
and serpentine samples have magnetic susceptibility values > 50 x 10-3
SI. The younger Oribi
Gorger Pluton (A-type) samples show magnetic susceptibilities of < 15 x 10-3
SI, with one
granite with a high magnetic susceptibility (83 x 10-3
SI).
Magnetic susceptibility measurements in Figure 4 and Figure 5 show a broad range of
magnetic rocks within these terranes, though the supracrustal rocks of the Mzumbe terrane
show consistently higher values distributed over a larger area. To confirm whether these
supracrustals (and associated migmatites) are the source of the magnetic linear anomalies
north of the BMA, it is necessary to investigate the distribution of the lithologies relative to
the anomalies. This analysis focuses on the Mzumbe terrane as the Margate terrane has
limited exposure.

ACC
EPTE
D M
ANU
SCR
IPT
ACCEPTED MANUSCRIPT
12
5. Magnetic Field Analysis and Forward Modelling
To gain a broader tectonic understanding of these magnetic linear anomalies
identified by Thomas et al. (1992b), we investigate the high-pass (HP) filtered map for South
Africa. We test a range of cut-off wavelengths for this filter (25, 50, 70, 100 and 125 km) to
isolate short, long and intermediate wavelength patterns. Additional filters are applied to the
magnetic data on the east coast of South Africa to further understand the depth of the source
associated with these anomalies. High-pass filtered data is used to highlight shallower
magnetic features, while low-pass (LP) filtered data highlights regional structures at mid-
crustal levels. The tilt derivative (TDR) map highlights the orientation of the linear tectonic
fabric of the basement as the TDR is positive over a source and negative elsewhere (Miller
and Singh, 1994; Verduzco et al., 2004). The pseudogravity, which is calculated from the
magnetic data, allows for comparison with the BA map. Similarities between the two would
imply common deeper sources for the anomalies (Baranov, 1957). The magnetic signal over
the BMA at its shallowest on the east coast was also investigated to shed light on the nature
of the source.
In addition, we carried out 2D modelling of potential field data using GM-SYS
(Geosoft Oasis Montaj). Gravity and magnetic model responses were calculated using the
methods of Talwani et al. (1959) and Talwani and Heirtzler (1964), and using the algorithms
described by Won and Bevis (1987). Models were created along the two approximately
north-south Inkaba yeAfrica profiles in the south-western Cape shown in Figure 3a. During
modelling free-air anomalies were modelled using an accurate terrain model.
ACC
EPTE
D M
ANU
SCR
IPT
ACCEPTED MANUSCRIPT
13
6. Results
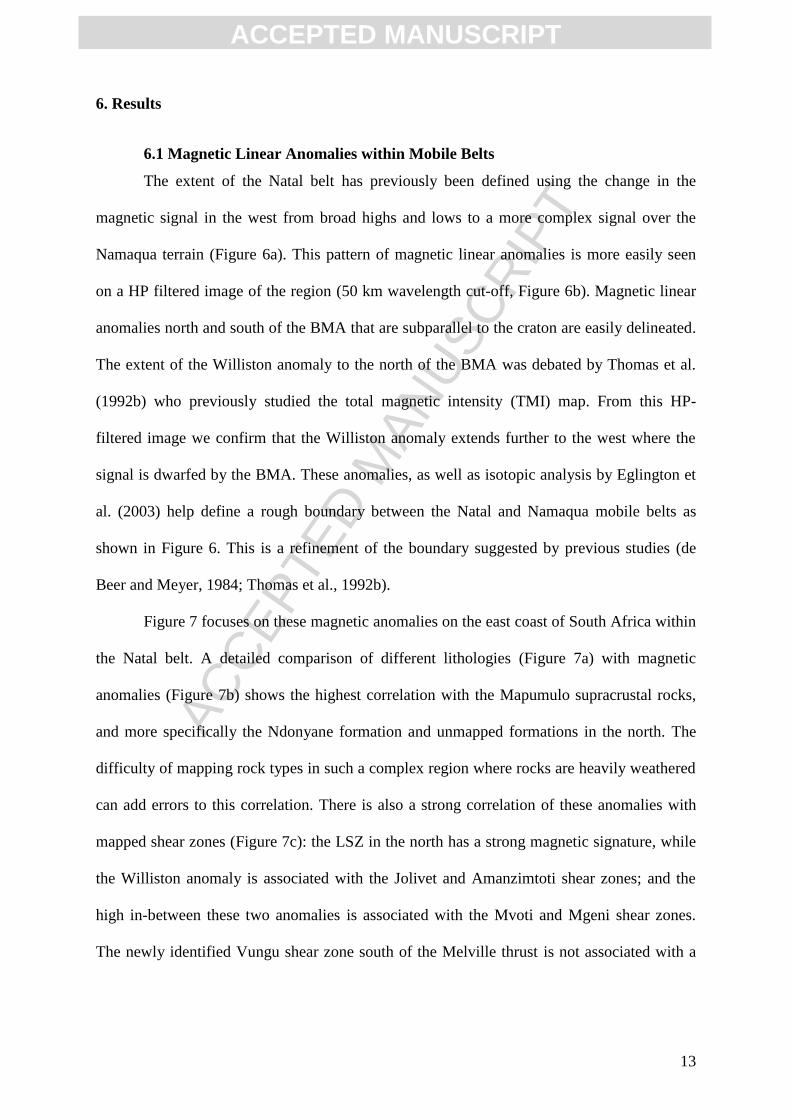
6.1 Magnetic Linear Anomalies within Mobile Belts
The extent of the Natal belt has previously been defined using the change in the
magnetic signal in the west from broad highs and lows to a more complex signal over the
Namaqua terrain (Figure 6a). This pattern of magnetic linear anomalies is more easily seen
on a HP filtered image of the region (50 km wavelength cut-off, Figure 6b). Magnetic linear
anomalies north and south of the BMA that are subparallel to the craton are easily delineated.
The extent of the Williston anomaly to the north of the BMA was debated by Thomas et al.
(1992b) who previously studied the total magnetic intensity (TMI) map. From this HP-
filtered image we confirm that the Williston anomaly extends further to the west where the
signal is dwarfed by the BMA. These anomalies, as well as isotopic analysis by Eglington et
al. (2003) help define a rough boundary between the Natal and Namaqua mobile belts as
shown in Figure 6. This is a refinement of the boundary suggested by previous studies (de
Beer and Meyer, 1984; Thomas et al., 1992b).
Figure 7 focuses on these magnetic anomalies on the east coast of South Africa within
the Natal belt. A detailed comparison of different lithologies (Figure 7a) with magnetic
anomalies (Figure 7b) shows the highest correlation with the Mapumulo supracrustal rocks,
and more specifically the Ndonyane formation and unmapped formations in the north. The
difficulty of mapping rock types in such a complex region where rocks are heavily weathered
can add errors to this correlation. There is also a strong correlation of these anomalies with
mapped shear zones (Figure 7c): the LSZ in the north has a strong magnetic signature, while
the Williston anomaly is associated with the Jolivet and Amanzimtoti shear zones; and the
high in-between these two anomalies is associated with the Mvoti and Mgeni shear zones.
The newly identified Vungu shear zone south of the Melville thrust is not associated with a
ACC
EPTE
D M
ANU
SCR
IPT
ACCEPTED MANUSCRIPT
14
strong anomaly. It is evident that strong anomalies are also associated with the Oribi Gorge
plutons, though these anomalies are more circular in nature.
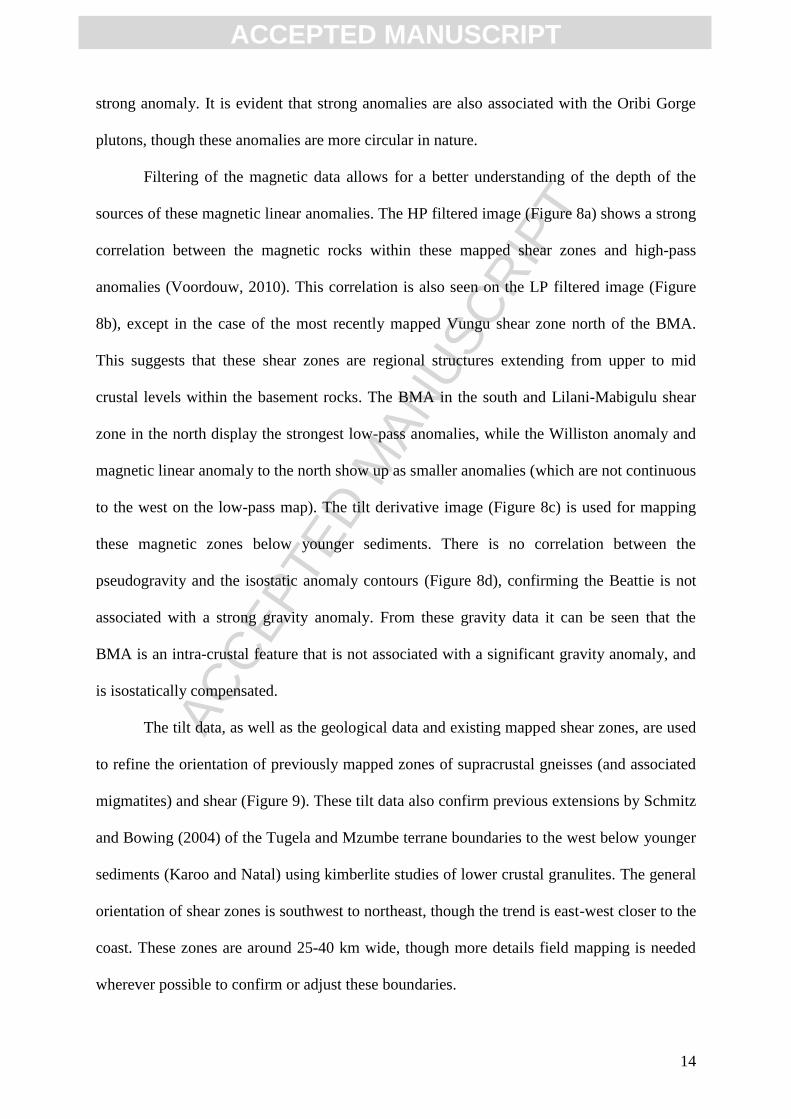
Filtering of the magnetic data allows for a better understanding of the depth of the
sources of these magnetic linear anomalies. The HP filtered image (Figure 8a) shows a strong
correlation between the magnetic rocks within these mapped shear zones and high-pass
anomalies (Voordouw, 2010). This correlation is also seen on the LP filtered image (Figure
8b), except in the case of the most recently mapped Vungu shear zone north of the BMA.
This suggests that these shear zones are regional structures extending from upper to mid
crustal levels within the basement rocks. The BMA in the south and Lilani-Mabigulu shear
zone in the north display the strongest low-pass anomalies, while the Williston anomaly and
magnetic linear anomaly to the north show up as smaller anomalies (which are not continuous
to the west on the low-pass map). The tilt derivative image (Figure 8c) is used for mapping
these magnetic zones below younger sediments. There is no correlation between the
pseudogravity and the isostatic anomaly contours (Figure 8d), confirming the Beattie is not
associated with a strong gravity anomaly. From these gravity data it can be seen that the
BMA is an intra-crustal feature that is not associated with a significant gravity anomaly, and
is isostatically compensated.
The tilt data, as well as the geological data and existing mapped shear zones, are used
to refine the orientation of previously mapped zones of supracrustal gneisses (and associated
migmatites) and shear (Figure 9). These tilt data also confirm previous extensions by Schmitz
and Bowing (2004) of the Tugela and Mzumbe terrane boundaries to the west below younger
sediments (Karoo and Natal) using kimberlite studies of lower crustal granulites. The general
orientation of shear zones is southwest to northeast, though the trend is east-west closer to the
coast. These zones are around 25-40 km wide, though more details field mapping is needed
wherever possible to confirm or adjust these boundaries.
ACC
EPTE
D M
ANU
SCR
IPT
ACCEPTED MANUSCRIPT
15
These magnetic linear anomalies allow us to conclude that the BMA has a similar
source as the Williston anomaly, namely Natal supracrustal rocks which form part of thrust
sheets later cut by shear zones. This complex nature of the BMA is supported by
aeromagnetic data on the east coast where the source is at its shallowest (Figure 10). Instead
of a smooth broad signal as seen in the south-western Karoo, in the east the broad high of the
BMA is more complex. Shorter wavelength anomalies in this region represent younger Karoo
dolerite dykes (< 2000 m).
6.2 Forward modelling
2D potential field models were created over the BMA in the south-western and south-
central Karoo to investigate whether the Natal mobile belt magnetic source geometry can be
reconciled with the geophysical data, and to better constrain the petrophysical properties of
the source.
The western profile was constrained using offshore seismic data from Parsiegla et al.
(2007) and onshore refraction data from Stankiewicz et al. (2008; 2007). These data were
reprocessed into a single velocity model by Stankiewicz et al. (2008) focusing on deeper
structures. Reflection seismic data from Lindeque et al. (2011) and magnetotelluric data from
Weckmann et al. (2007b) were also used. The existence of a high velocity zone in the lower
crust was determined from seismic data (Lindeque et al., 2007; Stankiewicz et al., 2008), and
was therefore inferred for the central profile. The shallower lithologies were constrained
using borehole data (Rowsell and De Swardt, 1976).
The central profile is less constrained with an offshore seismic data from Parsiegla et
al. (2008) and onshore refraction data from Stankiewicz et al. (2007), and magnetotelluric
data from Weckmann et al. (2007b). We do not model a profile over the eastern extent of the
BMA due to limited deep boreholes and a complete lack of seismic data. Previous potential
ACC
EPTE
D M
ANU
SCR
IPT
ACCEPTED MANUSCRIPT
16
field models over these two profiles were exclusively constrained using seismic data without
including the connection to the Natal belt (Scheiber-Enslin et al., 2012). Teleseismic data
collected during the Southern Africa Broadband Seismic Experiment were used to constrain
the Moho depths in both models (Harvey et al., 2001; Nguuri et al., 2001).
The density and magnetic susceptibility values used during modelling are shown in
Table 1. Density values are based on borehole (Rowsell and De Swardt, 1976) and hand
sample data from the CGS Physical Properties Atlas (Maré, 2012), as well as p-wave seismic
velocity to density conversion curves (Christensen and Mooney, 1995). Magnetic
susceptibility values are based on recent field investigations of the Williston anomaly, as well
as the physical properties atlas. Maré and Thomas (1998) showed that more comprehensive
studies are needed to better understand the complex remanent magnetization of the Natal
supracrustal rocks, therefore here we include only simplistic models with induced
magnetization.
Figure 11 shows the modelled western profile where the BMA appears to split. Due to
geological observation from the Natal terrane we model these high amplitude magnetic linear
anomalies as thrust sheets, i.e. near vertical slabs of highly magnetic supracrustal rock
separated by slabs with lower magnetic susceptibilities that represent either weakly-magnetic
supracrustal rocks or later weakly-magnetic intrusives. The dip of these sheets to the south is
assumed from the direction of movement during formation of the Natal belt, i.e. overlap onto
the craton in the north, and the dip of high conductivity anomalies from MT data (Weckmann
et al., 2007b). This direction is opposite to that determined from reflection seismic data
(Lindeque et al., 2011). The density and magnetic susceptibility values for these anomalous
bodies are slightly higher than the surrounding middle crust, with bodies deepening towards
the south.
ACC
EPTE
D M
ANU
SCR
IPT
ACCEPTED MANUSCRIPT
17
A HP-filtered TMI image is shown in (a) with magnetic linear anomalies from Figure
6 marked. Magnetic and gravity models for this profile are shown in (b) and (c) respectively.
These magnetic data are correlated with seismic and MT data over the profile. It can be see
that the magnetic linear anomalies correlate with zones of complex reflectivity identified on
reflection seismic data in (d), and anomalous zones on the seismic refraction and MT data (e-
f). This supports the idea of a similar source for the individual bodies. In (e) the linear
anomalies correlate with high velocity zones (as would be expected from velocity to density
conversion curves), except for the shallowest body associated with the Williston anomaly. In
(f) the Williston anomaly correlates with alternating high-low conductivity synform
structures, and the BMA correlates with a steeply dipping high conductivity zone flanked by
resistive zones. Weckmann et al. (2007a) and Quesnel et al. (2009) assume during magnetic
modelling that the high resistivity regions identified on MT data are the source of the BMA,
separated by a shear zone or fault. In our model the bodies are closely associated with the
highly resistive regions, though the region of high conductivity does overlap with a high
magnetic susceptibility body.
The depths of these bodies range from 5 to 15 km for the Williston anomaly, 7.5 to 16
km for the BMA and 15 – 25 km for the Mbashe anomaly. Accurate magnetic modelling of
the Williston anomaly is not possible unless the magnetic terrane further to the north is taken
into account, which is attempted here. More detailed studies of this northern terrane
(Namaqua) are, however, needed.
The free-air gravity anomaly follows the terrain (Figure 11c). A low-amplitude
gravity high is measured over the BMA, though densities used during modelling do not differ
significantly from the surrounding mid-crust. The modelled density values for the BMA and
other bodies are affected by the modelling of the shallower, less dense layers. These
shallower layers are defined using refraction seismic data (Stankiewicz et al., 2008;
ACC
EPTE
D M
ANU
SCR
IPT
ACCEPTED MANUSCRIPT
18
Stankiewicz et al., 2007) and therefore are not exact, which in turn will affect the accuracy of
the density model.
These models largely follow the velocity layers of the seismic refraction data, giving
the appearance of a layered model without much depth variation in the middle crust (~5-10
km). This is a simplified model compared to the reflection seismic data, which shows a more
complicated middle and lower crustal structure with different overlapping terranes.
Potential field models along the central Inkaba profile are shown in Figure 12. HP-
filtered magnetic linear anomalies are shown in (a), while magnetic and gravity models for
this profile are shown in (b) and (c) respectively. The correlation of these magnetic linear
anomalies with high-velocity zones is evident on the refraction seismic profile in (d), except
in the case of the Mbashe anomaly in the south. The magnetic signal, however, cannot be
properly modeled without including a body at depth below the Mbashe anomaly. This
refraction seismic profile images shallower depths compared to the western profile, limiting
deeper modelling. The BMA also correlates with a high conductivity zone that stretches
down to ~ 25 km on MT data along a shorter central profile that is not shown here
(Weckmann et al., 2007a). Separate thrust sheets associated with supracrustal rocks, similar
to the western profile, are modelled in the mid-crust and constrained by the magnetic linear
anomalies and anomalous seismic zones. The source of the BMA along this profile is more
limited in width compared to the western profile.
Similar to the western profile, the main gravity feature along this central profile (c) is
due to terrain. Again only a slight gravity high is measured over the BMA. An anomalous
low density body is needed in the upper crust below the CFB to model the gravity data south
of the Cape Isostatic anomaly (Hales and Gough, 1960). This model, however, is non-unique
and bodies in the lower crust or upper mantle below this region could also produce the
observed gravity anomaly.
ACC
EPTE
D M
ANU
SCR
IPT
ACCEPTED MANUSCRIPT
19
In the 2D magnetic models shown in Figure 11 and Figure 12 we model the zones of
complex seismic reflectivity that correlate with the magnetic linear anomalies as 20 - 60 km
wide bodies. Previous magnetic models over the BMA have included 30 to 150 km wide
bodies, with vertical extents of ~5 km down to 30 km (controlled by Curie temperature, de
Beer et al., 1982; Pitts et al., 1992; Weckmann et al., 2007a). The depth extent of the bodies
in this study is approximately 10 - 15 km as determined from seismic data, starting at a depth
of ~5 km in the north and deepening to the south. MT data along the central profile, however,
suggest the conductive body linked to the BMA could continue down to around 25 km
(Weckmann et al., 2007a). The deepening of the bodies to the south is similar to what is seen
on the east coast, with the Mzumbe terrane outcropping, while the southern part of the
Margate terrane is not exposed. In addition, further south of the Margate terrane (close to
East London) borehole SP1/69 does not intersect basement even though it extends to a depth
of ~4.5 km (Rowsell and De Swardt, 1976).
The 20 - 60 km wide bodies modelled here are sometimes made up of several sheets
with variable physical property values that are higher than the surrounding crust. Modelled
density and magnetic susceptibility values (2840 – 2900 kg/m3, 10-100 x 10
-3 SI) are similar
to those used in previous models (2870 - 2900 kg/cm3, 50-90 x 10-3 SI; de Beer et al., 1982;
Pitts et al., 1992; Weckmann et al., 2007a), though magnetic susceptibility values are higher
than those measured in the field for supracrustal rocks of the Mzumbe terrane (10-60 x 10-3
SI).
7. Discussion
In this study we show that although the magnitude of the BMA is significant (~400
nT), the anomaly itself is not unique as was previously thought. It forms part of a group of
magnetic linear anomalies which define the extent of the Natal basement. This link is further
ACC
EPTE
D M
ANU
SCR
IPT
ACCEPTED MANUSCRIPT
20
confirmed by similar anomalous zones on other geophysical datasets (seismic and MT). Our
study therefore does not support the proposal by de Beer et al. (1982), de Beer and Meyer
(1983) and Hälbich (1993) that the BMA is a suture zone, as the Mbashe anomaly is visible
south of the BMA.
Due to this link, conclusions can be drawn regarding the source of the BMA from
geological observations linked to the Williston anomaly. These anomalies’ elongate magnetic
signature is therefore linked to the original thrust terranes and supracrustal rocks making up
the belt that extend down to mid-crustal depths, as well as the associated shear zones. The
difference in magnitude of the anomalies does, however, suggest that rocks within each linear
anomaly have different magnetic properties.
It appears that shear zones have preferentially formed in these supracrustal regions,
resulting in the elongate nature of the rocks and magnetic signals. This is an extension of the
source models proposed by Thomas et al. (1992b) and Corner (1989), and previously
supported by Weckmann et al. (2007a; 2007b). It appears that the shear zones marking the
edge of terranes (e.g., Lilani-Mabigulu shear zone) have stronger low-pass filter anomalies
and therefore large crustal extents, while those occurring within terranes have weaker low-
pass anomalies. Using these observations the BMA would be expected to represent a terrane
boundary. Due to poor magnetic data over the Mbashe anomaly no conclusions can be drawn.
In the east and west it appears as if the BMA splits, which we would attribute to
truncation of two thrust terranes with the middle section of the terranes merged or one
removed. From the two seismic reflection profiles (Stankiewicz et al., 2007) it is evident that
the BMA does not shallow significantly over the western ~800 km portion, but shallows
rapidly towards the east (~100 to 150 km from the coast). It is unclear why this is the case
and could be linked to the breakup of Gondwanaland.
ACC
EPTE
D M
ANU
SCR
IPT
ACCEPTED MANUSCRIPT
21
In a global sense, these magnetic signatures allow us to better understand how
Proterozoic mobile belts amalgamated, in some cases as continuous terranes over ~ 1000 km.
This characteristic magnetic signal could also allow for identification of mobile belts that are
not yet exposed. This principal could not, however, be applied to the more complicated
Namaqua belt as it is made up of several smaller terranes of varying ages (Cornell et al.,
1986; Geringer et al., 1994; Raith et al., 2003; Robb et al., 1999).
The 2D models produced in this study show that thrust sheet geometries for the BMA,
Williston and Mbashe anomalies fit the potential field data. The complex nature of the
magnetic signal over the BMA on the east coast support this idea as the signal appears to be
made up of several overlapping narrow magnetic anomalies. It must be noted, however, that
without addition constrains this model is non-unique. Magnetic susceptibility values are on
the higher-end of those measured in the field for (weathered) supracrustal rocks, and could be
due to the lack of remanent magnetisation included in the model. High Königsberger ratios
determined Máre and Thomas (1998) suggest remanent magnetisation cannot be excluded
and needs to be studied in more detail for better constraints. The modelled density values are
in line with those expected for supracrustal rocks, and correlate with higher seismic velocities
calculated using velocity-to-density curves (Christensen and Mooney, 1995). High
resistivities are expected for the igneous/metamorphic rocks making up the Natal basement
not cut by shear zones.
There is, however, no clear correlation between zones of complex reflectivity
identified on reflection seismic data and zones of high conductivity on MT data. This is
explained by geological field observations within sheared regions in the Natal mobile belt.
These regions are made up of a complex array of elongate geological units and zones of
intense shear that can change over less than a kilometre and are not easily delimited. We
therefore assume that the entire zone would be characterised by complex reflectivity patterns
ACC
EPTE
D M
ANU
SCR
IPT
ACCEPTED MANUSCRIPT
22
(Wall et al., 2009; Welford and Clowes, 2006), and that only larger shear zones would be
resolvable as a high conductivity anomalies on the MT data. For the Williston anomaly it
appears that the zones of complex reflectivity do correlate with conductive zones, which we
assume to be shear zones within the amphibolite facies Mzumbe terrane. For the BMA the
zones of complex reflectivity correlate broadly with resistive regions, which we assume to be
the boundary between the Margate granulite terrane and a terrane further to the south, cut by
a conductive shear zone. An even better correlation with MT and refraction seismic data may
also be possible with the introduction of remanent magnetisation to the model.
Despite the fact that the strongest of these magnetic linear anomalies (BMA) is
assumed to be closely associated with the granulite facies of the Margate terrane, there
appears to be no direct correlation between metamorphic grade and the strength of the
magnetic anomalies. This conclusion is drawn as the granulite facies rocks within the
Margate terrane do not display particularly high magnetic susceptibilities (Figure 5a).
However, this could be due to limited exposure of the Margate terrane. In addition, as can be
seen in the Mzumbe terrane, only certain supracrustals (and associated migmatites) display
high magnetic susceptibilities (Figure 4a).
A different picture is pained for granulite facies rocks in Antarctic at the proposed
continuation of the BMA (Jacobs et al., 2004). Gondwana reconstructions link the NNMB in
South Africa to a orogenic belt stretching from western (WDML) to central Dronning Maud
Land (CDML) in the Antarctic (Gose et al., 1997; Jacobs et al., 1998), with the Falklands
Island fragment fitted between the two regions. Terranes within WDML and CDML, namely
Mannefallknausane, Heimefrontfjella, Kirwanveggen and HU Sverdripfjella are associated
with broad elongated magnetic highs and lows (Figure 13) that have been linked through
limited outcrops to the ~1.1 Ga orogenic basement (Jacobs et al., 1996). These terranes
ACC
EPTE
D M
ANU
SCR
IPT
ACCEPTED MANUSCRIPT
23
consist of supracrustal gneisses of volcanic and sedimentary origin that have been intruded
mainly by granitoids (Jacobs et al., 1996).
Jacobs et al. (1996) links the Vardeklettane and Mannefallknausane rocks within the
Heimefrontfjella terrane to the Margate terrane using geological, geochemical, age and
magnetic similarities. Magnetic susceptibility measurements made on a handful of granulite
rocks from this terrane range from ~10 - 50 x 10-3
SI, significantly higher than for granulites
in the Margate terrane (Jacobs et al., 2004). Thus the granulites in the Margate terrane could
be the cause of the large amplitude of the BMA.
Another explanation for the large signal of the BMA was put forward by Quesnel et
al. (2009), i.e., exsolved hematite-ilmenite within the granulite-facies mid-crustal rocks of the
NNMB. These lamellae can result in high natural remanent magnetization (up to 30 A/m,
McEnroe et al., 2001; McEnroe et al., 2002; McEnroe et al., 2009; Robinson et al., 2002).
Martelat et al. (2014) suggest a similar source for magnetic anomalies associated with a
granulitic metamorphic belt with a complex Proterozoic shear zone network in southern
Madagascar. In these belts, metamorphic reactions have resulted in the breakdown of biotite
to orthopyroxene and iron-rich oxides. These oxides are shown to have exsolved iron-rich
oxide intergrowths on cooling (e.g., magnetite and ilmenite) resulting in strong lamellar
magnetism.
Thin section analysis of several supracrustal samples collected in the region of the
Williston anomaly during this study show similar lamellae, and therefore provide support for
the proposal by Quesnel et al. (2009). Samples contain 1-3% opaque minerals (approximately
70% magnetite and 30% ilmenite), with ilmentite lamellae in magnetite grains. Other
reactions within the belt could also have contributed to the production of magnetite, and
therefore a comprehensive sampling study in the region would be needed to confirm these
observations.
ACC
EPTE
D M
ANU
SCR
IPT
ACCEPTED MANUSCRIPT
24
World-wide other large magnetic anomalies similar to the Beattie, e.g., along the
Cascadia convergent margin in North America, have been explained by Blakely et al. (2005)
as being linked to a serpentinized mantle wedge. This magnetic anomaly is also associated
with a. This lower crustal body is associated with a long wavelength magnetic anomaly and
weak gravity anomaly (<20 mGal, Blakely et al., 2005), and a low velocity anomaly
compared to the surrounding mantle (Carlson and Miller, 2003). The fact that the BMA
source is a mid-crustal feature makes it unlikely, however, to be a serpentinized mantle
wedge. The wedge could have somehow been brought to shallower levels during terrain
formation, though it is unlikely it would have remained intact as a large crustal block (~20
km in width according to reflection seismic estimates, Lindeque et al. (2011)) considering the
deformation of other supracrustal rocks. However, serpentinization is a complicated
processes and dependant on pressure and temperature conditions and water content
(Hyndman and Peacock, 2003), and cannot be ruled out without sampling of the BMA
source. MT data show highly resistive zones (500 – 1000 ohm.m, i.e. 0.001 – 0.05 S/m) that
appear to correlate with the Beattie (Weckmann et al., 2007a; Weckmann et al., 2007b).
These values are in line with those determined for a serpentinized mantle wedge above a
subduction zone (0.001 S/m, Reynard et al., 2011) though are at shallower depths (5 – 15
km).
The question regarding the source of the anomaly can only be solved by drilling the
anomaly at its shallowest point on the east coast. Attempts have been made in the past to drill
the BMA just south of Mkambati reserve (Figure 10), but due to the drill rig scheduling
conflicts was not successful. Care would need to be taken during drilling as this study has
shown that the anomaly is made up of zones of high magnetic susceptibility instead of one
large body. A high resolution ground magnetic profile and/or airborne survey should be
completed over the anomaly before an ideal drilling location can be determined.
ACC
EPTE
D M
ANU
SCR
IPT
ACCEPTED MANUSCRIPT
25
8. Conclusions
We have developed a new model for the BMA that combines geological,
petrophysical and potential field data, along with seismic and MT data and existing models.
The final model contributes to our understanding of the formation of mobile belts similar to
the Natal belt.
Filtering of aeromagnetic data allow us to investigate the regional tectonic fabric
within the NNMB. These data suggest that the BMA forms part of a group of magnetic linear
anomalies visible along the east coast of South Africa, including the Williston anomaly to the
north and Mbashe anomaly to the south. These linear anomalies together form the Natal belt,
and allow the boundary of the belt to be easily delineated in the west.
Investigation of Natal basement rocks associated with the Williston anomaly reveal a
complex ENE-oriented sheared zones of predominantly high magnetic susceptibility
supracrustal rocks.
Potential field modelling confirms that a similar geological setting can account for the
source of the BMA. Our model allows us to refine the basement architecture and constrain
density and magnetic susceptibility distributions for these anomalous zones.
The significant amplitude of the BMA is attributed to high magnetic susceptibility
granulite supracrustals of the Margate terrane, which are cut by conductive shear zones and
mark the southern boundary of this Natal terrane.
A previous study in the region highlights the complex remanent magnetization of
these Natal basement rocks. A more detailed study is needed to better constrain this
magnetism, therefore allowing for more accurate modelling.
ACC
EPTE
D M
ANU
SCR
IPT
ACCEPTED MANUSCRIPT
26
Though no clear geological evidence exists for the BMA source, this study has shown
that several other hypotheses can be ruled out as they only explain parts of the available
geophysical data.
9. Acknowledgements
This project was funded by the National Research Foundation (NRF), Council for Geoscience
(CGS), University of the Witwatersrand and the Society of Exploration Geophysicists (SEG),
with software support from Geosoft. Field work was made possible by Greg Botha and the
Pietermartizburg CGS office. We thank Ute Weckmann, Jacek Stankiewicz, Bob Thomas,
Johan de Beer, Reinie Meyer, Branco Corner, Bruce Eglington and Lew Ashwal for sharing
their knowledge on the topic. The authors are grateful to Eric Ferré and Edgar Stettler for
improving this manuscript through the review process.
10. References
Airo, M.L., Loukola-Ruskeeniemi, K., 2004. Characterization of sulfide deposits by airborne magnetic and gamma-ray responses in eastern Finland. Ore Geology Reviews 24, 67-84. Amante, C., Eakins, B.W., 2009. ETOPO1 1 arc-minute global relief model: procedures, data sources and analysis, NOAA Technical Memorandum NESDIS NGDC-24, p. 19. Bailie, R., Armstrong, R., Reid, D., 2007. The Bushmanland Group supracrustal succession, Aggeneys, Bushmanland, South Africa: Provenance, age of deposition and metamorphism. South African Journal of Geology 110, 59-86. Baranov, V., 1957. A new method for interpretation of aeromagnetics maps: pseudogravimetric anomalies. Geophysics 29, 359-383. Barnett, W., Armstrong, R., Wit, M.d., 1997. Stratigraphy of the upper Neoproterozoic Kango and lower Paleozoic Table Mountain Group of the Cape Fold Belt revisited. South African Journal of Geology 100, 237– 250. Beattie, J., 1909. Report of the Magnetic Survey of South Africa. Cambridge Univ. Press, New York. Blakely, R., Brocher, T.M., Wells, R.E., 2005. Subduction-zone magnetic anomalies and implications for hydrated forearc mantle. Geology 33, 445-448. Carlson, R.L., Miller, D.J., 2003. Mantle wedge water contents estimated from seismic velocities in partially serpentinized peridotites. Geophysical Research Letters 30, 1250. Christensen, N.I., Mooney, W.D., 1995. Seismic velocity structure and composition of the continental crust: a global view. Journal of Geophysical Research 100, 9761-9788. Cornell, D.H., Hawkesworth, C.J., van Calstersen, P., Scott, W.D., 1986. Sm–Nd study of Precambrian crustal development in the Prieska-Copperton region, Cape Province. Transactions Geological Society of South Africa 89, 17–28.
ACC
EPTE
D M
ANU
SCR
IPT
ACCEPTED MANUSCRIPT
27
Cornell, D.H., Thomas, R.J., Moen, H.F.G., Reid, D.L., Moore, J.M., Gibson, R.L., 2006. The Namaqua-Natal Province, in: Johnson, M.R., Anhaeusser, C.R., Thomas, R.J. (Eds.), The Geology of South Africa. Geological Society of South Africa and Council for Geoscience, pp. 325-279. Corner, B., 1989. The Beattie anomaly and its significance for crustal evolution within the Gondwana framework, Extended Abstracts, South African Geophysical Association, First Technical Meeting, pp. 15-17. de Beer, J., van Zijl, J., Gough, D., 1982. The Southern Cape Conductive Belt (South Africa): Its Composition, Origin and Tectonic Significance. Tectonophysics 83, 205-225. de Beer, J.H., Gough, D.I., 1980. Conductive structures in southernmost Africa: A magnetometer array study. Geophysical Journal of the Royal Astronomical Society 63, 479-495. de Beer, J.H., Meyer, R., 1983. Geoelectrical and gravitational characteristics of the Namaqua-Natal Mobile Belt and its boundaries. Special Publication of Geology Society of South Africa 10, 91-100. de Beer, J.H., Meyer, R., 1984. Geophysical characteristics of the Namaqua-Natal Belt and its boundaries, South Africa. Journal of Geodynamics 1, 473-494. de Beer, J.H., Van Zyl, J.S.V., Bahnemann, F.K., 1974. Plate tectonic origin for the Cape Fold Belt. Nature 252, 675-676. Eglington, B.M., 2006. Evolution of the Namaqua-Natal Belt, southern Africa – A geochronological and isotope geochemical review. Journal of African Earth Science 46, 93-111. Eglington, B.M., Armstrong, R.A., 2003. Geochronological and isotopic constraints on the Mesoproterozoic Namaqua-Natal Belt: evidence from deep borehole intersection in South Africa. Precambrian Research 125, 179-189. Eglington, B.M., Harmer, R.E., Kerr, A., 1989. Isotope and geochemical constraints on Proterozoic crustal evolution in South-eastern Africa. Precambrian Research 45, 159-174. Fatti, L., 1970. The use of seismic reflection techniques in the Karoo basin, Department of Geophysics. University of the Witwatersrand, South Africa, Johannesburg, p. 57. Frimmel, H.E., 2004. Formation of a late Mesoproterozoic supercontinent: the South Africa–East Antarctica connection, in: Eriksson, P.G., Altermann, W., Nelson, D.R., Mueller, W.U., Catuneanu, O. (Eds.), The Precambrian Earth: Tempos and Events. Elsevier Science BV, Amsterdam, pp. 240–255. Geringer, G.J., Humphreys, H.C., Scheepers, D.J., 1994. Lithostratigraphy, protolithology and tectonic setting of the Areachap Group along the eastern margin of the Namaqua Mobile Belt, South Africa. South African Journal of Geology 97, 78-100. Gose, W.A., Helper, M.A., Connelly, J.N., Hutson, F.E., Dalziel, I.W.D., 1997. Paleomagnetic data and U-Pb isotopic age determinations from Coats Land, Antarctica: implications for late Proterozoic plate reconstructions. Journal Geophysical Research 102. Gough, D., Beer, J.d., Zijl, J.v., 1973. A magnetometer array study in southern Africa. Geophys. J. R. Astron. Soc. 34, 421– 433. Grantham, G.H., Eglington, B.M., Thomas, R.J., Mendonidis, P., 2001. The nature of the Grenville-age Charnockitic A-type magmatism from the Natal, Namaqua and Maud Belts of southern Africa and western Dronning Maud Land, Antarctica. Memoir, National Institute of Polar Research, Tokyo, Japan, Special Issue 55, 59-86. Hälbich, I., 1993. Cape Fold Belt - Agulhas Bank Transect across Gondwana suture, southern Africa. American Geophysical Union Special Publication 202, 18pp. Hales, A.L., Gough, D.I., 1960. Isostatic Anomalies and Crustal Sturcture in the Southern Cape. Geophysical Journal of the Royal Astronomical Society 3, 225-236. Harvey, J.D., de Wit, M.J., Stankiewicz, J., Doucouré, C.M., 2001. Structural variations of the crust in the south-western Cape deduced from seismic received-functions. South African Journal of Geology 104, 231-242. Hyndman, R.D., Peacock, S.M., 2003. Serpentinization of the forearc mantle. Earth and Planetary Science Letters 212, 417–432.
ACC
EPTE
D M
ANU
SCR
IPT
ACCEPTED MANUSCRIPT
28
Jacobs, J., Bauer, W., Schmidt, R., 2004. Magnetic Susceptibilities of the different Teetone-Stratigraphie Terranes of Heimefrontfjella, Western Dronning Maud Land, East Antarctica Polarforschung 72, 41-48. Jacobs, J., Bauer, W., Spaeth, G., Thomas, R.J., Weber, K., 1996. Lithology and structure of the Grenville-aged (»1.1 Ga) basement of Heimefrontfjella (East Antarctica). Geol. Rundsch. 85, 800–821. Jacobs, J., Falter, M., Thomas, R.J., Kunz, J., Jessberger, E.K., 1997. 40Ar/39Ar thermochronological constraints on the structural evolution of the Mesoproterozoic Natal Metamorphic Province, SE Africa. Precambrian Research 86, 71-92. Jacobs, J., Fanning, C.M., Henjes-Kunst, F., Olesch, M., Paech, H.-J., 1998. Continuation of the Mozambique Belt into East Antarctica: Grenville-age metamorphism and polyphase Pan-African high-grade events in central Dronning Maud Land. Journal of Geology 106, 385–406. Jacobs, J., Thomas, R.J., 1994. Oblique collision at about 1.1 Ga along the southern margin of the Kaapval continent, south-east Africa. Geologische Rundschlag 83, 322–333. Jacobs, J., Thomas, R.J., Weber, K., 1993. Accretion and indentation tectonics at the southern edge of the Kaapvaal craton during the Kibaran (Grenville) orogeny. Geology 21, 203–206. Kawano, S., Yoshino, T., Katayama, I., 2012. Electrical conductivity of magnetite-bearing serpentinite during shear deformation. Geophysical Research Letters 39, L20313. Kim, H.R., Frese, R.R.B.v., 2004. ADMAP - Antarctic Digital magnetic Anomaly Project. Kongju University, South Korea. Leaman, D.E., 1984. Notes on microbarometer elevation determinations. Exploration Geophysics 15, 53-59. Lindeque, A.S., de Wit, M.J.R., T., Weber, M., Chevallier, L., 2011. Deep crustal profile across the Southern Karoo basin and Beattie magnetic anomaly, South Africa: An integrated interpretation with tectonic implications. South African Journal of Geology 114, 265-292. Lindeque, A.S., Ryberg, T., Stankiewicz, J., Weber, M.H., de Wit, M.J., 2007. Deep Crustal Seismic Reflection Experiment across the Southern Karoo Basin, South Africa. South African Journal of Geology 110, 419-438. Loots, L., 2013. Investigation of the crust in the southern Karoo using the seismic reflection technique, School of Geoscience. University of the Witwatersrand, South Africa. Maré, L.P., 2012. Council for Geoscience Petrophysical Properties Atlas, Silverton, Pretoria. Maré, L.P., Thomas, R.J., 1998. Palaeomagnetism and aeromagnetic modelling of the Mesoproterozoic Ntimbankulu Pluton, KwaZulu-Natal, South Afirca: mushroom-shaped diapir? Journal of African Earth Science 25, 519-537. Martelat, J.-E., Randrianasolo, B., Schulmann, K., Lardeaux, J.-M., Devidal, J.-L., 2014. Airborne magnetic data compared to petrology of crustal scale shear zones from southern Madagascar: A tool for deciphering magma and fluid transfer in orogenic crust. Journal of African Earth Science 94, 74–85. McCourt, S., Armstrong, R.A., Grantam, G.H., Thomas, R.J., 2006. Geology and evolution of the Natal belt, South Africa. Journal of African Earth Sciences 46, 71-92. McEnroe, S., Harrison, R., Robinson, P., Golla, U., Jercinovic, M., 2001. Effect of fine-scale microstructures in titanohematite on the acquisition and stability of natural remanent magnetization in granulite facies metamorphic rocks, southwest Sweden: implications for crustal magnetism. Journal of Geophysical Research 106, 30523-30546. McEnroe, S., Harrison, R., Robinson, P., Langenhorst, F., 2002. Nanoscale haematite–ilmenite lamellae in massive ilmenite rock: an example of ‘lamellar magnetism’ with implications for planetary magnetic anomalies. Geophysical Journal International 151, 890-912. McEnroe, S.A., Fabian, K., Robinson, P., Gaina, C., Brown, L.L., 2009. Crustal Magnetism, Lamellar Magnetism and Rocks That Remember. Elements 5. Miller, H.G., Singh, V., 1994. Potential field tilt a new concept for location of potential field sources. Applied Geophysics 32, 213–217.
ACC
EPTE
D M
ANU
SCR
IPT
ACCEPTED MANUSCRIPT
29
Nguuri, T.K., Gore, J., James, D.E., Webb, S.J., Wright, C., Zengeni, T.G., Gwavava, O., Snoke, J.A., Group, K.S., 2001. Crustal structure beneath southern Africa and its implications for the formation and evolution of the Kaapvaal and Zimbabwe cratons. Geophysical Research Letters 28, 2501–2504. Parsiegla, N., Gohl, K., Uenzelmann-Neben, G., 2007. Deep crustal structure of the sheared South African continental margin: first results of the Agulhas-Karoo Geoscience Transect. South African Journal of Geology 110, 393-406. Parsiegla, N., Gohl, K., Uenzelmann-Neben, G., 2008. The Agulhas Plateau: structure and evolution of a Large Igneous Province. Geophysical Journal International 174, 336-350. Pitts, B., Mahler, M., Beer, J.d., Gough, D., 1992. Interpretation of magnetic, gravity and magnetotelluric data across the Cape Fold Belt and Karoo Basin, in: De Wit, M., Ransome, I.G.D. (Eds.), Inversion Tectonics of the Cape Fold Belt, Karoo and Cretaceous Basins of Southern Africa. Balkema, Rotterdam, pp. 27–32. Quesnel, Y., Weckmann, U., Ritter, O., Stankiewicz, J., Lesur, V., Mandea, M., Langlais, B., Sotin, C., Galdéano, A., 2009. Simple models for the Beattie Magnetic Anomaly in South Africa. Tectonophysics 478, 111-118. Raith, J.G., Cornell, D.H., Frimmel, H.E., De Beer, C.H., 2003. New insights into the geology of the Namaqua tectonic province South Africa, from ion probe dating of detrital and metamorphic zircon. Journal of Geology 111, 347–366. Reynard, B., Mibe, K., Van de Moortele, B., 2011. Electrical conductivity of the serpentinised mantle and fluid flow in subduction zones. Earth and Planetary Science Letters 307, 387-394. Robb, L.J., Armstrong, R.A., Waters, D.J., 1999. The history of granulitefacies metamorphism and crustal growth from single zircon U–Pb geochronology: Namaqualand, South Africa. Journal Petrology 40, 1747–1770. Robinson, P., Harrison, R., McEnroe, S., Hargraves, R., 2002. Lamellar magnetism in the haematite–ilmenite series as an explanation for strong remanent magnetization. Nature 418, 517–520. Rowsell, D.M., De Swardt, A.M.J., 1976. Diagenesis in Cape and Karroo sediments, South Africa, and its bearing on their hydrocarbon potential. Transactions, Geological Society of South Africa 79, 81-145. SACS, 1980. Stratigraphy of South Africa. Geological Survey of South Africa. Scheiber-Enslin, S.E., Ebbing, J., Eberle, D.G., Webb, S.J., 2012. Geophysical 3D Modelling of the Karoo Basin, South Africa - Preliminary Results, LASI 5 Conference, Port Elizabeth, South Africa. Schmitz, M.D., Bowring, S.A., 2004. Lower crustal granulite dormation during Mesoproterozoic Namaqua-Natal collisional orogenesis, southern Africa. South African Journal of Geology 107, 261-284. Scogings, A.J., Mkaza, J., Mngomezulu, M.A., 1984. Final report on the Mvoti scheelite project. SA Dev. Trust Int. Rep., p. 12. Söhnge, A., Hälbich, I.W., 1983. Geodynamics of the Cape Fold Belt, Spec. Publ. Geological Society of South Africa 12. Stankiewicz, J., Ryberg, T., Parsiegla, N., Gohl, K., Trumbull, R., Weber, M., 2008. Crustal structure of the Southern Margin of the African Plate: Results from Geophysical Experiments. Journal Geophysical Research 113, B10313. Stankiewicz, J., Ryberg, T., Schulze, A., Lindeque, A.S., Weber, M.H., de Wit, M.J., 2007. Initial results from wide-angle seismic refraction lines in the southern Cape. South African Journal of Geology 110, 407-418. Stettler, E.H., Fourie, C.J.S., Bühmann, J.R., Hattingh, E., Cole, P., Kleywegt, R.J., Wolmarans, L.G., Cloete, A.J., 1999. Magnetics, South African Geophysical Atlas. Volume 2 (CD Rom). Council for Geoscience, South Africa. Talwani, M., Heirtzler, J.R., 1964. Computation of magnetic anomalies caused by two-dimensional bodies of arbitrary shape, in: Parks, G.A. (Ed.), Computers in the mineral industries, Part 1. Stanford Univ. Publ., Geological Sciences, pp. 464-480.
ACC
EPTE
D M
ANU
SCR
IPT
ACCEPTED MANUSCRIPT
30
Talwani, M., Worzel, J.L., Landisman, M., 1959. Rapid gravity computations for two-dimensional bodies with application to the Mendocino submarine fracture zone. Journal Geophysical Research 64, 49-59. Tankard, A., Welsink, H., Aukes, P., Newton, R., Stettler, E.H., 2009. Tectonic evolution of the Cape and Karoo basins of South Africa. Marine and Petroleum Geology 26, 1379-1412. Thomas, R.J., 1989. A tale of two tectonic terranes. South African Journal of Geology 92, 306-321. Thomas, R.J., 1992. Mapumulo Group, in: Johnson, M.R. (Ed.), Catalogue of South Africa Lithostratigraphic Units, 1st ed. SA Committee for Stratigraphy. Thomas, R.J., Cornell, D.H., Grantam, G.H., 1992a. Protolithology of the Quha Formation in the type area, Natal Metamorphic Province, Geocongress. Geological Society of South Africa, Bloemfontein, pp. 396-398. Thomas, R.J., Du Plessis, A.J., Fitch, F., Marshall, C.G.A., Miller, J.A., Von Brunn, V., Watkeys, M.K., 1992b. Geological studies in southern Natal and Transkei: implications for the Cape Oroogen, in: de Wit, M.J., Ransome, I.G.D. (Eds.), Inversion Tectonics of the Cape Fold Belt, Karoo and Cretaceous Basins of Southern Africa. Balkema, Rotterdam, pp. 229-236. Thomas, R.J., Eglington, B.M., 1990. A Rb–Sr, Sm–Nd and U–Pb zircon isotopic study of the Mzumbe suite, the oldest intrusive granitoid in southern Natal, South Africa. South African Journal of Geology 93, 761-765. Venter, C.P., du Plessis, J.G., Stettler, R.H., Potgieter, T.D., Kleywegt, R.J., Hattingh, E., Fourie, C.J.S., Wolmarans, L.G., Cloete, A.J., Maré , L.P., 1999. Gravity, South African Geophysical Atlas. Council for Geoscience, South Africa, p. 77. Verduzco, B., Fairhead, J.D., Green, C.M., MacKenzie, C., 2004. New Insights into Magnetic Derivatives for Structural Mapping. The Leading Edge 23, 116-119. Voordouw, R.J., 2010. A D3 Shear Zone In The Margate Terrane And Its Implications For Regional Deformation In The Natal Metamorphic Province (South Africa). South African Journal of Geology 113, 183-194. Wall, M., Cartwright, J., Daviesw, R., McGrandlez, A., 2009. 3D seismic imaging of a Tertiary Dyke Swarm in the Southern North Sea, UK. Basin Research 22, 181-194. Weckmann, U., Jung, A., Branch, T., Ritter, O., 2007a. Comparison of electrical conductivity structures and 2D magnetic modelling along two profiles crossing the Beattie Magnetic Anomaly, South Africa. South African Journal of Geology 110, 449–464. Weckmann, U., Ritter, O., Jung, A., Branch, T., de Wit, M., 2007b. Magnetotelluric measurements across the Beattie magnetic anomaly and the Southern Cape Conductive Belt, South Africa. Journal Geophysical Research 112, doi:10.1029/2005JB0039755. Welford, J.K., Clowes, R.M., 2006. Three-dimensional seismic reflection investigation of the upper crustal Winagami sill complex of northwestern Alberta, Canada. Geophysical Journal International 166, 155-169. Won, I.J., Bevis, M., 1987. Computing the gravitational and magnetic anomalies due to a polygon: Algorithms and Fortran subroutines. Geophysics 52, 232-238.
Figure captions
Figure 1) Topographic map of South Africa (Amante and Eakins, 2009) with the major
tectonic provinces outlined (thin black lines). These include the Archean Kaapvaal Craton
(KVC), surrounded by the Namaqua-Natal mobile belt (NNMB), and the deformed Cape
ACC
EPTE
D M
ANU
SCR
IPT
ACCEPTED MANUSCRIPT
31
Fold Belt (CFB) in the south. The outline of the Southern Cape Conductive Belt (red lines),
and the maximum axis of the Beattie Magnetic Anomaly are shown (thick black line). The
location of deep SOEKOR boreholes that intersect basement are labelled (black circles,
KA1/66, KC1/70, QU1/65 and WE1/66, Eglington and Armstrong (2003).
Figure 2) Schematic diagram illustrating the evolution of the Natal belt between 1170 to 1140
Ma and 1090 to 1070 Ma (modified from McCourt et al., 2006). During the earlier period the
Tugela terrane accreted onto the Kaapvaal Craton, and granites (oldest intrusives) intruded
the supracrustals and associated rocks of the Mzumbe-Margate arc. Between 1090 and 1070
Ma the Mzumbe and Margate terranes accreted onto the Tugela terrane-KVC margin, and S-
type granitoids intruded the Mzumbe-Margate terranes.
Figure 3a) Aeromagnetic total intensity; b) free-air gravity; c) Bouguer gravity and b)
isostatic anomaly maps for South Africa. Major tectonic provinces are outlined (see Figure 1
for details). Coincident geophysical profiles collected over the south-western and south-
central portion of the BMA are indicated in (a) (black lines), including a refraction seismic
line (Stankiewicz et al., 2007), magnetotelluric profiles (Weckmann et al., 2007a; Weckmann
et al., 2007b), reflection seismic profile (Lindeque et al., 2011), and offshore seismic lines
(Parsiegla et al., 2007, 2008). A vibroseis line (Loots, 2013) was collected between the two
profiles.
Figure 4) Magnetic susceptibility measurements (x 10-3
SI) for several geological units within
the Mzumbe Terrane, including the a) supracrustal rocks of the Mapumulo Group, b)
orthogneisses (S-type), and c) mafic intrusions and granitoids (S-type). Different suites or
formations within these units are marked with different colours. Rock types are labelled, with
ACC
EPTE
D M
ANU
SCR
IPT
ACCEPTED MANUSCRIPT
32
the common ones abbreviated: AMPH – amphibolite, CH – charnockite, GN – gneiss, GR –
granite, SERP - serpentinite. High magnetic susceptibility values which plot off the chart are
included in brackets. For the supracrustal rocks in (a), the highest magnetic susceptibilities
are for gneisses (> 20 x 10-3
SI). For the orthogneisses in (b) magnetic susceptibility values
overall are significantly lower (< 10 x 10-3
SI). For the Mzumbe mafics and granitoids (S-
type) in (c), the highest magnetic susceptibility is 55 x 10-3
SI for a granite and for
monzonites and syenites samples (< 25 x 10-3
SI), while the remaining samples have smaller
values (< 10 x 10-3
SI).
Figure 5) Magnetic susceptibility measurements (x 10-3
SI) for several geological units within
the Margate Terrane, including the a) supracrustal rocks of the Mzimkulu Group and b)
orthogneisses (S-type), and c) Oribi Gorge plutons (A-type) from both the Mzumbe and
Margate terranes. See Figure 4 for details. For the supracrustal rocks in (a), the highest
magnetic susceptibilities is for a basalt (12 x 10-3
SI), while the remaining recorded values are
< 2 x 10⁻³
SI. For the orthogneisses in (b) the highest magnetic susceptibilities are for a
diorite (54 x 10-3
SI) and serpentine (159 x 10-3
SI), while the remaining samples have
magnetic susceptibilities of < 10 x 10-3
SI. For the Margate Plutons (A-type) in (c) magnetic
susceptibilities of < 16 x 10-3
SI are recorded, while one granite has a measured magnetic
susceptibility of 83 x 10-3
SI.
Figure 6a) Total magnetic intensity (TMI) and b) high-pass (HP) filtered TMI for South
Africa (using a 50 km wavelength cut-off). Alternating subparallel magnetic highs and lows
are visible north and south of the BMA and are traced (black lines) and labelled according to
Thomas et al. (1992b). The Lilani-Mabigulu shear zone (LSZ) north of these anomalies is
labelled. From these traces the continuity of the Williston anomaly to the west is evident.
ACC
EPTE
D M
ANU
SCR
IPT
ACCEPTED MANUSCRIPT
33
These anomalies as well as borehole analysis by Eglington et al. (2003) were used to define
the border between the Natal and Namaqua terranes (green line). The boreholes used (black
circles) are labelled in (a) (KA1/66, KC1/70, QU1/65 and WE1/66). Tectonic provinces are
outlined (see Figure 1 for details).
Figure 7a) Geological map showing the Mzumbe terrane associated with the Williston
anomaly. Shear and thrust zones are marked (black lines, summarized by Voordouw (2010)).
Geological time-scales during deposition include the Neoproterozoic (N), Ordovician (O),
Carboniferous (C) through to Triassic (T), Jurassic (J) and Quaternary (Q). b) Total magnetic
intensity (TMI) map of the entire Mzumbe terrane with mapped Mzumbe supracrustal
gneisses (and associated migmatites) marked. Shear and thrust zones are marked and labelled
in (c). The terrane extends from the Lilani-Mabigulu shear zone (LSZ) in the north to the
Melville thrust in the south (MT). South of this a small portion of the Margate terrane is
exposed. The magnetic linear anomalies (Williston, BMA and Mbashe) are labelled. The
Kaapvaal craton boundary is marked with a black line to the north of the LSZ (between these
two boundaries is the Tugela terrane). The approximately northeast to southwest extent of
younger sedimentary cover is marked (thick black line, Karoo and Natal sediments), east of
which basement rocks outcrop. The magnetic highs of the LSZ, Williston and the high in-
between are most closely associated with outcropping supracrustal rocks (Mapumulo group)
and shear zones. More circular anomalies to the south are associated with the younger Oribi
Gorge plutons. Towns include Amanzimtoti (AM), Pennington (PT), Port Edward (PE)
(black circles).
Figure 8a) High-pass (HP) filtered and b) low-pass (LP) filtered magnetic data (50 km cut-
off), as well as b) tilt derivative (TDR) and d) pseudogravity (PG) data and isostatic anomaly
ACC
EPTE
D M
ANU
SCR
IPT
ACCEPTED MANUSCRIPT
34
contours for the Natal mobile belt on the east coast of South Africa. Magnetic linear
anomalies defined by Thomas et al. (1992b), as well as major shear zones (black lines) are
indicated. See Figure 7 for details. There is a strong correlation between the HP and LP
anomalies and mapped shear zones. The TDR map can be used to better map these zones,
while no correlation is seen between the PG and the isostatic anomaly contours (15 mGal
interval).
Figure 9) TMI image with refined shear zones (black lines) constrained using geology data,
previously mapped shear zones and magnetic tilt derivative data.
Figure 10a) Total magnetic intensity map over the BMA on the east coast of South Africa; b)
North-south profile over the BMA at its shallowest on the east coast (location marked with a
black line in (a)). The data reveals the complex nature of the source. Towns indicated include
Port Edward (PE) and Port St. Johns (PJ), as well as the Mkambati Nature Reserve (MB)
(black circles).
Figure 11a) High-pass filtered TMI image for the region surrounding the western profile in
Figure 3a. Traces of magnetic linear anomalies identified in Figure 6b are marked with black
lines (M-Mbashe, BMA-Beattie Magnetic Anomaly, W-Williston). b) 2D magnetic model
along the profile shown in (a). The upper panel shows the observed magnetic anomaly (thick
black line) and calculated anomaly (thin black line). The lower panel shows the created 2D
magnetic model, with the different bodies labelled. Seismic refraction velocities for these
bodies are included in brackets, and the colour of the body represents the magnetic
susceptibility (SI) of the body. Mid-crustal bodies with higher magnetic susceptibilities are
ACC
EPTE
D M
ANU
SCR
IPT
ACCEPTED MANUSCRIPT
35
used to fit the BMA, Williston and Mbashe anomalies. These bodies correlate with
anomalous zones identified on seismic and MT data, and are modelled with increasing depth
and magnetic susceptibilities towards the south. The location of SOEKOR deep boreholes
used to constrain the depth of the Karoo basin are shown (KW1/67, SA1/67, QU1/65). c) 2D
density model corresponding with the magnetic profile in (b). The upper panel shows the
observed free-air anomaly (thick black line) and calculated gravity (thin black line). The
lower panel shows the 2D density model (density values in kg/m). d) Correlated seismic
reflection image (Lindeque et al., 2007), e) seismic refraction image (Stankiewicz et al.,
2008), and f) MT resistivity image (Weckmann et al., 2007b) used to constrain the model.
Figure 12a) High-pass filtered TMI image for the region surrounding the central profile
shown in Figure 3a. b) 2D magnetic model along the profile shown in (a). The mid-crustal
high susceptibility bodies used to fit the anomalies correlate with the magnetic traces in (a) as
well as anomalous zones of high seismic velocity (Stankiewicz et al., 2007), and are
modelled with increasing depth towards the south. c) 2D gravity model corresponding with
the magnetic profile in (b). d) Seismic refraction data from Stankiewicz et al. (2007) used to
constrain the model. Boreholes used to constrain the model are shown (SC3/67, CR1/68,
VREDE1/66). See Figure 11 for details.
Figure 13a) Terrane map of western (WDML) and central Dronning Maud Land (CDML)
with the different terranes labelled and delineated with black lines (Amante and Eakins,
2009). b) Total magnetic intensity map of WDML and CDML (Kim and Frese, 2004). Broad
elongated magnetic highs and lows that characterize the western region have been linked with
~1.1 Ga orogenic basement, as well as similar basement and anomalies on the east coast of
South Africa. Black lines mark terranes labelled in (a). The Heimefrontfjella region in the
ACC
EPTE
D M
ANU
SCR
IPT
ACCEPTED MANUSCRIPT
36
southwest, which includes the Vardeklettane terrane (V) and Mannefallknausane (M, Jacobs
et al., 1996), has been linked to the Margate terrane.
Table Captions
Table 1) Density and magnetic susceptibility values used for potential field modelling.
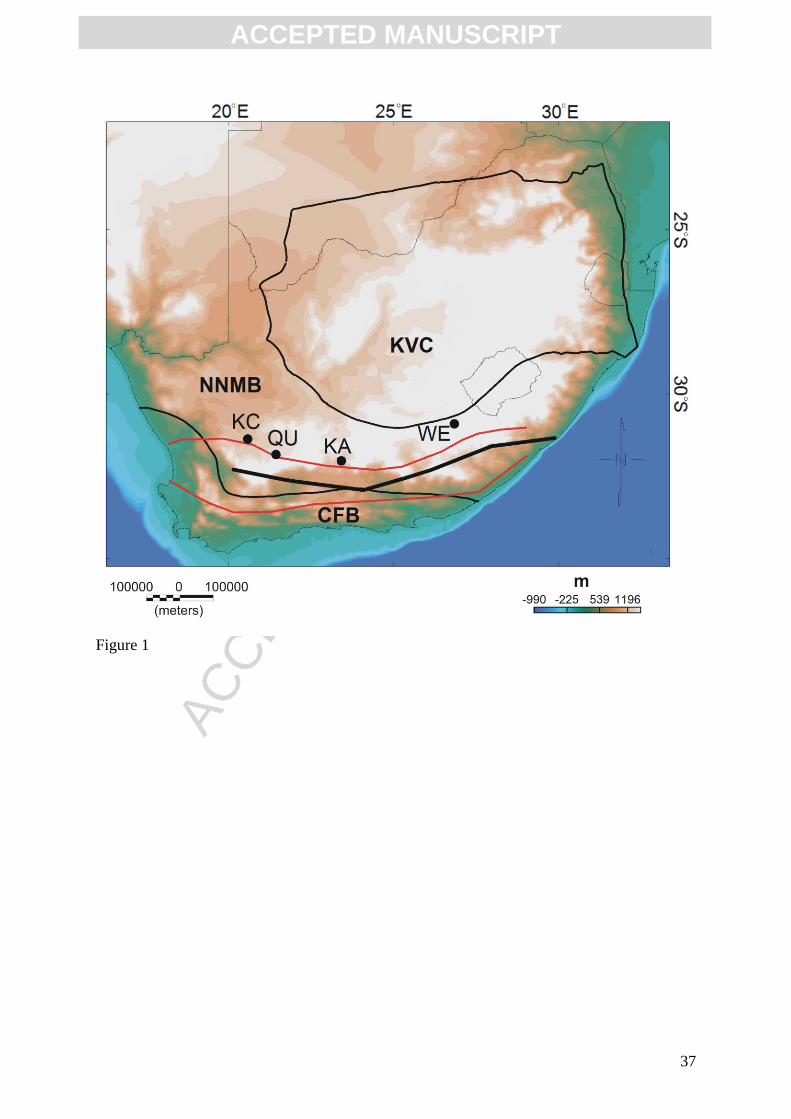
ACC
EPTE
D M
ANU
SCR
IPT
ACCEPTED MANUSCRIPT
37
Figure 1
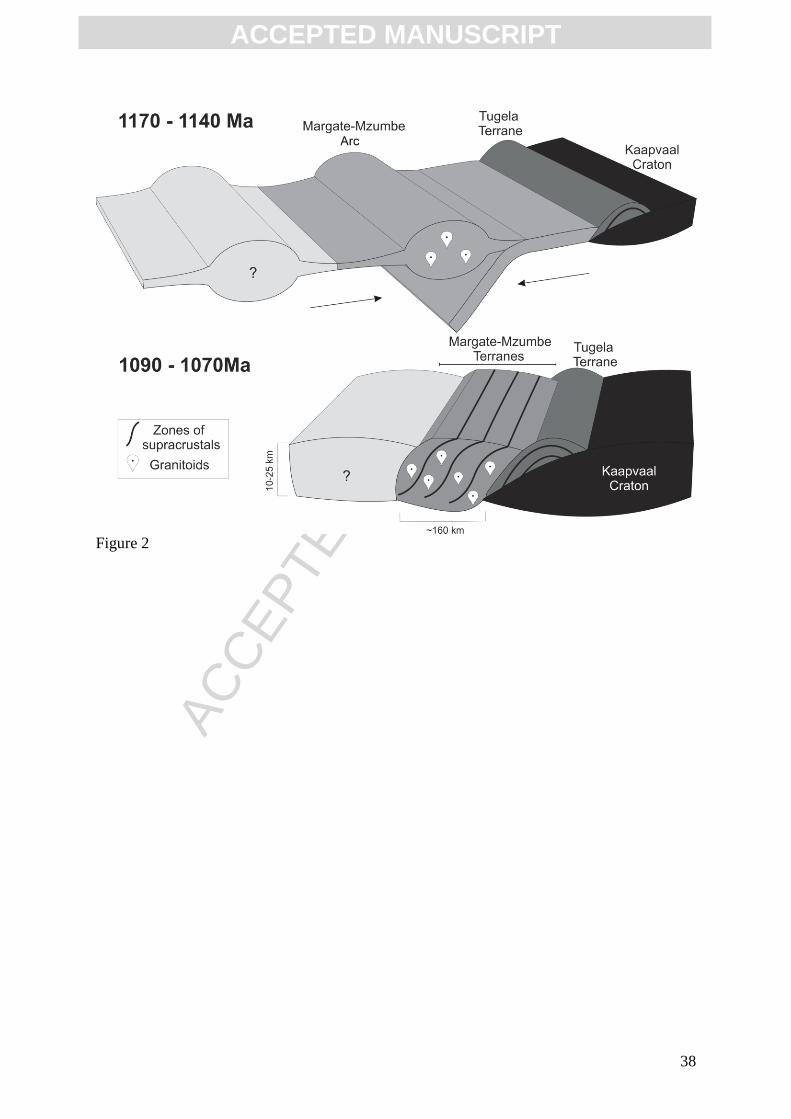
ACC
EPTE
D M
ANU
SCR
IPT
ACCEPTED MANUSCRIPT
38
Figure 2
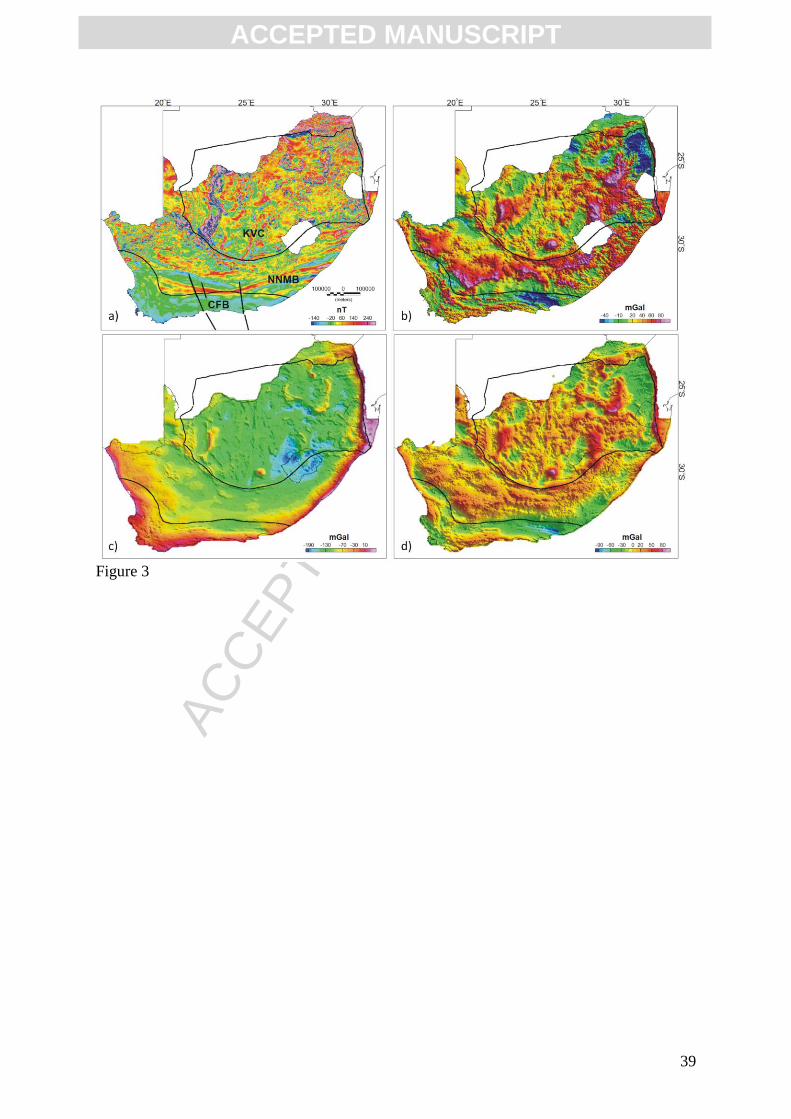
ACC
EPTE
D M
ANU
SCR
IPT
ACCEPTED MANUSCRIPT
39
Figure 3
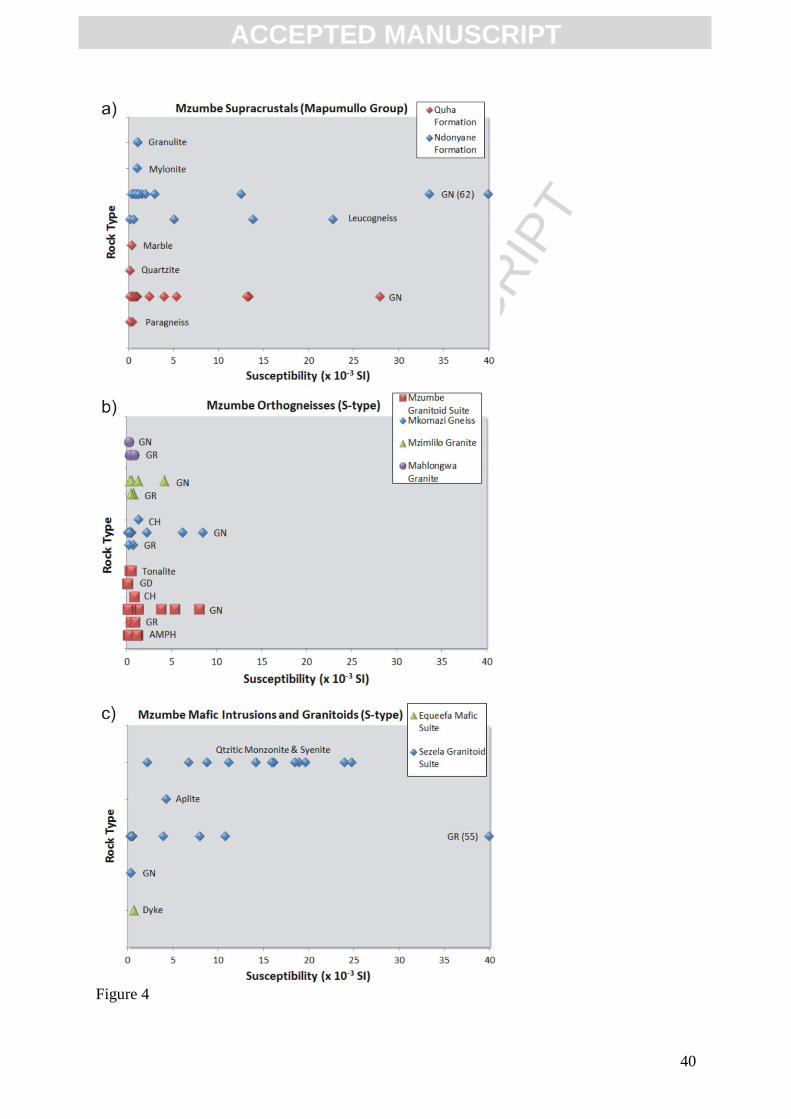
ACC
EPTE
D M
ANU
SCR
IPT
ACCEPTED MANUSCRIPT
40
Figure 4
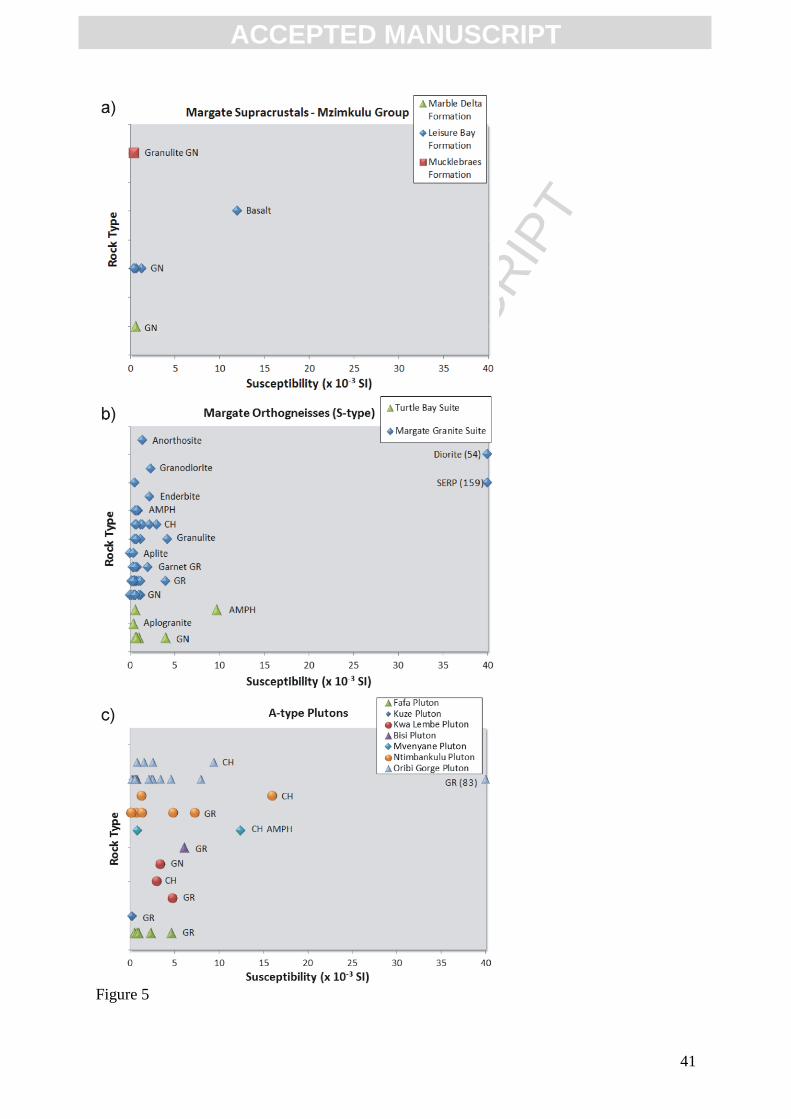
ACC
EPTE
D M
ANU
SCR
IPT
ACCEPTED MANUSCRIPT
41
Figure 5
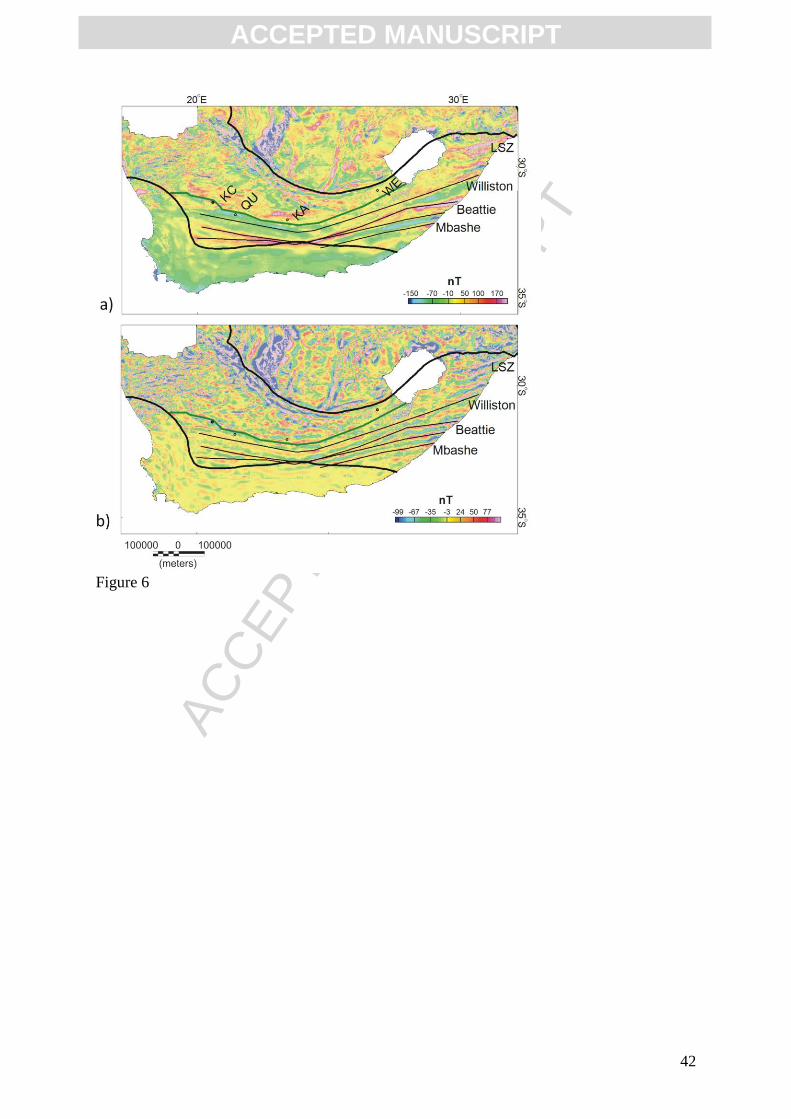
ACC
EPTE
D M
ANU
SCR
IPT
ACCEPTED MANUSCRIPT
42
Figure 6
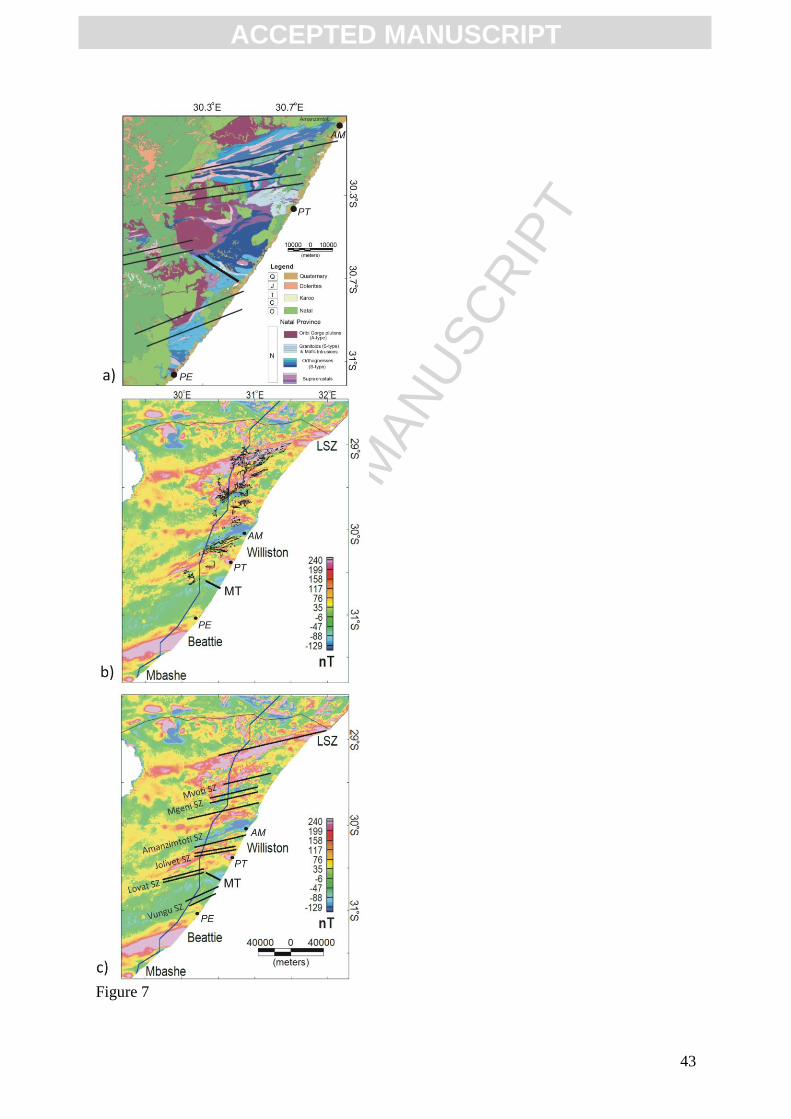
ACC
EPTE
D M
ANU
SCR
IPT
ACCEPTED MANUSCRIPT
43
Figure 7
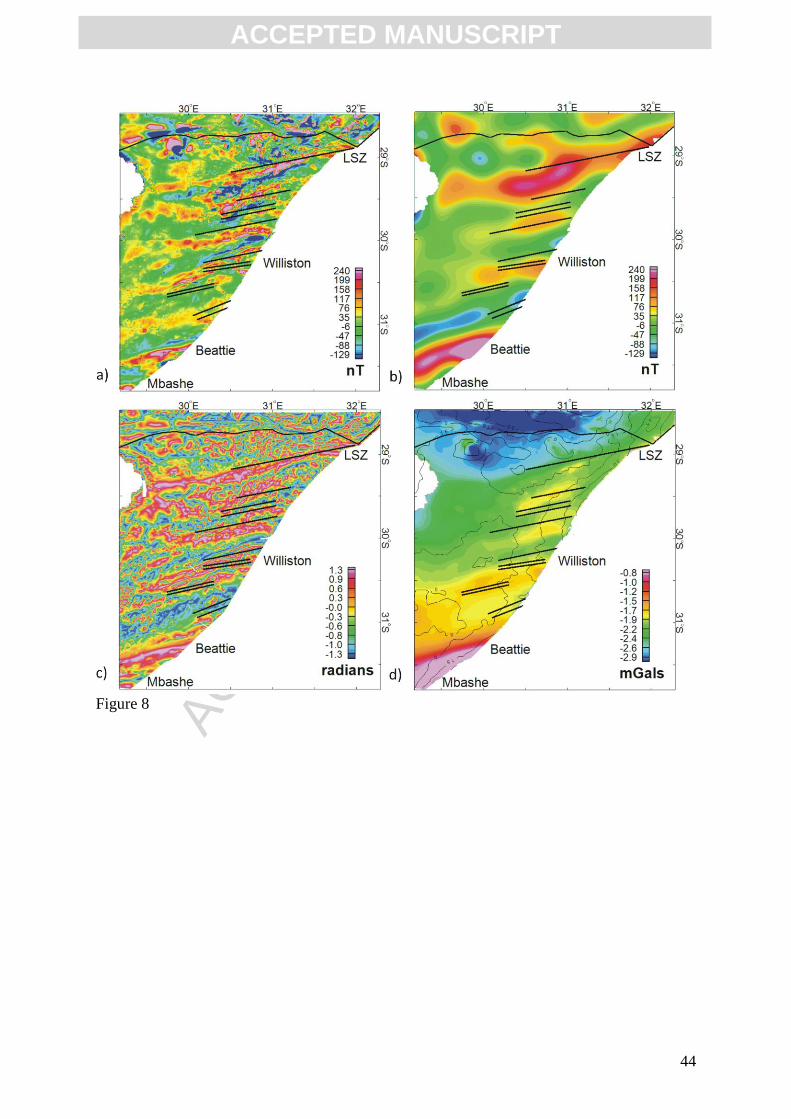
ACC
EPTE
D M
ANU
SCR
IPT
ACCEPTED MANUSCRIPT
44
Figure 8
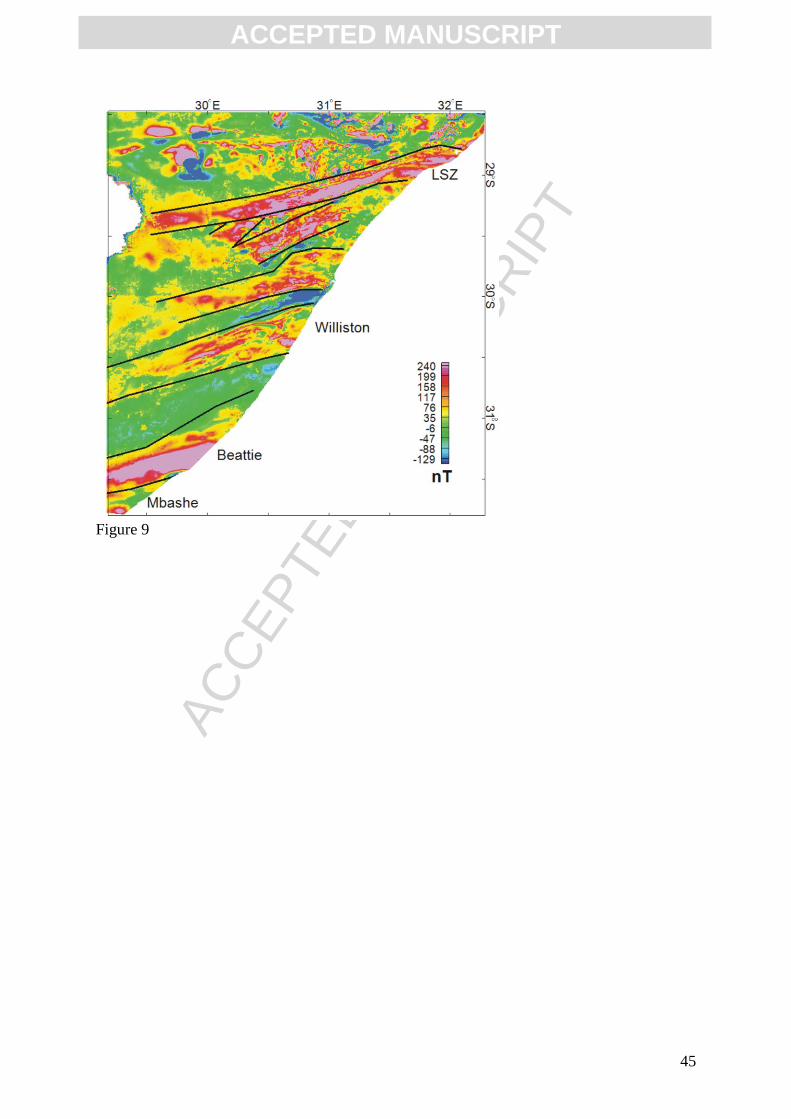
ACC
EPTE
D M
ANU
SCR
IPT
ACCEPTED MANUSCRIPT
45
Figure 9
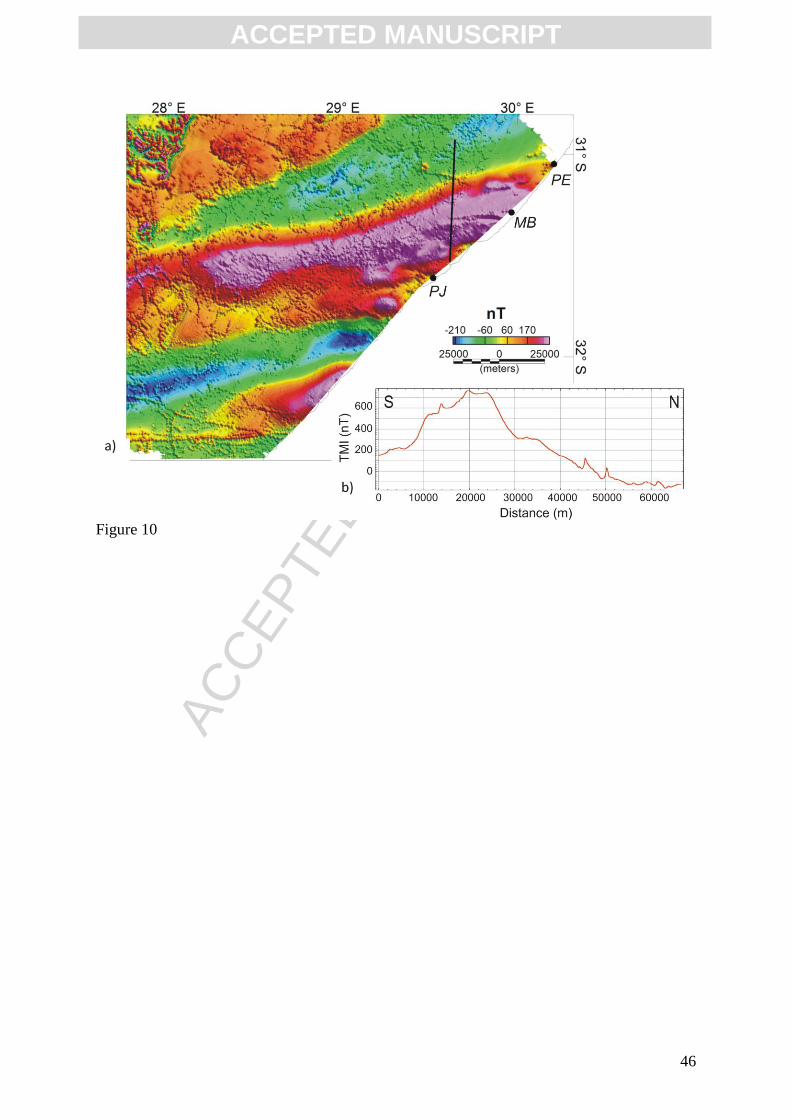
ACC
EPTE
D M
ANU
SCR
IPT
ACCEPTED MANUSCRIPT
46
Figure 10
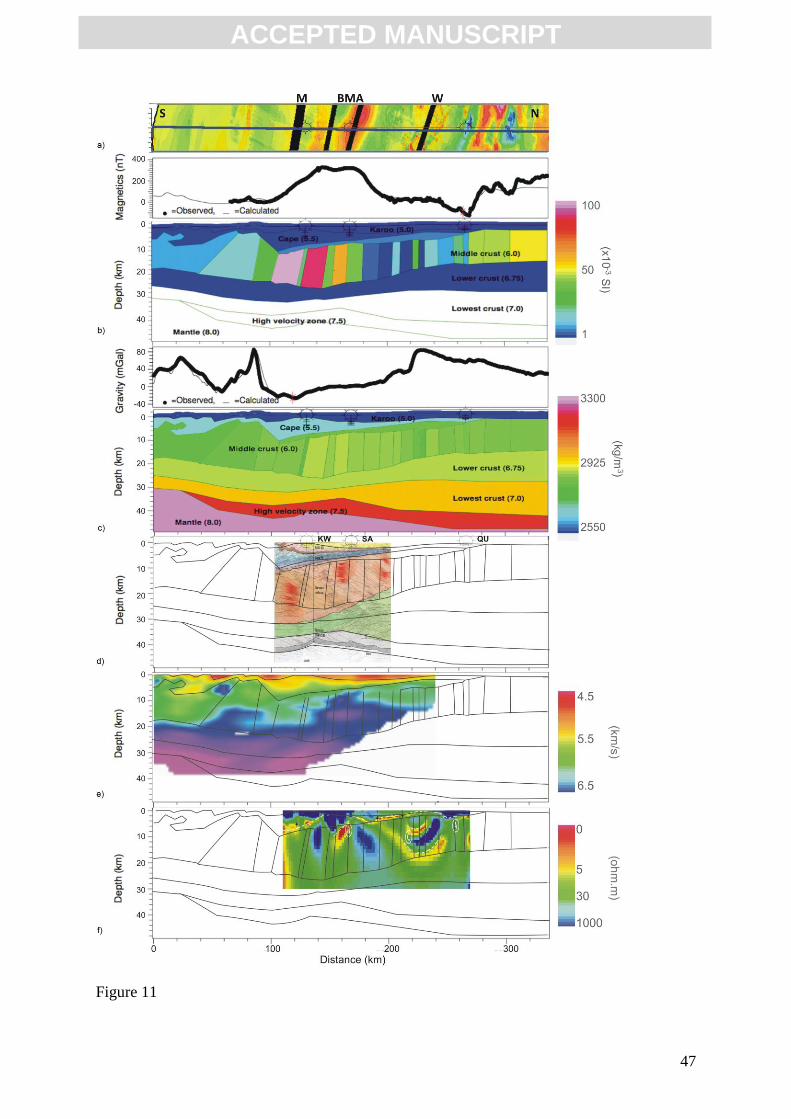
ACC
EPTE
D M
ANU
SCR
IPT
ACCEPTED MANUSCRIPT
47
Figure 11
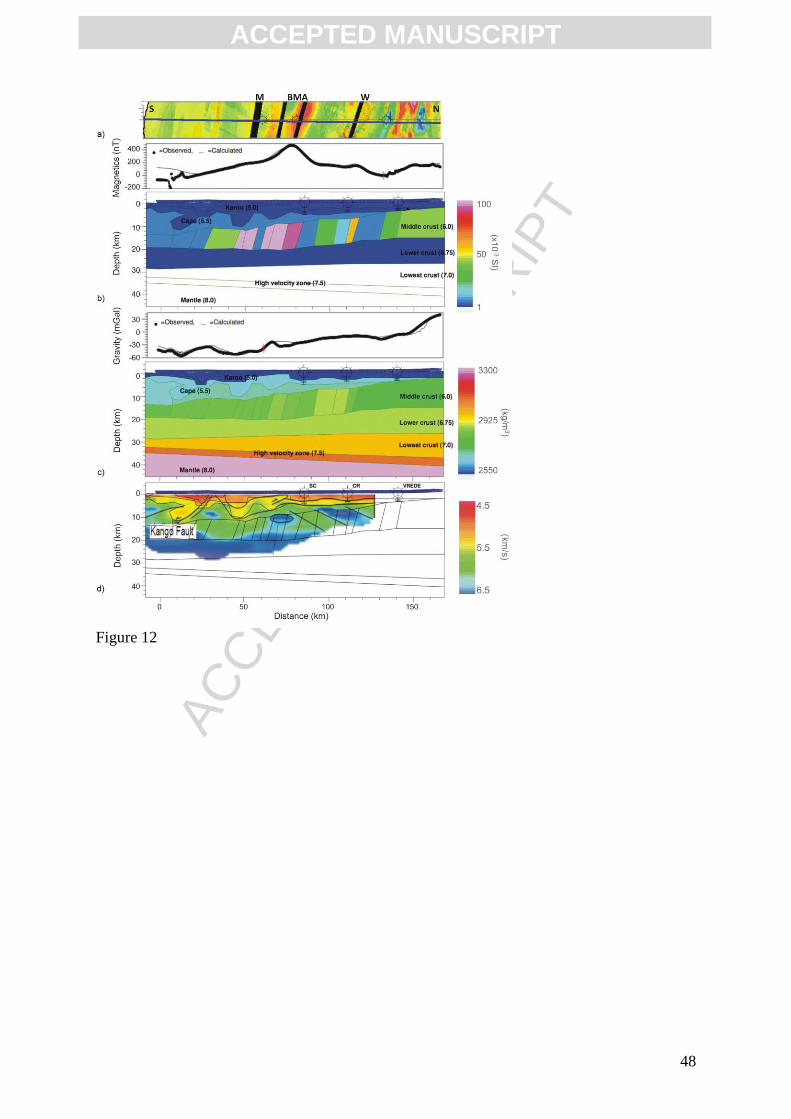
ACC
EPTE
D M
ANU
SCR
IPT
ACCEPTED MANUSCRIPT
48
Figure 12
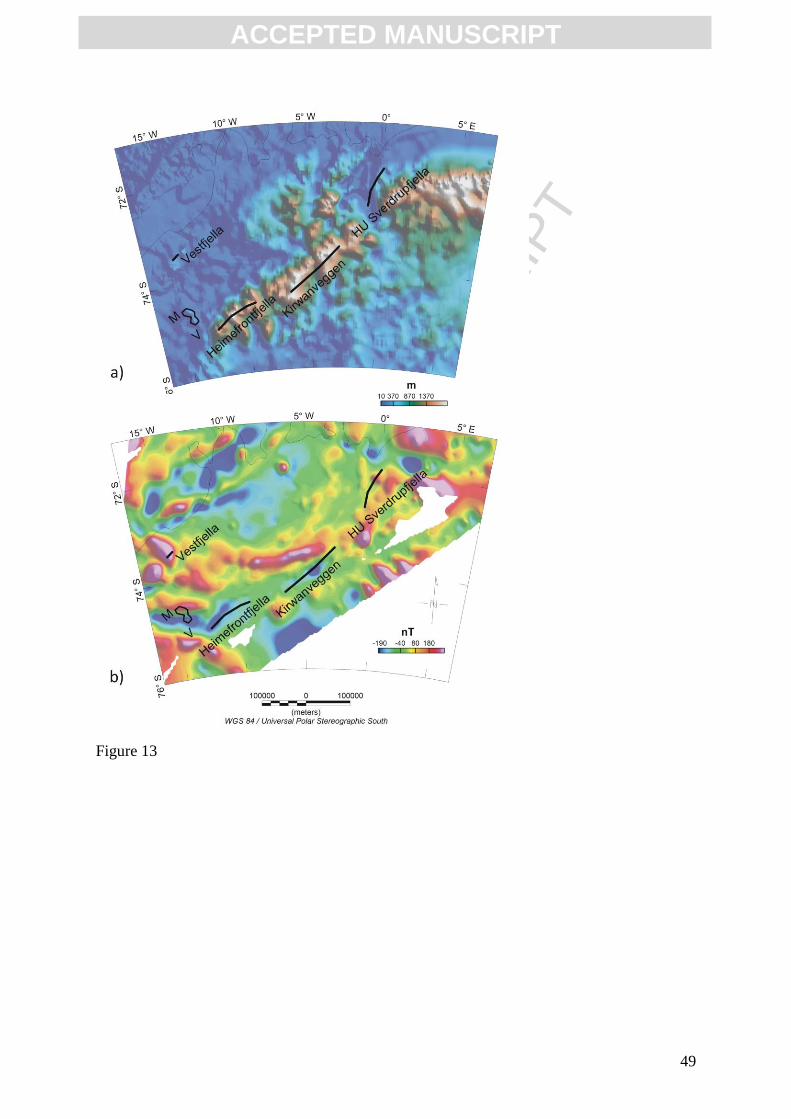
ACC
EPTE
D M
ANU
SCR
IPT
ACCEPTED MANUSCRIPT
49
Figure 13
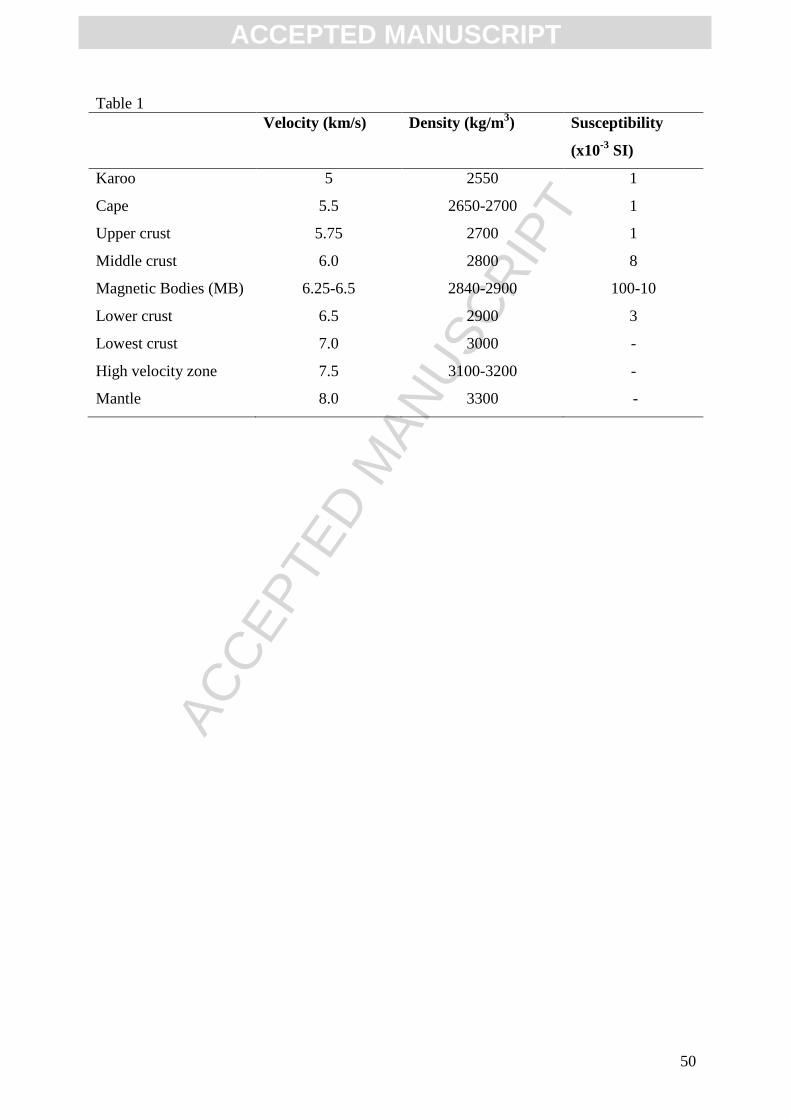
ACC
EPTE
D M
ANU
SCR
IPT
ACCEPTED MANUSCRIPT
50
Table 1
Velocity (km/s) Density (kg/m3) Susceptibility
(x10-3
SI)
Karoo 5 2550 1
Cape 5.5 2650-2700 1
Upper crust 5.75 2700 1
Middle crust 6.0 2800 8
Magnetic Bodies (MB) 6.25-6.5 2840-2900 100-10
Lower crust 6.5 2900 3
Lowest crust 7.0 3000 -
High velocity zone 7.5 3100-3200 -
Mantle 8.0 3300 -
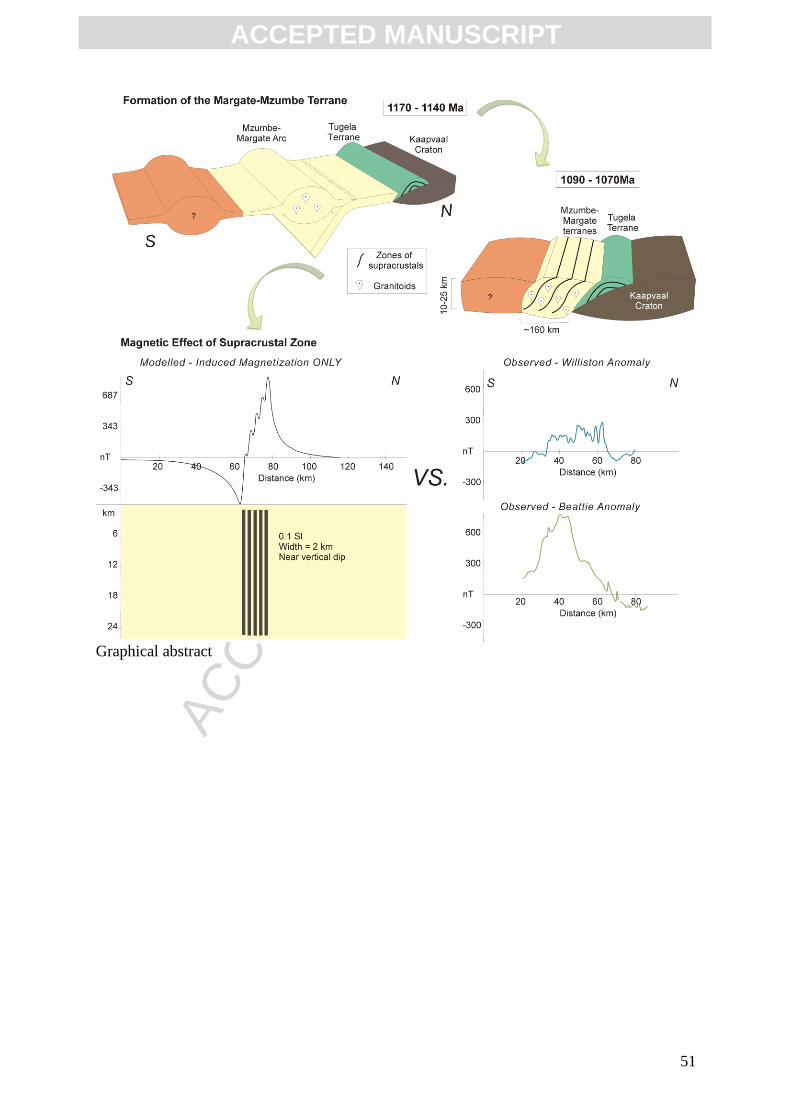
ACC
EPTE
D M
ANU
SCR
IPT
ACCEPTED MANUSCRIPT
51
Graphical abstract
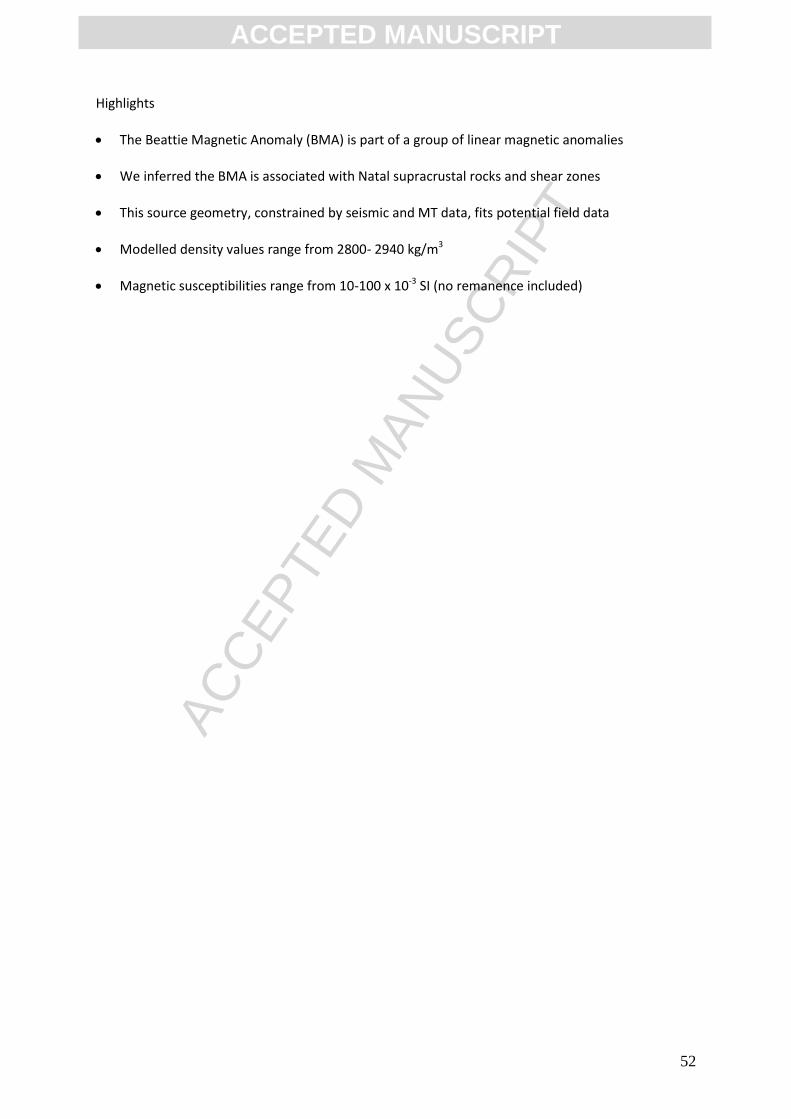
ACC
EPTE
D M
ANU
SCR
IPT
ACCEPTED MANUSCRIPT
52
Highlights
The Beattie Magnetic Anomaly (BMA) is part of a group of linear magnetic anomalies
We inferred the BMA is associated with Natal supracrustal rocks and shear zones
This source geometry, constrained by seismic and MT data, fits potential field data
Modelled density values range from 2800- 2940 kg/m3
Magnetic susceptibilities range from 10-100 x 10-3 SI (no remanence included)