integrated geophysical techniques and geomorphological approach to investigate the...
TRANSCRIPT

Engineering Geology 98 (2008) 156–167
Contents lists available at ScienceDirect
Engineering Geology
j ourna l homepage: www.e lsev ie r.com/ locate /enggeo
Integrated geophysical and geomorphological approach to investigate thesnowmelt-triggered landslide of Bosco Piccolo village(Basilicata, southern Italy)
V. Naudet b, M. Lazzari a, A. Perrone c,⁎, A. Loperte c, S. Piscitelli c, V. Lapenna c
a Institute for Archaeological and Monumental Heritage, IBAM-CNR, Contrada S.Loja, Tito Scalo (Pz), I-85050, Italyb Université Bordeaux 1, Geosciences Hydrosciences Material and Constructions, GHYMAC-EA 4134, Talence, F-33405, Francec Institute of Methodologies for Environmental Analysis, IMAA-CNR, Contrada S.Loja, Tito Scalo (Pz), I-85050, Italy
a r t i c l e i n f o
⁎ Corresponding author.E-mail address: [email protected] (A. Perrone).
0013-7952/$ – see front matter © 2008 Elsevier B.V. Aldoi:10.1016/j.enggeo.2008.02.008
a b s t r a c t
Article history:Received 29 May 2007Received in revised form 31 January 2008Accepted 1 February 2008Available online 5 March 2008
Most of Basilicata region in the southern Italian Apennines is characterized by landslides often developing inclayey–marly formations. Many events have been triggered by extreme rainfall or snowmelt. The mostimportant happened (on February–March 2005) at Bosco Piccolo 5 km far from Potenza. This landslidedeveloped subsequently to rapid snowmelt occurred during alternating short periods of high temperaturesand intense and continuous snowfalls. This complex landslide affected 4 ha of surface and reached amaximum depth of 20 m inducing damage and collapse of about 80% of the buildings in the village. Anintegrated multidisciplinary approach has been adopted to study the landslide. A multitemporal aerial photointerpretation and detailed geomorphological surveys have been carried out. Combined Electrical ResistivityTomography (ERT) and Self-Potential (SP) measurements have been performed and calibrated with boreholesstratigraphy. Such an integrated approach allowed us to partially reconstruct the geometry of the investigatedbody and to evaluate the effectiveness of drainage system planned for the area.
© 2008 Elsevier B.V. All rights reserved.
Keywords:LandslideGeomorphologyElectrical resistivity tomographySelf potentialDrainage systemBasilicataSouthern Italy
1. Introduction
In respect of the national average, Basilicata region (southern Italy)exhibits the highest density of landslides with more than 27 landslideareas every 100 km2 (Guzzetti, 2000). This high landslide density isrelated to predisposing conditions such as prevailing clayey materialsas well as morphological setting of the slopes, and to determining con-ditions such as extreme rainfall events (Piccareta et al., 2004) or humanactivity, such as cave excavation (Lazzari et al., 2006), deforestation(Boenzi and Giura Longo, 1994) and intense urbanization and indus-trialization. Many landslide events have been historically triggered byextreme rainfall or snowmelt occurrences. The Basilicata region can betherefore considered a natural outdoor laboratory to apply geophysicalmethods to investigate the complex geometry of landslide bodies.
To answer unsolved questions in geomorphology research regard-ing for example the thickness and internal structures of landslides,several geophysical techniques can be used. The success of their ap-plications is determined by the following fundamentals factors: con-trast of the physical properties of involved materials, depth of thetarget, high space and temporal resolution of the data, signal-to-noiseratio. Their advantages are to be fairly flexible and relatively easy to
l rights reserved.
deploy on mountainous area and to provide highly pertinent two orthree-dimensional subsurface information in a non-invasive way.The main drawbacks are their decreasing resolution with depth, thenon-uniqueness of their solution, the indirect information they yield(geophysical parameters), and the resulting need of calibration. Since afew decades, the use of geophysical methods for landslide character-ization is commonly increasing. These methods include seismicreflection or refraction, seismic noise, electromagnetic,magnetometry,gravity, and thermometry (Hack, 2000; Jongmans and Garambois,2007; Schrott and Sass, 2008 and references therein), although themost applied are ground-penetrating radar, electrical resistivity andseismic refraction (Bichler et al., 2004; Lapenna et al., 2005; Mericet al., 2005; Godio et al., 2006).
Recently, considerable attention has been devoted to two geoelec-trical methods: the electrical resistivity tomography (ERT) or electricalimaging, and the self-potential (SP) or streaming potential method.These twomethods are relatively time and cost effective whenworkingon large area and are reasonably user-friendly for geomorphologists.
The efficiency of the electrical resisitivity method mainly dependson the electrical resistivity contrast induced by the soil. This contrastcan be due to variations in the lithology, theweathering, an increase inwater content and presence of awater table (Jongmans andGarambois,2007). Numerous papers have dealt with this electrical method toassess, in clayey or metamorphic environments, the depth and ge-ometry of complex landslides, to identify the discontinuity between

157V. Naudet et al. / Engineering Geology 98 (2008) 156–167
the landslide material and bedrock, and to locate possible slidingsurfaces (Perrone et al., 2004; Lapenna et al., 2005; Meric et al., 2005;Sass et al., 2008). Thanks to the high variability of electrode spacingsand configurations, Agnesi et al. (2005) and Lebourg et al. (2005) usedthe electrical resistivity methods to study deep-seated landslide.
The self-potential method (SP) involves the passive measurementof the electrical potential distribution at the ground surface of the Earthwith non-polarisable electrodes. SP anomalies are associated with dif-ferent charge polarization mechanisms occurring at depth. In the caseof landslides, the SP method is sensitive to groundwater flow throughthe electrokinetic effect (see therein Lorne et al.,1999; Revil et al.,1999).As concentratedwater seepage andhigh level of groundwater are causesin landslides triggering, drainage systems are often installed. Therefore,detecting electrokinetic effect due to water seepage based on SP surveycan allow zoning of infiltrating water recharge and run-off areas, andcan determine the extent of effects of subsurface drainage works. Inter-esting results have been obtained in landslide areas using SP method(Bogoslovsky and Ogilvy, 1977; Bruno andMarillier, 2000). Thanks to SPmaps, Perrone et al. (2004) and Colangelo et al. (2006) described themain patterns of the subsurface fluid flow in a clayey landslide, locatingsource and accumulation areas. Combined with further geophysicalmethods, Meric et al. (2005) performed SP profiles and observed sharpSP variations at the boundaries of a large rocky landslide and strongpositive anomalies over the high motion zone.
In this paper, we present a combined geoelectrical (ERT and PS)geomorphological and geotechnical (boreholes and inclinometer) inves-tigation of one of the most important landslides happened between theend of February and the beginning of March 2005 on Bosco Piccolocountryside, 5 km far fromPotenza town,along the axial zoneof southernApennines chain (Fig. 1). Compared to previous work, the novelty of thispaper results in the self-potential method, which has been appliedto delineate the limit of clayey landslide limits and to determine the
Fig. 1. Geographical location of the study area in the Basilicata region, and the Bosco Piccolo lafigure legend, the reader is referred to the web version of this article.)
efficiency of a drainage network installed just after the landslide events.In addition the sliding surface is not occurring at a lithological interface.
2. Study area
2.1. Geological and geomorphological setting
The Bosco Piccolo landslide is located along the southern borderof the Cozzo Staccata–Piano Grande ridge that divides the hydrographicbasin of Tiera river (left hand tributary of Basento river) from that ofArvo river (right hand tributary of Bradano river). The slope is mainlycharacterized by the oldest Apennine formational units (Cretaceous–mid-lower Miocene) mainly represented by clayey–marly–arenaceousdeposits (Argille Varicolori Formation — AVF), and by marly limestonesof the Corleto Perticara Formation (CPF lower Miocene–Oligocene,(Pescatore et al., 1988), both particularly susceptible to landsliding(Fig. 2) as shown by Fig. 3. Besides, the Corleto Perticara Fm. defines thelocal morphology with calcareous ridges less erodible than the sur-rounding clayey deposits. In this area, the average annual temperatureis 12 °C and average rainfall ranges between 650 and 800 mm/year.Nevertheless, during the last fifty years, more extreme events charac-terized by an increase in the rainfall-snowfall intensity and a progres-sive decrease in rainy days, have been recorded. The lithology of thesubstratum (clayey–marly–arenaceous) and theextrememetereologicalevents are the two main factors responsible for the slope evolution andlandslides triggering of Bosco Piccolo countryside.
The landslide hazard scenario was mapped during the last sixteenyears through an integrated approach of geomorphological field surveysand the interpretation of multiple sets of stereoscopic aerial photo-graphs (1954–55, 1989, 1990, 1999, 2001 and 2004). The results showthat thewhole slope, onwhich the village is located, has been repeatedlyaffected by landslide movements during the last fifty years (Fig. 3).
ndslide (in red in the left window). (For interpretation of the references to colour in this

Fig. 2. Geological schematic map of the study area. Geophysical investigations, boreholes, topographic lines and position of the landslide deduced from geomorphological surveys arealso indicated. Boreholes stratigraphy is also indicated with a related to the weathered Varicolour Clays, b the Varicolour Clays with calcareous lithofacies, and c the Varicolour Clayswith clay–marly lithofacies.
158 V. Naudet et al. / Engineering Geology 98 (2008) 156–167
One of the causes of the Bosco Piccolo landslide triggering was theintense and continuous snowfall occurred between the end ofJanuary and the middle of March 2005, where continuous snowfallof 72 h have been also recorded (Fig. 4). Moreover, these events havebeen alternated to brief warmer periods during which a quicksnowmelt occurred and a great amount of water permeated into theclayey–marly deposits of the slope. This process determined a quicksoil saturation, inducing an increase in weight and in pore-waterpressures, due to the addition of water, and the overloaded of theslopes which, reaching their limit equilibrium, collapsed with pro-gressive downslope breaking (Fig. 5). The Bosco Piccolo landslidedeveloped progressively between the 24 and 25 February 2005 (firstdetachment) along the neo-formation shear-surface, showing thefirst collapse-zones below the main road, and then retrogressedupward with secondary detachment during the following week(Fig. 4 and 5).
After the first and most important sliding, classified according toCruden and Varnes (1996) as complex type (rotational and mudflow),the up-slope areas have been involved in the mass movement with aretrogressive evolution (Fig. 5). Besides, along the involved slope a lotof counterslopes and compressive structures have been generated bythe rotational movement of the landslide body with concavo-convexsoil deformation and tension cracks, inducing the progressive forma-tion of a wide landslide lake 3 m deep. The 4 ha of surface involved inthe mass movement showed a progressive enlarging towards theflanks, as testified by several trenches at the margins of the landslidebody (Fig. 5). In May 2005, after the landslide event, a drainage net-work was designed on the site to reduce the groundwater level andhydraulic pressures along the slope, which are determining para-meters in the instability of clayeymaterials. This network is composedof around 2m large trenches carried out in the southern portion of thelandslide, where high water content have been measured (Table 1).

Fig. 3. Multitemporal landslide map showing the events occurred during last fifty years (1955–2005) in the study area.
159V. Naudet et al. / Engineering Geology 98 (2008) 156–167
After this detailed field inspection, including geomorphologicalanalyses of the landslide complex, three boreholes (B1, B2 and B3) withone inclinometer (B2) and one Casagrande piezometer (B3) were re-alized by the municipality of Potenza town (location on Fig. 2). Then,electrical resistivity and self-potential surveys have beenperformed onMarch and October respectively. In the following section, a descriptionof these two geoelectrical methods is given with a critical analysisof their limits and of the acquisition strategies than can release theirreliability in the present context.
Fig. 4. Daily variation of the height of snow–mantle between January and March 2005, whstructural damages South of the Bosco Piccolo and illustrating the landslide main scarp evo
2.2. Design of the geoelectrical survey
2.2.1. Electrical resistivity tomography (ERT)ERT is an active geoelectrical prospecting technique used to obtain
2D, 3D and 4D (with time) images of the subsurface electrical resistivitydistribution. It has been applied for investigating areas of complexgeology, such as volcanic and geothermal areas (Di Maio et al., 1998),seismotectonic structures (Caputo et al., 2003; Nguyen et al., 2005),and areas of hydrogeologic phenomena and environmental problems
en intense snowfalls were alternated by brief warmer periods (a). Photos representinglution (b).

Fig. 5. Geomorphological features of the landslide (a) deduced from the aerial view (b) and in-field geomorphological analyses with the location of boreholes. Legend: 1) mainrotational scarp, 2) minor rotational scarp; 3) earth and mudflow scarp; 4) counterslopes; 5) tension cracks; 6) longitudinal fault zones; 7) mudflows; 8) shallow shear zones; 9) flowdirection; 10) boreholes. Boreholes stratigraphy is also indicated with a related to the weathered Varicolour Clays, b the Varicolour Clays with calcareous lithofacies, and c theVaricolour Clays with clay–marly lithofacies.
160 V. Naudet et al. / Engineering Geology 98 (2008) 156–167
(Ogilvy et al., 1999; Naudet et al., 2004). Recently, ERT has been used todelineate the geometry of complex landslides (Agnesi et al., 2005;Lapenna et al., 2005; Lebourg et al., 2005;Meric et al., 2005; Godio et al.,2006; Sass et al., 2008).
Technically the ERT is obtained by using different multielectrodearrays, such as the dipole–dipole, Wenner, Schlumberger andWenner–Schlumberger, the choice of which depends on the subsoil,the depth of investigation, the sensitivity to vertical and horizontalchanges in the subsurface resistivity, the horizontal data coverage andthe signal strength (Loke, 1999). The current is injected into theground through a couple of electrodes, and the resulting potentialdifferences are measured between another couple of electrodes at thesurface. The mathematical combination between electric currents andvoltage measurements provides the apparent resistivity values. Usingthe algorithm RES2DINV proposed by Loke and Barker (1996) theapparent resistivity values are inverted in true resistivity values. Theinversion routine is based on the smoothness constrained least-squares inversion implemented by using a quasi-Newton optimisation
Table 1Synthesis of the main information linked and deducted from boreholes drilling
Borehole Maximumdepth (m)
Depth of the waterlevel (m)
Sample Depth Moisturecontent (%)
Observat
B1 10 Dry Up-slopethe first d
B2 20 Between 1.5 and 7 1 17.6–18 13.6 LandslideB3 20 Between 1.8 and 5 1 5–5.4 35 Landslide
2 12.4–12.4 12 Landslide3 15–15.3 11 Landslide4 19–19.5 16,5 Unweath
technique. The subsurface is divided into rectangular blocks, thenumber of which corresponds to the number of measurement points.The optimisation method adjusts the 2D resistivity model trying toiteratively reduce the difference between the calculated andmeasuredapparent resistivity values. The root-mean-squared (RMS) errorprovides a measurement of this difference.
We applied this method in order to depict the geometric features ofthe landslide and to estimate the thickness of themobilizedmaterial.Weused twodifferentelectrode configurations (dipole–dipole andWenner–Schlumberger) and a multielectrode system with 32 electrodes, 10 mspacing, connecting to a georesistivimeter Syscal R2 for data acquisitionand the RES2DINV software (Loke and Barker, 1996) for data inversion.The dipole–dipole array configuration was chosen for its depthpenetration and good resolution for lateral heterogeneities and theWenner–Schlumberger for its robustness and lowsensitivity (Dahlin andZhou, 2004). Two tomographies, 310 m long and 25–30 m deep, wereoriented transversally to the landslide body (profiles E2 and E3), whilethe other one (profile E1), 600m long and25–30mdeep,wasperformed
ion Sliding surfacedepth (m)
Monitoring measure instruments
area not involved inetachmentbody (degraded weathered AVF) 18–19 Inclinometerbody (degraded weathered AVF) 14–15 Casagrande Piezometerbody (degraded weathered AVF)body (degraded weathered AVF)
ered substratum (AVF and CPF)

161V. Naudet et al. / Engineering Geology 98 (2008) 156–167
along the main landslide axis (location on Fig. 2). These three longprofiles were obtained by using the roll-along acquisition technique.
2.2.2. Self potential measurements (SP)The self-potential method (SP) involves the passive measurement
of the electrical potential distribution at the ground surface of theEarth with non-polarisable electrodes. This method maps theelectrical potential associated with different charge polarizationmechanisms occurring at depth. These mechanisms can be due toan electrokinetic coupling (Birch, 1998; Rizzo et al., 2004), electro-chemical coupling like diffusion of ionic species (Maineult et al.,2004), oxide-reduction reactions in the case of contaminants (Naudetet al., 2004) or ore deposits (Corry, 1985); and thermoelectric coupling(Di Maio et al., 1998; Finizola et al., 2004). As concerns the landslide,the main source of the SP signal is usually associated with ground-water flow through the electrokinetic coupling. This phenomenon iscontrolled by the relative motion between the charged mineralsurface (negative in siliceous minerals such as clays) and the excess ofcharges located in the electrical diffuse layer of the pore fluid (Lorne etal., 1999; Revil et al., 1999). In this scheme, positive charges are carriedout in the direction of the fluid flow, producing positive SP anomalieson the surface where water discharge is located and negative SPanomalies in the sites of infiltration. This hydro-electrical conversioncan be detected by self potential surveys and can allow zoning ofinfiltration water recharge and runoff areas. The SP method is non-destructive, fast, low in cost and very simple to implement in the fieldrequiring a high impedance millivoltmeter (108 Ωm internal impe-dance) connecting non-polarisable electrodes through a reel of wire(200 m). In this study, “Petiau” Pb/PbCl2 electrodes were chosen fortheir stability (Petiau, 2000). These electrodes comprise a rod of leadimmersed in kaolinite saturated by KCl/PbCl2 electrolyte. To ensureuniform ground contact between the electrodes, small holes (≈10 cm)were dug at each station, including the base station, and filled with≈50 g of salty bentonite mud. As the soil was dry and rocky, theaddition of bentonite mud improved the electrical contact with theground and averaged the signal over a larger surface area of contact. Inaddition, before and after each series of measurements related to thesame base station, the electrodes were put face to face and then sideby side in the same hole to check the difference in potential. This staticdifference between the electrodes was rather stable and less than2 mV, but we have preferred to remove it from the measurements.Repeated measurements at each station showed that the localvariability was usually +/−2 mV.
The gradient method, also called the “leapfrog” technique, wascombined with the base station configuration to reduce cumulativeerrors by changing the reference too often along the same profile(Corwin, 1989). For this combined technique, one electrode was usedas a fixed electrode while the roving electrode was moved to eachmeasurement station to scan the electrical potential at the groundsurface. The base station was changed each 200 m. We first per-formed SP measurements on an external loop all around the land-slide with electrode spacing of 50 m. Then, seven profiles have beenperformed perpendicular to the landslide with an electrode spacingof 20 m. The positions of the SP data points and profiles are locatedon Fig. 2.
To obtain a consistent map, survey lines were interconnectedat numerous tie-in points to form loops. The quality of the mea-surements can be checked using the fact that the sum of thepotential drops should go to zero along a closed loop outside thesource region (Kirchoff's law). If not, the small residual voltagedifferences (closure errors usually b5 mV) were redistributed overthe base stations of the loops, closing the SP loop. Then, all theSP data were referenced to an unique base station at the north-eastern part of the studied area. Finally, using a contour lines rep-resentation, we obtained the distribution of the electrical potentialas a SP map.
3. Results and discussion
3.1. Geotechnical and geomorphological analyses
The detailed field survey, including geomorphological analysis of thelandslide complex is reported on Fig. 5 with the delineation of thelandslide. These analyses show that the landslide involved about 4 hawith a total soil volume of 350,000 m3 and has severely damaged 80%of the buildings (in red on Fig. 5). The total soil volume has beendetermined on the basis of geometrical reconstruction started from theoutcropping first detachment shear surface and borehole stratigraphiclogs. The landslide area extends towards SE from 814 m above s.l. to720 m above s.l. and is approximately 700-m long and 200-m wide.Three boreholes between 10 and 20m depth have been performed afterthe event between May and June 2005. They permitted to deduce thestratigraphy and gave direct information on the depth of the landslidesliding surface.Moisture contentwas alsomeasured fromsome samplescollected from these boreholes (Table 1). Amaximumof 35% ofmoisturecontent has been measured at around 5 m depth in borehole B3.Borehole B1was dry while in boreholes B2 and B3 water was detected at1.5 m and 1.8 depths respectively. The main shear surface has beendepicted at amaximum depth of 19m in boreholes B2 and at 15m in B3.A landslide monitoring has been carried out with an inclinometerinstalled in B2. It showed a total displacement of 18.5 cm between 6 and8 m depth during three weeks (June 2005) of observation. Due to thesehigh displacements, the inclinometer was broken after 3 months.
3.2. Electrical resistivity tomography
The ERTs have been performed one month after the event inMarch, when the hydrological conditions of the slope were stillaltered. In particular, a high saturation degree characterized the area(35% of moisture content, Table 1), as also confirmed by piezometricdata and in-field observations. The results obtained from the dipole–dipole and the Wenner–Schlumberger arrays show almost the sameresistivity pattern but with high RMS values. As we have a goodagreement between these two arrays, it seems that the high RMSvalues are not due to the array but possibly to the complex lithologicalnature and the hydraulic conditions of the terrains. We also attributethese high RMS values to the shallow disturbed material involved inthe landslide, which could have decreased the electrode-groundcoupling, and to the non linearity of the profile E1. As the formerpresents the ability to detect vertical resistivity discontinuities and togive a good horizontal coverage, in this paper only dipole–dipole ERTswill be discussed.
Starting from a preliminary inspection of all the ERTs (Fig. 6), weobserved aweak variability of the electrical resistivity, showing valueslower than 150Ωmand a poor resistivity contrast between conductive(ρb20 Ω m) and relatively resistive (ρN20 Ω m) material. The ERT E1(AA′) (Fig. 6), carried out parallel to the landslide axis, shows in thefirst100 m from the origin of the profile a relatively high resistive material(20bρb50 Ω m) associated to terrains not involved in the mainmovement. In the central part, the tomography shows very low re-sistivity values (ρb15 Ω m) located just above the roto-translationalmovement. Below this conductivematerial of lenticular shape, a strongresistive structure (ρN50 Ω m) is observed, with an outcrop between160–180 m, and an increase in resistivity with depth (ρN100 Ω m).Considering the lithology of the outcropping terrains and the threeboreholes stratigraphy, resistive material (ρN50 Ω m) could be asso-ciated to the weathered calcareous lithofacies (AVF substratum), andconductive material (ρb15 Ω m) to the clay–marly lithofacies of thesame formation. Very high resistive superficial nuclei (ρN127 Ω m)may be due to the presence of gabionades.
According to the depth of the sliding surface measured on bore-holes B2 (18–19 m) and B3 (14–15 m) (Table 1), we drawn on thetomographies a dashed black line as the hypothetic sliding surface. On

Fig. 6. Electrical resistivity tomographies obtained after inversionwith topographical correction (location on Fig. 2). Profile E1 (AA′) carried out parallel to the landslide body axis withstratigraphical data comparison (boreholes B1, B2 and B3). Profile E2 (BB′) carried out transversally to the landslide body. Profile E3 (CC′) carried out transversally to the landslide bodywith stratigraphical data comparison (borehole B3). Dashed lines represent the supposed slipping surfaces, obtained by combining resistivity, stratigraphical and in-fieldgeomorphological information.
162 V. Naudet et al. / Engineering Geology 98 (2008) 156–167

Fig. 7. Self-potential profiles transversal to the landslide body (see location on Fig. 2). The western and eastern boudaries of the landslide body are reprensented by the arrowsW andE respectively. The crosses indicate the location of the intersection with the drainage trenches.
163V. Naudet et al. / Engineering Geology 98 (2008) 156–167
profile E1 (AA′) this line seems to coincidewith the resistivity contrastbetween the above conductive zone (clay–marly lithofacies) and themore resistive bedrock (calcareous lithofacies, AVF substratum) not in-volved in the slide. We also drawn a thin layer with moderate resistivevalues (30bρb70 Ω m) in the shallow part of the tomography, whichcould be associable with the material involved in a superficial earth-flow. We can also notice that the counterslope, which is marked inthe surface by the topography, is also detectable in depth. Indeed, ataround 330 m from the beginning of the profile E1, the conductivematerial (i.e. clay–marly lithofacies) is lightlymore resistant just abovethe location of the counterslope.
This conductivematerial is also observed in the central portion of theprofile E2 (BB'), which has been carried out along the main road of thevillage and outside of the landslide. Its shape is also lenticular and itsdepth can be estimated at around 20 m. Resistive material (ρN50 Ω m)related to the calcareous lithofacies, characterizes the bottom and thelateral boundaries of the tomography. Some small resistive nuclei(50bρb80 Ω m) are embedded in the conductive material. On thistomography, the discontinuity between resistive and conductivematerial could be related to a lithologic boundary or an old slide surface.
The ERT E3 (CC') (Fig. 6), carried out also transversally to thelandslide, still shows the conductive zone (ρb20 Ω m) characterizedby an irregular shape and enclosed in the resistive zone. The com-parison with stratigraphical data from borehole B3 highlights that theorganic soil and the weathered AVF are characterized by resistivityvalues (20bρb60Ωm) higher than the unweathered AVF (ρb20Ωm).From borehole B3, stratigraphical data report a sliding surface at adepth of about 14 m inside the clay–marly lithofacies of AVF (Table 1).The ERT did not show a strong resistivity contrast at the same depthmainly because the sliding surface is located in the clay–marlylithofacies and not at the boundary between two different lithofacies.Indeed, the tomography has been carried out just after the event,when a high saturation degree characterized the hydrological condi-tions of the terrains. Moreover, the presence of old landslide bodiescould have contributed to the chaotic resistivity pattern showed in theERT.
To conclude, the transversal electrical resistivity tomographieshave detected a lenticular shape conductive material related to theclay–marly lithofacies, in which the sliding surface occurred. Thanksto calibration with borehole data, a hypothetic sliding surface, with a

164 V. Naudet et al. / Engineering Geology 98 (2008) 156–167
maximum depth at 18–19 m, has been drawn. The counterslope of theBosco Piccolo landslide has also been identified from this tomography.From the other tomographies, the sliding surface was hardly de-tectable. In addition, when the sliding surface is not between twolithological interfaces, wewere not able to detect sliding surfaces fromelectrical images derived on a fast clayey landslide, mainly becausethese deformations did not create observable resistivity contrasts.
3.3. Self potential measurements
Fig. 7 presents six transversal SP profiles performed with a 20 melectrode spacing (location on Fig. 2). These profiles show a SP mag-nitude varying from −14 to 4 mV. This magnitude is weak comparedto results obtained by Perrone et al. (2004) at the Varco d'Izzo clayeylandslide in Italy (SP from −120 to +120mV) and byMeric et al. (2005)across the rocky landslide movement of Séchilienne in France (SPfrom −150 to +350 mV). These variations of SP magnitude betweenthese different works can be explained by 1) the dynamic of the watermovement, which is more important in fractures and faults in rockymaterials than in clayey material, 2) the infiltration, which is moreimportant during dry seasons, and 3) the fluid conductivity as itdecreases the electrokinetic coupling effect (Revil et al., 1999), 4) thepresence of high resistive rock on Séchilienne mass movement whichfavours the high SP anomaly. The difference between the two clayeylandslides (this study and Perrone et al., 2004) can be explained by alowwater level inside the landslide and aweak groundwater dynamicfor our study as SP measurements were performed after dry months.Indeed, during spring periodswhen rains are important, Lapenna et al.(2003) and Jardani et al. (2006) have observed more significantSP anomalies after a dry period, when evaporation can exceedinfiltration.
Fig. 8. Self-potential map obtained from the interpolation of 140measurements (red dots). Elby red lines. The drainage system is represented by the thick black line and the boundaries olandslide lake are also represented.
On profiles presented on Fig. 7, the boundaries of the landslidedetermined from geomorphologic analyses are also indicated. As SPvariations are weak, it is difficult to define the limits of the landslidefrom these profiles. Nevertheless, on profiles P3, P4 and P6, some SPvariations are geographical correlated with the boundaries of thelandslide. Meric et al. (2005) have also observed SP variations at bothends of the Séchelienne landslide due to geological structure of themovement (fracturing, lead–zinc and quartz veine). Our variationsmay be associated either to a contrast of groundwater flow betweenthe disturbed material of the landslide body and the in situ stableground, and/or to an electrical resistivity contrast between these twomaterials due to variation in water content and geology. The electricalresistivity tomography E3 (Fig. 6), which has beenperformed along theSP profile P4 shows a more resistive body (50 Ω m) at the distance180m of the profile compared to the lenticular conductive body in thecentral part of the tomography (10Ωm). This contrast can be explainedby higher groundwater content and clay content in the landslide body.
In past, to prevent landslides, farmers have installed a drainagenetwork at 2 m deep. One of these trenches has been detected on theERT profile E3 (Fig. 6). At present some portions of this old drainagenetwork are full of undrained water, which deals with an increase ofthe heaviness of the slope and then favours the landslide triggering.After the landslide of February 2005, a newdrainage system composedof trenches has been installed to reduce the hydraulic pressure alongthe slope and to decrease the groundwater level (location on Fig. 8).Due to this drainage, the electrokinetic effect should be reduced. FromSP data obtained at a slope landslide before and after groundwatercontrol works were completed, Okuyama et al. (2005) observed sucha decrease in the SP magnitude around drainage pipes. From our SPprofiles, no clear SP decreases have been identified at the location ofthe drainages trenches (black crosses on Fig. 7). This can be explained
ectrical resistivity tomographies (ERT) are located by blue lines and self potential profilesf the landslide by the black thin line. Main and minor rotational scarp features and the
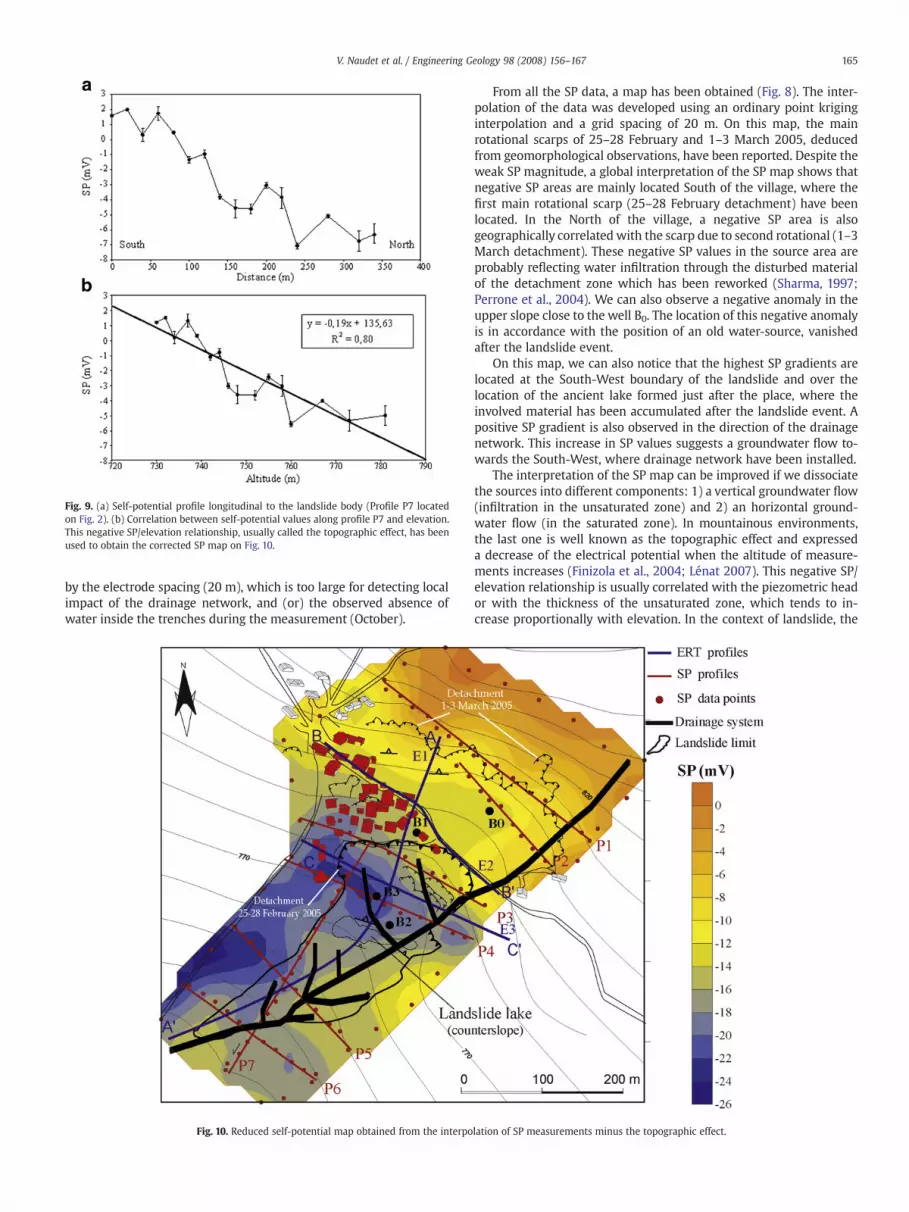
Fig. 9. (a) Self-potential profile longitudinal to the landslide body (Profile P7 locatedon Fig. 2). (b) Correlation between self-potential values along profile P7 and elevation.This negative SP/elevation relationship, usually called the topographic effect, has beenused to obtain the corrected SP map on Fig. 10.
165V. Naudet et al. / Engineering Geology 98 (2008) 156–167
by the electrode spacing (20 m), which is too large for detecting localimpact of the drainage network, and (or) the observed absence ofwater inside the trenches during the measurement (October).
Fig. 10. Reduced self-potential map obtained from the interpo
From all the SP data, a map has been obtained (Fig. 8). The inter-polation of the data was developed using an ordinary point kriginginterpolation and a grid spacing of 20 m. On this map, the mainrotational scarps of 25–28 February and 1–3 March 2005, deducedfrom geomorphological observations, have been reported. Despite theweak SP magnitude, a global interpretation of the SP map shows thatnegative SP areas are mainly located South of the village, where thefirst main rotational scarp (25–28 February detachment) have beenlocated. In the North of the village, a negative SP area is alsogeographically correlated with the scarp due to second rotational (1–3March detachment). These negative SP values in the source area areprobably reflecting water infiltration through the disturbed materialof the detachment zone which has been reworked (Sharma, 1997;Perrone et al., 2004). We can also observe a negative anomaly in theupper slope close to the well B0. The location of this negative anomalyis in accordance with the position of an old water-source, vanishedafter the landslide event.
On this map, we can also notice that the highest SP gradients arelocated at the South-West boundary of the landslide and over thelocation of the ancient lake formed just after the place, where theinvolved material has been accumulated after the landslide event. Apositive SP gradient is also observed in the direction of the drainagenetwork. This increase in SP values suggests a groundwater flow to-wards the South-West, where drainage network have been installed.
The interpretation of the SP map can be improved if we dissociatethe sources into different components: 1) a vertical groundwater flow(infiltration in the unsaturated zone) and 2) an horizontal ground-water flow (in the saturated zone). In mountainous environments,the last one is well known as the topographic effect and expresseda decrease of the electrical potential when the altitude of measure-ments increases (Finizola et al., 2004; Lénat 2007). This negative SP/elevation relationship is usually correlated with the piezometric heador with the thickness of the unsaturated zone, which tends to in-crease proportionally with elevation. In the context of landslide, the
lation of SP measurements minus the topographic effect.

166 V. Naudet et al. / Engineering Geology 98 (2008) 156–167
most interesting component is related to infiltration as it can triggerslandslide events. Therefore, if ones can estimate the topographiceffect, the corrected SP map will mainly reflect infiltration areas.Fig. 9a presents the SP values along profile P7 in the direction parallelto the landslide body and Fig. 9b SP versus elevation of each mea-surement along this profile. The correlation obtained between SPand elevation was used to reduce the field SP data from this topo-graphic effect. The resulting reduced SP map is presented on Fig. 10.This topographic correction on the SP map highlights the infiltrationareas characterized by the lower SP values in the South West portionof the landslide. We can also notice that in the surroundings of thedrainage trenches the variations of the SP values are less pronounced,probably due to a weak infiltration in this area. Therefore, based onthese remarks, we can suppose that the new drainage trenchesinstalled on this site are efficient.
4. Conclusions
An integrated multidisciplinary geomorphologic and geophysicalapproach has been adopted to study the Bosco Piccolo complexlandslide. To investigate and monitor the landslide body, combinedelectrical resistivity tomography and self-potential measurementshave been carried out and calibrated with boreholes stratigraphy.
Information coming from boreholes had permitted to depict themain shear at a maximum depth of 19 m. The electrical resistivitytomographies allowed us to characterize the clayey deposits involvedin the old mass movement. Less easy was the identification of therecent sliding surfaces. Only the integration between geoelectricaland stratigraphical data allowed us to draw the hypothetic slidingsurface, because the sliding is occurring inside the clayey formationand not between two lithological interfaces. The high velocity ofmass movement creates a weak dislocation of the sliding mass asthere is no observable resistivity contrast. Despite the weak mag-nitude of the self-potential signal, some landslide boundaries havebeen detected on transversal profiles. Negative SP anomalies ob-served on the map were located in the main scarp under the village.Finally, the efficiency of the drainage system predisposed on thelandslide body to drain the water and limit water infiltration wasevaluated thanks to the SP map.
The results of this investigation illustrate the benefits of such anintegrated approach to characterize the area involved in the massmovement and the groundwater flow responsible of the landslide.This integrated approach seems to constitute also a promising tool,especially if the geophysical methods are used in time-lapse, toevaluate and monitor the geometry, volume and dynamic of thesliding mass. The SP technique, in particular, could bring relevantinformation on the efficiency of the drainage system and the phe-nomena of interstitial overpressures. We plan to set up permanentSP electrodes to monitor the groundwater flow processes inside thelandslide body and therefore delineate potentially remobilizedareas.
Acknowledgements
We thank the Institute of Methodologies for EnvironmentalAnalysis for their support and Machiella Rossana for her help in thefield. We also thank the Editor and the two referees for their helpfulcomments to improve the paper.
References
Agnesi, V., Camarda, M., Conoscenti, C., Di Maggio, C., Diliberto, I.S., Madonia, P.,Rotigliano, E., 2005. A multidisciplinary approach to the evaluation of themechanism that triggered the Cerda landslide (Sicily, Italy). Geomorphology 65,101–116.
Birch, F.S., 1998. Imaging the water table by filtering self-potential profiles. GroundWater 36, 779–782.
Bichler, A., Bobrowsky, P., Best, P., Douma, M., Hunter, J., Calvert, T., Burns, R., 2004.Three-dimensional mapping of a landslide using a multi-geophysical approach: theQuesnel Forks landslide. Landslide 1, 29–40.
Boenzi, F., Giura Longo, R., 1994. La Basilicata: i tempi, gli uomini e l'ambiente. EDIPUGLIA,p. 250.
Bogoslovsky, V.A., Ogilvy, A.A., 1977. Geophysical methods in the investigation oflandslides. Geophysics 42, 562–571.
Bruno, F., Marillier, F., 2000. Test of high-resolution seismic reflection and othergeophysical techniques on the Boup Landslide in the Swiss Alps. Surv. Geophys. 21,333–348.
Caputo, R., Piscitelli, S., Oliveto, A., Rizzo, E., Lapenna, V., 2003. High-resolutionresistivity tomographies in Active Tectonic studies. Examples from the TyrnavosBasin, Greece. J. Geodyn. 36, 19–35.
Colangelo, G., Lapenna, V., Perrone, A., Piscitelli, S., Telesca, L., 2006. 2D Self-potentialtomographies for studying groundwater flows in the Varco d'Izzo landslide (Basilicataregion, southern Italy). Eng. Geol. 88, 274–286.
Corry, E., 1985. Spontaneous polarization associated with porphyry sulfide mineraliza-tion. Geophysics 50, 1020–1034.
Corwin, R.F., 1989. Data quality for engineering self-potential surveys. Proceedings ofInternational Symposium on the detection of subsurface flow phenomena, LectureNotes in Earth Sciences. Springler-Verlag, Berlin, pp. 51–72.
Cruden, D.M., Varnes, D.J., 1996. Landslide types and processes. In: Turner, A.K.,Schuster, R.L. (Eds.), Landslides, Investigation and Mitigation. TransportationResearch Board, Special Report 247, Washington D.C. , pp. 36–75.
Dahlin, T., Zhou, B., 2004. A numerical comparison of 2D resistivity imaging with tenelectrode arrays. Geophys. Prospect. 52, 379–398.
Di Maio, R., Mauriello, P., Patella, D., Petrillo, Z., Piscitelli, S., Siniscalchi, A., 1998. Electricand electromagnetic outline of the Mount Somma–Vesuvius structural setting.J. Volcanol. Geotherm. Res. 82, 219–238.
Finizola, A., Lénat, J.F., Macedo, O., Ramos, D., Thouret, J.C., Sortino, F., 2004. Fluidcirculation and structural discontinuities inside Misti volcano (Peru) inferred fromself-potential measurements. J. Volcanol. Geotherm. Res. 135, 343–360.
Godio, A., Strobbia, C., De Bacco, G., 2006. Geophysical characterisation of a rockslide inan alpine region. Eng. Geol. 83, 273–286.
Guzzetti, F., 2000. Landslide fatalities and the evaluation of landslide risk in Italy. Eng.Geol. 58, 89–107.
Hack, R., 2000. Geophysics for slope stability. Surv. Geophys. 21, 423–448.Jardani, A., Dupont, J.P., Revil, A., 2006. Self-potential signals associatedwith preferential
groundwater flow pathways in sinkholes. J. Geophys. Res. 111, B09204, doi:10.1029/2005JB004231.
Jongmans, D., Garambois, S., 2007. Geophysical investigation of landslides: a review.Bull. Soc. Géol. Fr. 178 (2), 101–112.
Lapenna, V., Lorenzo, P., Perrone, A., Piscitelli, S., Sdao, F., Rizzo, E., 2003. High-resolutiongeoelectrical tomographies in the study of the Giarrossa landslide (Potenza,Basilicata). Bull. Eng. Geol. Environ. 62, 259–268.
Lapenna, V., Lorenzo, P., Perrone, A., Piscitelli, S., Rizzo, E., Sdao, F., 2005. Case History 2Delectrical resistivity imaging of some complex landslides in the Lucanian Apenninechain, southern Italy. Geophysics 70 (3), B11–B18.
Lazzari, M., Geraldi, E., Lapenna, V., Loperte, A., 2006. Natural hazards vs. human impact:an integrated methodological approach in geomorphological risk assessing on Tursihistorical site, southern Italy. Landslides 3 (4), 275–287.
Lebourg, T., Binet, S., Tric, E., Jomard, H., El Bedoui, S., 2005. Geophysical survey toestimate the 3D sliding surface and the 4D evolution of the water pressure on partof a deep seated landslide. Terra Nova 5, 399–406.
Lénat, J.-F., 2007. Retrieving self-potential anomalies in a complex volcanic environ-ment: an SP/elevation gradient approach. Near Surface Geophysics, pp. 161–170.
Loke, M.H., 1999. RES2DINV ver. 3.42, Geoelectrical Imaging 2D & 3D, User Manual.Loke, M.H., Barker, R.D., 1996. Rapid least-squares inversion of apparent resistivity
pseudosections by a quasi-Newton method. Geophys. Prospect. 44, 131–152.Lorne, B., Perrier, F., Avouac, J.P., 1999. Streaming potential measurements: 1. Properties
of the electrical double layer from crushed rock samples. J. Geophys. Res. 104,17857–17877.
Maineult, A., Bernabé, Y., Ackerer, P., 2004. Electrical Response of Flow, Diffusion, andAdvection in a Laboratory Sand Box. Vadose Zone Journal 3, 1180–1192.
Meric, O., Garambois, S., Jongmans, D., Wathelet, M., Chatelain, J.L., Vengeon, J.M., 2005.Application of geophysical methods for the investigation of the large gravitationalmass movement of Séchilienne, France. Can. Geotech. J. 42, 1105–1115.
Naudet, V., Revil, A., Rizzo, E., Bottero, J.Y., Bégassat, P., 2004. Groundwater redoxconditions and conductivity in a contaminant plume from geoelectrical investiga-tions. Hydrol. Earth Syst. Sci. 8 (1), 8–22.
Nguyen, F., Garambois, S., Jongmans, D., Pirard, E., Locke, M., 2005. Image processing of2D resistivity data to locate precisely faults. J. Appl. Geophys. 57, 260–277.
Ogilvy, R., Meldrum, P., Chambers, J., 1999. Imaging of industrial waste deposits andburied quarry geometry by 3-D resistivity tomography. Eur. J. Environ. Eng.Geophys. 3, 103–113.
Okuyama, T., Nakazato, H., Kuroda, S., Takeuchi, M., 2005. Change in Self-potential Dueto Groundwater Control Works for Landslide Prevention. Technical Report of theNIRE, N°203, March 2005.
Perrone, A., Iannuzzi, A., Lapenna, V., Lorenzo, P., Piscitelli, S., Rizzo, E., Sdao, F., 2004.High-resolution electrical imaging of the Varco d'Izzo earthflow (southern Italy).J. Appl. Geophys. 56, 17–29.
Pescatore, T., Renda, P., Tramutoli, M., 1988. Rapporti tra le unità lagonegresi e le unitàSicilidi nella media valle del Basento (Appennino lucano). Mem. Soc. Geol. Ital. 41,353–361.
Petiau, G., 2000. Second generation of lead–lead chloride electrodes for geophysicalapplications. Pure Appl. Geophys. 157, 357–382.

167V. Naudet et al. / Engineering Geology 98 (2008) 156–167
Piccareta,M., Capolongo, D., Boenzi, F., 2004. Trend analysis of precipitation and droughtin Basilicata from 1923 to 2000 within a southern Italy context. Int. J. Climatol. 24,907–922.
Revil, A., Pezard, P.A., Glover, P.W.J., 1999. Streaming potential in porous media: 1.Theory of the zeta potential. J. Geophys. Res. 104, 20021–20031.
Rizzo, E., Suski, B., Revil, A., Straface, S., Troisi, S., 2004. Self-potential signals associatedwithpumping tests experiments. J. Geophys. Res. 109, B10203.
Sass, O., Bell, R., Glade, T., 2008. Comparison of GPR, 2D-resistivity and traditionaltechniques for the subsurface exploration of the Öschingen landslide, Swabian Alb(Germany). Geomorphology 93, 89–103.
Schrott, L., Sass, O., 2008. Application of field geophysics in geomorphology: Advancesand limitations exemplified by case studies. Geomorphology 93, 55–73.
Sharma, P.S., 1997. Environmental and engineering geophysics. Cambridge UniversityPress.