measurements of spatially averaged ocean surface geophysical parameters using underwater sound...
TRANSCRIPT
1
MEASUREMENTS OF SPATIALLY AVERAGED OCEAN SURFACE GEOPHYSICAL PARAMETERS USING UNDERWATER SOUND INTEGRATED WITH THE POSEIDON MONITORING SYSTEM
M. N. Anagnostoua, J. Nystuenb, E. N. Anagnostoua,c, A. Papadopoulosa, D. Ballasa, K. Nittisa, P. Pagonisa, L. Perivoliotisa, and D. Georgopoulosa
aHellenic Center for Marine Research, 19013 Anavissos, Greece. bApplied Physics Laboratory, University of Washington, Seattle, WT, USA. c
Corresponding Author: Hellenic Center for Marine Research, Institute of Inland Waters, 46.7 km Athinon Souniou Ave., P.O. Box 712, GR-19013, Anavissos Attikis, Greece, tel.: +30 22910 76399 – Fax: +30 22910 76323, email: [email protected]
University of Connecticut, Department of Civil and Environmental, Storrs, CT, USA.
Abstract: One of the most challenge and difficult atmospheric parameters to measure is rain, especially over the oceans, because of its spatial and temporal variability. Since, the last decades, many satellites have been lunched to observe globally the rain variability; however, they have large scale spatial and temporal resolution. Also, there are few surface validation sites over the oceans for calibrating/validating their retrievals. Even though, ocean plays a vital role in the hydrological cycle, till now air-sea feedback mechanisms are not properly resolved by numerical models. Therefore, it is significant to have geophysical (precipitation, wind speed, wind direction, etc.) observations over the oceans that can be used to initialize forecasting models, to improve their numerical parameterisation schemes, and validate satellite retrieval algorithms. Operational monitoring systems provide in real time this required information. However, rain and wind speed observations using raingauges and anemometers installed on buoys are point measurements and may introduce erroneous values in the measurements. A Passive Aquatic Listener (PAL) integrated for first time with an operational oceanographic monitoring (Poseidon) system, in the southwest Ionian Sea buoy. Acoustical measurements of rainfall and wind speed are reported from 500 meters depth, since November 2008. These spatial averaged measurements are compared with the buoy’s surface anemometer and the Hellenic National Meteorological Service C-band radar rainfall measurements. Keywords: Underwater acoustics, rainfall estimation, wind speed measurements, operational oceanography.

2
1. INTRODUCTION
Ambient sound in the ocean is a combination of natural and anthropogenic sounds. Various physical processes including wind, rain, and drizzle are primary sound sources in the frequency range from a few hundred Hertz to 50 kHz. Human generated sounds include ships and sonars, and different marine animals (whales, dolphins, etc.), especially cetaceans, produce sound underwater in this same frequency band. As part of the POSEIDON monitoring and forecasting system the Hellenic Center for Marine Research (HCMR) has acquired an advanced Passive Aquatic Listener (PAL) sensor that can be used to identify and quantify those sources of sound from deep water acoustic measurements. Understanding the distribution and change of oceanic rainfall patterns is a major component of global/regional water cycle and climate change. In addition to rainfall rate we need detailed knowledge of precipitation type (in the forms of convective vs. stratiform precipitation) and drop size distribution (DSD). Satellite-based measurements of rainfall provide global coverage of rainfall distribution [1] however these measurements need to be verified by surface rainfall measurements. The lack of detailed knowledge of DSD is a primary factor that limits the accuracy of radar and satellite rain retrievals [2], [3]. In addition, an understanding and characterization of precipitation microphysics is needed to improve parameterizations in numerical weather prediction (NWP) models (e.g., [4]). Acoustic measurements provide basic information on rainfall science that cannot be provided by satellite observations including high temporal resolution, rainfall classification and DSD. Consequently, these measurements if proven robust and accurate can be used to (1) provide continuous measurements of precipitation characteristics in the open Sea (e.g. Mediterranean region) and (2) as in situ reference to physically validate satellite observations.
One interesting feature of the acoustical measurement is that the listening area for a hydrophone, its effective “catchment basin,” [5] is proportional to its depth, and yet, the signal should be independent of depth if the sound source is uniformly distributed on the sea surface. Thus, the acoustical measurement of rainfall has an inherent spatial averaging that can be compared to the beam filling assumption of radar or satellite measurements of rainfall. Rainfall makes only one of the acoustic signals that are part of the marine ambient sound budget. Other physical processes that can be measured are wind and sea state (bubbles, salinity, and temperature) conditions. Passive acoustic monitoring for marine mammals, especially whales, is critical to ecological studies of these animals. In section 2, we give a brief technical description of the PAL. In section 3, we describe the study area and data associated with the POPSEIDON monitoring system. In section 4, we present the acoustic data and our future work.
2. PASSIVE AQUATIC LISTENER (PAL)
PALs are autonomous acoustic recorders designed to be attached to ocean moorings. They consist of a broadband, low noise omnidirectional (zenith angle) hydrophone (Hi-Tech-92WB), a signal processing board, a low-power microprocessor (Tattletale-8) with a 100 kHz A/D digitizer, a 2 GB memory card and a 60 Amp-hour battery pack. The sampling strategy can be designed to allow autonomous operations for up to one year. Physically a PAL is a cylindrical instrument 76 cm long by 15 cm in diameter. The hydrophone extends from one end. The nominal sensitivity of these instruments is -160 dB relative to 1 V/µPa and the equivalent oceanic background noise level of the pre-amplifier system is about 28 dB relative
3
to 1 µPa2Hz-1
3. PAL DEPLOYED UNDER THE POSEIDON II FRAMEWORK
. Bandpass filters are present to reduce saturation from low-frequency sound (high pass at 300 Hz) and aliasing from above 50 kHz (low pass at 40 kHz). The hydrophone sensitivity also rolls off above its resonance frequency, about 40 kHz. A further sensitivity correction due to the depth of deployment is also present. A data collection sequence consists of a four-second time series collected at 100 kHz.
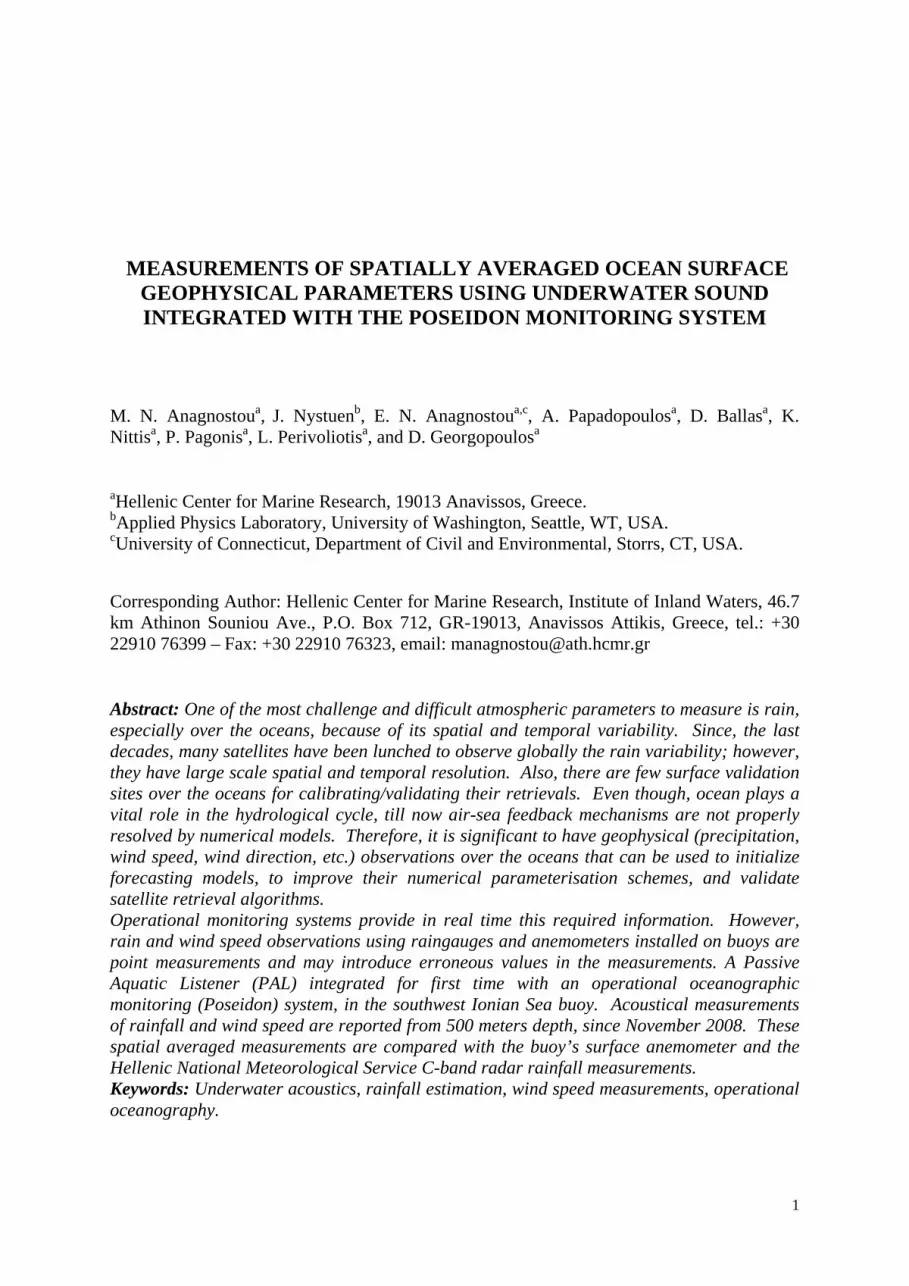
The POSEIDON (http://www.poseidon.ncmr.gr) is a monitoring, forecasting and information system for the Hellenic Seas and Coastal areas. It is operated by the Hellenic Center for Marine Research (HCMR) providing real-time information and forecasts for weather, sea-state, hydrological structure and water quality. The POSEIDON system consists of a network of 11 oceanographic buoys equipped with state of the art physical, chemical and biological sensors deployed in the Aegean and Ionian Seas, and an operational forecasting system. The extension of the POSEIDON system (named POSEIDON II) includes, among other aspects, the deployment of PAL sensors on two of the deep sea POSEIDON buoys (shown in Fig. 1). In POSEIDON II the PALs are connected through inductive modem to the surface buoy providing real-time data to the HCMR operational control center.
3.1. Experimental sites
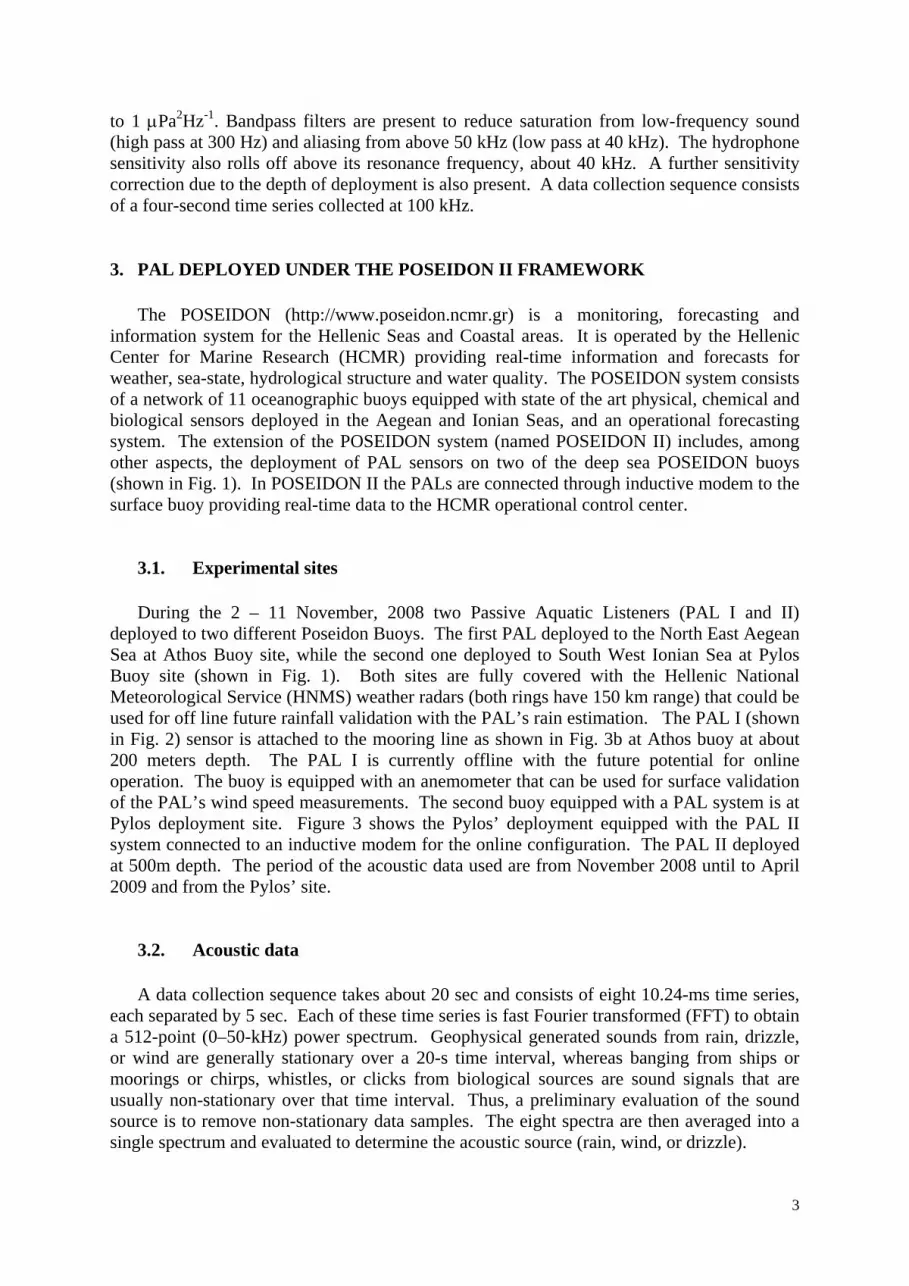
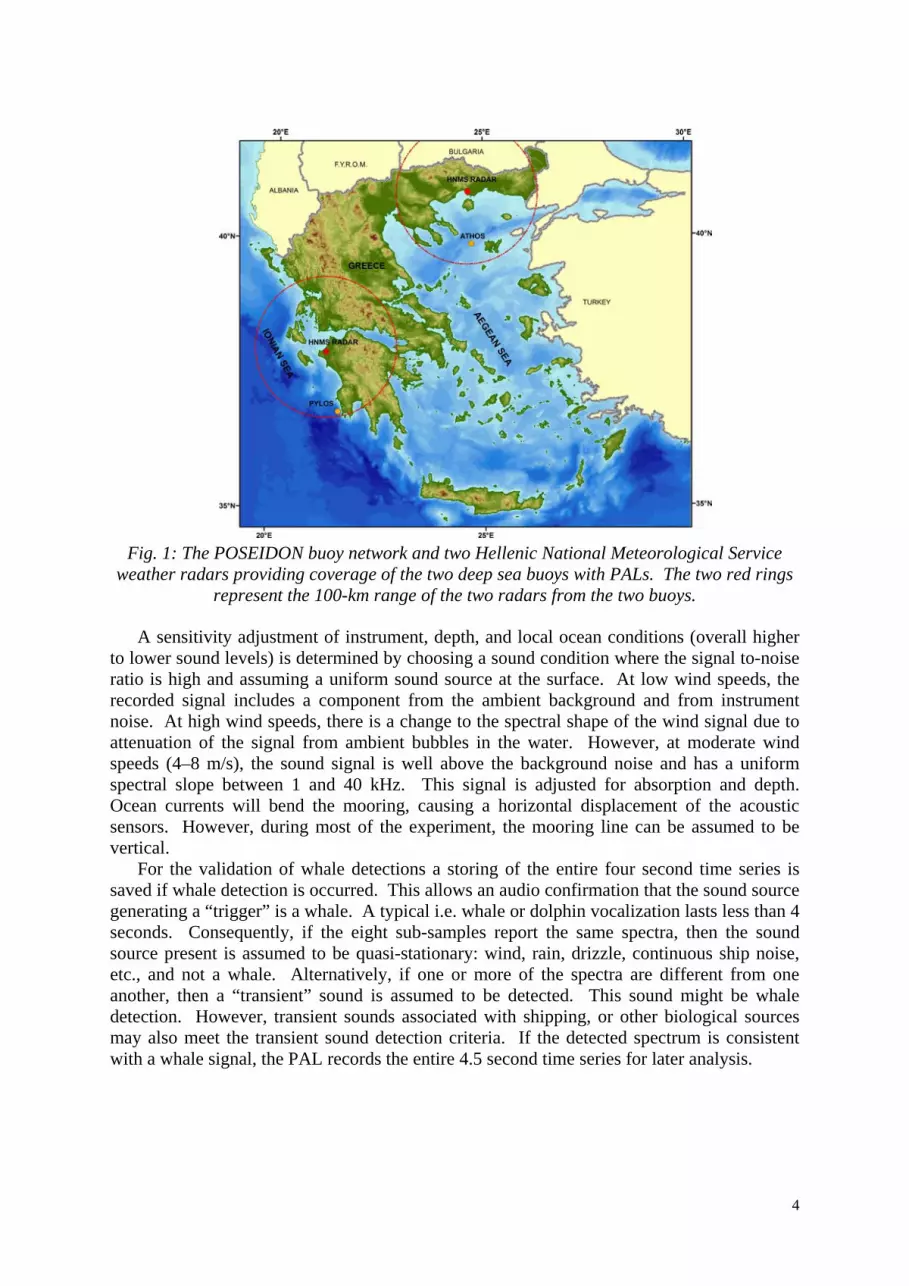
During the 2 – 11 November, 2008 two Passive Aquatic Listeners (PAL I and II) deployed to two different Poseidon Buoys. The first PAL deployed to the North East Aegean Sea at Athos Buoy site, while the second one deployed to South West Ionian Sea at Pylos Buoy site (shown in Fig. 1). Both sites are fully covered with the Hellenic National Meteorological Service (HNMS) weather radars (both rings have 150 km range) that could be used for off line future rainfall validation with the PAL’s rain estimation. The PAL I (shown in Fig. 2) sensor is attached to the mooring line as shown in Fig. 3b at Athos buoy at about 200 meters depth. The PAL I is currently offline with the future potential for online operation. The buoy is equipped with an anemometer that can be used for surface validation of the PAL’s wind speed measurements. The second buoy equipped with a PAL system is at Pylos deployment site. Figure 3 shows the Pylos’ deployment equipped with the PAL II system connected to an inductive modem for the online configuration. The PAL II deployed at 500m depth. The period of the acoustic data used are from November 2008 until to April 2009 and from the Pylos’ site.
3.2. Acoustic data
A data collection sequence takes about 20 sec and consists of eight 10.24-ms time series, each separated by 5 sec. Each of these time series is fast Fourier transformed (FFT) to obtain a 512-point (0–50-kHz) power spectrum. Geophysical generated sounds from rain, drizzle, or wind are generally stationary over a 20-s time interval, whereas banging from ships or moorings or chirps, whistles, or clicks from biological sources are sound signals that are usually non-stationary over that time interval. Thus, a preliminary evaluation of the sound source is to remove non-stationary data samples. The eight spectra are then averaged into a single spectrum and evaluated to determine the acoustic source (rain, wind, or drizzle).
4
Fig. 1: The POSEIDON buoy network and two Hellenic National Meteorological Service
weather radars providing coverage of the two deep sea buoys with PALs. The two red rings represent the 100-km range of the two radars from the two buoys.
A sensitivity adjustment of instrument, depth, and local ocean conditions (overall higher to lower sound levels) is determined by choosing a sound condition where the signal to-noise ratio is high and assuming a uniform sound source at the surface. At low wind speeds, the recorded signal includes a component from the ambient background and from instrument noise. At high wind speeds, there is a change to the spectral shape of the wind signal due to attenuation of the signal from ambient bubbles in the water. However, at moderate wind speeds (4–8 m/s), the sound signal is well above the background noise and has a uniform spectral slope between 1 and 40 kHz. This signal is adjusted for absorption and depth. Ocean currents will bend the mooring, causing a horizontal displacement of the acoustic sensors. However, during most of the experiment, the mooring line can be assumed to be vertical.
For the validation of whale detections a storing of the entire four second time series is saved if whale detection is occurred. This allows an audio confirmation that the sound source generating a “trigger” is a whale. A typical i.e. whale or dolphin vocalization lasts less than 4 seconds. Consequently, if the eight sub-samples report the same spectra, then the sound source present is assumed to be quasi-stationary: wind, rain, drizzle, continuous ship noise, etc., and not a whale. Alternatively, if one or more of the spectra are different from one another, then a “transient” sound is assumed to be detected. This sound might be whale detection. However, transient sounds associated with shipping, or other biological sources may also meet the transient sound detection criteria. If the detected spectrum is consistent with a whale signal, the PAL records the entire 4.5 second time series for later analysis.
5
Fig. 2: The PAL I sensor as a standalone system attached to the Athos Buoy mooring line.
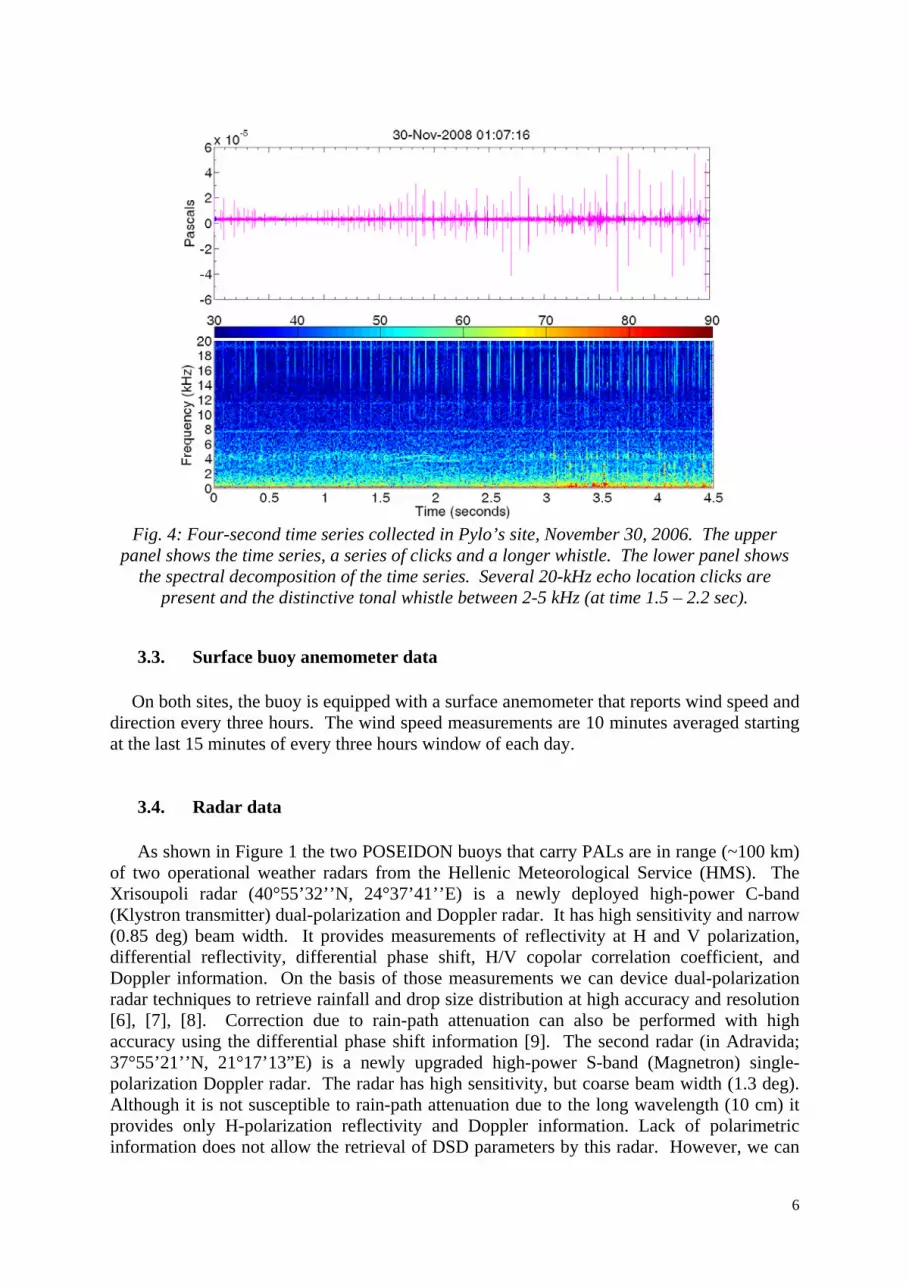
An example of a 4-second time series showing dolphin detection from Pylo’s site is shown in Figure 4. Note the computer memory capacity (2 GB) limits the total number of time series saves to 2200 per deployment. Consequently a rationing code controls when 4-second time series saves are allowed.
Fig. 3: PAL II current (online) configuration system attached to Pylos’ mooring line of Poseidon system. The figure (b) shows how the PAL’s serial output port connects to the
inductive model that attached on the inductive cable.
The PAL is capable of communicating to the shore via its serial port (shown in Fig. 3b) to an inductive modem. The system via the inductive cable sends every three hours a text phrase of the averaged three hours accumulated rainfall (in mm/hr), mean wind speed (in m/s), number of whales (integer), the percentage (%) of ambient noise and precipitation, battery voltage, the remaining storage space and the last instantaneous measurement of spectrum.
(a) (b)
6
Fig. 4: Four-second time series collected in Pylo’s site, November 30, 2006. The upper
panel shows the time series, a series of clicks and a longer whistle. The lower panel shows the spectral decomposition of the time series. Several 20-kHz echo location clicks are
present and the distinctive tonal whistle between 2-5 kHz (at time 1.5 – 2.2 sec).
3.3. Surface buoy anemometer data
On both sites, the buoy is equipped with a surface anemometer that reports wind speed and direction every three hours. The wind speed measurements are 10 minutes averaged starting at the last 15 minutes of every three hours window of each day.
3.4. Radar data
As shown in Figure 1 the two POSEIDON buoys that carry PALs are in range (~100 km) of two operational weather radars from the Hellenic Meteorological Service (HMS). The Xrisoupoli radar (40°55’32’’N, 24°37’41’’E) is a newly deployed high-power C-band (Klystron transmitter) dual-polarization and Doppler radar. It has high sensitivity and narrow (0.85 deg) beam width. It provides measurements of reflectivity at H and V polarization, differential reflectivity, differential phase shift, H/V copolar correlation coefficient, and Doppler information. On the basis of those measurements we can device dual-polarization radar techniques to retrieve rainfall and drop size distribution at high accuracy and resolution [6], [7], [8]. Correction due to rain-path attenuation can also be performed with high accuracy using the differential phase shift information [9]. The second radar (in Adravida; 37°55’21’’N, 21°17’13”E) is a newly upgraded high-power S-band (Magnetron) single-polarization Doppler radar. The radar has high sensitivity, but coarse beam width (1.3 deg). Although it is not susceptible to rain-path attenuation due to the long wavelength (10 cm) it provides only H-polarization reflectivity and Doppler information. Lack of polarimetric information does not allow the retrieval of DSD parameters by this radar. However, we can
7
device algorithms to retrieve precipitation type and rainfall rate [10], [11] on the basis of singe-polarization reflectivity measurements. At 100-km range the beam sizes for the Xrisoupoli and Adravida radars is 1.5-km and 2.5-km, respectively. A point to note is that the theoretical contributing area for hydrophone located at 500 m depth is a circular area of 1.5-km radius and the one at 200 meters depth is a circular are of 600 meters [5], which is comparable to the two radar resolutions at 100-km range.
4. PAL DATA ANALYSIS
Ambient sound in the ocean is a combination of natural and man-made sounds. Various physical processes, including wind, rain, and drizzle, are the primary sound sources in the frequency range from a few hundred hertz to 50 kHz. These are sound sources at the sea surface. The microphysics of the sound generation is resonating bubbles created during the splashing of wind waves or raindrop splashes. These bubbles are very near the free surface of the ocean and, consequently, are assumed to behave as vertically oriented acoustic dipole sources. The next step in the acoustic data analysis is to identify the sound source. Different sources include breaking waves from wind, raindrop splashes, ships and biological sources including whales. Each of these sound sources has unique spectral characteristics that allow detection and identification of the sound source. Critical components are the relative sound levels between frequencies and slopes of the spectra.
4.1. Identify the sounds
Different sound sources are identified by their spectral characteristics. Features of sound source spectra that can be used to identify the source include spectral levels at various frequencies, ratios of these levels, spectral slopes and the temporal persistence of the sound source. The data were examined to find times when the sound source could be confidently assumed. Long periods (hours) of steady uniform sound were assumed to be periods of constant wind. Short loud events consistent with typical ship spectra (very loud at low frequency) during non-rainy periods were assumed to be ships. Distinctive rain and drizzle spectra were identified and confirmed with radar. These ‘typical’ sound sources are shown in Figure 5, taken as an example from Anagnostou et al. [5], and were used to build an acoustic classification algorithm that can be used to objectively identify the sound source in the remaining data. The goal is to reliably detect the sound source so that subsequent analysis is not contaminated by sound generated by other source. Figure 6 shows the relationship between 8 and 20 kHz. This comparison of sound levels at two frequencies is particularly illustrative for demonstrating the ability to use ambient sound to identify the sound sources. In fact, multiple measures are actually used. For example, there is an ambiguity for the sound source “wind = 12 m/s” and “ships”. Other features of the sound field are needed to separate these two sources. For this situation, periods of high wind are usually of long durations (hours), while ships pass the mooring in minutes.
The points associated with the "clean" wind speed spectra used to establish the sensitivity correction reveal a distinctive pattern that can be used to quantitatively measure wind speed [12], [13]. The principal features of a typical ship sound spectrum are high sound levels at lower frequency (below 2 kHz), and a consequently very steep spectral slope between 8 – 15 kHz. The next component of the classification routine is to identify precipitation [14].

8
Fig. 5: Typical sound spectra for different periods of February 12th
, 2004 from PAL N at 200 m depth (taken from [5]).
Rain has relatively more high frequency content, producing relatively high sound levels at 15-30 kHz and a flatter spectral slope from 8 – 15 kHz. In fact, drizzle has a very distinctive spectral peak from 13-25 kHz associated with bubbles trapped underwater by small (1 mm) raindrops [15].
Fig. 6: Scatter diagrams of the 20 versus 8 kHz sound intensities. Wind (blue), rain (black), ship (yellow) sound sources are shown. The solid curves lines represent different
wind speeds estimates.

9
Heavy rain, containing large raindrops (over 2.2 mm diameter) produces sound at lower frequencies, but still generates a sound spectrum that is easily distinguished from the wind-generated spectrum. Once the sound sources are identified, quantitative analysis is possible. The acoustic wind speed and rainfall rate estimations are then compared with the surface anemometer wind speed and the rainfall rate reported from the NHS weather radars. Anagnostou et al. [5] has report that comparison of high-resolution coastal weather radar shows an increase in effective listening area of the PAL with increasing depth and high correlations.
5. CONCLUSION/FUTURE WORK
Our future goals with this long term deployment are to evaluate, determine uncertainties of, and improve the acoustic rainfall rate and wind speed estimates. The main strategy in evaluating the acoustic rain estimates using the POSEIDON data sets will be by comparing them to the NHS’ radar rain estimates, which in turn will be evaluated by the rain gauge measurements. We will try to identify and resolve significant discrepancies between the underwater and the radar rain rate estimates. Acoustic classification of rainfall type is another goal of this project. An acoustic classification algorithm of rain type will be developed with the ongoing POSEIDON data. The influence of wind on the performance of acoustic classification of rainfall type will also identify. In addition, Anagnostou et al. [5] have shown a bias with respect to a published rainfall rate algorithm using data from the tropical Pacific Ocean that has been also used in the two PALs deployed in the POSEIDON system.
Finally, acoustic inversion for rainfall drop size distribution (DSD) is the most ambitious acoustic measurement of rainfall at sea. The published inversion technique [15] used data from a shallow, sheltered pond. The influence of wind on the signal from rain will be estimated and removed from the rainfall signal. The drop size distribution inversion algorithm will then be applied and integrated rainfall DSD parameters will be calculated and compared to co-located radar estimates of the same DSD parameters. Reference data for the assessment of underwater estimates of DSD will be retrievals from Dual-Polarization radar techniques [7], [8]. In this study we will use polarimetric radar data from the Xrisoupoli C-band Dual-Polarization radar. Radar estimates of DSD will be first verified against DSD parameters derived from disdrometer-measured raindrop spectra.
REFERENCES [1] Huffman, G. J., R. F. Adler, D. T. Bolvin, G. Gu, E. J. Nelkin, K. P. Bowman, Y.
Hong, E. F. Stocker, and D. B. Wolff, 2008: “The TRMM Multi-satellite Precipitation Analysis: Quasi-Global, Multi-Year, Combined-Sensor Precipitation Estimates at Fine Scale,” Journal of Hydrometeorology., Vol. 8, pp. 38 – 55.
[2] Grecu, M., W. S. Olson, and E. N. Anagnostou, 2004: “Retrieval of Precipitation Profiles From Multiresolution, Multifrequency, Active and Passive Microwave Observations,” J. Appl. Meteor, Vol. 43, pp. 562 – 575.
[3] Testud, J., S. Oury, and P. Amayenc, 2000: “The concept of "normalized" distribution to describe raindrop spectra: A tool for hydrometeor remote sensing,” Physics and Chemistry of the Earth. Part B-Hydrology Oceans and Atmosphere, Vol. 25, pp. 897 – 902.

10
[4] Sun, J., 2005: “Initialization and Numerical Forecasting of a Supercell Storm Observed during STEPS,” Monthly Weather Review, Vol. 133, pp. 793 – 813.
[5] Anagnostou, M. N., J. A. Nystuen, E. N. Anagnostou, E. Nikolopoulos, E. Amitai, 2008a: “Evaluation of underwater rainfall measurements during the Ionian Sea rainfall experiment,” IEEE Transaction of Geosciences and Remote Sensing, Vol. 46, pp. 2936 – 2946.
[6] Anagnostou, E. N., M. N. Anagnostou, W. F. Krajewski, A. Kruger, and B. Miriovsky, 2004: “High-Resolution Rainfall Estimation from X-Band Polarimetric Radar Measurements,” Journal of Hydrometeorology, Vol. 5, pp. 110-128.
[7] Anagnostou, M. N., E. N. Anagnostou, J. Vivekanandan, and Fred L. Ogden, 2007: “Comparison of Two Raindrop Size Distribution Retrieval Algorithms for X-Band Dual Polarization Observations,” Journal of Hydrometeorology, Vol. 9, pp. 589 – 600.
[8] Anagnostou, M. N., E. N. Anagnostou, V. Gianfranco, M. Montopoli, F. S. Marzano, J. Vivekanandan, 2008b: “Evaluation of X-band polarimetric radar estimates of drop size distribution from coincident S-band polarimetric estimates and measured raindrop spectra,” IEEE Transaction of Geosciences and Remote Sensing, Vol. 46, pp. 3067 – 3075.
[9] Anagnostou, M. N., E. N. Anagnostou, and J. Vivekanandan, 2006: “Correction for Rain-Path Specific and Differential Attenuation of X-band Dual-Polarization Observations,” IEEE Transaction of Geosciences and Remote Sensing, Vol. 44, pp. 2470 – 2480.
[10] Anagnostou, E. N., and C. Morales, 2002: “Rainfall Estimation from TOGA Radar Observations during LBA Field Campaign,” Journal of Geophysical Research-Atmospheres, 107(D18).
[11] Dinku, T., E. N. Anagnostou, and M. Borga, 2002: “Improving Radar-Based Estimation of Rainfall over Complex Terrain,” J. Appl. Meteor., Vol. 41, pp. 1163–1178.
[12] Vagle S, Large W. G., Farmer D. M., 1990: “An evaluation of the WOTAN technique for inferring oceanic wind from underwater sound,” J. Atmos. Ocea. Tech., Vol. 7, pp. 576 – 595.
[13] Nystuen J. A., Selsor H. D., 1997: “Weather classification using passive acoustic drifters,” J. Atmos. Ocean. Technol., Vol. 14, pp. 656 – 666.
[14] Ma, B. B. and J. A. Nystuen, 2005, “Passive Acoustic Detection and Measurements of Rainfall at Sea”, J. Atmos. Ocea. Tech., Vol. 22, pp. 1225 – 1248.
[15] Nystuen, J. A., 2001: “Listening to raindrops from underwater: An acoustic disdrometer,” J. Atmos. Ocean. Technol., vol. 18, pp.1640–1657.