geophysical maps of spain
TRANSCRIPT
GEOPHYSICAL MAPS OF SPAIN Martínez Solares, J.M.*, Gil, A.*, Socias, I.*, Mezcua, J.*, Martin, A.J.** and Marin, V.* * Instituto Geográfico Nacional. Gral. Ibañez de Ibero 3 , 28003 Madrid (Spain) ** Servicio Regional del Instituto Geografico Nacional. Edf. Sevilla 2, 41018 Sevilla (Spain)
ABSTRACT From the geophysical point of view, Spain as part of the Iberian Peninsula, presents a lot of different characteristics that are necessary to express, in space and time way, by means of specific cartography. In this work we want to show the importance a good election of adequate cartographic parameters has for the representation of geophysical features: projection, scale, colours, symbols, etc,. Good elections will aloud a quick first interpretation of the maps. GEOMAGNETIC CARTOGRAPHY The geomagnetic cartography of Spain, carried up by the Instituto Geografico Nacional (IGN), intends to study the Earth's magnetic field over Spain. This work is achieved by measures at the geomagnetic Observatories, network of repeat stations and in other points, distributed regularly over all the geography of the country (map stations). In 1906, the project for the accomplishment of the first geomagnetic map of Spain was redacted. The field work begun in 1912 and was finished in 1919, but it was not published until 1924. This map was made up of sheets, that mapped the following components of the magnetic field:
Magnetic declination Inclination Horizontal Isodynamic.
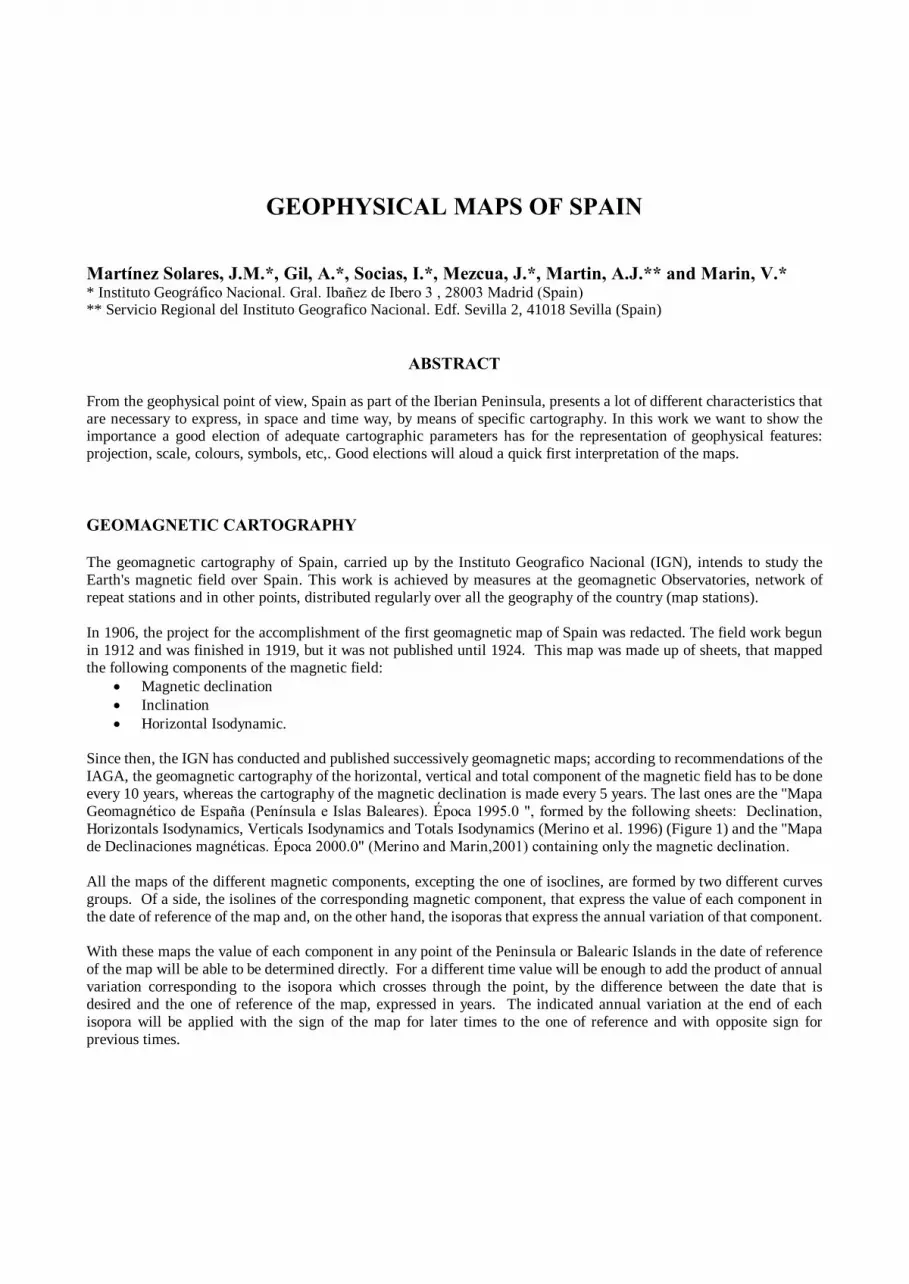
Since then, the IGN has conducted and published successively geomagnetic maps; according to recommendations of the IAGA, the geomagnetic cartography of the horizontal, vertical and total component of the magnetic field has to be done every 10 years, whereas the cartography of the magnetic declination is made every 5 years. The last ones are the "Mapa Geomagnético de España (Península e Islas Baleares). Época 1995.0 ", formed by the following sheets: Declination, Horizontals Isodynamics, Verticals Isodynamics and Totals Isodynamics (Merino et al. 1996) (Figure 1) and the "Mapa de Declinaciones magnéticas. Época 2000.0" (Merino and Marin,2001) containing only the magnetic declination. All the maps of the different magnetic components, excepting the one of isoclines, are formed by two different curves groups. Of a side, the isolines of the corresponding magnetic component, that express the value of each component in the date of reference of the map and, on the other hand, the isoporas that express the annual variation of that component. With these maps the value of each component in any point of the Peninsula or Balearic Islands in the date of reference of the map will be able to be determined directly. For a different time value will be enough to add the product of annual variation corresponding to the isopora which crosses through the point, by the difference between the date that is desired and the one of reference of the map, expressed in years. The indicated annual variation at the end of each isopora will be applied with the sign of the map for later times to the one of reference and with opposite sign for previous times.
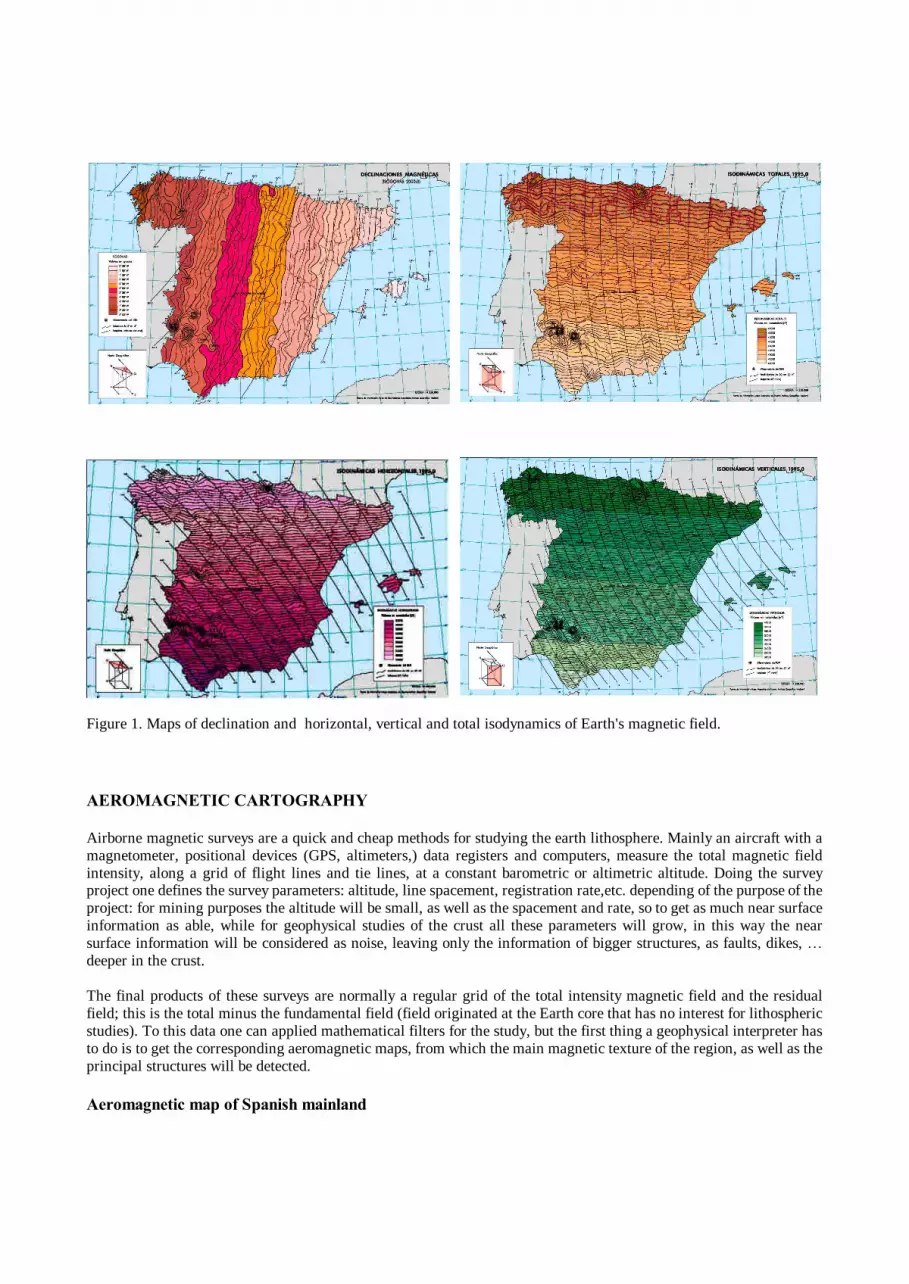
Figure 1. Maps of declination and horizontal, vertical and total isodynamics of Earth's magnetic field. AEROMAGNETIC CARTOGRAPHY Airborne magnetic surveys are a quick and cheap methods for studying the earth lithosphere. Mainly an aircraft with a magnetometer, positional devices (GPS, altimeters,) data registers and computers, measure the total magnetic field intensity, along a grid of flight lines and tie lines, at a constant barometric or altimetric altitude. Doing the survey project one defines the survey parameters: altitude, line spacement, registration rate,etc. depending of the purpose of the project: for mining purposes the altitude will be small, as well as the spacement and rate, so to get as much near surface information as able, while for geophysical studies of the crust all these parameters will grow, in this way the near surface information will be considered as noise, leaving only the information of bigger structures, as faults, dikes, � deeper in the crust. The final products of these surveys are normally a regular grid of the total intensity magnetic field and the residual field; this is the total minus the fundamental field (field originated at the Earth core that has no interest for lithospheric studies). To this data one can applied mathematical filters for the study, but the first thing a geophysical interpreter has to do is to get the corresponding aeromagnetic maps, from which the main magnetic texture of the region, as well as the principal structures will be detected. Aeromagnetic map of Spanish mainland
Was the first airborne magnetic survey done in 1986/87 by the IGN (Ardizone et al.1989; Socías, 1994). The survey consisted of 102 flight lines in north-south direction distant 10km from each other and 20 tie-lines 40km apart east west. The altitude for the whole survey was 3,000m above sea level. Aeromagnetic Map of Canary Archipelago This survey was done by the IGN in 1993 (Socías y Mezcua,1996). The interest of an aeromagnetic map of volcanic areas is clearly seen in the map of Figure 2, where the anomalies are of more than a thousand nanoteslas, indicating the high magnetism of these areas. The particularity of the survey was that it was flown at different altitudes due to the topographic and bathymetric differences that go from more than 5,000 meters below sea level up to 4,000 meters above sea level.
Figure 2: Aeromagnetic map of Canary Archipielago (altitude 3,200m) In the map of Figure 2 can observe the difference in the magnetic texture between the eastern and western islands; while the first shows an arc pattern in the second the anomalies are located punctually over the volcanic structures. The two areas are separated by a big anomaly, between Tenerife and Gran Canaria Islands, over a tectonic feature already known. Aeromagnetic maps compilation
1.Spanish Mainland 2.Portugal Continental 3.Alboran Sea 4. Gulf of Valencia 5.Continental Margin 6.Gulf of Cadiz
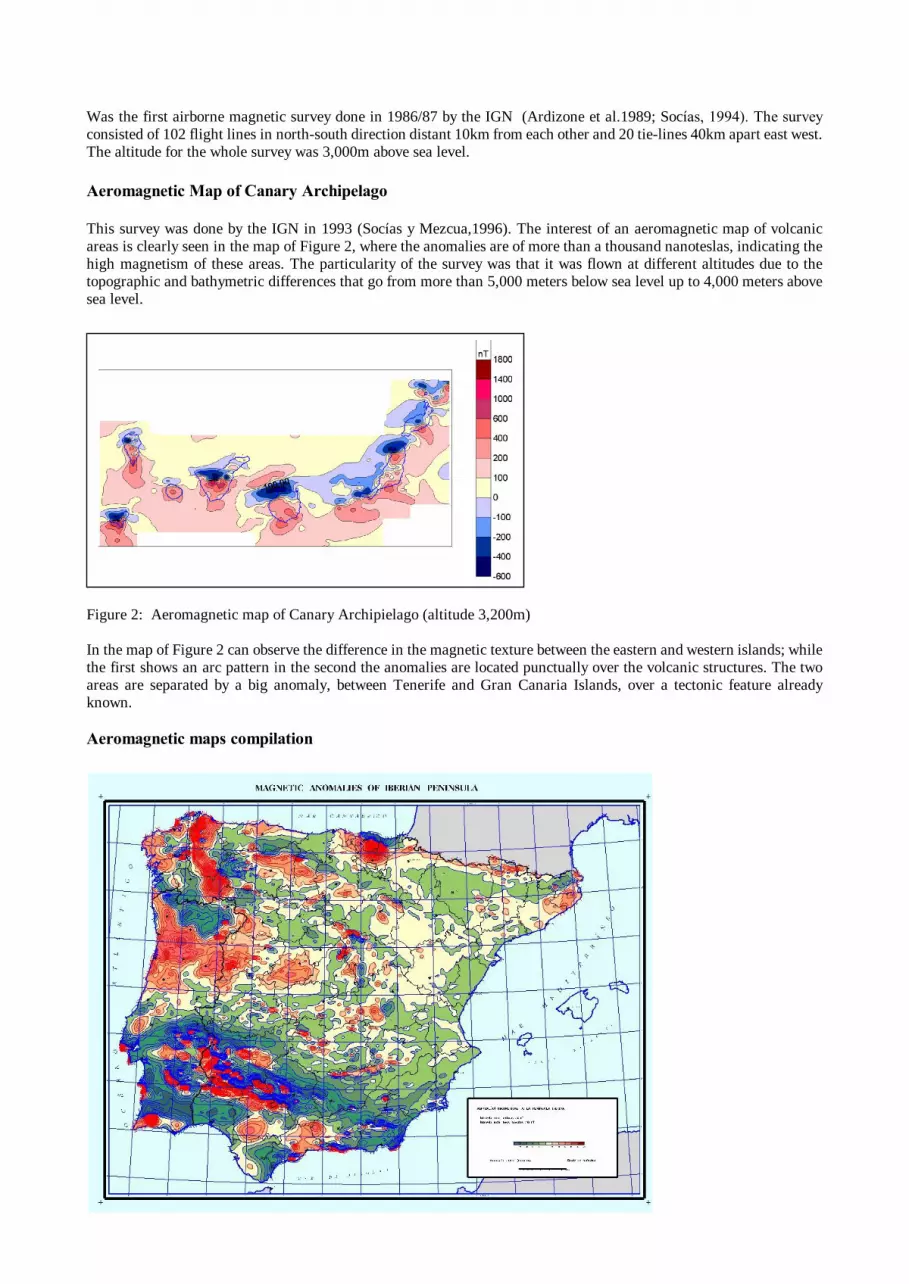
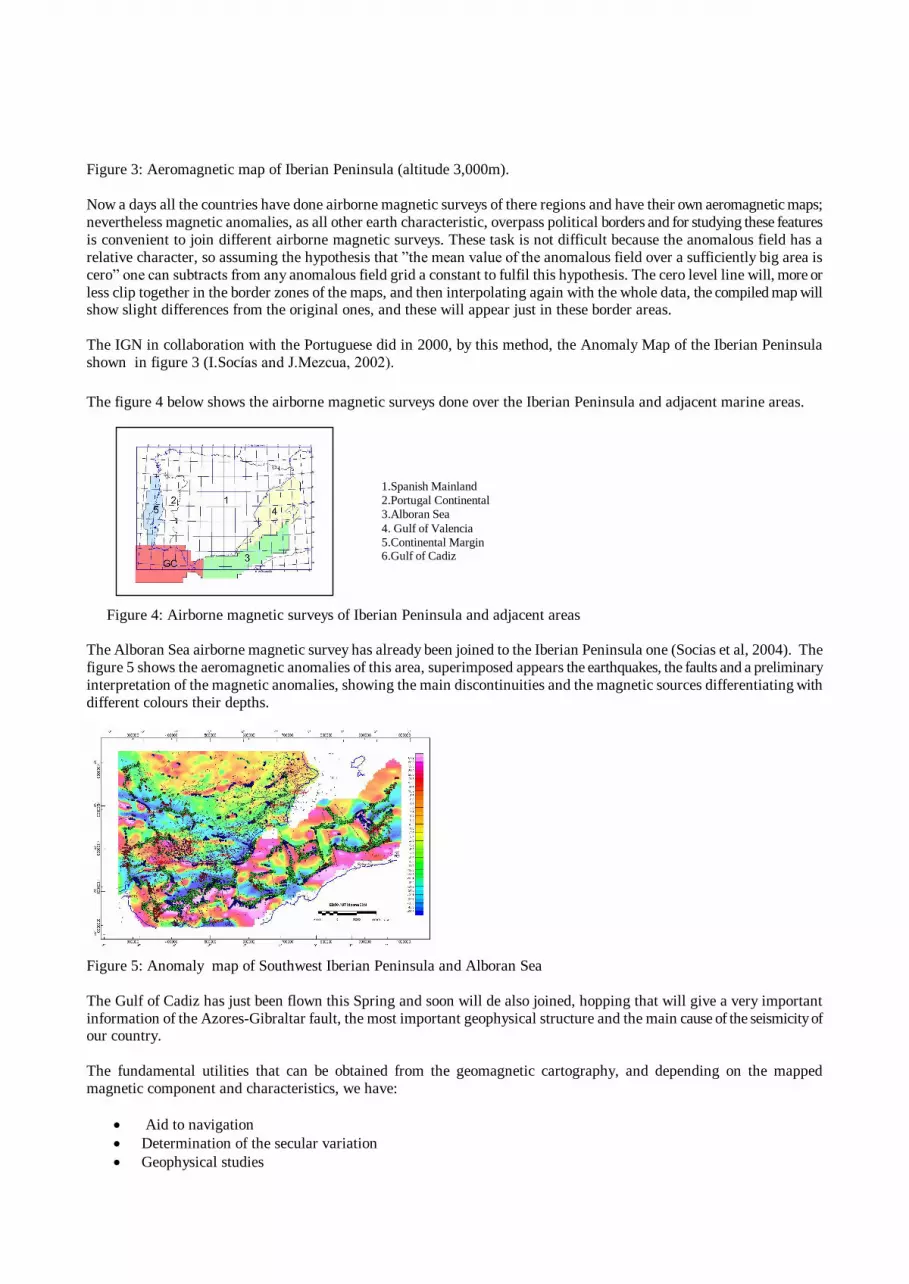
Figure 3: Aeromagnetic map of Iberian Peninsula (altitude 3,000m). Now a days all the countries have done airborne magnetic surveys of there regions and have their own aeromagnetic maps; nevertheless magnetic anomalies, as all other earth characteristic, overpass political borders and for studying these features is convenient to join different airborne magnetic surveys. These task is not difficult because the anomalous field has a relative character, so assuming the hypothesis that �the mean value of the anomalous field over a sufficiently big area is cero� one can subtracts from any anomalous field grid a constant to fulfil this hypothesis. The cero level line will, more or less clip together in the border zones of the maps, and then interpolating again with the whole data, the compiled map will show slight differences from the original ones, and these will appear just in these border areas. The IGN in collaboration with the Portuguese did in 2000, by this method, the Anomaly Map of the Iberian Peninsula shown in figure 3 (I.Socías and J.Mezcua, 2002). The figure 4 below shows the airborne magnetic surveys done over the Iberian Peninsula and adjacent marine areas. Figure 4: Airborne magnetic surveys of Iberian Peninsula and adjacent areas The Alboran Sea airborne magnetic survey has already been joined to the Iberian Peninsula one (Socias et al, 2004). The figure 5 shows the aeromagnetic anomalies of this area, superimposed appears the earthquakes, the faults and a preliminary interpretation of the magnetic anomalies, showing the main discontinuities and the magnetic sources differentiating with different colours their depths.
Figure 5: Anomaly map of Southwest Iberian Peninsula and Alboran Sea The Gulf of Cadiz has just been flown this Spring and soon will de also joined, hopping that will give a very important information of the Azores-Gibraltar fault, the most important geophysical structure and the main cause of the seismicity of our country. The fundamental utilities that can be obtained from the geomagnetic cartography, and depending on the mapped magnetic component and characteristics, we have:
Aid to navigation Determination of the secular variation Geophysical studies
Magnetic mineral search
SEISMOLOGICAL MAPS Spain, together with Portugal, form the Iberian Peninsula as a geographical unity located in the southwest of the Euroasiatic tectonic plate, in the border with the African plate, known as the Azores-Gibraltar fault. The seismic activity of the region is moderate, with earthquakes of a maximum estimated magnitude of about 6.8 for the Peninsula, nevertheless at the contact fault the level grows, reaching magnitudes up to 8.5 and 7.3, for the earthquakes of 1755 and 1969, respectively.
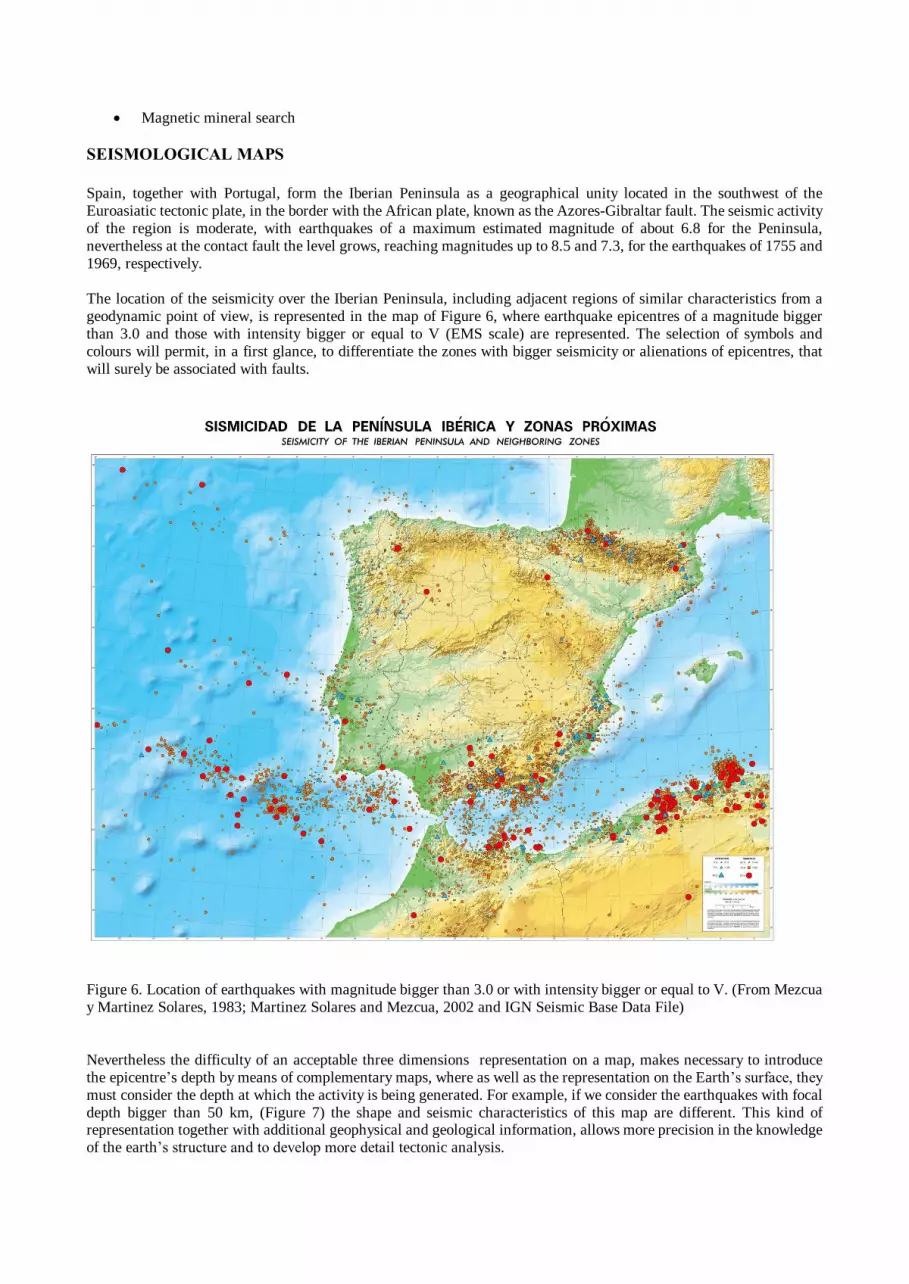
The location of the seismicity over the Iberian Peninsula, including adjacent regions of similar characteristics from a geodynamic point of view, is represented in the map of Figure 6, where earthquake epicentres of a magnitude bigger than 3.0 and those with intensity bigger or equal to V (EMS scale) are represented. The selection of symbols and colours will permit, in a first glance, to differentiate the zones with bigger seismicity or alienations of epicentres, that will surely be associated with faults.
Figure 6. Location of earthquakes with magnitude bigger than 3.0 or with intensity bigger or equal to V. (From Mezcua y Martinez Solares, 1983; Martinez Solares and Mezcua, 2002 and IGN Seismic Base Data File) Nevertheless the difficulty of an acceptable three dimensions representation on a map, makes necessary to introduce the epicentre�s depth by means of complementary maps, where as well as the representation on the Earth�s surface, they must consider the depth at which the activity is being generated. For example, if we consider the earthquakes with focal depth bigger than 50 km, (Figure 7) the shape and seismic characteristics of this map are different. This kind of representation together with additional geophysical and geological information, allows more precision in the knowledge of the earth�s structure and to develop more detail tectonic analysis.
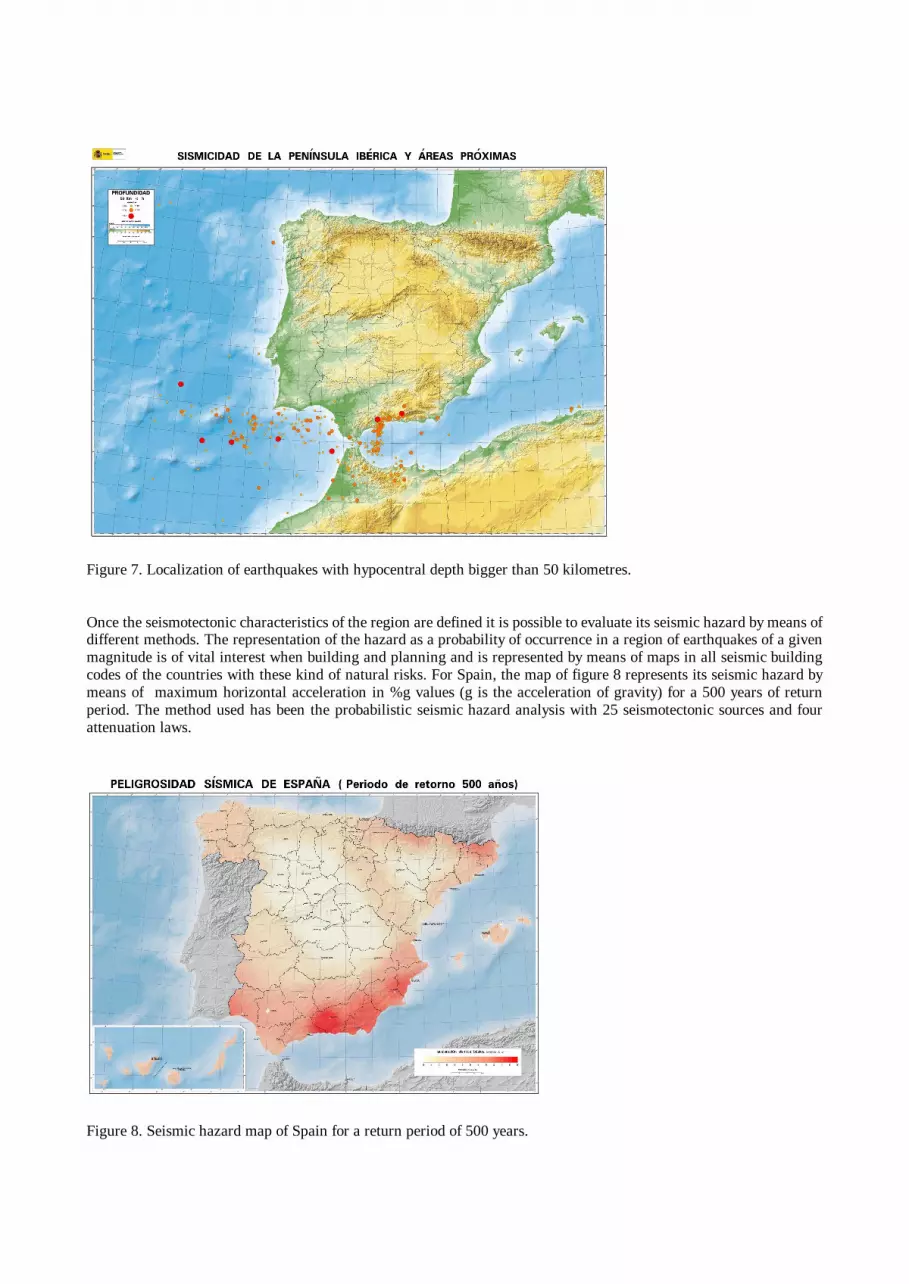
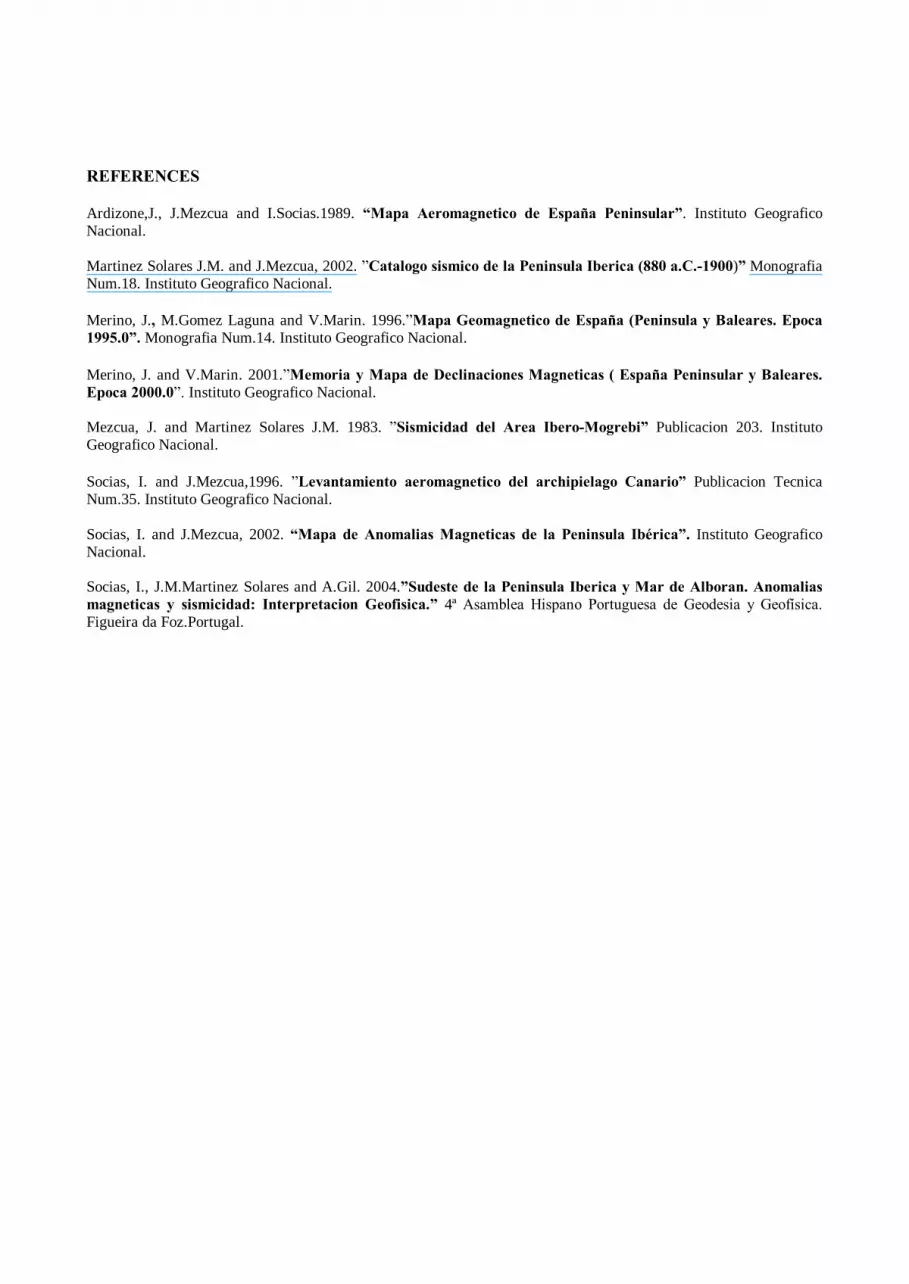
Figure 7. Localization of earthquakes with hypocentral depth bigger than 50 kilometres. Once the seismotectonic characteristics of the region are defined it is possible to evaluate its seismic hazard by means of different methods. The representation of the hazard as a probability of occurrence in a region of earthquakes of a given magnitude is of vital interest when building and planning and is represented by means of maps in all seismic building codes of the countries with these kind of natural risks. For Spain, the map of figure 8 represents its seismic hazard by means of maximum horizontal acceleration in %g values (g is the acceleration of gravity) for a 500 years of return period. The method used has been the probabilistic seismic hazard analysis with 25 seismotectonic sources and four attenuation laws.
Figure 8. Seismic hazard map of Spain for a return period of 500 years.
REFERENCES Ardizone,J., J.Mezcua and I.Socias.1989. �Mapa Aeromagnetico de España Peninsular�. Instituto Geografico Nacional. Martinez Solares J.M. and J.Mezcua, 2002. �Catalogo sismico de la Peninsula Iberica (880 a.C.-1900)� Monografia Num.18. Instituto Geografico Nacional. Merino, J., M.Gomez Laguna and V.Marin. 1996.�Mapa Geomagnetico de España (Peninsula y Baleares. Epoca 1995.0�. Monografia Num.14. Instituto Geografico Nacional. Merino, J. and V.Marin. 2001.�Memoria y Mapa de Declinaciones Magneticas ( España Peninsular y Baleares. Epoca 2000.0�. Instituto Geografico Nacional. Mezcua, J. and Martinez Solares J.M. 1983. �Sismicidad del Area Ibero-Mogrebi� Publicacion 203. Instituto Geografico Nacional. Socias, I. and J.Mezcua,1996. �Levantamiento aeromagnetico del archipielago Canario� Publicacion Tecnica Num.35. Instituto Geografico Nacional. Socias, I. and J.Mezcua, 2002. �Mapa de Anomalias Magneticas de la Peninsula Ibérica�. Instituto Geografico Nacional. Socias, I., J.M.Martinez Solares and A.Gil. 2004.�Sudeste de la Peninsula Iberica y Mar de Alboran. Anomalias magneticas y sismicidad: Interpretacion Geofisica.� 4ª Asamblea Hispano Portuguesa de Geodesia y Geofísica. Figueira da Foz.Portugal.