discrete neural representations for explainable anomaly
TRANSCRIPT

Discrete neural representations for explainable anomaly detection
Stanislaw SzymanowiczUniversity of Cambridge
James CharlesUniversity of Cambridge
Roberto CipollaUniversity of Cambridge
Abstract
The aim of this work is to detect and automatically gen-erate high-level explanations of anomalous events in video.Understanding the cause of an anomalous event is crucialas the required response is dependant on its nature andseverity. Recent works typically use object or action clas-sifier to detect and provide labels for anomalous events.However, this constrains detection systems to a finite setof known classes and prevents generalisation to unknownobjects or behaviours. Here we show how to robustly de-tect anomalies without the use of object or action classi-fiers yet still recover the high level reason behind the event.We make the following contributions: (1) a method usingsaliency maps to decouple the explanation of anomalousevents from object and action classifiers, (2) show how toimprove the quality of saliency maps using a novel neuralarchitecture for learning discrete representations of videoby predicting future frames and (3) beat the state-of-the-artanomaly explanation methods by 60% on a subset of thepublic benchmark X-MAN dataset [25].
1. IntroductionDetecting anomalies has an important application in
many types of video monitoring settings. For example, itis crucial for self-driving cars to hypothesise about normalfuture video content and detect deviations from the norme.g. pedestrians normally walk road-side but a fall into theroad would be anomalous. Anomaly detection also shows ahuge potential in video surveillance, particularly for crimeprevention or for health and safety e.g. detecting an objectleft unattended in a train station, a drunk person provokingby-standers, falls or abnormal behaviour in care homes.
In both of these applications explanation of anomaliesis essential, because the required response, ranging fromsubtle change of direction to coming to an abrupt stop inthe case of the self-driving car, depends on the nature ofthe anomaly. Moreover, anomaly detection systems used inpublic settings (e.g. anomaly detection in CCTV videos oftrain stations) have to be interpretable in order to prevent
Encoder Decoder
5 previous frames Predicted next frame
Explainability module
Saliency map(prediction error)
VQU-Net
Anomaly explanations
ride a skateboard
bicycle, ride a bicycle
Anomaly detection
score
Real next frame
Figure 1. Overview. An input of 5 consecutive frames is passedthrough an autoencoder (our proposed VQU-Net) trained to pre-dict the next frame. A saliency map is formed from per-pixel pre-diction error with the real next frame. The anomaly detection scoreis formed by summing over the whole frame. The real next frameand saliency map are then passed to the explainability module toexplain the detected anomalies.
any bias (e.g. against minority groups).This is challenging, because (a) neural networks at the
forefront of this problem are not interpretable, (b) detectingand understanding the appearance of anomalous objects isoften impeded, because the objects can be blurry, occludedand in uncommon locations (e.g. flying up in the air), (c) in-terpreting the anomaly requires high level understanding ofthe video context, e.g. is anomalous motion in the scene dueto people pushing each other in a train station, or someonewalking in the wrong direction? and (d) systems used inpractical settings cannot miss important anomalous events,e.g. someone carrying a gun.
In this work we focus on anomaly detection datasets inwhich all videos come from the same scene. In an effortto address all four of these challenges, we make the fol-lowing contributions to the field of interpretable anomalydetection: (1) we propose a general method for explaining

anomalies based on per-pixel prediction of future framesin video. Thus we remove the need to classify action orobjects for the anomaly detection stage, (2) we use tem-poral information for explaining anomalies with the useof an action recognition module, (3) develop a VectorQuantized Autoencoder (VQA) to ensure our models can-not reconstruct anomalous objects or actions, resulting ina justifiable behaviour for it’s good performance and (4)achieve attractive qualitative and quantitative results againststate-of-the-art, improving by 61% mean Average Preci-sion (mAP) and 74% mAP on the task of anomaly explana-tion on the public X-MAN labels [25] for UCSD Ped2 [16]and Avenue [14] anomaly detection datasets, respectively.Project page: http://jjcvision.com/projects/vqunet_anomally_detection.html
2. Recent works
2.1. Anomaly detection
The most successful anomaly detection approaches arebased on deep learning methods and can be split into twogroups. The first group learns and uses feature represen-tations directly to detect anomalies. These methods useout of distribution detection algorithms [4, 6, 21] appliedto the task of anomaly detection based on learned featurerepresentations [17, 24, 28]. More recently and success-fully, one-vs-all cluster classification [7, 8] is used based onlearned feature representations.
The second group of approaches to anomaly detec-tion with deep learning is to reconstruct or predict fu-ture ‘normal’ video frames from sparse feature representa-tions [3, 15, 27], sometimes augmented with memory mod-ules [18], and/or optical-flow images [13, 19, 20]. With aone-stage approach (not requiring object detection), thesemethods are more robust. Anomalies are detected based onthe assumption these models will find it difficult to generateabnormal frames, e.g. if there are no bikes observed in thetraining data, the trained models are expected to fail to gen-eralise when attempting to reconstruct a bike in an anoma-lous frame. In such situation where the predicted framediffers significantly from the observed one, an anomaly isdeclared. The downside to these approaches is that they donot provide high level explanation to the anomalous events.
Our method is most similar to the memory-augmentedautoencoder [18], where the features at the bottleneck areappended to the closest entries from a learnt codebook con-taining a small number of codes. This guides the recon-structions to be similar to ‘normal’ events, therefore mak-ing bigger errors in reconstructing anomalous frames. Weobserve in the method by Park et al. [18] that (1) the sizeof the bottleneck of the method is twice as big as the input,hence the model could potentially copy the input when re-constructing and (2) the codebook could simply be ignored
by the decoder as it has access to raw bottleneck features.Performance therefore relies on careful tuning so that it gen-eralises enough to reconstruct only normal frames, which isdifficult and time consuming to achieve. We address theseshortcomings by using a vector quantizer [26] at the bottle-neck of our autoencoder, therefore discretising the featuremaps. We show fixing the possible set of high-level fea-ture maps to a discrete set of embeddings provides a betterguarantee that anomalous events will not be reconstructed.This discrete version replaces the original raw feature mapso that the decoder has no access to any low-level infor-mation from the input, reducing generalisation performancewhen reconstructing anomalous frames. To the best of ourknowledge, we are the first to propose the use of a vectorquantizer [26] module for anomaly detection.
2.2. Anomaly explanation
In this work we consider anomaly explanation as the pro-cess of labeling anomalous events with high-level humaninterpretable labels, e.g. ‘running’, similarly to Szymanow-icz et al. [25] and Hinami et al. This is different and onestep further to visual explanation of anomalies [12] wherethe system only has to highlight anomalous regions in animage. The method of Szymanowicz et al. [25] explainsthe decisions of anomaly detectors based on feature repre-sentations and gives high-level explanations of anomalousevents. However, the method of Szymanowiczet al. [25]and MT-FRCN [5] are brittle under object detection failure.We argue that this is a significant shortcoming, because inpractical settings anomalous objects are likely to (1) be inmotion, hence they might be blurry, (2) be in uncommonlocations (3) have unusual appearance and (4) be from outof domain classes to the object detector. Hence two-stageanomaly detection designs where object detection as a pre-processing stage are unlikely to be successful in practicalanomaly detection. In contrast, we chose to explain the de-cisions of more robust anomaly detectors based on futureframe prediction. Our method provides high-level explana-tions of the vector that was used in these kind of methods todeclare a frame as anomalous, i.e. the per-pixel predictionerror. As opposed to previous works that describe anoma-lous events [5, 25], we additionally use temporal context tounderstand actions, leading to an improvement in anomalyexplanation performance.
3. Method
The method consists of two stages, first an en-coder/decoder architecture is used to produce saliency mapsfor detecting anomalies. The second stage is an explainabil-ity module which interprets the saliency maps and providesspatial location and high-level human interpretable labelsfor the anomalous event, see Figure 1.

n x 3
256x
256
64 6412
8x12
8
64 128 128
64x
64
128 256 256
32x
32
256 512 512 quantization
𝑧𝑞 = 𝑎𝑟𝑔𝑚𝑖𝑛𝑗ԡ𝑧𝑒 − ฮ𝑒𝑗 2{𝑧𝑒} {𝑧𝑞}
𝑒1𝑒2𝑒3
𝑒𝐾
codebook
512
512 256 256
256 128 128
128 64 64 3
max pooling / upsampling
convolution
quantization
concatenation
Figure 2. VQU-Net. Architecture of our prediction network. The resolutions of input and output are the same. n is the number of framesat the input to the network – they are concatenated along the channel dimension. The output of the encoder, ze(x), is quantized, resultingin a quantized feature map zq(x), which is then used as the input to the decoder.
3.1. Econder/Decoder architecture
The network architecture is based on U-Net [23], whichhas been successfully applied to the task of reconstructionand future frame prediction [18, 13]. Our contribution isthe proposal of a learnable codebook using a vector quanti-zation module [26] at the output of the encoder (see Fig. 2),forming a Vector Quantized U-Net (VQU-Net).
Following [18] we remove the last batch normalizationlayer and the last ReLU activation layer, because ReLU cutsoff negative values, possibly restricting the diverse featurerepresentation. We also pad the input to convolutions tokeep image size unchanged between downsampling or up-sampling layers.
The input x consists of n consecutive frames It at timeindices t = t0 to t = t0 + n − 1 inclusive, concatenatedalong the channel dimension. The output of the encoder(last feature map before the first deconvolution) is denotedze(x) – a set of H ×W D-dimensional vectors ze(x) (seeFig. 2). The output of the decoder I is trained to predictthe frame at time index t0 + n, It0+n. The reconstructiontask is equivalent to simply setting n = 0. When trainingthe network for frame reconstruction, skip connections, areremoved so that the network cannot learn to simply copythe input.
The learnable codebook is placed between the output of
the encoder and the input to the decoder. The codebook is aset of K, D-dimensional embedding vectors ei ∈ RD, i =1, 2, . . . ,K. For an input feature vector ze(x), the quan-tizer retrieves and outputs zq(x), the closest entry ek in thecodebook, measured by Euclidean distance.
zq(x) = ek, where k = argminj∥ze(x)− ej∥2 (1)
The operation described in Eq. 1 is repeated for all vec-tors ze(x) in the feature map ze(x), outputting a quantizedfeature map zq .
Following [26], zq(x) is passed to the decoder duringthe forward pass. The argmin operator is non-differentiable,but the gradient with respect to the encoder parameters isapproximated by copying the gradient during the backwardpass from the decoder to the encoder.
3.2. Training losses
The total loss function consists of the prediction lossLpred, embedding loss Lembed, the so-called commitmentloss [26] Lcommit and feature separatedness loss [18] Lsep.
L = Lpred + λeLembed + λcLcommit + λsLsep

Prediction loss Lpred is the L2 norm of the error betweenthe prediction and the target frame.
Lpred = ∥I − It0+n∥22
Embedding loss trains the retrieved embeddings zq to beclose to the input features ze by minimising the L2 norm ofthe error between them, assuming the input features are heldconstant. This is implemented with the stop-gradient opera-tor [26] (denoted as sg), which is an identity on the forwardpass and has zero derivatives on the backward pass, effec-tively setting the argument as a constant in the backwardpass.
Lembed = ∥sg [ze(x)]− zq(x)∥22
The commitment loss ensures that the encoder outputsvalues close to the ones present in the codebook, thereforeforcing the encoder to ‘commit’ to the discrete representa-tion defined by the codebook. Scaling factor β is set to 0.25as in [26].
Lcommit = β∥ze(x)− sg [zq(x)]∥22
Finally, separatedness loss [18] is used to help learn a di-verse feature representation and improve the discriminativepower of the codebook. The encoded features ze are theanchor, the closest entries in the codebook zq are a posi-tive sample and the second closest entries zn are a negativesample. The loss then helps push the negative samples awayfrom the queries, while the other losses push the positivesamples close to the queries. This results in codebook fea-tures being placed far from each other improving diversity.
Lsep = γ[∥sg [ze]− zq∥22 − ∥sg [ze]− zn∥22 + α
]+
3.3. Saliency maps and anomaly detection
Saliency maps are produced by calculating the per-pixelerror between the predicted frame and the ground truth.These can be visualised as heatmaps (Figure 1) with zeroerror as dark blue and becoming light green as it gets larger.From these saliency maps an anomaly score is formed basedon it’s L2 norm. Different to Szymanowiczet al. [25], thisanomaly score is now computed globally for the wholeframe rather than based on the detected objects, this resultsin improved performance while not being reliant on objectdetection accuracy.
3.4. Explainability module
Explaining the decision behind the anomaly requires thesystem to specify which actions and objects are responsi-ble for the error in prediction. Given a predicted frame
and ground truth we first produce a heatmap of the per-pixel squared error. Next, we run an object detector (Faster-RCNN [22]) and action recognition module (SlowFast [1])on the ground truth frames (see Fig. 3). The ”heat” issummed within the each bounding box of detected actionsand objects to obtain per-box anomaly score. The classes ofobjects and actions corresponding to the boxes with high-est anomaly scores serve as anomaly explanations. Notethat this frame prediction framework will fail to explain ananomaly if the object detector fails however the system canstill return a successful anomaly detection. This is in con-trast to methods which rely on object detectors as a pre-processing step where the anomaly would be missed.
4. ExperimentsOur approach is evaluated for both detecting anoma-
lies and explaining them. For anomaly detection we com-pare to state of the art on existing public datasets describedin Sec. 4.1 and for anomaly explanation we use the X-MAN [25] dataset and the metric described in Sec. 4.2.
4.1. Datasets
For the task of anaomaly detection two public datasetsare used: UCSD Ped2 [16] and Avenue [14]. For anomalyexplanation evaluation is conducted on the public X-MANDataset [25].
UCSD [16]. A standard benchmark for anomaly detec-tion. The training data contains only normal events, whiletesting data contains some abnormal events. 19600 framescaptured using two different cameras: UCSD Ped1 andUCSD Ped2 which contains 16 training and 12 testingvideos. Normal events include pedestrians walking, whileabnormal events include trucks, cyclists and skateboarders.Following [5] we evaluate on Ped2 only as Ped1 is very lowresolution.
Avenue [14]. This dataset contains contains 16 trainingand 21 testing videos. All captured from the same scene,a total of 30,652 (15,328 training, 15,324 testing) frames.This is a challenging dataset because it includes a variety ofevents such as “running”, “throwing bag”, “pushing bike”and “wrong direction”. We train from the videos in Avenuethat contain normal events. This dataset focuses on dynamicevents e.g. walking in an uncommon area in the scene andregards abnormal static events as normal e.g. standing in thesame uncommon area.
X-MAN [25]. A recent dataset for evaluating anomalyexplanation methods. Consists of 22,722 manually la-belled frames in ShanghaiTech (17,362), Avenue (3,712)and UCSD Ped2 (1,648). Each frame contains between 1

Input frames
Ground truth
Prediction error
VQU-Net
Detectors
Detected objects Recognised actions
Per-box error +
thresholding
Explanations
ride a skateboard
bicycle, ride a bicycle
Figure 3. VQU-Net explanations. Top: 5 consecutive frames are input to VQU-Net trained for the prediction task. The predicted frameis compared to ground truth to obtain a map of per-pixel prediction error. Bottom: ground truth frame is passed to object detection andaction recognition modules. Right: per-box prediction error is computed and thresholded to identify the anomalous regions and theircorresponding objects and actions, i.e. anomaly explanations.
and 5 explanation labels, each label being a different reasonwhy the frame is anomalous (many frames contain multipleanomalous events, e.g. one person running and one riding abike). In total, there are 40,618 labels across all frames. Themajority of anomalies (22,640) are due to actions, followedby anomalous objects (14,828). The remaining anomaliesare due to an anomalous location. There are 42 anomalousactions and 13 anomalous objects. We use X-MAN labelsfor anomalies in UCSD Ped2 and Avenue.
4.2. Evaluation metrics
Two separate evaluation metrics are used, one foranomaly detection and the other for explanation.
Anomaly detection metric. All test video frames from alldatasets are marked as either containing or not containing ananomaly. Measuring the true and false positive rates againstthis ground truth, we use the standard metric of evaluatingabnormal event detection: the area under the ROC curve(AUC).
Anomaly explanation metric. The metric, first fully ex-plained by Szymanowiczet al. [25], is the mean average pre-cision (mAP) in predicting the labels of anomalous events.The mean is taken across the different explanation classes inorder to weight rare explanation classes equally to commonones.
4.3. Implementation details
A codebook with K = 256 entries is used with a sep-aration margin of α = 1.0 and separation loss weightingγ = 0.01. The network is trained with a learning rate of2 × 10−5 for the reconstruction task and 2 × 10⁻⁴ for theprediction task. We train the network for 60 epochs. Forobject explanations, we use Faster R-CNN [22] models forobject detection, implemented in the Detectron2 [?] frame-work and pre-trained on MS-COCO [11] dataset. For actionexplanations we use the implementation from the authors ofSlowFast [1] pre-trained on AVA Kinetics [10] dataset.
5. Results
5.1. Qualitative analysis
Reconstruction. We first compare the reconstructions ofanomalous frames from the baseline U-Net model and fromthe model with the codebook (VQU-Net). Fig. 4. showsthe attempted reconstructions. While the baseline modeldoes produce slightly blurry reconstructions, the shapes arestill clearly visible - the model is only able detect anoma-lies due to limited generalisation, which cannot be guaran-teed in a practical setting. In contrast, our model with thecodebook is clearly strictly limited to certain shapes and ap-pearances: in Fig. 4. our model (1) fails to reconstruct thetruck completely and replaces it with person-like blobs, (2)completely removes the bikes from the input frames and re-places cyclists with pedestrians and (3) is seen to produce a

Input frameBaseline
reconstructionVQU-Net
reconstruction
Figure 4. Reconstruction examples. Example reconstructions ofthe input frames (left column) with baseline U-Net (middle col-umn) and VQU-Net (right column). VQU-Net is constrained bythe codebook and is not able to reconstruct anomalous objects, asintended: the truck is missing (top row), bicycles are removed andcyclists are replaced with pedestrians (middle two rows) and per-son picking up a bag is largely missing (bottom row).
much worse reconstruction of a bending person. Removingthese anomalous objects when attempting the reconstruc-tion is advantageous for the task of anomaly detection andshows that our method is purposefully limited by the code-book, and not a simple side effect of limited generalisation.
Anomaly detection. Saliency maps are formed by theper-pixel reconstruction error. Examples produced by ourprediction network are shown in Fig. 5. Examples of cor-rectly detected anomalous frames include anomalous ob-jects, actions and objects in anomalous locations. Thesaliency maps closely align with the regions in the imagewhere the anomalies occur.
Anomaly explanation. Combining the prediction errorsaliency maps with object detection and action recognitionmodules allows for explanations of anomalies detected by
Figure 5. Prediction saliency maps. Example saliency maps (per-pixel reconstruction squared error) from the output of VQU-Nettrained for prediction task. The prediction saliency maps alignclosely with a variety of anomalous objects and actions. Top rightshows a frame with anomalous objects: a bicycle and a car. Otherexamples show frames with anomalous actions: top right – run-ning, middle left – catching a bag, middle right – throwing a bag.Bottom right shows an example of a frame with an object in ananomalous location: pieces of paper flying in the air.
our method. Examples of explained anomalous objects andactions are shown in Fig. 6. The examples show that ourmethod is capable of explaining anomalies due to unex-pected actions, e.g. riding a skateboard, practicing martialarts or bending / bowing at the waist. Our method can alsoexplain anomalies due to anomalous objects, e.g. trucks orbicycles.
5.2. Anomaly detection state-of-the-art (SOTA)comparison.
Table 1 summarises the AUC on all datasets.Our VQU-Net method performs better than the method
of Szymanowicz et al. on the task of anomaly detection.This illustrates the advantage of single-stage approaches foranomaly detection. VQU-Net performs on par with otherSOTA methods, while additionally providing explanationsof detected anomalies.
We believe that in a practical setting providing anomalyexplanations at the cost of slightly lower anomaly detec-tion performance is advantageous because it allows humanoperators of monitor systems to decide on appropriate re-sponses. It also allows for grading of the alert level raisedby the anomaly, i.e. anomaly due to a gun is more alarmingthan an anomaly due to a person jumping.
Ablation study. We investigate the effect of includingtemporal information (i.e. if the network attempts to pre-

ride a skateboard
bicycle, ride a bicycle
truck
martial arts
bow / bend at the waist
Figure 6. Anomaly explanations. Examples of correctly ex-plained anomalies. Left column shows the input frame withbounding boxes of detected objects. Middle column shows thesaliency maps produced by passing the input frame through theprediction network. Right column shows the bounding box thatwas found anomalous and the corresponding action or object cat-egory.
dict a future frame, or simply reconstruct a current frame)and the effect of using the codebook. As seen in Tab. 2., in-cluding temporal information improves performance on theanomaly detection task by more than 15 percentage pointson UCSD Ped2 and around 7 percentage points on Avenue.Hence, it can be concluded that temporal information (i.e.motion) is crucial for identifying anomalies. Analysis ofTab. 2 also reveals that using the learnable codebook in thereconstruction model improves performance on Avenue byalmost 3 percentage points. Including the codebook in theprediction model improves performance on both datasets byaround 1 percentage point, suggesting that restricting thenetwork to a discrete feature map is advantageous for de-tecting anomalies. The codebook has a smaller effect onthe prediction network due to the presence of skip connec-tions – not all feature maps are quantized in the network. Itis hypothesised that quantizing the feature maps at all levels(i.e. quantizing the skip connections too) would improveperformance even further, but this could be slow, because
Method UCSD AvenuePed2
Kim et al. [9] 59.0 -Mahadevan et al. [16] 82.9 -Lu et al. [14] - 80.6Hasan et al. [3] 90.0 70.2Luo et al. [15] 92.2 81.7Liu et al. [13] 95.4 85.1Park et al. [18] 97.0 88.5Hinami et al. [5] 90.8 -Szymanowicz et al. [25] 84.4 75.3VQU-Net (Ours) 89.2 88.3
Table 1. Abnormal event detection accuracy in AUC (%). Wecompare the results from VQU-Net trained for the prediction taskagainst SOTA methods. Only Hinami et al. [5] and Szymanowiczet al. [25] propose methods with explanations of anomalies, hencethese are the main methods we compare against.
Temporal Codebook UCSD Ped2 Avenue✗ ✗ 71.1 78.3✗ ✓ 66.7 81.5✓ ✗ 88.1 87.9✓ ✓ 89.2 88.3
Table 2. Ablation study. Abnormal event detection accuracy inAUC (%). We compare the effect of the temporal information andthe codebook on the performance of VQU-Net method.
Method UCSD AvenuePed2
Szymanowicz et al. [25] 41.6 6.82VQU-Net + Explainability module 67.2 11.9
Table 3. Abnormal event explanation mean Average Precision(mAP) evaluated on the full X-MAN dataset.
quantization requires retrieving the nearest neighbour in thecodebook.
5.3. Anomaly explanations.
Comparison against the method from Szymanowicz etal. [25]. Tab. 3 shows the mAP achieved by our systemon the anomaly explanation task. VQU-Net is seen to out-perform the method from Szymanowicz et al. [25] on bothdatasets. There are 2 main reasons for this. Firstly, Slow-Fast [1] (used for explanations in the VQU-Net method)is a temporal method, while DRG [2] (used for explana-tions in the method from Szymanowicz et al. [25]) operateson a single frame, hence it is expected that SlowFast willrecognise actions / interactions better than DRG, hence re-sulting in a higher explanation mAP. Secondly, the X-MANdataset contains classes that follow mostly the COCO and
Method UCSD AvenuePed2
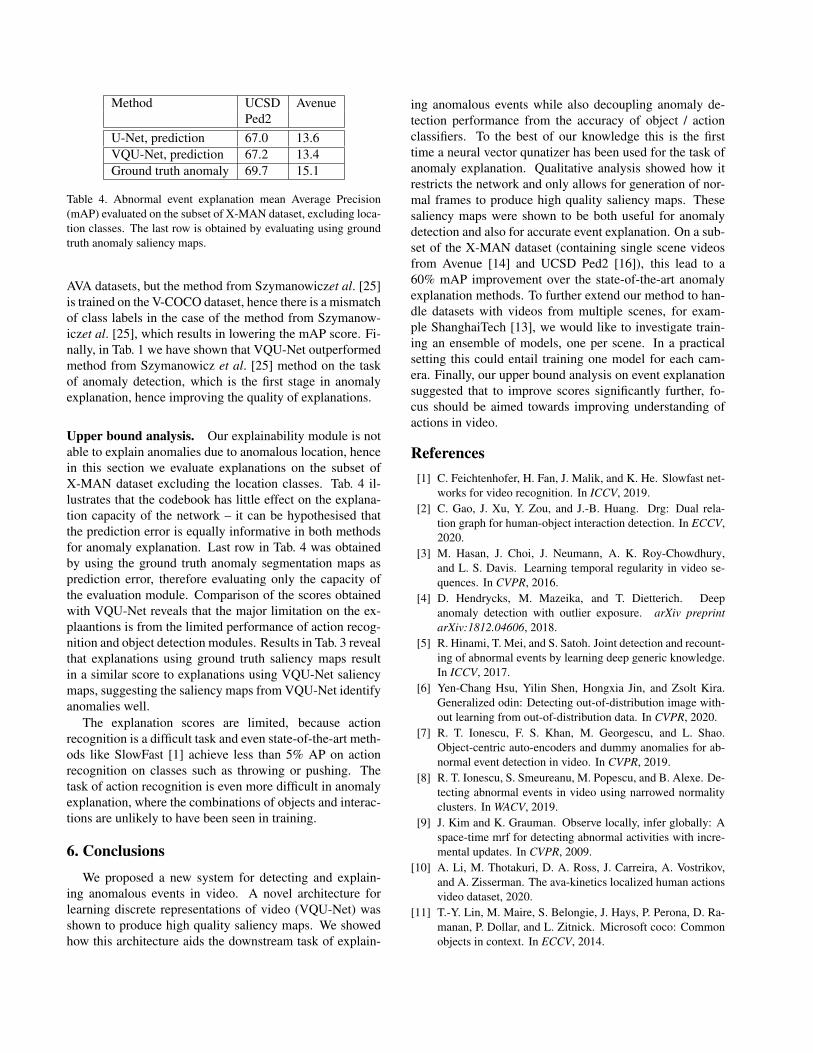
U-Net, prediction 67.0 13.6VQU-Net, prediction 67.2 13.4Ground truth anomaly 69.7 15.1
Table 4. Abnormal event explanation mean Average Precision(mAP) evaluated on the subset of X-MAN dataset, excluding loca-tion classes. The last row is obtained by evaluating using groundtruth anomaly saliency maps.
AVA datasets, but the method from Szymanowiczet al. [25]is trained on the V-COCO dataset, hence there is a mismatchof class labels in the case of the method from Szymanow-iczet al. [25], which results in lowering the mAP score. Fi-nally, in Tab. 1 we have shown that VQU-Net outperformedmethod from Szymanowicz et al. [25] method on the taskof anomaly detection, which is the first stage in anomalyexplanation, hence improving the quality of explanations.
Upper bound analysis. Our explainability module is notable to explain anomalies due to anomalous location, hencein this section we evaluate explanations on the subset ofX-MAN dataset excluding the location classes. Tab. 4 il-lustrates that the codebook has little effect on the explana-tion capacity of the network – it can be hypothesised thatthe prediction error is equally informative in both methodsfor anomaly explanation. Last row in Tab. 4 was obtainedby using the ground truth anomaly segmentation maps asprediction error, therefore evaluating only the capacity ofthe evaluation module. Comparison of the scores obtainedwith VQU-Net reveals that the major limitation on the ex-plaantions is from the limited performance of action recog-nition and object detection modules. Results in Tab. 3 revealthat explanations using ground truth saliency maps resultin a similar score to explanations using VQU-Net saliencymaps, suggesting the saliency maps from VQU-Net identifyanomalies well.
The explanation scores are limited, because actionrecognition is a difficult task and even state-of-the-art meth-ods like SlowFast [1] achieve less than 5% AP on actionrecognition on classes such as throwing or pushing. Thetask of action recognition is even more difficult in anomalyexplanation, where the combinations of objects and interac-tions are unlikely to have been seen in training.
6. ConclusionsWe proposed a new system for detecting and explain-
ing anomalous events in video. A novel architecture forlearning discrete representations of video (VQU-Net) wasshown to produce high quality saliency maps. We showedhow this architecture aids the downstream task of explain-
ing anomalous events while also decoupling anomaly de-tection performance from the accuracy of object / actionclassifiers. To the best of our knowledge this is the firsttime a neural vector qunatizer has been used for the task ofanomaly explanation. Qualitative analysis showed how itrestricts the network and only allows for generation of nor-mal frames to produce high quality saliency maps. Thesesaliency maps were shown to be both useful for anomalydetection and also for accurate event explanation. On a sub-set of the X-MAN dataset (containing single scene videosfrom Avenue [14] and UCSD Ped2 [16]), this lead to a60% mAP improvement over the state-of-the-art anomalyexplanation methods. To further extend our method to han-dle datasets with videos from multiple scenes, for exam-ple ShanghaiTech [13], we would like to investigate train-ing an ensemble of models, one per scene. In a practicalsetting this could entail training one model for each cam-era. Finally, our upper bound analysis on event explanationsuggested that to improve scores significantly further, fo-cus should be aimed towards improving understanding ofactions in video.
References[1] C. Feichtenhofer, H. Fan, J. Malik, and K. He. Slowfast net-
works for video recognition. In ICCV, 2019.[2] C. Gao, J. Xu, Y. Zou, and J.-B. Huang. Drg: Dual rela-
tion graph for human-object interaction detection. In ECCV,2020.
[3] M. Hasan, J. Choi, J. Neumann, A. K. Roy-Chowdhury,and L. S. Davis. Learning temporal regularity in video se-quences. In CVPR, 2016.
[4] D. Hendrycks, M. Mazeika, and T. Dietterich. Deepanomaly detection with outlier exposure. arXiv preprintarXiv:1812.04606, 2018.
[5] R. Hinami, T. Mei, and S. Satoh. Joint detection and recount-ing of abnormal events by learning deep generic knowledge.In ICCV, 2017.
[6] Yen-Chang Hsu, Yilin Shen, Hongxia Jin, and Zsolt Kira.Generalized odin: Detecting out-of-distribution image with-out learning from out-of-distribution data. In CVPR, 2020.
[7] R. T. Ionescu, F. S. Khan, M. Georgescu, and L. Shao.Object-centric auto-encoders and dummy anomalies for ab-normal event detection in video. In CVPR, 2019.
[8] R. T. Ionescu, S. Smeureanu, M. Popescu, and B. Alexe. De-tecting abnormal events in video using narrowed normalityclusters. In WACV, 2019.
[9] J. Kim and K. Grauman. Observe locally, infer globally: Aspace-time mrf for detecting abnormal activities with incre-mental updates. In CVPR, 2009.
[10] A. Li, M. Thotakuri, D. A. Ross, J. Carreira, A. Vostrikov,and A. Zisserman. The ava-kinetics localized human actionsvideo dataset, 2020.
[11] T.-Y. Lin, M. Maire, S. Belongie, J. Hays, P. Perona, D. Ra-manan, P. Dollar, and L. Zitnick. Microsoft coco: Commonobjects in context. In ECCV, 2014.

[12] W. Liu, R. Li, M. Zheng, S. Karanam, Z. Wu, B. Bhanu,R. J. Radke, and O. Camps. Towards visually explainingvariational autoencoders. In CVPR, 2020.
[13] W. Liu, W. Luo, D. Lian, and S. Gao. Future frame predictionfor anomaly detection - a new baseline. In CVPR, 2018.
[14] C. Lu, J. Shi, and J. Jia. Abnormal event detection at 150 fpsin matlab. In ICCV, 2013.
[15] W. Luo, W. Liu, and S. Gao. A revisit of sparse coding basedanomaly detection in stacked rnn framework. In ICCV, 2017.
[16] V. Mahadevan, W. Li, V. Bhalodia, and N. Vasconcelos.Anomaly detection in crowded scenes. In CVPR, 2010.
[17] H. Mousavi, S. Mohammadi, A. Perina, R. Chellali, and V.Murino. Analyzing tracklets for the detection of abnormalcrowd behavior. In WACV, 2015.
[18] H. Park, J. Noh, and B. Ham. Learning memory-guided nor-mality for anomaly detection. In CVPR, 2020.
[19] M. Ravanbakhsh, M. Nabi, E. Sangineto, L. Marcenaro, C.Regazzoni, and N. Sebe. Abnormal event detection in videosusing generative adversarial nets. In ICIP, 2017.
[20] M. Ravanbakhsh, E. Sangineto, M. Nabi, and N. Sebe. Train-ing adversarial discriminators for cross-channel abnormalevent detection in crowds. In WACV, 2019.
[21] Jie Ren, Peter J Liu, Emily Fertig, Jasper Snoek, RyanPoplin, Mark A DePristo, Joshua V Dillon, and Balaji Lak-shminarayanan. Likelihood ratios for out-of-distribution de-tection. arXiv preprint arXiv:1906.02845, 2019.
[22] S. Ren, K. He, R. Girshick, and J. Sun. Faster r-cnn: Towardsreal-time object detection with region proposal networks. InC. Cortes, N. D. Lawrence, D. D. Lee, M. Sugiyama, andR. Garnett, editors, NIPS, pages 91–99. Curran Associates,Inc., 2015.
[23] O. Ronneberger, P.Fischer, and T. Brox. U-net: Convolu-tional networks for biomedical image segmentation. In Med-ical Image Computing and Computer-Assisted Intervention(MICCAI), volume 9351 of LNCS, pages 234–241. Springer,2015.
[24] M. Sabokrou, M. Fathy, M. Hoseini, and R. Klette. Real-time anomaly detection and localization in crowded scenes.In CVPR, 2015.
[25] S. Szymanowicz, J. Charles, and R. Cipolla. X-MAN: Ex-plaining multiple sources of anomalies in video. In CVPRWorkshops, 2021.
[26] Aaron van den Oord, Oriol Vinyals, and koray kavukcuoglu.Neural discrete representation learning. In I. Guyon, U. V.Luxburg, S. Bengio, H. Wallach, R. Fergus, S. Vish-wanathan, and R. Garnett, editors, Advances in Neural Infor-mation Processing Systems, volume 30. Curran Associates,Inc., 2017.
[27] L. Wang, F. Zhou, Z. Li, W. Zuo, and H. Tan. Abnormalevent detection in videos using hybrid spatio-temporal au-toencoder. In ICIP, 2018.
[28] Y. Zhao, L. Zhou, K. Fu, and J. Yang. Abnormal event detec-tion using spatio-temporal feature and nonnegative locality-constrained linear coding. In ICIP, 2016.