pluviometric anomaly in the llobregat delta
TRANSCRIPT

Tethys, 6, 31–50, 2009Journal of Weather & Climate of the Western Mediterraneanwww.tethys.catISSN-1697-1523eISSN-1139-3394DOI:10.3369/tethys.2009.6.03
Journal edited by ACAM(Associacio Catalana de Meteorologia)
Pluviometric anomaly in the Llobregat DeltaJ. Mazon1 and D. Pino1,2
1Department of Applied Physics. Escola Politecnica Superior de Castelldefels, Universitat Politecnica de Catalunya. Avda.del Canal Olımpic s/n. 08860 Castelldefels
2Institut d’Estudis Espacials de Catalunya (IEEC/CSIC). Barcelona
Received: 16-X-2008 – Accepted: 10-III-2009 – Translated version
Correspondence to: [email protected]
Abstract
The data from surface automatic weather stations show that in the area of the Llobregat delta(northeast of the Iberian Peninsula) we can observe greater precipitation than in nearby inlandareas (Ordal, Collserola, Garraf), than on the other side of a massif located on the coast (Garraf)and than on the northern coast. This distribution of the precipitation could be explained by theformation of a nocturnal surface cold front in the Llobregat delta. In order to analyze in-depththe physical mechanisms that can influence the formation of this front (topography, sea anddrainage winds), two rain episodes in the area were simulated with the MM5 mesoscale model,reproducing satisfactorily the physical mechanisms that favor the appearance of the front.
Key words: nocturnal land breeze, coastal fronts, precipitation rhythms
1 Introduction
When two air masses with different temperatures, andtherefore different densities, converge on the surface, as it isknown, they do not mix, but the warmer and less dense massmoves above the cold one. If the cold mass, which is moredense, is the one that advances under the warm one, the re-sult is the formation of a cold front. If the warm mass movesabove the cold one, the result is the formation of a warmfront. When ascending, the relatively warm mass gets coolerand might therefore generate cloudiness and precipitation.
As we will see, the comparative climatic analysis of theprecipitation in the Llobregat delta and neighboring areas in-dicates that precipitation is greater in the delta than in theneighboring areas from the end of the summer to the begin-ning of the winter, but above all during the fall. The reasonfor this pluviometric anomaly, as proposed in this work, isthe formation of a nocturnal surface cold front over the delta,or at a few kilometers from the coast.
The topographic characteristics of the Llobregat deltawould favor the convergence of air masses of different den-sities. First of all, this is because of the existence of the wideand long low-lying valley of the Llobregat river, confinedbetween the Ordal and Collserola ranges in its last stretch,
which becomes wider when reaching the delta area. Sec-ondly, it is due to the sudden rise of the Garraf massif, in thewesternmost area of the delta, and of Montjuıc Mountain tothe east, both limiting the Llobregat delta, and therefore lim-iting the cold air that descends the valley during the night.Lastly, there is the presence of the Mediterranean sea, withhigh water temperatures from the end of the summer until thebeginning of the winter, which guarantee a warm and moistair mass in the coastal region.
This work is structured as follows: Section 2 explainshow a coastal front is formed through differences of temper-ature between air masses. Section 3 is dedicated to the cli-matic analysis of the area. Once the pluviometric peculiarityof this area is detected and explained, Section 4 explains themodeling of two rain episodes in the area with the mesoscalemodel MM5 (Dudhia, 1993). The article ends with the con-clusions.
2 The surface cold front
The formation of a coastal surface cold front throughthe interaction of a relatively cold air mass, that descends avalley (drainage) or comes from the mountains located near
2009 Author(s). This work is licensed under a Creative Commons License.
J. Mazon i D. Pino: Pluviometric anomaly
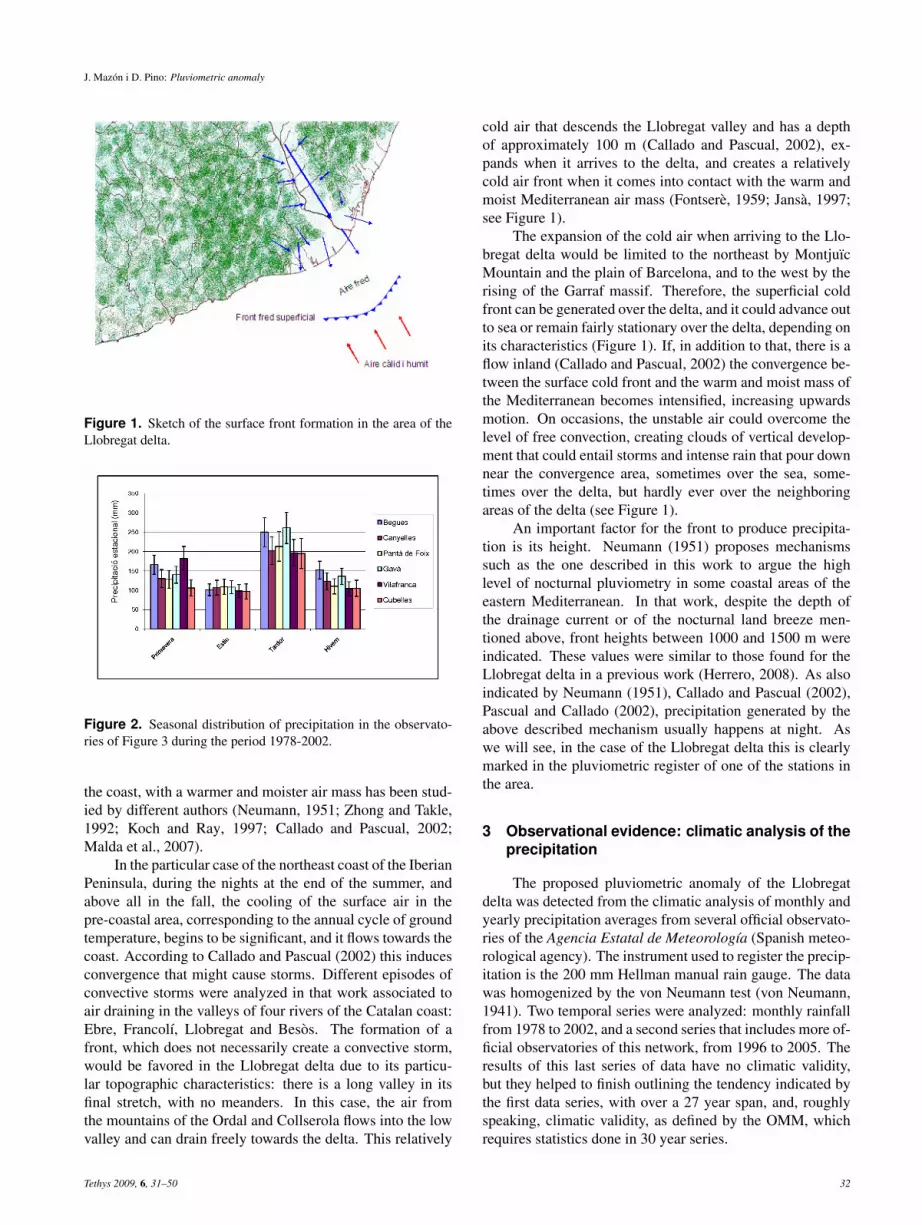
Figure 1. Sketch of the surface front formation in the area of theLlobregat delta.
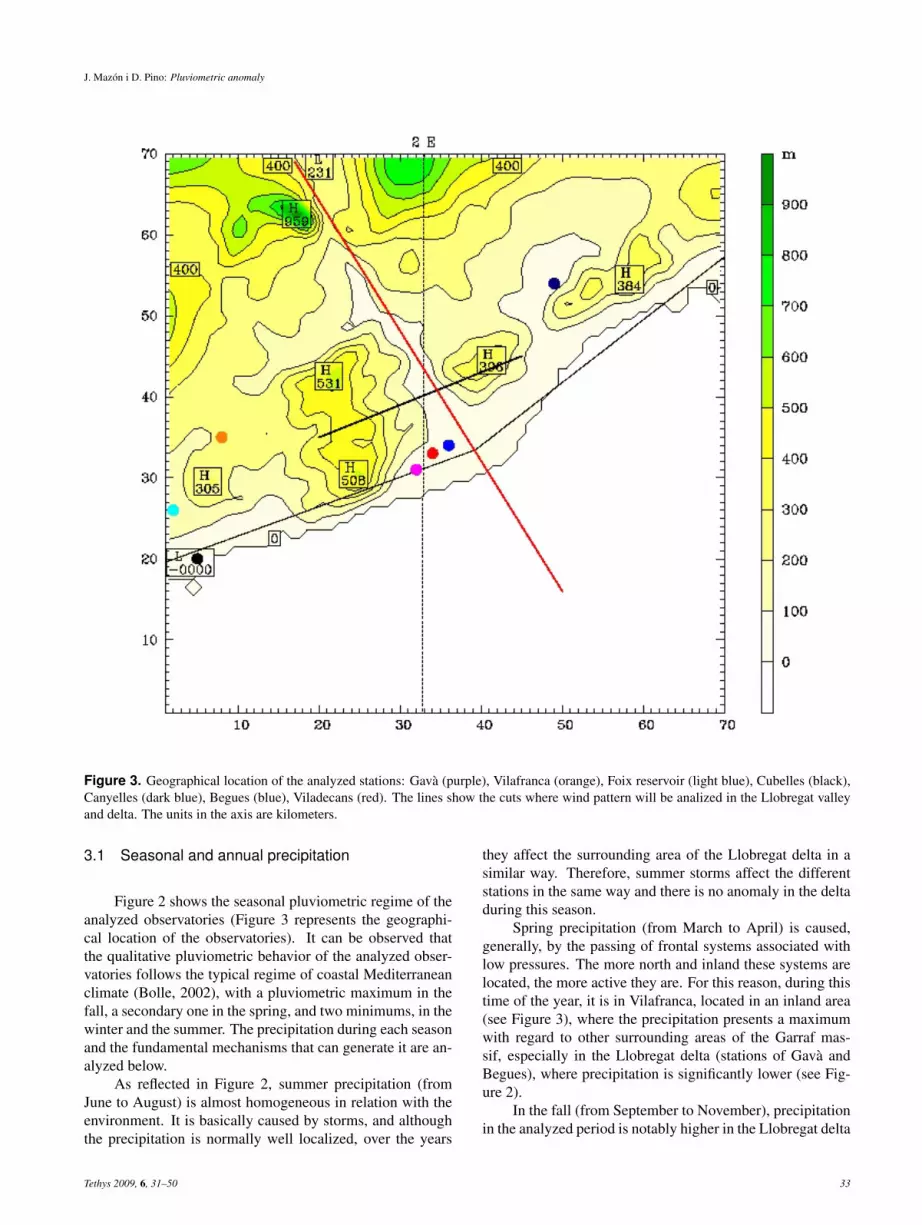
Figure 2. Seasonal distribution of precipitation in the observato-ries of Figure 3 during the period 1978-2002.
the coast, with a warmer and moister air mass has been stud-ied by different authors (Neumann, 1951; Zhong and Takle,1992; Koch and Ray, 1997; Callado and Pascual, 2002;Malda et al., 2007).
In the particular case of the northeast coast of the IberianPeninsula, during the nights at the end of the summer, andabove all in the fall, the cooling of the surface air in thepre-coastal area, corresponding to the annual cycle of groundtemperature, begins to be significant, and it flows towards thecoast. According to Callado and Pascual (2002) this inducesconvergence that might cause storms. Different episodes ofconvective storms were analyzed in that work associated toair draining in the valleys of four rivers of the Catalan coast:Ebre, Francolı, Llobregat and Besos. The formation of afront, which does not necessarily create a convective storm,would be favored in the Llobregat delta due to its particu-lar topographic characteristics: there is a long valley in itsfinal stretch, with no meanders. In this case, the air fromthe mountains of the Ordal and Collserola flows into the lowvalley and can drain freely towards the delta. This relatively
cold air that descends the Llobregat valley and has a depthof approximately 100 m (Callado and Pascual, 2002), ex-pands when it arrives to the delta, and creates a relativelycold air front when it comes into contact with the warm andmoist Mediterranean air mass (Fontsere, 1959; Jansa, 1997;see Figure 1).
The expansion of the cold air when arriving to the Llo-bregat delta would be limited to the northeast by MontjuıcMountain and the plain of Barcelona, and to the west by therising of the Garraf massif. Therefore, the superficial coldfront can be generated over the delta, and it could advance outto sea or remain fairly stationary over the delta, depending onits characteristics (Figure 1). If, in addition to that, there is aflow inland (Callado and Pascual, 2002) the convergence be-tween the surface cold front and the warm and moist mass ofthe Mediterranean becomes intensified, increasing upwardsmotion. On occasions, the unstable air could overcome thelevel of free convection, creating clouds of vertical develop-ment that could entail storms and intense rain that pour downnear the convergence area, sometimes over the sea, some-times over the delta, but hardly ever over the neighboringareas of the delta (see Figure 1).
An important factor for the front to produce precipita-tion is its height. Neumann (1951) proposes mechanismssuch as the one described in this work to argue the highlevel of nocturnal pluviometry in some coastal areas of theeastern Mediterranean. In that work, despite the depth ofthe drainage current or of the nocturnal land breeze men-tioned above, front heights between 1000 and 1500 m wereindicated. These values were similar to those found for theLlobregat delta in a previous work (Herrero, 2008). As alsoindicated by Neumann (1951), Callado and Pascual (2002),Pascual and Callado (2002), precipitation generated by theabove described mechanism usually happens at night. Aswe will see, in the case of the Llobregat delta this is clearlymarked in the pluviometric register of one of the stations inthe area.
3 Observational evidence: climatic analysis of theprecipitation
The proposed pluviometric anomaly of the Llobregatdelta was detected from the climatic analysis of monthly andyearly precipitation averages from several official observato-ries of the Agencia Estatal de Meteorologıa (Spanish meteo-rological agency). The instrument used to register the precip-itation is the 200 mm Hellman manual rain gauge. The datawas homogenized by the von Neumann test (von Neumann,1941). Two temporal series were analyzed: monthly rainfallfrom 1978 to 2002, and a second series that includes more of-ficial observatories of this network, from 1996 to 2005. Theresults of this last series of data have no climatic validity,but they helped to finish outlining the tendency indicated bythe first data series, with over a 27 year span, and, roughlyspeaking, climatic validity, as defined by the OMM, whichrequires statistics done in 30 year series.
Tethys 2009, 6, 31–50 32
J. Mazon i D. Pino: Pluviometric anomaly
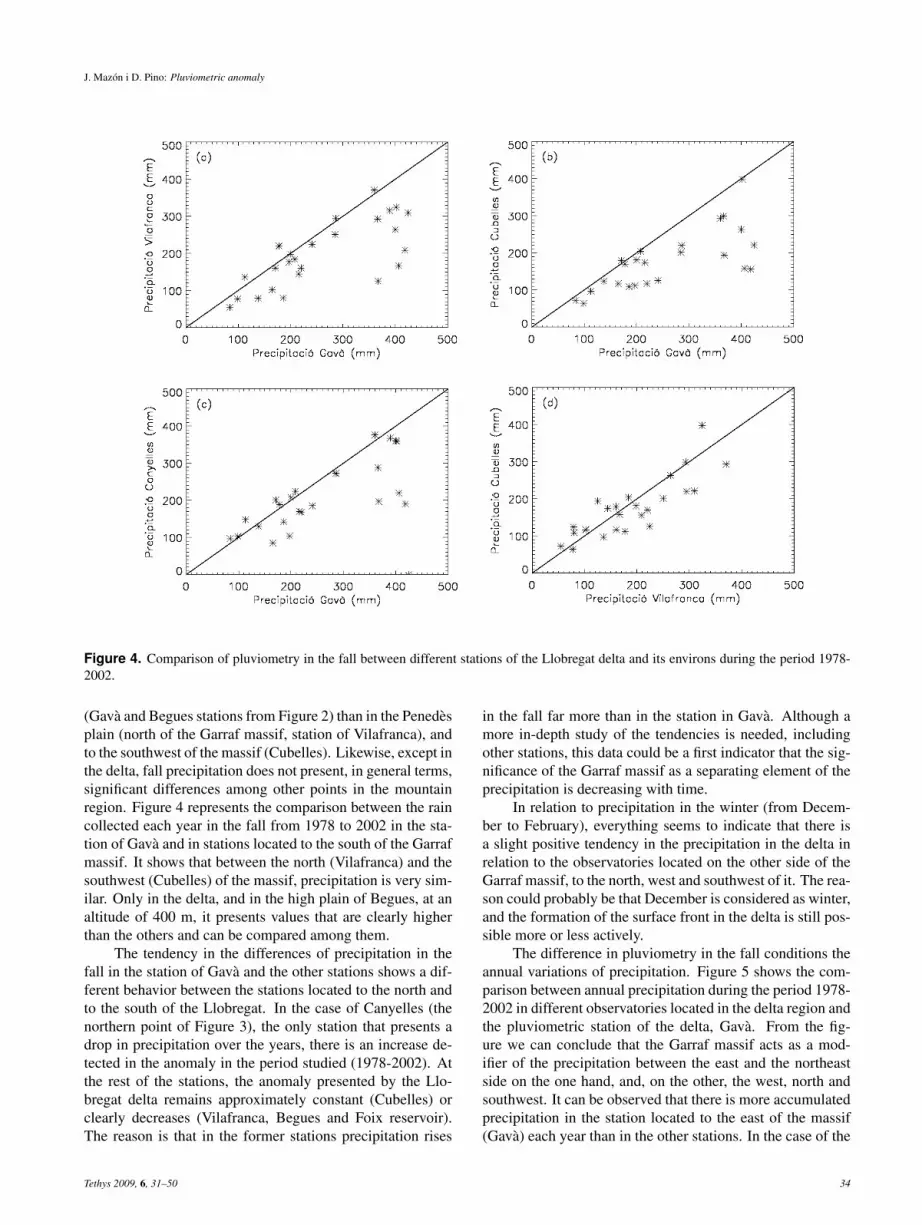
Figure 3. Geographical location of the analyzed stations: Gava (purple), Vilafranca (orange), Foix reservoir (light blue), Cubelles (black),Canyelles (dark blue), Begues (blue), Viladecans (red). The lines show the cuts where wind pattern will be analized in the Llobregat valleyand delta. The units in the axis are kilometers.
3.1 Seasonal and annual precipitation
Figure 2 shows the seasonal pluviometric regime of theanalyzed observatories (Figure 3 represents the geographi-cal location of the observatories). It can be observed thatthe qualitative pluviometric behavior of the analyzed obser-vatories follows the typical regime of coastal Mediterraneanclimate (Bolle, 2002), with a pluviometric maximum in thefall, a secondary one in the spring, and two minimums, in thewinter and the summer. The precipitation during each seasonand the fundamental mechanisms that can generate it are an-alyzed below.
As reflected in Figure 2, summer precipitation (fromJune to August) is almost homogeneous in relation with theenvironment. It is basically caused by storms, and althoughthe precipitation is normally well localized, over the years
they affect the surrounding area of the Llobregat delta in asimilar way. Therefore, summer storms affect the differentstations in the same way and there is no anomaly in the deltaduring this season.
Spring precipitation (from March to April) is caused,generally, by the passing of frontal systems associated withlow pressures. The more north and inland these systems arelocated, the more active they are. For this reason, during thistime of the year, it is in Vilafranca, located in an inland area(see Figure 3), where the precipitation presents a maximumwith regard to other surrounding areas of the Garraf mas-sif, especially in the Llobregat delta (stations of Gava andBegues), where precipitation is significantly lower (see Fig-ure 2).
In the fall (from September to November), precipitationin the analyzed period is notably higher in the Llobregat delta
Tethys 2009, 6, 31–50 33
J. Mazon i D. Pino: Pluviometric anomaly
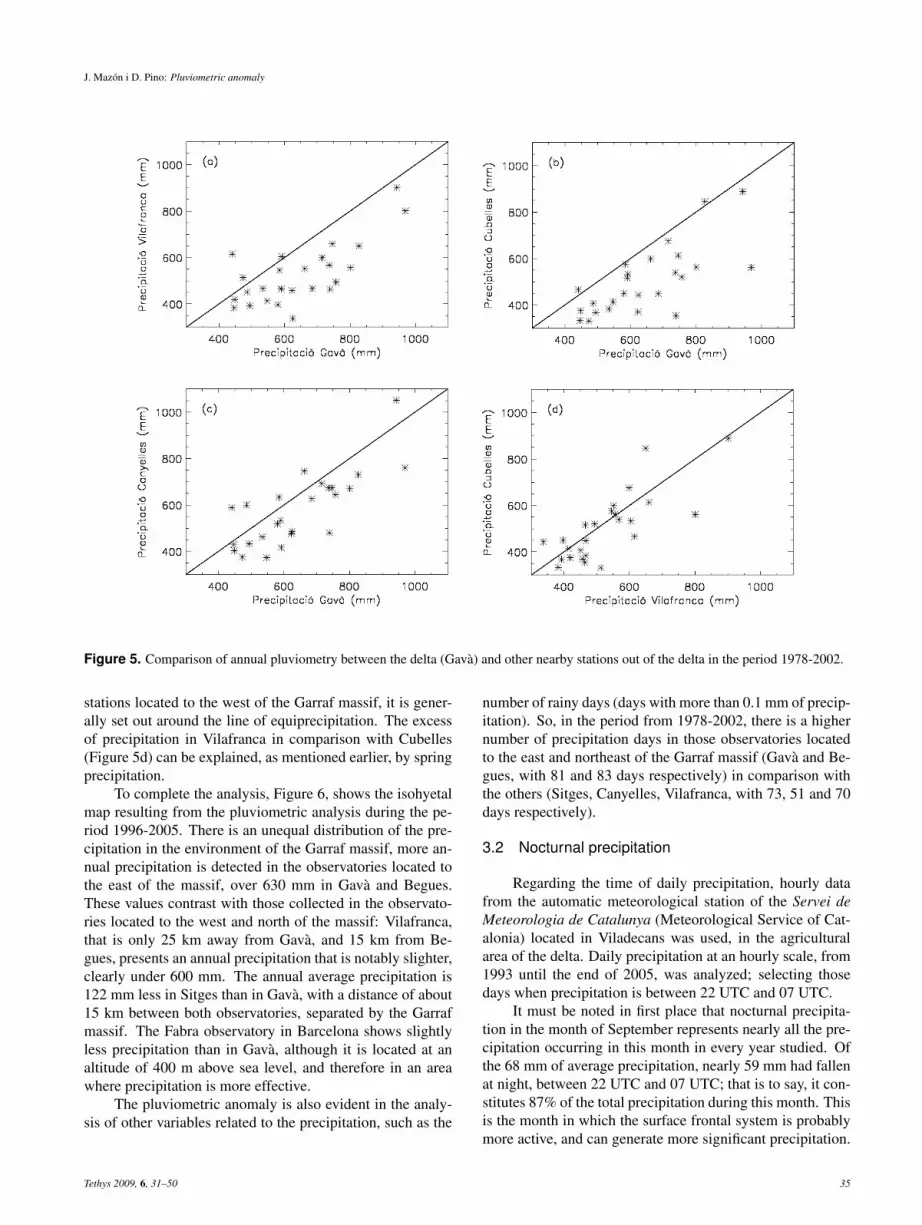
Figure 4. Comparison of pluviometry in the fall between different stations of the Llobregat delta and its environs during the period 1978-2002.
(Gava and Begues stations from Figure 2) than in the Penedesplain (north of the Garraf massif, station of Vilafranca), andto the southwest of the massif (Cubelles). Likewise, except inthe delta, fall precipitation does not present, in general terms,significant differences among other points in the mountainregion. Figure 4 represents the comparison between the raincollected each year in the fall from 1978 to 2002 in the sta-tion of Gava and in stations located to the south of the Garrafmassif. It shows that between the north (Vilafranca) and thesouthwest (Cubelles) of the massif, precipitation is very sim-ilar. Only in the delta, and in the high plain of Begues, at analtitude of 400 m, it presents values that are clearly higherthan the others and can be compared among them.
The tendency in the differences of precipitation in thefall in the station of Gava and the other stations shows a dif-ferent behavior between the stations located to the north andto the south of the Llobregat. In the case of Canyelles (thenorthern point of Figure 3), the only station that presents adrop in precipitation over the years, there is an increase de-tected in the anomaly in the period studied (1978-2002). Atthe rest of the stations, the anomaly presented by the Llo-bregat delta remains approximately constant (Cubelles) orclearly decreases (Vilafranca, Begues and Foix reservoir).The reason is that in the former stations precipitation rises
in the fall far more than in the station in Gava. Although amore in-depth study of the tendencies is needed, includingother stations, this data could be a first indicator that the sig-nificance of the Garraf massif as a separating element of theprecipitation is decreasing with time.
In relation to precipitation in the winter (from Decem-ber to February), everything seems to indicate that there isa slight positive tendency in the precipitation in the delta inrelation to the observatories located on the other side of theGarraf massif, to the north, west and southwest of it. The rea-son could probably be that December is considered as winter,and the formation of the surface front in the delta is still pos-sible more or less actively.
The difference in pluviometry in the fall conditions theannual variations of precipitation. Figure 5 shows the com-parison between annual precipitation during the period 1978-2002 in different observatories located in the delta region andthe pluviometric station of the delta, Gava. From the fig-ure we can conclude that the Garraf massif acts as a mod-ifier of the precipitation between the east and the northeastside on the one hand, and, on the other, the west, north andsouthwest. It can be observed that there is more accumulatedprecipitation in the station located to the east of the massif(Gava) each year than in the other stations. In the case of the
Tethys 2009, 6, 31–50 34
J. Mazon i D. Pino: Pluviometric anomaly
Figure 5. Comparison of annual pluviometry between the delta (Gava) and other nearby stations out of the delta in the period 1978-2002.
stations located to the west of the Garraf massif, it is gener-ally set out around the line of equiprecipitation. The excessof precipitation in Vilafranca in comparison with Cubelles(Figure 5d) can be explained, as mentioned earlier, by springprecipitation.
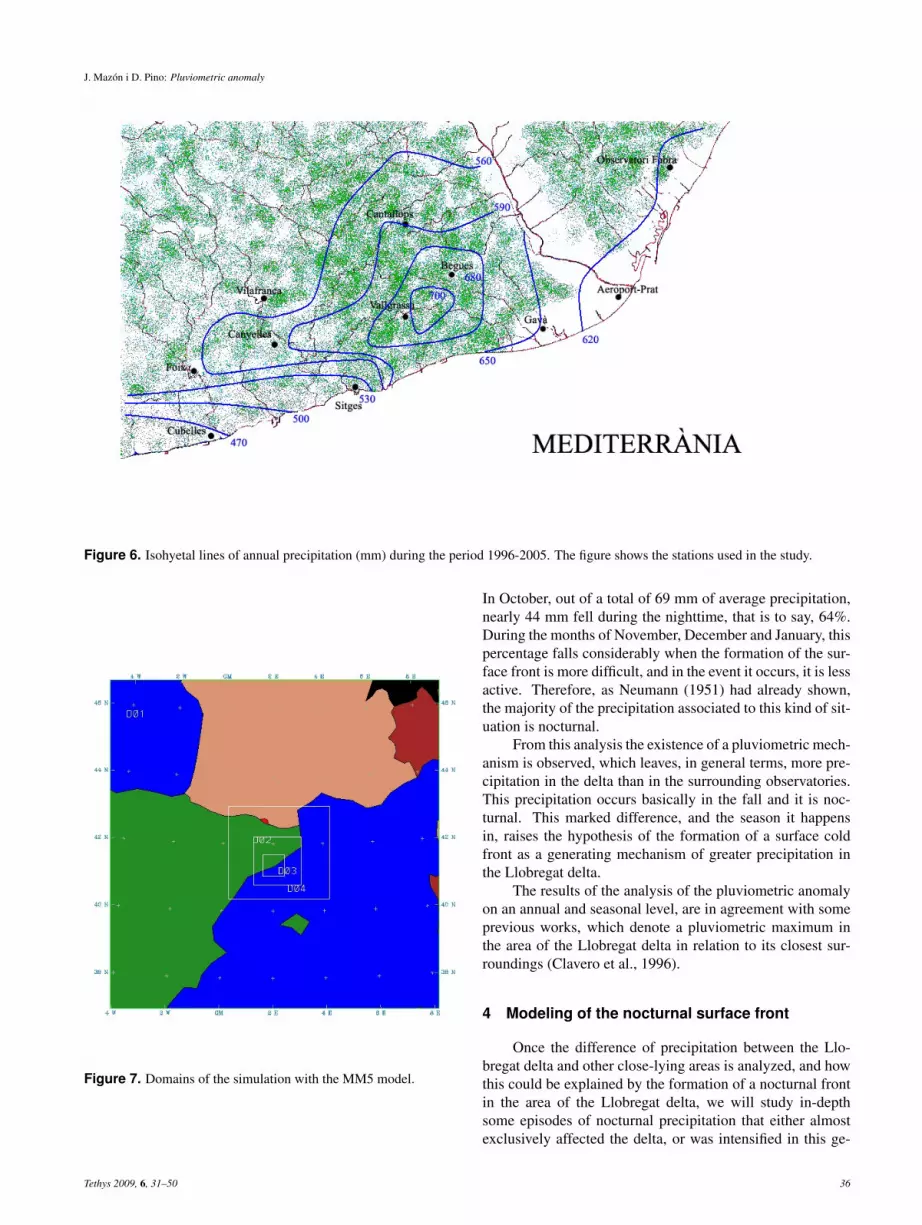
To complete the analysis, Figure 6, shows the isohyetalmap resulting from the pluviometric analysis during the pe-riod 1996-2005. There is an unequal distribution of the pre-cipitation in the environment of the Garraf massif, more an-nual precipitation is detected in the observatories located tothe east of the massif, over 630 mm in Gava and Begues.These values contrast with those collected in the observato-ries located to the west and north of the massif: Vilafranca,that is only 25 km away from Gava, and 15 km from Be-gues, presents an annual precipitation that is notably slighter,clearly under 600 mm. The annual average precipitation is122 mm less in Sitges than in Gava, with a distance of about15 km between both observatories, separated by the Garrafmassif. The Fabra observatory in Barcelona shows slightlyless precipitation than in Gava, although it is located at analtitude of 400 m above sea level, and therefore in an areawhere precipitation is more effective.
The pluviometric anomaly is also evident in the analy-sis of other variables related to the precipitation, such as the
number of rainy days (days with more than 0.1 mm of precip-itation). So, in the period from 1978-2002, there is a highernumber of precipitation days in those observatories locatedto the east and northeast of the Garraf massif (Gava and Be-gues, with 81 and 83 days respectively) in comparison withthe others (Sitges, Canyelles, Vilafranca, with 73, 51 and 70days respectively).
3.2 Nocturnal precipitation
Regarding the time of daily precipitation, hourly datafrom the automatic meteorological station of the Servei deMeteorologia de Catalunya (Meteorological Service of Cat-alonia) located in Viladecans was used, in the agriculturalarea of the delta. Daily precipitation at an hourly scale, from1993 until the end of 2005, was analyzed; selecting thosedays when precipitation is between 22 UTC and 07 UTC.
It must be noted in first place that nocturnal precipita-tion in the month of September represents nearly all the pre-cipitation occurring in this month in every year studied. Ofthe 68 mm of average precipitation, nearly 59 mm had fallenat night, between 22 UTC and 07 UTC; that is to say, it con-stitutes 87% of the total precipitation during this month. Thisis the month in which the surface frontal system is probablymore active, and can generate more significant precipitation.
Tethys 2009, 6, 31–50 35
J. Mazon i D. Pino: Pluviometric anomaly
Figure 6. Isohyetal lines of annual precipitation (mm) during the period 1996-2005. The figure shows the stations used in the study.
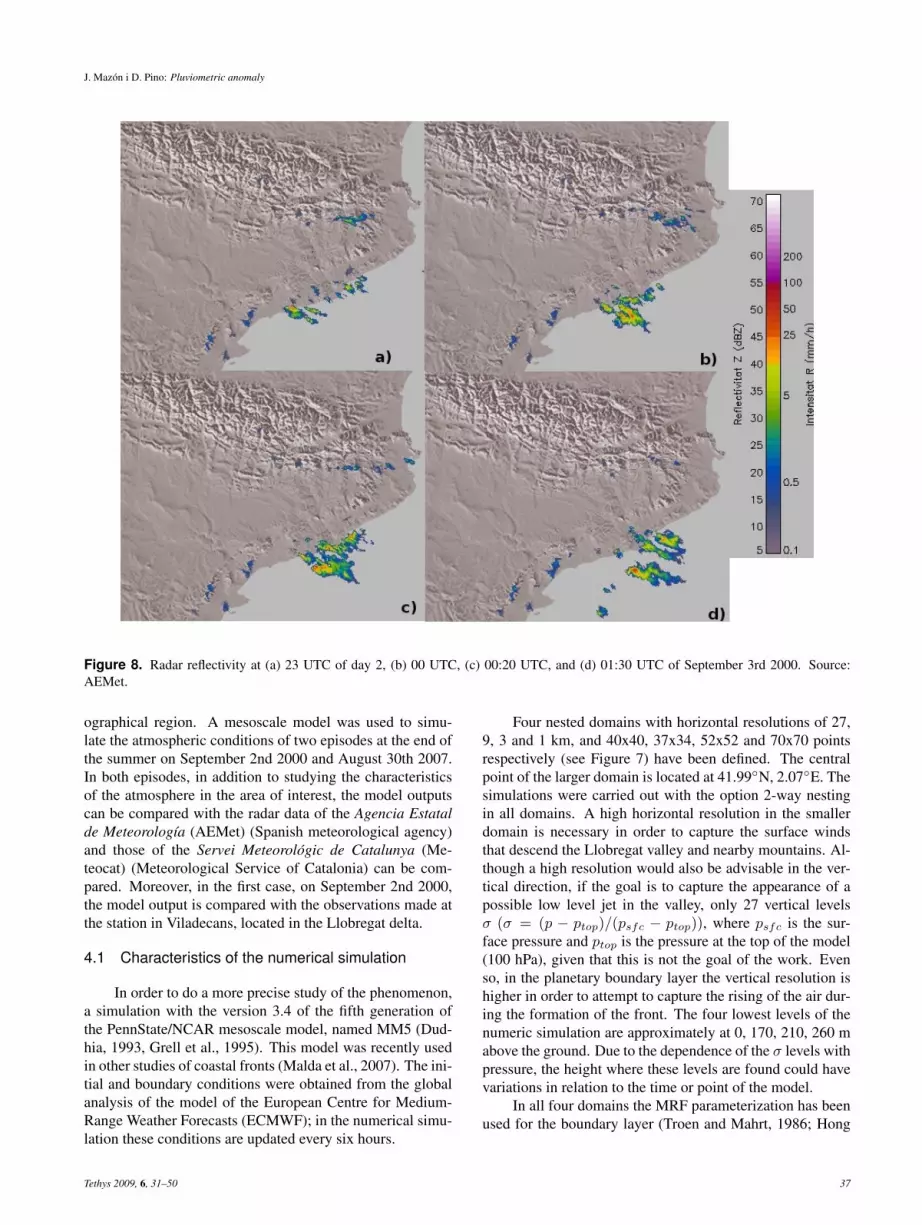
Figure 7. Domains of the simulation with the MM5 model.
In October, out of a total of 69 mm of average precipitation,nearly 44 mm fell during the nighttime, that is to say, 64%.During the months of November, December and January, thispercentage falls considerably when the formation of the sur-face front is more difficult, and in the event it occurs, it is lessactive. Therefore, as Neumann (1951) had already shown,the majority of the precipitation associated to this kind of sit-uation is nocturnal.
From this analysis the existence of a pluviometric mech-anism is observed, which leaves, in general terms, more pre-cipitation in the delta than in the surrounding observatories.This precipitation occurs basically in the fall and it is noc-turnal. This marked difference, and the season it happensin, raises the hypothesis of the formation of a surface coldfront as a generating mechanism of greater precipitation inthe Llobregat delta.
The results of the analysis of the pluviometric anomalyon an annual and seasonal level, are in agreement with someprevious works, which denote a pluviometric maximum inthe area of the Llobregat delta in relation to its closest sur-roundings (Clavero et al., 1996).
4 Modeling of the nocturnal surface front
Once the difference of precipitation between the Llo-bregat delta and other close-lying areas is analyzed, and howthis could be explained by the formation of a nocturnal frontin the area of the Llobregat delta, we will study in-depthsome episodes of nocturnal precipitation that either almostexclusively affected the delta, or was intensified in this ge-
Tethys 2009, 6, 31–50 36
J. Mazon i D. Pino: Pluviometric anomaly
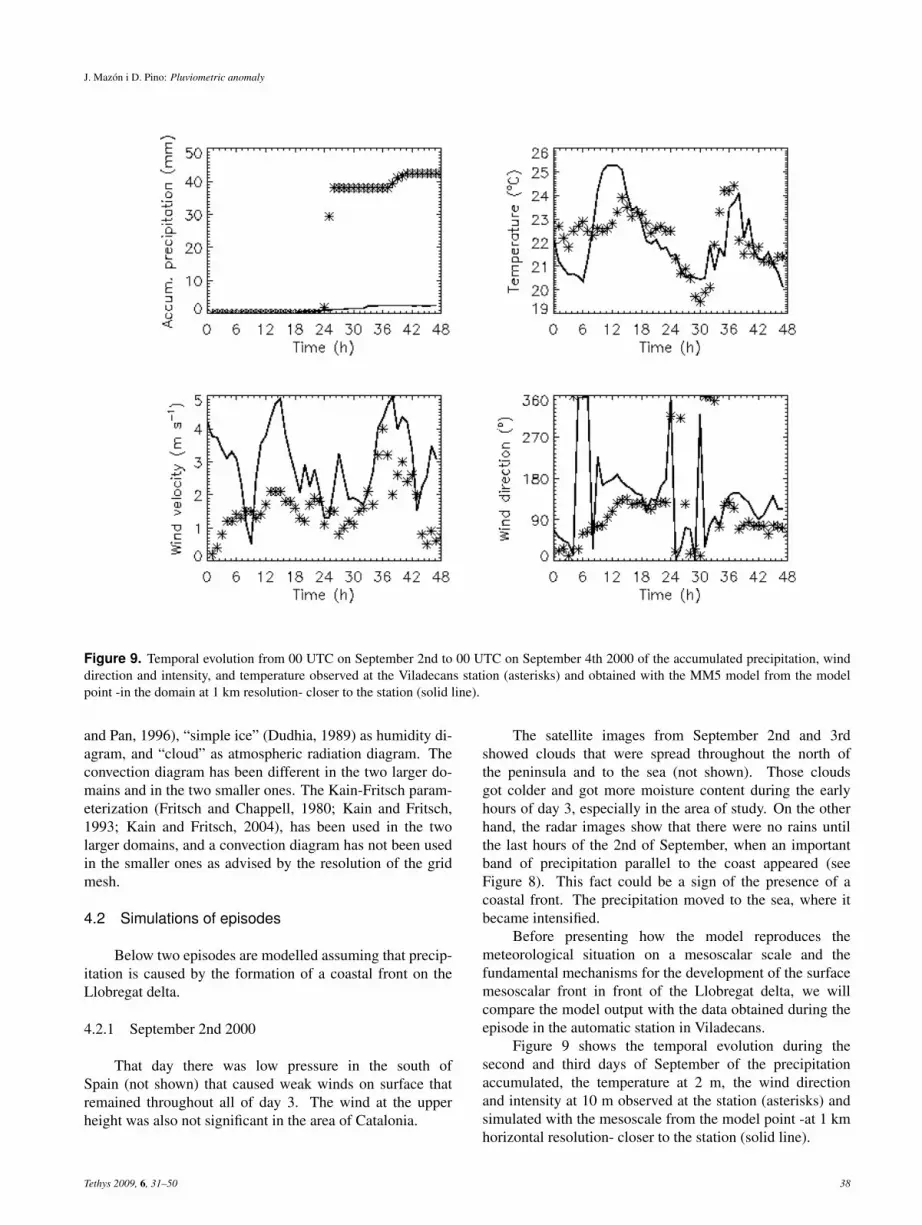
Figure 8. Radar reflectivity at (a) 23 UTC of day 2, (b) 00 UTC, (c) 00:20 UTC, and (d) 01:30 UTC of September 3rd 2000. Source:AEMet.
ographical region. A mesoscale model was used to simu-late the atmospheric conditions of two episodes at the end ofthe summer on September 2nd 2000 and August 30th 2007.In both episodes, in addition to studying the characteristicsof the atmosphere in the area of interest, the model outputscan be compared with the radar data of the Agencia Estatalde Meteorologıa (AEMet) (Spanish meteorological agency)and those of the Servei Meteorologic de Catalunya (Me-teocat) (Meteorological Service of Catalonia) can be com-pared. Moreover, in the first case, on September 2nd 2000,the model output is compared with the observations made atthe station in Viladecans, located in the Llobregat delta.
4.1 Characteristics of the numerical simulation
In order to do a more precise study of the phenomenon,a simulation with the version 3.4 of the fifth generation ofthe PennState/NCAR mesoscale model, named MM5 (Dud-hia, 1993, Grell et al., 1995). This model was recently usedin other studies of coastal fronts (Malda et al., 2007). The ini-tial and boundary conditions were obtained from the globalanalysis of the model of the European Centre for Medium-Range Weather Forecasts (ECMWF); in the numerical simu-lation these conditions are updated every six hours.
Four nested domains with horizontal resolutions of 27,9, 3 and 1 km, and 40x40, 37x34, 52x52 and 70x70 pointsrespectively (see Figure 7) have been defined. The centralpoint of the larger domain is located at 41.99◦N, 2.07◦E. Thesimulations were carried out with the option 2-way nestingin all domains. A high horizontal resolution in the smallerdomain is necessary in order to capture the surface windsthat descend the Llobregat valley and nearby mountains. Al-though a high resolution would also be advisable in the ver-tical direction, if the goal is to capture the appearance of apossible low level jet in the valley, only 27 vertical levelsσ (σ = (p − ptop)/(psfc − ptop)), where psfc is the sur-face pressure and ptop is the pressure at the top of the model(100 hPa), given that this is not the goal of the work. Evenso, in the planetary boundary layer the vertical resolution ishigher in order to attempt to capture the rising of the air dur-ing the formation of the front. The four lowest levels of thenumeric simulation are approximately at 0, 170, 210, 260 mabove the ground. Due to the dependence of the σ levels withpressure, the height where these levels are found could havevariations in relation to the time or point of the model.
In all four domains the MRF parameterization has beenused for the boundary layer (Troen and Mahrt, 1986; Hong
Tethys 2009, 6, 31–50 37
J. Mazon i D. Pino: Pluviometric anomaly
Figure 9. Temporal evolution from 00 UTC on September 2nd to 00 UTC on September 4th 2000 of the accumulated precipitation, winddirection and intensity, and temperature observed at the Viladecans station (asterisks) and obtained with the MM5 model from the modelpoint -in the domain at 1 km resolution- closer to the station (solid line).
and Pan, 1996), “simple ice” (Dudhia, 1989) as humidity di-agram, and “cloud” as atmospheric radiation diagram. Theconvection diagram has been different in the two larger do-mains and in the two smaller ones. The Kain-Fritsch param-eterization (Fritsch and Chappell, 1980; Kain and Fritsch,1993; Kain and Fritsch, 2004), has been used in the twolarger domains, and a convection diagram has not been usedin the smaller ones as advised by the resolution of the gridmesh.
4.2 Simulations of episodes
Below two episodes are modelled assuming that precip-itation is caused by the formation of a coastal front on theLlobregat delta.
4.2.1 September 2nd 2000
That day there was low pressure in the south ofSpain (not shown) that caused weak winds on surface thatremained throughout all of day 3. The wind at the upperheight was also not significant in the area of Catalonia.
The satellite images from September 2nd and 3rdshowed clouds that were spread throughout the north ofthe peninsula and to the sea (not shown). Those cloudsgot colder and got more moisture content during the earlyhours of day 3, especially in the area of study. On the otherhand, the radar images show that there were no rains untilthe last hours of the 2nd of September, when an importantband of precipitation parallel to the coast appeared (seeFigure 8). This fact could be a sign of the presence of acoastal front. The precipitation moved to the sea, where itbecame intensified.
Before presenting how the model reproduces themeteorological situation on a mesoscalar scale and thefundamental mechanisms for the development of the surfacemesoscalar front in front of the Llobregat delta, we willcompare the model output with the data obtained during theepisode in the automatic station in Viladecans.
Figure 9 shows the temporal evolution during thesecond and third days of September of the precipitationaccumulated, the temperature at 2 m, the wind directionand intensity at 10 m observed at the station (asterisks) andsimulated with the mesoscale from the model point -at 1 kmhorizontal resolution- closer to the station (solid line).
Tethys 2009, 6, 31–50 38

J. Mazon i D. Pino: Pluviometric anomaly
Figure 10. Vertical profiles of temperature, temperature in the frost point, wind velocity and direction measured with the Barcelona sounding(solid line) and obtained in the nearest point of the MM5 model (asterisks) on September 3rd 2000 at 00 UTC.
As shown in the figure, the model clearly underesti-mates the precipitation collected in the station. Moreover,the model simulates more precipitation between 10 UTCand 18 UTC on day 3 and not during the previous night.
Regarding temperature, the model adjusts the observa-tions made during the early morning of day 3 quite well,with a 5% of maximum error. Likewise, the model correctlysimulates the wind direction and intensity observed duringthe last hours of day 2 and throughout day 3. This periodcoincides with the development of the front. As shown,winds between 00 UTC and 08 UTC on September 3rdcome from the northwest, and could be drainage windsthat descend the Llobregat valley. Therefore, looking atFigure 9, the model correctly reproduces the atmosphericconditions registered at Viladecans, except the precipitationwhich, as postulated throughout the article, is quite a localphenomenon.
The sounding in Barcelona, 15 km to the north of thearea of study, and outside the influence of the Llobregatdelta, provides another source of validation of the model forthe days of study. Figure 10 represents the vertical profilesof the temperature, the temperature of the dew point, thewind direction and intensity measured with the Barcelona
sounding (41.383◦N, 2.116◦E) and obtained with the modelMM5 from the point in domain 4 closer to the soundingpoint (41.404◦N, 2.181◦E, 28 m) on September 3rd 2000 at00 UTC.
We can conclude that, despite the fact that the modelcan not capture all the structure of the surface layer, espe-cially regarding wind speed, the atmospheric conditions inthe boundary layer are well reproduced on the day of study.
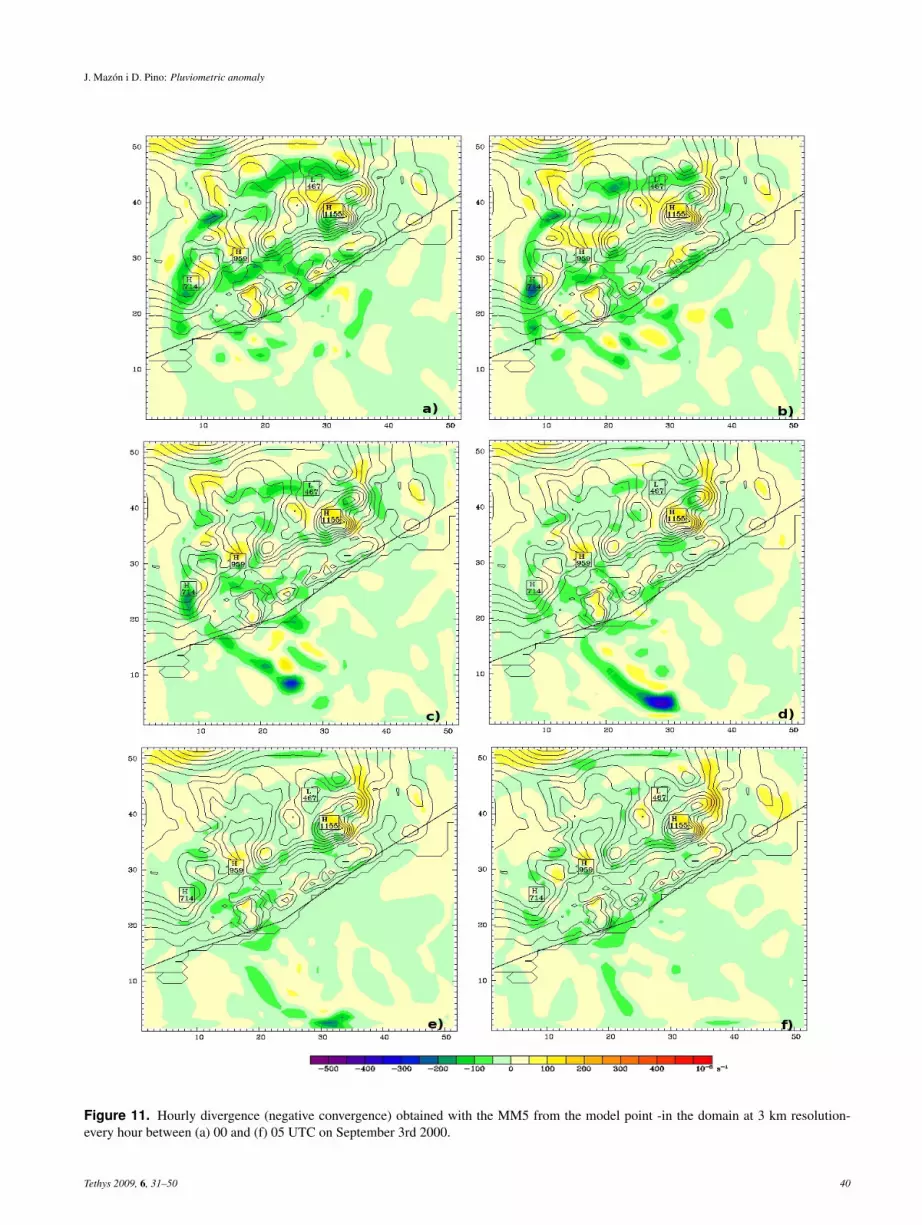
Next, we will focus on the wind simulation and pre-cipitation obtained in the two smaller domains, of 3 and1 km horizontal resolution. Figure 11 shows the divergence(negative convergence) obtained with the numeric simulationin domain 3 between 00 and 05 UTC on September 3rd2000. As illustrated, the model produces negative values ofthe divergence, i.e., positive convergence, in the entire coastbefore the Llobregat delta, which favors vertical movementsand could produce cloudiness in the area. To observe howthis convergence happens and its effects in more detail, wewill analyze the model output to the smaller domain.
Figure 12 shows surface winds and the accumulatedprecipitation obtained with the model in the smallest domainof the simulation between 00 and 05 UTC on September 3rd2000. It can be observed that initially the predominant winds
Tethys 2009, 6, 31–50 39
J. Mazon i D. Pino: Pluviometric anomaly
Figure 11. Hourly divergence (negative convergence) obtained with the MM5 from the model point -in the domain at 3 km resolution-every hour between (a) 00 and (f) 05 UTC on September 3rd 2000.
Tethys 2009, 6, 31–50 40

J. Mazon i D. Pino: Pluviometric anomaly
Figure 12. Surface winds (red arrows) and accumulated precipitation outlines obtained with the MM5 from the model point -in the domainat 1 km resolution- every hour between (a) 00 and (f) 05 UTC on September 3rd 2000.
Tethys 2009, 6, 31–50 41

J. Mazon i D. Pino: Pluviometric anomaly
Figure 13. Wind field (left) and intensity of the horizontal component of the wind in north-south direction (right) at 06 UTC on September3rd 2000 along the vertical cut marked with a red line in Figure 15. It is important to remark that the vertical scale is different in both graphs.In the graph on the left the maximum horizontal and vertical magnitudes of the wind are 5.6 m s−1 and 47.6 cm s−1 respectively.
Figure 14. Wind field (left) and divergence (right) at 06 UTC on September 3rd 2000 along the vertical cut marked with a black line inFigure 3. In the graph on the left the maximum horizontal and vertical magnitudes of the wind are 5.2 m s−1 and 35.2 cm s−1 respectively.
Tethys 2009, 6, 31–50 42
J. Mazon i D. Pino: Pluviometric anomaly
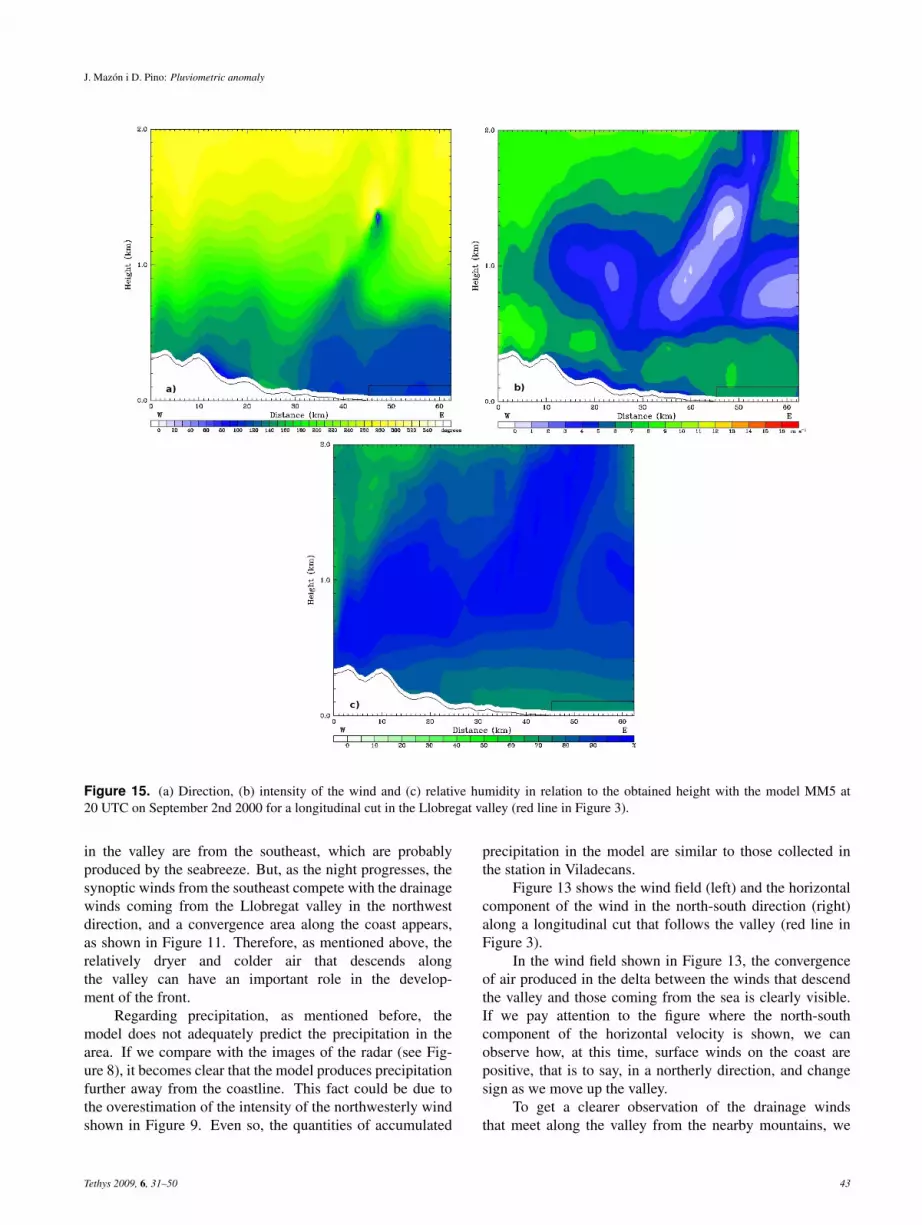
Figure 15. (a) Direction, (b) intensity of the wind and (c) relative humidity in relation to the obtained height with the model MM5 at20 UTC on September 2nd 2000 for a longitudinal cut in the Llobregat valley (red line in Figure 3).
in the valley are from the southeast, which are probablyproduced by the seabreeze. But, as the night progresses, thesynoptic winds from the southeast compete with the drainagewinds coming from the Llobregat valley in the northwestdirection, and a convergence area along the coast appears,as shown in Figure 11. Therefore, as mentioned above, therelatively dryer and colder air that descends alongthe valley can have an important role in the develop-ment of the front.
Regarding precipitation, as mentioned before, themodel does not adequately predict the precipitation in thearea. If we compare with the images of the radar (see Fig-ure 8), it becomes clear that the model produces precipitationfurther away from the coastline. This fact could be due tothe overestimation of the intensity of the northwesterly windshown in Figure 9. Even so, the quantities of accumulated
precipitation in the model are similar to those collected inthe station in Viladecans.
Figure 13 shows the wind field (left) and the horizontalcomponent of the wind in the north-south direction (right)along a longitudinal cut that follows the valley (red line inFigure 3).
In the wind field shown in Figure 13, the convergenceof air produced in the delta between the winds that descendthe valley and those coming from the sea is clearly visible.If we pay attention to the figure where the north-southcomponent of the horizontal velocity is shown, we canobserve how, at this time, surface winds on the coast arepositive, that is to say, in a northerly direction, and changesign as we move up the valley.
To get a clearer observation of the drainage windsthat meet along the valley from the nearby mountains, we
Tethys 2009, 6, 31–50 43
J. Mazon i D. Pino: Pluviometric anomaly
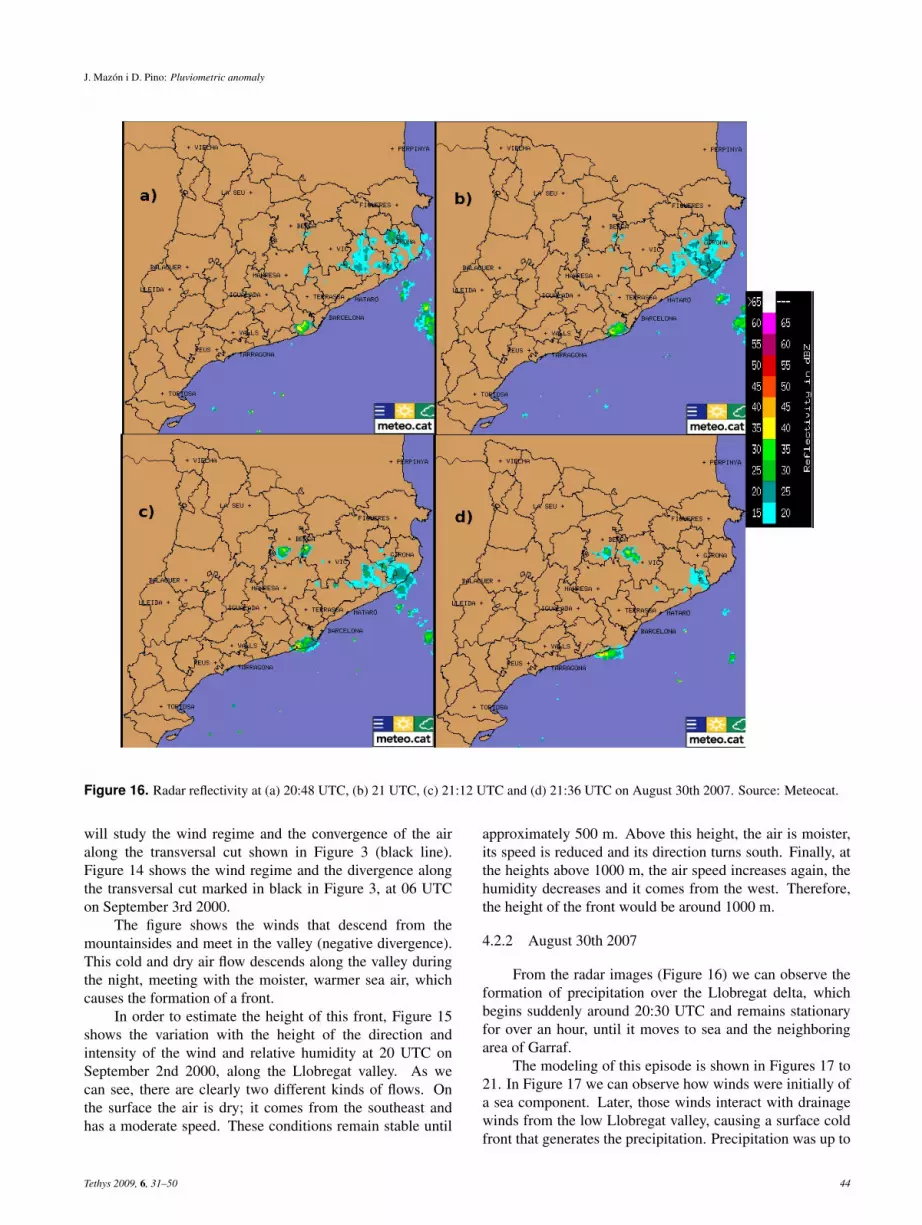
Figure 16. Radar reflectivity at (a) 20:48 UTC, (b) 21 UTC, (c) 21:12 UTC and (d) 21:36 UTC on August 30th 2007. Source: Meteocat.
will study the wind regime and the convergence of the airalong the transversal cut shown in Figure 3 (black line).Figure 14 shows the wind regime and the divergence alongthe transversal cut marked in black in Figure 3, at 06 UTCon September 3rd 2000.
The figure shows the winds that descend from themountainsides and meet in the valley (negative divergence).This cold and dry air flow descends along the valley duringthe night, meeting with the moister, warmer sea air, whichcauses the formation of a front.
In order to estimate the height of this front, Figure 15shows the variation with the height of the direction andintensity of the wind and relative humidity at 20 UTC onSeptember 2nd 2000, along the Llobregat valley. As wecan see, there are clearly two different kinds of flows. Onthe surface the air is dry; it comes from the southeast andhas a moderate speed. These conditions remain stable until
approximately 500 m. Above this height, the air is moister,its speed is reduced and its direction turns south. Finally, atthe heights above 1000 m, the air speed increases again, thehumidity decreases and it comes from the west. Therefore,the height of the front would be around 1000 m.
4.2.2 August 30th 2007
From the radar images (Figure 16) we can observe theformation of precipitation over the Llobregat delta, whichbegins suddenly around 20:30 UTC and remains stationaryfor over an hour, until it moves to sea and the neighboringarea of Garraf.
The modeling of this episode is shown in Figures 17 to21. In Figure 17 we can observe how winds were initially ofa sea component. Later, those winds interact with drainagewinds from the low Llobregat valley, causing a surface coldfront that generates the precipitation. Precipitation was up to
Tethys 2009, 6, 31–50 44

J. Mazon i D. Pino: Pluviometric anomaly
Figure 17. Images of the surface wind and accumulated precipitation obtained with the MM5 from the model point -in the domain at 1 kmresolution- at (a) 19 UTC, (b) 20 UTC, (c) 21 UTC and (d) 22 UTC on August 30th 2007.
10 mm in the municipality of Viladecans. Around 22 UTCthe drainage wind dominates on the ground, and the cold airmass moves to the south when arriving to the delta coast.The front then moves to the Garraf coast, as observed in theradar images (Figure 16).
As for the accumulated precipitation, the comparisonwith the radar images highlights that the model does notproperly reproduce its spatial location. The precipitation pre-scribed by the model is located more inland and directed tothe south, over the Garraf massif and Ordal (see Figure 17),than the one observed in the radar images (Figure 16).
Figures 18, 19 and 20 show, respectively, the vari-ation with the height of the direction, wind intensity andrelative humidity obtained along the Llobregat valley (redline in Figure 3) during the evening of August 30th 2007.The existence of a surface front should be reflected by a,more or less, noticeable variation in relation to the heightof the direction and, perhaps, intensity, as well as relativehumidity.
In Figure 18 we can observe how the wind directionprogressively changes with the height along the wholevalley, from 19 UTC. This shear becomes more marked from20 UTC, corresponding to the formation of the precipitation,
Tethys 2009, 6, 31–50 45
J. Mazon i D. Pino: Pluviometric anomaly
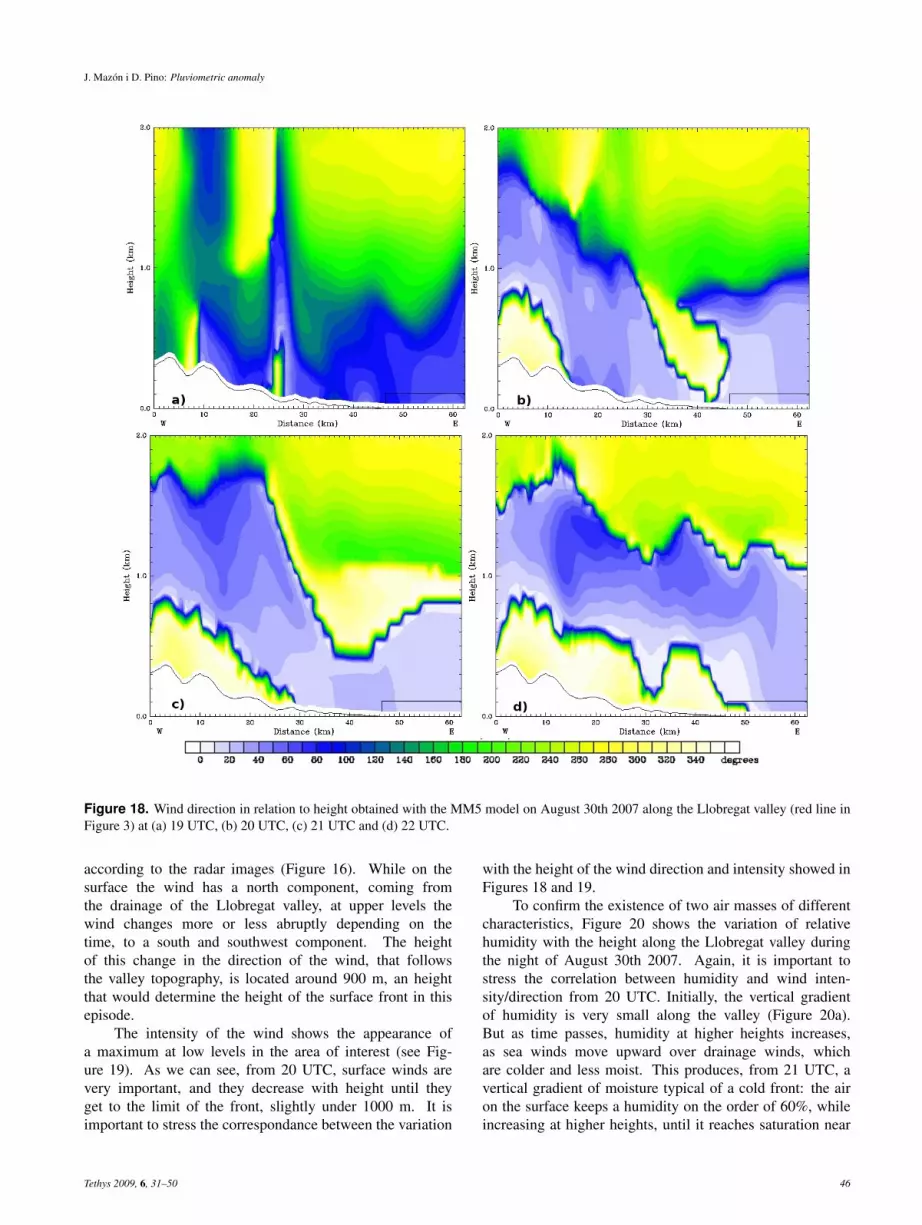
Figure 18. Wind direction in relation to height obtained with the MM5 model on August 30th 2007 along the Llobregat valley (red line inFigure 3) at (a) 19 UTC, (b) 20 UTC, (c) 21 UTC and (d) 22 UTC.
according to the radar images (Figure 16). While on thesurface the wind has a north component, coming fromthe drainage of the Llobregat valley, at upper levels thewind changes more or less abruptly depending on thetime, to a south and southwest component. The heightof this change in the direction of the wind, that followsthe valley topography, is located around 900 m, an heightthat would determine the height of the surface front in thisepisode.
The intensity of the wind shows the appearance ofa maximum at low levels in the area of interest (see Fig-ure 19). As we can see, from 20 UTC, surface winds arevery important, and they decrease with height until theyget to the limit of the front, slightly under 1000 m. It isimportant to stress the correspondance between the variation
with the height of the wind direction and intensity showed inFigures 18 and 19.
To confirm the existence of two air masses of differentcharacteristics, Figure 20 shows the variation of relativehumidity with the height along the Llobregat valley duringthe night of August 30th 2007. Again, it is important tostress the correlation between humidity and wind inten-sity/direction from 20 UTC. Initially, the vertical gradientof humidity is very small along the valley (Figure 20a).But as time passes, humidity at higher heights increases,as sea winds move upward over drainage winds, whichare colder and less moist. This produces, from 21 UTC, avertical gradient of moisture typical of a cold front: the airon the surface keeps a humidity on the order of 60%, whileincreasing at higher heights, until it reaches saturation near
Tethys 2009, 6, 31–50 46

J. Mazon i D. Pino: Pluviometric anomaly
Figure 19. Wind intensity in relation to height obtained with the MM5 model on August 30th 2007 along the Llobregat valley (red line inFigure 3) at (a) 19 UTC, (b) 20 UTC, (c) 21 UTC and (d) 22 UTC.
900 m, coinciding with the change in the wind direction andto the minimum of intensity, what we suppose is the heightof the front.
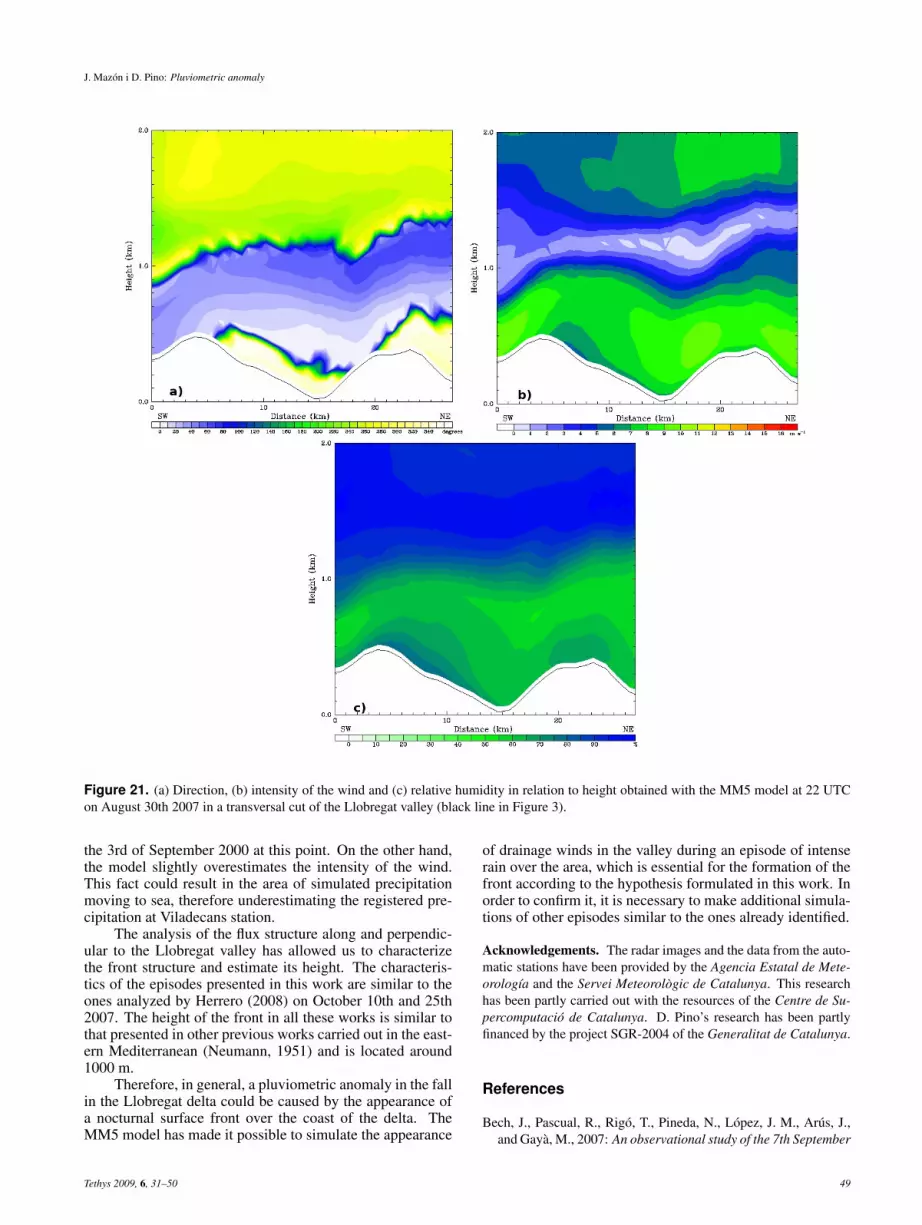
The structure of the front can also be clearly observedin Figure 21, where wind direction and intensity, and relativehumidity are represented along a cut perpendicular to thevalley at 22 UTC on August 30th 2003. For all the variablesrepresented in this figure the height of the front remainsclearly marked by its vertical gradient.
5 Conclusions
After the analysis of the pluviometric regime in severalstations located in the Llobregat delta and its environs, it hasbeen shown how, despite proximity between the pluviomet-ric stations, the annual average precipitation is higher in the
area of the Llobregat delta in relation with the surroundingareas. This difference becomes more notable in relation withthe stations located to the southwest, on the other side of theGarraf massif.
These differences are more noticeable in the fall thanduring the other seasons. In the pluviometric observatoriesof the delta environment, in general, rainfall during the fallis the most considerable of the year, but it does not reach,in general terms, the level of precipitation of the Llobregatdelta, except in Begues, located above 400 m. The reasonpresented in this work to explain the differences in precipita-tion is the formation of a nocturnal surface cold front in thedelta or out to sea.
The Llobregat valley, wide and rectilinear in its laststretch, channels the nocturnal cold air in the end of the sum-mer and fall, creating a cold front when arriving to the delta;it is dominated by a warm and moist air mass, a Mediter-
Tethys 2009, 6, 31–50 47

J. Mazon i D. Pino: Pluviometric anomaly
Figure 20. Relative humidity in relation to height obtained with the MM5 model on August 30th 2007 along the Llobregat valley (red linein Figure 3) at (a) 19 UTC, (b) 20 UTC, (c) 21 UTC and (d) 22 UTC.
ranean air mass. This front can generate cloudiness of ver-tical development, and provides significant precipitation outto sea, or precipitation that very often affects the delta area.This hypothesis is reinforced after analyzing the precipitationin the fall in the delta during the period 1993-2005, where wecould observe that more than the 80% of it happened at night.
The situation is not the same for inland areas, suchas Ordal or Collserola, or on the other side of the Gar-raf massif. The reason for this is that the Garraf mas-sif prevents this front from spreading to the southeast, tothe Garraf and Baix Penedes regions. As a consequence,in this area precipitation is noticeably lower in the fall,and during the rest of the year. It has been postulatedthat this air convergence in the area of the Llobregat deltamight favor the formation of phenomena of deep convectionand storms such as those described by Bech et al. (2007).
To confirm this fact, two meteorological situationswere analyzed and simulated through the mesoscale modelMM5, where everything indicates that this nocturnal sur-face cold front was generated and left precipitation inthe Llobregat delta. The model simulates, in general terms,the synoptic situation, and clearly reproduces the drainagewinds that appear at the end of the night in the Llobregatvalley and cause the formation of a front in the area of theLlobregat delta.
On the two days presented, despite the fact that thesimulation produces precipitation in the area of study, itis developed further away from the coast than observed inthe radar images. This is also reflected in the comparisonwith the data from the Viladecans station for September 2nd2000. The model properly simulates the wind direction andtemperature during the night of the 2nd and early morning of
Tethys 2009, 6, 31–50 48
J. Mazon i D. Pino: Pluviometric anomaly
Figure 21. (a) Direction, (b) intensity of the wind and (c) relative humidity in relation to height obtained with the MM5 model at 22 UTCon August 30th 2007 in a transversal cut of the Llobregat valley (black line in Figure 3).
the 3rd of September 2000 at this point. On the other hand,the model slightly overestimates the intensity of the wind.This fact could result in the area of simulated precipitationmoving to sea, therefore underestimating the registered pre-cipitation at Viladecans station.
The analysis of the flux structure along and perpendic-ular to the Llobregat valley has allowed us to characterizethe front structure and estimate its height. The characteris-tics of the episodes presented in this work are similar to theones analyzed by Herrero (2008) on October 10th and 25th2007. The height of the front in all these works is similar tothat presented in other previous works carried out in the east-ern Mediterranean (Neumann, 1951) and is located around1000 m.
Therefore, in general, a pluviometric anomaly in the fallin the Llobregat delta could be caused by the appearance ofa nocturnal surface front over the coast of the delta. TheMM5 model has made it possible to simulate the appearance
of drainage winds in the valley during an episode of intenserain over the area, which is essential for the formation of thefront according to the hypothesis formulated in this work. Inorder to confirm it, it is necessary to make additional simula-tions of other episodes similar to the ones already identified.
Acknowledgements. The radar images and the data from the auto-matic stations have been provided by the Agencia Estatal de Mete-orologıa and the Servei Meteorologic de Catalunya. This researchhas been partly carried out with the resources of the Centre de Su-percomputacio de Catalunya. D. Pino’s research has been partlyfinanced by the project SGR-2004 of the Generalitat de Catalunya.
References
Bech, J., Pascual, R., Rigo, T., Pineda, N., Lopez, J. M., Arus, J.,and Gaya, M., 2007: An observational study of the 7th September
Tethys 2009, 6, 31–50 49

J. Mazon i D. Pino: Pluviometric anomaly
2005 Barcelona tornado outbreak, Nat Hazards Earth Syst Sci,7, 139.
Bolle, J. H., 2002: Climate, climate variability and impacts in theMediterranean area: An overview, Springer Ed., MediterraneanClimate, 320 pag.
Callado, A. and Pascual, R., 2002: Storms in front of the mounthin north-eastern coast of Iberian penninsula, Proceedings del4th Plinius Conference on Mediterranean Storms, Pollenca (Es-panya), 2-4 octubre.
Clavero, P., Martın-Vide, J., and Raso, J., 1996: Atlas climatic deCatalunya: termopluviometria, Departament de Medi Ambient,Generalitat de Catalunya, 42 pag.
Dudhia, J., 1989: Numerical study of convection observed dur-ing the Winter Monsoon Experiment using a mesoscale two-dimensional model, J Atmos Sci, 46, 3077–3107.
Dudhia, J., 1993: A nonhydrostatic version of the Penn-State-NCARmesoscale model: validation tests and simulation o fan Atlanticcyclone and cold front, Mon Wea Rev, 121, 1493–1513.
Fontsere, E., 1959: La masa de aire mediterranea, Rev Geofis, 18,35–40.
Fritsch, J. M. and Chappell, C. F., 1980: Numerical prediction ofconvectively driven mesoscale pressure systems. Part I: Convec-tive parameterization, J Atmos Sci, 37, 1722–1733.
Grell, G. A., Dudhia, J., and Stauffer, D. R., 1995: A description ofthe fifth-generation Penn State/NCAR Mesoscale Model (MM5),NCAR Tech, nCAR/TN-398+STR, 122 pag.
Herrero, V., 2008: Caracteritzacio del front superficial del delta delLlobregat, Universitat Politecnica de Catalunya, projecte Finalde Carrera.
Hong, S. Y. and Pan, H. L., 1996: Nonlocal boundary layer verticaldiffusion in a medium-range forecast model, Mon Wea Rev, 124,2322–2339.
Jansa, A., 1997: INM/WMO International Symposium on Cy-clones and Hazardous Weather in the Mediterranean, A gen-eral view about Mediterranean Meteorology, Cyclones and Haz-ardous Weather (opening lecture), Palma de Mallorca (Spain),14-17 abril. MMA-INM/UIB, 33-42.
Kain, J. S. and Fritsch, J. M., 1993: The Kain-Fritsch scheme. Therepresentation of Cumulus convection in numerical models, Me-teorol Monogr, 46, edited by: Emmanuel, K. A. and Raymond,D. J., Amer Meteorol Soc, 165–170.
Kain, J. S. and Fritsch, J. M., 2004: The Kain-Fritsch convectiveparameterization: an update, J Appl Meteorol, 43, 170–181.
Koch, S. E. and Ray, C. A., 1997: Mesoanalysis of summertimeconvergence zones in central and eastern North Carolina, WeaForecast, 12, 56–77.
Malda, D., Vila-Guerau de Arellano, J., van den Berg, W. D., andZuurendonk, I. W., 2007: The role of atmospheric boundarylayer-surface interactions on the development of coastal fronts,Ann Geophys, 25, 341–360.
Neumann, J., 1951: Land breezes and nocturnal thunderstorms, JMeteorol, 8, 60–67.
Pascual, R. and Callado, A., 2002: Mesoanalysis of recur-rent convergence zones in northeastern Iberian Peninsula, Pro-ceedings del 4th European Conference on Radar Meteorology(ERAD2002), Delft (Paısos Baixos), 18-22 Novembre. 59-64.
Troen, I. and Mahrt, L., 1986: A simple model of the atmosphericboundary layer: Sensitivity to surface evaporation, Bound LayerMeteorol, 37, 129–148.
von Neumann, J., 1941: Distribution of the ratio of the mean squaresuccessive difference to the variance, Ann Math Stat, 12, 367–
395.Zhong, S. and Takle, E. S., 1992: An observational study of sea- and
land-breeze circulation in an area of complex coastal heating, JAppl Meteorol, 31, 1226–1438.
Tethys 2009, 6, 31–50 50