spearman's rank correlation of two methods in integrated geophysical investigation
TRANSCRIPT
Spearman’s Rank Correlation of Two Methods in Integrated Geophysical Investigation.
G.N. Egwuonwu1*, I.B. Osazuwa2, and S.O. Ibe3
1Federal College of chemical and Leather Technology, Zaria, Nigeria.
2Ahmadu Bello University, Zaria, Nigeria. 3Federal college of Education, Zaria, Nigeria.
E-mail: [email protected]* [email protected] [email protected]
ABSTRACT Spearman’s formula for rank correlation analysis has been applied to shallow 2D seismic refraction tomogram and electrical resistivity tomogram to determine their extent of their reliability in the characterization of their lithological stratification. Four profiles were occupied for both the seismic and the electrical imaging techniques during the data acquisition. The profiles were taken in parallel and close to the four sides of a building which was identified with foundation based structural defects. The building is located at the Area BZ quarters of Ahmadu Bello University, Zaria, Nigeria. Results show that the Spearman’s rank correlation coefficients between the two data sets range between +0.9008 and +0.9883. This indicates that at 95% confidence level, there is a strong positive correlation between the processed data obtained from both the shallow seismic refraction, and that from the electrical resistivity imaging. Also, the analysis indicates that the use sufficient data size in integrated geophysical investigation can improve the confidence limit of the data and its interpretation.
(Keywords: geophysical investigation, seismic refraction, electrical resistivity)
INTRODUCTION It is highly desirable to adopt integrated geophysical field technique in routine high-resolution temporal and spatial characterization of near-surface environments. The combination of methods demonstrates the improved resolution obtained by integrating shallow geophysical imaging. Seismic Tomography, Electrical Tomography, Ground Penetrating Radar (GPR),
and other geophysical methods can be integrated in the investigation of the near surface. Interestingly, however, despite the large number of recent surveys, it is hard to find unequivocal models describing the variations in the relevant physical properties in the near surface (El-Quady et al., 2005). For improved problem solution, there is a need for an integrated approach both in engineering geophysics and contaminated land studies. It is however instructive to investigate the variation in electrical resistivity and p-wave velocities in the overburden and shallow bedrocks of geologic terrains so as to understand better, the behaviour of the subsurface such as the bearing capacities of the overburden. It is therefore assumed possible to resolve some existing discrepancies in various non-invasive geophysical imaging methods. Integrated geophysical surveys, coupled with hydrogeological, microbial, and geochemical time-lapse studies of the near-surface on a wide scale, can help to push geophysical methods to their limits and establish whether they can furnish diagnostic data to resolve the characteristics and properties of subsurface targets and to establish whether there is a relationship between the physical signatures of the adopted methods across the site investigation (Meju, 2002). This paper therefore presents the correlation of some of the results obtained from these two geophysical methods using the Spearman’s Rank Correlation Analysis. It is required in every survey of this kind to have the same dimension of results for the methods which should be correlated (Griffiths and Barker, 1993). The data used in this work is sourced from two-dimensional
The Pacific Journal of Science and Technology –693– http://www.akamaiuniversity.us/PJST.htm Volume 10. Number 2. November 2009 (Fall)

resistivity and seismic refraction tomography. These were used to image the subsurface at common profiles. The use of this pair of geophysical methods in the study of the subsurface structures is considered in relation to engineering problems associated with building site investigation. However, their success may be limited by their resolution and penetration respectively as they may be applied in any given situation. Statistical discussion was chosen in order to test the extent of correlation between the data obtained from the two methods in this investigation. It is expected therefore that the discussion will aid the reliability of conclusions drawn on the interpreted results of the individual investigation. STUDY AREA AND ITS GEOLOGY Zaria area is located approximately between 11003′N and 11011′N, and 07012′E and 110.47′E
on an elevation of about 670 m above mean sea level. It lies on a dissected portion of the Zaria–Kano plains. The plains are an extensive peneplane developed on the crystalline rocks of the Nigerian Basement Complex. Residual granite inselbergs, the largest of which is the Kufena Hill, provides the main relief in Zaria area. The area has a tropical continental climate with distinct wet and dry seasons. This study site within Zaria area lies within 70 35′ 17″E and 70 41′ 17″E longitudes, and 110 7′50″N and 110 11′22″N latitudes (Figure 1) on the National grid. The site is a two bedroom flat bungalow built in 1966. The topography of this site is relatively plane and the building fully constructed with masonry blocks. Various sides of the buildings for over one decade have been undergoing repairs annually due to numerous wall cracks rooted on the building’s foundation. There are numerous vertical and diagonal cracks on the walls while the horizontal cracks are negligible.
Figure 1: The Location Map of the Study Area Showing the Profiles where the Data were Collected.
The Pacific Journal of Science and Technology –694– http://www.akamaiuniversity.us/PJST.htm Volume 10. Number 2. November 2009 (Fall)
The most prominent crack is a vertical one which divides the building into two unequal parts trending in east-west direction. These cracks have their origin at the building’s foundation because they are widest at the foundation and floors and most of them extend to the building’s roof. Reconnaissance observation of the building’s premises and environment shows that the area is principally characterized by clayey topsoil. Integrated geophysical investigation is therefore necessary for an unequivocal mapping of the geologic formation at shallow depths which may be responsible for the defects on the building. THE FIELD TECHNIQUES Two-dimensional electrical resistivity tomography (ERT) and seismic refraction tomography (SRT) were applied in the study of the subsurface structures around the building site. In the electrical imaging survey, 42 steel electrodes were used. It was ensured that the ground surface was amenable to the electrode insertion. Terrameter SAS 4000 aided with its auto-electrode selector ES464 was used for the data acquisition. Wenner 32SX protocol (continuous vertical electrical sounding with two cables) was adopted for the field technique using electrode spacing ranging between 2.5 m and 5.0 m depending on each profile’s length. In the seismic refraction survey, 12 geophones were used at spacing of 5.0 m. Measurements were made using an ABEM Seismograph (Terraloc Mk 6) and shots were taken at each geophone position in order to ensure adequate scanning of the subsurface. DATA PROCESSING AND RESULTS The electrical resistivity and seismic refraction tomography data were processed using inversion routine software packages. Resistivity data was processed using RES 2DINV software which displays a 2-dimensional colour image of the subsurface showing both vertical and lateral changes in ground resistivity. The data processing requires no previous knowledge of the subsurface; however, the initial-guess model is constructed directly from the field measurements. Both standard and robust constraints of the least square inversion were applied (Claerbout and
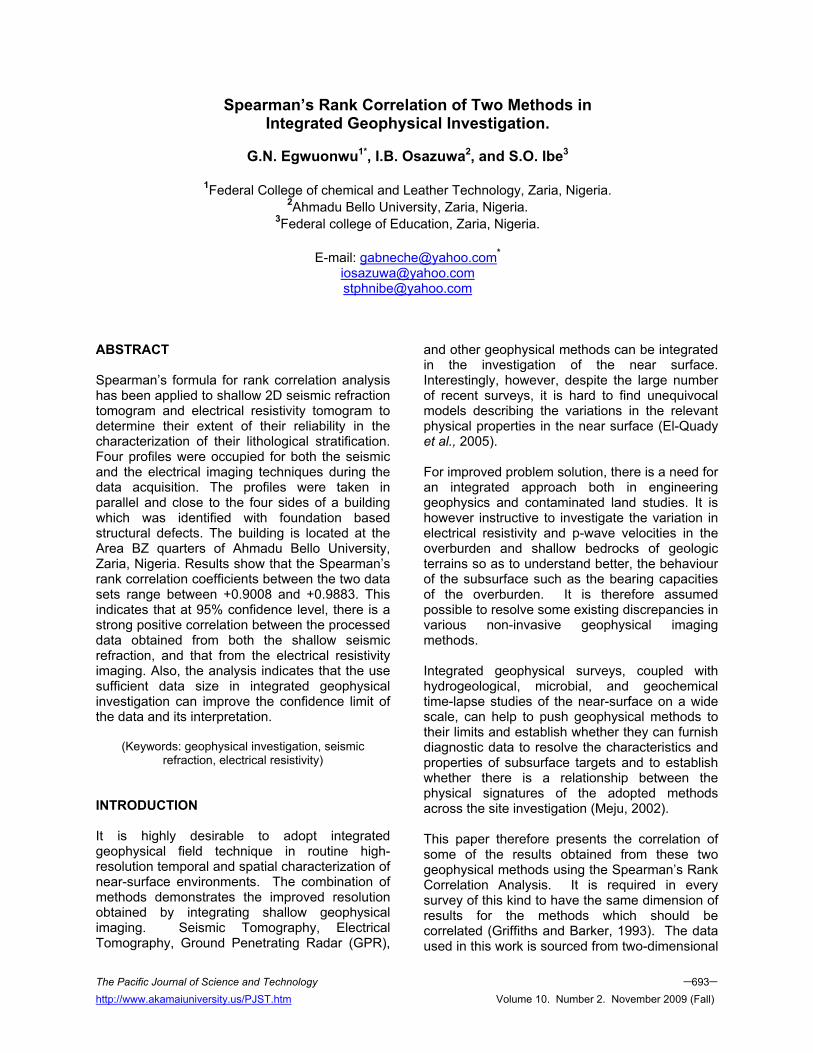
Muir, 1973). The pseudosections of the measured and calculated apparent resistivity were first displayed to show agreement; these were followed by the inverted resistivity models for profiles. The raw data of the seismic refraction tomography survey was imported and processed using REFLEX-W software package. First arrivals were picked from wiggle mode of seismic signal for each shot along the profiles. The arrival times were assigned to layers and models were generated. The inversion tomograms for both resistivity and seismic surveys were displayed after the data processing (Figures 2-5). The tomograms for the two methods have the same centre of spread. The tomograms obtained from the two methods at common profile show structural resemblance. STATISTICAL ANALYSIS Since the two techniques in this survey were applied on the same profile lines and positioned to have the same centre of spread, the correlation of the electrical resistivity and the seismic p-wave velocity at various lateral and depth locations was possible. The two processed sets of data derived from the two methods were correlated using the Spearman's Rank Correlation Equation. Spearman’s rank correlation is a non-parametric method commonly used for correlating variables of two data sets because it gives an approximation to the product-moment correlation coefficient (Francis, 1995). In principle, the Spearman’s correlation coefficient (ρ) is simply a special case of the Pearson product-moment coefficient in which the data are converted to rankings before calculating the coefficient. In practice, the processed data are standardized in order to eliminate the variation of covariance due to individual units of the data sets (Frank and Altheon, 1995). Secondly, the data were converted to ranks, before the differences ‘d’ between the ranks of each observation on the two variables were obtained. If there are no tied ranks, then ρ is given by:
(1) where di is the difference between each rank of corresponding values of the variable and n is the number of the pairs of the values (Spiegel and Stephen, 1999).
The Pacific Journal of Science and Technology –695– http://www.akamaiuniversity.us/PJST.htm Volume 10. Number 2. November 2009 (Fall)
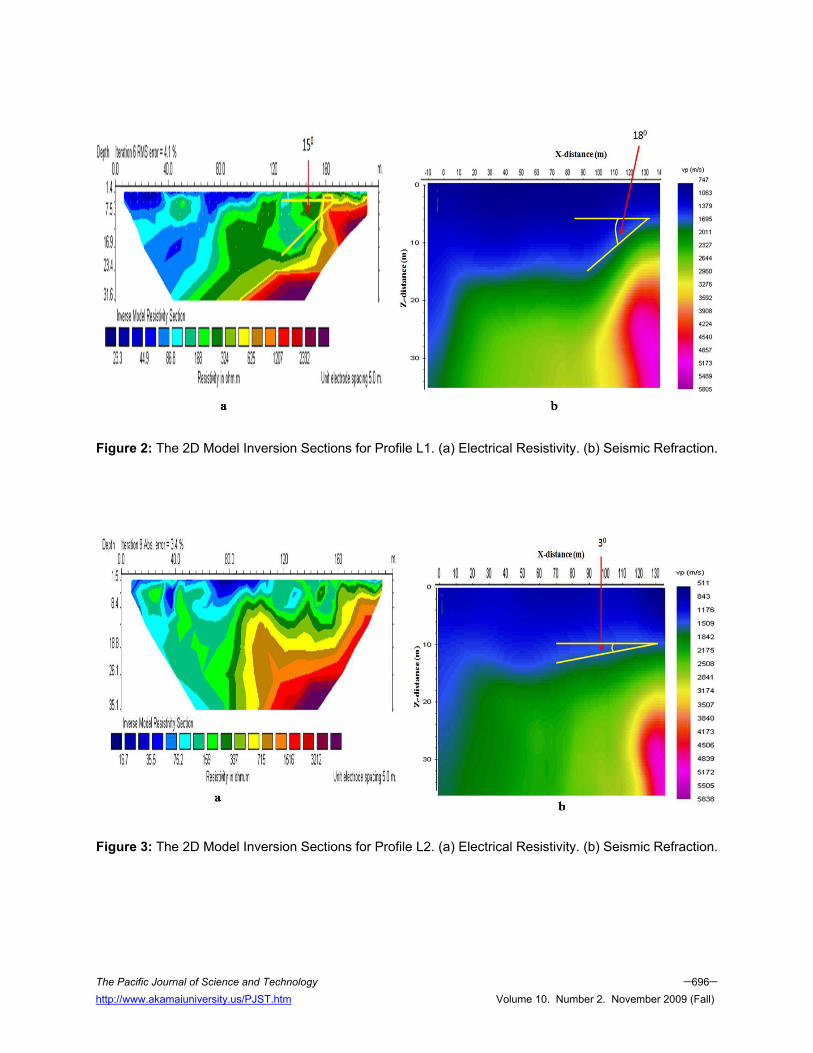
Figure 2: The 2D Model Inversion Sections for Profile L1. (a) Electrical Resistivity. (b) Seismic Refraction.
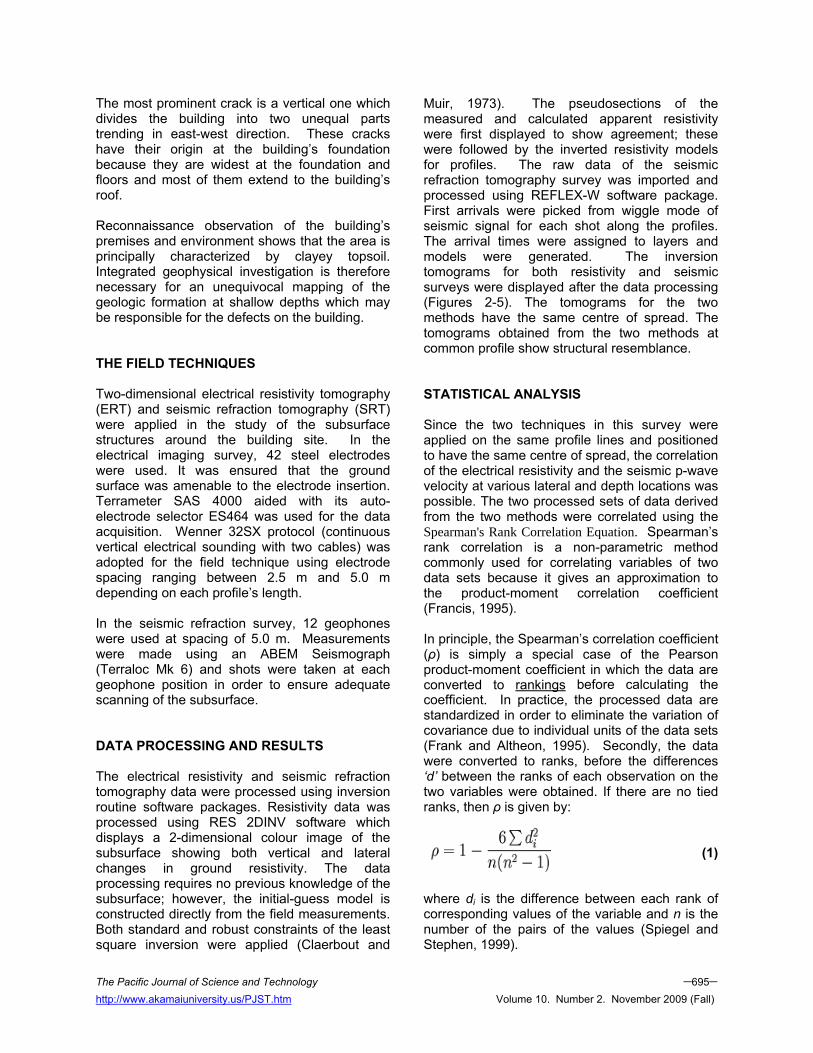
Figure 3: The 2D Model Inversion Sections for Profile L2. (a) Electrical Resistivity. (b) Seismic Refraction.
The Pacific Journal of Science and Technology –696– http://www.akamaiuniversity.us/PJST.htm Volume 10. Number 2. November 2009 (Fall)
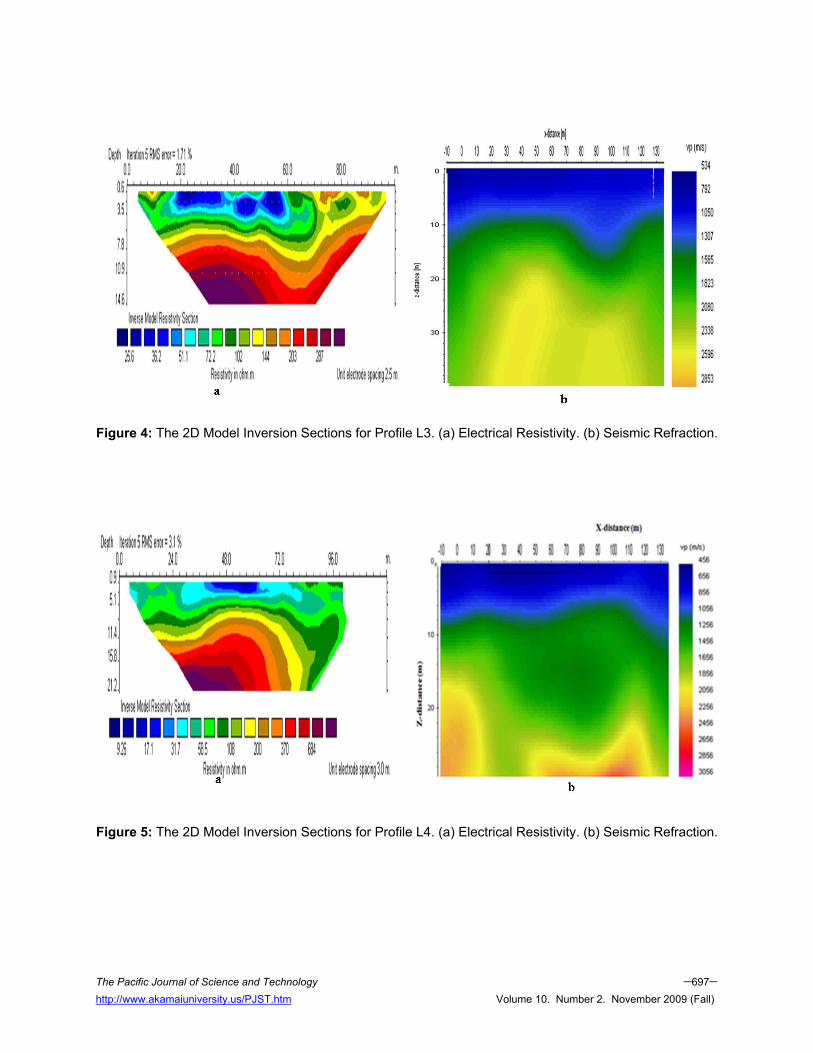
Figure 4: The 2D Model Inversion Sections for Profile L3. (a) Electrical Resistivity. (b) Seismic Refraction.
Figure 5: The 2D Model Inversion Sections for Profile L4. (a) Electrical Resistivity. (b) Seismic Refraction.
The Pacific Journal of Science and Technology –697– http://www.akamaiuniversity.us/PJST.htm Volume 10. Number 2. November 2009 (Fall)
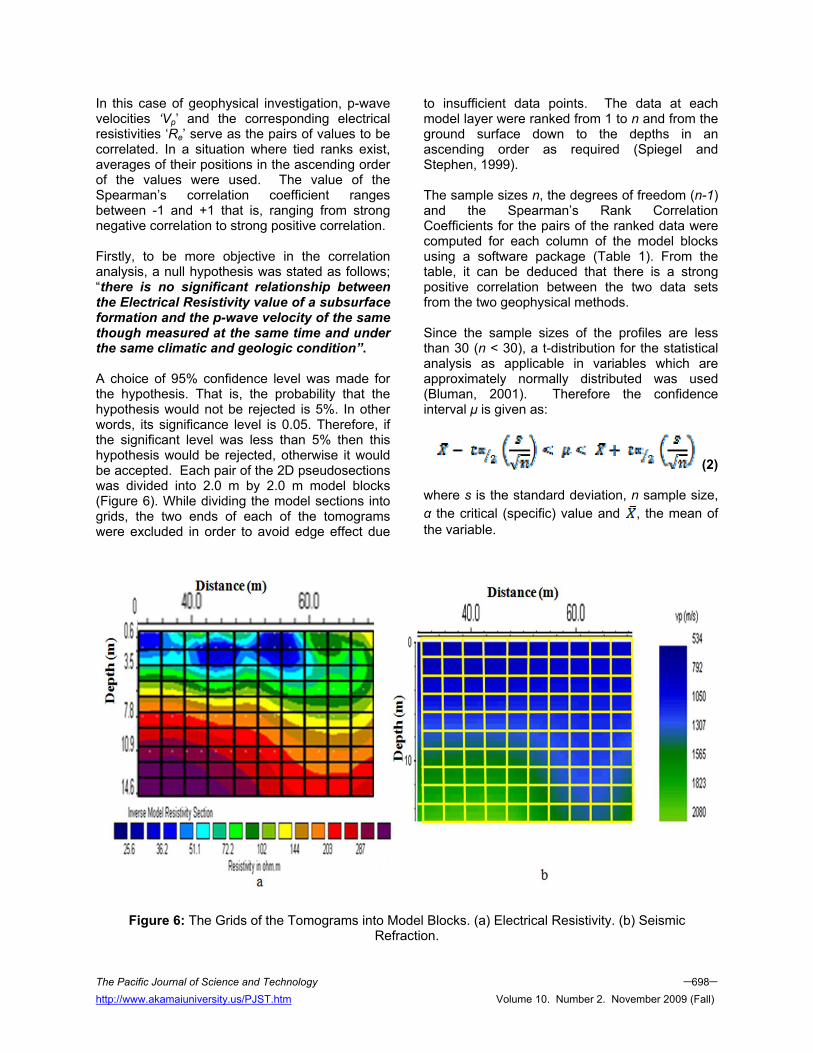
In this case of geophysical investigation, p-wave velocities ‘Vp’ and the corresponding electrical resistivities ‘Re’ serve as the pairs of values to be correlated. In a situation where tied ranks exist, averages of their positions in the ascending order of the values were used. The value of the Spearman’s correlation coefficient ranges between -1 and +1 that is, ranging from strong negative correlation to strong positive correlation. Firstly, to be more objective in the correlation analysis, a null hypothesis was stated as follows; “there is no significant relationship between the Electrical Resistivity value of a subsurface formation and the p-wave velocity of the same though measured at the same time and under the same climatic and geologic condition”. A choice of 95% confidence level was made for the hypothesis. That is, the probability that the hypothesis would not be rejected is 5%. In other words, its significance level is 0.05. Therefore, if the significant level was less than 5% then this hypothesis would be rejected, otherwise it would be accepted. Each pair of the 2D pseudosections was divided into 2.0 m by 2.0 m model blocks (Figure 6). While dividing the model sections into grids, the two ends of each of the tomograms were excluded in order to avoid edge effect due
to insufficient data points. The data at each model layer were ranked from 1 to n and from the ground surface down to the depths in an ascending order as required (Spiegel and Stephen, 1999). The sample sizes n, the degrees of freedom (n-1) and the Spearman’s Rank Correlation Coefficients for the pairs of the ranked data were computed for each column of the model blocks using a software package (Table 1). From the table, it can be deduced that there is a strong positive correlation between the two data sets from the two geophysical methods. Since the sample sizes of the profiles are less than 30 (n < 30), a t-distribution for the statistical analysis as applicable in variables which are approximately normally distributed was used (Bluman, 2001). Therefore the confidence interval μ is given as:
(2) where s is the standard deviation, n sample size, α the critical (specific) value and , the mean of the variable.
Figure 6: The Grids of the Tomograms into Model Blocks. (a) Electrical Resistivity. (b) Seismic Refraction.
The Pacific Journal of Science and Technology –698– http://www.akamaiuniversity.us/PJST.htm Volume 10. Number 2. November 2009 (Fall)
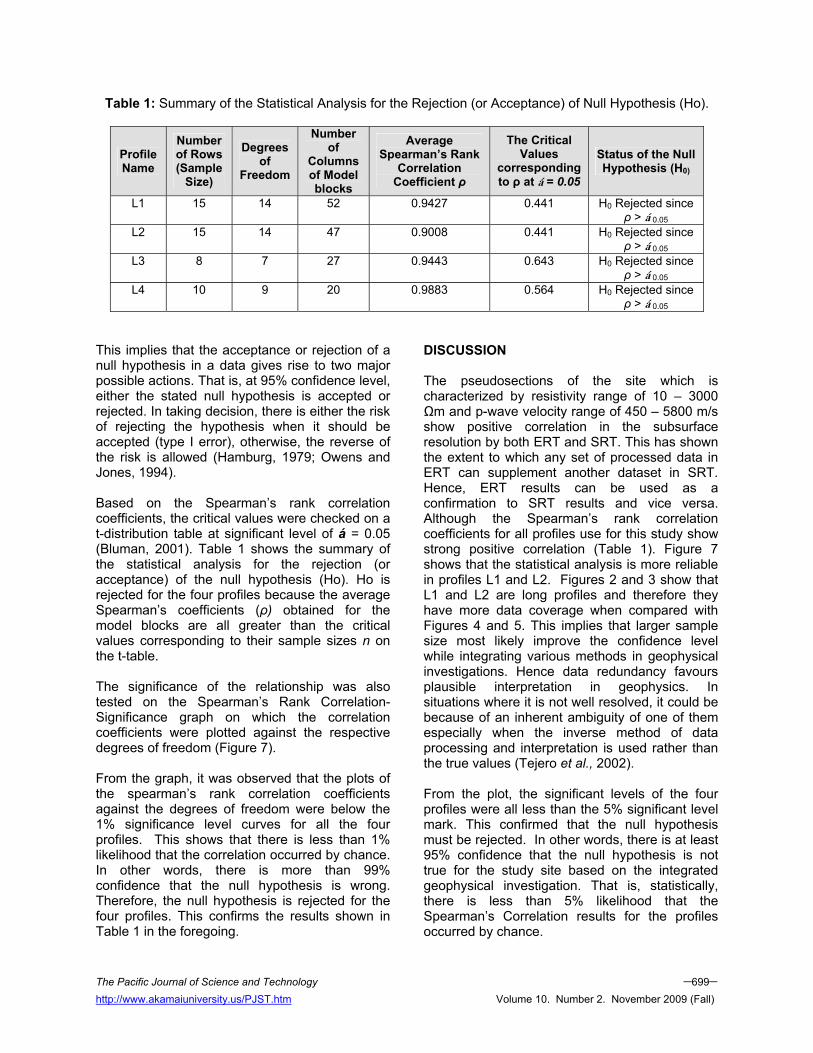
Table 1: Summary of the Statistical Analysis for the Rejection (or Acceptance) of Null Hypothesis (Ho).
Profile Name
Number of Rows (Sample
Size)
Degrees of
Freedom
Number of
Columns of Model blocks
Average Spearman’s Rank
Correlation Coefficient ρ
The Critical Values
corresponding to ρ at á = 0.05
Status of the Null Hypothesis (H0)
L1 15 14 52 0.9427 0.441 H0 Rejected since ρ > á 0.05
L2 15 14 47 0.9008 0.441 H0 Rejected since ρ > á 0.05
L3 8 7 27 0.9443 0.643 H0 Rejected since ρ > á 0.05
L4 10 9 20 0.9883 0.564 H0 Rejected since ρ > á 0.05
This implies that the acceptance or rejection of a null hypothesis in a data gives rise to two major possible actions. That is, at 95% confidence level, either the stated null hypothesis is accepted or rejected. In taking decision, there is either the risk of rejecting the hypothesis when it should be accepted (type I error), otherwise, the reverse of the risk is allowed (Hamburg, 1979; Owens and Jones, 1994). Based on the Spearman’s rank correlation coefficients, the critical values were checked on a t-distribution table at significant level of á = 0.05 (Bluman, 2001). Table 1 shows the summary of the statistical analysis for the rejection (or acceptance) of the null hypothesis (Ho). Ho is rejected for the four profiles because the average Spearman’s coefficients (ρ) obtained for the model blocks are all greater than the critical values corresponding to their sample sizes n on the t-table. The significance of the relationship was also tested on the Spearman’s Rank Correlation-Significance graph on which the correlation coefficients were plotted against the respective degrees of freedom (Figure 7). From the graph, it was observed that the plots of the spearman’s rank correlation coefficients against the degrees of freedom were below the 1% significance level curves for all the four profiles. This shows that there is less than 1% likelihood that the correlation occurred by chance. In other words, there is more than 99% confidence that the null hypothesis is wrong. Therefore, the null hypothesis is rejected for the four profiles. This confirms the results shown in Table 1 in the foregoing.
DISCUSSION The pseudosections of the site which is characterized by resistivity range of 10 – 3000 Ωm and p-wave velocity range of 450 – 5800 m/s show positive correlation in the subsurface resolution by both ERT and SRT. This has shown the extent to which any set of processed data in ERT can supplement another dataset in SRT. Hence, ERT results can be used as a confirmation to SRT results and vice versa. Although the Spearman’s rank correlation coefficients for all profiles use for this study show strong positive correlation (Table 1). Figure 7 shows that the statistical analysis is more reliable in profiles L1 and L2. Figures 2 and 3 show that L1 and L2 are long profiles and therefore they have more data coverage when compared with Figures 4 and 5. This implies that larger sample size most likely improve the confidence level while integrating various methods in geophysical investigations. Hence data redundancy favours plausible interpretation in geophysics. In situations where it is not well resolved, it could be because of an inherent ambiguity of one of them especially when the inverse method of data processing and interpretation is used rather than the true values (Tejero et al., 2002). From the plot, the significant levels of the four profiles were all less than the 5% significant level mark. This confirmed that the null hypothesis must be rejected. In other words, there is at least 95% confidence that the null hypothesis is not true for the study site based on the integrated geophysical investigation. That is, statistically, there is less than 5% likelihood that the Spearman’s Correlation results for the profiles occurred by chance.
The Pacific Journal of Science and Technology –699– http://www.akamaiuniversity.us/PJST.htm Volume 10. Number 2. November 2009 (Fall)
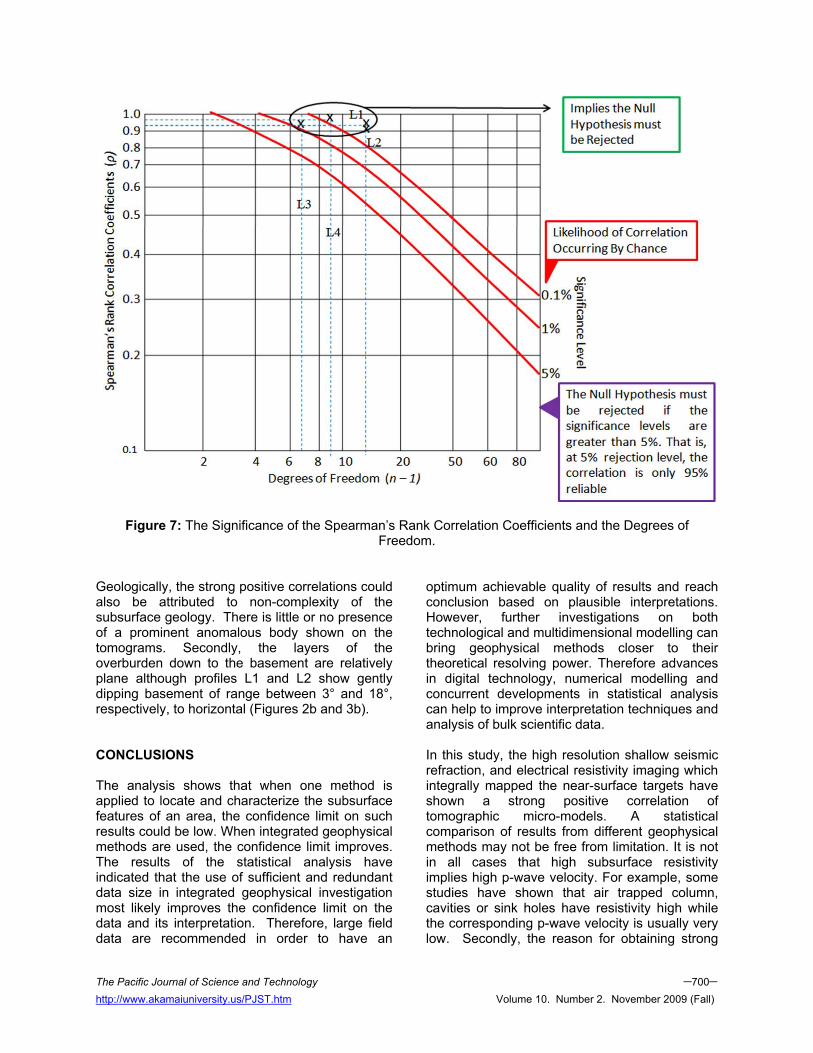
Figure 7: The Significance of the Spearman’s Rank Correlation Coefficients and the Degrees of Freedom.
Geologically, the strong positive correlations could also be attributed to non-complexity of the subsurface geology. There is little or no presence of a prominent anomalous body shown on the tomograms. Secondly, the layers of the overburden down to the basement are relatively plane although profiles L1 and L2 show gently dipping basement of range between 3° and 18°, respectively, to horizontal (Figures 2b and 3b). CONCLUSIONS The analysis shows that when one method is applied to locate and characterize the subsurface features of an area, the confidence limit on such results could be low. When integrated geophysical methods are used, the confidence limit improves. The results of the statistical analysis have indicated that the use of sufficient and redundant data size in integrated geophysical investigation most likely improves the confidence limit on the data and its interpretation. Therefore, large field data are recommended in order to have an
optimum achievable quality of results and reach conclusion based on plausible interpretations. However, further investigations on both technological and multidimensional modelling can bring geophysical methods closer to their theoretical resolving power. Therefore advances in digital technology, numerical modelling and concurrent developments in statistical analysis can help to improve interpretation techniques and analysis of bulk scientific data. In this study, the high resolution shallow seismic refraction, and electrical resistivity imaging which integrally mapped the near-surface targets have shown a strong positive correlation of tomographic micro-models. A statistical comparison of results from different geophysical methods may not be free from limitation. It is not in all cases that high subsurface resistivity implies high p-wave velocity. For example, some studies have shown that air trapped column, cavities or sink holes have resistivity high while the corresponding p-wave velocity is usually very low. Secondly, the reason for obtaining strong
The Pacific Journal of Science and Technology –700– http://www.akamaiuniversity.us/PJST.htm Volume 10. Number 2. November 2009 (Fall)

positive correlation for all the profiles could partly be due to simplicity of the geology of the area. However, in areas of very complex geology and rugged terrain, the strength of positive or negative correlation could be less. In general plausible interpretations and conclusions are made of the subsurface when geophysical methods are combined. ACKNOWLEDGEMENTS The authors are greatly indebted to the Project leader, Professor I.B. Osazuwa of Ahmadu Bello University, Zaria whose stimulating discussions led to the production of this paper. Secondly, our thanks go to the International Programme for Physical Sciences (IPPS) Uppsala, Sweden, which provided both the field equipment and the grants for this study. REFERENCES 1. Bluman, A.G. 2001. Elementary Statistics: A Step
By Step Approach. McGraw Hill Company: New York, NY. 296 481.
2. Claerbout, J.F. and Muir, F. 1973. “Robust
Modeling with Erratic Data”. Geophysics. 38: 826. 3. El-Quady, G., Hafez, M., Mohamed A.A., and
Keisuke, U. 2005. “Imaging Subsurface Cavities Using Geoelectric Tomography and Ground-Penetrating Radar”. Journal of Cave and Karst Studies. 67(3):174–181.
4. Francis, A. 1995. Business Mathematics and
Statistics. DP Publications, Aldine House: Aldine Place, London, UK. 101-148, 325-337.
5. Frank, H. and Althoen S.C. 1995. Statistics:
Concepts and Application. Cambridge University Press: Cambridge, UK.
6. Griffiths, D.H. and Barker, R.D. 1993. “Two–
Dimensional Resistivity Imaging and Modeling In Areas Of Complex Geology”. Journal Of Applied Geophysics. 29: 211 – 226.
7. Hamburg, M. 1979. Basic Statistics: A Modern
Approach. Harcourt Jovanovich (HBJ) International: New York, NY. 330-352.
8. Meju, M. 2002. “Conceptual Models Challenges,
and the Way Forward”. Environmental Geophysics. University of Leicester The Leading Edge of May 2002. [email protected]
9. Owens, F. and Jones, R. 1994. Statistics. Financial Times Publishing (4th Ed.). 386-396.
10. Spiegel, M.R. and Stephen, L.J. 1999. Statistics.
Schaum’s Outliners (3rd Edition). Mc-Graw-Hill. Int.: London, UK. 89-94, 216-406.
11. Tejero, A., Chávez, R.E., Urbieta, R.E., and
Flores-Márque, E.L. 2002. “Cavity Detection In The Southwestern Hilly Portion Of Mexico City by Resistivity Imaging”. Journal Of Environmental And Engineering Geophysics. 7(3): 130–139.
SUGGESTED CITATION Egwuonuw, G.N., I.B. Osazuwa, and S.O. Ibe. 2009. “Spearman’s Rank Correlation of Two Methods in Integrated Geophysical Investigation”. Pacific Journal of Science and Technology. 10(2):693-701.
Pacific Journal of Science and Technology
The Pacific Journal of Science and Technology –701– http://www.akamaiuniversity.us/PJST.htm Volume 10. Number 2. November 2009 (Fall)