on the rank deficiency and rank augmentation of the spectral measurement matrix
TRANSCRIPT
ELSEVIER Chemometrics and Intelligent Laboratory Systems 33 (1996) 17-33
Chemometrics and intelligent laboratory systems
On the rank deficiency and rank augmentation of the spectral measurement matrix ’
M. Amrhein a* * , B. Srinivasan a, D. Bonvin a, M.M. Schumacher b a Institut d’Automatique, I&ok Polytechnique Fkdirale de Lawanne, CH-1015 Lausanne, Switzerland
b Lonza Ltd., CH-3930 Visp, Switzerland
Received 14 July 1995; accepted 19 October 1995
Abstract
The analysis of spectral measurements using standard factor-analytical (FA) techniques requires the rank of the ab- sorbance matrix to be equal to the number of absorbing species, S. However, in many practical reaction networks, such an assumption does not hold. This paper examines various scenarios where ‘rank deficiency’ can occur. The most important case is when the number of independent reactions, R, is less than S. In such a case, rank analysis can only reveal R and, hence, standard FA techniques will fail. Hence, one possibility is to perform rotation in the reaction-spectra space of dimen- sion R. Another possibility is to augment the rank of the data matrix to S for which two experimental methods are devel- oped. Rank augmentation is performed by (i) multiple process runs and (ii) addition of reactants or products during the reac- tion. The composite data matrices are of rank S and, hence, suited to factor analysis. The number of necessary runs or addi- tions can be detected by determining the rank of both the original and column-mean-centered data matrices. With rank aug- mentation, it is possible to determine both the number of independent reactions and the number of absorbing species. Fur- thermore, the influence on the rank of data pretreatment such as mean centering, normalization, auto-scaling, and differentia- tion with respect to time or wavelength is examined.
Keywords: Rank deficiency and augmentation; Spectral measurement matrix
1. Introduction
Factor analysis (FA) is a multivariate technique used for uncovering the major trends or factors in a data matrix. In contrast to concentrations which are hardly available from direct measurement of reacting mixtures, spectral data can be most easily obtained
?? Corresponding author. E-mail: [email protected] ’ Original version of the paper was presented at InCINC’94.
on-line (especially NIR). In this paper, for the sake of simplicity, we will limit ourselves to absorbance measurements. If the absorbance spectrum is linear in the mixture concentrations (e.g. Beer’s law) and if the extinction coefficients are constant, FA techniques have been shown to be well suited to solving the fol- lowing two problems:
(1) resolution of pure-component spectra and composition for non-reacting mixtures [l], and
(2) resolution of chemical reaction networks from composition or spectral data [2-61.
All FA methods reported in the literature assume
Ol69-7439/%/$15.00 0 1996 Elsevier Science B.V. All rights reserved SSDI 0169-7439(95)00086-O
18 M. Amrhein et al./ Chemometrics and Intelligent Laboratory Systems 33 (1996) 17-33
that the rank of the data matrix is equal to the num- ber of (absorbing) species (see for review [7] and re- cently proposed ones which include evolving factor analysis (EFA) [8,9], incremental target factor analy- sis (IncTFA) [5], heuristic evolving latent projection (HELP) [ 101, interactive self-modeling multivariate analysis [ll], and window factor analysis (WFA) [12]). The rank of a matrix is the number of linearly- independent rows or columns. However, if a data matrix is noisy, one has to resort to the pseudo-rank (essential rank) for further analysis. A comprehen- sive survey of the methods available for pseudo-rank determination is given by Malinowski [7].
In this paper, we analyze various situations where the absorbance matrix can be rank deficient, i.e., the rank is less than the number of absorbing species. Such scenarios can be broadly classified into rank deficiency caused by (i) data pretreatment (e.g., mean centering, auto-scaling, differentiation) and (ii) the presence of reactions. Rank analysis was performed by Pell et al. [13] who dealt with the deficiency caused by closure and baseline problems when the data is mean centered. On the other hand, Cochran and Home [ 141 indicated that the number of indepen- dent reactions and absorbing species can be obtained by looking into the ranks of the original and column-mean-centered matrices. However, we show that the rank difference between the original and mean-centered matrices can be at most one. More- over, this is only an indication that there are more absorbing species than independent reactions. Also, a more comprehensive analysis on rank deficiency is performed where the influence on the rank of data pretreatment, time-varying baseline, and linear de- pendencies (e.g., closure and pure-component spec- tra) is examined.
The most important case, where rank deficiency occurs, is that of reacting mixtures; the rank of the data matrix is min(R, S>, with R the number of in- dependent reactions and S the number of absorbing species. The concentration profiles of the S-compo- nent reaction mixture will be linearly dependent due to the governing reactions which cause this rank de- ficiency. The analysis of spectral data will then only uncover the ‘reaction spectra’ (a spectrum, assigned to each reaction, obtained by a linear combination of the stoichiometric coefficients and the pure-compo- nent spectra [51).
Standard FA techniques will fail when the data matrix is rank deficient. Two possibilities exist to circumvent this difficulty: (i) use of reaction-spectra targets and rotation of abstract factors in the reac- tion-spectra space and (ii) augmentation of the rank of the data matrix. Both these techniques are ex- plained in detail here. The rank of the data matrix is augmented either by using multiple process runs or by adding known amounts of absorbing species already present in the reacting mixture.
Section 2 reviews some mathematical fundamen- tals concerning the rank of matrices. Section 3 pre- sents the models and Section 4 the methods of data pretreatment relevant to he analysis of spectral data in this work. The rank-deficiency analysis is taken up in Section 5. Section 6 is devoted to factor rotation in the reaction-spectra space in the presence of rank deficiency. Rank augmentation using multiple pro- cess runs or absorbing-species addition during reac- tion is discussed in Section 7. An example is pro- vided in Section 8 to illustrate the ideas, and Section 9 concludes the paper.
2. Mathematical properties of the rank
Property 1: Let Z be an m X n matrix. Then,
rank(Z) < min( Ilf, tz) (1)
Property 2: If Z is decomposed into two con- formable matrices P (m X s) and Q (s X n), Z = PQ, then,
rank(Z) 5 min(rank(P),rank(Q)) (2)
Property 3: If the first r rows of Z are linearly- independent, Z can be decomposed into an m X r matrix P and an r X n matrix Q:
Z=PQwithP= i [I I
where I is the identity matrix of dimension r and P, is an (m - r) X r matrix. A similar property holds for the columns also.
Property 4: Let J, = I - illT be a m X m pro- jection matrix, I the identity matrix of dimension m, 1 a column vector of appropriate dimension with all elements equal to one, and Z, = J,Z the column-
M. Amrhein et 01. / Chemometrics and Intelligent Loboratory Systems 33 (1996) 17-33 19
mean-centered matrix. Then the bounds on the rank of Z, are given by
3. Systems equations
rank(Z) - 1 5; rank(Z,) < min(rank(Z), m - 1)
(4)
The time evolution of absorbance measurements of a chemical reaction system can be modeled by 3 re- lationships:
In addition, if the vector 1 lies in the space spanned (1) the relationship between absorbance or spec- by the columns of Z, i.e., in the column space of Z tral measurements and concentrations of the absorb- denoted by ye(Z), then ing species (spectral measurement model),
rank(Z,) = rank(Z) - 1; 1 EYE (5)
else rank (Z,> = min(rank(Z), m - 1). A similar property holds for row centering also (for Proof - See Appendix A).
(2) the relationship between concentration changes of reacting species and extents of reaction (stoichio- metric model),
(3) the relationship between extents of reaction and concentrations (kinetic model).
Property 5: Let For rank analysis of the spectral data matrix, it is
sufficient to only look into the first two models.
I
-1 1 0 . . . 0 0 0 -1 1 . . . 0 0
F, = . . . . . . . . . . . . . . . . . . 1 (6) 0 0 0 . . . -1 1 0 0 0 . . . 0 0
be the m X m backward finite difference matrix, and Z = F,Z denote the matrix obtained by taking finite differences along the columns of Z. Then the bounds on the rank of Z are given by
3.1. Spectral measurement model
Let a(k) be an L-dimensional vector representing the electromagnetic spectrum at L wavelengths or channels at the observation instant k. For a unit path- length and Beer’s law being valid, a(k) can be ex- pressed as:
rank(Z) - 1s rank(Z) s min(rank(Z), m - 1)
(7)
In addition, if the vector 1 EYE, then
aT(k) =c’(k)E (10)
where c(k) is an S-dimensional concentration vector, E is an S X L matrix of pure-component spectra (or extinction coefficients), and S is the number of ab- sorbing species.
rank(Z) = rank(Z) - 1 (8)
else rank (Z) = min(rank(Z), m - 1). A similar prop- erty holds for finite difference along the rows also (for Proof - See Appendix A).
For K observations, (10) can be written in matrix form as:
Property 6: Let Z be an m x m matrix of rank r which can be decomposed into two matrices P (m X r) and Q (r X n), Z = PQ, with P and Q being ma- trices of full rank. Let Y be a matrix constructed as in, Y = Z + IzT,,. If z’,~ and 1 do not lie in the row space of Q, yr(Q), and the column space of P, yc,(P>, respectively, then
rank(Y) =min(rank(Z) + l,m,n);z~,G9~(Q),
1 ~csipc(P) (9)
(for Proof- See Appendix A).
A=CE (11)
with A being the K X L data matrix and C the K X S
concentration matrix. In practical applications, L, K > S which will be used in the remaining part of this paper.
Generally, k indicates an individual observation in time. Hence, for the spectra of a reacting mixture, the columns of C reflect the concentration profiles of the S absorbing species. Let A, = la: and C, = lci be the initial absorbance and concentration matrices with a, and c0 being the initial spectrum and concentra- tions, respectively. Subtracting A, from (11) leads to:
H=A-A,=DEwithD=C-CC, (12)
20 M. Amrhein et ul. / Chenwmerrics and Intelligent Laboratory Systems 33 (1996) 17-33
where H and D represent the changes in absorbance Row-mean centering will lead to the relationship A, and concentration, respectively. = CE,, where A, and E, are row-mean centered.
3.2. Stoichiometric model
A modeling approach for the stoichiometric model is presented in Appendix B. From this, the concen- tration-change matrix for a constant-volume batch reactor, D, of dimension K X S is expressed as:
D=XN (13) where X is the K X R matrix of extents of reactions, N the R X S matrix of stoichiometric coefficients, R the number of independent reactions, and S the num- ber of absorbing species.
With regard to differentiation with respect to time (in this case, calculating the backward difference along the columns of the data matrices), since N and E are assumed to be time-invariant, it follows from (12) and (13):
Definition: A set of reactions (observed via the concentration-change matrix D> is said to be inde- pendent, if (i) the columns of the matrix of reaction extents, X, are independent and (ii) the rows of the matrix of stoichiometric coefficients, N, are indepen- dent [151.
A&;C:=D (18)
A=CE=XNE (19) When differentiated with respect to wavelength,
dA dE dH dE dh=Cdh;dh=DZ (20)
since C and D are independent of the wavelength. Normalization is performed on either the columns
(rows) of A such that each column (row) has a Eu- clidean norm of 1. Auto-scaling is a data pretreat- ment composed of two sequential steps: (1) mean centering and (2) normalization.
Examples of dependent reuctions are provided in Appendix B.
Upon combining the spectral measurement model (12) with the stoichiometric one (13), one obtains:
H=XNE (14)
5. Rank deficiency in the absorbance matrix
In FA applications to absorbance data, it is gener- ally assumed that the rank of A is equal to the num- ber of absorbing species S. It is also assumed that data pretreatment does not affect the rank. However, in many practical applications, the matrix A is rank de- ficient, i.e., that the rank is less than S. Also there are certain scenarios where data pretreatment causes rank reduction. Conditions under which such rank defi- ciency occurs will be discussed in detail in this sec- tion. To set the stage, we list below certain useful mathematical results which are rigorously proved in Appendix C.
4. Data pretreatment
The four types of data pretreatment considered in this work are: 6) mean centering, (ii> differentiation, (iii) normalization, and (iv) auto-scaling. All these pretreatments can be carried out either in the time (observation) or in the wavelength direction.
The column-mean-centered matrix of A denoted by A,, is given by
A, = A - la: = J,A (15) with
a:= -!-lTA K
the column mean. Since A = CE, column-mean cen- tering will lead to the relationship A e = J, A = J,CE = C,E, where C, is column-mean centered. Also,
C, = J,(lc; + D) = (J,l)c; + J,D = D, (16) H,=D,E=C,E=A, (17)
Propositions: (1) If the matrix of extinction coefficients, E, is of
full rank, then
rank(A) = rank(C) (21) Also, rank(A,) = rank(C,).
(2) If the concentration matrix can be decomposed into
C = lcT + C,C, , then (22) rank(C,) s min(rank(C,),rank(C,)) (23)

ht. Am&in et al./ Chemometrics and Intelligent Laboratory Systems 33 (1996) 17-33 21
(3) If E is of full rank, then
rank(A,) = rank(C,) = min( R, S) (24)
rank(H) = rank(D) = min( R , S) (25) In addition, if the initial concentration ci epr(N), then
rank(A) = rank(C) = min( R + 1, S)
(4) If E is of full rank, then
(26)
rat&( A) = rank(C) = min( R , S) (27)
Proposition 1 states that if E is of full rank, it is sufficient to look into the rank of C to comment on the rank of A. Similarly, it is sufficient to look into the rank of the column-mean-centered matrix C, for analyzing the rank of A,.
From among the data pretreatment techniques, normalization has no effect on the rank. On the other hand, mean centering and differentiation can reduce the rank at most by one. In addition, auto-scaling and mean centering exhibit the same characteristics with regard to rank, since auto-scaling includes a mean- centering step. Furthermore, Propositions 3 and 4 states that the ranks of the matrices obtained by col- umn-mean centering and differentiation with respect to time are equal. In the forthcoming discussion, only the column-mean-centered matrices will be analyzed. Differentiation with respect to time will lead to anal- ogous results.
The different scenarios where the column-mean- centered matrix shows rank deficiency will be enu- merated below. For the purpose of illustration, we will use Proposition 2 and show that in each case the concentration matrix can be decomposed as in (22) with C, or C, being of rank obviously lower than S.
Scenario 1: Reacting mixtures It can be seen from Proposition 3 that
rank( C,) = min( R, S)
andrank =min(R+ 1,s) (28) This means that if R < S, rank deficiency is bound to occur in C, and, according to Proposition 1, also in A,. Then
rank(A,) = rank(C,) = R
and rank(A) = rank(C) = R + 1 (29)
The difference in the ranks of the original and the column-mean-centered matrices is an indication that the rank of A has not revealed the number of absorb- ing species, S. The rank of the column-mean-centered matrix, A,, gives the number of independent reac- tions. The rank deficiency is due to the fact that the concentrations of the absorbing species remain lin- early dependent due to the underlying reaction net- work. The case R < S is frequently encountered in many practical reaction networks.
As far as the rank of the absorbance matrix is concerned, the number of independent reactions, in terms of independent reaction stoichiometries and ki- netics, is more important than the total number of re- actions in the network. So, even when the total num- ber of reactions is larger than S, if the number of in- dependent reactions is less than the number of ab- sorbing species, then rank analysis can only reveal the number of independent reactions. Cases with depen- dent reactions are illustrated in Appendix B.
Scenario 2: Closure problem In the case of non-reacting mixtures, care should
be taken in forming the various mixtures to be ana- lyzed [16]. If the total molar concentration remains constant over the K mixtures, then the column- mean-centered concentration matrix will not be of full rank. Consider the more general case, where a weighted sum of the molar concentration remains constant, i.e.,
cp=(Y1 (30) where (Y is a scalar and p a vector with elements pi, P 2, . . . , &. Without loss of generality, it is assumed that /3, = 1. From (30), the concentration matrix can be written as
c= l[o! OT] +c*[-p* I] (31) where @* is fi without the first element, and C * is the matrix C without the first column of dimension KXS-l.SinceC* isatmostofrank S-l,itfol- lows from Proposition 2
rank(C,) SS- 1 (32)
The standard closure problem (@ = 1, (Y the total molar concentration) is a special case of the general problem (30). If the mixture concentrations show
22 M. Amrhein et al./ Chemometrics and Intelligent Laboratory Systems 33 (1996) 17-33
enough variability except for this closure constraint, then rank(A,) = rank(C,) = S - 1 and rank(A) = rank(A,) + 1 = S. 0
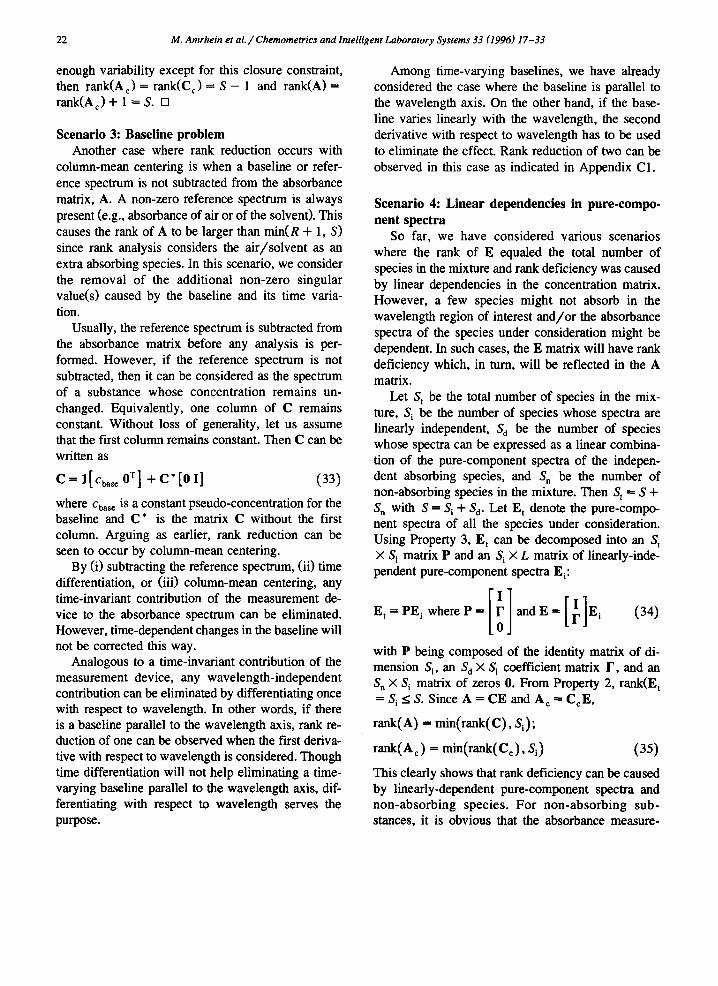
Scenario 3: Baseline problem Another case where rank reduction occurs with
column-mean centering is when a baseline or refer- ence spectrum is not subtracted from the absorbance matrix, A. A non-zero reference spectrum is always present (e.g., absorbance of air or of the solvent). This causes the rank of A to be larger than tnin( R + 1, S> since rank analysis considers the air/solvent as an extra absorbing species. In this scenario, we consider the removal of the additional non-zero singular value(s) caused by the baseline and its time varia- tion.
Usually, the reference spectrum is subtracted from the absorbance matrix before any analysis is per- formed. However, if the reference spectrum is not subtracted, then it can be considered as the spectrum of a substance whose concentration remains un- changed. Equivalently, one column of C remains constant. Without loss of generality, let us assume that the first column remains constant. Then C can be written as
c = l[ Chase 0’1 +c*[o1] (33) where chase is a constant pseudo-concentration for the baseline and C * is the matrix C without the first column. Arguing as earlier, rank reduction can be seen to occur by column-mean centering.
By (i) subtracting the reference spectrum, (ii) time differentiation, or (iii) column-mean centering, any time-invariant contribution of the measurement de- vice to the absorbance spectrum can be eliminated. However, time-dependent changes in the baseline will not be corrected this way.
Analogous to a time-invariant contribution of the measurement device, any wavelength-independent contribution can be eliminated by differentiating once with respect to wavelength. In other words, if there is a baseline parallel to the wavelength axis, rank re- duction of one can be observed when the first deriva- tive with respect to wavelength is considered. Though time differentiation will not help eliminating a time- varying baseline parallel to the wavelength axis, dif- ferentiating with respect to wavelength serves the Purpose.
Among time-varying baselines, we have already considered the case where the baseline is parallel to the wavelength axis. On the other hand, if the base- line varies linearly with the wavelength, the second derivative with respect to wavelength has to be used to eliminate the effect. Rank reduction of two can be observed in this case as indicated in Appendix Cl.
Scenario 4: Linear dependencies in pure-compo- nent spectra
So far, we have considered various scenarios where the rank of E equaled the total number of species in the mixture and rank deficiency was caused by linear dependencies in the concentration matrix. However, a few species might not absorb in the wavelength region of interest and/or the absorbance spectra of the species under consideration might be dependent. In such cases, the E matrix will have rank deficiency which, in turn, will be reflected in the A matrix.
Let S, be the total number of species in the mix- ture, Si be the number of species whose spectra are linearly independent, S, be the number of species whose spectra can be expressed as a linear combina- tion of the pure-component spectra of the indepen- dent absorbing species, and S, be the number of non-absorbing species in the mixture. Then S, = S + S, with S = Si + S,. Let E, denote the pure-compo- nent spectra of all the species under consideration. Using Property 3, E, can be decomposed into an S, X Si matrix P and an Si X L matrix of linearly-inde- pendent pure-component spectra Ei:
E,=PE, whereP=[i]andE=[i]E, (34)
with P being composed of the identity matrix of di- mension Si, an S, X Si coefficient matrix F, and an S, X Si matrix of zeros 0. From Property 2, rank(E, = Si < S. Since A = CE and A, = C,E,
rank(A) = min( rank( C) , Si);
rank(A,) = min(rank(C,), Si) (35)
This clearly shows that rank deficiency can be caused by linearly-dependent pure-component spectra and non-absorbing species. For non-absorbing sub- stances, it is obvious that the absorbance measure-
M. Amrhein et al. / Chemomerrics and lntelligeni Laboratory Systems 33 (1996) 17-33 23
ments provide no information. Hence, additional measurements such as temperature, pressure, compo- sition, calorimetry or spectra in other regions of the electro-magnetic spectrum have to be taken. Even for absorbing species, if the pure-component spectra of a few of the substances are dependent, then we need more information in the form of constraints to infer the concentrations of these substances. Dependencies in E such as closure can be handled in a manner sim- ilar to Scenario 2. However, in the present discussion we will assume that the E matrix is of rank S. Proposition 3 is stated for E being of full rank. If the pure-component spectra are linearly-dependent, S should be replaced by Si.
An exhaustive analysis of the rank of the column-mean-centered concentration matrix C, was performed. It was shown how dependencies can cause rank deficiencies. Proposition 3 gives a comprehen- sive summary of the relationships between the ranks of various original and column-mean-centered matri- ces. The main results are: (i) the ranks of all the col- umn-mean-centered matrices are equal, (ii> the ranks of the matrices which represent change in ab- sorbance, H, or change in concentration, D, are equal to that of column-mean-centered matrices, (iii) the original absorbance matrix, A, and the concentration matrix, C, can have a rank larger than their column- mean-centered counterparts. However, the difference in rank can at most be one and such a difference will not exist when R 2 S. Proposition 4 shows that the results for column-mean-centered matrices hold also for time-differentiated matrices.
From the above discussion, we see that there is an increase in rank (rank augmentation) when going from the column-mean-centered matrix to the origi- nal matrix. Yet, such a rank augmentation can be at most one. The aim, however, is to increase the rank up to S, so that the number of absorbing species can be detected via rank analysis and standard FA can be used. Techniques performing this task are presented in Section 7.
6. Consequences of rank deficiency on factor analysis
The most important result obtained in the previ- ous section by analyzing linear dependencies and
their influence on the rank of the absorbance matrix A, is that if the number of independent reactions is less than the number of absorbing species, then rank analysis reveals only the number of independent re- actions. Hence, standard FA cannot be applied to A.
In FA, the first step is the determination of the pseudo-rank and the abstract spaces. A popular method is to use SVD and neglect the non-signifi- cant singular values and their corresponding singular vectors. The abstract spaces are the row span and column span of the left and the right singular vec- tors, respectively. The second step in FA is a rotation in which the abstract spaces are rotated to determine the physical spaces (see Malinowski [7]), either using targets or optimization criteria:
H “z (V,Z,)W:=D,E, = (XN),E,
= (XN),TT-‘E, such that T- ’ E, = E, (36)
where subscript ‘ 1’ indicates a dominant quantity re- lated to the significant singular values, T is an S X S rotation matrix, the subscripts ‘a’ and ‘p’ denote an abstract and a physical quantity, respectively. In ad- dition to determining the concentrations, Prinz and Bonvin [17] proposed a two-step target factor analy- sis (TFA) approach to obtain the reaction extents. The two steps of the procedure are: (i) determination of S from A, TFA on A using pure-component-spectra targets, and estimation of C and D and (ii) determi- nation of R from D, TFA on D using reaction tar- gets, and estimation of X. This approach will only work for the cases R 2 S but will fail for the most common case R < S. This is due to the fact that H has (pseudo-)rank R and thus, does not describe the S-dimensional abstract space of E. In short, pure- component-spectra targets cannot be tested individu- ally in this case.
However, a similar TFA method can be used if reaction targets can be provided as well. Since R is the dimension of the reaction-spectra space, targets of the form (nTE) have to be provided instead of indi- vidual pure-component spectra eT. The rotation can be performed in the R-dimensional space spanned by the rows of NE:
H = X,(NE), = X,TT-‘(NE), such that
T-‘W% = W)p (37)
24 hf. Amrhein et al./ Chemometrics and Intelligent Laboratory Systems 33 (1996) 17-33
with T being an R X R rotation matrix. However, as tained from such a fed-batch run, let e be the con- can be seen, this would necessitate the knowledge of centration matrix corresponding to A, and let Xk be the pure-component spectra of all the reacting the overall reaction extents during sub-interval k. If species, which is quite demanding and often impossi- E is of full rank, Ack are independent of each other ble. and (AckjT e?iPr(N), Vk = 1, . . . . m, then
rank(A) =rank(C) =min(R+m,S) (4)
(7)If mI;S-R,then, 7. Rank augmentation of the absorbance matrix
From Section 5, if R < S, only the number of in- dependent reactions can be obtained by analyzing the rank of the column-mean-centered absorbance ma- trix. Also from Proposition 3, one sees that by adding the initial value explicitly to the matrices D and H, the rank can be augmented by one. In this section, the idea is to augment the absorbance matrix such that its rank becomes equal to S. This would allow testing pure-component spectra individually in the rotation step of TFA.
We propose two methods to augment the rank of A:
(1) multiple process runs, and (2) addition of mixtures of known concentrations. As before, we first list the results that will be use-
ful in explaining rank augmentation using multiple process runs and addition of mixtures and then illus- trate them.
Propositions (see Appendix D for proofs) (5) Let x be composed of m absorbance matrices
Ak, Vk= 1, . . . . m from m different process runs (starting from different initial conditions, I$:
(38)
Let c be the composite concentration matrix corre- sponding to A. If E is of full rank, ci are indepen- dent of each other and (c:>~ CZAR, Vk = 1, . . . , m where Xk are the reaction extents of run k, then
rank(i) = rank(c) = min( R + m, S) (39
(6) Let absorbing-species mixtures with concen- trations Ack be added to the reacting mixture at m different time instants, i.e., at the beginning of sub- interval k, k = 1, . . . . m, with AC’ being the initial concentration. Let i be the absorbance matrix ob-
rank(A,) = rank(A) - 1; rank(&) = rank(i) - 1
(41)
If m>S-R,then,
rank(&) = rank(X); rank(&) = rank(A) (42)
7.1. Multiple process runs
Here we conduct m different process runs starting from m different initial conditions, c& Vk = 1, . . . . m and collect the absorbance matrices, Ak, Vk = 1, . . . . m. Then we append the m measured absorbance ma- trices to form the composite matrix x as in (38). Proposition 5 tells us that rank augmentation occurs in A. For every additional process run starting from an independent initial condition, the rank of the com- posite matrix goes up by one. However, rank aug- mentation is possible only up to the stage where the rank of the appended matrix is equal to the number of absorbing species, S. If additional runs are per- formed, no further rank augmentation can be ob- served.
Another interesting issue is with regard to the col- umn-mean-centered matrices as noted in Proposition 7. Up to the stage where the augmentation is partial or just complete, i.e., m 5 S - R, column-mean cen- tering will show rank reduction of one. However, when the augmentation is more than sufficient, then rank reduction by column-mean centering can no longer be observed. This can be used as an indication to whether we need more process runs or not. Hence, a procedure can be adopted in which we keep ap- pending more and more process runs till column- mean centering does not cause rank reduction. Such a procedure is, in one sense, conservative because it will use one more process run than necessary. This is due to the fact that the procedure will terminate only when m=S-R+l.

hi. Amrhein et ul./ Chemometrics and Intelligent Laboratory Systems 33 (1996) 17-33 25
7.2. Addition of substances during reaction
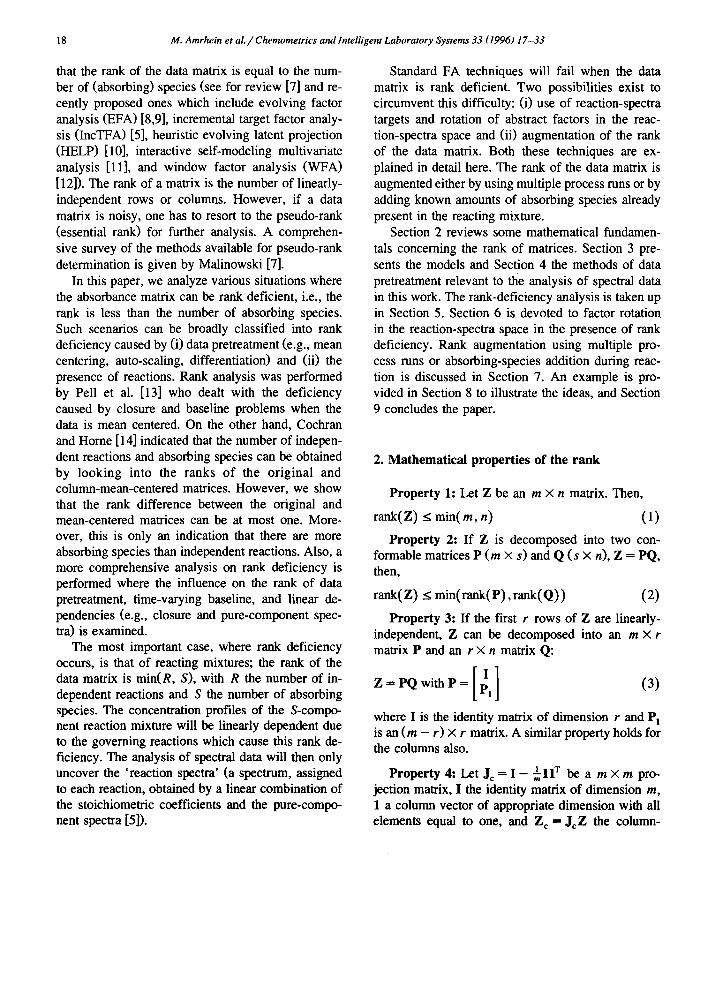
In this procedure, some of the reactants or prod- ucts are added to the reacting mixture during the course of the reaction. The added mixtures have con- centrations Ack, Vk = 1, . . . . m. These concentrations are a posteriori concentrations, i.e., concentrations after the substances have been added to the reacting mixture. Addition of Ack increases the volume of the mixture, though a constant volume was initially as- sumed in this work. Therefore, we will assume for simplicity that the change in volume is negligible. Fig. la illustrates the concentration profile of a species s and Fig. lb the profile of the reaction ex- tent of a reaction r. tk denotes the time instant where the concentrations Ack are added, tk_ the time in- stant just before t,, and t * a time instant in the sub- interval k. The subscripts s and r indicate the sth and rth column of the respective quantity. The relative change in the reaction extent A .x,” (t) = x:(t) - x;(t,>.
The absorbance matrix of such a fed-batch pro- cess run is measured as A. Proposition 6 indicates that the rank of x increases by one for every addition up to the maximum of S. In this case also, rank reduc- tion by column-mean centering can be used as a Boolean measure to check whether the augmentation is sufficient or not.
Remark
Both Propositions 5 and 6 demand m independent initial concentrations or additions. However, if only S known substances in the reacting mixture are known, we can at best generate Sknown linearly-independent
initial concentrations or additions. Hence, for the ab- sorbance matrix to have rank S, the number of known substances in the reacting mixture should satisfy, s known 2 m = S - R. In other words, the number of unknown substances, Sunknown, should be less than or equal to the number of independent reactions, s unknown s R. Once the total number of absorbing species is found experimentally through determina- tion of the rank of A or A, one can determine the number of unknown absorbing species, Sunknown = S - SkIlow”’ This constitutes the first step in FA. How- ever, for the rotation step of TFA, pure-component- spectra targets also for the unknown absorbing species have to be proposed.
To summarize, by using m = S - R independent process runs or by adding substances at m different points in time during the reaction, it is possible to augment the rank of the absorbance matrix to S, the number of absorbing species in the reacting mixture. The rank reduction with column-mean centering is used as an indication whether the augmentation is sufficient or not. Hence, both methods reveal both the number of absorbing species, S, and the number of independent reactions, R. With full augmentation, all the methods mentioned in the introduction will now work and, especially, pure-component spectra targets can be tested individually in TFA.
In applying FA tethniques to the rank-augmented absorbance matrices A and A, it is important to note that the initial concentrations, cf, or the concentra- tions of added mixtures, Ack, respectively, are not required to be known. Even though the initial con- centrations and the concentrations of the added mix- tures are normally known, the measured spectrum
Fig. 1. Rank augmentation by additon of substances: (a) concentration profile of species S, (b) extent profile of reaction r.
26 M. Amrhein et al. / Chemometrics and Intelligent Laboratory Systems 33 (1996) 17-33
need not correspond to them (especially in the case where the reaction dynamics are fast). Hence, avoid- ing the knowledge of ci and Ack is a decisive ad- vantage of the proposed techniques.
8. Example
Both methods of rank augmentation described in the previous section are illustrated on a simulated isothermal and constant-volume batch reaction sys- tem involving S = 4 absorbing species and R = 2 in- dependent reactions (example adapted from Terwi- esch and Agarwal [ 181). Reactant A is converted to the desired product B. In a consecutive reaction auto- catalyzed by C, B reacts further to the waste prod- ucts C and D:
2A2B2C+2D
The mole balances for the batch reactor read
dc, - = -2k,( c*)* dt
dc, - = k,(c*)* - k,c,cc dt
(43)
(4)
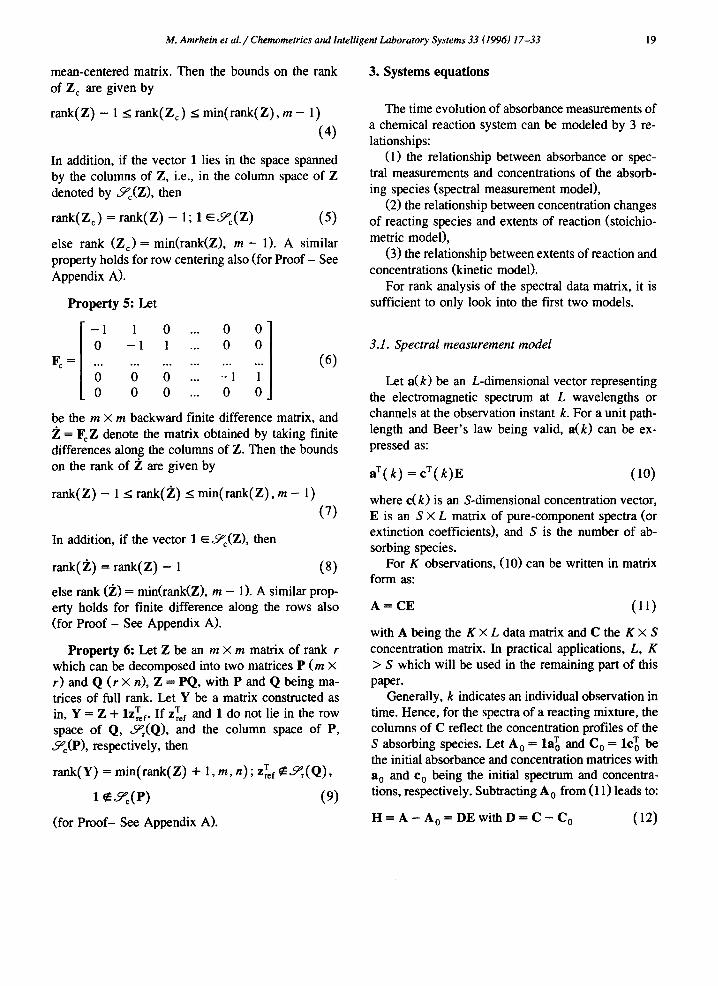
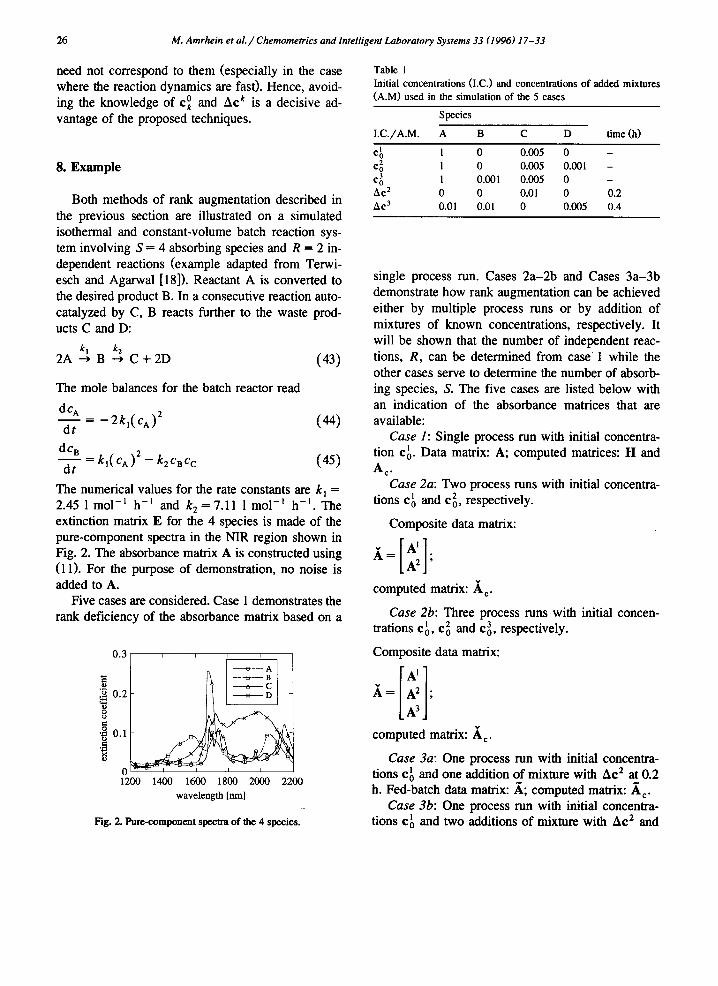
(45) The numerical values for the rate constants are k, = 2.45 1 mol-’ h-’ and k, = 7.11 1 mol-’ h-‘. The extinction matrix E for the 4 species is made of the pure-component spectra in the NIR region shown in Fig. 2. The absorbance matrix A is constructed using (11). For the purpose of demonstration, no noise is added to A.
Five cases are considered. Case 1 demonstrates the rank deficiency of the absorbance matrix based on a
wavelength [nm]
Fig. 2. Pure-component specba of the 4 species.
Table I Initial concentrations (I.C.) and concentrations of added mixtures (A.M) used in the simulation of the 5 cases
Species
I.C./A.M. A B C D time (h)
Cb 1 0 0.005 0 - 4 1 0 0.005 0.001 - c: I 0.001 0.005 0 - AC’ 0 0 0.01 0 0.2 AC’ 0.01 0.01 0 0.005 0.4
single process run. Cases 2a-2b and Cases 3a-3b demonstrate how rank augmentation can be achieved either by multiple process runs or by addition of mixtures of known concentrations, respectively. It will be shown that the number of independent reac- tions, R, can be determined from case’ 1 while the other cases serve to determine the number of absorb- ing species, S. The five cases are listed below with an indication of the absorbance matrices that are available:
Case I: Single process run with initial concentra- tion cb. Data matrix: A; computed matrices: H and A,*
Case 2~: Two process runs with initial concentra- tions cb and c& respectively.
Composite data matrix:
A= A’ . 1 1 A* ’
computed matrix: A,.
Case 2b: Three process runs with initial concen- trations ch, ci and c& respectively.
Composite data matrix:
A’ A= A2 ; [I A3
computed matrix: A,.
Case 30: One process run with initial concentra- tions ch and one addition of mixture with AC* at 0.2 h. Fed-batch data matrix: A; computed matrix: d,.
Case 3b: One process run with initial concentra- tions ch and two additions of mixture with AC* and
M. Am&in et al. / Chemometrics and Intelligent Laboratory Systems 33 (1996) 17-33 27
.s b
0.4
8 B 0.2 x
0 0 0.2 0.4 0.6 0.8 1
time [h]
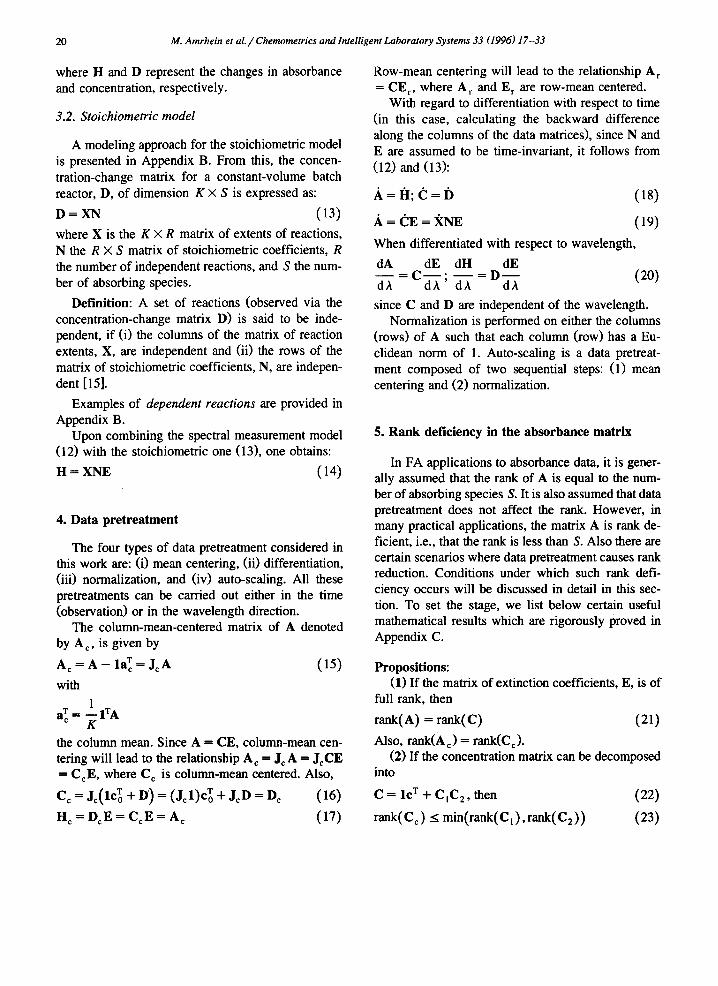
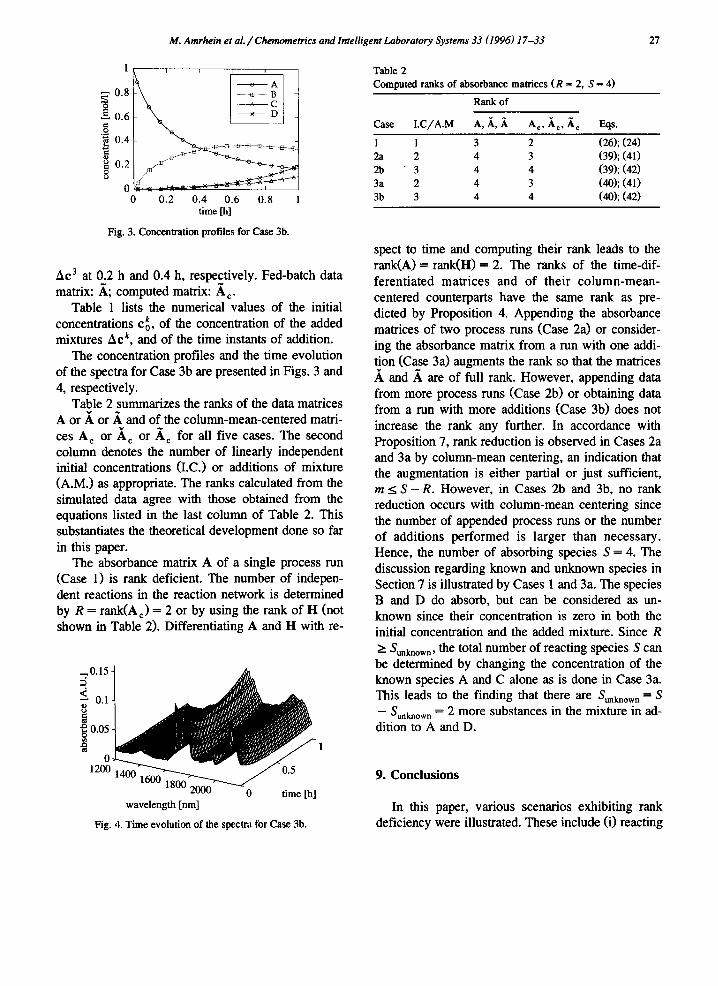
Fig. 3. Concentration profiles for Case 3b.
Ac3 at 0.2 h and 0.4 h, respectively. Fed-batch data matrix: A; computed matrix: A,.
Table 1 lists the numerical values of the initial concentrations c& of the concentration of the added mixtures Ack, and of the time instants of addition.
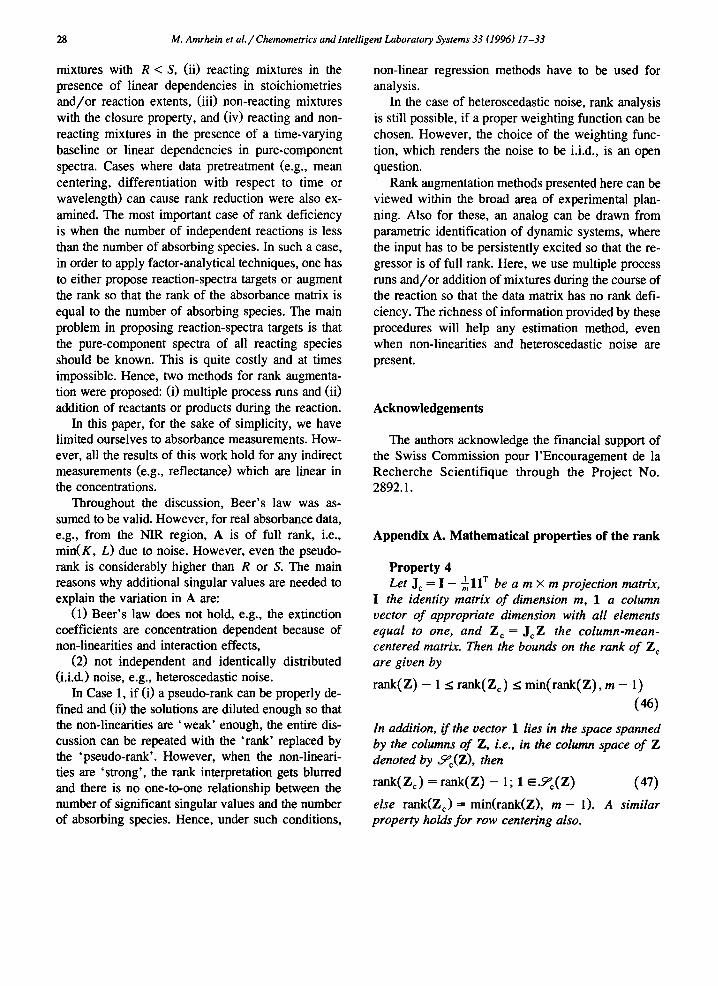
The concentration profiles and the time evolution of the spectra for Case 3b are presented in Figs. 3 and 4, respectively.
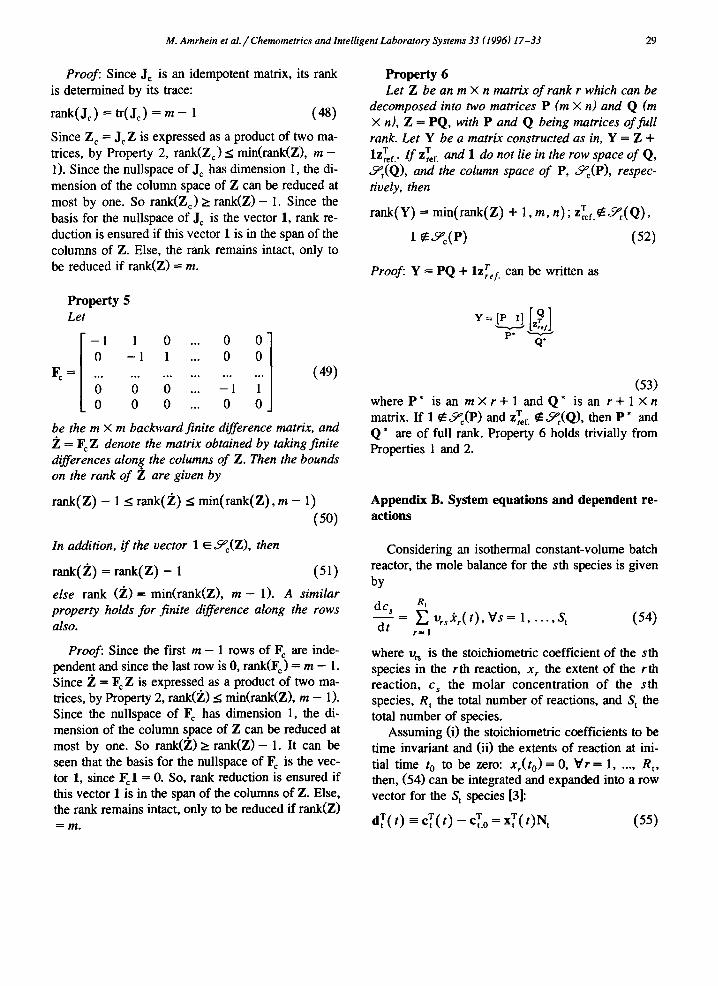
Table 2 summarizes the ranks of the data matrices A or x or A and of the column-mean-centered matri- ces A c or A, or A, for all five cases. The second column denotes the number of linearly independent initial concentrations (I.C.) or additions of mixture (A.M.) as appropriate. The ranks calculated from the simulated data agree with those obtained from the equations listed in the last column of Table 2. This substantiates the theoretical development done so far in this paper.
The absorbance matrix A of a single process run (Case 1) is rank deficient. The number of indepen- dent reactions in the reaction network is determined by R = rank(A c) = 2 or by using the rank of H (not shown in Table 2). Differentiating A and H with re-
2 0.15
; 0.1
8 fl 0.05 2 9 1
12;
wavelength [nm]
Fig. 4. Time evolution of the spectrn for Case 3b.
Table 2 Computed ranks of absorbance matrices (R = 2, S = 4)
Rank of
Case LC/A.M A, ii, ii A,, A,, A, Eqs.
1 1 3 2 (26); (24) 2a 2 4 3 (39); (41) 2b -3 4 4 (39); (42) 3a 2 4 3 (40); (41) 3b 3 4 4 (40); (42)
spect to time and computing their rank leads to the rank(A) = rank(H) = 2. The ranks of the time-dif- ferentiated matrices and of their column-mean- centered counterparts have the same rank as pre- dicted by Proposition 4. Appending the absorbance matrices of two process runs (Case 2a) or consider- ing the absorbance matrix from a run with one addi- tion (Case 3a) augments the rank so that the matrices A and A are of full rank. However, appending data from more process runs (Case 2b) or obtaining data from a run with more additions (Case 3b) does not increase the rank any further. In accordance with Proposition 7, rank reduction is observed in Cases 2a and 3a by column-mean centering, an indication that the augmentation is either partial or just sufficient, m s S - R. However, in Cases 2b and 3b, no rank reduction occurs with column-mean centering since the number of appended process runs or the number of additions performed is larger than necessary. Hence, the number of absorbing species S = 4. The discussion regarding known and unknown species in Section 7 is illustrated by Cases 1 and 3a. The species B and D do absorb, but can be considered as un- known since their concentration is zero in both the initial concentration and the added mixture. Since R
2 Sunknown 9 the total number of reacting species S can be determined by changing the concentration of the known species A and C alone as is done in Case 3a. This leads to the finding that there are Sunknown = S - Sunknown = 2 more substances in the mixture in ad- dition to A and D.
9. Conclusions
In this paper, various scenarios exhibiting rank deficiency were illustrated. These include (i) reacting
28 M. Amrhein et al./ Chemometrics and Intelligent Laboratory Systems 33 (1996) 17-33
mixtures with R < S, (ii) reacting mixtures in the presence of linear dependencies in stoichiometries and/or reaction extents, (iii) non-reacting mixtures with the closure property, and (iv) reacting and non- reacting mixtures in the presence of a time-varying baseline or linear dependencies in pure-component spectra. Cases where data pretreatment (e.g., mean centering, differentiation with respect to time or wavelength) can cause rank reduction were also ex- amined. The most important case of rank deficiency is when the number of independent reactions is less than the number of absorbing species. In such a case, in order to apply factor-analytical techniques, one has to either propose reaction-spectra targets or augment the rank so that the rank of the absorbance matrix is equal to the number of absorbing species. The main problem in proposing reaction-spectra targets is that the pure-component spectra of all reacting species should be known. This is quite costly and at times impossible. Hence, two methods for rank augmenta- tion were proposed: (i) multiple process runs and (ii) addition of reactants or products during the reaction.
In this paper, for the sake of simplicity, we have limited ourselves to absorbance measurements. How- ever, all the results of this work hold for any indirect measurements (e.g., reflectance) which are linear in the concentrations.
Throughout the discussion, Beer’s law was as- sumed to be valid. However, for real absorbance data, e.g., from the NIR region, A is of full rank, i.e., min(K, L) due to noise. However, even the pseudo- rank is considerably higher than R or S. The main reasons why additional singular values are needed to explain the variation in A are:
(1) Beer’s law does not hold, e.g., the extinction coefficients are concentration dependent because of non-linearities and interaction effects,
(2) not independent and identically distributed (i.i.d.1 noise, e.g., heteroscedastic noise.
In Case 1, if (i) a pseudo-rank can be properly de- fined and (ii) the solutions are diluted enough so that the non-linearities are ‘weak’ enough, the entire dis- cussion can be repeated with the ‘rank’ replaced by the ‘pseudo-rank’. However, when the non-lineari- ties are ‘strong’, the rank interpretation gets blurred and there is no one-to-one relationship between the number of significant singular values and the number of absorbing species. Hence, under such conditions,
non-linear regression methods have to be used for analysis.
In the case of heteroscedastic noise, rank analysis is still possible, if a proper weighting function can be chosen. However, the choice of the weighting func- tion, which renders the noise to be i.i.d., is an open question.
Rank augmentation methods presented here can be viewed within the broad area of experimental plan- ning. Also for these, an analog can be drawn from parametric identification of dynamic systems, where the input has to be persistently excited so that the re- gressor is of full rank. Here, we use multiple process runs and/or addition of mixtures during the course of the reaction so that the data matrix has no rank defi- ciency. The richness of information provided by these procedures will help any estimation method, even when non-linearities and heteroscedastic noise are present.
Acknowledgements
The authors acknowledge the financial support of the Swiss Commission pour I’Encouragement de la Recherche Scientifique through the Project No. 2892.1.
Appendix A. Mathematical properties of the rank
Property 4 Let J, = I - $llT be a m X m projection matrix,
I the identity matrix of dimension m, 1 a column vector of appropriate dimension with all elements equal to one, and Z, = J,Z the column-mean- centered matrix. Then the bounds on the rank of Z, are given by
rank(Z) - 1 ezrank(Z,) <min(rank(Z),m- 1)
(4)
In addition, if the vector 1 lies in the space spanned by the columns of Z, i.e., in the column space of Z denoted by YC(Z), then
rank(Z,) = rank(Z) - 1; 1 EYE (47)
else rank(Z,) = min(rank(Z), m - 1). A similar proper@ holds for row centering also.
M. Amrhein et al. / Chemometrics and Intelligent Laboratory Systems 33 (1996) 17-33 29
Proof Since J, is an idempotent matrix, its rank is determined by its trace:
rank( J,) = tr( J,) = m - 1 (48)
Since Z, = J,Z is expressed as a product of two ma- trices, by Property 2, rank(Z,) < min(rank(Z), m - 1). Since the nullspace of J, has dimension 1, the di- mension of the column space of Z can be reduced at most by one. So rank(Z,) r rank(Z) - 1. Since the basis for the nullspace of J, is the vector 1, rank re- duction is ensured if this vector 1 is in the span of the columns of Z. Else, the rank remains intact, only to be reduced if rank(Z) = m.
Property 5 Let
F, =
i
-1 1 0 . . . 0 0 0 -1 1 . . . 0 0 . . . . . . . . . . . . . . . . . . (49) 0 0 0 . . . -1 1 0 0 0 . . . 0 0 1
be the m X m backwardjnite diflerence matrix, and Z = F,Z denote the matrix obtained by taking finite differences along the columns of Z. Then the bounds on the rank of Z are given by
rank(Z) - 1 5 rank(Z) s min(rank(Z) , m - 1)
(50)
In addition, if the vector 1 EY,(Z), then
rank(Z) = rank(Z) - 1 (51) else rank (Z) = min(rank(Z), m - 1). A similar property holds for finite difserence along the rows also.
Proof: Since the first m - 1 rows of F, are inde- pendent and since the last row is 0, rank(F,) = m - 1. Since Z = F,Z is expressed as a product of two ma- trices, by property 2, rank(Z) 5 min(rank(Z), m - 1). Since the nullspace of F, has dimension 1, the di- mension of the column space of Z can be reduced at most by one. So rank(Z) r rank(Z) - 1. It can be seen that the basis for the nullspace of F, is the vec- tor 1, since F,l = 0. So, rank reduction is ensured if this vector 1 is in the span of the columns of Z. Else, the rank remains intact, only to be reduced if rank(Z) = m.
Property 6 Let Z be an m X n matrix of rank r which can be
decomposed into two matrices P (m X n) and Q (m X n), Z = PQ, with P and Q being matrices offull rank. Let Y be a matrix constructed as in, Y = Z + We,. If z’,~, and 1 do not lie in the row space of Q, pr(Q), and the column space of P, PC(P), respec- tively, then
rank(Y) = min(rank(Z) + 1, m, n); ~‘,,,49~(Q),
I @X(P) (52)
Proof: Y = PQ + 1~;~~. can be written as
Y= [P l] 9 [ 1 - %I
P’ - Q’
(53) whereP* isan mXr+l andQ* isan r+lXn matrix. If 1 e9$P) and z”r. g yr(Q), then P * and Q * are of full rank. Property 6 holds trivially from Properties 1 and 2.
Appendix B. System equations and dependent re- actions
Considering an isothermal constant-volume batch reactor, the mole balance for the sth species is given by
dc, R, x=c ur,ir(t),Vs= 1, . . ..S. (54)
r- I
where u% is the stoichiometric coefficient of the sth species in the rth reaction, x, the extent of the rth reaction, c, the molar concentration of the sth species, R, the total number of reactions, and S, the total number of species.
Assuming (i) the stoichiometric coefficients to be time invariant and (ii) the extents of reaction at ini- tial time t,, to be zero: x,@,> = 0, Vr = 1, . . . . R,, then, (54) can be integrated and expanded into a row vector for the S, species [3]:
d;(t) =c;(t) -&,=x;(t)N, (55)
30 M. Amrhein et al./Chemometrics and Intelligent Laboratory Systems 33 (1996) 17-33
Here d, is the S,-dimensional concentration-change vector defined as the difference between the concen- tration vectors c, and c,,~ = c,(r,>, x, the R,-dimen- sional vector of extents of reaction, and N, the R, X S, stoichiometric matrix. The subscript ‘t’ is used to in- dicate the total number of species or reactions.
For K measurements, (5.5) can be written as
D, = C, - C,,, = X,N, (56) where D, is the K X S, concentration-change matrix and X, the K X R, matrix of extents of reaction. A similar relationship can also be derived for a non- isothermal constant-volume batch process (see for details [3]).
B.1. Dependent reaction stoichiometries
In the presence of linearly-dependent reaction sto- ichiometries, i.e., linearly-dependent rows in N,, the rank of N, will be less than R,. One source of lin- early-dependent reaction stoichiometries is the pres- ence of reversible reactions which are quite common in practical applications.
Let R, be the number of independent reaction stoichiometries. Then by Property 3, N, can be ex- pressed as
N,=PiN,, (57) where P, and N, are matrices of dimension R, X R, and R, X S,, respectively. Defining X, = X,P,, we get X,N, = X,P,N, = X,N, (58)
B.2. Dependent reaction kinetics
Due to coupling between reactions, the reaction extents and reaction rates can be linearly dependent. Such a situation occurs, for example, due to the cou- pling of energy production and consumption in bioreactions.
Analogous to dependent stoichiometries, in the presence of linearly-dependent reaction extents, i.e., dependent columns in X,, let R, be the number of independent reaction extents. Then by Property 3, and defining N, = P,N, we get,
X, = X,P*, X,N, = X,P,N, = X,N, (59) with the inner dimension of X x, P2, and N, being R,.
If dependencies in both reaction kinetics and reac- tion stoichiometries are eliminated using the alge- braic manipulations explained above, we can obtain a decomposition with the inner dimension being the number of independent reactions, R,
D, = X,N, = XN,, (9
such that the matrices X and N,, are of dimensions K X R and R X S,, respectively.
However, all the reacting species need not to ab- sorb in the frequency region of the electro-magnetic spectrum. So, the columns corresponding to the non-absorbing species of D, and N,, can be dropped to give
D=XN (61)
where D has a dimension K X S, while N is of di- mension R X S.
Appendix C. Rank deficiency in the absorbance matrix
Proposition 1 Let Ae!RKKXL, C=!RKXS, and EE~‘~’ be
defined as above with A = CE. Let L and K > S and E be offill rank, i.e., rank(E) = S. Then, rank(A) = rank(C) and rank(A,) = rank(C,).
Proof: From Property 2, rank(A) ZG min(rank(C), rank(E)). Also, by Property 1, rank(C) < S and by assumption rank(E) = S. Since rank(C) 5 rank(E), we get rank(A) < rank(C). The situation rank(A) < rank(C) arises only when some of the rows of C are orthogonal to the space spanned by the columns of E. Since E is of full rank, the columns of E span the en- tire %’ space. So, no row of C can be orthogonal to the column space of E unless it is a row with all ze- ros. Hence,
rank(A) = rank(C)
Similarly, rank(A,) = rank(C,). (62)
Proposition 2 If the concentration matrix can be decomposed
info C = lcT + C,C,, then
rank(C,) 5 min(rank(C,),rank(C,)) (63)
M. Amrhein et al. / Chemometrics and Intelligent Laboratory Systems 33 (1996) 17-33 31
Proof: The column-mean centered matrix C, can be written as C, = J,C. Given the decomposition of C in (221, we obtain
+ J,C,C, = J,C,C,
(64) So, rank(C,) 5 min(rank(J~i,), rank(C, 1, rank(C,)). Since J, is an idempotent matrix, m&J,) = K - 1, which by assumption (K > S) is larger than or equal to the ranks of C, and C, and, hence, the proposi- tion.
Proposition 3 If E is offull rank, then
rank(A,) = rank(C,) = min( R, S) (65)
rank(H) = rank(D) = min( R , S) (66)
In addition, if the initial concentration cz epr(:(N), then
rank(A) = rank(C) = min( R + 1, S) (67)
Proof: Since C = lci + XN from Property 2, it is clear that rank(C,) = min(rank(X,), rank(N)). Since the first row of X is OT, le._C$X). Then from Prop- erty 4, it is clear that there is no rank reduction by column-mean centering, rat&(X,) = rank(X). Since min(rank(X), rank(N)) = min( K, R, S> = min( R, S), Eq. (64) follows. Eq. (66) can be obtained from the fact that rank(X,) = rank(X) and rank(D,) = rank(D). Also by Proposition 1, rank(C,) = rank(A ,>. Since cz e Yr(N), rank augmentation takes place due to the addition of the initial condition, which gives
rank(C)
=rank(D+lc~)=min(rank(D) + l,K,S)
=min(min(R,S) + l,K,S)=min(R+ 1,s)
(68)
Proposition 4 Zf E is offill rank, then
rank(A) = rank(C) = min( R, S) (69)
Proof: Let P be a matrix with the elements of the columns being functions of time and the elements of the rows being functions of wavelength. So the time differentiation of the column vector 1 is equal to 0. If the matrix P can be decomposed into P = lpT + PIP2, then
P=P,P* +P,p, (70)
Since C = lcz + XN and fi = 0, e = kN. Since the first row of X is OT, 1 Z5$X). Then from Property 5, rank@ = rank(X). Hence,
rank(e) = min( R, S) (71)
From Proposition 1, ra.nk~A> = rank(C), since A = CE due to time invariance and E is of full rank. 0
C.I. Effect of diflerentiation with respect to wave- length
If the matrix Q can be decomposed into Q = qlT + Q ,Q2, then differentiating with respect to wave- length, leads to
dQ dQ2 dQ, -= dh Qqjy- + xQ2 (72)
Here the column vector q signifies the time variation of a baseline parallel to the wavelength axis. Clearly, rank reduction occurs in the presence of a such a baseline when the absorbance matrix is differentiated along the wavelength axis. If the baseline varies lin- early with wavelength then, A = atiselT + m AT + A,, where abase is the abscissa of the baseline, m the baseline slope, and A the wavelength vector. Note that the vectors abase and m contain the variation of the abscissa and slope of the baseline with respect to time. So, dA/dh can again be decomposed as dA/d A = mlT + dA i/dh. Hence, differentiating with respect to wavelength a second time will cause another rank reduction.

32 hf. Amrhein et al./ Chemometrics and Intelligem Laboratory Systems 33 (1996) 17-33
Appendix D. Augmenting the rank of the ab- sorbance matrix
Proysition 5 Let A be composed of m absorbance matrices Ak,
Vk= 1, . . . . m from m different process runs (starting from difSerent initial conditions, ci). Then,
x = CE; with
(73)
Let C be the composite concentration matrix corre- sponding to A. If E is of full rank, ci are indepen- dent of each other and (ctjT $Z9r(N), Vk = 1, . . . . m where Xk are the reaction extents of run k, then
rank(i) = rank(C) = min( R + m, S) (74)
Proof The matrix c can be written as
C=
(75) 2 and fi are matrices of dimension K X (R + m) and (R + m) X S, respectively. Since the first row of Xk is OT, 1 CS PC(Xk>, Vk = 1, . . . . m, X is of full rank. Also, 6 is of full rank due to the assumption 6~:)~ 65 Yr(N), Vk = 1, . . . . m. Hence, the Proposition fol- lows.
If (R + m) > S, then it will not be possible to find m initial concentrations independent of the stoichio- metric matrix. However, independent initial condi- tions can be found till the augmented matrix fi at- tains the rank of S.
Proposition 6 Let absorbing-species mixtures with concentra-
tions Ack be added to the reacting mixture at m dif- ferent time instants, i.e., at the beginning of sub-in- terval k, k = 1, . . . . m, with AC’ being the initial con-
centration. Let i be the absorbance matrix obtained from such a fed-batch run, let C be the concentra- tion matrix corresponding to A, and let 2 be the overall reaction extents during sub-interval k. Then, the concentration matrix during that sub-interval is given by
Ck=XkN+ i AC’ (76) i= 1
The fed-batch absorbance and concentration matri- ces are
.& = CE; with
I l( Ac’)~
CC l( Ac’)~ + l( Ac*)~ . . . . . . . . . . . . . . . . . . . . . . . . . . . . l( Ac~)~ + l( Ac*)~ + . . . + l( Ac”)~
(77)
If E is of full rank, Ack are independent of each other and (AckjT @Pr(N), Vk = 1, . . . . m, then
rank(A) = rank(c) = min( R + m, S) (78) Proof: The matrix (5 can be written as
c=pLJ$] % L
N
(79) The matrices X and R are of dimension K X (R + m) and (R + m) X S, respectively. Since the first row of X’ is OT, 1 eYC(XT). Hence, the (R + 11th column of X is independent of its first R columns. Also, as- suming the number of rows of X1 to be greater than R + 1, [X’ 11 is of full rank (R + 1). Due to this, the vector 0 of the (R + 21th column of X can be ex- pressed only as a trivial combination (all coordinates are zero) of the first R + 1 columns of 2. Hence, the (R + 2)th column is independent of the previous columns. By induction, X is of full rank. Also, fi is
hf. Amrhein et al./ Chemometrics and Intelligent Laboratory Systems 33 (1996) 17-33 33
of full rank due to the assumption (AcklT GEY~(N), Vk = 1, . . . . m. Hence, the Proposition follows.
Proposition 7 IfmlS-R, then
rank(&) = rank(A) - 1; rank(i,) = rank(a) - 1
(80)
Ifm>S-R,then
rank(&) = rank(A); rank(A,) = rank(a) (81)
Proof: Under the assumption that E and N are of full rank,
rank(&) = rank(C,) = rank(%,%) (82)
rank(&) = rank(c,) = rank(&R) (W
In the composite matrix 2, summing the last m columns leads to the 1 vector and hence the 1 vector lies in the space spanned by the columns of 2. Simi- larly, the 1 vector lies in the column space of ii since its (R + l)th column is already the 1 vector. The re- duction of rank by one is obvious from Property 6 and since rank(g) = rank(%) = R + m, rank@ ,> = rank(g,)=R+m-lassumingK>R+m.So,the ranks of the column-mean-centered matrices (A c ) and C&1,
m&(X,) = min(rank(%,),rank(&))
=min(R+m- 1,s) (84)
rank(ii,) = min(rank(%C),rank(fi))
=min(R+m- 1,s) (85) If m<S-RR, then R+m- l<S and rank&)= rank(A c > = R + m - 1. So from Proposition 5 and 6,
a rank drop by one can be clearly seen. On the con- trary, if m > S - R, then R + m - 1 > S and rank(X c ) = rank(;i c) = S = rank(X) = rank(ii>.
References
[ll R. Tauler and B.R. Kowalski, Anal. Chem., 65 (1993) 2040- 2047.
[2] S. Amsworth, J. Phys. Chem., 65 (1961) 1%8-1972. [3] D. Bonvin and D.W.T. Rippin, Chem. Eng. Sci., 45 (1990)
3417-3426. 141 J.W. Hamer, Chem. Eng. Sci., 44 (1989) 2363-2374. [5] 0. Prinz, Chemometric Methods for Investigating Chemical
Reaction Systems, Doctoral Thesis No. 9708, ETH Zurich, Switzerland, 1992.
[6] 0. Prinz and D. Bonvin, Monitoring discontinuous reactors using factor-analytical techniques, IFAC Symp. DYCORD + , College Park, MA, 1992.
171 E.R. Malinowski, Factor Analysis in Chemistry, 2nd edn., Wiley, New York, 1991.
[8] H.R. Keller and D.L. Massart, Chemom. Intell. Lab. Syst., 12 ( 1992) 209-224.
[9] M. Maeder, Anal. Chem., 59 (1987) 527-530. [lo] Y.-Z. Liang, O.M. Kvalheim, A. Rahmani and R.G. Brere-
ton, J. Chemom., 7 (1993) 15-43. [ll] W. Windig, Chemom. Intell. Lab. Syst., 16 (1992) l-23. [12] E.R. Malinowski, J. Chemom., 6 (1992) 29-40. [13] R.J. Pell, M.B. Seasholtz and B.R. Kowalski, I. Chemom., 6
( 1992) 57-62. [14] R.N. Cochran and F.H. Home, Anal. Chem., 49 (1977) 846-
853. 1151 G. Bastin, L. Chen and V. Chotteau, Can we identify
biotechnological processes?, Proc. ICCAFTS/IFAC-BIO 2, Colorado, 1992.
[16] J. Aitchison, The Statistical Analysis of Compositional Data, Monographs on Statistics and Applied Probability, Chapman and Hall, London, 1986.
[17] 0. Prinz and D. Bonvin, Monitoring chemical reaction sys- tems using incremental target factor analysis, IFAC Symp. ADCHEM’94, Kyoto, Japan, 1994.
[18] P. Terwiesch and M. Aganval, Comp. Chem. Eng., 12 (19921 1087-l 101.