a preliminary study of the subsoil of the roman amphitheatre of catania (sicily) through integrated...
TRANSCRIPT

DOI 10.1393/ncc/i2007-10272-4
IL NUOVO CIMENTO Online First
A preliminary study of the subsoil of the Roman Amphitheatre ofCatania (Sicily) through integrated geophysical and stratigraphicdata
S. Imposa(1)(2)(∗), F. Barone(1), F. Chiavetta(3), G. Coco(4), M. Corrao(4)and D. Chisari(5)(1) Dipartimento di Scienze Geologiche, Universita di Catania - Corso Italia 57
95129 Catania, Italy(2) C.R.I.Be.Cu.M, Centro di Ricerche sulle cause di degrado per il recupero dei Beni Culturali
e Monumentali - Corso Italia 57, 95129 Catania, Italy(3) Assessorato Regionale Beni Culturali e P.I. - Soprintendenza BB.CC.AA. di Catania
Via Luigi Sturzo 62, 95100 Catania, Italy(4) Geocheck S.r.l. - Via P.A. Secchi 7, 95130 Gravina di Catania (CT), Italy(5) Comune di Catania, LL.PP., S.I. e N.I., - P.O. 02. Coordinamento Geologico
Via Domenico Tempio 64, 95100 Catania, Italy
(ricevuto il 12 Settembre 2007; revisionato il 13 Marzo 2008; approvato il 18 Marzo 2008;pubblicato online il 3 Luglio 2008)
Summary. — To reconstruct the stratigraphy of the subsoil and the geometryof the lava deposits beneath the Roman Amphitheatre located within the city ofCatania (Sicily) we performed non-invasive geophysical prospections (seismic andelectric tomography). In urbanized contexts this kind of surveys represents the bestsupport to following more specific studies aimed at the conservation of monuments.Seismic tomography allowed us to reconstruct seismostratigraphic sections by imag-ing the distribution of seismic waves velocity in the internal ambulatory wall and itssubstrate and outside the Amphitheatre. Electric tomography allowed us to imagethe resistivity distribution outside the Amphitheatre and to locate anomalies relatedto the possible presence of cavities, water table and waste waters. The stratigraphicdata obtained from mechanical drillings carried out in the study area were used tocalibrate the information obtained from the geophysical surveys.
PACS 93.30.Ge – Europe.PACS 93.85.Bc – Computational methods and data processing, data acquisitionand storage.PACS 93.85.Rt – Seismic methods.
1. – Introduction and historical account
The aim of the present study is to reconstruct the stratigraphy and morphology of thesubstrate of the Roman Amphitheatre of Catania. This monument, built in the II centuryb.C., is located in the Stesicoro square, in the historical centre of Catania. The monument
(∗) E-mail: [email protected]
c© Societa Italiana di Fisica 1

2 S. IMPOSA, F. BARONE, F. CHIAVETTA, G. COCO, M. CORRAO and D. CHISARI
Fig. 1. – Left: location of the investigated area. Right: a picture of the Roman Amphitheatre,mostly buried below the present city level.
has undergone several events that have contributed to its partial destruction: betweenthe V and VI centuries a.C., King Theodoric authorized the taking of the collapsed lavicashlars and in the XI century part of the remaining ashlars was used to build the S.Agata Cathedral; in the XVI century, fearing an enemy attack, the civic Senate decreedthe demolition of the upper orders of the Amphitheatre to fortify the defensive walls [1].Of the original three-orders cavea with three entrances, only the lower order, in Doricstyle, is preserved. The ruins of the Amphitheatre are presently mostly covered by themodern buildings reconstructed after the 1693 Val di Noto earthquake (fig. 1).
The main and central element of this monument is the ellipse-shaped arena, with thelonger axis of 60 m and the shorter one of 39 m. Considering the external circumferenceof 192 m, it is one of the largest in Italy after the ones in Roma and Siracusa.
2. – Geologic and geomorphologic setting
The area of the Roman Amphitheatre of Catania is highly urbanized, so that onlya small part of the monument is visible and the rest lies below the present road paving(fig. 1). The geologic setting of the study area is characterized by beds of ancient lava(Larmisi’s lava) that cover the morphologically depressed areas and is in turn coveredby rubble material (fig. 2). In particular, from top to bottom, the following units arerecognized [2]:
– Detritus and filling material: sandy-gravely deposits associated to old and recentcoastlines and detritic material derived from the partial degradation of the Am-phitheatre itself.

A PRELIMINARY STUDY OF THE SUBSOIL OF THE ROMAN AMPHITHEATRE ETC. 3
Fig. 2. – (Colour on-line) Geologic map of the investigated area.
– Lava: volcanic deposits which generally appear with a top scoriaceous vacuolatedportion and a lower massive portion, with different degrees of fracturing and voidinclusions.
– Marly clays: this is the basal formation. It consists of pelitic sediments without aclear stratification, mixed to other fine-grained layers.
3. – Mechanical drillings
In the study area three mechanical drillings were performed using the mechanic ro-tation method. A continuous logging sampled the litostratigraphic succession from theground surface to a maximum depth of 21.8 m. In particular, the drilling M1 was carriedout near the S. Biagio church, outside the Amphitheatre, at an elevation of 20.5 m a.s.l.,and is 13 m deep, M2 was drilled 50 m east of the monument entrance, at an elevationof 14.1 m a.s.l., and is 21.8 m deep, M3 was drilled inside the arena at an elevation ofabout 9 m a.s.l. and reached a depth of 6.4 m (fig. 3). Stratigraphic data were then usedto calibrate the information obtained from the geophysical prospections.
4. – Geophysical prospections
4.1. Electric tomography . – In recent years geoelectric methods have been largelyapplied in near-surface surveys giving a significant contribution to address a wide classof geologic problems. New acquisition systems, as multielectrode array configurations,are combined with innovative inversion techniques to obtain tomographic images of theelectrical properties of the subsurface [3].
4 S. IMPOSA, F. BARONE, F. CHIAVETTA, G. COCO, M. CORRAO and D. CHISARI
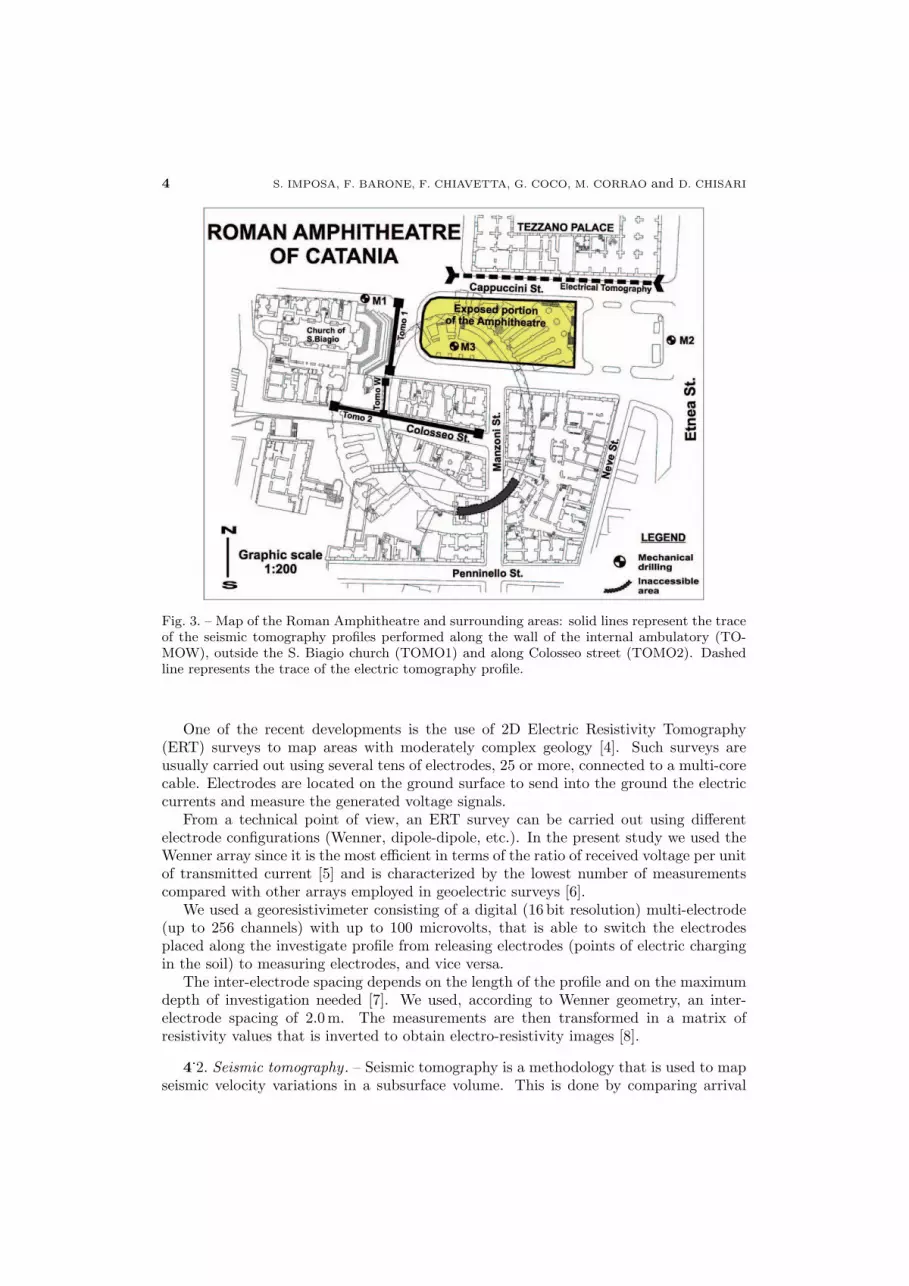
Fig. 3. – Map of the Roman Amphitheatre and surrounding areas: solid lines represent the traceof the seismic tomography profiles performed along the wall of the internal ambulatory (TO-MOW), outside the S. Biagio church (TOMO1) and along Colosseo street (TOMO2). Dashedline represents the trace of the electric tomography profile.
One of the recent developments is the use of 2D Electric Resistivity Tomography(ERT) surveys to map areas with moderately complex geology [4]. Such surveys areusually carried out using several tens of electrodes, 25 or more, connected to a multi-corecable. Electrodes are located on the ground surface to send into the ground the electriccurrents and measure the generated voltage signals.
From a technical point of view, an ERT survey can be carried out using differentelectrode configurations (Wenner, dipole-dipole, etc.). In the present study we used theWenner array since it is the most efficient in terms of the ratio of received voltage per unitof transmitted current [5] and is characterized by the lowest number of measurementscompared with other arrays employed in geoelectric surveys [6].
We used a georesistivimeter consisting of a digital (16 bit resolution) multi-electrode(up to 256 channels) with up to 100 microvolts, that is able to switch the electrodesplaced along the investigate profile from releasing electrodes (points of electric chargingin the soil) to measuring electrodes, and vice versa.
The inter-electrode spacing depends on the length of the profile and on the maximumdepth of investigation needed [7]. We used, according to Wenner geometry, an inter-electrode spacing of 2.0 m. The measurements are then transformed in a matrix ofresistivity values that is inverted to obtain electro-resistivity images [8].
4.2. Seismic tomography . – Seismic tomography is a methodology that is used to mapseismic velocity variations in a subsurface volume. This is done by comparing arrival

A PRELIMINARY STUDY OF THE SUBSOIL OF THE ROMAN AMPHITHEATRE ETC. 5
Fig. 4. – Stratigraphic columns obtained from the mechanical drillings.
times of seismic waves that traverse the volume in different directions and are recordedby an array of receivers (geophones) deployed at the surface over the volume of interest.
In this study the source of seismic waves is a sledge-hammer and waves are recordedby a multichannel seismograph with the following technical characteristics:
– signals sampling capacity between 0.002 and 0.00005 s;
– “time break” communication and transmission system;
– high pass and band reject filters;
– automatic Gain Control ;
– double A/D 12 bit converter.
Seismic data have been analyzed using the GSAO (Generalized Simulated-AnnealingOptmization) method [9]. This method allows the non-linear optimization of the inver-sion of the arrival times of direct and refracted waves and has the advantage of beingindependent on the starting velocity model [10].
5. – Analysis and discussion of the data
5.1. Mechanical drillings. – In fig. 4 are shown the stratigraphic columns obtainedfrom the mechanical drillings previously described. From top to bottom, the M1 drilling,ubicated near the St. Biagio church, is characterized by 30 cm of road paving, followed

6 S. IMPOSA, F. BARONE, F. CHIAVETTA, G. COCO, M. CORRAO and D. CHISARI
Fig. 5a. – (Colour on-line) Profiles of measured (top) and calculated (middle) apparent resistiv-ity; the bottom panel shows the tomographic section without topographic correction.
by rubble material down to a depth of 11.1 m and by a clayey silt layer, that can beascribed to an alluvial deposit, to a depth of 13.0 m.
The M2 drilling, located nearby the Amphitheatre entrance, shows a 50 cm thick roadpaving followed by a dark grey coloured vacuolar lava from 0.5 to 1.5 m, locally fissuredlava from 1.5 to 4.3 m, vacuolar lava from 4.3 to 7.8 m, massive lava from 7.8 to 16.5 m (infig. 3 these units are shown as a single layer) and scoriacea lava with sand from 16.5 to21.0 m; below the lava deposit a yellowish gravelly-sandy stratum is present down to thebottom. At site M3, ubicated within the arena, rubble and filling material were drilledin the first 70 cm of depth, followed by a stratum of vacuolar lava down to a depth of1.3 m and massive lava, locally fissured, to a depth of 4.4 m. Then, we found a layer ofvolcanic breccias to a depth of 5.0 m and a slimy-clayey layer down to 6.4 m.
5.2. Electric tomography . – A 92 m electric tomography profile was carried out alongthe Cappuccini Street, in front of the Tezzano Palace (fig. 3). The maximum depth ofinvestigation is 13 m in the central part of the section. Figure 5a shows the measuredand calculated apparent resistivity (upper and middle panels) and the inverse modelresistivity image without topographic correction (lower panel). Figure 5b shows the 2Dresistivity image along the acquisition profile, inclined following the westward sloping ofthe street. A topographic correction was performed using a portable GPS.
The chromatic scale of fig. 5c represents the resistivity values that were normalizedto differentiate three significant ranges of variation. The reddish anomalies, in the leftpart of the section, are characterized by the highest values of resistivity and are due

A PRELIMINARY STUDY OF THE SUBSOIL OF THE ROMAN AMPHITHEATRE ETC. 7
Fig. 5b. – (Colour on-line) Electric tomography section imaged in front of the Tezzano Palacewith topography correction.
to the presence of drains for the discharge of meteoric waters. Light-blue anomalies,corresponding to low-resistivity zones, are located in the central area of the prospectionand extend to the maximum depth investigated. They are due to infiltration of wastewaters, as confirmed by the direct observation of percolations inside the Amphitheatre.
5.3. Seismic tomography . – We carried out three seismic profiles for a total lengthof 93 m: TOMOW, along the wall of the Amphitheatre internal ambulatory, TOMO1,parallel to the S. Biagio church front, and TOMO2, along the Colosseo Street that partlyoverlies the Amphiteatre (fig. 3). For logistic reasons and being in an urbanized area,the seismic surveys outside the amphitheatre were configured to reduce the number ofgeophones and bursting as much as possible.
Fig. 5c. – (Colour on-line) Normalized chromatic scale representing the apparent resistivityvalues.

8 S. IMPOSA, F. BARONE, F. CHIAVETTA, G. COCO, M. CORRAO and D. CHISARI
Fig. 6. – (Colour on-line) a) Internal ambulatory wall. Arrows indicate geophones used for theseismic tomography; b) seismic tomography image of the internal ambulatory wall (TOMOWprofile). Triangles show the location of the piezoelectric sensors; c) projection of the tomographyimage along the ambulatory wall.
5.3.1. TOMOW. Along the TOMOW profile (fig. 6a) we deployed 14 geophones withG-spacing equal to 1.5 m, for a total length of 21.0 m. The seismic image of the internalambulatory wall shows an irregular morphology of the substrate (figs. 6b, c). Beyondthe gallery wall covering (in blue), as thick as 50 cm, we imaged a layer characterized bya P -wave velocity (Vp) of 1000–1200 m/s that can be ascribed to fractured lava. Massivelava with Vp ≥ 1800 m/s is found at a horizontal distance of 3.5–4.0 m from the wall.
5.3.2. TOMO1. Along the TOMO1 profile we deployed 12 geophones with G-spacingequal to 2.0 m, for a total length of 24.0 m. This profile is parallel to the front of the S.Biagio church (fig. 3). The tomographic image of fig. 7 shows a marked lateral anisotropyin the central part of the section, where velocity varies abruptly from 1000 to 2500 m/s,that we interpret as the contact between massive and fractured lava.
5.3.3. TOMO2. Along the TOMO2 profile we deployed 16 geophones with G-spacingequal to 3.0 m, for a total length of 48.0 m. This profile was carried out along the ColosseoStreet (fig. 3). The seismic image is characterized by a rather regular morphology of thesubstrate, with sub-horizontal seismic strata (fig. 8).
The seismic stratum with V p varying between 100 and 2000 m/s represents vulcan-oclastic units and fractured lavas, while the substrate with P -wave velocity higher than2500 m/s is made of massive lava, as in the central part of the TOMO 1 section.

A PRELIMINARY STUDY OF THE SUBSOIL OF THE ROMAN AMPHITHEATRE ETC. 9
Fig. 7. – (Colour on-line) Seismic tomography image in front of the San Biagio church (TOMO1profile).
6. – Conclusions
The aim of this study was contributing to reconstruct the stratigraphy and mor-phology of the sedimentary and volcanic deposits that are present in the subsoil of theRoman Amphitheatre of Catania. For this study we have adopted non-invasive geophys-ical prospections such as seismic and electric tomography.
Fig. 8. – (Colour on-line) Seismic tomography image beneath Colosseo street (TOMO2 profile).

10 S. IMPOSA, F. BARONE, F. CHIAVETTA, G. COCO, M. CORRAO and D. CHISARI
Inside and around the Amphitheatre we have carried out three seismic profiles, for atotal length of 93 m, and an electric profile of 92 m. The geophysical prospections werecalibrated and integrated with the stratigraphic data obtained from the M1, M2 and M3drillings.
A seismic profile was carried out in the internal ambulatory to investigate the thicknessof the lava flow beyond the ambulatory wall. From the interpretation of the tomographicsection it is evident that the lava leaned against the wall without damaging the internalambulatory. On the contrary, the lavic flow entered and heavily damaged other parts ofthe Amphitheatre, like the central arena. Two more seismic profiles acquired outside theAmphitheatre shows that the lava deposits are rather shallow, between 5 and 8 m.
As for the electric tomography, we have reconstructed a 2D image of the apparentresistivity along a section underlying Cappuccini street in front of the Tezzano Palace,north of the Amphitheatre. The resistivity pattern allowed us to identify and locatesignificant heterogeneities caused by the presence of fluids (presumably sewage from thepalace itself) that percolate inside the monument. The infiltration of fluids affects a quitelarge area and, as observed inside the Amphitheatre, causes structural instability, mainlyin the vaults that support the upper ambulatories. This is also testified by detachmentand collapse of material. The present study results can be considered as a starting pointto plan future investigations aimed at the recovering and preservation of this monument.They can be also used to address future archaeological explorations aimed at locatingburied structures of anthrophic or natural origin.
∗ ∗ ∗SI was supported by grants (PRA 2005-2006) from the University of Catania.
REFERENCES
[1] Sposito C., L’anfiteatro Romano di Catania: conoscenza-recupero e valorizzazione, Vol. I(Flaccovio editore) 2003, pp. 1–135.
[2] Monaco C., Catalano S., De Guidi G., Gresta S., Langer H. and Tortorici L.,Mem. Soc. Geol. Ital., 55 (2000) 425.
[3] Sharma P. V., Environmental and Engineering Geophysics (Cambridge University Press,New York) 1997, p. 475.
[4] Griffiths D. H. and Barker R. D., J. Appl. Geophys., 29 (1993) 211.[5] Roy A. and Apparao R., Geophysics, 36 (1971) 943.[6] Xu B. and Noel M., Geophys. Prospect., 41 (1993) 791.[7] Edwards L. S., Geophysics, 42 (1977) 1020.[8] Dahlin T. and Loke M. H., J. Appl. Geophys., 38 (1998) 237.[9] Sathish K. Pullammanappallil and John N. Louie, Bull. Seismol. Soc. Am., 84 (1994)
1397.[10] Optim, 2001. User’s Manual SeisOptR@2DTM Version 2.8, Optim LLC, UNR-MS 174,
1664 N. Virginia St., Reno, Nevada.