surficial gains and subsoil losses of soil carbon and nitrogen during secondary forest development
TRANSCRIPT

Surficial gains and subsoil losses of soil carbon andnitrogen during secondary forest developmentMEGAN L . MOBLEY 1 , 2 , KATE LA J THA 3 , MARC G . KRAMER 4 , ALLAN R . BACON1 , 2 , 5 ,
PAUL R . HE INE 2 and DANIEL DEB RICHTER1 , 2
1University Program in Ecology, Duke University, Durham, NC 27708, USA, 2Nicholas School of the Environment, Duke
University, Durham, NC 27708, USA, 3Department of Crop and Soil Science, Oregon State University, Corvallis, OR 97331,
USA, 4Soil and Water Science Department, University of Florida, Gainesville, FL 32601, USA, 5School of Forest Resources and
Conservation, University of Florida, Gainesville, FL 32601, USA
Abstract
Reforestation of formerly cultivated land is widely understood to accumulate above- and belowground detrital
organic matter pools, including soil organic matter. However, during 40 years of study of reforestation in the sub-
tropical southeastern USA, repeated observations of above- and belowground carbon documented that significant
gains in soil organic matter (SOM) in surface soils (0–7.5 cm) were offset by significant SOM losses in subsoils (35–60 cm). Here, we extended the observation period in this long-term experiment by an additional decade, and used
soil fractionation and stable isotopes and radioisotopes to explore changes in soil organic carbon and soil nitrogen
that accompanied nearly 50 years of loblolly pine secondary forest development. We observed that accumulations of
mineral soil C and N from 0 to 7.5 cm were almost entirely due to accumulations of light-fraction SOM. Meanwhile,
losses of soil C and N from mineral soils at 35 to 60 cm were from SOM associated with silt and clay-sized particles.
Isotopic signatures showed relatively large accumulations of forest-derived carbon in surface soils, and little to no
accumulation of forest-derived carbon in subsoils. We argue that the land use change from old field to secondary for-
est drove biogeochemical and hydrological changes throughout the soil profile that enhanced microbial activity and
SOM decomposition in subsoils. However, when the pine stands aged and began to transition to mixed pines and
hardwoods, demands on soil organic matter for nutrients to support aboveground growth eased due to pine mortal-
ity, and subsoil organic matter levels stabilized. This study emphasizes the importance of long-term experiments and
deep measurements when characterizing soil C and N responses to land use change and the remarkable paucity of
such long-term soil data deeper than 30 cm.
Keywords: land use change, loblolly pine, long-term experiment, reforestation, secondary forest development, soil fractionation,
soil nitrogen, soil organic carbon
Received 14 November 2013 and accepted 22 July 2014
Introduction
Old-field secondary forests are thought to sequester
carbon above and below ground, and thus mitigate
anthropogenic carbon emissions. Odum’s (1969) ‘Strat-
egy of Ecosystem Development’ posited that succession
is characterized not only by increasing biomass but also
by accumulations of detrital organic matter (OM).
Through leaching, fragmentation, and bioturbation,
large OM pools on the soil surface (detrital leaf and
woody organic matter) and in the soil profile (dead
roots) might be expected to lead to an increase in sur-
face soil C, but what of deeper soils? Globally, soils are
estimated to store up to 2300 Pg C in the top 3 m
(Jobb�agy & Jackson, 2000), compared to only 600 Pg C
stored in vegetation biomass (Houghton, 2007). Given
the enormous size of the soil C pool, understanding its
sensitivities to management, disturbance, climate, and
vegetation change is critical. Many studies have con-
firmed increases in surficial soil carbon following
revegetation of old fields, with cropland to forest con-
versions resulting in an average of 34 g C m�2 yr�1
increase in soil carbon (Post & Kwon, 2000). Long-term
and deep study of soil is essential to understanding
and managing fertility and carbon sources and sinks
following land use changes like deforestation, reforesta-
tion, and afforestation (Richter et al., 2007).
Although the depth distribution of roots and soil car-
bon differs with plant cover type, more than one third
of roots and more than one half of soil carbon are stored
below 20 cm depth (Jobb�agy & Jackson, 2000), suggest-
ing that land use change may well affect C in subsoils.
Yet despite this distribution of soil carbon and plantCorrespondence: Megan L. Mobley, tel. 307 223 1144, fax 206 208
0404, e-mail: [email protected]
986 © 2014 John Wiley & Sons Ltd
Global Change Biology (2015) 21, 986–996, doi: 10.1111/gcb.12715
Global Change Biology

roots, most studies do not sample soils very deeply. Of
approximately 360 studies included in two reviews on
land use change effects on soil carbon, only 10% sam-
pled more deeply than 30 cm (Post & Kwon, 2000; West
& Post, 2002). Spatial variability and difficulty of sam-
pling make soil a very challenging system to study,
especially when attempting to account for relatively
small temporal concentration changes in large soil vol-
umes (Leuzinger & H€attenschwiler, 2013). However,
studies that have examined soils below 30 cm have
observed strong soil carbon responses to changes in
temperature (Schwendenmann & Veldkamp, 2006),
[CO2] (Iversen et al., 2012), and land use change (Fon-
taine et al., 2004, 2007; Fimmen et al., 2008). Recognition
of the importance of subsoil processes and responses
appears to be growing (Schmidt et al., 2011).
One study uniquely equipped to quantify decadal
change in the upper 60 cm of mineral soil in response
to land use change and management disturbance is the
Calhoun Long-Term Soil-Ecosystem Study (LTSE) in
South Carolina, USA. Here, above- and belowground
ecosystem components have been resampled and soil
samples archived for over 50 years of forest growth
and development on formerly cultivated fields. Based
on observations during the first 40 years of forest
development, previously published work from this
experiment argued that forest development resulted in
large and rapid accumulations of carbon in biomass
and surficial detrital O-horizons, and transfers of nitro-
gen especially from subsoil (35 to 60 cm layer) to bio-
mass and O-horizon (Richter et al., 1999, 2000; Billings
& Richter, 2006). These studies observed relatively
modest increases in OM in 0–7.5 cm soils and signifi-
cant losses of carbon from subsoils at 35–60 cm (Richter
et al., 1999) and attributed losses of subsoil OM to
enhanced decomposition that exceeded rates of OM
inputs (Richter et al., 1999).
Over a decade later, we now appreciate that these
earlier studies captured the initial period of forest
development from establishment through thinning
phases of secondary pine forest development (sensu
Peet & Christensen, 1987), and concluded during peak
biomass and biomass-carbon storage (Mobley, 2011). In
this study, we examine the dynamics of soil C and N
during a later, transition, phase of forest development,
during which overstory pine tree biomass decreased
and, through natural successional processes, the forest
community began to reorganize toward a mixed pine-
hardwood forest.
The objectives of this study were to characterize
changes in soil C and N throughout the development of
this 50-year-old forest, including the transition phase of
forest development from even-aged pine to mixed
pine–hardwood, and to examine the soil fractions
responsible for C and N gains or losses. We used
density fractionation and stable isotopic and radio iso-
topic analysis of soil organic matter to investigate
depth-dependent SOM gains and losses following land
use change and through advanced stages of secondary
forest development. We hypothesized that as above-
ground forest growth slowed and tree mortality
increased, the soil continued to gain C and soil N deple-
tion slowed. As it is considered to be the most ‘active’
OM pool, we expected that light-fraction would be
responsible for most mineral soil C and N changes dur-
ing reforestation and that silt- and clay-associated OM
would be relatively stable over time.
Materials and methods
Site description
The Calhoun LTSE lies within the Sumter National Forest in
the Piedmont of South Carolina, USA. The experimental site is
characterized by gentle slopes (<3%) composed of Cataula ser-
ies soils (fine, kaolinitic, thermic Oxyaquic Kanhapludults).
These granite–gneiss-derived soils (including saprolite) are
approximately 30 m deep over unweathered bedrock (Richter
& Markewitz, 1995; Bacon et al., 2012). Sandy loam or loamy
sand A-horizons (soil solids >75% sand, <10% clay by mass)
range to 30 cm depth atop kaolinite- and sesquioxide-rich B
horizons (47% sand, 38% clay) (Richter & Markewitz, 2001).
The climate is subtropical (Mcknight & Hess, 2008): mean
annual precipitation is 1185 mm; mean annual temperature is
15.2 °C (Union 8S Station, 1977–2006; National Climatic Data
Center, 2008). The field experiment is organized in a random-
ized complete block design, with four blocks each containing
four 0.1 ha plots of different loblolly pine (Pinus taeda L.) tree
spacings (1.8, 2.4, 3.0, 3.7 m). For over 50 years, researchers
have monitored the biogeochemical cycles of the developing
loblolly pine forest – including C, N, P, cations, anions, and
trace elements – through repeated sampling and archiving of
soil and O-horizons and repeated tree biomass inventories
(Richter & Markewitz, 2001).
The Calhoun LTSE is located on land that typifies the agri-
cultural land use history of the southeastern USA Piedmont:
clearing of mixed-hardwood stands by European colonists,
>100 years of cultivation accompanied by soil erosion and
substantial above- and belowground carbon loss, and field
abandonment and replacement with even-aged loblolly pine
by the mid-20th century (Metz, 1958; Richter & Markewitz,
2001). The experimental forest was planted in 1957 in two old
cotton fields, previously limed and fertilized, as part of a US
Forest Service pine productivity and spacing study (Metz,
1958; Balmer et al., 1975; Harms & Lloyd, 1981). Aboveground
ecosystem development at the Calhoun LTSE proceeded typi-
cally for a southeastern USA old-field forest (Billings, 1938;
Coile, 1940; Oosting, 1942). Live pine tree biomass accumu-
lated rapidly during the establishment phase of forest growth
(Peet & Christensen, 1987). Self-thinning of the pines began at
approximately age 20, and woody debris began to accumulate
© 2014 John Wiley & Sons Ltd, Global Change Biology, 21, 986–996
SOIL C AND N UNDER SECONDARY FOREST 987

on the soil surface (Mobley, 2011; Mobley et al., 2013). Starting
at forest age 40 (circa 1997), live tree biomass began to decline
as the forest entered the transition phase of development, in
which growth of the remaining pines and the young hard-
wood understory was insufficient to compensate for the con-
tinued mortality of overstory pine trees (Mobley, 2011). By
2005, the loss of aboveground biomass had slowed (Mobley,
2011).
Soil collection
O-horizon (litter layer only, not including coarse woody detri-
tus) was sampled in the 16 plots in 1992, 1997, and 2005 using
707 cm2 circular samplers. Five samples were composited per
plot. From the 1992 sampling (Urrego, 1993), only site-level
mean organic matter and N masses of O-horizon are available,
not the individual plot estimates, so uncertainties were esti-
mated based on the among-plot CVs of 1997 and 2005 sam-
ples.
Mineral soils were collected at 4- to 8-year intervals in 1962,
1968, 1972, 1977, 1982, 1987, 1990, 1997, and 2005 by collecting
18 to 20 soil cores of 2 cm diameter from within each of 16
plots. Cores were separated into four depth increments
(0–7.5 cm, surface; 7.5–15 cm and 15–35 cm, intermediate; and
35–60 cm, subsoil) and composited into one sample per depth
increment per plot. In 1968, soils were only collected to 15 cm
depth, and in 1990, soil was sampled in 8 of 16 plots.
The Calhoun LTSE does not benefit from a legacy of bulk
density (Db) data; therefore, we report soil C and N contents
using a constant Db over the course of forest development in
the permanent plots. In 2011, extensive Db sampling (n = 128)
across all permanent plots in the Calhoun LTSE indicated that
Db at 0–7.5, 7.5–15, 15–35, and 35–55 cm was 1.22 � 0.06,
1.43 � 0.10, 1.46 � 0.03, and 1.41 � 0.03 g cm�3 (mean � one
standard deviation), respectively (Bacon et al. in preparation).
These estimates are in close agreement with previous esti-
mates for the permanent plots (n = 72 from four soil pits in
the early 1990s; Richter et al., 1994) and an extensive analysis
of Db to a depth of 35 cm under old-field pine ecosystems
across Union County, South Carolina (Dunscomb, 1992). Sim-
ulations of potential Db changes in the permanent plots from
1955 to 2011, and their impact on soil content calculations,
indicate that estimates of C, N, and exchangeable cation con-
tents differ by <10% when calculated with an equivalent soil
mass model (which accounts for changing Db; Ellert & Betta-
ny, 1995; Wendt & Hauser, 2013) and when calculated assum-
ing constant Db (Bacon et al. in prep). We corrected the 1962–
1997 soil C and N changes from Richter et al. (1999, 2000) (pre-
sented in above Site Description) using the updated Db values
from Bacon et al. (in prep).
For bulk soil C and N analyses, air-dried, pulverized soil of
every depth from every plot was analyzed separately. The
number of plots analyzed for bulk soil C and N varied by
year: 13 in 1962; 8 each in 1977, 1982, and 1990; 16 in 1997 and
2005. To minimize use of irreplaceable archived soil samples,
as well as to control analysis costs, isotopic analyses and
fractionations were conducted on composite samples, wherein
soils from 12 plots were combined into one sample per depth
for each sample year. Composited soils from 1962, 1982, and
2005 were used for soil density fractionation. Four plots were
excluded from all composites due to insufficient mass of
remaining sample.
Particle density and size fractionation
Our soil density fractionation protocol was modified from Sol-
lins et al. (2009). A single light-fraction (LF) was defined at
1.85 g cm�3, using a ratio of 20 g soil to 30 ml 1.9 g cm�3
clean (low C and N) sodium polytungstate [SPT;
Na6(H2W12O40); Tungsten Compounds, Grub am Forst, Ger-
many]. The remaining mineral soil was shaken with 30 ml of
sodium hexametaphosphate (HMP; 5 g l�1) at 100 rpm for
2 h, and then rinsed through a 53 lm sieve with 200–350 ml
deionized water, yielding a > 53 lm fraction (sand) and
a < 53 lm fraction (clay + silt; referred to as fine mineral, or
FM, fraction). The rinse solution was captured with the FM
fraction. The three fractions were dried at 60 °C, weighed,
transferred into an agate mortar, and hand-pulverized with a
pestle. The mass of HMP was subtracted from the mass of the
FM fraction.
Overall, soil recovery in the three fractions was excellent,
within 1% of initial bulk soil mass. Masses of soil particle size
components varied among depths according to the mean soil
textures of the site (Table 1), with the fine mineral size fraction
increasing from 15.7% of soil mass at 0–7.5 cm to 54.1% of soil
mass at 35–60 cm, and sand conversely decreasing from 83.2%
of soil mass at 0–7.5 cm to 44.9% of soil mass at 35–60 cm.
Bulk soil samples from individual plots from all sample
years were analyzed for %C and %N on a CE Elantech Flash
EA 1112 Elemental Analyzer (CE Elantech, Inc., Lakewood,
Table 1 Mean masses of three mineral soil components –
light-fraction organic matter (LF, floated at density of
1.85 g cm�3), fine mineral (FM, clay and silt particle size frac-
tion, passed 53 lm sieve), and sand particle size fraction
(retained on 53 lm sieve) – at four soil depths of the Calhoun
LTSE, SC, USA. Coefficients of variation represent variation
among 3 sample years (1962, 1982, and 2005)
Soil Component Depth (cm)
Percent of
initial bulk
soil mass
Coefficient
of Variation
(%)
LF, <1.85 g cm�3 0–7.5 1.07 51
7.5–15 0.52 9.3
15–35 0.23 7.7
35–60 0.088 27
FM, <53 lm 0–7.5 15.7 3.6
7.5–15 17.6 2.8
15–35 28.8 5.2
35–60 54.1 1.5
Sand, >53 lm 0–7.5 83.2 0.20
7.5–15 82.0 0.34
15–35 70.9 1.9
35–60 44.9 3.8
© 2014 John Wiley & Sons Ltd, Global Change Biology, 21, 986–996
988 M. L. MOBLEY et al.
NJ, USA) at Duke University. Composited bulk soils from
1962 to 1997 were analyzed for d15N and d13C on a Finnigan
Delta+ mass spectrometer (Finnigan MAT, Germany) cou-
pled to a Carlo Erba elemental analyzer (NA1500 CHN com-
bustion analyzer; Carlo Erba Strumentazione, Milan) via a
Finnigan Conflo II Interface at the University of Arkansas
Stable Isotope Laboratory in 2005 (Billings & Richter, 2006).
LF and FM soil fractions were analyzed for %C and %N,
and LF and FM fractions plus the 2005 bulk soils were ana-
lyzed for d13C and d15N, with a coupled continuous-flow ele-
mental analyzer isotope ratio mass spectrometer (EA-IRMS)
system coupled to a Carlo Erba model 1108 EA, interfaced
to a Thermo-Finnigan Delta Plus XP IRMS, at the USDA
ARS Regional Facility in Albany, CA. Radiocarbon analysis
on all samples was conducted at the Keck AMS Facility at
University of California-Irvine, with the 1962–1990 samples
analyzed in 1998 (Richter et al., 1999), and 1997–2005 sam-
ples analyzed in 2011. Based on preliminary analysis, sand
size soil fractions were deemed too low in %N to achieve
reliable combustion and element detection, and so were not
further analyzed. To test for effects of analysis date or labo-
ratory on the data, four bulk soil composite samples from
the 2005 stable isotope analysis and two samples from the
1998 radiocarbon analysis were reanalyzed in 2011. Stable
isotope remeasurements were within 1&, and radiocarbon
remeasurements were within 40&.
Statistical analyses
For bulk soil changes at each soil depth over time, we used
two-tailed, paired (by plot) two-sample t-tests comparing 1962
soil C and N values with values from 1997 and 2005 at the four
soil depths and for the 0–60 cm profile (for 1997 and 2005
comparisons: n = 16 for 0–7.5 cm; n = 15 for 7.5–15 cm, 15–
35 cm, and 35–60 cm; n = 13 for 0–60 cm profile).
Results
O-horizon
In the forest’s first 40 years, between 1957 and 1997, it
accrued approximately 13.0 kg C m�2 � 0.44 SE in liv-
ing tree biomass (Richter et al., 1999; Richter & Marke-
witz, 2001). At the same time, O-horizon stocks
accumulated to 3.8 kg C m�2 (� 0.18 SE) by 1997 and
then decreased to 2.7 kg C m�2 (� 0.12) by 2005. O-
horizon N reached 0.073 kg N m�2 (� 0.003) in 1997
(Richter et al., 1999), then decreased to 0.064 kg N m�2
(� 0.003) in 2005. The O-horizon C : N ratio decreased
from the 1997 value of 52.3 (� 1.86; Richter et al., 2000)
to 42.5 (� 1.11) in 2005.
Bulk mineral soil change
The aboveground and O-horizon changes corre-
sponded to depth-dependent changes in mineral soil.
At approximately forest age 40, 32 g DOC m�2 yr�1
� 8.9 washed in to the mineral soil from the O-horizon,
and less than 1.0 g DOC m�2 yr�1 � 0.07 leached out
below 60 cm soil depth (Markewitz et al., 1998). Surface
mineral soil (0–7.5 cm) carbon increased by 103 g
C m�2 � 22.8 over 40 years, or ~4 g m�2 yr�1 (Richter
et al., 1999). Yet over the same time period, sufficient C
was lost from the 35–60 cm depth (442 g C m�2 � 77.3)
to result in a significant net loss of 0–60 cm soil C of
271 g C m�2 � 97.3 (P = 0.0322 in two-tailed, paired
t-test of 1962 vs. 1997 soil C). Over the same 40 years,
the 0–60 cm soil nitrogen pool was significantly
depleted by 83.9 g N m�2 � 7.8 (P < 0.0001 in two-
tailed, paired t-test of 1962 vs. 1997 soil N) as 109 g
N m�2 � 3.7 was translocated to tree biomass and
O-horizons (Richter et al., 2000; Richter & Markewitz,
2001). Billings & Richter (2006) documented associated
and large shifts in d15N in soil organic nitrogen over
this period.
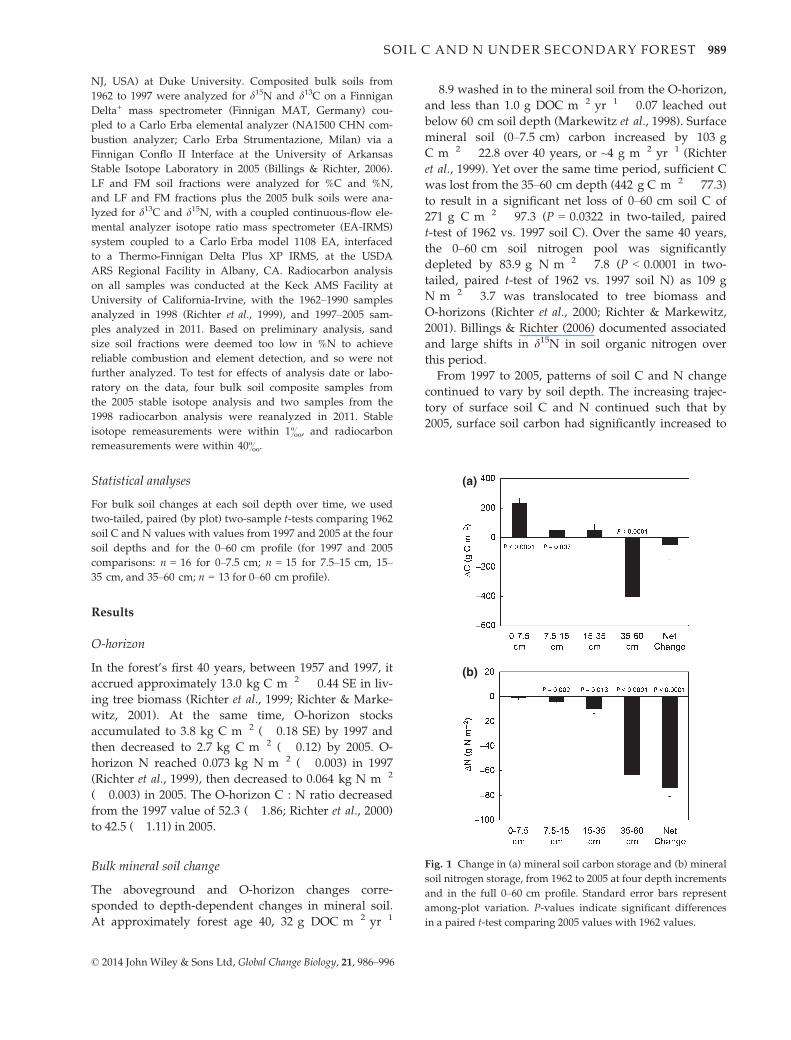
From 1997 to 2005, patterns of soil C and N change
continued to vary by soil depth. The increasing trajec-
tory of surface soil C and N continued such that by
2005, surface soil carbon had significantly increased to
(a)
(b)
Fig. 1 Change in (a) mineral soil carbon storage and (b) mineral
soil nitrogen storage, from 1962 to 2005 at four depth increments
and in the full 0–60 cm profile. Standard error bars represent
among-plot variation. P-values indicate significant differences
in a paired t-test comparing 2005 values with 1962 values.
© 2014 John Wiley & Sons Ltd, Global Change Biology, 21, 986–996
SOIL C AND N UNDER SECONDARY FOREST 989

0.81% C � 0.045 SE (P < 0.0001 in two-tailed, paired
t-test of 1962 vs. 2005 soil C) from the 1962 value of
0.55% C � 0.042 (Fig. 2). Soil C concentrations at
intermediate soil depths changed little from 1997 to
2005 (Fig. 2). On a mass basis, the surface soil gain
(+234 g C m�2 � 33.4) and subsoil carbon loss (�403 g
C m�2 � 69.2) canceled each other (Fig. 1a). Total
0–60 cm SOC storage summed to 3100 g C m�2 � 106
in 2005, compared to 3220 g C m�2 � 184 in 1962.
By 2005, surface soil %N had recovered to 1962 lev-
els, and intermediate-depth soils (7.5–35 cm) nearly so.
Subsoil N concentrations stopped decreasing after
30 years (Richter et al., 2000) and remained steady
through 2005 (Fig. 3). The C : N ratio of the 0–60 cm
bulk soil declined from its 1990 peak of 21.1 � 1.73 SE
to 16.4 � 0.34 by 2005. On a mass basis, there was vir-
tually no net change in surface 0–7.5 cm soil N (�1.1 g
N m�2 � 1.44), but the intermediate depths of 7.5–15 cm and 15–35 cm lost 4.7 � 1.40 and 9.8 � 3.94 g
N m�2, respectively, and the deepest soil sampled lost
63.1 g N m�2 � 4.54 from (Fig. 1b). Overall, the
0–60 cm soils lost 29% of soil N over nearly 50 years,
decreasing from 266 g N m�2 � 11.7 in 1962 to 190 g
N m�2 � 6.1 in 2005.
As the forest grew, pronounced depth-dependent
patterns developed in mineral soil d13C, D14C, and
d15N. Values of d13C were progressively depleted in
surface and intermediate soil layers, approaching val-
ues of pine leaf and root litter (�26.5 to �28.5&; Bill-
ings & Richter, 2006), but were unchanged in subsoils
(Fig. 4; Billings & Richter, 2006). Surface soil D14C val-
ues increased with atmospheric D14CO2 between 1962
and 1968, and did not begin to decrease until after 1990
(Fig. 5; Richter et al., 1999). Surface and intermediate-
depth soils remained greatly enriched above 1962 D14C
levels through 1997. Subsoil D14C increased to 50& in
Fig. 2 Change in bulk mean mineral soil carbon concentrations
at four depth increments during old-field forest development at
the Calhoun LTSE, SC, USA, updated from Richter et al. (1999;
previously published data encompassed in gray shading). Stan-
dard error bars indicate among-plot variation. Asterisks indicate
significant differences between 1962 and 2005 in paired t-tests.
Fig. 3 Change in bulk mineral soil nitrogen concentrations at
four depth increments during old-field forest development at
the Calhoun LTSE, SC, USA, updated from [Richter et al. (2000);
previously published data encompassed in gray shading]. Stan-
dard errors represent among-plot variation. Asterisks indicate
significant differences between 1962 and 2005 in paired t-tests.
Fig. 4 Change in bulk mineral soil organic matter d13C signa-
tures of four depth increments during old-field forest develop-
ment at the Calhoun LTSE, SC, USA, updated from [Billings &
Richter (2006); previously published data encompassed in light
gray shading]. Value for 2005 35–60 cm was excluded during
quality control.
© 2014 John Wiley & Sons Ltd, Global Change Biology, 21, 986–996
990 M. L. MOBLEY et al.

1972 and then decreased to its initial 1962 value of
150& by 1997. Values of d15N were unchanged in sur-
face soils, with progressively larger enrichments from
surface to subsoils (Fig. 6; Billings & Richter, 2006).
After 1997, there was little change in soil d13C, D14C, or
d15N (Figs 4, 5 and 6).
Soil fraction change: C and N
Light-fraction organic matter (LFOM) quantity and
change were largest in surface soils. Across the three
sample years subject to fractionation (1962, 1982, and
2005), LFOM averaged 1.3% of soil mass in surface soil,
decreasing with depth to <0.1% of soil mass at 35–60cm (Table 1). From 1962 to 2005, LFOM in surface soils
increased from 0.8 to 1.7% of soil mass (data not
shown). As a result, light-fraction carbon (LFC) dou-
bled in surface soils from 1962 to 2005, from 2.4 mg
C g�1 soil to 4.8 mg g�1 (Fig. 7). Light-fraction carbon
accumulations at other depths were of smaller magni-
tudes. Fine mineral-associated carbon (FMC) varied lit-
tle among depths, ranging from 1 to 2 mg C g�1. FMC
did fluctuate over time: from 1962 to 1982, FMC
decreased by 0.2–0.4 mg C g�1 soil in each of the soil
depths. From 1982 to 2005, 0–35 cm soils recovered to
near-1962 levels, while 35–60 cm FMC mass remained
relatively unchanged. Thus, over the full measurement
period of 1962–2005, 35–60 cm subsoils lost 0.3 mg
FMC g�1 soil, or 15% of 1962 subsoil FMC.
Nitrogen in soil fractions varied with depth and over
time. Like total LFOM, LFN decreased with soil depth.
Although light-fraction N (LFN) did not change at any
depth from 1962 to 1982, a surface LFN increase from
Fig. 5 Trend of bomb-14C incorporation into four mineral soil
depth increments at the Calhoun LTSE, SC, USA, updated from
[Richter et al. (1999); previously published data encompassed in
gray shading]. The dark gray line indicates atmospheric 14C sig-
nature (Levin & Kromer, 2004). Inset shows full extent of atmo-
spheric 14C bomb spike.
Fig. 6 Change in bulk mineral soil organic matter d15N signa-
tures of four depth increments during old-field forest develop-
ment at the Calhoun LTSE, SC, USA, updated from [Billings &
Richter (2006); previously published data encompassed in gray
shading].
(a) (c)
(b) (d)
Fig. 7 Trends in masses of C and N of two soil fractions and
four soil depths over 43 years of resampling at the Calhoun
LTSE, SC, USA. Left panels show trends in C content and right
panels show trends in N content. The solid black line represents
0–7.5 cm soils, and the lines become steadily more broken with
deeper soil depth. Top panels (a) and (b) show trends in light-
fraction C and N (LFC, LFN) over time; bottom panels (c) and
(d) show trends in fine mineral-associated C and N (FMC,
FMN).
© 2014 John Wiley & Sons Ltd, Global Change Biology, 21, 986–996
SOIL C AND N UNDER SECONDARY FOREST 991
1982 to 2005 resulted in 50% gain of 0.05 mg N g�1 in
surface soil over 43 years (Fig. 7). LF C : N ratios
increased from 1962 to 1982 at all depths, and were lit-
tle changed from 1982 to 2005 (Table S1). From 1962 to
1982, 0.02–0.05 mg FMN per g soil was lost from each
depth. From 1982 to 2005, 0.08 mg FMN g�1 soil was
replaced in the surface and intermediate soil layers,
approximately half of the initial loss. Fine mineral-asso-
ciated N (FMN) depletion in subsoil amounted to
0.03 mg N g�1 soil, or 15% of 1962 levels. FMN losses
from the 0–60 cm soil profile amounted to 12% of 1962
FMN. FM C : N ratios at 0–15 cm increased from 1962
to 1982, and then were unchanged from 1982 to 2005
(Table S1). FM C : N at 15–60 cm was unchanged over
the measurement period.
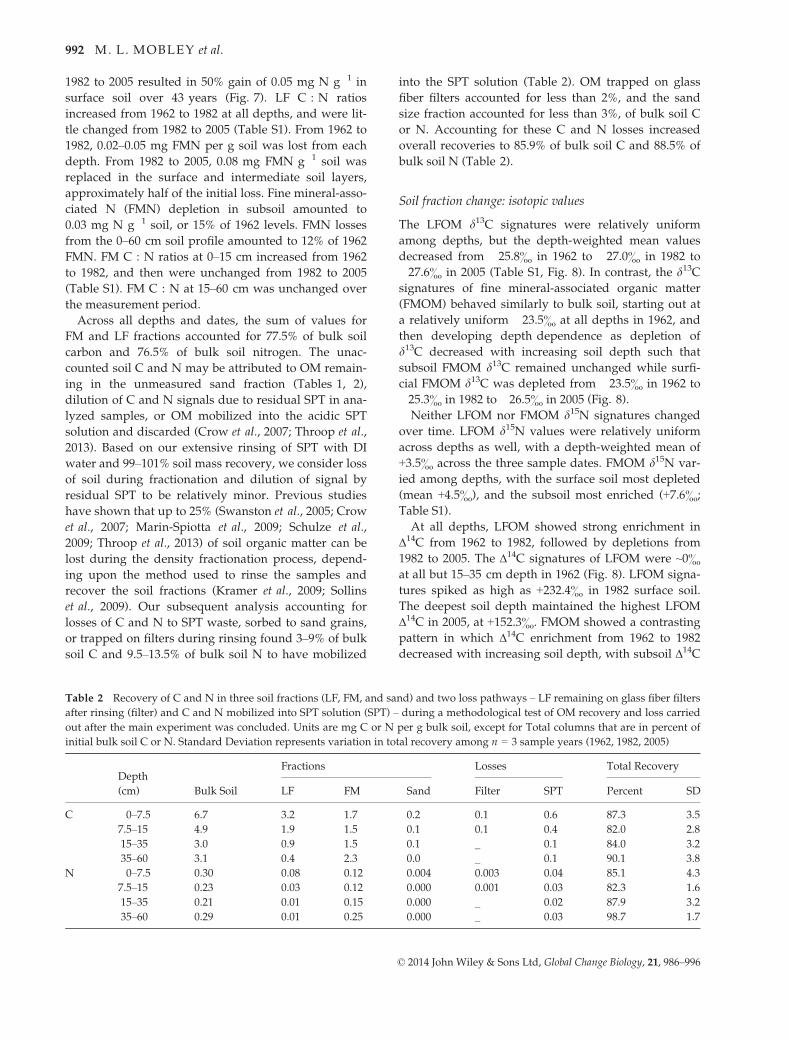
Across all depths and dates, the sum of values for
FM and LF fractions accounted for 77.5% of bulk soil
carbon and 76.5% of bulk soil nitrogen. The unac-
counted soil C and N may be attributed to OM remain-
ing in the unmeasured sand fraction (Tables 1, 2),
dilution of C and N signals due to residual SPT in ana-
lyzed samples, or OM mobilized into the acidic SPT
solution and discarded (Crow et al., 2007; Throop et al.,
2013). Based on our extensive rinsing of SPT with DI
water and 99–101% soil mass recovery, we consider loss
of soil during fractionation and dilution of signal by
residual SPT to be relatively minor. Previous studies
have shown that up to 25% (Swanston et al., 2005; Crow
et al., 2007; Marin-Spiotta et al., 2009; Schulze et al.,
2009; Throop et al., 2013) of soil organic matter can be
lost during the density fractionation process, depend-
ing upon the method used to rinse the samples and
recover the soil fractions (Kramer et al., 2009; Sollins
et al., 2009). Our subsequent analysis accounting for
losses of C and N to SPT waste, sorbed to sand grains,
or trapped on filters during rinsing found 3–9% of bulk
soil C and 9.5–13.5% of bulk soil N to have mobilized
into the SPT solution (Table 2). OM trapped on glass
fiber filters accounted for less than 2%, and the sand
size fraction accounted for less than 3%, of bulk soil C
or N. Accounting for these C and N losses increased
overall recoveries to 85.9% of bulk soil C and 88.5% of
bulk soil N (Table 2).
Soil fraction change: isotopic values
The LFOM d13C signatures were relatively uniform
among depths, but the depth-weighted mean values
decreased from �25.8& in 1962 to �27.0& in 1982 to
�27.6& in 2005 (Table S1, Fig. 8). In contrast, the d13Csignatures of fine mineral-associated organic matter
(FMOM) behaved similarly to bulk soil, starting out at
a relatively uniform �23.5& at all depths in 1962, and
then developing depth dependence as depletion of
d13C decreased with increasing soil depth such that
subsoil FMOM d13C remained unchanged while surfi-
cial FMOM d13C was depleted from �23.5& in 1962 to
�25.3& in 1982 to �26.5& in 2005 (Fig. 8).
Neither LFOM nor FMOM d15N signatures changed
over time. LFOM d15N values were relatively uniform
across depths as well, with a depth-weighted mean of
+3.5& across the three sample dates. FMOM d15N var-
ied among depths, with the surface soil most depleted
(mean +4.5&), and the subsoil most enriched (+7.6&;
Table S1).
At all depths, LFOM showed strong enrichment in
Δ14C from 1962 to 1982, followed by depletions from
1982 to 2005. The Δ14C signatures of LFOM were ~0&at all but 15–35 cm depth in 1962 (Fig. 8). LFOM signa-
tures spiked as high as +232.4& in 1982 surface soil.
The deepest soil depth maintained the highest LFOM
Δ14C in 2005, at +152.3&. FMOM showed a contrasting
pattern in which Δ14C enrichment from 1962 to 1982
decreased with increasing soil depth, with subsoil Δ14C
Table 2 Recovery of C and N in three soil fractions (LF, FM, and sand) and two loss pathways – LF remaining on glass fiber filters
after rinsing (filter) and C and N mobilized into SPT solution (SPT) – during a methodological test of OM recovery and loss carried
out after the main experiment was concluded. Units are mg C or N per g bulk soil, except for Total columns that are in percent of
initial bulk soil C or N. Standard Deviation represents variation in total recovery among n = 3 sample years (1962, 1982, 2005)
Depth
(cm) Bulk Soil
Fractions Losses Total Recovery
LF FM Sand Filter SPT Percent SD
C 0–7.5 6.7 3.2 1.7 0.2 0.1 0.6 87.3 3.5
7.5–15 4.9 1.9 1.5 0.1 0.1 0.4 82.0 2.8
15–35 3.0 0.9 1.5 0.1 _ 0.1 84.0 3.2
35–60 3.1 0.4 2.3 0.0 _ 0.1 90.1 3.8
N 0–7.5 0.30 0.08 0.12 0.004 0.003 0.04 85.1 4.3
7.5–15 0.23 0.03 0.12 0.000 0.001 0.03 82.3 1.6
15–35 0.21 0.01 0.15 0.000 _ 0.02 87.9 3.2
35–60 0.29 0.01 0.25 0.000 _ 0.03 98.7 1.7
© 2014 John Wiley & Sons Ltd, Global Change Biology, 21, 986–996
992 M. L. MOBLEY et al.

remaining relatively unchanged at < �142& (Fig. 8).
FMOM Δ14C was relatively unchanged at all depths
from 1982 to 2005.
Discussion
Depth dependent forest development effects on soilorganic matter
Aboveground changes in forest biomass strongly
impacted belowground C and N cycling. Over the first
40 years, the forest progressed through the establish-
ment and thinning development phases, rapidly accu-
mulating tree biomass (Peet & Christensen, 1987). This
rapid tree growth accumulated substantial biomass C
and N, and was accompanied by dramatic changes in
soil C and N pool size and depth distributions. After an
initial lag period of approximately 20 years, surface
mineral soils gained SOC steadily, while the subsoil
lost C (Richter et al., 1999). Also in the first 40 years,
the forest translocated 31.5% of mineral soil N to above-
ground pools, with most of that N coming from
35–60 cm subsoil layer (Richter et al., 2000).When forest
biomass peaked in the mid-1990s, the forest entered the
transition phase of development, characterized by large
accumulations of coarse woody detritus as overstory
trees died and live biomass accumulation slowed
(Mobley, 2011; Mobley et al., 2013). This work shows
that as biomass demand for mineral soil N decreased,
subsoil N stabilized and even began to increase; subsoil
C concentrations also stabilized during this time
(Figs 2, 3). After 48 years of secondary forest develop-
ment through the establishment, thinning, and transi-
tion phases, we estimate the net change in 0–60 cm
mineral SOC to be zero.
Fractionation of archived soils allowed us to examine
these patterns of C and N gain and loss in more detail.
Light-fraction C and N were quite dynamic in surface
soils, losing C and N initially, and then gaining large
quantities of C and N later in forest development
(Fig. 7). Almost the entire gain in bulk surface soil C
was due to accumulation of light-fraction OM (Table
S1). We observe that subsoil N losses during early for-
est development were largely from subsoil fine mineral
OM. Although we could not assign all of the subsoil C
loss to a measured soil fraction, at least some of the loss
was from the fine mineral fraction, and there was no
evidence of loss from the subsoil light-fraction.
In the decade following peak biomass, surface soils
have continued to gain considerable C and N while
subsoil C and N pools remained largely unchanged.
Values of d13C for the surface bulk soils in direct con-
tact with the O-horizon continue to decline toward val-
ues of fresh pine litter (�29&), while subsoil d13Cvalues have remained little altered over time, averaging
�24.6& (Fig. 4; Billings & Richter, 2006). The d15Nvalue of subsoil OM has also stabilized, after increasing
from <2& to > 8& over the first 35 years due to frac-
tionating uptake by mycorrhizal pine root systems (Bill-
ings & Richter, 2006). Immediately after the D14C of
atmospheric CO2 peaked in 1964, surface soil D14C val-
ues leapt to 240&; steady soil D14C values through 1990
indicated that this 14C-labeled SOM was retained over
that time. On the other hand, the spike in D14C value of
SOM between 7.5 and 60 cm followed within a decade
of the atmospheric peak, but this elevated D14C was
transient at depth, demonstrating relatively rapid
decomposition. These patterns probably reflect the
large depth-dependent differences in fine root turnover
(Gaudinski et al., 2001) and in mass of 14C incorpo-
rated.
Isotopic signatures of LFOM showed incorporation
of pine-derived C into LF at all depths (Fig. 8). Depth-
dependent patterns of FMOM d13C and D14C indicated
that pine-derived C was incorporated into mineral
associations in surface soils where C inputs are highest,
despite low concentrations of reactive minerals, but not
in deeper soils where reactive minerals are more abun-
(a) (c)
(b) (d)
Fig. 8 Carbon stable isotopic and radio isotopic signatures of
two soil fractions and four soil depths during forest develop-
ment at the Calhoun LTSE, SC, USA. Left panels (a) and (c)
show d13C signatures; (b) and (d) show D14C signatures on the
right. Top panels (a) and (b) show trends in light-fraction OM
(LFOM). Bottom panels (c) and (d) show trends in fine mineral-
associated OM (FMOM). The solid black line represents the sur-
face 0–7.5 cm soils, and the lines become steadily more broken
with deeper soil depth. The gray line in (b) and (d) shows atmo-
spheric D14C signature (Levin & Kromer, 2004).
© 2014 John Wiley & Sons Ltd, Global Change Biology, 21, 986–996
SOIL C AND N UNDER SECONDARY FOREST 993

dant (Richter et al., 2006; Li et al., 2008; Li, 2009; Mob-
ley, 2011).
Mechanisms of depth dependent soil C gains and losses
Inputs and decomposition have shifted nonlinearly
over time since reforestation. An initial loss of surface
0–7.5 cm SOC implies that decomposition outpaced
inputs in the early years of reforestation. After approxi-
mately 20 years, inputs to surface soils finally exceeded
decomposition and surface mineral SOC began to accu-
mulate. The lag time was even longer at depth: 35–60 cm subsoil C did not stabilize until 40 years after
reforestation. Surface 0–7.5 cm mineral soils continue
on a trajectory of steady increase at 10.4 g C m�2 yr�1,
and show no sign of slowing. The subsoil C pool is cur-
rently stable, and its future trajectory an open question.
In subsoils at 35–60-cm, the coincident patterns of
SOC depletion, large removals of N, and the shifts in C
and N isotopic signatures, all during the period of
aboveground biomass accumulation and decline, raise
several possibilities about mechanisms that may link
these patterns. Considerable SOC losses despite root C
inputs suggest root-induced mechanisms for SOM loss,
wherein physical or chemical effects of tree roots
resulted in loss of subsoil OM (Cheng & Kuzyakov,
2005). One potential mechanism is a drying effect
(Cheng & Kuzyakov, 2005), by which the conversion of
a relatively shallow-rooted agricultural ecosystem to a
more deeply rooted forest with greatly elevated tran-
spiration exposed subsoil OM and microbes to
increased aeration, increased variability in soil mois-
ture, and an overall reduction in soil moisture (Richter
et al., 1999; Cheng & Kuzyakov, 2005). This may have
increased microbial turnover and decomposition rates
(Cheng & Kuzyakov, 2005). Additional root effects that
may have influenced subsoil C include the priming
mechanisms of preferential substrate utilization or
microbial activation (Cheng & Kuzyakov, 2005). Prefer-
ential substrate utilization results when soil microbes
prefer nutrient-rich soil organic matter to nutrient-poor
rhizosphere C when nutrients are limiting. In the
case of microbial activation, labile root C inputs may
have stimulated rhizosphere microbial communities
directly or indirectly, increasing decomposition of
SOM, all under more aerobic environments than under
cultivation.
Ecosystem and laboratory studies have shown
increased fluxes of belowground carbon to result in
both soil carbon loss (Fontaine et al., 2004, 2007; Fon-
taine & Barot, 2005; Carney et al., 2007) and increased
uptake of N by plants (Dijkstra et al., 2009; Drake et al.,
2011). Priming of soil C decomposition due to enhanced
N demand is a phenomenon that has come to be
appreciated in recent elevated-CO2 studies (Carney
et al., 2007; Drake et al., 2011). A conceptually similar
pattern was observed by Billings & Ziegler (2008),
where incubations of Duke FACE soils showed increas-
ing C losses to microbial respiration with increasing
N limitation. In this study, we find evidence for sub-
stantial modern C inputs to depth, which are not being
incorporated into stable fractions, and we have clear
evidence of high demand for soil N. The spatial linkage
between the soil C and soil N changes further supports
drying and priming hypotheses for soil C loss.
Implications for reforestation and afforestation
A recent inventory of the world’s long-term soil experi-
ments observed that less than 10% examined effects of
land use change on forests, and also that continents
(e.g., South America and Africa) and soils (e.g., Oxisols,
Ultisols) undergoing large-scale land use transitions
had notably few long-term soil change studies (Richter
& Yaalon, 2012). Our study of five decades of reforesta-
tion of a subtropical-climate forest after over a century
of agricultural use provides important empirically
based insight into soil changes that may accompany
ongoing reforestation and afforestation activities in sub-
tropical and tropical regions of the world. Laganiere
et al. (2010) suggested that SOC response to re- and
afforestation at subtropical sites (like the Calhoun LTSE)
was more similar to that of tropical sites than to other
temperate zone sites. As Shi et al. (2013) have shown
soils in the tropics to be more prone to losing SOC with
reforestation or afforestation, it may be that highly
weathered, nutrient-poor soils are particularly prone to
root-induced SOM losses during forest establishment.
Our study underlines the importance of the O-hori-
zon to estimates of SOC change following field to forest
land use change (Laganiere et al., 2010; Poeplau et al.,
2011; B�arcena et al., 2014). Whereas recent meta-analy-
ses have suggested that the O-horizon accounts for 29–47% of total SOC increase on timescales from 22 to
100 years (Laganiere et al., 2010; Poeplau et al., 2011;
Shi et al., 2013), our long-term observations show
O-horizon to be even more important, contributing 89%
of SOC change in the top 30 cm, or 100% if the 35–60 cm
depth and its SOC loss are included. The O-horizon also
served as a reservoir for 82% of the N removed from the
mineral soil by the forest between 1962 and 2005.
The O-horizon SOM pool is, of course, relatively sus-
ceptible to recirculation and loss due to disturbance,
and thus its C and N storage is likely to be of shorter
duration than that of mineral soil. It is important to
note that changes to O-horizon inputs or pool size also
cascade into mineral soils. Another long-term study
found that removal of the O-horizon for 50 years
© 2014 John Wiley & Sons Ltd, Global Change Biology, 21, 986–996
994 M. L. MOBLEY et al.
caused losses of mineral soil C in both light and min-
eral-associated fractions, whereas litter addition
increased mineral soil C in light-fraction only (Lajtha
et al., 2014). Both of these long-term studies suggest
that disturbances or land use changes that reduce
organic matter inputs, even temporarily, result in rapid
mineral SOC losses that are very slow to recover after
inputs resume.
Our study clearly demonstrates that the subsoil is
dynamic and ecologically relevant on decadal time-
scales. At the Calhoun LTSE, the result is that nearly
50 years of SOC gains in the surficial mineral soils are
canceled by mineral subsoil C losses. Furthermore, our
understanding of soil N dynamics also depends on
depth of sampling. Looking only to 35 cm depth, we
would have observed that organic and mineral soils
had gained 49.2 g N m�2, a 39% increase, by 2005, and
might have speculated that N deposition or fixation
was responsible. Looking to 60 cm, however, we
observed a 5% net loss of 14.1 g N m�2 from 0 to 60 cm
mineral soil, which when compared to our estimate of
tree biomass N accumulation of 25.9 g N m�2, or 10%
of 1962 0–60 cm soil N, indicates a much tighter ecosys-
tem N cycle. Shallow sampling may explain unac-
counted soil N increases with reforestation in other
studies as well (Li et al., 2012).
Conclusions on SOM response to forest development
Long-term monitoring of soil organic matter down to
60 cm tells a fundamentally important story of soil C
and N dynamics, and even still we find questions
regarding the biogeochemistry of the soil and the eco-
system as a whole. We propose that land use change
from field to forest drove a cascade of changes through
the ecosystem and soil profile that enhanced microbial
activity and SOC decomposition in subsoils. These
changes include drying effects, wherein tree rooting
and transpiration increased the oxygenation of subsoils
and accelerated decomposition of pre-existing SOM.
Preferential substrate utilization may also be at work as
strong N demand by tree roots spurred degradation of
relatively nutrient-rich SOM, perhaps with energy pro-
vided by root-derived C (Cheng & Kuzyakov, 2005).
The establishment and thinning phases of forest
development were particularly taxing on soil C and N
pools, especially in subsoils where removals exceeded
new inputs. Yet when aboveground biomass accumula-
tion slowed and the forest began to transition from
even-aged pine to mixed pine–hardwood stands with
lower biomass, subsoil C and N finally stabilized. It will
be important to observe these soils’ depth dependent
trajectories over future decades of forest development.
After five decades of observation, we find some
support for Odum’s predictions of increasing OM with
forest development in O-horizons, but only in the most
surficial of mineral soils, and not yet for subsoils. It is
very clear from these results that the full soil profile is a
highly dynamic component of the ecosystem, with pro-
nounced depth dependent processing of OM, such that
accumulations and losses of carbon above ground are
on different temporal trajectories than changes below
ground.
Acknowledgements
We thank D Bell, E Bernhardt, S Billings, N Christensen, DMarkewitz, and the UW Postdoc Women’s Writing Group (SKim, T Johnson, J Zelikova), and two anonymous reviewersfor comments and encouragement on the manuscript. Thefollowing grant and fellowship programs provided funding forthis research: National Science Foundation Doctoral Disserta-tion Improvement Grant DEB-1011186 to DD Richter and MLMobley, National Science Foundation Ecosystems Grant DEB-0717368 to DD Richter, National Science Foundation CZO GrantEAR-1331846 James B. Duke Fellowship, E. Bayard HalsteadFellowship, Duke University Graduate School, Duke Program inEcology, and Nicholas School of the Environment. K Townsendand J Wig helped with method development, and D Cass pro-vided laboratory assistance.
References
Bacon AR, Richter DD, Bierman PR, Rood DH (2012) Coupling meteoric 10Be with
pedogenic losses of 9Be to improve soil residence time estimates on an ancient
North American interfluve. Geology, 40, 847–850.
Balmer WE, Owens EG, Jorgenson JR (1975) Effects of Various Spacings on Loblolly Pine
Growth 15 Years After Planting. Research Note SE-211. USDA Forest Service, South-
eastern Forest Experiment Station,Asheville, NC, USA.
B�arcena TG, Kiær LP, Vesterdal L, Stef�ansd�ottir HM, Gundersen P, Sigurdsson BD
(2014) Soil carbon stock change following afforestation in Northern Europe: a
meta-analysis. Global Change Biology, 20, 2393–2405.
Billings WD (1938) The structure and development of old field shortleaf pine stands
and certain associated physical properties of the soil. Ecological Monographs, 8,
437–500.
Billings SA, Richter DD (2006) Changes in stable isotopic signatures of soil nitrogen
and carbon during 40 years of forest development. Oecologia, 148, 325–333.
Billings SA, Ziegler SE (2008) Altered patterns of soil carbon substrate usage and het-
erotrophic respiration in a pine forest with elevated CO2 and N fertilization. Global
Change Biology, 14, 1025–1036.
Carney KM, Hungate BA, Drake BG, Megonigal JP (2007) Altered soil microbial com-
munity at elevated CO2 leads to loss of soil carbon. Proceedings of the National Acad-
emy of Sciences of the United States of America, 104, 4990–4995.
Cheng W, Kuzyakov Y (2005) Root effects on soil organic matter decomposition. In:
Roots and Soil Management: Interactions Between Roots and the Soil (eds Wright SF,
Zobel RW), pp. 119–143. American Society of Agronomy: Crop Science Society of
America Soil Science Society of America: Madison, Wisconsin, USA.
Coile TS (1940) Soil changes associated with loblolly pine succession on abandoned
agricultural land of the Piedmont Plateau. Duke University School of Forestry Bulle-
tin, 5, 1–85.
Crow S, Swanston C, Lajtha K, Brooks J, Keirstead H (2007) Density fractionation of
forest soils: methodological questions and interpretation of incubation results and
turnover time in an ecosystem context. Biogeochemistry, 85, 69–90.
Dijkstra FA, Bader NE, Johnson DW, Cheng W (2009) Does accelerated soil organic
matter decomposition in the presence of plants increase plant N availability? Soil
Biology and Biochemistry, 41, 1080–1087.
Drake JE, Gallet-Budynek A, Hofmockel KS et al. (2011) Increases in the flux of car-
bon belowground stimulate nitrogen uptake and sustain the long-term enhance-
ment of forest productivity under elevated CO2. Ecology Letters, 14, 349–357.
© 2014 John Wiley & Sons Ltd, Global Change Biology, 21, 986–996
SOIL C AND N UNDER SECONDARY FOREST 995

Dunscomb J (1992) Effects of Land Use on Organic Matter in some Piedmont Soils.
Unpublished Masters Project Duke University, Durham, NC, USA.
Ellert BH, Bettany JR (1995) Calculation of organic matter and nutrients stored in soils
undercontrastingmanagementregimes.CanadianJournalofSoilScience,75, 529–538.
Fimmen R, Richter DD, Vasudevan D, Williams MA, West LT (2008) Rhizogenic Fe-C
redox cycling: a hypothetical biogeochemical mechanism that drives crustal
weathering in upland soils. Biogeochemistry, 87, 127–141.
Fontaine S, Barot S (2005) Size and functional diversity of microbe populations con-
trol plant persistence and long-term soil carbon accumulation. Ecology Letters, 8,
1075–1087.
Fontaine S, Bardoux G, Abbadie L, Mariotti A (2004) Carbon input to soil may
decrease soil carbon content. Ecology Letters, 7, 314–320.
Fontaine S, Barot S, Barre P, Bdioui N, Mary B, Rumpel C (2007) Stability of organic
carbon in deep soil layers controlled by fresh carbon supply. Nature, 450, 277–280.
Gaudinski J, Trumbore S, Davidson E, Cook A, Markewitz D, Richter D (2001) The
age of fine-root carbon in three forests of the eastern United States measured by
radiocarbon. Oecologia, 129, 420–429.
Harms WR, Lloyd FT (1981) Stand structure and yield relationships in a 20-Year-Old
loblolly pine spacing study. Southern Journal of Applied Forestry, 5, 162–166.
Houghton RA (2007) Balancing the global carbon budget. Annual Review of Earth and
Planetary Sciences, 35, 313–347.
Iversen CM, Keller JK, Garten CT, Norby RJ (2012) Soil carbon and nitrogen cycling
and storage throughout the soil profile in a sweetgum plantation after 11 years of
CO2-enrichment. Global Change Biology, 18, 1684–1697.
Jobb�agy E, Jackson R (2000) The vertical distribution of soil organic carbon and its
relation to climate and vegetation. Ecological Applications, 10, 423–436.
Kramer M, Lajtha K, Thomas G, Sollins P (2009) Contamination effects on soil density
fractions from high N or C content sodium polytungstate. Biogeochemistry, 92, 177–
181.
Laganiere J, Angers DA, Pare D (2010) Carbon accumulation in agricultural soils after
afforestation: a meta-analysis. Global Change Biology, 16, 439–453.
Lajtha K, Townsend K, Kramer M, Swanston C, Bowden R, Nadelhoffer K (2014)
Changes to particulate versus mineral-associated soil carbon after 50 years of litter
manipulation in forest and prairie experimental ecosystems. Biogeochemistry, 119,
341–360.
Leuzinger S, H€attenschwiler S (2013) Beyond global change: lessons from 25 years of
CO2 research. Oecologia, 171, 639–651.
Levin I, Kromer B (2004) The tropospheric 14CO2 level in mid-latitudes of the North-
ern hemisphere (1959–2003). Radiocarbon, 46, 1261–1272.
Li J (2009) Effects of Land-Use History on Soil Macro- and Trace Elements in the Pied-
mont of Southeastern North America. Unpublished PhD Duke University, Dur-
ham, NC, USA. 140 pp.
Li J, Richter DD, Mendoza A, Heine PR (2008) Four-decade responses of soil trace ele-
ments to an aggrading old-field forest: B, Mn, Zn, Cu and Fe. Ecology, 89, 2911–
2923.
Li D, Niu S, Luo Y (2012) Global patterns of the dynamics of soil carbon and nitrogen
stocks following afforestation: a meta-analysis. New Phytologist, 195, 172–181.
Marin-Spiotta E, Silver WL, Swanston CW, Ostertag R (2009) Soil organic matter
dynamics during 80 years of reforestation of tropical pastures. Global Change Biol-
ogy, 15, 1584–1597.
Markewitz D, Richter DD, Allen HL, Urrego JB (1998) Three decades of observed soil
acidification in the Calhoun Experimental Forest: has acid rain made a difference?
Soil Science Society of America Journal, 62, 1428.
Mcknight TL, Hess D (2008) Climatic zones and types. In: Physical Geography: A Land-
scape Appreciation. (eds Mcknight TL, Hess D), pp. 210. Pearson Prentice Hall,
Upper Saddle River, NJ, USA.
Metz LJ (1958) The Calhoun Experimental Forest. US Department of Agriculture Forest
Service, Asheville, NC, USA.
Mobley ML (2011) An ecosystem approach to dead plant carbon over 50 years of old-
field forest development. Unpublished Ph.D. 3490348, Duke University, Durham,
NC, USA.
Mobley ML, Richter DD, Heine P (2013) Accumulation and decay of woody detritus
in a humid subtropical secondary pine forest. Canadian Journal of Forest Research,
43, 109–118.
National Climatic Data Center (2008) Station Union 8S, Coop ID 388786. Available at:
http://cdo.ncdc.noaa.gov/ancsum/ACS?coban=38878699999 (accessed 29 Octo-
ber 2008).
Odum EP (1969) The strategy of ecosystem development. Science, 164, 262–270.
Oosting HJ (1942) An ecological analysis of the plant communities of piedmont,
North Carolina. American Midland Naturalist, 28, 1–126.
Peet RK, Christensen NL (1987) Competition and tree death. BioScience, 37, 586–595.
Poeplau C, Don A, Vesterdal L, Leifeld J, Van Wesemael BaS, Schumacher J, Gensior
A (2011) Temporal dynamics of soil organic carbon after land-use change in the
temperate zone – carbon response functions as a model approach. Global Change
Biology, 17, 2415–2427.
Post WM, Kwon KC (2000) Soil carbon sequestration and land-use change: processes
and potential. Global Change Biology, 6, 317–327.
Richter DD, Markewitz D (1995) How deep is soil? BioScience, 45, 600–609.
Richter DD Jr, Markewitz D (2001) Understanding Soil Change. United Kingdom, Cam-
bridge University Press, Cambridge.
Richter DD, Yaalon DH (2012) ‘The changing model of soil’ revisited. Soil Science Soci-
ety of America Journal, 76, 766–778.
Richter DD, Markewitz D, Wells CG, Allen HL, April R, Heine PR, Urrego B (1994)
Soil chemical change during three decades in an old-field loblolly pine (Pinus taeda
L.) ecosystem. Ecology, 75, 1463.
Richter DD, Markewitz D, Trumbore SE, Wells CG (1999) Rapid accumulation and
turnover of soil carbon in a re-establishing forest. Nature, 400, 56–58.
Richter DD, Markewitz D, Heine PR, Jin V, Raikes J, Tian K, Wells CG (2000) Legacies
of agriculture and forest regrowth in the nitrogen of old-field soils. Forest Ecology
and Management, 138, 233–248.
Richter D, Allen H, Li J, Markewitz D, Raikes J (2006) Bioavailability of slowly cycling
soil phosphorus: major restructuring of soil P fractions over four decades in an ag-
grading forest. Oecologia, 150, 259–271.
Richter DD Jr, Hofmockel M, Callaham MA Jr, Powlson DS, Smith P (2007) Long-term
soil experiments: keys to managing Earth’s rapidly changing ecosystems. Soil Sci-
ence Society of America Journal, 71, 266–279.
Schmidt MWI, Torn MS, Abiven S et al. (2011) Persistence of soil organic matter as an
ecosystem property. Nature, 478, 49–56.
Schulze K, Borken W, Muhr J, Matzner E (2009) Stock, turnover time and accumula-
tion of organic matter in bulk and density fractions of a Podzol soil. European Jour-
nal of Soil Science, 60, 567–577.
Schwendenmann L, Veldkamp E (2006) Long-term CO2 production from deeply
weathered soils of a tropical rain forest: evidence for a potential positive feedback
to climate warming. Global Change Biology, 12, 1878–1893.
Shi S, Zhang W, Zhang P, Yu Y, Ding F (2013) A synthesis of change in deep soil
organic carbon stores with afforestation of agricultural soils. Forest Ecology and
Management, 296, 53–63.
Sollins P, Kramer M, Swanston C et al. (2009) Sequential density fractionation across
soils of contrasting mineralogy: evidence for both microbial- and mineral-con-
trolled soil organic matter stabilization. Biogeochemistry, 96, 209–231.
Swanston CW, Torn MS, Hanson PJ, Southon JR, Garten CT, Hanlon EM, Ganio L
(2005) Initial characterization of processes of soil carbon stabilization using forest
stand-level radiocarbon enrichment. Geoderma, 128, 52–62.
Throop H, Lajtha K, Kramer M (2013) Density fractionation and 13C reveal changes in
soil carbon following woody encroachment in a desert ecosystem. Biogeochemistry,
112, 409–422.
Urrego JB (1993) Nutrient accumulation in biomass and forest floor of a 34-year-old
loblolly pine plantation. Unpublished Master of Science North Carolina State Uni-
versity, Raleigh, NC, USA. 32 pp.
Wendt JW, Hauser S (2013) An equivalent soil mass procedure for monitoring
soil organic carbon in multiple soil layers. European Journal of Soil Science, 64,
58–65.
West TO, Post WM (2002) Soil organic carbon sequestration rates by tillage and crop
rotation: a global data analysis. Soil Science Society of America Journal, 66, 1930–
1946.
Supporting Information
Additional Supporting Information may be found in theonline version of this article:
Table S1. Properties of bulk SOM and two SOM fractions inthree sample years at four depths in the soil profile of theCalhoun LTSE, SC, USA. Microsoft Word document.
© 2014 John Wiley & Sons Ltd, Global Change Biology, 21, 986–996
996 M. L. MOBLEY et al.