a versatile 3d culture model facilitates monitoring of astrocytes undergoing reactive gliosis
TRANSCRIPT
JOURNAL OF TISSUE ENGINEERING AND REGENERATIVE MEDICINE R E S E A R C H A R T I C L EJ Tissue Eng Regen Med 2009; 3: 634–646.Published online 7 October 2009 in Wiley InterScience (www.interscience.wiley.com) DOI: 10.1002/term.209
A versatile 3D culture model facilitates monitoringof astrocytes undergoing reactive gliosisEmma East, Jonathan P. Golding and James B. Phillips*Department of Life Sciences, The Open University, Milton Keynes, UK
Abstract
A major impediment to CNS repair is the glial scar, which forms following damage and is composedmainly of ramified, ‘reactive’ astrocytes that inhibit neuronal regrowth. The transition of astrocytesinto this reactive phenotype (reactive gliosis) is a potential therapeutic target, but glial scarformation has proved difficult to study in monolayer cultures because they induce constitutiveastrocyte activation. Here we demonstrate a 3D collagen gel system in which primary rat astrocyteswere maintained in a persistently less reactive state than comparable cells in monolayer, resemblingtheir status in the undamaged CNS. Reactivity, proliferation and viability were monitored andquantified using confocal, fluorescence and time-lapse microscopy, 3D image analysis, RT–PCRand ELISA. To assess the potential of this system as a model of reactive gliosis, astrocytes in 3Dwere activated with TGFβ1 to a ramified, reactive phenotype (elevated GFAP, Aquaporin 4, CSPG,Vimentin and IL-6 secretion). This provides a versatile system in which astrocytes can be maintainedin a resting state, then be triggered to undergo reactive gliosis, enabling real-time monitoring andquantitative analysis throughout and providing a powerful new tool for research into CNS damageand repair. Copyright 2009 John Wiley & Sons, Ltd.
Received 28 February 2009; Revised 2 July 2009; Accepted 21 July 2009
Keywords CNS injury; glial scar; 3D culture model; GFAP; CSPG; vimentin; aquaporin 4; TGFβ1
1. Introduction
Traumatic injuries to the brain and spinal cord aredebilitating and often lead to cognitive impairment,paralysis and loss of sensation. Failure of the injured CNSto repair is in part attributed to the inhibitory environmentof the lesion site, most notably the formation of theglial scar, which consists predominantly of astrocytesand forms a physical and physiological barrier to axonregeneration (Fawcett and Asher, 1999). Astrocytesin the undamaged CNS express low levels of glialfibrillary acidic protein (GFAP) (Cancilla et al., 1992)but, following injury, exhibit a reactive hypertrophicphenotype (reactive gliosis) exemplified by upregulationof various markers, including GFAP, vimentin, aquaporin-4 (AqP4), S100β and chondroitin sulphate protoglycans(CSPGs) (Calvo et al., 1991; Hirsch and Bahr, 2000;Silver and Miller, 2004; Saadoun et al., 2005; Neal et al.,
*Correspondence to: James B. Phillips, Department of LifeSciences, The Open University, Walton Hall, Milton Keynes,MK7 6AA, UK. E-mail: [email protected]
2007). A common finding of strategies aimed at bridgingCNS lesions, particularly tissue-engineered approachesusing biomimetic materials (Phillips et al., 2004), is thatalthough axons readily enter and traverse the bridginggraft, they seldom exit the graft and re-enter the hostparenchyma, due to the inhibitory glial scar at thegraft–CNS interface (Geller and Fawcett, 2002).
Research in this field often focuses on the physiologyof CNS injury in experimental animals. Using thesein vivo models is an essential stage in developing newstrategies for treating human CNS damage, but thesemodels are often too complex for the isolation and controlof specific variables and, when seeking to understandcell-level biology, they allow only a snapshot view uponpost mortem examination. For many research questionsin neuroscience, in particular exploring the behaviourof specific cell populations involved in damage andrepair or establishing mechanisms involved in glialscar development and maturation, in vitro models canprovide a valuable tool. Commonly used in vitro modelsof the glial scar have employed mechanical scrapingof two-dimensional (2D) astrocyte cultures to produce
Copyright 2009 John Wiley & Sons, Ltd.
3D astrogliosis model 635
a ‘wound’ (Yu et al., 1993), stretching of astrocytescultured on silastic membranes (Ellis et al., 1995; Wanneret al., 2008) and creation of a glial scar in vivo onnitrocellulose membranes that are removed and culturedin vitro (McKeon et al., 1991). Whilst these and other 2Dculture models have revealed key information regardingthe reactivity of astrocytes and their effects on neuronalgrowth (reviewed by (Wu and Schwartz, 1998)), there arelimitations to their usefulness for studying the process ofreactive gliosis, since astrocytes in 2D cultures are highlyreactive, making it difficult to monitor further activation.
Scientists in other areas of biology are increasinglyutilizing three-dimensional (3D) cell culture systems,which allow researchers to investigate cell behaviour ina more physiologically relevant state (Lee et al., 2008).Furthermore, the glial scar is a 3D structure composed ofa meshwork of interwoven astrocytic processes that forma barrier, which consequently is very difficult to modelin 2D cultures (Fawcett et al., 1989). Tissue-engineered3D culture models offer an exciting opportunity to fillthe gulf in nervous system research between simple cellculture systems and whole-animal models (Pampaloniet al., 2007; Lee et al., 2008). These can provide a valuablemeans to investigate cell biology, using highly controlledenvironments in which parameters are easily manipulatedto gain insight into the fundamental biological processesthat follow nervous system injury whilst maintaining thecells in a meaningful spatial arrangement.
The aim of this work was to develop a 3D culturesystem in which astrocytes could be maintained in a lessreactive manner than in conventional monolayer culture.For such a system to be useful, it would be reproducible,controllable and amenable to a wide variety of analyses,including immunocytochemistry, time-lapse and confocalmicroscopy, ELISA and RT–PCR. Furthermore, astrocyteswould be capable of responding to a damage stimulus ina manner similar to their in vivo counterparts (changes inmorphology, expression of proteins and release of solublefactors).
To achieve these aims, type-I collagen was chosenas the substrate of choice for 3D cultures, due to theease with which it can be controlled and manipulatedto enable versatile monitoring and imaging. It is a goodbasal substrate that can be used as a scaffold on whichcells can deposit additional extracellular matrix (ECM)molecules as they modify their 3D environment. Thisis particularly important for investigating proteoglycansynthesis by astrocytes in response to activation, whichwould be difficult to detect in more complex 3D culturesubstrates (e.g. Matrigel), which often contain mixturesof a wide range of ECM proteins from the outset.
To test the effectiveness of this approach, the viabilityand activity of astrocytes in 3D collagen gels wasinvestigated, then they were treated with TGFβ1,considered to be a likely trigger for astrogliosis in vivo(Silver and Miller, 2004), causing astrocyte responsestypical of reactive gliosis. Thus we report a model inwhich reactive gliosis can be controlled and monitored toimprove the development of CNS repair strategies.
2. Materials and methods
2.1. Primary cortical astrocyte cultures
All experiments were performed according to theUK Animals (Scientific Procedures) Act (1986) andapproved by the appropriate institutional ethical com-mittee. Sprague–Dawley rats were used from establishedin-house breeding colonies. Primary astrocyte cultureswere prepared from the cortices of postnatal 2 day-oldrat pups (adapted from Dutton et al., 1981). Followingdecapitation, the cortices were dissected out and themeninges and associated blood vessels removed with fineforceps. The tissue was roughly chopped with a scalpelblade, placed in 250 µg/ml trypsin in 10 ml disaggre-gation medium [14 mM glucose (Sigma, Dorset, UK),3 mg/ml bovine serum albumin (BSA; Sigma), 1.5 mM
MgSO4 (BDH, VWR, UK) in Ca2+- and Mg2+-free Earle’sbalanced salt solution (Gibco, Invitrogen, Paisley, UK)]for 15 min at 37 ◦C, and agitated every few minutes. Fol-lowing this incubation, a dilute solution of soya beantrypsin inhibitor (21 µg/ml SBTI; Sigma) and deoxyri-bonuclease 1 (6 µg/ml DNase; Sigma) was added andthe cell suspension was centrifuged for 2 min at 250 × gto pellet the tissue. The supernatant was removed andthe pellet resuspended in 500 µl concentrated solutionof SBTI and DNase (133 µg/ml and 40 µg/ml, respec-tively). The solution was triturated using a 1 ml pipetteto break down any larger clumps of tissue; a fur-ther 500 µl concentrated SBTI and DNase solution wasadded and the suspension left to settle for 2 min. Thematerial at the top of the suspension was removed toa separate 15 ml tube. This trituration procedure wasrepeated twice more. The resulting cell suspension wasthen underlain with 4% w/v BSA, which was thencentrifuged at 250 × g for 5 min. The supernatant wasgently removed and the pellet resuspended in Dulbecco’smodified Eagle’s medium (DMEM; Gibco) supplementedwith penicillin/streptomycin (100 U/ml and 100 µg/mlrespectively; Sigma) and with 10% v/v fetal calf serum(FCS). This suspension was dispensed into 75 cm2 flasks(Greiner, Stonehouse, UK) that had been coated withpoly-D-lysine (Sigma) at an approximate density of 1–2cortices/flask. Each flask was topped up with 20 ml DMEMand placed in a humidified incubator at 37 ◦C with 5%CO2:95% air.
2.2. 2D and 3D astrocyte cultures
Astrocytes were expanded in culture for 8 days to reachconfluence. The flasks were shaken at 150 rpm for 4 hto deplete the microglia and less adherent cells fromthe cultures. Following shaking, the resulting cultureswere 95% astrocytes (as determined by immunoreactivityfor GFAP and IB4 lectin). The medium was removedand 7 ml trypsin–EDTA solution (Sigma) was addedto each flask for 15 min at 37 ◦C. The trypsin wasneutralized by the addition of 13 ml DMEM/flask,
Copyright 2009 John Wiley & Sons, Ltd. J Tissue Eng Regen Med 2009; 3: 634–646.DOI: 10.1002/term
636 E. East et al.
supplemented with penicillin/streptomycin and 10% FCS.The cells were centrifuged at 250 × g for 5 min andthe pellet resuspended in 1 ml medium; the cells werecounted using a haemocytometer. For 2D astrocytecultures, coverslips were coated with 15 µg type Irat tail collagen (First Link UK Ltd, Birmingham,UK) in 0.6% acetic acid for 1 h. This solution wasremoved and the coverslips were then rinsed withsterile phosphate-buffered saline (PBS) to removedany traces of acid, then were left to dry at roomtemperature. 35 K astrocytes were plated in 100 µlsuspension per collagen-coated coverslip in multiwellplates and left to adhere for 1 h at 37 ◦C before adding2 ml DMEM supplemented with penicillin/streptomycin10% FCS/well.
For 3D astrocyte cultures, cells were seeded at a densityof 2 million cells/ml gel. The gels were composed of 10%cell suspension in DMEM, 10% 10× minimum essentialmedium (MEM; Sigma) and 80% type-I rat tail collagen(2 mg/ml in 0.6% acetic acid; First Link, UK). TheMEM and collagen were mixed together and neutralizedusing sodium hydroxide, assessed by colour change ofphenol red. Upon neutralization, the collagen–MEMmixture was gently mixed with the cell suspension andtransferred to 24-well plates (0.75 ml/well; resultinggels approximately 4 mm thick) before placing at 37 ◦Cto set (∼5 min). Once the gels had set, the wellswere topped up with 2 ml DMEM supplemented withpenicillin/streptomycin and 10% FCS. Coverslips andgels for experiments comparing 2D and 3D conditionswere maintained in culture for 24 h before fixing or RNAextraction.
2.3. Cell viability and proliferation
Cell viability was assessed using propidium iodide (PI;Sigma) staining in combination with Hoechst. Briefly, PIwas added to cultures at 200 µg/ml in cell culture mediumand left to incubate for 10 min at 37 ◦C. The medium wasthen removed and the cultures were rinsed in PBS beforefixing in 4% paraformaldehyde (PFA) at 4 ◦C. Gels andcoverslips were incubated with Hoechst 33 258 (1 µg/ml;Sigma) in PBS for 10 min, before 3 × 5 min washes inPBS. Bromodeoxyuridine (BrdU) incorporation was usedto assess cell proliferation in addition to cell counts.BrdU was added into cell culture medium at 10 µM
and incubated at 37 ◦C for 20 min. The cultures werewashed twice with DMEM, then PBS, before fixing in 4%PFA. For BrdU only, coverslips and gels were incubatedwith 0.5% Triton-X-100 to permeabilize the cells beforetreating with DNase at 37 ◦C for 1 h. Detection of BrdUwas performed as described in the Immunocytochemistrysection below. The number of dead or proliferating cellswas calculated as a percentage of the total number of cellsper field (three randomly selected fields per coverslip orgel).
2.4. RT–PCR
Total RNA was isolated from primary astrocytes usingTrizol (Invitrogen). For 2D cultures, the medium wasremoved and Trizol was added directly onto the cells.The cells were then scraped and the resulting solutioncollected into sterile 2 ml tubes. The medium wasremoved from 3D gels; following a wash in sterile PBS,each gel was added to a sterile 2ml tube containing1 ml Trizol, which was then frozen in liquid nitrogen.After thawing, the gels were homogenized in the Trizolby trituration with a 19 G hypodermic needle on asyringe until no lumps of collagen gel were remaining.RNA extraction was then carried out according to themanufacturer’s instructions. The yield of total RNA wasquantified by optical density (OD) readings at 260 nm,and the purity was estimated by the 260 : 280 nm ratio.
Equivalent amounts of total RNA (3 µg) from astro-cyte preparations were reverse-transcribed into single-stranded cDNA in a reaction mixture containing 10 mM
dithiothreitol, 40 U RNase inhibitor, 10 mM Tris–HCl, pH8.3, 15 mM KCl, 0.6 mM MgCl2, 0.5 mM dNTPs, 250 ngrandom primers and 600 U MMLV reverse transcriptase(Invitrogen) at 37 ◦C for 80 min. Incubation for 10 min at70 ◦C terminated the reverse transcription reaction. Neg-ative controls were prepared by incubation of sampleswithout reverse transcriptase.
PCR was performed on the equivalent of 100 ngreverse-transcribed total RNA from each sample. A ther-mocycler was used with a reaction mixture containing50 mM KCl, 10 mM Tris–HCl, pH 9, 0.1% Triton X-100,0.5 mM MgCl2, 200 µM dNTPs, 1 µM each upstream anddownstream primer, and 2.5 U TaqDNA polymerase(Invitrogen). MgCl2 concentrations and optimal anneal-ing temperatures (OAT) were as follows: (1) GFAP (McK-eon et al., 1999), 1.5 mM MgCl2, OAT 60 ◦C, 20 cycles,forward 5′-GCCGCTCCTATGCCTCCTCCGA-3′, reverse5′-TCCAGCGACTCAACCTTCCTCT-3′; (2) GAPDH (Copel-man et al., 2000), 2 mM MgCl2, OAT 60 ◦C, 25 cycles, for-ward 5′-TGGTGCCAAAAGGGTCATCATCTCC-3′, reverse5′-GCCAGCCCCAGCATCAAAGGTG-3′; (3) Neurocan (Qiet al., 2003), 1.5 mM MgCl2, OAT 60 ◦C, 20 cycles,forward 5′-CTGCTTCTTTACCCTTCAACCAC-3′, reverse5′-AGTTGTCAAAGCCATCTTCGAAC-3′. Primer pairsspanned an exon boundary to obviate DNase treatmentof total RNA before reverse transcription (RT)–PCR. PCRperformed on non-reverse-transcribed total RNA samplesdid not produce any detectable products. The thermalcycle profile for each set of primers included a primarydenaturation cycle at 94 ◦C for 5 min and a final exten-sion period at 72 ◦C for 10 min. The intervening PCRcycle consisted of 45 s segments of primer denaturation,annealing and extension.
Equivalent amounts (12 µl) of each PCR product weresize-fractionated on a 1% agarose gel and the productsize was verified by running the samples against a 100bp DNA ladder (Promega, Southampton, UK). The PCRproducts were visualized by staining the agarose gels
Copyright 2009 John Wiley & Sons, Ltd. J Tissue Eng Regen Med 2009; 3: 634–646.DOI: 10.1002/term
3D astrogliosis model 637
with 0.5 µg/ml ethidium bromide and viewing underultraviolet light.
2.5. Time-lapse microscopy
Imaging was performed using an Olympus IX70 invertedmicroscope with heated stage set at 37 ◦C and a 20×viewing objective. Images were captured using In Vivo 3software (Media Cybernectics, MD, USA), then processedusing Volocity image analysis software (Improvision,Perkin-Elmer, Coventry, UK). For time-lapse microscopy,2D and 3D astrocyte cultures were prepared as describedabove. Cells were plated onto collagen-coated coverslipsor seeded into collagen gels and were viewed for 24 h,with images taken every 10 min. The cultures were keptin CO2-independent medium (Gibco) for the duration ofthe time-lapse experiment.
2.6. Astrogliosis model
3D astrocyte gels were treated with transforminggrowth factor-β1 (TGFβ1; 10 ng/ml; R&D Systems,Abingdon, UK), diluted in DMEM supplemented withpenicillin/streptomycin and 10% FCS every other dayfor 15 days. TGFβ1 has previously been used as a positivereactivity control (Cullen et al., 2007) and induces specificalterations that are consistent with astrogliosis (Loganet al., 1994). Furthermore, TGFβ1 has been identifiedas one of the potential triggers of inhibitory astrogliosis(Silver and Miller, 2004). Control gels were subject tomedia change only on the same days. Supernatantswere collected throughout the experiments for subsequentanalysis of cytokines and gels were fixed at days 1, 5, 10and 15 throughout the experiment.
2.7. Immunocytochemistry
The same procedure for immunocytochemistry wasperformed on coverslips and gels, with the incubationand wash times increased for gels. After fixing, the gelswere cut into quarters for staining and image analysis.Cell permeabilization was performed using 0.5% Triton-X-100 (Sigma), 15 min for coverslips, 30 min for gels.Following 3 × 5 min washes, non-specific binding wasblocked with 5% normal swine serum (Dako, Ely, UK)in PBS for 20 min (coverslips) or 40 min (gels). Afteranother wash step, primary antibodies were diluted in PBS(Table 1) and incubated at room temperature for 1.5 h(coverslips) or overnight at 4 ◦C (gels). Following 3 × 10min washes, secondary antibodies [anti-rabbit fluoresceinisothiocyanate (FITC), anti-rabbit tetramethylrhodamineisothiocyanate (TRITC), anti-mouse FITC or anti-mouseTRITC (Sigma)] were diluted in PBS (1 in 100) andadded for 45 min (coverslips) or 1.5 h (gels). Hoechst33 258 (1 µg/ml) was also added into the secondaryantibody dilutions for cell counting. Omission of primaryor secondary antibody was routinely used as a control.
Coverslips were placed on slides in fluorescence mountingmedium (Dako) and sealed with nail varnish. Gels werestored in PBS.
2.8. Image analysis and quantification
Fluorescence microscopy was performed on coverslipsand gels for comparison between 2D and 3D cultures.Images were captured using an Olympus BX61 microscopewith Analysis Pro imaging software (Olympus SoftImaging System, Munster, Germany). Three fields wererandomly selected per coverslip or gel. The number ofimmunopositive cells was calculated as a percentage ofthe total number of cells/field. In addition, the averagenumber of cells/field was compared between astrocytesin gels for 1 and 24 h as another indication of cellproliferation.
Confocal microscopy (Leica DMIRBE, Leica Microsys-tems, Mannheim, Germany) was performed on controlgels and gels treated with TGFβ1 and images were cap-tured using Leica confocal software (Leica, Germany);each field measured 1 × 1 mm × 40 µm (xyz), with40 slices/stack in the Z dimension. Analysis included14 independent gels per time point (seven controland seven TGFβ1), from two separate cell prepara-tions. Three fields per gel quarter were selected accord-ing to a robust protocol (2 mm in from all edges ina triangular formation). The perimeter of cell stain-ing (GFAP, AqP4, Vimentin) and the area of staining(CS56) were calculated using Volocity image analysissoftware (Improvision, Perkin-Elmer). Automated anal-ysis protocols were developed by identifying cells byintensity of staining, so various measurements could becalculated.
Cell shape was analysed using Openlab (Improvision)software. Extended-focus GFAP images captured byconfocal microscopy were analysed, with three fields pergel and seven gels per time point per condition (i.e.control and TGFβ1 treatment). The formula utilized forthis analysis by the software is (4 × π × A)/P2, whereA is the cell area and P is the cell perimeter. Aperfectly spherical cell will have a value of 1, whilstsmaller values indicate progressively more irregularlyshaped cells, thus providing an indicator of how roundedor ramified (i.e. with branch-like processes) the cellswere.
Table 1. Primary antibodies used in immunocytochemistry
Primaryantibody Dilution Source
BrdU 1 in 500 Abcam clone BU1/75GFAP 1 in 300 DakoVimentin 1 in 50 Sigma clone V9CSPGs 1 in 100 Sigma clone CS-56AqP4 1 in 300 ChemiconS100β 1 in 1000 Dakoβ-Actin 1 in 200 Sigma clone AC15
Copyright 2009 John Wiley & Sons, Ltd. J Tissue Eng Regen Med 2009; 3: 634–646.DOI: 10.1002/term
638 E. East et al.
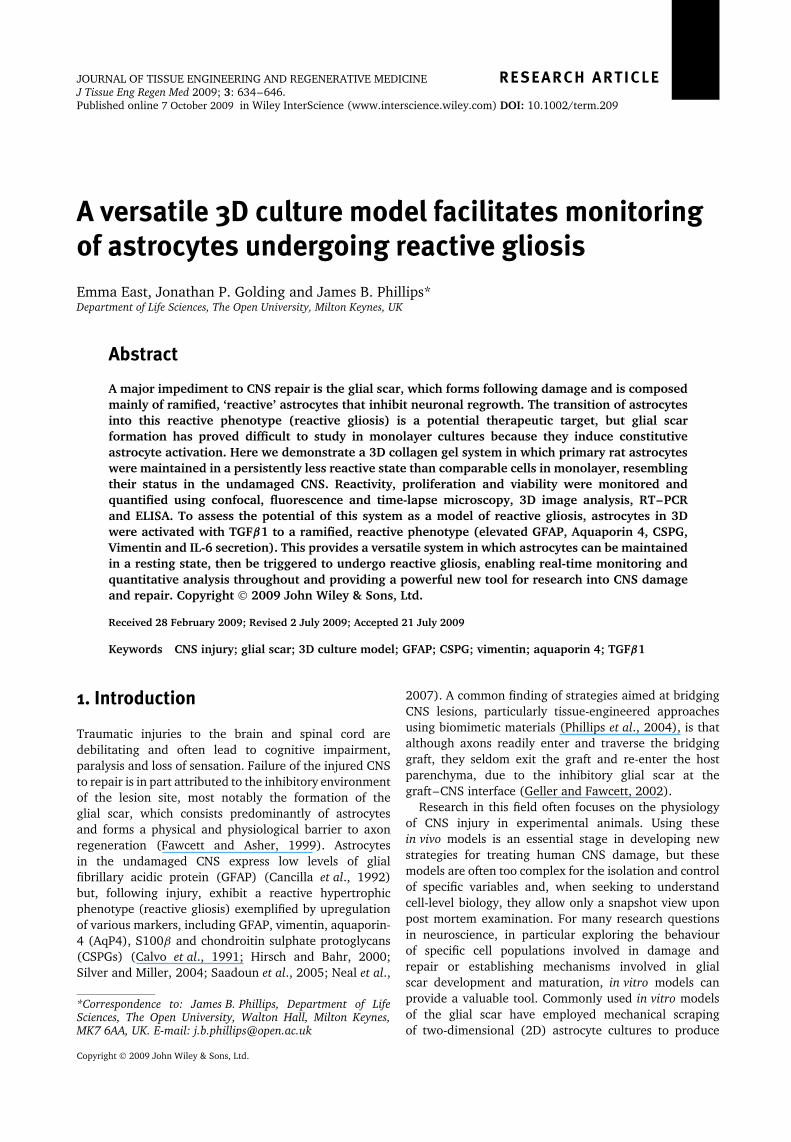
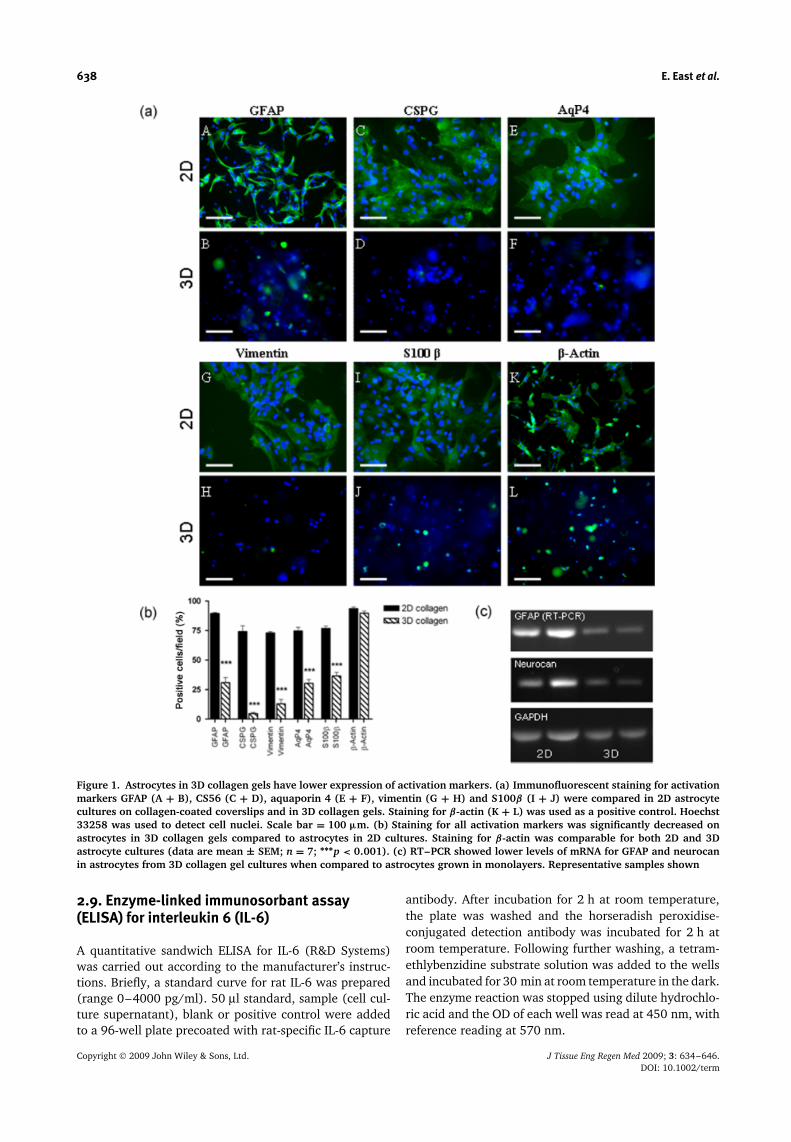
Figure 1. Astrocytes in 3D collagen gels have lower expression of activation markers. (a) Immunofluorescent staining for activationmarkers GFAP (A + B), CS56 (C + D), aquaporin 4 (E + F), vimentin (G + H) and S100β (I + J) were compared in 2D astrocytecultures on collagen-coated coverslips and in 3D collagen gels. Staining for β-actin (K + L) was used as a positive control. Hoechst33258 was used to detect cell nuclei. Scale bar = 100 µm. (b) Staining for all activation markers was significantly decreased onastrocytes in 3D collagen gels compared to astrocytes in 2D cultures. Staining for β-actin was comparable for both 2D and 3Dastrocyte cultures (data are mean ± SEM; n = 7; ∗∗∗p < 0.001). (c) RT–PCR showed lower levels of mRNA for GFAP and neurocanin astrocytes from 3D collagen gel cultures when compared to astrocytes grown in monolayers. Representative samples shown
2.9. Enzyme-linked immunosorbant assay(ELISA) for interleukin 6 (IL-6)
A quantitative sandwich ELISA for IL-6 (R&D Systems)was carried out according to the manufacturer’s instruc-tions. Briefly, a standard curve for rat IL-6 was prepared(range 0–4000 pg/ml). 50 µl standard, sample (cell cul-ture supernatant), blank or positive control were addedto a 96-well plate precoated with rat-specific IL-6 capture
antibody. After incubation for 2 h at room temperature,the plate was washed and the horseradish peroxidise-conjugated detection antibody was incubated for 2 h atroom temperature. Following further washing, a tetram-ethlybenzidine substrate solution was added to the wellsand incubated for 30 min at room temperature in the dark.The enzyme reaction was stopped using dilute hydrochlo-ric acid and the OD of each well was read at 450 nm, withreference reading at 570 nm.
Copyright 2009 John Wiley & Sons, Ltd. J Tissue Eng Regen Med 2009; 3: 634–646.DOI: 10.1002/term
3D astrogliosis model 639
2.10. Statistical analysis
Data were analysed with the GraphPad Prism computerpackage (GraphPad Software, San Diego, CA, USA).Normality and quality of variance tests were performedon all data to determine which test was appropriate. At-test was used, with significance level set at 95% forcomparison between 2D and 3D culture datasets and tocompare between control and TGFβ1-treated culturesat each of the time points. If variances of datasetswere significantly different, then Welch’s correction wasapplied. A one-way ANOVA with Dunnett’s multiplecomparison post hoc test was performed to comparecontrol data points over the 15 day experimental period.All values are indicated as the mean ± standard error ofthe mean (SEM). p values were taken as an indicator ofstatistical significance, using the following nomenclature:∗p < 0.05, ∗∗p < 0.01 and ∗∗∗p < 0.001.
3. Results
3.1. Astrocytes in 3D cultures are constitutivelyless activated than in 2D
Astrocytes on collagen-coated coverslips (2D) or in col-lagen gels (3D) were compared for immunofluorescencestaining (Figure 1a) of the activation markers GFAP (A+ B), CSPGs (C + D), AqP4 (E + F), vimentin (G +H) and S100β (I + J) after 24 h in culture. The num-ber of astrocytes immunopositive for all of the activationmarkers in 3D cultures were significantly fewer whencompared to astrocytes grown on 2D monolayer cultures(Figure 1b; p < 0.001). To confirm that this result wasnot due to differences in staining protocol or reduceddiffusion of antibodies through the gels, staining for β-actin was carried out as a positive control (Figure 1a;K + L). The number of β-actin-immunopositive astro-cytes did not differ significantly between 2D and 3Dcultures, thus indicating that the differences in the activ-ity markers was due to astrocytes in 3D gels exhibit-ing a less reactive phenotype than those in 2D, after24 h.
In order to investigate whether mRNA levels of GFAPand an astrocyte-specific CSPG, neurocan, were affectedby changes in cell culture dimension, in addition to proteinlevels, RT–PCR was performed for these markers andcompared to the house-keeping gene GAPDH. Messagelevels for neurocan and more notably GFAP were reducedin astrocytes cultured in 3D collagen gels, compared tothose grown in 2D monolayers (Figure 1c).
3.2. Cell viability and proliferation
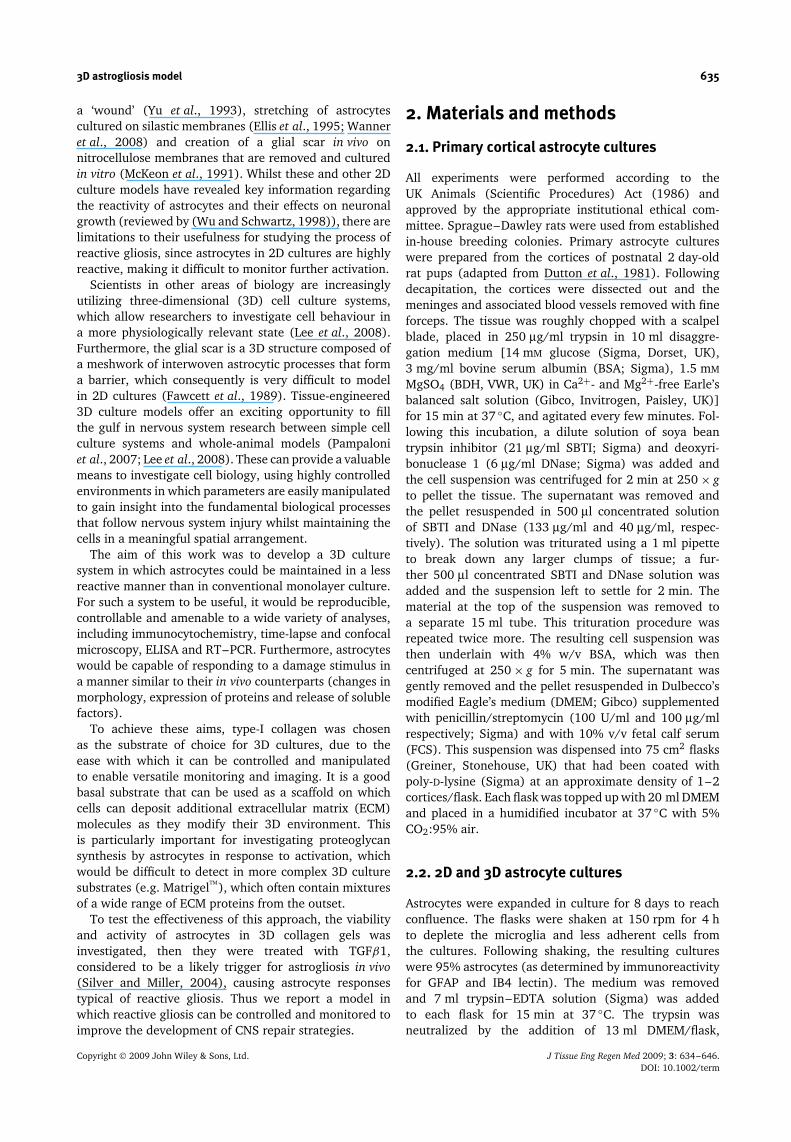
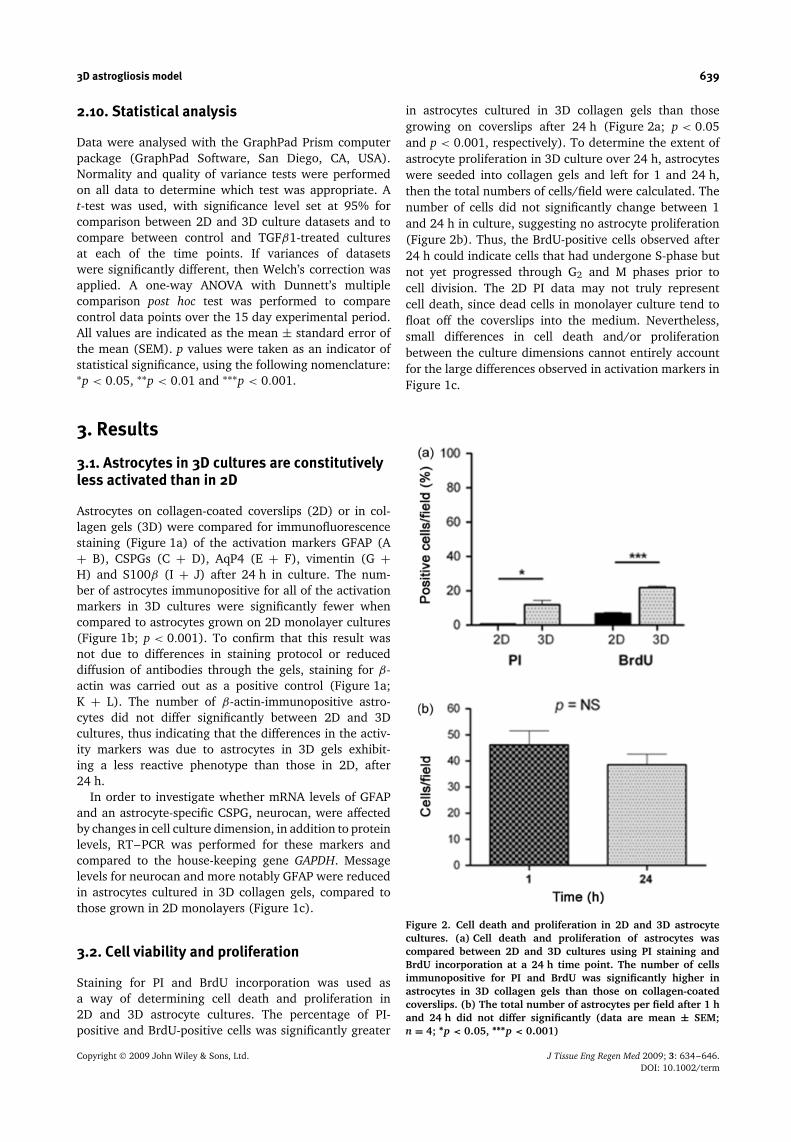
Staining for PI and BrdU incorporation was used asa way of determining cell death and proliferation in2D and 3D astrocyte cultures. The percentage of PI-positive and BrdU-positive cells was significantly greater
in astrocytes cultured in 3D collagen gels than thosegrowing on coverslips after 24 h (Figure 2a; p < 0.05and p < 0.001, respectively). To determine the extent ofastrocyte proliferation in 3D culture over 24 h, astrocyteswere seeded into collagen gels and left for 1 and 24 h,then the total numbers of cells/field were calculated. Thenumber of cells did not significantly change between 1and 24 h in culture, suggesting no astrocyte proliferation(Figure 2b). Thus, the BrdU-positive cells observed after24 h could indicate cells that had undergone S-phase butnot yet progressed through G2 and M phases prior tocell division. The 2D PI data may not truly representcell death, since dead cells in monolayer culture tend tofloat off the coverslips into the medium. Nevertheless,small differences in cell death and/or proliferationbetween the culture dimensions cannot entirely accountfor the large differences observed in activation markers inFigure 1c.
Figure 2. Cell death and proliferation in 2D and 3D astrocytecultures. (a) Cell death and proliferation of astrocytes wascompared between 2D and 3D cultures using PI staining andBrdU incorporation at a 24 h time point. The number of cellsimmunopositive for PI and BrdU was significantly higher inastrocytes in 3D collagen gels than those on collagen-coatedcoverslips. (b) The total number of astrocytes per field after 1 hand 24 h did not differ significantly (data are mean ± SEM;n = 4; ∗p < 0.05, ∗∗∗p < 0.001)
Copyright 2009 John Wiley & Sons, Ltd. J Tissue Eng Regen Med 2009; 3: 634–646.DOI: 10.1002/term
640 E. East et al.
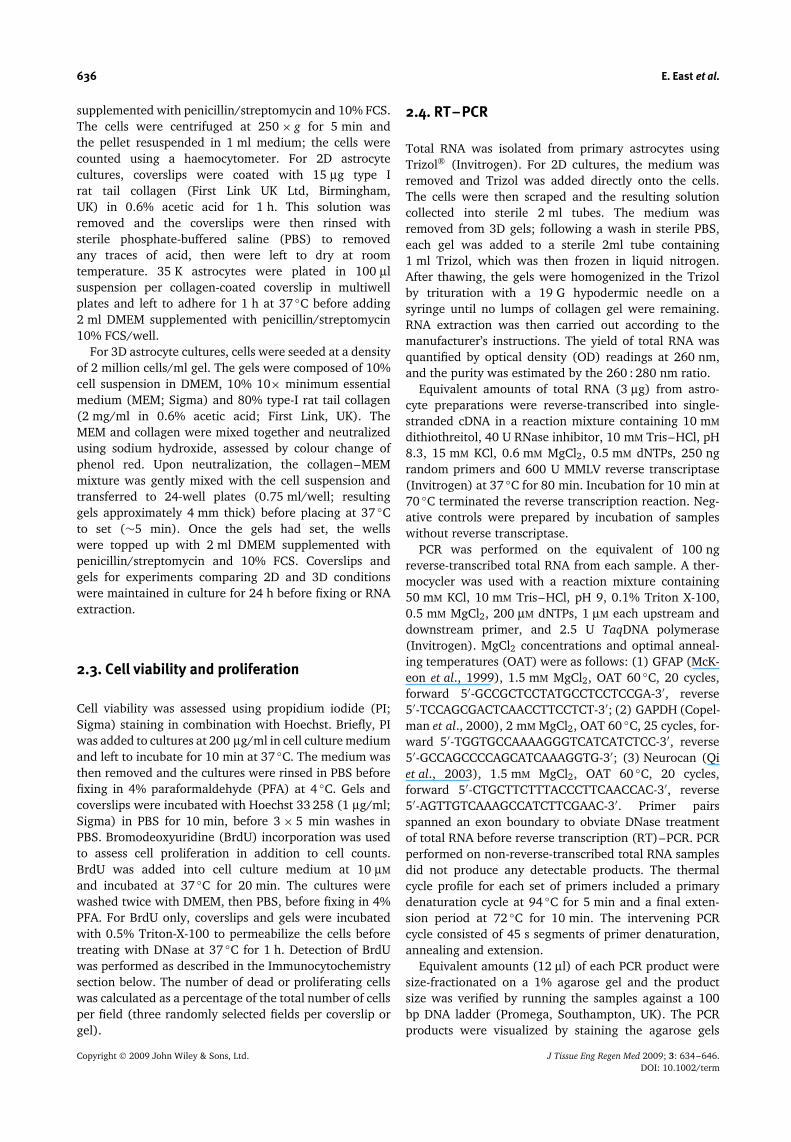
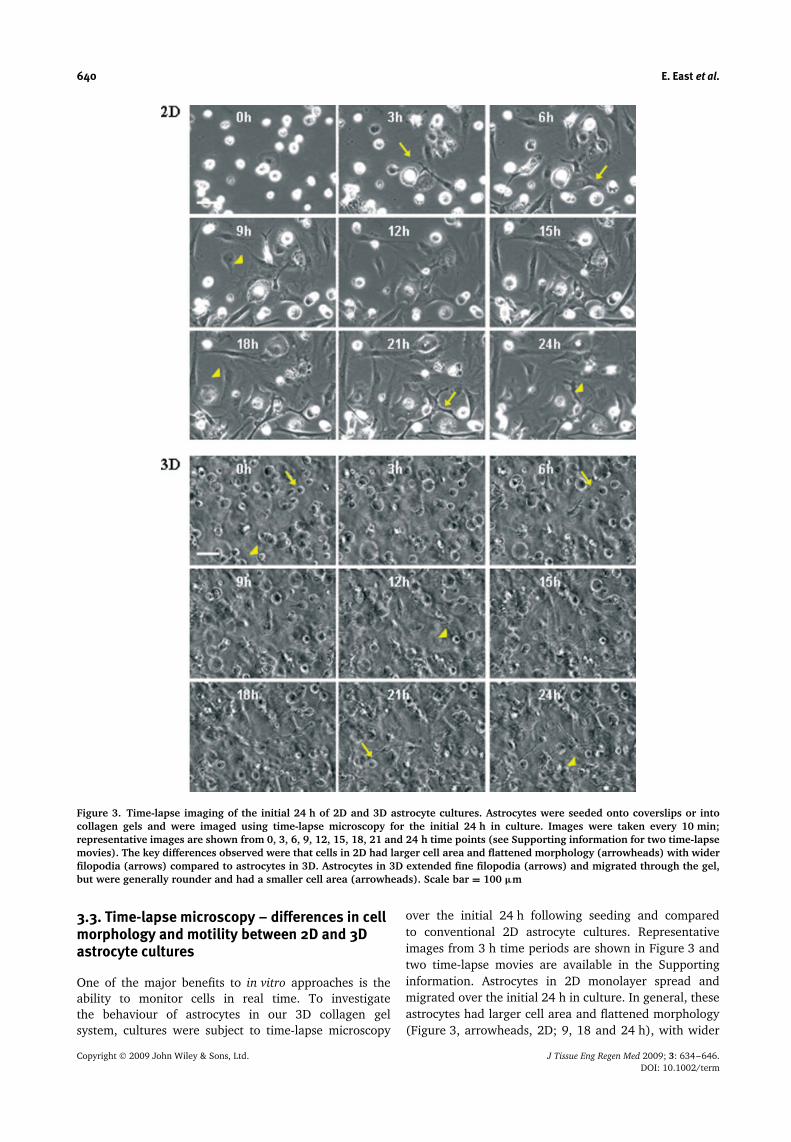
Figure 3. Time-lapse imaging of the initial 24 h of 2D and 3D astrocyte cultures. Astrocytes were seeded onto coverslips or intocollagen gels and were imaged using time-lapse microscopy for the initial 24 h in culture. Images were taken every 10 min;representative images are shown from 0, 3, 6, 9, 12, 15, 18, 21 and 24 h time points (see Supporting information for two time-lapsemovies). The key differences observed were that cells in 2D had larger cell area and flattened morphology (arrowheads) with widerfilopodia (arrows) compared to astrocytes in 3D. Astrocytes in 3D extended fine filopodia (arrows) and migrated through the gel,but were generally rounder and had a smaller cell area (arrowheads). Scale bar = 100 µm
3.3. Time-lapse microscopy – differences in cellmorphology and motility between 2D and 3Dastrocyte cultures
One of the major benefits to in vitro approaches is theability to monitor cells in real time. To investigatethe behaviour of astrocytes in our 3D collagen gelsystem, cultures were subject to time-lapse microscopy
over the initial 24 h following seeding and comparedto conventional 2D astrocyte cultures. Representativeimages from 3 h time periods are shown in Figure 3 andtwo time-lapse movies are available in the Supportinginformation. Astrocytes in 2D monolayer spread andmigrated over the initial 24 h in culture. In general, theseastrocytes had larger cell area and flattened morphology(Figure 3, arrowheads, 2D; 9, 18 and 24 h), with wider
Copyright 2009 John Wiley & Sons, Ltd. J Tissue Eng Regen Med 2009; 3: 634–646.DOI: 10.1002/term
3D astrogliosis model 641
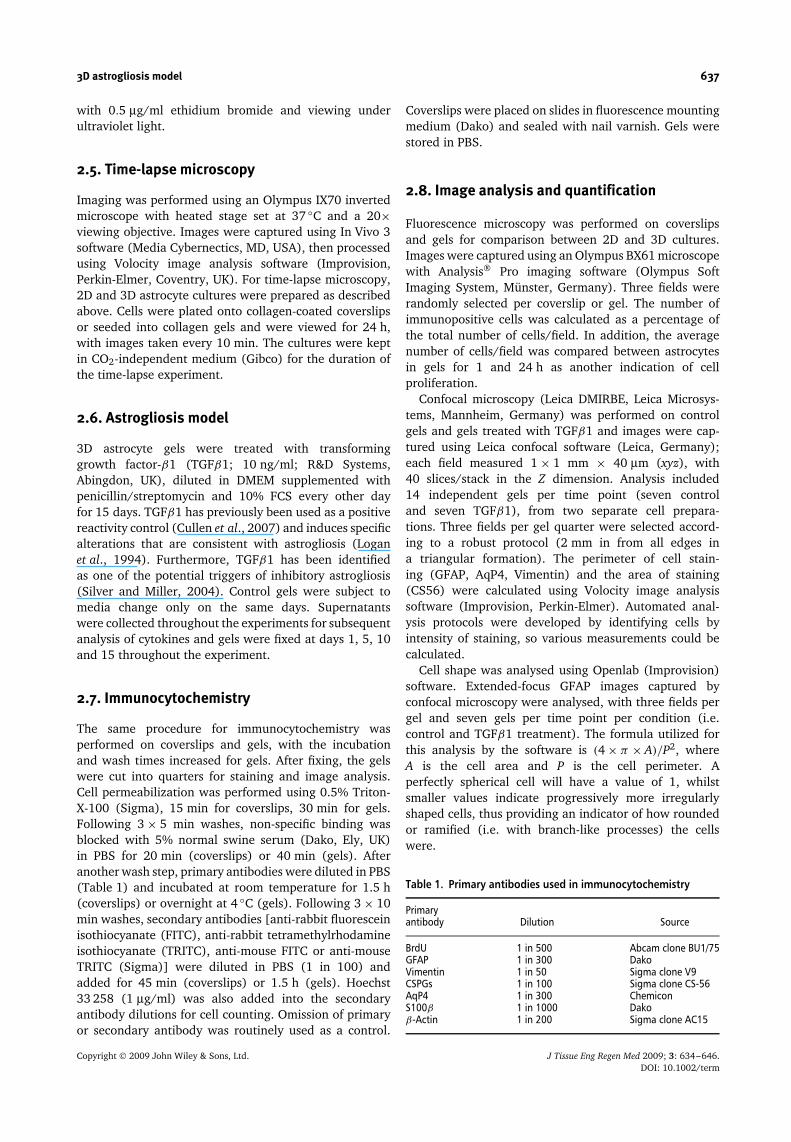
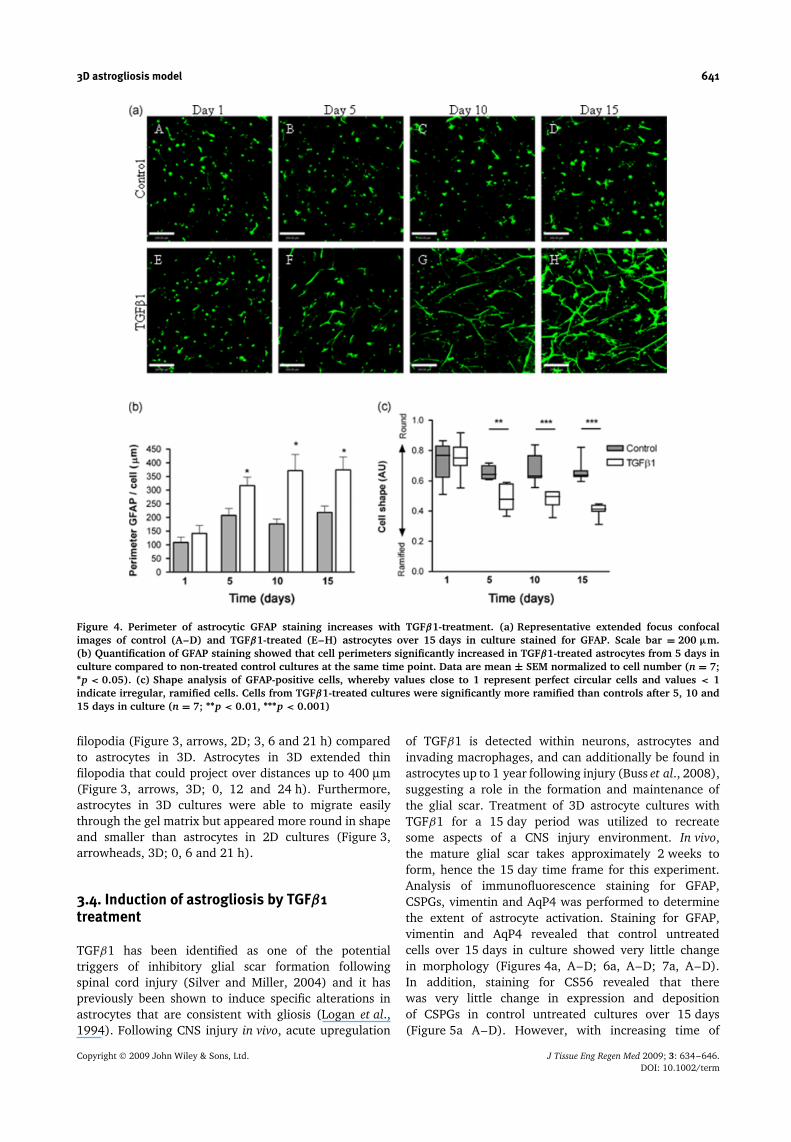
Figure 4. Perimeter of astrocytic GFAP staining increases with TGFβ1-treatment. (a) Representative extended focus confocalimages of control (A–D) and TGFβ1-treated (E–H) astrocytes over 15 days in culture stained for GFAP. Scale bar = 200 µm.(b) Quantification of GFAP staining showed that cell perimeters significantly increased in TGFβ1-treated astrocytes from 5 days inculture compared to non-treated control cultures at the same time point. Data are mean ± SEM normalized to cell number (n = 7;∗p < 0.05). (c) Shape analysis of GFAP-positive cells, whereby values close to 1 represent perfect circular cells and values < 1indicate irregular, ramified cells. Cells from TGFβ1-treated cultures were significantly more ramified than controls after 5, 10 and15 days in culture (n = 7; ∗∗p < 0.01, ∗∗∗p < 0.001)
filopodia (Figure 3, arrows, 2D; 3, 6 and 21 h) comparedto astrocytes in 3D. Astrocytes in 3D extended thinfilopodia that could project over distances up to 400 µm(Figure 3, arrows, 3D; 0, 12 and 24 h). Furthermore,astrocytes in 3D cultures were able to migrate easilythrough the gel matrix but appeared more round in shapeand smaller than astrocytes in 2D cultures (Figure 3,arrowheads, 3D; 0, 6 and 21 h).
3.4. Induction of astrogliosis by TGFβ1treatment
TGFβ1 has been identified as one of the potentialtriggers of inhibitory glial scar formation followingspinal cord injury (Silver and Miller, 2004) and it haspreviously been shown to induce specific alterations inastrocytes that are consistent with gliosis (Logan et al.,1994). Following CNS injury in vivo, acute upregulation
of TGFβ1 is detected within neurons, astrocytes andinvading macrophages, and can additionally be found inastrocytes up to 1 year following injury (Buss et al., 2008),suggesting a role in the formation and maintenance ofthe glial scar. Treatment of 3D astrocyte cultures withTGFβ1 for a 15 day period was utilized to recreatesome aspects of a CNS injury environment. In vivo,the mature glial scar takes approximately 2 weeks toform, hence the 15 day time frame for this experiment.Analysis of immunofluorescence staining for GFAP,CSPGs, vimentin and AqP4 was performed to determinethe extent of astrocyte activation. Staining for GFAP,vimentin and AqP4 revealed that control untreatedcells over 15 days in culture showed very little changein morphology (Figures 4a, A–D; 6a, A–D; 7a, A–D).In addition, staining for CS56 revealed that therewas very little change in expression and depositionof CSPGs in control untreated cultures over 15 days(Figure 5a A–D). However, with increasing time of
Copyright 2009 John Wiley & Sons, Ltd. J Tissue Eng Regen Med 2009; 3: 634–646.DOI: 10.1002/term
642 E. East et al.
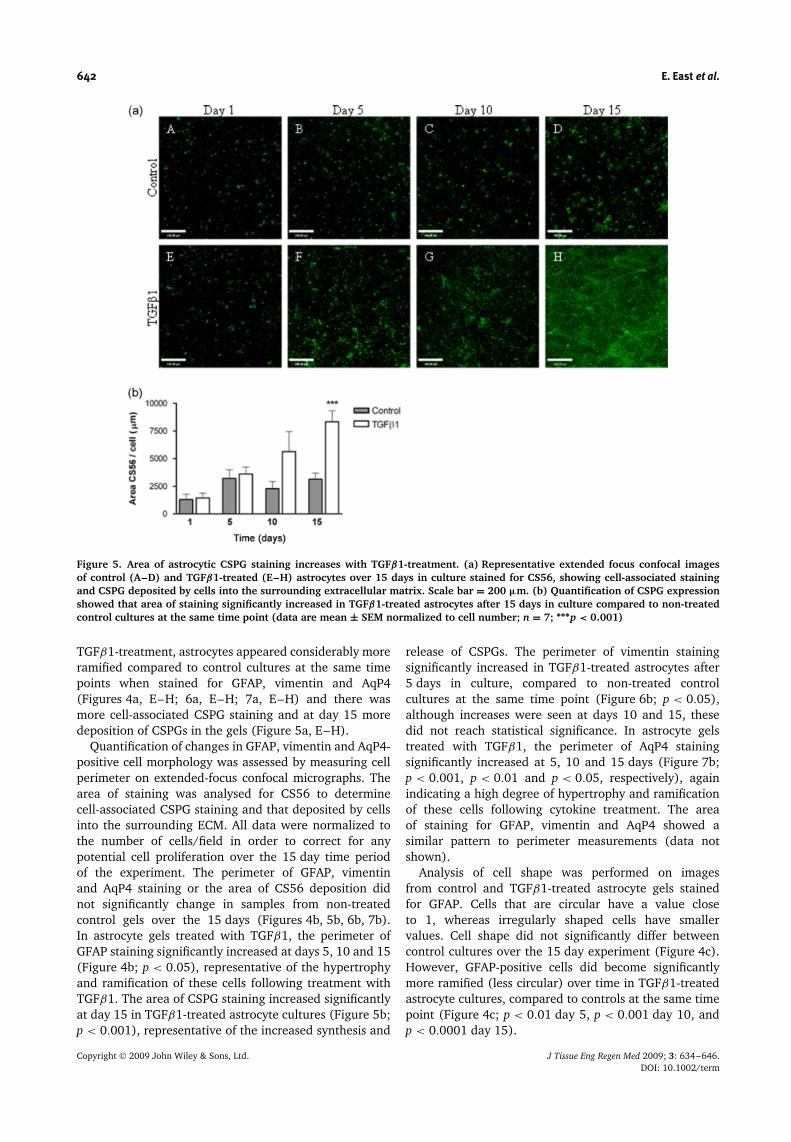
Figure 5. Area of astrocytic CSPG staining increases with TGFβ1-treatment. (a) Representative extended focus confocal imagesof control (A–D) and TGFβ1-treated (E–H) astrocytes over 15 days in culture stained for CS56, showing cell-associated stainingand CSPG deposited by cells into the surrounding extracellular matrix. Scale bar = 200 µm. (b) Quantification of CSPG expressionshowed that area of staining significantly increased in TGFβ1-treated astrocytes after 15 days in culture compared to non-treatedcontrol cultures at the same time point (data are mean ± SEM normalized to cell number; n = 7; ∗∗∗p < 0.001)
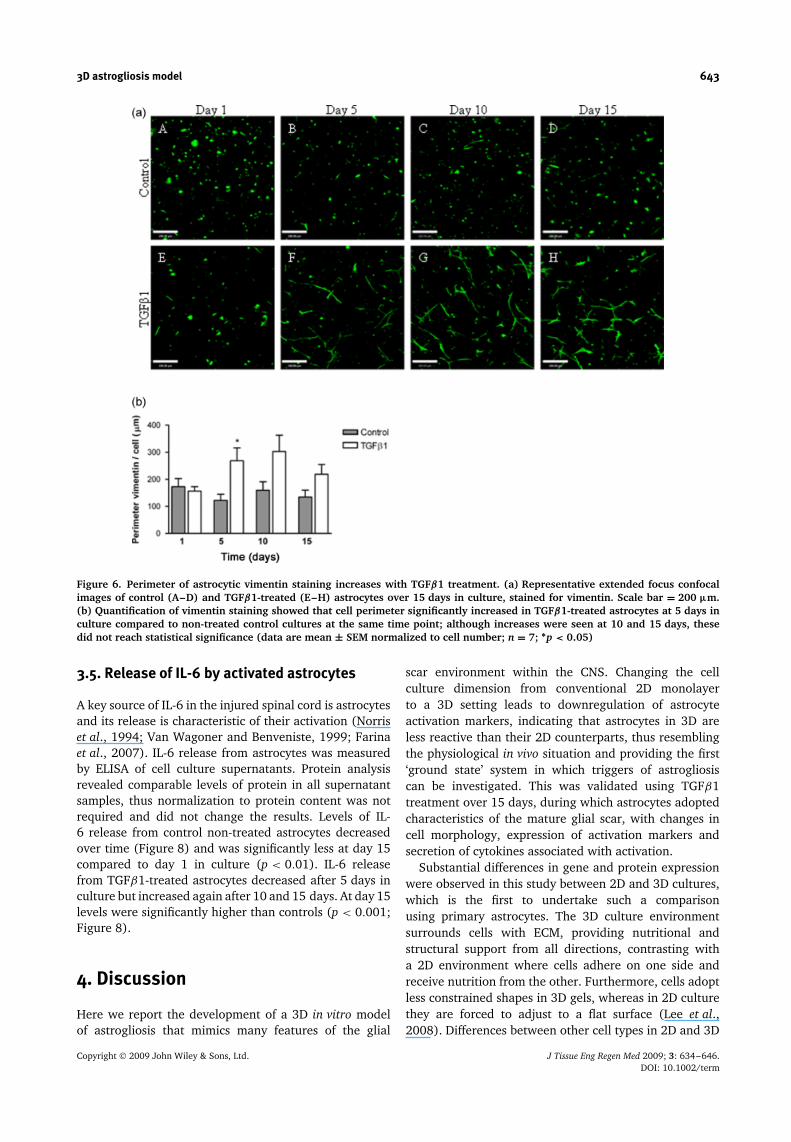
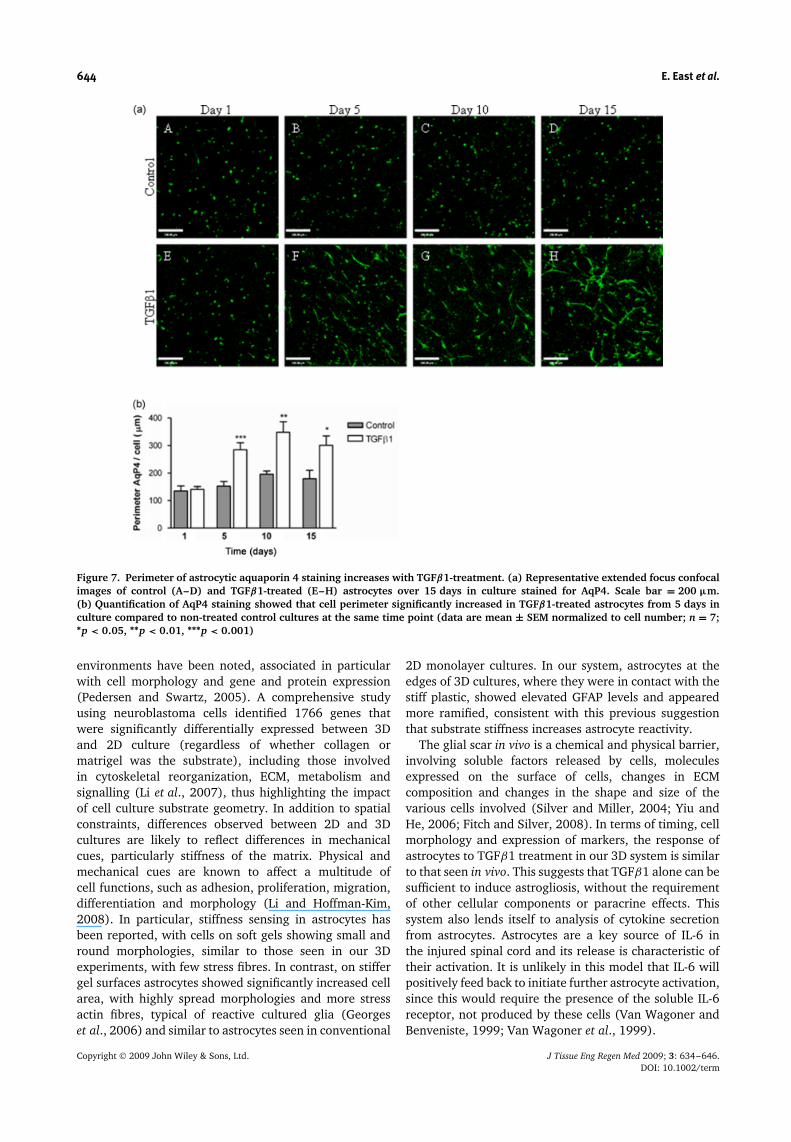
TGFβ1-treatment, astrocytes appeared considerably moreramified compared to control cultures at the same timepoints when stained for GFAP, vimentin and AqP4(Figures 4a, E–H; 6a, E–H; 7a, E–H) and there wasmore cell-associated CSPG staining and at day 15 moredeposition of CSPGs in the gels (Figure 5a, E–H).
Quantification of changes in GFAP, vimentin and AqP4-positive cell morphology was assessed by measuring cellperimeter on extended-focus confocal micrographs. Thearea of staining was analysed for CS56 to determinecell-associated CSPG staining and that deposited by cellsinto the surrounding ECM. All data were normalized tothe number of cells/field in order to correct for anypotential cell proliferation over the 15 day time periodof the experiment. The perimeter of GFAP, vimentinand AqP4 staining or the area of CS56 deposition didnot significantly change in samples from non-treatedcontrol gels over the 15 days (Figures 4b, 5b, 6b, 7b).In astrocyte gels treated with TGFβ1, the perimeter ofGFAP staining significantly increased at days 5, 10 and 15(Figure 4b; p < 0.05), representative of the hypertrophyand ramification of these cells following treatment withTGFβ1. The area of CSPG staining increased significantlyat day 15 in TGFβ1-treated astrocyte cultures (Figure 5b;p < 0.001), representative of the increased synthesis and
release of CSPGs. The perimeter of vimentin stainingsignificantly increased in TGFβ1-treated astrocytes after5 days in culture, compared to non-treated controlcultures at the same time point (Figure 6b; p < 0.05),although increases were seen at days 10 and 15, thesedid not reach statistical significance. In astrocyte gelstreated with TGFβ1, the perimeter of AqP4 stainingsignificantly increased at 5, 10 and 15 days (Figure 7b;p < 0.001, p < 0.01 and p < 0.05, respectively), againindicating a high degree of hypertrophy and ramificationof these cells following cytokine treatment. The areaof staining for GFAP, vimentin and AqP4 showed asimilar pattern to perimeter measurements (data notshown).
Analysis of cell shape was performed on imagesfrom control and TGFβ1-treated astrocyte gels stainedfor GFAP. Cells that are circular have a value closeto 1, whereas irregularly shaped cells have smallervalues. Cell shape did not significantly differ betweencontrol cultures over the 15 day experiment (Figure 4c).However, GFAP-positive cells did become significantlymore ramified (less circular) over time in TGFβ1-treatedastrocyte cultures, compared to controls at the same timepoint (Figure 4c; p < 0.01 day 5, p < 0.001 day 10, andp < 0.0001 day 15).
Copyright 2009 John Wiley & Sons, Ltd. J Tissue Eng Regen Med 2009; 3: 634–646.DOI: 10.1002/term
3D astrogliosis model 643
Figure 6. Perimeter of astrocytic vimentin staining increases with TGFβ1 treatment. (a) Representative extended focus confocalimages of control (A–D) and TGFβ1-treated (E–H) astrocytes over 15 days in culture, stained for vimentin. Scale bar = 200 µm.(b) Quantification of vimentin staining showed that cell perimeter significantly increased in TGFβ1-treated astrocytes at 5 days inculture compared to non-treated control cultures at the same time point; although increases were seen at 10 and 15 days, thesedid not reach statistical significance (data are mean ± SEM normalized to cell number; n = 7; ∗p < 0.05)
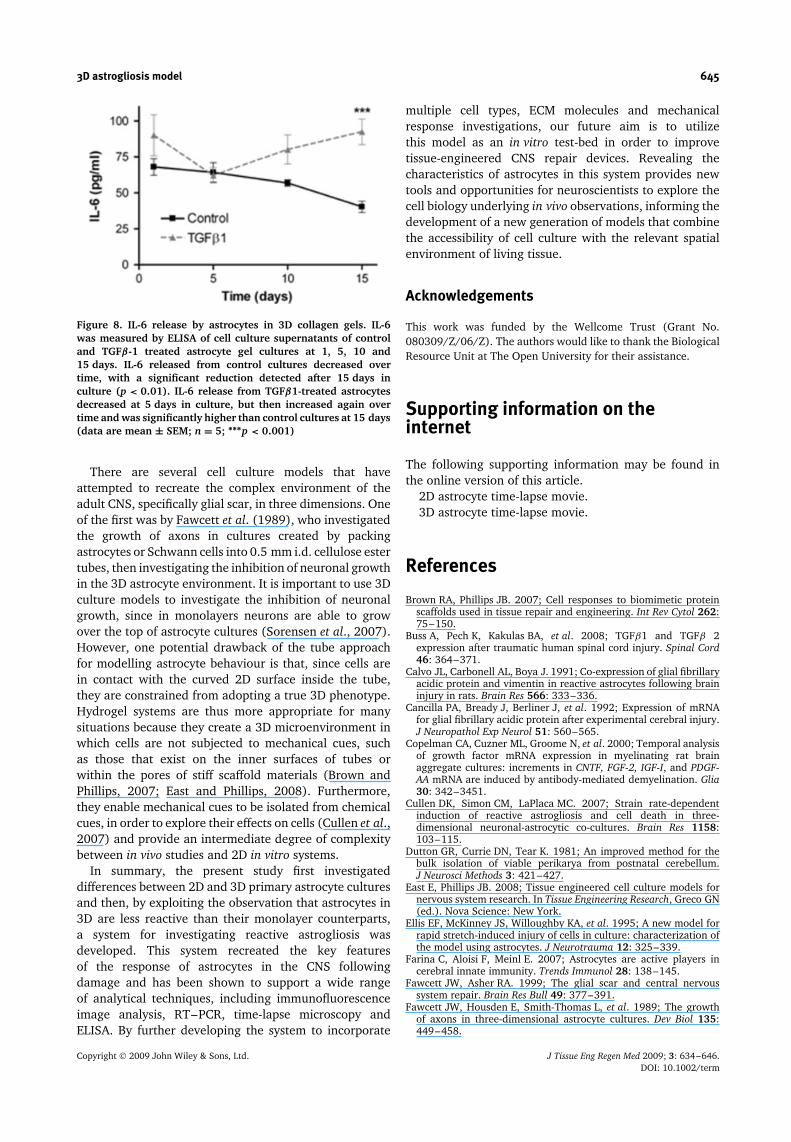
3.5. Release of IL-6 by activated astrocytes
A key source of IL-6 in the injured spinal cord is astrocytesand its release is characteristic of their activation (Norriset al., 1994; Van Wagoner and Benveniste, 1999; Farinaet al., 2007). IL-6 release from astrocytes was measuredby ELISA of cell culture supernatants. Protein analysisrevealed comparable levels of protein in all supernatantsamples, thus normalization to protein content was notrequired and did not change the results. Levels of IL-6 release from control non-treated astrocytes decreasedover time (Figure 8) and was significantly less at day 15compared to day 1 in culture (p < 0.01). IL-6 releasefrom TGFβ1-treated astrocytes decreased after 5 days inculture but increased again after 10 and 15 days. At day 15levels were significantly higher than controls (p < 0.001;Figure 8).
4. Discussion
Here we report the development of a 3D in vitro modelof astrogliosis that mimics many features of the glial
scar environment within the CNS. Changing the cellculture dimension from conventional 2D monolayerto a 3D setting leads to downregulation of astrocyteactivation markers, indicating that astrocytes in 3D areless reactive than their 2D counterparts, thus resemblingthe physiological in vivo situation and providing the first‘ground state’ system in which triggers of astrogliosiscan be investigated. This was validated using TGFβ1treatment over 15 days, during which astrocytes adoptedcharacteristics of the mature glial scar, with changes incell morphology, expression of activation markers andsecretion of cytokines associated with activation.
Substantial differences in gene and protein expressionwere observed in this study between 2D and 3D cultures,which is the first to undertake such a comparisonusing primary astrocytes. The 3D culture environmentsurrounds cells with ECM, providing nutritional andstructural support from all directions, contrasting witha 2D environment where cells adhere on one side andreceive nutrition from the other. Furthermore, cells adoptless constrained shapes in 3D gels, whereas in 2D culturethey are forced to adjust to a flat surface (Lee et al.,2008). Differences between other cell types in 2D and 3D
Copyright 2009 John Wiley & Sons, Ltd. J Tissue Eng Regen Med 2009; 3: 634–646.DOI: 10.1002/term
644 E. East et al.
Figure 7. Perimeter of astrocytic aquaporin 4 staining increases with TGFβ1-treatment. (a) Representative extended focus confocalimages of control (A–D) and TGFβ1-treated (E–H) astrocytes over 15 days in culture stained for AqP4. Scale bar = 200 µm.(b) Quantification of AqP4 staining showed that cell perimeter significantly increased in TGFβ1-treated astrocytes from 5 days inculture compared to non-treated control cultures at the same time point (data are mean ± SEM normalized to cell number; n = 7;∗p < 0.05, ∗∗p < 0.01, ∗∗∗p < 0.001)
environments have been noted, associated in particularwith cell morphology and gene and protein expression(Pedersen and Swartz, 2005). A comprehensive studyusing neuroblastoma cells identified 1766 genes thatwere significantly differentially expressed between 3Dand 2D culture (regardless of whether collagen ormatrigel was the substrate), including those involvedin cytoskeletal reorganization, ECM, metabolism andsignalling (Li et al., 2007), thus highlighting the impactof cell culture substrate geometry. In addition to spatialconstraints, differences observed between 2D and 3Dcultures are likely to reflect differences in mechanicalcues, particularly stiffness of the matrix. Physical andmechanical cues are known to affect a multitude ofcell functions, such as adhesion, proliferation, migration,differentiation and morphology (Li and Hoffman-Kim,2008). In particular, stiffness sensing in astrocytes hasbeen reported, with cells on soft gels showing small andround morphologies, similar to those seen in our 3Dexperiments, with few stress fibres. In contrast, on stiffergel surfaces astrocytes showed significantly increased cellarea, with highly spread morphologies and more stressactin fibres, typical of reactive cultured glia (Georgeset al., 2006) and similar to astrocytes seen in conventional
2D monolayer cultures. In our system, astrocytes at theedges of 3D cultures, where they were in contact with thestiff plastic, showed elevated GFAP levels and appearedmore ramified, consistent with this previous suggestionthat substrate stiffness increases astrocyte reactivity.
The glial scar in vivo is a chemical and physical barrier,involving soluble factors released by cells, moleculesexpressed on the surface of cells, changes in ECMcomposition and changes in the shape and size of thevarious cells involved (Silver and Miller, 2004; Yiu andHe, 2006; Fitch and Silver, 2008). In terms of timing, cellmorphology and expression of markers, the response ofastrocytes to TGFβ1 treatment in our 3D system is similarto that seen in vivo. This suggests that TGFβ1 alone can besufficient to induce astrogliosis, without the requirementof other cellular components or paracrine effects. Thissystem also lends itself to analysis of cytokine secretionfrom astrocytes. Astrocytes are a key source of IL-6 inthe injured spinal cord and its release is characteristic oftheir activation. It is unlikely in this model that IL-6 willpositively feed back to initiate further astrocyte activation,since this would require the presence of the soluble IL-6receptor, not produced by these cells (Van Wagoner andBenveniste, 1999; Van Wagoner et al., 1999).
Copyright 2009 John Wiley & Sons, Ltd. J Tissue Eng Regen Med 2009; 3: 634–646.DOI: 10.1002/term
3D astrogliosis model 645
Figure 8. IL-6 release by astrocytes in 3D collagen gels. IL-6was measured by ELISA of cell culture supernatants of controland TGFβ-1 treated astrocyte gel cultures at 1, 5, 10 and15 days. IL-6 released from control cultures decreased overtime, with a significant reduction detected after 15 days inculture (p < 0.01). IL-6 release from TGFβ1-treated astrocytesdecreased at 5 days in culture, but then increased again overtime and was significantly higher than control cultures at 15 days(data are mean ± SEM; n = 5; ∗∗∗p < 0.001)
There are several cell culture models that haveattempted to recreate the complex environment of theadult CNS, specifically glial scar, in three dimensions. Oneof the first was by Fawcett et al. (1989), who investigatedthe growth of axons in cultures created by packingastrocytes or Schwann cells into 0.5 mm i.d. cellulose estertubes, then investigating the inhibition of neuronal growthin the 3D astrocyte environment. It is important to use 3Dculture models to investigate the inhibition of neuronalgrowth, since in monolayers neurons are able to growover the top of astrocyte cultures (Sorensen et al., 2007).However, one potential drawback of the tube approachfor modelling astrocyte behaviour is that, since cells arein contact with the curved 2D surface inside the tube,they are constrained from adopting a true 3D phenotype.Hydrogel systems are thus more appropriate for manysituations because they create a 3D microenvironment inwhich cells are not subjected to mechanical cues, suchas those that exist on the inner surfaces of tubes orwithin the pores of stiff scaffold materials (Brown andPhillips, 2007; East and Phillips, 2008). Furthermore,they enable mechanical cues to be isolated from chemicalcues, in order to explore their effects on cells (Cullen et al.,2007) and provide an intermediate degree of complexitybetween in vivo studies and 2D in vitro systems.
In summary, the present study first investigateddifferences between 2D and 3D primary astrocyte culturesand then, by exploiting the observation that astrocytes in3D are less reactive than their monolayer counterparts,a system for investigating reactive astrogliosis wasdeveloped. This system recreated the key featuresof the response of astrocytes in the CNS followingdamage and has been shown to support a wide rangeof analytical techniques, including immunofluorescenceimage analysis, RT–PCR, time-lapse microscopy andELISA. By further developing the system to incorporate
multiple cell types, ECM molecules and mechanicalresponse investigations, our future aim is to utilizethis model as an in vitro test-bed in order to improvetissue-engineered CNS repair devices. Revealing thecharacteristics of astrocytes in this system provides newtools and opportunities for neuroscientists to explore thecell biology underlying in vivo observations, informing thedevelopment of a new generation of models that combinethe accessibility of cell culture with the relevant spatialenvironment of living tissue.
Acknowledgements
This work was funded by the Wellcome Trust (Grant No.080309/Z/06/Z). The authors would like to thank the BiologicalResource Unit at The Open University for their assistance.
Supporting information on theinternet
The following supporting information may be found inthe online version of this article.
2D astrocyte time-lapse movie.3D astrocyte time-lapse movie.
References
Brown RA, Phillips JB. 2007; Cell responses to biomimetic proteinscaffolds used in tissue repair and engineering. Int Rev Cytol 262:75–150.
Buss A, Pech K, Kakulas BA, et al. 2008; TGFβ1 and TGFβ 2expression after traumatic human spinal cord injury. Spinal Cord46: 364–371.
Calvo JL, Carbonell AL, Boya J. 1991; Co-expression of glial fibrillaryacidic protein and vimentin in reactive astrocytes following braininjury in rats. Brain Res 566: 333–336.
Cancilla PA, Bready J, Berliner J, et al. 1992; Expression of mRNAfor glial fibrillary acidic protein after experimental cerebral injury.J Neuropathol Exp Neurol 51: 560–565.
Copelman CA, Cuzner ML, Groome N, et al. 2000; Temporal analysisof growth factor mRNA expression in myelinating rat brainaggregate cultures: increments in CNTF, FGF-2, IGF-I, and PDGF-AA mRNA are induced by antibody-mediated demyelination. Glia30: 342–3451.
Cullen DK, Simon CM, LaPlaca MC. 2007; Strain rate-dependentinduction of reactive astrogliosis and cell death in three-dimensional neuronal-astrocytic co-cultures. Brain Res 1158:103–115.
Dutton GR, Currie DN, Tear K. 1981; An improved method for thebulk isolation of viable perikarya from postnatal cerebellum.J Neurosci Methods 3: 421–427.
East E, Phillips JB. 2008; Tissue engineered cell culture models fornervous system research. In Tissue Engineering Research, Greco GN(ed.). Nova Science: New York.
Ellis EF, McKinney JS, Willoughby KA, et al. 1995; A new model forrapid stretch-induced injury of cells in culture: characterization ofthe model using astrocytes. J Neurotrauma 12: 325–339.
Farina C, Aloisi F, Meinl E. 2007; Astrocytes are active players incerebral innate immunity. Trends Immunol 28: 138–145.
Fawcett JW, Asher RA. 1999; The glial scar and central nervoussystem repair. Brain Res Bull 49: 377–391.
Fawcett JW, Housden E, Smith-Thomas L, et al. 1989; The growthof axons in three-dimensional astrocyte cultures. Dev Biol 135:449–458.
Copyright 2009 John Wiley & Sons, Ltd. J Tissue Eng Regen Med 2009; 3: 634–646.DOI: 10.1002/term
646 E. East et al.
Fitch MT, Silver J. 2008; CNS injury, glial scars, and inflammation:inhibitory extracellular matrices and regeneration failure. ExpNeurol 209: 294–301.
Geller HM, Fawcett JW. 2002; Building a bridge: engineering spinalcord repair. Exp Neurol 174: 125–136.
Georges PC, Miller WJ, Meaney DF, et al. 2006; Matrices withcompliance comparable to that of brain tissue select neuronal overglial growth in mixed cortical cultures. Biophys J 90: 3012–3018.
Hirsch S, Bahr M. 2000; Glial response to injury. In AxonRegeneration in the CNS, Ingoglia NA, Murray M (eds). MarcelDekker Inc, New York.
Lee J, Cuddihy MJ, Kotov NA. 2008; Three-dimensional cell culturematrices: state of the art. Tissue Eng Part B Rev 14: 61–86.
Li GN, Hoffman-Kim D. 2008; Tissue-engineered platforms of axonguidance. Tissue Eng Part B Rev 14: 33–51.
Li GN, Livi LL, Gourd CM, et al. 2007; Genomic and morphologicalchanges of neuroblastoma cells in response to three-dimensionalmatrices. Tissue Eng 13: 1035–1047.
Logan A, Berry M, Gonzalez AM, et al. 1994; Effects of transforminggrowth factor β1 on scar production in the injured central nervoussystem of the rat. Eur J Neurosci 6: 355–363.
McKeon RJ, Jurynec MJ, Buck CR. 1999; The chondroitin sulfateproteoglycans neurocan and phosphacan are expressed byreactive astrocytes in the chronic CNS glial scar. J Neurosci 19:10778–10788.
McKeon RJ, Schreiber RC, Rudge JS, et al. 1991; Reduction ofneurite outgrowth in a model of glial scarring following CNSinjury is correlated with the expression of inhibitory molecules onreactive astrocytes. J Neurosci 11: 3398–3411.
Neal CJ, Lee EY, Gyorgy A, et al. 2007; Effect of penetrating braininjury on aquaporin-4 expression using a rat model. J Neurotrauma24: 1609–1617.
Norris JG, Tang LP, Sparacio SM, et al. 1994; Signal transductionpathways mediating astrocyte IL-6 induction by IL-1β and tumornecrosis factor-α. J Immunol 152: 841–850.
Pampaloni F, Reynaud EG, Stelzer EH. 2007; The third dimensionbridges the gap between cell culture and live tissue. Nat Rev MolCell Biol 8: 839–845.
Pedersen JA, Swartz MA. 2005; Mechanobiology in the thirddimension. Ann Biomed Eng 33: 1469–1490.
Phillips JB, King VR, Ward Z, et al. 2004; Fluid shear in viscousfibronectin gels allows aggregation of fibrous materials for CNStissue engineering. Biomaterials 25: 2769–2779.
Qi ML, Wakabayashi Y, Enomoto M, et al. 2003; Changes inneurocan expression in the distal spinal cord stump followingcomplete cord transection: a comparison between infant and adultrats. Neurosci Res 45: 181–188.
Saadoun S, Papadopoulos MC, Watanabe H, et al. 2005; Involve-ment of aquaporin-4 in astroglial cell migration and glial scarformation. J Cell Sci 118: 5691–5698.
Silver J, Miller JH. 2004; Regeneration beyond the glial scar. NatRev Neurosci 5: 146–156.
Sorensen A, Alekseeva T, Katechia K, et al. 2007; Long-term neuriteorientation on astrocyte monolayers aligned by microtopography.Biomaterials 28: 5498–5508.
Van Wagoner NJ, Benveniste EN. 1999; Interleukin-6 expression andregulation in astrocytes. J Neuroimmunol 100: 124–139.
Van Wagoner NJ, Oh JW, Repovic P, et al. 1999; Interleukin-6 (IL-6) production by astrocytes: autocrine regulation by IL-6 and thesoluble IL-6 receptor. J Neurosci 19: 5236–5244.
Wanner IB, Deik A, Torres M, et al. 2008; A new in vitro model ofthe glial scar inhibits axon growth. Glia 56: 1691–1709.
Wu VW, Schwartz JP. 1998; Cell culture models for reactive gliosis:new perspectives. J Neurosci Res 51: 675–681.
Yiu G, He Z. 2006; Glial inhibition of CNS axon regeneration. NatRev Neurosci 7: 617–627.
Yu AC, Lee YL, Eng LF. 1993; Astrogliosis in culture: I. The modeland the effect of antisense oligonucleotides on glial fibrillary acidicprotein synthesis. J Neurosci Res 34: 295–303.
Copyright 2009 John Wiley & Sons, Ltd. J Tissue Eng Regen Med 2009; 3: 634–646.DOI: 10.1002/term