geologian tutkimuskeskus geological survey of finland...
TRANSCRIPT

GEOLOGIAN TUTKIMUSKESKUS GEOLOGICAL SURVEY OF FINLAND Ydin-jätteiden si~joitustutkimukset Nuclear Waste Disposal Research
Tiedonanto YST-97 Report YST-97
INVESTIGATION OF ROCK MATRIX POROSITY IN ALTERATION PROFILES
Development of site characterization methodology
Marja ~iitari-Kauppi1, Antero Lindberg2, Karl-Heinz Hellmuth3 and Sakari Lukkarinen4
Laboratory of Radiochemistry, 00014 University of Helsinki 2 Geological Survey of Finland
Finnish Centre for Radiation and Nuclear Safety 4 Helsinki University of Technology
Espoo 1997

Peruskallioon sijoitetuista ydinpolttoaineen loppusijoitusvarastoista mahdollisesti vapautuvat radionuklidit kulkeutuvat pääasiassa kalliorakoja pitkin virtaavan veden mukana. Veteen liuenneiden radionuklidien kulkeutumista hidastaa niiden pidattyminen kalliorakojen pintaan ja rakotäytteisiin sekä diffuusio kiven mikrorakoihin ja huokoisiin mineraaleihin. Kulkeutumiseen vaikuttavien erilaisten fysikaalisten ja kemiallisten ilmiöiden vaikutusten, kuten myös kivimatriisin ominaisuuksien tunteminen on oleellista ennustettaessa ydinjatenuklidien kulkeuturnista ja pidattymista.
Tässä työssä maaritettiin yksityiskohtaisesti kivimatriisin ominaisuudet pohjavettä johtavien kalliorakojen läheisyydessä. Huokoisuusprofiilit mitattiin '4C-polymet~ylimetakrylaatti (I4c- PMMA) -menetelinalla kolmelle Syyryn alueen kivilajille: tonaliitille, kiillegneissille ja vulkaniitille. Tutkimuksessa käytetyt 20 - 30 cm:n pituiset kairansydännäytteet impregnoitiin (imeytettiin) 14C-leimatulla metyylimetakrylaatilla (MMA) tyhjiökuivauksen jalkeen. Monomeeri polymeroitiin Co-60-säteilylahteen kentässä. Tämän jälkeen näytteet sahattiin ja sahatut pinnat tutkittiin autoradiografisesti. Huokoisuusprofiilit ja huokoisuuden jakaumat määritettiin autoradiogrammeista digitaalisen kuvienkäsittelyn avulla. Näytteiden mineraalikoostumukset ja rakenteet tutkittiin mikroskooppisesti autoradiogrammeissa havaittujen piirteiden selvittämiseksi. Mineraalien muuntumisaste maaritettiin elektronimikroskooppisesti energiadispersiivisella alkuaineanalyysillä (SEMJEDS).
Kaytetyllä I4C-PMMA metelmällä saadaan uutta kvalitatiivista ja kvantitatiivista tietoa diffuusiolle käytettävissä olevan huokostilan leveydesta vetta johtavien ja pidättavien (varastoivien) rakojen laheisyydessa. Huokoisuutta tarkasteltiin kolmena eri alueena: muuntumattoman matriisin (tausta-) huokoisuutena, raon taytteen huokoisuutena ja raon vaikutuspiirissä olevan muuntumisvyöhykkeen huokoisuutena. Matriisien taustahuokoisuus oli alhainen ja vaihteli vain vähän (0.05 - 0.2%), raontäytteiden huokoisuus puolestaan vaihteli välillä 1 - 5%. Täytteellisten ja vetta pidattavien rakojen läheisyydessä oleva huokoisuusvyöhyke, joka pääosin aiheutuu maasälpien muuttumisesta (serisiittiyty misestä), oli tonaliitissa kapeampi kuin kiillegneississa. Tonaliitissa maasälpien muuttumista havaittiin myös huokoisuusvyöhykkeen ulkopuolella. Vulkaniitin huokoisuusvyöhykkeet olivat kapeita kuten kiillegneississä ja matriisin taustahuokoisuus oli pieni.
14 Avainsanat: kiven huokoisuus, muuttuminen, mikrorakoilu, C-PMMA-menetelmä, radioaktiivinen jäte, loppusijoitus

ABSTRACT
Assessment of bedrock performance for nuclear waste disposal can benefit from a more detailed understanding of the rock matrix properties along actual and potential groundwater flow pathways. The spatial variability along flow paths and the correlation of groundwater flow with rock matrix properties (type of minerals, porosity, internal surface areas) is an input parameter for the quantification of retarding properties and the chemical buffering capacity of the bedrock.
In this investigation tonalite, mica gneiss and volcanite samples from Syyry were studied. The samples were taken from a drill core located near water-conducting, Open fractures. The objective of the study was to describe the porosity of different altered and weathered rock matrices next to filled fissures and Open fractures.
Petrographic studies were done from several thin sections using optical rnicroscopy complemented by SEMIEDS. The porosity profiles were determined with the I4c- polymethylmethacrylate (I4C-pMMA) method. Porosity profile measurement based on autoradiographs produced by I4c-PMMA impregnation provides valuable qualitative and quantitative information on the thickness of the diffusion-accessible pore space of rock samples near water-conducting fractures and water-bearing fissures.
Rock samples from the Syyry site showed that the zones of increased porosity near water- bearing fissures in tonalites were narrower than comparable zones in rnica gneiss. The porosity profile was consistent with plagioclase sericitization in mica gneiss, but not in tonalite samples. The intermediate volcanite samples showed narrow porosity profiles next to laumontite-filled fissures and no consistent correlation with plagioclase sericitization was found. A gradual increase in porosity was observed in mica gneiss, but an abrupt decrease in porosity was found in tonalite samples. Chloritized biotite was found throughout the rock matrix in moderately altered tonalite, but no influence on the increased porosity zones near fissures was found.
Keywords: rock porosity, rock alteration, microfracturing, ' 4 ~ - ~ ~ ~ ~ method, nuclear waste disposal

CONTENTS
ABSTRACT
1. INTRODUCTION
2. GENERALGEOLOGY
3. EXPERIMENTAL
3.1 Materials
3.2 I4C-PMM~ method
3.2.1 Infiltration with 14C-methylmethacrylate
3.2.2 Digital image processing and analysis
4. RESULTS AND DISCUSSION
4.1 Porosity profiles
4.2 Comparison of porosity profiles
5. CONCLUSIONS
REFERENCES
APPENDICES

1. INTRODUCTION
The migration behaviour of radioelements through rock matrices is clearly controlled by
a complex combination of matrix diffusion and chemical interactions determined by
mineral specific compositional and microstructural factors. Diffusion of radionuclides into
the matrix of rocks along water conducting fractures and from fractures into water bearing
fissures is one of the major retarding mechanisms ensuring the safety of nuclear waste
repositories in deep geological formations. The mineral specific porosity and the breadth
of the increased porous zone near water bearing fissures are essential parameters when
appraising the ability of different rock types to retard by matrix diffusion.
Assessment of the performance of bedrock can benefit from a more detailed knowledge of
the rock matrix properties along actual and potential groundwater flow pathways. The
spatial variability along flow paths and the correlation of groundwater flow with rock
matrix properties (type of minerals, porosity profiles, internal surface areas) are input
parameters for the quantification of retarding properties and the chemical buffering
capacity of the geosphere.
In order to increase the predictability of the diffusion-releated properties of rocks in
relation to rock type and alteration, tonalite, mica gneiss and volcanite samples were
studied. The samples were taken from a drill core located near water-conductjng, Open
fractures. The objective of the study was to describe the porosity of different altered and
weathered rock matrices adjacent to filled fissures and Open fractures. Because the study
was not intended as a comprehensive site-specific investigation, but rather as a contribution
to methodological development, it was limited to sections of a single drill core.
Petrographic characterization was done analysing several thin sectjons with optical
microscopy and SEMIEDS. Porosity profiles were determined with I4c- polymethylmethacrylate ( ' 4 ~ - ~ ~ ~ ~ ) method. The measured values were fitted to a simple
equation to allow comparison of different profiles. An attempt was made to compare the
characteristics of different rock types on the basis of porosity profiles near filled fissures.
2. GENERAL GEOLOGY
The main rock types of the Syyry area are felsic plutonic rocks, particularly tonalite,
granodiorite and quartz diorite, but in the vicinity there are also schists and gneisses of
both volcanic and sedimentary origin. Southwest of Syyry there is a large occurrence of
volcanic rocks, mainly andesitic and dacitic porphyry, agglomerate and amphipolite, while
to the southeast is an area of mica schist. The more basic plutonic rocks (peridotite, gabbro
and diorite) grade into quartz diorite, tonalite and granodiorite without sharp contacts.
Granite occurs only in small amounts (Anttila et al. 1993, Salli 1967).
The stratigraphy of the area from oldest to youngest (supracrustal versus plutonic) is as
follows: arkose schists with some volcanic materia1 - ultramafic plutonic rocks and
gabbrodiorite; greywacke schists - quartz diorite, granodiorite; porphyroblastic mica schists
- granites; volcanic and subvolcanic material - various dyke rocks.
The dominant rock type in outcrop as well as in drill core from the Syyry site is tonalite,
which contains abundant inclusions (xenolithes) of various schist and plutonic rock types.
Aplite, quartz, epidote and pegmatite occur as intersecting dykes and veins. Mica gneiss
occurs in the outcrops of the study area only as inclusions, but immediately to the south
there is a fairly extensive occurence of greywacke-like mica gneiss which, according to
magnetic measurements, continues into the study area (Anttila et al. 1993).
The main folding episode in the area was isoclinal and the schistosity therefore mostly
shows steep or vertical dips. The orientations of fold axes undulate gently from the
northwest to southeast. The most intensive fracturing is restricted to the regional fracture
zones surrounding a block covering 12x25 km in the Syyry study area. The rocks in the
area underwent three significant plastic deformation phases followed by three mainly brittle
deformation phases (Kärki 1991). This study provides information about the last
deformation phases and associated weak metamorphic processes in the zeolite facies.
3. EXPERIMENTAL
3.1 Materials
The nine rock samples analyzed in this work were sawn from drill core SY7 obtained from
Sievi, Syyry (NW-Finland). Bore hole SY-KR7 intersects mainly medium grained, slightly
schistose tonalite, which contains some inclusions of fine grained and homogeneous mica
gneiss as well intermediate volcanite (tuffite). The bore hole intersected a 60 m thick
brittle-ductile shear zone. The central part of the drill core represents a distinct fracture
zone with loose rock fragments and abundant clay minerals, while part of the zone
comprises different types of mylonites. Mylonitization was followed by recrystallization,
after which the rock was affected by jointing developed in various orientations. As
hydrothermal alteration accompanied the mylonitization and late jointing, only the latter
phase contains zeolites and some prehnite as secondary minerals. Narrow (10 - 50 mm),
sharply bounded alteration zones have developed around fissures (Lindberg and Paananen
1992, Lindberg and Siitari-Kauppi 1998).
The drill core samples examined with the I 4 c - P M M ~ method were 56 mm in diameter and
ranged from 150 mm to 300 mm in length. Due to the mechanical weakness of fracture
fillings drilling can easily Open closed fractures and it was often difficult to determine by
visual inspection of the core sample, if a fracture was originally Open or a drilling artefact.
Closed fractures were nevertheless considered as potential flow pathways and included in
this study. Moreover, since core loss is comrnon near Open fractures, closed fractures and
fissures provided a more reliable basis for investigation of the systematics of alteration
profiles. The complex pattem of fissures observed at this site required long core samples
of up to 30 cm. Three rock types, mica gneiss, tonalite and intermediate volcanite, each
containing a variety of altered minerals, were studied. The sample depths, rock types and
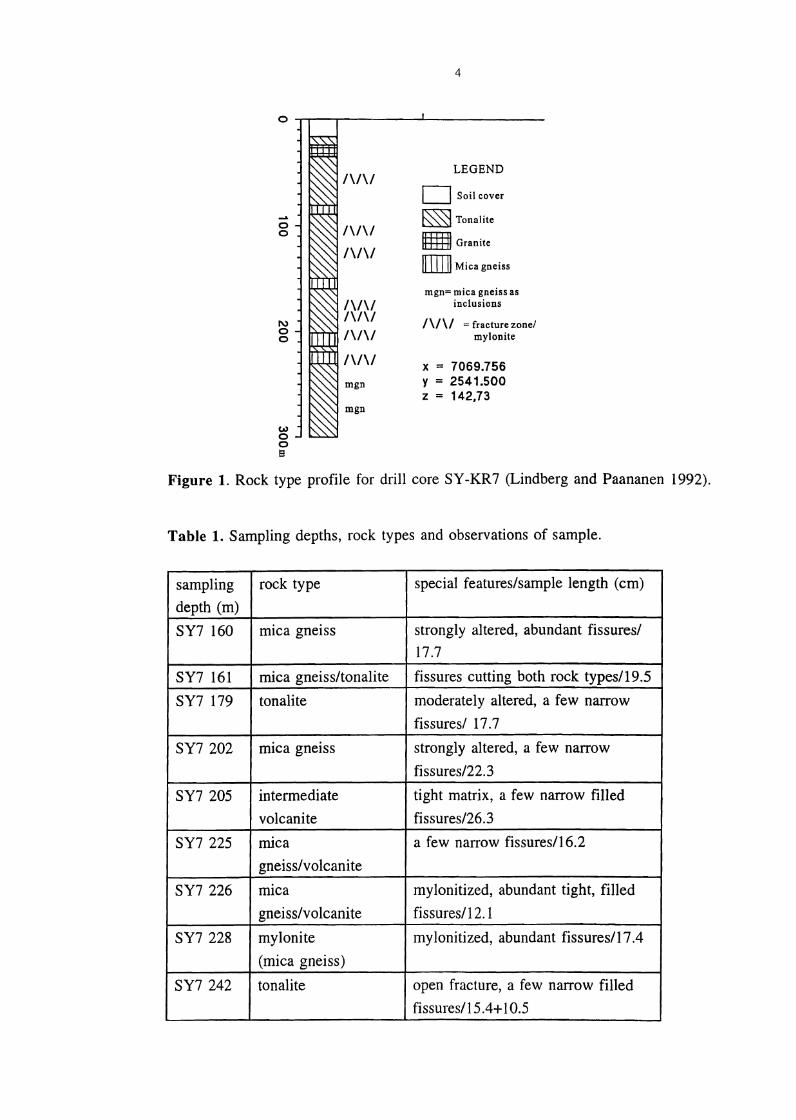
other essential observations are given in Table 1, while the rock type profile for drill core
SY-KR7 is shown in Figure 1. The sample SY7 242 m was separated into two sections
along the fracture in the middle of the core after methylmethacrylate impregnation.
LEGEND
0Soiicover
Tonalite
Granite
[rrm)Mica gneiss
mgn= mica gneiss as inclusions
/ \ / \ / = fracture zonei mylonite
B
Figure 1. Rock type profile for drill core SY-KR7 (Lindberg and Paananen
Table 1. Sampling depths, rock types and observations of sample.
sampling depth (m)
SY7 160
SY7 16 1
SY7 179
SY7 202
SY7 205
SY7 225
SY7 226
SY7 228
SY7 242
rock type
mica gneiss
mica gneissltonalite
tonalite
mica gneiss
intermediate
volcanite
mica
gneisslvolcani te
mica
gneisslvolcanite
mylonite
(mica gneiss)
tonalite
special featureslsample length (cm)
strongly altered, abundant fissuresl
17.7
fissures cutting both rock typesll9.5
moderately altered, a few narrow
fissuresl 17.7
strongly altered, a few narrow
fissuresl22.3
tight matrix, a few narrow filled
fissuresl26.3
a few narrow fissuresll6.2
mylonitized, abundant tight, filled
fissuresll2.1
myloni tized, abundant fissuresll7.4
open fracture, a few narrow filled
fissures/15.4+10.5
3.2 I 4 c - p M M ~ method
3.2.1 Infiltration with '4~-methylmethacrylate
The samples were dried at 120°C for about 2 weeks and impregnated under vacuum with
I4c labelled methylmethacrylate (14C-MM~) as described previously by Hellmuth et al.
(1993,1994). The tracer activity was 925 000 Bq/ml. The infiltration time exceeding 4
weeks to ensure thorough saturation of rock cores with I 4 c - M ~ ~ . After polymerization
with gamma radiation from a Co-60 source, core sections were sawed in two along the
axis using a diamond saw fitted with a blade 0.6 mm thick. The rock surfaces were
exposed on an X-ray film (Kodak X-Omat MA) and a p-film (Hyperfilm-pmax,
Amersham). Exposure times varied from 13 to 32 days.
3.2.2 Digital image processing and analysis
Two parallel systems were used to obtain quantitative porosity results from the
autoradiographs. The autoradiographs were digitized by video camera with zoom optics
(Quantimet-system) or were scanned with a table scanner (Ricoh FS2 -system). Both
methods allow measurement of the intensities of autoradiographs in 256 gray levels. The
resolution of the video camera system varies depending on the magnification while the
maximum resolution of the scanner is 600 dpi. The range of 150 keV P particle is about
90 pm in the matrix, which have the density of 2.7 g/cm3 and the resolution of ' 4 ~ - ~ ~ ~ ~
autoradiographs is about 20 to 30 pm (Hellmuth et al. 1993, 1994, Siitari-Kauppi et al.
1995, Rasilainen et al. 1996).
Calculation of porosity
Interpretation of the results is based on digital image analysis of autoradiographs that
begins with discretising the autoradiograph into area units called pixels. All the intensities
of the subdomains were effectively converted into corresponding optical densities which
in turn were converted into activities with the help of measured calibration curves for each
exposure. Finally the activities were converted into respective porosities. In principle the
interpretation is based on studying the abundance of tracer in each subdomain.

The intensity and the optical density
Assuming that the response of the image source and the amplifier of the digital image
analysator are linear, the digitized gray levels of the film can be treated as intensities.
Intensity means here the light intensity penetrating the autoradiographic film.
Optical densities which, according to Lambert & Beer's laws are proportional to
concentration, can be derived from intensities
where D is the optical density, 1, is the intensity of the background and 1 is the intensity
of the sample.
The activity and the optical density
A conversation function is needed to relate the measured optical densities (grey levels) to
corresponding activities. Pure 14C-PMMA standards having specific activities between 462
and 185 000 Bqlml have been used to establish the calibration f~~nct ion. The following
calibration curve was used:
where Dm,, is the maximum optical density , k is a fitting parameter, and A is the specific
activity. Solving A from the Eq. (2) gives:
The porosity
Local porosity E of the sample was simply obtained from the abundance of the tracer
(assuming constant tracer concentration in the PMMA, the higher the abundance of the
tracer, the higher the local porosity):
E = P (A1.J (4)
where A, is the speific activity of the tracer used to impregnate the rock matrix, and P is

7
the P-absorption correction factor. Absorption of P radiation in a substance depends in
practice linearly on the density of the substance . Therefore factor can be approximated
from:
B =PJPO (5
where p, is the density of the sample and p, is the density of pure PMMA (1 .18g/cm3). In
the interpretation the sample is assumed to consist of rock materal and pores (containing
PMMA), and therefore p, can be expressed as:
where p, is the density of mineral grains. In the practice of bulk measurements the average
density of the rock sample is used. Using Eqs.(5) and (6) in Eq.(4), the porosity and the
activity relationship can be solved:
The porosity of sample by each individual pixel n from the autoradiograph are calculated
according to the equations (3) and (7). The porosity histogram gives the relative frequency
of regions of individual porosities. The total porosity is obtained from the porosity
distribution by taking the weighted average:
where Area, is the area of pixel n, and E, is the local porosity of pixel n.

8
The rock is approximated as a homogeneous mixture of minerals and pore space. This
assumption is applicable when the pore apertures are below the limit of lateral resolution
of autoradiography, then the major fraction of the emitted beta radiation is attenuated by
silicate minerals, and the quantitative deterrnination of porosity from the autoradiographs
is possible.
The porosity profile
In porosity profile measurement the autoradiographs were scanned using 1-2 mm steps
across the fissure or next to the fissure or fracture. The width of the measuring frame was
convenient in relation to the grain size, corresponding to the heterogeneity, of the rock
matrix studied. Even more narrow steps could be used, but this led to unnecessary scatter
of the results. Intensities of each frame were calculated and the porosities were presented
as a function of distance.

4. RESULTS AND DISCUSSION
4.1 Porosity profiles
Porosity profile measurements were made next to the fissure, while avoiding inclusion of
the fissure filling into the calculation. Attempts to classify the profiles according to a
simplified model (see Section 4.2) were made based on these profile calculations. Most of
the profiles illustrated in Figs. 2 - 10 were scanned across the whole fissure including the
fissure filling; in those calculations the porosity of the filling materia1 could be analyzed.
The photographs and the corresponding autoradiographs of sawn surfaces are presented in
Appendices 1 - 10.
Sample SY7 160 m
The porosity profile of sample SY7 160 m and the corresponding measured area on the
autoradiograph are shown in Fig. 2. This is one of measured profiles, drawn on the
autoradiograph shown in Appendix 1.
Sample SY7 160 m consisted mainly of moderately altered fine grained, gray mica gneiss,
although medium grained tonalite occurred as a cross-cutting vein. In this sample the
fissures were filled and the altered zones next to the fissures were several mm wide, as was
evident from the sericitization of plagioclase extending for up to a distance of 5 - 25 mm
from the fissure wall. The sericitization of plagioclase grains was also consistent with the
measured zone of increased porosity. The porosity was found to be 0.3 - 0.4 % in unaltei-ed
regions. The thicknesses of fissure fillings varied from 1 mm to 5 mm and the porosities
of the fissure fillings were from 2.0 to 3.0 %. The zone of increased porosity next to the
fissures had a rather uniform porosity within the range 0.5 - 0.8 %.

0 10 20 30 40
distance (mm)
Figure 2. Porosity profile of SY7 160 m (left) and measured area on autoradiograph (right).
Sample SY7 161 m
The porosity profiles of sample SY7 161 m and the measured areas on the autoradiograph
are shown in Figs. 3 and 4. These are two of the measured profiles, drawn on the
autoradiograph shown in Appendix 2.
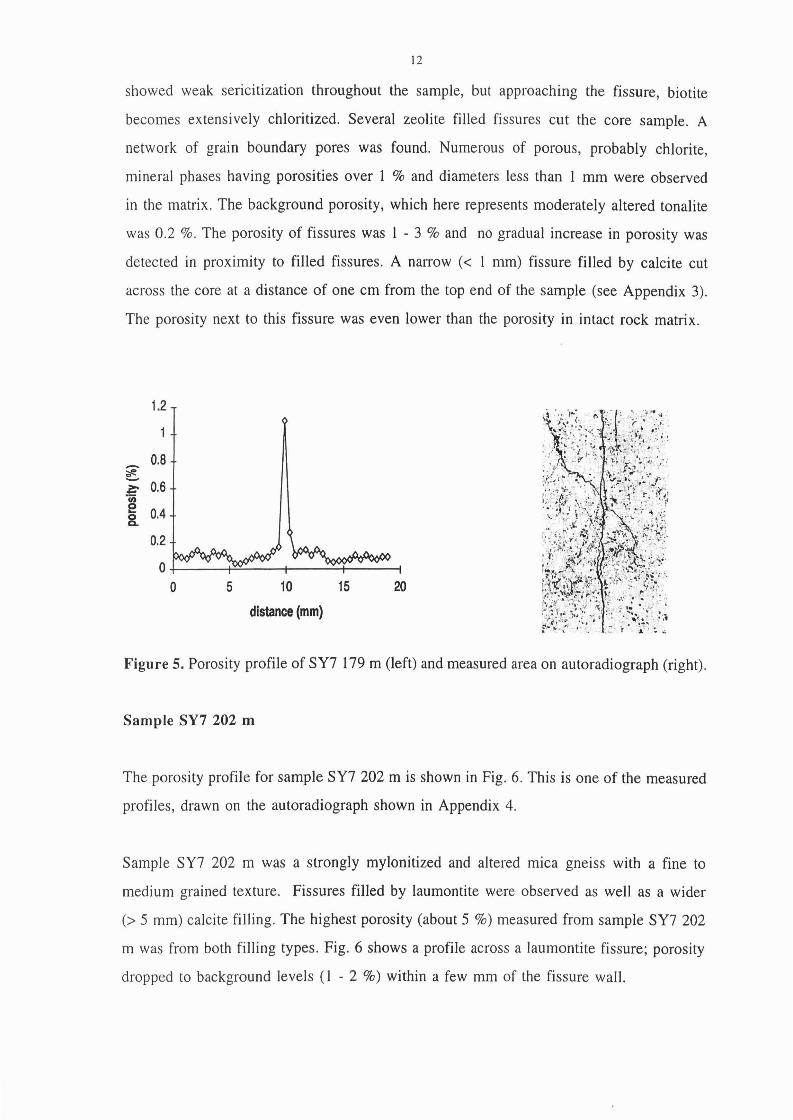
The sample SY7 161 m consisted of two rock types, namely tonalite and mica gneiss. The
contact between these two rock types is very sharp and tight. Very distinct filled fissures
with alteration zones were found to cut both the tonalite and mica gneiss. Fissures several
mm wide were filled with zeolites (laumontite, leonhardite) (Lindberg and Siitari-Kauppi
1998). The background porosities were measured in the unaltered matrix of tonalite and
mica gneiss as 0.13 % and 0.07 %, respectively. Grain boundary porosity was dominant
in the tonalite, but more even porosity distribution was found in mica gneiss due to
intraganular porosity present within biotite grains. The increased porosity was observed at
distances of up to 3 - 6 mm from the fissure filling in mica gneiss and at distances of 1 -
3 mm from the fissure filling in tonalite. The overall porosity in this alteration zone was
determined as 0.4 to 0.5 %. In tonalite the zone of increased porosity next to the fissure
was more abrupt than in the mica gneiss, due to the coarser matrix. The plagioclase grains
were sericitized to distances of 3 - 6 mm in the mica gneiss part of the sample and was
concistent with the observed increased porosity zone. Tlie alteration of plagioclase was also
observed in tonalite part of the sample, but without any concomitant increase in porosity.
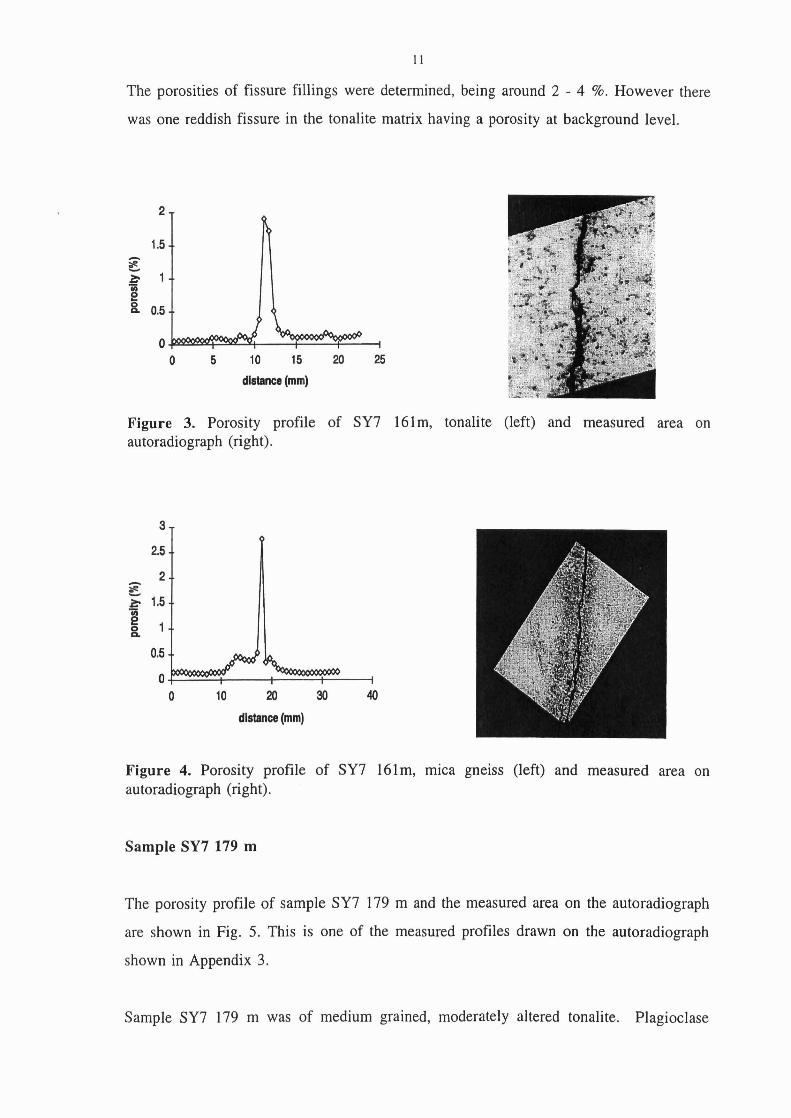
The porosities of fissure fillings were determined, being around 2 - 4 %. However there
was one reddish fissure in the tonalite matrix having a porosity at background level.
A
5.5 i?? 1 - ln
0.5
0 5 10 15 20 25
dlstance (mm)
Figure 3. Porosity profile of SY7 161m, tonalite (left) and measured area on autoradiograph (right).
0 10 20 30
dlstance (mm)
Figure 4. Porosity profile of SY7 161m, mica gneiss (left) and measured area on autoradiograph (right).
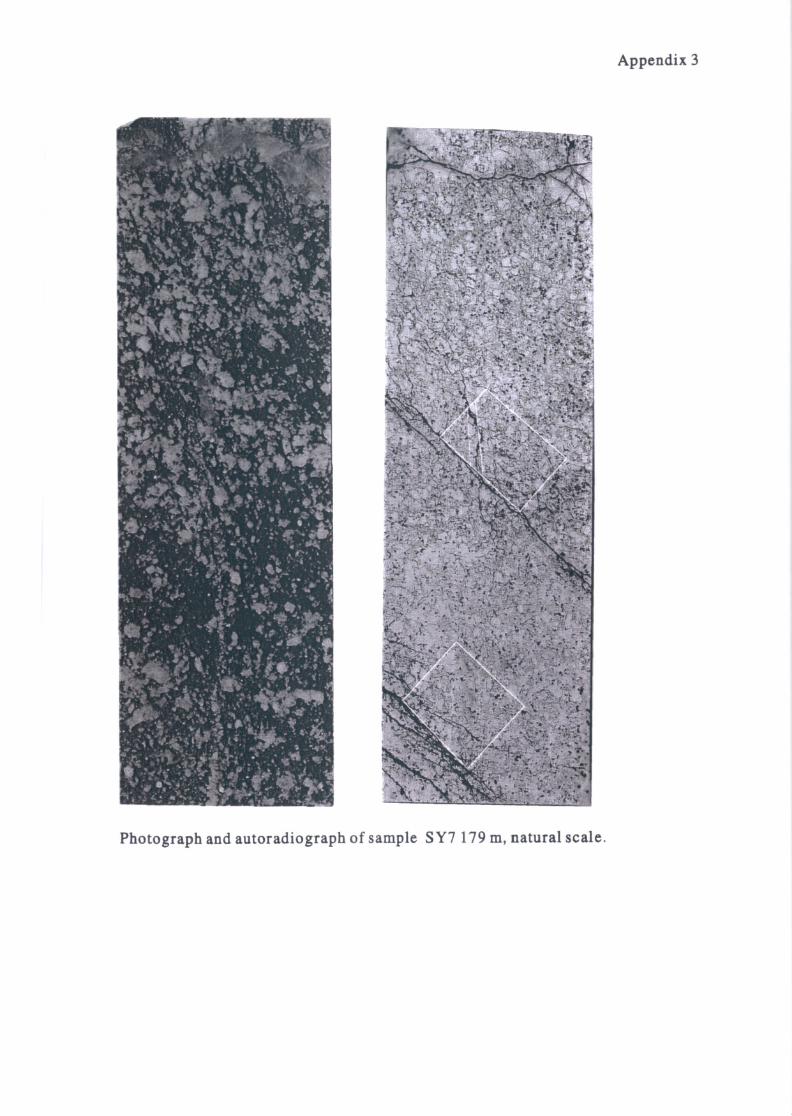
Sample SY7 179 m
The porosity profile of sample SY7 179 m and the measured area on the autoradiograph
are shown in Fig. 5. This is one of the measured profiles drawn on the autoradiograph
shown in Appendix 3.
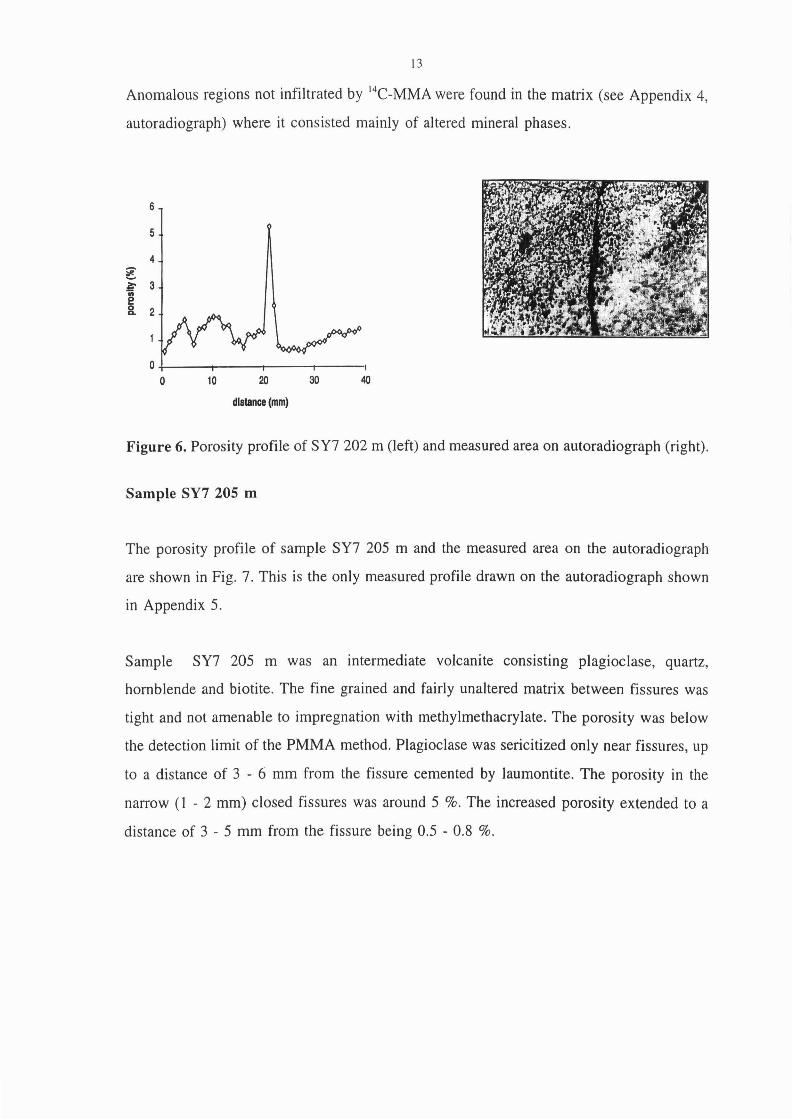
Sample SY7 179 m was of medium grained, moderately altered tonalite. Plagioclase
12
showed weak sericitization throughout the sample, but approaching the fissure, biotite
becomes extensively chloritized. Several zeolite filled fissures cut the core sample. A
network of grain boundary pores was found. Numerous of porous, probably chlorite,
mineral phases having porosities over 1 % and diameters less than 1 mm were observed
in the matrix. The background porosity, which here represents moderately altered tonalite
was 0.2 9%. The porosity of fissures was 1 - 3 % and no gradual increase in porosity was
detected in proximity to filled fissures. A narrow (< 1 mm) fissure filled by calcite cut
across the core at a distance of one cm from the top end of the sample (see Appendix 3).
The porosity next to this fissure was even lower than the porosity in intact rock matrix.
0 5 10 15 20
dlstance (mm)
Figure 5. Porosity profile of SY7 179 m (left) and measured area on autoradiograph (right).
Sarnple SY7 202 m
The porosity profile for sample SY7 202 m is shown in Fig. 6. This is one of the measured
profiles, drawn on the autoradiograph shown in Appendix 4.
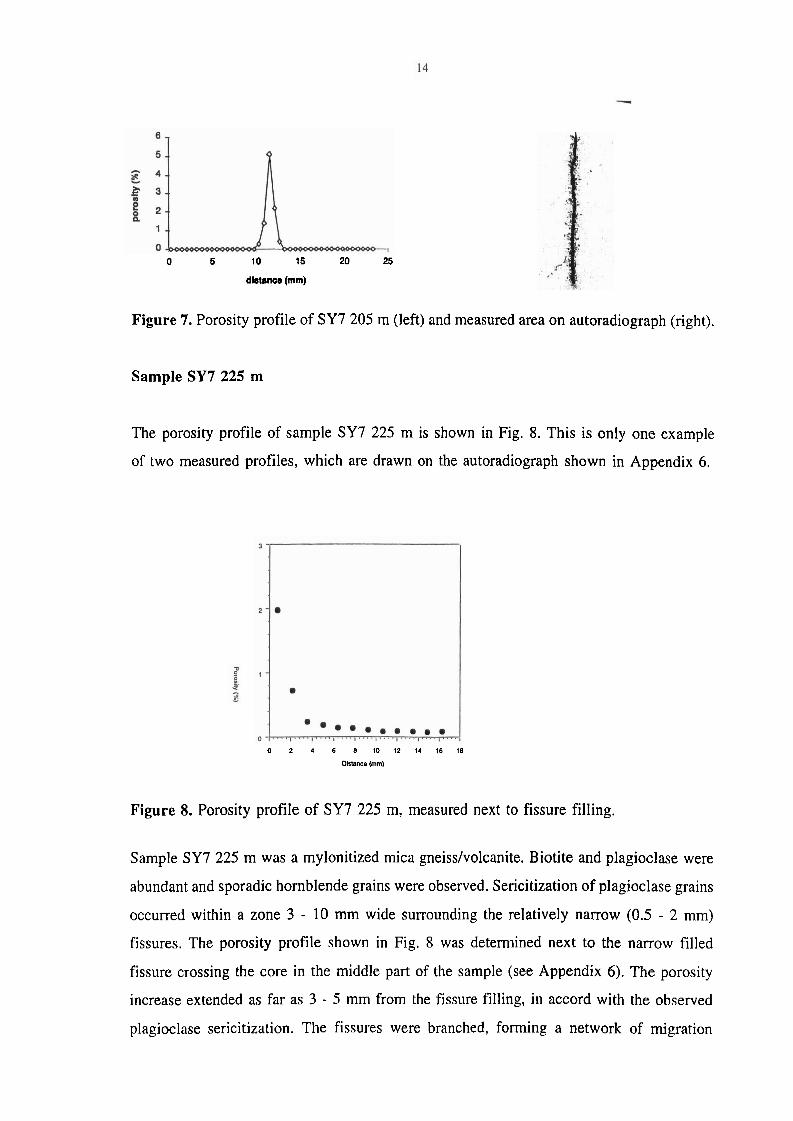
Sample SY7 202 m was a strongly mylonitized and altered mica gneiss with a fine to
medium grained texture. Fissures filled by laumontite were observed as well as a wider
(> 5 mm) calcite filling. The highest porosity (about 5 %) measured from sample SY7 202
m was from both filling types. Fig. 6 shows a profile across a laumontite fissure; porosity
dropped to background levels (1 - 2 %) within a few mm of the fissure wall.
13
Anomalous regions not infiltrated by 'T-MMA were found in the matrix (see Appendix 4,
autoradiograph) where it consisted mainly of al tered mineral phases.
0 10 20 30 40
dlstancc (mm)
Figure 6. Porosity profile of SY7 202 m (left) and measured area on autoradiograph (right).
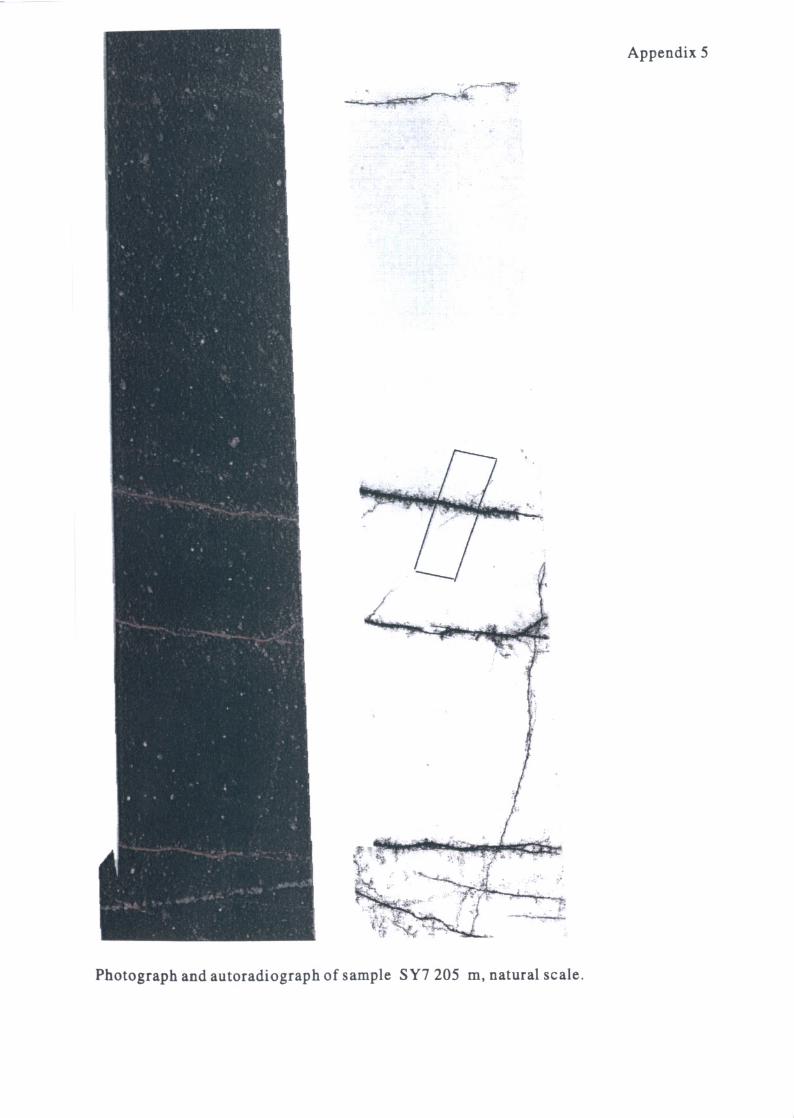
Sample SY7 205 m
The porosity profile of sample SY7 205 m and the measured area on the autoradiograph
are shown in Fig. 7. This is the only measured profile drawn on the autoradiograph shown
in Appendix 5.
Sample SY7 205 m was an intermediate volcanite consisting plagioclase, quartz,
hornblende and biotite. The fine grained and fairly unaltered matrix between fissures was
tight and not amenable to impregnation with methylmethacrylate. The porosity was below
the detection limit of the PMMA method. Plagioclase was sericitized only near fissures, up
to a distance of 3 - 6 mm from the fissure cemented by laumontite. The porosity in the
narrow (1 - 2 mm) closed fissures was around 5 %. The increased porosity extended to a
distance of 3 - 5 mm from the fissure being 0.5 - 0.8 %.
0 5 10 15 20 25
dlstancs (mm)
Figure 7. Porosity profile of SY7 205 m (left) and measured area on autoradiograph (right).
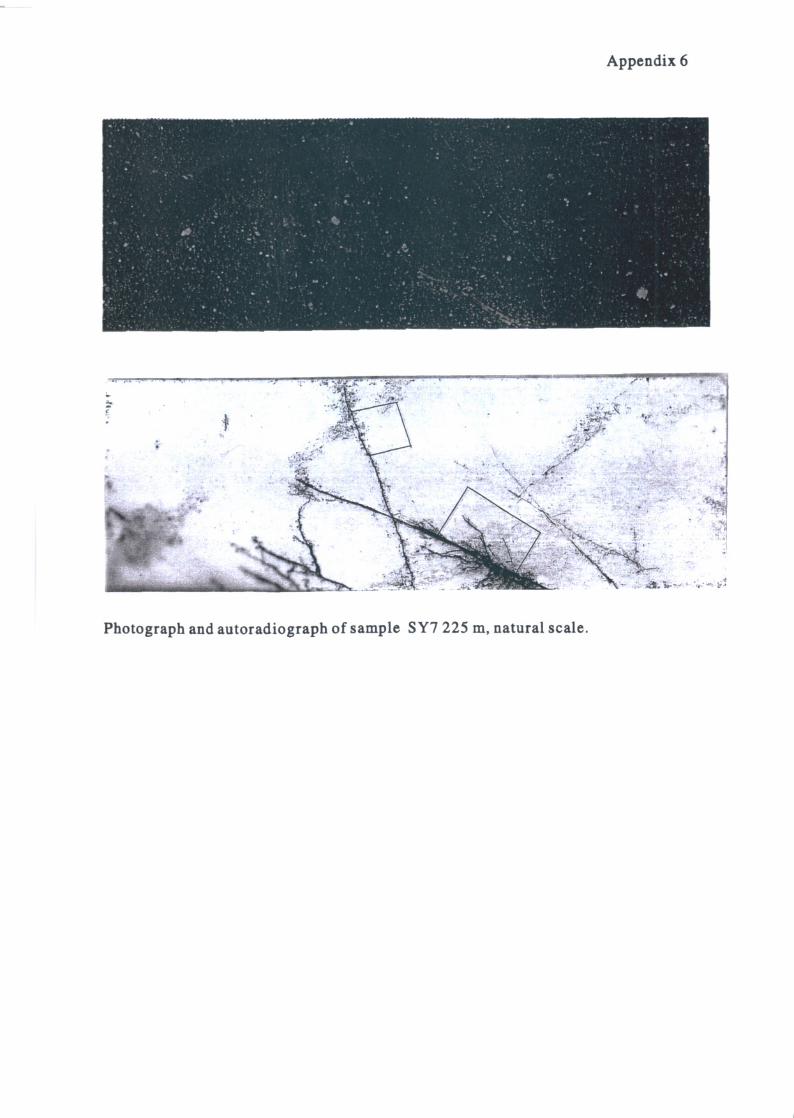
Sample SY7 225 m
The porosity profile of sample SY7 225 m is shown in Fig. 8. This is only one example
of two measured profiles, which are drawn on the autoradiograph shown in Appendix 6.
0 2 4 6 0 10 12 4 16 10
Dkinncs (mm)
Figure 8. Porosity profile of SY7 225 m, measured next to fissure filling.
Sample SY7 225 m was a mylonitized mica gneiss/volcanite. Biotite and plagioclase were
abundant and sporadic hornblende grains were observed. Sericitization of plagioclase grains
occurred within a zone 3 - 10 mm wide surrounding the relatively narrow (0.5 - 2 mm)
fissures. The porosity profile shown in Fig. 8 was determined next to the narrow filled
fissure crossing the core in the middle part of the sample (see Appendix 6). The porosity
increase extended as far as 3 - 5 mm from the fissure filling, in accord with the observed
plagioclase sericitization. The fissures were branched, forming a network of migration
15
pathways. The background porosity was 0.05 %.
Sample SY7 226 m
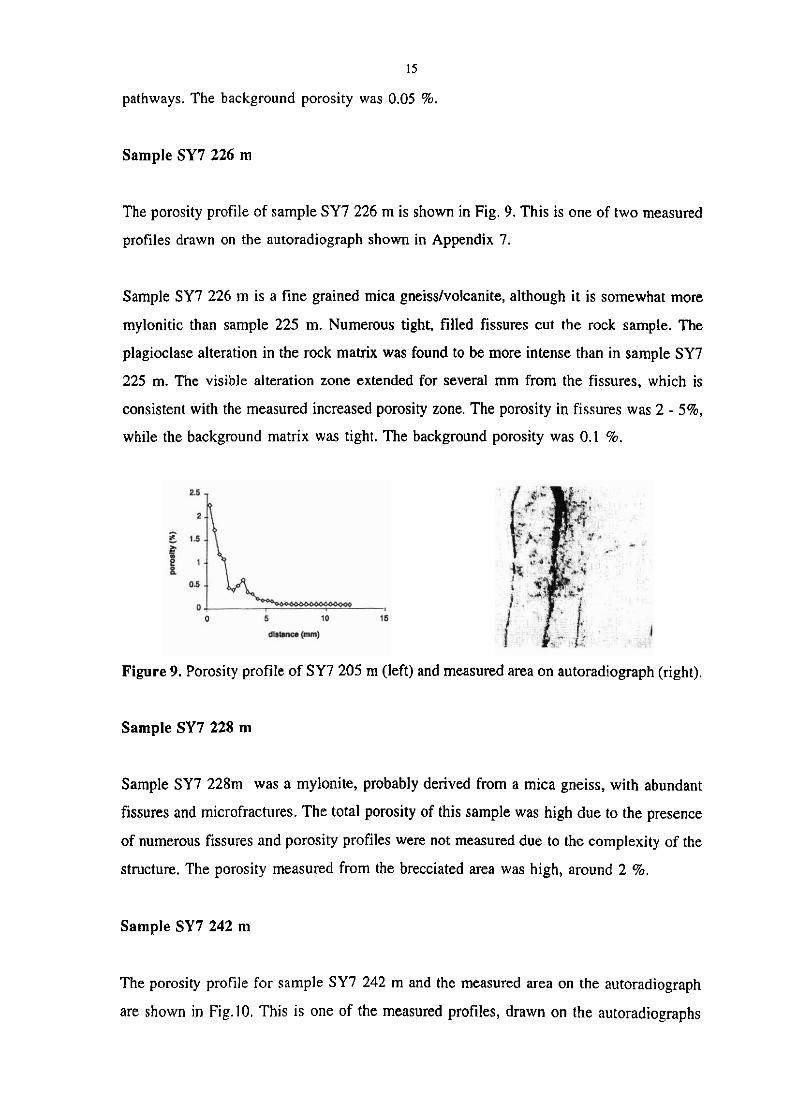
The porosity profile of sample SY7 226 m is shown in Fig. 9. This is one of two measured
profiles drawn on the autoradiograph shown in Appendix 7.
Sample SY7 226 m is a fine grained mica gneiss/volcanite, although it is somewhat more
mylonitic than sample 225 m. Numerous tight, filled fissures cut the rock sample. The
plagioclase alteration in the rock matrix was found to be more intense than in sample SY7
225 m. The visible alteration zone extended for several mm from the fissures, which is
consistent with the measured increased porosity zone. The porosity in fissures was 2 - 5%,
while the background matrix was tight. The background porosity was 0.1 %.
Figure 9. Porosity profile of SY7 205 m (left) and measured area on autoradiograph (right).
Sample SY7 228 m
Sample SY7 228m was a mylonite, probably denved from a mica gneiss, with abundant
fissures and microfractures. The total porosity of this sample was high due to the presence
of numerous fissures and porosity profiles were not measured due to the complexity of the
stmcture. The porosity measured from the brecciated area was high, around 2 %.
Sample SY7 242 m
The porosity profile for sample SY7 242 m and the measured area on the autoradiograph
are shown in Fig.10. This is one of the measured profiles, drawn on the autoradiographs

16
shown in Appendices 9 and 10, which comprise two pieces of the sample: SY7 242a m and
SY7 242b m. The sample was moderately altered tonalite, mineralogically similar to sample
SY7 179 m (described above), containing slightly sericitized plagioclase and partially
altered hornblende and biotite in the matrix.
Sample SY7 242b m contains two different kinds of fractures; at the end of the sample (see
Appendix 10, right end) there is a permeable Open fissure with rich calcite and analcime
layers on the surface and a visible alteration zone 2 cm wide. The porosity of the filling
materia1 was around 2 to 6 % and in the altered zone around 0.5 to 1.5 %. The porosity
in the intact matrix was 0.2 %. The porosity profile of the fracture zone is illustrated in
Fig. 10. Another fissure is located 11 cm from the right hand end, cemented by laumontite
and surrounded by an alteration zone around 10 mm wide. The increased porosity extended
to depths of 3 - 7 mm from laumontite fissure walls. A few narrow fissures were observed,
mostly filled by laumontite, but no distinct zone of increased porosity were recorded next
to the fissures.
3.5
- 3 5 25 ; 2 g 1.5
1
0.5 0
dlsbnce (mm)
Figure 10. Porosity profile of SY7 242b m (left) and measured area on autoradiograph (right).

17
4.2 Comparison of porosity profiles
Different porosity profiles were compared with each other by means of the simple equation:
where the parameter C, varies between 0.1 to 1.0 and is the background porosity of the
rock matrix and C,+C, is the highest porosity near the fissure. The parameter h represents
the shape of the profile.
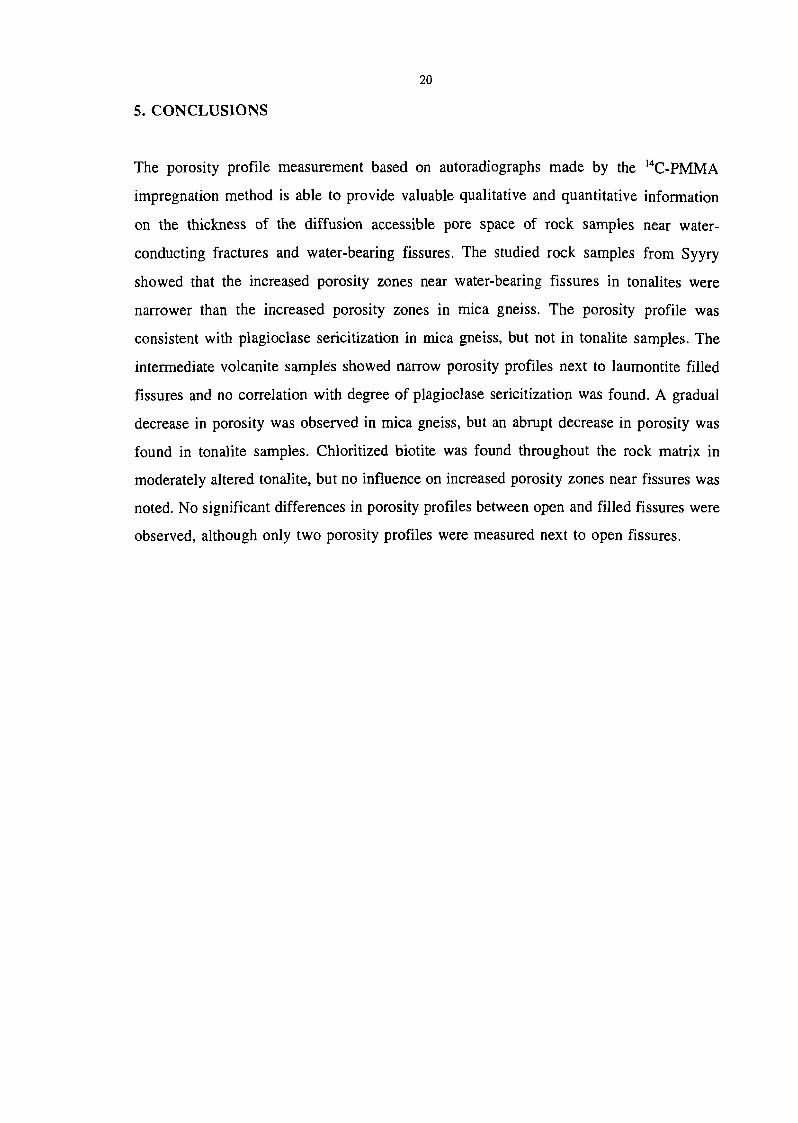
The porosity profiles for samples SY7 161 m; mica gneiss, SY7 205 m; intermediate
volcanite and SY7 242a m; tonalite, are illustrated by means of Equation 9 in Figs. 11, 12
and 13. The calculated fit using the function (9) is shown as a solid line.
Figure 11. Porosity profile for sample SY7 161 m, mica gneiss, fitted by means of Equation 9.
The h-values are surnrnarized in Table 2. An abrupt decrease was observed in porosity in
the intermediate volcanite in sample SY7 205 m. The porosity also decreased steeply in
tonalite and moderately altered tonalite samples near laumontite filled fissures, in samples
SY7 161 m and SY7 242 m. In mica gneiss samples, SY7 160 m and SY7 161 m, the
increase in porosity near fissures filled by analcime or laumontite was gradual.
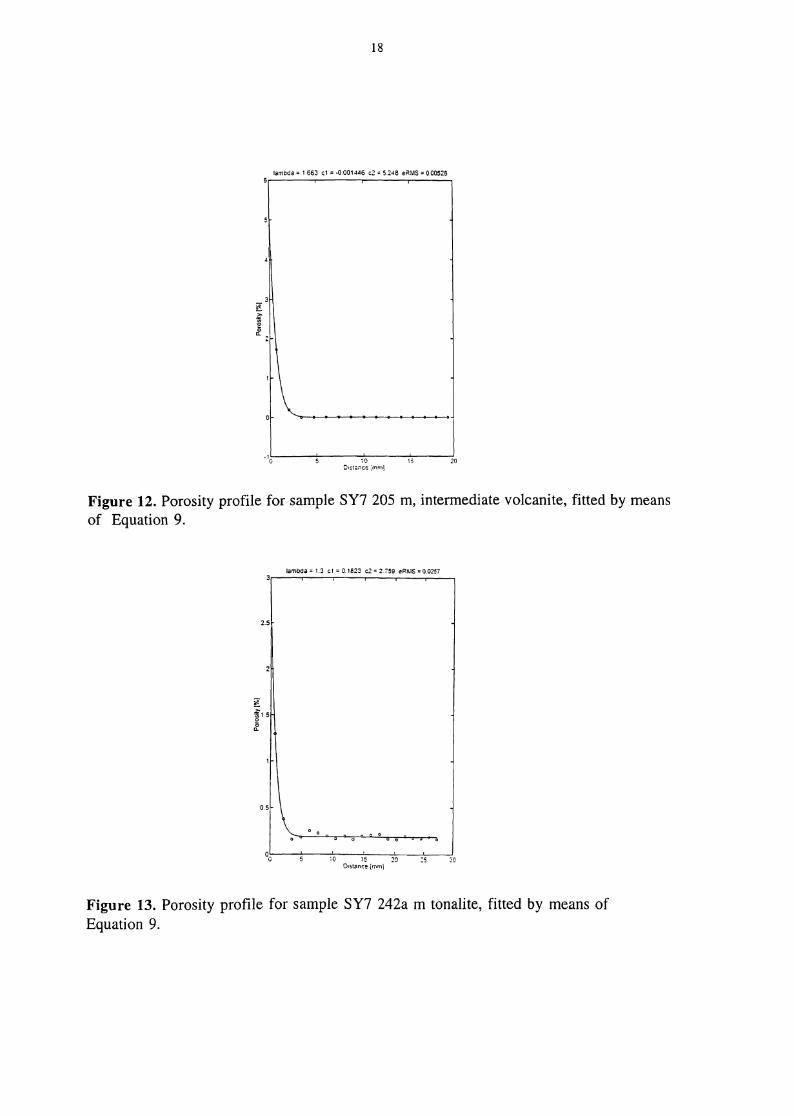
Figure 12. Porosity profile for sample SY7 205 m, intermediate volcanite, fitted by means of Equation 9.
Figure 13. Porosity profile for sample SY7 242a m tonalite, fitted by means of Equation 9.

Table 2. Parameters from porosity profile measurements. h is shape of profile and C , is background porosity .
sample
mica gneiss 0.63
SY7 161m/ tonalite 0.94 0.84
SY7 161ml mica 0.44 gneiss 0.54 SY7 179ml 0.93 tonalite 0.64 SY7 202mf mica gneiss SY7 205mI 1.66 intermediate 2.03 volcanite SY7 225ml mica 1.38 gneiss - volcanite 1.30 SY7 2261111 mica 0.70 gneiss - volcanite SY7 228ml mylonite SY7 242mAf 1.3* tonalite SY7 242mBl 1.13* tonalite 0.82
1.4 "open fissure
0.48
0.12 0.14
0.1 1 0.1 1 0.15 0.14
0.05 0.06 0.11
0.18
0.15 0.20 0.13
5. CONCLUSIONS
The porosity profile measurement based on autoradiographs made by the 14c-pMMA
impregnation method is able to provide valuable qualitative and quantitative infomation
on the thickness of the diffusion accessible pore space of rock samples near water-
conducting fractures and water-bearing fissures. The studied rock samples from Syyry
showed that the increased porosity zones near water-bearing fissures in tonalites were
narrower than the increased porosity zones in mica gneiss. The porosity profile was
consistent with plagioclase sericitization in mica gneiss, but not in tonalite samples. The
intermediate volcanite samples showed narrow porosity profiles next to laumontite filled
fissures and no correlation with degree of plagioclase sericitization was found. A gradual
decrease in porosity was obsemed in mica gneiss, but an abrupt decrease in porosity was
found in tonalite samples. Chloritized biotite was found throughout the rock matrix in
moderately altered tonalite, but no influence on increased porosity zones near fissures was
noted. No significant differences in porosity profiles between Open and filled fissures were
observed, although only two porosity profiles were measured next to Open fissures.

REFERENCES
Anttila, P., Kuivamäki, A., Lindberg, A., Kurimo, M., Paananen, M., Front, K., Pitkänen,
P. and Karki, A. 1993. The Geology of the Syyry Area, Summary report. Nuclear Waste
Comrnission of Finnish Power Companies, Report-93-19, 40p.
Hellmuth, K.H., Siitari-Kauppi, M. and Lindberg, A. 1993. Study of Porosity and Migration
Pathways in Crystalline Rock by Impregnation with '4C-polymethylmethacrylate. Journal
of Contaminant Hydrology, 13: 403-41 8.
Hellmuth, K.H., Lukkarinen, S. and Siitari-Kauppi, M. 1994. Rock Matrix Studies with
Carbon-14-Polymethylmethacrylate (PMMA); Method Development and Applications.
Isotopenpraxis Environ. Health Stud., 30: 47-60.
Karki, A. 1991. Structural Interpretation of Syyry in Sievi. Kivitieto Oy. TVOfSite
investigations, Work Report 91-06, 53p, in Finnish.
Lindberg, A. and Paananen, M. 1992. Konginkankaan Kivetyn, Sievin Syyryn ja Eurajoen
Olkiluodon kallionäytteiden petrografia, geokemia ja geofysiikka. Kairanreiät KI-KR7, SY-
KR7 ja OL-KR6. TVO/Paikkatutkimukset, Työraportti 92-34, in Finnish.
Lindberg, A. and Siitari-Kauppi, M. 1998. Shear Zone-Related Hydrothermal Alteration in
Proterozoic Rocks in Finland, in print: Water-Rock Interaction 9, New Zealand 1998.
Rasilainen, K., Hellmuth, K-H., Kivekäs, L., Melamed, A., Ruskeeniemi, T., Siitari-Kauppi,
M., Timonen, J. & Valkiainen, M. 1996. An Interlaboratory Comparison of Methods for
Measuring Rock Matrix Porosity. Espoo: VTT Energy, VTTRN 1776.
Salli, 1. 1967. Pre-quatemary rocks in Lestijärvi and Reisjarvi Map Sheet Areas.
Explanation to the Maps of Pre-quaternary Rocks. Map sheets 2341 and 2343. Geological
Map of Finland 1 : 100000. Espoo, Geological Survey of Finland, 37 p., in Finnish, English
Summary.

Siitari-Kauppi, M., Lukkarinen, S. and Lindberg, A. 1995. Study of Rock Porosity by
Impregnation with Carbon-14-Methylmethacrylate, Nuclear Waste Commission of Finnish
Power Companies, Report YJT-95-09.
APPENDICES
Appendix 1. Photograph and autoradiograph of SY7 160m.
Appendix 2. Photograph and autoradiograph of SY7 161m
Appendix 3. Photograph and autoradiograph of SY7 179m
Appendix 4. Photograph and autoradiograph of SY7 202m
Appendix 5. Photograph and autoradiograph of SY7 205m
Appendix 6. Photograph and autoradiograph of SY7 225m
Appendix 7. Photograph and autoradiograph of SY7 226m
Appendix 8. Photograph and autoradiograph of SY7 228m
Appendix 9. Photograph and autoradiograph of SY7 242a m
Appendix 10. Photograph and autoradiograph of SY7 242b m