suspension flow in microfluidic devices — a review of experimental techniques focussing on...
TRANSCRIPT
Advances in Colloid and Interface Science 173 (2012) 23–34
Contents lists available at SciVerse ScienceDirect
Advances in Colloid and Interface Science
j ourna l homepage: www.e lsev ie r .com/ locate /c is
Suspension flow in microfluidic devices — A review of experimental techniquesfocussing on concentration and velocity gradients
A.M.C. van Dinther a,⁎, C.G.P.H. Schroën a, F.J. Vergeldt c, R.G.M. van der Sman a,b, R.M. Boom a
a Agrotechnology and Food Sciences Group, Department Food Process Engineering, Building 307, Bomenweg 2, 6703 HD Wageningen, The Netherlandsb Wageningen UR Food and Biobased Research, Building 118, Bornse Weilanden 9, 6708 WG Wageningen, The Netherlandsc Laboratory of Biophysics, Building 312, Dreijenlaan 3, 6703 HA Wageningen, The Netherlands
⁎ Corresponding author. Tel.: +31 317482240.E-mail address: [email protected] (A.M.C. va
0001-8686/$ – see front matter © 2012 Elsevier B.V. Alldoi:10.1016/j.cis.2012.02.003
a b s t r a c t
a r t i c l e i n f oAvailable online 23 February 2012
Keywords:Microfluidic devicesExperimental techniquesSuspensionParticle migration
Microfluidic devices are an emerging technology for processing suspensions in e.g. medical applications,pharmaceutics and food. Compared to larger scales, particles will be more influenced by migration in micro-fluidic devices, and this may even be used to facilitate segregation and separation. In order to get most out ofthese completely new technologies, methods to experimentally measure (or compute) particle migration areneeded to gain sufficient insights for rational design. However, the currently available methods only allowlimited access to particle behaviour.In this review we compare experimental methods to investigate migration phenomena that can occur inmicrofluidic systems when operated with natural suspensions, having typical particle diameters of 0.1 to10 μm. The methods are used to monitor concentration and velocity profiles of bidisperse and polydispersesuspensions, which are notoriously difficult to measure due to the small dimensions of channels and parti-cles. Various methods have been proposed in literature: tomography, ultrasound, and optical analysis, andhere we review and evaluate them on general dimensionless numbers related to process conditions andchannel dimensions. Besides, eleven practical criteria chosen such that they can also be used for various ap-plications, are used to evaluate the performance of the methods.We found that NMR and CSLM, although expensive, are the most promising techniques to investigate flowingsuspensions in microfluidic devices, where one may be preferred over the other depending on the size, con-centration and nature of the suspension, the dimensions of the channel, and the information that has to beobtained. The paper concludes with an outlook on future developments of measurement techniques.
© 2012 Elsevier B.V. All rights reserved.
Contents
1. Introduction . . . . . . . . . . . . . . . . . . . . . . . . . . . . . . . . . . . . . . . . . . . . . . . . . . . . . . . . . . . . . . 242. Theory . . . . . . . . . . . . . . . . . . . . . . . . . . . . . . . . . . . . . . . . . . . . . . . . . . . . . . . . . . . . . . . . . 24
2.1. Reynolds number . . . . . . . . . . . . . . . . . . . . . . . . . . . . . . . . . . . . . . . . . . . . . . . . . . . . . . . . . 242.2. Péclet number . . . . . . . . . . . . . . . . . . . . . . . . . . . . . . . . . . . . . . . . . . . . . . . . . . . . . . . . . . 252.3. Channel dimensions . . . . . . . . . . . . . . . . . . . . . . . . . . . . . . . . . . . . . . . . . . . . . . . . . . . . . . . 252.4. Suspension characteristics . . . . . . . . . . . . . . . . . . . . . . . . . . . . . . . . . . . . . . . . . . . . . . . . . . . . . 252.5. Overview of process conditions in relation to migration phenomena . . . . . . . . . . . . . . . . . . . . . . . . . . . . . . . . . 26
3. Evaluation criteria . . . . . . . . . . . . . . . . . . . . . . . . . . . . . . . . . . . . . . . . . . . . . . . . . . . . . . . . . . . . 263.1. Measurement parameters . . . . . . . . . . . . . . . . . . . . . . . . . . . . . . . . . . . . . . . . . . . . . . . . . . . . . 263.2. Technique characteristics . . . . . . . . . . . . . . . . . . . . . . . . . . . . . . . . . . . . . . . . . . . . . . . . . . . . . 26
4. Measurement techniques . . . . . . . . . . . . . . . . . . . . . . . . . . . . . . . . . . . . . . . . . . . . . . . . . . . . . . . . 274.1. Tomographic methods . . . . . . . . . . . . . . . . . . . . . . . . . . . . . . . . . . . . . . . . . . . . . . . . . . . . . . 27
4.1.1. EIT (electrical impedance tomography) . . . . . . . . . . . . . . . . . . . . . . . . . . . . . . . . . . . . . . . . . . 274.1.2. NMR (nuclear magnetic resonance)/MRI (magnetic resonance imaging) . . . . . . . . . . . . . . . . . . . . . . . . . . . 274.1.3. PEPT (positron emission particle tracking)/neutron and x-ray radiographies/tomographies . . . . . . . . . . . . . . . . . . 29
4.2. Ultrasonic measurement . . . . . . . . . . . . . . . . . . . . . . . . . . . . . . . . . . . . . . . . . . . . . . . . . . . . . 29
n Dinther).
rights reserved.
24 A.M.C. van Dinther et al. / Advances in Colloid and Interface Science 173 (2012) 23–34
4.2.1. UPDV (ultrasonic pulsed Doppler velocimetry) and UVP (ultrasonic velocity profile) . . . . . . . . . . . . . . . . . . . . . 294.3. Optical methods . . . . . . . . . . . . . . . . . . . . . . . . . . . . . . . . . . . . . . . . . . . . . . . . . . . . . . . . . 30
4.3.1. LDV (laser Doppler velocimetry) and LDA (laser Doppler anemometry) . . . . . . . . . . . . . . . . . . . . . . . . . . . 304.3.2. PTV (particle tracking velocimetry) . . . . . . . . . . . . . . . . . . . . . . . . . . . . . . . . . . . . . . . . . . . . 304.3.3. Micro-PIV (micro particle image velocimetry) . . . . . . . . . . . . . . . . . . . . . . . . . . . . . . . . . . . . . . . 304.3.4. CSLM (confocal scanning laser microscopy) . . . . . . . . . . . . . . . . . . . . . . . . . . . . . . . . . . . . . . . . 314.3.5. FCS (fluorescence correlation spectroscopy) . . . . . . . . . . . . . . . . . . . . . . . . . . . . . . . . . . . . . . . . 31
5. Comparison and future developments . . . . . . . . . . . . . . . . . . . . . . . . . . . . . . . . . . . . . . . . . . . . . . . . . . . 326. Conclusions . . . . . . . . . . . . . . . . . . . . . . . . . . . . . . . . . . . . . . . . . . . . . . . . . . . . . . . . . . . . . . . 32Acknowledgement . . . . . . . . . . . . . . . . . . . . . . . . . . . . . . . . . . . . . . . . . . . . . . . . . . . . . . . . . . . . . . 32References . . . . . . . . . . . . . . . . . . . . . . . . . . . . . . . . . . . . . . . . . . . . . . . . . . . . . . . . . . . . . . . . . . 33
1. Introduction
Microfluidic devices are increasingly used in for example (cell) bi-ology, food, pharmaceutics and chemical synthesis [1]. Their advan-tages are the small volume and large surface area, leading to bettermass and heat transfer. Besides, they can be used manipulate multi-phase systems (e.g. for the preparation of droplets or particles) butalso to manipulate particle suspensions or emulsions and induce mi-gration phenomena. Particles can migrate to specific regions in achannel as a result of fluid flow phenomena and particle interactions.Migration of particles perpendicular to the flow can be a disadvantagewhen heat treatment of suspensions is concerned; residence time dis-tribution occurs with different heat treatment as result. This can leadto rheological and structural changes of the product [2–6] and forfoods even to implications for microbial food safety [7]. However, mi-gration of particles to specific regions in the channel, can also bebeneficial, for example in (membrane) separation processes [8,9]. Es-pecially in the last decade, the interest in the separation and fraction-ation of food suspensions is increasing; illustrative examples areremoval of specific components (e.g. bacteria from milk), concentra-tion (e.g. removal of water from fruit juices) or isolation of specificfractions as new food products or ingredients (e.g. milk fat globulesfrom milk proteins) [10–13].
Biological cells can be cultivated and investigated individually inmicrofluidic devices, and in order to control migration, this is oftendone in microdroplets in microchannels, also known as ‘biphasic’,‘segmented’, or ‘plug-based’ microfluidics [14,15], where liquid seg-ments are used to compartmentalise the device. Mostly this is notan option and migration will take place when flowing a suspensionthrough a microchannel, be it in biological applications, medicine oroceanography, where cell types can be differentiated based on flowbehaviour in a fast and accurate manner [16–19]. The newest devel-opments in the field of separation revolve around microfluidic de-vices that can be used to sort cells and DNA [20–26].
Inmicrofluidic devices, it is not easy to trace micron particles in nar-row channels and at these small scales, process conditions also influ-ence migration strongly, which makes it difficult to establishconcentration and velocity profiles that are needed to effectively usemigration phenomena in the design of such devices [22,26]. Besides,natural suspensions tend to be concentrated and this makes measure-ment of particle migration even more complex. To understand particlebehaviour in microfluidic devices it is of eminent importance to beable to measure the influence of process conditions on particle migra-tion. Here, we distinguish three common migration phenomena, forparticles that are in the range of nanometres to millimetres, beingshear-induced diffusion, inertial lift and Brownian diffusion. Particlesin the order of nanometres are mainly sensitive to Brownian diffusion;for particles between 0.1 and 10 μm shear-induced diffusion plays amajor role and for even larger particles, inertial lift is the main migra-tion phenomenon [27]. The ‘particle’ radius (a) (with which we meanany component, not necessary a solid particle), relative to the dimen-sions of the device (like half the channel height, h0) determines thescale at whichmigration phenomena play a role (see also next section).
The goal that we set for this paper is to evaluate experimentalmethods on their suitability to measure migration phenomena inmicrofluidic devices based on knowledge about migration phenome-na and other characteristics of the techniques.
2. Theory
In Poiseuille flow, which occurs when a viscous fluid flows in achannel and a constant pressure gradient over the length is applied,the flow has a characteristic parabolic profile, and this is alsoexpected to be the case in microfluidic devices. For a no slip velocityat the walls (vwall=0), the velocity at a certain height in the channel(vx(y) (m/s)) is given by Eq. (1).
vx yð Þ ¼ 12η ϕð Þ
ΔpLx
h2
� �2−y2
� �: ð1Þ
Here Δp is the pressure drop (Pa) over the channel length (Lx(m)), h is the channel height (m) and y is the position of the particlerelative to the wall (m). η(ϕ) is the viscosity of the suspension as afunction of the particle volume fraction ϕ, which is described byEq. (2) [28],
η ϕð Þη0
¼ 1− ϕϕmax
� �− η½ �ϕmax
ð2Þ
η0 is the viscosity of the particle-free liquid (Pa·s), ϕmax themaximumrandom packing density for the suspension (−) (assumed to be 0.64for monodisperse suspensions of hard spheres), and [η] is the intrin-sic relative viscosity of the suspension (assumed to be 2.68 asreported by Phillips et al. [29] or 2.5 by Einstein).
Particles present in Poiseulle flow, will experience a velocity gra-dient, and depending on their size they may migrate to other flowlanes. Viscous forces, combined with inter-particle interactions leadto hydrodynamic diffusion of particles in the range of 1–10 μm(shear-induced diffusion), and inertial forces (inertial lift) of parti-cles>10 μm. The importance of these mechanisms can be derivedfrom the ratio between inertial and viscous forces, characterised bythe Reynolds number, as discussed in the next section. To be com-plete, Brownian motion generally leads to random motion of parti-cles, but may lead to separation when an external field is applied, asit is the case in field flow fractionation [30]. This latter case, we willnot discuss further in this review.
2.1. Reynolds number
The Reynolds number defines the ratio of inertial to viscous forcesand is shown in Eq. (3).
Rec ¼ρvDh
η ϕð Þ : ð3Þ

25A.M.C. van Dinther et al. / Advances in Colloid and Interface Science 173 (2012) 23–34
For a rectangular channel, as it is mostly the case in microfluidicdevices, the hydraulic diameter is described in Eq. (4). For other ge-ometries, different equations are available.
Dh ¼ 4wh0wþ 2h0ð Þ : ð4Þ
In which ρ is the density, v is the average velocity in the channel,Dh is the hydraulic diameter (Eq. (4)),w is the channel width (m) andh0 is half the height of the channel (m).
Shear-induced diffusion occurs already at low Reynolds numbers,where inertia is not relevant. As a rule of thumb, inertial lift only takesplace in a rectangular channel when the Reynolds number of the par-ticle Rep (−) defined in Eq. (5) [31], is larger than 1.
Rep ¼ RecaDh
� �2¼ γρa2 wþ 2h0ð Þ
3η ϕð Þw ð5Þ
γ ¼ 3vh0
: ð6Þ
In which, γ is the shear rate (1/s) given in Eq. (6), a is the particleradius (m), Rep is the particle Reynolds number and Rec is the channelReynolds number (as defined in Eq. (3)).
2.2. Péclet number
The ratio between convection and diffusion, characterised by thePéclet number, defines the ratio between hydrodynamic forces andBrownian diffusion. It indicates whether hydrodynamic migration orBrownian diffusion is dominant and relates this to dimensions ofthe device. Transition frommainly Brownian to hydrodynamic migra-tion occurs at a Péclet number of 1, as defined in Eq. (7) [32]. In sys-tems where hydrodynamic migration should be dominant, conditionslike channel height, velocity and viscosity should be chosen in such away that Péclet numbers are larger than 1.
Pe ¼ γa2
D¼ 6γa3η ϕð Þπ
kT: ð7Þ
Where k the Boltzmann constant (1.380×10⁻²³ J/K) and T thetemperature (K), and D is given by the Stokes–Einstein diffusivity(m2/s) given in Eq. (8).
D ¼ kT6πη ϕð Þa : ð8Þ
Hydrodynamic forces in a Poiseuille type flow field cause the par-ticles to concentrate at certain regions, e.g. the centre of the channelin case of shear-induced diffusion or off-axis focusing (i.e. ‘tubularpinch’) in the case of inertial lift. Brownian motion may counteractthese effects, but is mostly much weaker. For example, for a dilutesuspension with 1 μm particles in a 100 μm channel, a velocity largerthan 4 μm/s already causes the migration effect to surpass Brownianmotion.
Besides the Reynolds and Péclet numbers described here, whichare really focussing on particle behaviour, there are also other dimen-sionless numbers expressing the relevance of various physical phe-nomena in microfluidic devices. For a complete overview, we wouldlike to refer through to the review by Squires et al. [33].
2.3. Channel dimensions
Combining Eqs. (6) and (7) leads to the conclusion that in micro-channels, where the particle to channel ratio (a/h0) is comparatively
large, the Péclet number is often larger than 1 and that leads to dom-inance of hydrodynamic diffusion.
The particle Reynolds number increases with a/h0 ratio, which indi-cates that the lift effect becomes more pronounced at higher a/h0 ratio(Eq. (5)). The same holds for shear-induced diffusion, where theshear-induced self-diffusion coefficient can be described by Eq. (9).
Dshear ¼ D ϕð Þγa2: ð9Þ
The typical average shear rate (γ) in a channel can be estimatedfrom the average flow velocity divided by the half-height of the chan-nel (v/h0). D(ϕ) is a dimensionless function of the solid volume frac-tion (ϕ (−)), for which several comparable equations are known inliterature. Here we follow the approach by Leighton and Acrivos[34] for spherical-shaped particles.
D ϕð Þ ¼ ϕ2 1þ e8:8ϕ� �
: ð10Þ
In systems with gradients in concentration, shear rate and/or vis-cosity, the self-diffusion coefficient cannot be directly taken to de-scribe migration and the shear-induced migration flux under theseconditions needs to be taken into account. Phillips et al. [29] proposeda model, described in Eq. (11).
J ¼ −Dca2ϕ∇ ϕγð Þ−Dμa
2ϕ2γ∇ln η ϕð Þð Þ: ð11Þ
In which Dc and Dμ are dimensionless parameters (possibly linkedto the self-diffusion coefficient). The gradients include the shear rateand the viscosity, which is influenced by the distribution of the parti-cles over the channel. This relation shows that the particles willdistribute unevenly when the suspension is subjected to a non-homogeneous shear field (e.g., Poiseuille flow). One can see thatsince the shear rate at the centre of a flow channel is zero, the equa-tion predicts that particles will move towards the centre of the chan-nel, even against their own concentration gradient.
Particle migration is much more likely to occur in small channelsthan in traditional process equipment that uses larger dimensions.First of all, the gradients will be larger; second, the distance overwhich migration has to take place is much shorter. Knowledgeabout these aspects, is expected to drive development of micro-technological devices for e.g. food, biological and chemical applica-tions in which particles from 0.1 to 10 μm are abundantly availablemuch further.
2.4. Suspension characteristics
For shear-induced diffusion the dependency of the dimensionlessdiffusion coefficient depends on the particle shape. Non-sphericalparticles have shear-induced diffusivities up to five times largerthan diffusivities of spheres [35], e.g. Rusconi and Stone found valuesthat were two times higher for plate-like clay particles [36].
Furthermore natural particles can be deformable. In case of iner-tial lift in Poiseuille flow, it was demonstrated that under the condi-tions where rigid particles migrate to an equilibrium radial positionin the tube, neutrally buoyant, deformable particles may migrate tothe tube axis [37] depending on the liquid behaviour [38]. Faivre etal. demonstrated this with deformable blood cells, which causes alarger particle free layer near the wall than found for rigid particles[39].
All presented equations hold for monodisperse suspensions, butcan also be applied to other suspensions that tend to be polydispersedue to natural variation. Polydispersity can cause several migrationphenomena to be taking place simultaneously or causes a migrationeffect to be important over a broader range of sizes.

26 A.M.C. van Dinther et al. / Advances in Colloid and Interface Science 173 (2012) 23–34
2.5. Overview of process conditions in relation to migration phenomena
In Table 1, an overview is given of the conditions expressed as di-mensionless numbers related to migration mechanisms; please note,these values are indicative. Shear-induced diffusion is dominant inconcentrated systems and at low Reynolds numbers, while inertiallift is more dominant in dilute suspensions at high Reynolds numbers.Both low and high Reynolds numbers can be applied in microfluidics,which allows a choice in migration mechanism, as for example dem-onstrated in the work of Di Carlo who showed that inertial lift isabundantly used in microfluidic devices [40].
This is the general case, when using polydisperse suspensions, orsuspensions with non-spherical or even deformable particles thiswill lead to extra implications for the technology used to determineconcentration or velocity profiles in microfluidic devices. The spatialand temporal resolutions of the technique will determine therange of particle Reynolds numbers and Péclet numbers that can beinvestigated.
For magnetic resonance imaging and ultrasonic pulsed Dopplervelocimetry, a survey has been performed by Powell et al., 2008[41], and Aubin et al. [42] discussed measurement techniques formicrochannels, mainly focussing on mixing of fluids and measure-ments of droplets under static conditions. The objective of our paperis to evaluate all existing experimental methods which are able togive detailed information about migration phenomena in realistic,flowing suspensions. The evaluation includes optical techniques spe-cifically targeted at confined flow geometries such as microfluidic de-vices, but also tomography and ultrasound.
All methods are evaluated and compared, as presented in Tables 2and 3, through which a choice can be made for the most appropriatemethod to study particle migration in suspensions in microfluidic de-vices, and an outlook is given on expected developments.
To be complete, modelling can be a useful tool to investigate par-ticle migration, and considerable progress has been made in recentyears. An extensive review about modelling in microfluidic devicesis written by Erickson [43]. The physics involved are very complexand necessarily ‘simplified’ systems are used in modelling; a recentreview for mainly shear-induced migration in flowing viscous, con-centrated particle suspensions is written by Vollebregt et al. [44].Further, it has been reported that entrance/exit effects are difficultto cover as are wall-particle hydrodynamic interactions [45], especial-ly when differently shaped, deformable, natural particles are used,e.g. blood cells in vessels [46], or when there is an obstacle in thechannel [47]. For this review, we consider modelling techniques out-side the scope.
3. Evaluation criteria
The eight measurement techniques are presented in the nextchapter, and four dimensionless numbers will initially be used forthe evaluation. Two are already mentioned, i.e. Reynolds and Pécletnumber, and two others will be defined in Sections 3.2d and e. How-ever, there are more specific requirements that we summarized ineleven criteria related to the nature of the suspension, module ormeasurement parameters (discussed in Section 3.2). These eleven cri-teria can be divided into measurement parameters and techniquecharacteristics, which are specific for the method used in relation tomeasurement of concentrated natural suspensions.
Table 1Overview of conditions at which different migration phenomena are dominant.
Pe Re Rep ϕ
Brownian diffusion b1 b10 b1 Increase ϕ, decreShear-induced diffusion >1 b10 b1 Increase ϕ, increaInertial lift >1 10–1000 1–100 Increase ϕ, decre
3.1. Measurement parameters
Three quantities need to be measured, preferably simultaneously,all as function of the 3D location in the channel:
(1) The volume fraction of the particles(2) The velocity of the particles(3) The particle size (distribution) and shape
A measurement technique is needed that allows for single particledetection in space as well as in time and discriminates between par-ticles. As biological suspensions are often polydisperse, informationabout particle size and spatial locationwould be a key parameter to in-vestigate. For most measurement techniques it would be easy if par-ticles of different sizes or shapes have different material propertiesto distinguish them, or can be labelled with different markers; obvi-ously in a real system this would mostly not be possible. On theother hand, if the size or shape of the particle itself can be measuredwith the measurement technique, differentiation becomes morestraightforward.
3.2. Technique characteristics
Below the list of technical characteristics that we identified as im-portant for the measurement of realistic suspensions.
(a) The technique should not be limited to model suspensions, butshould be usable with practical media. The fluidic properties ofsuspensions are dependent on many parameters; simplifyingthe suspension into a model suspension may well fundamen-tally change the behaviour of the fluid. Changing particle prop-erties might lead to different migration behaviour and inindustrial processes, particles should be traced inline in orderto control the process.
(b) Practically relevant media are often concentrated, and thereforethe technique should be able to measure concentrated sys-tems. High concentrations of suspended particles can influencevisibility; therefore, most systems are opaque, and opticalmeasurement techniques are less suited. Often model systemsare used in which the optical index of particles and surround-ing liquid are matched. The reflection of light at the particlesurface is minimized and consequently other properties of par-ticles can be used to determine concentration and velocity pro-files, e.g. fluorescently dyed particles under a laser microscope.Additionally, not all techniques are suitable to measure con-centrated suspensions, due to scattering and interference,resulting in a low signal-to-noise ratio.
(c) As mentioned, the signal-to-noise ratio should be high enoughto distinguish signal from noise. When the signal-to-noiseratio is too low, the data become less reliable. We could saythat the signal needs to be at least twice as big as the noise,but preferably this ratio is larger. For example, the Péclet num-ber from Eq. (4) should be larger than 1 to have sufficient sig-nal over the noise caused by Brownian diffusion.
(d) The fourth characteristic is spatial resolution. Here also thesuspension characteristics determine whether the spatial reso-lution of a technique is sufficient. Suspensions can be distin-guished based on particle sizes present and in this article wefocus on suspensions, with sizes typically between 0.1 and
a/h0 a
ase Brownian diffusion N.A. ab1·10−6 mse shear-induced diffusion Large (a/h0≥0.1) 1·10−6 mbab1·10−5 mase inertial lift Large (a/h0≥0.1) a>1·10−5 m

Table 2Overview of scores on dimensionless numbers for different techniques.
Method Tomographic methods Neutron andX-ray radiographies
Ultrasonic methods Optical methods
EIT MRI NMR(no imaging)
UPDV/UVP (μ)-PIV+PTV LDV/LDA/PDA CSLM FCS
Péclet number (>1) ≫1 ≫1 ≫1 ≫1 ≫1 ≫1 ≫1 ≫1 ≫1Δx/a (b1) b10 b100 N.A. b100 >100 b10 b100 b10 b1vΔt/Δx (bb1) b10 b10 N.A. b1 b1 bb1 b10 b10 b10Reynolds >10 b100 b100 b100 b10 b100 b100 b10 b10
27A.M.C. van Dinther et al. / Advances in Colloid and Interface Science 173 (2012) 23–34
10 μm. Detection of single particles in these size ranges canonly be possible in a measurement volume in the order of afew micron cubed. The measurement technique should there-fore have a spatial resolution slightly smaller than 1 μm, i.e.Δx/ab1.
(e) Besides spatial resolution, time resolution is important as well.The temporal resolution should be much smaller than 1 s athigh velocities, for tracking particles in the flow, i.e. Δx/v≪Δtor a/v≪Δt.
(f) It is obvious that the measurement technique should be non-invasive. If the flow is disturbed, migration of particles will beinfluenced.
(g) Data analysis can be time consuming and rather complicated.Especially for industrial use this should be prevented.
(h) Even though cost is not of the utmost importance for an analysistechnique, some techniques, such as NMR, require extensiveequipment when applied with high resolution. Obviously, atechnique that yields the same resolution but ismore cost effec-tive is preferred.
4. Measurement techniques
4.1. Tomographic methods
4.1.1. EIT (electrical impedance tomography)Electrical Impedance Tomography is a technique where the differ-
ence in electrical conductivity is measured to determine the distribu-tion of a phase with lower conductivity than the continuous phase.The technique was for the first time used to study the spatial distribu-tion of air and water flow in a pipe [48]. Networks of wires wereinstalled in the cross-sectional area; the extremely small diameterof the wires did not disturb the flow. Electrodes can also be installedat the outside of the pipe, thereby preventing any hindrance for theflowing suspension. From the conductance between two parallelwires, the phase distribution or particle volume fraction can be deter-mined via numerical inversion, which is relevant for measurement oftwo-phase systems [49].
4.1.1.1. Advantages and disadvantages. EIT is a technique that can wellbe used for the measurement of concentration profiles of concentrat-ed suspensions. Although EIT is not a common technique to measureparticle migration in pressure-driven flow, it was successfully used byButler et al., for suspensions up to 0.40 solid volume fraction, with200 μm particles in a 2 cm channel [50]. Measurement of these con-centration profiles can be done for a large range of Reynolds numbers,with velocities up to 3 m/s [49]. However, the velocity profiles andparticle sizes as a function of spatial position cannot be measured,while the data analysis is time consuming.
EIT is known to be a relatively inexpensive technique with a goodtime resolution; data can usually be measured within less than 1 s[50,51], with a minimum of even 5 ms [49]. The main reason whyEIT is not often used for suspension flow is the need for a large differ-ence in electrical conductivity between particles and the fluid [52]and its commonly poor spatial resolution (5% of the channel).
Although Reinecke et al. showed that 1 μm particles flowing at a ve-locity of 1 μm/s could be detected in a 100 μm channel (1% spatial res-olution), it should be noted that this is on the limit of the technique[49]. Improvements in spatial resolution have mainly been focussedon combination of EIT with other techniques like Nuclear MagneticResonance, described in the next section, to create higher resolutionconductivity images [42].
4.1.1.2. Applicability for practical suspensions in microfluidic devices.Only recently EIT has been used in microchannels. Before, EIT wasmainly applied to relatively large channels and particles. Measure-ment of particles smaller than 10 μm is shown to be possible, aslong as the difference in conductivity between solvent and particlesis sufficient. In milk, for example, the non-fat part of milk has a con-ductance of 5.40 mS at 100 kHz, while addition of 3.6% fat reducesthe average conductance to 5.05 mS. The conductance differencecan be used to investigate the migration of milk fat globules withEIT, although spatial resolution might be low for 4 micron fat globules[53]. Ayliffe et al. successfully used microelectric impedance with in-tegrated electrodes in a 10 micron channel for the detection of biolog-ical cells and a polymer dispersion [54]. This technique (sometimesslightly modified) is increasingly used in biological cell characterisa-tion in small chips [55].
Also Bao et al. have written an extensive review about electricanalysis of cells in microfluidic devices [56]. The short measurementdistance in microchannels improves conductivity measurement, aslong as electrodes and no wires are used [54], and this is a big profor application of this technique.
4.1.2. NMR (nuclear magnetic resonance)/MRI(magnetic resonance imaging)
Nuclear magnetic resonance is often used to study migration ofparticles; the interested reader is referred to a recent review byPowell et al. [41]. NMR allows the detection of the volume fraction(s),the physical behaviour (physical response) as well as properties(physical system's state). The sample is placed in an external magnet-ic field and commonly the resonance frequency of protons (1H), aswell as the relaxation times of the signal is measured. The amplitudeof the signal can be related to proton density, which is related to theamount of a certain component present [57].
4.1.2.1. Advantages and disadvantages. The main advantage of NMR isits versatility: many parameters can be evaluated simultaneously, in-cluding concentration distributions, velocity fields, diffusion rates andvelocity fluctuation correlations, as well as information on pores andviscosity [58,59]. Interesting is the possibility to measure size distri-butions of droplets in an emulsion, based on hindered diffusion ofone component in another phase [5,60,61].
Especially d'Avila et al. studied concentrated emulsions underflow and showed the possibility to measure velocity, droplet size dis-tribution and volume fraction with different techniques within MRI,although the droplet sizes were measured under static conditions[60]. The NMR technique can measure highly concentrated suspen-sions without disturbing fluid flow. The range of flow velocities is

Table3
Ove
rview
ofscores
onev
alua
tion
criteria
fordifferen
ttech
niqu
es.
Metho
dTo
mog
raph
icmetho
dsUltrasonic
metho
dsOptical
metho
ds
EIT
MRI
NMR(n
oim
aging)
Neu
tron
andX-ray
radiog
raph
ies
UPD
V/U
VP
(μ)-PIV+
PTV
LDV/LDA/PDA
CSLM
FCS
Mea
suremen
tpa
rameters
Veloc
ityprofi
le––
++
++
++
++
++
++
++
+Co
ncen
trationprofi
le+
++
++
++
++
++
++
++
++
Bidisp
erse/
polydisp
erse
system
+(con
trast
cond
uctivity)
+(d
ifferen
cematerial
prop
erties)
+(d
ifferen
cematerial
prop
erties)
+(con
trastne
utron/
X-ray
sign
al)
−−
+(d
ifferen
tlabe
lling
)+
+(P
DA)
++
+(d
ifferen
tlabe
lling
)Te
chniqu
ech
aracteristics
Mea
sure
real
med
ia+
(con
trast
cond
uctivity)
++
(amou
ntproton
s)+
+(amou
ntproton
s)+
(con
trastne
utron/
x-raysign
al)
+−
(fluo
rescen
t)−
(fluo
rescen
t)−
(fluo
rescen
t)−
(fluo
rescen
t)
Conc
entrated
susp
ension
s+
+(u
pto
0.4)
++
(highe
rϕ,
moresign
al)
++
(highe
rϕ,m
ore
sign
al)
+−
−(scattering)
−−
(scattering)
−−
(scattering)
+−
−(scattering)
Sign
al-to-no
ise
(S/N
)−
−−
−−
−−
−+
++
Spatialr
esolution
+(1
–5%
oftube
)−
(10μm
)N.A.
+(1
μm)
−−
(40μm
)+
(1μm
)+
(1.6
μm)
+(1
μm)
++
(0.1
μm)
Timeresolution
+(5
ms–
1s)
+(3
2ms)
+(3
2ms)
++
(66μs)
+(0
.015
–2s)
++
(0.1
ns–1s)
++
(11ms)
+(1
ms–10
s)Nodisturba
nceflow
andno
n-inva
sive
+(inv
asive)
++
++
++
++
++
++
++
++
Dataan
alysis
−−
−−
−−
+−
−+
+−
Costs
+−
−−
−−
−+
+−
−−
−−
−−
−To
tal
4+
7+
8+
7+
3+
2+
5+
10+
5+
28 A.M.C. van Dinther et al. / Advances in Colloid and Interface Science 173 (2012) 23–34
typically between 10−4 and 1 m/s at a velocity resolution of a fewtens of μm/s [62], and temporal resolutions of 32 ms can be applied[63]. This implies that both shear-induced diffusion and inertial liftcan be monitored.
A drawback is that NMR is a relatively specialized technique, withexpensive equipment, and the need for trained staff to operate andinterpret the results. Another disadvantage is that often many as-sumptions have to be made on the specific properties of materials.
Additionally, the signal-to-noise ratio for an NMR experiment is,amongst others, strongly proportional to the strength of the magneticfield. Thus, from a purely signal over noise (S/N) consideration, NMRshould be done in the strongest field possible (B0), as indicated inEq. (12).
SN e
ffiffiffiffiffiffiffiffiB0
3q
: ð12Þ
In which, B0 is the static magnetic field strength (T), S is the signal(Hz) and N is the noise (Hz) [64].
However, there is a trade-off between intensity of the magneticfield and the volume of the effective field; it is not so easy to make ho-mogeneous, strong field magnets in a large volume. One should alsobe aware that there is always an optimisation between spatial andtemporal resolutions [41]. Spatial resolutions of up to 10 μm can beobtained for 1H of water, however a spatial resolution of 50–100 μmis more realistic [65,66].
4.1.2.2. Applicability for practical suspensions in microfluidic devices.Various techniques within NMR and MRI are able to measure velocityand concentration profiles, but spatial resolution is relatively low[67]. The most commonmethod is MRI, where measurement of veloc-ity and concentration profiles in flowing suspensions is done in largedevices and with large particles [5,68,69]. More recently smaller di-mensions are studied and Brown et al. investigated the migration of2.5 μm particles in a 1 mm channel [70], and Zhang et al. made useof high static magnetic field generated by microcoils, to study two-phase flows in 400 μm capillaries [18]. Measurement in microchan-nels was possible but only in strong fields, which through the use ofsmall coils to drastically improved signal-to-noise, may be withinreach. Developments in this field are going fast, clearly shown bythe article of Lee et al., where a new generation of diagnostic magnet-ic resonance (DMR) sensors was developed, that combines a micro-probe with magnetic nanoparticles, to detect cancer cells [71].
To deal with the relatively low spatial resolution, another option isto not use direct imaging as such but instead measure the distributionof the volume fractions as a function of velocity in the channel. Thisimplies that there is no spatial registration and therefore no spatialresolution limit. The probability distribution of the velocity over aspatial range will be measured and the data give a statistical distribu-tion of the displacement for all particles [58,72]. A distribution curvecan be made, in which the chance to find a certain velocity is on the y-axis, and the velocity itself is on the x-axis.
Static conditions in suspensions are relatively easy to measurewith MRI, but under dynamic conditions higher temporal and spatialresolutions are needed. Particle size can be derived from hindered dif-fusion inside the particle (in the case of e.g. emulsion droplets) whichis the diffusion perpendicular to the flow, but the signal-to-noise ratiohas to be drastically improved when one investigates particle flow ina microchannel. Particle sizes with different material properties canbe chosen and major particle components can be distinguishedthrough spectroscopic investigation or by investigation of the relaxa-tion times.
Additionally, the relaxation time is strongly concentration depen-dent; so information about concentration profiles can be obtained. Allthese possibilities show that NMR can be a very useful tool to studyparticle behaviour in microchannels.

29A.M.C. van Dinther et al. / Advances in Colloid and Interface Science 173 (2012) 23–34
4.1.3. PEPT (positron emission particle tracking)/neutron and x-rayradiographies/tomographies
Neutron and x-ray radiographies are imaging techniques, capableof showing particle concentration profiles. Where the x-ray imagingrelies on the presence of elements with higher atomic number,neutron scattering imaging depends on the presence of a few specificelements. Neutrons are attenuated by some light materials, i.e. hydro-gen, oils, plastics and water, but penetrate many heavy materials, likemetals. The neutron beam is recorded after penetrating a sample, andan image representing the macroscopic structure is obtained; thepenetrating radiation has a wavelength less than 10 nm [73]. As a re-sult the neutron radiography technique can be used to characterisethe flow of tracer particles through metal shrouded pipes, as demon-strated by Cimbala et al. [74].
X-ray radiography has been successfully applied for profiles of alu-mina and glass particles in composite-polymers [75]; the x-ray sourcebeing poly-energetic [76]. One could see tomography as a more ad-vanced form of radiography, because images are made of one geomet-ric plane of the object, while in general with radiography a kind of‘shadowgram’ is made [77].
4.1.3.1. Advantages and disadvantages. Neutron and x-ray radiogra-phies are capable of studying two-phase flows in any geometry, andcan penetrate materials often used for equipment; they are non-invasive and non-intrusive [78]. At the same time, they are not abun-dantly used given the expensive equipment, specialized facilities andstaff needed [52].
Further, the spatial resolutions are generally not high [79], asdemonstrated in the studies of Lagasse et al. [75] and Mondy et al.[80], where a spatial resolution of 0.2 mm was reached for x-rayradiography and particle and bubble sizes were between 1 μm and1.7 mm. The temporal resolution was found to be high, namely66 ms. Addition of multiple x-ray source/sensor pairs also improvesscan time and reconstruction time [52]. With neutron and x-ray radi-ographies both concentration profiles as well as velocity profiles canbe measured [78] and velocities in the range of 0–30 cm/s can beused [81].
4.1.3.2. Applicability for practical suspensions in microfluidic devices. X-ray radiography is often related to metal applications [82], but in thestudy of David et al., the concentration of casein micelles was studiedabove a membrane with small-angle x-ray scattering [19], having aspatial resolution of 100 μm and a temporal resolution of a fractionof a second. Unfortunately, the membrane module material did influ-ence the scattered signal of the beam, but Davit et al. showed that thecontrast between particles (biofilm) and surrounding (porous media)could be enhanced with the addition of contrast agents [83]. Further,spatial resolution can be drastically increased to 9 μm with x-raymicrotomography and even up to 5 μm per voxel. Suspension parti-cles in microchannels need higher resolution, but the trends towardsmicrotomography show great potential for this technique in naturalsuspensions. Microfocused small-angle X-ray scattering has beenused to study concentration and structure of nanoparticles in spaceand time with a micron spatial resolution [84]. Further, to trace differ-ent sized particles a difference in contrast is needed.
Food systems are sometimes analysed with neutron radiography,e.g. the structure of corn kernels [85], mainly based on the presenceand absence of water. X-ray tomography can be used in the study ofblood flow with contrast agent in for example a dialyzer [86] or forthe transport of naturally mobile particles, through microchannelsin the soil, into the groundwater [87].
Positron emission particle tracking or PEPT is used to track a singleradioactively labelled tracer particle in food multiphase systems [88].Since the tracer particles should have a minimum size of around60 μm to have enough radioactive load, this is beyond the size rangeof interest of this paper [89].
4.2. Ultrasonic measurement
4.2.1. UPDV (ultrasonic pulsed Doppler velocimetry) and UVP(ultrasonic velocity profile)
The use of ultrasonic waves to determine velocities is very similarto Laser Doppler Anemometry and Laser Doppler Velocimetry. Forvelocity determination, the Doppler shift in the frequency of an ultra-sonic wave scattered from a moving particle is determined at differ-ent positions. The acoustic pressure is usually related to the velocityof the particle given in Eq. (13).
p ¼ vZ: ð13Þ
In which p is the acoustic pressure (kg/m·s2), Z is the characteristicimpedance, which is dependent on the material properties (kg/m2·s)(see Eq. (14)) and v is the particle velocity (m/s).
Z ¼ cp: ð14Þ
where ρ is the density (kg/m³) and c the speed of sound (m/s).When particle–particle interactions are taking place, especially in
concentrated systems, the sound attenuation is found to be differentand consequently the (particle size) measurement changed [90].
4.2.1.1. Advantages and disadvantages. UDPV and UVP are both ‘light’in equipment, training, and staff costs compared to other techniques.The technique is non-invasive, and non-transparent samples can bemeasured [91]. Spatial resolutions are about 40 μm and the temporalresolution varies between 0.02 and 2 s as shown by Manneville et al.for a dilute oil-in-water emulsion [92]. For concentrated emulsions,multiple scattering and adsorption of ultrasonic waves severely influ-ence the results [93].
Christopher et al. measured a velocity between 0.5 and 5 mm/s inblood flow, with temporal resolutions between 15 and 100 ms [94].The technique is therefore well capable of measuring shear-induceddiffusion, although for inertial lift, the maximum measurable velocity(which can be derived from the Nyquist theorem; Eq. (15)) is proba-bly not high enough.
vmax ¼c
4tprf Fecos θð Þ : ð15Þ
In which vmax is the maximum velocity (m/s), c is the sound veloc-ity of the ultrasonic wave in the fluid (m/s), tprf is the time betweentwo emissions, Fe the emitting frequency (Hz) and θ the angle be-tween two intersecting waves [95].
UVP can measure velocity profiles [96], but concentration profilesare not easy to measure, due to multiple scattering and low spatialresolution [93]. However, Wang et al. developed a method thatallowed measurement of the concentration as well as the location.The spatial location follows from the velocity of an ultrasound wavethrough the different materials (i.e. the wall, liquid in tube) and thetime span between emitting and receiving pulses. Additionally, theconcentration of particles is related to the decrease in received ultra-sound intensity as a result of backscatter [97].
Measuring spatial orientation of particles in concentrated suspen-sions is not straightforward due to multiple scattering. To determinethe spatial position of large and small particles in a polydisperse sus-pension is outside the reach of this technique.
4.2.1.2. Applicability for practical suspensions in microfluidic devices. Todistinguish particles from the surrounding fluid and determine thevelocity of the particles, the characteristic impedance of materialscan be used. In milk for example, the impedance values of water and9% protein are respectively 1.49·106 and 1.83·106 kg/m2·s, whilemilk itself has a characteristic impedance of 1.56·106 kg/m2·s [98].The flow of blood is abundantly studied with ultrasonic techniques,

Left camera Right camera
Fig. 1. Two cameras to create a 3D view.
30 A.M.C. van Dinther et al. / Advances in Colloid and Interface Science 173 (2012) 23–34
where blood cells have a characteristic impedance of 1.6·106 kg/m2·sand blood vessels of 1.7·106 kg/m2·s.
It is however not possible to distinguish the signals in three phasesystems; information on bidisperse suspensions and their spatial ori-entation is therefore outside the reach of this technique. Based on thelow spatial resolution of 40 μm [99], high prevalence of multiple-scattering and the ability to only measure velocity profiles, this meth-od is not a logical choice to measure flow of most practical suspen-sions in microchannels.
4.3. Optical methods
4.3.1. LDV (laser Doppler velocimetry) and LDA(laser Doppler anemometry)
In LDA and LDV, velocity of particles is determined by comparingthe interference patterns (fringes) from two laser beams with thescattered light from a crossing particle [100]. Also concentration pro-files can be determined by measuring the time between two particlesentering the probe volume [101].
4.3.1.1. Advantages and disadvantages. The concentration and velocityprofiles can only be measured with LDA when the dispersed phase isdilute enough to have not more than one particle at a given time inthe sample volume. The detection volumes should be small, but notsmaller than the particles. The fringe spacing of the lasers determinesthe particle sizes that can be measured, as described in Eq. (16).
df ¼λ
2sin θ=2ð Þ : ð16Þ
In which df is the fringe spacing (m), λ the wavelength (m) and θthe angle between two intersecting waves of beam light (°) [102].
Durst et al. concluded that a particle diameter to fringe ratio of0.5–2.0 gives the highest signal-to-noise ratio, which implies (takingthe wavelength into account) that a range of particle sizes between0.3 and 16 μm is within reach, which makes this technique suitablefor most natural systems [103].
The overall signal-to-noise ratio is not very high, due to a generallyweak light intensity due to scattering [102]; the signal can also be influ-enced by the wall [104]. LDV and LDA do not disturb the flow [105] andhave good spatial resolution, first reported from 20 μm to several mm[104] and more recently down to 1.6 μm [106]. Three velocity compo-nents, ranging from 10−5 to 10 m/s (broad range of Pe and Re), canbe measured with wide range and high-resolution sensors [107].
However, it is not possible to discriminate on particle size with ei-ther technique [105], but Phase Doppler Anemometry, might be a solu-tion to this. PDA is an extension of LDA [106], using not only the Dopplershift frequency to determine velocity, but also the phase shift at threedifferent receiving locations to derive the diameter of the scatteringparticle [102]. It should be mentioned that scattered light intensityand polarization depend strongly on the viewing angle and the refrac-tive indexes of the continuous and dispersed phases.
The costs of these techniques are still fairly high due to the lasersas well as the processing equipment. There is a trend towards cheapersemi-conductor lasers, although some issues still need to be resolved[108].
4.3.1.2. Applicability for practical suspensions in microfluidic devices. Inmicrochannels the signal-to-noise ratio near the wall is low, as a re-sult of a high surface to volume ratio, and this leads to a bias in thedata. For the measurement of concentrated suspensions with LDAand LDV, the refractive index of particles and fluid needs to bematched, which often leads to the use of model suspensions. It is achallenge to translate data from model systems to realistic productsand therefore measurement of real media is preferred. Although thespatial resolution can go down to 1.6 μm, mostly micro-PIV is used
when microchannels are concerned and this technique is describedin Section 4.3.3 [109].
The main advantage of PDA is that particle size, velocity and con-centration can be obtained simultaneously. The other pros and cons,as well as the applicability for realistic suspension in microchannelsare similar to LDV an LDA.
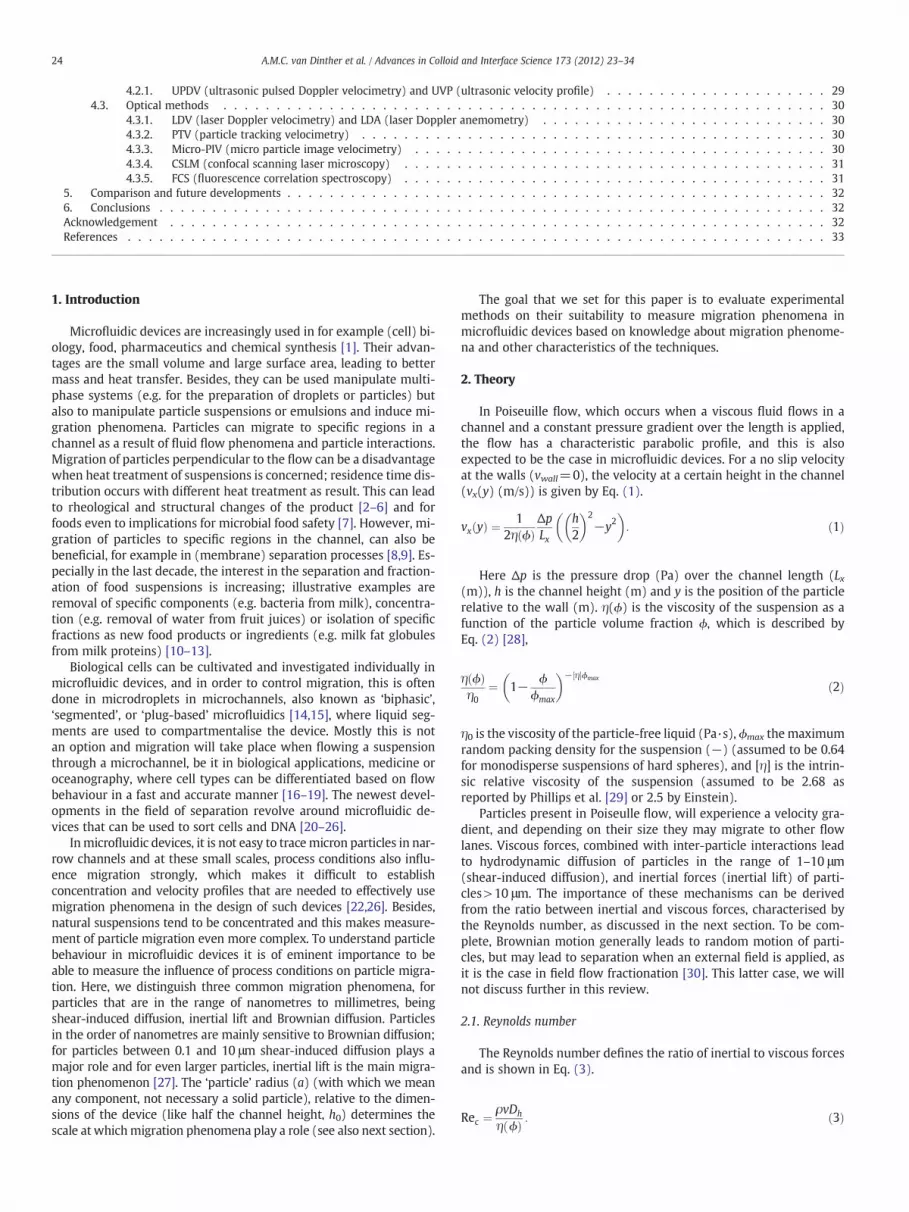
4.3.2. PTV (particle tracking velocimetry)With Particle Tracking Velocimetry, particle behaviour in flow can
be visualised by two cameras, creating a 3D image (see Fig. 1). Parti-cles are fluorescently labelled and are individually tracked in consecu-tive images. Afterwards the directionally resolved vector is computedfor each pair of matched particle-images.
4.3.2.1. Advantages and disadvantages. The PTV technique allows anal-ysis over the whole volume during the whole time, rather than point-by-point, as it is the case with other anemometric techniques [110].The limitation of PTV is the gathering of large amounts of dataabout the flow field, which requires extensive analysis of multiple im-ages [111].
The spatial resolution of PTV is generally not so high, and dependson the resolution of the camera and on the observation volume. In thearticle of Maas et al. from 1993, the spatial resolution was in the orderof millimetres, with 1000 particles in a flow field at a time resolutionof 40 ms [112].
In the last years this technique has improved and is now able tomeasure length scales from 0.1 to 100 μm [113] and a temporal reso-lution of 10 ms [114]. To improve visualisation of the particles, theyneed to be at least in the nanometre range [115]. The concentrationis limited to allow identification of single particle trajectories, whichmay be improved by creation of a vector for each particle as discussedin the next section.
4.3.2.2. Applicability for practical suspensions in microfluidic devices. Ve-locity and concentration gradients as well as particle size can be de-termined with PTV, although as with all optical methods, refractiveindex matching has to be done for concentrated systems. Spatial res-olution of PTV has been improved, but for the measurement of parti-cles between 0.1 and 10 μm in microchannels, the technique shouldbe combined with a more sophisticated, sensitive method likemicro-PIV as described next, similar to micro-PTV.
4.3.3. Micro-PIV (micro particle image velocimetry)Particle Tracking Velocimetry is actually a low-image-density PIV
method [116]. To investigate fluid flow in a micro-fluidic device,micro-PIV is an option. Fluorescent, neutrally buoyant tracer particlesthat are large enough to minimize the influence of Brownian motion(Pe>1) are added to the fluid [117]. Two lasers are used and imagesare recorded using a high-speed CCD camera. From the spatial corre-lation of the position of the particles in different images, velocitygradients of the fluid can be derived. Statistical analysis is used to

31A.M.C. van Dinther et al. / Advances in Colloid and Interface Science 173 (2012) 23–34
evaluate the particle-image displacement as a function of the spatialresolution [118]. When PIV is combined with PTV, two cameras detectthe light which yields a 3D velocity image with high spatial resolu-tion. PTV creates a vector for each particle, while PIV creates onevector for each window [119]. Micro-PIV has been combined withconfocal scanning laser microscopy (CSLM) [120]; Lindken et al.used stereo micro-PIV, where two cameras are detecting fluorescencefrom particles illuminated by a double pulse laser and viewed by astereomicroscope [121].
4.3.3.1. Advantages and disadvantages. The main advantage of PIV overother techniques is that PIV produces detailed information on the spa-tial distribution. The analysis is however time intensive, leading to alimited amount of data [105]. The spatial resolution of PIV is stronglydependent on the optics and co-determined by the size of the mea-surement volume, which is typically a fraction of a mm [116]. For suf-ficient resolution the smallest particles span at least 3–4 pixels indiameter. Increasing the spatial resolution to 1 μm has recently beenshown possible in so-called super-resolution PIV, with observationvolumes of 13.6 by 0.9 by 2.2 μm³ [42,122]. The temporal resolutionmay range from tens of nanoseconds up to a few seconds. This intervalcan be reduced to nanoseconds by changing the camera resolution, il-lustrating the dependency of both time and spatial resolutions oncamera characteristics [117]. Typical velocities that can be measuredare from μm/s to cm/s, e.g. 3.3 cm/s for 80 μm particles [123]. Theamount of fluorescent particles in the observation volume should beat least 2–3, which implies that the concentration of fluorescent parti-cles in the suspension should be sufficiently high, while fluorescentlight scattering at high concentrations should be prevented.
PIV was initially developed for the measurement of velocity pro-files, but concentration profiles are within reach by combinationwith PTV or CSLM.
4.3.3.2. Applicability for practical suspensions in microfluidic devices. Inconcentrated systems, particles need to be optically matched withthe carrier fluid. The particle size needs to be larger than the wave-length of the laser light, which is usually 532 nm; and micron-sizedparticles can be measured. The velocities are mainly in the μm/srange (low Re) when micro-PIV is used in combination with CSLM[120]. Increasing the velocity will lead to streaks, and less reliable re-sults [122]. Since high spatial resolutions can be obtained with micro-PIV, it can be applied for flowing suspensions in microchannels with-out any problem, albeit that model systems are needed.
4.3.4. CSLM (confocal scanning laser microscopy)Confocal scanning lasermicroscopy receives the emitted light from a
fluorescent sample that was excited with laser light, by optically focus-ing on a small volume in the channel. Although for CSLM, concentratedsuspensions should have particles where the refractive index is
(a)
Focal volume
Observation volume
Fig. 2. FCS. (a) Focal and observation volume; (b) autocorrelation curve obta
matched with the surrounding liquid, this technique can eliminateout-of-focus parts and select an optical section from a thick samplemuch easier than the conventional microscope [124]. An extensivestudy by Sandison and Webb showed that the signal-to-noise ratioobtainedwith a confocal microscope can bemore than 100 times great-er than with a conventional microscope [125]. Rusconi and Stoneshowed that with a conventional fast-scanning microscope measure-ment of particle suspensions up to solid volume fractions of 1% is possi-ble, but for concentrated systems this technique becomes limited [36].
4.3.4.1. Advantages and disadvantages. For microscopy, there is alwaysa balance between number of pixels of the image, speed of the pic-tures taken, magnification used, thickness of the measured area,etc., comparable to PTV and micro-PIV. At high particle concentration,a lower signal-to-noise ratio is obtained, which influences velocitycalculations when combined with PIV analysis [120]. Additionally, re-fractive index matching of the particles with the surrounding solutionis needed, as it is the case for all optical methods, which limits thetype of systems that can be studied.
Maximum velocities that can be measured are dependent on theoptical system (camera, objective) and observation volume chosen.With a field of view of 55 by 55 μm2, and a 100·1.35 numerical aper-ture objective, the temporal resolution is 11 ms and particles can flowwith velocities up to 5 mm/s [126]. In the article of Frank et al., evenspeeds up to 8 mm/s were measured [127], similar to the velocitiesmentioned by Besseling et al. [128].
4.3.4.2. Applicability for practical suspensions in microfluidic devices.CSLM can focus on an image at a specific height in the channel andcombined with refractive index matching (model suspensions),gives the possibility to look at relatively concentrated suspensions.An illustrative example is given in the study of Isa et al., where con-centrated suspensions with particles of around 1 μm were flowingthroughmicrochannels [122]. Concentration profiles, as well as veloc-ity profiles can be determined, although this has not yet been pub-lished for polydisperse suspensions. This is possible using differentfluorescent dyes and following the particle movement by taking suc-cessive images (comparable to PTV).
In the paper of Park et al. both CSLM and micro-PIV have been ap-plied to creeping Poiseuille flow in microchannels of 99 μm internaldiameter [116] and several other authors have used CSLM as well toinvestigate particle behaviour in microchannels as the technique isable to focus on small volumes [124,127,129–134].
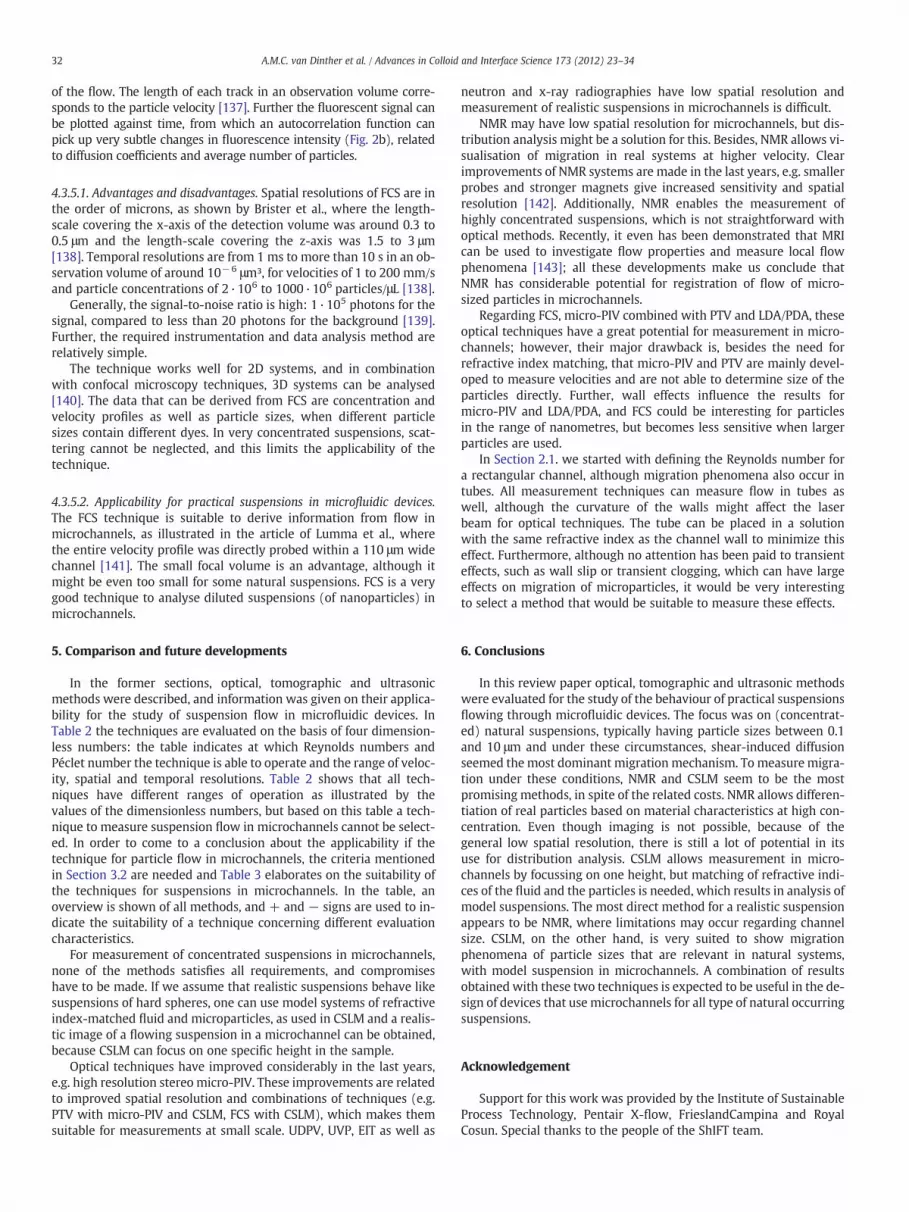
4.3.5. FCS (fluorescence correlation spectroscopy)The concept of FCSwas introduced in the early 1970s [135] in biolog-
ical and chemical research. The technique is based on fluctuation mea-surement of a fluorescence signal from a particle in a voxel (Fig. 2a)[136]; combined with a high-speed camera it enables visualisation
(b)
Correlation time (ms)
Aut
ocor
rela
tion
Fast diffusion
Slow diffusion
ined from fluorescence signal that is converted to average fluorescence.
32 A.M.C. van Dinther et al. / Advances in Colloid and Interface Science 173 (2012) 23–34
of the flow. The length of each track in an observation volume corre-sponds to the particle velocity [137]. Further the fluorescent signal canbe plotted against time, from which an autocorrelation function canpick up very subtle changes in fluorescence intensity (Fig. 2b), relatedto diffusion coefficients and average number of particles.
4.3.5.1. Advantages and disadvantages. Spatial resolutions of FCS are inthe order of microns, as shown by Brister et al., where the length-scale covering the x-axis of the detection volume was around 0.3 to0.5 μm and the length-scale covering the z-axis was 1.5 to 3 μm[138]. Temporal resolutions are from 1 ms to more than 10 s in an ob-servation volume of around 10−6 μm³, for velocities of 1 to 200 mm/sand particle concentrations of 2·106 to 1000·106 particles/μL [138].
Generally, the signal-to-noise ratio is high: 1·105 photons for thesignal, compared to less than 20 photons for the background [139].Further, the required instrumentation and data analysis method arerelatively simple.
The technique works well for 2D systems, and in combinationwith confocal microscopy techniques, 3D systems can be analysed[140]. The data that can be derived from FCS are concentration andvelocity profiles as well as particle sizes, when different particlesizes contain different dyes. In very concentrated suspensions, scat-tering cannot be neglected, and this limits the applicability of thetechnique.
4.3.5.2. Applicability for practical suspensions in microfluidic devices.The FCS technique is suitable to derive information from flow inmicrochannels, as illustrated in the article of Lumma et al., wherethe entire velocity profile was directly probed within a 110 μm widechannel [141]. The small focal volume is an advantage, although itmight be even too small for some natural suspensions. FCS is a verygood technique to analyse diluted suspensions (of nanoparticles) inmicrochannels.
5. Comparison and future developments
In the former sections, optical, tomographic and ultrasonicmethods were described, and information was given on their applica-bility for the study of suspension flow in microfluidic devices. InTable 2 the techniques are evaluated on the basis of four dimension-less numbers: the table indicates at which Reynolds numbers andPéclet number the technique is able to operate and the range of veloc-ity, spatial and temporal resolutions. Table 2 shows that all tech-niques have different ranges of operation as illustrated by thevalues of the dimensionless numbers, but based on this table a tech-nique to measure suspension flow in microchannels cannot be select-ed. In order to come to a conclusion about the applicability if thetechnique for particle flow in microchannels, the criteria mentionedin Section 3.2 are needed and Table 3 elaborates on the suitability ofthe techniques for suspensions in microchannels. In the table, anoverview is shown of all methods, and + and − signs are used to in-dicate the suitability of a technique concerning different evaluationcharacteristics.
For measurement of concentrated suspensions in microchannels,none of the methods satisfies all requirements, and compromiseshave to be made. If we assume that realistic suspensions behave likesuspensions of hard spheres, one can use model systems of refractiveindex-matched fluid and microparticles, as used in CSLM and a realis-tic image of a flowing suspension in a microchannel can be obtained,because CSLM can focus on one specific height in the sample.
Optical techniques have improved considerably in the last years,e.g. high resolution stereo micro-PIV. These improvements are relatedto improved spatial resolution and combinations of techniques (e.g.PTV with micro-PIV and CSLM, FCS with CSLM), which makes themsuitable for measurements at small scale. UDPV, UVP, EIT as well as
neutron and x-ray radiographies have low spatial resolution andmeasurement of realistic suspensions in microchannels is difficult.
NMR may have low spatial resolution for microchannels, but dis-tribution analysis might be a solution for this. Besides, NMR allows vi-sualisation of migration in real systems at higher velocity. Clearimprovements of NMR systems are made in the last years, e.g. smallerprobes and stronger magnets give increased sensitivity and spatialresolution [142]. Additionally, NMR enables the measurement ofhighly concentrated suspensions, which is not straightforward withoptical methods. Recently, it even has been demonstrated that MRIcan be used to investigate flow properties and measure local flowphenomena [143]; all these developments make us conclude thatNMR has considerable potential for registration of flow of micro-sized particles in microchannels.
Regarding FCS, micro-PIV combined with PTV and LDA/PDA, theseoptical techniques have a great potential for measurement in micro-channels; however, their major drawback is, besides the need forrefractive index matching, that micro-PIV and PTV are mainly devel-oped to measure velocities and are not able to determine size of theparticles directly. Further, wall effects influence the results formicro-PIV and LDA/PDA, and FCS could be interesting for particlesin the range of nanometres, but becomes less sensitive when largerparticles are used.
In Section 2.1. we started with defining the Reynolds number fora rectangular channel, although migration phenomena also occur intubes. All measurement techniques can measure flow in tubes aswell, although the curvature of the walls might affect the laserbeam for optical techniques. The tube can be placed in a solutionwith the same refractive index as the channel wall to minimize thiseffect. Furthermore, although no attention has been paid to transienteffects, such as wall slip or transient clogging, which can have largeeffects on migration of microparticles, it would be very interestingto select a method that would be suitable to measure these effects.
6. Conclusions
In this review paper optical, tomographic and ultrasonic methodswere evaluated for the study of the behaviour of practical suspensionsflowing through microfluidic devices. The focus was on (concentrat-ed) natural suspensions, typically having particle sizes between 0.1and 10 μm and under these circumstances, shear-induced diffusionseemed the most dominant migration mechanism. To measuremigra-tion under these conditions, NMR and CSLM seem to be the mostpromising methods, in spite of the related costs. NMR allows differen-tiation of real particles based on material characteristics at high con-centration. Even though imaging is not possible, because of thegeneral low spatial resolution, there is still a lot of potential in itsuse for distribution analysis. CSLM allows measurement in micro-channels by focussing on one height, but matching of refractive indi-ces of the fluid and the particles is needed, which results in analysis ofmodel suspensions. The most direct method for a realistic suspensionappears to be NMR, where limitations may occur regarding channelsize. CSLM, on the other hand, is very suited to show migrationphenomena of particle sizes that are relevant in natural systems,with model suspension in microchannels. A combination of resultsobtained with these two techniques is expected to be useful in the de-sign of devices that use microchannels for all type of natural occurringsuspensions.
Acknowledgement
Support for this work was provided by the Institute of SustainableProcess Technology, Pentair X-flow, FrieslandCampina and RoyalCosun. Special thanks to the people of the ShIFT team.

33A.M.C. van Dinther et al. / Advances in Colloid and Interface Science 173 (2012) 23–34
References
[1] Whitesides GM. The origins and the future of microfluidics. Nature 2006;442:368–73.
[2] Barigou M, Fairhurst PG, Fryer PJ, Pain JP. Concentric flow regime of solid-liquidfood suspensions: theory and experiment. Chem Eng Sci 2003;58:1671–86.
[3] Hong QA, Sheetz MP, Elson EL. Single-particle tracking — analysis of diffusionand flow in 2-dimensional systems. Biophys J 1991;60:910–21.
[4] Lareo C, Fryer PJ, Barigou M. The fluid mechanics of two-phase solid-liquid foodflows: a review. Food Bioprod Process 1997;75:73–105.
[5] McCarthy KL, Kerr WL. Rheological characterization of a model suspension dur-ing pipe flow using MRI. J Food Eng 1998;37:11–23.
[6] Pal R. Techniques for measuring the composition (oil and water content) ofemulsions — a state of the art review. Colloids Surf Physicochem Eng Aspects1994;84:141–93.
[7] Sastry SK, Zuritz CA. A review of particle behavior in tube flow: applications toaseptic processing 1. J Food Process Eng 1987;10:27–52.
[8] Kromkamp J. Particle separation and fractionation by microfiltration. Wagenin-gen Netherlands: Wageningen Universiteit (Wageningen University); 2005.
[9] Kulrattanarak T, van der Sman RGM, Schroën CGPH, Boom RM. Classification andevaluation of microfluidic devices for continuous suspension fractionation. AdvColloid Interface Sci 2008;142:53–66.
[10] Goudédranche H, Fauquant J, Maubois J-L. Fractionation of globular milk fat bymembrane microfiltration. Lait 2000;80:93–8.
[11] Rausch KD. Front end to backpipe: membrane technology in the starch proces-sing industry. Starch — Stärke 2002;54:273–84.
[12] Roda B, Zattoni A, Reschiglian P, Moon MH, Mirasoli M, Michelini E, et al. Field-flow fractionation in bioanalysis: a review of recent trends. Anal Chim Acta2009;635:132–43.
[13] van Dinther AMC, Schroën CGPH, Boom RM. High-flux membrane separationusing fluid skimming dominated convective fluid flow. J Membr Sci 2011;371:20–7.
[14] Teh S-Y, Lin R, Hung L-H, Lee AP. Droplet microfluidics. Lab Chip 2008;8:198–220.
[15] Theberge AB, Courtois F, Schaerli Y, Fischlechner M, Abell C, Hollfelder F, et al.Microdroplets in microfluidics: an evolving platform for discoveries in chemistryand biology. Angew Chem Int Ed 2010;49:5846–68.
[16] Krishnan GP, Leighton J David T. Inertial lift on a moving sphere in contact with aplane wall in a shear flow. Phys Fluids 1995;7:2538–45.
[17] Hur SC, Tse HTK, Di Carlo D. Sheathless inertial cell ordering for extremethroughput flow cytometry. Lab Chip 2010;10:274–80.
[18] Zhang J, Balcom BJ. Parallel-plate RF resonator imaging of chemical shift resolvedcapillary flow. Magn Reson Imaging 2010;28:826–33.
[19] David C, Pignon F, Narayanan T, Sztucki M, Gesan-Guiziou G, Magnin A. Spatial andtemporal in situ evolution of the concentration profile during casein micelle ultra-filtration probed by small-angle X-ray scattering. Langmuir 2008;24:4523–9.
[20] Aguilera JM. Why food microstructure? J Food Eng 2005;67:3–11.[21] Bhagat AAS, Kuntaegowdanahalli SS, Papautsky I. Inertial microfluidics for con-
tinuous particle filtration and extraction. Microfluid Nanofluid 2009;7:217–26.[22] Ros A, Hellmich W, Regtmeier J, Duong TT, Anselmetti D. Bioanalysis in struc-
tured microfluidic systems. Electrophoresis 2006;27:2651–8.[23] Skurtys O, Aguilera JM. Applications of microfluidic devices in food engineering.
Food Biophys 2008;3:1–15.[24] Toner M, Irimia D. Blood-on-a-chip. Annu Rev Biomed Eng 2005;7:77–103.[25] Yamada M, Nakashima M, Seki M. Pinched flow fractionation: continuous size
separation of particles utilizing a laminar flow profile in a pinched microchannel.Anal Chem 2004;76:5465–71.
[26] Yoo JY, Kim YW. Recent experimental studies on microscale channel flows. Pro-ceedings of the 12th Asian Congress of Fluid Mechanics; 2008.
[27] Davis RH. Modeling of fouling of crossflow microfiltration membranes. Sep PurifRev 1992;21:75.
[28] Krieger IM, Dougherty TJ. A mechanism for non-Newtonian flow in suspensionsof rigid spheres. Trans Soc Rheol 1959;3:137–52.
[29] Phillips RJ, Armstrong RC, Brown RA, Graham AL, Abbott JR. A constitutive equa-tion for concentrated suspensions that accounts for shear-induced particle mi-gration. Phys Fluids A-Fluid Dyn 1992;4:30–40.
[30] Schimpf ME, Caldwell K, Giddings JC. Field flow fractionation handbook. Wiley-Interscience; 2000.
[31] Altena FW, Belfort G. Lateral migration of spherical-particles in porous flowchannels — application to membrane filtration. Chem Eng Sci 1984;39:343–55.
[32] Ackerson BJ. Shear induced order in equilibrium colloidal liquids. Physica A1991;174:15–30.
[33] Squires TM, Quake SR. Microfluidics: fluid physics at the nanoliter scale. Rev ModPhys 2005;77:977–1026.
[34] Leighton D, Acrivos A. The shear-induced migration of particles in concentratedsuspensions. J Fluid Mech 1987;181:415–39.
[35] Lopez M. Enhancement of mixing and transport in microfluidic devices by chaot-ic dynamics and shear-induced diffusion. Madison: The University of Wisconsin;2008.
[36] Rusconi R, Stone HA. Shear-induced diffusion of platelike particles in microchan-nels. Phys Rev Lett 2008;101:254502.
[37] Karnis A, Goldsmith HL, Mason SG. The flow of suspensions through tubes: V. In-ertial effects. Can J Chem Eng 1966;44:181–93.
[38] Gauthier F, Goldsmit HL, Mason SG. Particle motions in non-Newtonian media. II.Poiseuille flow. J Rheol 1971;15:297–330.
[39] Faivre M, Abkarian M, Bickraj K, Stone HA. Geometrical focusing of cells in amicrofluidic device: An approach to separate blood plasma. Biorheology2006;43:147–59.
[40] Di Carlo D. Inertial microfluidics. Lab Chip 2009;9:3038–46.[41] Powell RL. Experimental techniques for multiphase flows. Phys Fluids
2008;20(040605):1–22.[42] Aubin J, Ferrando M, Jiricny V. Current methods for characterising mixing and
flow in microchannels. Chem Eng Sci 2010;65:2065–93.[43] Erickson D. Towards numerical prototyping of labs-on-chip: modeling for inte-
grated microfluidic devices. Microfluid Nanofluid 2005;1:301–18.[44] Vollebregt HM, van der Sman RGM, Boom RM. Suspension flow modelling in
particle migration and microfiltration. Soft Matter 2010;6:6052–64.[45] Al Quddus N, Moussa WA, Bhattacharjee S. Motion of a spherical particle in a cy-
lindrical channel using arbitrary Lagrangian–Eulerian method. J Colloid InterfaceSci 2008;317:620–30.
[46] Longest PW, Kleinstreuer C, Buchanan JR. Efficient computation of micro-particledynamics including wall effects. Comput Fluids 2004;33:577–601.
[47] Roberto GP. Additional effects on internal flow of non-Newtonian fluids in thepresence of a particle. J Non-Newtonian Fluid Mech 2000;95:85–100.
[48] Cheney M, Isaacson D, Newell JC. Electrical impedance tomography. Siam Rev1999;41:85–101.
[49] Reinecke N, Petritsch G, Boddem M, Mewes D. Tomographic imaging of thephase distribution in two-phase slug flow. Int J Multiphase Flow 1998;24:617–34.
[50] Butler JE, Bonnecaze RT. Imaging of particle shear migration with electrical im-pedance tomography. Phys Fluids 1999;11:1982–94.
[51] KimMC, Kim KY, Kim S, Lee KJ. Reconstruction algorithm of electrical impedancetomography for particle concentration distribution in suspension. Korean J ChemEng 2004;21:352–7.
[52] Williams RA. Tomographic imaging of particulate systems. Adv Powder Technol2003;14:1.
[53] Mabrook MF, Petty MC. Effect of composition on the electrical conductance ofmilk. J Food Eng 2003;60:321–5.
[54] Ayliffe HE, Frazier AB, Rabbitt RD. Electric impedance spectroscopy using micro-channels with integrated metal electrodes. J Microelectromech Syst 1999;8:50–7.
[55] Cheung KC, Renaud P. BioMEMS for medicine: on-chip cell characterization andimplantable microelectrodes. Solid State Electron 2006;50:551–7.
[56] Bao N, Wang J, Lu C. Recent advances in electric analysis of cells in microfluidicsystems. Anal Bioanal Chem 2008;391:933–42.
[57] Windt CW. Nuclear magnetic response imaging of sap flow in plants Thesis,Wageningen University. 2007.
[58] Fukushima E. Nuclear magnetic resonance as a tool to study flow. Annu Rev FluidMech 1999;31:95–123.
[59] Powell RL, Maneval JE, Seymour JD, Mccarthy KL, Mccarthy MJ. Nuclear-magnetic-resonance imaging for viscosity measurements. J Rheol 1994;38:1465–70.
[60] d'Avila MA, Powell RL, Phillips RJ, Shapley NC, Walton JH, Dungan SR. Magneticresonance imaging (MRI): a technique to study flow an microstructure of con-centrated emulsions. Braz J Chem Eng 2005;22:49–60.
[61] Packer KJ, Rees C. Pulsed NMR studies of restricted diffusion. 1. Droplet size dis-tributions in emulsions. J Colloid Interface Sci 1972;40:206–18.
[62] Kose K. A real-time NMR image-reconstruction system using echo-planar imag-ing and a digital signal processor. Meas Sci Technol 1992;3:1161–5.
[63] Raguin LG, Ciobanu L. Multiple echo NMR velocimetry: fast and localized mea-surements of steady and pulsatile flows in small channels. J Magn Reson2007;184:337–43.
[64] Hoult DI, Chen CN, Sank VJ. The field-dependence of NMR imaging. 2. Argumentsconcerning an optimal field-strength. Magn Reson Med 1986;3:730–46.
[65] Gao C, Xu B, Gilchrist JF. Mixing and segregation of microspheres in microchan-nel flows of mono- and bidispersed suspensions. Phys Rev E 2009;79:036311.
[66] Lens PNL, Gastesi R, Vergeldt F, van Aelst AC, Pisabarro AG, Van As H. Diffusionalproperties of methanogenic granular sludge: H-1 NMR characterization. ApplEnviron Microbiol 2003;69:6644–9.
[67] Altobelli SA, Givler RC, Fukushima E. Velocity and concentration measurementsof suspensions by nuclear-magnetic-resonance imaging. J Rheol 1991;35:721–34.
[68] Chow AW, Sinton SW, Iwamiya JH, Stephens TS. Shear-induced particle migra-tion in couette and parallel-plate viscometers — NMR imaging and stress mea-surements. Phys Fluids 1994;6:2561–76.
[69] Majors PD, Givler RC, Fukushima E. Velocity and concentration measurements inmultiphase flows by NMR. J Magn Reson 1989;85:235–43.
[70] Brown JR, Fridjonsson EO, Seymour JD, Codd SL. Nuclear magnetic resonancemeasurement of shear-induced particle migration in Brownian suspensions.Phys Fluids 2009;21.
[71] Lee H, Yoon T-J, Figueiredo J-L, Swirski FK, Weissleder R. Rapid detection andprofiling of cancer cells in fine-needle aspirates. Proc Natl Acad Sci 2009;106:12459–64.
[72] Garroway AN. Velocity measurements in flowing fluids by MNR. J Phys 1974;7:L159.
[73] Prince E. Neutron scattering instrumentation: a tutorial review. Appl SpectroscRev 1999;34:159–72.
[74] Cimbala JM, Sathianathan D. Streakline flow visualization with neutron radiogra-phy. Exp Fluids 1988;6:547–52.
[75] Lagasse RR, Thompson KR. Spatial gradients in particle reinforced polymers char-acterized by X-ray attenuation and laser confocal microscopy. Polymer 2002;43:803–12.
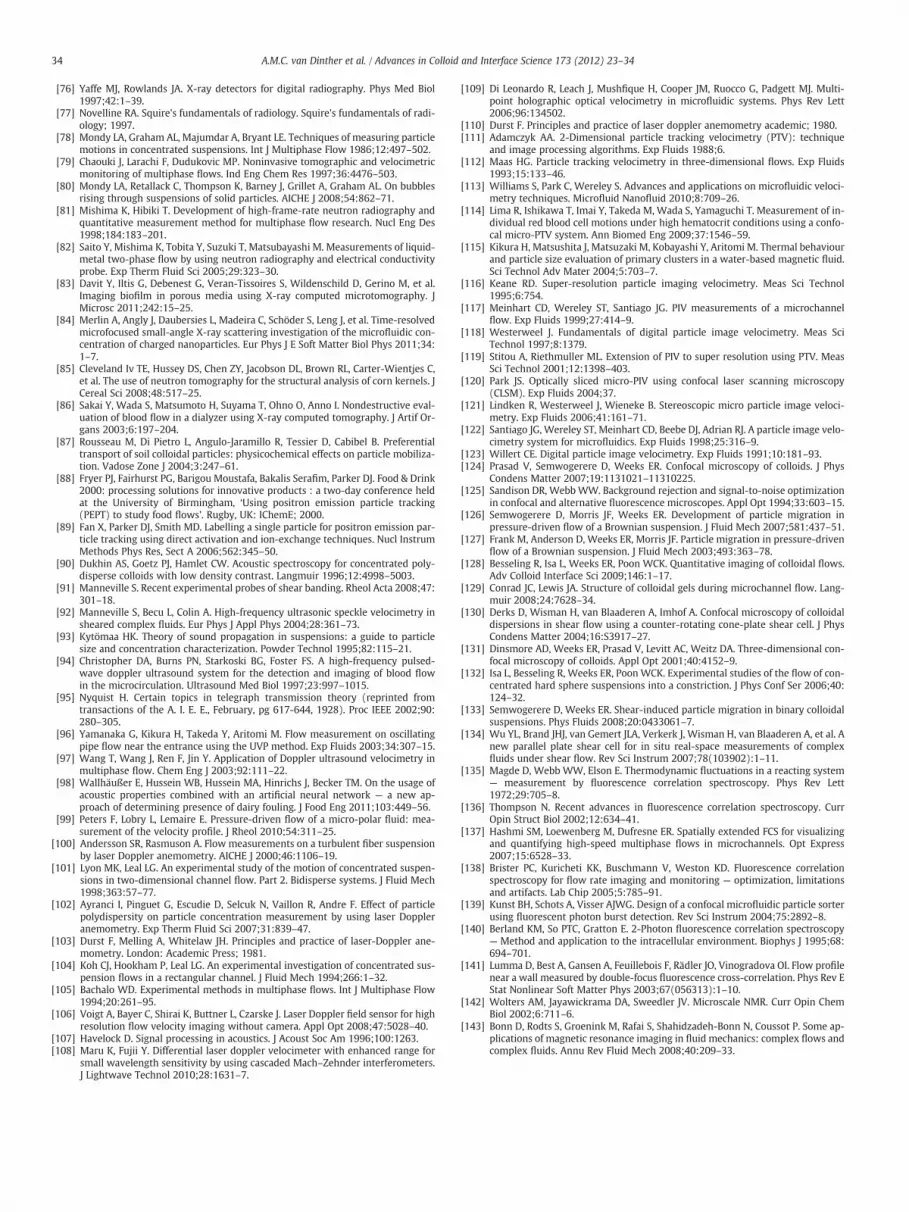
34 A.M.C. van Dinther et al. / Advances in Colloid and Interface Science 173 (2012) 23–34
[76] Yaffe MJ, Rowlands JA. X-ray detectors for digital radiography. Phys Med Biol1997;42:1–39.
[77] Novelline RA. Squire's fundamentals of radiology. Squire's fundamentals of radi-ology; 1997.
[78] Mondy LA, Graham AL, Majumdar A, Bryant LE. Techniques of measuring particlemotions in concentrated suspensions. Int J Multiphase Flow 1986;12:497–502.
[79] Chaouki J, Larachi F, Dudukovic MP. Noninvasive tomographic and velocimetricmonitoring of multiphase flows. Ind Eng Chem Res 1997;36:4476–503.
[80] Mondy LA, Retallack C, Thompson K, Barney J, Grillet A, Graham AL. On bubblesrising through suspensions of solid particles. AICHE J 2008;54:862–71.
[81] Mishima K, Hibiki T. Development of high-frame-rate neutron radiography andquantitative measurement method for multiphase flow research. Nucl Eng Des1998;184:183–201.
[82] Saito Y, Mishima K, Tobita Y, Suzuki T, Matsubayashi M. Measurements of liquid-metal two-phase flow by using neutron radiography and electrical conductivityprobe. Exp Therm Fluid Sci 2005;29:323–30.
[83] Davit Y, Iltis G, Debenest G, Veran-Tissoires S, Wildenschild D, Gerino M, et al.Imaging biofilm in porous media using X-ray computed microtomography. JMicrosc 2011;242:15–25.
[84] Merlin A, Angly J, Daubersies L, Madeira C, Schöder S, Leng J, et al. Time-resolvedmicrofocused small-angle X-ray scattering investigation of the microfluidic con-centration of charged nanoparticles. Eur Phys J E Soft Matter Biol Phys 2011;34:1–7.
[85] Cleveland Iv TE, Hussey DS, Chen ZY, Jacobson DL, Brown RL, Carter-Wientjes C,et al. The use of neutron tomography for the structural analysis of corn kernels. JCereal Sci 2008;48:517–25.
[86] Sakai Y, Wada S, Matsumoto H, Suyama T, Ohno O, Anno I. Nondestructive eval-uation of blood flow in a dialyzer using X-ray computed tomography. J Artif Or-gans 2003;6:197–204.
[87] Rousseau M, Di Pietro L, Angulo-Jaramillo R, Tessier D, Cabibel B. Preferentialtransport of soil colloidal particles: physicochemical effects on particle mobiliza-tion. Vadose Zone J 2004;3:247–61.
[88] Fryer PJ, Fairhurst PG, Barigou Moustafa, Bakalis Serafim, Parker DJ. Food & Drink2000: processing solutions for innovative products : a two-day conference heldat the University of Birmingham, ‘Using positron emission particle tracking(PEPT) to study food flows’. Rugby, UK: IChemE; 2000.
[89] Fan X, Parker DJ, Smith MD. Labelling a single particle for positron emission par-ticle tracking using direct activation and ion-exchange techniques. Nucl InstrumMethods Phys Res, Sect A 2006;562:345–50.
[90] Dukhin AS, Goetz PJ, Hamlet CW. Acoustic spectroscopy for concentrated poly-disperse colloids with low density contrast. Langmuir 1996;12:4998–5003.
[91] Manneville S. Recent experimental probes of shear banding. Rheol Acta 2008;47:301–18.
[92] Manneville S, Becu L, Colin A. High-frequency ultrasonic speckle velocimetry insheared complex fluids. Eur Phys J Appl Phys 2004;28:361–73.
[93] Kytömaa HK. Theory of sound propagation in suspensions: a guide to particlesize and concentration characterization. Powder Technol 1995;82:115–21.
[94] Christopher DA, Burns PN, Starkoski BG, Foster FS. A high-frequency pulsed-wave doppler ultrasound system for the detection and imaging of blood flowin the microcirculation. Ultrasound Med Biol 1997;23:997–1015.
[95] Nyquist H. Certain topics in telegraph transmission theory (reprinted fromtransactions of the A. I. E. E., February, pg 617-644, 1928). Proc IEEE 2002;90:280–305.
[96] Yamanaka G, Kikura H, Takeda Y, Aritomi M. Flow measurement on oscillatingpipe flow near the entrance using the UVP method. Exp Fluids 2003;34:307–15.
[97] Wang T, Wang J, Ren F, Jin Y. Application of Doppler ultrasound velocimetry inmultiphase flow. Chem Eng J 2003;92:111–22.
[98] Wallhäußer E, Hussein WB, Hussein MA, Hinrichs J, Becker TM. On the usage ofacoustic properties combined with an artificial neural network — a new ap-proach of determining presence of dairy fouling. J Food Eng 2011;103:449–56.
[99] Peters F, Lobry L, Lemaire E. Pressure-driven flow of a micro-polar fluid: mea-surement of the velocity profile. J Rheol 2010;54:311–25.
[100] Andersson SR, Rasmuson A. Flow measurements on a turbulent fiber suspensionby laser Doppler anemometry. AICHE J 2000;46:1106–19.
[101] Lyon MK, Leal LG. An experimental study of the motion of concentrated suspen-sions in two-dimensional channel flow. Part 2. Bidisperse systems. J Fluid Mech1998;363:57–77.
[102] Ayranci I, Pinguet G, Escudie D, Selcuk N, Vaillon R, Andre F. Effect of particlepolydispersity on particle concentration measurement by using laser Doppleranemometry. Exp Therm Fluid Sci 2007;31:839–47.
[103] Durst F, Melling A, Whitelaw JH. Principles and practice of laser-Doppler ane-mometry. London: Academic Press; 1981.
[104] Koh CJ, Hookham P, Leal LG. An experimental investigation of concentrated sus-pension flows in a rectangular channel. J Fluid Mech 1994;266:1–32.
[105] Bachalo WD. Experimental methods in multiphase flows. Int J Multiphase Flow1994;20:261–95.
[106] Voigt A, Bayer C, Shirai K, Buttner L, Czarske J. Laser Doppler field sensor for highresolution flow velocity imaging without camera. Appl Opt 2008;47:5028–40.
[107] Havelock D. Signal processing in acoustics. J Acoust Soc Am 1996;100:1263.[108] Maru K, Fujii Y. Differential laser doppler velocimeter with enhanced range for
small wavelength sensitivity by using cascaded Mach–Zehnder interferometers.J Lightwave Technol 2010;28:1631–7.
[109] Di Leonardo R, Leach J, Mushfique H, Cooper JM, Ruocco G, Padgett MJ. Multi-point holographic optical velocimetry in microfluidic systems. Phys Rev Lett2006;96:134502.
[110] Durst F. Principles and practice of laser doppler anemometry academic; 1980.[111] Adamczyk AA. 2-Dimensional particle tracking velocimetry (PTV): technique
and image processing algorithms. Exp Fluids 1988;6.[112] Maas HG. Particle tracking velocimetry in three-dimensional flows. Exp Fluids
1993;15:133–46.[113] Williams S, Park C, Wereley S. Advances and applications on microfluidic veloci-
metry techniques. Microfluid Nanofluid 2010;8:709–26.[114] Lima R, Ishikawa T, Imai Y, Takeda M, Wada S, Yamaguchi T. Measurement of in-
dividual red blood cell motions under high hematocrit conditions using a confo-cal micro-PTV system. Ann Biomed Eng 2009;37:1546–59.
[115] Kikura H, Matsushita J, Matsuzaki M, Kobayashi Y, Aritomi M. Thermal behaviourand particle size evaluation of primary clusters in a water-based magnetic fluid.Sci Technol Adv Mater 2004;5:703–7.
[116] Keane RD. Super-resolution particle imaging velocimetry. Meas Sci Technol1995;6:754.
[117] Meinhart CD, Wereley ST, Santiago JG. PIV measurements of a microchannelflow. Exp Fluids 1999;27:414–9.
[118] Westerweel J. Fundamentals of digital particle image velocimetry. Meas SciTechnol 1997;8:1379.
[119] Stitou A, Riethmuller ML. Extension of PIV to super resolution using PTV. MeasSci Technol 2001;12:1398–403.
[120] Park JS. Optically sliced micro-PIV using confocal laser scanning microscopy(CLSM). Exp Fluids 2004;37.
[121] Lindken R, Westerweel J, Wieneke B. Stereoscopic micro particle image veloci-metry. Exp Fluids 2006;41:161–71.
[122] Santiago JG, Wereley ST, Meinhart CD, Beebe DJ, Adrian RJ. A particle image velo-cimetry system for microfluidics. Exp Fluids 1998;25:316–9.
[123] Willert CE. Digital particle image velocimetry. Exp Fluids 1991;10:181–93.[124] Prasad V, Semwogerere D, Weeks ER. Confocal microscopy of colloids. J Phys
Condens Matter 2007;19:1131021–11310225.[125] Sandison DR, WebbWW. Background rejection and signal-to-noise optimization
in confocal and alternative fluorescence microscopes. Appl Opt 1994;33:603–15.[126] Semwogerere D, Morris JF, Weeks ER. Development of particle migration in
pressure-driven flow of a Brownian suspension. J Fluid Mech 2007;581:437–51.[127] Frank M, Anderson D, Weeks ER, Morris JF. Particle migration in pressure-driven
flow of a Brownian suspension. J Fluid Mech 2003;493:363–78.[128] Besseling R, Isa L, Weeks ER, Poon WCK. Quantitative imaging of colloidal flows.
Adv Colloid Interface Sci 2009;146:1–17.[129] Conrad JC, Lewis JA. Structure of colloidal gels during microchannel flow. Lang-
muir 2008;24:7628–34.[130] Derks D, Wisman H, van Blaaderen A, Imhof A. Confocal microscopy of colloidal
dispersions in shear flow using a counter-rotating cone-plate shear cell. J PhysCondens Matter 2004;16:S3917–27.
[131] Dinsmore AD, Weeks ER, Prasad V, Levitt AC, Weitz DA. Three-dimensional con-focal microscopy of colloids. Appl Opt 2001;40:4152–9.
[132] Isa L, Besseling R, Weeks ER, Poon WCK. Experimental studies of the flow of con-centrated hard sphere suspensions into a constriction. J Phys Conf Ser 2006;40:124–32.
[133] Semwogerere D, Weeks ER. Shear-induced particle migration in binary colloidalsuspensions. Phys Fluids 2008;20:0433061–7.
[134] Wu YL, Brand JHJ, van Gemert JLA, Verkerk J, Wisman H, van Blaaderen A, et al. Anew parallel plate shear cell for in situ real-space measurements of complexfluids under shear flow. Rev Sci Instrum 2007;78(103902):1–11.
[135] Magde D, Webb WW, Elson E. Thermodynamic fluctuations in a reacting system— measurement by fluorescence correlation spectroscopy. Phys Rev Lett1972;29:705–8.
[136] Thompson N. Recent advances in fluorescence correlation spectroscopy. CurrOpin Struct Biol 2002;12:634–41.
[137] Hashmi SM, Loewenberg M, Dufresne ER. Spatially extended FCS for visualizingand quantifying high-speed multiphase flows in microchannels. Opt Express2007;15:6528–33.
[138] Brister PC, Kuricheti KK, Buschmann V, Weston KD. Fluorescence correlationspectroscopy for flow rate imaging and monitoring — optimization, limitationsand artifacts. Lab Chip 2005;5:785–91.
[139] Kunst BH, Schots A, Visser AJWG. Design of a confocal microfluidic particle sorterusing fluorescent photon burst detection. Rev Sci Instrum 2004;75:2892–8.
[140] Berland KM, So PTC, Gratton E. 2-Photon fluorescence correlation spectroscopy— Method and application to the intracellular environment. Biophys J 1995;68:694–701.
[141] Lumma D, Best A, Gansen A, Feuillebois F, Rädler JO, Vinogradova OI. Flow profilenear a wall measured by double-focus fluorescence cross-correlation. Phys Rev EStat Nonlinear Soft Matter Phys 2003;67(056313):1–10.
[142] Wolters AM, Jayawickrama DA, Sweedler JV. Microscale NMR. Curr Opin ChemBiol 2002;6:711–6.
[143] Bonn D, Rodts S, Groenink M, Rafai S, Shahidzadeh-Bonn N, Coussot P. Some ap-plications of magnetic resonance imaging in fluid mechanics: complex flows andcomplex fluids. Annu Rev Fluid Mech 2008;40:209–33.